Lakeshore, LA Map & Demographics
Lakeshore Map
Lakeshore Overview
$21,683
PER CAPITA INCOME
$41,181
AVG FAMILY INCOME
$39,826
AVG HOUSEHOLD INCOME
42.3%
WAGE / INCOME GAP [ % ]
57.7¢/ $1
WAGE / INCOME GAP [ $ ]
0.41
INEQUALITY / GINI INDEX
3,114
TOTAL POPULATION
1,492
MALE POPULATION
1,622
FEMALE POPULATION
91.99
MALES / 100 FEMALES
108.71
FEMALES / 100 MALES
31.8
MEDIAN AGE
3.5
AVG FAMILY SIZE
2.8
AVG HOUSEHOLD SIZE
1,356
LABOR FORCE [ PEOPLE ]
56.5%
PERCENT IN LABOR FORCE
4.5%
UNEMPLOYMENT RATE
Income in Lakeshore
Income Overview in Lakeshore
Per Capita Income in Lakeshore is $21,683, while median incomes of families and households are $41,181 and $39,826 respectively.
| Characteristic | Number | Measure |
| Per Capita Income | 3,114 | $21,683 |
| Median Family Income | 709 | $41,181 |
| Mean Family Income | 709 | $68,706 |
| Median Household Income | 1,101 | $39,826 |
| Mean Household Income | 1,101 | $58,445 |
| Income Deficit | 709 | $0 |
| Wage / Income Gap (%) | 3,114 | 42.31% |
| Wage / Income Gap ($) | 3,114 | 57.69¢ per $1 |
| Gini / Inequality Index | 3,114 | 0.41 |
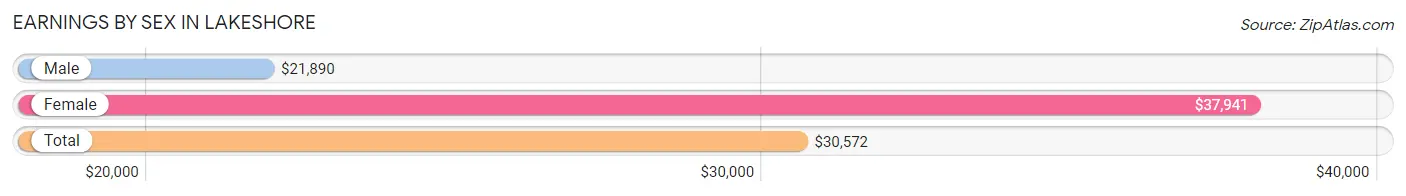
Earnings by Sex in Lakeshore
Average Earnings in Lakeshore are $30,572, $21,890 for men and $37,941 for women, a difference of 42.3%.
| Sex | Number | Average Earnings |
| Male | 775 (55.6%) | $21,890 |
| Female | 618 (44.4%) | $37,941 |
| Total | 1,393 (100.0%) | $30,572 |
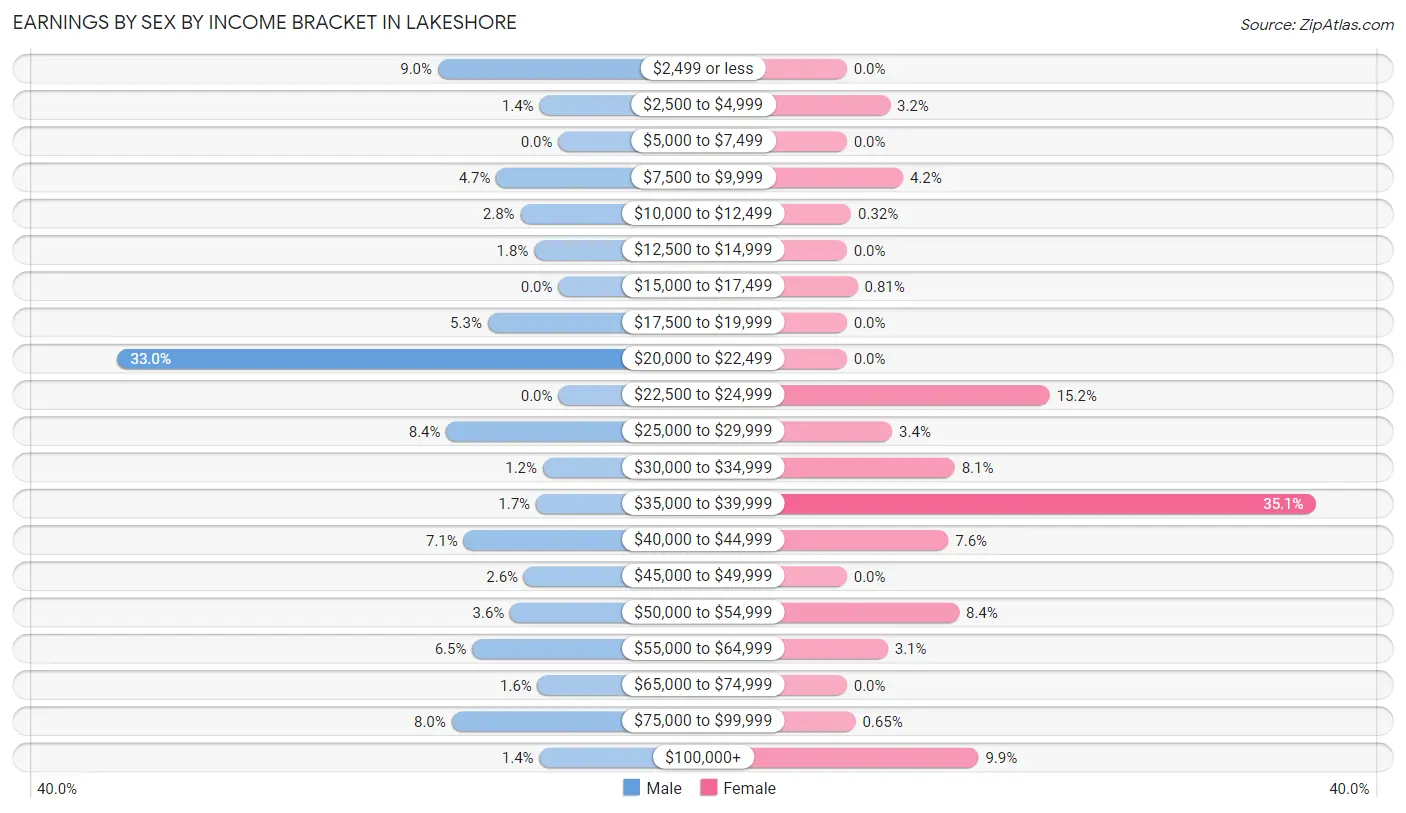
Earnings by Sex by Income Bracket in Lakeshore
The most common earnings brackets in Lakeshore are $20,000 to $22,499 for men (256 | 33.0%) and $35,000 to $39,999 for women (217 | 35.1%).
| Income | Male | Female |
| $2,499 or less | 70 (9.0%) | 0 (0.0%) |
| $2,500 to $4,999 | 11 (1.4%) | 20 (3.2%) |
| $5,000 to $7,499 | 0 (0.0%) | 0 (0.0%) |
| $7,500 to $9,999 | 36 (4.6%) | 26 (4.2%) |
| $10,000 to $12,499 | 22 (2.8%) | 2 (0.3%) |
| $12,500 to $14,999 | 14 (1.8%) | 0 (0.0%) |
| $15,000 to $17,499 | 0 (0.0%) | 5 (0.8%) |
| $17,500 to $19,999 | 41 (5.3%) | 0 (0.0%) |
| $20,000 to $22,499 | 256 (33.0%) | 0 (0.0%) |
| $22,500 to $24,999 | 0 (0.0%) | 94 (15.2%) |
| $25,000 to $29,999 | 65 (8.4%) | 21 (3.4%) |
| $30,000 to $34,999 | 9 (1.2%) | 50 (8.1%) |
| $35,000 to $39,999 | 13 (1.7%) | 217 (35.1%) |
| $40,000 to $44,999 | 55 (7.1%) | 47 (7.6%) |
| $45,000 to $49,999 | 20 (2.6%) | 0 (0.0%) |
| $50,000 to $54,999 | 28 (3.6%) | 52 (8.4%) |
| $55,000 to $64,999 | 50 (6.5%) | 19 (3.1%) |
| $65,000 to $74,999 | 12 (1.5%) | 0 (0.0%) |
| $75,000 to $99,999 | 62 (8.0%) | 4 (0.6%) |
| $100,000+ | 11 (1.4%) | 61 (9.9%) |
| Total | 775 (100.0%) | 618 (100.0%) |
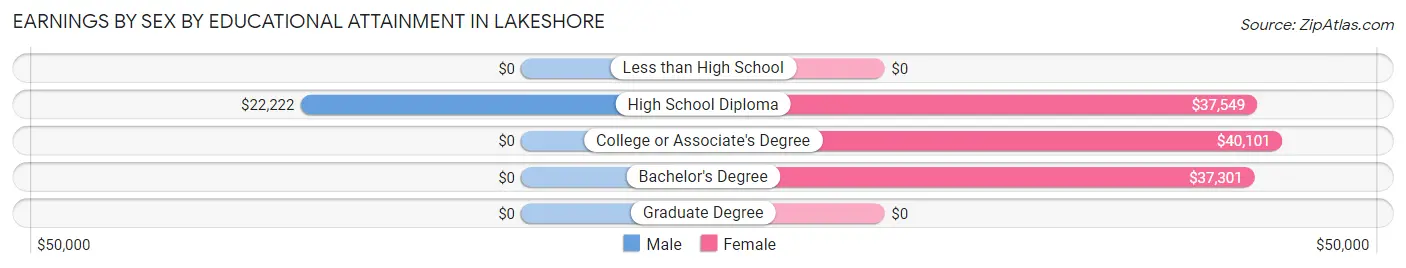
Earnings by Sex by Educational Attainment in Lakeshore
Average earnings in Lakeshore are $22,314 for men and $37,941 for women, a difference of 41.2%. Men with an educational attainment of high school diploma enjoy the highest average annual earnings of $22,222, while those with high school diploma education earn the least with $22,222. Women with an educational attainment of college or associate's degree earn the most with the average annual earnings of $40,101, while those with bachelor's degree education have the smallest earnings of $37,301.
| Educational Attainment | Male Income | Female Income |
| Less than High School | - | - |
| High School Diploma | $22,222 | $37,549 |
| College or Associate's Degree | - | - |
| Bachelor's Degree | - | - |
| Graduate Degree | - | - |
| Total | $22,314 | $37,941 |
Family Income in Lakeshore
Family Income Brackets in Lakeshore
According to the Lakeshore family income data, there are 149 families falling into the $35,000 to $49,999 income range, which is the most common income bracket and makes up 21.0% of all families.
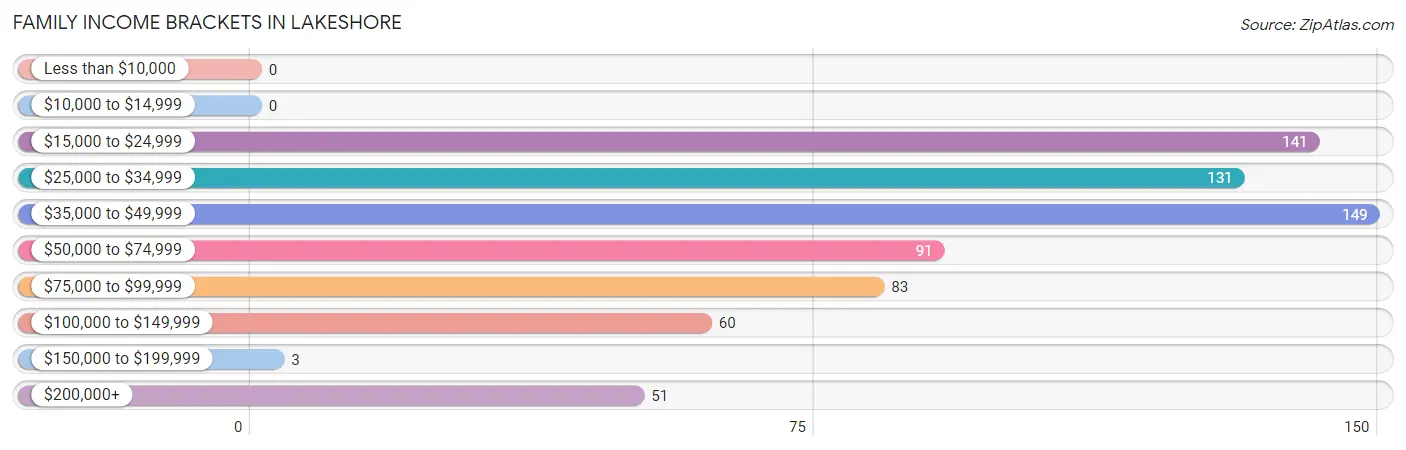
| Income Bracket | # Families | % Families |
| Less than $10,000 | 0 | 0.0% |
| $10,000 to $14,999 | 0 | 0.0% |
| $15,000 to $24,999 | 141 | 19.9% |
| $25,000 to $34,999 | 131 | 18.5% |
| $35,000 to $49,999 | 149 | 21.0% |
| $50,000 to $74,999 | 91 | 12.8% |
| $75,000 to $99,999 | 83 | 11.7% |
| $100,000 to $149,999 | 60 | 8.5% |
| $150,000 to $199,999 | 3 | 0.4% |
| $200,000+ | 51 | 7.2% |
Family Income by Famaliy Size in Lakeshore
2-person families (284 | 40.1%) account for the highest median family income in Lakeshore with $44,914 per family, while 2-person families (284 | 40.1%) have the highest median income of $22,457 per family member.
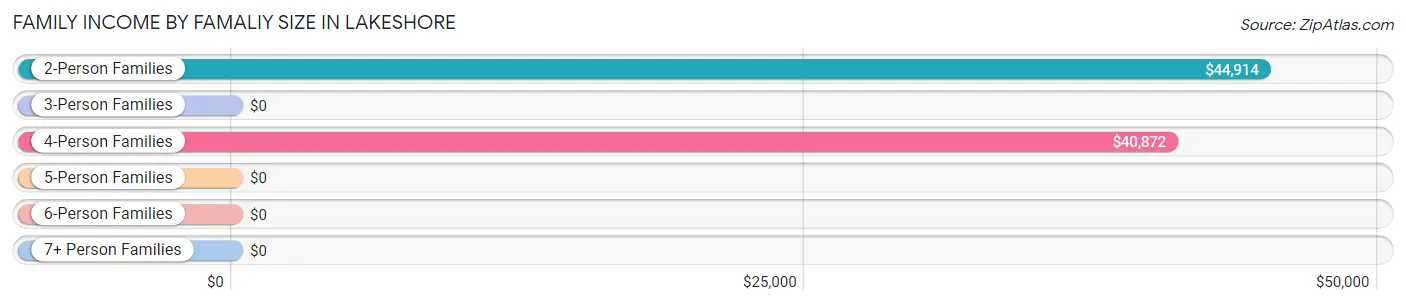
| Income Bracket | # Families | Median Income |
| 2-Person Families | 284 (40.1%) | $44,914 |
| 3-Person Families | 256 (36.1%) | $0 |
| 4-Person Families | 80 (11.3%) | $40,872 |
| 5-Person Families | 22 (3.1%) | $0 |
| 6-Person Families | 0 (0.0%) | $0 |
| 7+ Person Families | 67 (9.5%) | $0 |
| Total | 709 (100.0%) | $41,181 |
Family Income by Number of Earners in Lakeshore
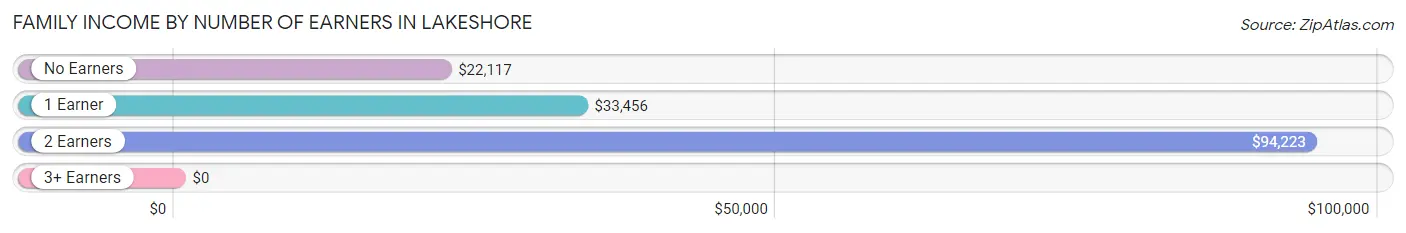
| Number of Earners | # Families | Median Income |
| No Earners | 105 (14.8%) | $22,117 |
| 1 Earner | 303 (42.7%) | $33,456 |
| 2 Earners | 221 (31.2%) | $94,223 |
| 3+ Earners | 80 (11.3%) | $0 |
| Total | 709 (100.0%) | $41,181 |
Household Income in Lakeshore
Household Income Brackets in Lakeshore
With 362 households falling in the category, the $35,000 to $49,999 income range is the most frequent in Lakeshore, accounting for 32.9% of all households. In contrast, only 3 households (0.3%) fall into the $150,000 to $199,999 income bracket, making it the least populous group.
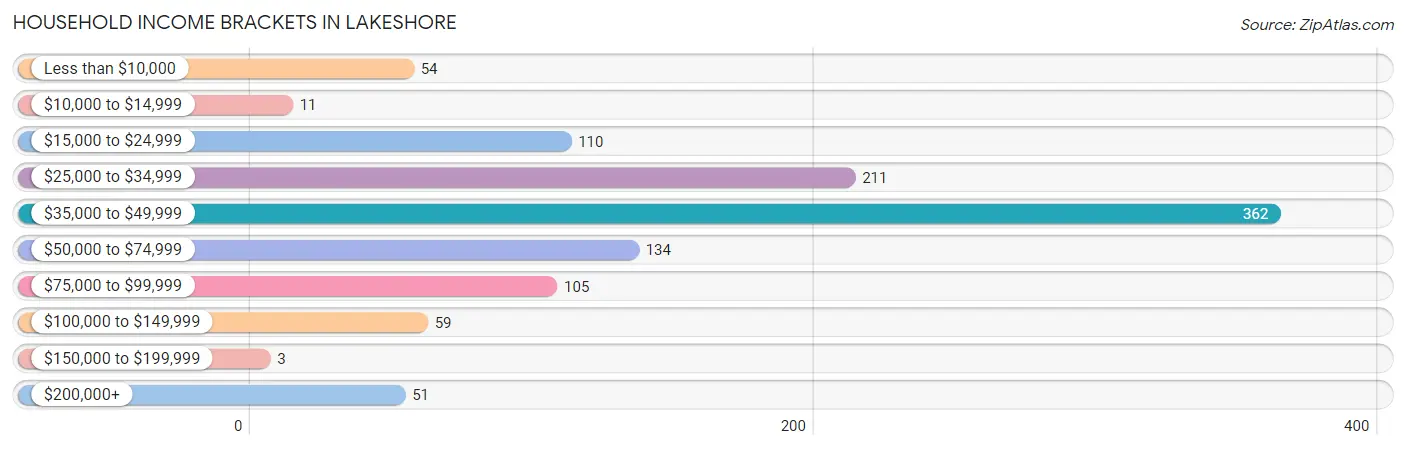
| Income Bracket | # Households | % Households |
| Less than $10,000 | 54 | 4.9% |
| $10,000 to $14,999 | 11 | 1.0% |
| $15,000 to $24,999 | 110 | 10.0% |
| $25,000 to $34,999 | 211 | 19.2% |
| $35,000 to $49,999 | 362 | 32.9% |
| $50,000 to $74,999 | 134 | 12.2% |
| $75,000 to $99,999 | 105 | 9.5% |
| $100,000 to $149,999 | 59 | 5.4% |
| $150,000 to $199,999 | 3 | 0.3% |
| $200,000+ | 51 | 4.6% |
Household Income by Householder Age in Lakeshore
The median household income in Lakeshore is $39,826, with the highest median household income of $38,889 found in the 25 to 44 years age bracket for the primary householder. A total of 622 households (56.5%) fall into this category.
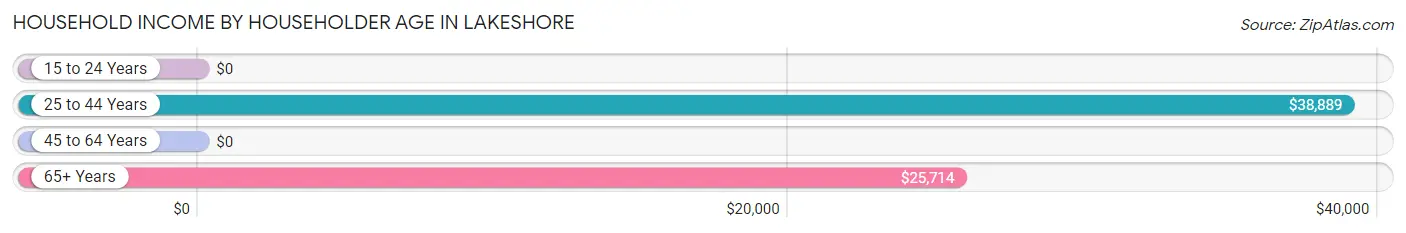
| Income Bracket | # Households | Median Income |
| 15 to 24 Years | 0 (0.0%) | $0 |
| 25 to 44 Years | 622 (56.5%) | $38,889 |
| 45 to 64 Years | 333 (30.2%) | $0 |
| 65+ Years | 146 (13.3%) | $25,714 |
| Total | 1,101 (100.0%) | $39,826 |
Poverty in Lakeshore
Income Below Poverty by Sex and Age in Lakeshore
With 26.9% poverty level for males and 42.9% for females among the residents of Lakeshore, 6 to 11 year old males and 18 to 24 year old females are the most vulnerable to poverty, with 128 males (76.6%) and 38 females (88.4%) in their respective age groups living below the poverty level.
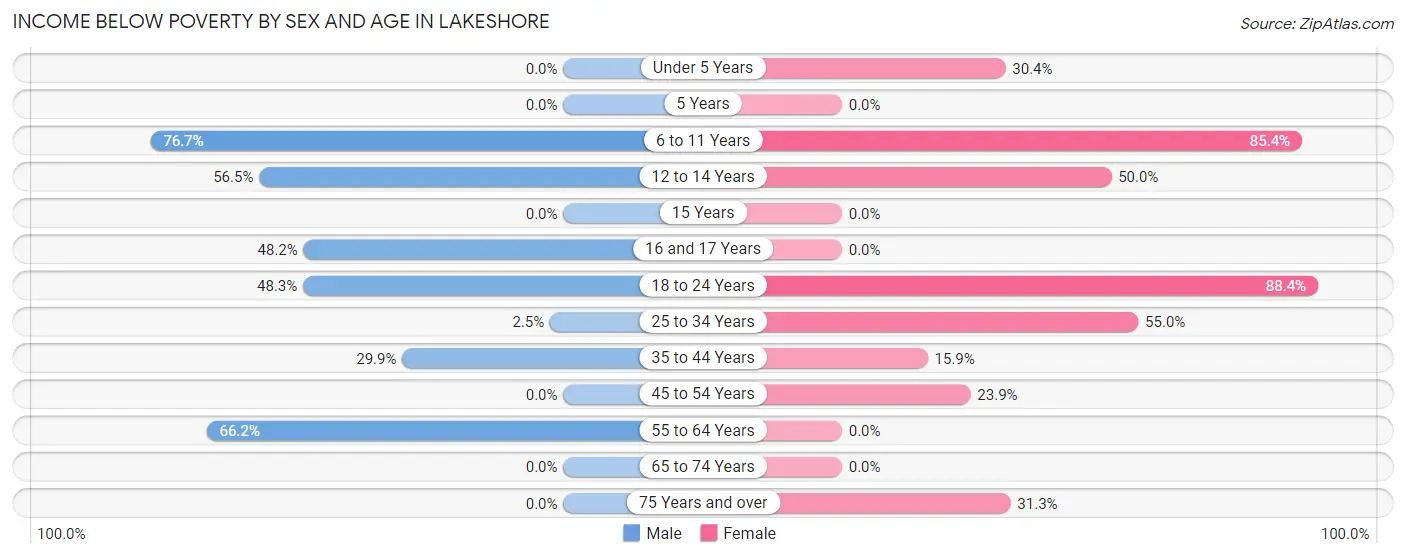
| Age Bracket | Male | Female |
| Under 5 Years | 0 (0.0%) | 17 (30.4%) |
| 5 Years | 0 (0.0%) | 0 (0.0%) |
| 6 to 11 Years | 128 (76.6%) | 234 (85.4%) |
| 12 to 14 Years | 35 (56.5%) | 34 (50.0%) |
| 15 Years | 0 (0.0%) | 0 (0.0%) |
| 16 and 17 Years | 27 (48.2%) | 0 (0.0%) |
| 18 to 24 Years | 71 (48.3%) | 38 (88.4%) |
| 25 to 34 Years | 10 (2.5%) | 247 (55.0%) |
| 35 to 44 Years | 81 (29.9%) | 32 (15.9%) |
| 45 to 54 Years | 0 (0.0%) | 53 (23.9%) |
| 55 to 64 Years | 49 (66.2%) | 0 (0.0%) |
| 65 to 74 Years | 0 (0.0%) | 0 (0.0%) |
| 75 Years and over | 0 (0.0%) | 41 (31.3%) |
| Total | 401 (26.9%) | 696 (42.9%) |
Income Above Poverty by Sex and Age in Lakeshore
According to the poverty statistics in Lakeshore, males aged under 5 years and females aged 16 and 17 years are the age groups that are most secure financially, with 100.0% of males and 100.0% of females in these age groups living above the poverty line.
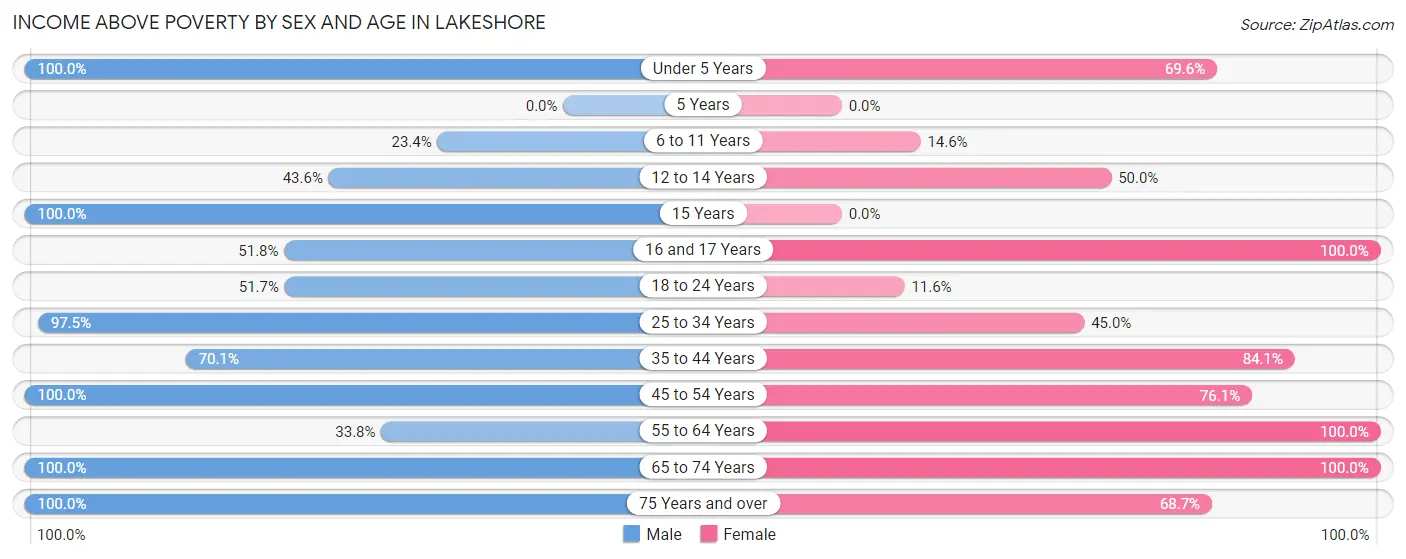
| Age Bracket | Male | Female |
| Under 5 Years | 82 (100.0%) | 39 (69.6%) |
| 5 Years | 0 (0.0%) | 0 (0.0%) |
| 6 to 11 Years | 39 (23.4%) | 40 (14.6%) |
| 12 to 14 Years | 27 (43.5%) | 34 (50.0%) |
| 15 Years | 5 (100.0%) | 0 (0.0%) |
| 16 and 17 Years | 29 (51.8%) | 5 (100.0%) |
| 18 to 24 Years | 76 (51.7%) | 5 (11.6%) |
| 25 to 34 Years | 397 (97.5%) | 202 (45.0%) |
| 35 to 44 Years | 190 (70.1%) | 169 (84.1%) |
| 45 to 54 Years | 83 (100.0%) | 169 (76.1%) |
| 55 to 64 Years | 25 (33.8%) | 138 (100.0%) |
| 65 to 74 Years | 92 (100.0%) | 35 (100.0%) |
| 75 Years and over | 46 (100.0%) | 90 (68.7%) |
| Total | 1,091 (73.1%) | 926 (57.1%) |
Income Below Poverty Among Married-Couple Families in Lakeshore
The poverty statistics for married-couple families in Lakeshore show that 15.9% or 74 of the total 467 families live below the poverty line. Families with 3 or 4 children have the highest poverty rate of 100.0%, comprising of 6 families. On the other hand, families with no children have the lowest poverty rate of 9.5%, which includes 36 families.
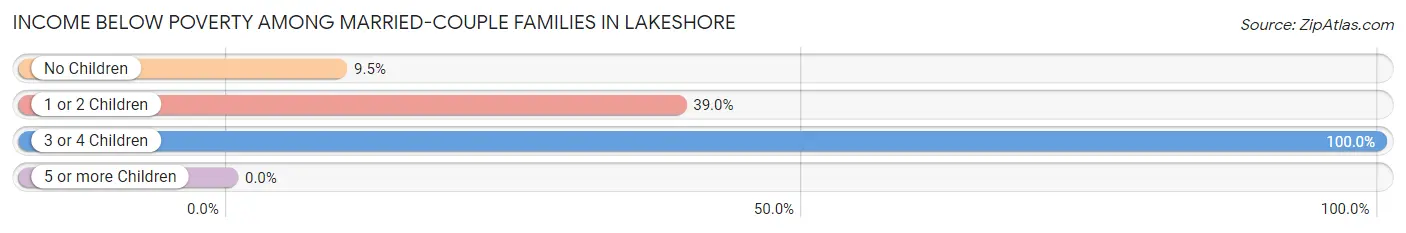
| Children | Above Poverty | Below Poverty |
| No Children | 343 (90.5%) | 36 (9.5%) |
| 1 or 2 Children | 50 (61.0%) | 32 (39.0%) |
| 3 or 4 Children | 0 (0.0%) | 6 (100.0%) |
| 5 or more Children | 0 (0.0%) | 0 (0.0%) |
| Total | 393 (84.2%) | 74 (15.9%) |
Income Below Poverty Among Single-Parent Households in Lakeshore
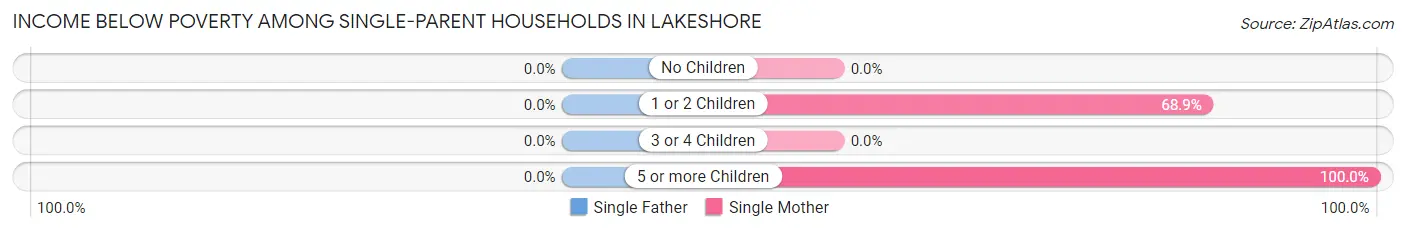
| Children | Single Father | Single Mother |
| No Children | 0 (0.0%) | 0 (0.0%) |
| 1 or 2 Children | 0 (0.0%) | 62 (68.9%) |
| 3 or 4 Children | 0 (0.0%) | 0 (0.0%) |
| 5 or more Children | 0 (0.0%) | 35 (100.0%) |
| Total | 0 (0.0%) | 97 (51.9%) |
Income Below Poverty Among Married-Couple vs Single-Parent Households in Lakeshore
The poverty data for Lakeshore shows that 74 of the married-couple family households (15.9%) and 97 of the single-parent households (40.1%) are living below the poverty level. Within the married-couple family households, those with 3 or 4 children have the highest poverty rate, with 6 households (100.0%) falling below the poverty line. Among the single-parent households, those with 5 or more children have the highest poverty rate, with 35 household (100.0%) living below poverty.
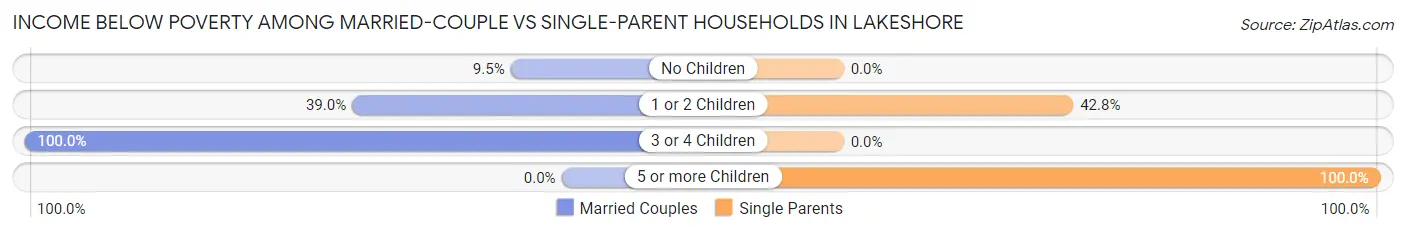
| Children | Married-Couple Families | Single-Parent Households |
| No Children | 36 (9.5%) | 0 (0.0%) |
| 1 or 2 Children | 32 (39.0%) | 62 (42.8%) |
| 3 or 4 Children | 6 (100.0%) | 0 (0.0%) |
| 5 or more Children | 0 (0.0%) | 35 (100.0%) |
| Total | 74 (15.9%) | 97 (40.1%) |
Race in Lakeshore
The most populous races in Lakeshore are Black / African American (2,043 | 65.6%), White / Caucasian (904 | 29.0%), and Two or more Races (139 | 4.5%).
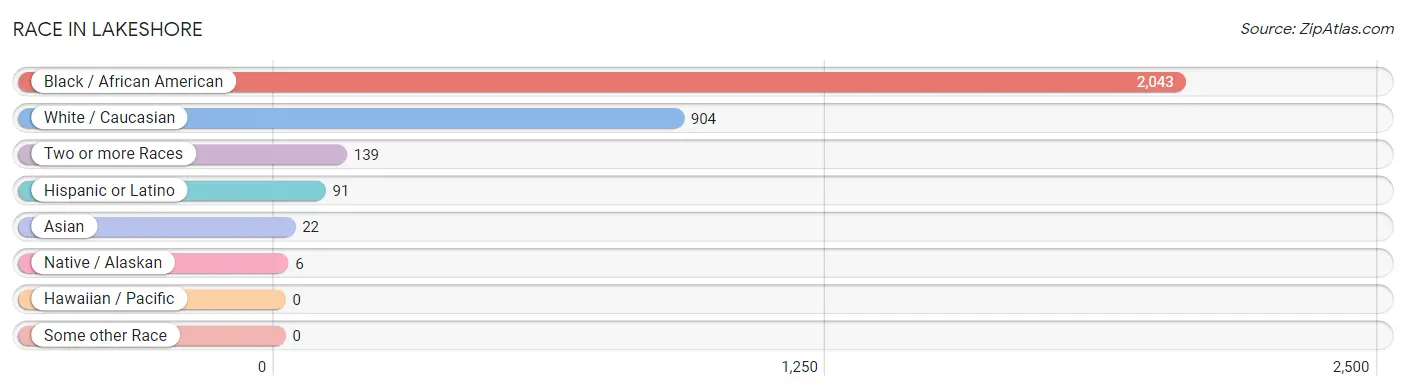
| Race | # Population | % Population |
| Asian | 22 | 0.7% |
| Black / African American | 2,043 | 65.6% |
| Hawaiian / Pacific | 0 | 0.0% |
| Hispanic or Latino | 91 | 2.9% |
| Native / Alaskan | 6 | 0.2% |
| White / Caucasian | 904 | 29.0% |
| Two or more Races | 139 | 4.5% |
| Some other Race | 0 | 0.0% |
| Total | 3,114 | 100.0% |
Ancestry in Lakeshore
The most populous ancestries reported in Lakeshore are English (209 | 6.7%), American (181 | 5.8%), Irish (102 | 3.3%), Mexican (86 | 2.8%), and German (62 | 2.0%), together accounting for 20.5% of all Lakeshore residents.
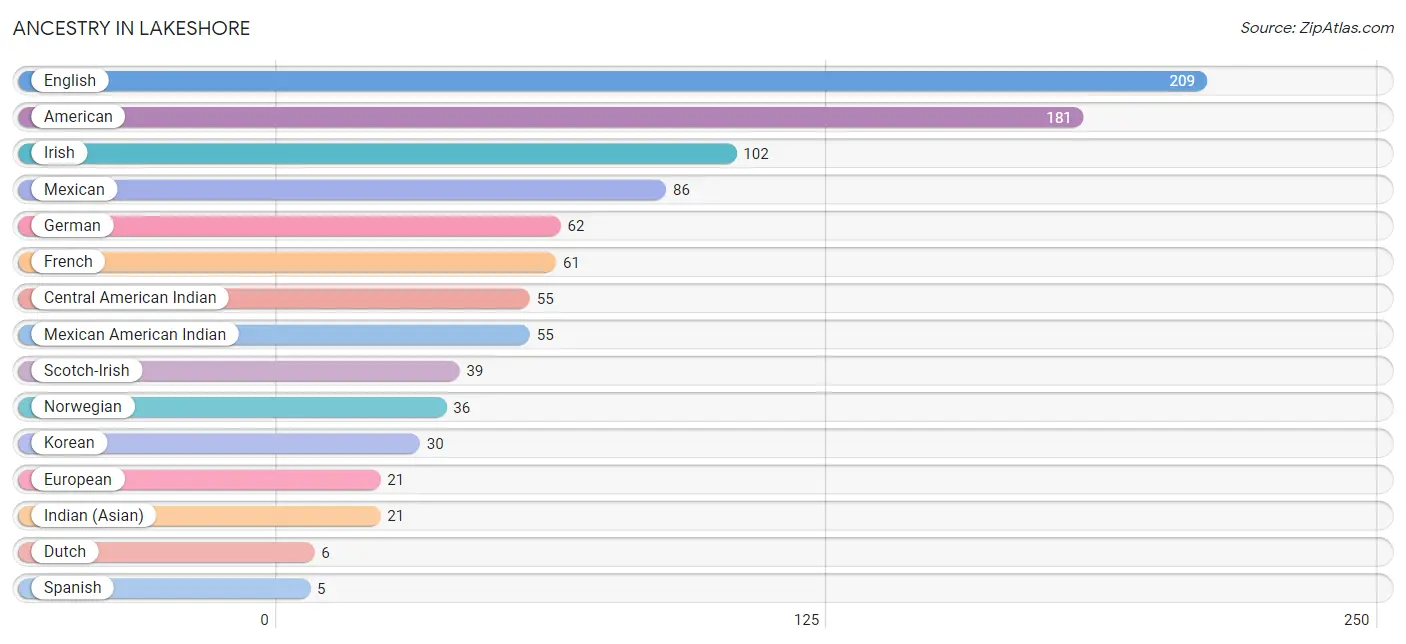
| Ancestry | # Population | % Population |
| American | 181 | 5.8% |
| Central American Indian | 55 | 1.8% |
| Cherokee | 2 | 0.1% |
| Dutch | 6 | 0.2% |
| English | 209 | 6.7% |
| European | 21 | 0.7% |
| French | 61 | 2.0% |
| German | 62 | 2.0% |
| Indian (Asian) | 21 | 0.7% |
| Irish | 102 | 3.3% |
| Korean | 30 | 1.0% |
| Mexican | 86 | 2.8% |
| Mexican American Indian | 55 | 1.8% |
| Norwegian | 36 | 1.2% |
| Scotch-Irish | 39 | 1.3% |
| Spanish | 5 | 0.2% | View All 16 Rows |
Immigrants in Lakeshore
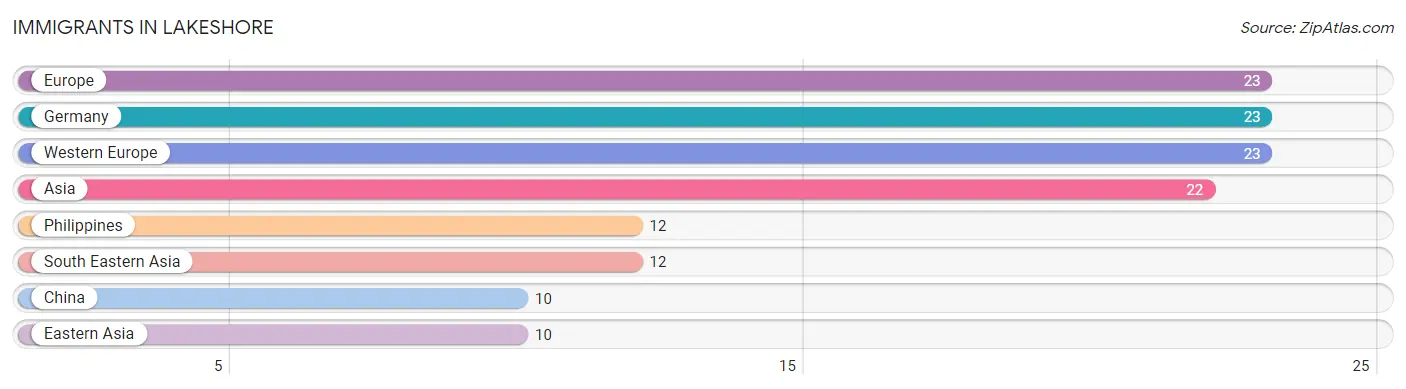
The most numerous immigrant groups reported in Lakeshore came from Europe (23 | 0.7%), Germany (23 | 0.7%), Western Europe (23 | 0.7%), Asia (22 | 0.7%), and Philippines (12 | 0.4%), together accounting for 3.3% of all Lakeshore residents.
| Immigration Origin | # Population | % Population |
| Asia | 22 | 0.7% |
| China | 10 | 0.3% |
| Eastern Asia | 10 | 0.3% |
| Europe | 23 | 0.7% |
| Germany | 23 | 0.7% |
| Philippines | 12 | 0.4% |
| South Eastern Asia | 12 | 0.4% |
| Western Europe | 23 | 0.7% | View All 8 Rows |
Sex and Age in Lakeshore
Sex and Age in Lakeshore
The most populous age groups in Lakeshore are 25 to 29 Years (249 | 16.7%) for men and 25 to 29 Years (262 | 16.2%) for women.
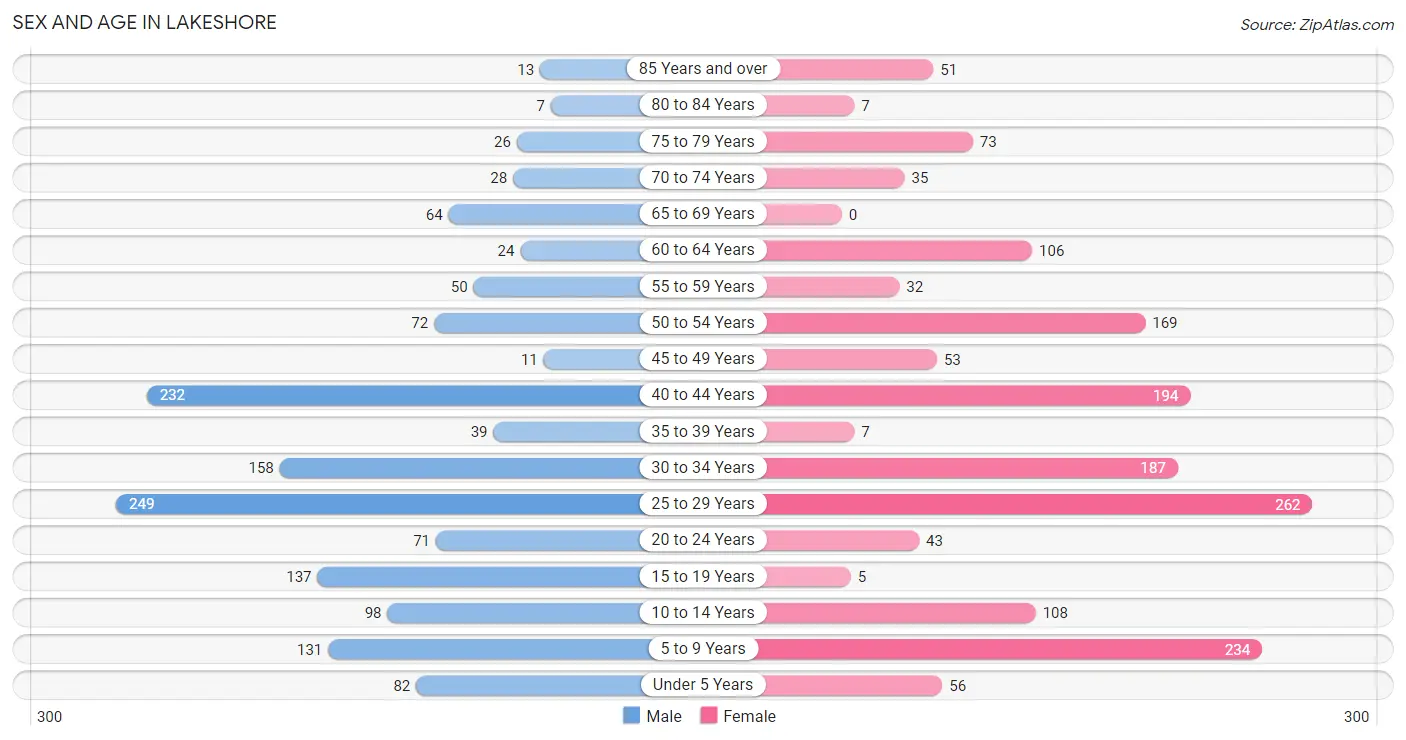
| Age Bracket | Male | Female |
| Under 5 Years | 82 (5.5%) | 56 (3.5%) |
| 5 to 9 Years | 131 (8.8%) | 234 (14.4%) |
| 10 to 14 Years | 98 (6.6%) | 108 (6.7%) |
| 15 to 19 Years | 137 (9.2%) | 5 (0.3%) |
| 20 to 24 Years | 71 (4.8%) | 43 (2.6%) |
| 25 to 29 Years | 249 (16.7%) | 262 (16.2%) |
| 30 to 34 Years | 158 (10.6%) | 187 (11.5%) |
| 35 to 39 Years | 39 (2.6%) | 7 (0.4%) |
| 40 to 44 Years | 232 (15.5%) | 194 (12.0%) |
| 45 to 49 Years | 11 (0.7%) | 53 (3.3%) |
| 50 to 54 Years | 72 (4.8%) | 169 (10.4%) |
| 55 to 59 Years | 50 (3.4%) | 32 (2.0%) |
| 60 to 64 Years | 24 (1.6%) | 106 (6.5%) |
| 65 to 69 Years | 64 (4.3%) | 0 (0.0%) |
| 70 to 74 Years | 28 (1.9%) | 35 (2.2%) |
| 75 to 79 Years | 26 (1.7%) | 73 (4.5%) |
| 80 to 84 Years | 7 (0.5%) | 7 (0.4%) |
| 85 Years and over | 13 (0.9%) | 51 (3.1%) |
| Total | 1,492 (100.0%) | 1,622 (100.0%) |
Families and Households in Lakeshore
Median Family Size in Lakeshore
The median family size in Lakeshore is 3.45 persons per family, with single female/mother families (187 | 26.4%) accounting for the largest median family size of 4.47 persons per family. On the other hand, single male/father families (55 | 7.8%) represent the smallest median family size with 2.53 persons per family.
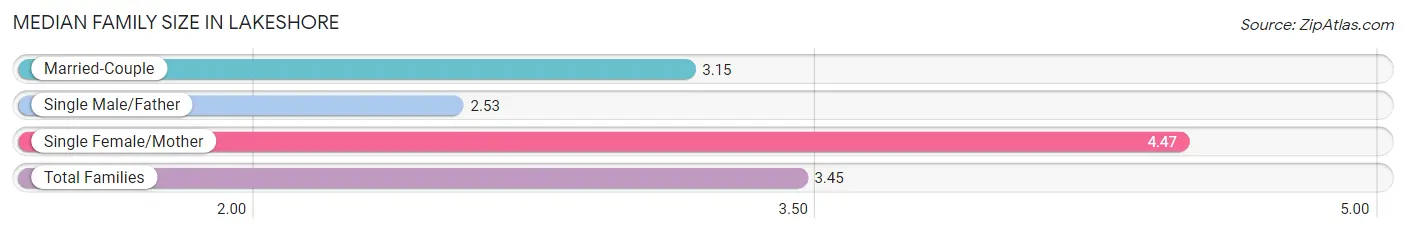
| Family Type | # Families | Family Size |
| Married-Couple | 467 (65.9%) | 3.15 |
| Single Male/Father | 55 (7.8%) | 2.53 |
| Single Female/Mother | 187 (26.4%) | 4.47 |
| Total Families | 709 (100.0%) | 3.45 |
Median Household Size in Lakeshore
The median household size in Lakeshore is 2.83 persons per household, with single female/mother households (187 | 17.0%) accounting for the largest median household size of 5.7 persons per household. non-family households (392 | 35.6%) represent the smallest median household size with 1.04 persons per household.
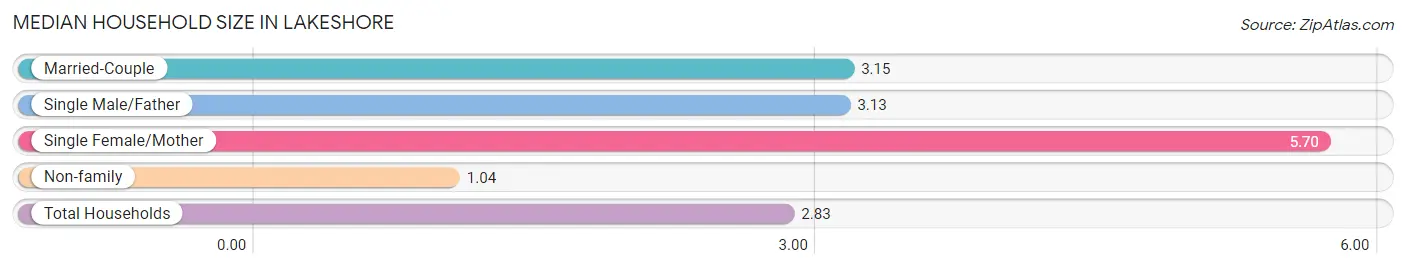
| Household Type | # Households | Household Size |
| Married-Couple | 467 (42.4%) | 3.15 |
| Single Male/Father | 55 (5.0%) | 3.13 |
| Single Female/Mother | 187 (17.0%) | 5.70 |
| Non-family | 392 (35.6%) | 1.04 |
| Total Households | 1,101 (100.0%) | 2.83 |
Household Size by Marriage Status in Lakeshore
Out of a total of 1,101 households in Lakeshore, 709 (64.4%) are family households, while 392 (35.6%) are nonfamily households. The most numerous type of family households are 2-person households, comprising 284, and the most common type of nonfamily households are 1-person households, comprising 379.
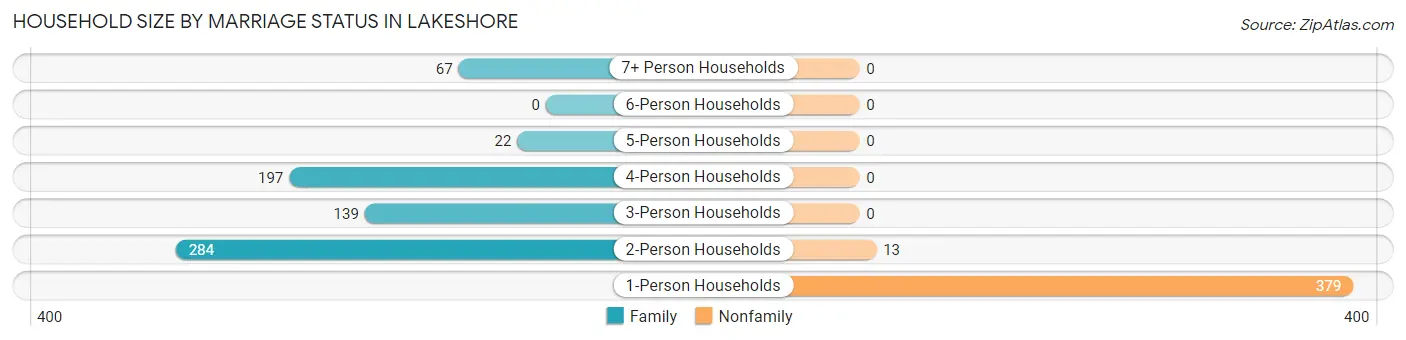
| Household Size | Family Households | Nonfamily Households |
| 1-Person Households | - | 379 (34.4%) |
| 2-Person Households | 284 (25.8%) | 13 (1.2%) |
| 3-Person Households | 139 (12.6%) | 0 (0.0%) |
| 4-Person Households | 197 (17.9%) | 0 (0.0%) |
| 5-Person Households | 22 (2.0%) | 0 (0.0%) |
| 6-Person Households | 0 (0.0%) | 0 (0.0%) |
| 7+ Person Households | 67 (6.1%) | 0 (0.0%) |
| Total | 709 (64.4%) | 392 (35.6%) |
Female Fertility in Lakeshore
Fertility by Age in Lakeshore
Average fertility rate in Lakeshore is 81.0 births per 1,000 women. Women in the age bracket of 35 to 50 years have the highest fertility rate with 110.0 births per 1,000 women. Women in the age bracket of 20 to 34 years acount for 53.2% of all women with births.
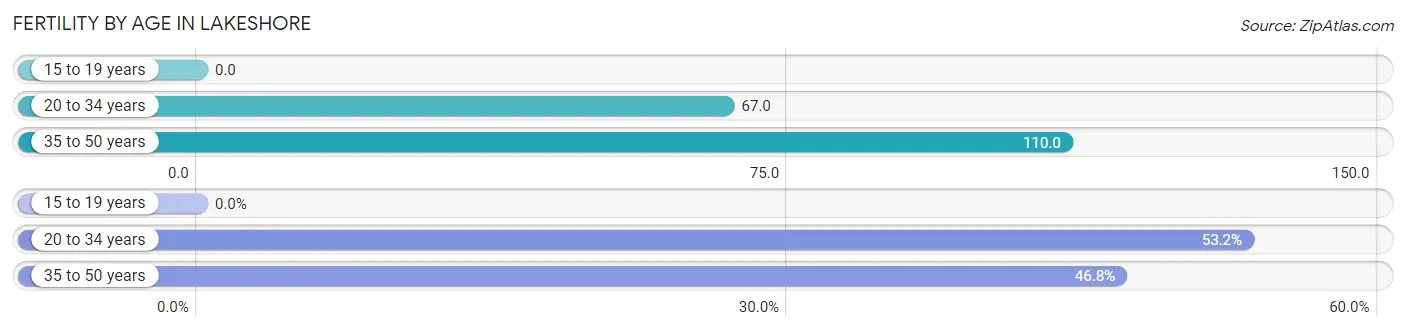
| Age Bracket | Women with Births | Births / 1,000 Women |
| 15 to 19 years | 0 (0.0%) | 0.0 |
| 20 to 34 years | 33 (53.2%) | 67.0 |
| 35 to 50 years | 29 (46.8%) | 110.0 |
| Total | 62 (100.0%) | 81.0 |
Fertility by Age by Marriage Status in Lakeshore
46.8% of women with births (62) in Lakeshore are married. The highest percentage of unmarried women with births falls into 20 to 34 years age bracket with 100.0% of them unmarried at the time of birth, while the lowest percentage of unmarried women with births belong to 35 to 50 years age bracket with 0.0% of them unmarried.
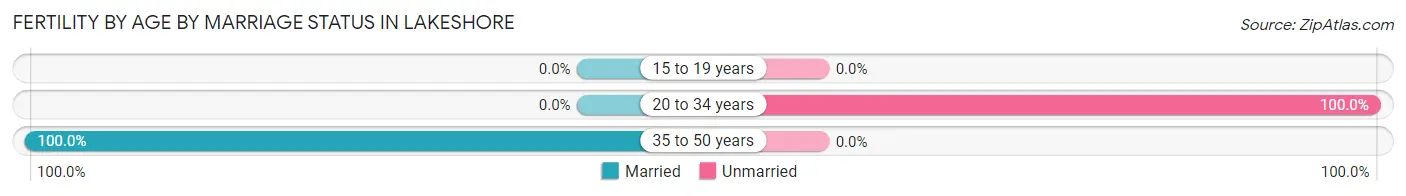
| Age Bracket | Married | Unmarried |
| 15 to 19 years | 0 (0.0%) | 0 (0.0%) |
| 20 to 34 years | 0 (0.0%) | 33 (100.0%) |
| 35 to 50 years | 29 (100.0%) | 0 (0.0%) |
| Total | 29 (46.8%) | 33 (53.2%) |
Fertility by Education in Lakeshore
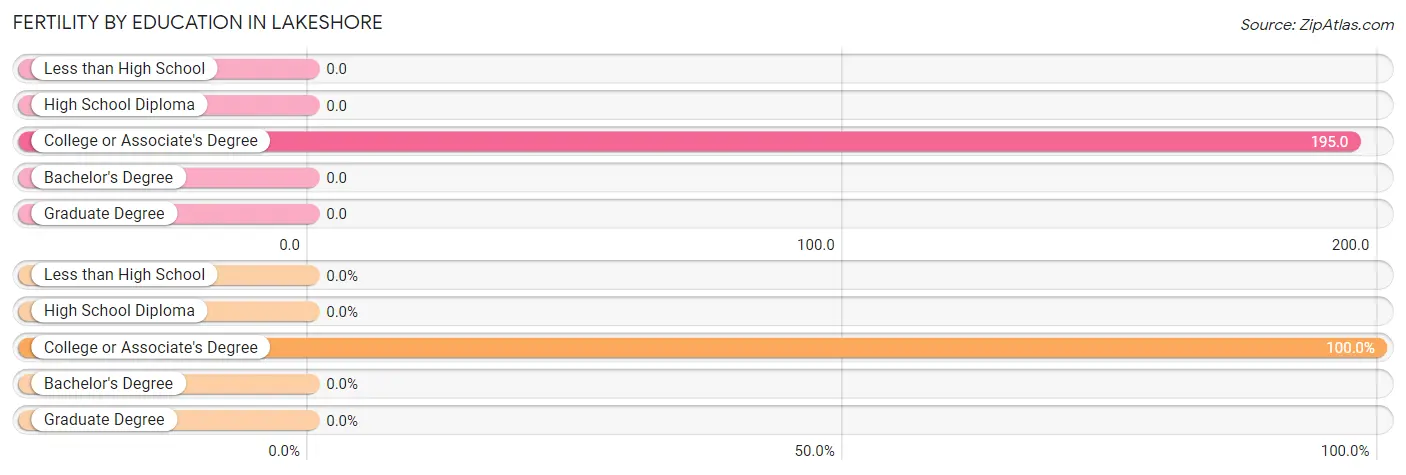
| Educational Attainment | Women with Births | Births / 1,000 Women |
| Less than High School | 0 (0.0%) | 0.0 |
| High School Diploma | 0 (0.0%) | 0.0 |
| College or Associate's Degree | 62 (100.0%) | 195.0 |
| Bachelor's Degree | 0 (0.0%) | 0.0 |
| Graduate Degree | 0 (0.0%) | 0.0 |
| Total | 62 (100.0%) | 81.0 |
Fertility by Education by Marriage Status in Lakeshore
53.2% of women with births in Lakeshore are unmarried. Women with the educational attainment of college or associate's degree are most likely to be married with 46.8% of them married at childbirth, while women with the educational attainment of college or associate's degree are least likely to be married with 53.2% of them unmarried at childbirth.
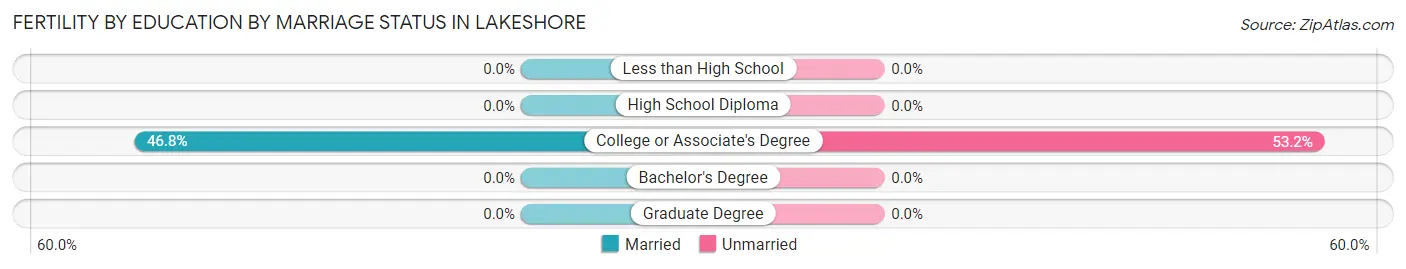
| Educational Attainment | Married | Unmarried |
| Less than High School | 0 (0.0%) | 0 (0.0%) |
| High School Diploma | 0 (0.0%) | 0 (0.0%) |
| College or Associate's Degree | 29 (46.8%) | 33 (53.2%) |
| Bachelor's Degree | 0 (0.0%) | 0 (0.0%) |
| Graduate Degree | 0 (0.0%) | 0 (0.0%) |
| Total | 29 (46.8%) | 33 (53.2%) |
Employment Characteristics in Lakeshore
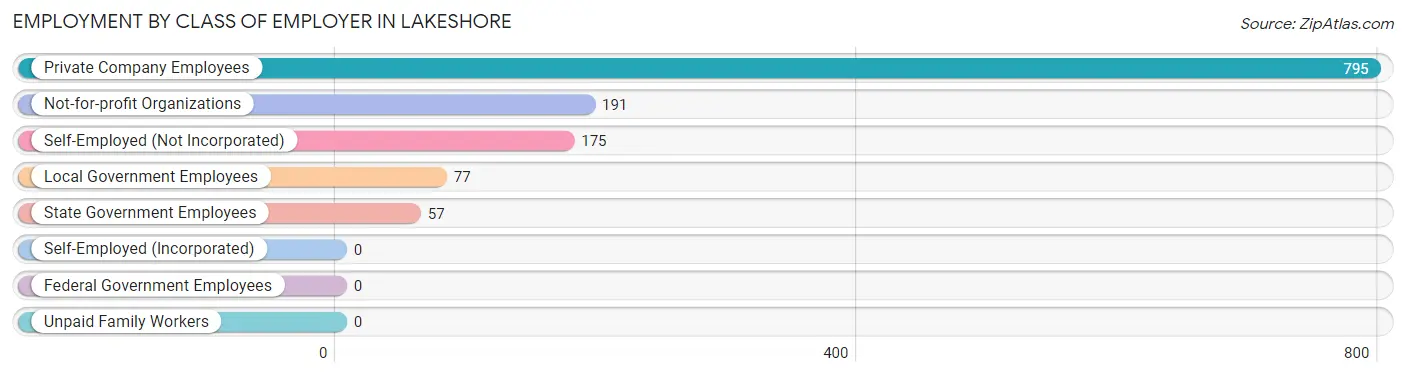
Employment by Class of Employer in Lakeshore
Among the 1,295 employed individuals in Lakeshore, private company employees (795 | 61.4%), not-for-profit organizations (191 | 14.7%), and self-employed (not incorporated) (175 | 13.5%) make up the most common classes of employment.
| Employer Class | # Employees | % Employees |
| Private Company Employees | 795 | 61.4% |
| Self-Employed (Incorporated) | 0 | 0.0% |
| Self-Employed (Not Incorporated) | 175 | 13.5% |
| Not-for-profit Organizations | 191 | 14.7% |
| Local Government Employees | 77 | 5.9% |
| State Government Employees | 57 | 4.4% |
| Federal Government Employees | 0 | 0.0% |
| Unpaid Family Workers | 0 | 0.0% |
| Total | 1,295 | 100.0% |
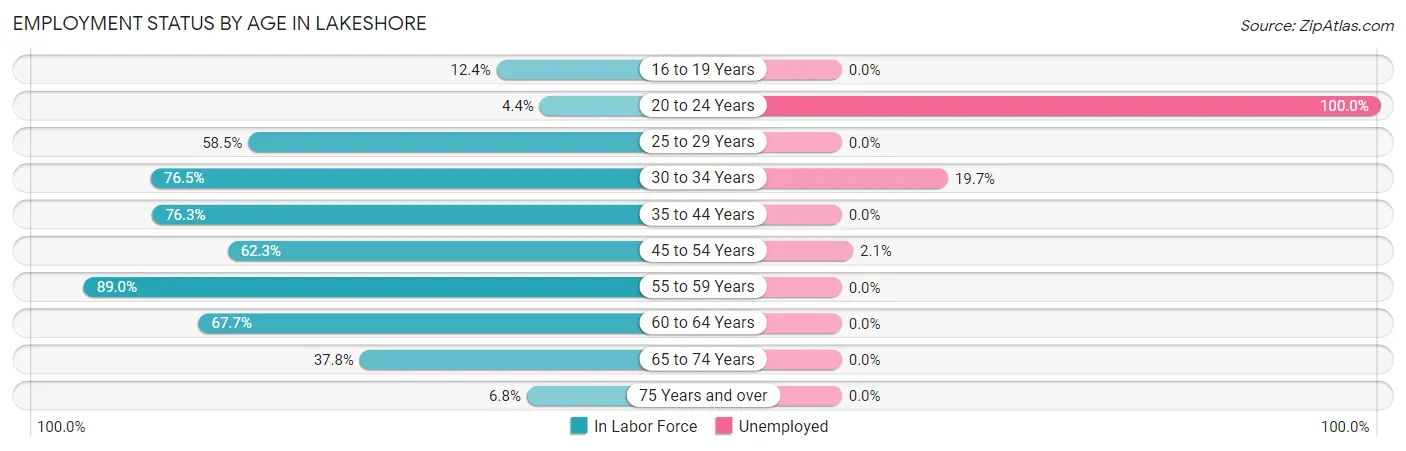
Employment Status by Age in Lakeshore
According to the labor force statistics for Lakeshore, out of the total population over 16 years of age (2,400), 56.5% or 1,356 individuals are in the labor force, with 4.5% or 61 of them unemployed. The age group with the highest labor force participation rate is 55 to 59 years, with 89.0% or 73 individuals in the labor force. Within the labor force, the 20 to 24 years age range has the highest percentage of unemployed individuals, with 100.0% or 5 of them being unemployed.
| Age Bracket | In Labor Force | Unemployed |
| 16 to 19 Years | 17 (12.4%) | 0 (0.0%) |
| 20 to 24 Years | 5 (4.4%) | 5 (100.0%) |
| 25 to 29 Years | 299 (58.5%) | 0 (0.0%) |
| 30 to 34 Years | 264 (76.5%) | 52 (19.7%) |
| 35 to 44 Years | 360 (76.3%) | 0 (0.0%) |
| 45 to 54 Years | 190 (62.3%) | 4 (2.1%) |
| 55 to 59 Years | 73 (89.0%) | 0 (0.0%) |
| 60 to 64 Years | 88 (67.7%) | 0 (0.0%) |
| 65 to 74 Years | 48 (37.8%) | 0 (0.0%) |
| 75 Years and over | 12 (6.8%) | 0 (0.0%) |
| Total | 1,356 (56.5%) | 61 (4.5%) |
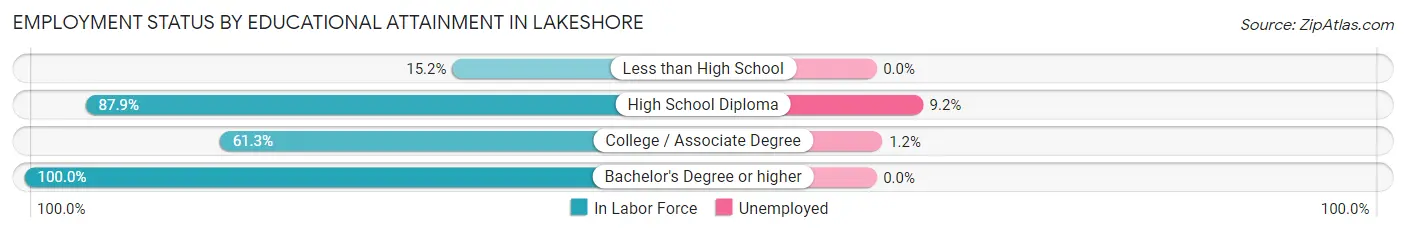
Employment Status by Educational Attainment in Lakeshore
According to labor force statistics for Lakeshore, 69.1% of individuals (1,275) out of the total population between 25 and 64 years of age (1,845) are in the labor force, with 4.4% or 56 of them being unemployed. The group with the highest labor force participation rate are those with the educational attainment of bachelor's degree or higher, with 100.0% or 315 individuals in the labor force. Within the labor force, individuals with high school diploma education have the highest percentage of unemployment, with 9.2% or 52 of them being unemployed.
| Educational Attainment | In Labor Force | Unemployed |
| Less than High School | 50 (15.2%) | 0 (0.0%) |
| High School Diploma | 568 (87.9%) | 59 (9.2%) |
| College / Associate Degree | 341 (61.3%) | 7 (1.2%) |
| Bachelor's Degree or higher | 315 (100.0%) | 0 (0.0%) |
| Total | 1,275 (69.1%) | 81 (4.4%) |
Employment Occupations by Sex in Lakeshore
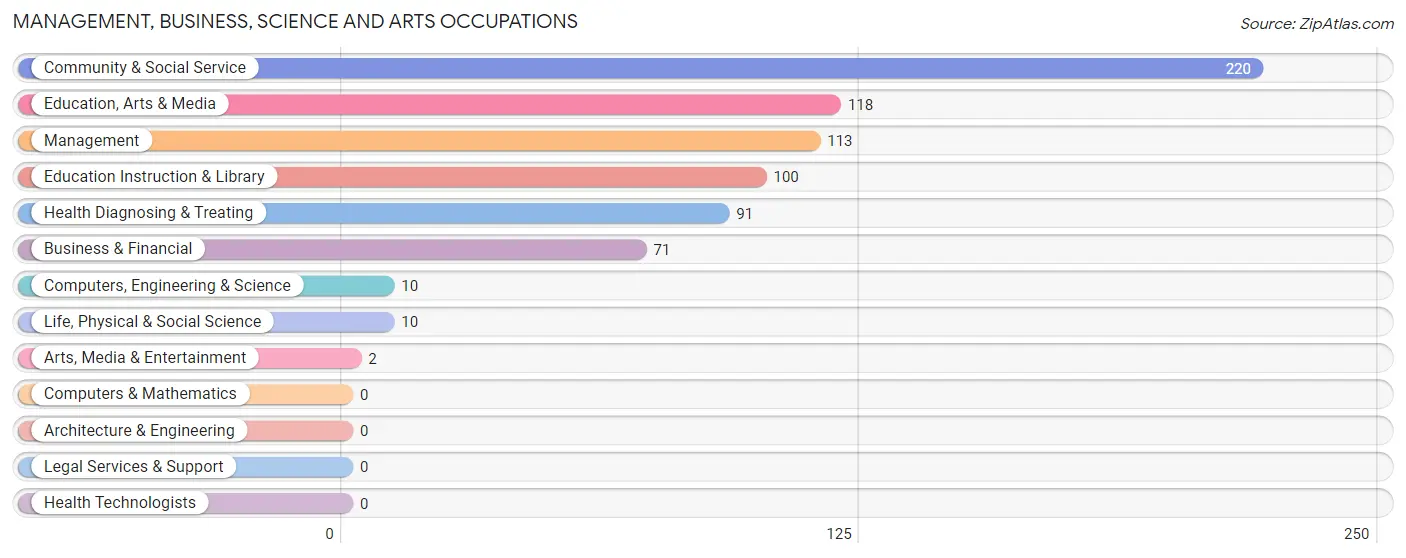
Management, Business, Science and Arts Occupations
The most common Management, Business, Science and Arts occupations in Lakeshore are Community & Social Service (220 | 17.0%), Education, Arts & Media (118 | 9.1%), Management (113 | 8.7%), Education Instruction & Library (100 | 7.7%), and Health Diagnosing & Treating (91 | 7.0%).
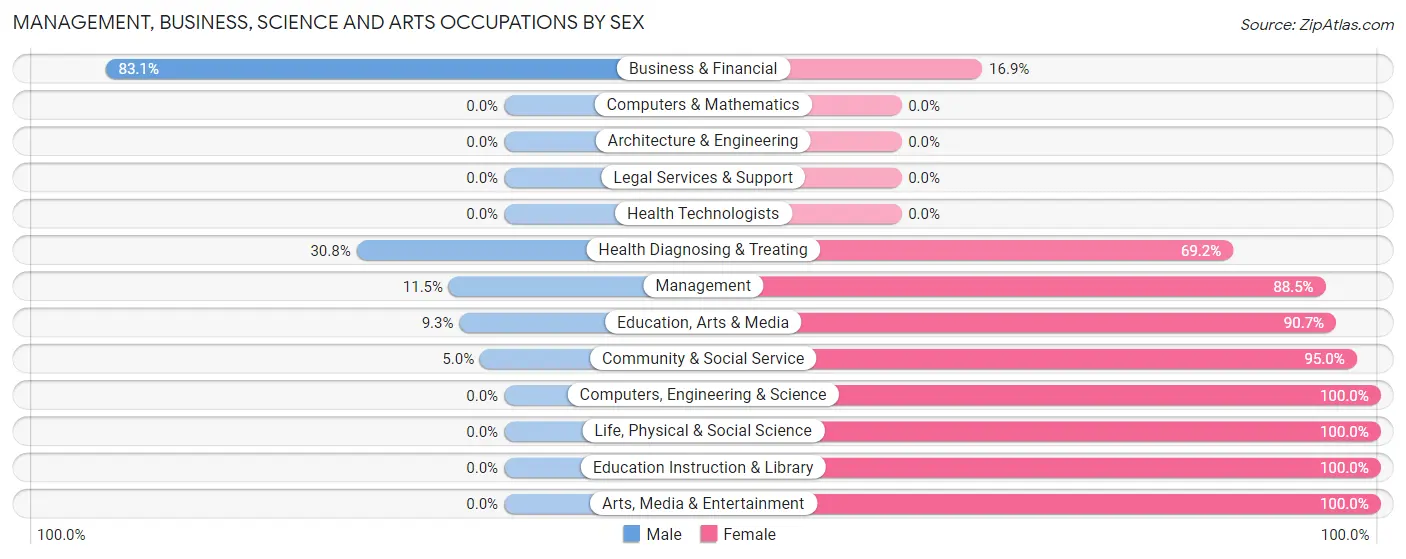
Management, Business, Science and Arts Occupations by Sex
Within the Management, Business, Science and Arts occupations in Lakeshore, the most male-oriented occupations are Business & Financial (83.1%), Health Diagnosing & Treating (30.8%), and Management (11.5%), while the most female-oriented occupations are Computers, Engineering & Science (100.0%), Life, Physical & Social Science (100.0%), and Education Instruction & Library (100.0%).
| Occupation | Male | Female |
| Management | 13 (11.5%) | 100 (88.5%) |
| Business & Financial | 59 (83.1%) | 12 (16.9%) |
| Computers, Engineering & Science | 0 (0.0%) | 10 (100.0%) |
| Computers & Mathematics | 0 (0.0%) | 0 (0.0%) |
| Architecture & Engineering | 0 (0.0%) | 0 (0.0%) |
| Life, Physical & Social Science | 0 (0.0%) | 10 (100.0%) |
| Community & Social Service | 11 (5.0%) | 209 (95.0%) |
| Education, Arts & Media | 11 (9.3%) | 107 (90.7%) |
| Legal Services & Support | 0 (0.0%) | 0 (0.0%) |
| Education Instruction & Library | 0 (0.0%) | 100 (100.0%) |
| Arts, Media & Entertainment | 0 (0.0%) | 2 (100.0%) |
| Health Diagnosing & Treating | 28 (30.8%) | 63 (69.2%) |
| Health Technologists | 0 (0.0%) | 0 (0.0%) |
| Total (Category) | 111 (22.0%) | 394 (78.0%) |
| Total (Overall) | 681 (52.6%) | 614 (47.4%) |
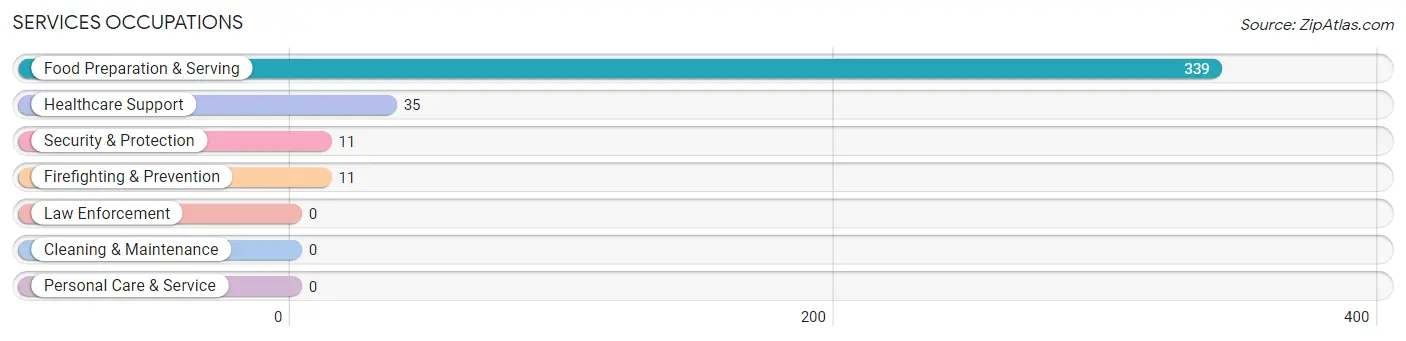
Services Occupations
The most common Services occupations in Lakeshore are Food Preparation & Serving (339 | 26.2%), Healthcare Support (35 | 2.7%), Security & Protection (11 | 0.9%), and Firefighting & Prevention (11 | 0.9%).
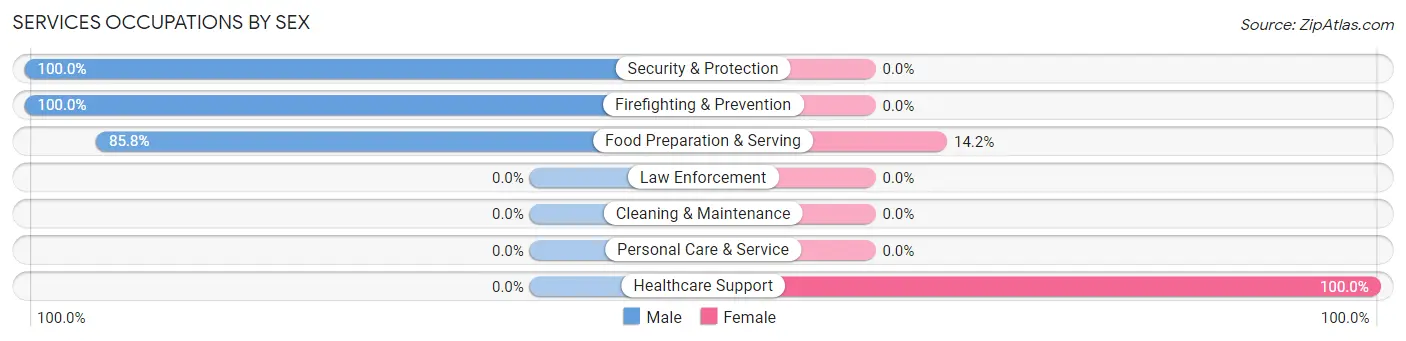
Services Occupations by Sex
Within the Services occupations in Lakeshore, the most male-oriented occupations are Security & Protection (100.0%), Firefighting & Prevention (100.0%), and Food Preparation & Serving (85.8%), while the most female-oriented occupations are Healthcare Support (100.0%), and Food Preparation & Serving (14.2%).
| Occupation | Male | Female |
| Healthcare Support | 0 (0.0%) | 35 (100.0%) |
| Security & Protection | 11 (100.0%) | 0 (0.0%) |
| Firefighting & Prevention | 11 (100.0%) | 0 (0.0%) |
| Law Enforcement | 0 (0.0%) | 0 (0.0%) |
| Food Preparation & Serving | 291 (85.8%) | 48 (14.2%) |
| Cleaning & Maintenance | 0 (0.0%) | 0 (0.0%) |
| Personal Care & Service | 0 (0.0%) | 0 (0.0%) |
| Total (Category) | 302 (78.4%) | 83 (21.6%) |
| Total (Overall) | 681 (52.6%) | 614 (47.4%) |
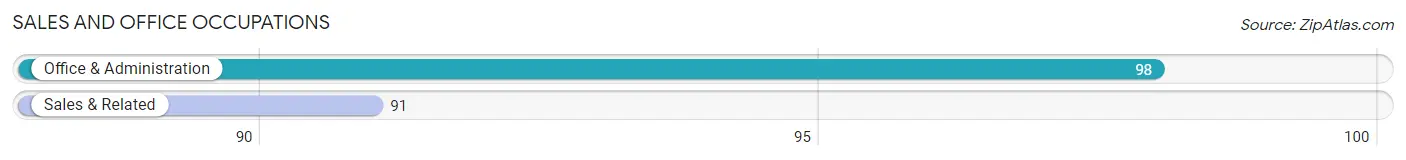
Sales and Office Occupations
The most common Sales and Office occupations in Lakeshore are Office & Administration (98 | 7.6%), and Sales & Related (91 | 7.0%).
Sales and Office Occupations by Sex
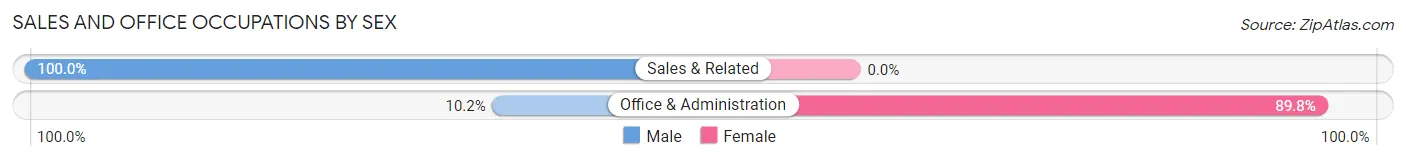
| Occupation | Male | Female |
| Sales & Related | 91 (100.0%) | 0 (0.0%) |
| Office & Administration | 10 (10.2%) | 88 (89.8%) |
| Total (Category) | 101 (53.4%) | 88 (46.6%) |
| Total (Overall) | 681 (52.6%) | 614 (47.4%) |
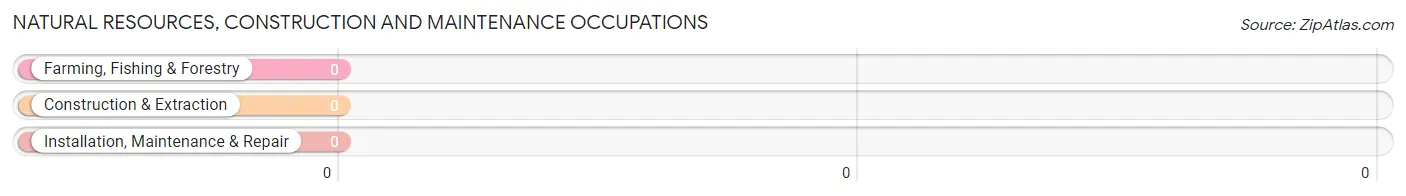
Natural Resources, Construction and Maintenance Occupations
Natural Resources, Construction and Maintenance Occupations by Sex
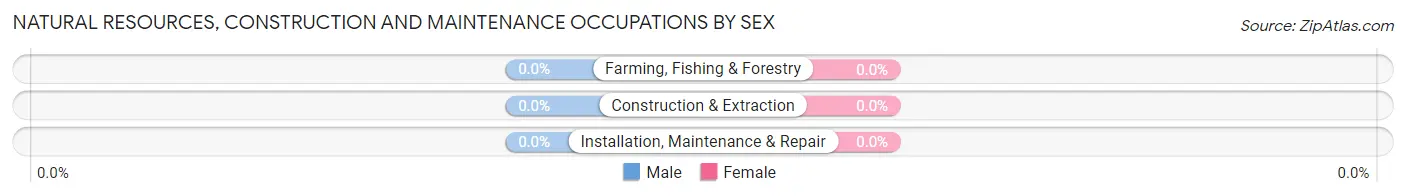
| Occupation | Male | Female |
| Farming, Fishing & Forestry | 0 (0.0%) | 0 (0.0%) |
| Construction & Extraction | 0 (0.0%) | 0 (0.0%) |
| Installation, Maintenance & Repair | 0 (0.0%) | 0 (0.0%) |
| Total (Category) | 0 (0.0%) | 0 (0.0%) |
| Total (Overall) | 681 (52.6%) | 614 (47.4%) |
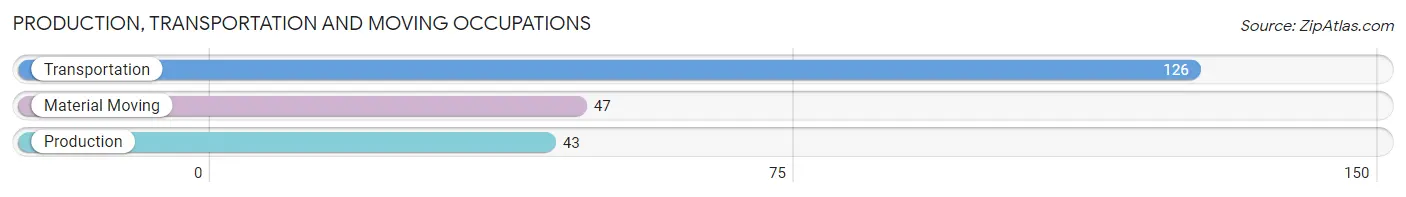
Production, Transportation and Moving Occupations
The most common Production, Transportation and Moving occupations in Lakeshore are Transportation (126 | 9.7%), Material Moving (47 | 3.6%), and Production (43 | 3.3%).
Production, Transportation and Moving Occupations by Sex
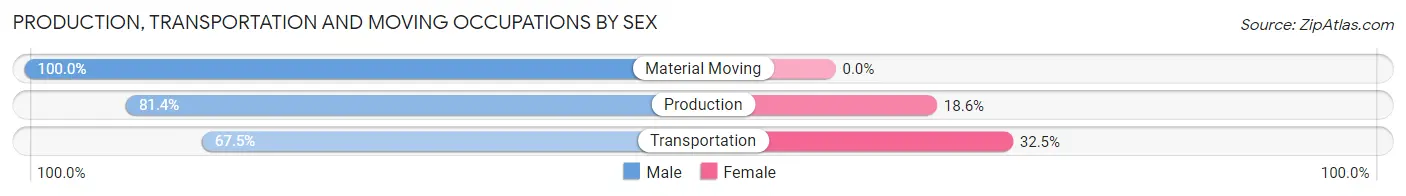
| Occupation | Male | Female |
| Production | 35 (81.4%) | 8 (18.6%) |
| Transportation | 85 (67.5%) | 41 (32.5%) |
| Material Moving | 47 (100.0%) | 0 (0.0%) |
| Total (Category) | 167 (77.3%) | 49 (22.7%) |
| Total (Overall) | 681 (52.6%) | 614 (47.4%) |
Employment Industries by Sex in Lakeshore
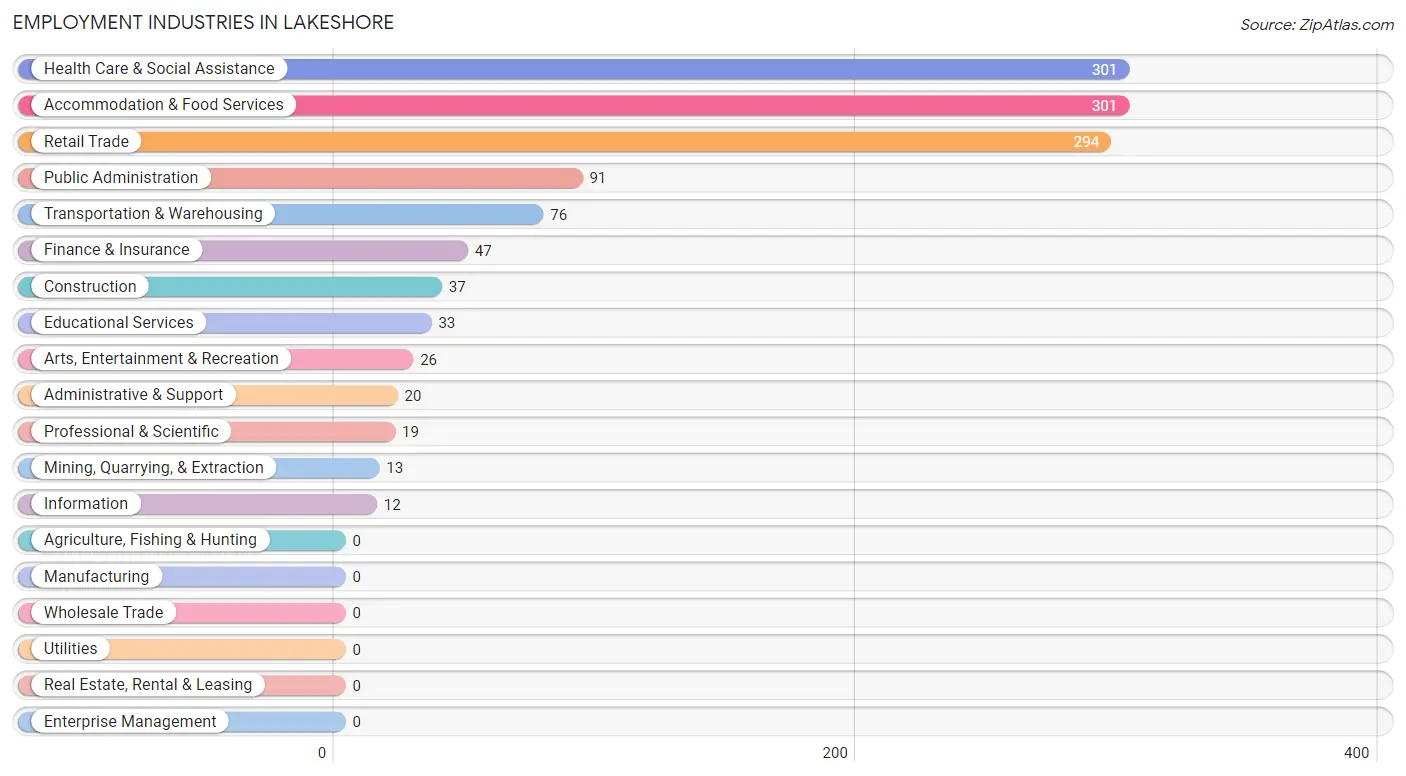
Employment Industries in Lakeshore
The major employment industries in Lakeshore include Health Care & Social Assistance (301 | 23.2%), Accommodation & Food Services (301 | 23.2%), Retail Trade (294 | 22.7%), Public Administration (91 | 7.0%), and Transportation & Warehousing (76 | 5.9%).
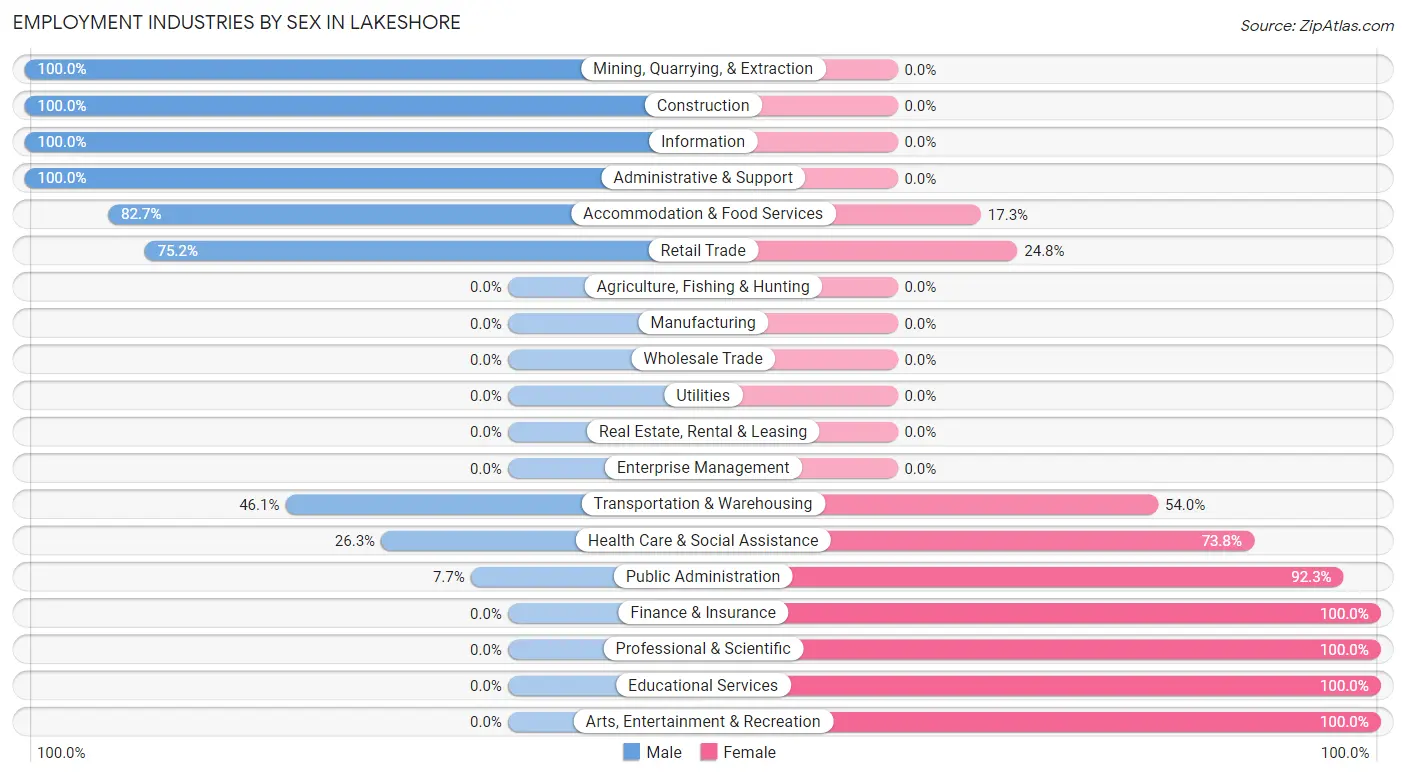
Employment Industries by Sex in Lakeshore
The Lakeshore industries that see more men than women are Mining, Quarrying, & Extraction (100.0%), Construction (100.0%), and Information (100.0%), whereas the industries that tend to have a higher number of women are Finance & Insurance (100.0%), Professional & Scientific (100.0%), and Educational Services (100.0%).
| Industry | Male | Female |
| Agriculture, Fishing & Hunting | 0 (0.0%) | 0 (0.0%) |
| Mining, Quarrying, & Extraction | 13 (100.0%) | 0 (0.0%) |
| Construction | 37 (100.0%) | 0 (0.0%) |
| Manufacturing | 0 (0.0%) | 0 (0.0%) |
| Wholesale Trade | 0 (0.0%) | 0 (0.0%) |
| Retail Trade | 221 (75.2%) | 73 (24.8%) |
| Transportation & Warehousing | 35 (46.1%) | 41 (53.9%) |
| Utilities | 0 (0.0%) | 0 (0.0%) |
| Information | 12 (100.0%) | 0 (0.0%) |
| Finance & Insurance | 0 (0.0%) | 47 (100.0%) |
| Real Estate, Rental & Leasing | 0 (0.0%) | 0 (0.0%) |
| Professional & Scientific | 0 (0.0%) | 19 (100.0%) |
| Enterprise Management | 0 (0.0%) | 0 (0.0%) |
| Administrative & Support | 20 (100.0%) | 0 (0.0%) |
| Educational Services | 0 (0.0%) | 33 (100.0%) |
| Health Care & Social Assistance | 79 (26.3%) | 222 (73.8%) |
| Arts, Entertainment & Recreation | 0 (0.0%) | 26 (100.0%) |
| Accommodation & Food Services | 249 (82.7%) | 52 (17.3%) |
| Public Administration | 7 (7.7%) | 84 (92.3%) |
| Total | 681 (52.6%) | 614 (47.4%) |
Education in Lakeshore
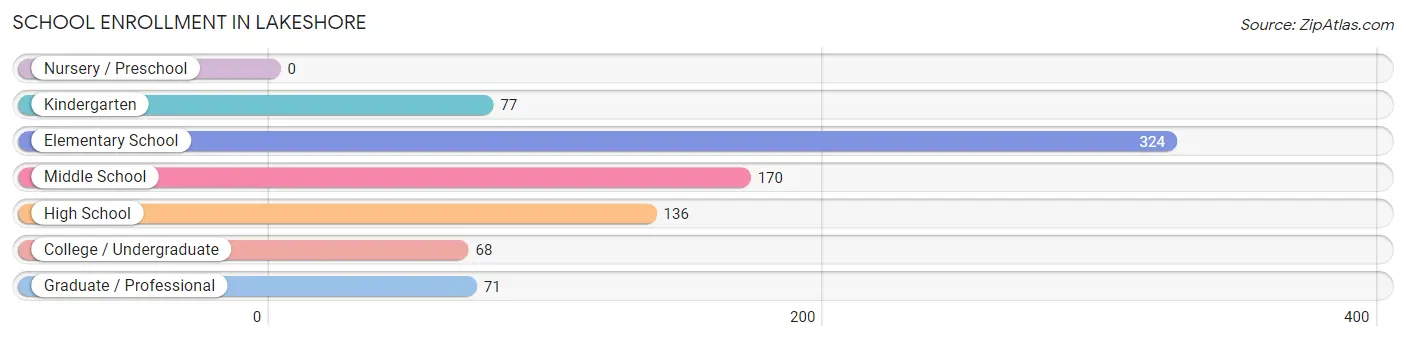
School Enrollment in Lakeshore
The most common levels of schooling among the 846 students in Lakeshore are elementary school (324 | 38.3%), middle school (170 | 20.1%), and high school (136 | 16.1%).
| School Level | # Students | % Students |
| Nursery / Preschool | 0 | 0.0% |
| Kindergarten | 77 | 9.1% |
| Elementary School | 324 | 38.3% |
| Middle School | 170 | 20.1% |
| High School | 136 | 16.1% |
| College / Undergraduate | 68 | 8.0% |
| Graduate / Professional | 71 | 8.4% |
| Total | 846 | 100.0% |
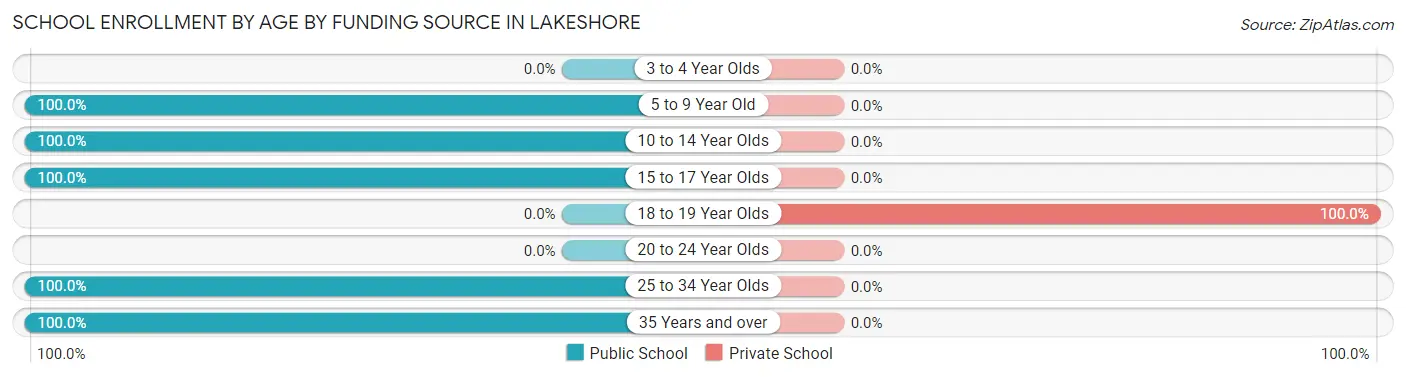
School Enrollment by Age by Funding Source in Lakeshore
Out of a total of 846 students who are enrolled in schools in Lakeshore, 76 (9.0%) attend a private institution, while the remaining 770 (91.0%) are enrolled in public schools. The age group of 18 to 19 year olds has the highest likelihood of being enrolled in private schools, with 76 (100.0% in the age bracket) enrolled. Conversely, the age group of 5 to 9 year old has the lowest likelihood of being enrolled in a private school, with 365 (100.0% in the age bracket) attending a public institution.
| Age Bracket | Public School | Private School |
| 3 to 4 Year Olds | 0 (0.0%) | 0 (0.0%) |
| 5 to 9 Year Old | 365 (100.0%) | 0 (0.0%) |
| 10 to 14 Year Olds | 206 (100.0%) | 0 (0.0%) |
| 15 to 17 Year Olds | 66 (100.0%) | 0 (0.0%) |
| 18 to 19 Year Olds | 0 (0.0%) | 76 (100.0%) |
| 20 to 24 Year Olds | 0 (0.0%) | 0 (0.0%) |
| 25 to 34 Year Olds | 84 (100.0%) | 0 (0.0%) |
| 35 Years and over | 49 (100.0%) | 0 (0.0%) |
| Total | 770 (91.0%) | 76 (9.0%) |
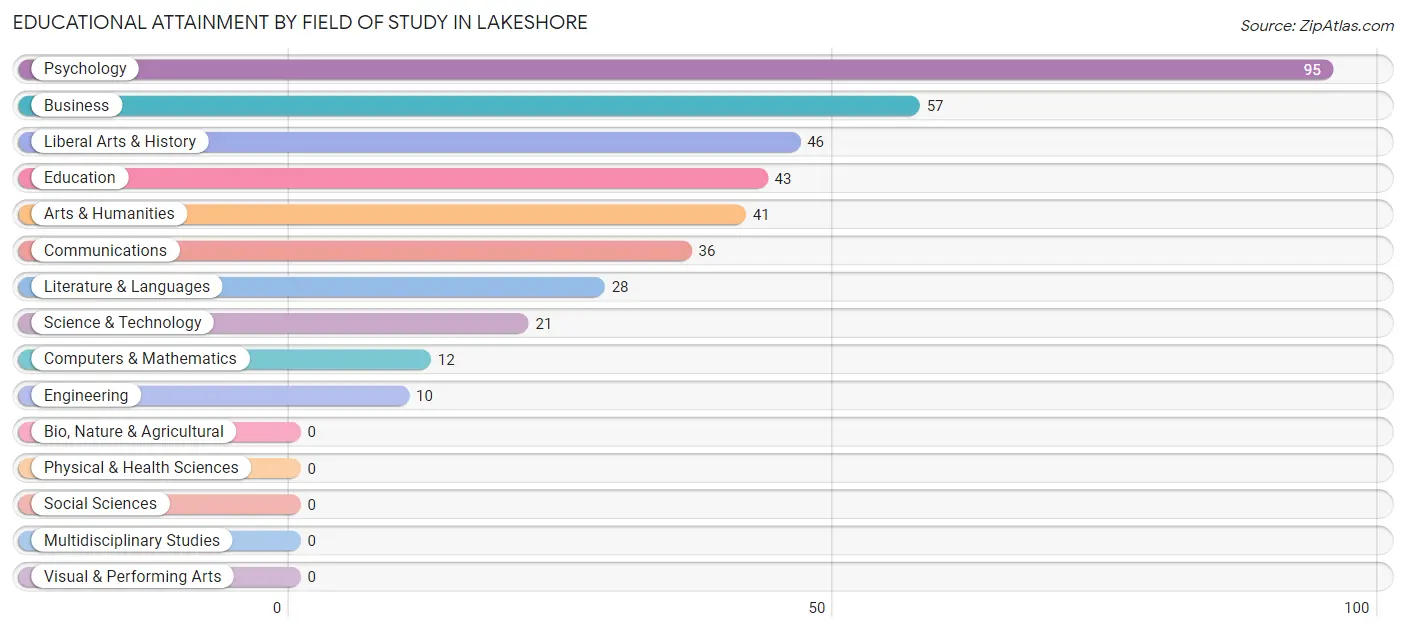
Educational Attainment by Field of Study in Lakeshore
Psychology (95 | 24.4%), business (57 | 14.6%), liberal arts & history (46 | 11.8%), education (43 | 11.1%), and arts & humanities (41 | 10.5%) are the most common fields of study among 389 individuals in Lakeshore who have obtained a bachelor's degree or higher.
| Field of Study | # Graduates | % Graduates |
| Computers & Mathematics | 12 | 3.1% |
| Bio, Nature & Agricultural | 0 | 0.0% |
| Physical & Health Sciences | 0 | 0.0% |
| Psychology | 95 | 24.4% |
| Social Sciences | 0 | 0.0% |
| Engineering | 10 | 2.6% |
| Multidisciplinary Studies | 0 | 0.0% |
| Science & Technology | 21 | 5.4% |
| Business | 57 | 14.6% |
| Education | 43 | 11.1% |
| Literature & Languages | 28 | 7.2% |
| Liberal Arts & History | 46 | 11.8% |
| Visual & Performing Arts | 0 | 0.0% |
| Communications | 36 | 9.2% |
| Arts & Humanities | 41 | 10.5% |
| Total | 389 | 100.0% |
Transportation & Commute in Lakeshore
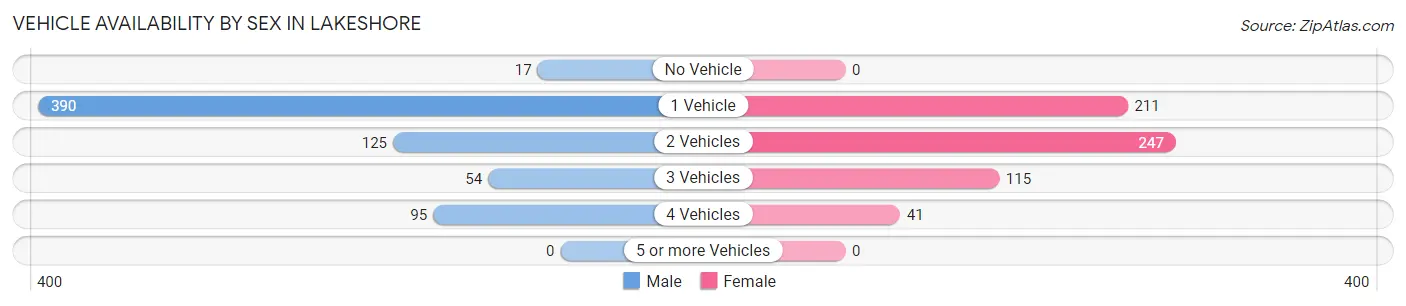
Vehicle Availability by Sex in Lakeshore
The most prevalent vehicle ownership categories in Lakeshore are males with 1 vehicle (390, accounting for 57.3%) and females with 1 vehicle (211, making up 63.5%).
| Vehicles Available | Male | Female |
| No Vehicle | 17 (2.5%) | 0 (0.0%) |
| 1 Vehicle | 390 (57.3%) | 211 (34.4%) |
| 2 Vehicles | 125 (18.4%) | 247 (40.2%) |
| 3 Vehicles | 54 (7.9%) | 115 (18.7%) |
| 4 Vehicles | 95 (14.0%) | 41 (6.7%) |
| 5 or more Vehicles | 0 (0.0%) | 0 (0.0%) |
| Total | 681 (100.0%) | 614 (100.0%) |
Commute Time in Lakeshore
The most frequently occuring commute durations in Lakeshore are 15 to 19 minutes (418 commuters, 39.7%), 20 to 24 minutes (208 commuters, 19.8%), and 10 to 14 minutes (186 commuters, 17.7%).
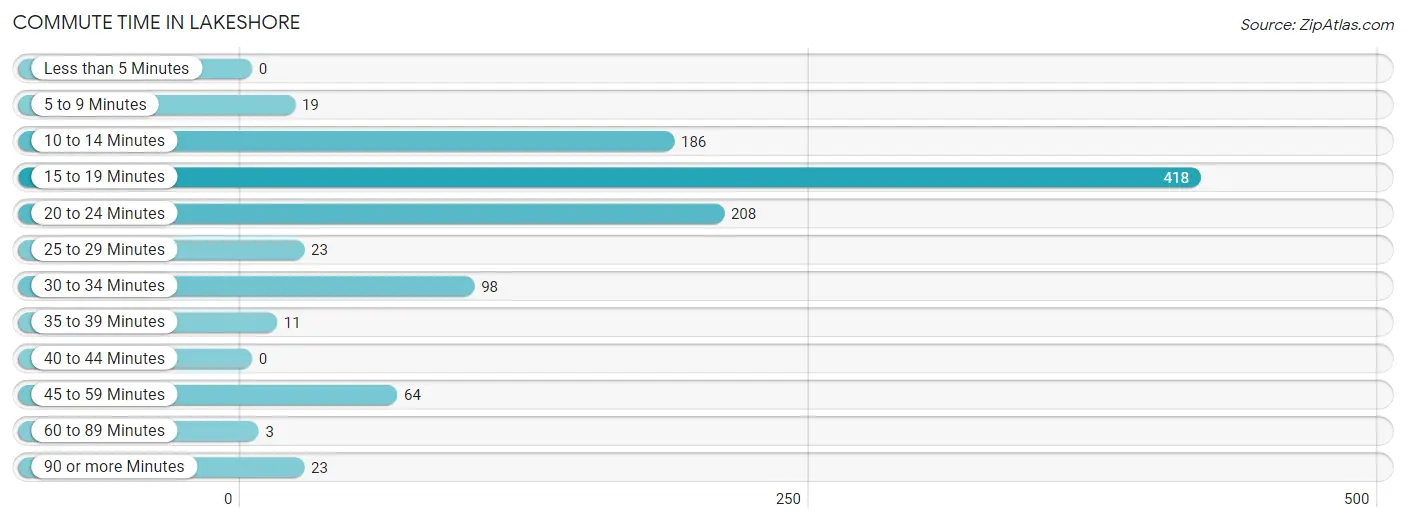
| Commute Time | # Commuters | % Commuters |
| Less than 5 Minutes | 0 | 0.0% |
| 5 to 9 Minutes | 19 | 1.8% |
| 10 to 14 Minutes | 186 | 17.7% |
| 15 to 19 Minutes | 418 | 39.7% |
| 20 to 24 Minutes | 208 | 19.8% |
| 25 to 29 Minutes | 23 | 2.2% |
| 30 to 34 Minutes | 98 | 9.3% |
| 35 to 39 Minutes | 11 | 1.0% |
| 40 to 44 Minutes | 0 | 0.0% |
| 45 to 59 Minutes | 64 | 6.1% |
| 60 to 89 Minutes | 3 | 0.3% |
| 90 or more Minutes | 23 | 2.2% |
Commute Time by Sex in Lakeshore
The most common commute times in Lakeshore are 15 to 19 minutes (245 commuters, 51.0%) for males and 20 to 24 minutes (195 commuters, 34.0%) for females.
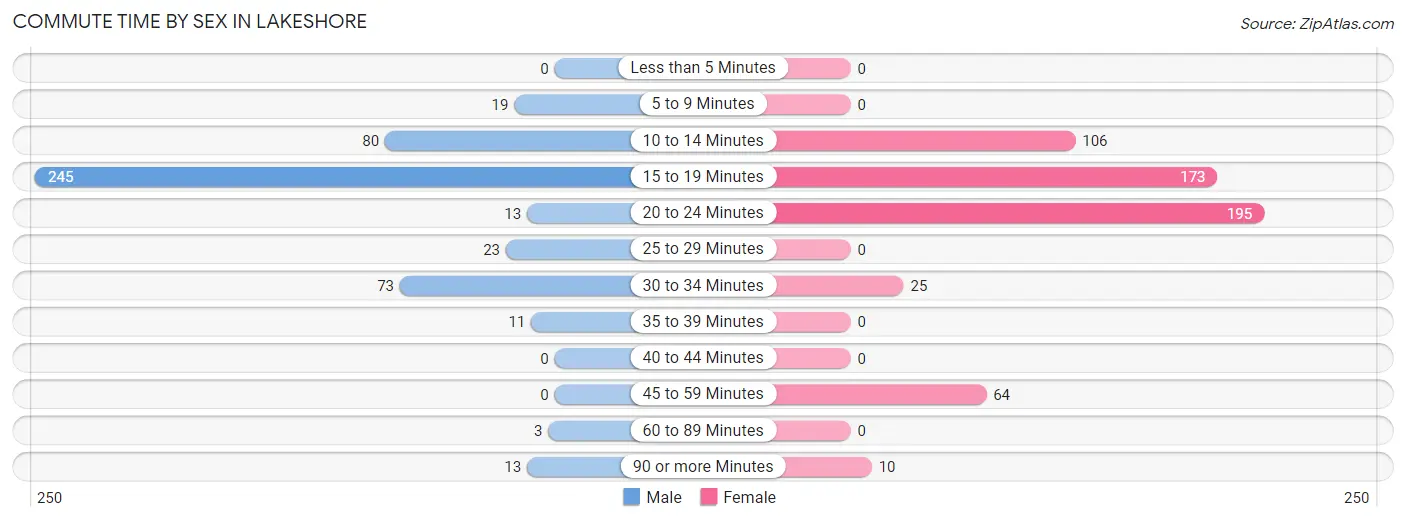
| Commute Time | Male | Female |
| Less than 5 Minutes | 0 (0.0%) | 0 (0.0%) |
| 5 to 9 Minutes | 19 (4.0%) | 0 (0.0%) |
| 10 to 14 Minutes | 80 (16.7%) | 106 (18.5%) |
| 15 to 19 Minutes | 245 (51.0%) | 173 (30.2%) |
| 20 to 24 Minutes | 13 (2.7%) | 195 (34.0%) |
| 25 to 29 Minutes | 23 (4.8%) | 0 (0.0%) |
| 30 to 34 Minutes | 73 (15.2%) | 25 (4.4%) |
| 35 to 39 Minutes | 11 (2.3%) | 0 (0.0%) |
| 40 to 44 Minutes | 0 (0.0%) | 0 (0.0%) |
| 45 to 59 Minutes | 0 (0.0%) | 64 (11.2%) |
| 60 to 89 Minutes | 3 (0.6%) | 0 (0.0%) |
| 90 or more Minutes | 13 (2.7%) | 10 (1.8%) |
Time of Departure to Work by Sex in Lakeshore
The most frequent times of departure to work in Lakeshore are 7:30 AM to 7:59 AM (162, 33.8%) for males and 6:30 AM to 6:59 AM (147, 25.7%) for females.
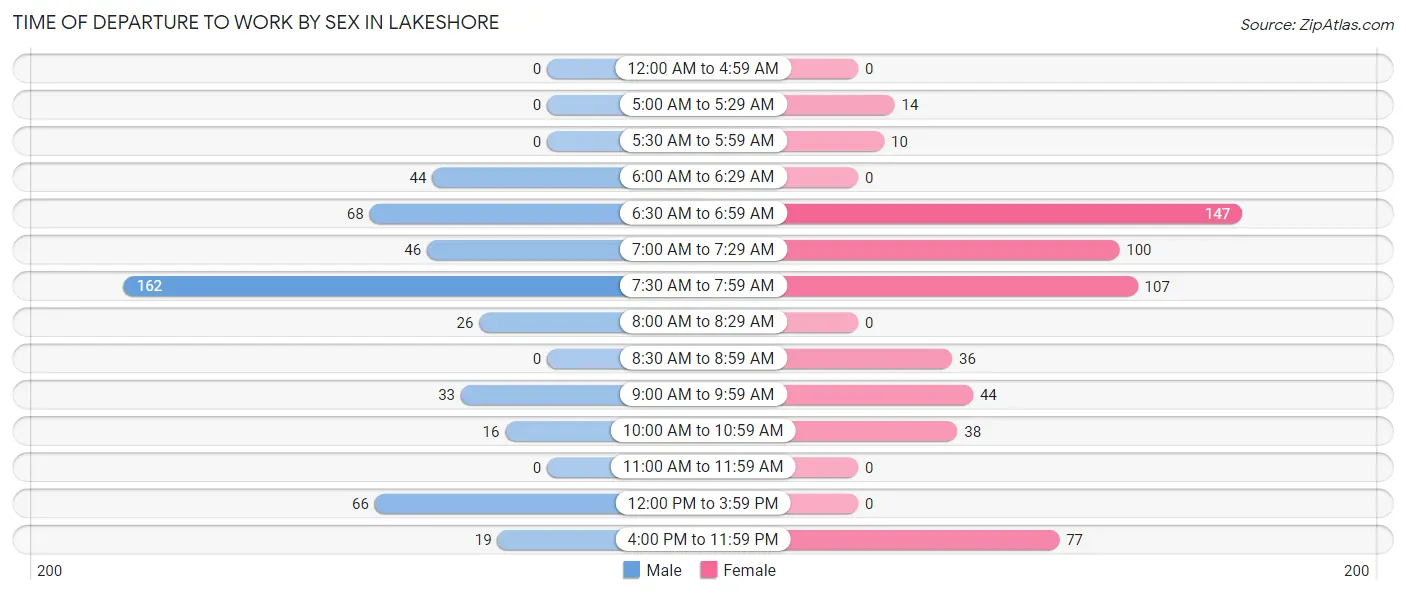
| Time of Departure | Male | Female |
| 12:00 AM to 4:59 AM | 0 (0.0%) | 0 (0.0%) |
| 5:00 AM to 5:29 AM | 0 (0.0%) | 14 (2.4%) |
| 5:30 AM to 5:59 AM | 0 (0.0%) | 10 (1.8%) |
| 6:00 AM to 6:29 AM | 44 (9.2%) | 0 (0.0%) |
| 6:30 AM to 6:59 AM | 68 (14.2%) | 147 (25.7%) |
| 7:00 AM to 7:29 AM | 46 (9.6%) | 100 (17.4%) |
| 7:30 AM to 7:59 AM | 162 (33.8%) | 107 (18.7%) |
| 8:00 AM to 8:29 AM | 26 (5.4%) | 0 (0.0%) |
| 8:30 AM to 8:59 AM | 0 (0.0%) | 36 (6.3%) |
| 9:00 AM to 9:59 AM | 33 (6.9%) | 44 (7.7%) |
| 10:00 AM to 10:59 AM | 16 (3.3%) | 38 (6.6%) |
| 11:00 AM to 11:59 AM | 0 (0.0%) | 0 (0.0%) |
| 12:00 PM to 3:59 PM | 66 (13.8%) | 0 (0.0%) |
| 4:00 PM to 11:59 PM | 19 (4.0%) | 77 (13.4%) |
| Total | 480 (100.0%) | 573 (100.0%) |
Housing Occupancy in Lakeshore
Occupancy by Ownership in Lakeshore
Of the total 1,101 dwellings in Lakeshore, owner-occupied units account for 599 (54.4%), while renter-occupied units make up 502 (45.6%).
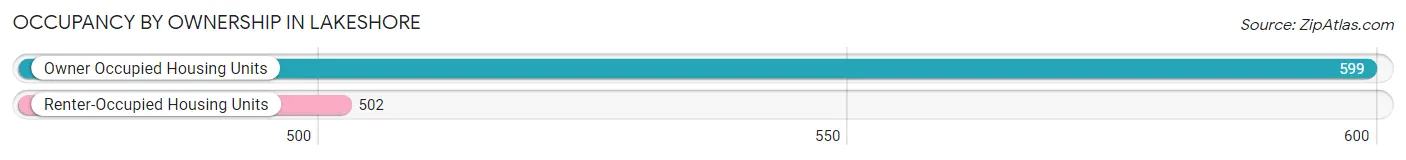
| Occupancy | # Housing Units | % Housing Units |
| Owner Occupied Housing Units | 599 | 54.4% |
| Renter-Occupied Housing Units | 502 | 45.6% |
| Total Occupied Housing Units | 1,101 | 100.0% |
Occupancy by Household Size in Lakeshore
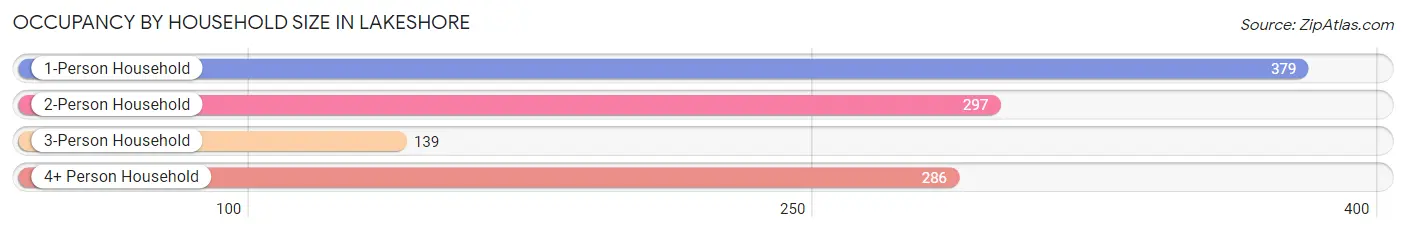
| Household Size | # Housing Units | % Housing Units |
| 1-Person Household | 379 | 34.4% |
| 2-Person Household | 297 | 27.0% |
| 3-Person Household | 139 | 12.6% |
| 4+ Person Household | 286 | 26.0% |
| Total Housing Units | 1,101 | 100.0% |
Occupancy by Ownership by Household Size in Lakeshore
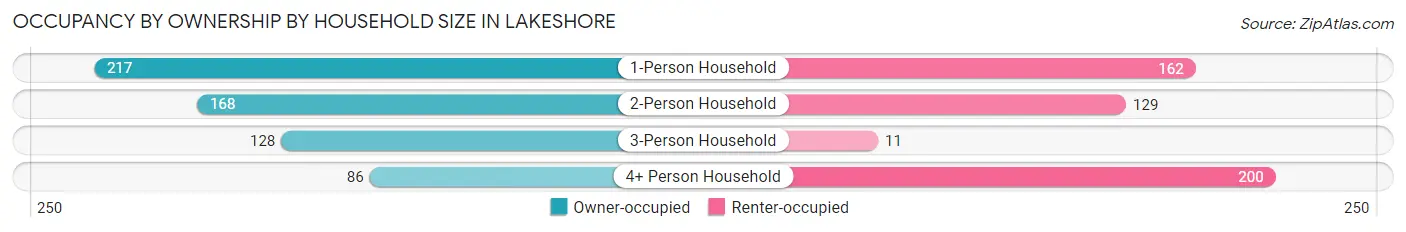
| Household Size | Owner-occupied | Renter-occupied |
| 1-Person Household | 217 (57.3%) | 162 (42.7%) |
| 2-Person Household | 168 (56.6%) | 129 (43.4%) |
| 3-Person Household | 128 (92.1%) | 11 (7.9%) |
| 4+ Person Household | 86 (30.1%) | 200 (69.9%) |
| Total Housing Units | 599 (54.4%) | 502 (45.6%) |
Occupancy by Educational Attainment in Lakeshore
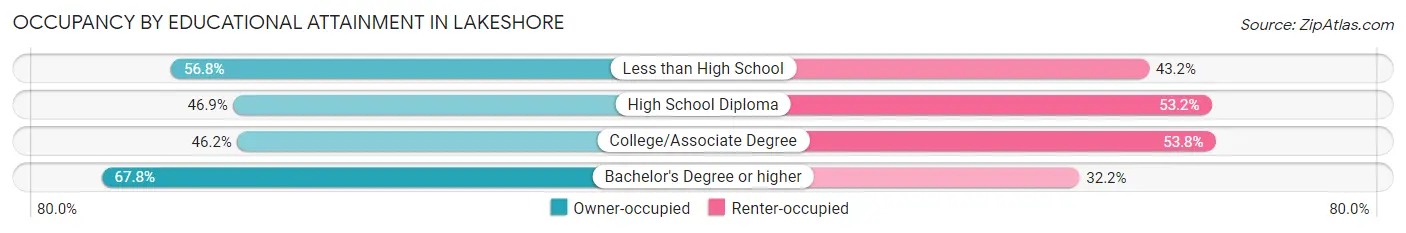
| Household Size | Owner-occupied | Renter-occupied |
| Less than High School | 84 (56.8%) | 64 (43.2%) |
| High School Diploma | 223 (46.9%) | 253 (53.1%) |
| College/Associate Degree | 67 (46.2%) | 78 (53.8%) |
| Bachelor's Degree or higher | 225 (67.8%) | 107 (32.2%) |
Occupancy by Age of Householder in Lakeshore
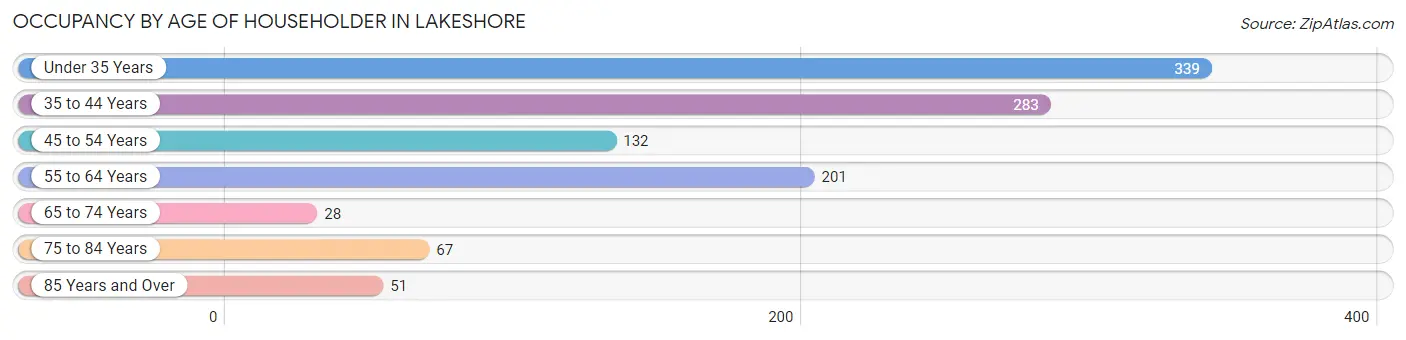
| Age Bracket | # Households | % Households |
| Under 35 Years | 339 | 30.8% |
| 35 to 44 Years | 283 | 25.7% |
| 45 to 54 Years | 132 | 12.0% |
| 55 to 64 Years | 201 | 18.3% |
| 65 to 74 Years | 28 | 2.5% |
| 75 to 84 Years | 67 | 6.1% |
| 85 Years and Over | 51 | 4.6% |
| Total | 1,101 | 100.0% |
Housing Finances in Lakeshore
Median Income by Occupancy in Lakeshore
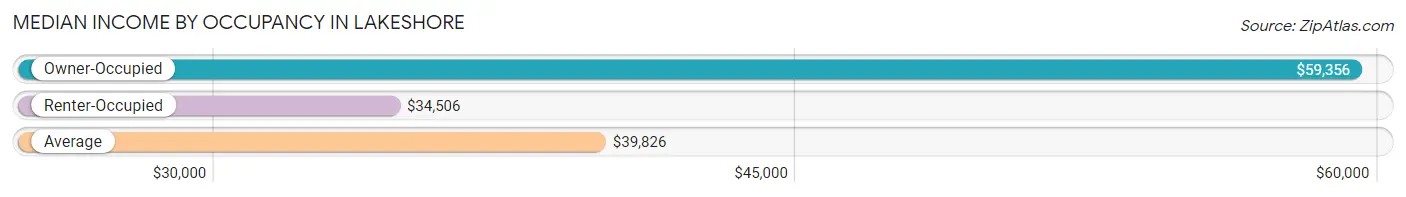
| Occupancy Type | # Households | Median Income |
| Owner-Occupied | 599 (54.4%) | $59,356 |
| Renter-Occupied | 502 (45.6%) | $34,506 |
| Average | 1,101 (100.0%) | $39,826 |
Occupancy by Householder Income Bracket in Lakeshore
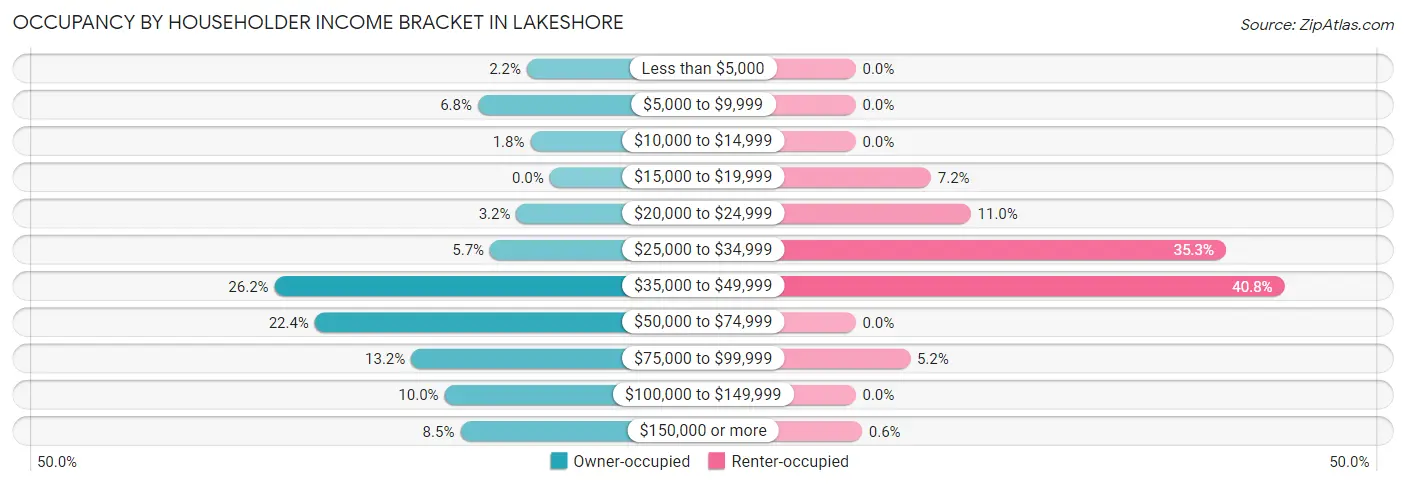
| Income Bracket | Owner-occupied | Renter-occupied |
| Less than $5,000 | 13 (2.2%) | 0 (0.0%) |
| $5,000 to $9,999 | 41 (6.8%) | 0 (0.0%) |
| $10,000 to $14,999 | 11 (1.8%) | 0 (0.0%) |
| $15,000 to $19,999 | 0 (0.0%) | 36 (7.2%) |
| $20,000 to $24,999 | 19 (3.2%) | 55 (11.0%) |
| $25,000 to $34,999 | 34 (5.7%) | 177 (35.3%) |
| $35,000 to $49,999 | 157 (26.2%) | 205 (40.8%) |
| $50,000 to $74,999 | 134 (22.4%) | 0 (0.0%) |
| $75,000 to $99,999 | 79 (13.2%) | 26 (5.2%) |
| $100,000 to $149,999 | 60 (10.0%) | 0 (0.0%) |
| $150,000 or more | 51 (8.5%) | 3 (0.6%) |
| Total | 599 (100.0%) | 502 (100.0%) |
Monthly Housing Cost Tiers in Lakeshore
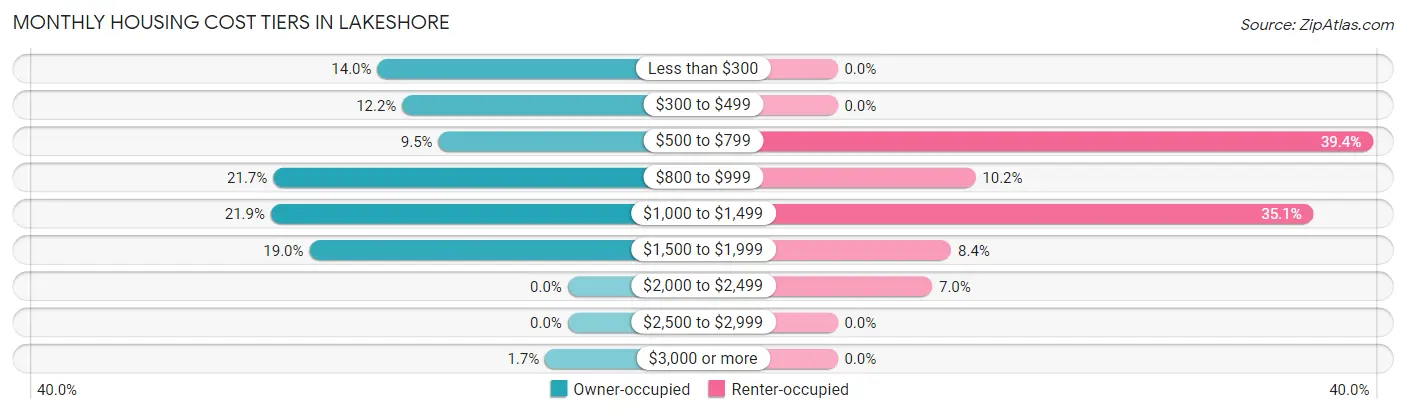
| Monthly Cost | Owner-occupied | Renter-occupied |
| Less than $300 | 84 (14.0%) | 0 (0.0%) |
| $300 to $499 | 73 (12.2%) | 0 (0.0%) |
| $500 to $799 | 57 (9.5%) | 198 (39.4%) |
| $800 to $999 | 130 (21.7%) | 51 (10.2%) |
| $1,000 to $1,499 | 131 (21.9%) | 176 (35.1%) |
| $1,500 to $1,999 | 114 (19.0%) | 42 (8.4%) |
| $2,000 to $2,499 | 0 (0.0%) | 35 (7.0%) |
| $2,500 to $2,999 | 0 (0.0%) | 0 (0.0%) |
| $3,000 or more | 10 (1.7%) | 0 (0.0%) |
| Total | 599 (100.0%) | 502 (100.0%) |
Physical Housing Characteristics in Lakeshore
Housing Structures in Lakeshore
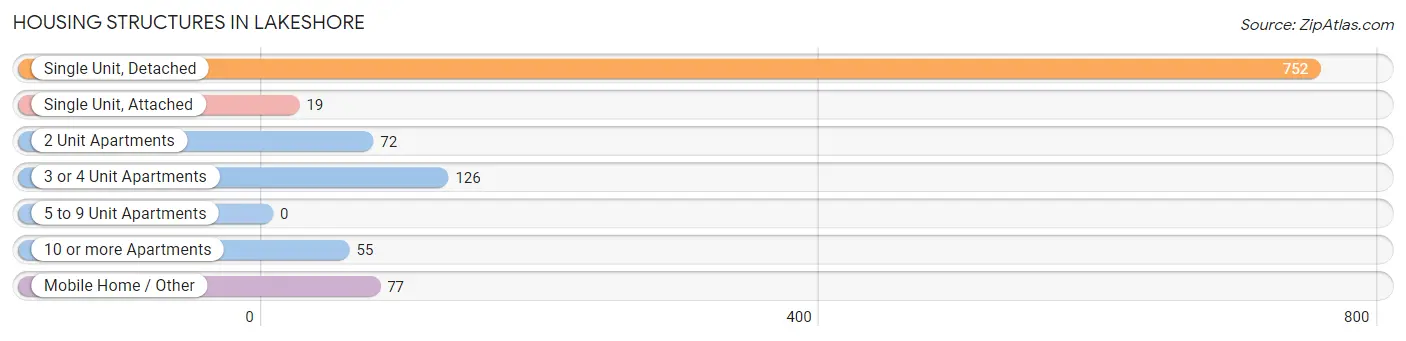
| Structure Type | # Housing Units | % Housing Units |
| Single Unit, Detached | 752 | 68.3% |
| Single Unit, Attached | 19 | 1.7% |
| 2 Unit Apartments | 72 | 6.5% |
| 3 or 4 Unit Apartments | 126 | 11.4% |
| 5 to 9 Unit Apartments | 0 | 0.0% |
| 10 or more Apartments | 55 | 5.0% |
| Mobile Home / Other | 77 | 7.0% |
| Total | 1,101 | 100.0% |
Housing Structures by Occupancy in Lakeshore
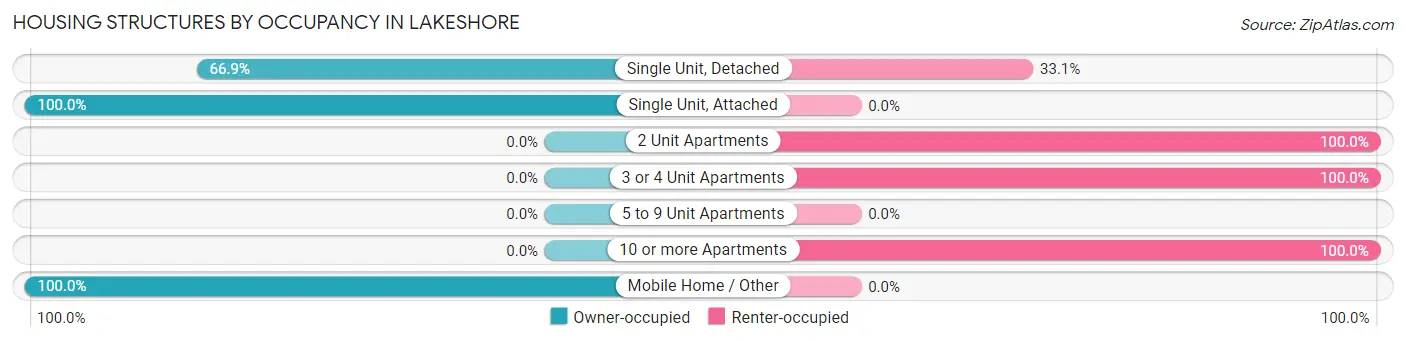
| Structure Type | Owner-occupied | Renter-occupied |
| Single Unit, Detached | 503 (66.9%) | 249 (33.1%) |
| Single Unit, Attached | 19 (100.0%) | 0 (0.0%) |
| 2 Unit Apartments | 0 (0.0%) | 72 (100.0%) |
| 3 or 4 Unit Apartments | 0 (0.0%) | 126 (100.0%) |
| 5 to 9 Unit Apartments | 0 (0.0%) | 0 (0.0%) |
| 10 or more Apartments | 0 (0.0%) | 55 (100.0%) |
| Mobile Home / Other | 77 (100.0%) | 0 (0.0%) |
| Total | 599 (54.4%) | 502 (45.6%) |
Housing Structures by Number of Rooms in Lakeshore
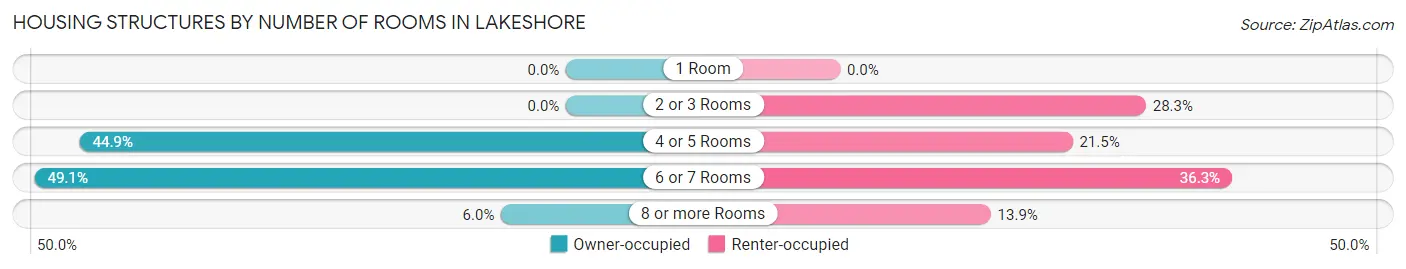
| Number of Rooms | Owner-occupied | Renter-occupied |
| 1 Room | 0 (0.0%) | 0 (0.0%) |
| 2 or 3 Rooms | 0 (0.0%) | 142 (28.3%) |
| 4 or 5 Rooms | 269 (44.9%) | 108 (21.5%) |
| 6 or 7 Rooms | 294 (49.1%) | 182 (36.2%) |
| 8 or more Rooms | 36 (6.0%) | 70 (13.9%) |
| Total | 599 (100.0%) | 502 (100.0%) |
Housing Structure by Heating Type in Lakeshore
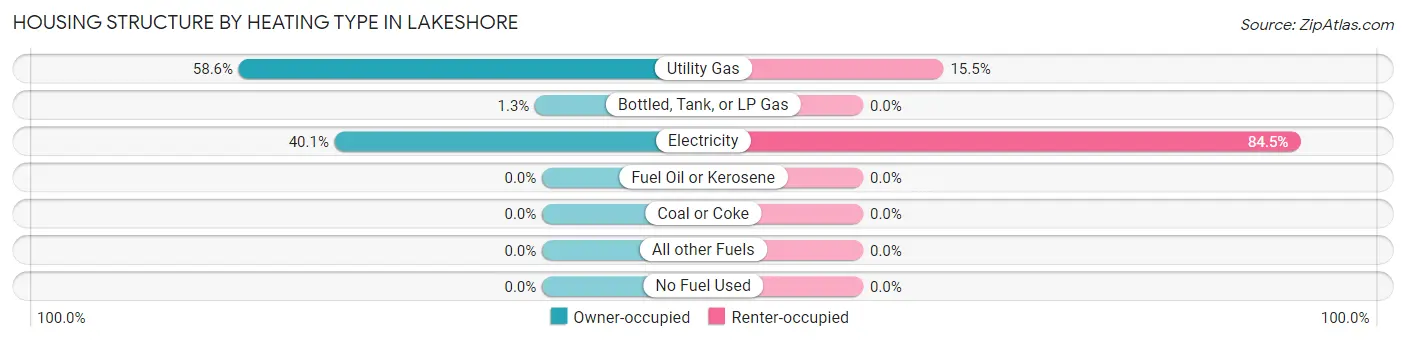
| Heating Type | Owner-occupied | Renter-occupied |
| Utility Gas | 351 (58.6%) | 78 (15.5%) |
| Bottled, Tank, or LP Gas | 8 (1.3%) | 0 (0.0%) |
| Electricity | 240 (40.1%) | 424 (84.5%) |
| Fuel Oil or Kerosene | 0 (0.0%) | 0 (0.0%) |
| Coal or Coke | 0 (0.0%) | 0 (0.0%) |
| All other Fuels | 0 (0.0%) | 0 (0.0%) |
| No Fuel Used | 0 (0.0%) | 0 (0.0%) |
| Total | 599 (100.0%) | 502 (100.0%) |
Household Vehicle Usage in Lakeshore
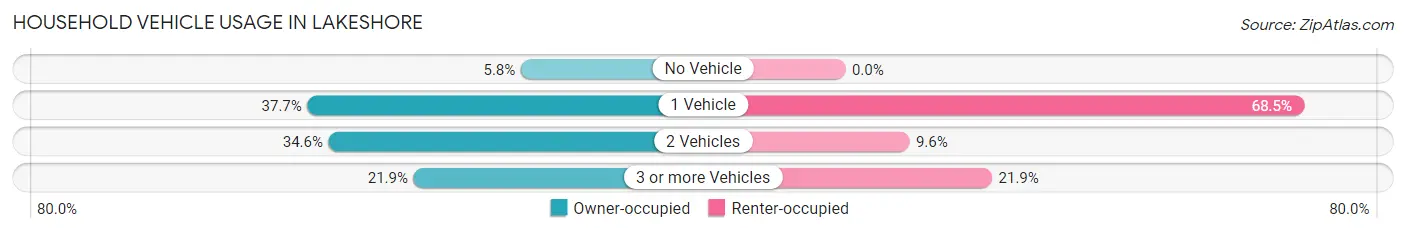
| Vehicles per Household | Owner-occupied | Renter-occupied |
| No Vehicle | 35 (5.8%) | 0 (0.0%) |
| 1 Vehicle | 226 (37.7%) | 344 (68.5%) |
| 2 Vehicles | 207 (34.6%) | 48 (9.6%) |
| 3 or more Vehicles | 131 (21.9%) | 110 (21.9%) |
| Total | 599 (100.0%) | 502 (100.0%) |
Real Estate & Mortgages in Lakeshore
Real Estate and Mortgage Overview in Lakeshore
| Characteristic | Without Mortgage | With Mortgage |
| Housing Units | 178 | 421 |
| Median Property Value | $145,500 | $122,600 |
| Median Household Income | - | - |
| Monthly Housing Costs | $336 | $10 |
| Real Estate Taxes | $377 | $137 |
Property Value by Mortgage Status in Lakeshore
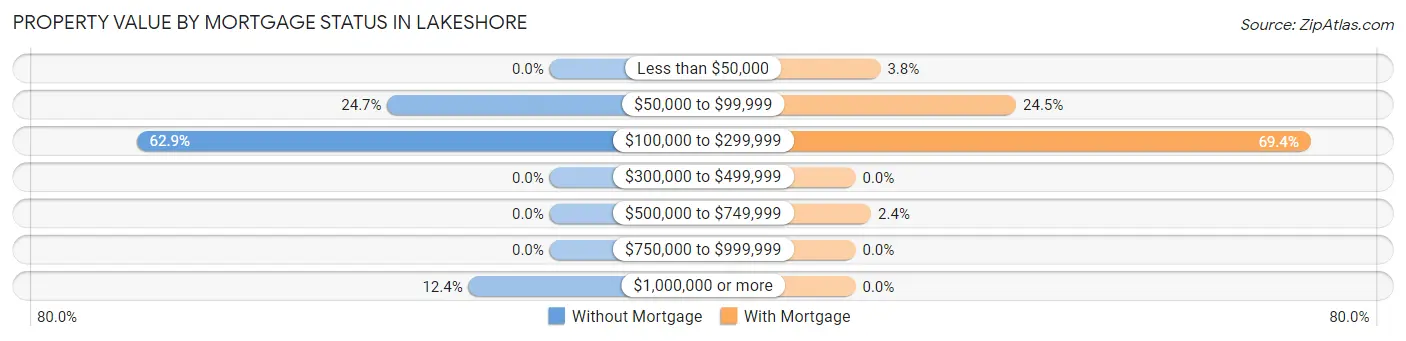
| Property Value | Without Mortgage | With Mortgage |
| Less than $50,000 | 0 (0.0%) | 16 (3.8%) |
| $50,000 to $99,999 | 44 (24.7%) | 103 (24.5%) |
| $100,000 to $299,999 | 112 (62.9%) | 292 (69.4%) |
| $300,000 to $499,999 | 0 (0.0%) | 0 (0.0%) |
| $500,000 to $749,999 | 0 (0.0%) | 10 (2.4%) |
| $750,000 to $999,999 | 0 (0.0%) | 0 (0.0%) |
| $1,000,000 or more | 22 (12.4%) | 0 (0.0%) |
| Total | 178 (100.0%) | 421 (100.0%) |
Household Income by Mortgage Status in Lakeshore
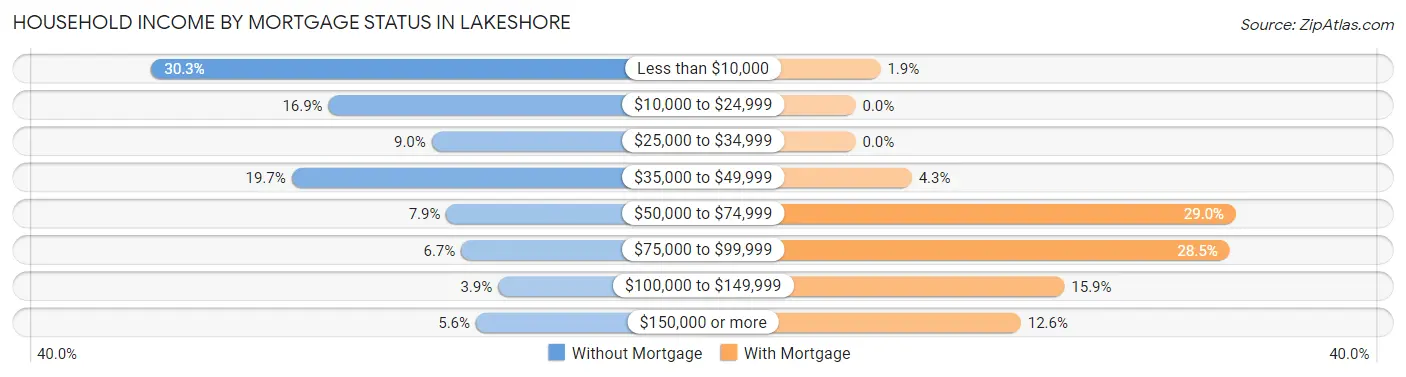
| Household Income | Without Mortgage | With Mortgage |
| Less than $10,000 | 54 (30.3%) | 8 (1.9%) |
| $10,000 to $24,999 | 30 (16.9%) | 0 (0.0%) |
| $25,000 to $34,999 | 16 (9.0%) | 0 (0.0%) |
| $35,000 to $49,999 | 35 (19.7%) | 18 (4.3%) |
| $50,000 to $74,999 | 14 (7.9%) | 122 (29.0%) |
| $75,000 to $99,999 | 12 (6.7%) | 120 (28.5%) |
| $100,000 to $149,999 | 7 (3.9%) | 67 (15.9%) |
| $150,000 or more | 10 (5.6%) | 53 (12.6%) |
| Total | 178 (100.0%) | 421 (100.0%) |
Property Value to Household Income Ratio in Lakeshore
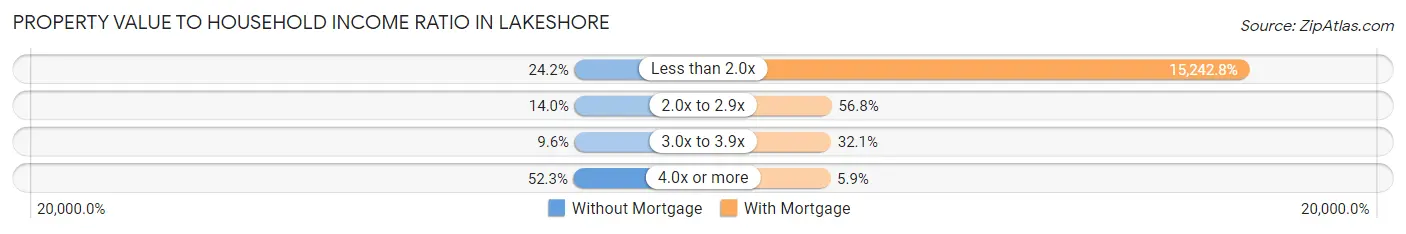
| Value-to-Income Ratio | Without Mortgage | With Mortgage |
| Less than 2.0x | 43 (24.2%) | 64,172 (15,242.8%) |
| 2.0x to 2.9x | 25 (14.0%) | 239 (56.8%) |
| 3.0x to 3.9x | 17 (9.6%) | 135 (32.1%) |
| 4.0x or more | 93 (52.2%) | 25 (5.9%) |
| Total | 178 (100.0%) | 421 (100.0%) |
Real Estate Taxes by Mortgage Status in Lakeshore
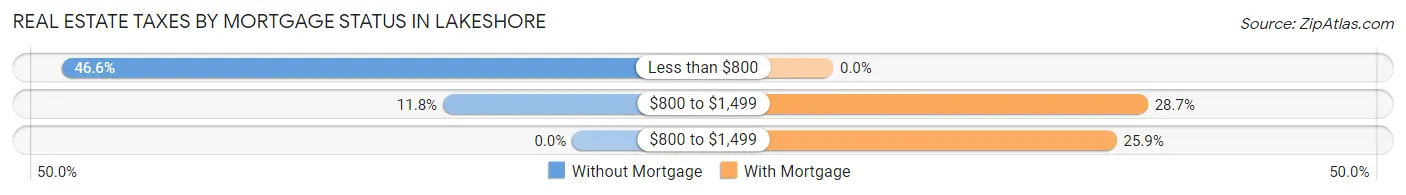
| Property Taxes | Without Mortgage | With Mortgage |
| Less than $800 | 83 (46.6%) | 0 (0.0%) |
| $800 to $1,499 | 21 (11.8%) | 121 (28.7%) |
| $800 to $1,499 | 0 (0.0%) | 109 (25.9%) |
| Total | 178 (100.0%) | 421 (100.0%) |
Health & Disability in Lakeshore
Health Insurance Coverage by Age in Lakeshore
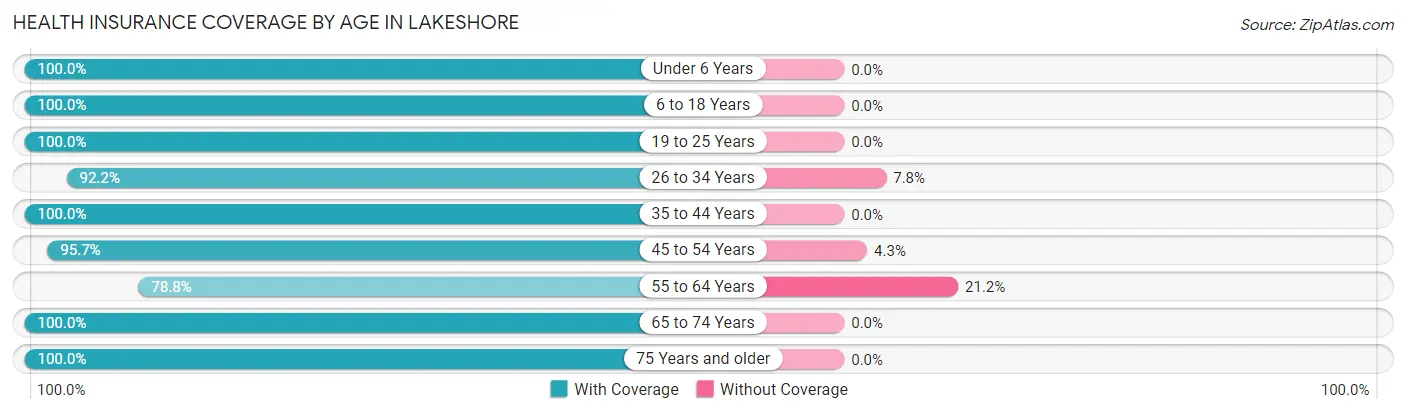
| Age Bracket | With Coverage | Without Coverage |
| Under 6 Years | 138 (100.0%) | 0 (0.0%) |
| 6 to 18 Years | 707 (100.0%) | 0 (0.0%) |
| 19 to 25 Years | 184 (100.0%) | 0 (0.0%) |
| 26 to 34 Years | 730 (92.2%) | 62 (7.8%) |
| 35 to 44 Years | 472 (100.0%) | 0 (0.0%) |
| 45 to 54 Years | 292 (95.7%) | 13 (4.3%) |
| 55 to 64 Years | 167 (78.8%) | 45 (21.2%) |
| 65 to 74 Years | 127 (100.0%) | 0 (0.0%) |
| 75 Years and older | 177 (100.0%) | 0 (0.0%) |
| Total | 2,994 (96.2%) | 120 (3.8%) |
Health Insurance Coverage by Citizenship Status in Lakeshore
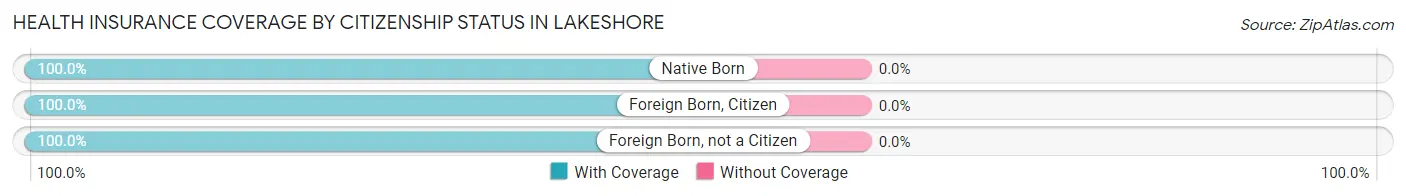
| Citizenship Status | With Coverage | Without Coverage |
| Native Born | 138 (100.0%) | 0 (0.0%) |
| Foreign Born, Citizen | 707 (100.0%) | 0 (0.0%) |
| Foreign Born, not a Citizen | 184 (100.0%) | 0 (0.0%) |
Health Insurance Coverage by Household Income in Lakeshore
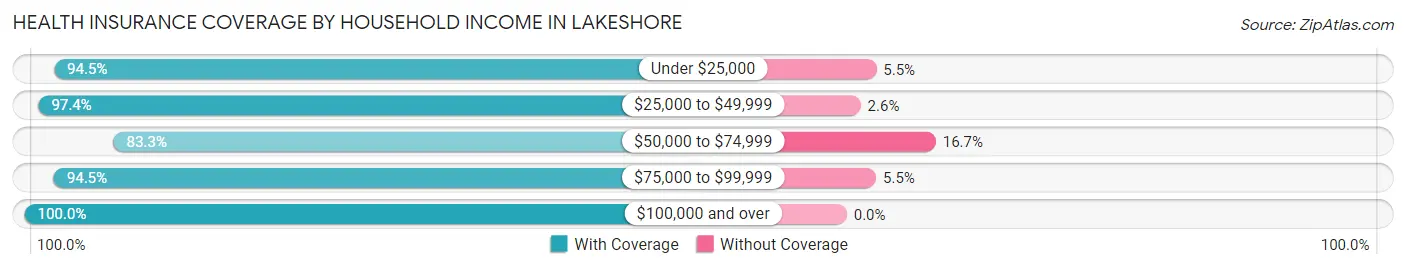
| Household Income | With Coverage | Without Coverage |
| Under $25,000 | 222 (94.5%) | 13 (5.5%) |
| $25,000 to $49,999 | 1,982 (97.4%) | 53 (2.6%) |
| $50,000 to $74,999 | 205 (83.3%) | 41 (16.7%) |
| $75,000 to $99,999 | 224 (94.5%) | 13 (5.5%) |
| $100,000 and over | 361 (100.0%) | 0 (0.0%) |
Public vs Private Health Insurance Coverage by Age in Lakeshore
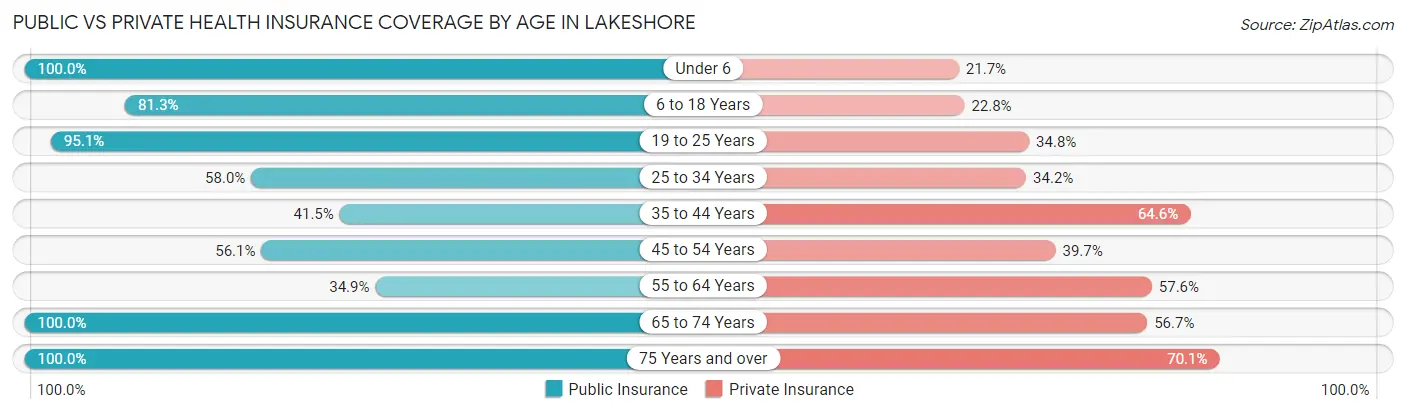
| Age Bracket | Public Insurance | Private Insurance |
| Under 6 | 138 (100.0%) | 30 (21.7%) |
| 6 to 18 Years | 575 (81.3%) | 161 (22.8%) |
| 19 to 25 Years | 175 (95.1%) | 64 (34.8%) |
| 25 to 34 Years | 459 (58.0%) | 271 (34.2%) |
| 35 to 44 Years | 196 (41.5%) | 305 (64.6%) |
| 45 to 54 Years | 171 (56.1%) | 121 (39.7%) |
| 55 to 64 Years | 74 (34.9%) | 122 (57.6%) |
| 65 to 74 Years | 127 (100.0%) | 72 (56.7%) |
| 75 Years and over | 177 (100.0%) | 124 (70.1%) |
| Total | 2,092 (67.2%) | 1,270 (40.8%) |
Disability Status by Sex by Age in Lakeshore
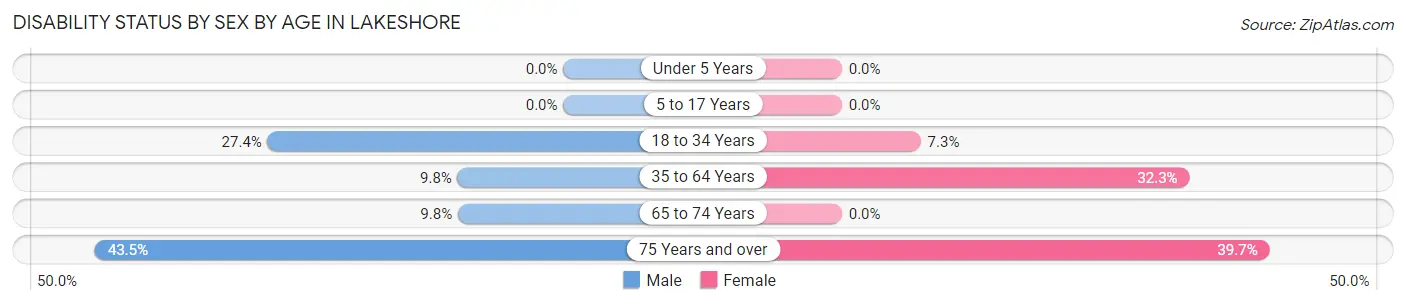
| Age Bracket | Male | Female |
| Under 5 Years | 0 (0.0%) | 0 (0.0%) |
| 5 to 17 Years | 0 (0.0%) | 0 (0.0%) |
| 18 to 34 Years | 152 (27.4%) | 36 (7.3%) |
| 35 to 64 Years | 42 (9.8%) | 181 (32.3%) |
| 65 to 74 Years | 9 (9.8%) | 0 (0.0%) |
| 75 Years and over | 20 (43.5%) | 52 (39.7%) |
Disability Class by Sex by Age in Lakeshore
Disability Class: Hearing Difficulty
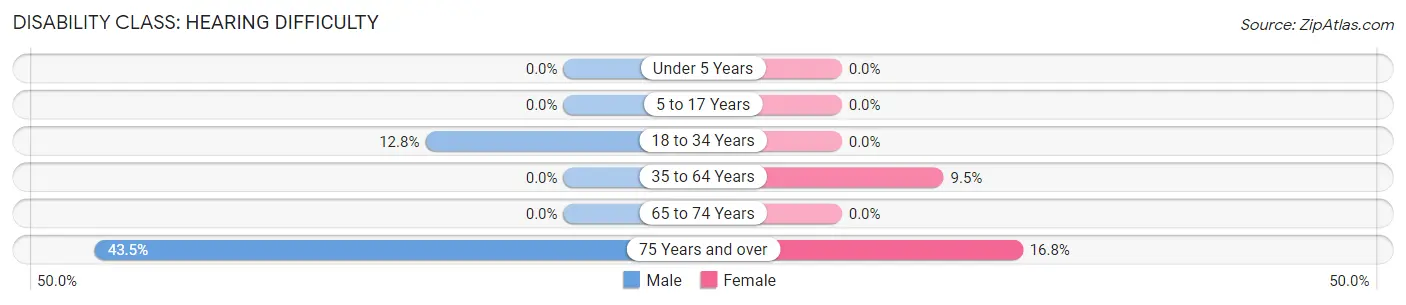
| Age Bracket | Male | Female |
| Under 5 Years | 0 (0.0%) | 0 (0.0%) |
| 5 to 17 Years | 0 (0.0%) | 0 (0.0%) |
| 18 to 34 Years | 71 (12.8%) | 0 (0.0%) |
| 35 to 64 Years | 0 (0.0%) | 53 (9.5%) |
| 65 to 74 Years | 0 (0.0%) | 0 (0.0%) |
| 75 Years and over | 20 (43.5%) | 22 (16.8%) |
Disability Class: Vision Difficulty
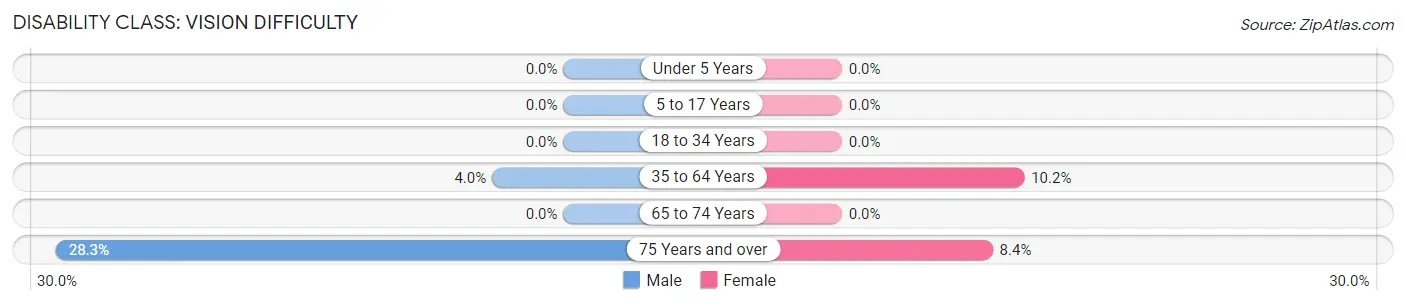
| Age Bracket | Male | Female |
| Under 5 Years | 0 (0.0%) | 0 (0.0%) |
| 5 to 17 Years | 0 (0.0%) | 0 (0.0%) |
| 18 to 34 Years | 0 (0.0%) | 0 (0.0%) |
| 35 to 64 Years | 17 (4.0%) | 57 (10.2%) |
| 65 to 74 Years | 0 (0.0%) | 0 (0.0%) |
| 75 Years and over | 13 (28.3%) | 11 (8.4%) |
Disability Class: Cognitive Difficulty
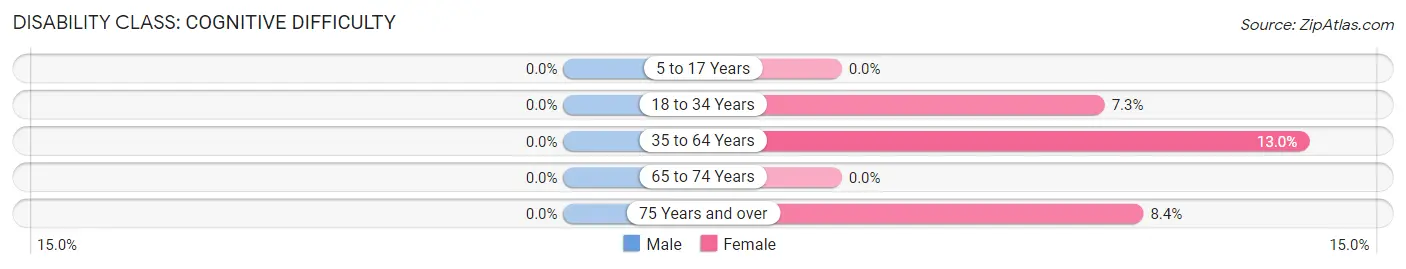
| Age Bracket | Male | Female |
| 5 to 17 Years | 0 (0.0%) | 0 (0.0%) |
| 18 to 34 Years | 0 (0.0%) | 36 (7.3%) |
| 35 to 64 Years | 0 (0.0%) | 73 (13.0%) |
| 65 to 74 Years | 0 (0.0%) | 0 (0.0%) |
| 75 Years and over | 0 (0.0%) | 11 (8.4%) |
Disability Class: Ambulatory Difficulty
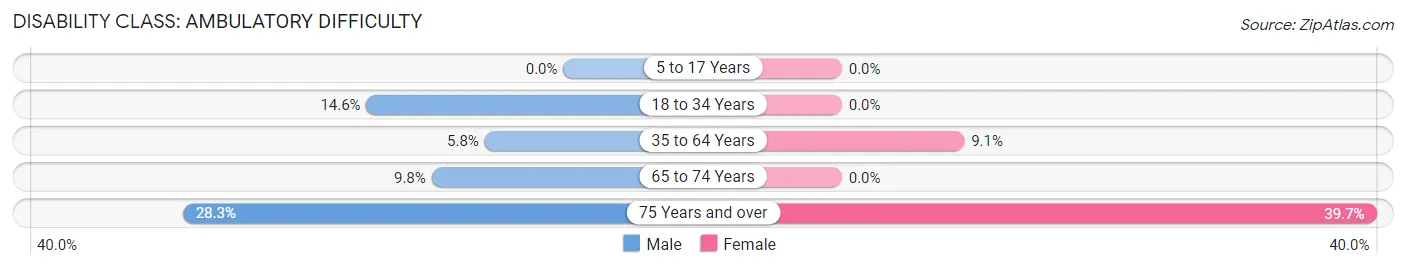
| Age Bracket | Male | Female |
| 5 to 17 Years | 0 (0.0%) | 0 (0.0%) |
| 18 to 34 Years | 81 (14.6%) | 0 (0.0%) |
| 35 to 64 Years | 25 (5.8%) | 51 (9.1%) |
| 65 to 74 Years | 9 (9.8%) | 0 (0.0%) |
| 75 Years and over | 13 (28.3%) | 52 (39.7%) |
Disability Class: Self-Care Difficulty
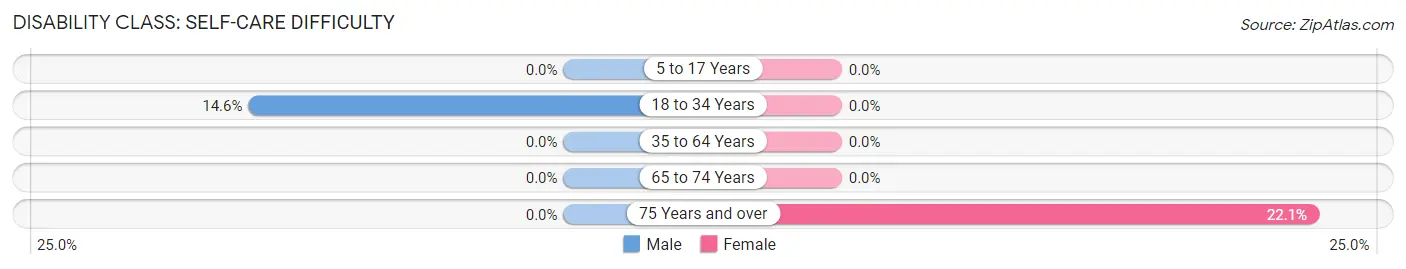
| Age Bracket | Male | Female |
| 5 to 17 Years | 0 (0.0%) | 0 (0.0%) |
| 18 to 34 Years | 81 (14.6%) | 0 (0.0%) |
| 35 to 64 Years | 0 (0.0%) | 0 (0.0%) |
| 65 to 74 Years | 0 (0.0%) | 0 (0.0%) |
| 75 Years and over | 0 (0.0%) | 29 (22.1%) |
Technology Access in Lakeshore
Computing Device Access in Lakeshore
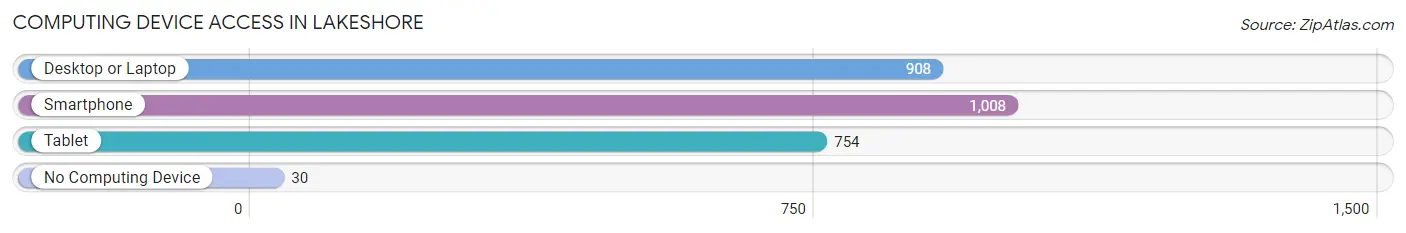
| Device Type | # Households | % Households |
| Desktop or Laptop | 908 | 82.5% |
| Smartphone | 1,008 | 91.5% |
| Tablet | 754 | 68.5% |
| No Computing Device | 30 | 2.7% |
| Total | 1,101 | 100.0% |
Internet Access in Lakeshore
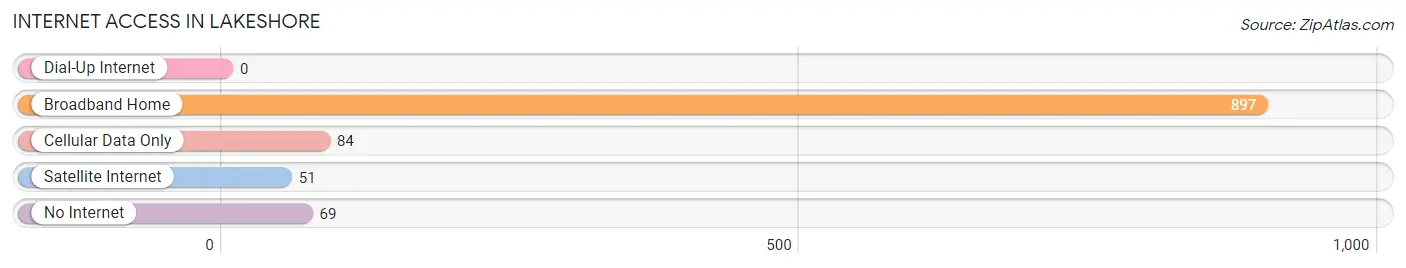
| Internet Type | # Households | % Households |
| Dial-Up Internet | 0 | 0.0% |
| Broadband Home | 897 | 81.5% |
| Cellular Data Only | 84 | 7.6% |
| Satellite Internet | 51 | 4.6% |
| No Internet | 69 | 6.3% |
| Total | 1,101 | 100.0% |
Lakeshore Summary
Lakeshore is a small town located in Tangipahoa Parish, Louisiana. It is situated on the north shore of Lake Pontchartrain, approximately 40 miles north of New Orleans. The town has a population of approximately 1,500 people and is part of the Hammond Metropolitan Statistical Area.
History
Lakeshore was founded in 1883 by a group of settlers from the nearby town of Ponchatoula. The settlers were looking for a place to settle that was close to the lake and had access to the water. The town was originally called “Lakeshore Landing” and was a popular spot for fishing and hunting. In the early 1900s, the town was renamed “Lakeshore” and began to grow.
In the 1920s, the town was home to a number of businesses, including a sawmill, a general store, a post office, and a hotel. The town also had a school, a church, and a number of other businesses.
In the 1950s, the town began to decline as the population moved away to larger cities. The sawmill closed in the 1960s and the post office closed in the 1970s. The town was nearly abandoned by the 1980s.
In the 1990s, the town began to experience a resurgence as people began to move back to the area. The town was incorporated in 1998 and has since seen a steady growth in population.
Geography
Lakeshore is located in Tangipahoa Parish, Louisiana. It is situated on the north shore of Lake Pontchartrain, approximately 40 miles north of New Orleans. The town is bordered by the towns of Ponchatoula to the east, Hammond to the south, and Mandeville to the west.
The town is located in a flat, low-lying area and is surrounded by wetlands and marshland. The town is located at an elevation of approximately 10 feet above sea level.
Economy
The economy of Lakeshore is largely based on tourism and fishing. The town is home to a number of restaurants, bars, and other businesses that cater to tourists. The town is also home to a number of marinas and boat launches that provide access to Lake Pontchartrain.
The town is also home to a number of small businesses, including a grocery store, a hardware store, and a number of other retail stores. The town is also home to a number of manufacturing and industrial businesses.
Demographics
As of the 2010 census, the population of Lakeshore was 1,500. The racial makeup of the town was 79.2% White, 17.3% African American, 0.7% Native American, 0.7% Asian, 0.3% from other races, and 1.9% from two or more races. Hispanic or Latino of any race were 1.3% of the population.
The median income for a household in the town was $37,500, and the median income for a family was $45,000. The per capita income for the town was $18,000. About 15.3% of families and 18.2% of the population were below the poverty line, including 25.0% of those under age 18 and 8.3% of those age 65 or over.
Conclusion
Lakeshore is a small town located in Tangipahoa Parish, Louisiana. It is situated on the north shore of Lake Pontchartrain, approximately 40 miles north of New Orleans. The town has a population of approximately 1,500 people and is part of the Hammond Metropolitan Statistical Area. The economy of Lakeshore is largely based on tourism and fishing, and the town is home to a number of small businesses. The racial makeup of the town is 79.2% White, 17.3% African American, 0.7% Native American, 0.7% Asian, 0.3% from other races, and 1.9% from two or more races. The median income for a household in the town was $37,500, and the median income for a family was $45,000.
Common Questions
What is Per Capita Income in Lakeshore?
Per Capita income in Lakeshore is $21,683.
What is the Median Family Income in Lakeshore?
Median Family Income in Lakeshore is $41,181.
What is the Median Household income in Lakeshore?
Median Household Income in Lakeshore is $39,826.
What is Income or Wage Gap in Lakeshore?
Income or Wage Gap in Lakeshore is 42.3%.
Women in Lakeshore earn 57.7 cents for every dollar earned by a man.
What is Inequality or Gini Index in Lakeshore?
Inequality or Gini Index in Lakeshore is 0.41.
What is the Total Population of Lakeshore?
Total Population of Lakeshore is 3,114.
What is the Total Male Population of Lakeshore?
Total Male Population of Lakeshore is 1,492.
What is the Total Female Population of Lakeshore?
Total Female Population of Lakeshore is 1,622.
What is the Ratio of Males per 100 Females in Lakeshore?
There are 91.99 Males per 100 Females in Lakeshore.
What is the Ratio of Females per 100 Males in Lakeshore?
There are 108.71 Females per 100 Males in Lakeshore.
What is the Median Population Age in Lakeshore?
Median Population Age in Lakeshore is 31.8 Years.
What is the Average Family Size in Lakeshore
Average Family Size in Lakeshore is 3.5 People.
What is the Average Household Size in Lakeshore
Average Household Size in Lakeshore is 2.8 People.
How Large is the Labor Force in Lakeshore?
There are 1,356 People in the Labor Forcein in Lakeshore.
What is the Percentage of People in the Labor Force in Lakeshore?
56.5% of People are in the Labor Force in Lakeshore.
What is the Unemployment Rate in Lakeshore?
Unemployment Rate in Lakeshore is 4.5%.