Lake Arthur, LA Map & Demographics
Lake Arthur Map
Lake Arthur Overview
$26,368
PER CAPITA INCOME
$64,107
AVG FAMILY INCOME
$43,625
AVG HOUSEHOLD INCOME
65.1%
WAGE / INCOME GAP [ % ]
34.9¢/ $1
WAGE / INCOME GAP [ $ ]
0.46
INEQUALITY / GINI INDEX
2,617
TOTAL POPULATION
1,307
MALE POPULATION
1,310
FEMALE POPULATION
99.77
MALES / 100 FEMALES
100.23
FEMALES / 100 MALES
36.0
MEDIAN AGE
3.4
AVG FAMILY SIZE
3.0
AVG HOUSEHOLD SIZE
1,129
LABOR FORCE [ PEOPLE ]
53.6%
PERCENT IN LABOR FORCE
9.4%
UNEMPLOYMENT RATE
Lake Arthur Zip Codes
Lake Arthur Area Codes
Income in Lake Arthur
Income Overview in Lake Arthur
Per Capita Income in Lake Arthur is $26,368, while median incomes of families and households are $64,107 and $43,625 respectively.
| Characteristic | Number | Measure |
| Per Capita Income | 2,617 | $26,368 |
| Median Family Income | 659 | $64,107 |
| Mean Family Income | 659 | $77,652 |
| Median Household Income | 885 | $43,625 |
| Mean Household Income | 885 | $65,559 |
| Income Deficit | 659 | $0 |
| Wage / Income Gap (%) | 2,617 | 65.15% |
| Wage / Income Gap ($) | 2,617 | 34.85¢ per $1 |
| Gini / Inequality Index | 2,617 | 0.46 |
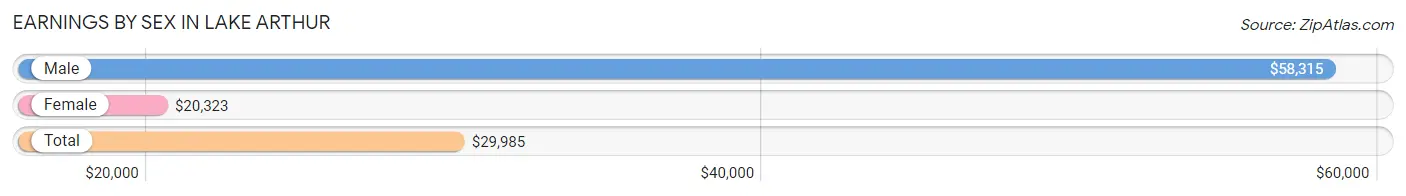
Earnings by Sex in Lake Arthur
Average Earnings in Lake Arthur are $29,985, $58,315 for men and $20,323 for women, a difference of 65.1%.
| Sex | Number | Average Earnings |
| Male | 655 (51.9%) | $58,315 |
| Female | 606 (48.1%) | $20,323 |
| Total | 1,261 (100.0%) | $29,985 |
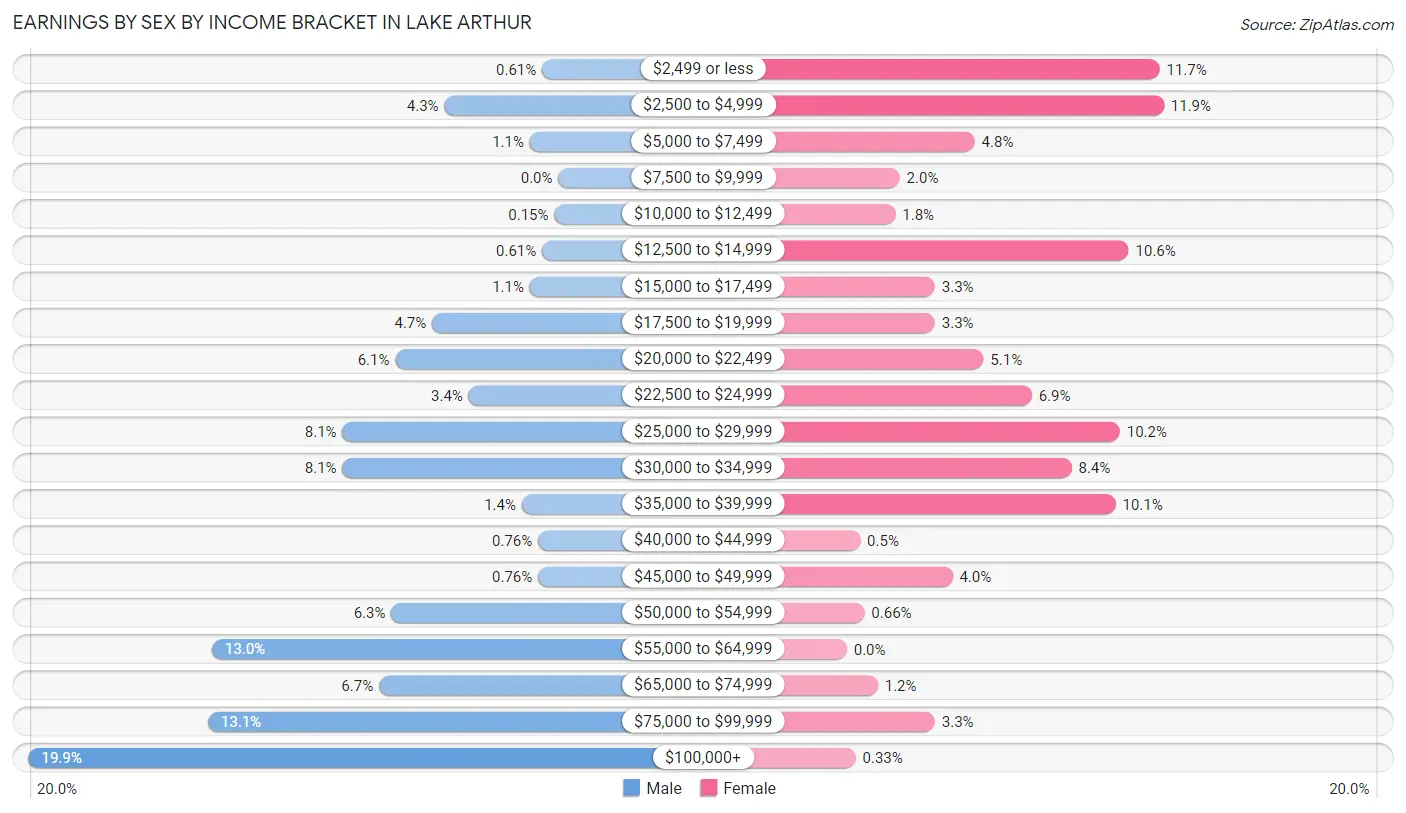
Earnings by Sex by Income Bracket in Lake Arthur
The most common earnings brackets in Lake Arthur are $100,000+ for men (130 | 19.9%) and $2,500 to $4,999 for women (72 | 11.9%).
| Income | Male | Female |
| $2,499 or less | 4 (0.6%) | 71 (11.7%) |
| $2,500 to $4,999 | 28 (4.3%) | 72 (11.9%) |
| $5,000 to $7,499 | 7 (1.1%) | 29 (4.8%) |
| $7,500 to $9,999 | 0 (0.0%) | 12 (2.0%) |
| $10,000 to $12,499 | 1 (0.2%) | 11 (1.8%) |
| $12,500 to $14,999 | 4 (0.6%) | 64 (10.6%) |
| $15,000 to $17,499 | 7 (1.1%) | 20 (3.3%) |
| $17,500 to $19,999 | 31 (4.7%) | 20 (3.3%) |
| $20,000 to $22,499 | 40 (6.1%) | 31 (5.1%) |
| $22,500 to $24,999 | 22 (3.4%) | 42 (6.9%) |
| $25,000 to $29,999 | 53 (8.1%) | 62 (10.2%) |
| $30,000 to $34,999 | 53 (8.1%) | 51 (8.4%) |
| $35,000 to $39,999 | 9 (1.4%) | 61 (10.1%) |
| $40,000 to $44,999 | 5 (0.8%) | 3 (0.5%) |
| $45,000 to $49,999 | 5 (0.8%) | 24 (4.0%) |
| $50,000 to $54,999 | 41 (6.3%) | 4 (0.7%) |
| $55,000 to $64,999 | 85 (13.0%) | 0 (0.0%) |
| $65,000 to $74,999 | 44 (6.7%) | 7 (1.2%) |
| $75,000 to $99,999 | 86 (13.1%) | 20 (3.3%) |
| $100,000+ | 130 (19.9%) | 2 (0.3%) |
| Total | 655 (100.0%) | 606 (100.0%) |
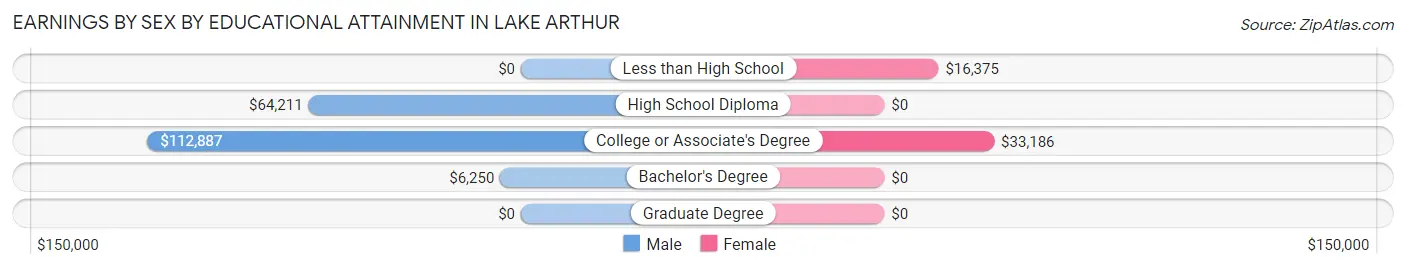
Earnings by Sex by Educational Attainment in Lake Arthur
Average earnings in Lake Arthur are $63,380 for men and $22,708 for women, a difference of 64.2%. Men with an educational attainment of college or associate's degree enjoy the highest average annual earnings of $112,887, while those with bachelor's degree education earn the least with $6,250. Women with an educational attainment of college or associate's degree earn the most with the average annual earnings of $33,186, while those with less than high school education have the smallest earnings of $16,375.
| Educational Attainment | Male Income | Female Income |
| Less than High School | - | - |
| High School Diploma | $64,211 | $0 |
| College or Associate's Degree | $112,887 | $33,186 |
| Bachelor's Degree | $6,250 | $0 |
| Graduate Degree | - | - |
| Total | $63,380 | $22,708 |
Family Income in Lake Arthur
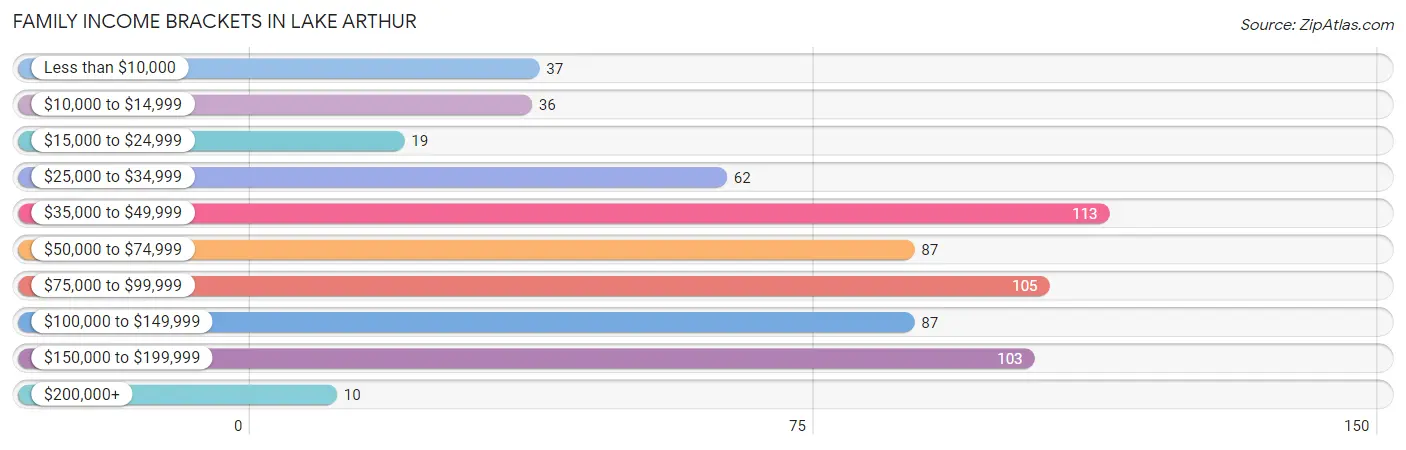
Family Income Brackets in Lake Arthur
According to the Lake Arthur family income data, there are 113 families falling into the $35,000 to $49,999 income range, which is the most common income bracket and makes up 17.2% of all families. Conversely, the $200,000+ income bracket is the least frequent group with only 10 families (1.5%) belonging to this category.
| Income Bracket | # Families | % Families |
| Less than $10,000 | 37 | 5.6% |
| $10,000 to $14,999 | 36 | 5.5% |
| $15,000 to $24,999 | 19 | 2.9% |
| $25,000 to $34,999 | 62 | 9.4% |
| $35,000 to $49,999 | 113 | 17.1% |
| $50,000 to $74,999 | 87 | 13.2% |
| $75,000 to $99,999 | 105 | 15.9% |
| $100,000 to $149,999 | 87 | 13.2% |
| $150,000 to $199,999 | 103 | 15.6% |
| $200,000+ | 10 | 1.5% |
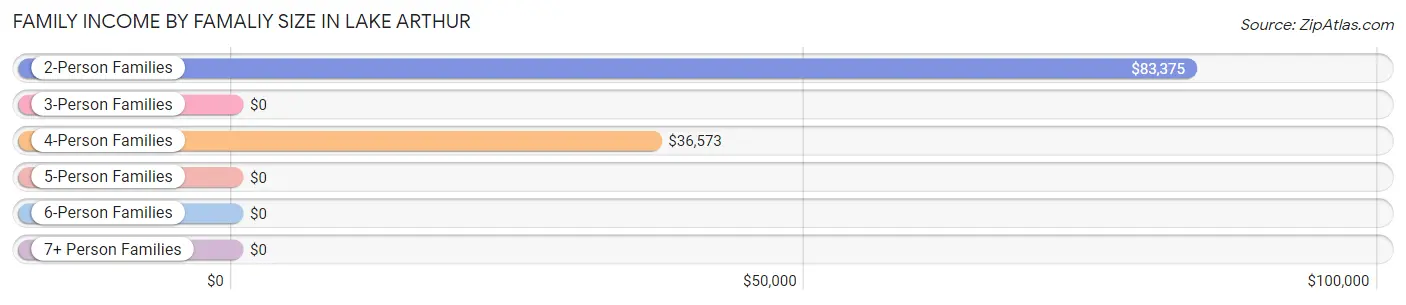
Family Income by Famaliy Size in Lake Arthur
2-person families (290 | 44.0%) account for the highest median family income in Lake Arthur with $83,375 per family, while 2-person families (290 | 44.0%) have the highest median income of $41,688 per family member.
| Income Bracket | # Families | Median Income |
| 2-Person Families | 290 (44.0%) | $83,375 |
| 3-Person Families | 152 (23.1%) | $0 |
| 4-Person Families | 97 (14.7%) | $36,573 |
| 5-Person Families | 88 (13.4%) | $0 |
| 6-Person Families | 20 (3.0%) | $0 |
| 7+ Person Families | 12 (1.8%) | $0 |
| Total | 659 (100.0%) | $64,107 |
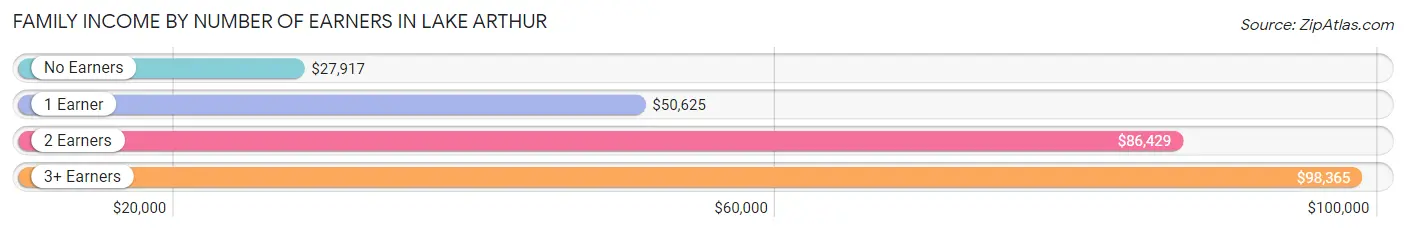
Family Income by Number of Earners in Lake Arthur
The median family income in Lake Arthur is $64,107, with families comprising 3+ earners (47) having the highest median family income of $98,365, while families with no earners (106) have the lowest median family income of $27,917, accounting for 7.1% and 16.1% of families, respectively.
| Number of Earners | # Families | Median Income |
| No Earners | 106 (16.1%) | $27,917 |
| 1 Earner | 210 (31.9%) | $50,625 |
| 2 Earners | 296 (44.9%) | $86,429 |
| 3+ Earners | 47 (7.1%) | $98,365 |
| Total | 659 (100.0%) | $64,107 |
Household Income in Lake Arthur
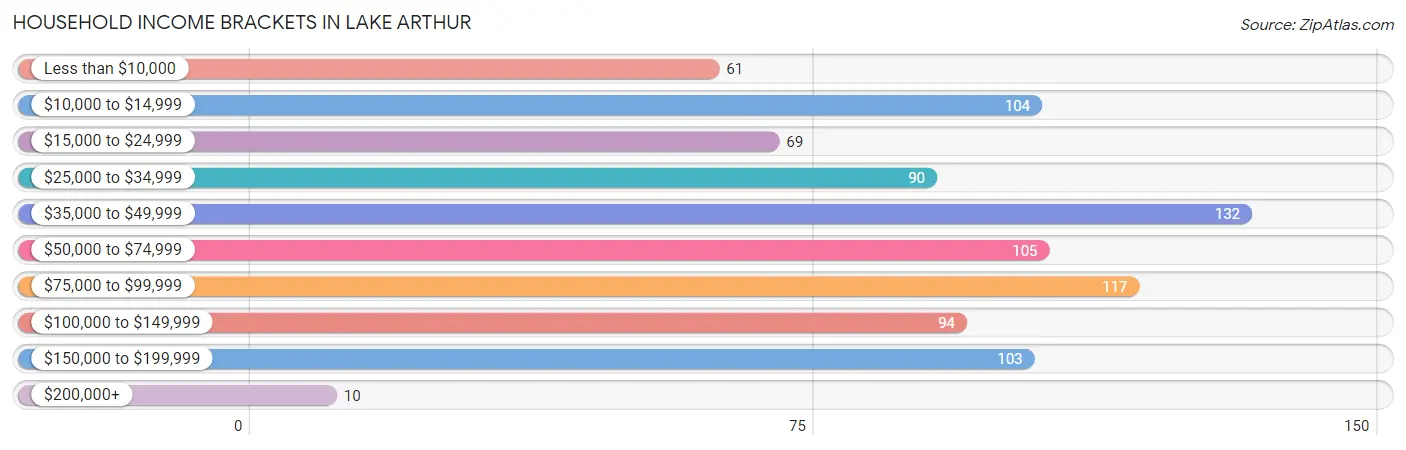
Household Income Brackets in Lake Arthur
With 132 households falling in the category, the $35,000 to $49,999 income range is the most frequent in Lake Arthur, accounting for 14.9% of all households. In contrast, only 10 households (1.1%) fall into the $200,000+ income bracket, making it the least populous group.
| Income Bracket | # Households | % Households |
| Less than $10,000 | 61 | 6.9% |
| $10,000 to $14,999 | 104 | 11.8% |
| $15,000 to $24,999 | 69 | 7.8% |
| $25,000 to $34,999 | 90 | 10.2% |
| $35,000 to $49,999 | 132 | 14.9% |
| $50,000 to $74,999 | 105 | 11.9% |
| $75,000 to $99,999 | 117 | 13.2% |
| $100,000 to $149,999 | 94 | 10.6% |
| $150,000 to $199,999 | 103 | 11.6% |
| $200,000+ | 10 | 1.1% |
Household Income by Householder Age in Lake Arthur
The median household income in Lake Arthur is $43,625, with the highest median household income of $84,500 found in the 45 to 64 years age bracket for the primary householder. A total of 370 households (41.8%) fall into this category. Meanwhile, the 15 to 24 years age bracket for the primary householder has the lowest median household income of $0, with 7 households (0.8%) in this group.
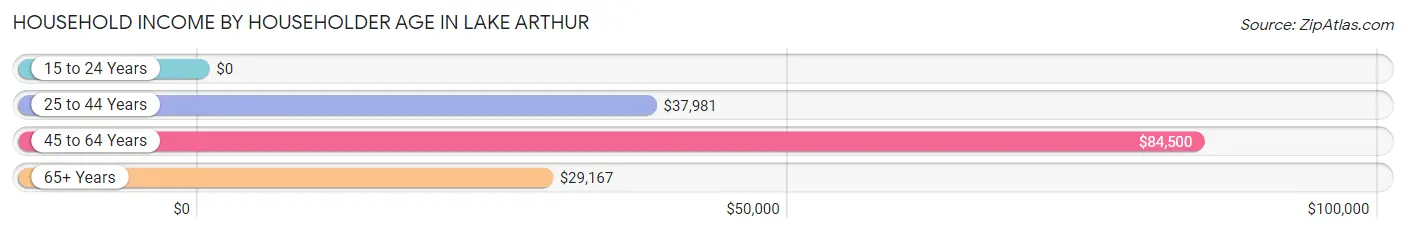
| Income Bracket | # Households | Median Income |
| 15 to 24 Years | 7 (0.8%) | $0 |
| 25 to 44 Years | 288 (32.5%) | $37,981 |
| 45 to 64 Years | 370 (41.8%) | $84,500 |
| 65+ Years | 220 (24.9%) | $29,167 |
| Total | 885 (100.0%) | $43,625 |
Poverty in Lake Arthur
Income Below Poverty by Sex and Age in Lake Arthur
With 19.2% poverty level for males and 25.7% for females among the residents of Lake Arthur, 16 and 17 year old males and 12 to 14 year old females are the most vulnerable to poverty, with 25 males (39.7%) and 36 females (66.7%) in their respective age groups living below the poverty level.
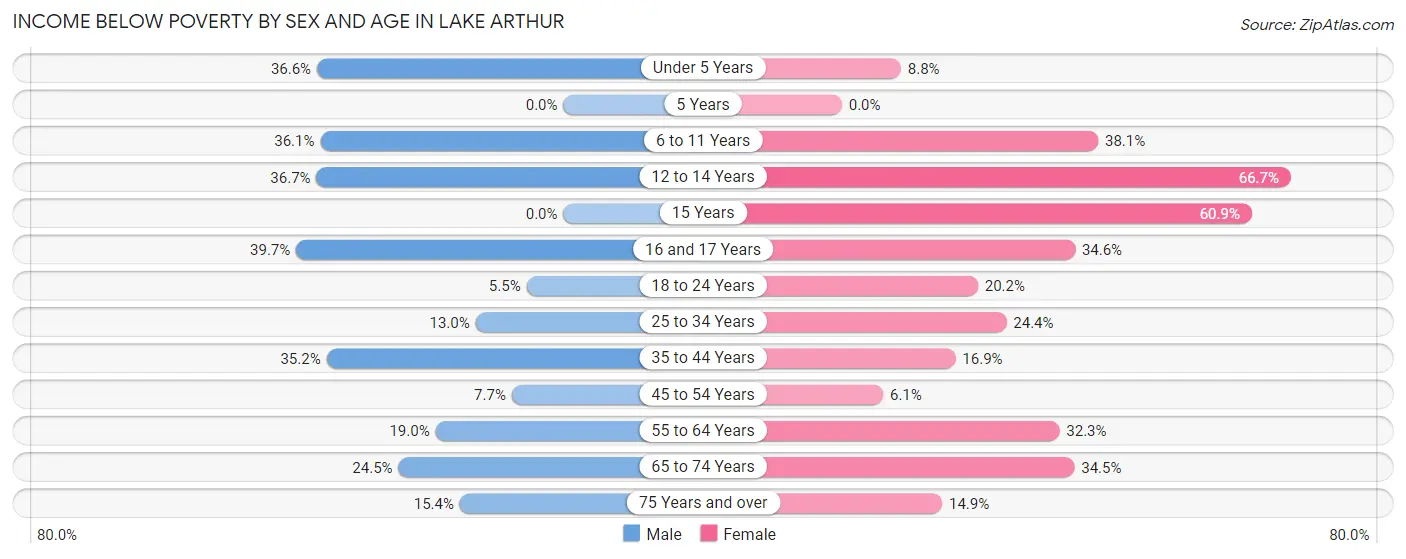
| Age Bracket | Male | Female |
| Under 5 Years | 15 (36.6%) | 5 (8.8%) |
| 5 Years | 0 (0.0%) | 0 (0.0%) |
| 6 to 11 Years | 48 (36.1%) | 43 (38.1%) |
| 12 to 14 Years | 11 (36.7%) | 36 (66.7%) |
| 15 Years | 0 (0.0%) | 14 (60.9%) |
| 16 and 17 Years | 25 (39.7%) | 9 (34.6%) |
| 18 to 24 Years | 7 (5.5%) | 42 (20.2%) |
| 25 to 34 Years | 30 (13.0%) | 33 (24.4%) |
| 35 to 44 Years | 51 (35.2%) | 28 (16.9%) |
| 45 to 54 Years | 21 (7.7%) | 9 (6.1%) |
| 55 to 64 Years | 15 (19.0%) | 63 (32.3%) |
| 65 to 74 Years | 24 (24.5%) | 48 (34.5%) |
| 75 Years and over | 4 (15.4%) | 7 (14.9%) |
| Total | 251 (19.2%) | 337 (25.7%) |
Income Above Poverty by Sex and Age in Lake Arthur
According to the poverty statistics in Lake Arthur, males aged 5 years and females aged 45 to 54 years are the age groups that are most secure financially, with 100.0% of males and 93.9% of females in these age groups living above the poverty line.
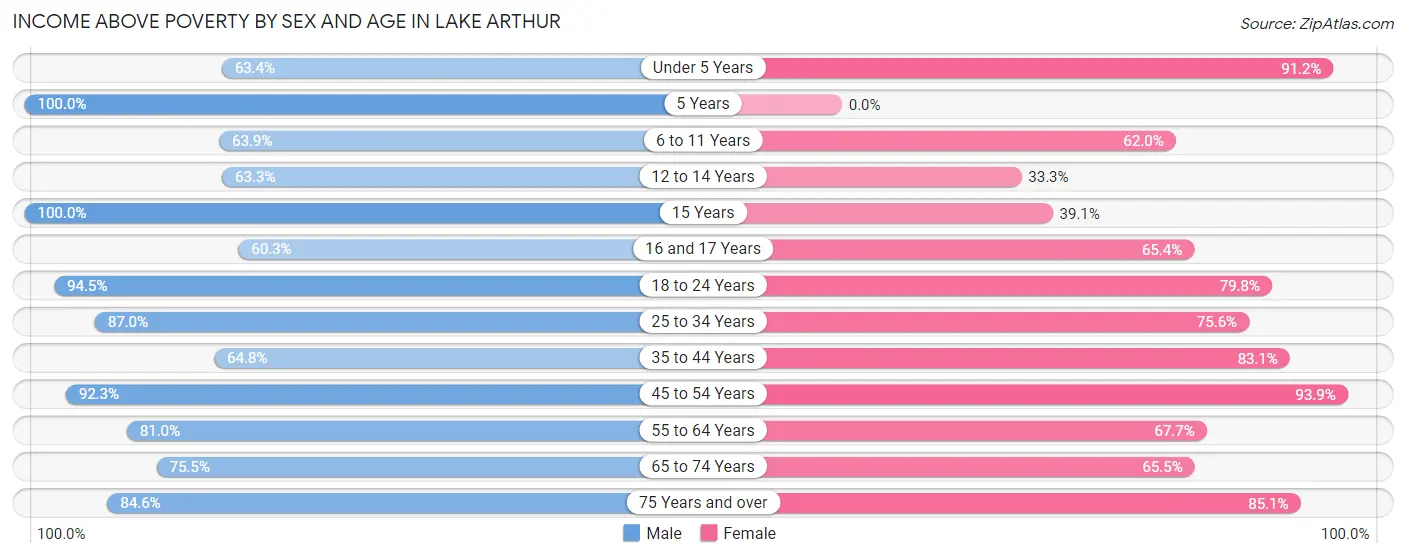
| Age Bracket | Male | Female |
| Under 5 Years | 26 (63.4%) | 52 (91.2%) |
| 5 Years | 54 (100.0%) | 0 (0.0%) |
| 6 to 11 Years | 85 (63.9%) | 70 (62.0%) |
| 12 to 14 Years | 19 (63.3%) | 18 (33.3%) |
| 15 Years | 6 (100.0%) | 9 (39.1%) |
| 16 and 17 Years | 38 (60.3%) | 17 (65.4%) |
| 18 to 24 Years | 121 (94.5%) | 166 (79.8%) |
| 25 to 34 Years | 200 (87.0%) | 102 (75.6%) |
| 35 to 44 Years | 94 (64.8%) | 138 (83.1%) |
| 45 to 54 Years | 253 (92.3%) | 138 (93.9%) |
| 55 to 64 Years | 64 (81.0%) | 132 (67.7%) |
| 65 to 74 Years | 74 (75.5%) | 91 (65.5%) |
| 75 Years and over | 22 (84.6%) | 40 (85.1%) |
| Total | 1,056 (80.8%) | 973 (74.3%) |
Income Below Poverty Among Married-Couple Families in Lake Arthur
The poverty statistics for married-couple families in Lake Arthur show that 10.7% or 42 of the total 392 families live below the poverty line. Families with 5 or more children have the highest poverty rate of 100.0%, comprising of 5 families. On the other hand, families with no children have the lowest poverty rate of 5.2%, which includes 11 families.
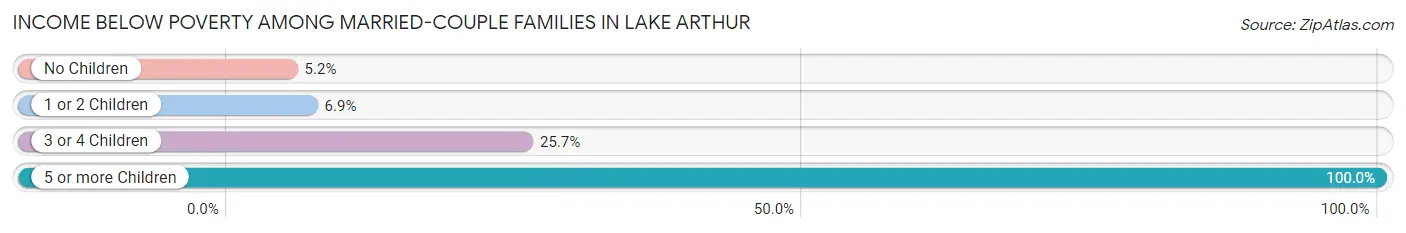
| Children | Above Poverty | Below Poverty |
| No Children | 201 (94.8%) | 11 (5.2%) |
| 1 or 2 Children | 94 (93.1%) | 7 (6.9%) |
| 3 or 4 Children | 55 (74.3%) | 19 (25.7%) |
| 5 or more Children | 0 (0.0%) | 5 (100.0%) |
| Total | 350 (89.3%) | 42 (10.7%) |
Income Below Poverty Among Single-Parent Households in Lake Arthur
According to the poverty data in Lake Arthur, 13.8% or 17 single-father households and 40.3% or 58 single-mother households are living below the poverty line. Among single-father households, those with 1 or 2 children have the highest poverty rate, with 17 households (22.7%) experiencing poverty. Likewise, among single-mother households, those with 3 or 4 children have the highest poverty rate, with 20 households (62.5%) falling below the poverty line.
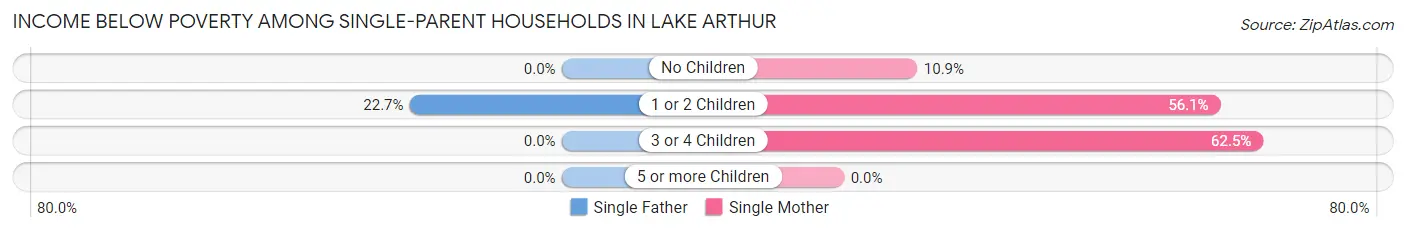
| Children | Single Father | Single Mother |
| No Children | 0 (0.0%) | 6 (10.9%) |
| 1 or 2 Children | 17 (22.7%) | 32 (56.1%) |
| 3 or 4 Children | 0 (0.0%) | 20 (62.5%) |
| 5 or more Children | 0 (0.0%) | 0 (0.0%) |
| Total | 17 (13.8%) | 58 (40.3%) |
Income Below Poverty Among Married-Couple vs Single-Parent Households in Lake Arthur
The poverty data for Lake Arthur shows that 42 of the married-couple family households (10.7%) and 75 of the single-parent households (28.1%) are living below the poverty level. Within the married-couple family households, those with 5 or more children have the highest poverty rate, with 5 households (100.0%) falling below the poverty line. Among the single-parent households, those with 3 or 4 children have the highest poverty rate, with 20 household (62.5%) living below poverty.
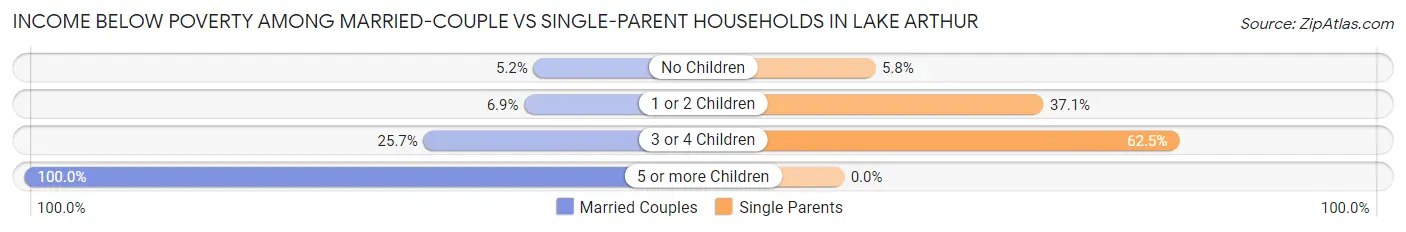
| Children | Married-Couple Families | Single-Parent Households |
| No Children | 11 (5.2%) | 6 (5.8%) |
| 1 or 2 Children | 7 (6.9%) | 49 (37.1%) |
| 3 or 4 Children | 19 (25.7%) | 20 (62.5%) |
| 5 or more Children | 5 (100.0%) | 0 (0.0%) |
| Total | 42 (10.7%) | 75 (28.1%) |
Race in Lake Arthur
The most populous races in Lake Arthur are White / Caucasian (2,263 | 86.5%), Black / African American (184 | 7.0%), and Hispanic or Latino (171 | 6.5%).
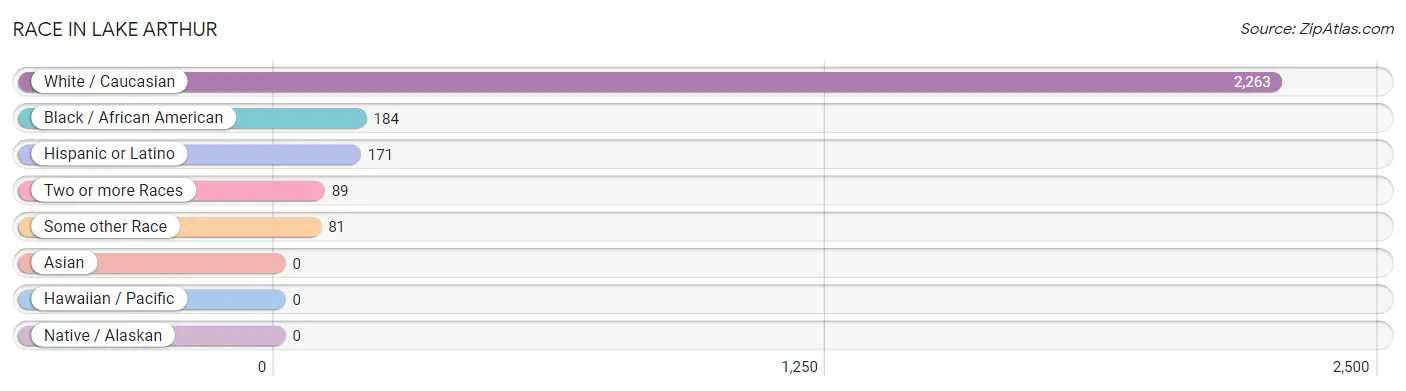
| Race | # Population | % Population |
| Asian | 0 | 0.0% |
| Black / African American | 184 | 7.0% |
| Hawaiian / Pacific | 0 | 0.0% |
| Hispanic or Latino | 171 | 6.5% |
| Native / Alaskan | 0 | 0.0% |
| White / Caucasian | 2,263 | 86.5% |
| Two or more Races | 89 | 3.4% |
| Some other Race | 81 | 3.1% |
| Total | 2,617 | 100.0% |
Ancestry in Lake Arthur
The most populous ancestries reported in Lake Arthur are French (860 | 32.9%), German (231 | 8.8%), French Canadian (194 | 7.4%), English (174 | 6.7%), and Italian (171 | 6.5%), together accounting for 62.3% of all Lake Arthur residents.
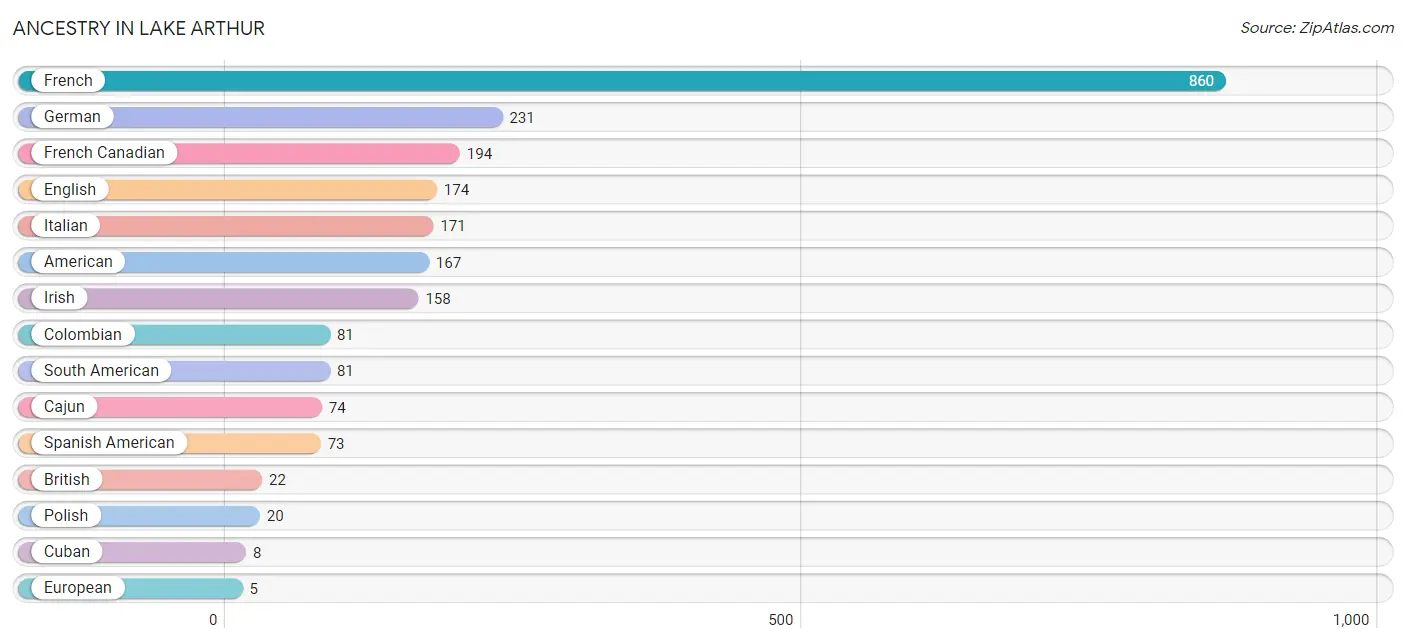
| Ancestry | # Population | % Population |
| American | 167 | 6.4% |
| British | 22 | 0.8% |
| Cajun | 74 | 2.8% |
| Colombian | 81 | 3.1% |
| Cuban | 8 | 0.3% |
| English | 174 | 6.7% |
| European | 5 | 0.2% |
| French | 860 | 32.9% |
| French Canadian | 194 | 7.4% |
| German | 231 | 8.8% |
| Irish | 158 | 6.0% |
| Italian | 171 | 6.5% |
| Norwegian | 4 | 0.2% |
| Polish | 20 | 0.8% |
| Scottish | 3 | 0.1% |
| South American | 81 | 3.1% |
| Spaniard | 5 | 0.2% |
| Spanish | 4 | 0.2% |
| Spanish American | 73 | 2.8% | View All 19 Rows |
Immigrants in Lake Arthur

| Immigration Origin | # Population | % Population | View All 0 Rows |
Sex and Age in Lake Arthur
Sex and Age in Lake Arthur
The most populous age groups in Lake Arthur are 50 to 54 Years (207 | 15.8%) for men and 20 to 24 Years (200 | 15.3%) for women.
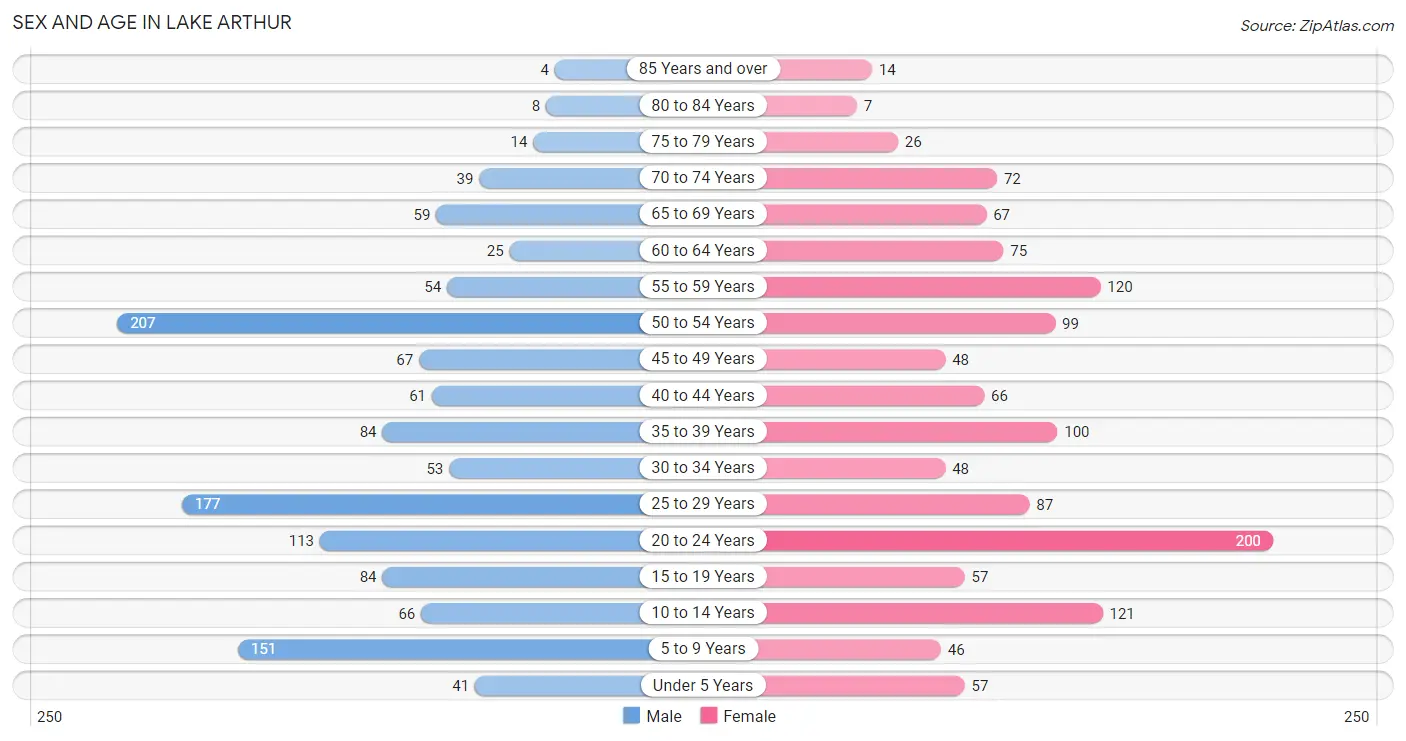
| Age Bracket | Male | Female |
| Under 5 Years | 41 (3.1%) | 57 (4.3%) |
| 5 to 9 Years | 151 (11.6%) | 46 (3.5%) |
| 10 to 14 Years | 66 (5.1%) | 121 (9.2%) |
| 15 to 19 Years | 84 (6.4%) | 57 (4.3%) |
| 20 to 24 Years | 113 (8.6%) | 200 (15.3%) |
| 25 to 29 Years | 177 (13.5%) | 87 (6.6%) |
| 30 to 34 Years | 53 (4.1%) | 48 (3.7%) |
| 35 to 39 Years | 84 (6.4%) | 100 (7.6%) |
| 40 to 44 Years | 61 (4.7%) | 66 (5.0%) |
| 45 to 49 Years | 67 (5.1%) | 48 (3.7%) |
| 50 to 54 Years | 207 (15.8%) | 99 (7.6%) |
| 55 to 59 Years | 54 (4.1%) | 120 (9.2%) |
| 60 to 64 Years | 25 (1.9%) | 75 (5.7%) |
| 65 to 69 Years | 59 (4.5%) | 67 (5.1%) |
| 70 to 74 Years | 39 (3.0%) | 72 (5.5%) |
| 75 to 79 Years | 14 (1.1%) | 26 (2.0%) |
| 80 to 84 Years | 8 (0.6%) | 7 (0.5%) |
| 85 Years and over | 4 (0.3%) | 14 (1.1%) |
| Total | 1,307 (100.0%) | 1,310 (100.0%) |
Families and Households in Lake Arthur
Median Family Size in Lake Arthur
The median family size in Lake Arthur is 3.44 persons per family, with married-couple families (392 | 59.5%) accounting for the largest median family size of 3.59 persons per family. On the other hand, single male/father families (123 | 18.7%) represent the smallest median family size with 3.02 persons per family.
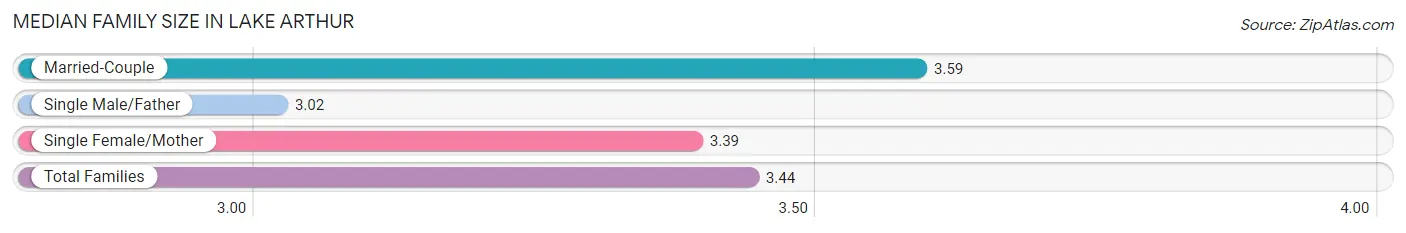
| Family Type | # Families | Family Size |
| Married-Couple | 392 (59.5%) | 3.59 |
| Single Male/Father | 123 (18.7%) | 3.02 |
| Single Female/Mother | 144 (21.8%) | 3.39 |
| Total Families | 659 (100.0%) | 3.44 |
Median Household Size in Lake Arthur
The median household size in Lake Arthur is 2.96 persons per household, with single female/mother households (144 | 16.3%) accounting for the largest median household size of 3.63 persons per household. non-family households (226 | 25.5%) represent the smallest median household size with 1.10 persons per household.
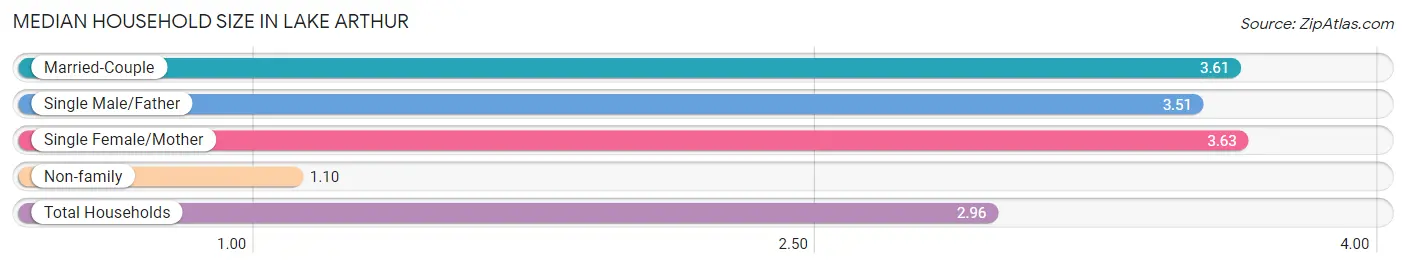
| Household Type | # Households | Household Size |
| Married-Couple | 392 (44.3%) | 3.61 |
| Single Male/Father | 123 (13.9%) | 3.51 |
| Single Female/Mother | 144 (16.3%) | 3.63 |
| Non-family | 226 (25.5%) | 1.10 |
| Total Households | 885 (100.0%) | 2.96 |
Household Size by Marriage Status in Lake Arthur
Out of a total of 885 households in Lake Arthur, 659 (74.5%) are family households, while 226 (25.5%) are nonfamily households. The most numerous type of family households are 2-person households, comprising 279, and the most common type of nonfamily households are 1-person households, comprising 205.
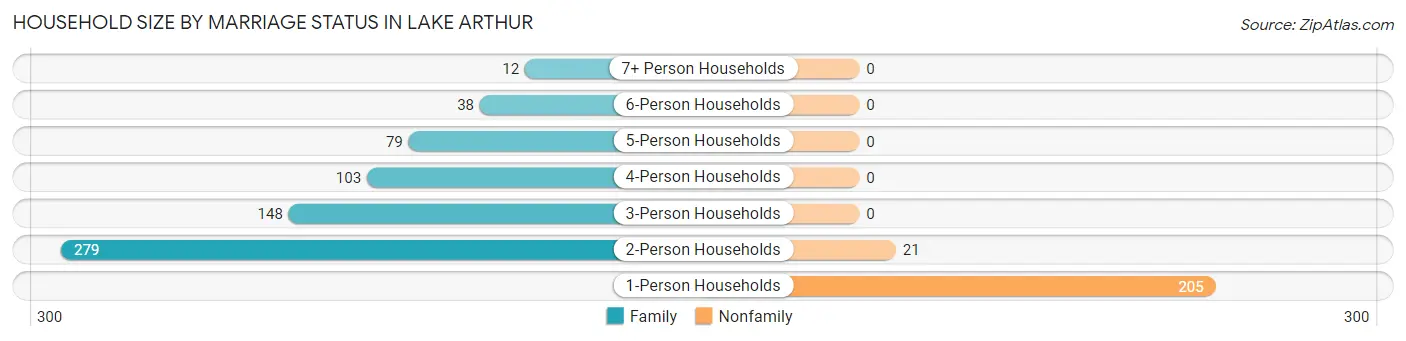
| Household Size | Family Households | Nonfamily Households |
| 1-Person Households | - | 205 (23.2%) |
| 2-Person Households | 279 (31.5%) | 21 (2.4%) |
| 3-Person Households | 148 (16.7%) | 0 (0.0%) |
| 4-Person Households | 103 (11.6%) | 0 (0.0%) |
| 5-Person Households | 79 (8.9%) | 0 (0.0%) |
| 6-Person Households | 38 (4.3%) | 0 (0.0%) |
| 7+ Person Households | 12 (1.4%) | 0 (0.0%) |
| Total | 659 (74.5%) | 226 (25.5%) |
Female Fertility in Lake Arthur
Fertility by Age in Lake Arthur
Average fertility rate in Lake Arthur is 52.0 births per 1,000 women. Women in the age bracket of 15 to 19 years have the highest fertility rate with 158.0 births per 1,000 women. Women in the age bracket of 35 to 50 years acount for 51.5% of all women with births.
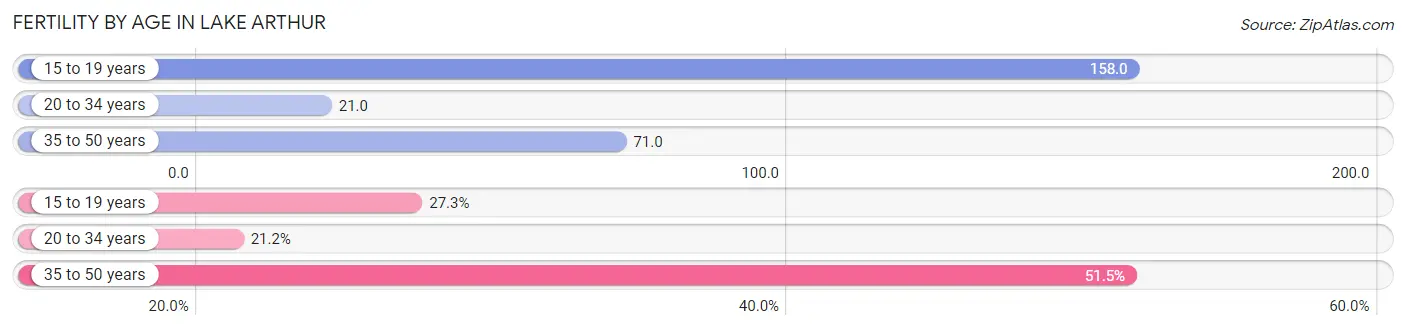
| Age Bracket | Women with Births | Births / 1,000 Women |
| 15 to 19 years | 9 (27.3%) | 158.0 |
| 20 to 34 years | 7 (21.2%) | 21.0 |
| 35 to 50 years | 17 (51.5%) | 71.0 |
| Total | 33 (100.0%) | 52.0 |
Fertility by Age by Marriage Status in Lake Arthur
21.2% of women with births (33) in Lake Arthur are married. The highest percentage of unmarried women with births falls into 15 to 19 years age bracket with 100.0% of them unmarried at the time of birth, while the lowest percentage of unmarried women with births belong to 20 to 34 years age bracket with 0.0% of them unmarried.
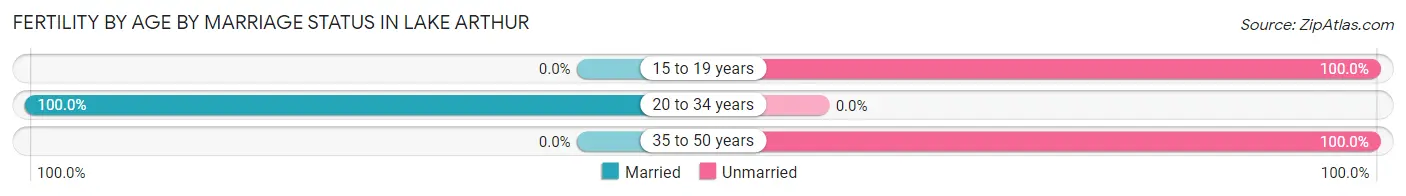
| Age Bracket | Married | Unmarried |
| 15 to 19 years | 0 (0.0%) | 9 (100.0%) |
| 20 to 34 years | 7 (100.0%) | 0 (0.0%) |
| 35 to 50 years | 0 (0.0%) | 17 (100.0%) |
| Total | 7 (21.2%) | 26 (78.8%) |
Fertility by Education in Lake Arthur
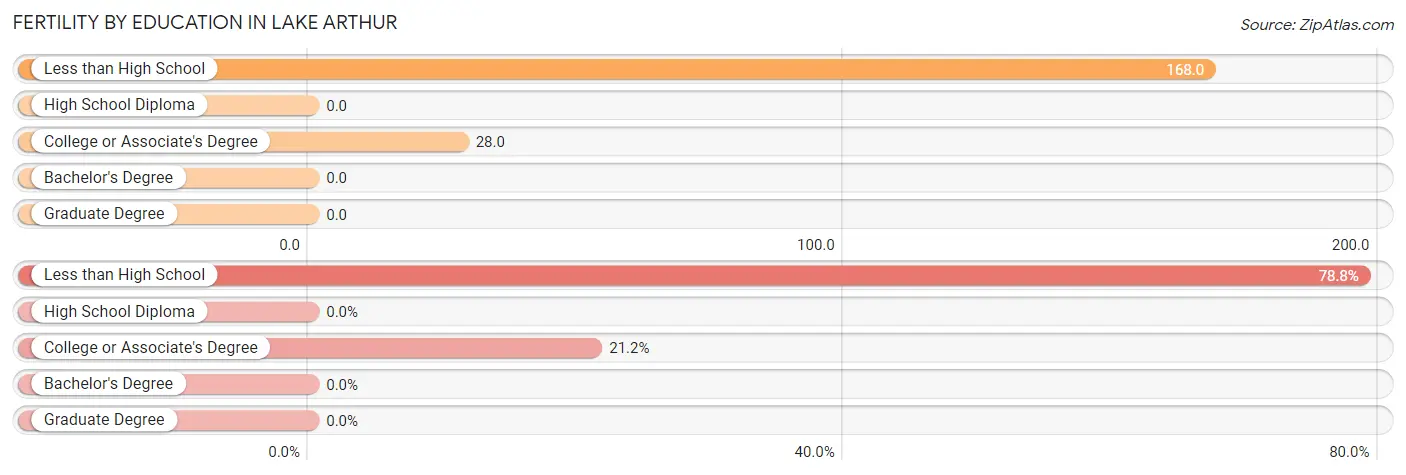
| Educational Attainment | Women with Births | Births / 1,000 Women |
| Less than High School | 26 (78.8%) | 168.0 |
| High School Diploma | 0 (0.0%) | 0.0 |
| College or Associate's Degree | 7 (21.2%) | 28.0 |
| Bachelor's Degree | 0 (0.0%) | 0.0 |
| Graduate Degree | 0 (0.0%) | 0.0 |
| Total | 33 (100.0%) | 52.0 |
Fertility by Education by Marriage Status in Lake Arthur
78.8% of women with births in Lake Arthur are unmarried. Women with the educational attainment of college or associate's degree are most likely to be married with 100.0% of them married at childbirth, while women with the educational attainment of less than high school are least likely to be married with 100.0% of them unmarried at childbirth.
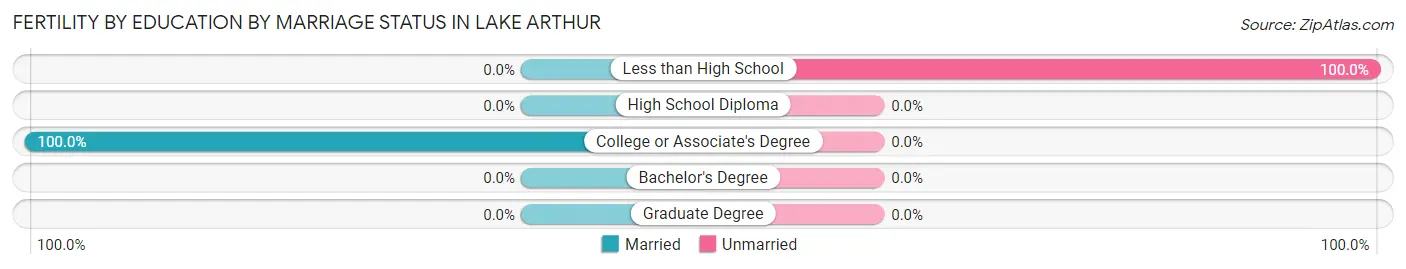
| Educational Attainment | Married | Unmarried |
| Less than High School | 0 (0.0%) | 26 (100.0%) |
| High School Diploma | 0 (0.0%) | 0 (0.0%) |
| College or Associate's Degree | 7 (100.0%) | 0 (0.0%) |
| Bachelor's Degree | 0 (0.0%) | 0 (0.0%) |
| Graduate Degree | 0 (0.0%) | 0 (0.0%) |
| Total | 7 (21.2%) | 26 (78.8%) |
Employment Characteristics in Lake Arthur
Employment by Class of Employer in Lake Arthur
Among the 1,022 employed individuals in Lake Arthur, private company employees (783 | 76.6%), local government employees (100 | 9.8%), and not-for-profit organizations (49 | 4.8%) make up the most common classes of employment.
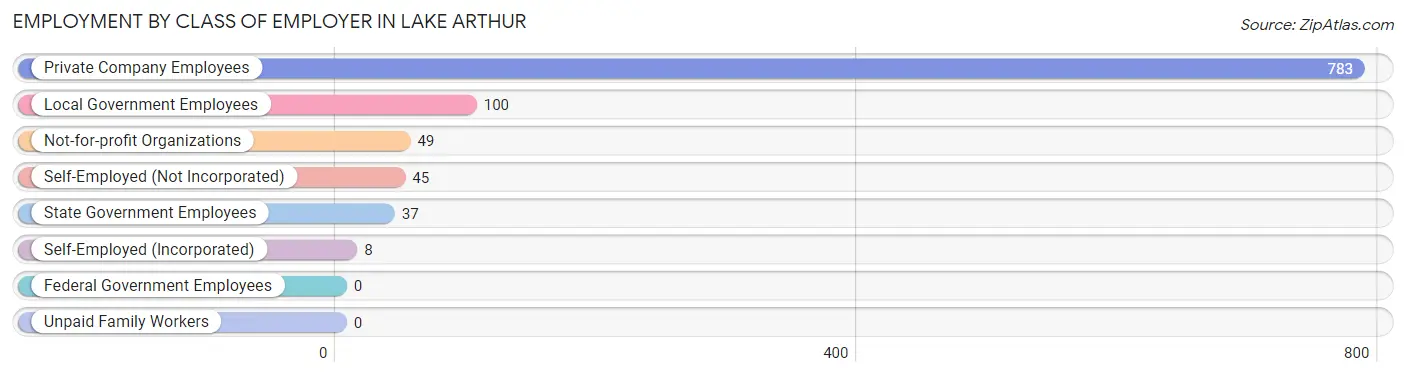
| Employer Class | # Employees | % Employees |
| Private Company Employees | 783 | 76.6% |
| Self-Employed (Incorporated) | 8 | 0.8% |
| Self-Employed (Not Incorporated) | 45 | 4.4% |
| Not-for-profit Organizations | 49 | 4.8% |
| Local Government Employees | 100 | 9.8% |
| State Government Employees | 37 | 3.6% |
| Federal Government Employees | 0 | 0.0% |
| Unpaid Family Workers | 0 | 0.0% |
| Total | 1,022 | 100.0% |
Employment Status by Age in Lake Arthur
According to the labor force statistics for Lake Arthur, out of the total population over 16 years of age (2,106), 53.6% or 1,129 individuals are in the labor force, with 9.4% or 106 of them unemployed. The age group with the highest labor force participation rate is 30 to 34 years, with 92.1% or 93 individuals in the labor force. Within the labor force, the 16 to 19 years age range has the highest percentage of unemployed individuals, with 84.4% or 27 of them being unemployed.
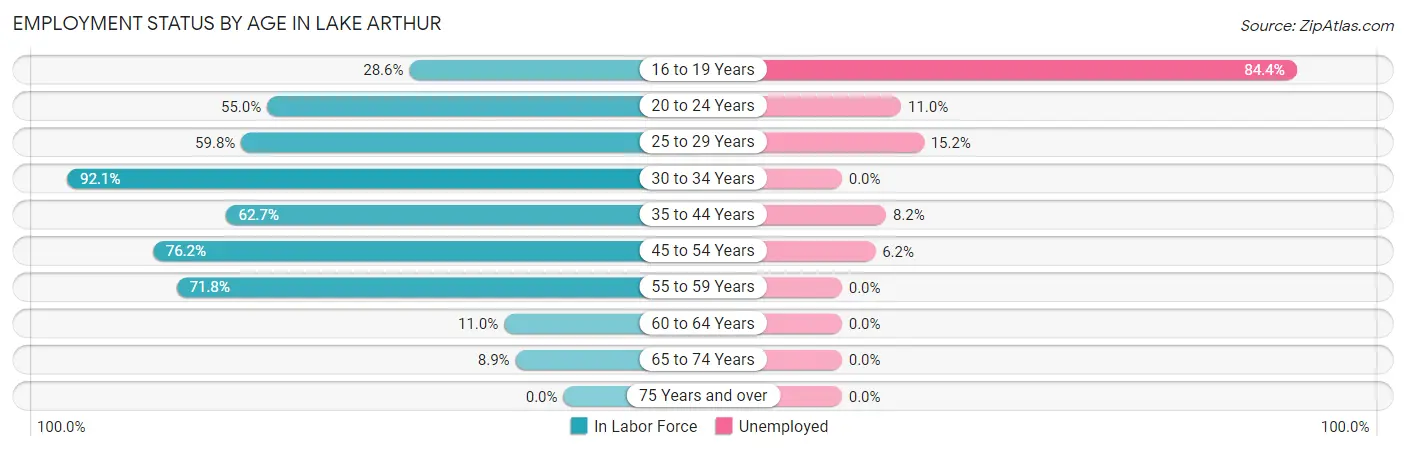
| Age Bracket | In Labor Force | Unemployed |
| 16 to 19 Years | 32 (28.6%) | 27 (84.4%) |
| 20 to 24 Years | 172 (55.0%) | 19 (11.0%) |
| 25 to 29 Years | 158 (59.8%) | 24 (15.2%) |
| 30 to 34 Years | 93 (92.1%) | 0 (0.0%) |
| 35 to 44 Years | 195 (62.7%) | 16 (8.2%) |
| 45 to 54 Years | 321 (76.2%) | 20 (6.2%) |
| 55 to 59 Years | 125 (71.8%) | 0 (0.0%) |
| 60 to 64 Years | 11 (11.0%) | 0 (0.0%) |
| 65 to 74 Years | 21 (8.9%) | 0 (0.0%) |
| 75 Years and over | 0 (0.0%) | 0 (0.0%) |
| Total | 1,129 (53.6%) | 106 (9.4%) |
Employment Status by Educational Attainment in Lake Arthur
According to labor force statistics for Lake Arthur, 65.9% of individuals (903) out of the total population between 25 and 64 years of age (1,371) are in the labor force, with 6.6% or 60 of them being unemployed. The group with the highest labor force participation rate are those with the educational attainment of college / associate degree, with 85.3% or 378 individuals in the labor force. Within the labor force, individuals with less than high school education have the highest percentage of unemployment, with 21.1% or 32 of them being unemployed.
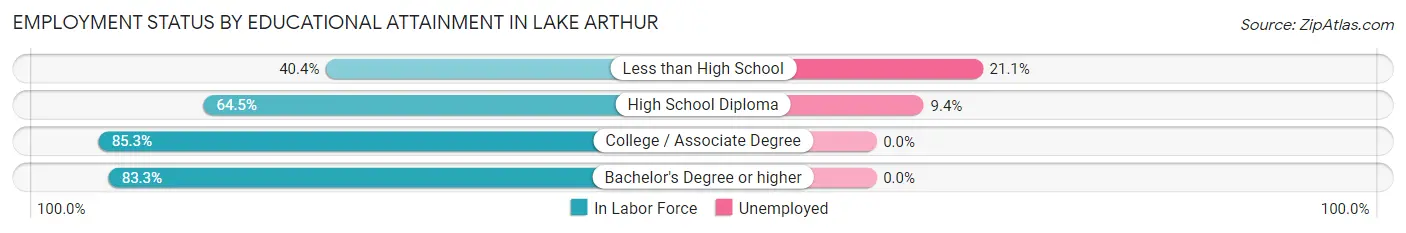
| Educational Attainment | In Labor Force | Unemployed |
| Less than High School | 152 (40.4%) | 79 (21.1%) |
| High School Diploma | 298 (64.5%) | 43 (9.4%) |
| College / Associate Degree | 378 (85.3%) | 0 (0.0%) |
| Bachelor's Degree or higher | 75 (83.3%) | 0 (0.0%) |
| Total | 903 (65.9%) | 90 (6.6%) |
Employment Occupations by Sex in Lake Arthur
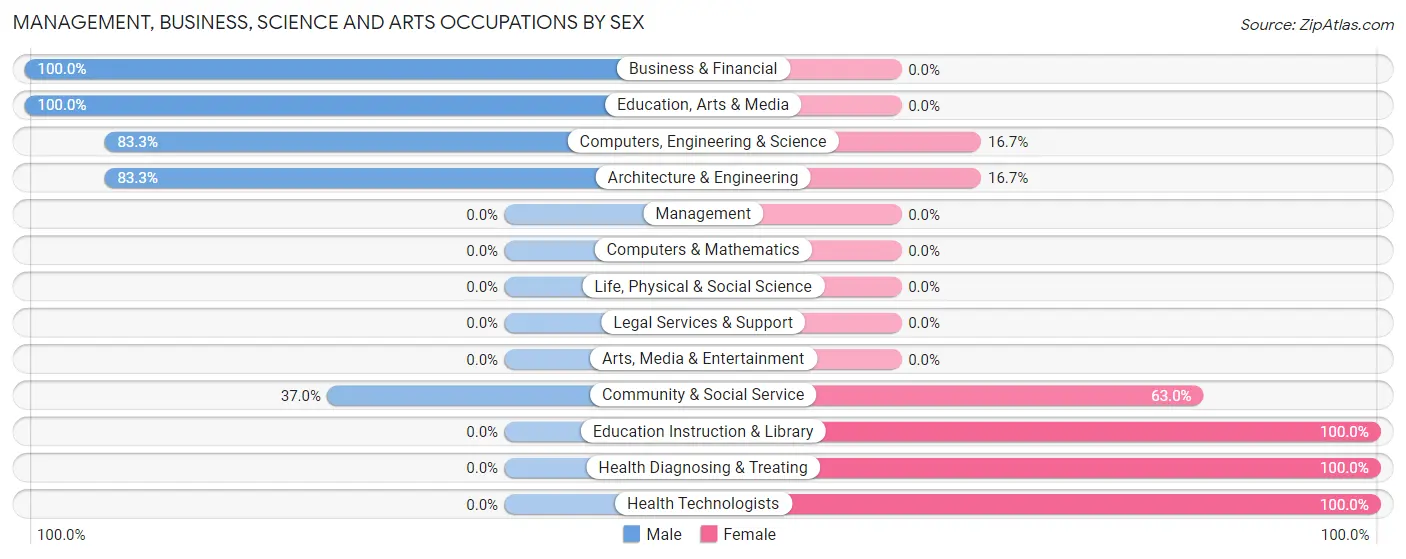
Management, Business, Science and Arts Occupations
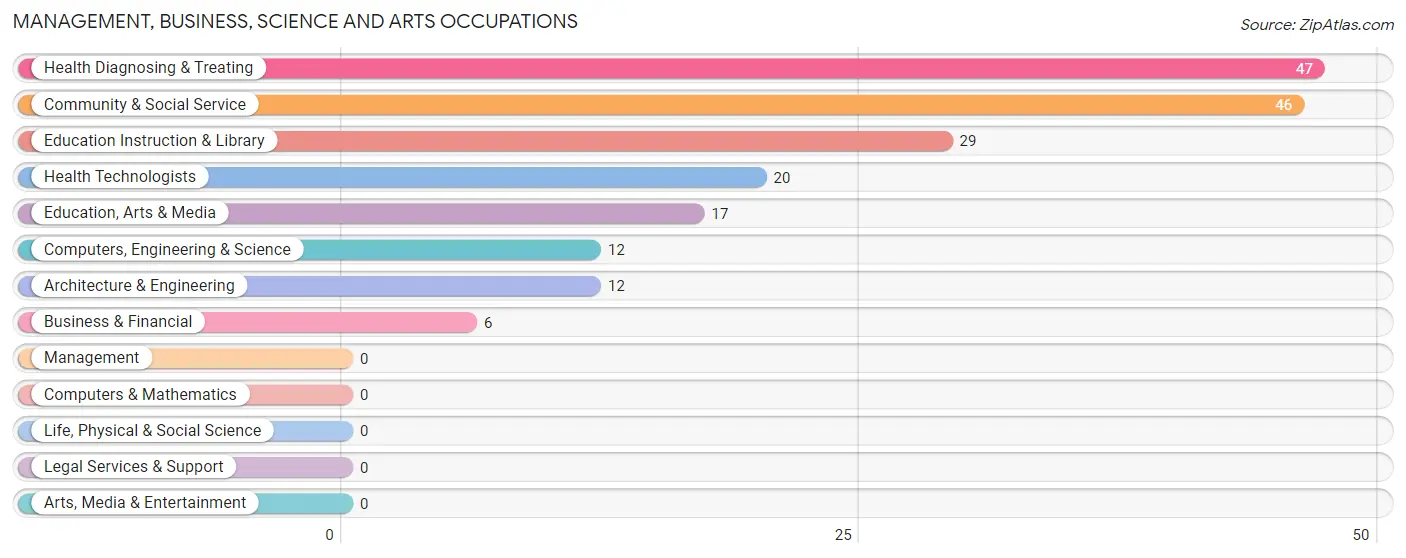
The most common Management, Business, Science and Arts occupations in Lake Arthur are Health Diagnosing & Treating (47 | 4.6%), Community & Social Service (46 | 4.5%), Education Instruction & Library (29 | 2.8%), Health Technologists (20 | 2.0%), and Education, Arts & Media (17 | 1.7%).
Management, Business, Science and Arts Occupations by Sex
Within the Management, Business, Science and Arts occupations in Lake Arthur, the most male-oriented occupations are Business & Financial (100.0%), Education, Arts & Media (100.0%), and Computers, Engineering & Science (83.3%), while the most female-oriented occupations are Education Instruction & Library (100.0%), Health Diagnosing & Treating (100.0%), and Health Technologists (100.0%).
| Occupation | Male | Female |
| Management | 0 (0.0%) | 0 (0.0%) |
| Business & Financial | 6 (100.0%) | 0 (0.0%) |
| Computers, Engineering & Science | 10 (83.3%) | 2 (16.7%) |
| Computers & Mathematics | 0 (0.0%) | 0 (0.0%) |
| Architecture & Engineering | 10 (83.3%) | 2 (16.7%) |
| Life, Physical & Social Science | 0 (0.0%) | 0 (0.0%) |
| Community & Social Service | 17 (37.0%) | 29 (63.0%) |
| Education, Arts & Media | 17 (100.0%) | 0 (0.0%) |
| Legal Services & Support | 0 (0.0%) | 0 (0.0%) |
| Education Instruction & Library | 0 (0.0%) | 29 (100.0%) |
| Arts, Media & Entertainment | 0 (0.0%) | 0 (0.0%) |
| Health Diagnosing & Treating | 0 (0.0%) | 47 (100.0%) |
| Health Technologists | 0 (0.0%) | 20 (100.0%) |
| Total (Category) | 33 (29.7%) | 78 (70.3%) |
| Total (Overall) | 537 (52.5%) | 485 (47.5%) |
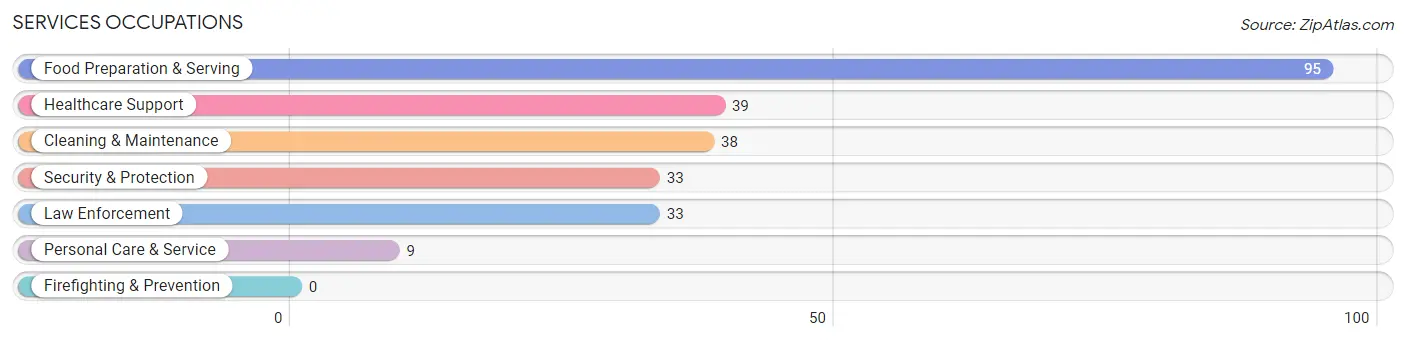
Services Occupations
The most common Services occupations in Lake Arthur are Food Preparation & Serving (95 | 9.3%), Healthcare Support (39 | 3.8%), Cleaning & Maintenance (38 | 3.7%), Security & Protection (33 | 3.2%), and Law Enforcement (33 | 3.2%).
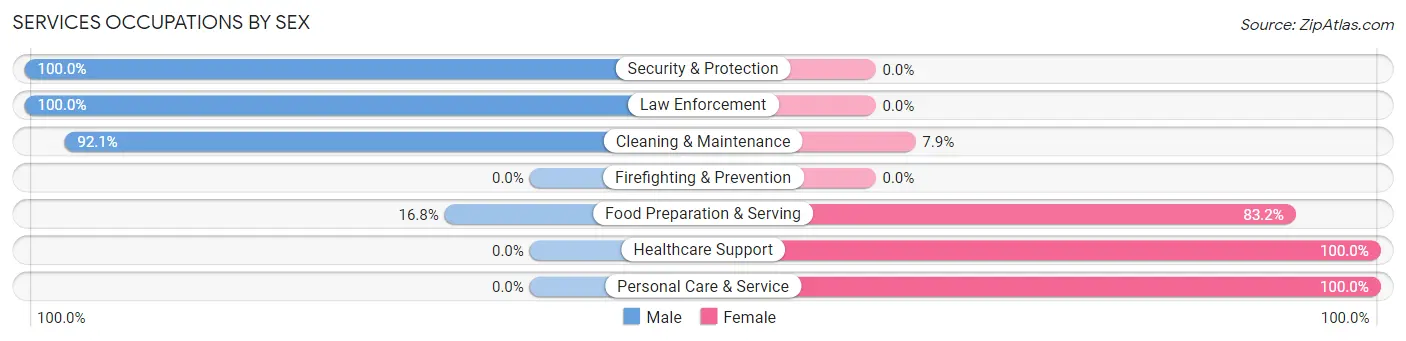
Services Occupations by Sex
Within the Services occupations in Lake Arthur, the most male-oriented occupations are Security & Protection (100.0%), Law Enforcement (100.0%), and Cleaning & Maintenance (92.1%), while the most female-oriented occupations are Healthcare Support (100.0%), Personal Care & Service (100.0%), and Food Preparation & Serving (83.2%).
| Occupation | Male | Female |
| Healthcare Support | 0 (0.0%) | 39 (100.0%) |
| Security & Protection | 33 (100.0%) | 0 (0.0%) |
| Firefighting & Prevention | 0 (0.0%) | 0 (0.0%) |
| Law Enforcement | 33 (100.0%) | 0 (0.0%) |
| Food Preparation & Serving | 16 (16.8%) | 79 (83.2%) |
| Cleaning & Maintenance | 35 (92.1%) | 3 (7.9%) |
| Personal Care & Service | 0 (0.0%) | 9 (100.0%) |
| Total (Category) | 84 (39.3%) | 130 (60.8%) |
| Total (Overall) | 537 (52.5%) | 485 (47.5%) |
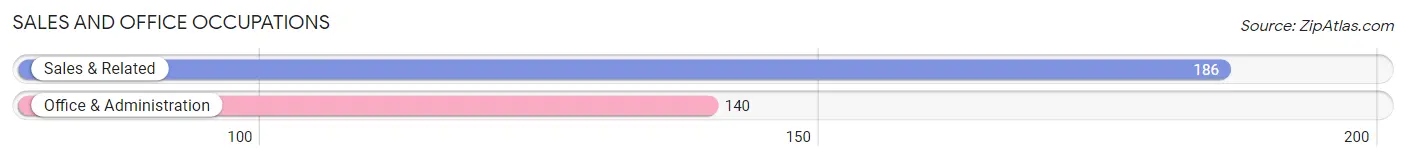
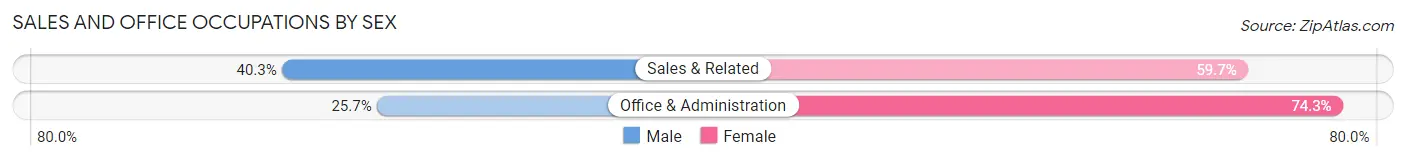
Sales and Office Occupations
The most common Sales and Office occupations in Lake Arthur are Sales & Related (186 | 18.2%), and Office & Administration (140 | 13.7%).
Sales and Office Occupations by Sex
| Occupation | Male | Female |
| Sales & Related | 75 (40.3%) | 111 (59.7%) |
| Office & Administration | 36 (25.7%) | 104 (74.3%) |
| Total (Category) | 111 (34.1%) | 215 (65.9%) |
| Total (Overall) | 537 (52.5%) | 485 (47.5%) |
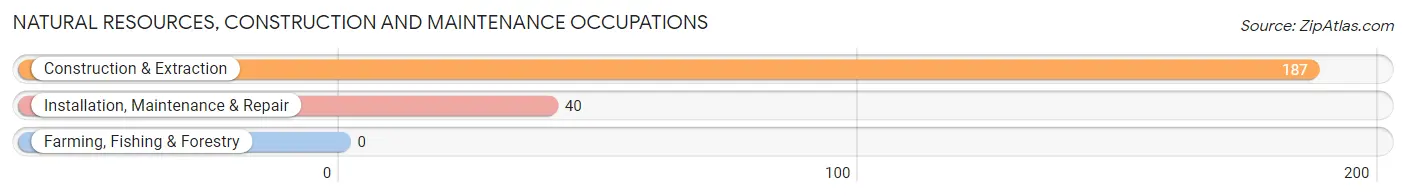
Natural Resources, Construction and Maintenance Occupations
The most common Natural Resources, Construction and Maintenance occupations in Lake Arthur are Construction & Extraction (187 | 18.3%), and Installation, Maintenance & Repair (40 | 3.9%).
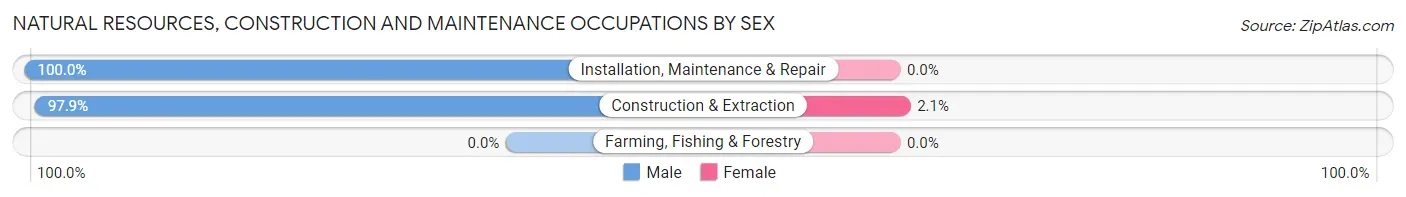
Natural Resources, Construction and Maintenance Occupations by Sex
| Occupation | Male | Female |
| Farming, Fishing & Forestry | 0 (0.0%) | 0 (0.0%) |
| Construction & Extraction | 183 (97.9%) | 4 (2.1%) |
| Installation, Maintenance & Repair | 40 (100.0%) | 0 (0.0%) |
| Total (Category) | 223 (98.2%) | 4 (1.8%) |
| Total (Overall) | 537 (52.5%) | 485 (47.5%) |
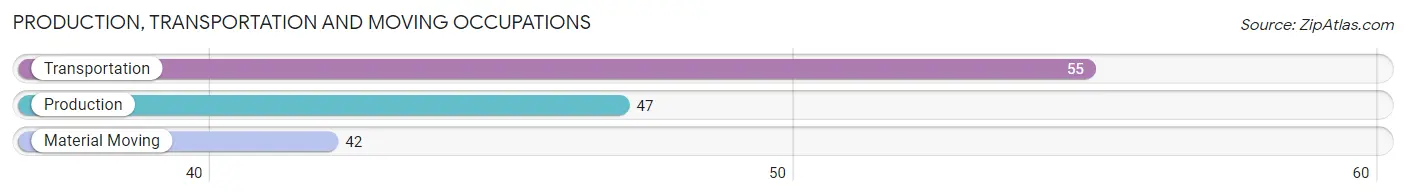
Production, Transportation and Moving Occupations
The most common Production, Transportation and Moving occupations in Lake Arthur are Transportation (55 | 5.4%), Production (47 | 4.6%), and Material Moving (42 | 4.1%).
Production, Transportation and Moving Occupations by Sex
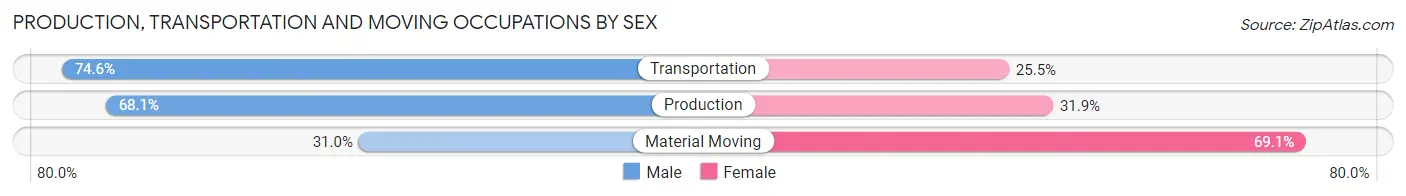
| Occupation | Male | Female |
| Production | 32 (68.1%) | 15 (31.9%) |
| Transportation | 41 (74.6%) | 14 (25.5%) |
| Material Moving | 13 (30.9%) | 29 (69.1%) |
| Total (Category) | 86 (59.7%) | 58 (40.3%) |
| Total (Overall) | 537 (52.5%) | 485 (47.5%) |
Employment Industries by Sex in Lake Arthur
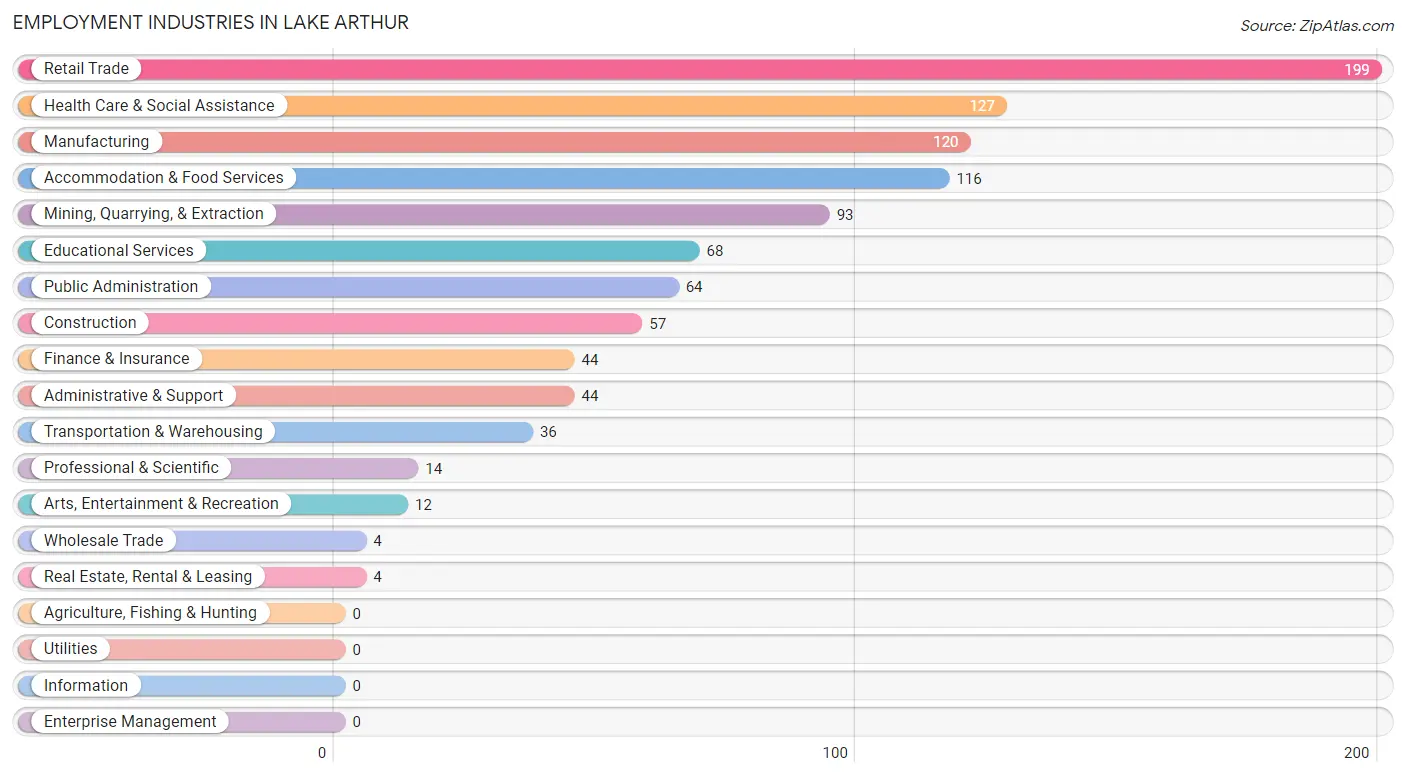
Employment Industries in Lake Arthur
The major employment industries in Lake Arthur include Retail Trade (199 | 19.5%), Health Care & Social Assistance (127 | 12.4%), Manufacturing (120 | 11.7%), Accommodation & Food Services (116 | 11.4%), and Mining, Quarrying, & Extraction (93 | 9.1%).
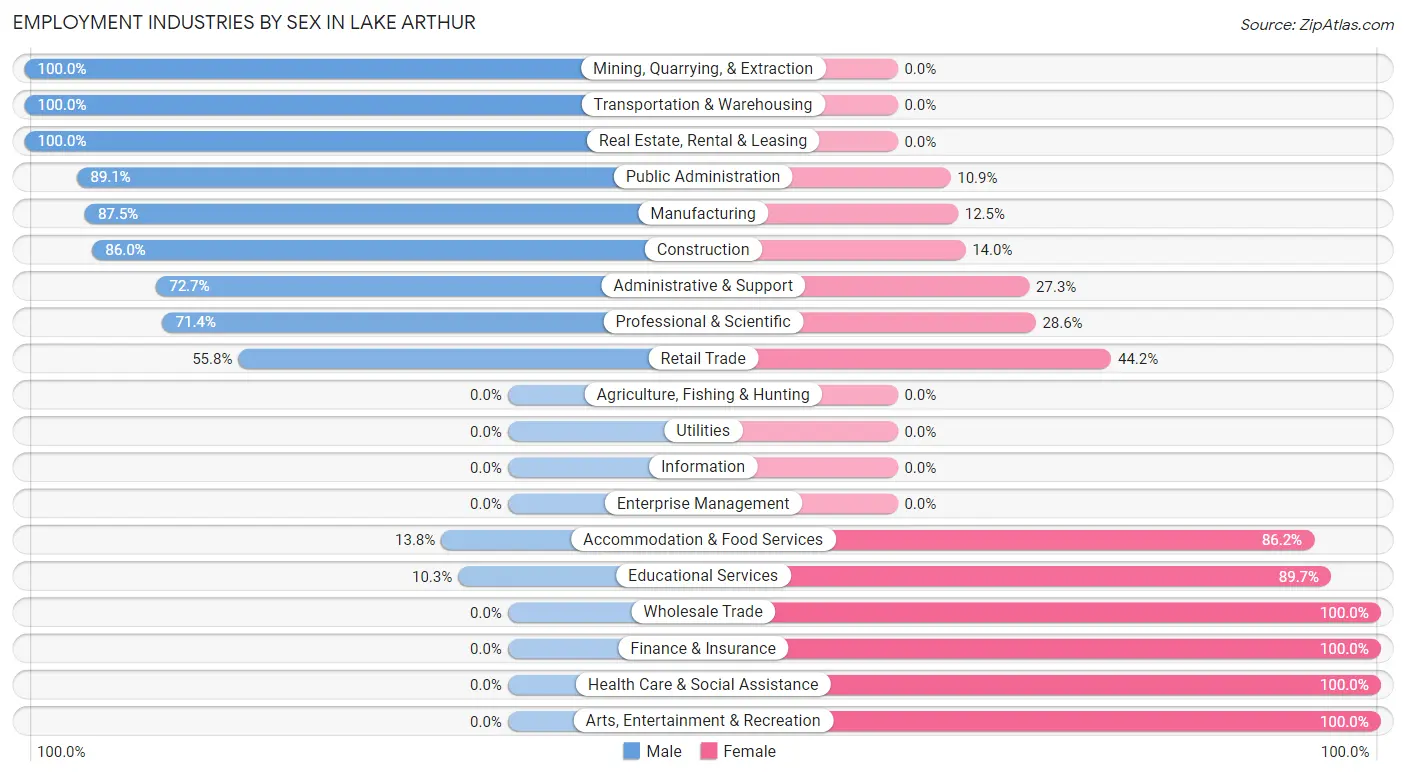
Employment Industries by Sex in Lake Arthur
The Lake Arthur industries that see more men than women are Mining, Quarrying, & Extraction (100.0%), Transportation & Warehousing (100.0%), and Real Estate, Rental & Leasing (100.0%), whereas the industries that tend to have a higher number of women are Wholesale Trade (100.0%), Finance & Insurance (100.0%), and Health Care & Social Assistance (100.0%).
| Industry | Male | Female |
| Agriculture, Fishing & Hunting | 0 (0.0%) | 0 (0.0%) |
| Mining, Quarrying, & Extraction | 93 (100.0%) | 0 (0.0%) |
| Construction | 49 (86.0%) | 8 (14.0%) |
| Manufacturing | 105 (87.5%) | 15 (12.5%) |
| Wholesale Trade | 0 (0.0%) | 4 (100.0%) |
| Retail Trade | 111 (55.8%) | 88 (44.2%) |
| Transportation & Warehousing | 36 (100.0%) | 0 (0.0%) |
| Utilities | 0 (0.0%) | 0 (0.0%) |
| Information | 0 (0.0%) | 0 (0.0%) |
| Finance & Insurance | 0 (0.0%) | 44 (100.0%) |
| Real Estate, Rental & Leasing | 4 (100.0%) | 0 (0.0%) |
| Professional & Scientific | 10 (71.4%) | 4 (28.6%) |
| Enterprise Management | 0 (0.0%) | 0 (0.0%) |
| Administrative & Support | 32 (72.7%) | 12 (27.3%) |
| Educational Services | 7 (10.3%) | 61 (89.7%) |
| Health Care & Social Assistance | 0 (0.0%) | 127 (100.0%) |
| Arts, Entertainment & Recreation | 0 (0.0%) | 12 (100.0%) |
| Accommodation & Food Services | 16 (13.8%) | 100 (86.2%) |
| Public Administration | 57 (89.1%) | 7 (10.9%) |
| Total | 537 (52.5%) | 485 (47.5%) |
Education in Lake Arthur
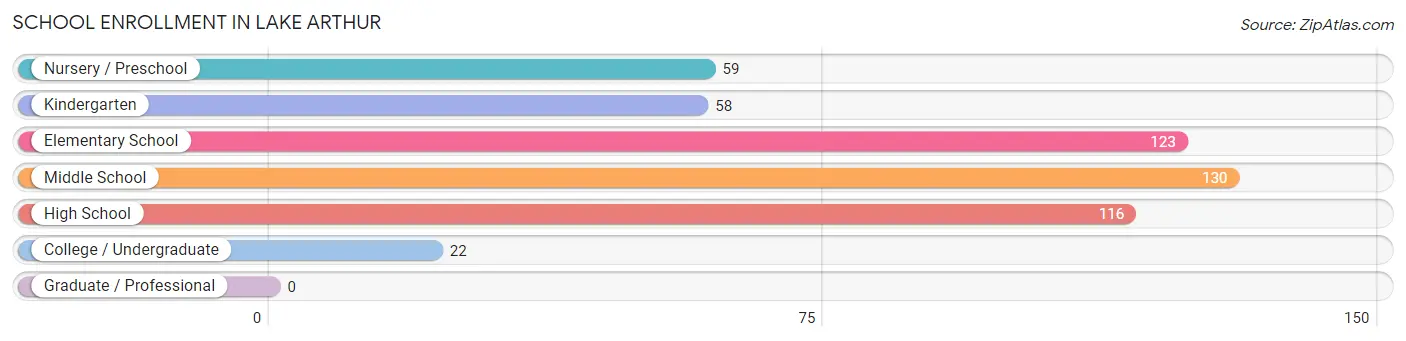
School Enrollment in Lake Arthur
The most common levels of schooling among the 508 students in Lake Arthur are middle school (130 | 25.6%), elementary school (123 | 24.2%), and high school (116 | 22.8%).
| School Level | # Students | % Students |
| Nursery / Preschool | 59 | 11.6% |
| Kindergarten | 58 | 11.4% |
| Elementary School | 123 | 24.2% |
| Middle School | 130 | 25.6% |
| High School | 116 | 22.8% |
| College / Undergraduate | 22 | 4.3% |
| Graduate / Professional | 0 | 0.0% |
| Total | 508 | 100.0% |
School Enrollment by Age by Funding Source in Lake Arthur
Out of a total of 508 students who are enrolled in schools in Lake Arthur, 9 (1.8%) attend a private institution, while the remaining 499 (98.2%) are enrolled in public schools. The age group of 15 to 17 year olds has the highest likelihood of being enrolled in private schools, with 5 (5.1% in the age bracket) enrolled. Conversely, the age group of 3 to 4 year olds has the lowest likelihood of being enrolled in a private school, with 16 (100.0% in the age bracket) attending a public institution.
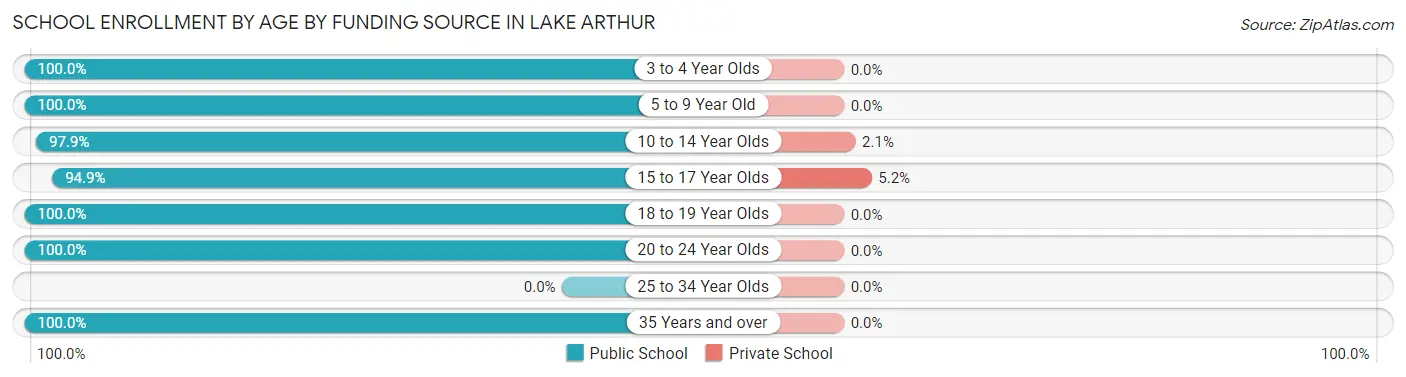
| Age Bracket | Public School | Private School |
| 3 to 4 Year Olds | 16 (100.0%) | 0 (0.0%) |
| 5 to 9 Year Old | 186 (100.0%) | 0 (0.0%) |
| 10 to 14 Year Olds | 183 (97.9%) | 4 (2.1%) |
| 15 to 17 Year Olds | 92 (94.9%) | 5 (5.1%) |
| 18 to 19 Year Olds | 8 (100.0%) | 0 (0.0%) |
| 20 to 24 Year Olds | 9 (100.0%) | 0 (0.0%) |
| 25 to 34 Year Olds | 0 (0.0%) | 0 (0.0%) |
| 35 Years and over | 5 (100.0%) | 0 (0.0%) |
| Total | 499 (98.2%) | 9 (1.8%) |
Educational Attainment by Field of Study in Lake Arthur
Psychology (45 | 30.2%), business (24 | 16.1%), education (23 | 15.4%), social sciences (17 | 11.4%), and bio, nature & agricultural (14 | 9.4%) are the most common fields of study among 149 individuals in Lake Arthur who have obtained a bachelor's degree or higher.

| Field of Study | # Graduates | % Graduates |
| Computers & Mathematics | 0 | 0.0% |
| Bio, Nature & Agricultural | 14 | 9.4% |
| Physical & Health Sciences | 12 | 8.1% |
| Psychology | 45 | 30.2% |
| Social Sciences | 17 | 11.4% |
| Engineering | 0 | 0.0% |
| Multidisciplinary Studies | 0 | 0.0% |
| Science & Technology | 0 | 0.0% |
| Business | 24 | 16.1% |
| Education | 23 | 15.4% |
| Literature & Languages | 11 | 7.4% |
| Liberal Arts & History | 0 | 0.0% |
| Visual & Performing Arts | 0 | 0.0% |
| Communications | 0 | 0.0% |
| Arts & Humanities | 3 | 2.0% |
| Total | 149 | 100.0% |
Transportation & Commute in Lake Arthur
Vehicle Availability by Sex in Lake Arthur
The most prevalent vehicle ownership categories in Lake Arthur are males with 2 vehicles (148, accounting for 27.6%) and females with 2 vehicles (123, making up 30.5%).
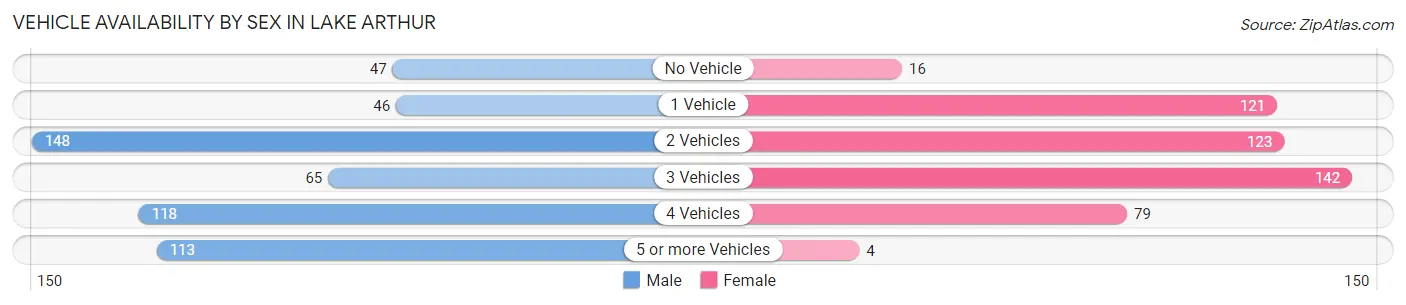
| Vehicles Available | Male | Female |
| No Vehicle | 47 (8.7%) | 16 (3.3%) |
| 1 Vehicle | 46 (8.6%) | 121 (24.9%) |
| 2 Vehicles | 148 (27.6%) | 123 (25.4%) |
| 3 Vehicles | 65 (12.1%) | 142 (29.3%) |
| 4 Vehicles | 118 (22.0%) | 79 (16.3%) |
| 5 or more Vehicles | 113 (21.0%) | 4 (0.8%) |
| Total | 537 (100.0%) | 485 (100.0%) |
Commute Time in Lake Arthur
The most frequently occuring commute durations in Lake Arthur are 15 to 19 minutes (220 commuters, 21.7%), 45 to 59 minutes (206 commuters, 20.3%), and 20 to 24 minutes (161 commuters, 15.9%).
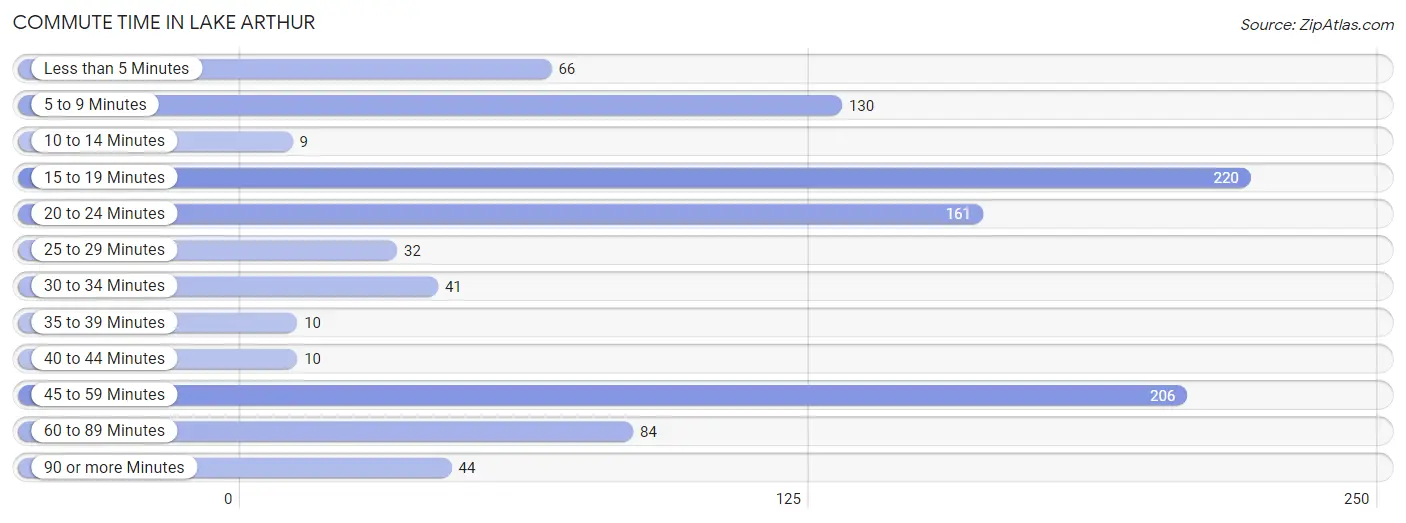
| Commute Time | # Commuters | % Commuters |
| Less than 5 Minutes | 66 | 6.5% |
| 5 to 9 Minutes | 130 | 12.8% |
| 10 to 14 Minutes | 9 | 0.9% |
| 15 to 19 Minutes | 220 | 21.7% |
| 20 to 24 Minutes | 161 | 15.9% |
| 25 to 29 Minutes | 32 | 3.2% |
| 30 to 34 Minutes | 41 | 4.1% |
| 35 to 39 Minutes | 10 | 1.0% |
| 40 to 44 Minutes | 10 | 1.0% |
| 45 to 59 Minutes | 206 | 20.3% |
| 60 to 89 Minutes | 84 | 8.3% |
| 90 or more Minutes | 44 | 4.3% |
Commute Time by Sex in Lake Arthur
The most common commute times in Lake Arthur are 45 to 59 minutes (142 commuters, 26.4%) for males and 15 to 19 minutes (116 commuters, 24.4%) for females.
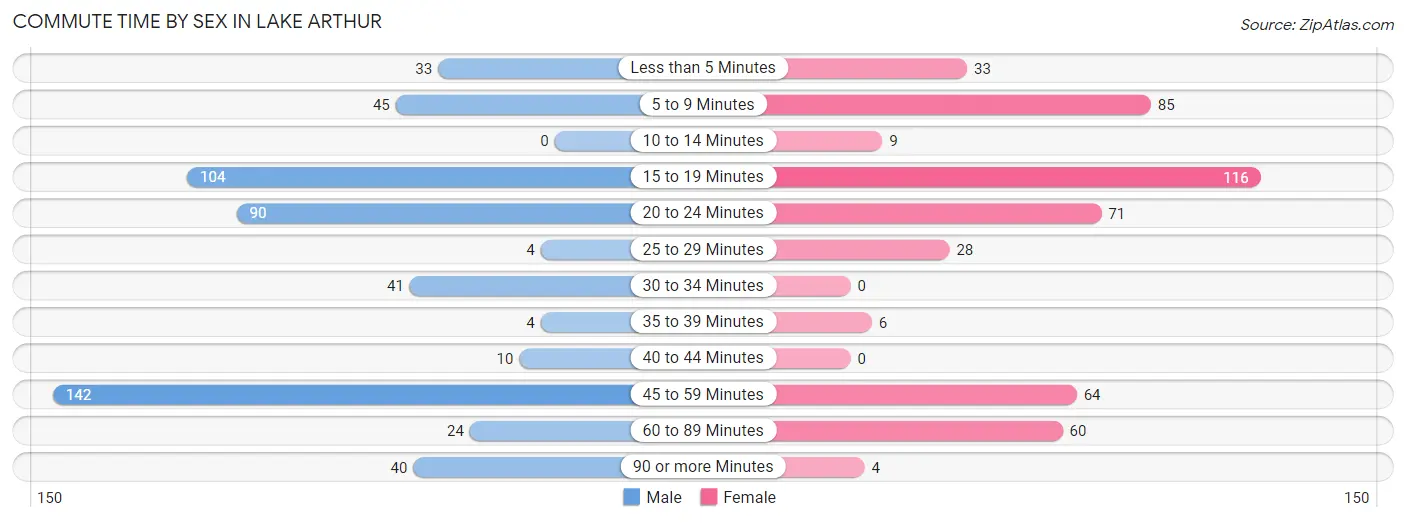
| Commute Time | Male | Female |
| Less than 5 Minutes | 33 (6.1%) | 33 (6.9%) |
| 5 to 9 Minutes | 45 (8.4%) | 85 (17.9%) |
| 10 to 14 Minutes | 0 (0.0%) | 9 (1.9%) |
| 15 to 19 Minutes | 104 (19.4%) | 116 (24.4%) |
| 20 to 24 Minutes | 90 (16.8%) | 71 (14.9%) |
| 25 to 29 Minutes | 4 (0.7%) | 28 (5.9%) |
| 30 to 34 Minutes | 41 (7.6%) | 0 (0.0%) |
| 35 to 39 Minutes | 4 (0.7%) | 6 (1.3%) |
| 40 to 44 Minutes | 10 (1.9%) | 0 (0.0%) |
| 45 to 59 Minutes | 142 (26.4%) | 64 (13.5%) |
| 60 to 89 Minutes | 24 (4.5%) | 60 (12.6%) |
| 90 or more Minutes | 40 (7.4%) | 4 (0.8%) |
Time of Departure to Work by Sex in Lake Arthur
The most frequent times of departure to work in Lake Arthur are 6:30 AM to 6:59 AM (121, 22.5%) for males and 4:00 PM to 11:59 PM (88, 18.5%) for females.
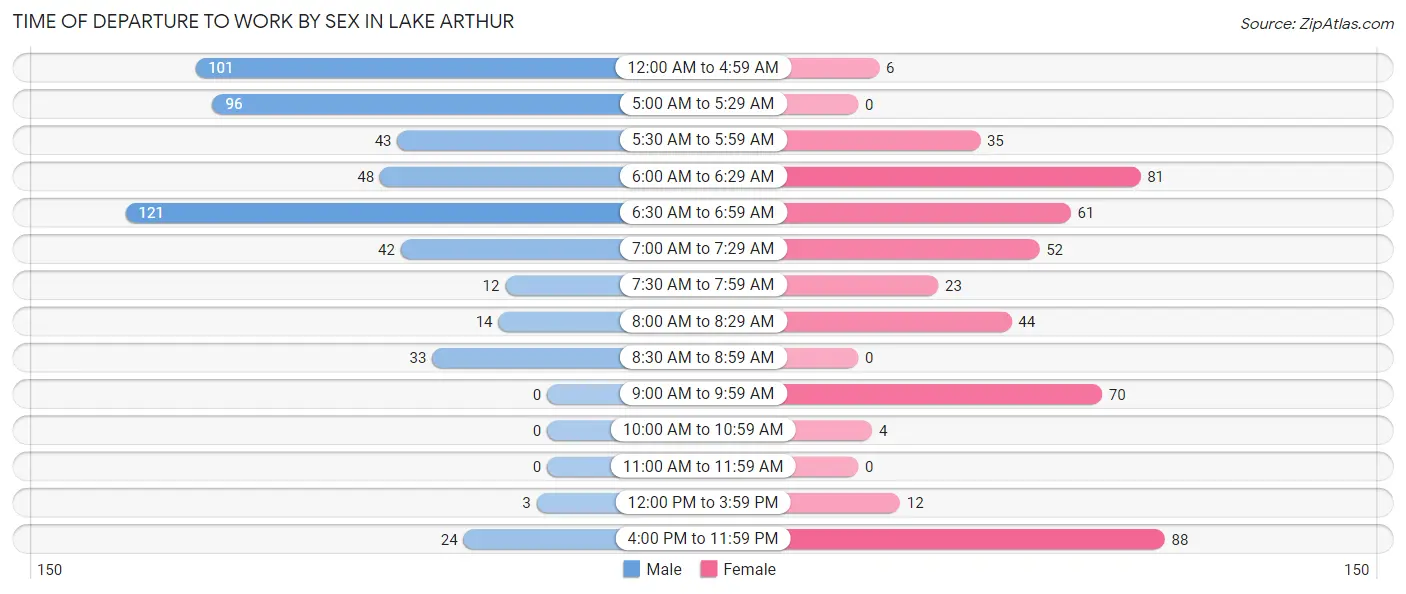
| Time of Departure | Male | Female |
| 12:00 AM to 4:59 AM | 101 (18.8%) | 6 (1.3%) |
| 5:00 AM to 5:29 AM | 96 (17.9%) | 0 (0.0%) |
| 5:30 AM to 5:59 AM | 43 (8.0%) | 35 (7.3%) |
| 6:00 AM to 6:29 AM | 48 (8.9%) | 81 (17.0%) |
| 6:30 AM to 6:59 AM | 121 (22.5%) | 61 (12.8%) |
| 7:00 AM to 7:29 AM | 42 (7.8%) | 52 (10.9%) |
| 7:30 AM to 7:59 AM | 12 (2.2%) | 23 (4.8%) |
| 8:00 AM to 8:29 AM | 14 (2.6%) | 44 (9.2%) |
| 8:30 AM to 8:59 AM | 33 (6.1%) | 0 (0.0%) |
| 9:00 AM to 9:59 AM | 0 (0.0%) | 70 (14.7%) |
| 10:00 AM to 10:59 AM | 0 (0.0%) | 4 (0.8%) |
| 11:00 AM to 11:59 AM | 0 (0.0%) | 0 (0.0%) |
| 12:00 PM to 3:59 PM | 3 (0.6%) | 12 (2.5%) |
| 4:00 PM to 11:59 PM | 24 (4.5%) | 88 (18.5%) |
| Total | 537 (100.0%) | 476 (100.0%) |
Housing Occupancy in Lake Arthur
Occupancy by Ownership in Lake Arthur
Of the total 885 dwellings in Lake Arthur, owner-occupied units account for 596 (67.3%), while renter-occupied units make up 289 (32.7%).
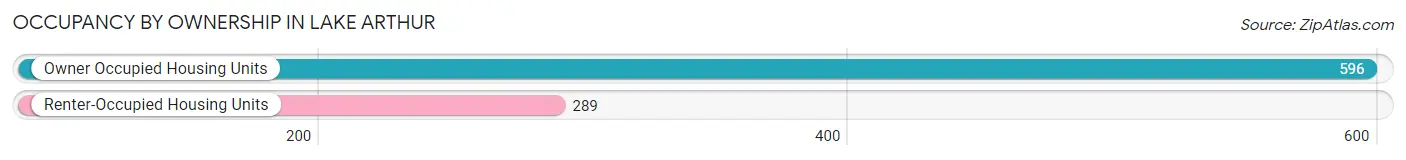
| Occupancy | # Housing Units | % Housing Units |
| Owner Occupied Housing Units | 596 | 67.3% |
| Renter-Occupied Housing Units | 289 | 32.7% |
| Total Occupied Housing Units | 885 | 100.0% |
Occupancy by Household Size in Lake Arthur
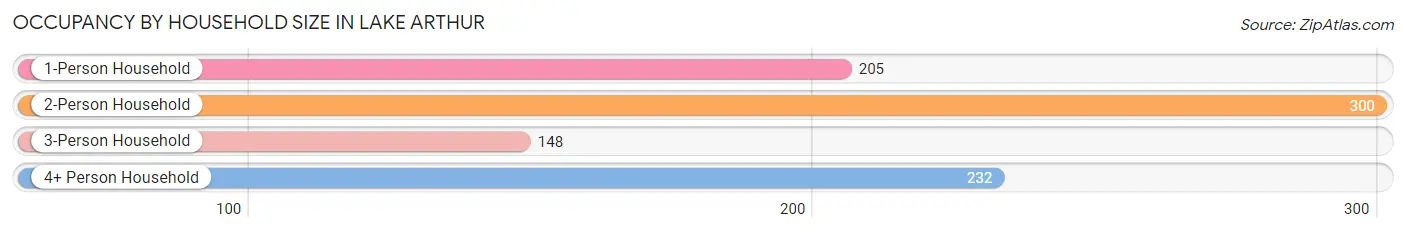
| Household Size | # Housing Units | % Housing Units |
| 1-Person Household | 205 | 23.2% |
| 2-Person Household | 300 | 33.9% |
| 3-Person Household | 148 | 16.7% |
| 4+ Person Household | 232 | 26.2% |
| Total Housing Units | 885 | 100.0% |
Occupancy by Ownership by Household Size in Lake Arthur
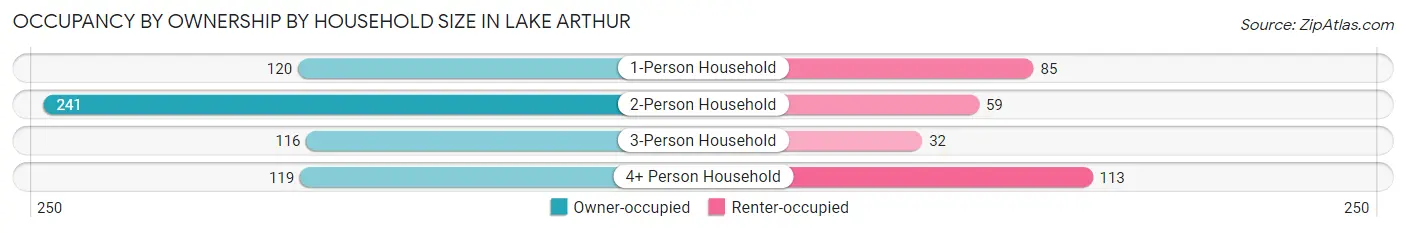
| Household Size | Owner-occupied | Renter-occupied |
| 1-Person Household | 120 (58.5%) | 85 (41.5%) |
| 2-Person Household | 241 (80.3%) | 59 (19.7%) |
| 3-Person Household | 116 (78.4%) | 32 (21.6%) |
| 4+ Person Household | 119 (51.3%) | 113 (48.7%) |
| Total Housing Units | 596 (67.3%) | 289 (32.7%) |
Occupancy by Educational Attainment in Lake Arthur
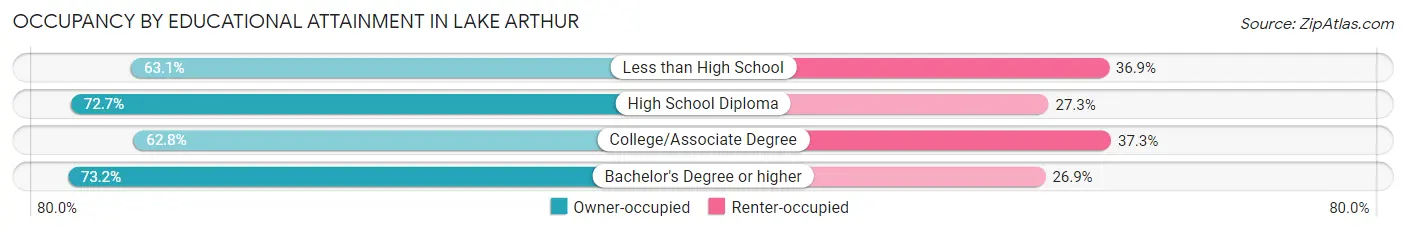
| Household Size | Owner-occupied | Renter-occupied |
| Less than High School | 147 (63.1%) | 86 (36.9%) |
| High School Diploma | 210 (72.7%) | 79 (27.3%) |
| College/Associate Degree | 160 (62.7%) | 95 (37.2%) |
| Bachelor's Degree or higher | 79 (73.2%) | 29 (26.9%) |
Occupancy by Age of Householder in Lake Arthur
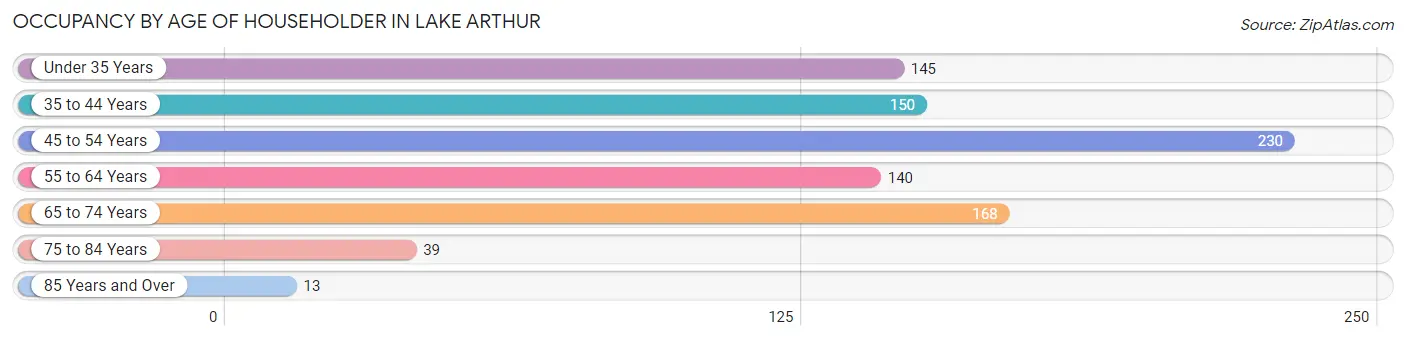
| Age Bracket | # Households | % Households |
| Under 35 Years | 145 | 16.4% |
| 35 to 44 Years | 150 | 17.0% |
| 45 to 54 Years | 230 | 26.0% |
| 55 to 64 Years | 140 | 15.8% |
| 65 to 74 Years | 168 | 19.0% |
| 75 to 84 Years | 39 | 4.4% |
| 85 Years and Over | 13 | 1.5% |
| Total | 885 | 100.0% |
Housing Finances in Lake Arthur
Median Income by Occupancy in Lake Arthur
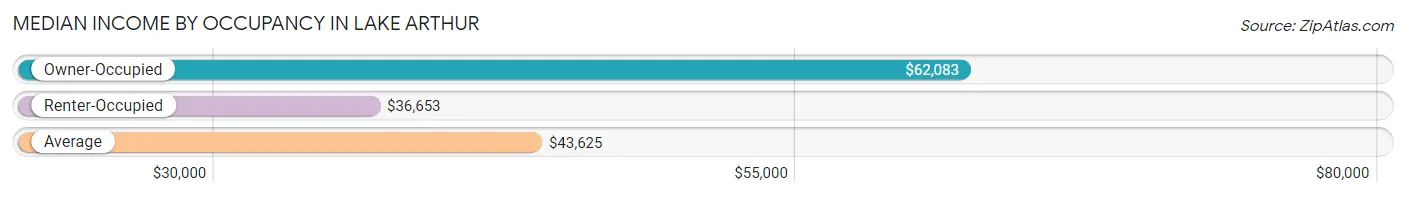
| Occupancy Type | # Households | Median Income |
| Owner-Occupied | 596 (67.3%) | $62,083 |
| Renter-Occupied | 289 (32.7%) | $36,653 |
| Average | 885 (100.0%) | $43,625 |
Occupancy by Householder Income Bracket in Lake Arthur
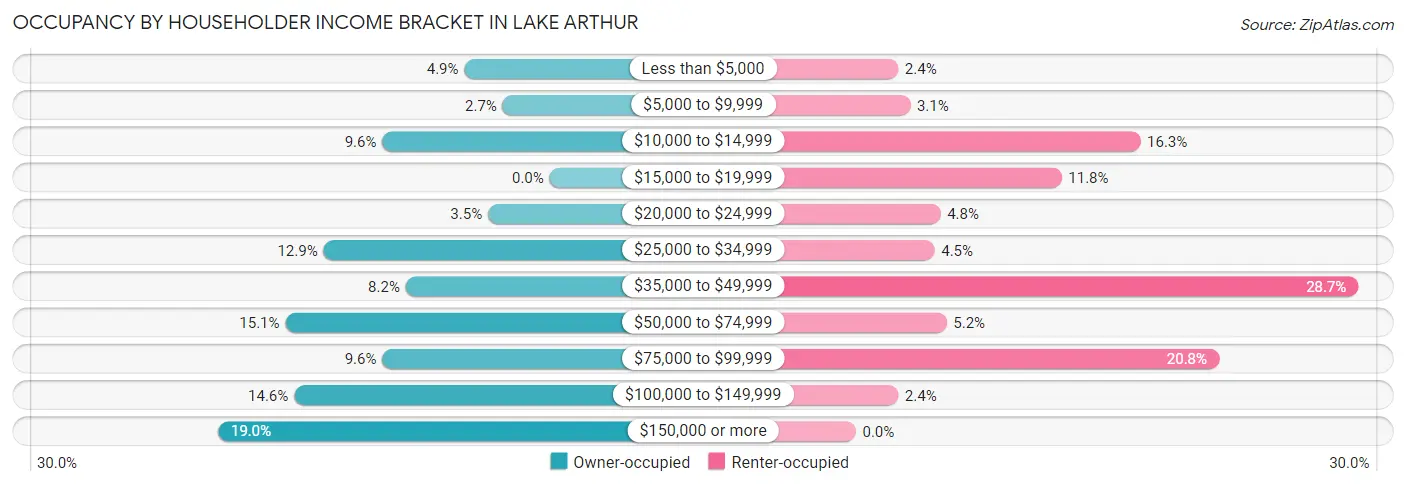
| Income Bracket | Owner-occupied | Renter-occupied |
| Less than $5,000 | 29 (4.9%) | 7 (2.4%) |
| $5,000 to $9,999 | 16 (2.7%) | 9 (3.1%) |
| $10,000 to $14,999 | 57 (9.6%) | 47 (16.3%) |
| $15,000 to $19,999 | 0 (0.0%) | 34 (11.8%) |
| $20,000 to $24,999 | 21 (3.5%) | 14 (4.8%) |
| $25,000 to $34,999 | 77 (12.9%) | 13 (4.5%) |
| $35,000 to $49,999 | 49 (8.2%) | 83 (28.7%) |
| $50,000 to $74,999 | 90 (15.1%) | 15 (5.2%) |
| $75,000 to $99,999 | 57 (9.6%) | 60 (20.8%) |
| $100,000 to $149,999 | 87 (14.6%) | 7 (2.4%) |
| $150,000 or more | 113 (19.0%) | 0 (0.0%) |
| Total | 596 (100.0%) | 289 (100.0%) |
Monthly Housing Cost Tiers in Lake Arthur
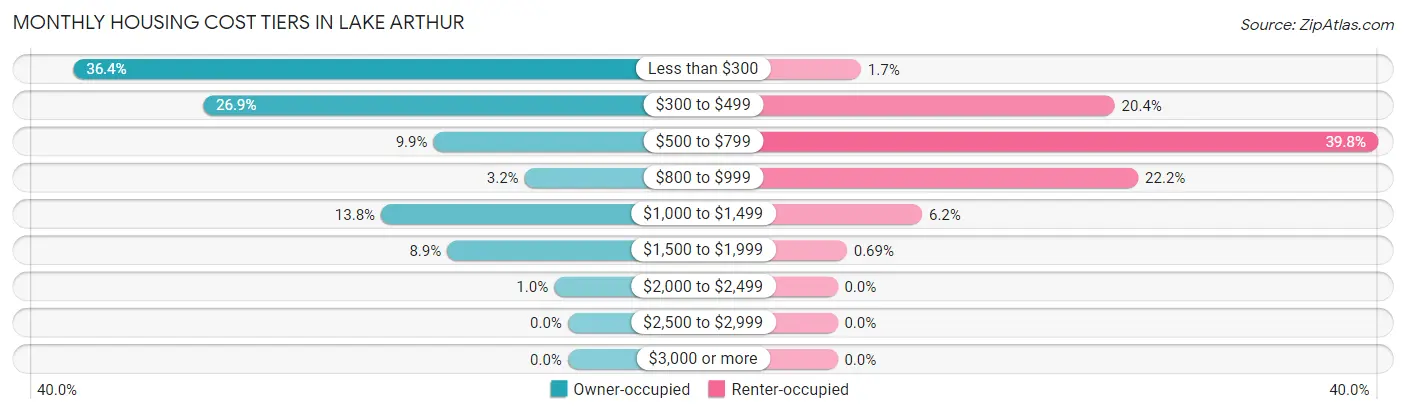
| Monthly Cost | Owner-occupied | Renter-occupied |
| Less than $300 | 217 (36.4%) | 5 (1.7%) |
| $300 to $499 | 160 (26.9%) | 59 (20.4%) |
| $500 to $799 | 59 (9.9%) | 115 (39.8%) |
| $800 to $999 | 19 (3.2%) | 64 (22.2%) |
| $1,000 to $1,499 | 82 (13.8%) | 18 (6.2%) |
| $1,500 to $1,999 | 53 (8.9%) | 2 (0.7%) |
| $2,000 to $2,499 | 6 (1.0%) | 0 (0.0%) |
| $2,500 to $2,999 | 0 (0.0%) | 0 (0.0%) |
| $3,000 or more | 0 (0.0%) | 0 (0.0%) |
| Total | 596 (100.0%) | 289 (100.0%) |
Physical Housing Characteristics in Lake Arthur
Housing Structures in Lake Arthur
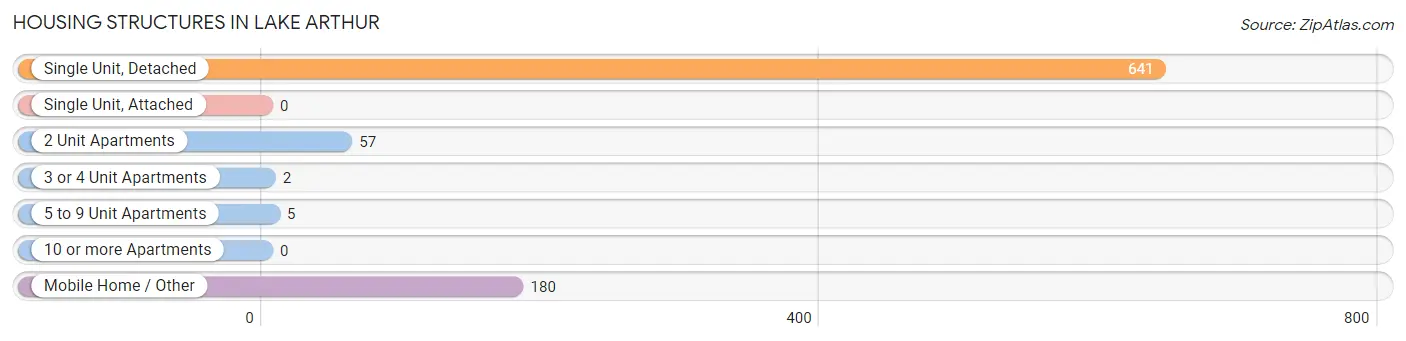
| Structure Type | # Housing Units | % Housing Units |
| Single Unit, Detached | 641 | 72.4% |
| Single Unit, Attached | 0 | 0.0% |
| 2 Unit Apartments | 57 | 6.4% |
| 3 or 4 Unit Apartments | 2 | 0.2% |
| 5 to 9 Unit Apartments | 5 | 0.6% |
| 10 or more Apartments | 0 | 0.0% |
| Mobile Home / Other | 180 | 20.3% |
| Total | 885 | 100.0% |
Housing Structures by Occupancy in Lake Arthur
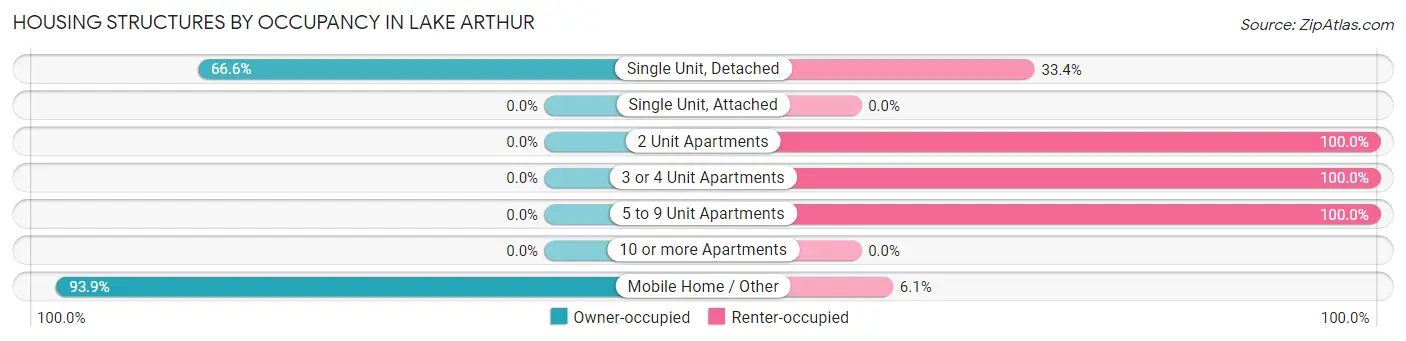
| Structure Type | Owner-occupied | Renter-occupied |
| Single Unit, Detached | 427 (66.6%) | 214 (33.4%) |
| Single Unit, Attached | 0 (0.0%) | 0 (0.0%) |
| 2 Unit Apartments | 0 (0.0%) | 57 (100.0%) |
| 3 or 4 Unit Apartments | 0 (0.0%) | 2 (100.0%) |
| 5 to 9 Unit Apartments | 0 (0.0%) | 5 (100.0%) |
| 10 or more Apartments | 0 (0.0%) | 0 (0.0%) |
| Mobile Home / Other | 169 (93.9%) | 11 (6.1%) |
| Total | 596 (67.3%) | 289 (32.7%) |
Housing Structures by Number of Rooms in Lake Arthur
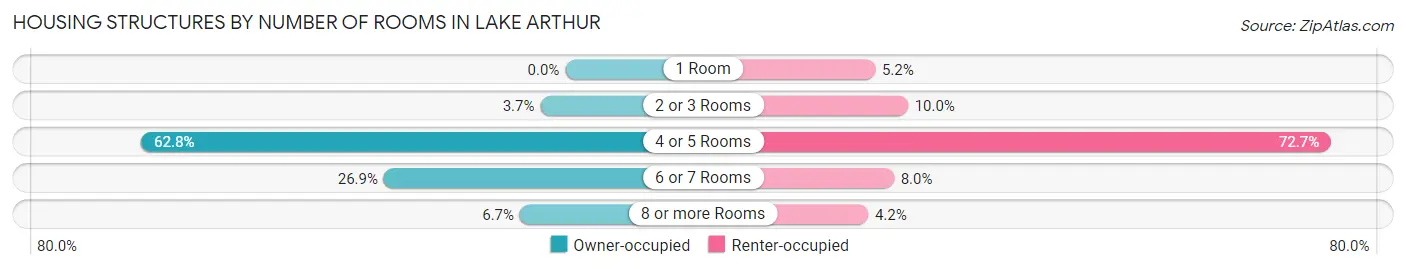
| Number of Rooms | Owner-occupied | Renter-occupied |
| 1 Room | 0 (0.0%) | 15 (5.2%) |
| 2 or 3 Rooms | 22 (3.7%) | 29 (10.0%) |
| 4 or 5 Rooms | 374 (62.7%) | 210 (72.7%) |
| 6 or 7 Rooms | 160 (26.9%) | 23 (8.0%) |
| 8 or more Rooms | 40 (6.7%) | 12 (4.2%) |
| Total | 596 (100.0%) | 289 (100.0%) |
Housing Structure by Heating Type in Lake Arthur
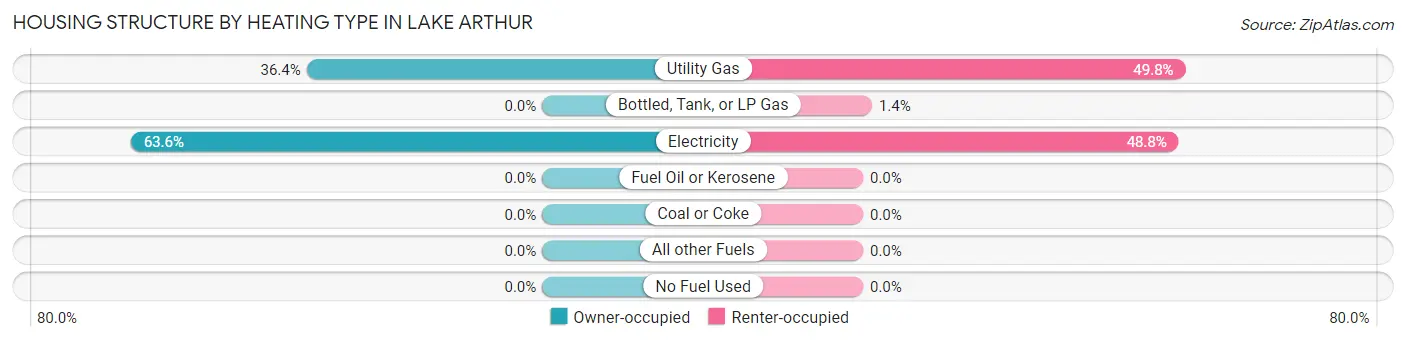
| Heating Type | Owner-occupied | Renter-occupied |
| Utility Gas | 217 (36.4%) | 144 (49.8%) |
| Bottled, Tank, or LP Gas | 0 (0.0%) | 4 (1.4%) |
| Electricity | 379 (63.6%) | 141 (48.8%) |
| Fuel Oil or Kerosene | 0 (0.0%) | 0 (0.0%) |
| Coal or Coke | 0 (0.0%) | 0 (0.0%) |
| All other Fuels | 0 (0.0%) | 0 (0.0%) |
| No Fuel Used | 0 (0.0%) | 0 (0.0%) |
| Total | 596 (100.0%) | 289 (100.0%) |
Household Vehicle Usage in Lake Arthur
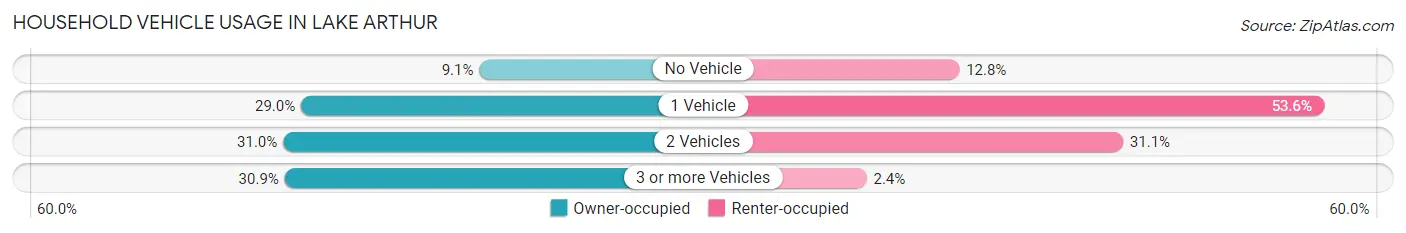
| Vehicles per Household | Owner-occupied | Renter-occupied |
| No Vehicle | 54 (9.1%) | 37 (12.8%) |
| 1 Vehicle | 173 (29.0%) | 155 (53.6%) |
| 2 Vehicles | 185 (31.0%) | 90 (31.1%) |
| 3 or more Vehicles | 184 (30.9%) | 7 (2.4%) |
| Total | 596 (100.0%) | 289 (100.0%) |
Real Estate & Mortgages in Lake Arthur
Real Estate and Mortgage Overview in Lake Arthur
| Characteristic | Without Mortgage | With Mortgage |
| Housing Units | 401 | 195 |
| Median Property Value | $51,000 | $120,700 |
| Median Household Income | $46,563 | $98 |
| Monthly Housing Costs | $291 | $0 |
| Real Estate Taxes | $199 | $0 |
Property Value by Mortgage Status in Lake Arthur
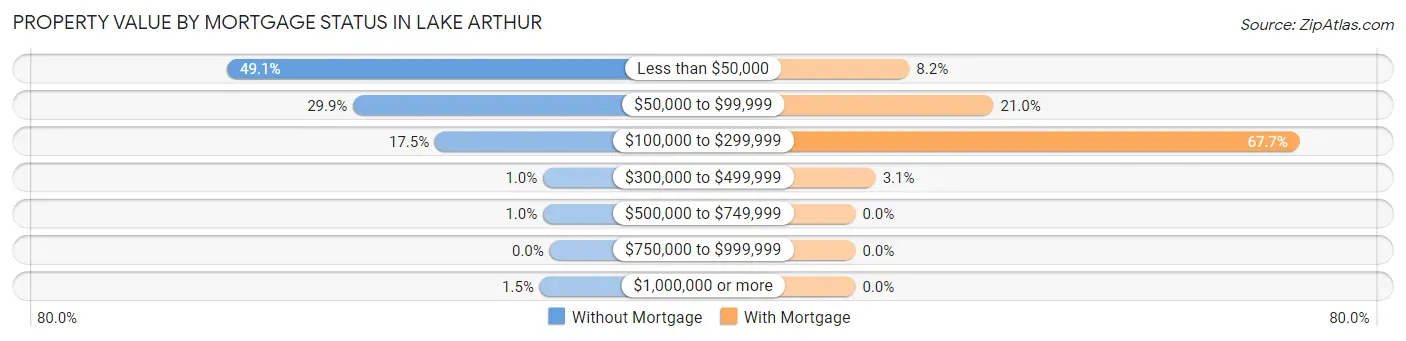
| Property Value | Without Mortgage | With Mortgage |
| Less than $50,000 | 197 (49.1%) | 16 (8.2%) |
| $50,000 to $99,999 | 120 (29.9%) | 41 (21.0%) |
| $100,000 to $299,999 | 70 (17.5%) | 132 (67.7%) |
| $300,000 to $499,999 | 4 (1.0%) | 6 (3.1%) |
| $500,000 to $749,999 | 4 (1.0%) | 0 (0.0%) |
| $750,000 to $999,999 | 0 (0.0%) | 0 (0.0%) |
| $1,000,000 or more | 6 (1.5%) | 0 (0.0%) |
| Total | 401 (100.0%) | 195 (100.0%) |
Household Income by Mortgage Status in Lake Arthur
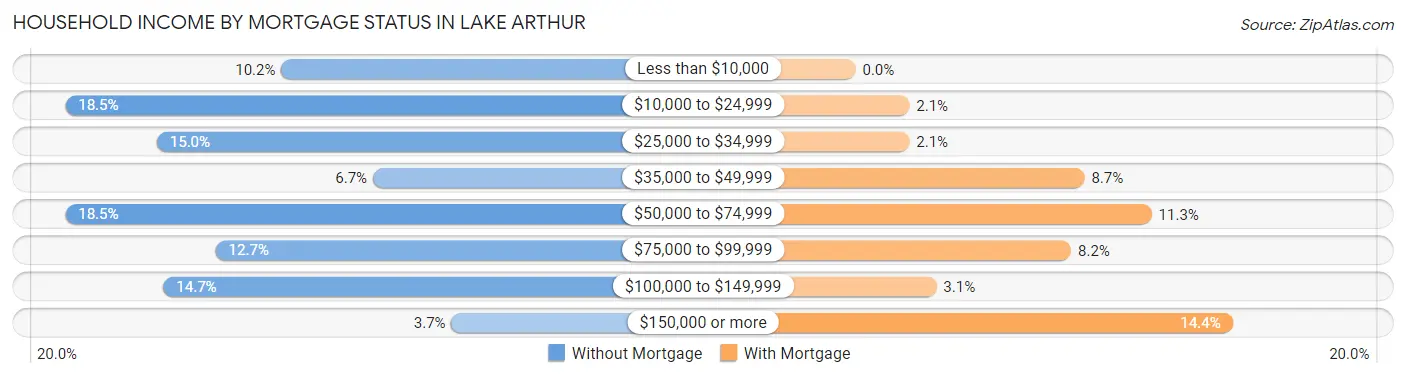
| Household Income | Without Mortgage | With Mortgage |
| Less than $10,000 | 41 (10.2%) | 0 (0.0%) |
| $10,000 to $24,999 | 74 (18.4%) | 4 (2.1%) |
| $25,000 to $34,999 | 60 (15.0%) | 4 (2.1%) |
| $35,000 to $49,999 | 27 (6.7%) | 17 (8.7%) |
| $50,000 to $74,999 | 74 (18.4%) | 22 (11.3%) |
| $75,000 to $99,999 | 51 (12.7%) | 16 (8.2%) |
| $100,000 to $149,999 | 59 (14.7%) | 6 (3.1%) |
| $150,000 or more | 15 (3.7%) | 28 (14.4%) |
| Total | 401 (100.0%) | 195 (100.0%) |
Property Value to Household Income Ratio in Lake Arthur
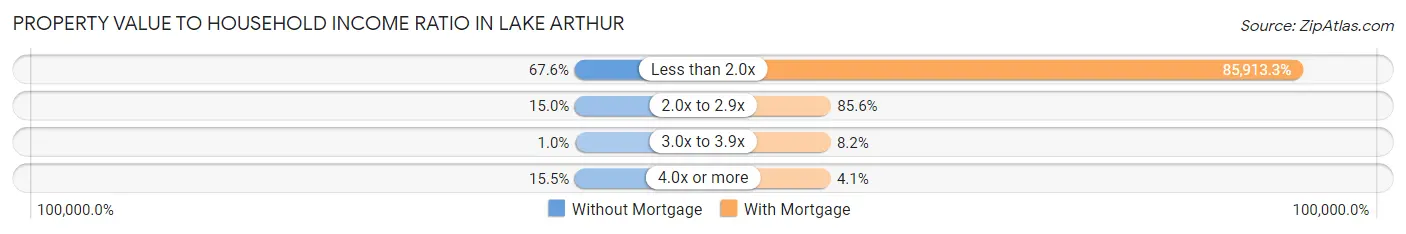
| Value-to-Income Ratio | Without Mortgage | With Mortgage |
| Less than 2.0x | 271 (67.6%) | 167,531 (85,913.3%) |
| 2.0x to 2.9x | 60 (15.0%) | 167 (85.6%) |
| 3.0x to 3.9x | 4 (1.0%) | 16 (8.2%) |
| 4.0x or more | 62 (15.5%) | 8 (4.1%) |
| Total | 401 (100.0%) | 195 (100.0%) |
Real Estate Taxes by Mortgage Status in Lake Arthur
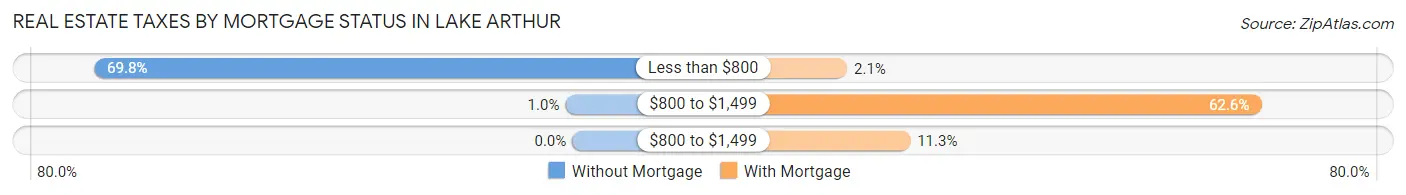
| Property Taxes | Without Mortgage | With Mortgage |
| Less than $800 | 280 (69.8%) | 4 (2.1%) |
| $800 to $1,499 | 4 (1.0%) | 122 (62.6%) |
| $800 to $1,499 | 0 (0.0%) | 22 (11.3%) |
| Total | 401 (100.0%) | 195 (100.0%) |
Health & Disability in Lake Arthur
Health Insurance Coverage by Age in Lake Arthur
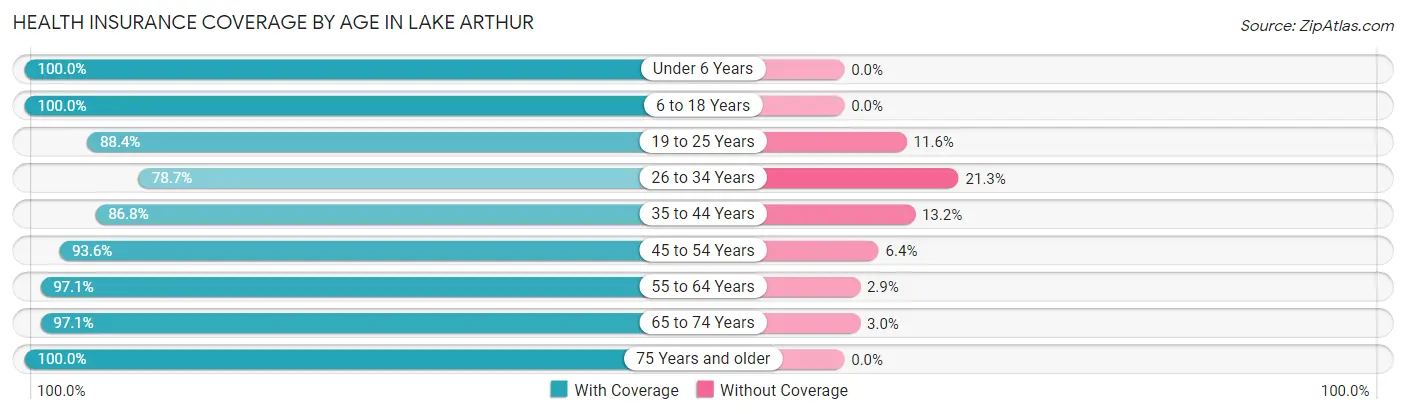
| Age Bracket | With Coverage | Without Coverage |
| Under 6 Years | 152 (100.0%) | 0 (0.0%) |
| 6 to 18 Years | 461 (100.0%) | 0 (0.0%) |
| 19 to 25 Years | 380 (88.4%) | 50 (11.6%) |
| 26 to 34 Years | 203 (78.7%) | 55 (21.3%) |
| 35 to 44 Years | 270 (86.8%) | 41 (13.2%) |
| 45 to 54 Years | 394 (93.6%) | 27 (6.4%) |
| 55 to 64 Years | 266 (97.1%) | 8 (2.9%) |
| 65 to 74 Years | 230 (97.1%) | 7 (2.9%) |
| 75 Years and older | 73 (100.0%) | 0 (0.0%) |
| Total | 2,429 (92.8%) | 188 (7.2%) |
Health Insurance Coverage by Citizenship Status in Lake Arthur
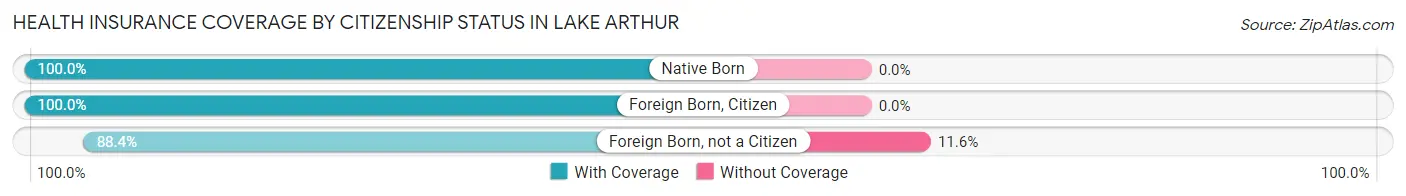
| Citizenship Status | With Coverage | Without Coverage |
| Native Born | 152 (100.0%) | 0 (0.0%) |
| Foreign Born, Citizen | 461 (100.0%) | 0 (0.0%) |
| Foreign Born, not a Citizen | 380 (88.4%) | 50 (11.6%) |
Health Insurance Coverage by Household Income in Lake Arthur
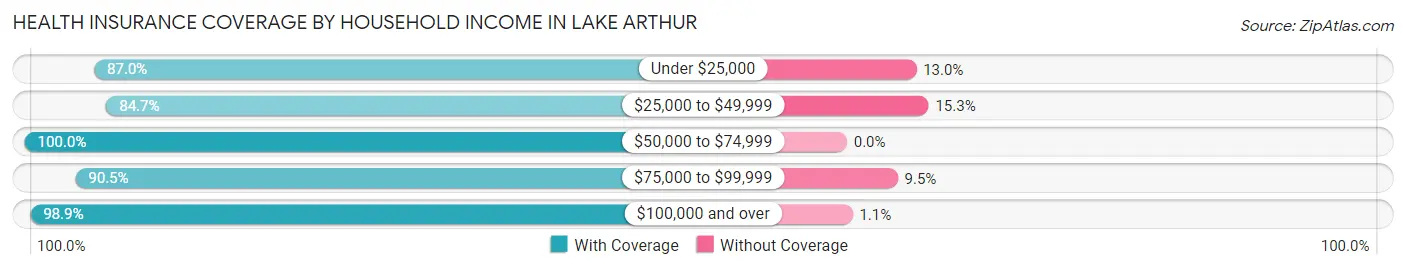
| Household Income | With Coverage | Without Coverage |
| Under $25,000 | 368 (87.0%) | 55 (13.0%) |
| $25,000 to $49,999 | 509 (84.7%) | 92 (15.3%) |
| $50,000 to $74,999 | 405 (100.0%) | 0 (0.0%) |
| $75,000 to $99,999 | 304 (90.5%) | 32 (9.5%) |
| $100,000 and over | 843 (98.9%) | 9 (1.1%) |
Public vs Private Health Insurance Coverage by Age in Lake Arthur
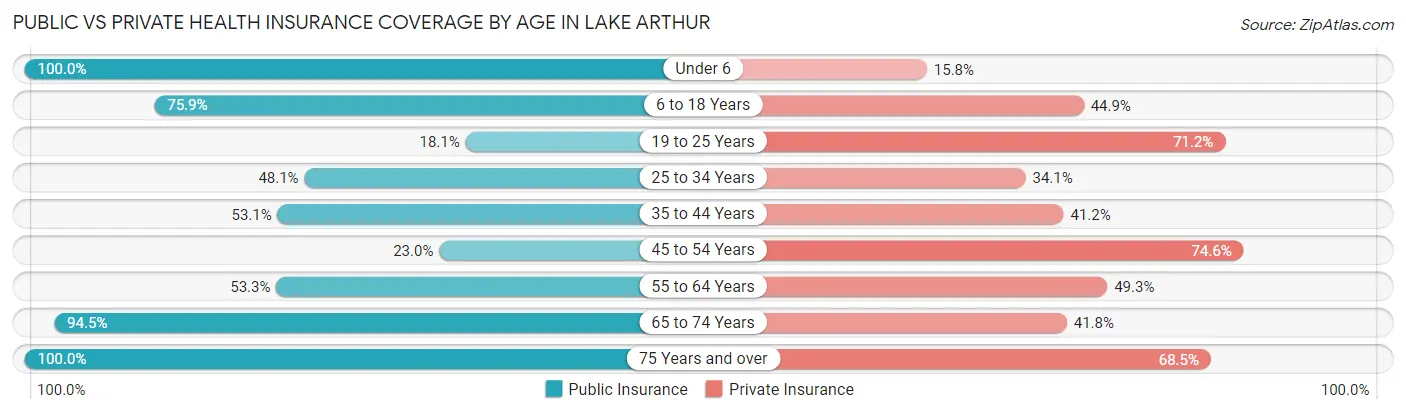
| Age Bracket | Public Insurance | Private Insurance |
| Under 6 | 152 (100.0%) | 24 (15.8%) |
| 6 to 18 Years | 350 (75.9%) | 207 (44.9%) |
| 19 to 25 Years | 78 (18.1%) | 306 (71.2%) |
| 25 to 34 Years | 124 (48.1%) | 88 (34.1%) |
| 35 to 44 Years | 165 (53.0%) | 128 (41.2%) |
| 45 to 54 Years | 97 (23.0%) | 314 (74.6%) |
| 55 to 64 Years | 146 (53.3%) | 135 (49.3%) |
| 65 to 74 Years | 224 (94.5%) | 99 (41.8%) |
| 75 Years and over | 73 (100.0%) | 50 (68.5%) |
| Total | 1,409 (53.8%) | 1,351 (51.6%) |
Disability Status by Sex by Age in Lake Arthur
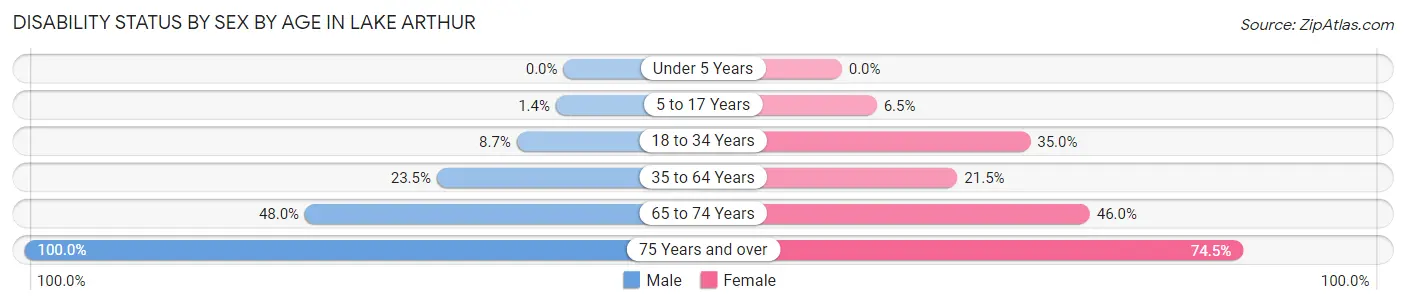
| Age Bracket | Male | Female |
| Under 5 Years | 0 (0.0%) | 0 (0.0%) |
| 5 to 17 Years | 4 (1.4%) | 14 (6.5%) |
| 18 to 34 Years | 31 (8.7%) | 120 (35.0%) |
| 35 to 64 Years | 117 (23.5%) | 109 (21.5%) |
| 65 to 74 Years | 47 (48.0%) | 64 (46.0%) |
| 75 Years and over | 26 (100.0%) | 35 (74.5%) |
Disability Class by Sex by Age in Lake Arthur
Disability Class: Hearing Difficulty
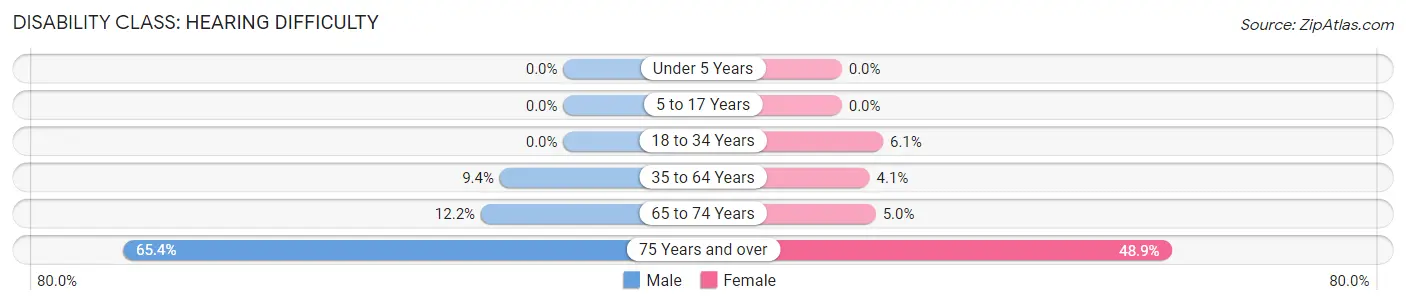
| Age Bracket | Male | Female |
| Under 5 Years | 0 (0.0%) | 0 (0.0%) |
| 5 to 17 Years | 0 (0.0%) | 0 (0.0%) |
| 18 to 34 Years | 0 (0.0%) | 21 (6.1%) |
| 35 to 64 Years | 47 (9.4%) | 21 (4.1%) |
| 65 to 74 Years | 12 (12.2%) | 7 (5.0%) |
| 75 Years and over | 17 (65.4%) | 23 (48.9%) |
Disability Class: Vision Difficulty
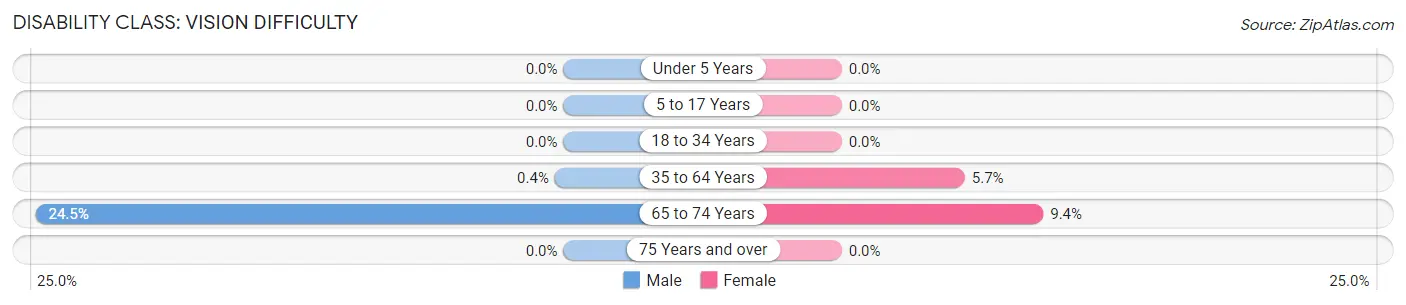
| Age Bracket | Male | Female |
| Under 5 Years | 0 (0.0%) | 0 (0.0%) |
| 5 to 17 Years | 0 (0.0%) | 0 (0.0%) |
| 18 to 34 Years | 0 (0.0%) | 0 (0.0%) |
| 35 to 64 Years | 2 (0.4%) | 29 (5.7%) |
| 65 to 74 Years | 24 (24.5%) | 13 (9.3%) |
| 75 Years and over | 0 (0.0%) | 0 (0.0%) |
Disability Class: Cognitive Difficulty
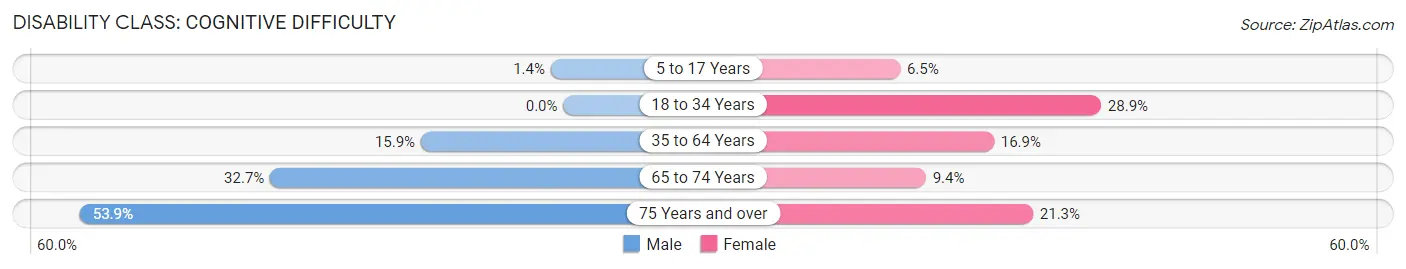
| Age Bracket | Male | Female |
| 5 to 17 Years | 4 (1.4%) | 14 (6.5%) |
| 18 to 34 Years | 0 (0.0%) | 99 (28.9%) |
| 35 to 64 Years | 79 (15.9%) | 86 (16.9%) |
| 65 to 74 Years | 32 (32.7%) | 13 (9.3%) |
| 75 Years and over | 14 (53.8%) | 10 (21.3%) |
Disability Class: Ambulatory Difficulty
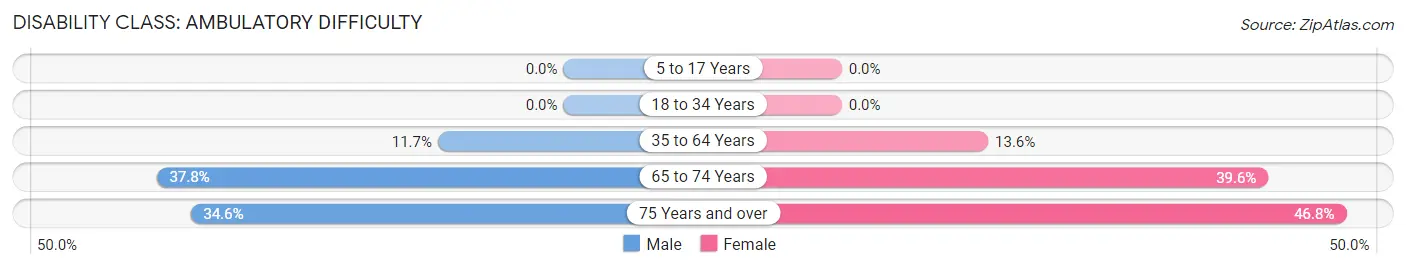
| Age Bracket | Male | Female |
| 5 to 17 Years | 0 (0.0%) | 0 (0.0%) |
| 18 to 34 Years | 0 (0.0%) | 0 (0.0%) |
| 35 to 64 Years | 58 (11.7%) | 69 (13.6%) |
| 65 to 74 Years | 37 (37.8%) | 55 (39.6%) |
| 75 Years and over | 9 (34.6%) | 22 (46.8%) |
Disability Class: Self-Care Difficulty
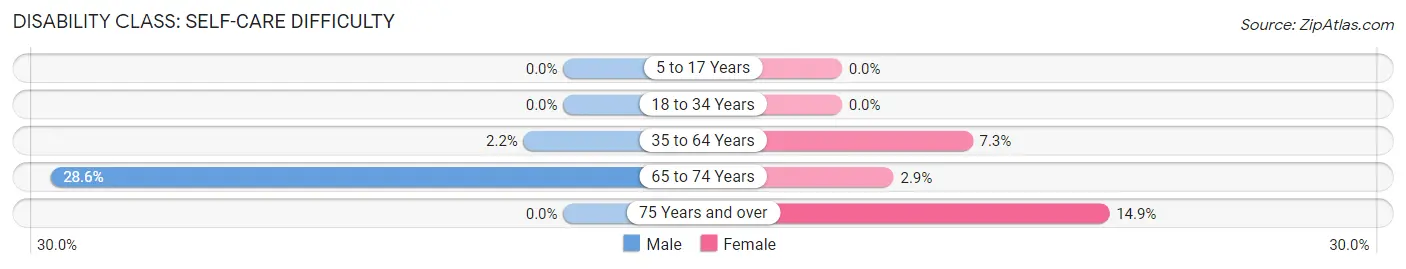
| Age Bracket | Male | Female |
| 5 to 17 Years | 0 (0.0%) | 0 (0.0%) |
| 18 to 34 Years | 0 (0.0%) | 0 (0.0%) |
| 35 to 64 Years | 11 (2.2%) | 37 (7.3%) |
| 65 to 74 Years | 28 (28.6%) | 4 (2.9%) |
| 75 Years and over | 0 (0.0%) | 7 (14.9%) |
Technology Access in Lake Arthur
Computing Device Access in Lake Arthur
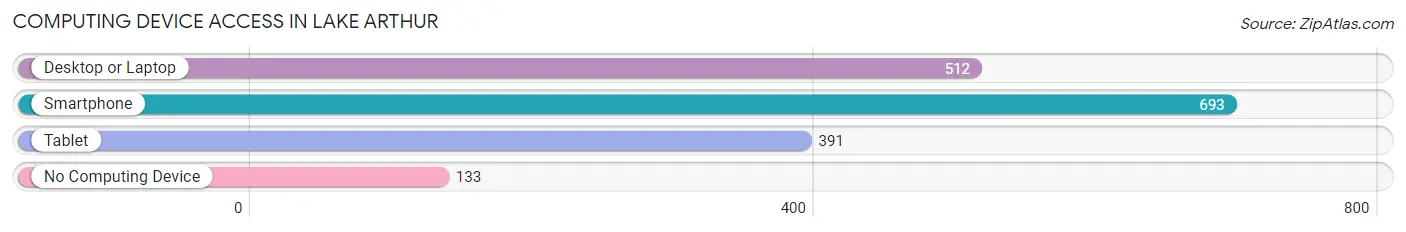
| Device Type | # Households | % Households |
| Desktop or Laptop | 512 | 57.9% |
| Smartphone | 693 | 78.3% |
| Tablet | 391 | 44.2% |
| No Computing Device | 133 | 15.0% |
| Total | 885 | 100.0% |
Internet Access in Lake Arthur
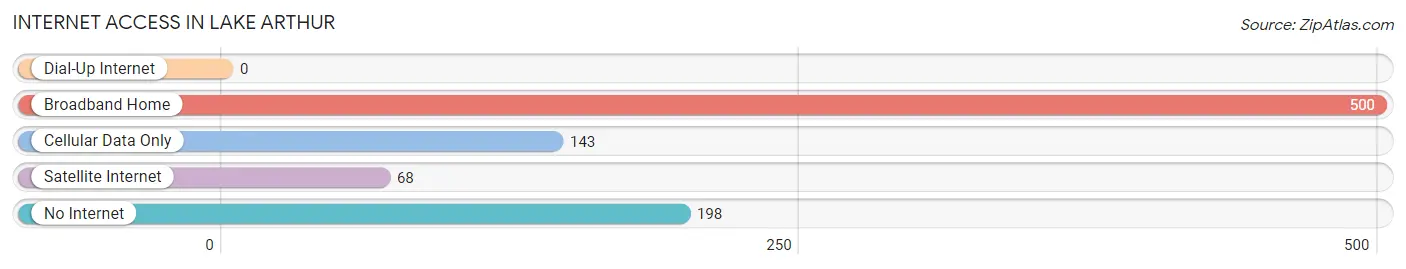
| Internet Type | # Households | % Households |
| Dial-Up Internet | 0 | 0.0% |
| Broadband Home | 500 | 56.5% |
| Cellular Data Only | 143 | 16.2% |
| Satellite Internet | 68 | 7.7% |
| No Internet | 198 | 22.4% |
| Total | 885 | 100.0% |
Lake Arthur Summary
History
Lake Arthur is a small town located in the southwestern corner of Louisiana, in Jefferson Davis Parish. It was founded in the late 19th century by a group of settlers from the nearby town of Welsh. The town was named after Arthur Broussard, a local landowner who donated the land for the town.
The town was originally a farming community, with cotton and sugar cane being the main crops. In the early 20th century, the town began to grow as the lumber industry began to take off. The town was also home to a number of sawmills, which provided jobs for many of the town’s residents.
In the 1950s, the town began to experience a population boom as oil and gas exploration began in the area. This led to the construction of a number of oil and gas refineries in the area, which provided jobs for many of the town’s residents.
In the late 20th century, the town began to experience a decline in population as the oil and gas industry began to decline. This led to a decrease in the number of jobs available in the area. However, the town has since experienced a resurgence in population as the tourism industry has grown in the area.
Geography
Lake Arthur is located in the southwestern corner of Louisiana, in Jefferson Davis Parish. It is situated on the banks of the Calcasieu River, which flows through the town. The town is located approximately 30 miles south of Lake Charles and approximately 40 miles east of Beaumont, Texas.
The town is located in a humid subtropical climate zone, with hot summers and mild winters. The average annual temperature is around 70 degrees Fahrenheit, with the average high temperature in the summer months reaching around 90 degrees Fahrenheit.
Economy
The economy of Lake Arthur is largely based on the tourism industry. The town is home to a number of tourist attractions, including the Lake Arthur State Park, which offers camping, fishing, and other outdoor activities. The town is also home to a number of restaurants, bars, and other businesses that cater to tourists.
In addition to the tourism industry, the town is also home to a number of oil and gas refineries, which provide jobs for many of the town’s residents. The town is also home to a number of sawmills, which provide jobs for many of the town’s residents.
Demographics
As of the 2010 census, the population of Lake Arthur was 2,945. The racial makeup of the town was 79.3% White, 17.2% African American, 0.7% Native American, 0.3% Asian, 0.1% Pacific Islander, and 2.4% from other races. The median household income in the town was $31,250, and the median family income was $37,500. The per capita income in the town was $17,845.
Conclusion
Lake Arthur is a small town located in the southwestern corner of Louisiana, in Jefferson Davis Parish. It was founded in the late 19th century by a group of settlers from the nearby town of Welsh. The town is home to a number of tourist attractions, including the Lake Arthur State Park, which offers camping, fishing, and other outdoor activities. The town is also home to a number of oil and gas refineries, which provide jobs for many of the town’s residents. As of the 2010 census, the population of Lake Arthur was 2,945. The racial makeup of the town was 79.3% White, 17.2% African American, 0.7% Native American, 0.3% Asian, 0.1% Pacific Islander, and 2.4% from other races. The median household income in the town was $31,250, and the median family income was $37,500. The per capita income in the town was $17,845.
Common Questions
What is Per Capita Income in Lake Arthur?
Per Capita income in Lake Arthur is $26,368.
What is the Median Family Income in Lake Arthur?
Median Family Income in Lake Arthur is $64,107.
What is the Median Household income in Lake Arthur?
Median Household Income in Lake Arthur is $43,625.
What is Income or Wage Gap in Lake Arthur?
Income or Wage Gap in Lake Arthur is 65.1%.
Women in Lake Arthur earn 34.9 cents for every dollar earned by a man.
What is Inequality or Gini Index in Lake Arthur?
Inequality or Gini Index in Lake Arthur is 0.46.
What is the Total Population of Lake Arthur?
Total Population of Lake Arthur is 2,617.
What is the Total Male Population of Lake Arthur?
Total Male Population of Lake Arthur is 1,307.
What is the Total Female Population of Lake Arthur?
Total Female Population of Lake Arthur is 1,310.
What is the Ratio of Males per 100 Females in Lake Arthur?
There are 99.77 Males per 100 Females in Lake Arthur.
What is the Ratio of Females per 100 Males in Lake Arthur?
There are 100.23 Females per 100 Males in Lake Arthur.
What is the Median Population Age in Lake Arthur?
Median Population Age in Lake Arthur is 36.0 Years.
What is the Average Family Size in Lake Arthur
Average Family Size in Lake Arthur is 3.4 People.
What is the Average Household Size in Lake Arthur
Average Household Size in Lake Arthur is 3.0 People.
How Large is the Labor Force in Lake Arthur?
There are 1,129 People in the Labor Forcein in Lake Arthur.
What is the Percentage of People in the Labor Force in Lake Arthur?
53.6% of People are in the Labor Force in Lake Arthur.
What is the Unemployment Rate in Lake Arthur?
Unemployment Rate in Lake Arthur is 9.4%.