Lacombe, LA Map & Demographics
Lacombe Map
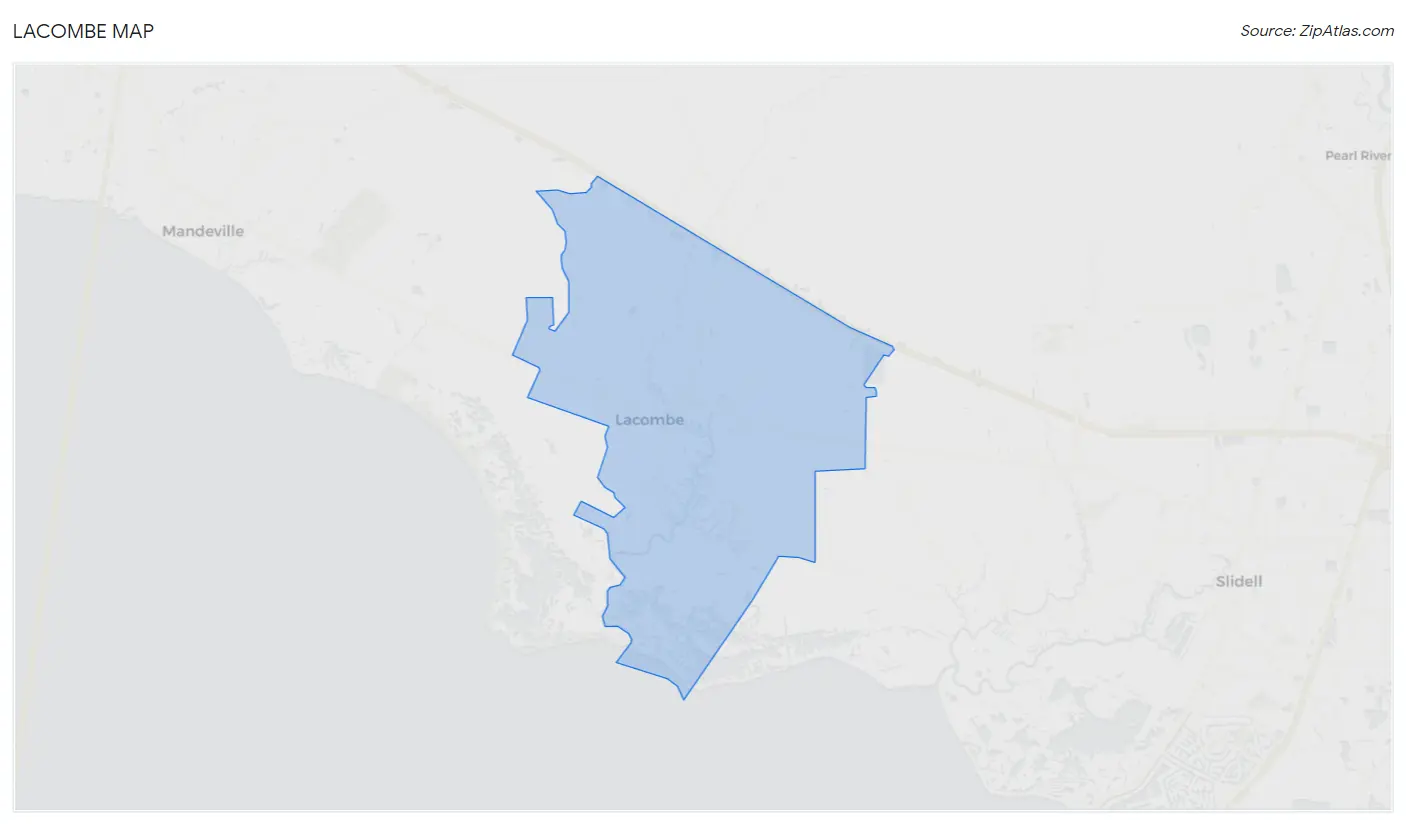
Lacombe Overview
$35,664
PER CAPITA INCOME
$79,877
AVG FAMILY INCOME
$61,850
AVG HOUSEHOLD INCOME
8.0%
WAGE / INCOME GAP [ % ]
92.0¢/ $1
WAGE / INCOME GAP [ $ ]
0.49
INEQUALITY / GINI INDEX
7,035
TOTAL POPULATION
3,872
MALE POPULATION
3,163
FEMALE POPULATION
122.42
MALES / 100 FEMALES
81.69
FEMALES / 100 MALES
52.6
MEDIAN AGE
3.0
AVG FAMILY SIZE
2.5
AVG HOUSEHOLD SIZE
3,420
LABOR FORCE [ PEOPLE ]
57.1%
PERCENT IN LABOR FORCE
12.8%
UNEMPLOYMENT RATE
Lacombe Zip Codes
Lacombe Area Codes
Income in Lacombe
Income Overview in Lacombe
Per Capita Income in Lacombe is $35,664, while median incomes of families and households are $79,877 and $61,850 respectively.
| Characteristic | Number | Measure |
| Per Capita Income | 7,035 | $35,664 |
| Median Family Income | 1,864 | $79,877 |
| Mean Family Income | 1,864 | $110,499 |
| Median Household Income | 2,811 | $61,850 |
| Mean Household Income | 2,811 | $87,644 |
| Income Deficit | 1,864 | $0 |
| Wage / Income Gap (%) | 7,035 | 7.96% |
| Wage / Income Gap ($) | 7,035 | 92.04¢ per $1 |
| Gini / Inequality Index | 7,035 | 0.49 |
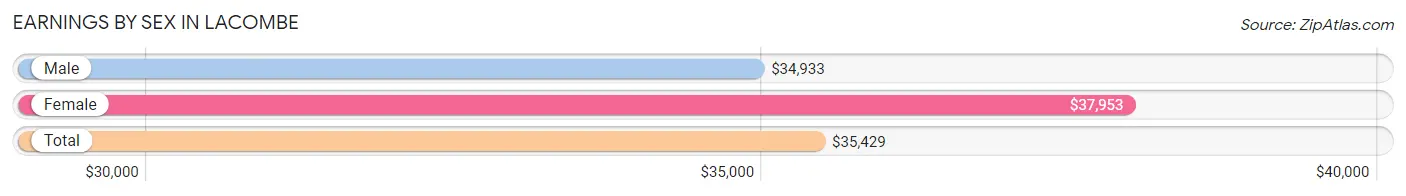
Earnings by Sex in Lacombe
Average Earnings in Lacombe are $35,429, $34,933 for men and $37,953 for women, a difference of 8.0%.
| Sex | Number | Average Earnings |
| Male | 1,937 (59.8%) | $34,933 |
| Female | 1,301 (40.2%) | $37,953 |
| Total | 3,238 (100.0%) | $35,429 |
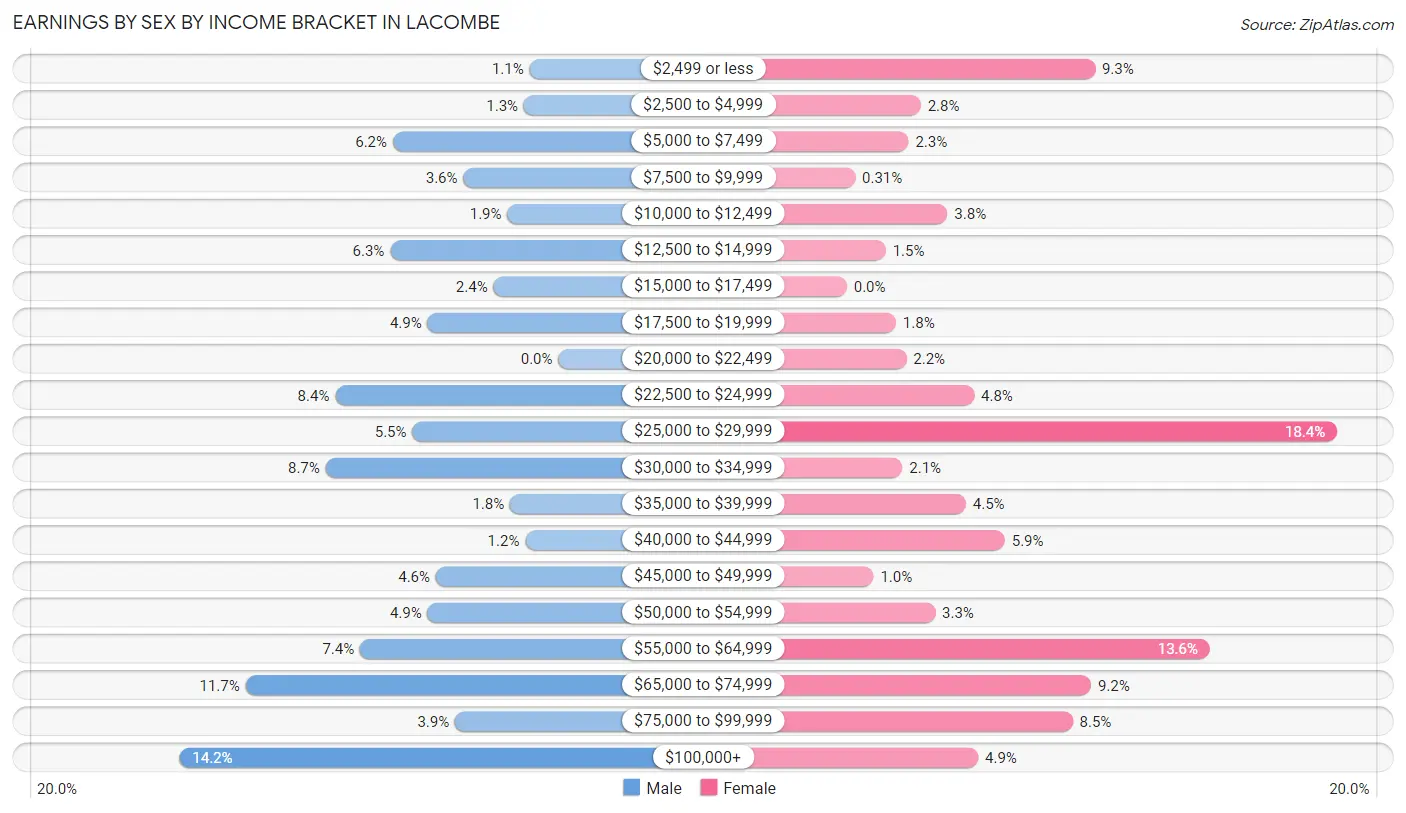
Earnings by Sex by Income Bracket in Lacombe
The most common earnings brackets in Lacombe are $100,000+ for men (275 | 14.2%) and $25,000 to $29,999 for women (239 | 18.4%).
| Income | Male | Female |
| $2,499 or less | 21 (1.1%) | 121 (9.3%) |
| $2,500 to $4,999 | 25 (1.3%) | 36 (2.8%) |
| $5,000 to $7,499 | 120 (6.2%) | 30 (2.3%) |
| $7,500 to $9,999 | 69 (3.6%) | 4 (0.3%) |
| $10,000 to $12,499 | 37 (1.9%) | 49 (3.8%) |
| $12,500 to $14,999 | 122 (6.3%) | 19 (1.5%) |
| $15,000 to $17,499 | 47 (2.4%) | 0 (0.0%) |
| $17,500 to $19,999 | 95 (4.9%) | 24 (1.8%) |
| $20,000 to $22,499 | 0 (0.0%) | 29 (2.2%) |
| $22,500 to $24,999 | 162 (8.4%) | 62 (4.8%) |
| $25,000 to $29,999 | 106 (5.5%) | 239 (18.4%) |
| $30,000 to $34,999 | 169 (8.7%) | 27 (2.1%) |
| $35,000 to $39,999 | 35 (1.8%) | 58 (4.5%) |
| $40,000 to $44,999 | 24 (1.2%) | 77 (5.9%) |
| $45,000 to $49,999 | 89 (4.6%) | 13 (1.0%) |
| $50,000 to $54,999 | 95 (4.9%) | 43 (3.3%) |
| $55,000 to $64,999 | 144 (7.4%) | 177 (13.6%) |
| $65,000 to $74,999 | 227 (11.7%) | 119 (9.1%) |
| $75,000 to $99,999 | 75 (3.9%) | 110 (8.5%) |
| $100,000+ | 275 (14.2%) | 64 (4.9%) |
| Total | 1,937 (100.0%) | 1,301 (100.0%) |
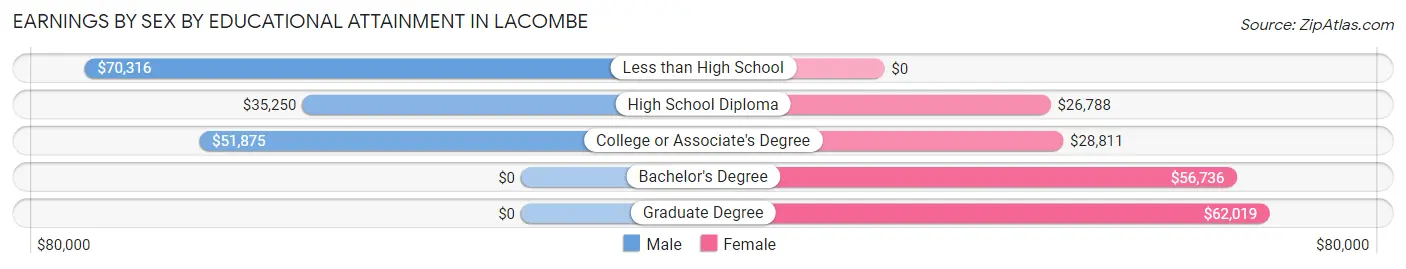
Earnings by Sex by Educational Attainment in Lacombe
Average earnings in Lacombe are $49,770 for men and $39,526 for women, a difference of 20.6%. Men with an educational attainment of less than high school enjoy the highest average annual earnings of $70,316, while those with high school diploma education earn the least with $35,250. Women with an educational attainment of graduate degree earn the most with the average annual earnings of $62,019, while those with high school diploma education have the smallest earnings of $26,788.
| Educational Attainment | Male Income | Female Income |
| Less than High School | $70,316 | $0 |
| High School Diploma | $35,250 | $26,788 |
| College or Associate's Degree | $51,875 | $28,811 |
| Bachelor's Degree | - | - |
| Graduate Degree | - | - |
| Total | $49,770 | $39,526 |
Family Income in Lacombe
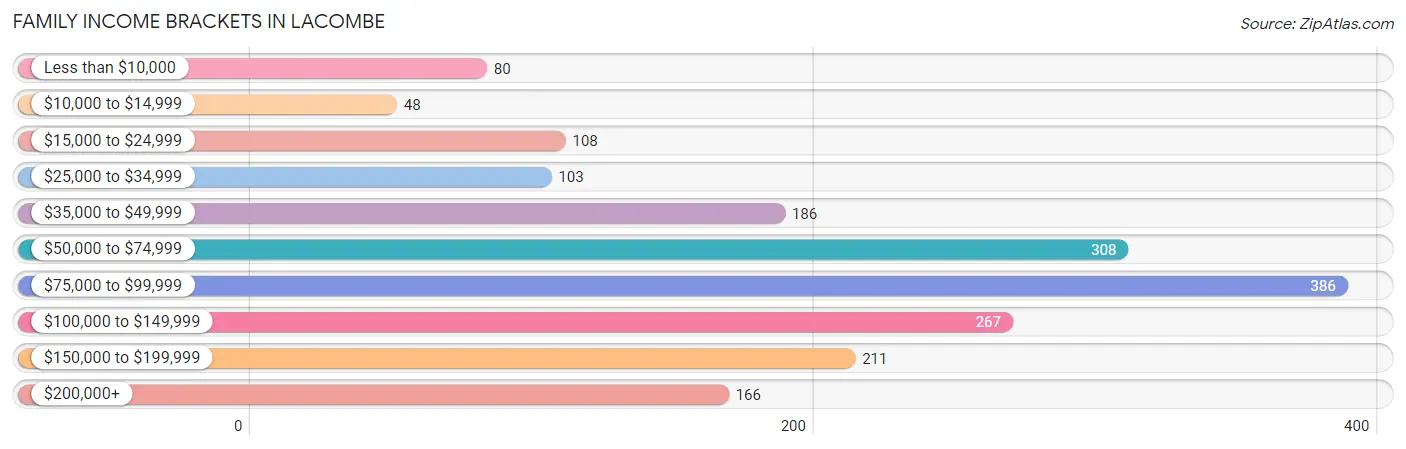
Family Income Brackets in Lacombe
According to the Lacombe family income data, there are 386 families falling into the $75,000 to $99,999 income range, which is the most common income bracket and makes up 20.7% of all families. Conversely, the $10,000 to $14,999 income bracket is the least frequent group with only 48 families (2.6%) belonging to this category.
| Income Bracket | # Families | % Families |
| Less than $10,000 | 80 | 4.3% |
| $10,000 to $14,999 | 48 | 2.6% |
| $15,000 to $24,999 | 108 | 5.8% |
| $25,000 to $34,999 | 103 | 5.5% |
| $35,000 to $49,999 | 186 | 10.0% |
| $50,000 to $74,999 | 308 | 16.5% |
| $75,000 to $99,999 | 386 | 20.7% |
| $100,000 to $149,999 | 267 | 14.3% |
| $150,000 to $199,999 | 211 | 11.3% |
| $200,000+ | 166 | 8.9% |
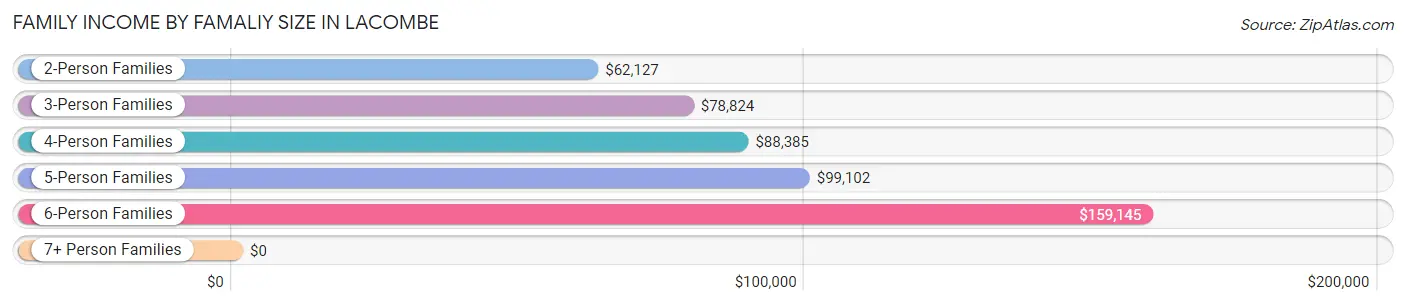
Family Income by Famaliy Size in Lacombe
6-person families (41 | 2.2%) account for the highest median family income in Lacombe with $159,145 per family, while 2-person families (980 | 52.6%) have the highest median income of $31,064 per family member.
| Income Bracket | # Families | Median Income |
| 2-Person Families | 980 (52.6%) | $62,127 |
| 3-Person Families | 462 (24.8%) | $78,824 |
| 4-Person Families | 195 (10.5%) | $88,385 |
| 5-Person Families | 166 (8.9%) | $99,102 |
| 6-Person Families | 41 (2.2%) | $159,145 |
| 7+ Person Families | 20 (1.1%) | $0 |
| Total | 1,864 (100.0%) | $79,877 |
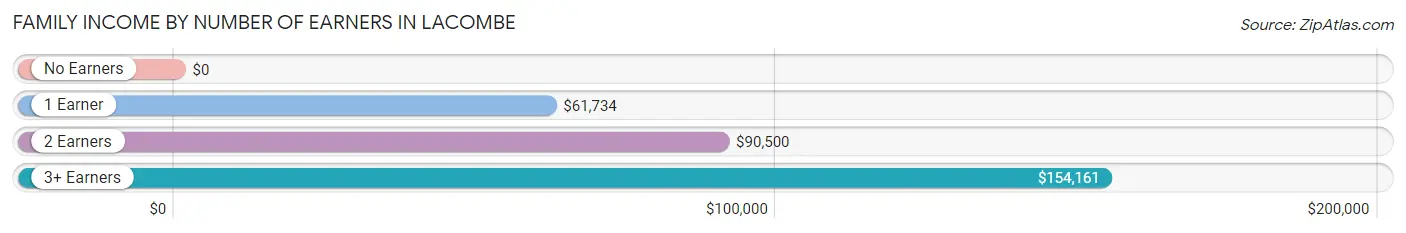
Family Income by Number of Earners in Lacombe
| Number of Earners | # Families | Median Income |
| No Earners | 502 (26.9%) | $0 |
| 1 Earner | 565 (30.3%) | $61,734 |
| 2 Earners | 574 (30.8%) | $90,500 |
| 3+ Earners | 223 (12.0%) | $154,161 |
| Total | 1,864 (100.0%) | $79,877 |
Household Income in Lacombe
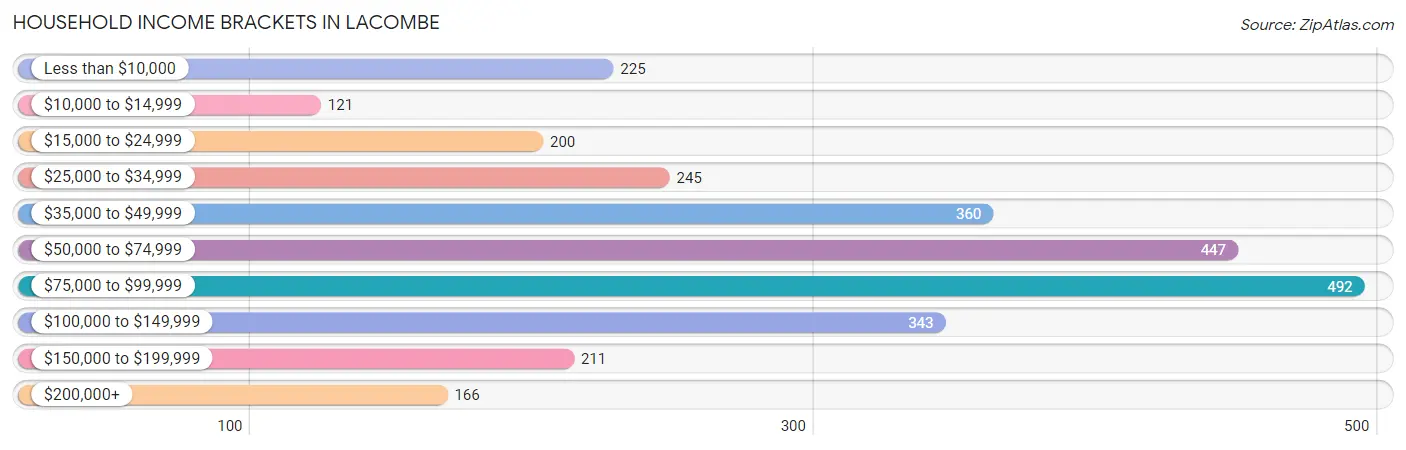
Household Income Brackets in Lacombe
With 492 households falling in the category, the $75,000 to $99,999 income range is the most frequent in Lacombe, accounting for 17.5% of all households. In contrast, only 121 households (4.3%) fall into the $10,000 to $14,999 income bracket, making it the least populous group.
| Income Bracket | # Households | % Households |
| Less than $10,000 | 225 | 8.0% |
| $10,000 to $14,999 | 121 | 4.3% |
| $15,000 to $24,999 | 200 | 7.1% |
| $25,000 to $34,999 | 245 | 8.7% |
| $35,000 to $49,999 | 360 | 12.8% |
| $50,000 to $74,999 | 447 | 15.9% |
| $75,000 to $99,999 | 492 | 17.5% |
| $100,000 to $149,999 | 343 | 12.2% |
| $150,000 to $199,999 | 211 | 7.5% |
| $200,000+ | 166 | 5.9% |
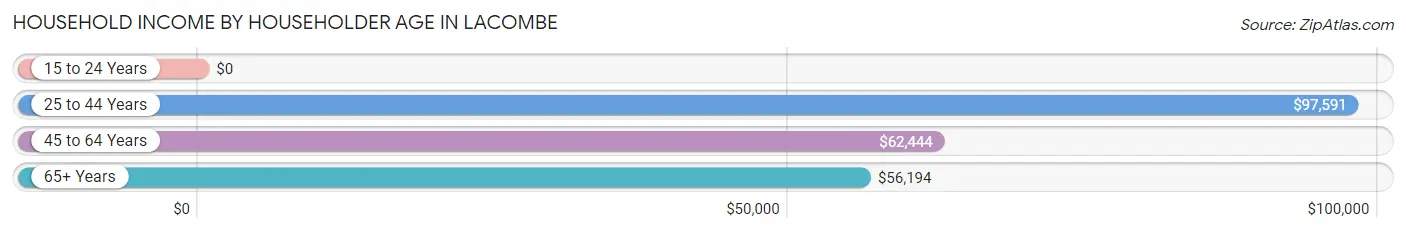
Household Income by Householder Age in Lacombe
The median household income in Lacombe is $61,850, with the highest median household income of $97,591 found in the 25 to 44 years age bracket for the primary householder. A total of 506 households (18.0%) fall into this category.
| Income Bracket | # Households | Median Income |
| 15 to 24 Years | 0 (0.0%) | $0 |
| 25 to 44 Years | 506 (18.0%) | $97,591 |
| 45 to 64 Years | 1,140 (40.6%) | $62,444 |
| 65+ Years | 1,165 (41.4%) | $56,194 |
| Total | 2,811 (100.0%) | $61,850 |
Poverty in Lacombe
Income Below Poverty by Sex and Age in Lacombe
With 14.7% poverty level for males and 12.5% for females among the residents of Lacombe, 16 and 17 year old males and under 5 year old females are the most vulnerable to poverty, with 9 males (32.1%) and 86 females (80.4%) in their respective age groups living below the poverty level.
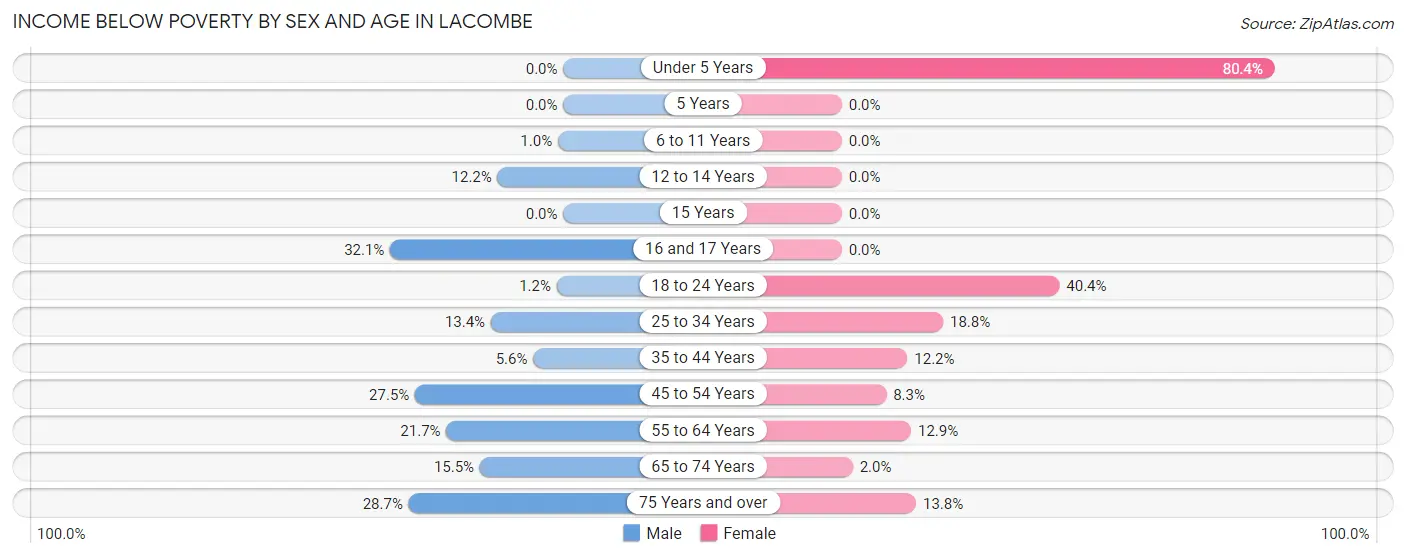
| Age Bracket | Male | Female |
| Under 5 Years | 0 (0.0%) | 86 (80.4%) |
| 5 Years | 0 (0.0%) | 0 (0.0%) |
| 6 to 11 Years | 2 (1.0%) | 0 (0.0%) |
| 12 to 14 Years | 10 (12.2%) | 0 (0.0%) |
| 15 Years | 0 (0.0%) | 0 (0.0%) |
| 16 and 17 Years | 9 (32.1%) | 0 (0.0%) |
| 18 to 24 Years | 4 (1.2%) | 42 (40.4%) |
| 25 to 34 Years | 57 (13.4%) | 53 (18.8%) |
| 35 to 44 Years | 24 (5.6%) | 41 (12.2%) |
| 45 to 54 Years | 118 (27.5%) | 39 (8.3%) |
| 55 to 64 Years | 150 (21.7%) | 80 (12.9%) |
| 65 to 74 Years | 91 (15.5%) | 10 (2.0%) |
| 75 Years and over | 97 (28.7%) | 40 (13.8%) |
| Total | 562 (14.7%) | 391 (12.5%) |
Income Above Poverty by Sex and Age in Lacombe
According to the poverty statistics in Lacombe, males aged under 5 years and females aged 6 to 11 years are the age groups that are most secure financially, with 100.0% of males and 100.0% of females in these age groups living above the poverty line.
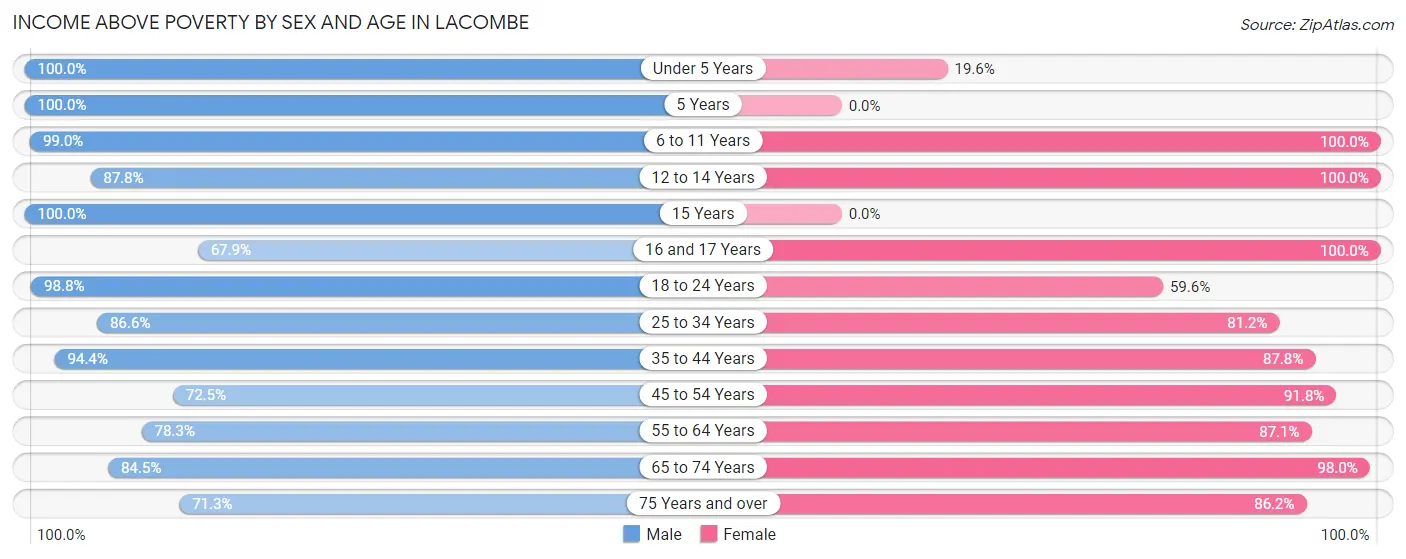
| Age Bracket | Male | Female |
| Under 5 Years | 122 (100.0%) | 21 (19.6%) |
| 5 Years | 61 (100.0%) | 0 (0.0%) |
| 6 to 11 Years | 198 (99.0%) | 160 (100.0%) |
| 12 to 14 Years | 72 (87.8%) | 213 (100.0%) |
| 15 Years | 100 (100.0%) | 0 (0.0%) |
| 16 and 17 Years | 19 (67.9%) | 51 (100.0%) |
| 18 to 24 Years | 325 (98.8%) | 62 (59.6%) |
| 25 to 34 Years | 367 (86.6%) | 229 (81.2%) |
| 35 to 44 Years | 406 (94.4%) | 296 (87.8%) |
| 45 to 54 Years | 311 (72.5%) | 434 (91.7%) |
| 55 to 64 Years | 541 (78.3%) | 542 (87.1%) |
| 65 to 74 Years | 497 (84.5%) | 483 (98.0%) |
| 75 Years and over | 241 (71.3%) | 250 (86.2%) |
| Total | 3,260 (85.3%) | 2,741 (87.5%) |
Income Below Poverty Among Married-Couple Families in Lacombe
The poverty statistics for married-couple families in Lacombe show that 4.1% or 54 of the total 1,334 families live below the poverty line. Families with no children have the highest poverty rate of 5.0%, comprising of 45 families. On the other hand, families with 3 or 4 children have the lowest poverty rate of 0.0%, which includes 0 families.
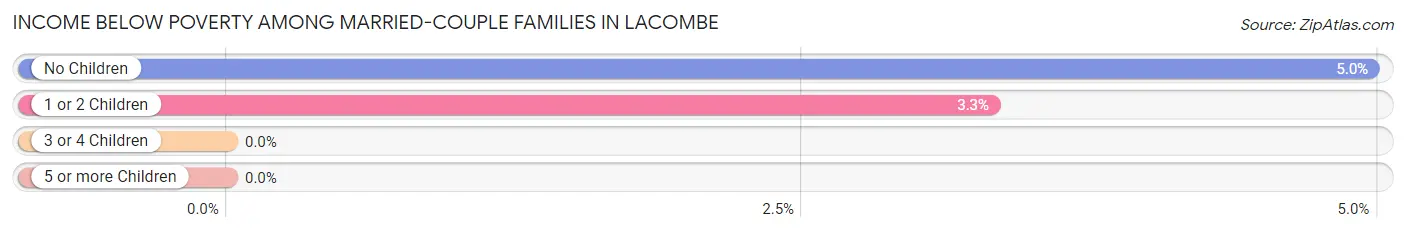
| Children | Above Poverty | Below Poverty |
| No Children | 861 (95.0%) | 45 (5.0%) |
| 1 or 2 Children | 262 (96.7%) | 9 (3.3%) |
| 3 or 4 Children | 157 (100.0%) | 0 (0.0%) |
| 5 or more Children | 0 (0.0%) | 0 (0.0%) |
| Total | 1,280 (96.0%) | 54 (4.1%) |
Income Below Poverty Among Single-Parent Households in Lacombe
According to the poverty data in Lacombe, 28.2% or 33 single-father households and 23.2% or 96 single-mother households are living below the poverty line. Among single-father households, those with no children have the highest poverty rate, with 33 households (34.0%) experiencing poverty. Likewise, among single-mother households, those with 1 or 2 children have the highest poverty rate, with 55 households (47.0%) falling below the poverty line.
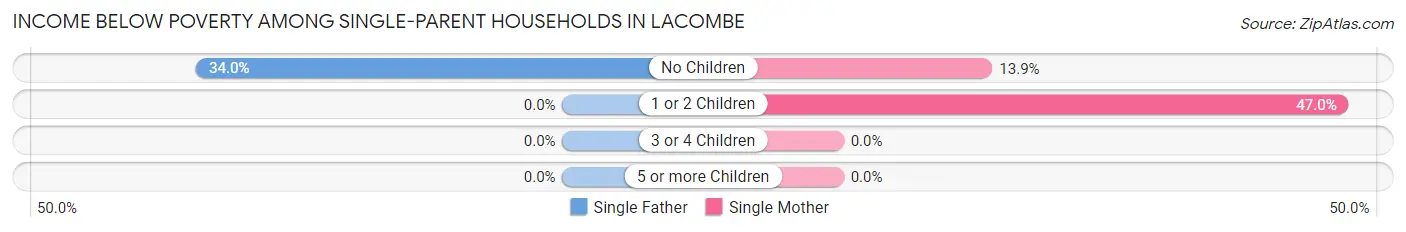
| Children | Single Father | Single Mother |
| No Children | 33 (34.0%) | 41 (13.9%) |
| 1 or 2 Children | 0 (0.0%) | 55 (47.0%) |
| 3 or 4 Children | 0 (0.0%) | 0 (0.0%) |
| 5 or more Children | 0 (0.0%) | 0 (0.0%) |
| Total | 33 (28.2%) | 96 (23.2%) |
Income Below Poverty Among Married-Couple vs Single-Parent Households in Lacombe
The poverty data for Lacombe shows that 54 of the married-couple family households (4.1%) and 129 of the single-parent households (24.3%) are living below the poverty level. Within the married-couple family households, those with no children have the highest poverty rate, with 45 households (5.0%) falling below the poverty line. Among the single-parent households, those with 1 or 2 children have the highest poverty rate, with 55 household (40.2%) living below poverty.
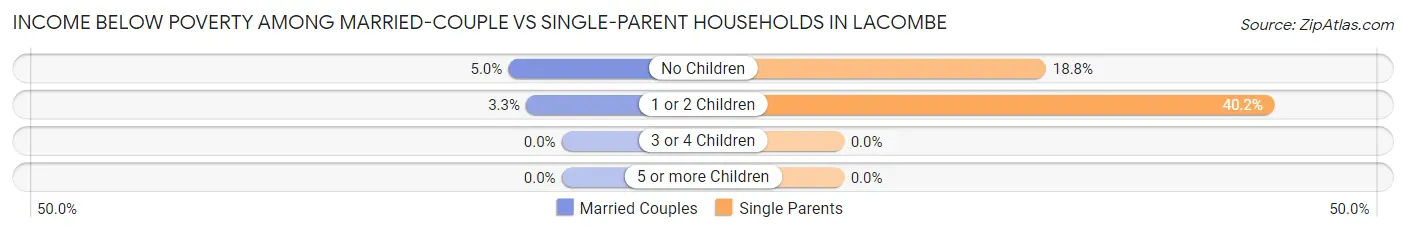
| Children | Married-Couple Families | Single-Parent Households |
| No Children | 45 (5.0%) | 74 (18.8%) |
| 1 or 2 Children | 9 (3.3%) | 55 (40.2%) |
| 3 or 4 Children | 0 (0.0%) | 0 (0.0%) |
| 5 or more Children | 0 (0.0%) | 0 (0.0%) |
| Total | 54 (4.1%) | 129 (24.3%) |
Race in Lacombe
The most populous races in Lacombe are White / Caucasian (4,379 | 62.3%), Black / African American (2,178 | 31.0%), and Two or more Races (307 | 4.4%).
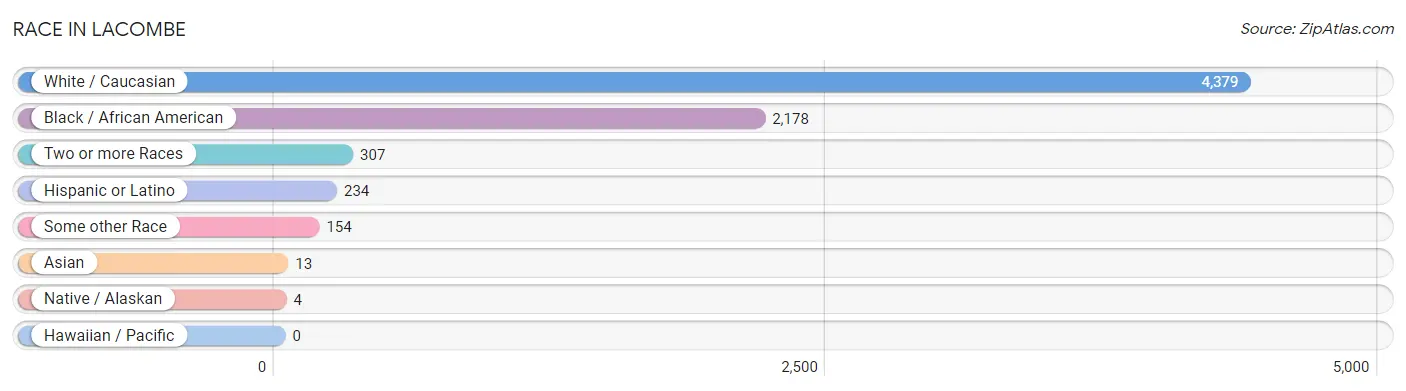
| Race | # Population | % Population |
| Asian | 13 | 0.2% |
| Black / African American | 2,178 | 31.0% |
| Hawaiian / Pacific | 0 | 0.0% |
| Hispanic or Latino | 234 | 3.3% |
| Native / Alaskan | 4 | 0.1% |
| White / Caucasian | 4,379 | 62.3% |
| Two or more Races | 307 | 4.4% |
| Some other Race | 154 | 2.2% |
| Total | 7,035 | 100.0% |
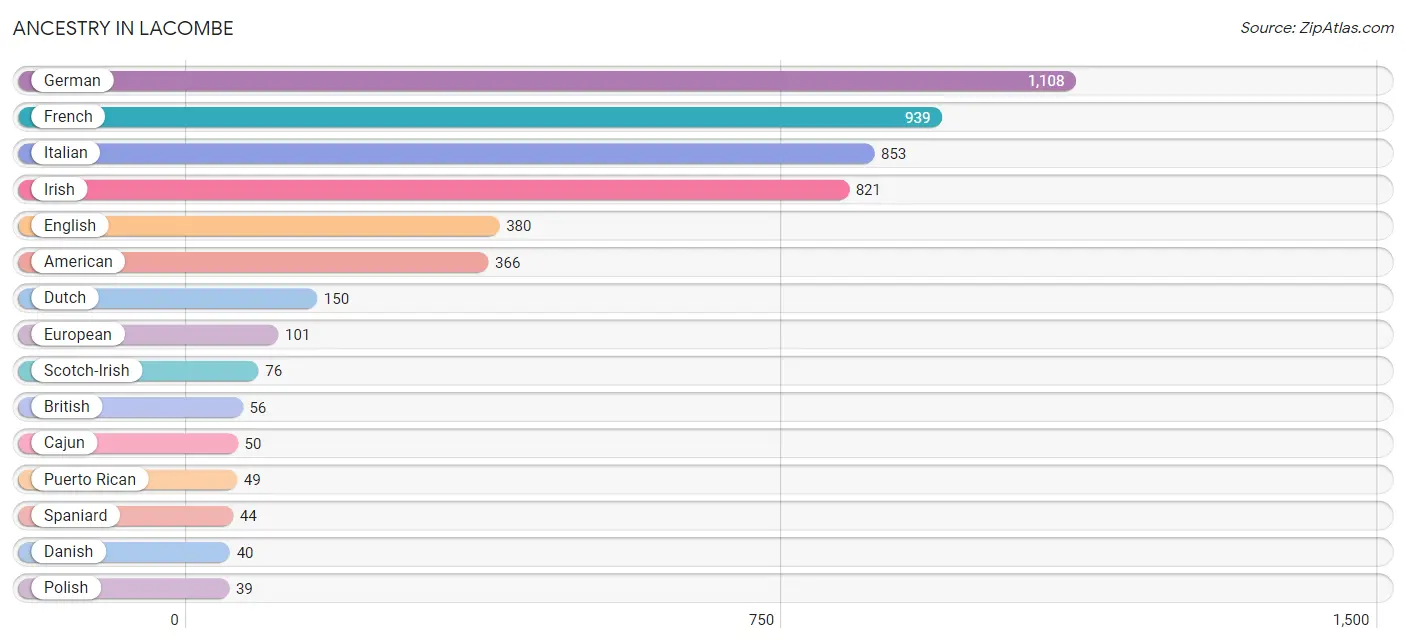
Ancestry in Lacombe
The most populous ancestries reported in Lacombe are German (1,108 | 15.8%), French (939 | 13.4%), Italian (853 | 12.1%), Irish (821 | 11.7%), and English (380 | 5.4%), together accounting for 58.3% of all Lacombe residents.
| Ancestry | # Population | % Population |
| American | 366 | 5.2% |
| Arab | 31 | 0.4% |
| Austrian | 12 | 0.2% |
| Belgian | 37 | 0.5% |
| Blackfeet | 35 | 0.5% |
| British | 56 | 0.8% |
| Cajun | 50 | 0.7% |
| Central American | 13 | 0.2% |
| Cherokee | 3 | 0.0% |
| Choctaw | 20 | 0.3% |
| Cuban | 10 | 0.1% |
| Danish | 40 | 0.6% |
| Dutch | 150 | 2.1% |
| Egyptian | 7 | 0.1% |
| English | 380 | 5.4% |
| European | 101 | 1.4% |
| French | 939 | 13.4% |
| French Canadian | 31 | 0.4% |
| German | 1,108 | 15.8% |
| Honduran | 13 | 0.2% |
| Indian (Asian) | 13 | 0.2% |
| Irish | 821 | 11.7% |
| Italian | 853 | 12.1% |
| Lebanese | 24 | 0.3% |
| Mexican | 18 | 0.3% |
| Norwegian | 33 | 0.5% |
| Polish | 39 | 0.5% |
| Puerto Rican | 49 | 0.7% |
| Scotch-Irish | 76 | 1.1% |
| Scottish | 18 | 0.3% |
| Sioux | 35 | 0.5% |
| Spaniard | 44 | 0.6% |
| Spanish | 36 | 0.5% | View All 33 Rows |
Immigrants in Lacombe
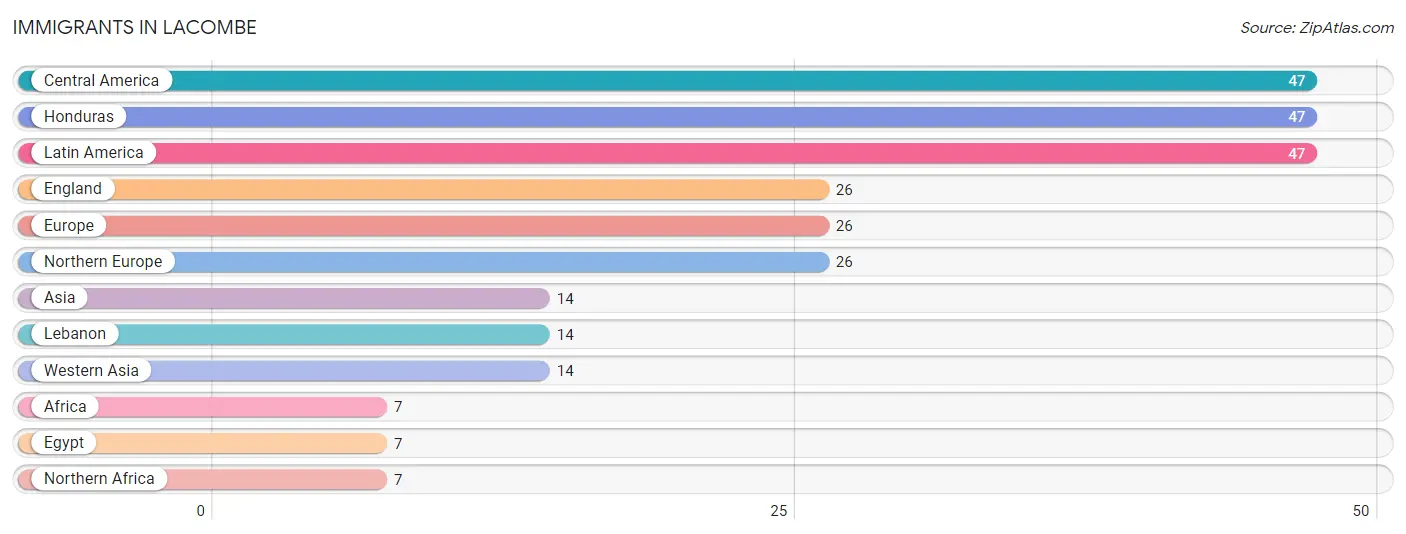
The most numerous immigrant groups reported in Lacombe came from Central America (47 | 0.7%), Honduras (47 | 0.7%), Latin America (47 | 0.7%), England (26 | 0.4%), and Europe (26 | 0.4%), together accounting for 2.8% of all Lacombe residents.
| Immigration Origin | # Population | % Population |
| Africa | 7 | 0.1% |
| Asia | 14 | 0.2% |
| Central America | 47 | 0.7% |
| Egypt | 7 | 0.1% |
| England | 26 | 0.4% |
| Europe | 26 | 0.4% |
| Honduras | 47 | 0.7% |
| Latin America | 47 | 0.7% |
| Lebanon | 14 | 0.2% |
| Northern Africa | 7 | 0.1% |
| Northern Europe | 26 | 0.4% |
| Western Asia | 14 | 0.2% | View All 12 Rows |
Sex and Age in Lacombe
Sex and Age in Lacombe
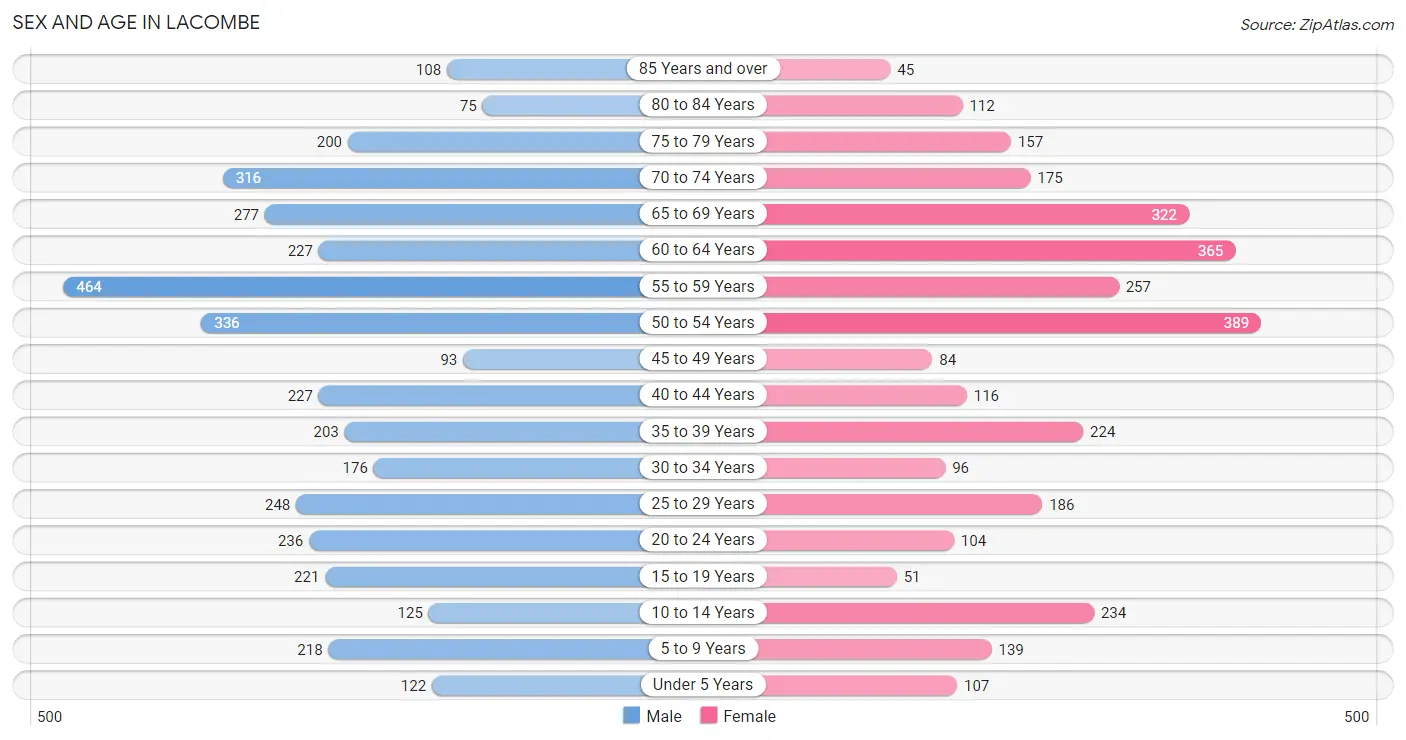
The most populous age groups in Lacombe are 55 to 59 Years (464 | 12.0%) for men and 50 to 54 Years (389 | 12.3%) for women.
| Age Bracket | Male | Female |
| Under 5 Years | 122 (3.2%) | 107 (3.4%) |
| 5 to 9 Years | 218 (5.6%) | 139 (4.4%) |
| 10 to 14 Years | 125 (3.2%) | 234 (7.4%) |
| 15 to 19 Years | 221 (5.7%) | 51 (1.6%) |
| 20 to 24 Years | 236 (6.1%) | 104 (3.3%) |
| 25 to 29 Years | 248 (6.4%) | 186 (5.9%) |
| 30 to 34 Years | 176 (4.5%) | 96 (3.0%) |
| 35 to 39 Years | 203 (5.2%) | 224 (7.1%) |
| 40 to 44 Years | 227 (5.9%) | 116 (3.7%) |
| 45 to 49 Years | 93 (2.4%) | 84 (2.7%) |
| 50 to 54 Years | 336 (8.7%) | 389 (12.3%) |
| 55 to 59 Years | 464 (12.0%) | 257 (8.1%) |
| 60 to 64 Years | 227 (5.9%) | 365 (11.5%) |
| 65 to 69 Years | 277 (7.1%) | 322 (10.2%) |
| 70 to 74 Years | 316 (8.2%) | 175 (5.5%) |
| 75 to 79 Years | 200 (5.2%) | 157 (5.0%) |
| 80 to 84 Years | 75 (1.9%) | 112 (3.5%) |
| 85 Years and over | 108 (2.8%) | 45 (1.4%) |
| Total | 3,872 (100.0%) | 3,163 (100.0%) |
Families and Households in Lacombe
Median Family Size in Lacombe
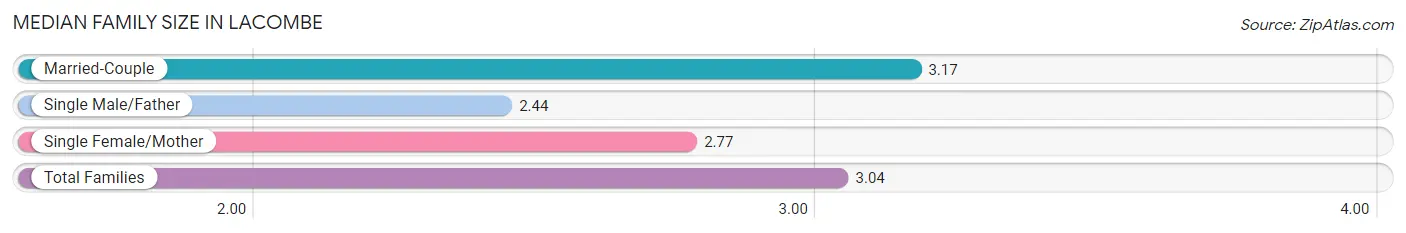
The median family size in Lacombe is 3.04 persons per family, with married-couple families (1,334 | 71.6%) accounting for the largest median family size of 3.17 persons per family. On the other hand, single male/father families (117 | 6.3%) represent the smallest median family size with 2.44 persons per family.
| Family Type | # Families | Family Size |
| Married-Couple | 1,334 (71.6%) | 3.17 |
| Single Male/Father | 117 (6.3%) | 2.44 |
| Single Female/Mother | 413 (22.2%) | 2.77 |
| Total Families | 1,864 (100.0%) | 3.04 |
Median Household Size in Lacombe
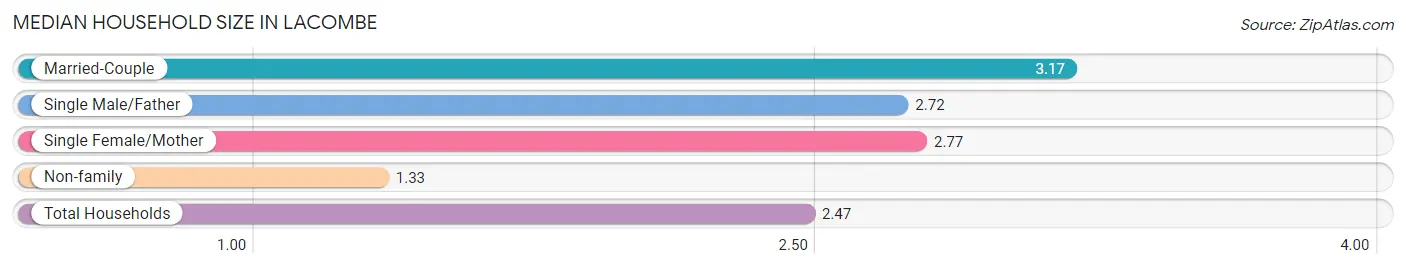
The median household size in Lacombe is 2.47 persons per household, with married-couple households (1,334 | 47.5%) accounting for the largest median household size of 3.17 persons per household. non-family households (947 | 33.7%) represent the smallest median household size with 1.33 persons per household.
| Household Type | # Households | Household Size |
| Married-Couple | 1,334 (47.5%) | 3.17 |
| Single Male/Father | 117 (4.2%) | 2.72 |
| Single Female/Mother | 413 (14.7%) | 2.77 |
| Non-family | 947 (33.7%) | 1.33 |
| Total Households | 2,811 (100.0%) | 2.47 |
Household Size by Marriage Status in Lacombe
Out of a total of 2,811 households in Lacombe, 1,864 (66.3%) are family households, while 947 (33.7%) are nonfamily households. The most numerous type of family households are 2-person households, comprising 956, and the most common type of nonfamily households are 1-person households, comprising 693.
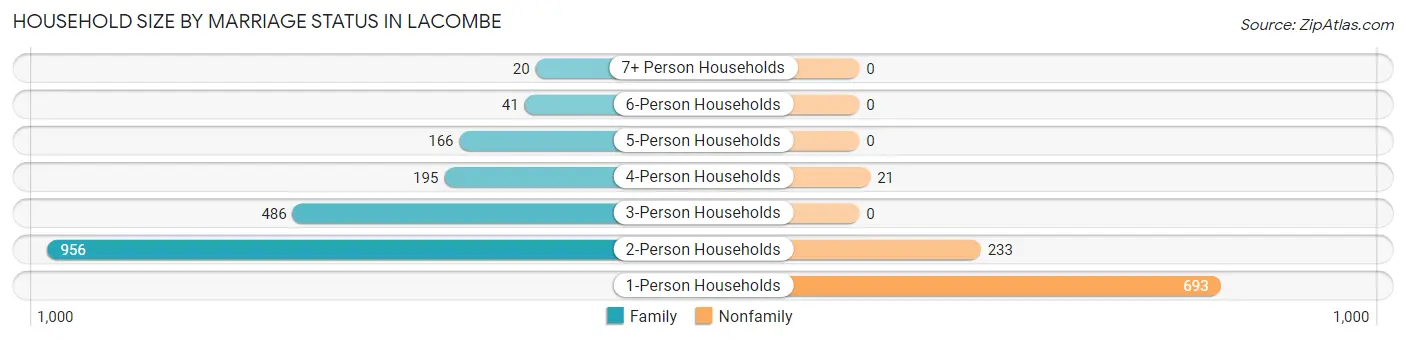
| Household Size | Family Households | Nonfamily Households |
| 1-Person Households | - | 693 (24.6%) |
| 2-Person Households | 956 (34.0%) | 233 (8.3%) |
| 3-Person Households | 486 (17.3%) | 0 (0.0%) |
| 4-Person Households | 195 (6.9%) | 21 (0.7%) |
| 5-Person Households | 166 (5.9%) | 0 (0.0%) |
| 6-Person Households | 41 (1.5%) | 0 (0.0%) |
| 7+ Person Households | 20 (0.7%) | 0 (0.0%) |
| Total | 1,864 (66.3%) | 947 (33.7%) |
Female Fertility in Lacombe
Fertility by Age in Lacombe
Average fertility rate in Lacombe is 46.0 births per 1,000 women. Women in the age bracket of 20 to 34 years have the highest fertility rate with 104.0 births per 1,000 women. Women in the age bracket of 20 to 34 years acount for 100.0% of all women with births.
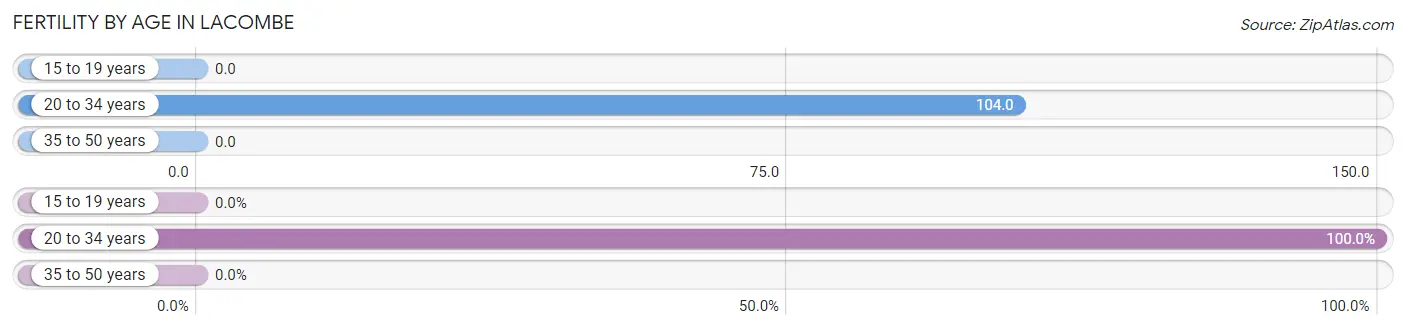
| Age Bracket | Women with Births | Births / 1,000 Women |
| 15 to 19 years | 0 (0.0%) | 0.0 |
| 20 to 34 years | 40 (100.0%) | 104.0 |
| 35 to 50 years | 0 (0.0%) | 0.0 |
| Total | 40 (100.0%) | 46.0 |
Fertility by Age by Marriage Status in Lacombe
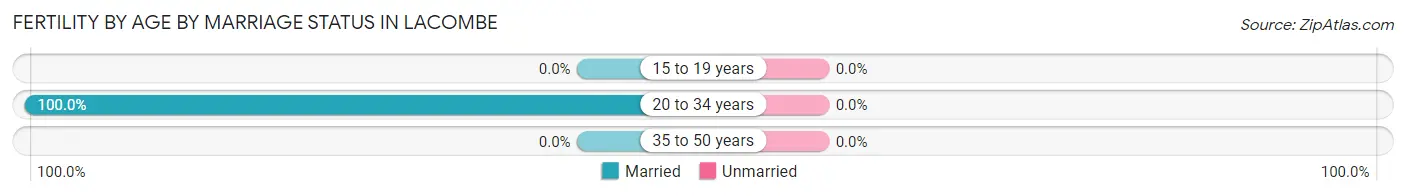
| Age Bracket | Married | Unmarried |
| 15 to 19 years | 0 (0.0%) | 0 (0.0%) |
| 20 to 34 years | 40 (100.0%) | 0 (0.0%) |
| 35 to 50 years | 0 (0.0%) | 0 (0.0%) |
| Total | 40 (100.0%) | 0 (0.0%) |
Fertility by Education in Lacombe
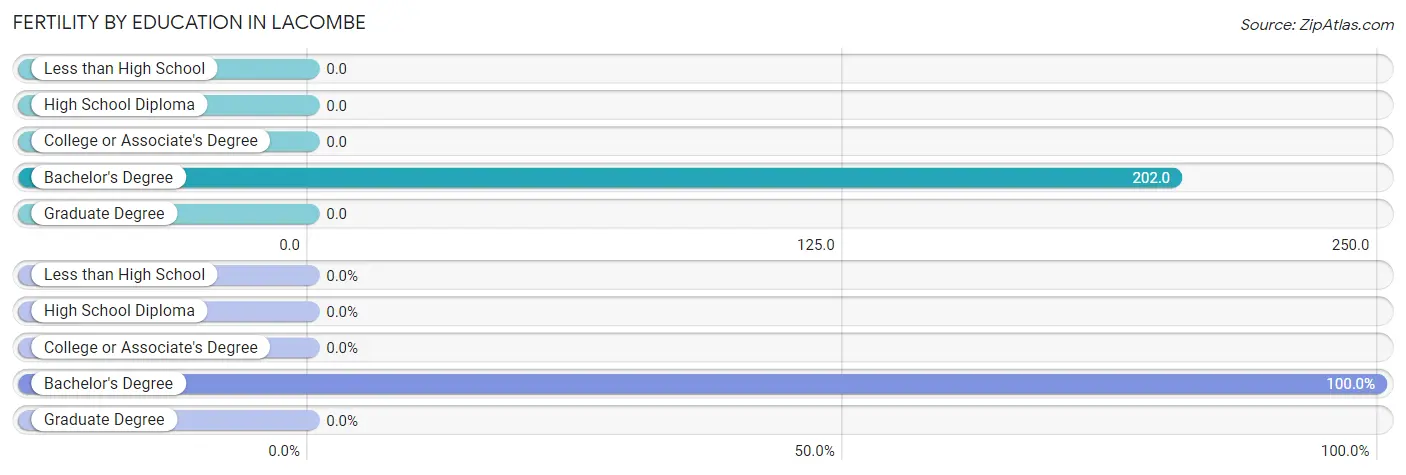
| Educational Attainment | Women with Births | Births / 1,000 Women |
| Less than High School | 0 (0.0%) | 0.0 |
| High School Diploma | 0 (0.0%) | 0.0 |
| College or Associate's Degree | 0 (0.0%) | 0.0 |
| Bachelor's Degree | 40 (100.0%) | 202.0 |
| Graduate Degree | 0 (0.0%) | 0.0 |
| Total | 40 (100.0%) | 46.0 |
Fertility by Education by Marriage Status in Lacombe
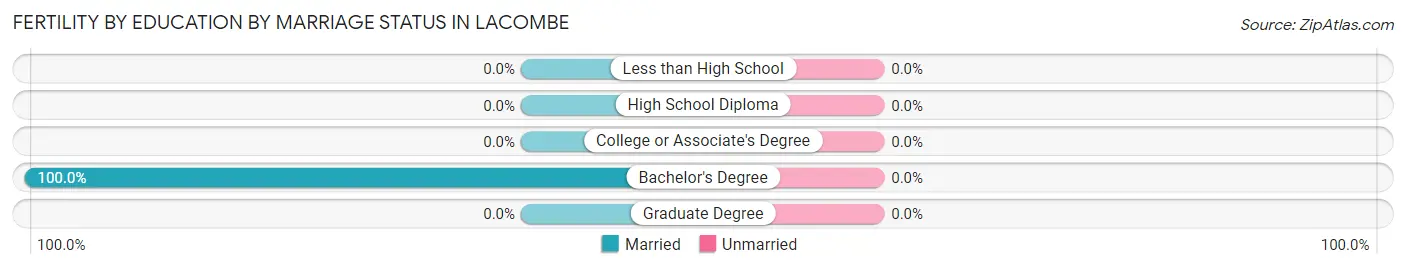
| Educational Attainment | Married | Unmarried |
| Less than High School | 0 (0.0%) | 0 (0.0%) |
| High School Diploma | 0 (0.0%) | 0 (0.0%) |
| College or Associate's Degree | 0 (0.0%) | 0 (0.0%) |
| Bachelor's Degree | 40 (100.0%) | 0 (0.0%) |
| Graduate Degree | 0 (0.0%) | 0 (0.0%) |
| Total | 40 (100.0%) | 0 (0.0%) |
Employment Characteristics in Lacombe
Employment by Class of Employer in Lacombe
Among the 2,849 employed individuals in Lacombe, private company employees (1,730 | 60.7%), local government employees (390 | 13.7%), and state government employees (214 | 7.5%) make up the most common classes of employment.
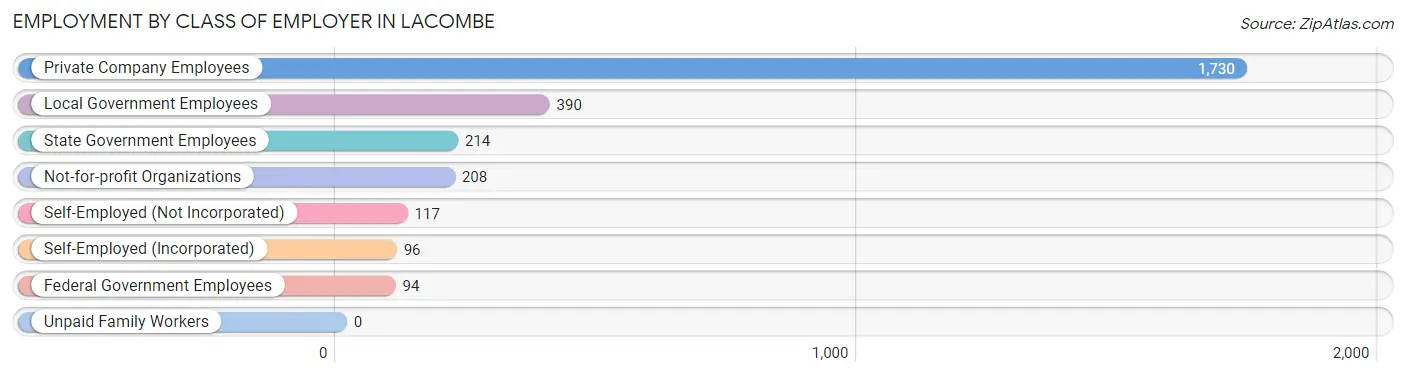
| Employer Class | # Employees | % Employees |
| Private Company Employees | 1,730 | 60.7% |
| Self-Employed (Incorporated) | 96 | 3.4% |
| Self-Employed (Not Incorporated) | 117 | 4.1% |
| Not-for-profit Organizations | 208 | 7.3% |
| Local Government Employees | 390 | 13.7% |
| State Government Employees | 214 | 7.5% |
| Federal Government Employees | 94 | 3.3% |
| Unpaid Family Workers | 0 | 0.0% |
| Total | 2,849 | 100.0% |
Employment Status by Age in Lacombe
According to the labor force statistics for Lacombe, out of the total population over 16 years of age (5,990), 57.1% or 3,420 individuals are in the labor force, with 12.8% or 438 of them unemployed. The age group with the highest labor force participation rate is 20 to 24 years, with 90.9% or 309 individuals in the labor force. Within the labor force, the 25 to 29 years age range has the highest percentage of unemployed individuals, with 42.6% or 153 of them being unemployed.
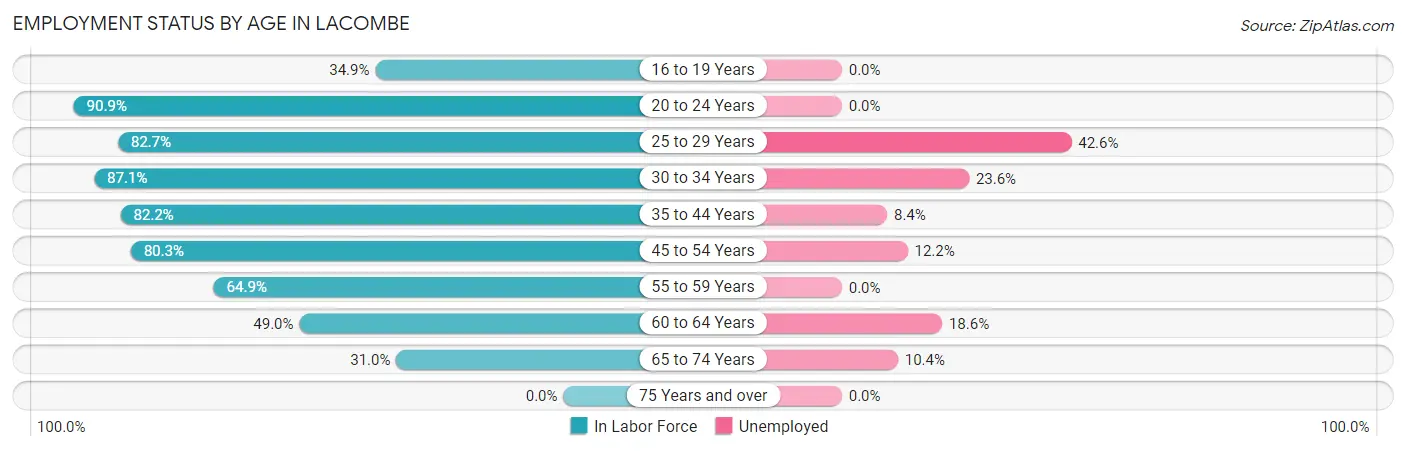
| Age Bracket | In Labor Force | Unemployed |
| 16 to 19 Years | 60 (34.9%) | 0 (0.0%) |
| 20 to 24 Years | 309 (90.9%) | 0 (0.0%) |
| 25 to 29 Years | 359 (82.7%) | 153 (42.6%) |
| 30 to 34 Years | 237 (87.1%) | 56 (23.6%) |
| 35 to 44 Years | 633 (82.2%) | 53 (8.4%) |
| 45 to 54 Years | 724 (80.3%) | 88 (12.2%) |
| 55 to 59 Years | 468 (64.9%) | 0 (0.0%) |
| 60 to 64 Years | 290 (49.0%) | 54 (18.6%) |
| 65 to 74 Years | 338 (31.0%) | 35 (10.4%) |
| 75 Years and over | 0 (0.0%) | 0 (0.0%) |
| Total | 3,420 (57.1%) | 438 (12.8%) |
Employment Status by Educational Attainment in Lacombe
According to labor force statistics for Lacombe, 73.4% of individuals (2,709) out of the total population between 25 and 64 years of age (3,691) are in the labor force, with 14.9% or 404 of them being unemployed. The group with the highest labor force participation rate are those with the educational attainment of bachelor's degree or higher, with 83.7% or 769 individuals in the labor force. Within the labor force, individuals with less than high school education have the highest percentage of unemployment, with 32.3% or 87 of them being unemployed.
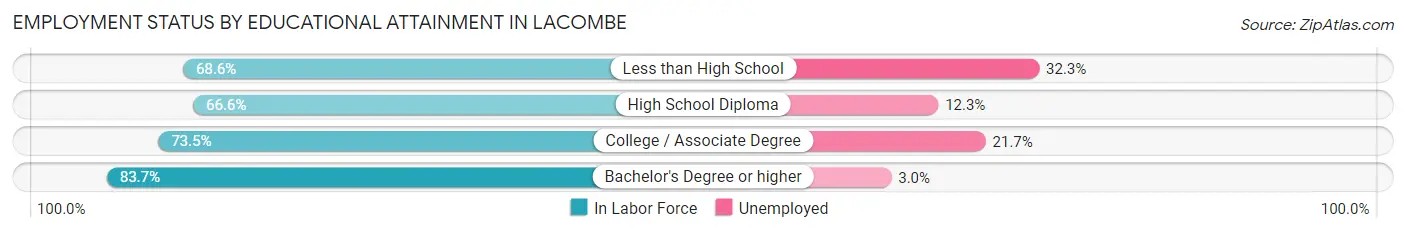
| Educational Attainment | In Labor Force | Unemployed |
| Less than High School | 269 (68.6%) | 127 (32.3%) |
| High School Diploma | 734 (66.6%) | 136 (12.3%) |
| College / Associate Degree | 939 (73.5%) | 277 (21.7%) |
| Bachelor's Degree or higher | 769 (83.7%) | 28 (3.0%) |
| Total | 2,709 (73.4%) | 550 (14.9%) |
Employment Occupations by Sex in Lacombe
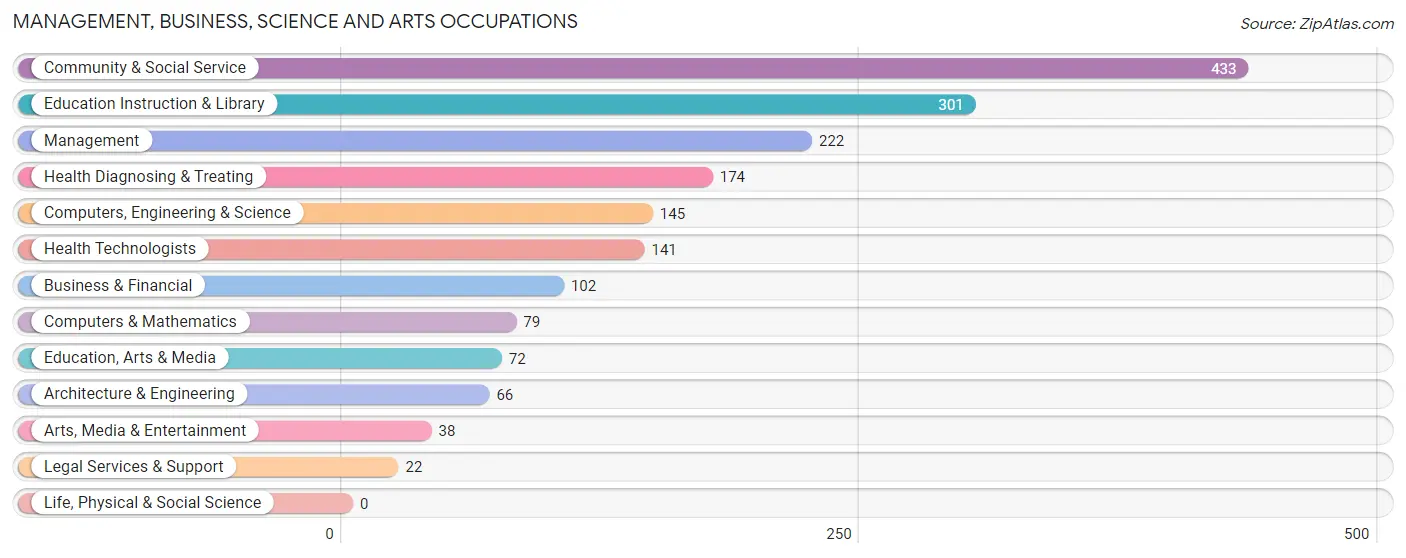
Management, Business, Science and Arts Occupations
The most common Management, Business, Science and Arts occupations in Lacombe are Community & Social Service (433 | 14.5%), Education Instruction & Library (301 | 10.1%), Management (222 | 7.4%), Health Diagnosing & Treating (174 | 5.8%), and Computers, Engineering & Science (145 | 4.9%).
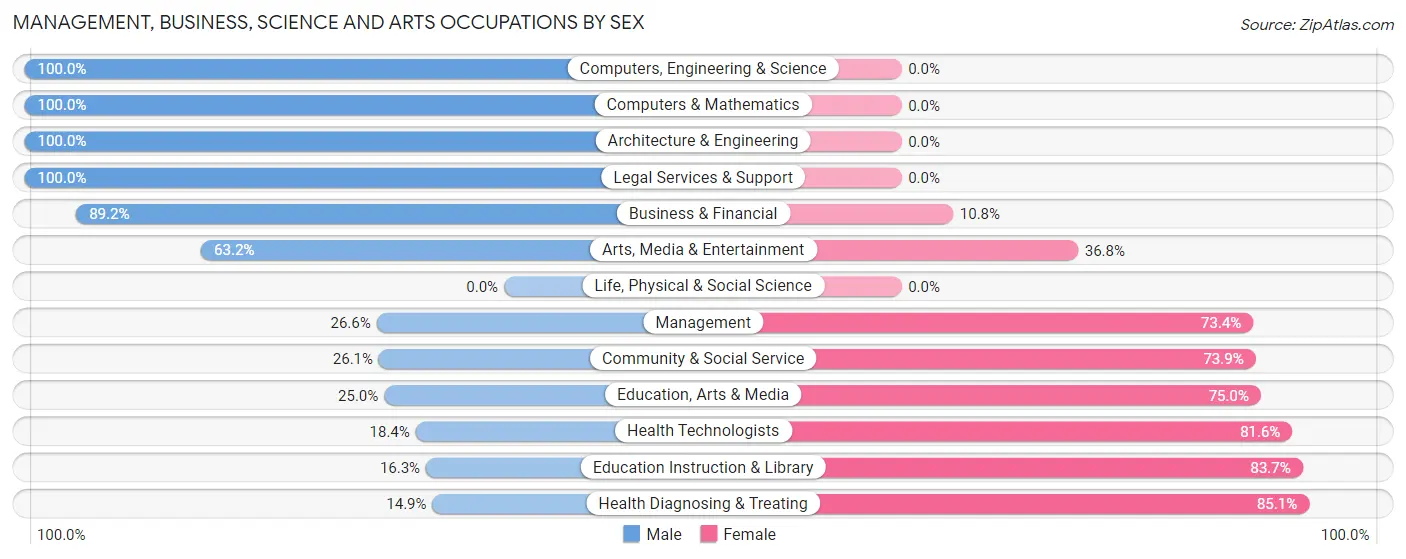
Management, Business, Science and Arts Occupations by Sex
Within the Management, Business, Science and Arts occupations in Lacombe, the most male-oriented occupations are Computers, Engineering & Science (100.0%), Computers & Mathematics (100.0%), and Architecture & Engineering (100.0%), while the most female-oriented occupations are Health Diagnosing & Treating (85.1%), Education Instruction & Library (83.7%), and Health Technologists (81.6%).
| Occupation | Male | Female |
| Management | 59 (26.6%) | 163 (73.4%) |
| Business & Financial | 91 (89.2%) | 11 (10.8%) |
| Computers, Engineering & Science | 145 (100.0%) | 0 (0.0%) |
| Computers & Mathematics | 79 (100.0%) | 0 (0.0%) |
| Architecture & Engineering | 66 (100.0%) | 0 (0.0%) |
| Life, Physical & Social Science | 0 (0.0%) | 0 (0.0%) |
| Community & Social Service | 113 (26.1%) | 320 (73.9%) |
| Education, Arts & Media | 18 (25.0%) | 54 (75.0%) |
| Legal Services & Support | 22 (100.0%) | 0 (0.0%) |
| Education Instruction & Library | 49 (16.3%) | 252 (83.7%) |
| Arts, Media & Entertainment | 24 (63.2%) | 14 (36.8%) |
| Health Diagnosing & Treating | 26 (14.9%) | 148 (85.1%) |
| Health Technologists | 26 (18.4%) | 115 (81.6%) |
| Total (Category) | 434 (40.3%) | 642 (59.7%) |
| Total (Overall) | 1,745 (58.6%) | 1,234 (41.4%) |
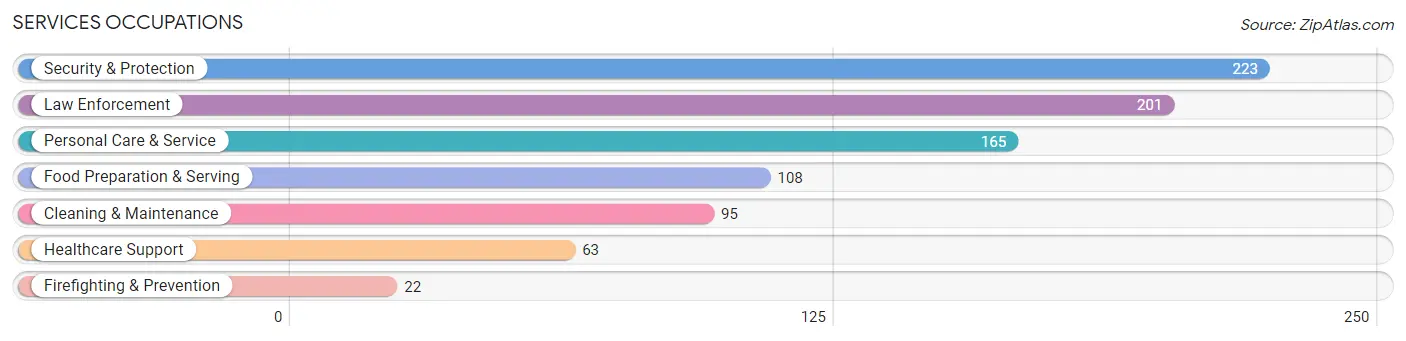
Services Occupations
The most common Services occupations in Lacombe are Security & Protection (223 | 7.5%), Law Enforcement (201 | 6.8%), Personal Care & Service (165 | 5.5%), Food Preparation & Serving (108 | 3.6%), and Cleaning & Maintenance (95 | 3.2%).
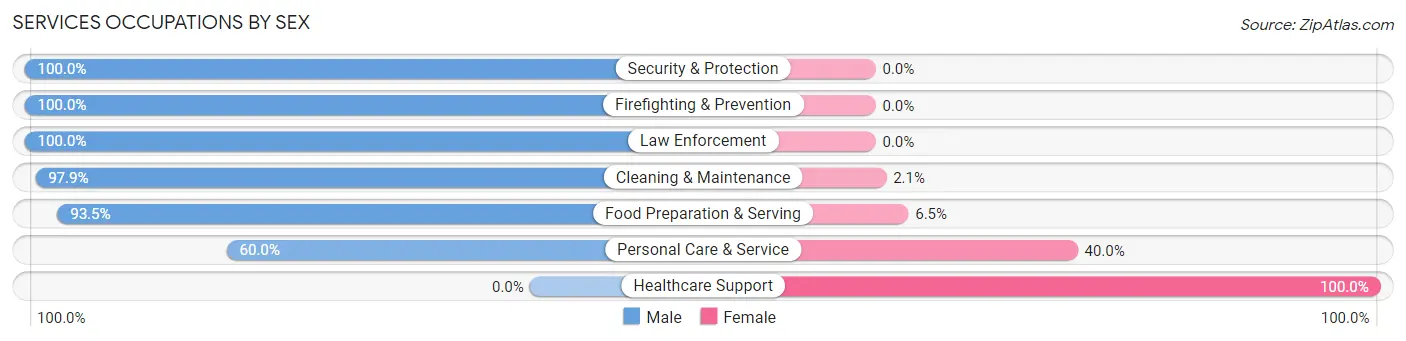
Services Occupations by Sex
Within the Services occupations in Lacombe, the most male-oriented occupations are Security & Protection (100.0%), Firefighting & Prevention (100.0%), and Law Enforcement (100.0%), while the most female-oriented occupations are Healthcare Support (100.0%), Personal Care & Service (40.0%), and Food Preparation & Serving (6.5%).
| Occupation | Male | Female |
| Healthcare Support | 0 (0.0%) | 63 (100.0%) |
| Security & Protection | 223 (100.0%) | 0 (0.0%) |
| Firefighting & Prevention | 22 (100.0%) | 0 (0.0%) |
| Law Enforcement | 201 (100.0%) | 0 (0.0%) |
| Food Preparation & Serving | 101 (93.5%) | 7 (6.5%) |
| Cleaning & Maintenance | 93 (97.9%) | 2 (2.1%) |
| Personal Care & Service | 99 (60.0%) | 66 (40.0%) |
| Total (Category) | 516 (78.9%) | 138 (21.1%) |
| Total (Overall) | 1,745 (58.6%) | 1,234 (41.4%) |
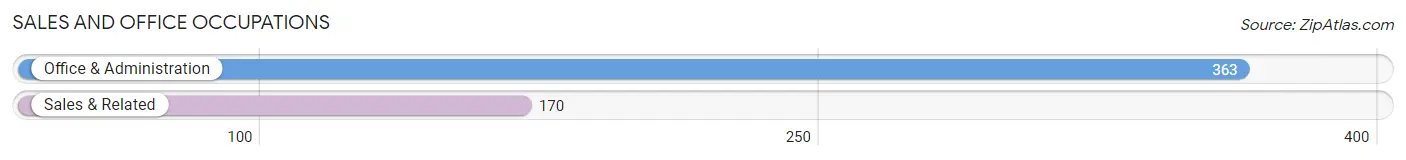
Sales and Office Occupations
The most common Sales and Office occupations in Lacombe are Office & Administration (363 | 12.2%), and Sales & Related (170 | 5.7%).
Sales and Office Occupations by Sex
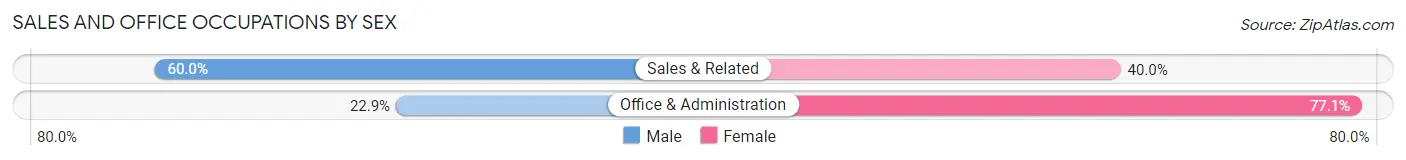
| Occupation | Male | Female |
| Sales & Related | 102 (60.0%) | 68 (40.0%) |
| Office & Administration | 83 (22.9%) | 280 (77.1%) |
| Total (Category) | 185 (34.7%) | 348 (65.3%) |
| Total (Overall) | 1,745 (58.6%) | 1,234 (41.4%) |
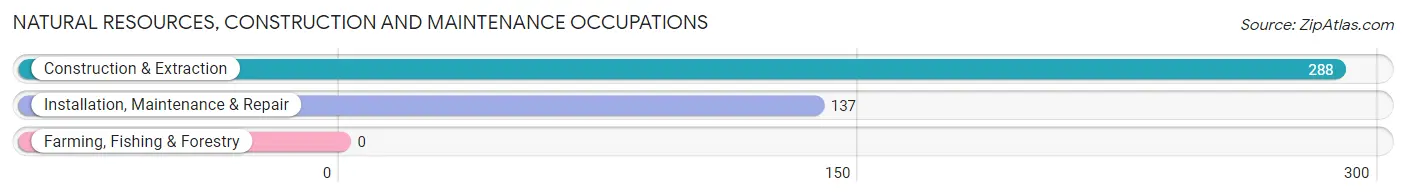
Natural Resources, Construction and Maintenance Occupations
The most common Natural Resources, Construction and Maintenance occupations in Lacombe are Construction & Extraction (288 | 9.7%), and Installation, Maintenance & Repair (137 | 4.6%).
Natural Resources, Construction and Maintenance Occupations by Sex
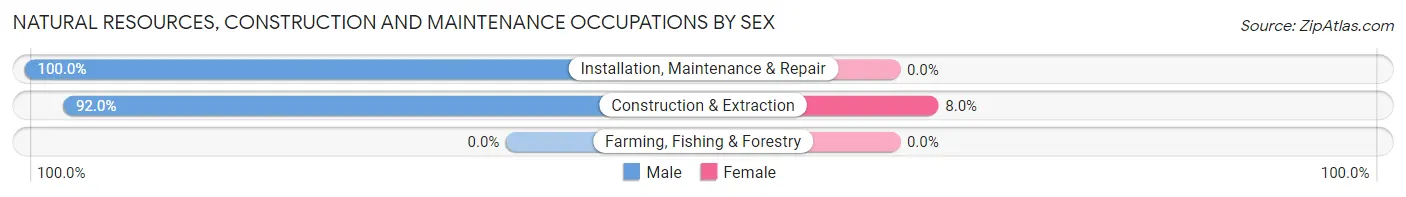
| Occupation | Male | Female |
| Farming, Fishing & Forestry | 0 (0.0%) | 0 (0.0%) |
| Construction & Extraction | 265 (92.0%) | 23 (8.0%) |
| Installation, Maintenance & Repair | 137 (100.0%) | 0 (0.0%) |
| Total (Category) | 402 (94.6%) | 23 (5.4%) |
| Total (Overall) | 1,745 (58.6%) | 1,234 (41.4%) |
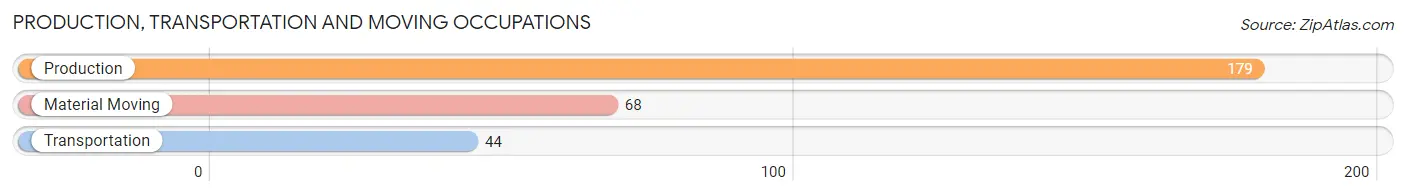
Production, Transportation and Moving Occupations
The most common Production, Transportation and Moving occupations in Lacombe are Production (179 | 6.0%), Material Moving (68 | 2.3%), and Transportation (44 | 1.5%).
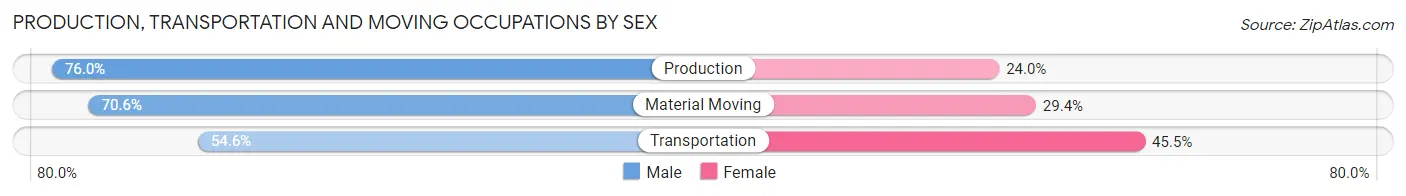
Production, Transportation and Moving Occupations by Sex
| Occupation | Male | Female |
| Production | 136 (76.0%) | 43 (24.0%) |
| Transportation | 24 (54.5%) | 20 (45.5%) |
| Material Moving | 48 (70.6%) | 20 (29.4%) |
| Total (Category) | 208 (71.5%) | 83 (28.5%) |
| Total (Overall) | 1,745 (58.6%) | 1,234 (41.4%) |
Employment Industries by Sex in Lacombe
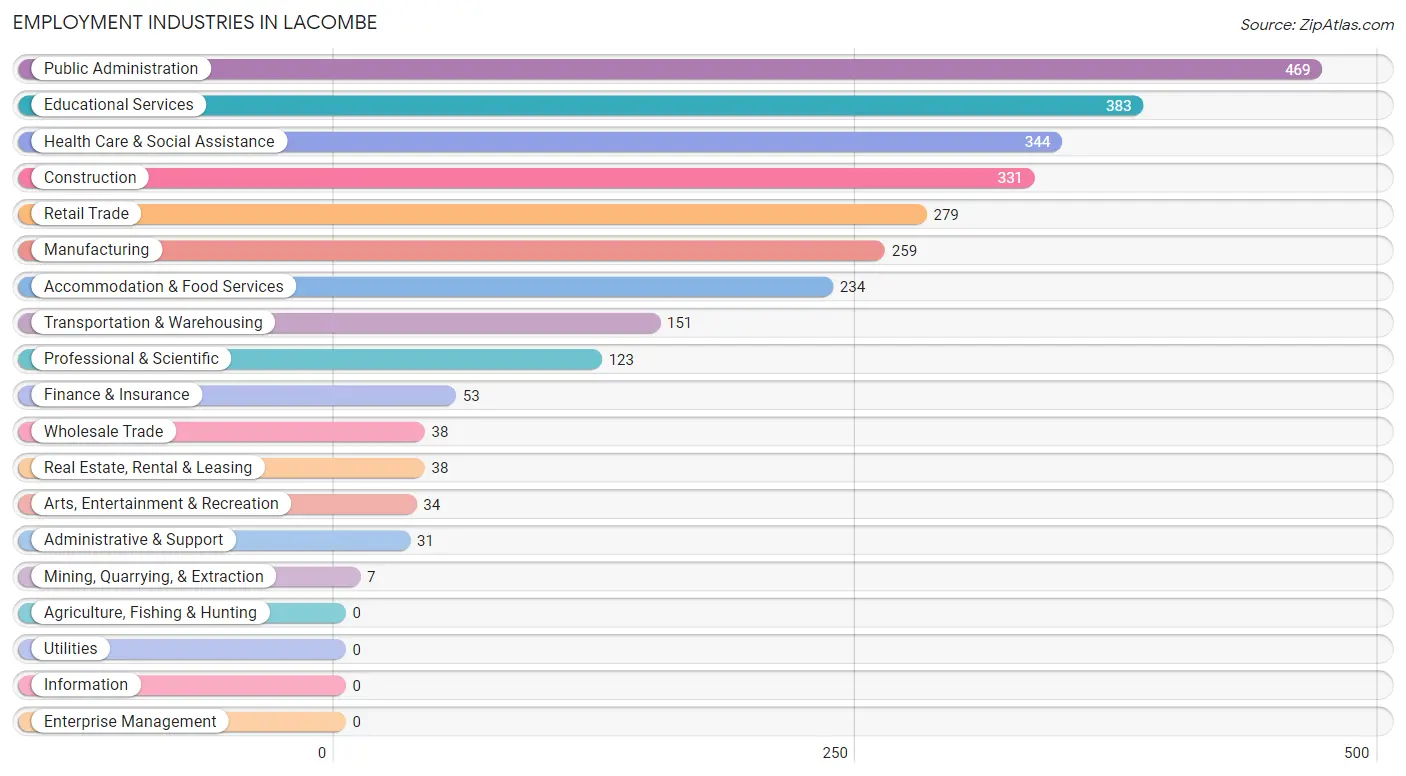
Employment Industries in Lacombe
The major employment industries in Lacombe include Public Administration (469 | 15.7%), Educational Services (383 | 12.9%), Health Care & Social Assistance (344 | 11.6%), Construction (331 | 11.1%), and Retail Trade (279 | 9.4%).
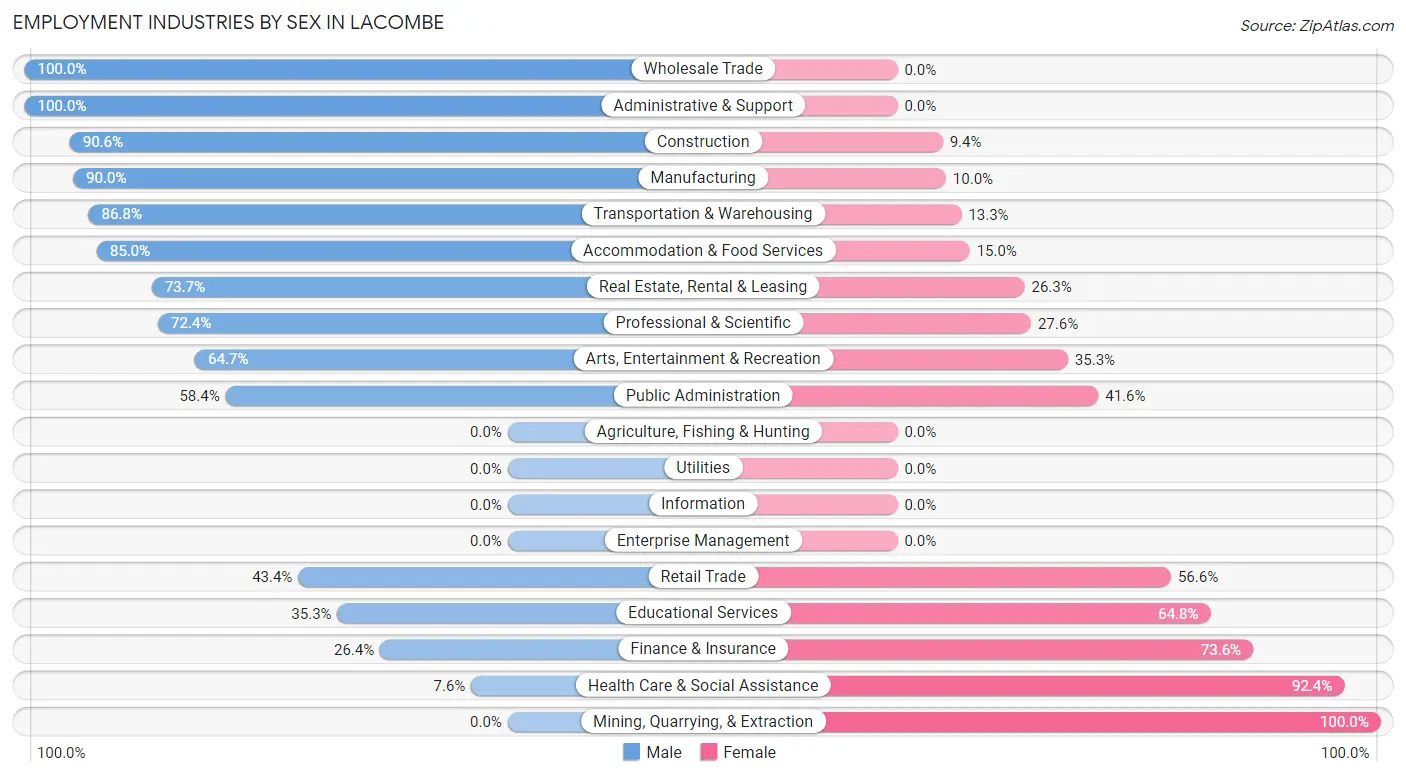
Employment Industries by Sex in Lacombe
The Lacombe industries that see more men than women are Wholesale Trade (100.0%), Administrative & Support (100.0%), and Construction (90.6%), whereas the industries that tend to have a higher number of women are Mining, Quarrying, & Extraction (100.0%), Health Care & Social Assistance (92.4%), and Finance & Insurance (73.6%).
| Industry | Male | Female |
| Agriculture, Fishing & Hunting | 0 (0.0%) | 0 (0.0%) |
| Mining, Quarrying, & Extraction | 0 (0.0%) | 7 (100.0%) |
| Construction | 300 (90.6%) | 31 (9.4%) |
| Manufacturing | 233 (90.0%) | 26 (10.0%) |
| Wholesale Trade | 38 (100.0%) | 0 (0.0%) |
| Retail Trade | 121 (43.4%) | 158 (56.6%) |
| Transportation & Warehousing | 131 (86.8%) | 20 (13.3%) |
| Utilities | 0 (0.0%) | 0 (0.0%) |
| Information | 0 (0.0%) | 0 (0.0%) |
| Finance & Insurance | 14 (26.4%) | 39 (73.6%) |
| Real Estate, Rental & Leasing | 28 (73.7%) | 10 (26.3%) |
| Professional & Scientific | 89 (72.4%) | 34 (27.6%) |
| Enterprise Management | 0 (0.0%) | 0 (0.0%) |
| Administrative & Support | 31 (100.0%) | 0 (0.0%) |
| Educational Services | 135 (35.2%) | 248 (64.7%) |
| Health Care & Social Assistance | 26 (7.6%) | 318 (92.4%) |
| Arts, Entertainment & Recreation | 22 (64.7%) | 12 (35.3%) |
| Accommodation & Food Services | 199 (85.0%) | 35 (15.0%) |
| Public Administration | 274 (58.4%) | 195 (41.6%) |
| Total | 1,745 (58.6%) | 1,234 (41.4%) |
Education in Lacombe
School Enrollment in Lacombe
The most common levels of schooling among the 1,186 students in Lacombe are middle school (319 | 26.9%), elementary school (298 | 25.1%), and high school (206 | 17.4%).
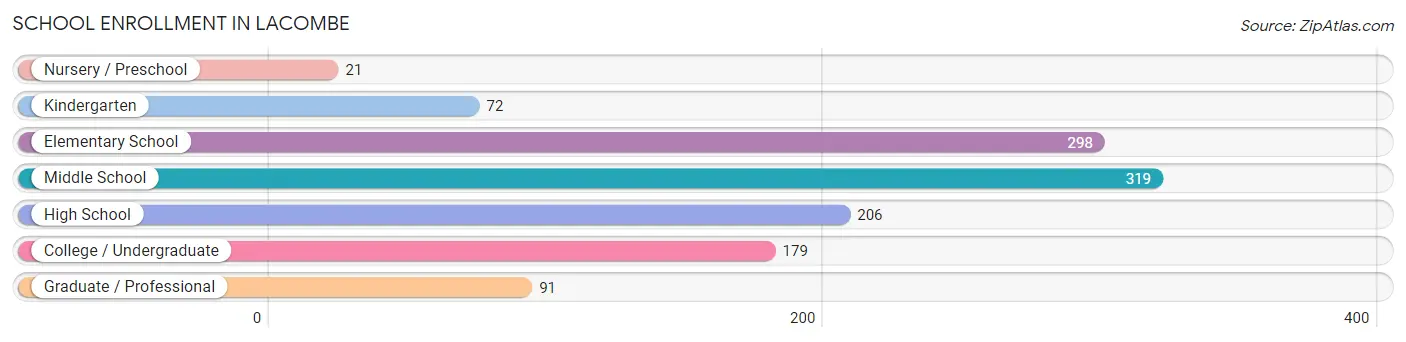
| School Level | # Students | % Students |
| Nursery / Preschool | 21 | 1.8% |
| Kindergarten | 72 | 6.1% |
| Elementary School | 298 | 25.1% |
| Middle School | 319 | 26.9% |
| High School | 206 | 17.4% |
| College / Undergraduate | 179 | 15.1% |
| Graduate / Professional | 91 | 7.7% |
| Total | 1,186 | 100.0% |
School Enrollment by Age by Funding Source in Lacombe
Out of a total of 1,186 students who are enrolled in schools in Lacombe, 366 (30.9%) attend a private institution, while the remaining 820 (69.1%) are enrolled in public schools. The age group of 35 years and over has the highest likelihood of being enrolled in private schools, with 7 (100.0% in the age bracket) enrolled. Conversely, the age group of 18 to 19 year olds has the lowest likelihood of being enrolled in a private school, with 29 (100.0% in the age bracket) attending a public institution.
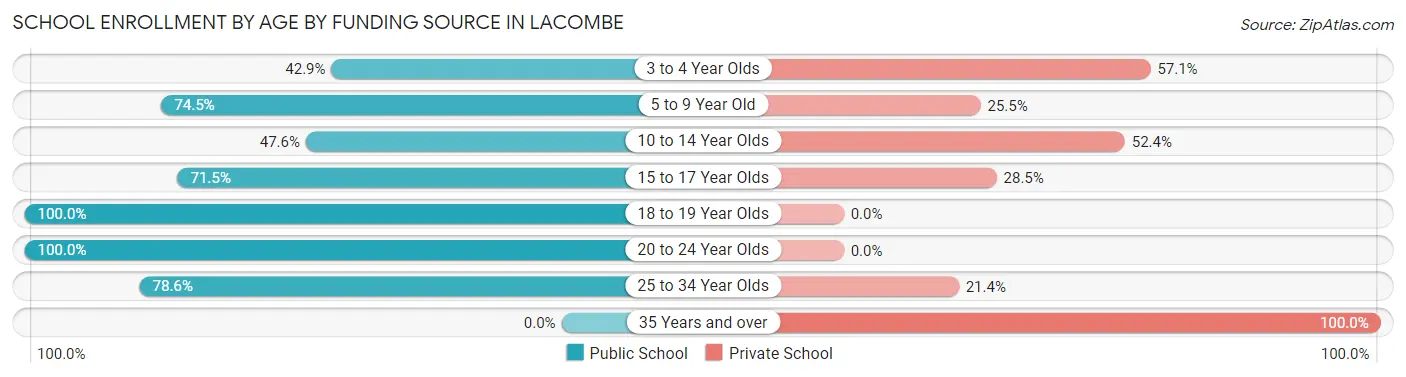
| Age Bracket | Public School | Private School |
| 3 to 4 Year Olds | 9 (42.9%) | 12 (57.1%) |
| 5 to 9 Year Old | 266 (74.5%) | 91 (25.5%) |
| 10 to 14 Year Olds | 171 (47.6%) | 188 (52.4%) |
| 15 to 17 Year Olds | 128 (71.5%) | 51 (28.5%) |
| 18 to 19 Year Olds | 29 (100.0%) | 0 (0.0%) |
| 20 to 24 Year Olds | 150 (100.0%) | 0 (0.0%) |
| 25 to 34 Year Olds | 66 (78.6%) | 18 (21.4%) |
| 35 Years and over | 0 (0.0%) | 7 (100.0%) |
| Total | 820 (69.1%) | 366 (30.9%) |
Educational Attainment by Field of Study in Lacombe
Education (332 | 19.1%), business (295 | 17.0%), science & technology (185 | 10.6%), social sciences (177 | 10.2%), and liberal arts & history (148 | 8.5%) are the most common fields of study among 1,739 individuals in Lacombe who have obtained a bachelor's degree or higher.
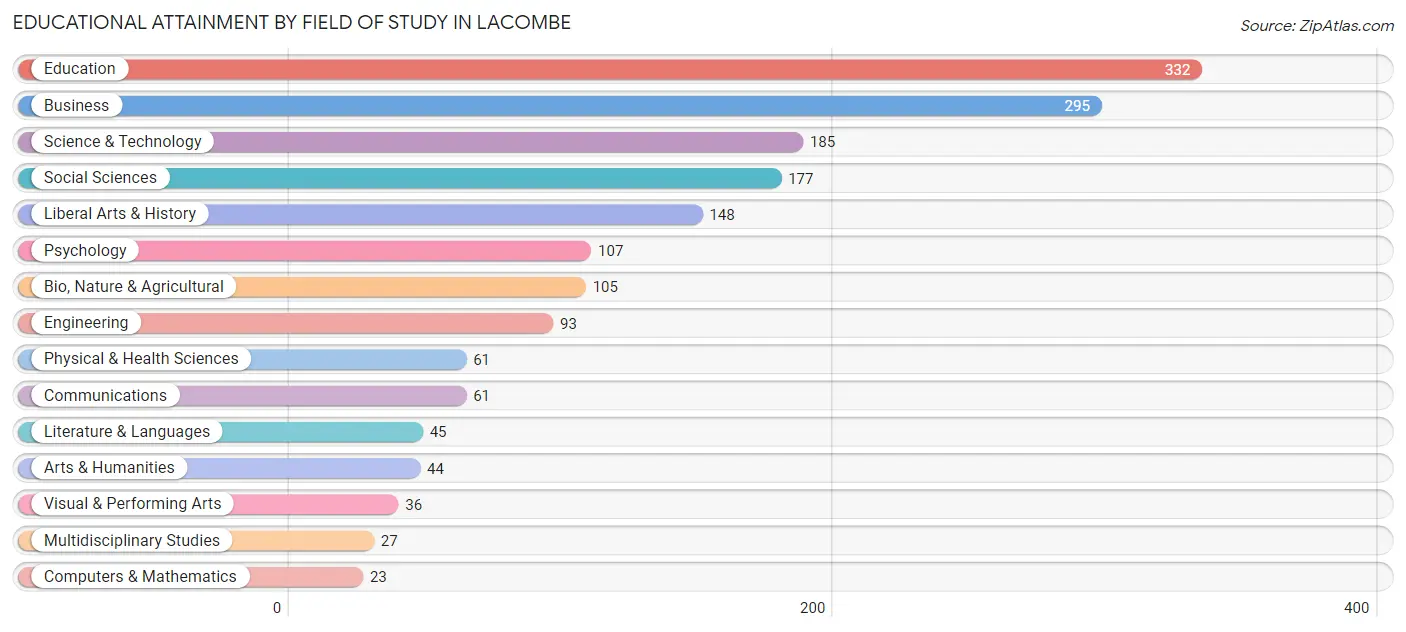
| Field of Study | # Graduates | % Graduates |
| Computers & Mathematics | 23 | 1.3% |
| Bio, Nature & Agricultural | 105 | 6.0% |
| Physical & Health Sciences | 61 | 3.5% |
| Psychology | 107 | 6.1% |
| Social Sciences | 177 | 10.2% |
| Engineering | 93 | 5.3% |
| Multidisciplinary Studies | 27 | 1.5% |
| Science & Technology | 185 | 10.6% |
| Business | 295 | 17.0% |
| Education | 332 | 19.1% |
| Literature & Languages | 45 | 2.6% |
| Liberal Arts & History | 148 | 8.5% |
| Visual & Performing Arts | 36 | 2.1% |
| Communications | 61 | 3.5% |
| Arts & Humanities | 44 | 2.5% |
| Total | 1,739 | 100.0% |
Transportation & Commute in Lacombe
Vehicle Availability by Sex in Lacombe
The most prevalent vehicle ownership categories in Lacombe are males with 3 vehicles (540, accounting for 33.0%) and females with 3 vehicles (405, making up 44.5%).
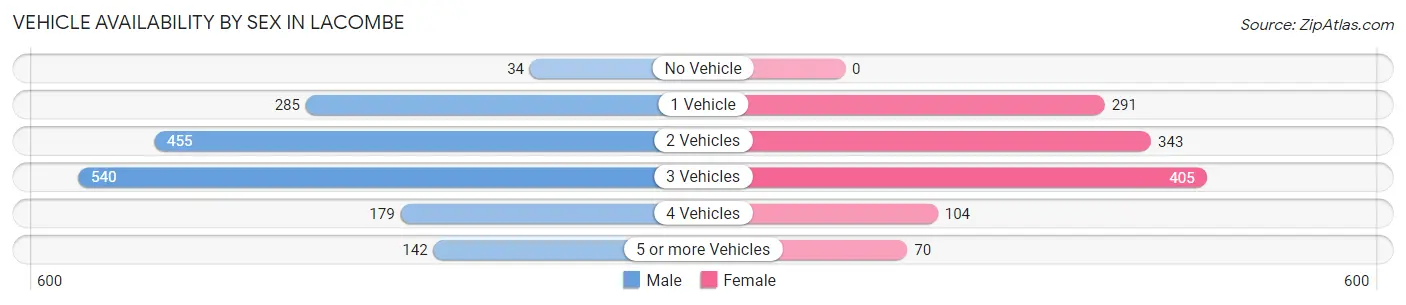
| Vehicles Available | Male | Female |
| No Vehicle | 34 (2.1%) | 0 (0.0%) |
| 1 Vehicle | 285 (17.4%) | 291 (24.0%) |
| 2 Vehicles | 455 (27.8%) | 343 (28.3%) |
| 3 Vehicles | 540 (33.0%) | 405 (33.4%) |
| 4 Vehicles | 179 (11.0%) | 104 (8.6%) |
| 5 or more Vehicles | 142 (8.7%) | 70 (5.8%) |
| Total | 1,635 (100.0%) | 1,213 (100.0%) |
Commute Time in Lacombe
The most frequently occuring commute durations in Lacombe are 20 to 24 minutes (533 commuters, 19.3%), 45 to 59 minutes (401 commuters, 14.5%), and 30 to 34 minutes (397 commuters, 14.4%).
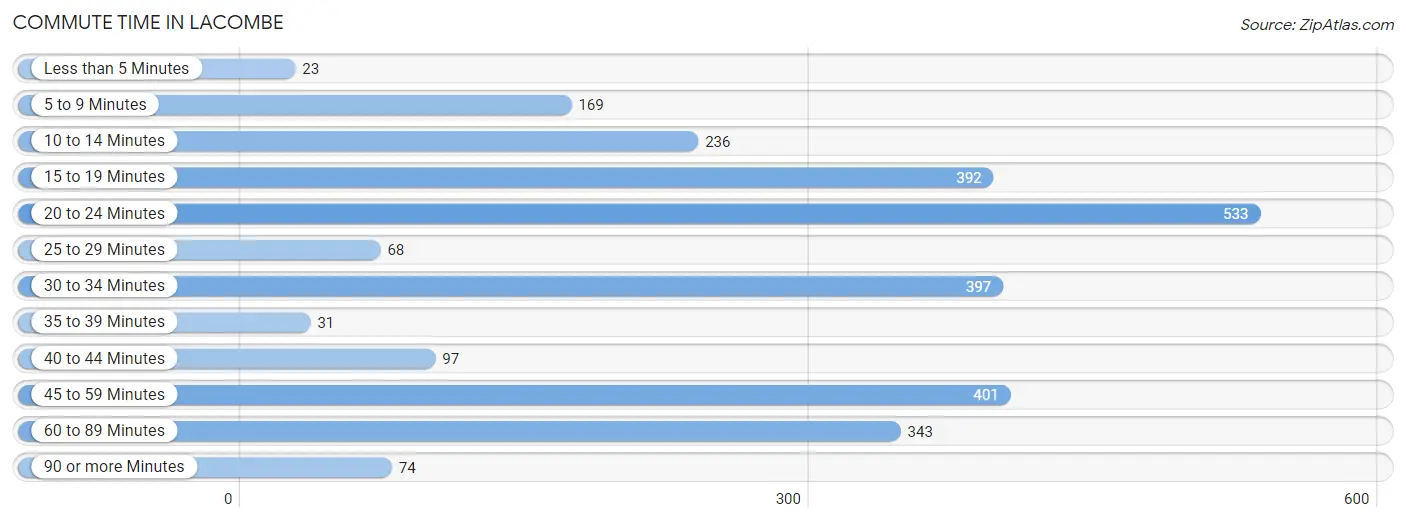
| Commute Time | # Commuters | % Commuters |
| Less than 5 Minutes | 23 | 0.8% |
| 5 to 9 Minutes | 169 | 6.1% |
| 10 to 14 Minutes | 236 | 8.5% |
| 15 to 19 Minutes | 392 | 14.2% |
| 20 to 24 Minutes | 533 | 19.3% |
| 25 to 29 Minutes | 68 | 2.5% |
| 30 to 34 Minutes | 397 | 14.4% |
| 35 to 39 Minutes | 31 | 1.1% |
| 40 to 44 Minutes | 97 | 3.5% |
| 45 to 59 Minutes | 401 | 14.5% |
| 60 to 89 Minutes | 343 | 12.4% |
| 90 or more Minutes | 74 | 2.7% |
Commute Time by Sex in Lacombe
The most common commute times in Lacombe are 45 to 59 minutes (297 commuters, 19.0%) for males and 20 to 24 minutes (311 commuters, 26.0%) for females.
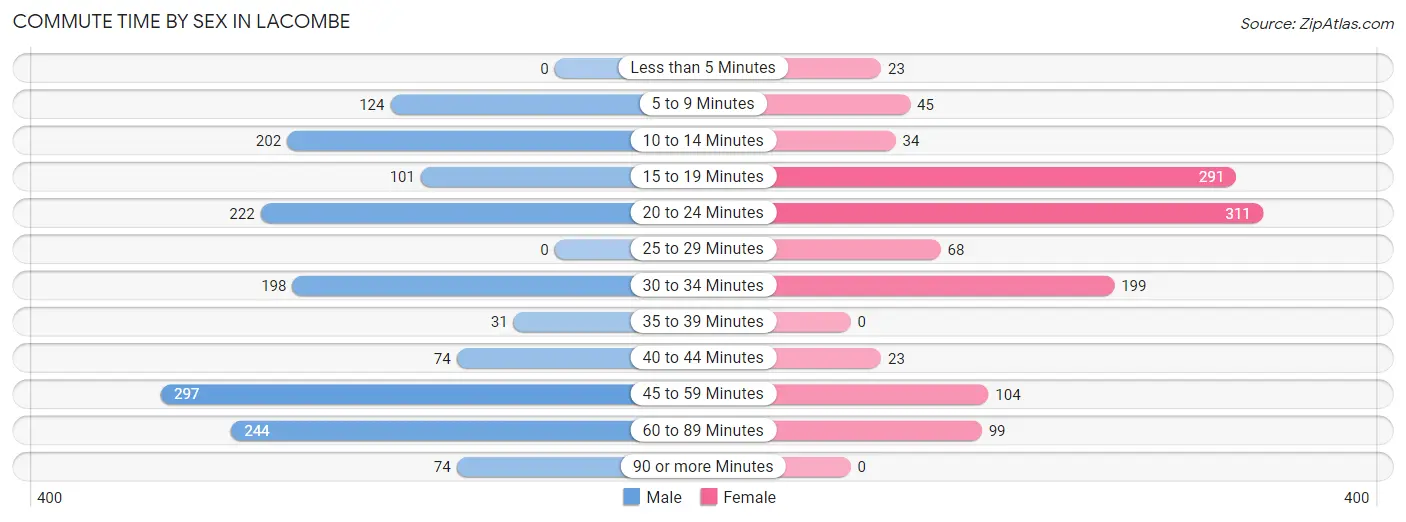
| Commute Time | Male | Female |
| Less than 5 Minutes | 0 (0.0%) | 23 (1.9%) |
| 5 to 9 Minutes | 124 (7.9%) | 45 (3.8%) |
| 10 to 14 Minutes | 202 (12.9%) | 34 (2.8%) |
| 15 to 19 Minutes | 101 (6.5%) | 291 (24.3%) |
| 20 to 24 Minutes | 222 (14.2%) | 311 (26.0%) |
| 25 to 29 Minutes | 0 (0.0%) | 68 (5.7%) |
| 30 to 34 Minutes | 198 (12.6%) | 199 (16.6%) |
| 35 to 39 Minutes | 31 (2.0%) | 0 (0.0%) |
| 40 to 44 Minutes | 74 (4.7%) | 23 (1.9%) |
| 45 to 59 Minutes | 297 (19.0%) | 104 (8.7%) |
| 60 to 89 Minutes | 244 (15.6%) | 99 (8.3%) |
| 90 or more Minutes | 74 (4.7%) | 0 (0.0%) |
Time of Departure to Work by Sex in Lacombe
The most frequent times of departure to work in Lacombe are 7:00 AM to 7:29 AM (337, 21.5%) for males and 7:00 AM to 7:29 AM (336, 28.1%) for females.
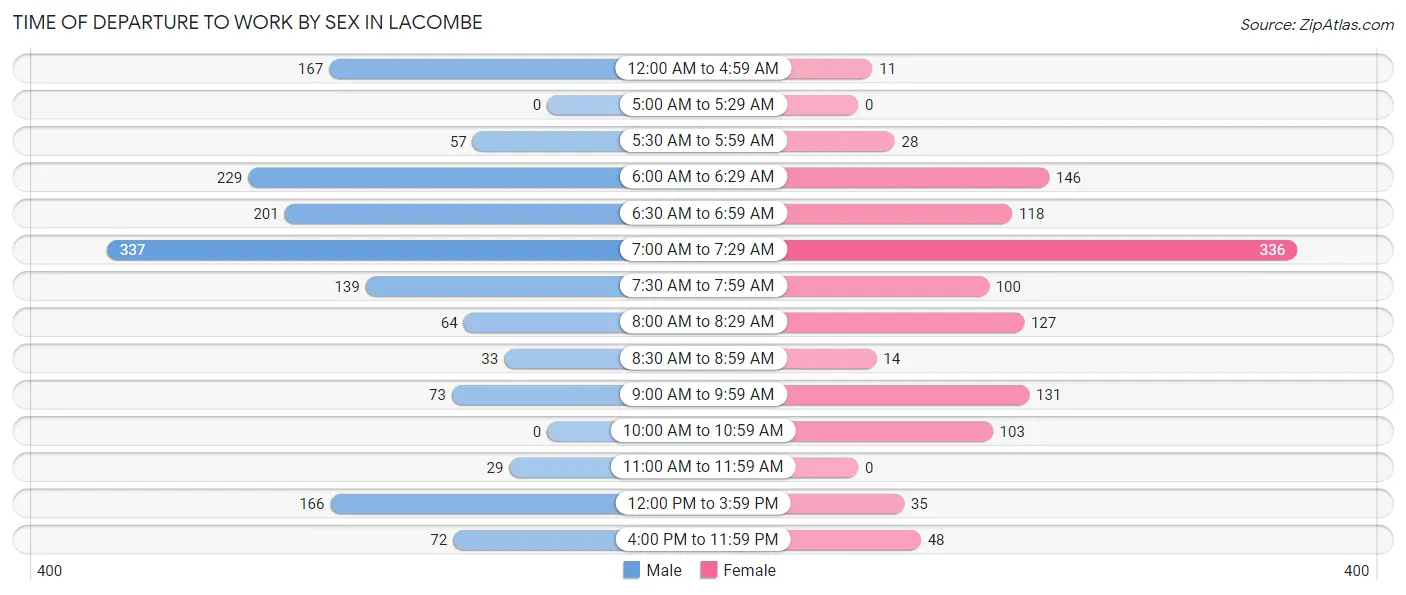
| Time of Departure | Male | Female |
| 12:00 AM to 4:59 AM | 167 (10.7%) | 11 (0.9%) |
| 5:00 AM to 5:29 AM | 0 (0.0%) | 0 (0.0%) |
| 5:30 AM to 5:59 AM | 57 (3.6%) | 28 (2.3%) |
| 6:00 AM to 6:29 AM | 229 (14.6%) | 146 (12.2%) |
| 6:30 AM to 6:59 AM | 201 (12.8%) | 118 (9.9%) |
| 7:00 AM to 7:29 AM | 337 (21.5%) | 336 (28.1%) |
| 7:30 AM to 7:59 AM | 139 (8.9%) | 100 (8.4%) |
| 8:00 AM to 8:29 AM | 64 (4.1%) | 127 (10.6%) |
| 8:30 AM to 8:59 AM | 33 (2.1%) | 14 (1.2%) |
| 9:00 AM to 9:59 AM | 73 (4.7%) | 131 (10.9%) |
| 10:00 AM to 10:59 AM | 0 (0.0%) | 103 (8.6%) |
| 11:00 AM to 11:59 AM | 29 (1.8%) | 0 (0.0%) |
| 12:00 PM to 3:59 PM | 166 (10.6%) | 35 (2.9%) |
| 4:00 PM to 11:59 PM | 72 (4.6%) | 48 (4.0%) |
| Total | 1,567 (100.0%) | 1,197 (100.0%) |
Housing Occupancy in Lacombe
Occupancy by Ownership in Lacombe
Of the total 2,811 dwellings in Lacombe, owner-occupied units account for 2,455 (87.3%), while renter-occupied units make up 356 (12.7%).
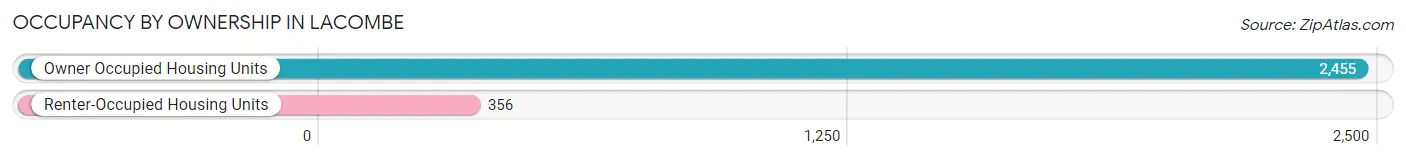
| Occupancy | # Housing Units | % Housing Units |
| Owner Occupied Housing Units | 2,455 | 87.3% |
| Renter-Occupied Housing Units | 356 | 12.7% |
| Total Occupied Housing Units | 2,811 | 100.0% |
Occupancy by Household Size in Lacombe
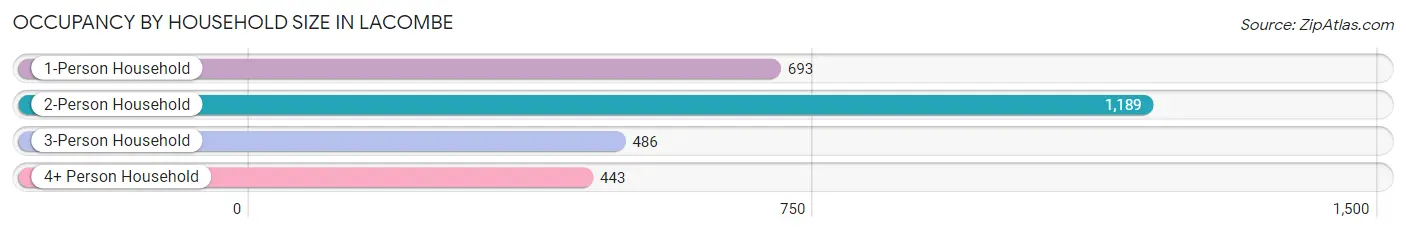
| Household Size | # Housing Units | % Housing Units |
| 1-Person Household | 693 | 24.6% |
| 2-Person Household | 1,189 | 42.3% |
| 3-Person Household | 486 | 17.3% |
| 4+ Person Household | 443 | 15.8% |
| Total Housing Units | 2,811 | 100.0% |
Occupancy by Ownership by Household Size in Lacombe
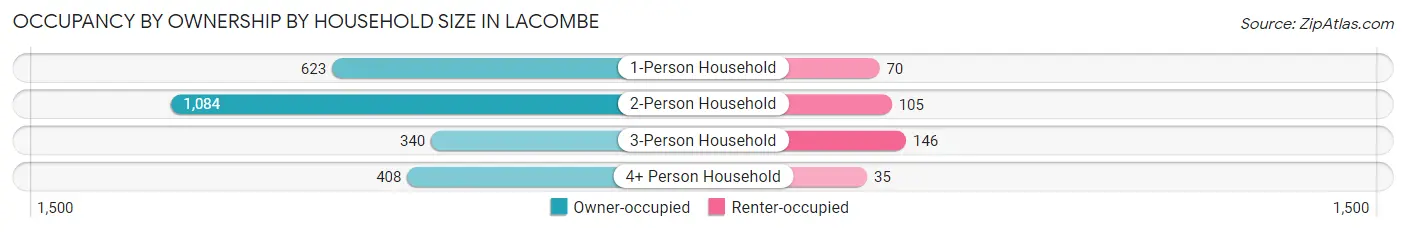
| Household Size | Owner-occupied | Renter-occupied |
| 1-Person Household | 623 (89.9%) | 70 (10.1%) |
| 2-Person Household | 1,084 (91.2%) | 105 (8.8%) |
| 3-Person Household | 340 (70.0%) | 146 (30.0%) |
| 4+ Person Household | 408 (92.1%) | 35 (7.9%) |
| Total Housing Units | 2,455 (87.3%) | 356 (12.7%) |
Occupancy by Educational Attainment in Lacombe
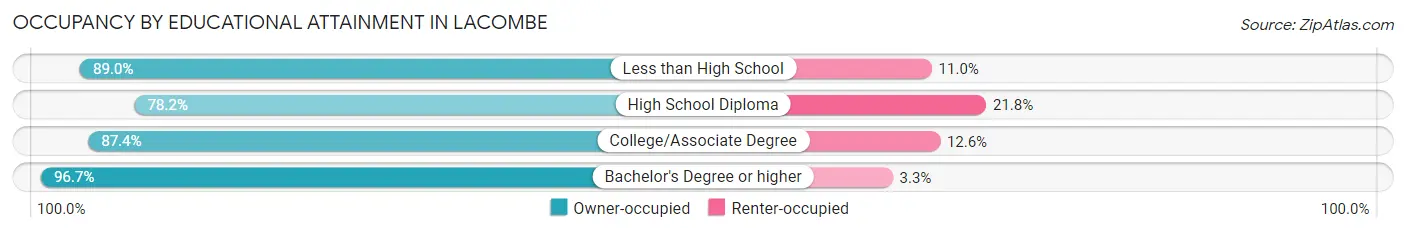
| Household Size | Owner-occupied | Renter-occupied |
| Less than High School | 186 (89.0%) | 23 (11.0%) |
| High School Diploma | 700 (78.2%) | 195 (21.8%) |
| College/Associate Degree | 767 (87.4%) | 111 (12.6%) |
| Bachelor's Degree or higher | 802 (96.7%) | 27 (3.3%) |
Occupancy by Age of Householder in Lacombe
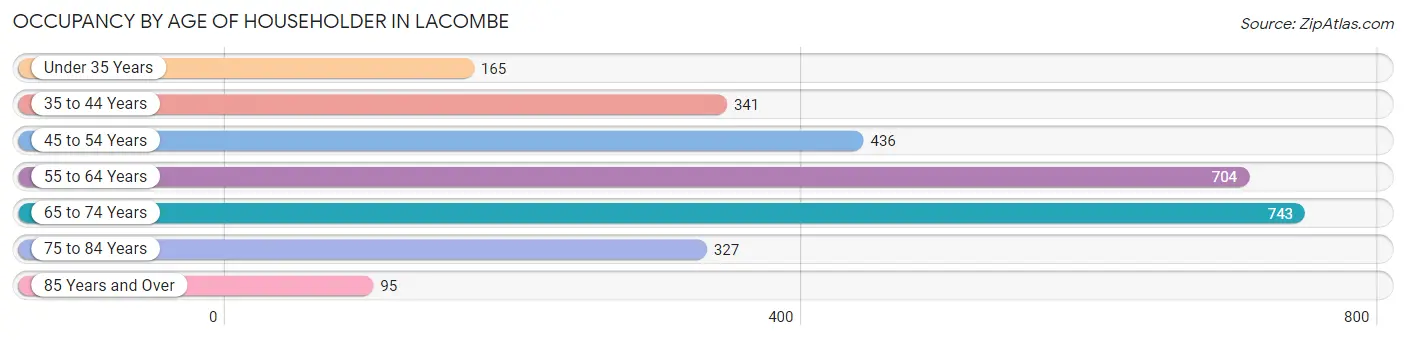
| Age Bracket | # Households | % Households |
| Under 35 Years | 165 | 5.9% |
| 35 to 44 Years | 341 | 12.1% |
| 45 to 54 Years | 436 | 15.5% |
| 55 to 64 Years | 704 | 25.0% |
| 65 to 74 Years | 743 | 26.4% |
| 75 to 84 Years | 327 | 11.6% |
| 85 Years and Over | 95 | 3.4% |
| Total | 2,811 | 100.0% |
Housing Finances in Lacombe
Median Income by Occupancy in Lacombe
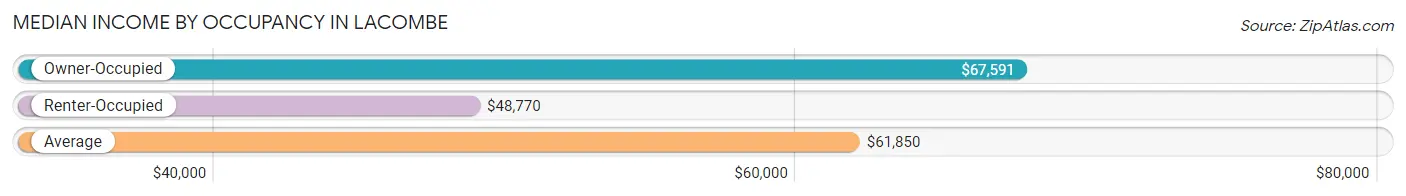
| Occupancy Type | # Households | Median Income |
| Owner-Occupied | 2,455 (87.3%) | $67,591 |
| Renter-Occupied | 356 (12.7%) | $48,770 |
| Average | 2,811 (100.0%) | $61,850 |
Occupancy by Householder Income Bracket in Lacombe
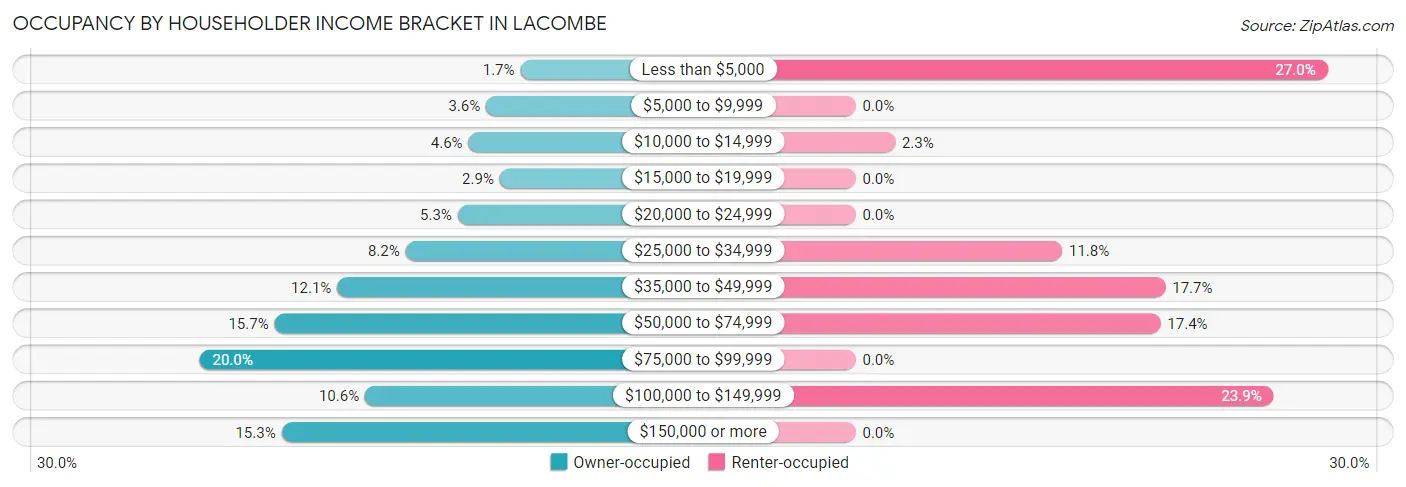
| Income Bracket | Owner-occupied | Renter-occupied |
| Less than $5,000 | 41 (1.7%) | 96 (27.0%) |
| $5,000 to $9,999 | 89 (3.6%) | 0 (0.0%) |
| $10,000 to $14,999 | 114 (4.6%) | 8 (2.2%) |
| $15,000 to $19,999 | 70 (2.9%) | 0 (0.0%) |
| $20,000 to $24,999 | 129 (5.2%) | 0 (0.0%) |
| $25,000 to $34,999 | 202 (8.2%) | 42 (11.8%) |
| $35,000 to $49,999 | 298 (12.1%) | 63 (17.7%) |
| $50,000 to $74,999 | 386 (15.7%) | 62 (17.4%) |
| $75,000 to $99,999 | 491 (20.0%) | 0 (0.0%) |
| $100,000 to $149,999 | 259 (10.5%) | 85 (23.9%) |
| $150,000 or more | 376 (15.3%) | 0 (0.0%) |
| Total | 2,455 (100.0%) | 356 (100.0%) |
Monthly Housing Cost Tiers in Lacombe
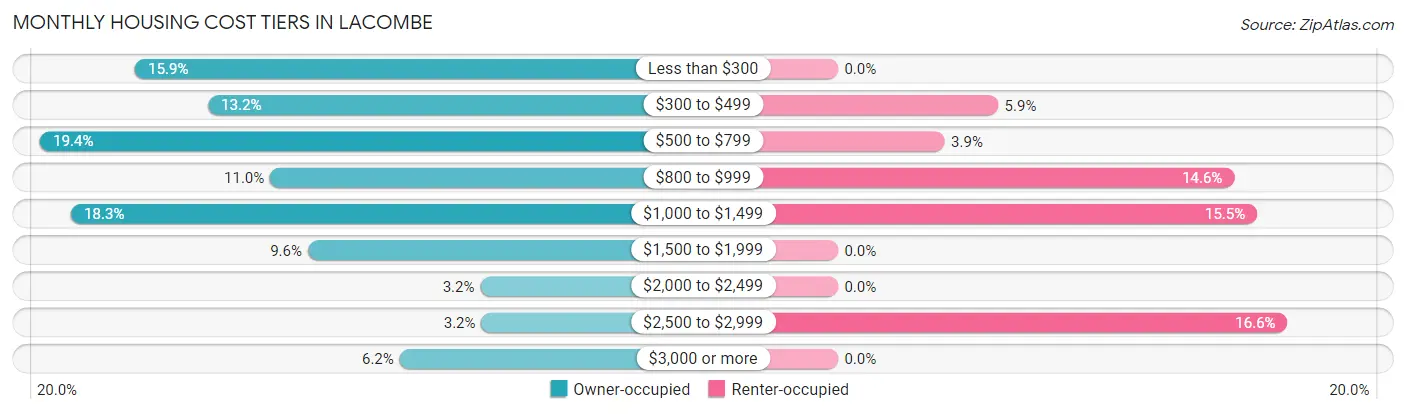
| Monthly Cost | Owner-occupied | Renter-occupied |
| Less than $300 | 391 (15.9%) | 0 (0.0%) |
| $300 to $499 | 325 (13.2%) | 21 (5.9%) |
| $500 to $799 | 477 (19.4%) | 14 (3.9%) |
| $800 to $999 | 269 (11.0%) | 52 (14.6%) |
| $1,000 to $1,499 | 449 (18.3%) | 55 (15.4%) |
| $1,500 to $1,999 | 235 (9.6%) | 0 (0.0%) |
| $2,000 to $2,499 | 79 (3.2%) | 0 (0.0%) |
| $2,500 to $2,999 | 78 (3.2%) | 59 (16.6%) |
| $3,000 or more | 152 (6.2%) | 0 (0.0%) |
| Total | 2,455 (100.0%) | 356 (100.0%) |
Physical Housing Characteristics in Lacombe
Housing Structures in Lacombe
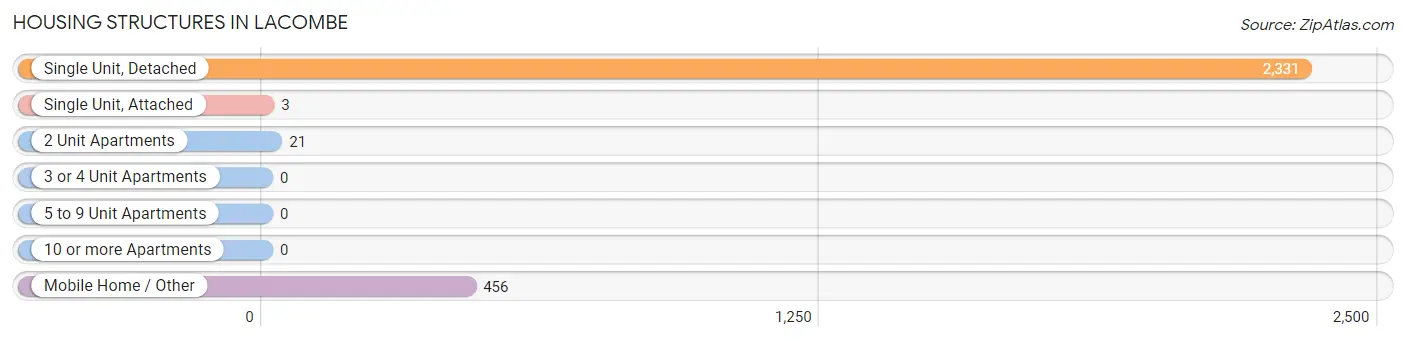
| Structure Type | # Housing Units | % Housing Units |
| Single Unit, Detached | 2,331 | 82.9% |
| Single Unit, Attached | 3 | 0.1% |
| 2 Unit Apartments | 21 | 0.7% |
| 3 or 4 Unit Apartments | 0 | 0.0% |
| 5 to 9 Unit Apartments | 0 | 0.0% |
| 10 or more Apartments | 0 | 0.0% |
| Mobile Home / Other | 456 | 16.2% |
| Total | 2,811 | 100.0% |
Housing Structures by Occupancy in Lacombe
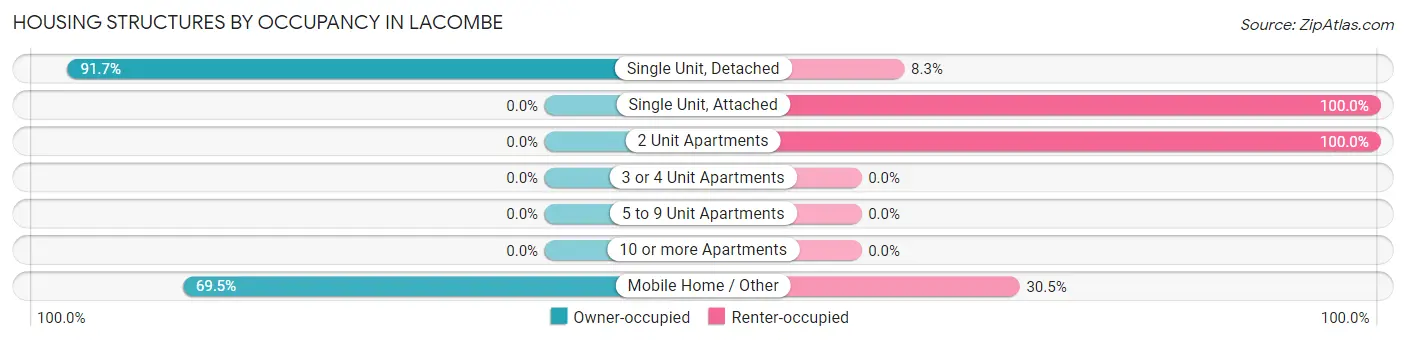
| Structure Type | Owner-occupied | Renter-occupied |
| Single Unit, Detached | 2,138 (91.7%) | 193 (8.3%) |
| Single Unit, Attached | 0 (0.0%) | 3 (100.0%) |
| 2 Unit Apartments | 0 (0.0%) | 21 (100.0%) |
| 3 or 4 Unit Apartments | 0 (0.0%) | 0 (0.0%) |
| 5 to 9 Unit Apartments | 0 (0.0%) | 0 (0.0%) |
| 10 or more Apartments | 0 (0.0%) | 0 (0.0%) |
| Mobile Home / Other | 317 (69.5%) | 139 (30.5%) |
| Total | 2,455 (87.3%) | 356 (12.7%) |
Housing Structures by Number of Rooms in Lacombe
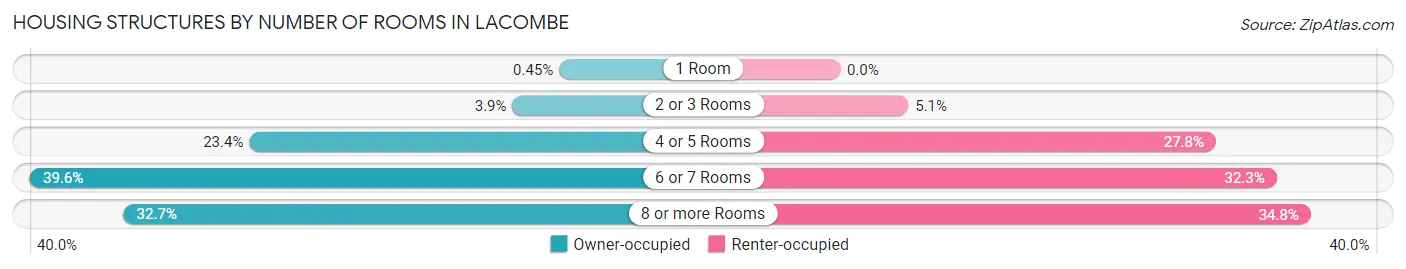
| Number of Rooms | Owner-occupied | Renter-occupied |
| 1 Room | 11 (0.4%) | 0 (0.0%) |
| 2 or 3 Rooms | 96 (3.9%) | 18 (5.1%) |
| 4 or 5 Rooms | 574 (23.4%) | 99 (27.8%) |
| 6 or 7 Rooms | 972 (39.6%) | 115 (32.3%) |
| 8 or more Rooms | 802 (32.7%) | 124 (34.8%) |
| Total | 2,455 (100.0%) | 356 (100.0%) |
Housing Structure by Heating Type in Lacombe
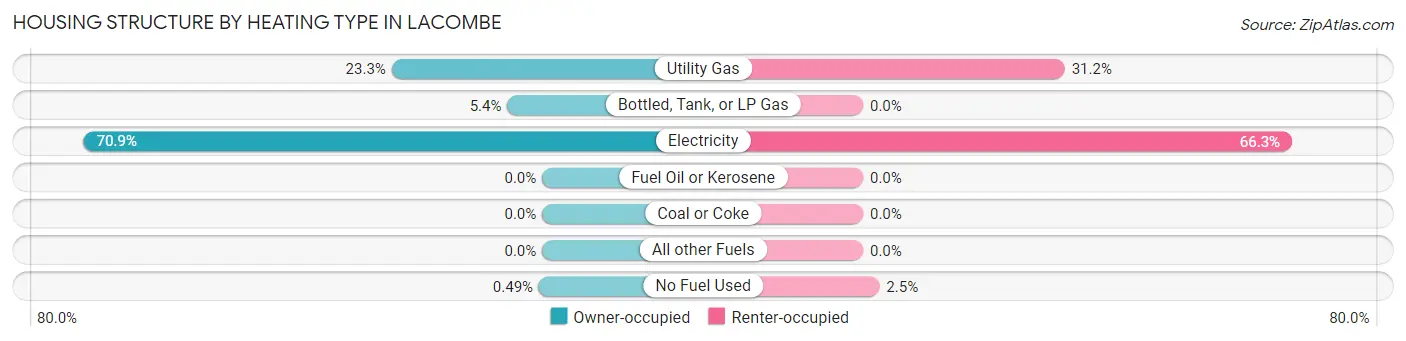
| Heating Type | Owner-occupied | Renter-occupied |
| Utility Gas | 571 (23.3%) | 111 (31.2%) |
| Bottled, Tank, or LP Gas | 132 (5.4%) | 0 (0.0%) |
| Electricity | 1,740 (70.9%) | 236 (66.3%) |
| Fuel Oil or Kerosene | 0 (0.0%) | 0 (0.0%) |
| Coal or Coke | 0 (0.0%) | 0 (0.0%) |
| All other Fuels | 0 (0.0%) | 0 (0.0%) |
| No Fuel Used | 12 (0.5%) | 9 (2.5%) |
| Total | 2,455 (100.0%) | 356 (100.0%) |
Household Vehicle Usage in Lacombe
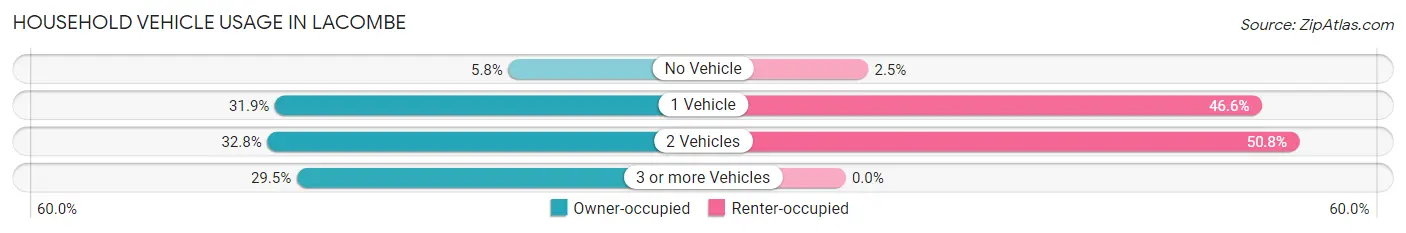
| Vehicles per Household | Owner-occupied | Renter-occupied |
| No Vehicle | 142 (5.8%) | 9 (2.5%) |
| 1 Vehicle | 784 (31.9%) | 166 (46.6%) |
| 2 Vehicles | 805 (32.8%) | 181 (50.8%) |
| 3 or more Vehicles | 724 (29.5%) | 0 (0.0%) |
| Total | 2,455 (100.0%) | 356 (100.0%) |
Real Estate & Mortgages in Lacombe
Real Estate and Mortgage Overview in Lacombe
| Characteristic | Without Mortgage | With Mortgage |
| Housing Units | 1,293 | 1,162 |
| Median Property Value | $220,500 | $227,200 |
| Median Household Income | $45,292 | $294 |
| Monthly Housing Costs | $471 | $152 |
| Real Estate Taxes | $1,330 | $203 |
Property Value by Mortgage Status in Lacombe
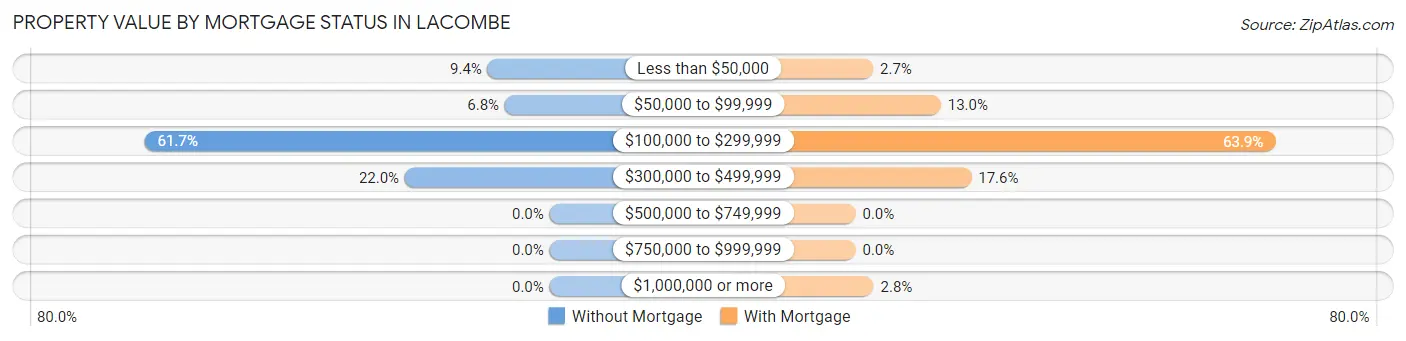
| Property Value | Without Mortgage | With Mortgage |
| Less than $50,000 | 122 (9.4%) | 31 (2.7%) |
| $50,000 to $99,999 | 88 (6.8%) | 151 (13.0%) |
| $100,000 to $299,999 | 798 (61.7%) | 743 (63.9%) |
| $300,000 to $499,999 | 285 (22.0%) | 205 (17.6%) |
| $500,000 to $749,999 | 0 (0.0%) | 0 (0.0%) |
| $750,000 to $999,999 | 0 (0.0%) | 0 (0.0%) |
| $1,000,000 or more | 0 (0.0%) | 32 (2.8%) |
| Total | 1,293 (100.0%) | 1,162 (100.0%) |
Household Income by Mortgage Status in Lacombe
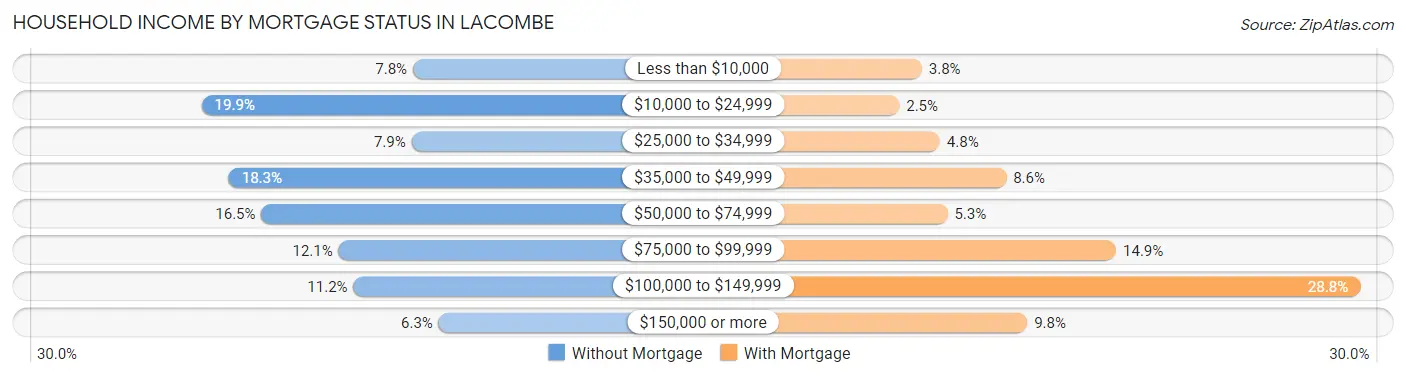
| Household Income | Without Mortgage | With Mortgage |
| Less than $10,000 | 101 (7.8%) | 44 (3.8%) |
| $10,000 to $24,999 | 257 (19.9%) | 29 (2.5%) |
| $25,000 to $34,999 | 102 (7.9%) | 56 (4.8%) |
| $35,000 to $49,999 | 237 (18.3%) | 100 (8.6%) |
| $50,000 to $74,999 | 213 (16.5%) | 61 (5.2%) |
| $75,000 to $99,999 | 156 (12.1%) | 173 (14.9%) |
| $100,000 to $149,999 | 145 (11.2%) | 335 (28.8%) |
| $150,000 or more | 82 (6.3%) | 114 (9.8%) |
| Total | 1,293 (100.0%) | 1,162 (100.0%) |
Property Value to Household Income Ratio in Lacombe
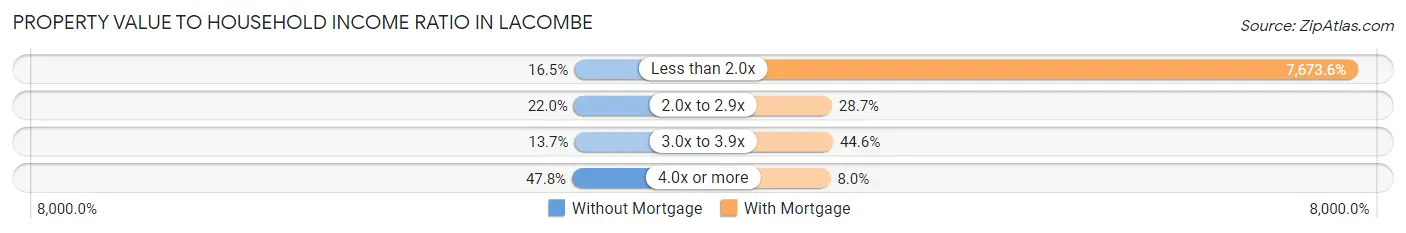
| Value-to-Income Ratio | Without Mortgage | With Mortgage |
| Less than 2.0x | 213 (16.5%) | 89,167 (7,673.6%) |
| 2.0x to 2.9x | 285 (22.0%) | 334 (28.7%) |
| 3.0x to 3.9x | 177 (13.7%) | 518 (44.6%) |
| 4.0x or more | 618 (47.8%) | 93 (8.0%) |
| Total | 1,293 (100.0%) | 1,162 (100.0%) |
Real Estate Taxes by Mortgage Status in Lacombe
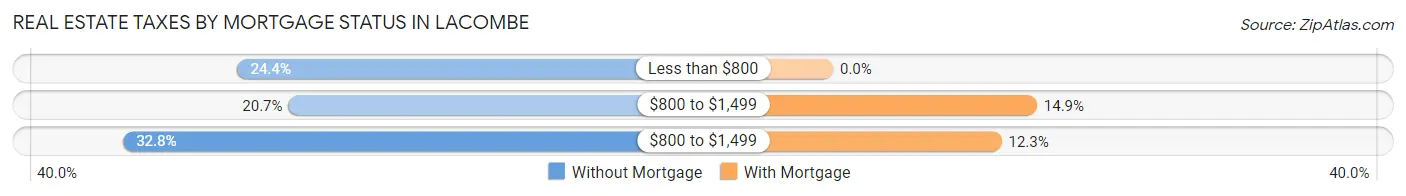
| Property Taxes | Without Mortgage | With Mortgage |
| Less than $800 | 316 (24.4%) | 0 (0.0%) |
| $800 to $1,499 | 268 (20.7%) | 173 (14.9%) |
| $800 to $1,499 | 424 (32.8%) | 143 (12.3%) |
| Total | 1,293 (100.0%) | 1,162 (100.0%) |
Health & Disability in Lacombe
Health Insurance Coverage by Age in Lacombe
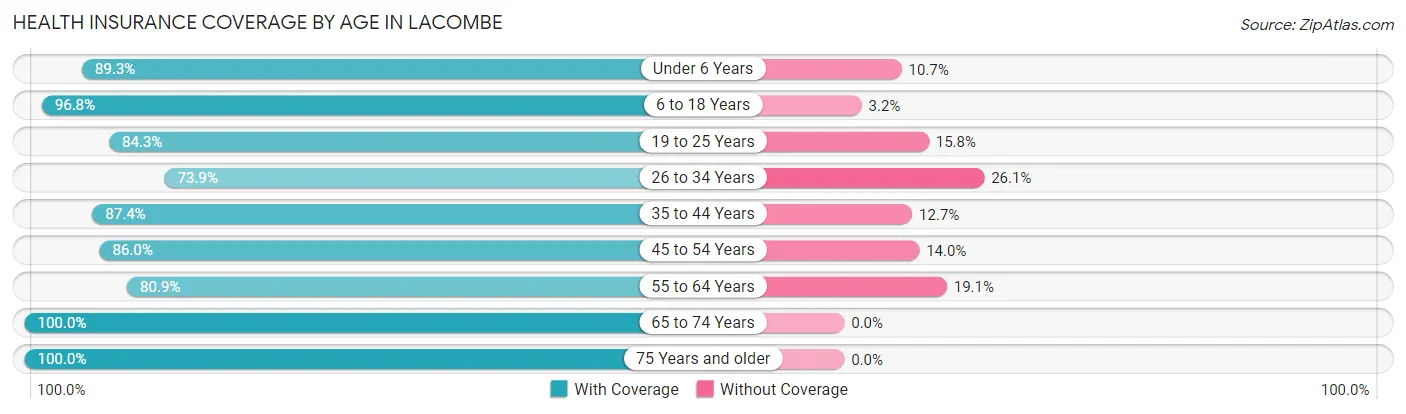
| Age Bracket | With Coverage | Without Coverage |
| Under 6 Years | 259 (89.3%) | 31 (10.7%) |
| 6 to 18 Years | 839 (96.8%) | 28 (3.2%) |
| 19 to 25 Years | 412 (84.3%) | 77 (15.8%) |
| 26 to 34 Years | 456 (73.9%) | 161 (26.1%) |
| 35 to 44 Years | 670 (87.4%) | 97 (12.7%) |
| 45 to 54 Years | 776 (86.0%) | 126 (14.0%) |
| 55 to 64 Years | 1,062 (80.9%) | 251 (19.1%) |
| 65 to 74 Years | 1,081 (100.0%) | 0 (0.0%) |
| 75 Years and older | 628 (100.0%) | 0 (0.0%) |
| Total | 6,183 (88.9%) | 771 (11.1%) |
Health Insurance Coverage by Citizenship Status in Lacombe
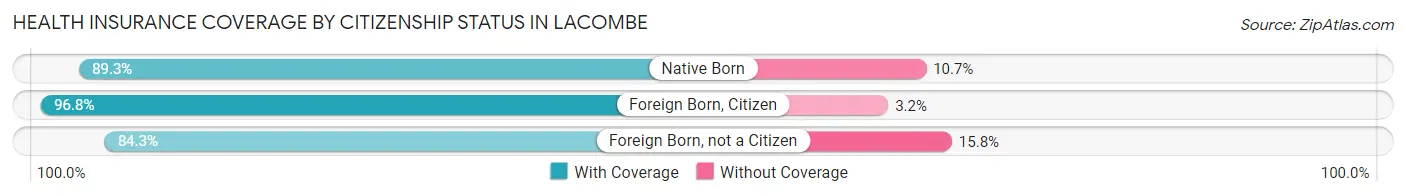
| Citizenship Status | With Coverage | Without Coverage |
| Native Born | 259 (89.3%) | 31 (10.7%) |
| Foreign Born, Citizen | 839 (96.8%) | 28 (3.2%) |
| Foreign Born, not a Citizen | 412 (84.3%) | 77 (15.8%) |
Health Insurance Coverage by Household Income in Lacombe
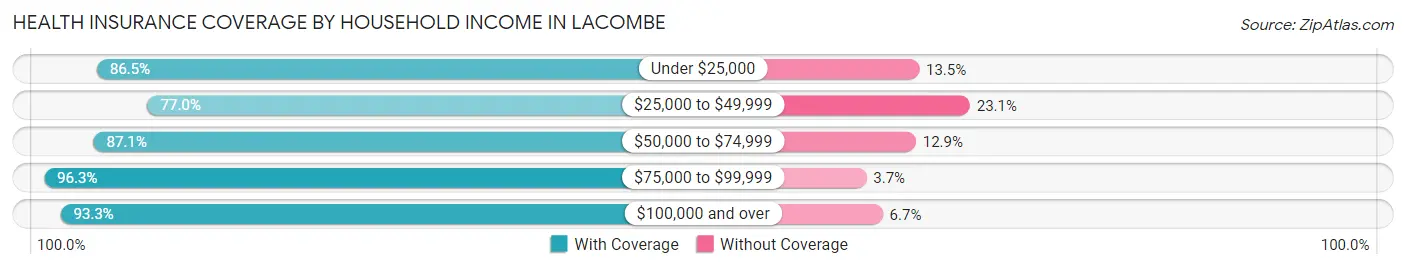
| Household Income | With Coverage | Without Coverage |
| Under $25,000 | 767 (86.5%) | 120 (13.5%) |
| $25,000 to $49,999 | 1,015 (76.9%) | 304 (23.1%) |
| $50,000 to $74,999 | 983 (87.1%) | 146 (12.9%) |
| $75,000 to $99,999 | 1,317 (96.3%) | 50 (3.7%) |
| $100,000 and over | 2,095 (93.3%) | 151 (6.7%) |
Public vs Private Health Insurance Coverage by Age in Lacombe
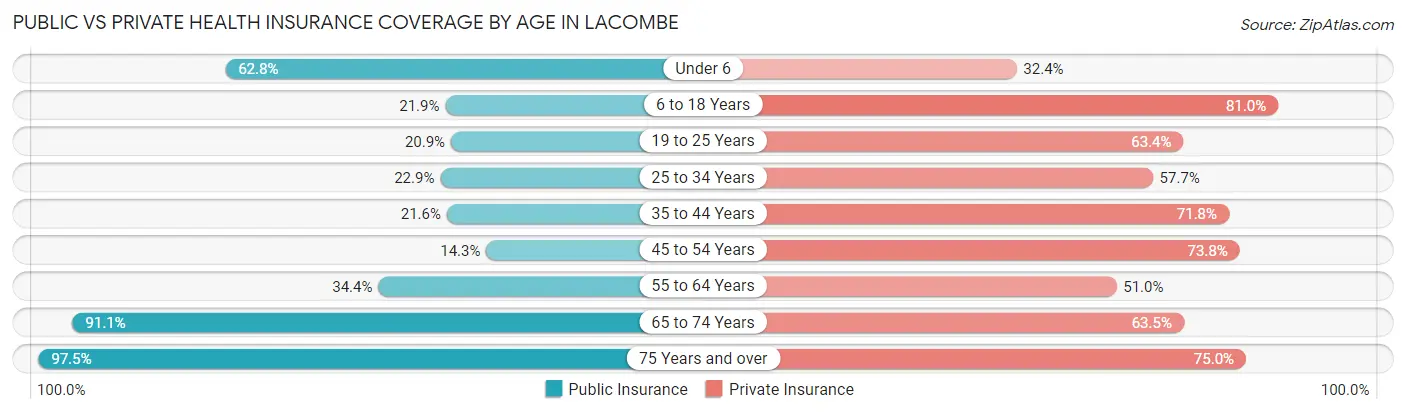
| Age Bracket | Public Insurance | Private Insurance |
| Under 6 | 182 (62.8%) | 94 (32.4%) |
| 6 to 18 Years | 190 (21.9%) | 702 (81.0%) |
| 19 to 25 Years | 102 (20.9%) | 310 (63.4%) |
| 25 to 34 Years | 141 (22.9%) | 356 (57.7%) |
| 35 to 44 Years | 166 (21.6%) | 551 (71.8%) |
| 45 to 54 Years | 129 (14.3%) | 666 (73.8%) |
| 55 to 64 Years | 451 (34.4%) | 669 (50.9%) |
| 65 to 74 Years | 985 (91.1%) | 686 (63.5%) |
| 75 Years and over | 612 (97.5%) | 471 (75.0%) |
| Total | 2,958 (42.5%) | 4,505 (64.8%) |
Disability Status by Sex by Age in Lacombe
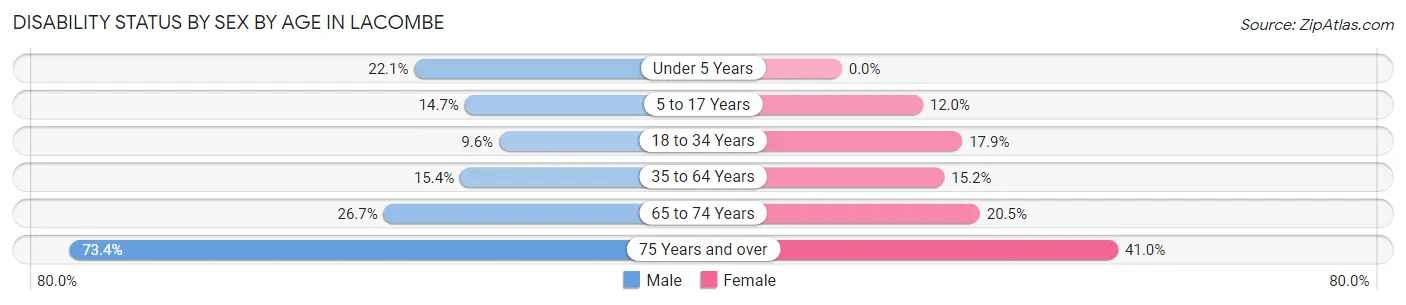
| Age Bracket | Male | Female |
| Under 5 Years | 27 (22.1%) | 0 (0.0%) |
| 5 to 17 Years | 69 (14.6%) | 51 (12.0%) |
| 18 to 34 Years | 72 (9.6%) | 69 (17.9%) |
| 35 to 64 Years | 238 (15.3%) | 218 (15.2%) |
| 65 to 74 Years | 157 (26.7%) | 101 (20.5%) |
| 75 Years and over | 248 (73.4%) | 119 (41.0%) |
Disability Class by Sex by Age in Lacombe
Disability Class: Hearing Difficulty
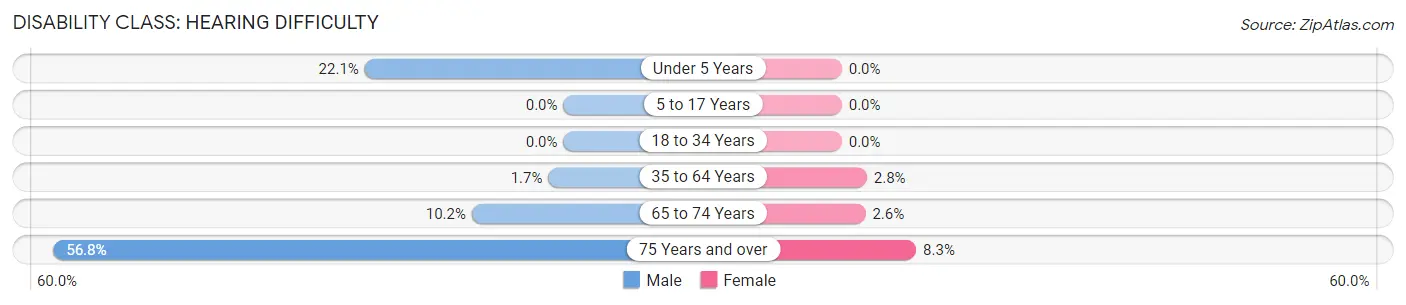
| Age Bracket | Male | Female |
| Under 5 Years | 27 (22.1%) | 0 (0.0%) |
| 5 to 17 Years | 0 (0.0%) | 0 (0.0%) |
| 18 to 34 Years | 0 (0.0%) | 0 (0.0%) |
| 35 to 64 Years | 26 (1.7%) | 40 (2.8%) |
| 65 to 74 Years | 60 (10.2%) | 13 (2.6%) |
| 75 Years and over | 192 (56.8%) | 24 (8.3%) |
Disability Class: Vision Difficulty
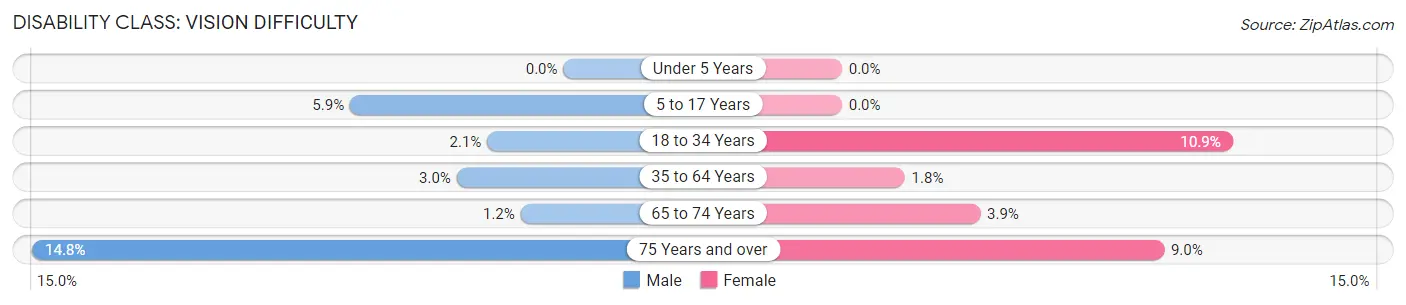
| Age Bracket | Male | Female |
| Under 5 Years | 0 (0.0%) | 0 (0.0%) |
| 5 to 17 Years | 28 (5.9%) | 0 (0.0%) |
| 18 to 34 Years | 16 (2.1%) | 42 (10.9%) |
| 35 to 64 Years | 46 (3.0%) | 25 (1.8%) |
| 65 to 74 Years | 7 (1.2%) | 19 (3.8%) |
| 75 Years and over | 50 (14.8%) | 26 (9.0%) |
Disability Class: Cognitive Difficulty
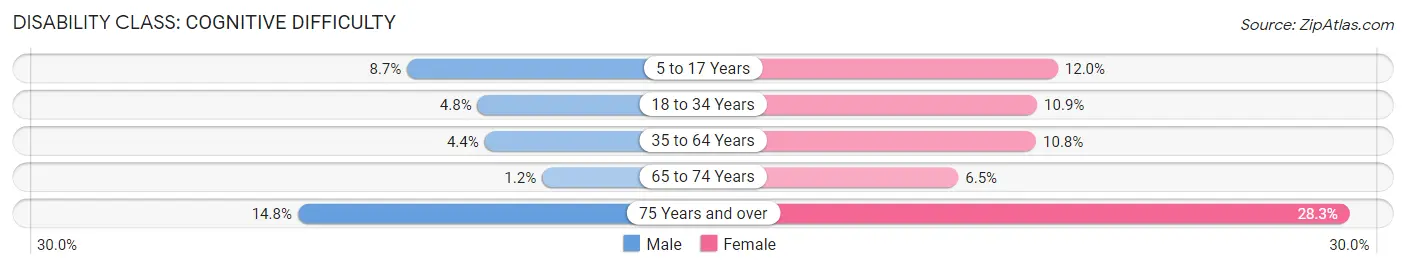
| Age Bracket | Male | Female |
| 5 to 17 Years | 41 (8.7%) | 51 (12.0%) |
| 18 to 34 Years | 36 (4.8%) | 42 (10.9%) |
| 35 to 64 Years | 68 (4.4%) | 155 (10.8%) |
| 65 to 74 Years | 7 (1.2%) | 32 (6.5%) |
| 75 Years and over | 50 (14.8%) | 82 (28.3%) |
Disability Class: Ambulatory Difficulty
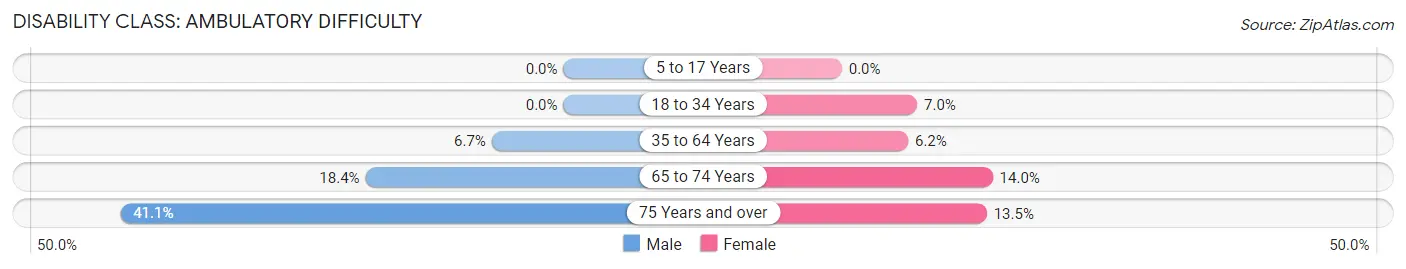
| Age Bracket | Male | Female |
| 5 to 17 Years | 0 (0.0%) | 0 (0.0%) |
| 18 to 34 Years | 0 (0.0%) | 27 (7.0%) |
| 35 to 64 Years | 103 (6.7%) | 88 (6.1%) |
| 65 to 74 Years | 108 (18.4%) | 69 (14.0%) |
| 75 Years and over | 139 (41.1%) | 39 (13.5%) |
Disability Class: Self-Care Difficulty
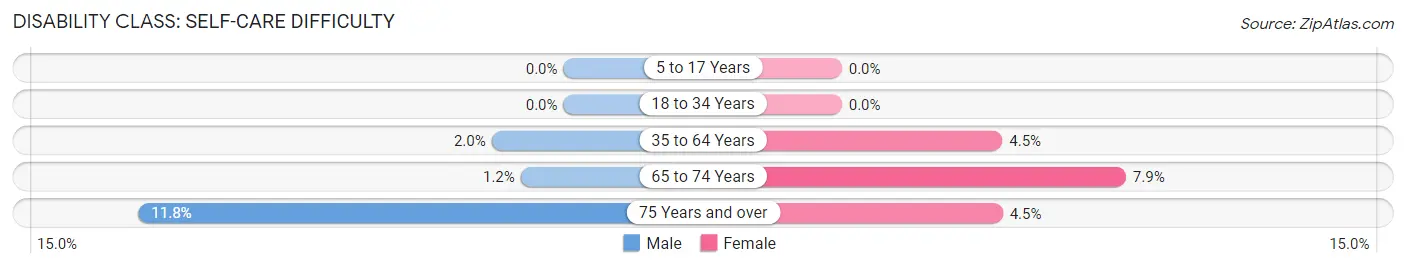
| Age Bracket | Male | Female |
| 5 to 17 Years | 0 (0.0%) | 0 (0.0%) |
| 18 to 34 Years | 0 (0.0%) | 0 (0.0%) |
| 35 to 64 Years | 31 (2.0%) | 64 (4.5%) |
| 65 to 74 Years | 7 (1.2%) | 39 (7.9%) |
| 75 Years and over | 40 (11.8%) | 13 (4.5%) |
Technology Access in Lacombe
Computing Device Access in Lacombe
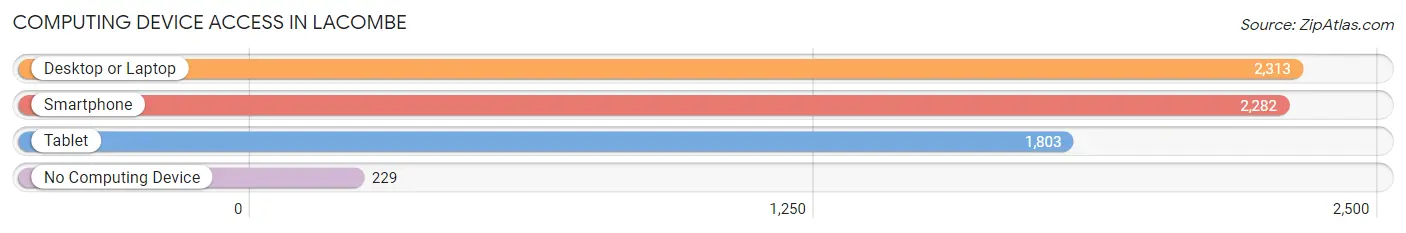
| Device Type | # Households | % Households |
| Desktop or Laptop | 2,313 | 82.3% |
| Smartphone | 2,282 | 81.2% |
| Tablet | 1,803 | 64.1% |
| No Computing Device | 229 | 8.2% |
| Total | 2,811 | 100.0% |
Internet Access in Lacombe
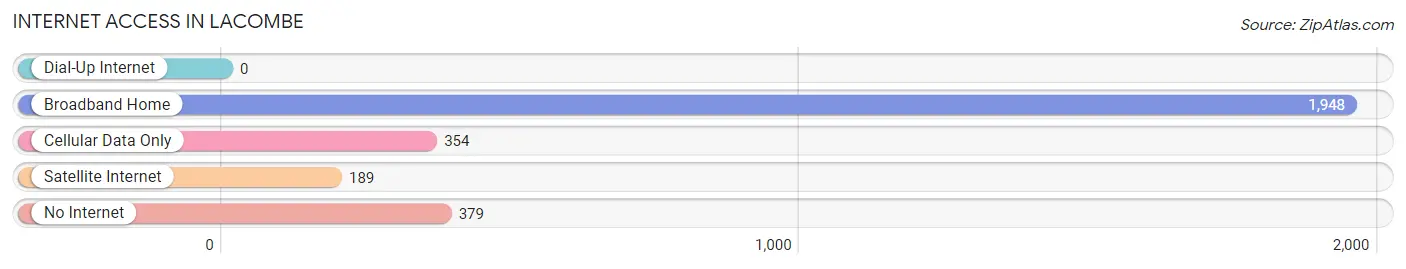
| Internet Type | # Households | % Households |
| Dial-Up Internet | 0 | 0.0% |
| Broadband Home | 1,948 | 69.3% |
| Cellular Data Only | 354 | 12.6% |
| Satellite Internet | 189 | 6.7% |
| No Internet | 379 | 13.5% |
| Total | 2,811 | 100.0% |
Lacombe Summary
Lacombe is a small town located in St. Tammany Parish, Louisiana, United States. It is situated on the north shore of Lake Pontchartrain, about 25 miles north of New Orleans. The population was 8,679 at the 2010 census.
History
Lacombe was founded in 1855 by a group of French-speaking settlers from the nearby town of Abita Springs. The town was named after the French word for “lake”, and was originally a small fishing village. The town grew slowly over the years, and by the early 1900s, it had become a popular summer resort destination for wealthy New Orleanians.
In the 1950s, the town began to experience rapid growth as the nearby city of Slidell began to expand. This growth was further accelerated by the construction of Interstate 12, which connected Lacombe to New Orleans and other nearby cities.
Geography
Lacombe is located at 30°19'25" North, 89°45'45" West (30.323, -89.7625). According to the United States Census Bureau, the town has a total area of 4.2 square miles (10.8 km2), of which 4.1 square miles (10.6 km2) is land and 0.1 square miles (0.2 km2) is water.
Economy
Lacombe’s economy is largely based on tourism and the service industry. The town is home to several restaurants, hotels, and other businesses that cater to visitors. The town is also home to a number of small businesses, including a few retail stores, a hardware store, and a few auto repair shops.
Demographics
As of the 2010 census, there were 8,679 people, 3,093 households, and 2,092 families residing in the town. The population density was 2,092.2 people per square mile (805.3/km2). There were 3,521 housing units at an average density of 860.2 per square mile (332.2/km2). The racial makeup of the town was 79.2% White, 15.2% African American, 0.4% Native American, 0.7% Asian, 0.1% Pacific Islander, 2.2% from other races, and 2.2% from two or more races. Hispanic or Latino of any race were 5.2% of the population.
There were 3,093 households, out of which 33.2% had children under the age of 18 living with them, 48.2% were married couples living together, 14.7% had a female householder with no husband present, and 31.7% were non-families. 25.2% of all households were made up of individuals, and 8.2% had someone living alone who was 65 years of age or older. The average household size was 2.63 and the average family size was 3.17.
In the town, the population was spread out, with 25.7% under the age of 18, 8.7% from 18 to 24, 28.7% from 25 to 44, 24.3% from 45 to 64, and 12.6% who were 65 years of age or older. The median age was 36 years. For every 100 females, there were 97.2 males. For every 100 females age 18 and over, there were 94.2 males.
The median income for a household in the town was $41,944, and the median income for a family was $50,944. Males had a median income of $37,944 versus $25,944 for females. The per capita income for the town was $20,944. About 8.2% of families and 10.2% of the population were below the poverty line, including 14.2% of those under age 18 and 8.2% of those age 65 or over.
Common Questions
What is Per Capita Income in Lacombe?
Per Capita income in Lacombe is $35,664.
What is the Median Family Income in Lacombe?
Median Family Income in Lacombe is $79,877.
What is the Median Household income in Lacombe?
Median Household Income in Lacombe is $61,850.
What is Income or Wage Gap in Lacombe?
Income or Wage Gap in Lacombe is 8.0%.
Women in Lacombe earn 92.0 cents for every dollar earned by a man.
What is Inequality or Gini Index in Lacombe?
Inequality or Gini Index in Lacombe is 0.49.
What is the Total Population of Lacombe?
Total Population of Lacombe is 7,035.
What is the Total Male Population of Lacombe?
Total Male Population of Lacombe is 3,872.
What is the Total Female Population of Lacombe?
Total Female Population of Lacombe is 3,163.
What is the Ratio of Males per 100 Females in Lacombe?
There are 122.42 Males per 100 Females in Lacombe.
What is the Ratio of Females per 100 Males in Lacombe?
There are 81.69 Females per 100 Males in Lacombe.
What is the Median Population Age in Lacombe?
Median Population Age in Lacombe is 52.6 Years.
What is the Average Family Size in Lacombe
Average Family Size in Lacombe is 3.0 People.
What is the Average Household Size in Lacombe
Average Household Size in Lacombe is 2.5 People.
How Large is the Labor Force in Lacombe?
There are 3,420 People in the Labor Forcein in Lacombe.
What is the Percentage of People in the Labor Force in Lacombe?
57.1% of People are in the Labor Force in Lacombe.
What is the Unemployment Rate in Lacombe?
Unemployment Rate in Lacombe is 12.8%.