Kentwood, LA Map & Demographics
Kentwood Map
Kentwood Overview
$21,730
PER CAPITA INCOME
$32,396
AVG FAMILY INCOME
$29,856
AVG HOUSEHOLD INCOME
16.9%
WAGE / INCOME GAP [ % ]
83.1¢/ $1
WAGE / INCOME GAP [ $ ]
0.55
INEQUALITY / GINI INDEX
1,932
TOTAL POPULATION
1,004
MALE POPULATION
928
FEMALE POPULATION
108.19
MALES / 100 FEMALES
92.43
FEMALES / 100 MALES
36.7
MEDIAN AGE
3.9
AVG FAMILY SIZE
3.0
AVG HOUSEHOLD SIZE
634
LABOR FORCE [ PEOPLE ]
40.9%
PERCENT IN LABOR FORCE
15.8%
UNEMPLOYMENT RATE
Kentwood Zip Codes
Kentwood Area Codes
Income in Kentwood
Income Overview in Kentwood
Per Capita Income in Kentwood is $21,730, while median incomes of families and households are $32,396 and $29,856 respectively.
| Characteristic | Number | Measure |
| Per Capita Income | 1,932 | $21,730 |
| Median Family Income | 374 | $32,396 |
| Mean Family Income | 374 | $62,013 |
| Median Household Income | 611 | $29,856 |
| Mean Household Income | 611 | $50,716 |
| Income Deficit | 374 | $0 |
| Wage / Income Gap (%) | 1,932 | 16.93% |
| Wage / Income Gap ($) | 1,932 | 83.07¢ per $1 |
| Gini / Inequality Index | 1,932 | 0.55 |
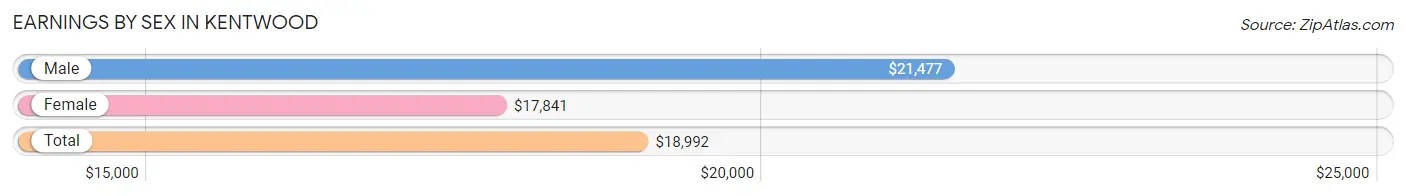
Earnings by Sex in Kentwood
Average Earnings in Kentwood are $18,992, $21,477 for men and $17,841 for women, a difference of 16.9%.
| Sex | Number | Average Earnings |
| Male | 325 (47.3%) | $21,477 |
| Female | 362 (52.7%) | $17,841 |
| Total | 687 (100.0%) | $18,992 |
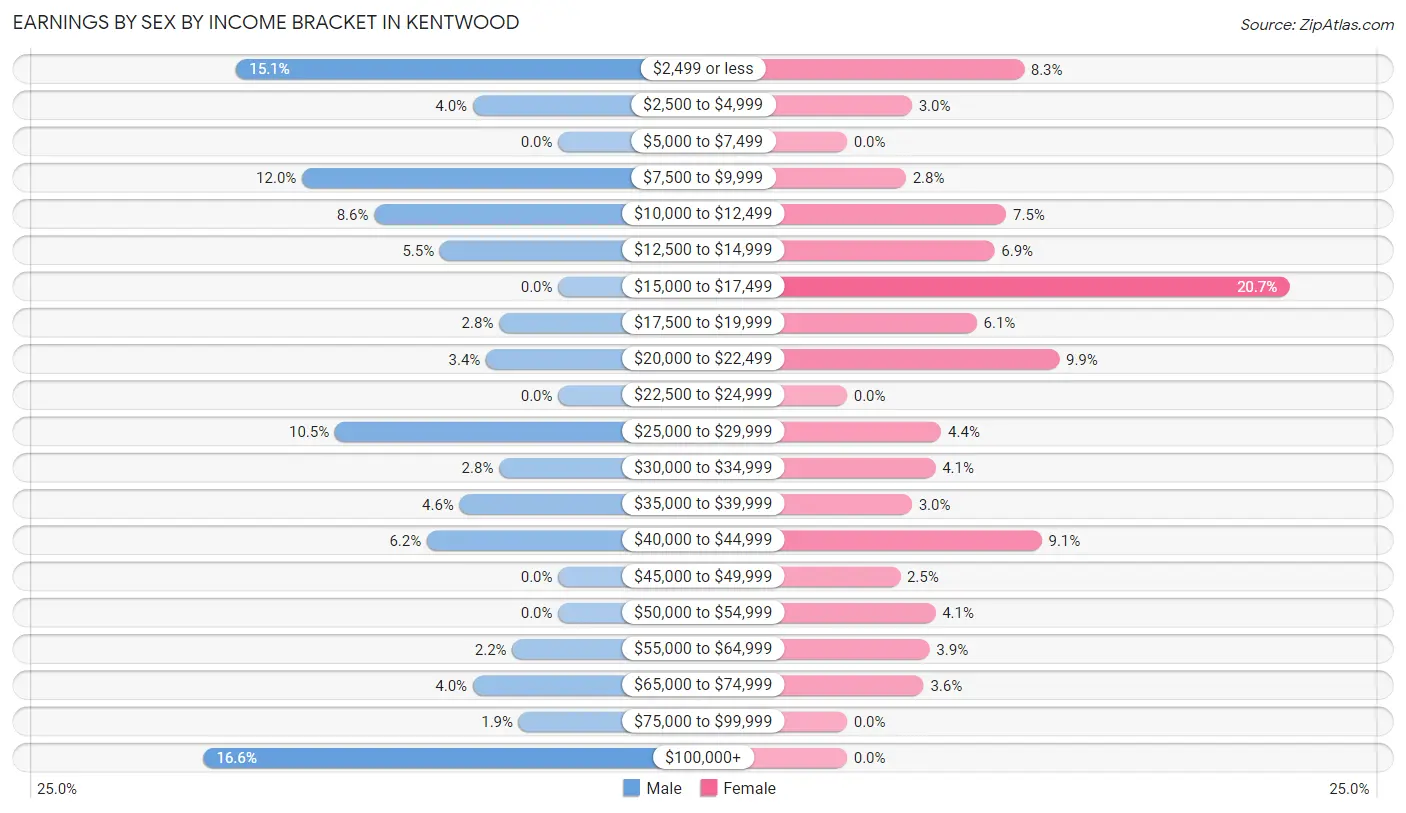
Earnings by Sex by Income Bracket in Kentwood
The most common earnings brackets in Kentwood are $100,000+ for men (54 | 16.6%) and $15,000 to $17,499 for women (75 | 20.7%).
| Income | Male | Female |
| $2,499 or less | 49 (15.1%) | 30 (8.3%) |
| $2,500 to $4,999 | 13 (4.0%) | 11 (3.0%) |
| $5,000 to $7,499 | 0 (0.0%) | 0 (0.0%) |
| $7,500 to $9,999 | 39 (12.0%) | 10 (2.8%) |
| $10,000 to $12,499 | 28 (8.6%) | 27 (7.5%) |
| $12,500 to $14,999 | 18 (5.5%) | 25 (6.9%) |
| $15,000 to $17,499 | 0 (0.0%) | 75 (20.7%) |
| $17,500 to $19,999 | 9 (2.8%) | 22 (6.1%) |
| $20,000 to $22,499 | 11 (3.4%) | 36 (9.9%) |
| $22,500 to $24,999 | 0 (0.0%) | 0 (0.0%) |
| $25,000 to $29,999 | 34 (10.5%) | 16 (4.4%) |
| $30,000 to $34,999 | 9 (2.8%) | 15 (4.1%) |
| $35,000 to $39,999 | 15 (4.6%) | 11 (3.0%) |
| $40,000 to $44,999 | 20 (6.1%) | 33 (9.1%) |
| $45,000 to $49,999 | 0 (0.0%) | 9 (2.5%) |
| $50,000 to $54,999 | 0 (0.0%) | 15 (4.1%) |
| $55,000 to $64,999 | 7 (2.1%) | 14 (3.9%) |
| $65,000 to $74,999 | 13 (4.0%) | 13 (3.6%) |
| $75,000 to $99,999 | 6 (1.8%) | 0 (0.0%) |
| $100,000+ | 54 (16.6%) | 0 (0.0%) |
| Total | 325 (100.0%) | 362 (100.0%) |
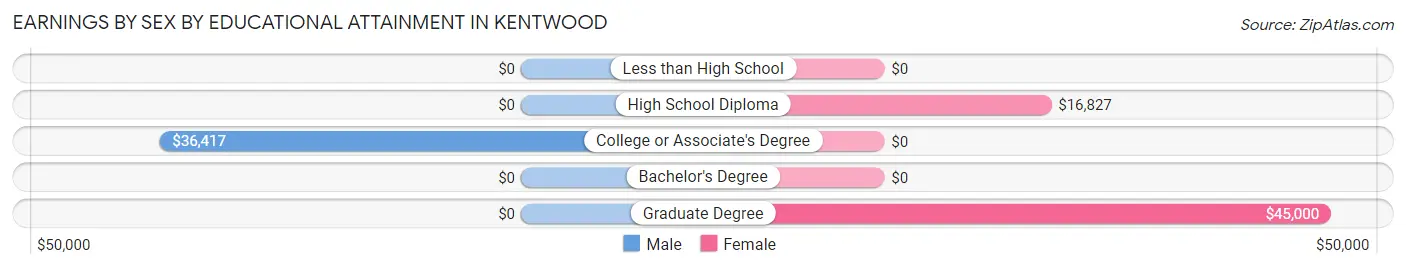
Earnings by Sex by Educational Attainment in Kentwood
Average earnings in Kentwood are $28,750 for men and $17,500 for women, a difference of 39.1%. Men with an educational attainment of college or associate's degree enjoy the highest average annual earnings of $36,417, while those with college or associate's degree education earn the least with $36,417. Women with an educational attainment of graduate degree earn the most with the average annual earnings of $45,000, while those with high school diploma education have the smallest earnings of $16,827.
| Educational Attainment | Male Income | Female Income |
| Less than High School | - | - |
| High School Diploma | - | - |
| College or Associate's Degree | $36,417 | $0 |
| Bachelor's Degree | - | - |
| Graduate Degree | - | - |
| Total | $28,750 | $17,500 |
Family Income in Kentwood
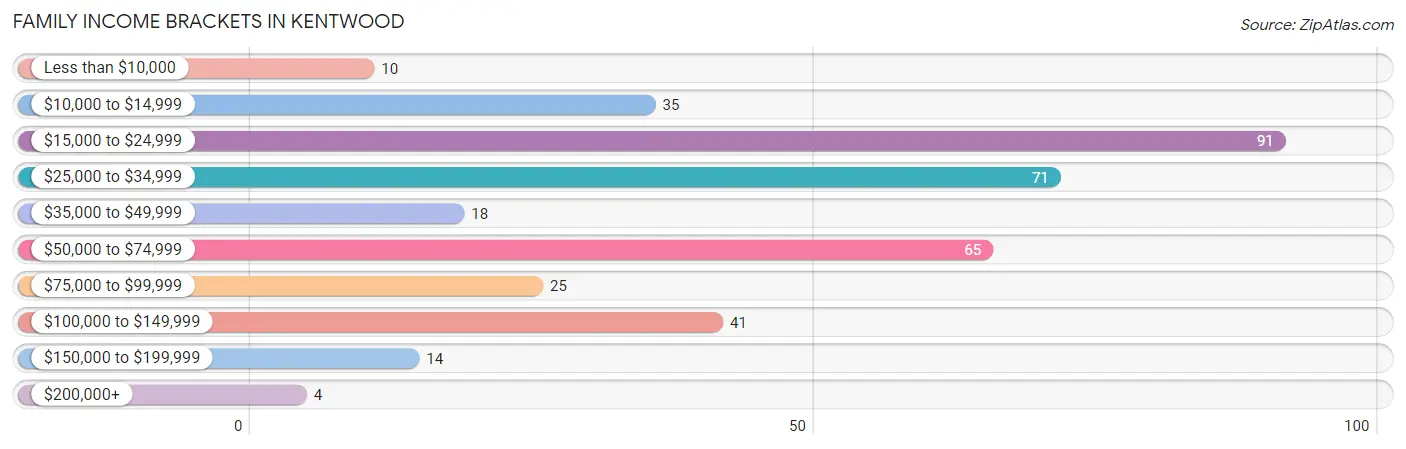
Family Income Brackets in Kentwood
According to the Kentwood family income data, there are 91 families falling into the $15,000 to $24,999 income range, which is the most common income bracket and makes up 24.3% of all families. Conversely, the $200,000+ income bracket is the least frequent group with only 4 families (1.1%) belonging to this category.
| Income Bracket | # Families | % Families |
| Less than $10,000 | 10 | 2.7% |
| $10,000 to $14,999 | 35 | 9.4% |
| $15,000 to $24,999 | 91 | 24.3% |
| $25,000 to $34,999 | 71 | 19.0% |
| $35,000 to $49,999 | 18 | 4.8% |
| $50,000 to $74,999 | 65 | 17.4% |
| $75,000 to $99,999 | 25 | 6.7% |
| $100,000 to $149,999 | 41 | 11.0% |
| $150,000 to $199,999 | 14 | 3.7% |
| $200,000+ | 4 | 1.1% |
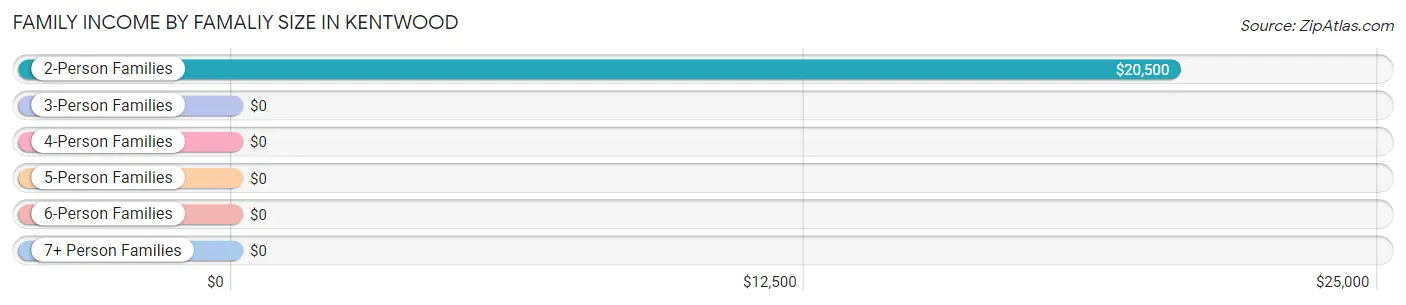
Family Income by Famaliy Size in Kentwood
2-person families (162 | 43.3%) account for the highest median family income in Kentwood with $20,500 per family, while 2-person families (162 | 43.3%) have the highest median income of $10,250 per family member.
| Income Bracket | # Families | Median Income |
| 2-Person Families | 162 (43.3%) | $20,500 |
| 3-Person Families | 105 (28.1%) | $0 |
| 4-Person Families | 45 (12.0%) | $0 |
| 5-Person Families | 48 (12.8%) | $0 |
| 6-Person Families | 14 (3.7%) | $0 |
| 7+ Person Families | 0 (0.0%) | $0 |
| Total | 374 (100.0%) | $32,396 |
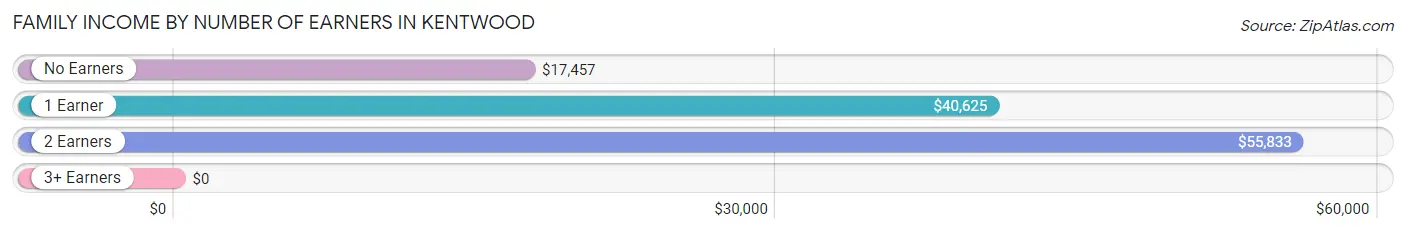
Family Income by Number of Earners in Kentwood
| Number of Earners | # Families | Median Income |
| No Earners | 139 (37.2%) | $17,457 |
| 1 Earner | 133 (35.6%) | $40,625 |
| 2 Earners | 72 (19.3%) | $55,833 |
| 3+ Earners | 30 (8.0%) | $0 |
| Total | 374 (100.0%) | $32,396 |
Household Income in Kentwood
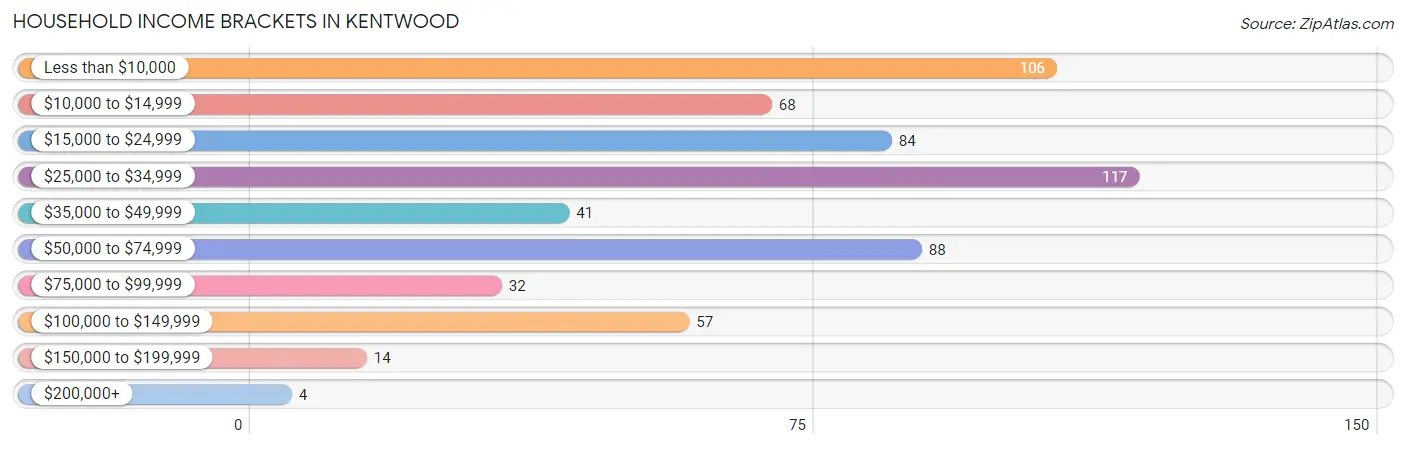
Household Income Brackets in Kentwood
With 117 households falling in the category, the $25,000 to $34,999 income range is the most frequent in Kentwood, accounting for 19.2% of all households. In contrast, only 4 households (0.6%) fall into the $200,000+ income bracket, making it the least populous group.
| Income Bracket | # Households | % Households |
| Less than $10,000 | 106 | 17.3% |
| $10,000 to $14,999 | 68 | 11.1% |
| $15,000 to $24,999 | 84 | 13.7% |
| $25,000 to $34,999 | 117 | 19.1% |
| $35,000 to $49,999 | 41 | 6.7% |
| $50,000 to $74,999 | 88 | 14.4% |
| $75,000 to $99,999 | 32 | 5.2% |
| $100,000 to $149,999 | 57 | 9.3% |
| $150,000 to $199,999 | 14 | 2.3% |
| $200,000+ | 4 | 0.7% |
Household Income by Householder Age in Kentwood
The median household income in Kentwood is $29,856, with the highest median household income of $30,885 found in the 65+ years age bracket for the primary householder. A total of 257 households (42.1%) fall into this category. Meanwhile, the 15 to 24 years age bracket for the primary householder has the lowest median household income of $0, with 5 households (0.8%) in this group.
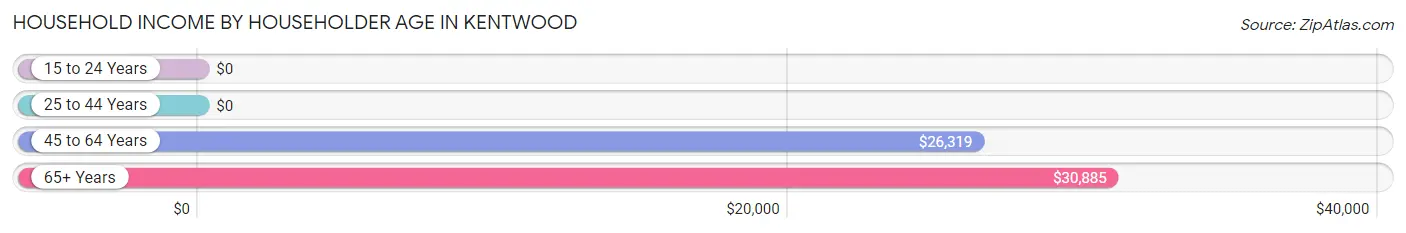
| Income Bracket | # Households | Median Income |
| 15 to 24 Years | 5 (0.8%) | $0 |
| 25 to 44 Years | 166 (27.2%) | $0 |
| 45 to 64 Years | 183 (29.9%) | $26,319 |
| 65+ Years | 257 (42.1%) | $30,885 |
| Total | 611 (100.0%) | $29,856 |
Poverty in Kentwood
Income Below Poverty by Sex and Age in Kentwood
With 28.6% poverty level for males and 27.7% for females among the residents of Kentwood, 6 to 11 year old males and under 5 year old females are the most vulnerable to poverty, with 49 males (55.7%) and 8 females (100.0%) in their respective age groups living below the poverty level.
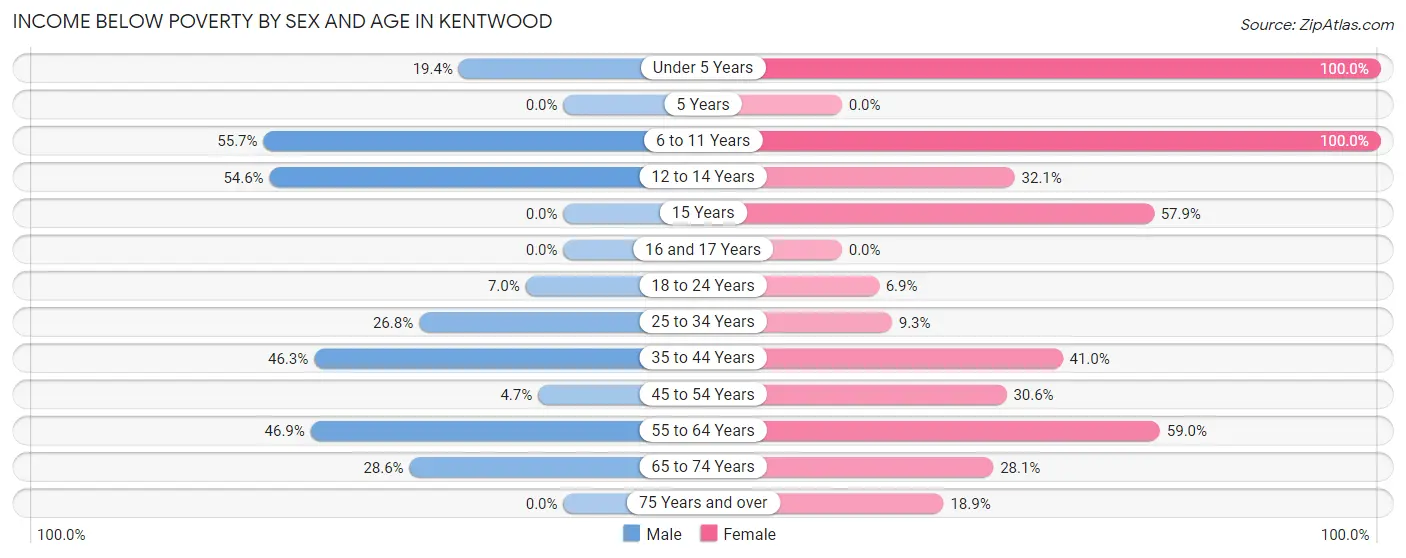
| Age Bracket | Male | Female |
| Under 5 Years | 20 (19.4%) | 8 (100.0%) |
| 5 Years | 0 (0.0%) | 0 (0.0%) |
| 6 to 11 Years | 49 (55.7%) | 9 (100.0%) |
| 12 to 14 Years | 36 (54.5%) | 17 (32.1%) |
| 15 Years | 0 (0.0%) | 11 (57.9%) |
| 16 and 17 Years | 0 (0.0%) | 0 (0.0%) |
| 18 to 24 Years | 4 (7.0%) | 5 (6.9%) |
| 25 to 34 Years | 26 (26.8%) | 18 (9.3%) |
| 35 to 44 Years | 56 (46.3%) | 59 (41.0%) |
| 45 to 54 Years | 6 (4.7%) | 11 (30.6%) |
| 55 to 64 Years | 38 (46.9%) | 49 (59.0%) |
| 65 to 74 Years | 44 (28.6%) | 43 (28.1%) |
| 75 Years and over | 0 (0.0%) | 10 (18.9%) |
| Total | 279 (28.6%) | 240 (27.7%) |
Income Above Poverty by Sex and Age in Kentwood
According to the poverty statistics in Kentwood, males aged 5 years and females aged 5 years are the age groups that are most secure financially, with 100.0% of males and 100.0% of females in these age groups living above the poverty line.
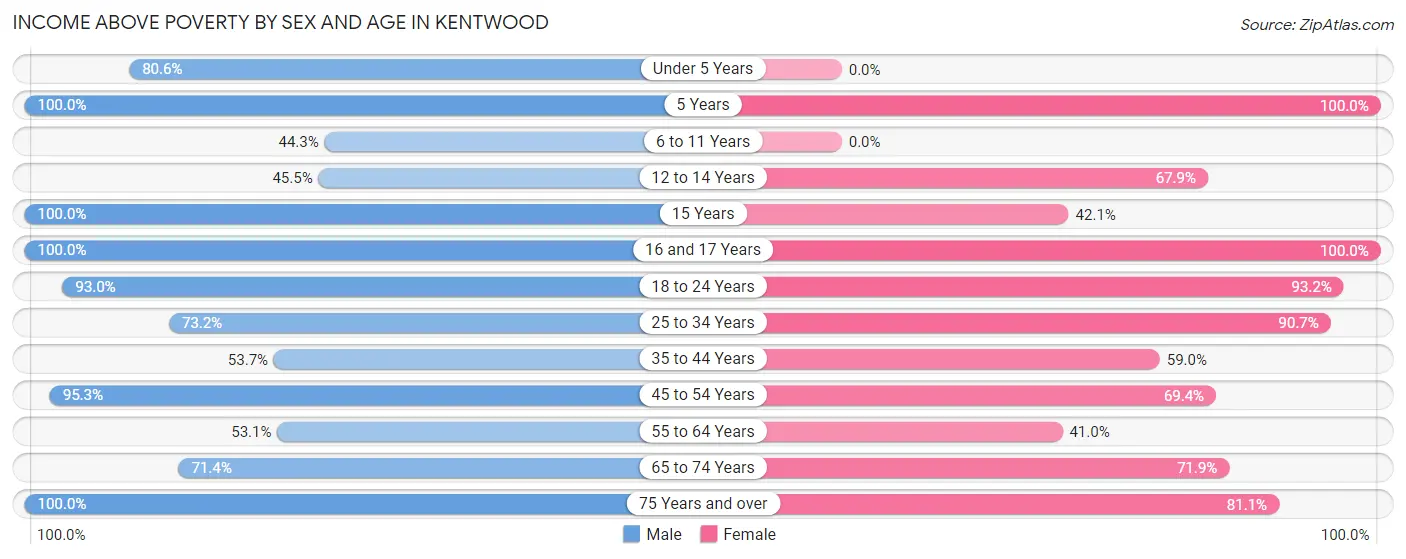
| Age Bracket | Male | Female |
| Under 5 Years | 83 (80.6%) | 0 (0.0%) |
| 5 Years | 4 (100.0%) | 12 (100.0%) |
| 6 to 11 Years | 39 (44.3%) | 0 (0.0%) |
| 12 to 14 Years | 30 (45.5%) | 36 (67.9%) |
| 15 Years | 20 (100.0%) | 8 (42.1%) |
| 16 and 17 Years | 33 (100.0%) | 31 (100.0%) |
| 18 to 24 Years | 53 (93.0%) | 68 (93.1%) |
| 25 to 34 Years | 71 (73.2%) | 176 (90.7%) |
| 35 to 44 Years | 65 (53.7%) | 85 (59.0%) |
| 45 to 54 Years | 122 (95.3%) | 25 (69.4%) |
| 55 to 64 Years | 43 (53.1%) | 34 (41.0%) |
| 65 to 74 Years | 110 (71.4%) | 110 (71.9%) |
| 75 Years and over | 24 (100.0%) | 43 (81.1%) |
| Total | 697 (71.4%) | 628 (72.4%) |
Income Below Poverty Among Married-Couple Families in Kentwood
The poverty statistics for married-couple families in Kentwood show that 24.1% or 40 of the total 166 families live below the poverty line. Families with 3 or 4 children have the highest poverty rate of 47.2%, comprising of 17 families. On the other hand, families with 1 or 2 children have the lowest poverty rate of 0.0%, which includes 0 families.
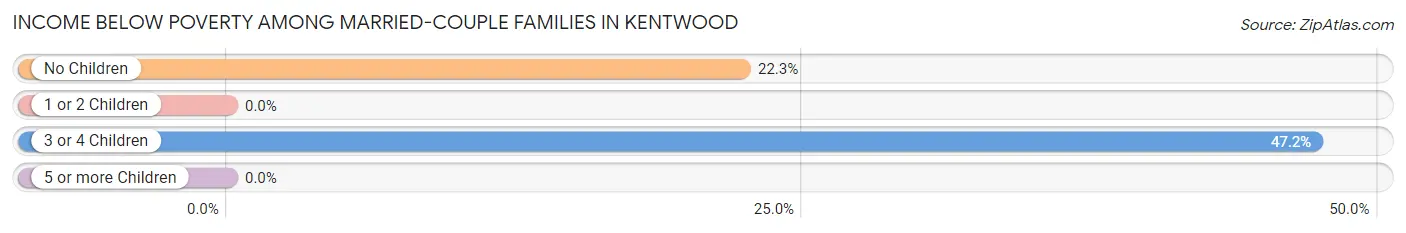
| Children | Above Poverty | Below Poverty |
| No Children | 80 (77.7%) | 23 (22.3%) |
| 1 or 2 Children | 27 (100.0%) | 0 (0.0%) |
| 3 or 4 Children | 19 (52.8%) | 17 (47.2%) |
| 5 or more Children | 0 (0.0%) | 0 (0.0%) |
| Total | 126 (75.9%) | 40 (24.1%) |
Income Below Poverty Among Single-Parent Households in Kentwood
According to the poverty data in Kentwood, 100.0% or 18 single-father households and 27.9% or 53 single-mother households are living below the poverty line. Among single-father households, those with 1 or 2 children have the highest poverty rate, with 18 households (100.0%) experiencing poverty. Likewise, among single-mother households, those with 1 or 2 children have the highest poverty rate, with 26 households (32.1%) falling below the poverty line.
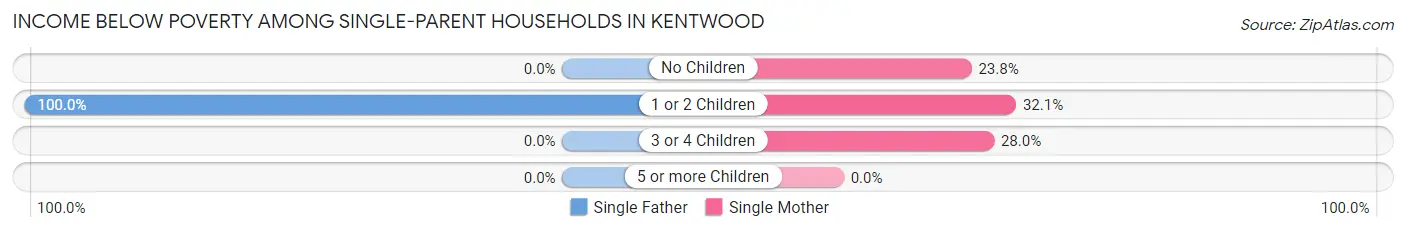
| Children | Single Father | Single Mother |
| No Children | 0 (0.0%) | 20 (23.8%) |
| 1 or 2 Children | 18 (100.0%) | 26 (32.1%) |
| 3 or 4 Children | 0 (0.0%) | 7 (28.0%) |
| 5 or more Children | 0 (0.0%) | 0 (0.0%) |
| Total | 18 (100.0%) | 53 (27.9%) |
Income Below Poverty Among Married-Couple vs Single-Parent Households in Kentwood
The poverty data for Kentwood shows that 40 of the married-couple family households (24.1%) and 71 of the single-parent households (34.1%) are living below the poverty level. Within the married-couple family households, those with 3 or 4 children have the highest poverty rate, with 17 households (47.2%) falling below the poverty line. Among the single-parent households, those with 1 or 2 children have the highest poverty rate, with 44 household (44.4%) living below poverty.
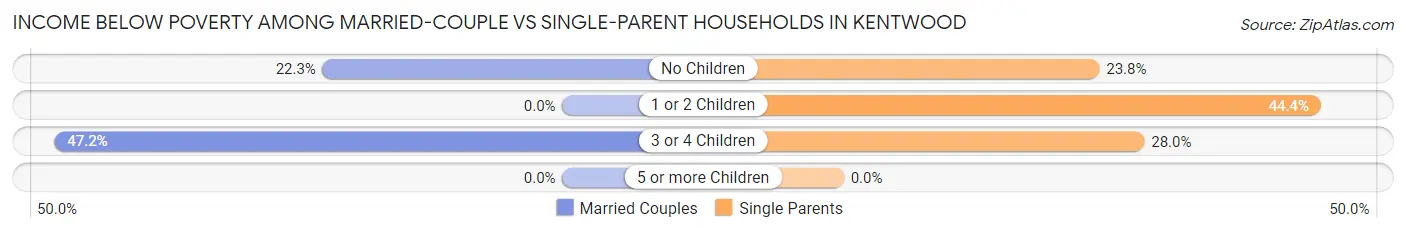
| Children | Married-Couple Families | Single-Parent Households |
| No Children | 23 (22.3%) | 20 (23.8%) |
| 1 or 2 Children | 0 (0.0%) | 44 (44.4%) |
| 3 or 4 Children | 17 (47.2%) | 7 (28.0%) |
| 5 or more Children | 0 (0.0%) | 0 (0.0%) |
| Total | 40 (24.1%) | 71 (34.1%) |
Race in Kentwood
The most populous races in Kentwood are Black / African American (1,213 | 62.8%), White / Caucasian (593 | 30.7%), and Two or more Races (126 | 6.5%).
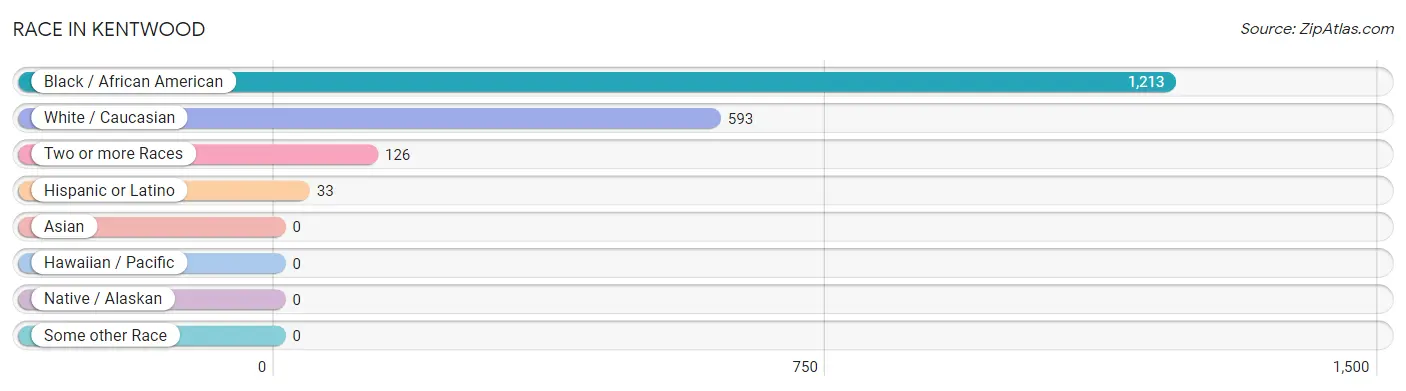
| Race | # Population | % Population |
| Asian | 0 | 0.0% |
| Black / African American | 1,213 | 62.8% |
| Hawaiian / Pacific | 0 | 0.0% |
| Hispanic or Latino | 33 | 1.7% |
| Native / Alaskan | 0 | 0.0% |
| White / Caucasian | 593 | 30.7% |
| Two or more Races | 126 | 6.5% |
| Some other Race | 0 | 0.0% |
| Total | 1,932 | 100.0% |
Ancestry in Kentwood
The most populous ancestries reported in Kentwood are American (166 | 8.6%), English (95 | 4.9%), French (45 | 2.3%), Colombian (29 | 1.5%), and South American (29 | 1.5%), together accounting for 18.8% of all Kentwood residents.
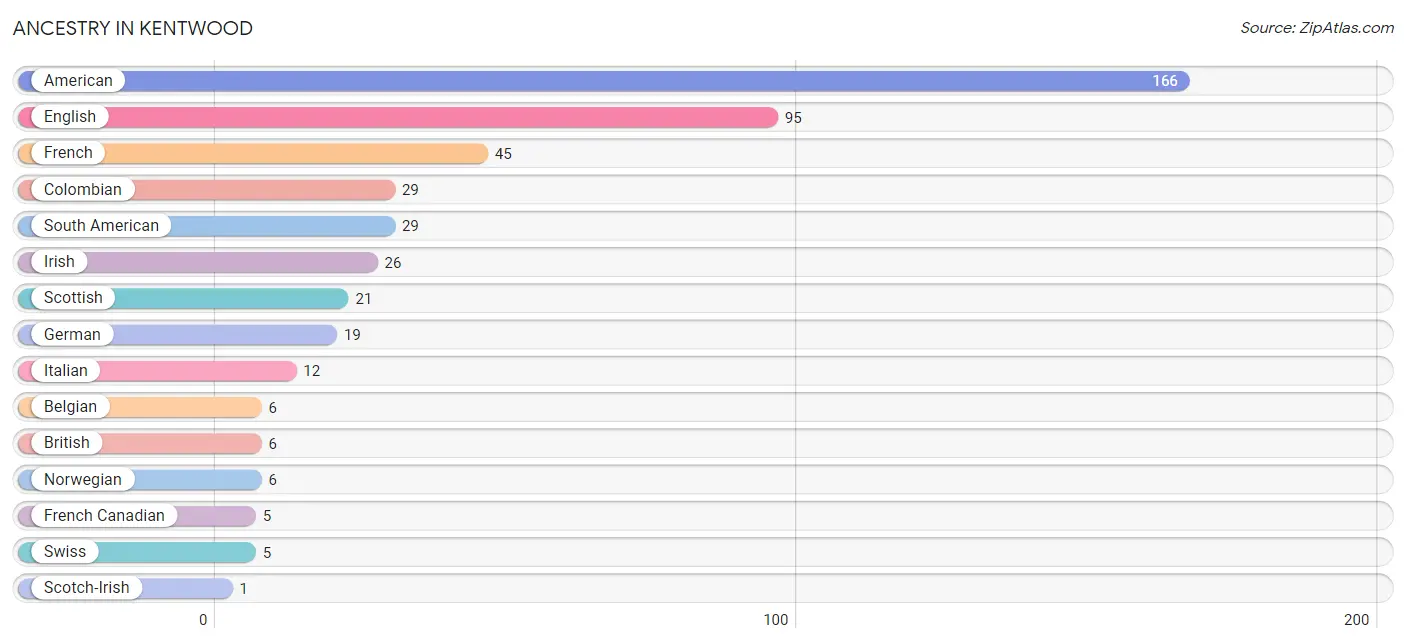
| Ancestry | # Population | % Population |
| American | 166 | 8.6% |
| Belgian | 6 | 0.3% |
| British | 6 | 0.3% |
| Colombian | 29 | 1.5% |
| English | 95 | 4.9% |
| French | 45 | 2.3% |
| French Canadian | 5 | 0.3% |
| German | 19 | 1.0% |
| Irish | 26 | 1.3% |
| Italian | 12 | 0.6% |
| Norwegian | 6 | 0.3% |
| Scotch-Irish | 1 | 0.1% |
| Scottish | 21 | 1.1% |
| South American | 29 | 1.5% |
| Swiss | 5 | 0.3% | View All 15 Rows |
Immigrants in Kentwood
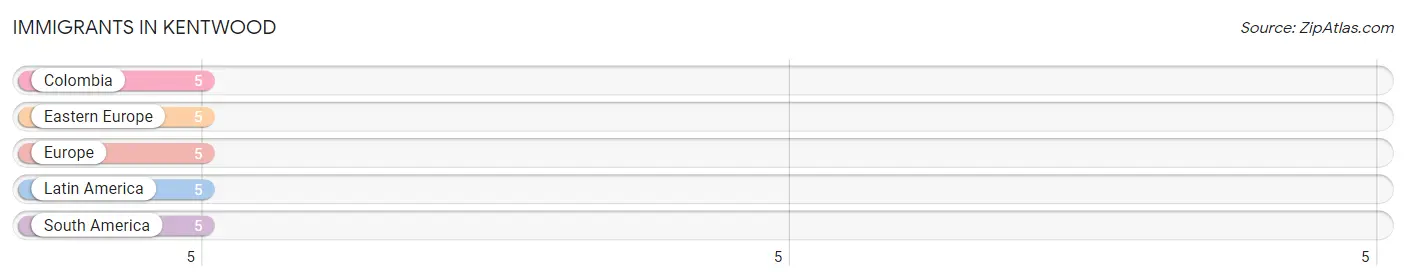
The most numerous immigrant groups reported in Kentwood came from Colombia (5 | 0.3%), Eastern Europe (5 | 0.3%), Europe (5 | 0.3%), Latin America (5 | 0.3%), and South America (5 | 0.3%), together accounting for 1.3% of all Kentwood residents.
| Immigration Origin | # Population | % Population |
| Colombia | 5 | 0.3% |
| Eastern Europe | 5 | 0.3% |
| Europe | 5 | 0.3% |
| Latin America | 5 | 0.3% |
| South America | 5 | 0.3% | View All 5 Rows |
Sex and Age in Kentwood
Sex and Age in Kentwood
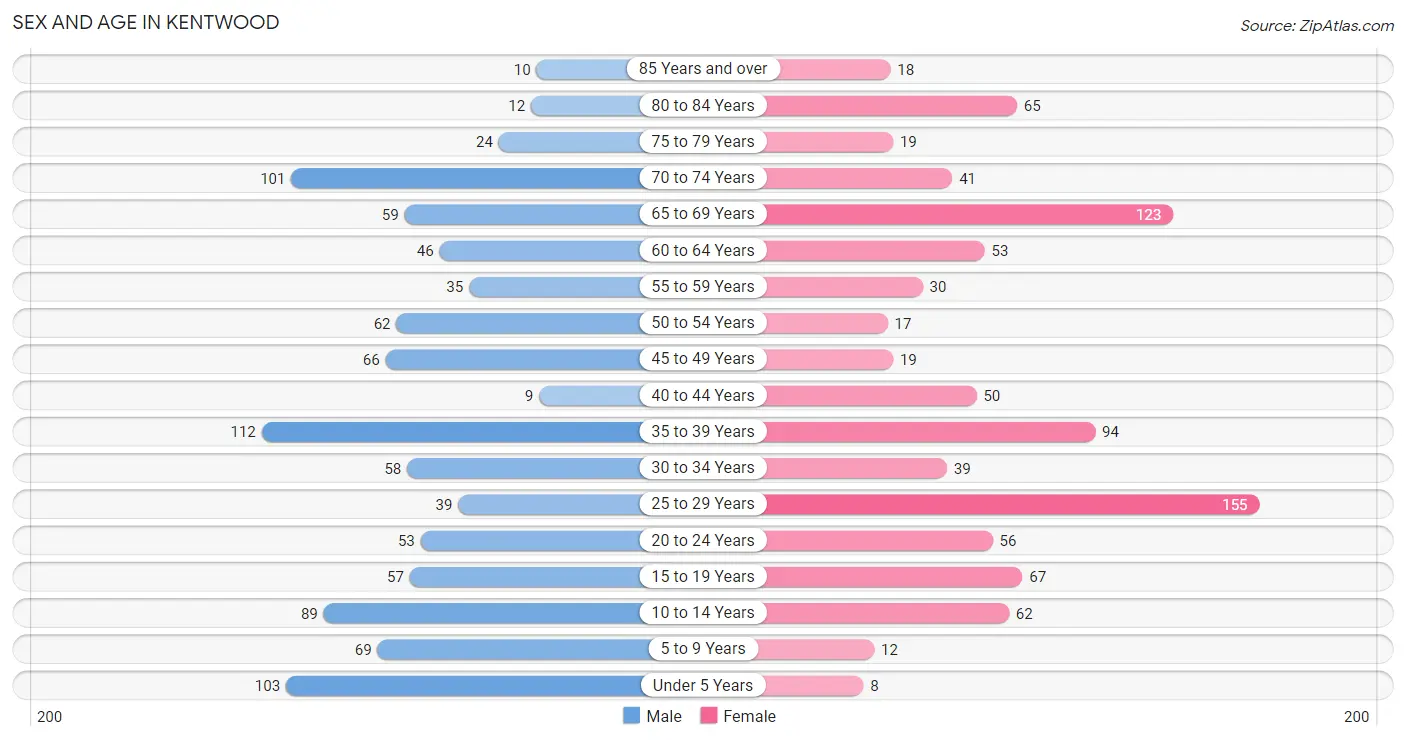
The most populous age groups in Kentwood are 35 to 39 Years (112 | 11.2%) for men and 25 to 29 Years (155 | 16.7%) for women.
| Age Bracket | Male | Female |
| Under 5 Years | 103 (10.3%) | 8 (0.9%) |
| 5 to 9 Years | 69 (6.9%) | 12 (1.3%) |
| 10 to 14 Years | 89 (8.9%) | 62 (6.7%) |
| 15 to 19 Years | 57 (5.7%) | 67 (7.2%) |
| 20 to 24 Years | 53 (5.3%) | 56 (6.0%) |
| 25 to 29 Years | 39 (3.9%) | 155 (16.7%) |
| 30 to 34 Years | 58 (5.8%) | 39 (4.2%) |
| 35 to 39 Years | 112 (11.2%) | 94 (10.1%) |
| 40 to 44 Years | 9 (0.9%) | 50 (5.4%) |
| 45 to 49 Years | 66 (6.6%) | 19 (2.1%) |
| 50 to 54 Years | 62 (6.2%) | 17 (1.8%) |
| 55 to 59 Years | 35 (3.5%) | 30 (3.2%) |
| 60 to 64 Years | 46 (4.6%) | 53 (5.7%) |
| 65 to 69 Years | 59 (5.9%) | 123 (13.3%) |
| 70 to 74 Years | 101 (10.1%) | 41 (4.4%) |
| 75 to 79 Years | 24 (2.4%) | 19 (2.1%) |
| 80 to 84 Years | 12 (1.2%) | 65 (7.0%) |
| 85 Years and over | 10 (1.0%) | 18 (1.9%) |
| Total | 1,004 (100.0%) | 928 (100.0%) |
Families and Households in Kentwood
Median Family Size in Kentwood
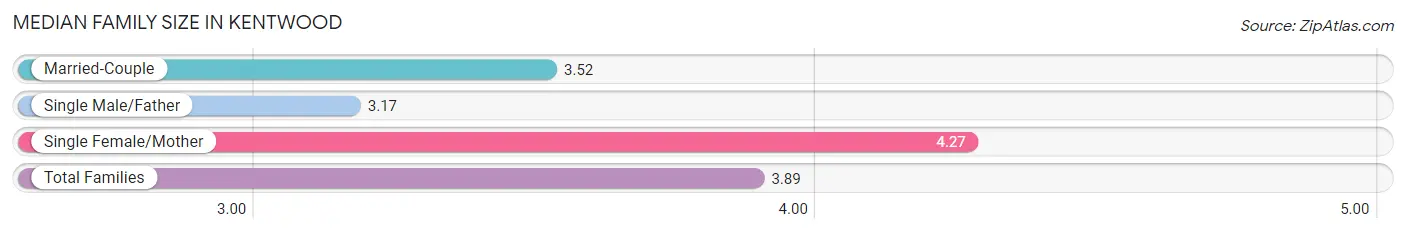
The median family size in Kentwood is 3.89 persons per family, with single female/mother families (190 | 50.8%) accounting for the largest median family size of 4.27 persons per family. On the other hand, single male/father families (18 | 4.8%) represent the smallest median family size with 3.17 persons per family.
| Family Type | # Families | Family Size |
| Married-Couple | 166 (44.4%) | 3.52 |
| Single Male/Father | 18 (4.8%) | 3.17 |
| Single Female/Mother | 190 (50.8%) | 4.27 |
| Total Families | 374 (100.0%) | 3.89 |
Median Household Size in Kentwood
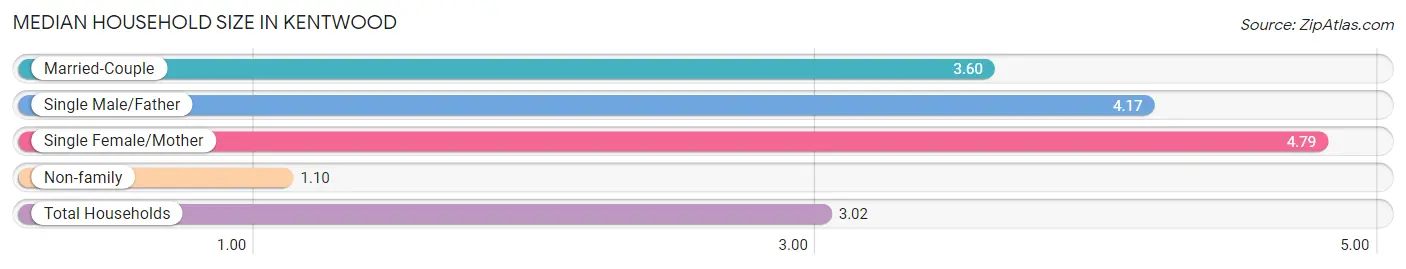
The median household size in Kentwood is 3.02 persons per household, with single female/mother households (190 | 31.1%) accounting for the largest median household size of 4.79 persons per household. non-family households (237 | 38.8%) represent the smallest median household size with 1.10 persons per household.
| Household Type | # Households | Household Size |
| Married-Couple | 166 (27.2%) | 3.60 |
| Single Male/Father | 18 (2.9%) | 4.17 |
| Single Female/Mother | 190 (31.1%) | 4.79 |
| Non-family | 237 (38.8%) | 1.10 |
| Total Households | 611 (100.0%) | 3.02 |
Household Size by Marriage Status in Kentwood
Out of a total of 611 households in Kentwood, 374 (61.2%) are family households, while 237 (38.8%) are nonfamily households. The most numerous type of family households are 2-person households, comprising 138, and the most common type of nonfamily households are 1-person households, comprising 219.
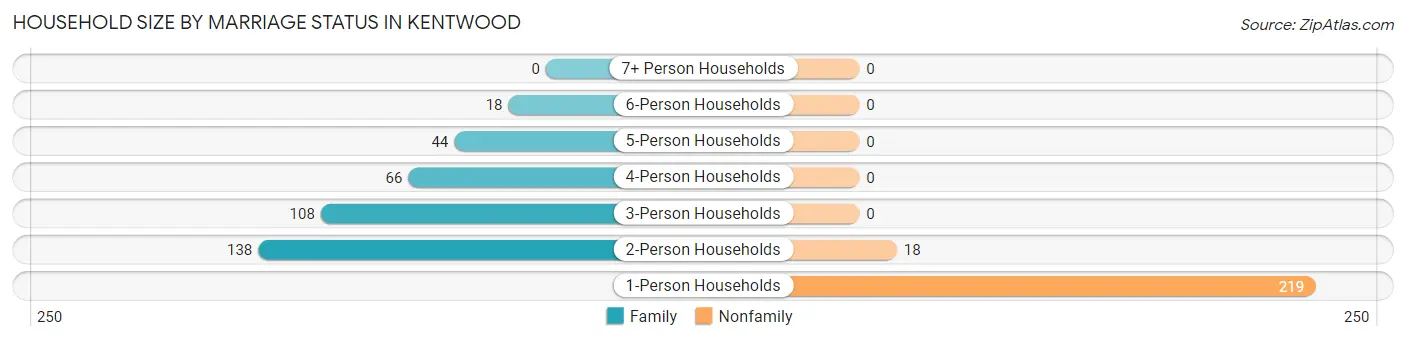
| Household Size | Family Households | Nonfamily Households |
| 1-Person Households | - | 219 (35.8%) |
| 2-Person Households | 138 (22.6%) | 18 (2.9%) |
| 3-Person Households | 108 (17.7%) | 0 (0.0%) |
| 4-Person Households | 66 (10.8%) | 0 (0.0%) |
| 5-Person Households | 44 (7.2%) | 0 (0.0%) |
| 6-Person Households | 18 (2.9%) | 0 (0.0%) |
| 7+ Person Households | 0 (0.0%) | 0 (0.0%) |
| Total | 374 (61.2%) | 237 (38.8%) |
Female Fertility in Kentwood
Fertility by Age in Kentwood
Average fertility rate in Kentwood is 21.0 births per 1,000 women. Women in the age bracket of 35 to 50 years have the highest fertility rate with 31.0 births per 1,000 women. Women in the age bracket of 20 to 34 years acount for 50.0% of all women with births.
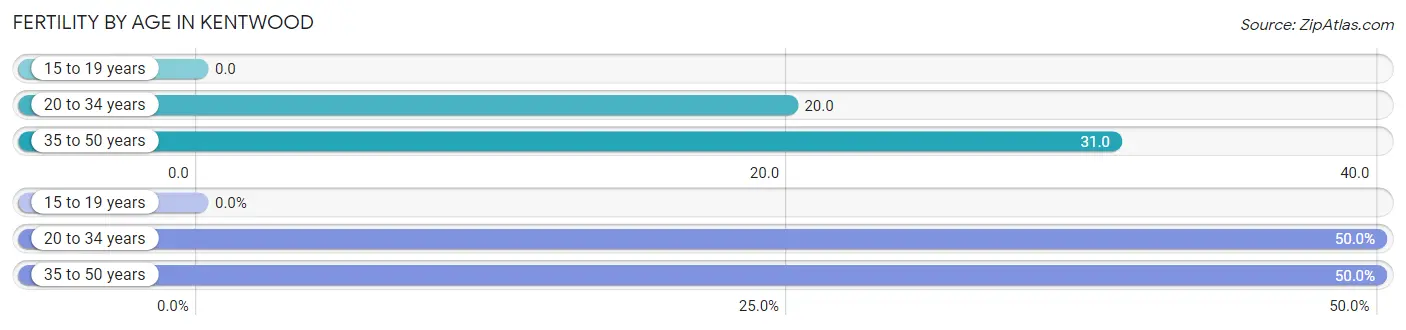
| Age Bracket | Women with Births | Births / 1,000 Women |
| 15 to 19 years | 0 (0.0%) | 0.0 |
| 20 to 34 years | 5 (50.0%) | 20.0 |
| 35 to 50 years | 5 (50.0%) | 31.0 |
| Total | 10 (100.0%) | 21.0 |
Fertility by Age by Marriage Status in Kentwood
50.0% of women with births (10) in Kentwood are married. The highest percentage of unmarried women with births falls into 20 to 34 years age bracket with 100.0% of them unmarried at the time of birth, while the lowest percentage of unmarried women with births belong to 35 to 50 years age bracket with 0.0% of them unmarried.
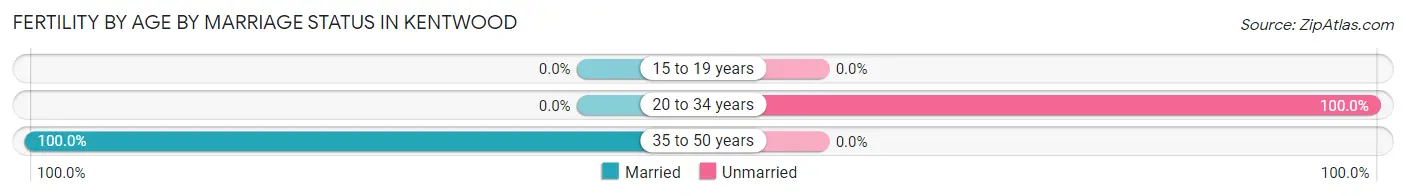
| Age Bracket | Married | Unmarried |
| 15 to 19 years | 0 (0.0%) | 0 (0.0%) |
| 20 to 34 years | 0 (0.0%) | 5 (100.0%) |
| 35 to 50 years | 5 (100.0%) | 0 (0.0%) |
| Total | 5 (50.0%) | 5 (50.0%) |
Fertility by Education in Kentwood
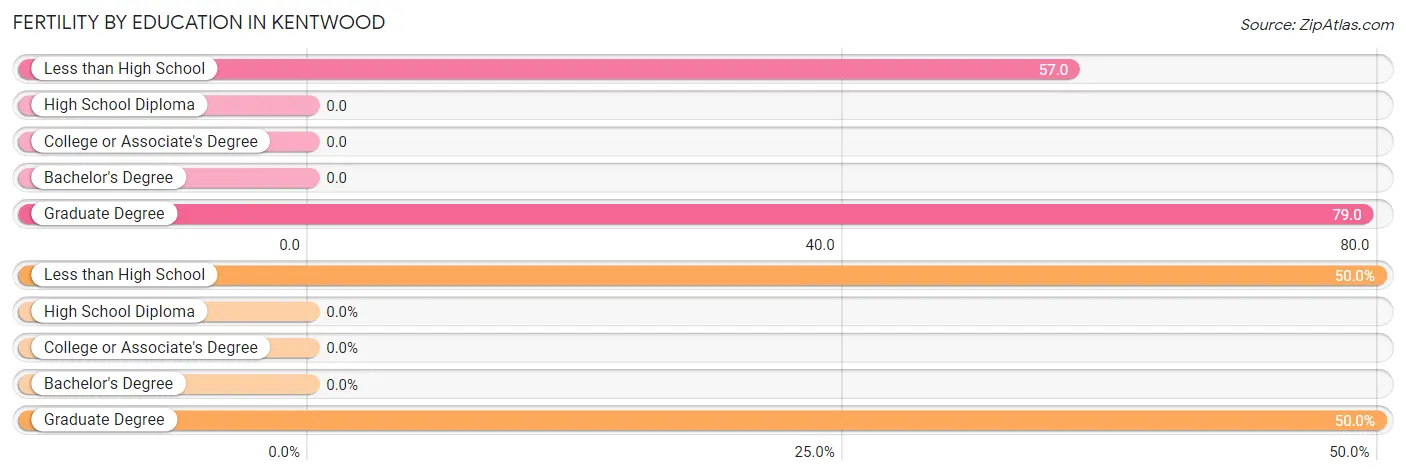
| Educational Attainment | Women with Births | Births / 1,000 Women |
| Less than High School | 5 (50.0%) | 57.0 |
| High School Diploma | 0 (0.0%) | 0.0 |
| College or Associate's Degree | 0 (0.0%) | 0.0 |
| Bachelor's Degree | 0 (0.0%) | 0.0 |
| Graduate Degree | 5 (50.0%) | 79.0 |
| Total | 10 (100.0%) | 21.0 |
Fertility by Education by Marriage Status in Kentwood
50.0% of women with births in Kentwood are unmarried. Women with the educational attainment of graduate degree are most likely to be married with 100.0% of them married at childbirth, while women with the educational attainment of less than high school are least likely to be married with 100.0% of them unmarried at childbirth.
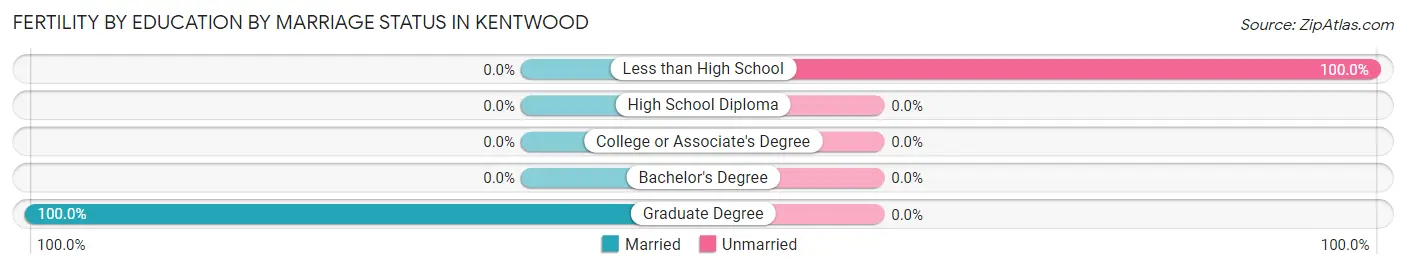
| Educational Attainment | Married | Unmarried |
| Less than High School | 0 (0.0%) | 5 (100.0%) |
| High School Diploma | 0 (0.0%) | 0 (0.0%) |
| College or Associate's Degree | 0 (0.0%) | 0 (0.0%) |
| Bachelor's Degree | 0 (0.0%) | 0 (0.0%) |
| Graduate Degree | 5 (100.0%) | 0 (0.0%) |
| Total | 5 (50.0%) | 5 (50.0%) |
Employment Characteristics in Kentwood
Employment by Class of Employer in Kentwood
Among the 524 employed individuals in Kentwood, private company employees (430 | 82.1%), local government employees (48 | 9.2%), and self-employed (incorporated) (21 | 4.0%) make up the most common classes of employment.
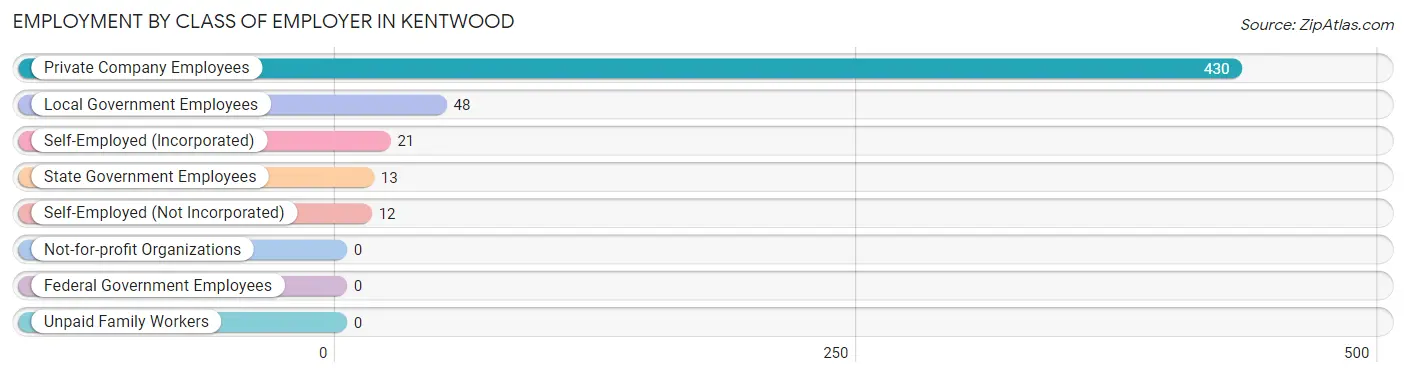
| Employer Class | # Employees | % Employees |
| Private Company Employees | 430 | 82.1% |
| Self-Employed (Incorporated) | 21 | 4.0% |
| Self-Employed (Not Incorporated) | 12 | 2.3% |
| Not-for-profit Organizations | 0 | 0.0% |
| Local Government Employees | 48 | 9.2% |
| State Government Employees | 13 | 2.5% |
| Federal Government Employees | 0 | 0.0% |
| Unpaid Family Workers | 0 | 0.0% |
| Total | 524 | 100.0% |
Employment Status by Age in Kentwood
According to the labor force statistics for Kentwood, out of the total population over 16 years of age (1,550), 40.9% or 634 individuals are in the labor force, with 15.8% or 100 of them unemployed. The age group with the highest labor force participation rate is 20 to 24 years, with 81.7% or 89 individuals in the labor force. Within the labor force, the 20 to 24 years age range has the highest percentage of unemployed individuals, with 61.8% or 55 of them being unemployed.
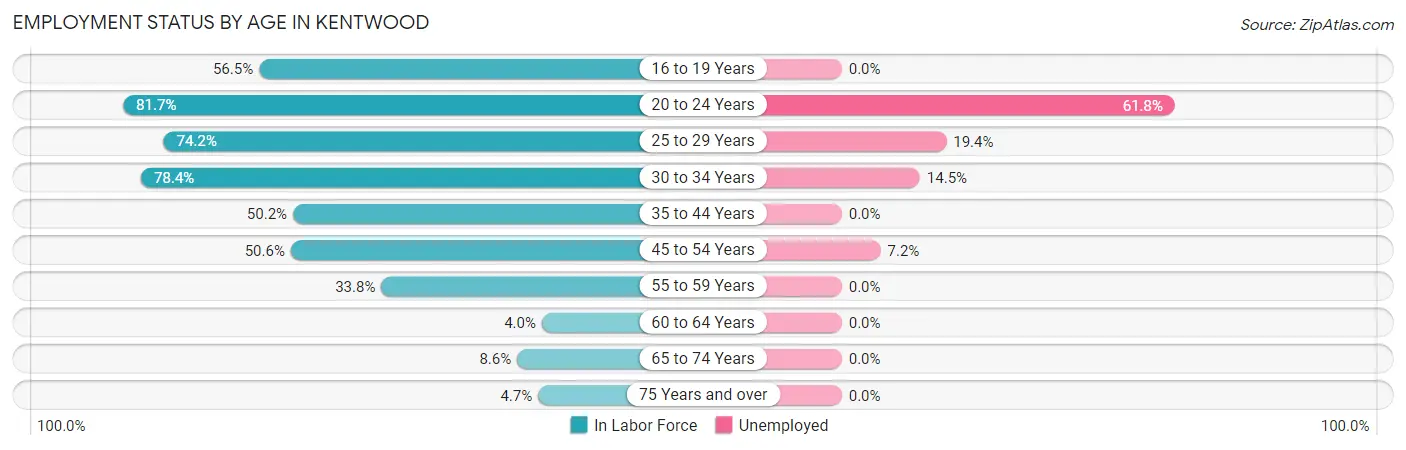
| Age Bracket | In Labor Force | Unemployed |
| 16 to 19 Years | 48 (56.5%) | 0 (0.0%) |
| 20 to 24 Years | 89 (81.7%) | 55 (61.8%) |
| 25 to 29 Years | 144 (74.2%) | 28 (19.4%) |
| 30 to 34 Years | 76 (78.4%) | 11 (14.5%) |
| 35 to 44 Years | 133 (50.2%) | 0 (0.0%) |
| 45 to 54 Years | 83 (50.6%) | 6 (7.2%) |
| 55 to 59 Years | 22 (33.8%) | 0 (0.0%) |
| 60 to 64 Years | 4 (4.0%) | 0 (0.0%) |
| 65 to 74 Years | 28 (8.6%) | 0 (0.0%) |
| 75 Years and over | 7 (4.7%) | 0 (0.0%) |
| Total | 634 (40.9%) | 100 (15.8%) |
Employment Status by Educational Attainment in Kentwood
According to labor force statistics for Kentwood, 52.3% of individuals (462) out of the total population between 25 and 64 years of age (884) are in the labor force, with 9.7% or 45 of them being unemployed. The group with the highest labor force participation rate are those with the educational attainment of college / associate degree, with 95.7% or 157 individuals in the labor force. Within the labor force, individuals with less than high school education have the highest percentage of unemployment, with 65.4% or 17 of them being unemployed.
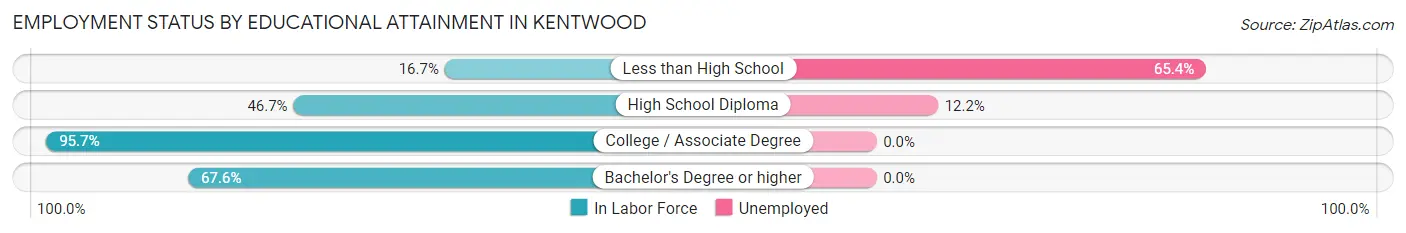
| Educational Attainment | In Labor Force | Unemployed |
| Less than High School | 26 (16.7%) | 102 (65.4%) |
| High School Diploma | 229 (46.7%) | 60 (12.2%) |
| College / Associate Degree | 157 (95.7%) | 0 (0.0%) |
| Bachelor's Degree or higher | 50 (67.6%) | 0 (0.0%) |
| Total | 462 (52.3%) | 86 (9.7%) |
Employment Occupations by Sex in Kentwood
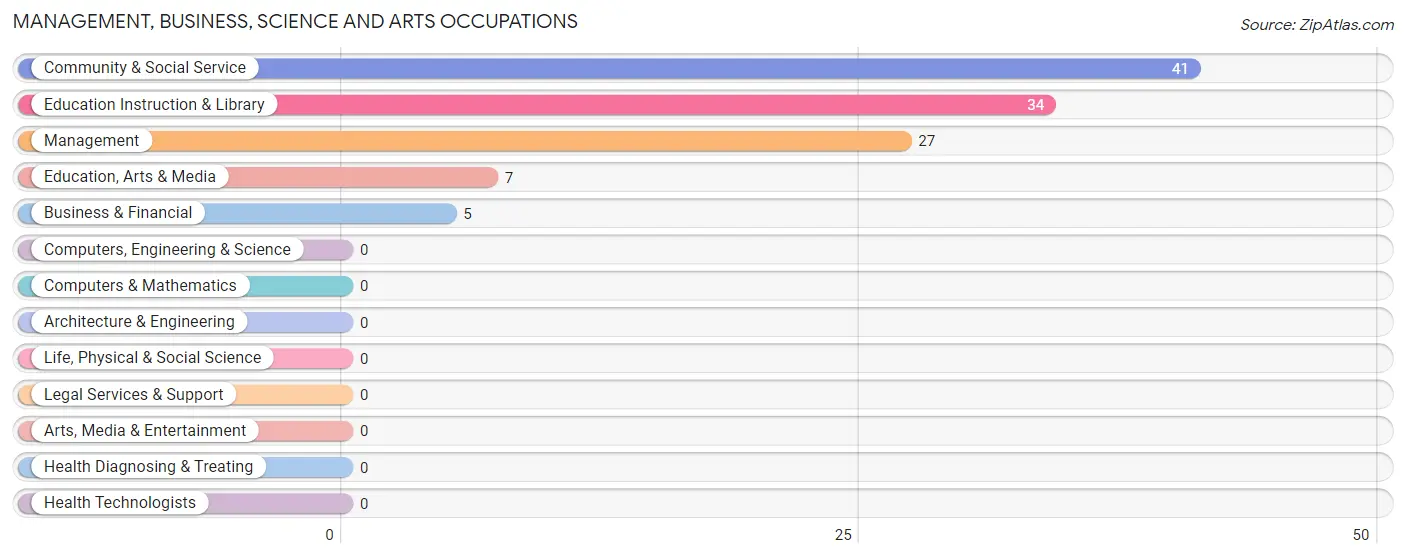
Management, Business, Science and Arts Occupations
The most common Management, Business, Science and Arts occupations in Kentwood are Community & Social Service (41 | 7.7%), Education Instruction & Library (34 | 6.4%), Management (27 | 5.1%), Education, Arts & Media (7 | 1.3%), and Business & Financial (5 | 0.9%).
Management, Business, Science and Arts Occupations by Sex
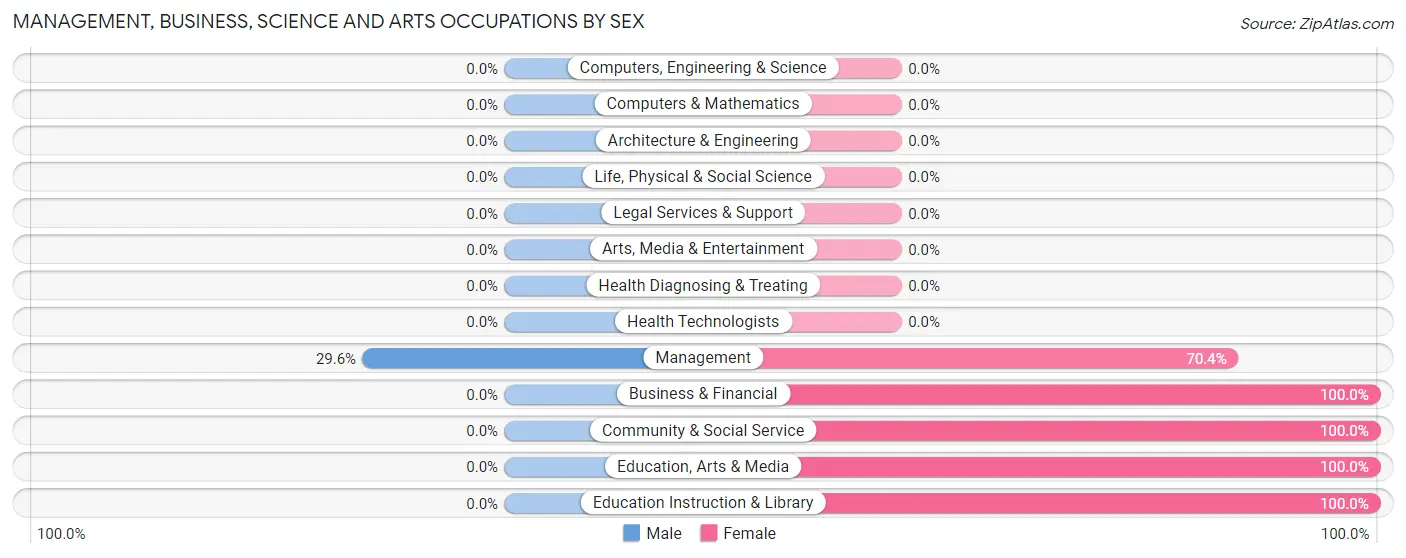
| Occupation | Male | Female |
| Management | 8 (29.6%) | 19 (70.4%) |
| Business & Financial | 0 (0.0%) | 5 (100.0%) |
| Computers, Engineering & Science | 0 (0.0%) | 0 (0.0%) |
| Computers & Mathematics | 0 (0.0%) | 0 (0.0%) |
| Architecture & Engineering | 0 (0.0%) | 0 (0.0%) |
| Life, Physical & Social Science | 0 (0.0%) | 0 (0.0%) |
| Community & Social Service | 0 (0.0%) | 41 (100.0%) |
| Education, Arts & Media | 0 (0.0%) | 7 (100.0%) |
| Legal Services & Support | 0 (0.0%) | 0 (0.0%) |
| Education Instruction & Library | 0 (0.0%) | 34 (100.0%) |
| Arts, Media & Entertainment | 0 (0.0%) | 0 (0.0%) |
| Health Diagnosing & Treating | 0 (0.0%) | 0 (0.0%) |
| Health Technologists | 0 (0.0%) | 0 (0.0%) |
| Total (Category) | 8 (11.0%) | 65 (89.0%) |
| Total (Overall) | 215 (40.3%) | 319 (59.7%) |
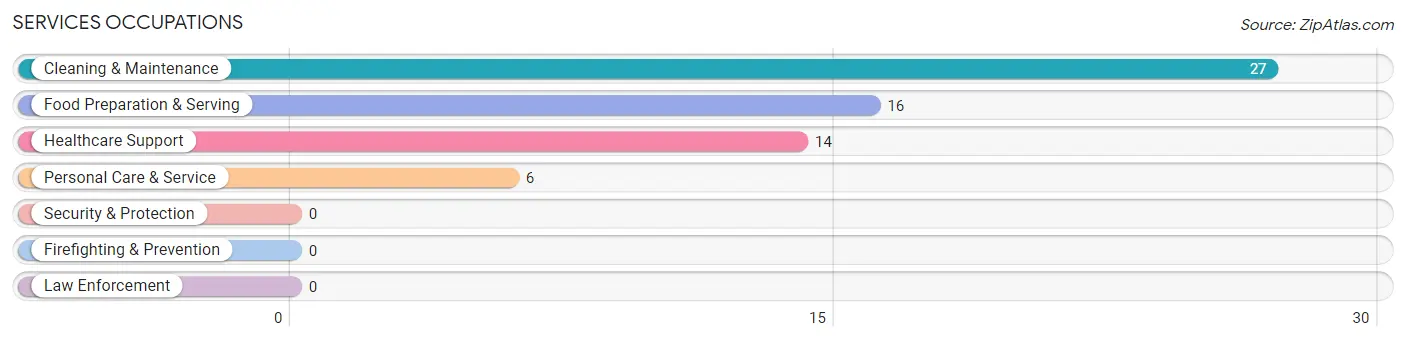
Services Occupations
The most common Services occupations in Kentwood are Cleaning & Maintenance (27 | 5.1%), Food Preparation & Serving (16 | 3.0%), Healthcare Support (14 | 2.6%), and Personal Care & Service (6 | 1.1%).
Services Occupations by Sex
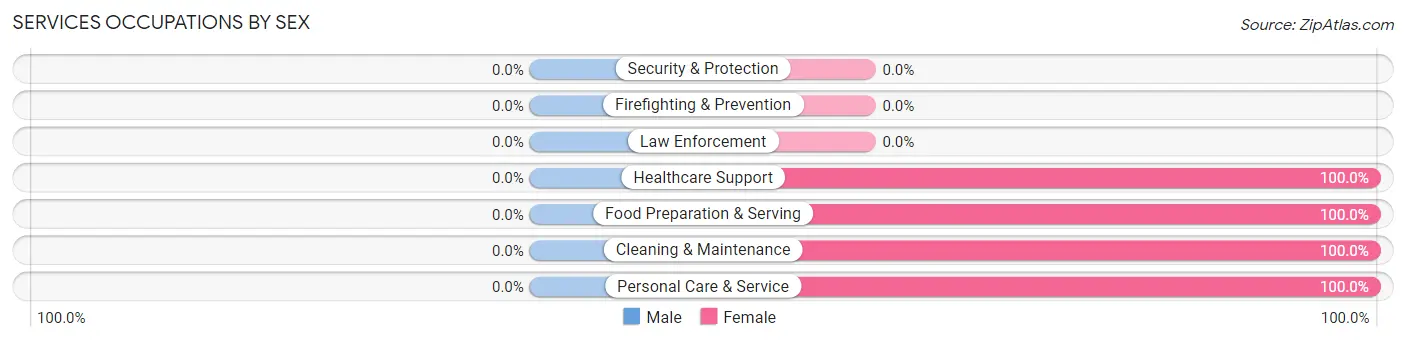
| Occupation | Male | Female |
| Healthcare Support | 0 (0.0%) | 14 (100.0%) |
| Security & Protection | 0 (0.0%) | 0 (0.0%) |
| Firefighting & Prevention | 0 (0.0%) | 0 (0.0%) |
| Law Enforcement | 0 (0.0%) | 0 (0.0%) |
| Food Preparation & Serving | 0 (0.0%) | 16 (100.0%) |
| Cleaning & Maintenance | 0 (0.0%) | 27 (100.0%) |
| Personal Care & Service | 0 (0.0%) | 6 (100.0%) |
| Total (Category) | 0 (0.0%) | 63 (100.0%) |
| Total (Overall) | 215 (40.3%) | 319 (59.7%) |
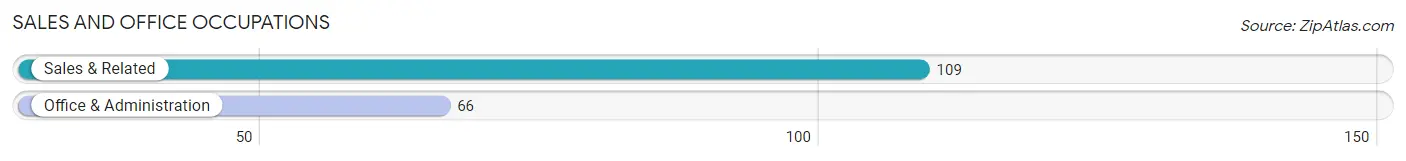
Sales and Office Occupations
The most common Sales and Office occupations in Kentwood are Sales & Related (109 | 20.4%), and Office & Administration (66 | 12.4%).
Sales and Office Occupations by Sex
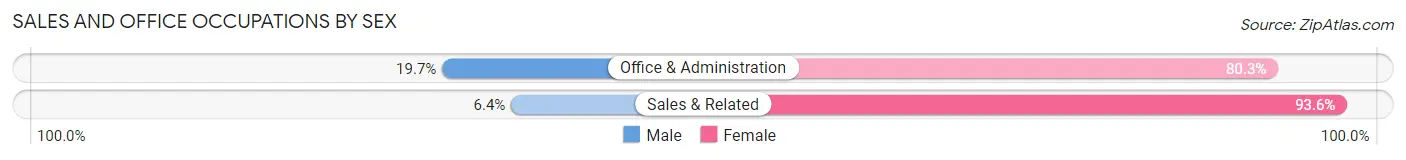
| Occupation | Male | Female |
| Sales & Related | 7 (6.4%) | 102 (93.6%) |
| Office & Administration | 13 (19.7%) | 53 (80.3%) |
| Total (Category) | 20 (11.4%) | 155 (88.6%) |
| Total (Overall) | 215 (40.3%) | 319 (59.7%) |
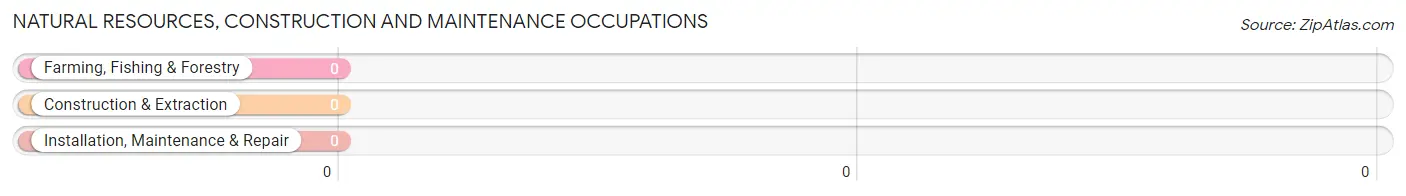
Natural Resources, Construction and Maintenance Occupations
Natural Resources, Construction and Maintenance Occupations by Sex
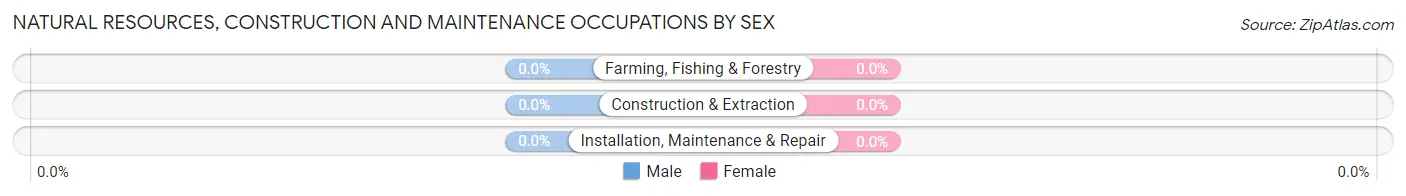
| Occupation | Male | Female |
| Farming, Fishing & Forestry | 0 (0.0%) | 0 (0.0%) |
| Construction & Extraction | 0 (0.0%) | 0 (0.0%) |
| Installation, Maintenance & Repair | 0 (0.0%) | 0 (0.0%) |
| Total (Category) | 0 (0.0%) | 0 (0.0%) |
| Total (Overall) | 215 (40.3%) | 319 (59.7%) |
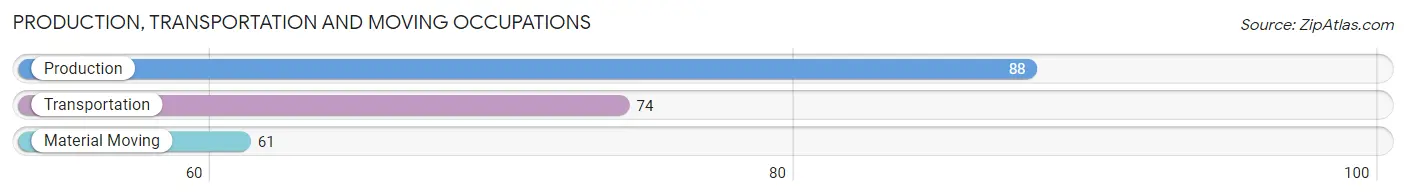
Production, Transportation and Moving Occupations
The most common Production, Transportation and Moving occupations in Kentwood are Production (88 | 16.5%), Transportation (74 | 13.9%), and Material Moving (61 | 11.4%).
Production, Transportation and Moving Occupations by Sex
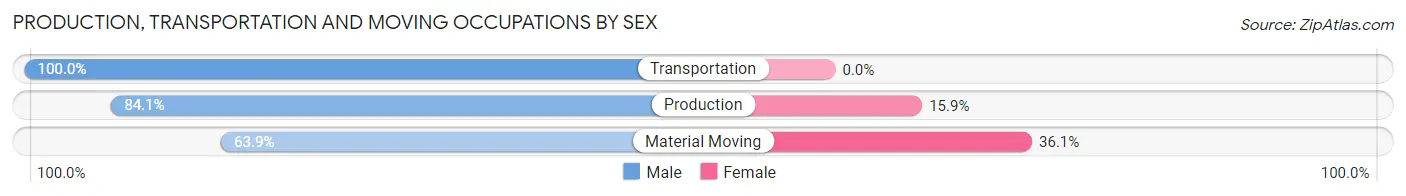
| Occupation | Male | Female |
| Production | 74 (84.1%) | 14 (15.9%) |
| Transportation | 74 (100.0%) | 0 (0.0%) |
| Material Moving | 39 (63.9%) | 22 (36.1%) |
| Total (Category) | 187 (83.9%) | 36 (16.1%) |
| Total (Overall) | 215 (40.3%) | 319 (59.7%) |
Employment Industries by Sex in Kentwood
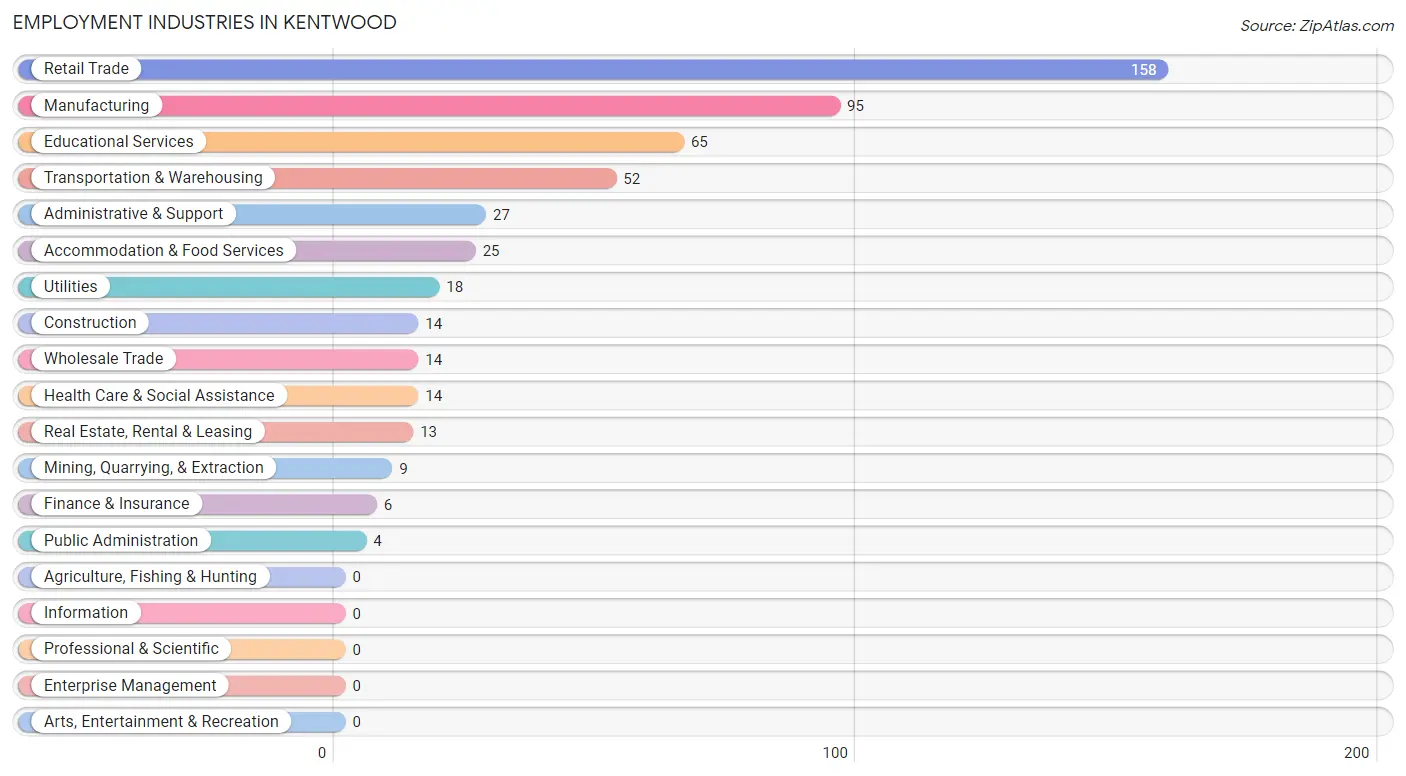
Employment Industries in Kentwood
The major employment industries in Kentwood include Retail Trade (158 | 29.6%), Manufacturing (95 | 17.8%), Educational Services (65 | 12.2%), Transportation & Warehousing (52 | 9.7%), and Administrative & Support (27 | 5.1%).
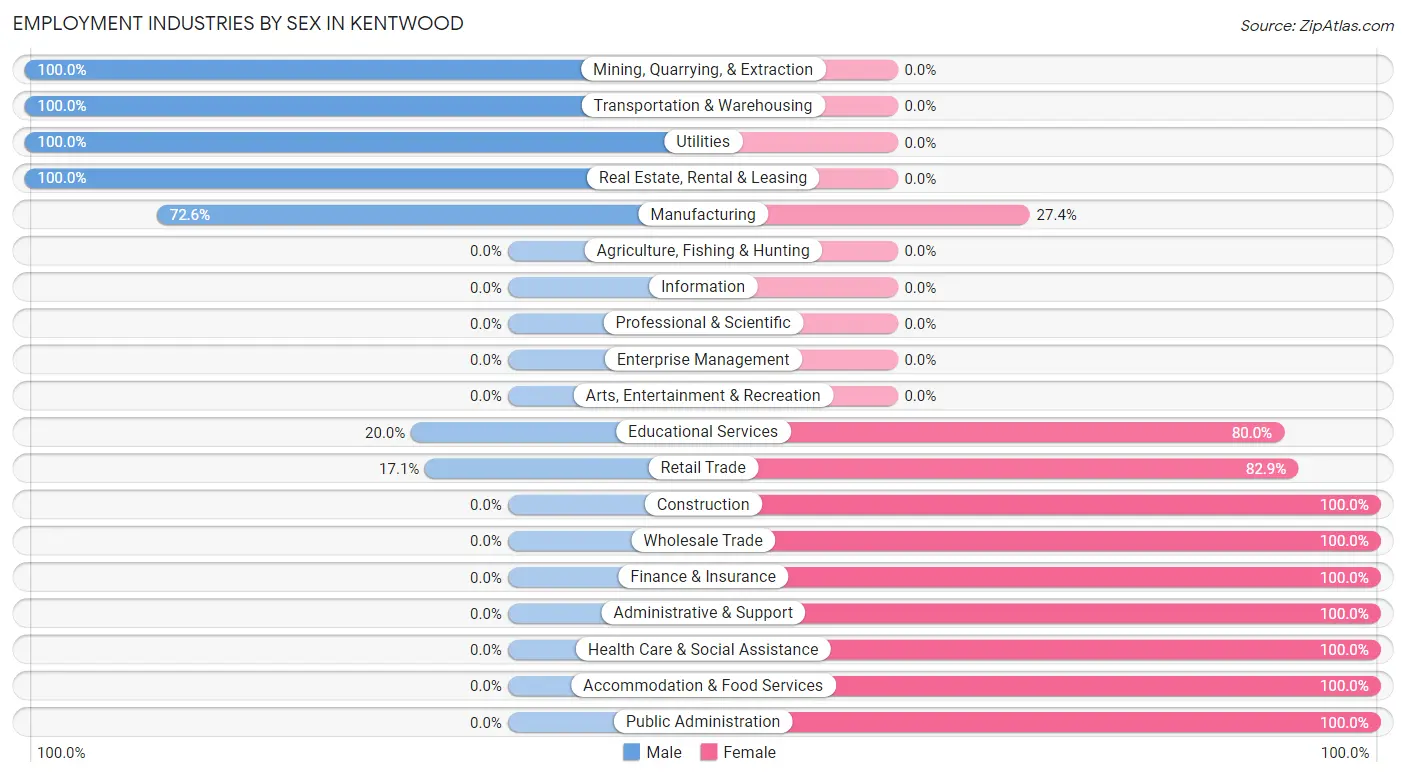
Employment Industries by Sex in Kentwood
The Kentwood industries that see more men than women are Mining, Quarrying, & Extraction (100.0%), Transportation & Warehousing (100.0%), and Utilities (100.0%), whereas the industries that tend to have a higher number of women are Construction (100.0%), Wholesale Trade (100.0%), and Finance & Insurance (100.0%).
| Industry | Male | Female |
| Agriculture, Fishing & Hunting | 0 (0.0%) | 0 (0.0%) |
| Mining, Quarrying, & Extraction | 9 (100.0%) | 0 (0.0%) |
| Construction | 0 (0.0%) | 14 (100.0%) |
| Manufacturing | 69 (72.6%) | 26 (27.4%) |
| Wholesale Trade | 0 (0.0%) | 14 (100.0%) |
| Retail Trade | 27 (17.1%) | 131 (82.9%) |
| Transportation & Warehousing | 52 (100.0%) | 0 (0.0%) |
| Utilities | 18 (100.0%) | 0 (0.0%) |
| Information | 0 (0.0%) | 0 (0.0%) |
| Finance & Insurance | 0 (0.0%) | 6 (100.0%) |
| Real Estate, Rental & Leasing | 13 (100.0%) | 0 (0.0%) |
| Professional & Scientific | 0 (0.0%) | 0 (0.0%) |
| Enterprise Management | 0 (0.0%) | 0 (0.0%) |
| Administrative & Support | 0 (0.0%) | 27 (100.0%) |
| Educational Services | 13 (20.0%) | 52 (80.0%) |
| Health Care & Social Assistance | 0 (0.0%) | 14 (100.0%) |
| Arts, Entertainment & Recreation | 0 (0.0%) | 0 (0.0%) |
| Accommodation & Food Services | 0 (0.0%) | 25 (100.0%) |
| Public Administration | 0 (0.0%) | 4 (100.0%) |
| Total | 215 (40.3%) | 319 (59.7%) |
Education in Kentwood
School Enrollment in Kentwood
The most common levels of schooling among the 366 students in Kentwood are middle school (138 | 37.7%), high school (98 | 26.8%), and elementary school (59 | 16.1%).
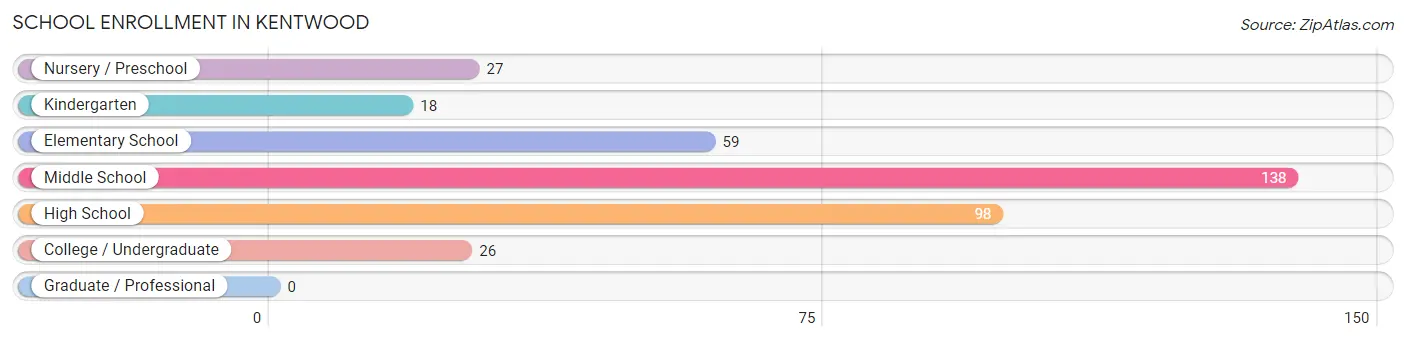
| School Level | # Students | % Students |
| Nursery / Preschool | 27 | 7.4% |
| Kindergarten | 18 | 4.9% |
| Elementary School | 59 | 16.1% |
| Middle School | 138 | 37.7% |
| High School | 98 | 26.8% |
| College / Undergraduate | 26 | 7.1% |
| Graduate / Professional | 0 | 0.0% |
| Total | 366 | 100.0% |
School Enrollment by Age by Funding Source in Kentwood
Out of a total of 366 students who are enrolled in schools in Kentwood, 26 (7.1%) attend a private institution, while the remaining 340 (92.9%) are enrolled in public schools. The age group of 35 years and over has the highest likelihood of being enrolled in private schools, with 7 (53.8% in the age bracket) enrolled. Conversely, the age group of 3 to 4 year olds has the lowest likelihood of being enrolled in a private school, with 23 (100.0% in the age bracket) attending a public institution.
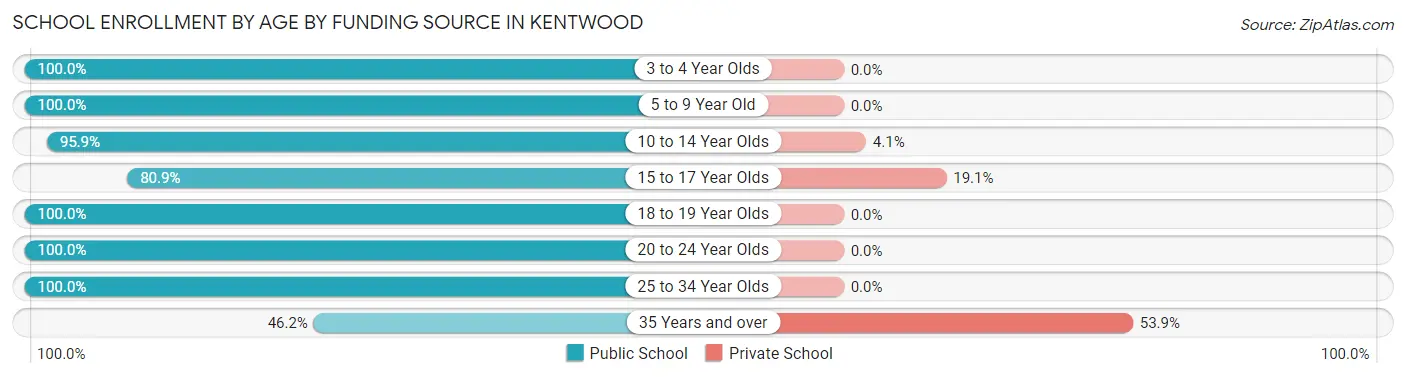
| Age Bracket | Public School | Private School |
| 3 to 4 Year Olds | 23 (100.0%) | 0 (0.0%) |
| 5 to 9 Year Old | 81 (100.0%) | 0 (0.0%) |
| 10 to 14 Year Olds | 139 (95.9%) | 6 (4.1%) |
| 15 to 17 Year Olds | 55 (80.9%) | 13 (19.1%) |
| 18 to 19 Year Olds | 17 (100.0%) | 0 (0.0%) |
| 20 to 24 Year Olds | 13 (100.0%) | 0 (0.0%) |
| 25 to 34 Year Olds | 6 (100.0%) | 0 (0.0%) |
| 35 Years and over | 6 (46.2%) | 7 (53.8%) |
| Total | 340 (92.9%) | 26 (7.1%) |
Educational Attainment by Field of Study in Kentwood
Bio, nature & agricultural (39 | 32.2%), education (29 | 24.0%), computers & mathematics (24 | 19.8%), science & technology (16 | 13.2%), and business (6 | 5.0%) are the most common fields of study among 121 individuals in Kentwood who have obtained a bachelor's degree or higher.
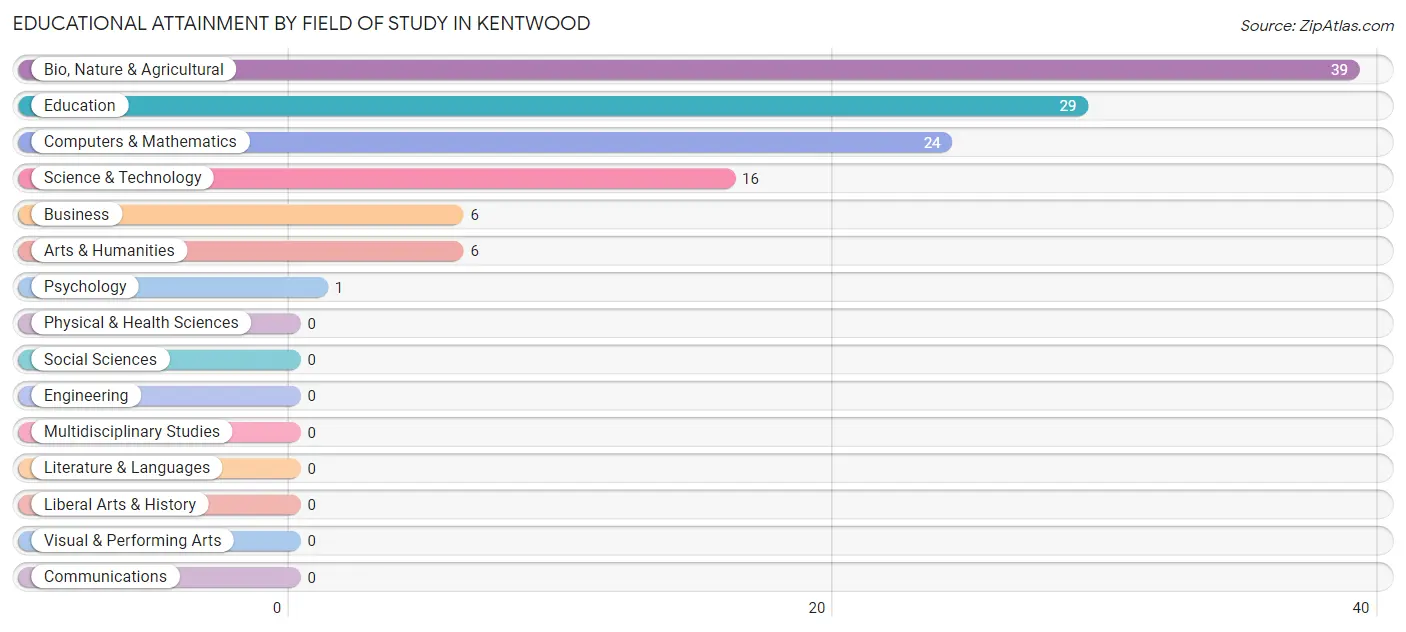
| Field of Study | # Graduates | % Graduates |
| Computers & Mathematics | 24 | 19.8% |
| Bio, Nature & Agricultural | 39 | 32.2% |
| Physical & Health Sciences | 0 | 0.0% |
| Psychology | 1 | 0.8% |
| Social Sciences | 0 | 0.0% |
| Engineering | 0 | 0.0% |
| Multidisciplinary Studies | 0 | 0.0% |
| Science & Technology | 16 | 13.2% |
| Business | 6 | 5.0% |
| Education | 29 | 24.0% |
| Literature & Languages | 0 | 0.0% |
| Liberal Arts & History | 0 | 0.0% |
| Visual & Performing Arts | 0 | 0.0% |
| Communications | 0 | 0.0% |
| Arts & Humanities | 6 | 5.0% |
| Total | 121 | 100.0% |
Transportation & Commute in Kentwood
Vehicle Availability by Sex in Kentwood
The most prevalent vehicle ownership categories in Kentwood are males with 1 vehicle (81, accounting for 37.7%) and females with 1 vehicle (190, making up 26.2%).
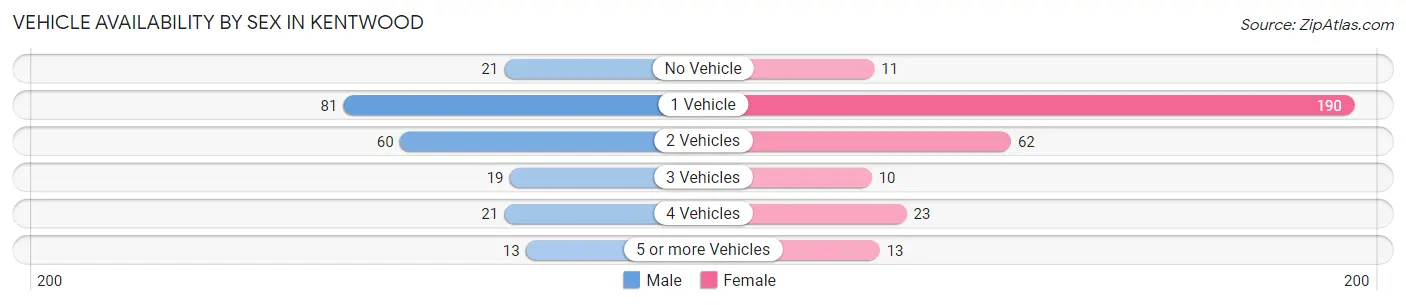
| Vehicles Available | Male | Female |
| No Vehicle | 21 (9.8%) | 11 (3.6%) |
| 1 Vehicle | 81 (37.7%) | 190 (61.5%) |
| 2 Vehicles | 60 (27.9%) | 62 (20.1%) |
| 3 Vehicles | 19 (8.8%) | 10 (3.2%) |
| 4 Vehicles | 21 (9.8%) | 23 (7.4%) |
| 5 or more Vehicles | 13 (6.0%) | 13 (4.2%) |
| Total | 215 (100.0%) | 309 (100.0%) |
Commute Time in Kentwood
The most frequently occuring commute durations in Kentwood are 15 to 19 minutes (110 commuters, 21.0%), 60 to 89 minutes (85 commuters, 16.2%), and 45 to 59 minutes (60 commuters, 11.5%).
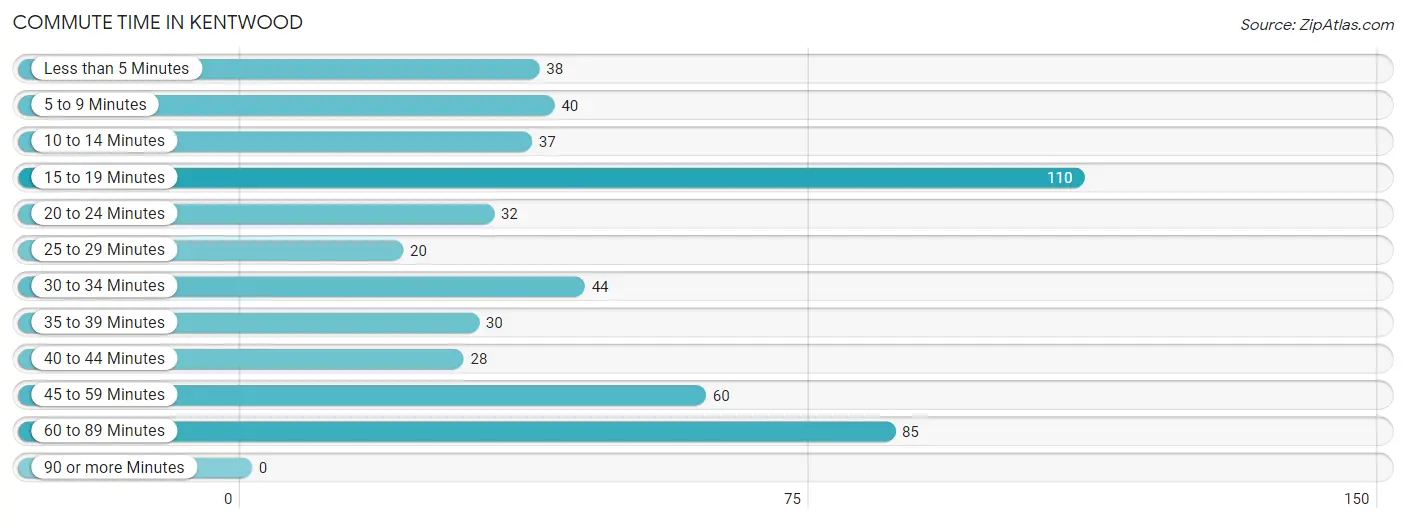
| Commute Time | # Commuters | % Commuters |
| Less than 5 Minutes | 38 | 7.2% |
| 5 to 9 Minutes | 40 | 7.6% |
| 10 to 14 Minutes | 37 | 7.1% |
| 15 to 19 Minutes | 110 | 21.0% |
| 20 to 24 Minutes | 32 | 6.1% |
| 25 to 29 Minutes | 20 | 3.8% |
| 30 to 34 Minutes | 44 | 8.4% |
| 35 to 39 Minutes | 30 | 5.7% |
| 40 to 44 Minutes | 28 | 5.3% |
| 45 to 59 Minutes | 60 | 11.5% |
| 60 to 89 Minutes | 85 | 16.2% |
| 90 or more Minutes | 0 | 0.0% |
Commute Time by Sex in Kentwood
The most common commute times in Kentwood are 60 to 89 minutes (56 commuters, 26.1%) for males and 15 to 19 minutes (90 commuters, 29.1%) for females.
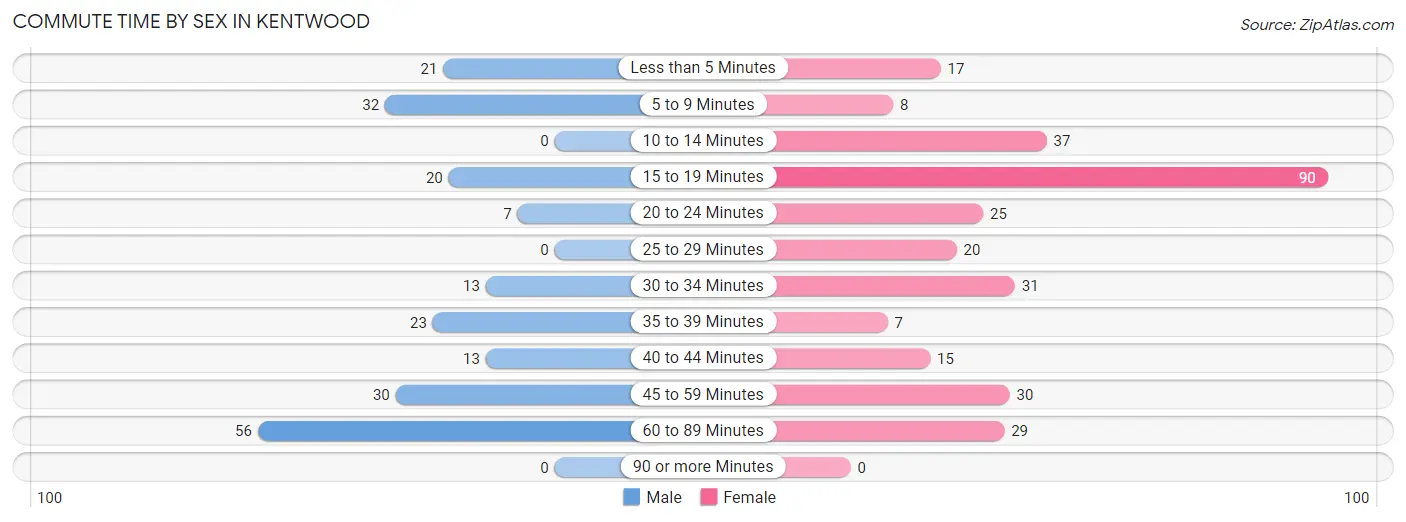
| Commute Time | Male | Female |
| Less than 5 Minutes | 21 (9.8%) | 17 (5.5%) |
| 5 to 9 Minutes | 32 (14.9%) | 8 (2.6%) |
| 10 to 14 Minutes | 0 (0.0%) | 37 (12.0%) |
| 15 to 19 Minutes | 20 (9.3%) | 90 (29.1%) |
| 20 to 24 Minutes | 7 (3.3%) | 25 (8.1%) |
| 25 to 29 Minutes | 0 (0.0%) | 20 (6.5%) |
| 30 to 34 Minutes | 13 (6.0%) | 31 (10.0%) |
| 35 to 39 Minutes | 23 (10.7%) | 7 (2.3%) |
| 40 to 44 Minutes | 13 (6.0%) | 15 (4.9%) |
| 45 to 59 Minutes | 30 (14.0%) | 30 (9.7%) |
| 60 to 89 Minutes | 56 (26.1%) | 29 (9.4%) |
| 90 or more Minutes | 0 (0.0%) | 0 (0.0%) |
Time of Departure to Work by Sex in Kentwood
The most frequent times of departure to work in Kentwood are 4:00 PM to 11:59 PM (67, 31.2%) for males and 6:30 AM to 6:59 AM (68, 22.0%) for females.
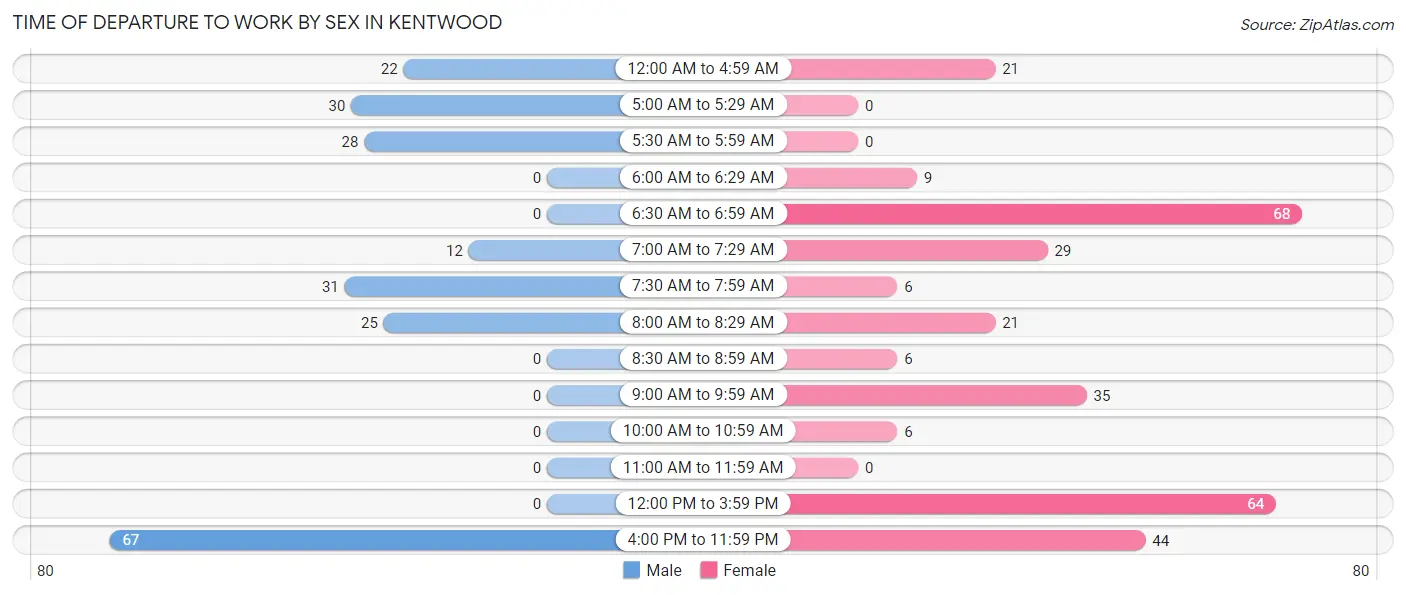
| Time of Departure | Male | Female |
| 12:00 AM to 4:59 AM | 22 (10.2%) | 21 (6.8%) |
| 5:00 AM to 5:29 AM | 30 (14.0%) | 0 (0.0%) |
| 5:30 AM to 5:59 AM | 28 (13.0%) | 0 (0.0%) |
| 6:00 AM to 6:29 AM | 0 (0.0%) | 9 (2.9%) |
| 6:30 AM to 6:59 AM | 0 (0.0%) | 68 (22.0%) |
| 7:00 AM to 7:29 AM | 12 (5.6%) | 29 (9.4%) |
| 7:30 AM to 7:59 AM | 31 (14.4%) | 6 (1.9%) |
| 8:00 AM to 8:29 AM | 25 (11.6%) | 21 (6.8%) |
| 8:30 AM to 8:59 AM | 0 (0.0%) | 6 (1.9%) |
| 9:00 AM to 9:59 AM | 0 (0.0%) | 35 (11.3%) |
| 10:00 AM to 10:59 AM | 0 (0.0%) | 6 (1.9%) |
| 11:00 AM to 11:59 AM | 0 (0.0%) | 0 (0.0%) |
| 12:00 PM to 3:59 PM | 0 (0.0%) | 64 (20.7%) |
| 4:00 PM to 11:59 PM | 67 (31.2%) | 44 (14.2%) |
| Total | 215 (100.0%) | 309 (100.0%) |
Housing Occupancy in Kentwood
Occupancy by Ownership in Kentwood
Of the total 611 dwellings in Kentwood, owner-occupied units account for 380 (62.2%), while renter-occupied units make up 231 (37.8%).
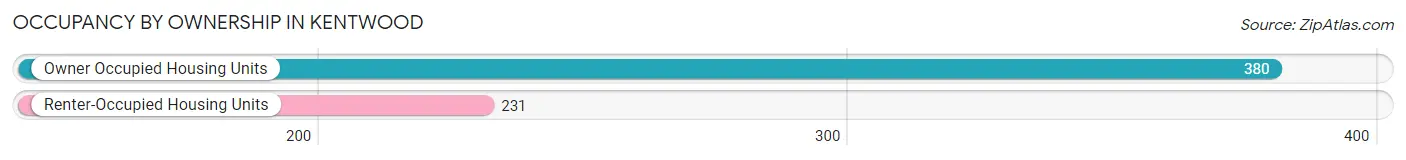
| Occupancy | # Housing Units | % Housing Units |
| Owner Occupied Housing Units | 380 | 62.2% |
| Renter-Occupied Housing Units | 231 | 37.8% |
| Total Occupied Housing Units | 611 | 100.0% |
Occupancy by Household Size in Kentwood
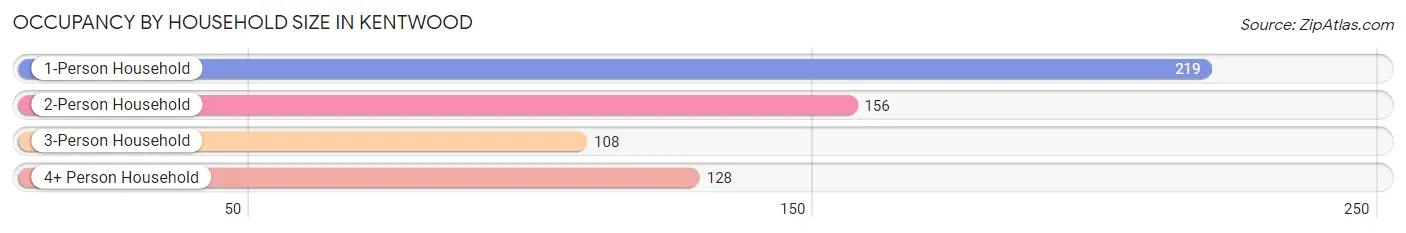
| Household Size | # Housing Units | % Housing Units |
| 1-Person Household | 219 | 35.8% |
| 2-Person Household | 156 | 25.5% |
| 3-Person Household | 108 | 17.7% |
| 4+ Person Household | 128 | 20.9% |
| Total Housing Units | 611 | 100.0% |
Occupancy by Ownership by Household Size in Kentwood
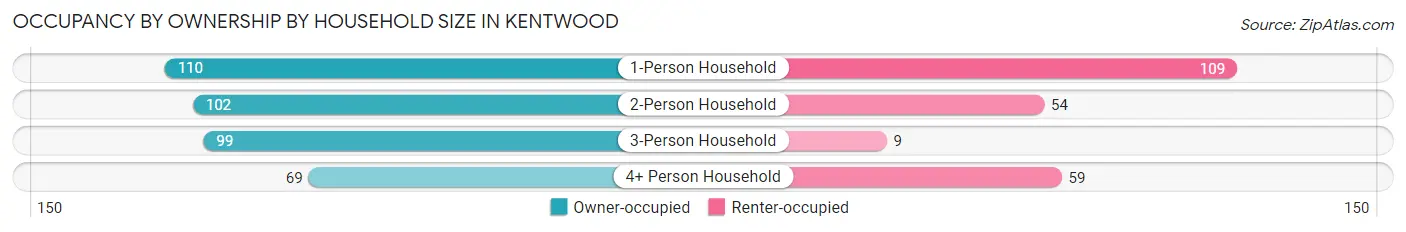
| Household Size | Owner-occupied | Renter-occupied |
| 1-Person Household | 110 (50.2%) | 109 (49.8%) |
| 2-Person Household | 102 (65.4%) | 54 (34.6%) |
| 3-Person Household | 99 (91.7%) | 9 (8.3%) |
| 4+ Person Household | 69 (53.9%) | 59 (46.1%) |
| Total Housing Units | 380 (62.2%) | 231 (37.8%) |
Occupancy by Educational Attainment in Kentwood
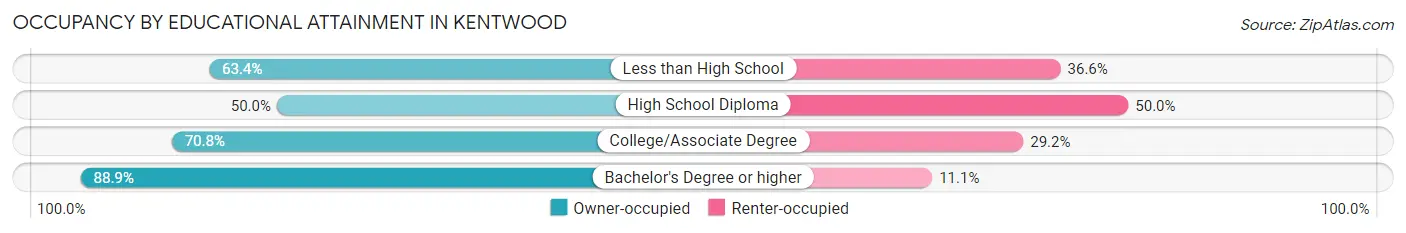
| Household Size | Owner-occupied | Renter-occupied |
| Less than High School | 111 (63.4%) | 64 (36.6%) |
| High School Diploma | 119 (50.0%) | 119 (50.0%) |
| College/Associate Degree | 102 (70.8%) | 42 (29.2%) |
| Bachelor's Degree or higher | 48 (88.9%) | 6 (11.1%) |
Occupancy by Age of Householder in Kentwood
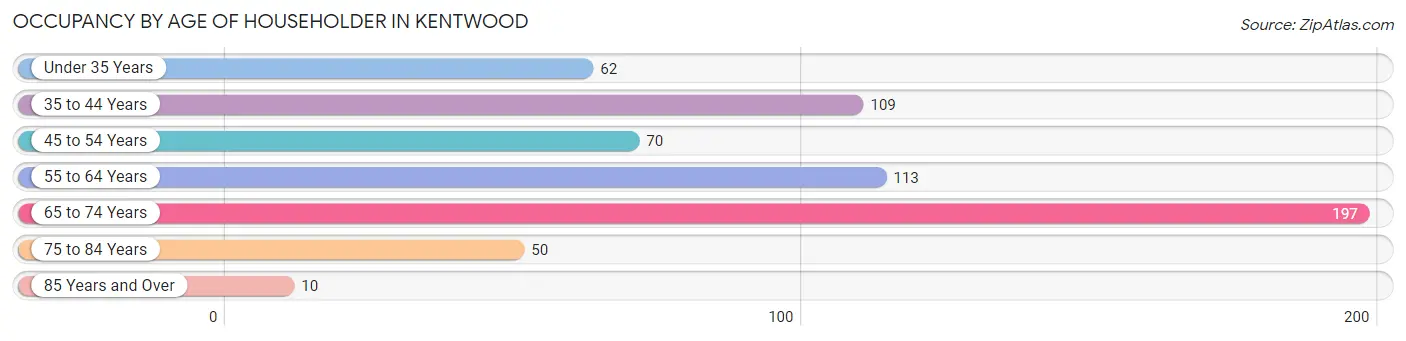
| Age Bracket | # Households | % Households |
| Under 35 Years | 62 | 10.2% |
| 35 to 44 Years | 109 | 17.8% |
| 45 to 54 Years | 70 | 11.5% |
| 55 to 64 Years | 113 | 18.5% |
| 65 to 74 Years | 197 | 32.2% |
| 75 to 84 Years | 50 | 8.2% |
| 85 Years and Over | 10 | 1.6% |
| Total | 611 | 100.0% |
Housing Finances in Kentwood
Median Income by Occupancy in Kentwood
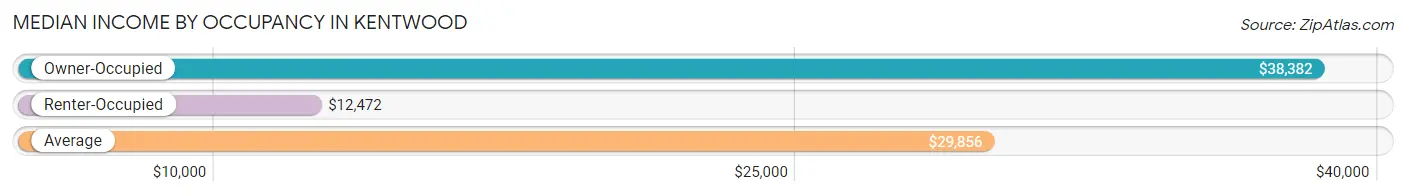
| Occupancy Type | # Households | Median Income |
| Owner-Occupied | 380 (62.2%) | $38,382 |
| Renter-Occupied | 231 (37.8%) | $12,472 |
| Average | 611 (100.0%) | $29,856 |
Occupancy by Householder Income Bracket in Kentwood
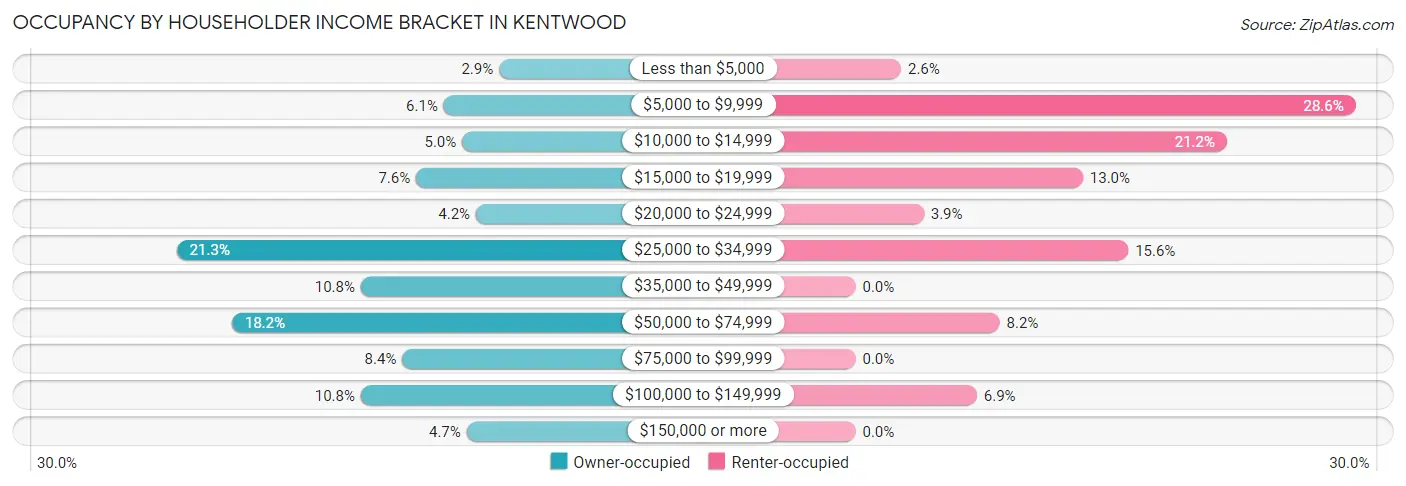
| Income Bracket | Owner-occupied | Renter-occupied |
| Less than $5,000 | 11 (2.9%) | 6 (2.6%) |
| $5,000 to $9,999 | 23 (6.0%) | 66 (28.6%) |
| $10,000 to $14,999 | 19 (5.0%) | 49 (21.2%) |
| $15,000 to $19,999 | 29 (7.6%) | 30 (13.0%) |
| $20,000 to $24,999 | 16 (4.2%) | 9 (3.9%) |
| $25,000 to $34,999 | 81 (21.3%) | 36 (15.6%) |
| $35,000 to $49,999 | 41 (10.8%) | 0 (0.0%) |
| $50,000 to $74,999 | 69 (18.2%) | 19 (8.2%) |
| $75,000 to $99,999 | 32 (8.4%) | 0 (0.0%) |
| $100,000 to $149,999 | 41 (10.8%) | 16 (6.9%) |
| $150,000 or more | 18 (4.7%) | 0 (0.0%) |
| Total | 380 (100.0%) | 231 (100.0%) |
Monthly Housing Cost Tiers in Kentwood
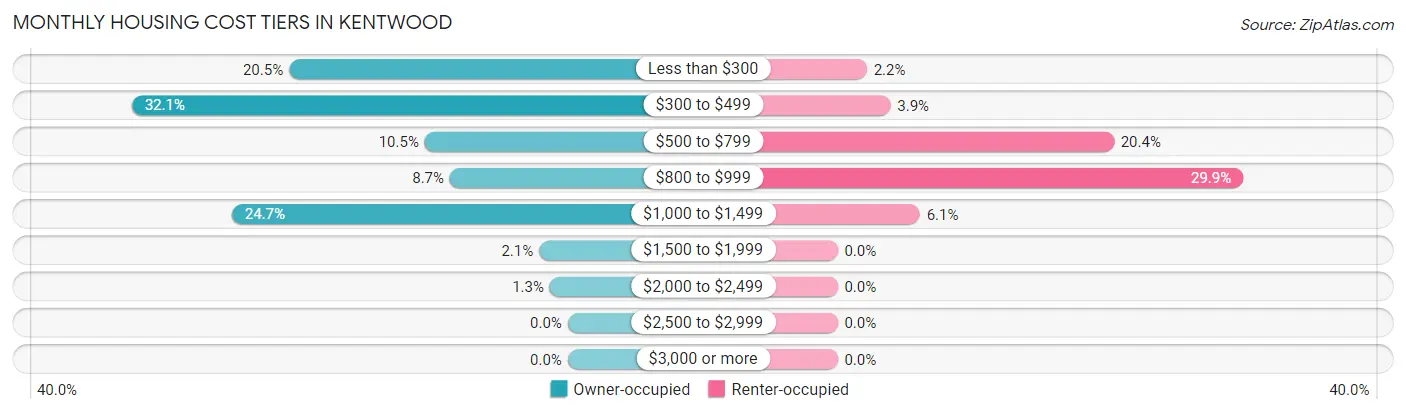
| Monthly Cost | Owner-occupied | Renter-occupied |
| Less than $300 | 78 (20.5%) | 5 (2.2%) |
| $300 to $499 | 122 (32.1%) | 9 (3.9%) |
| $500 to $799 | 40 (10.5%) | 47 (20.3%) |
| $800 to $999 | 33 (8.7%) | 69 (29.9%) |
| $1,000 to $1,499 | 94 (24.7%) | 14 (6.1%) |
| $1,500 to $1,999 | 8 (2.1%) | 0 (0.0%) |
| $2,000 to $2,499 | 5 (1.3%) | 0 (0.0%) |
| $2,500 to $2,999 | 0 (0.0%) | 0 (0.0%) |
| $3,000 or more | 0 (0.0%) | 0 (0.0%) |
| Total | 380 (100.0%) | 231 (100.0%) |
Physical Housing Characteristics in Kentwood
Housing Structures in Kentwood
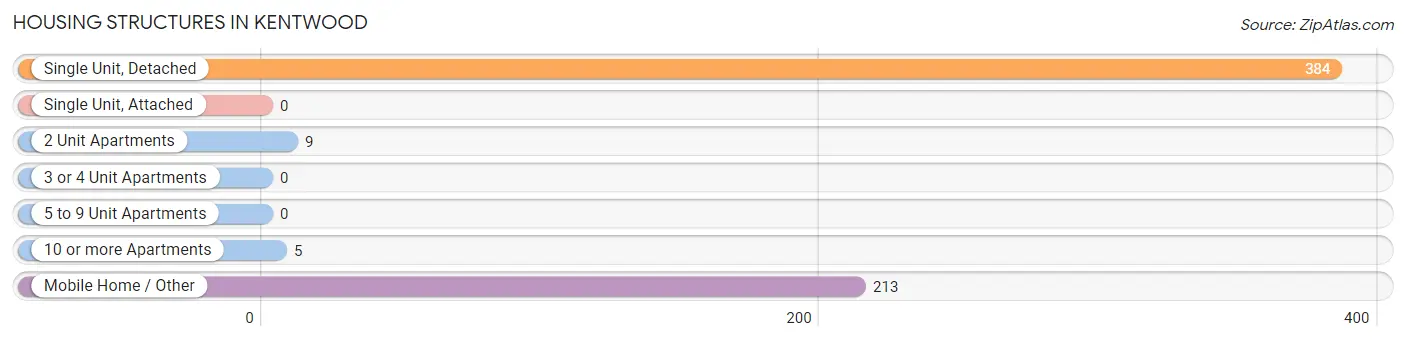
| Structure Type | # Housing Units | % Housing Units |
| Single Unit, Detached | 384 | 62.8% |
| Single Unit, Attached | 0 | 0.0% |
| 2 Unit Apartments | 9 | 1.5% |
| 3 or 4 Unit Apartments | 0 | 0.0% |
| 5 to 9 Unit Apartments | 0 | 0.0% |
| 10 or more Apartments | 5 | 0.8% |
| Mobile Home / Other | 213 | 34.9% |
| Total | 611 | 100.0% |
Housing Structures by Occupancy in Kentwood
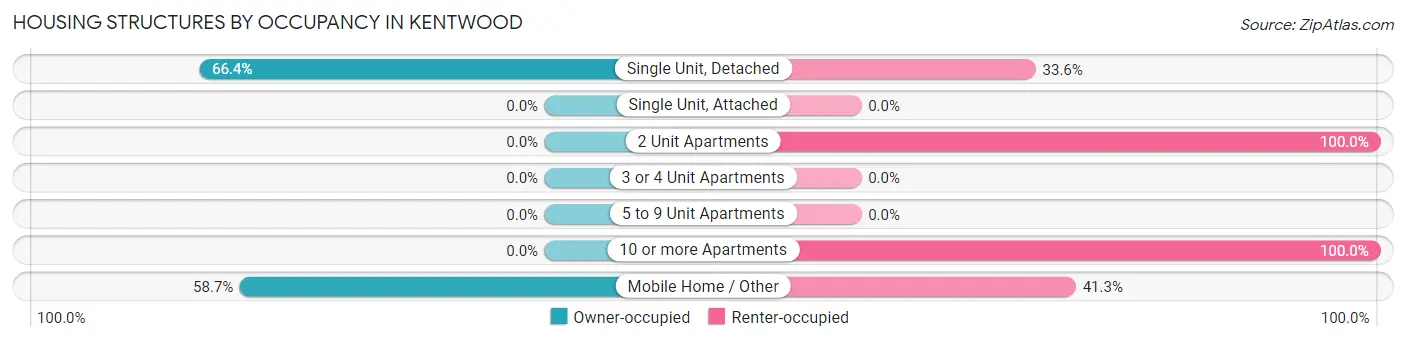
| Structure Type | Owner-occupied | Renter-occupied |
| Single Unit, Detached | 255 (66.4%) | 129 (33.6%) |
| Single Unit, Attached | 0 (0.0%) | 0 (0.0%) |
| 2 Unit Apartments | 0 (0.0%) | 9 (100.0%) |
| 3 or 4 Unit Apartments | 0 (0.0%) | 0 (0.0%) |
| 5 to 9 Unit Apartments | 0 (0.0%) | 0 (0.0%) |
| 10 or more Apartments | 0 (0.0%) | 5 (100.0%) |
| Mobile Home / Other | 125 (58.7%) | 88 (41.3%) |
| Total | 380 (62.2%) | 231 (37.8%) |
Housing Structures by Number of Rooms in Kentwood
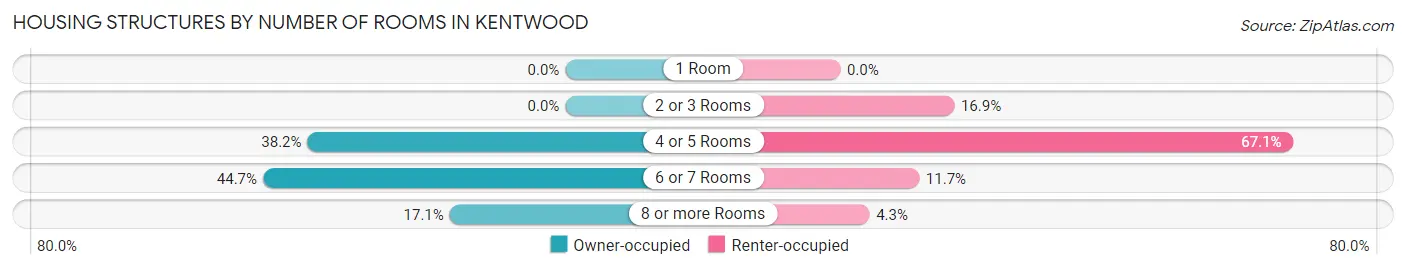
| Number of Rooms | Owner-occupied | Renter-occupied |
| 1 Room | 0 (0.0%) | 0 (0.0%) |
| 2 or 3 Rooms | 0 (0.0%) | 39 (16.9%) |
| 4 or 5 Rooms | 145 (38.2%) | 155 (67.1%) |
| 6 or 7 Rooms | 170 (44.7%) | 27 (11.7%) |
| 8 or more Rooms | 65 (17.1%) | 10 (4.3%) |
| Total | 380 (100.0%) | 231 (100.0%) |
Housing Structure by Heating Type in Kentwood
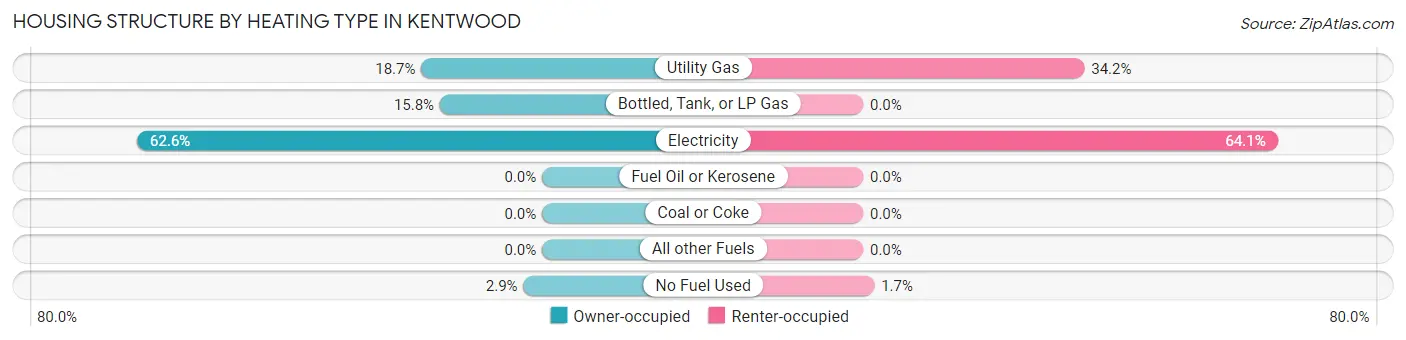
| Heating Type | Owner-occupied | Renter-occupied |
| Utility Gas | 71 (18.7%) | 79 (34.2%) |
| Bottled, Tank, or LP Gas | 60 (15.8%) | 0 (0.0%) |
| Electricity | 238 (62.6%) | 148 (64.1%) |
| Fuel Oil or Kerosene | 0 (0.0%) | 0 (0.0%) |
| Coal or Coke | 0 (0.0%) | 0 (0.0%) |
| All other Fuels | 0 (0.0%) | 0 (0.0%) |
| No Fuel Used | 11 (2.9%) | 4 (1.7%) |
| Total | 380 (100.0%) | 231 (100.0%) |
Household Vehicle Usage in Kentwood
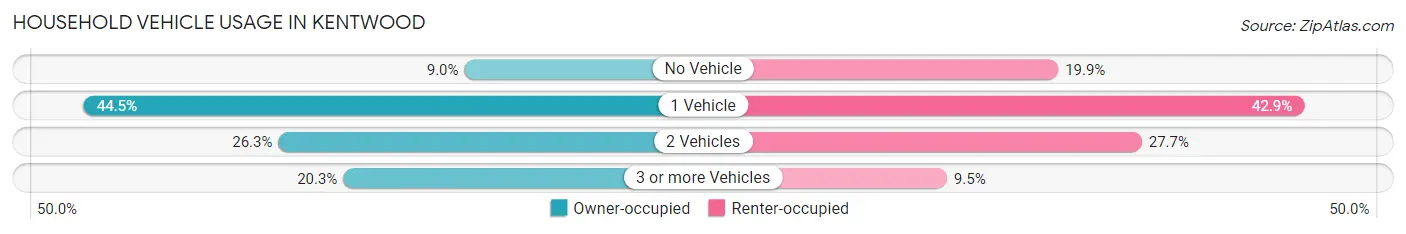
| Vehicles per Household | Owner-occupied | Renter-occupied |
| No Vehicle | 34 (8.9%) | 46 (19.9%) |
| 1 Vehicle | 169 (44.5%) | 99 (42.9%) |
| 2 Vehicles | 100 (26.3%) | 64 (27.7%) |
| 3 or more Vehicles | 77 (20.3%) | 22 (9.5%) |
| Total | 380 (100.0%) | 231 (100.0%) |
Real Estate & Mortgages in Kentwood
Real Estate and Mortgage Overview in Kentwood
| Characteristic | Without Mortgage | With Mortgage |
| Housing Units | 250 | 130 |
| Median Property Value | $51,500 | $89,100 |
| Median Household Income | $32,083 | $10 |
| Monthly Housing Costs | $344 | $0 |
| Real Estate Taxes | $199 | $1 |
Property Value by Mortgage Status in Kentwood
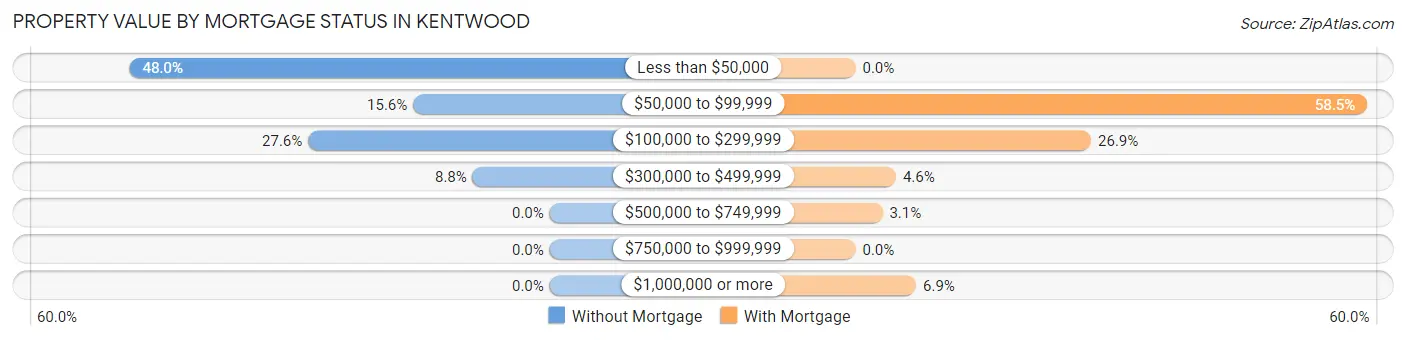
| Property Value | Without Mortgage | With Mortgage |
| Less than $50,000 | 120 (48.0%) | 0 (0.0%) |
| $50,000 to $99,999 | 39 (15.6%) | 76 (58.5%) |
| $100,000 to $299,999 | 69 (27.6%) | 35 (26.9%) |
| $300,000 to $499,999 | 22 (8.8%) | 6 (4.6%) |
| $500,000 to $749,999 | 0 (0.0%) | 4 (3.1%) |
| $750,000 to $999,999 | 0 (0.0%) | 0 (0.0%) |
| $1,000,000 or more | 0 (0.0%) | 9 (6.9%) |
| Total | 250 (100.0%) | 130 (100.0%) |
Household Income by Mortgage Status in Kentwood
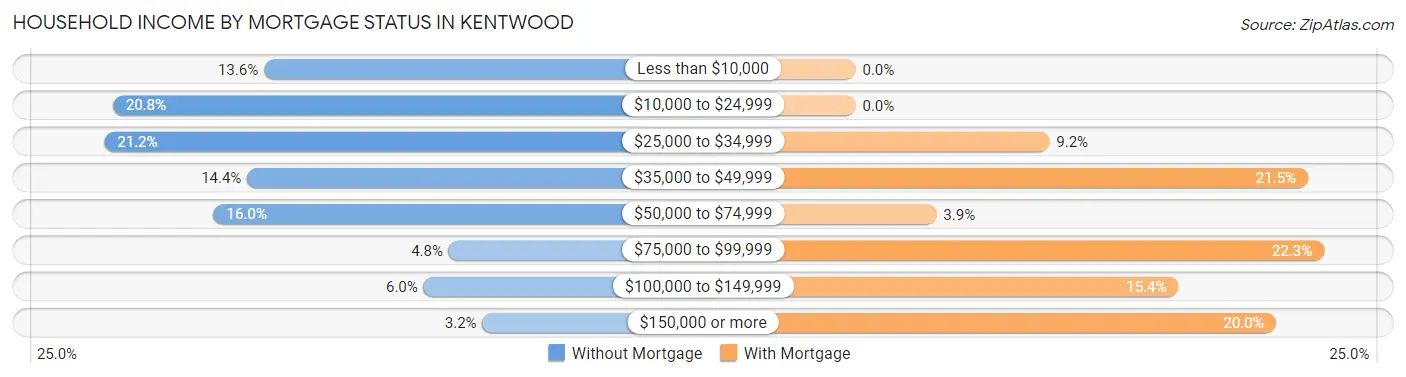
| Household Income | Without Mortgage | With Mortgage |
| Less than $10,000 | 34 (13.6%) | 0 (0.0%) |
| $10,000 to $24,999 | 52 (20.8%) | 0 (0.0%) |
| $25,000 to $34,999 | 53 (21.2%) | 12 (9.2%) |
| $35,000 to $49,999 | 36 (14.4%) | 28 (21.5%) |
| $50,000 to $74,999 | 40 (16.0%) | 5 (3.8%) |
| $75,000 to $99,999 | 12 (4.8%) | 29 (22.3%) |
| $100,000 to $149,999 | 15 (6.0%) | 20 (15.4%) |
| $150,000 or more | 8 (3.2%) | 26 (20.0%) |
| Total | 250 (100.0%) | 130 (100.0%) |
Property Value to Household Income Ratio in Kentwood
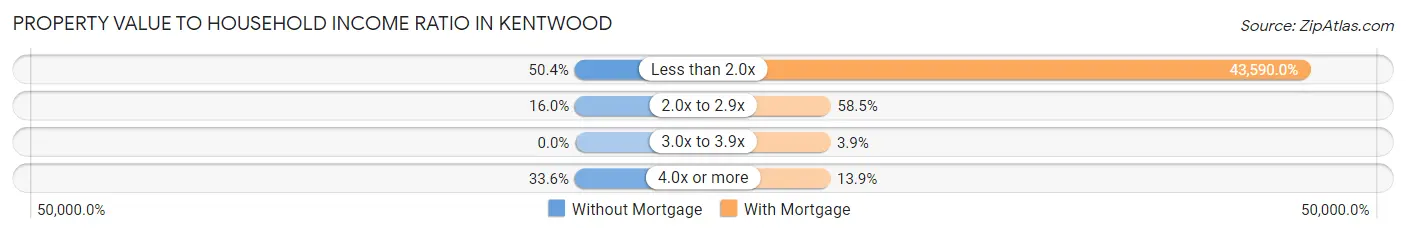
| Value-to-Income Ratio | Without Mortgage | With Mortgage |
| Less than 2.0x | 126 (50.4%) | 56,667 (43,590.0%) |
| 2.0x to 2.9x | 40 (16.0%) | 76 (58.5%) |
| 3.0x to 3.9x | 0 (0.0%) | 5 (3.8%) |
| 4.0x or more | 84 (33.6%) | 18 (13.9%) |
| Total | 250 (100.0%) | 130 (100.0%) |
Real Estate Taxes by Mortgage Status in Kentwood
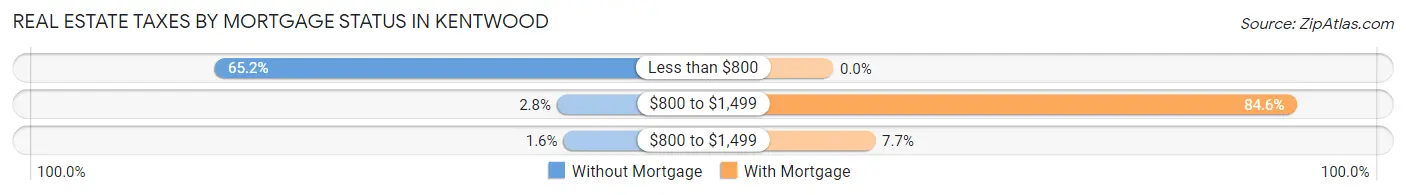
| Property Taxes | Without Mortgage | With Mortgage |
| Less than $800 | 163 (65.2%) | 0 (0.0%) |
| $800 to $1,499 | 7 (2.8%) | 110 (84.6%) |
| $800 to $1,499 | 4 (1.6%) | 10 (7.7%) |
| Total | 250 (100.0%) | 130 (100.0%) |
Health & Disability in Kentwood
Health Insurance Coverage by Age in Kentwood
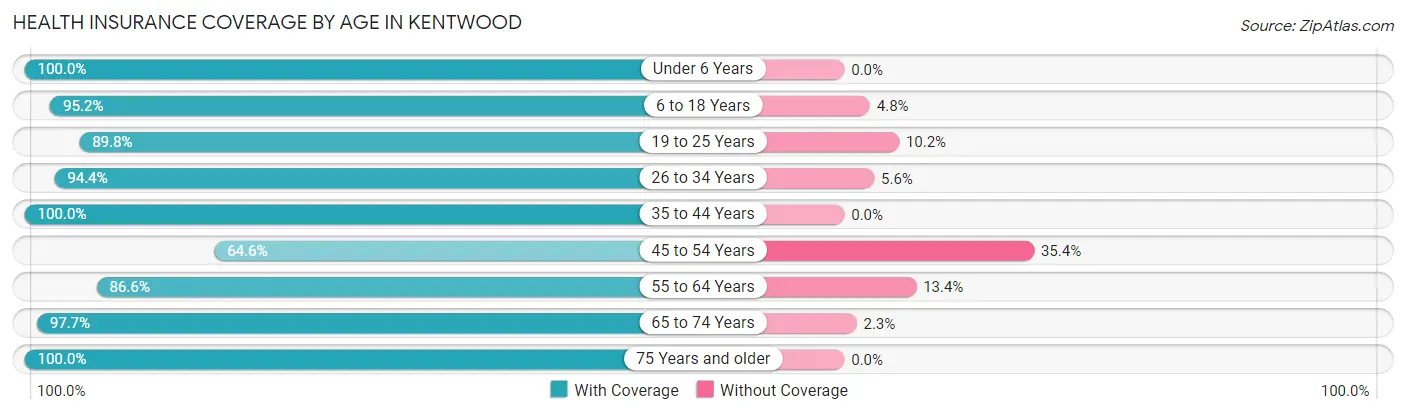
| Age Bracket | With Coverage | Without Coverage |
| Under 6 Years | 127 (100.0%) | 0 (0.0%) |
| 6 to 18 Years | 320 (95.2%) | 16 (4.8%) |
| 19 to 25 Years | 185 (89.8%) | 21 (10.2%) |
| 26 to 34 Years | 187 (94.4%) | 11 (5.6%) |
| 35 to 44 Years | 265 (100.0%) | 0 (0.0%) |
| 45 to 54 Years | 106 (64.6%) | 58 (35.4%) |
| 55 to 64 Years | 142 (86.6%) | 22 (13.4%) |
| 65 to 74 Years | 300 (97.7%) | 7 (2.3%) |
| 75 Years and older | 77 (100.0%) | 0 (0.0%) |
| Total | 1,709 (92.7%) | 135 (7.3%) |
Health Insurance Coverage by Citizenship Status in Kentwood
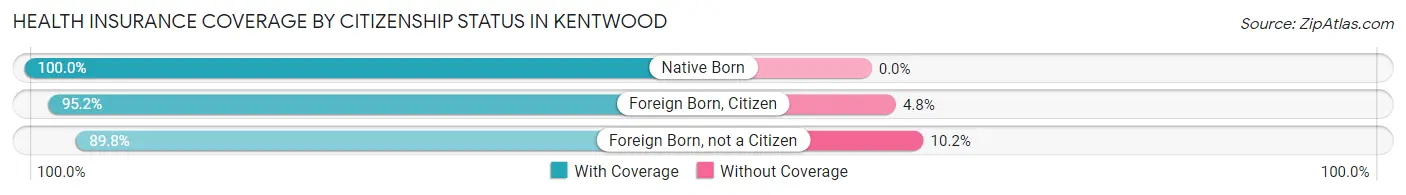
| Citizenship Status | With Coverage | Without Coverage |
| Native Born | 127 (100.0%) | 0 (0.0%) |
| Foreign Born, Citizen | 320 (95.2%) | 16 (4.8%) |
| Foreign Born, not a Citizen | 185 (89.8%) | 21 (10.2%) |
Health Insurance Coverage by Household Income in Kentwood
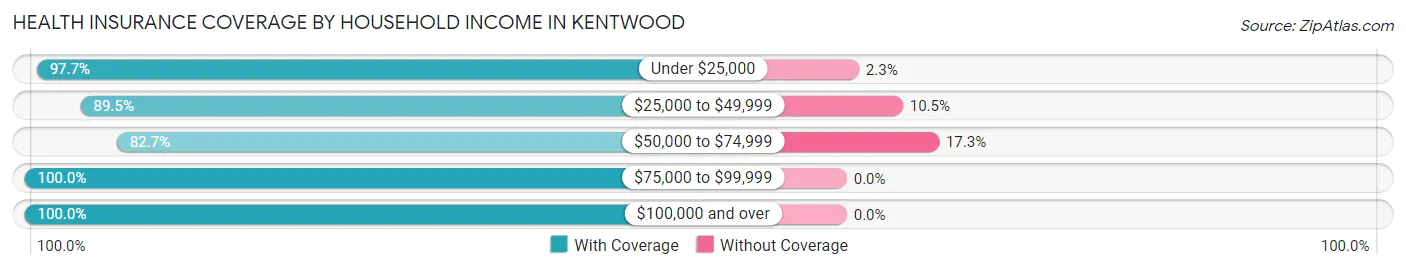
| Household Income | With Coverage | Without Coverage |
| Under $25,000 | 516 (97.7%) | 12 (2.3%) |
| $25,000 to $49,999 | 401 (89.5%) | 47 (10.5%) |
| $50,000 to $74,999 | 364 (82.7%) | 76 (17.3%) |
| $75,000 to $99,999 | 145 (100.0%) | 0 (0.0%) |
| $100,000 and over | 283 (100.0%) | 0 (0.0%) |
Public vs Private Health Insurance Coverage by Age in Kentwood
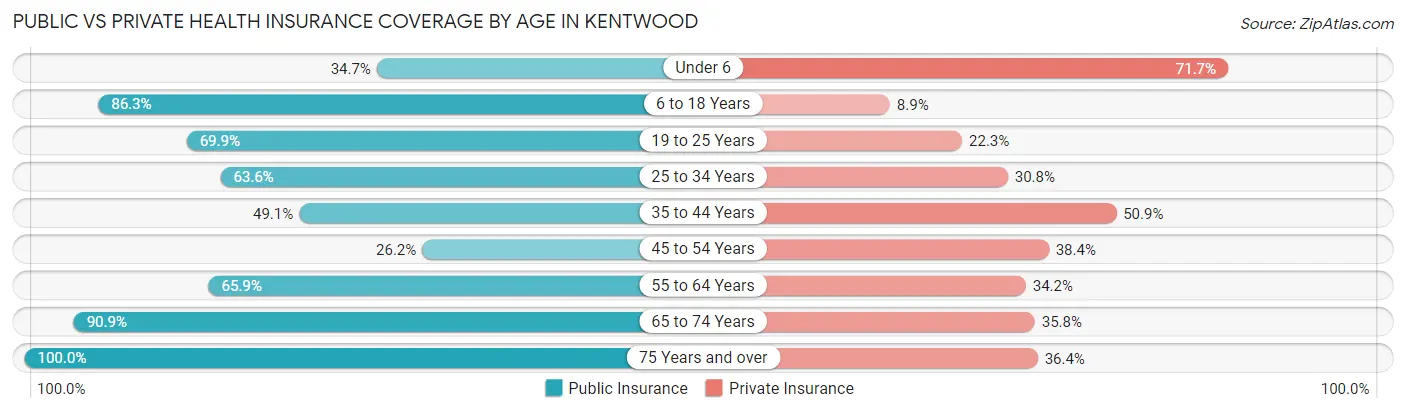
| Age Bracket | Public Insurance | Private Insurance |
| Under 6 | 44 (34.6%) | 91 (71.7%) |
| 6 to 18 Years | 290 (86.3%) | 30 (8.9%) |
| 19 to 25 Years | 144 (69.9%) | 46 (22.3%) |
| 25 to 34 Years | 126 (63.6%) | 61 (30.8%) |
| 35 to 44 Years | 130 (49.1%) | 135 (50.9%) |
| 45 to 54 Years | 43 (26.2%) | 63 (38.4%) |
| 55 to 64 Years | 108 (65.8%) | 56 (34.2%) |
| 65 to 74 Years | 279 (90.9%) | 110 (35.8%) |
| 75 Years and over | 77 (100.0%) | 28 (36.4%) |
| Total | 1,241 (67.3%) | 620 (33.6%) |
Disability Status by Sex by Age in Kentwood
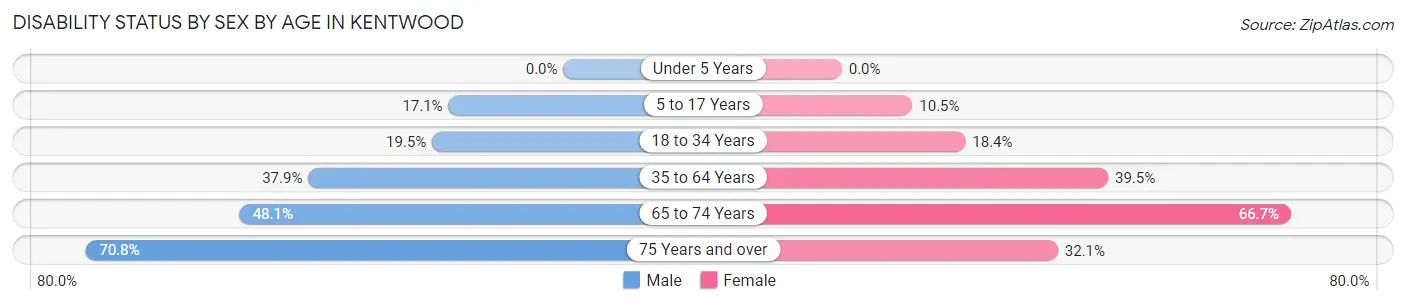
| Age Bracket | Male | Female |
| Under 5 Years | 0 (0.0%) | 0 (0.0%) |
| 5 to 17 Years | 36 (17.1%) | 13 (10.5%) |
| 18 to 34 Years | 30 (19.5%) | 49 (18.3%) |
| 35 to 64 Years | 125 (37.9%) | 104 (39.5%) |
| 65 to 74 Years | 74 (48.0%) | 102 (66.7%) |
| 75 Years and over | 17 (70.8%) | 17 (32.1%) |
Disability Class by Sex by Age in Kentwood
Disability Class: Hearing Difficulty
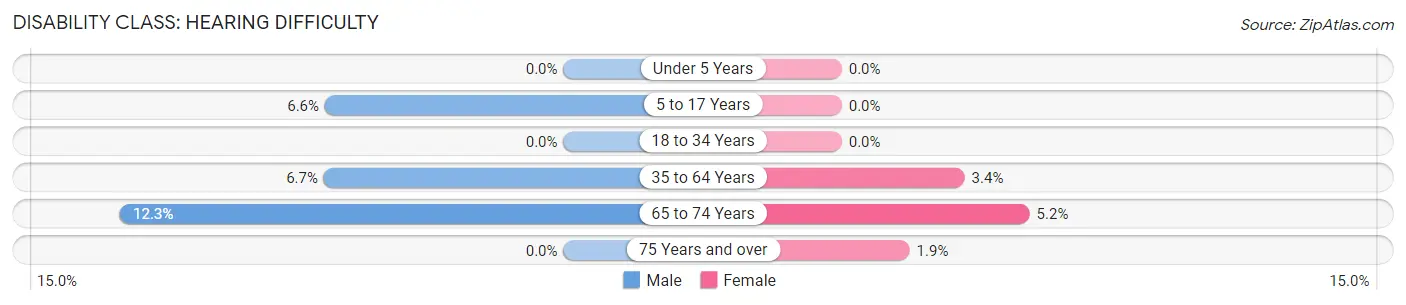
| Age Bracket | Male | Female |
| Under 5 Years | 0 (0.0%) | 0 (0.0%) |
| 5 to 17 Years | 14 (6.6%) | 0 (0.0%) |
| 18 to 34 Years | 0 (0.0%) | 0 (0.0%) |
| 35 to 64 Years | 22 (6.7%) | 9 (3.4%) |
| 65 to 74 Years | 19 (12.3%) | 8 (5.2%) |
| 75 Years and over | 0 (0.0%) | 1 (1.9%) |
Disability Class: Vision Difficulty
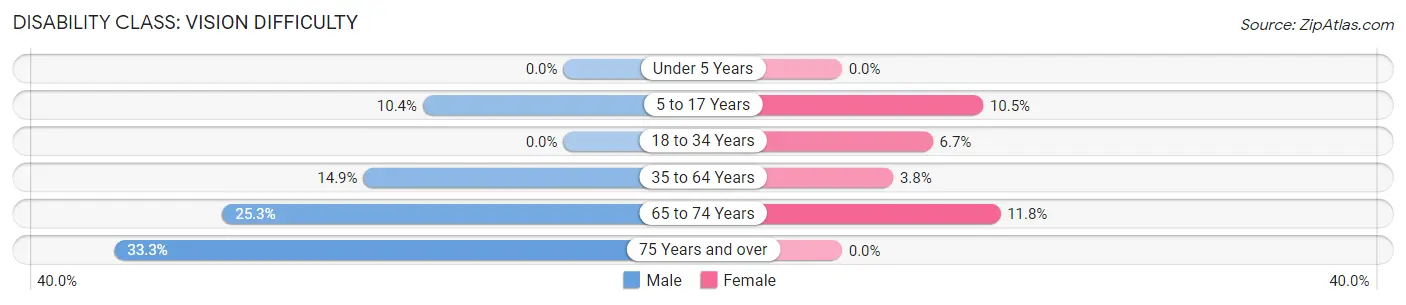
| Age Bracket | Male | Female |
| Under 5 Years | 0 (0.0%) | 0 (0.0%) |
| 5 to 17 Years | 22 (10.4%) | 13 (10.5%) |
| 18 to 34 Years | 0 (0.0%) | 18 (6.7%) |
| 35 to 64 Years | 49 (14.8%) | 10 (3.8%) |
| 65 to 74 Years | 39 (25.3%) | 18 (11.8%) |
| 75 Years and over | 8 (33.3%) | 0 (0.0%) |
Disability Class: Cognitive Difficulty
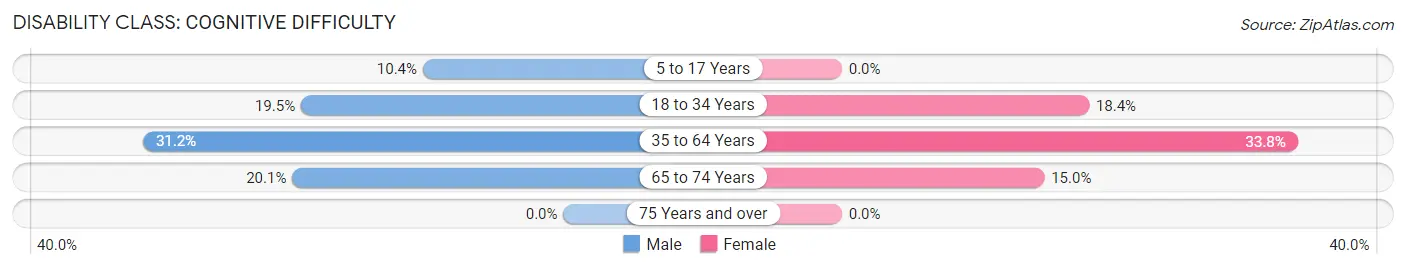
| Age Bracket | Male | Female |
| 5 to 17 Years | 22 (10.4%) | 0 (0.0%) |
| 18 to 34 Years | 30 (19.5%) | 49 (18.3%) |
| 35 to 64 Years | 103 (31.2%) | 89 (33.8%) |
| 65 to 74 Years | 31 (20.1%) | 23 (15.0%) |
| 75 Years and over | 0 (0.0%) | 0 (0.0%) |
Disability Class: Ambulatory Difficulty
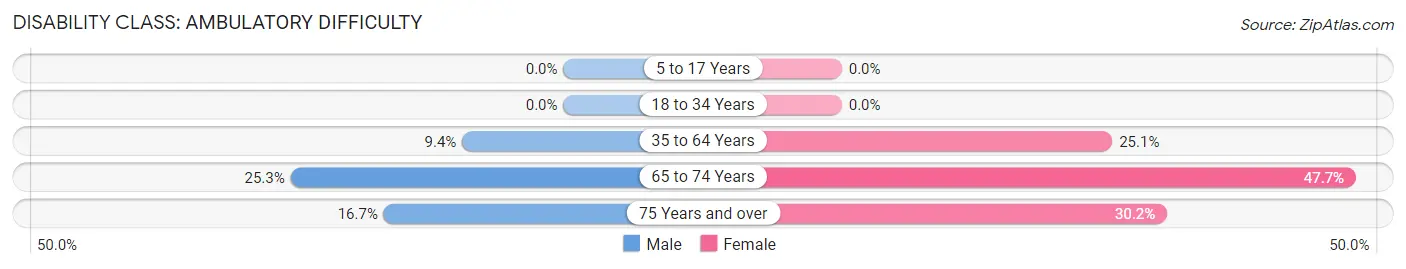
| Age Bracket | Male | Female |
| 5 to 17 Years | 0 (0.0%) | 0 (0.0%) |
| 18 to 34 Years | 0 (0.0%) | 0 (0.0%) |
| 35 to 64 Years | 31 (9.4%) | 66 (25.1%) |
| 65 to 74 Years | 39 (25.3%) | 73 (47.7%) |
| 75 Years and over | 4 (16.7%) | 16 (30.2%) |
Disability Class: Self-Care Difficulty
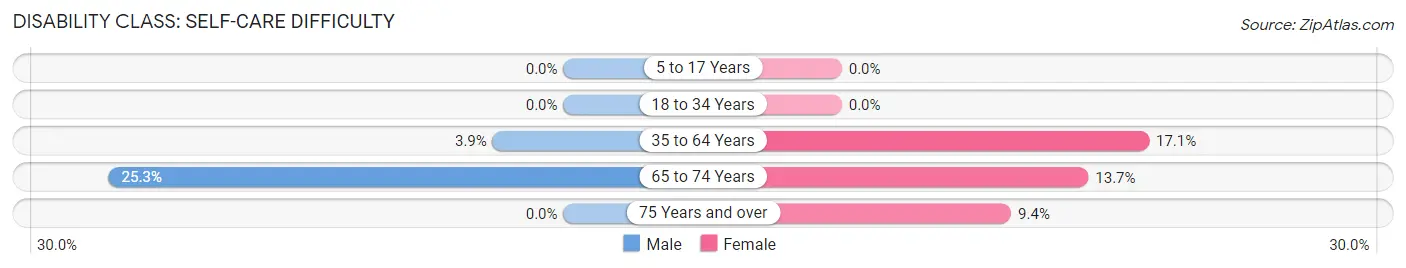
| Age Bracket | Male | Female |
| 5 to 17 Years | 0 (0.0%) | 0 (0.0%) |
| 18 to 34 Years | 0 (0.0%) | 0 (0.0%) |
| 35 to 64 Years | 13 (3.9%) | 45 (17.1%) |
| 65 to 74 Years | 39 (25.3%) | 21 (13.7%) |
| 75 Years and over | 0 (0.0%) | 5 (9.4%) |
Technology Access in Kentwood
Computing Device Access in Kentwood
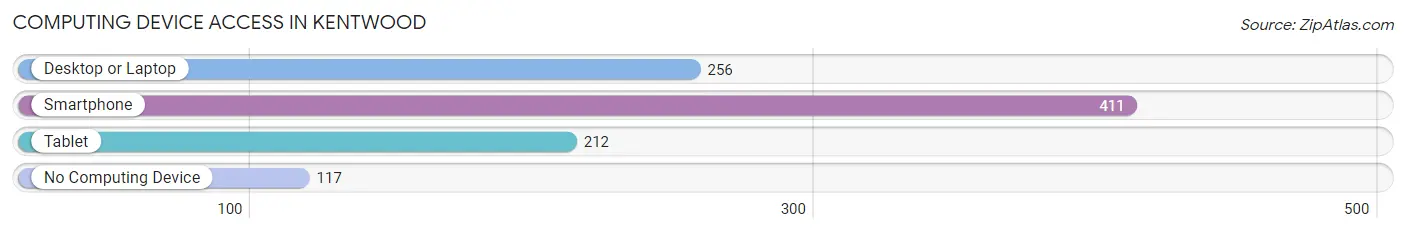
| Device Type | # Households | % Households |
| Desktop or Laptop | 256 | 41.9% |
| Smartphone | 411 | 67.3% |
| Tablet | 212 | 34.7% |
| No Computing Device | 117 | 19.2% |
| Total | 611 | 100.0% |
Internet Access in Kentwood
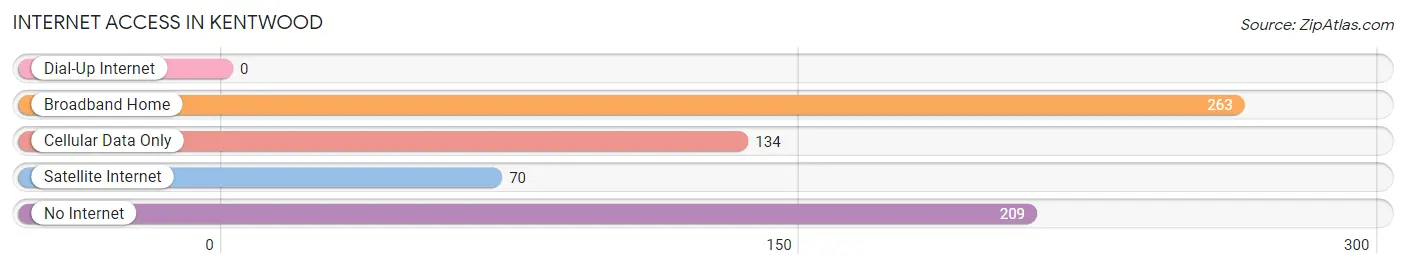
| Internet Type | # Households | % Households |
| Dial-Up Internet | 0 | 0.0% |
| Broadband Home | 263 | 43.0% |
| Cellular Data Only | 134 | 21.9% |
| Satellite Internet | 70 | 11.5% |
| No Internet | 209 | 34.2% |
| Total | 611 | 100.0% |
Kentwood Summary
Kentwood, Louisiana is a small town located in Tangipahoa Parish, Louisiana. It is situated in the southeastern part of the state, approximately 50 miles north of New Orleans. The town has a population of approximately 2,000 people and is the county seat of Tangipahoa Parish.
Geography
Kentwood is located in the southeastern part of Louisiana, approximately 50 miles north of New Orleans. The town is situated in the northern part of Tangipahoa Parish, which is bordered by the Amite River to the east and the Pearl River to the west. The town is located on the western edge of the Florida Parishes, a region of southeastern Louisiana that is characterized by its rolling hills and pine forests. The town is situated at an elevation of approximately 200 feet above sea level.
The climate in Kentwood is humid subtropical, with hot, humid summers and mild winters. The average annual temperature is around 70 degrees Fahrenheit, with temperatures reaching as high as 95 degrees in the summer and as low as 40 degrees in the winter. The average annual precipitation is around 50 inches, with most of the rain falling in the spring and summer months.
Economy
The economy of Kentwood is largely based on agriculture and forestry. The town is home to several large farms, which produce a variety of crops, including corn, soybeans, cotton, and wheat. The town is also home to several lumber mills, which produce lumber for use in construction and furniture making.
In addition to agriculture and forestry, Kentwood is home to several small businesses, including restaurants, retail stores, and service providers. The town is also home to a number of manufacturing companies, which produce a variety of products, including furniture, clothing, and electronics.
Demographics
As of the 2010 census, the population of Kentwood was 2,000 people. The racial makeup of the town was 79.2% White, 17.2% African American, 0.7% Native American, 0.3% Asian, 0.1% Pacific Islander, and 2.5% from other races. The median household income was $30,000, and the median family income was $35,000.
The town is served by the Tangipahoa Parish School District, which includes two elementary schools, one middle school, and one high school. The town is also home to a number of churches, including Baptist, Methodist, and Catholic.
Conclusion
Kentwood, Louisiana is a small town located in Tangipahoa Parish, Louisiana. It is situated in the southeastern part of the state, approximately 50 miles north of New Orleans. The town has a population of approximately 2,000 people and is the county seat of Tangipahoa Parish. The economy of Kentwood is largely based on agriculture and forestry, and the town is home to several small businesses, including restaurants, retail stores, and service providers. The racial makeup of the town is 79.2% White, 17.2% African American, 0.7% Native American, 0.3% Asian, 0.1% Pacific Islander, and 2.5% from other races. The town is served by the Tangipahoa Parish School District, which includes two elementary schools, one middle school, and one high school.
Common Questions
What is Per Capita Income in Kentwood?
Per Capita income in Kentwood is $21,730.
What is the Median Family Income in Kentwood?
Median Family Income in Kentwood is $32,396.
What is the Median Household income in Kentwood?
Median Household Income in Kentwood is $29,856.
What is Income or Wage Gap in Kentwood?
Income or Wage Gap in Kentwood is 16.9%.
Women in Kentwood earn 83.1 cents for every dollar earned by a man.
What is Inequality or Gini Index in Kentwood?
Inequality or Gini Index in Kentwood is 0.55.
What is the Total Population of Kentwood?
Total Population of Kentwood is 1,932.
What is the Total Male Population of Kentwood?
Total Male Population of Kentwood is 1,004.
What is the Total Female Population of Kentwood?
Total Female Population of Kentwood is 928.
What is the Ratio of Males per 100 Females in Kentwood?
There are 108.19 Males per 100 Females in Kentwood.
What is the Ratio of Females per 100 Males in Kentwood?
There are 92.43 Females per 100 Males in Kentwood.
What is the Median Population Age in Kentwood?
Median Population Age in Kentwood is 36.7 Years.
What is the Average Family Size in Kentwood
Average Family Size in Kentwood is 3.9 People.
What is the Average Household Size in Kentwood
Average Household Size in Kentwood is 3.0 People.
How Large is the Labor Force in Kentwood?
There are 634 People in the Labor Forcein in Kentwood.
What is the Percentage of People in the Labor Force in Kentwood?
40.9% of People are in the Labor Force in Kentwood.
What is the Unemployment Rate in Kentwood?
Unemployment Rate in Kentwood is 15.8%.