Kaplan, LA Map & Demographics
Kaplan Map
Kaplan Overview
$25,808
PER CAPITA INCOME
$66,045
AVG FAMILY INCOME
$38,505
AVG HOUSEHOLD INCOME
39.0%
WAGE / INCOME GAP [ % ]
61.0¢/ $1
WAGE / INCOME GAP [ $ ]
0.50
INEQUALITY / GINI INDEX
4,335
TOTAL POPULATION
2,281
MALE POPULATION
2,054
FEMALE POPULATION
111.05
MALES / 100 FEMALES
90.05
FEMALES / 100 MALES
43.4
MEDIAN AGE
3.1
AVG FAMILY SIZE
2.3
AVG HOUSEHOLD SIZE
1,449
LABOR FORCE [ PEOPLE ]
41.4%
PERCENT IN LABOR FORCE
9.0%
UNEMPLOYMENT RATE
Kaplan Zip Codes
Kaplan Area Codes
Income in Kaplan
Income Overview in Kaplan
Per Capita Income in Kaplan is $25,808, while median incomes of families and households are $66,045 and $38,505 respectively.
| Characteristic | Number | Measure |
| Per Capita Income | 4,335 | $25,808 |
| Median Family Income | 1,007 | $66,045 |
| Mean Family Income | 1,007 | $73,923 |
| Median Household Income | 1,823 | $38,505 |
| Mean Household Income | 1,823 | $59,714 |
| Income Deficit | 1,007 | $0 |
| Wage / Income Gap (%) | 4,335 | 39.01% |
| Wage / Income Gap ($) | 4,335 | 60.99¢ per $1 |
| Gini / Inequality Index | 4,335 | 0.50 |
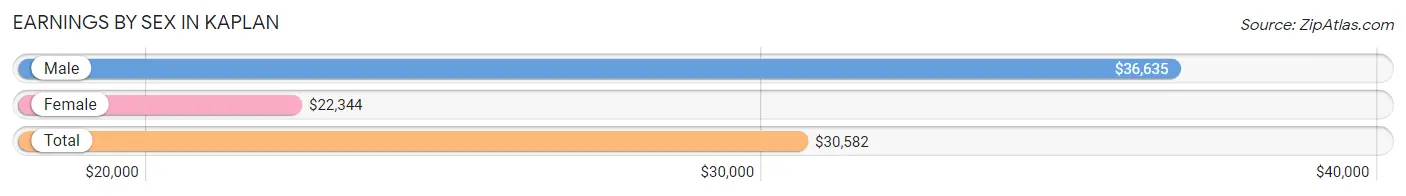
Earnings by Sex in Kaplan
Average Earnings in Kaplan are $30,582, $36,635 for men and $22,344 for women, a difference of 39.0%.
| Sex | Number | Average Earnings |
| Male | 894 (56.8%) | $36,635 |
| Female | 679 (43.2%) | $22,344 |
| Total | 1,573 (100.0%) | $30,582 |
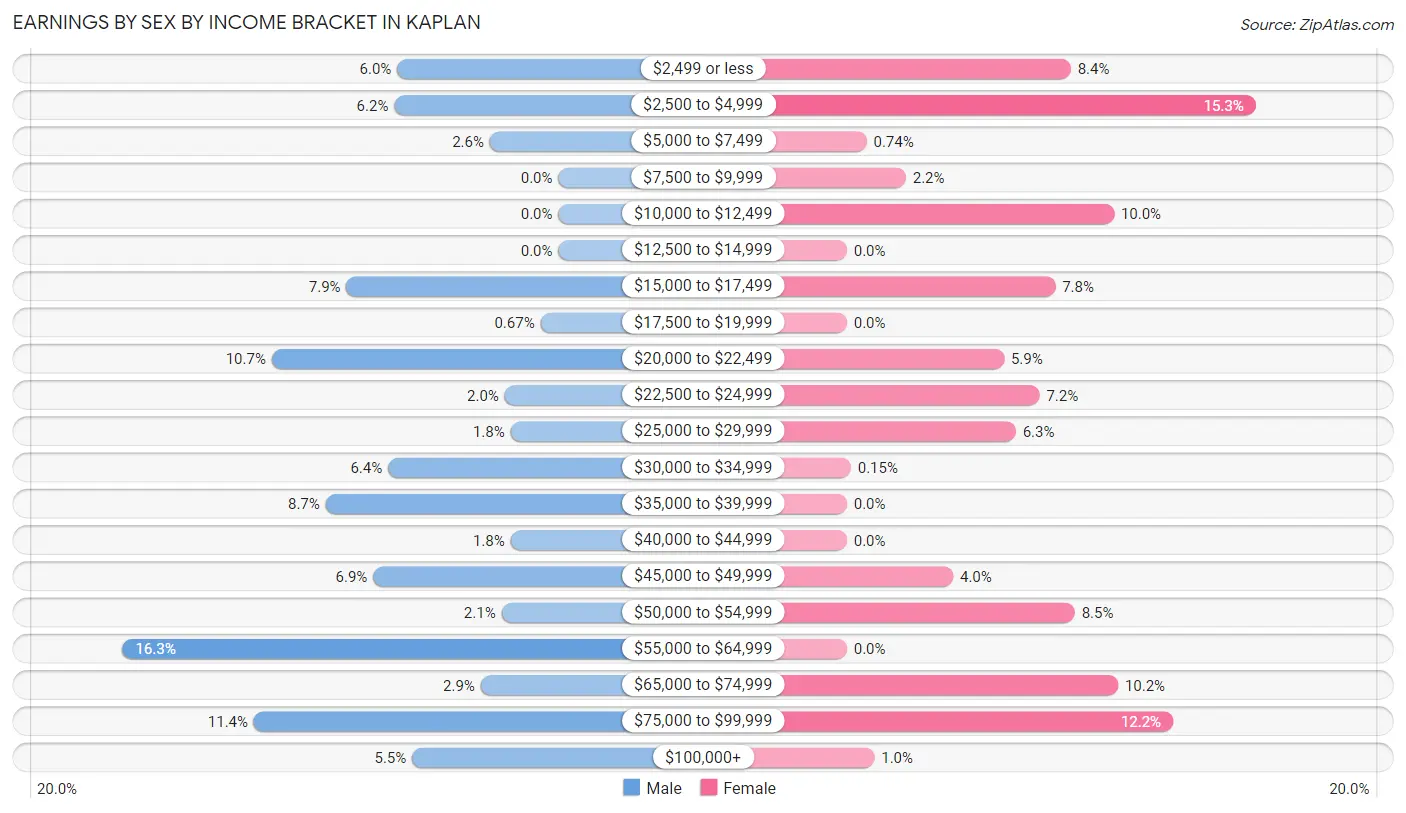
Earnings by Sex by Income Bracket in Kaplan
The most common earnings brackets in Kaplan are $55,000 to $64,999 for men (146 | 16.3%) and $2,500 to $4,999 for women (104 | 15.3%).
| Income | Male | Female |
| $2,499 or less | 54 (6.0%) | 57 (8.4%) |
| $2,500 to $4,999 | 55 (6.1%) | 104 (15.3%) |
| $5,000 to $7,499 | 23 (2.6%) | 5 (0.7%) |
| $7,500 to $9,999 | 0 (0.0%) | 15 (2.2%) |
| $10,000 to $12,499 | 0 (0.0%) | 68 (10.0%) |
| $12,500 to $14,999 | 0 (0.0%) | 0 (0.0%) |
| $15,000 to $17,499 | 71 (7.9%) | 53 (7.8%) |
| $17,500 to $19,999 | 6 (0.7%) | 0 (0.0%) |
| $20,000 to $22,499 | 96 (10.7%) | 40 (5.9%) |
| $22,500 to $24,999 | 18 (2.0%) | 49 (7.2%) |
| $25,000 to $29,999 | 16 (1.8%) | 43 (6.3%) |
| $30,000 to $34,999 | 57 (6.4%) | 1 (0.2%) |
| $35,000 to $39,999 | 78 (8.7%) | 0 (0.0%) |
| $40,000 to $44,999 | 16 (1.8%) | 0 (0.0%) |
| $45,000 to $49,999 | 62 (6.9%) | 27 (4.0%) |
| $50,000 to $54,999 | 19 (2.1%) | 58 (8.5%) |
| $55,000 to $64,999 | 146 (16.3%) | 0 (0.0%) |
| $65,000 to $74,999 | 26 (2.9%) | 69 (10.2%) |
| $75,000 to $99,999 | 102 (11.4%) | 83 (12.2%) |
| $100,000+ | 49 (5.5%) | 7 (1.0%) |
| Total | 894 (100.0%) | 679 (100.0%) |
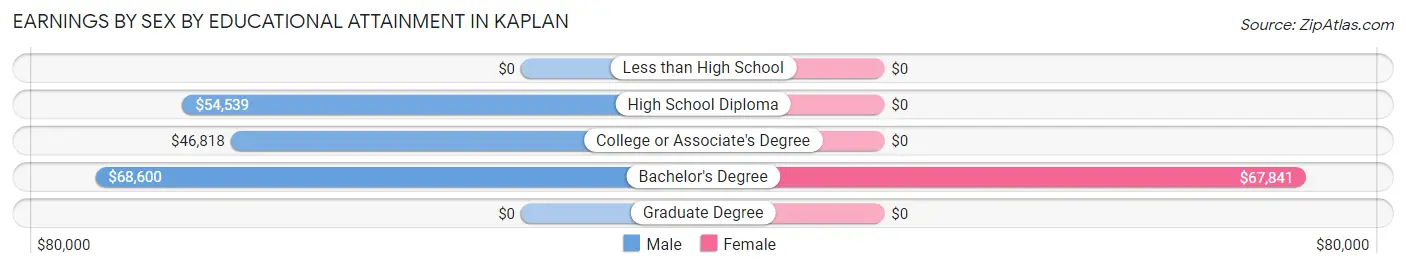
Earnings by Sex by Educational Attainment in Kaplan
| Educational Attainment | Male Income | Female Income |
| Less than High School | - | - |
| High School Diploma | $54,539 | $0 |
| College or Associate's Degree | $46,818 | $0 |
| Bachelor's Degree | $68,600 | $67,841 |
| Graduate Degree | - | - |
| Total | $53,289 | $0 |
Family Income in Kaplan
Family Income Brackets in Kaplan
According to the Kaplan family income data, there are 212 families falling into the $75,000 to $99,999 income range, which is the most common income bracket and makes up 21.0% of all families.
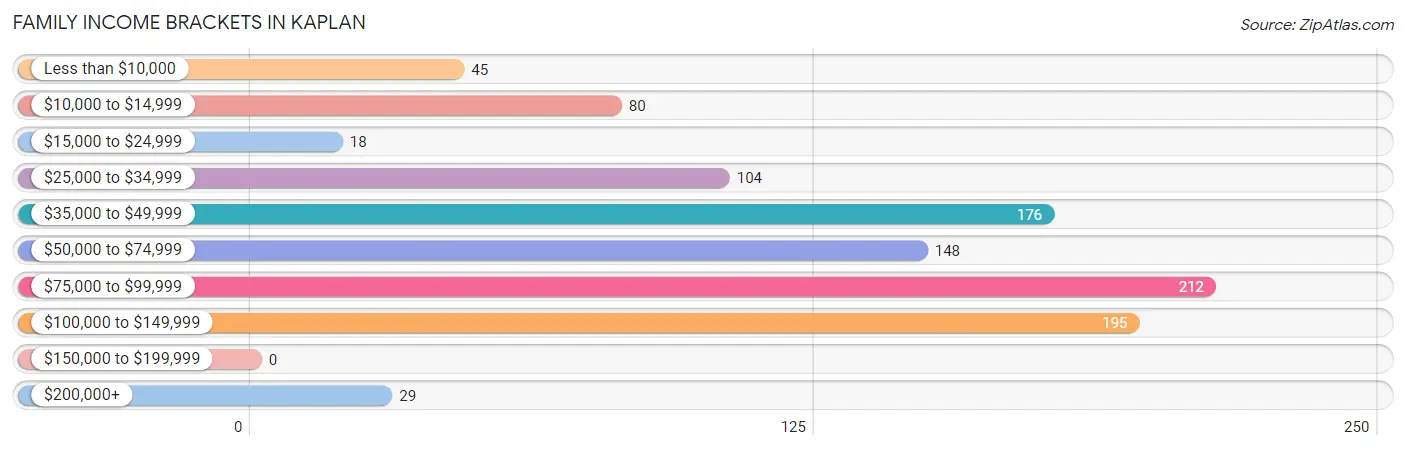
| Income Bracket | # Families | % Families |
| Less than $10,000 | 45 | 4.5% |
| $10,000 to $14,999 | 80 | 7.9% |
| $15,000 to $24,999 | 18 | 1.8% |
| $25,000 to $34,999 | 104 | 10.3% |
| $35,000 to $49,999 | 176 | 17.5% |
| $50,000 to $74,999 | 148 | 14.7% |
| $75,000 to $99,999 | 212 | 21.1% |
| $100,000 to $149,999 | 195 | 19.4% |
| $150,000 to $199,999 | 0 | 0.0% |
| $200,000+ | 29 | 2.9% |
Family Income by Famaliy Size in Kaplan
2-person families (483 | 48.0%) account for the highest median family income in Kaplan with $63,828 per family, while 2-person families (483 | 48.0%) have the highest median income of $31,914 per family member.
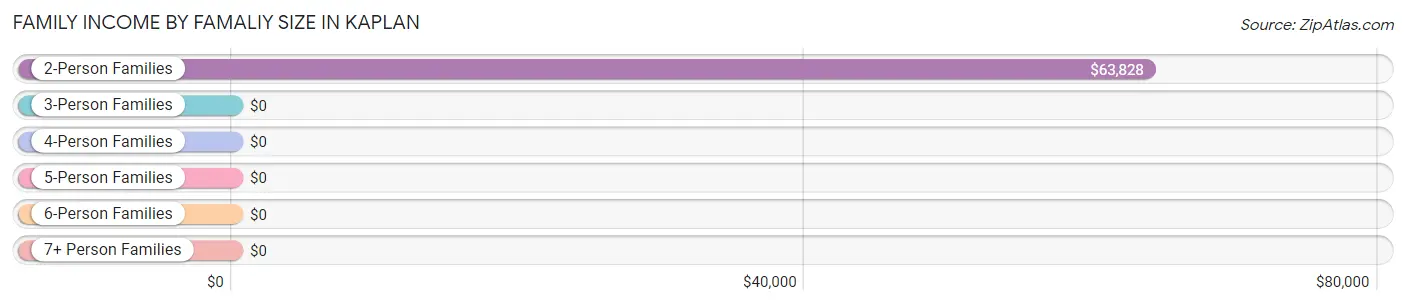
| Income Bracket | # Families | Median Income |
| 2-Person Families | 483 (48.0%) | $63,828 |
| 3-Person Families | 191 (19.0%) | $0 |
| 4-Person Families | 219 (21.7%) | $0 |
| 5-Person Families | 74 (7.3%) | $0 |
| 6-Person Families | 40 (4.0%) | $0 |
| 7+ Person Families | 0 (0.0%) | $0 |
| Total | 1,007 (100.0%) | $66,045 |
Family Income by Number of Earners in Kaplan
The median family income in Kaplan is $66,045, with families comprising 2 earners (248) having the highest median family income of $98,784, while families with no earners (309) have the lowest median family income of $36,641, accounting for 24.6% and 30.7% of families, respectively.
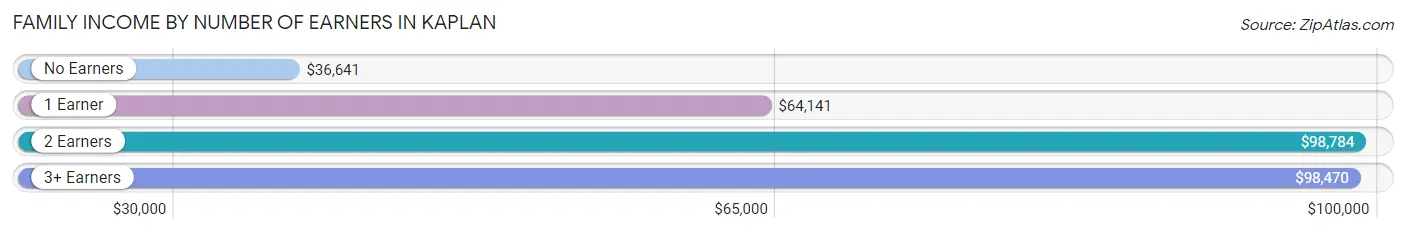
| Number of Earners | # Families | Median Income |
| No Earners | 309 (30.7%) | $36,641 |
| 1 Earner | 325 (32.3%) | $64,141 |
| 2 Earners | 248 (24.6%) | $98,784 |
| 3+ Earners | 125 (12.4%) | $98,470 |
| Total | 1,007 (100.0%) | $66,045 |
Household Income in Kaplan
Household Income Brackets in Kaplan
With 286 households falling in the category, the $50,000 to $74,999 income range is the most frequent in Kaplan, accounting for 15.7% of all households.
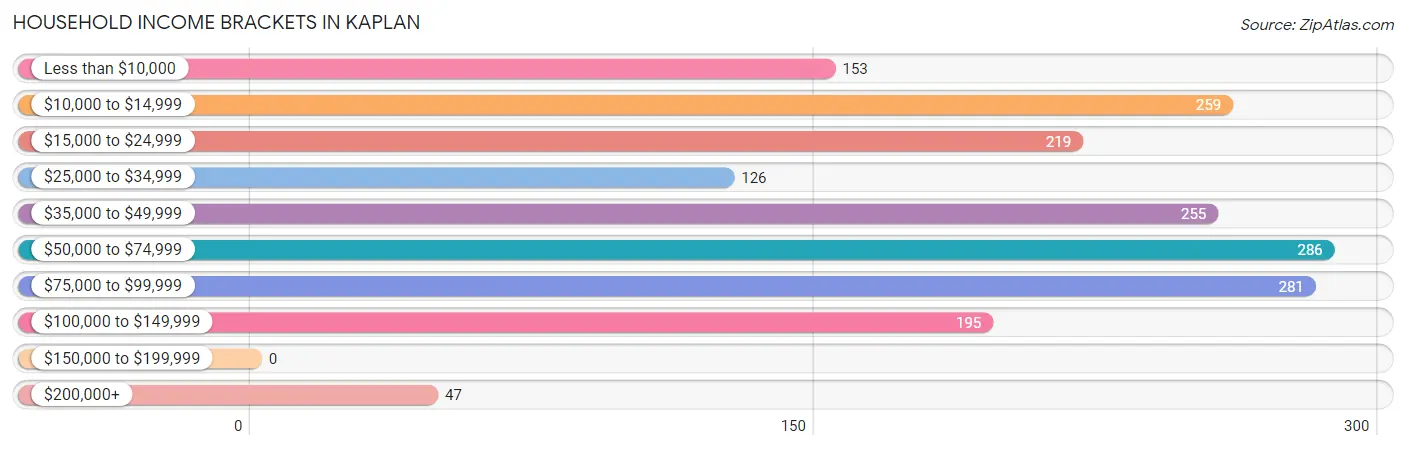
| Income Bracket | # Households | % Households |
| Less than $10,000 | 153 | 8.4% |
| $10,000 to $14,999 | 259 | 14.2% |
| $15,000 to $24,999 | 219 | 12.0% |
| $25,000 to $34,999 | 126 | 6.9% |
| $35,000 to $49,999 | 255 | 14.0% |
| $50,000 to $74,999 | 286 | 15.7% |
| $75,000 to $99,999 | 281 | 15.4% |
| $100,000 to $149,999 | 195 | 10.7% |
| $150,000 to $199,999 | 0 | 0.0% |
| $200,000+ | 47 | 2.6% |
Household Income by Householder Age in Kaplan
The median household income in Kaplan is $38,505, with the highest median household income of $66,972 found in the 25 to 44 years age bracket for the primary householder. A total of 380 households (20.8%) fall into this category. Meanwhile, the 15 to 24 years age bracket for the primary householder has the lowest median household income of $0, with 268 households (14.7%) in this group.
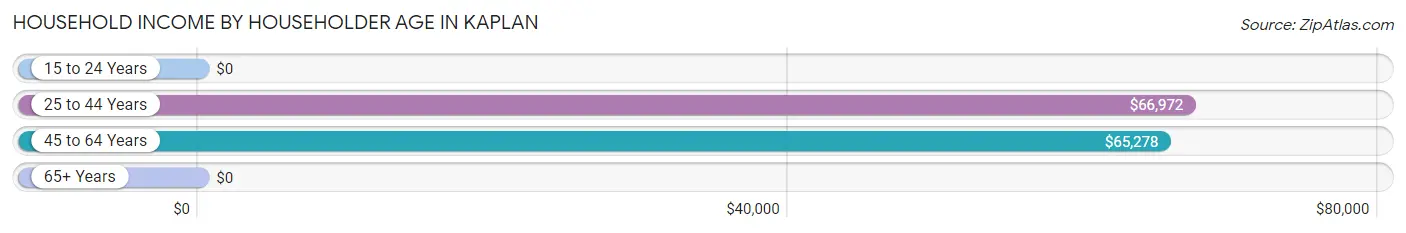
| Income Bracket | # Households | Median Income |
| 15 to 24 Years | 268 (14.7%) | $0 |
| 25 to 44 Years | 380 (20.8%) | $66,972 |
| 45 to 64 Years | 602 (33.0%) | $65,278 |
| 65+ Years | 573 (31.4%) | $0 |
| Total | 1,823 (100.0%) | $38,505 |
Poverty in Kaplan
Income Below Poverty by Sex and Age in Kaplan
With 26.8% poverty level for males and 30.8% for females among the residents of Kaplan, under 5 year old males and 6 to 11 year old females are the most vulnerable to poverty, with 97 males (100.0%) and 47 females (92.2%) in their respective age groups living below the poverty level.
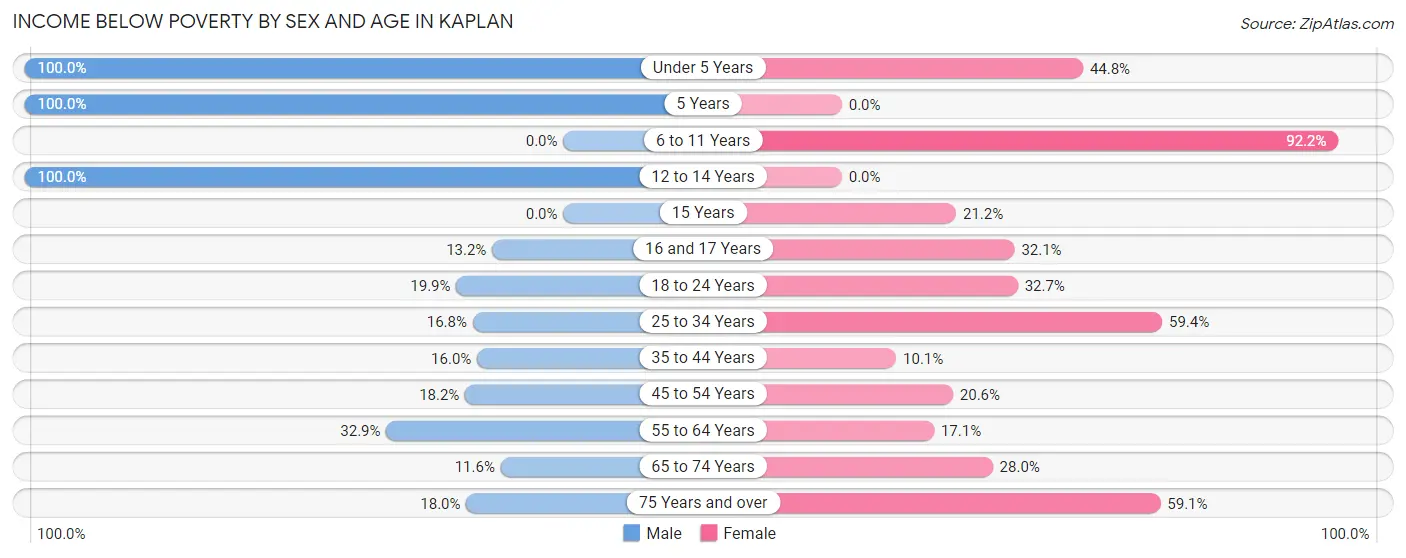
| Age Bracket | Male | Female |
| Under 5 Years | 97 (100.0%) | 94 (44.8%) |
| 5 Years | 76 (100.0%) | 0 (0.0%) |
| 6 to 11 Years | 0 (0.0%) | 47 (92.2%) |
| 12 to 14 Years | 31 (100.0%) | 0 (0.0%) |
| 15 Years | 0 (0.0%) | 14 (21.2%) |
| 16 and 17 Years | 7 (13.2%) | 25 (32.1%) |
| 18 to 24 Years | 55 (19.9%) | 64 (32.7%) |
| 25 to 34 Years | 42 (16.8%) | 85 (59.4%) |
| 35 to 44 Years | 28 (16.0%) | 24 (10.1%) |
| 45 to 54 Years | 39 (18.2%) | 34 (20.6%) |
| 55 to 64 Years | 159 (32.9%) | 58 (17.1%) |
| 65 to 74 Years | 28 (11.6%) | 42 (28.0%) |
| 75 Years and over | 36 (18.0%) | 136 (59.1%) |
| Total | 598 (26.8%) | 623 (30.8%) |
Income Above Poverty by Sex and Age in Kaplan
According to the poverty statistics in Kaplan, males aged 6 to 11 years and females aged 12 to 14 years are the age groups that are most secure financially, with 100.0% of males and 100.0% of females in these age groups living above the poverty line.
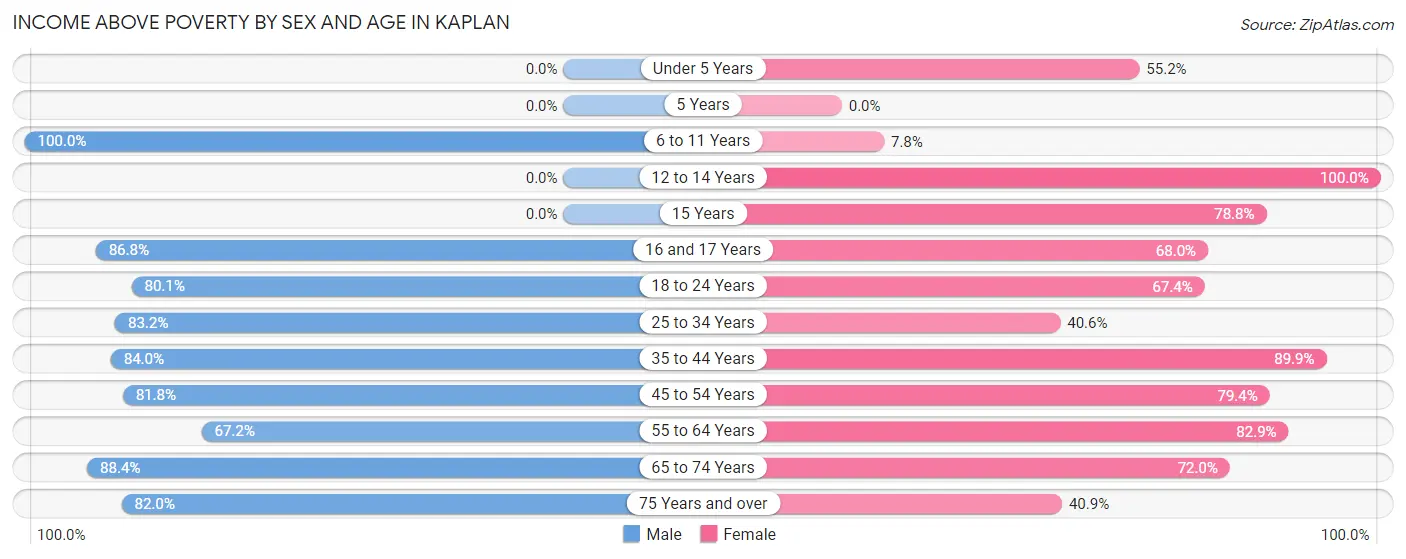
| Age Bracket | Male | Female |
| Under 5 Years | 0 (0.0%) | 116 (55.2%) |
| 5 Years | 0 (0.0%) | 0 (0.0%) |
| 6 to 11 Years | 131 (100.0%) | 4 (7.8%) |
| 12 to 14 Years | 0 (0.0%) | 155 (100.0%) |
| 15 Years | 0 (0.0%) | 52 (78.8%) |
| 16 and 17 Years | 46 (86.8%) | 53 (67.9%) |
| 18 to 24 Years | 222 (80.1%) | 132 (67.3%) |
| 25 to 34 Years | 208 (83.2%) | 58 (40.6%) |
| 35 to 44 Years | 147 (84.0%) | 214 (89.9%) |
| 45 to 54 Years | 175 (81.8%) | 131 (79.4%) |
| 55 to 64 Years | 325 (67.1%) | 281 (82.9%) |
| 65 to 74 Years | 213 (88.4%) | 108 (72.0%) |
| 75 Years and over | 164 (82.0%) | 94 (40.9%) |
| Total | 1,631 (73.2%) | 1,398 (69.2%) |
Income Below Poverty Among Married-Couple Families in Kaplan
The poverty statistics for married-couple families in Kaplan show that 9.0% or 72 of the total 798 families live below the poverty line. Families with 1 or 2 children have the highest poverty rate of 22.9%, comprising of 56 families. On the other hand, families with 3 or 4 children have the lowest poverty rate of 0.0%, which includes 0 families.
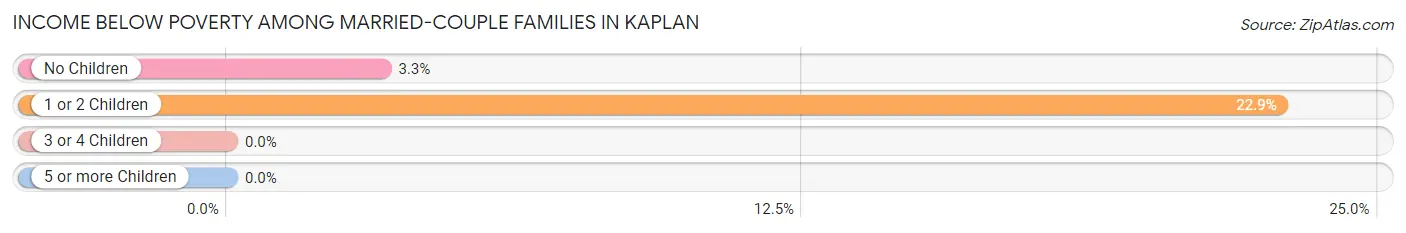
| Children | Above Poverty | Below Poverty |
| No Children | 463 (96.7%) | 16 (3.3%) |
| 1 or 2 Children | 189 (77.1%) | 56 (22.9%) |
| 3 or 4 Children | 74 (100.0%) | 0 (0.0%) |
| 5 or more Children | 0 (0.0%) | 0 (0.0%) |
| Total | 726 (91.0%) | 72 (9.0%) |
Income Below Poverty Among Single-Parent Households in Kaplan
According to the poverty data in Kaplan, 30.4% or 21 single-father households and 62.9% or 88 single-mother households are living below the poverty line. Among single-father households, those with 3 or 4 children have the highest poverty rate, with 21 households (100.0%) experiencing poverty. Likewise, among single-mother households, those with 3 or 4 children have the highest poverty rate, with 64 households (100.0%) falling below the poverty line.
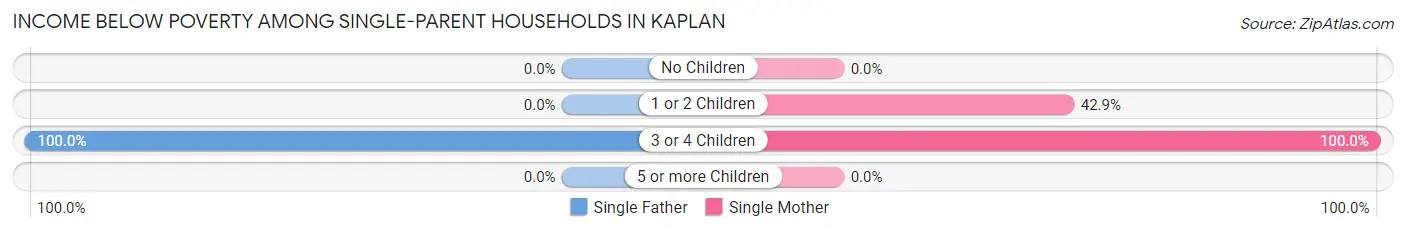
| Children | Single Father | Single Mother |
| No Children | 0 (0.0%) | 0 (0.0%) |
| 1 or 2 Children | 0 (0.0%) | 24 (42.9%) |
| 3 or 4 Children | 21 (100.0%) | 64 (100.0%) |
| 5 or more Children | 0 (0.0%) | 0 (0.0%) |
| Total | 21 (30.4%) | 88 (62.9%) |
Income Below Poverty Among Married-Couple vs Single-Parent Households in Kaplan
The poverty data for Kaplan shows that 72 of the married-couple family households (9.0%) and 109 of the single-parent households (52.1%) are living below the poverty level. Within the married-couple family households, those with 1 or 2 children have the highest poverty rate, with 56 households (22.9%) falling below the poverty line. Among the single-parent households, those with 3 or 4 children have the highest poverty rate, with 85 household (100.0%) living below poverty.
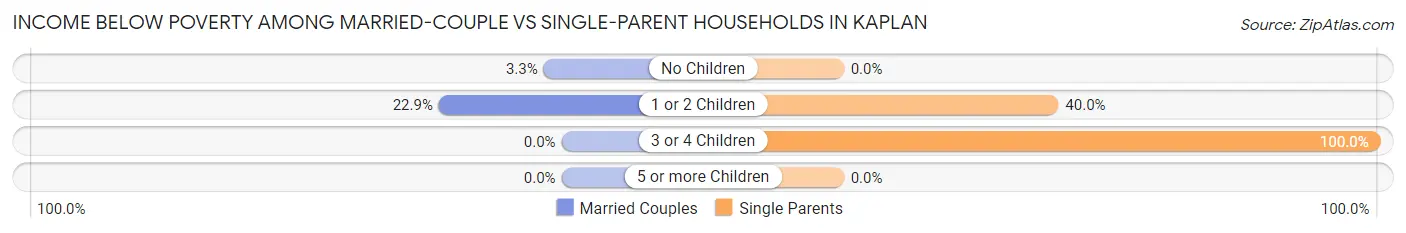
| Children | Married-Couple Families | Single-Parent Households |
| No Children | 16 (3.3%) | 0 (0.0%) |
| 1 or 2 Children | 56 (22.9%) | 24 (40.0%) |
| 3 or 4 Children | 0 (0.0%) | 85 (100.0%) |
| 5 or more Children | 0 (0.0%) | 0 (0.0%) |
| Total | 72 (9.0%) | 109 (52.1%) |
Race in Kaplan
The most populous races in Kaplan are White / Caucasian (3,881 | 89.5%), Black / African American (275 | 6.3%), and Hawaiian / Pacific (91 | 2.1%).
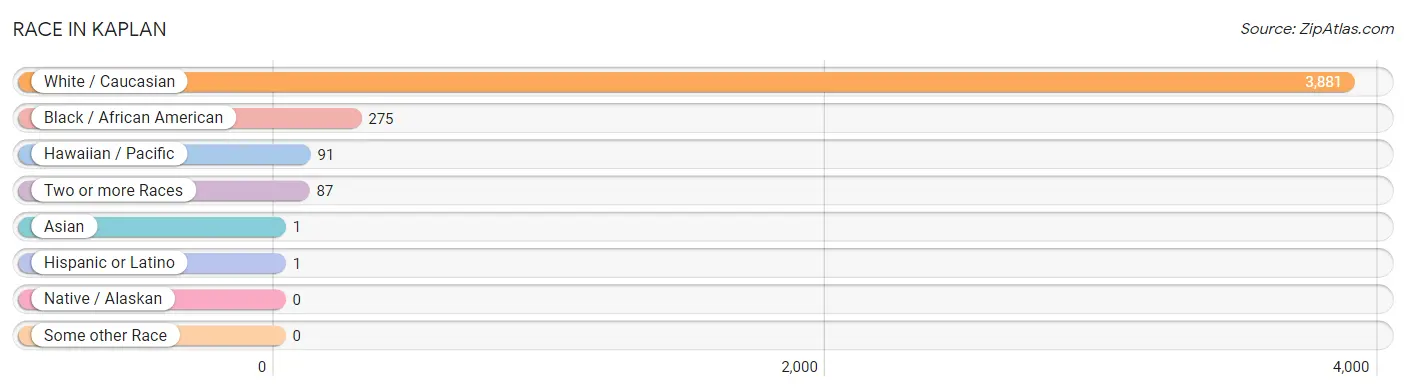
| Race | # Population | % Population |
| Asian | 1 | 0.0% |
| Black / African American | 275 | 6.3% |
| Hawaiian / Pacific | 91 | 2.1% |
| Hispanic or Latino | 1 | 0.0% |
| Native / Alaskan | 0 | 0.0% |
| White / Caucasian | 3,881 | 89.5% |
| Two or more Races | 87 | 2.0% |
| Some other Race | 0 | 0.0% |
| Total | 4,335 | 100.0% |
Ancestry in Kaplan
The most populous ancestries reported in Kaplan are German (930 | 21.4%), French (665 | 15.3%), French Canadian (469 | 10.8%), Cajun (325 | 7.5%), and American (256 | 5.9%), together accounting for 61.0% of all Kaplan residents.
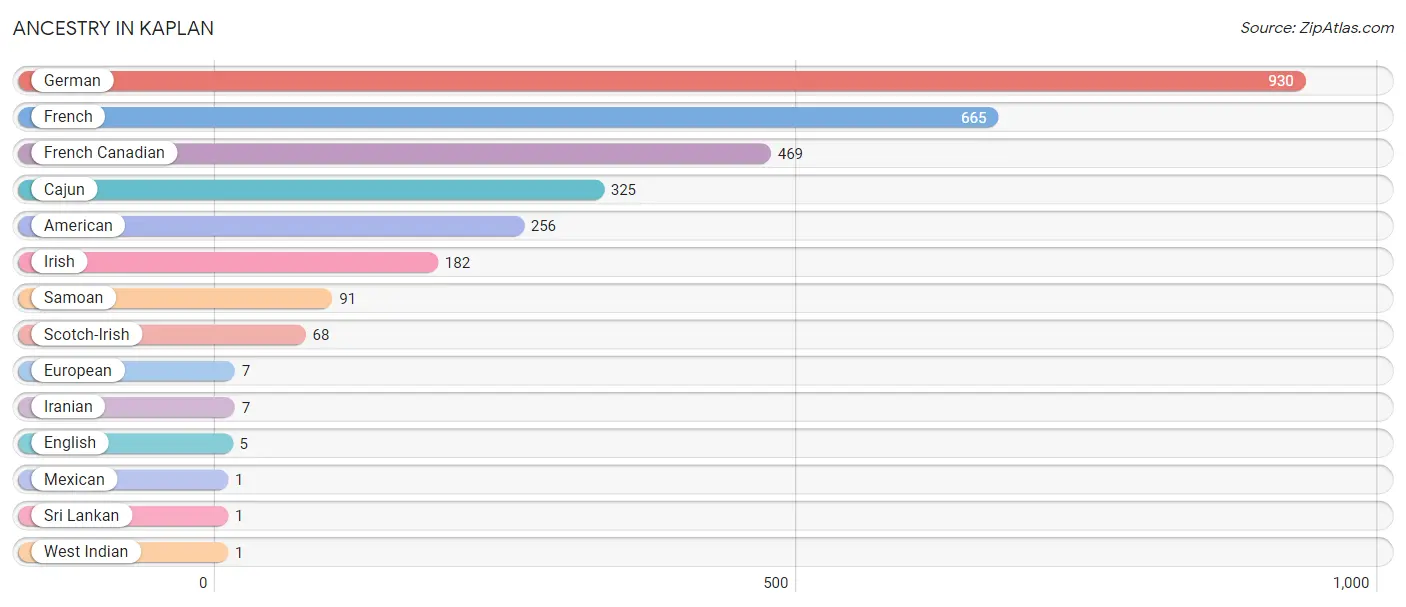
| Ancestry | # Population | % Population |
| American | 256 | 5.9% |
| Cajun | 325 | 7.5% |
| English | 5 | 0.1% |
| European | 7 | 0.2% |
| French | 665 | 15.3% |
| French Canadian | 469 | 10.8% |
| German | 930 | 21.4% |
| Iranian | 7 | 0.2% |
| Irish | 182 | 4.2% |
| Mexican | 1 | 0.0% |
| Samoan | 91 | 2.1% |
| Scotch-Irish | 68 | 1.6% |
| Sri Lankan | 1 | 0.0% |
| West Indian | 1 | 0.0% | View All 14 Rows |
Immigrants in Kaplan
The most numerous immigrant groups reported in Kaplan came from Europe (9 | 0.2%), Germany (9 | 0.2%), Western Europe (9 | 0.2%), Asia (1 | 0.0%), and Belize (1 | 0.0%), together accounting for 0.7% of all Kaplan residents.
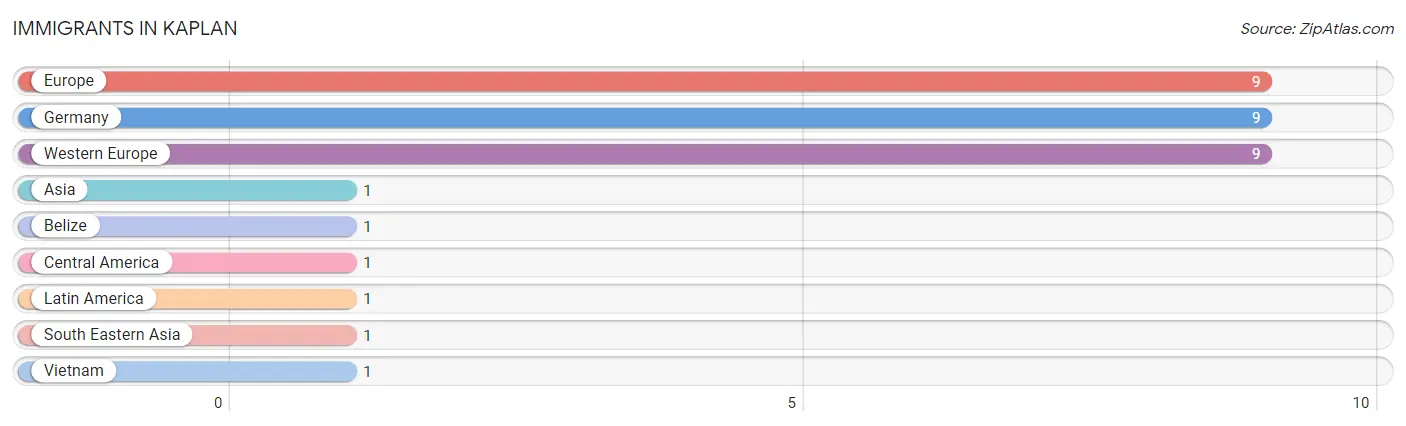
| Immigration Origin | # Population | % Population |
| Asia | 1 | 0.0% |
| Belize | 1 | 0.0% |
| Central America | 1 | 0.0% |
| Europe | 9 | 0.2% |
| Germany | 9 | 0.2% |
| Latin America | 1 | 0.0% |
| South Eastern Asia | 1 | 0.0% |
| Vietnam | 1 | 0.0% |
| Western Europe | 9 | 0.2% | View All 9 Rows |
Sex and Age in Kaplan
Sex and Age in Kaplan
The most populous age groups in Kaplan are 60 to 64 Years (321 | 14.1%) for men and 60 to 64 Years (230 | 11.2%) for women.
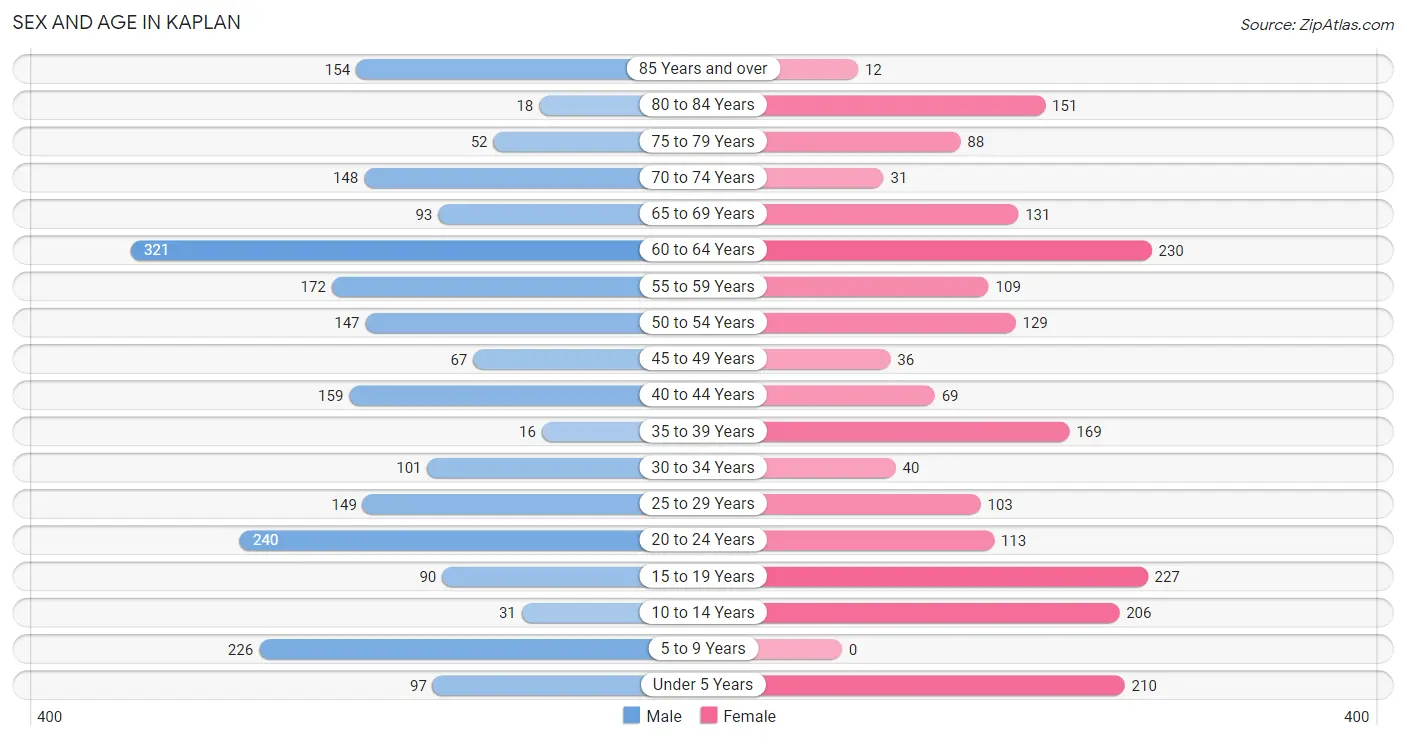
| Age Bracket | Male | Female |
| Under 5 Years | 97 (4.3%) | 210 (10.2%) |
| 5 to 9 Years | 226 (9.9%) | 0 (0.0%) |
| 10 to 14 Years | 31 (1.4%) | 206 (10.0%) |
| 15 to 19 Years | 90 (4.0%) | 227 (11.1%) |
| 20 to 24 Years | 240 (10.5%) | 113 (5.5%) |
| 25 to 29 Years | 149 (6.5%) | 103 (5.0%) |
| 30 to 34 Years | 101 (4.4%) | 40 (1.9%) |
| 35 to 39 Years | 16 (0.7%) | 169 (8.2%) |
| 40 to 44 Years | 159 (7.0%) | 69 (3.4%) |
| 45 to 49 Years | 67 (2.9%) | 36 (1.8%) |
| 50 to 54 Years | 147 (6.4%) | 129 (6.3%) |
| 55 to 59 Years | 172 (7.5%) | 109 (5.3%) |
| 60 to 64 Years | 321 (14.1%) | 230 (11.2%) |
| 65 to 69 Years | 93 (4.1%) | 131 (6.4%) |
| 70 to 74 Years | 148 (6.5%) | 31 (1.5%) |
| 75 to 79 Years | 52 (2.3%) | 88 (4.3%) |
| 80 to 84 Years | 18 (0.8%) | 151 (7.3%) |
| 85 Years and over | 154 (6.8%) | 12 (0.6%) |
| Total | 2,281 (100.0%) | 2,054 (100.0%) |
Families and Households in Kaplan
Median Family Size in Kaplan
The median family size in Kaplan is 3.12 persons per family, with single male/father families (69 | 6.9%) accounting for the largest median family size of 3.59 persons per family. On the other hand, married-couple families (798 | 79.2%) represent the smallest median family size with 3.08 persons per family.
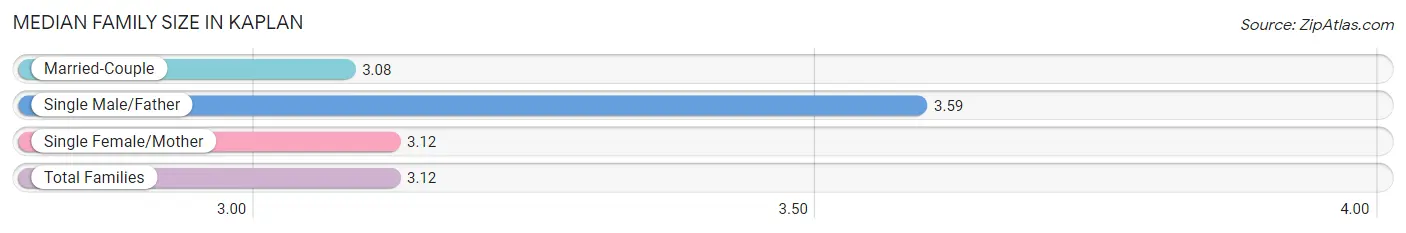
| Family Type | # Families | Family Size |
| Married-Couple | 798 (79.2%) | 3.08 |
| Single Male/Father | 69 (6.9%) | 3.59 |
| Single Female/Mother | 140 (13.9%) | 3.12 |
| Total Families | 1,007 (100.0%) | 3.12 |
Median Household Size in Kaplan
The median household size in Kaplan is 2.34 persons per household, with single male/father households (69 | 3.8%) accounting for the largest median household size of 4.28 persons per household. non-family households (816 | 44.8%) represent the smallest median household size with 1.27 persons per household.
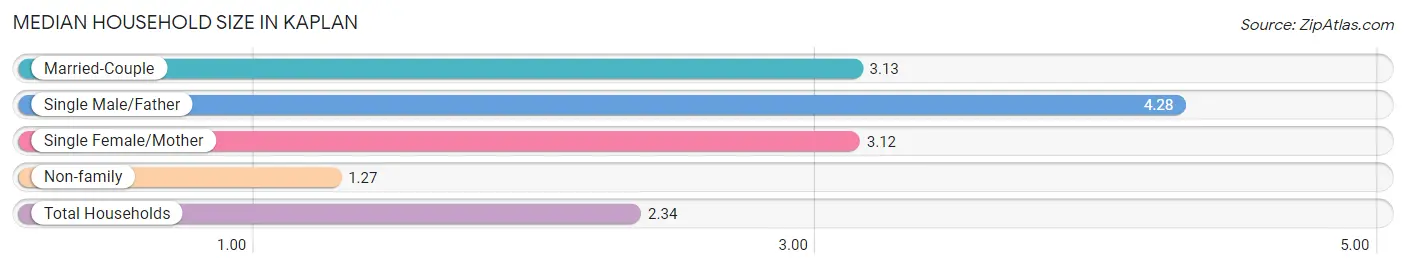
| Household Type | # Households | Household Size |
| Married-Couple | 798 (43.8%) | 3.13 |
| Single Male/Father | 69 (3.8%) | 4.28 |
| Single Female/Mother | 140 (7.7%) | 3.12 |
| Non-family | 816 (44.8%) | 1.27 |
| Total Households | 1,823 (100.0%) | 2.34 |
Household Size by Marriage Status in Kaplan
Out of a total of 1,823 households in Kaplan, 1,007 (55.2%) are family households, while 816 (44.8%) are nonfamily households. The most numerous type of family households are 2-person households, comprising 483, and the most common type of nonfamily households are 1-person households, comprising 590.
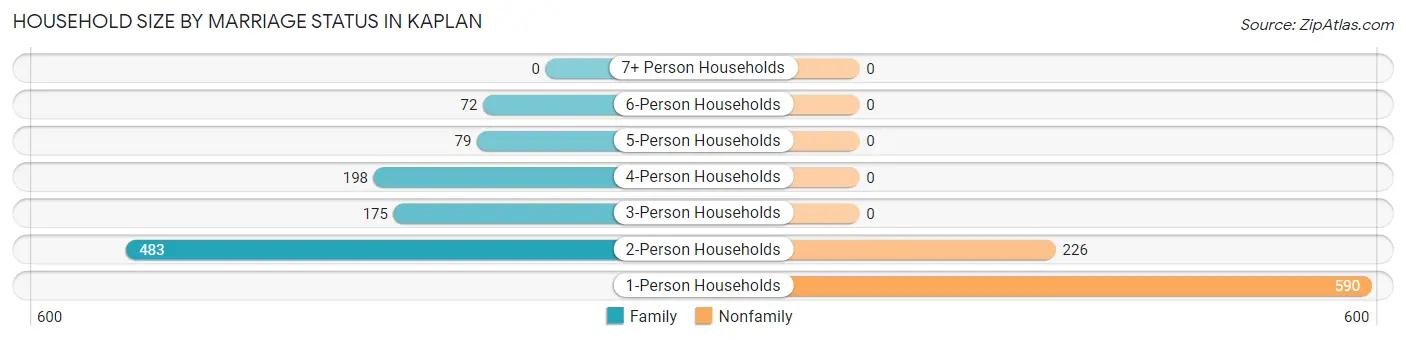
| Household Size | Family Households | Nonfamily Households |
| 1-Person Households | - | 590 (32.4%) |
| 2-Person Households | 483 (26.5%) | 226 (12.4%) |
| 3-Person Households | 175 (9.6%) | 0 (0.0%) |
| 4-Person Households | 198 (10.9%) | 0 (0.0%) |
| 5-Person Households | 79 (4.3%) | 0 (0.0%) |
| 6-Person Households | 72 (4.0%) | 0 (0.0%) |
| 7+ Person Households | 0 (0.0%) | 0 (0.0%) |
| Total | 1,007 (55.2%) | 816 (44.8%) |
Female Fertility in Kaplan
Fertility by Age in Kaplan
Average fertility rate in Kaplan is 37.0 births per 1,000 women. Women in the age bracket of 20 to 34 years have the highest fertility rate with 109.0 births per 1,000 women. Women in the age bracket of 20 to 34 years acount for 100.0% of all women with births.
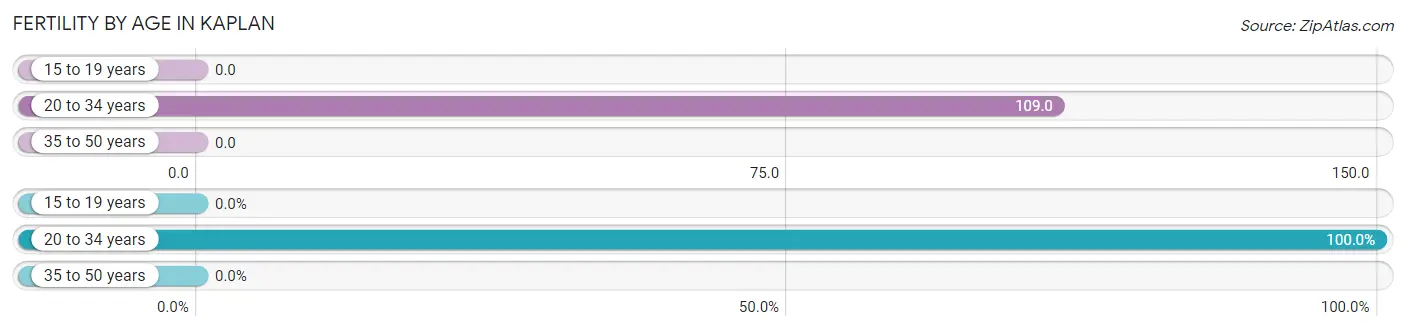
| Age Bracket | Women with Births | Births / 1,000 Women |
| 15 to 19 years | 0 (0.0%) | 0.0 |
| 20 to 34 years | 28 (100.0%) | 109.0 |
| 35 to 50 years | 0 (0.0%) | 0.0 |
| Total | 28 (100.0%) | 37.0 |
Fertility by Age by Marriage Status in Kaplan
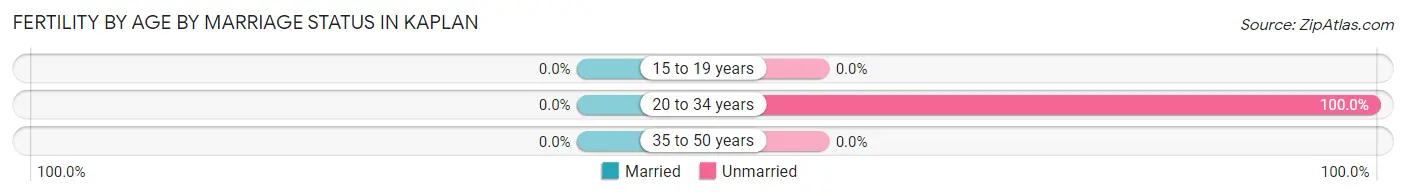
| Age Bracket | Married | Unmarried |
| 15 to 19 years | 0 (0.0%) | 0 (0.0%) |
| 20 to 34 years | 0 (0.0%) | 28 (100.0%) |
| 35 to 50 years | 0 (0.0%) | 0 (0.0%) |
| Total | 0 (0.0%) | 28 (100.0%) |
Fertility by Education in Kaplan
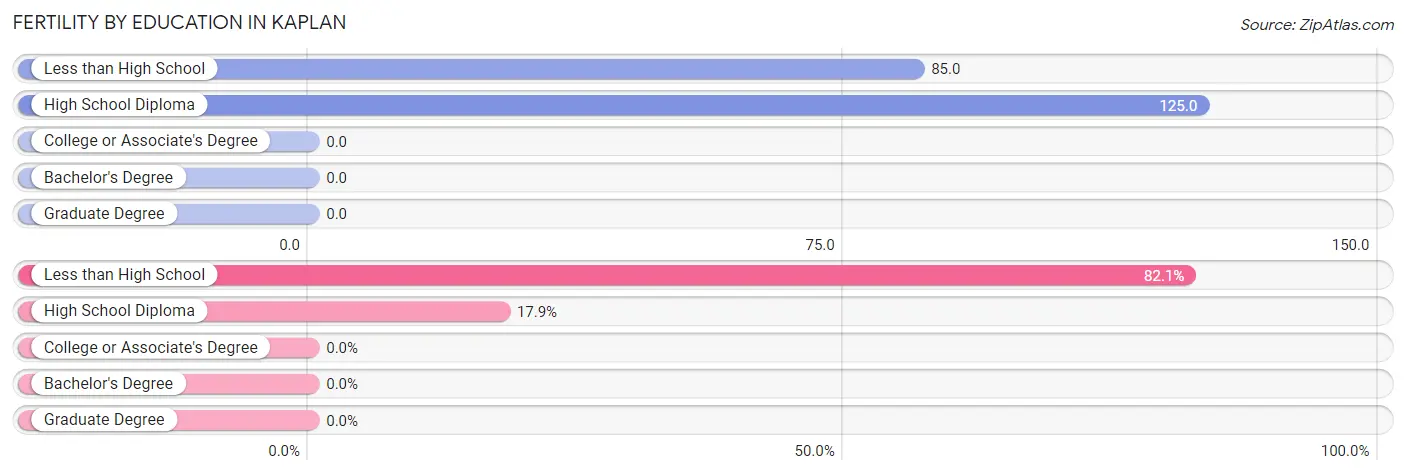
| Educational Attainment | Women with Births | Births / 1,000 Women |
| Less than High School | 23 (82.1%) | 85.0 |
| High School Diploma | 5 (17.9%) | 125.0 |
| College or Associate's Degree | 0 (0.0%) | 0.0 |
| Bachelor's Degree | 0 (0.0%) | 0.0 |
| Graduate Degree | 0 (0.0%) | 0.0 |
| Total | 28 (100.0%) | 37.0 |
Fertility by Education by Marriage Status in Kaplan
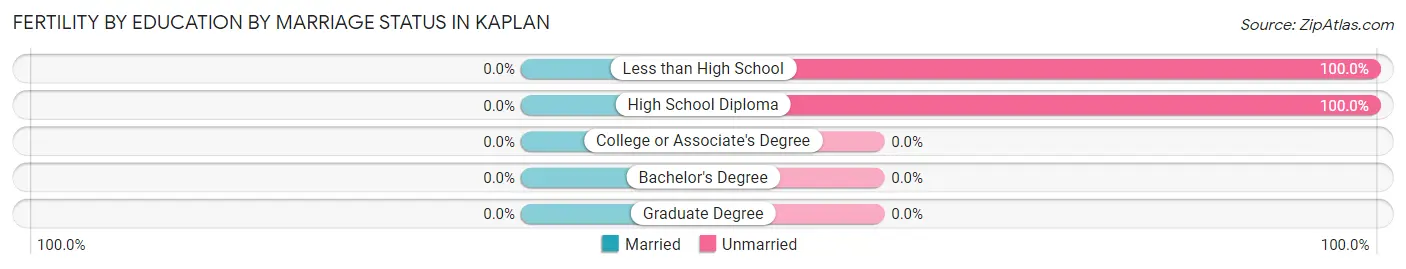
| Educational Attainment | Married | Unmarried |
| Less than High School | 0 (0.0%) | 23 (100.0%) |
| High School Diploma | 0 (0.0%) | 5 (100.0%) |
| College or Associate's Degree | 0 (0.0%) | 0 (0.0%) |
| Bachelor's Degree | 0 (0.0%) | 0 (0.0%) |
| Graduate Degree | 0 (0.0%) | 0 (0.0%) |
| Total | 0 (0.0%) | 28 (100.0%) |
Employment Characteristics in Kaplan
Employment by Class of Employer in Kaplan
Among the 1,237 employed individuals in Kaplan, private company employees (850 | 68.7%), self-employed (not incorporated) (165 | 13.3%), and federal government employees (87 | 7.0%) make up the most common classes of employment.
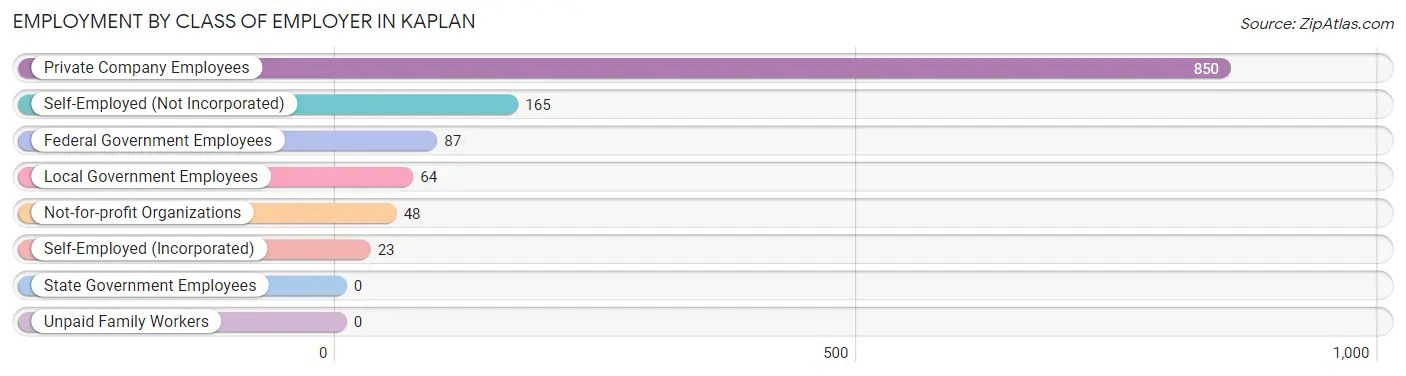
| Employer Class | # Employees | % Employees |
| Private Company Employees | 850 | 68.7% |
| Self-Employed (Incorporated) | 23 | 1.9% |
| Self-Employed (Not Incorporated) | 165 | 13.3% |
| Not-for-profit Organizations | 48 | 3.9% |
| Local Government Employees | 64 | 5.2% |
| State Government Employees | 0 | 0.0% |
| Federal Government Employees | 87 | 7.0% |
| Unpaid Family Workers | 0 | 0.0% |
| Total | 1,237 | 100.0% |
Employment Status by Age in Kaplan
According to the labor force statistics for Kaplan, out of the total population over 16 years of age (3,499), 41.4% or 1,449 individuals are in the labor force, with 9.0% or 130 of them unemployed. The age group with the highest labor force participation rate is 20 to 24 years, with 94.9% or 335 individuals in the labor force. Within the labor force, the 35 to 44 years age range has the highest percentage of unemployed individuals, with 42.9% or 73 of them being unemployed.
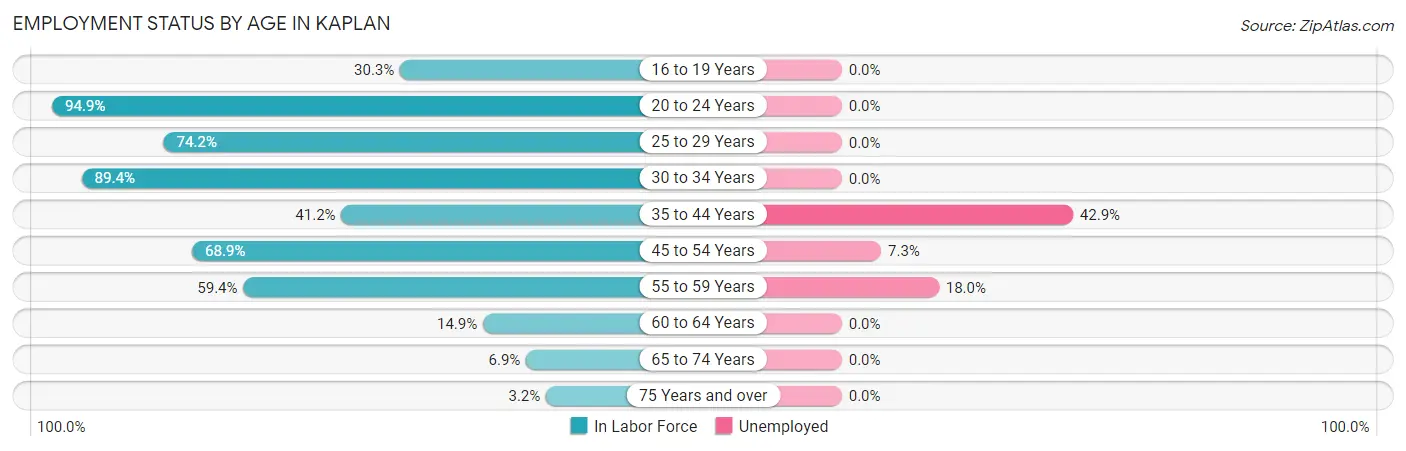
| Age Bracket | In Labor Force | Unemployed |
| 16 to 19 Years | 76 (30.3%) | 0 (0.0%) |
| 20 to 24 Years | 335 (94.9%) | 0 (0.0%) |
| 25 to 29 Years | 187 (74.2%) | 0 (0.0%) |
| 30 to 34 Years | 126 (89.4%) | 0 (0.0%) |
| 35 to 44 Years | 170 (41.2%) | 73 (42.9%) |
| 45 to 54 Years | 261 (68.9%) | 19 (7.3%) |
| 55 to 59 Years | 167 (59.4%) | 30 (18.0%) |
| 60 to 64 Years | 82 (14.9%) | 0 (0.0%) |
| 65 to 74 Years | 28 (6.9%) | 0 (0.0%) |
| 75 Years and over | 15 (3.2%) | 0 (0.0%) |
| Total | 1,449 (41.4%) | 130 (9.0%) |
Employment Status by Educational Attainment in Kaplan
According to labor force statistics for Kaplan, 49.2% of individuals (992) out of the total population between 25 and 64 years of age (2,017) are in the labor force, with 13.5% or 134 of them being unemployed. The group with the highest labor force participation rate are those with the educational attainment of college / associate degree, with 71.7% or 505 individuals in the labor force. Within the labor force, individuals with less than high school education have the highest percentage of unemployment, with 32.2% or 19 of them being unemployed.
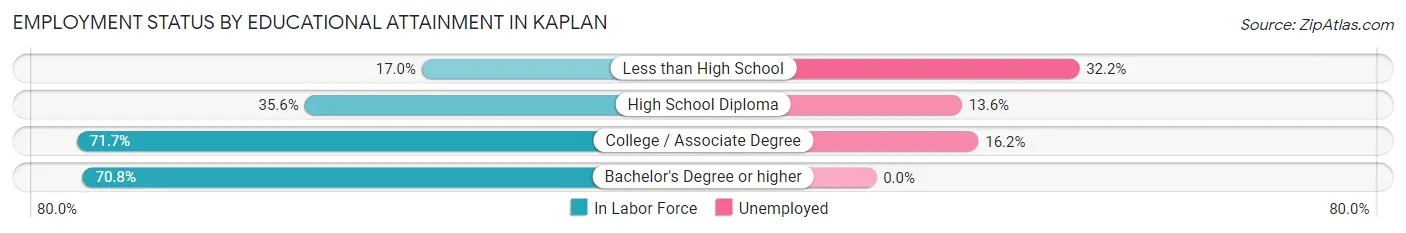
| Educational Attainment | In Labor Force | Unemployed |
| Less than High School | 59 (17.0%) | 112 (32.2%) |
| High School Diploma | 257 (35.6%) | 98 (13.6%) |
| College / Associate Degree | 505 (71.7%) | 114 (16.2%) |
| Bachelor's Degree or higher | 172 (70.8%) | 0 (0.0%) |
| Total | 992 (49.2%) | 272 (13.5%) |
Employment Occupations by Sex in Kaplan
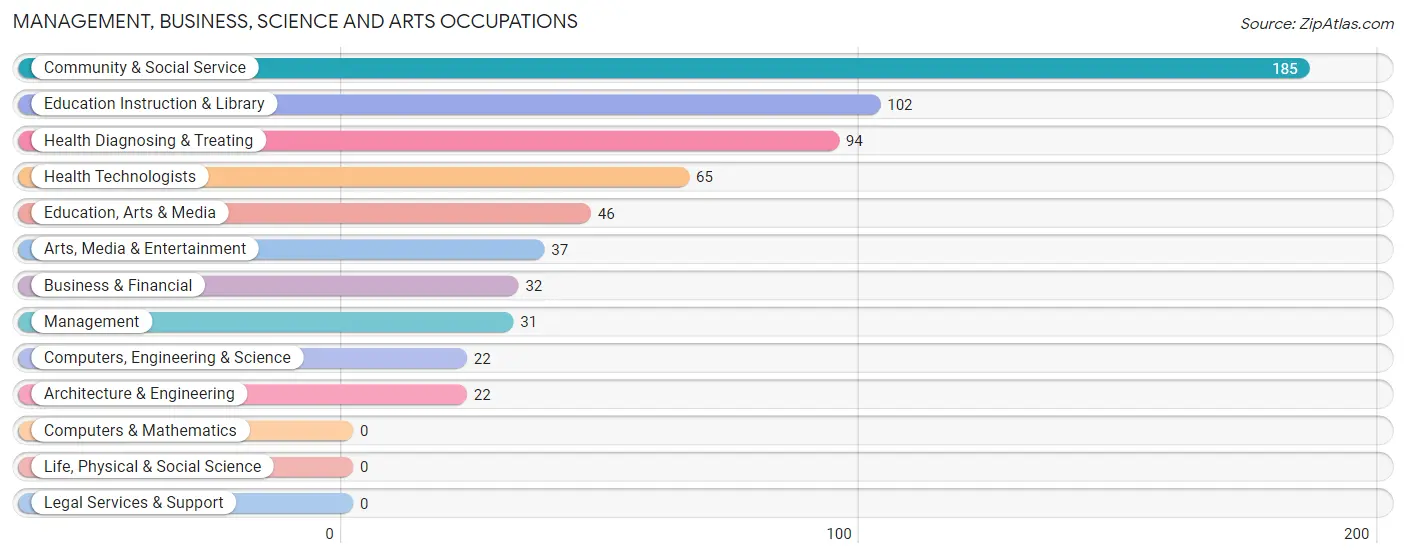
Management, Business, Science and Arts Occupations
The most common Management, Business, Science and Arts occupations in Kaplan are Community & Social Service (185 | 14.9%), Education Instruction & Library (102 | 8.2%), Health Diagnosing & Treating (94 | 7.6%), Health Technologists (65 | 5.2%), and Education, Arts & Media (46 | 3.7%).
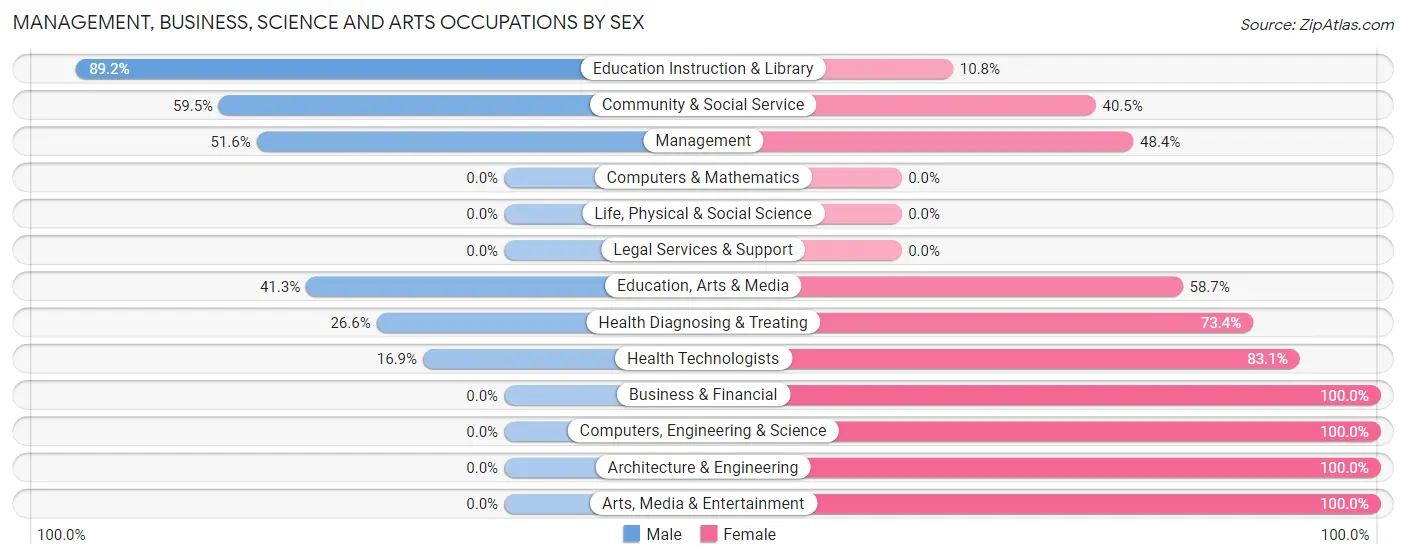
Management, Business, Science and Arts Occupations by Sex
Within the Management, Business, Science and Arts occupations in Kaplan, the most male-oriented occupations are Education Instruction & Library (89.2%), Community & Social Service (59.5%), and Management (51.6%), while the most female-oriented occupations are Business & Financial (100.0%), Computers, Engineering & Science (100.0%), and Architecture & Engineering (100.0%).
| Occupation | Male | Female |
| Management | 16 (51.6%) | 15 (48.4%) |
| Business & Financial | 0 (0.0%) | 32 (100.0%) |
| Computers, Engineering & Science | 0 (0.0%) | 22 (100.0%) |
| Computers & Mathematics | 0 (0.0%) | 0 (0.0%) |
| Architecture & Engineering | 0 (0.0%) | 22 (100.0%) |
| Life, Physical & Social Science | 0 (0.0%) | 0 (0.0%) |
| Community & Social Service | 110 (59.5%) | 75 (40.5%) |
| Education, Arts & Media | 19 (41.3%) | 27 (58.7%) |
| Legal Services & Support | 0 (0.0%) | 0 (0.0%) |
| Education Instruction & Library | 91 (89.2%) | 11 (10.8%) |
| Arts, Media & Entertainment | 0 (0.0%) | 37 (100.0%) |
| Health Diagnosing & Treating | 25 (26.6%) | 69 (73.4%) |
| Health Technologists | 11 (16.9%) | 54 (83.1%) |
| Total (Category) | 151 (41.5%) | 213 (58.5%) |
| Total (Overall) | 664 (53.6%) | 575 (46.4%) |
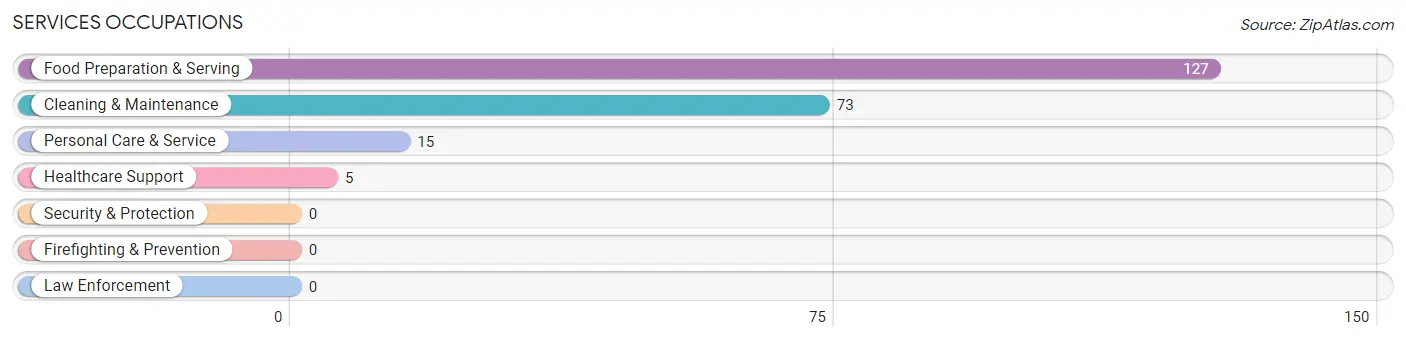
Services Occupations
The most common Services occupations in Kaplan are Food Preparation & Serving (127 | 10.2%), Cleaning & Maintenance (73 | 5.9%), Personal Care & Service (15 | 1.2%), and Healthcare Support (5 | 0.4%).
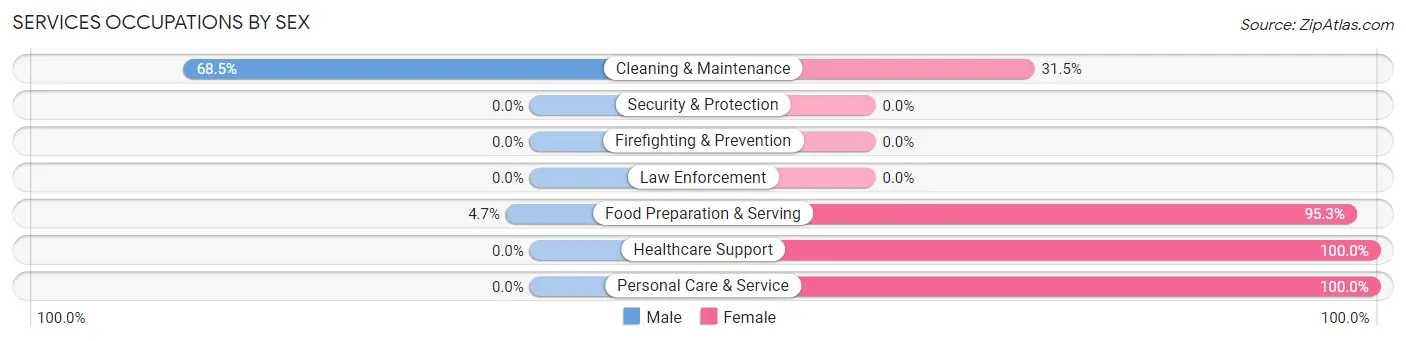
Services Occupations by Sex
Within the Services occupations in Kaplan, the most male-oriented occupations are Cleaning & Maintenance (68.5%), and Food Preparation & Serving (4.7%), while the most female-oriented occupations are Healthcare Support (100.0%), Personal Care & Service (100.0%), and Food Preparation & Serving (95.3%).
| Occupation | Male | Female |
| Healthcare Support | 0 (0.0%) | 5 (100.0%) |
| Security & Protection | 0 (0.0%) | 0 (0.0%) |
| Firefighting & Prevention | 0 (0.0%) | 0 (0.0%) |
| Law Enforcement | 0 (0.0%) | 0 (0.0%) |
| Food Preparation & Serving | 6 (4.7%) | 121 (95.3%) |
| Cleaning & Maintenance | 50 (68.5%) | 23 (31.5%) |
| Personal Care & Service | 0 (0.0%) | 15 (100.0%) |
| Total (Category) | 56 (25.5%) | 164 (74.6%) |
| Total (Overall) | 664 (53.6%) | 575 (46.4%) |
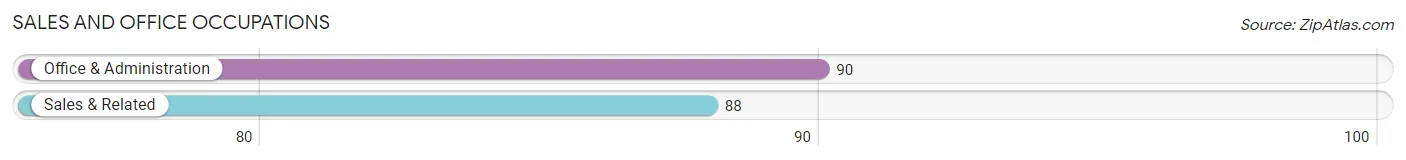
Sales and Office Occupations
The most common Sales and Office occupations in Kaplan are Office & Administration (90 | 7.3%), and Sales & Related (88 | 7.1%).
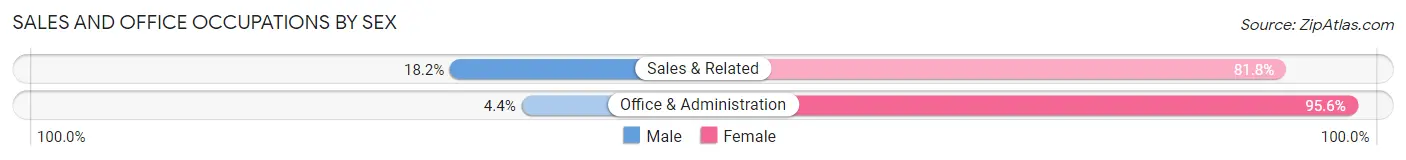
Sales and Office Occupations by Sex
| Occupation | Male | Female |
| Sales & Related | 16 (18.2%) | 72 (81.8%) |
| Office & Administration | 4 (4.4%) | 86 (95.6%) |
| Total (Category) | 20 (11.2%) | 158 (88.8%) |
| Total (Overall) | 664 (53.6%) | 575 (46.4%) |
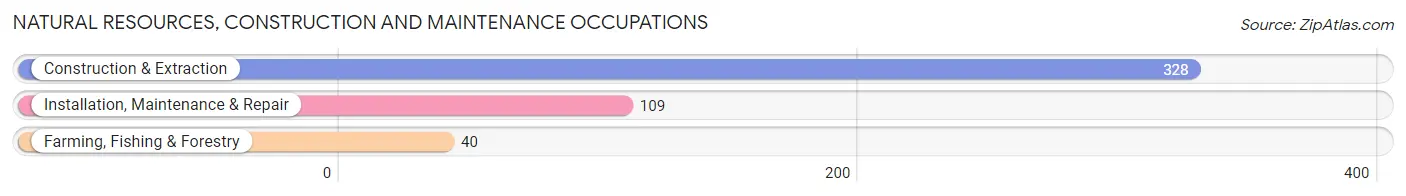
Natural Resources, Construction and Maintenance Occupations
The most common Natural Resources, Construction and Maintenance occupations in Kaplan are Construction & Extraction (328 | 26.5%), Installation, Maintenance & Repair (109 | 8.8%), and Farming, Fishing & Forestry (40 | 3.2%).
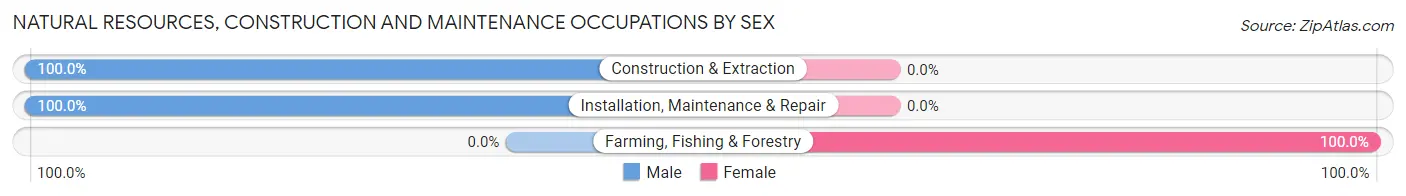
Natural Resources, Construction and Maintenance Occupations by Sex
| Occupation | Male | Female |
| Farming, Fishing & Forestry | 0 (0.0%) | 40 (100.0%) |
| Construction & Extraction | 328 (100.0%) | 0 (0.0%) |
| Installation, Maintenance & Repair | 109 (100.0%) | 0 (0.0%) |
| Total (Category) | 437 (91.6%) | 40 (8.4%) |
| Total (Overall) | 664 (53.6%) | 575 (46.4%) |
Production, Transportation and Moving Occupations
Production, Transportation and Moving Occupations by Sex
| Occupation | Male | Female |
| Production | 0 (0.0%) | 0 (0.0%) |
| Transportation | 0 (0.0%) | 0 (0.0%) |
| Material Moving | 0 (0.0%) | 0 (0.0%) |
| Total (Category) | 0 (0.0%) | 0 (0.0%) |
| Total (Overall) | 664 (53.6%) | 575 (46.4%) |
Employment Industries by Sex in Kaplan
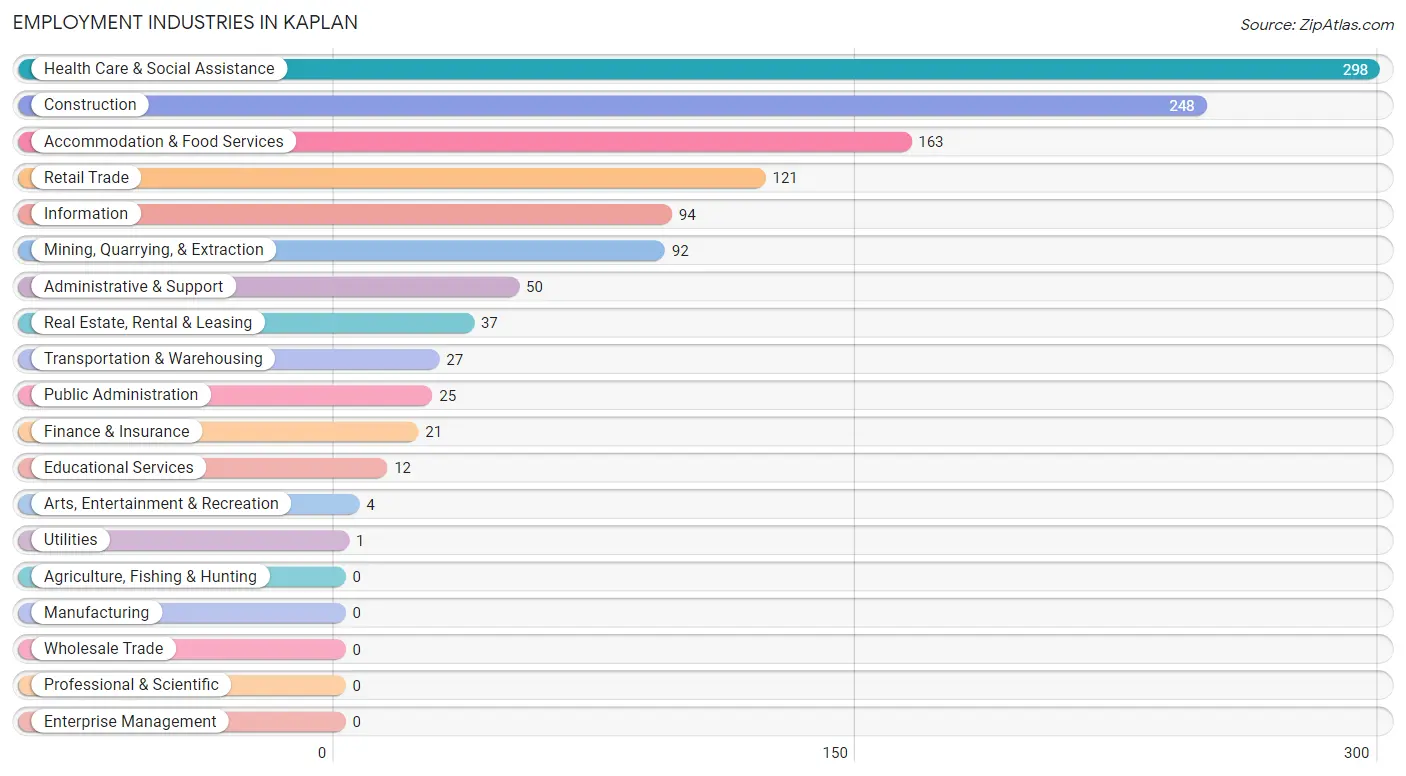
Employment Industries in Kaplan
The major employment industries in Kaplan include Health Care & Social Assistance (298 | 24.0%), Construction (248 | 20.0%), Accommodation & Food Services (163 | 13.2%), Retail Trade (121 | 9.8%), and Information (94 | 7.6%).
Employment Industries by Sex in Kaplan
The Kaplan industries that see more men than women are Construction (100.0%), Utilities (100.0%), and Administrative & Support (100.0%), whereas the industries that tend to have a higher number of women are Finance & Insurance (100.0%), Real Estate, Rental & Leasing (100.0%), and Educational Services (100.0%).
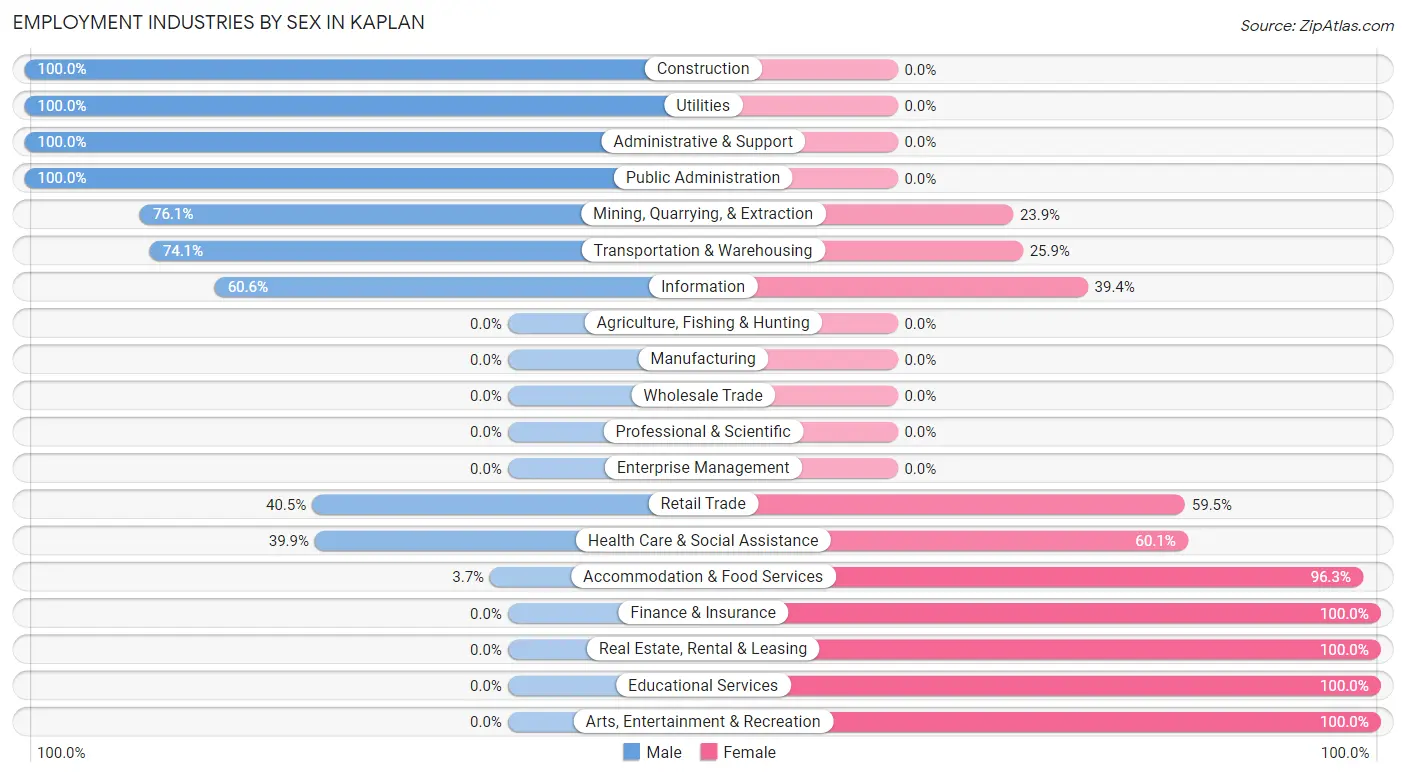
| Industry | Male | Female |
| Agriculture, Fishing & Hunting | 0 (0.0%) | 0 (0.0%) |
| Mining, Quarrying, & Extraction | 70 (76.1%) | 22 (23.9%) |
| Construction | 248 (100.0%) | 0 (0.0%) |
| Manufacturing | 0 (0.0%) | 0 (0.0%) |
| Wholesale Trade | 0 (0.0%) | 0 (0.0%) |
| Retail Trade | 49 (40.5%) | 72 (59.5%) |
| Transportation & Warehousing | 20 (74.1%) | 7 (25.9%) |
| Utilities | 1 (100.0%) | 0 (0.0%) |
| Information | 57 (60.6%) | 37 (39.4%) |
| Finance & Insurance | 0 (0.0%) | 21 (100.0%) |
| Real Estate, Rental & Leasing | 0 (0.0%) | 37 (100.0%) |
| Professional & Scientific | 0 (0.0%) | 0 (0.0%) |
| Enterprise Management | 0 (0.0%) | 0 (0.0%) |
| Administrative & Support | 50 (100.0%) | 0 (0.0%) |
| Educational Services | 0 (0.0%) | 12 (100.0%) |
| Health Care & Social Assistance | 119 (39.9%) | 179 (60.1%) |
| Arts, Entertainment & Recreation | 0 (0.0%) | 4 (100.0%) |
| Accommodation & Food Services | 6 (3.7%) | 157 (96.3%) |
| Public Administration | 25 (100.0%) | 0 (0.0%) |
| Total | 664 (53.6%) | 575 (46.4%) |
Education in Kaplan
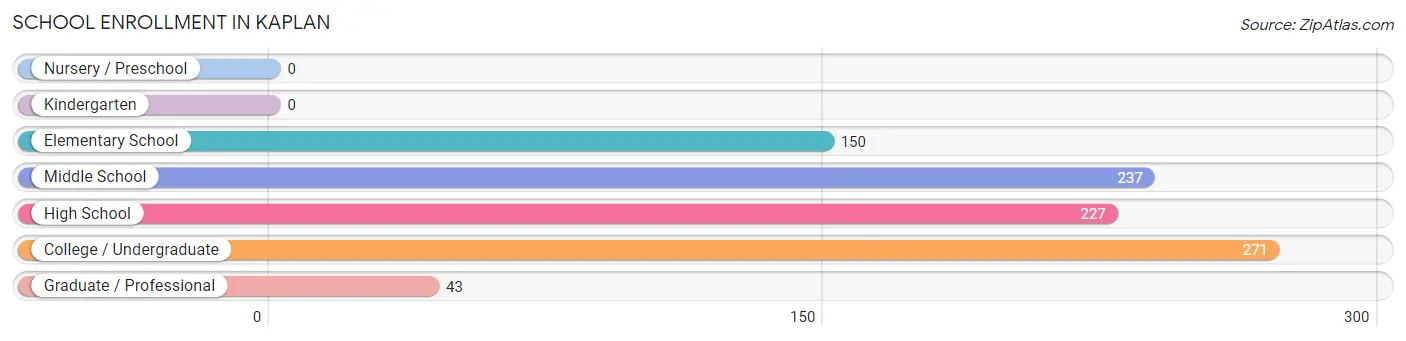
School Enrollment in Kaplan
The most common levels of schooling among the 928 students in Kaplan are college / undergraduate (271 | 29.2%), middle school (237 | 25.5%), and high school (227 | 24.5%).
| School Level | # Students | % Students |
| Nursery / Preschool | 0 | 0.0% |
| Kindergarten | 0 | 0.0% |
| Elementary School | 150 | 16.2% |
| Middle School | 237 | 25.5% |
| High School | 227 | 24.5% |
| College / Undergraduate | 271 | 29.2% |
| Graduate / Professional | 43 | 4.6% |
| Total | 928 | 100.0% |
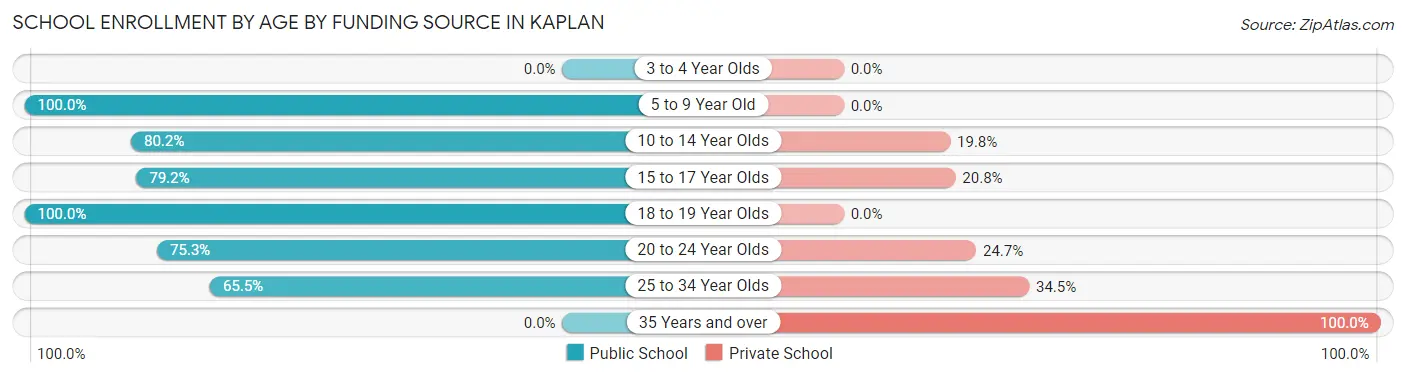
School Enrollment by Age by Funding Source in Kaplan
Out of a total of 928 students who are enrolled in schools in Kaplan, 166 (17.9%) attend a private institution, while the remaining 762 (82.1%) are enrolled in public schools. The age group of 35 years and over has the highest likelihood of being enrolled in private schools, with 12 (100.0% in the age bracket) enrolled. Conversely, the age group of 5 to 9 year old has the lowest likelihood of being enrolled in a private school, with 150 (100.0% in the age bracket) attending a public institution.
| Age Bracket | Public School | Private School |
| 3 to 4 Year Olds | 0 (0.0%) | 0 (0.0%) |
| 5 to 9 Year Old | 150 (100.0%) | 0 (0.0%) |
| 10 to 14 Year Olds | 190 (80.2%) | 47 (19.8%) |
| 15 to 17 Year Olds | 156 (79.2%) | 41 (20.8%) |
| 18 to 19 Year Olds | 120 (100.0%) | 0 (0.0%) |
| 20 to 24 Year Olds | 55 (75.3%) | 18 (24.7%) |
| 25 to 34 Year Olds | 91 (65.5%) | 48 (34.5%) |
| 35 Years and over | 0 (0.0%) | 12 (100.0%) |
| Total | 762 (82.1%) | 166 (17.9%) |
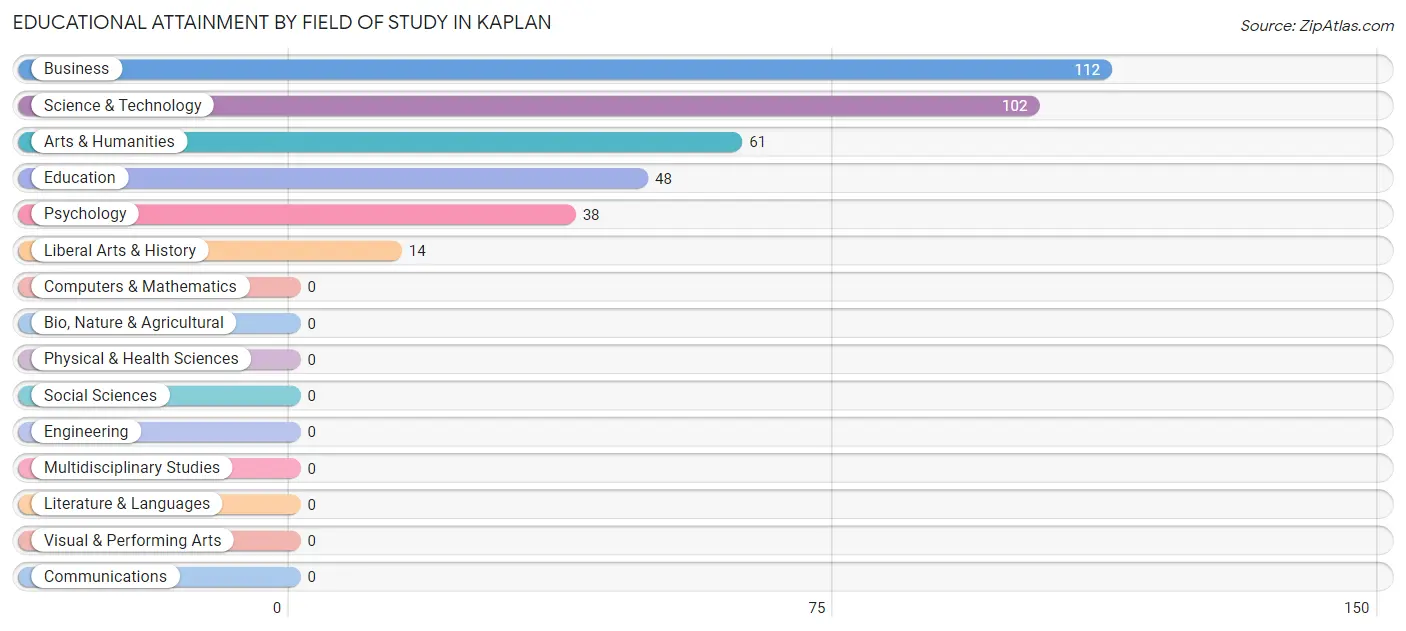
Educational Attainment by Field of Study in Kaplan
Business (112 | 29.9%), science & technology (102 | 27.2%), arts & humanities (61 | 16.3%), education (48 | 12.8%), and psychology (38 | 10.1%) are the most common fields of study among 375 individuals in Kaplan who have obtained a bachelor's degree or higher.
| Field of Study | # Graduates | % Graduates |
| Computers & Mathematics | 0 | 0.0% |
| Bio, Nature & Agricultural | 0 | 0.0% |
| Physical & Health Sciences | 0 | 0.0% |
| Psychology | 38 | 10.1% |
| Social Sciences | 0 | 0.0% |
| Engineering | 0 | 0.0% |
| Multidisciplinary Studies | 0 | 0.0% |
| Science & Technology | 102 | 27.2% |
| Business | 112 | 29.9% |
| Education | 48 | 12.8% |
| Literature & Languages | 0 | 0.0% |
| Liberal Arts & History | 14 | 3.7% |
| Visual & Performing Arts | 0 | 0.0% |
| Communications | 0 | 0.0% |
| Arts & Humanities | 61 | 16.3% |
| Total | 375 | 100.0% |
Transportation & Commute in Kaplan
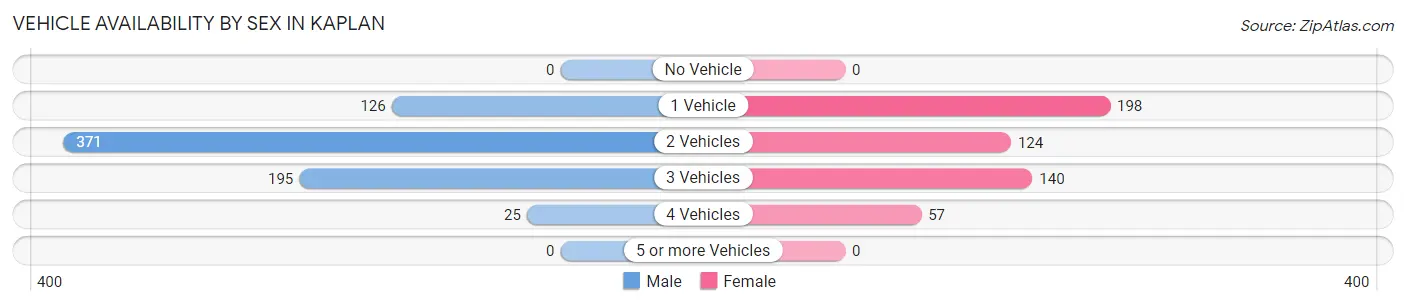
Vehicle Availability by Sex in Kaplan
The most prevalent vehicle ownership categories in Kaplan are males with 2 vehicles (371, accounting for 51.7%) and females with 2 vehicles (124, making up 71.5%).
| Vehicles Available | Male | Female |
| No Vehicle | 0 (0.0%) | 0 (0.0%) |
| 1 Vehicle | 126 (17.6%) | 198 (38.2%) |
| 2 Vehicles | 371 (51.7%) | 124 (23.9%) |
| 3 Vehicles | 195 (27.2%) | 140 (27.0%) |
| 4 Vehicles | 25 (3.5%) | 57 (11.0%) |
| 5 or more Vehicles | 0 (0.0%) | 0 (0.0%) |
| Total | 717 (100.0%) | 519 (100.0%) |
Commute Time in Kaplan
The most frequently occuring commute durations in Kaplan are 20 to 24 minutes (295 commuters, 24.2%), 5 to 9 minutes (276 commuters, 22.7%), and 45 to 59 minutes (242 commuters, 19.9%).
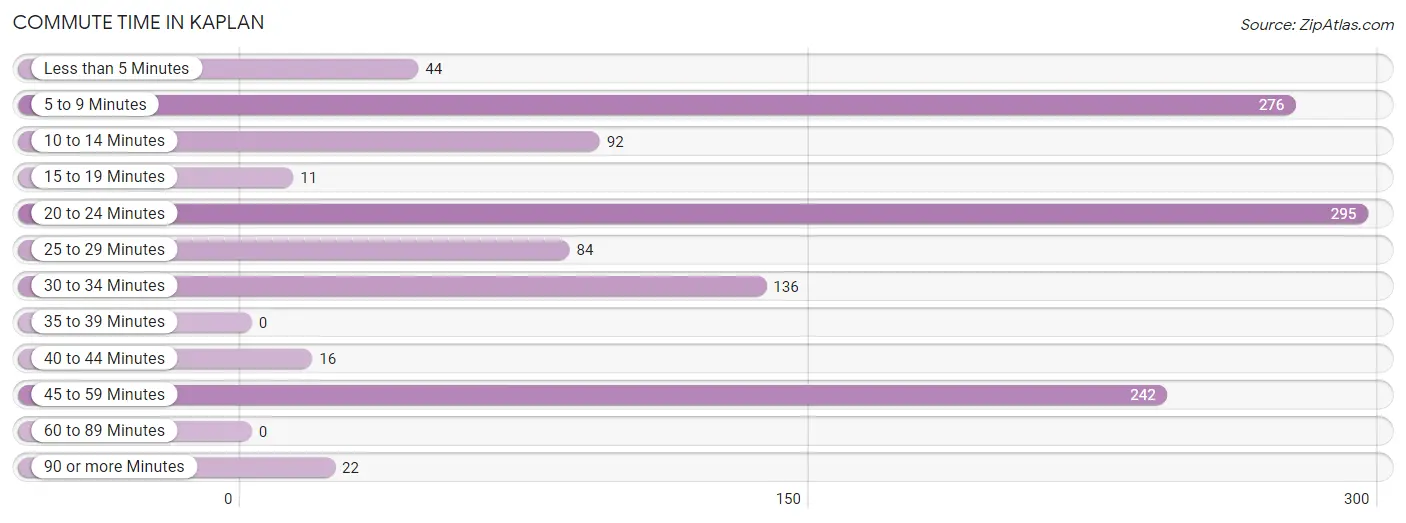
| Commute Time | # Commuters | % Commuters |
| Less than 5 Minutes | 44 | 3.6% |
| 5 to 9 Minutes | 276 | 22.7% |
| 10 to 14 Minutes | 92 | 7.5% |
| 15 to 19 Minutes | 11 | 0.9% |
| 20 to 24 Minutes | 295 | 24.2% |
| 25 to 29 Minutes | 84 | 6.9% |
| 30 to 34 Minutes | 136 | 11.2% |
| 35 to 39 Minutes | 0 | 0.0% |
| 40 to 44 Minutes | 16 | 1.3% |
| 45 to 59 Minutes | 242 | 19.9% |
| 60 to 89 Minutes | 0 | 0.0% |
| 90 or more Minutes | 22 | 1.8% |
Commute Time by Sex in Kaplan
The most common commute times in Kaplan are 45 to 59 minutes (164 commuters, 23.5%) for males and 20 to 24 minutes (163 commuters, 31.4%) for females.
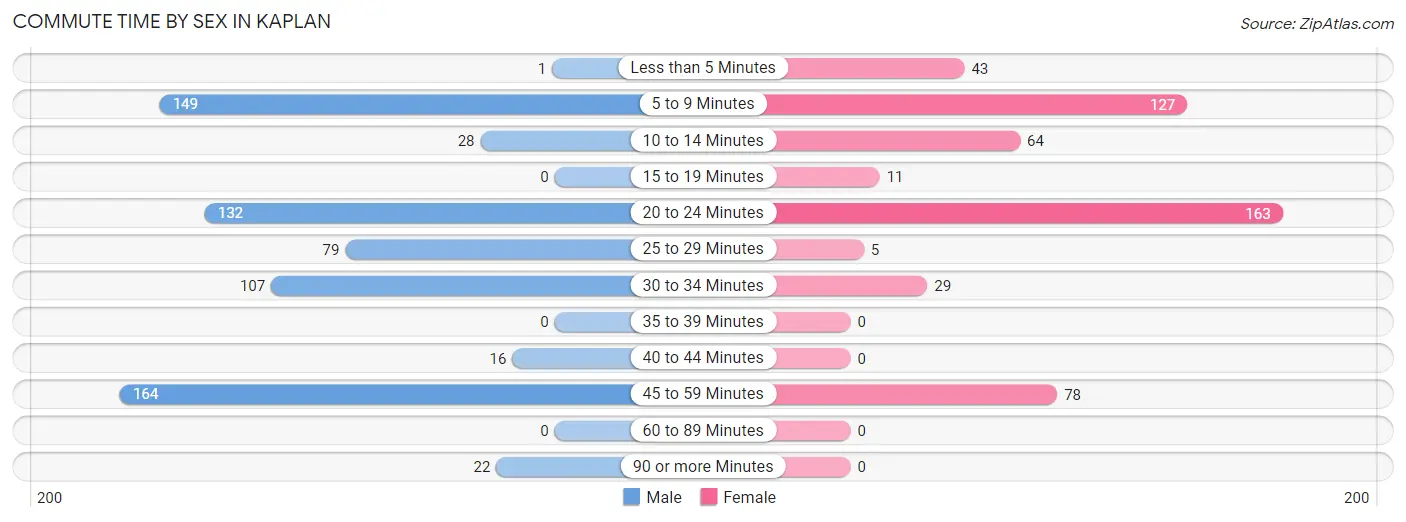
| Commute Time | Male | Female |
| Less than 5 Minutes | 1 (0.1%) | 43 (8.3%) |
| 5 to 9 Minutes | 149 (21.3%) | 127 (24.4%) |
| 10 to 14 Minutes | 28 (4.0%) | 64 (12.3%) |
| 15 to 19 Minutes | 0 (0.0%) | 11 (2.1%) |
| 20 to 24 Minutes | 132 (18.9%) | 163 (31.4%) |
| 25 to 29 Minutes | 79 (11.3%) | 5 (1.0%) |
| 30 to 34 Minutes | 107 (15.3%) | 29 (5.6%) |
| 35 to 39 Minutes | 0 (0.0%) | 0 (0.0%) |
| 40 to 44 Minutes | 16 (2.3%) | 0 (0.0%) |
| 45 to 59 Minutes | 164 (23.5%) | 78 (15.0%) |
| 60 to 89 Minutes | 0 (0.0%) | 0 (0.0%) |
| 90 or more Minutes | 22 (3.2%) | 0 (0.0%) |
Time of Departure to Work by Sex in Kaplan
The most frequent times of departure to work in Kaplan are 5:30 AM to 5:59 AM (172, 24.6%) for males and 7:30 AM to 7:59 AM (133, 25.6%) for females.
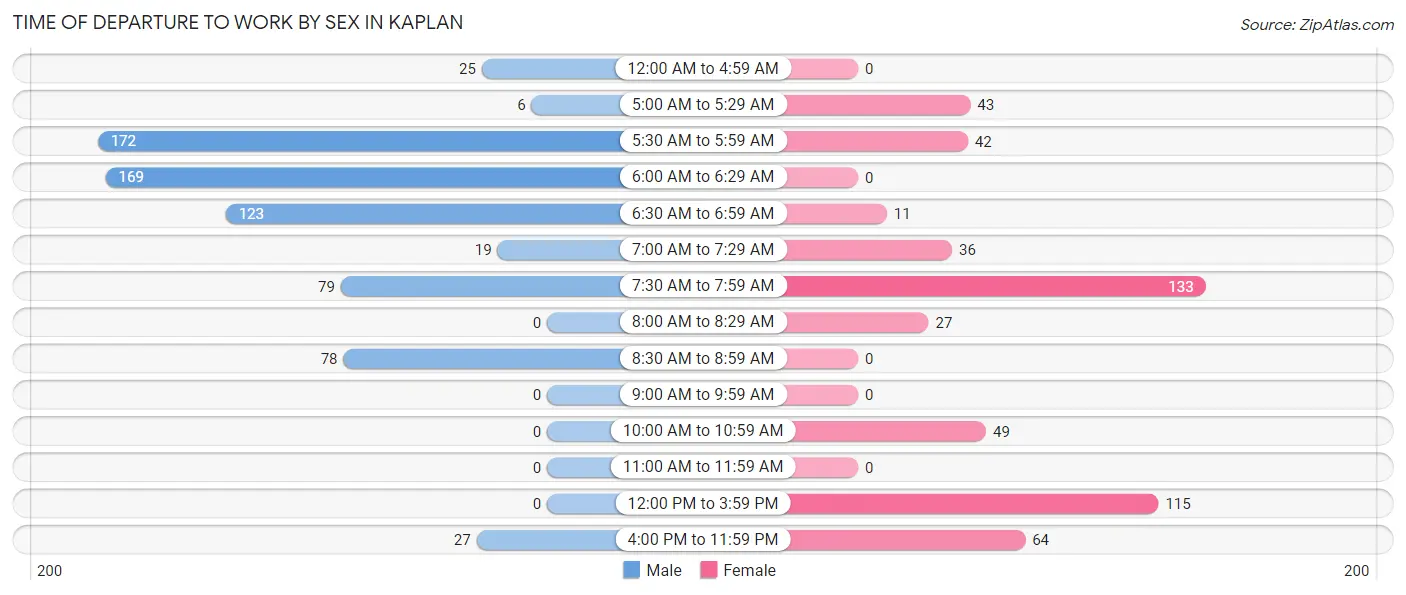
| Time of Departure | Male | Female |
| 12:00 AM to 4:59 AM | 25 (3.6%) | 0 (0.0%) |
| 5:00 AM to 5:29 AM | 6 (0.9%) | 43 (8.3%) |
| 5:30 AM to 5:59 AM | 172 (24.6%) | 42 (8.1%) |
| 6:00 AM to 6:29 AM | 169 (24.2%) | 0 (0.0%) |
| 6:30 AM to 6:59 AM | 123 (17.6%) | 11 (2.1%) |
| 7:00 AM to 7:29 AM | 19 (2.7%) | 36 (6.9%) |
| 7:30 AM to 7:59 AM | 79 (11.3%) | 133 (25.6%) |
| 8:00 AM to 8:29 AM | 0 (0.0%) | 27 (5.2%) |
| 8:30 AM to 8:59 AM | 78 (11.2%) | 0 (0.0%) |
| 9:00 AM to 9:59 AM | 0 (0.0%) | 0 (0.0%) |
| 10:00 AM to 10:59 AM | 0 (0.0%) | 49 (9.4%) |
| 11:00 AM to 11:59 AM | 0 (0.0%) | 0 (0.0%) |
| 12:00 PM to 3:59 PM | 0 (0.0%) | 115 (22.1%) |
| 4:00 PM to 11:59 PM | 27 (3.9%) | 64 (12.3%) |
| Total | 698 (100.0%) | 520 (100.0%) |
Housing Occupancy in Kaplan
Occupancy by Ownership in Kaplan
Of the total 1,823 dwellings in Kaplan, owner-occupied units account for 1,126 (61.8%), while renter-occupied units make up 697 (38.2%).
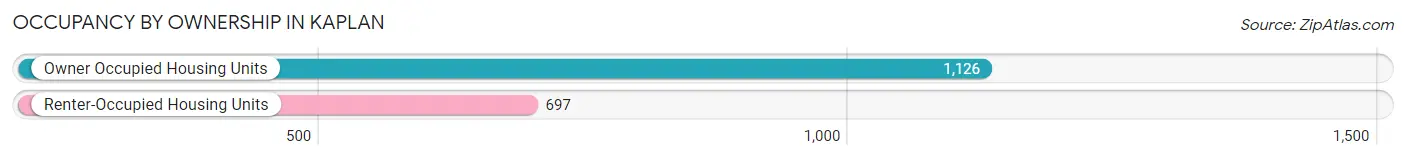
| Occupancy | # Housing Units | % Housing Units |
| Owner Occupied Housing Units | 1,126 | 61.8% |
| Renter-Occupied Housing Units | 697 | 38.2% |
| Total Occupied Housing Units | 1,823 | 100.0% |
Occupancy by Household Size in Kaplan
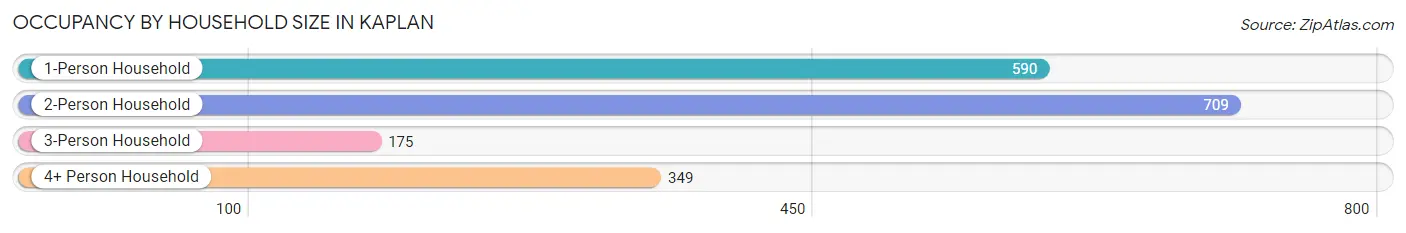
| Household Size | # Housing Units | % Housing Units |
| 1-Person Household | 590 | 32.4% |
| 2-Person Household | 709 | 38.9% |
| 3-Person Household | 175 | 9.6% |
| 4+ Person Household | 349 | 19.1% |
| Total Housing Units | 1,823 | 100.0% |
Occupancy by Ownership by Household Size in Kaplan
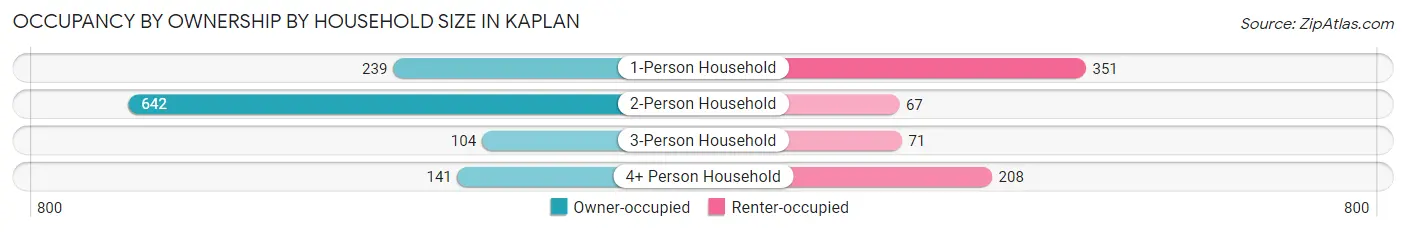
| Household Size | Owner-occupied | Renter-occupied |
| 1-Person Household | 239 (40.5%) | 351 (59.5%) |
| 2-Person Household | 642 (90.5%) | 67 (9.5%) |
| 3-Person Household | 104 (59.4%) | 71 (40.6%) |
| 4+ Person Household | 141 (40.4%) | 208 (59.6%) |
| Total Housing Units | 1,126 (61.8%) | 697 (38.2%) |
Occupancy by Educational Attainment in Kaplan
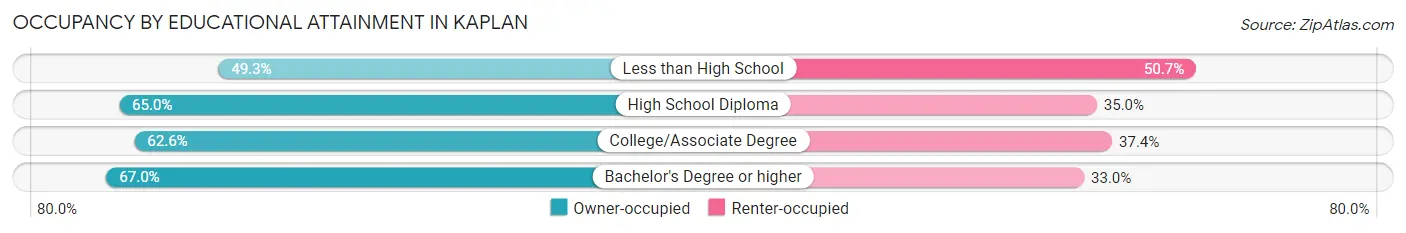
| Household Size | Owner-occupied | Renter-occupied |
| Less than High School | 168 (49.3%) | 173 (50.7%) |
| High School Diploma | 481 (65.0%) | 259 (35.0%) |
| College/Associate Degree | 286 (62.6%) | 171 (37.4%) |
| Bachelor's Degree or higher | 191 (67.0%) | 94 (33.0%) |
Occupancy by Age of Householder in Kaplan
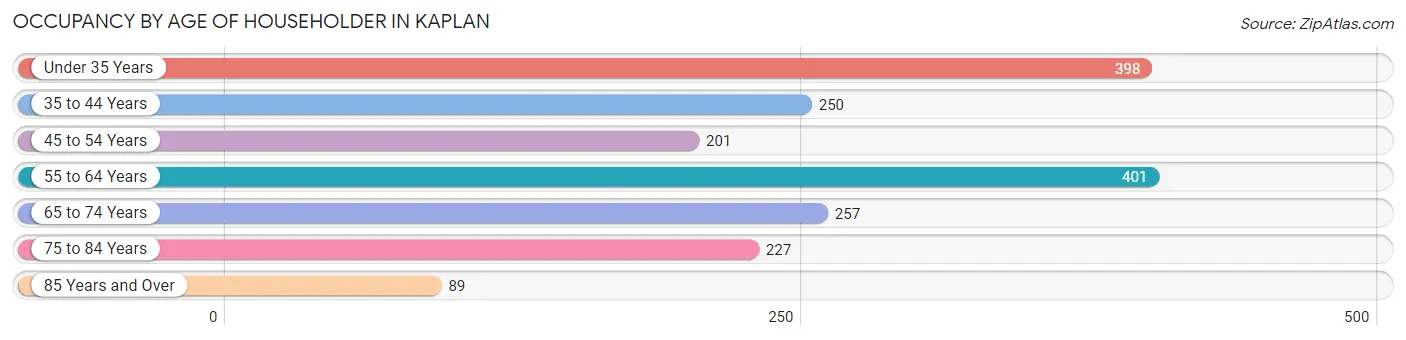
| Age Bracket | # Households | % Households |
| Under 35 Years | 398 | 21.8% |
| 35 to 44 Years | 250 | 13.7% |
| 45 to 54 Years | 201 | 11.0% |
| 55 to 64 Years | 401 | 22.0% |
| 65 to 74 Years | 257 | 14.1% |
| 75 to 84 Years | 227 | 12.4% |
| 85 Years and Over | 89 | 4.9% |
| Total | 1,823 | 100.0% |
Housing Finances in Kaplan
Median Income by Occupancy in Kaplan
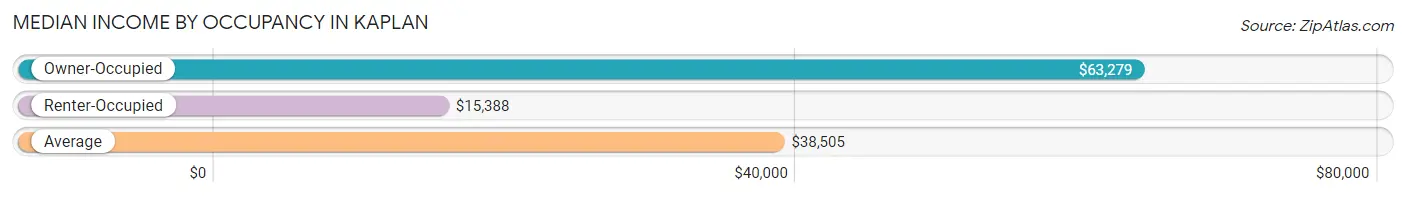
| Occupancy Type | # Households | Median Income |
| Owner-Occupied | 1,126 (61.8%) | $63,279 |
| Renter-Occupied | 697 (38.2%) | $15,388 |
| Average | 1,823 (100.0%) | $38,505 |
Occupancy by Householder Income Bracket in Kaplan
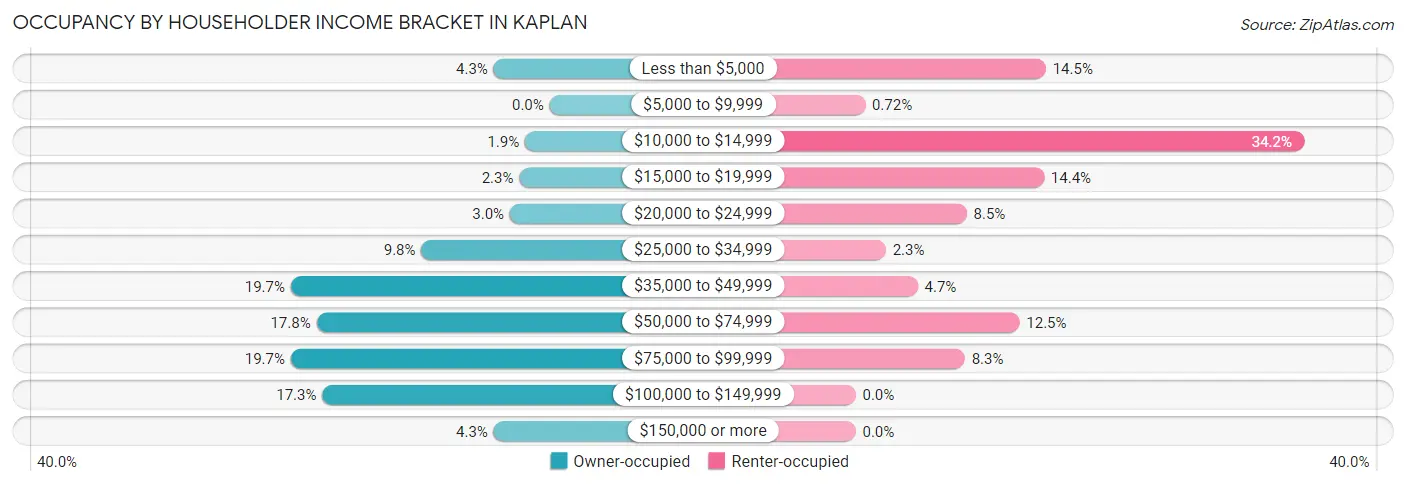
| Income Bracket | Owner-occupied | Renter-occupied |
| Less than $5,000 | 48 (4.3%) | 101 (14.5%) |
| $5,000 to $9,999 | 0 (0.0%) | 5 (0.7%) |
| $10,000 to $14,999 | 21 (1.9%) | 238 (34.2%) |
| $15,000 to $19,999 | 26 (2.3%) | 100 (14.3%) |
| $20,000 to $24,999 | 34 (3.0%) | 59 (8.5%) |
| $25,000 to $34,999 | 110 (9.8%) | 16 (2.3%) |
| $35,000 to $49,999 | 222 (19.7%) | 33 (4.7%) |
| $50,000 to $74,999 | 200 (17.8%) | 87 (12.5%) |
| $75,000 to $99,999 | 222 (19.7%) | 58 (8.3%) |
| $100,000 to $149,999 | 195 (17.3%) | 0 (0.0%) |
| $150,000 or more | 48 (4.3%) | 0 (0.0%) |
| Total | 1,126 (100.0%) | 697 (100.0%) |
Monthly Housing Cost Tiers in Kaplan
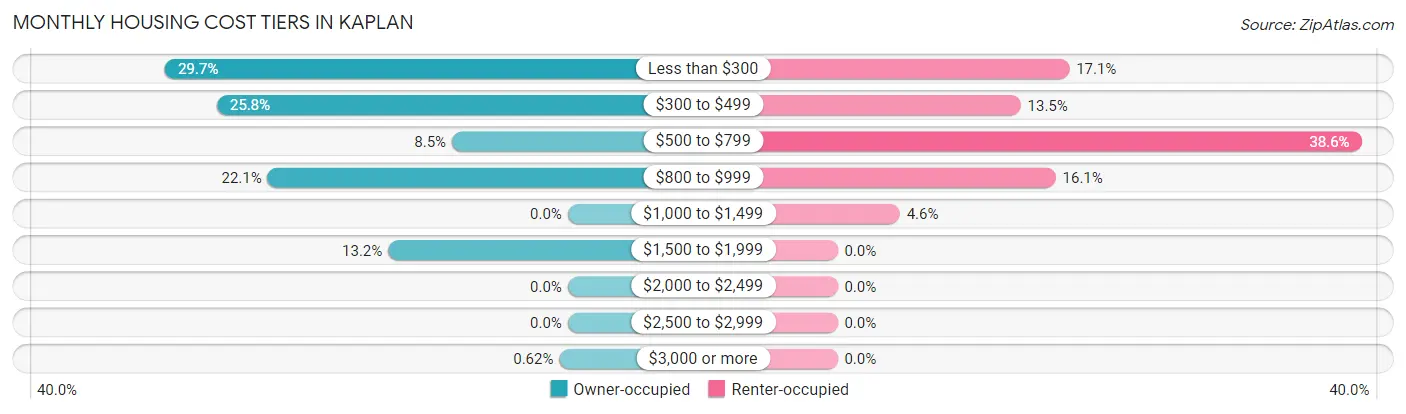
| Monthly Cost | Owner-occupied | Renter-occupied |
| Less than $300 | 334 (29.7%) | 119 (17.1%) |
| $300 to $499 | 291 (25.8%) | 94 (13.5%) |
| $500 to $799 | 96 (8.5%) | 269 (38.6%) |
| $800 to $999 | 249 (22.1%) | 112 (16.1%) |
| $1,000 to $1,499 | 0 (0.0%) | 32 (4.6%) |
| $1,500 to $1,999 | 149 (13.2%) | 0 (0.0%) |
| $2,000 to $2,499 | 0 (0.0%) | 0 (0.0%) |
| $2,500 to $2,999 | 0 (0.0%) | 0 (0.0%) |
| $3,000 or more | 7 (0.6%) | 0 (0.0%) |
| Total | 1,126 (100.0%) | 697 (100.0%) |
Physical Housing Characteristics in Kaplan
Housing Structures in Kaplan
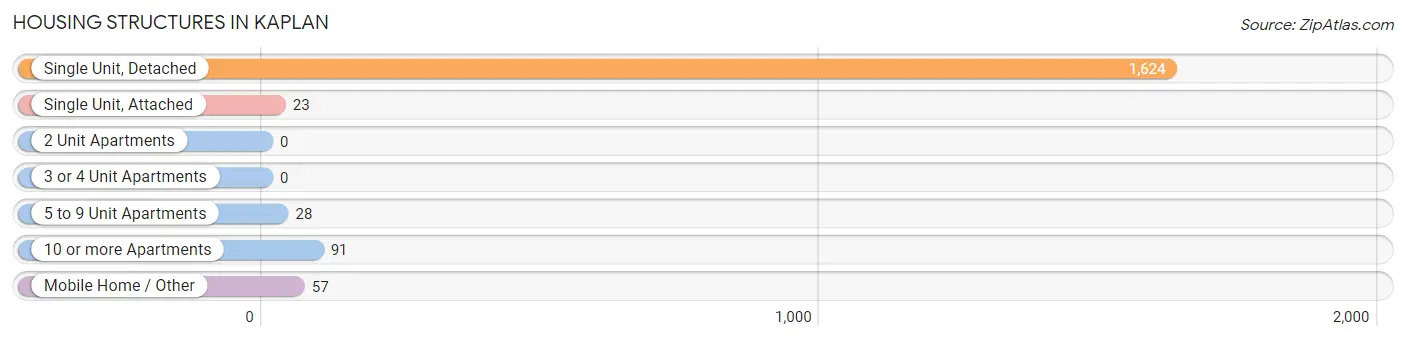
| Structure Type | # Housing Units | % Housing Units |
| Single Unit, Detached | 1,624 | 89.1% |
| Single Unit, Attached | 23 | 1.3% |
| 2 Unit Apartments | 0 | 0.0% |
| 3 or 4 Unit Apartments | 0 | 0.0% |
| 5 to 9 Unit Apartments | 28 | 1.5% |
| 10 or more Apartments | 91 | 5.0% |
| Mobile Home / Other | 57 | 3.1% |
| Total | 1,823 | 100.0% |
Housing Structures by Occupancy in Kaplan
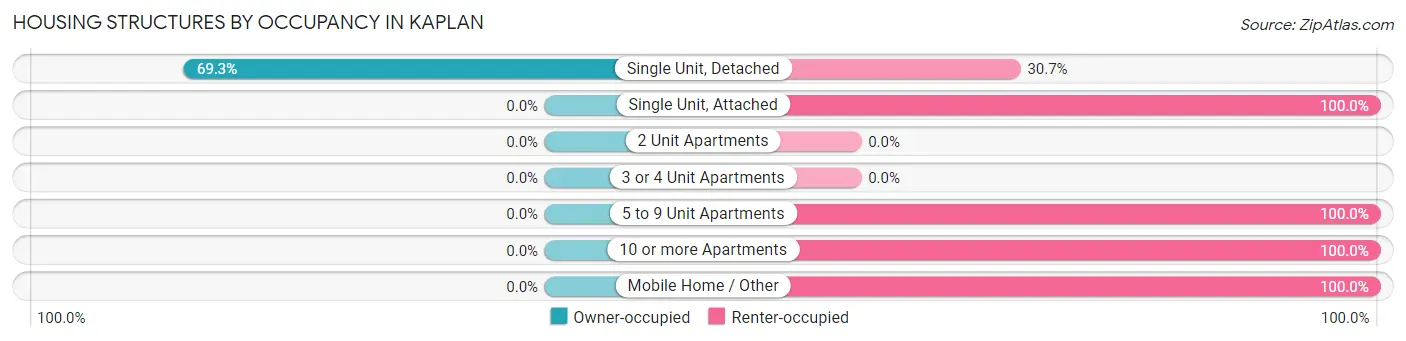
| Structure Type | Owner-occupied | Renter-occupied |
| Single Unit, Detached | 1,126 (69.3%) | 498 (30.7%) |
| Single Unit, Attached | 0 (0.0%) | 23 (100.0%) |
| 2 Unit Apartments | 0 (0.0%) | 0 (0.0%) |
| 3 or 4 Unit Apartments | 0 (0.0%) | 0 (0.0%) |
| 5 to 9 Unit Apartments | 0 (0.0%) | 28 (100.0%) |
| 10 or more Apartments | 0 (0.0%) | 91 (100.0%) |
| Mobile Home / Other | 0 (0.0%) | 57 (100.0%) |
| Total | 1,126 (61.8%) | 697 (38.2%) |
Housing Structures by Number of Rooms in Kaplan
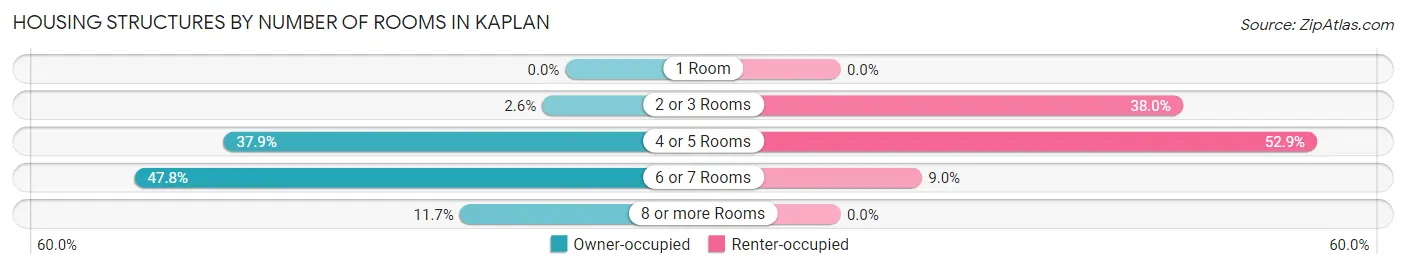
| Number of Rooms | Owner-occupied | Renter-occupied |
| 1 Room | 0 (0.0%) | 0 (0.0%) |
| 2 or 3 Rooms | 29 (2.6%) | 265 (38.0%) |
| 4 or 5 Rooms | 427 (37.9%) | 369 (52.9%) |
| 6 or 7 Rooms | 538 (47.8%) | 63 (9.0%) |
| 8 or more Rooms | 132 (11.7%) | 0 (0.0%) |
| Total | 1,126 (100.0%) | 697 (100.0%) |
Housing Structure by Heating Type in Kaplan
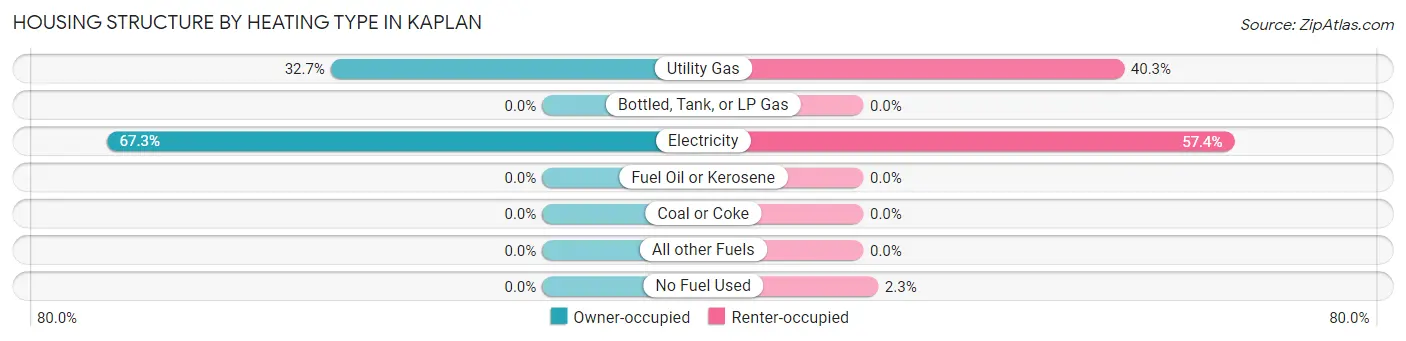
| Heating Type | Owner-occupied | Renter-occupied |
| Utility Gas | 368 (32.7%) | 281 (40.3%) |
| Bottled, Tank, or LP Gas | 0 (0.0%) | 0 (0.0%) |
| Electricity | 758 (67.3%) | 400 (57.4%) |
| Fuel Oil or Kerosene | 0 (0.0%) | 0 (0.0%) |
| Coal or Coke | 0 (0.0%) | 0 (0.0%) |
| All other Fuels | 0 (0.0%) | 0 (0.0%) |
| No Fuel Used | 0 (0.0%) | 16 (2.3%) |
| Total | 1,126 (100.0%) | 697 (100.0%) |
Household Vehicle Usage in Kaplan
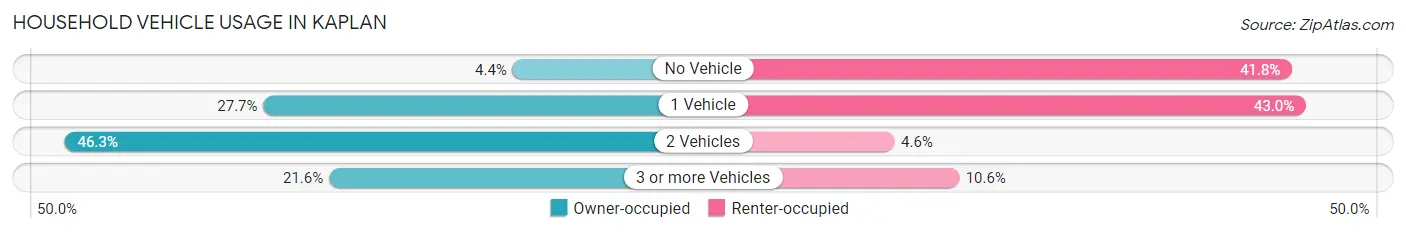
| Vehicles per Household | Owner-occupied | Renter-occupied |
| No Vehicle | 50 (4.4%) | 291 (41.7%) |
| 1 Vehicle | 312 (27.7%) | 300 (43.0%) |
| 2 Vehicles | 521 (46.3%) | 32 (4.6%) |
| 3 or more Vehicles | 243 (21.6%) | 74 (10.6%) |
| Total | 1,126 (100.0%) | 697 (100.0%) |
Real Estate & Mortgages in Kaplan
Real Estate and Mortgage Overview in Kaplan
| Characteristic | Without Mortgage | With Mortgage |
| Housing Units | 834 | 292 |
| Median Property Value | $81,600 | $119,500 |
| Median Household Income | $58,045 | $0 |
| Monthly Housing Costs | $353 | $7 |
| Real Estate Taxes | $199 | $147 |
Property Value by Mortgage Status in Kaplan
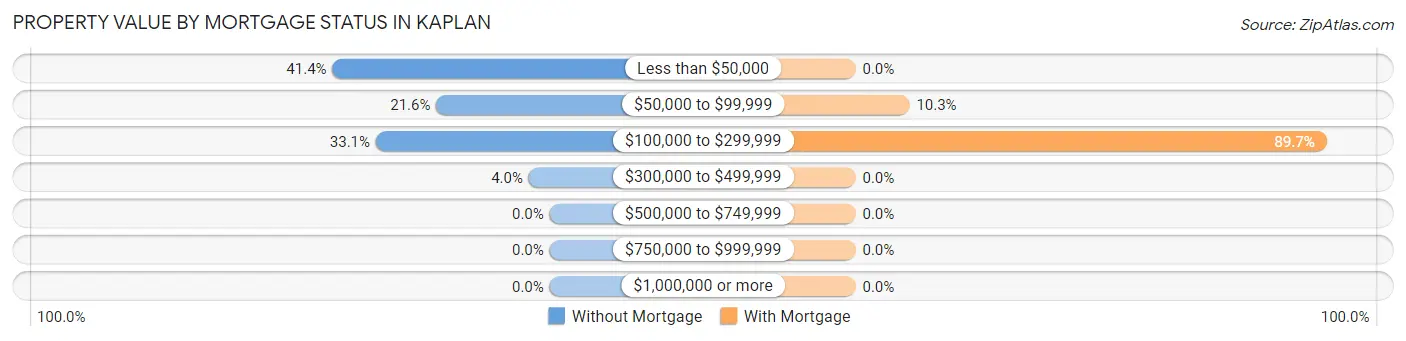
| Property Value | Without Mortgage | With Mortgage |
| Less than $50,000 | 345 (41.4%) | 0 (0.0%) |
| $50,000 to $99,999 | 180 (21.6%) | 30 (10.3%) |
| $100,000 to $299,999 | 276 (33.1%) | 262 (89.7%) |
| $300,000 to $499,999 | 33 (4.0%) | 0 (0.0%) |
| $500,000 to $749,999 | 0 (0.0%) | 0 (0.0%) |
| $750,000 to $999,999 | 0 (0.0%) | 0 (0.0%) |
| $1,000,000 or more | 0 (0.0%) | 0 (0.0%) |
| Total | 834 (100.0%) | 292 (100.0%) |
Household Income by Mortgage Status in Kaplan
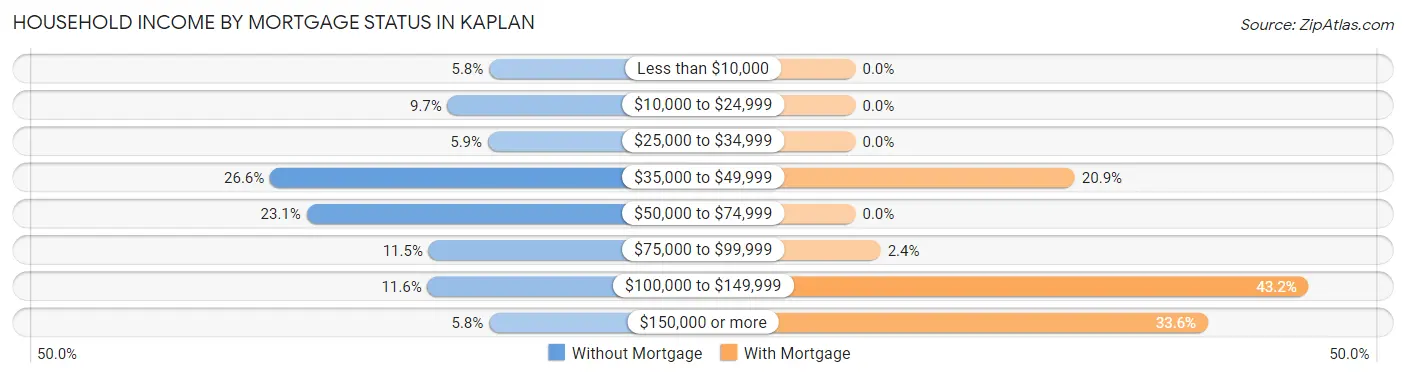
| Household Income | Without Mortgage | With Mortgage |
| Less than $10,000 | 48 (5.8%) | 0 (0.0%) |
| $10,000 to $24,999 | 81 (9.7%) | 0 (0.0%) |
| $25,000 to $34,999 | 49 (5.9%) | 0 (0.0%) |
| $35,000 to $49,999 | 222 (26.6%) | 61 (20.9%) |
| $50,000 to $74,999 | 193 (23.1%) | 0 (0.0%) |
| $75,000 to $99,999 | 96 (11.5%) | 7 (2.4%) |
| $100,000 to $149,999 | 97 (11.6%) | 126 (43.1%) |
| $150,000 or more | 48 (5.8%) | 98 (33.6%) |
| Total | 834 (100.0%) | 292 (100.0%) |
Property Value to Household Income Ratio in Kaplan
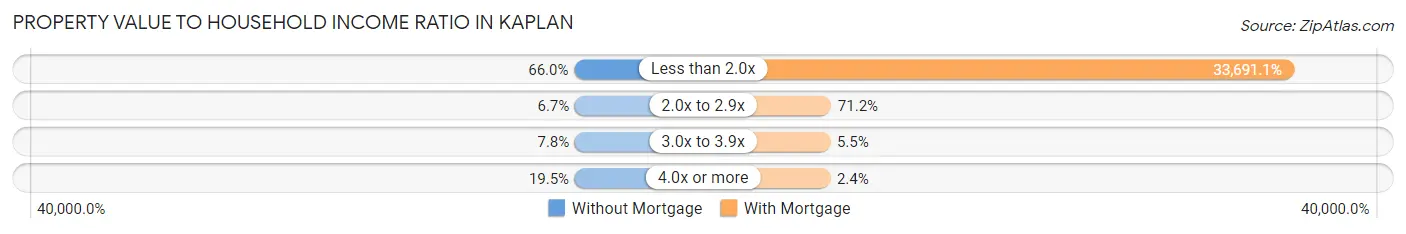
| Value-to-Income Ratio | Without Mortgage | With Mortgage |
| Less than 2.0x | 550 (65.9%) | 98,378 (33,691.1%) |
| 2.0x to 2.9x | 56 (6.7%) | 208 (71.2%) |
| 3.0x to 3.9x | 65 (7.8%) | 16 (5.5%) |
| 4.0x or more | 163 (19.5%) | 7 (2.4%) |
| Total | 834 (100.0%) | 292 (100.0%) |
Real Estate Taxes by Mortgage Status in Kaplan
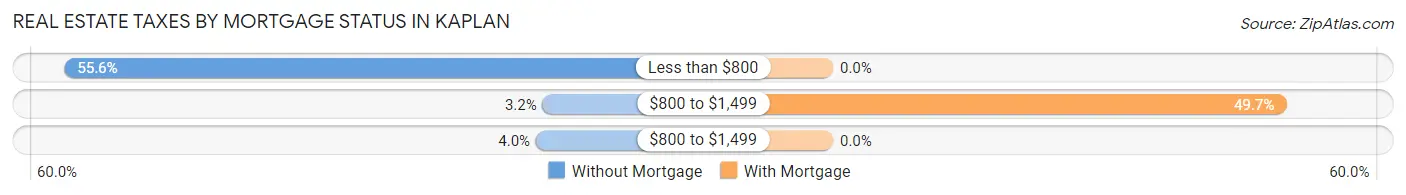
| Property Taxes | Without Mortgage | With Mortgage |
| Less than $800 | 464 (55.6%) | 0 (0.0%) |
| $800 to $1,499 | 27 (3.2%) | 145 (49.7%) |
| $800 to $1,499 | 33 (4.0%) | 0 (0.0%) |
| Total | 834 (100.0%) | 292 (100.0%) |
Health & Disability in Kaplan
Health Insurance Coverage by Age in Kaplan
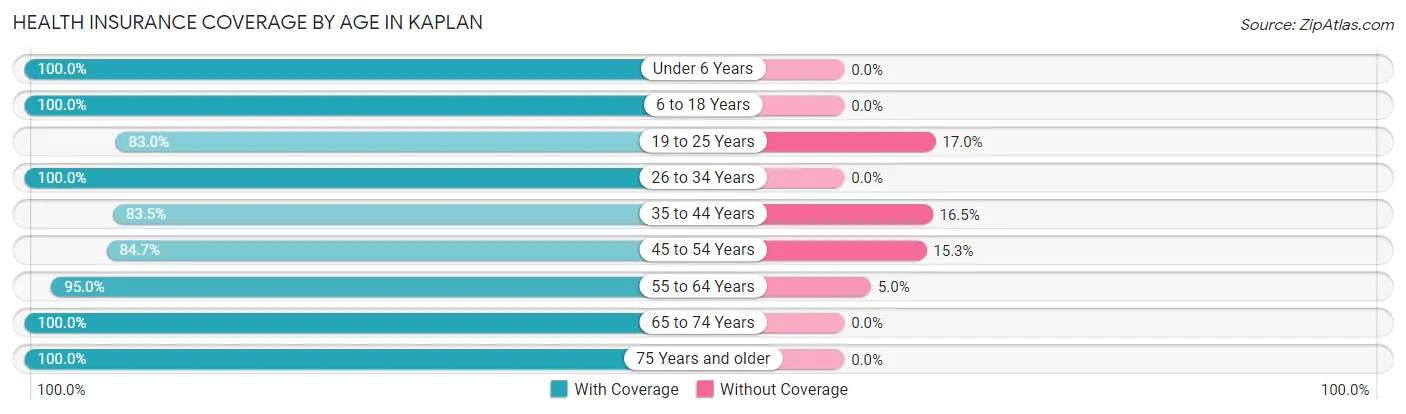
| Age Bracket | With Coverage | Without Coverage |
| Under 6 Years | 383 (100.0%) | 0 (0.0%) |
| 6 to 18 Years | 614 (100.0%) | 0 (0.0%) |
| 19 to 25 Years | 381 (83.0%) | 78 (17.0%) |
| 26 to 34 Years | 291 (100.0%) | 0 (0.0%) |
| 35 to 44 Years | 345 (83.5%) | 68 (16.5%) |
| 45 to 54 Years | 321 (84.7%) | 58 (15.3%) |
| 55 to 64 Years | 782 (95.0%) | 41 (5.0%) |
| 65 to 74 Years | 391 (100.0%) | 0 (0.0%) |
| 75 Years and older | 430 (100.0%) | 0 (0.0%) |
| Total | 3,938 (94.1%) | 245 (5.9%) |
Health Insurance Coverage by Citizenship Status in Kaplan
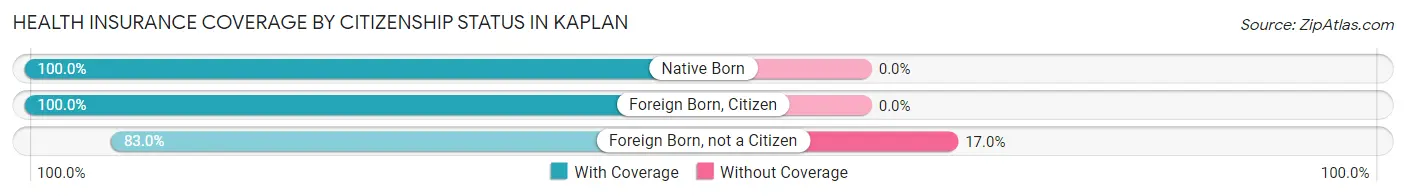
| Citizenship Status | With Coverage | Without Coverage |
| Native Born | 383 (100.0%) | 0 (0.0%) |
| Foreign Born, Citizen | 614 (100.0%) | 0 (0.0%) |
| Foreign Born, not a Citizen | 381 (83.0%) | 78 (17.0%) |
Health Insurance Coverage by Household Income in Kaplan
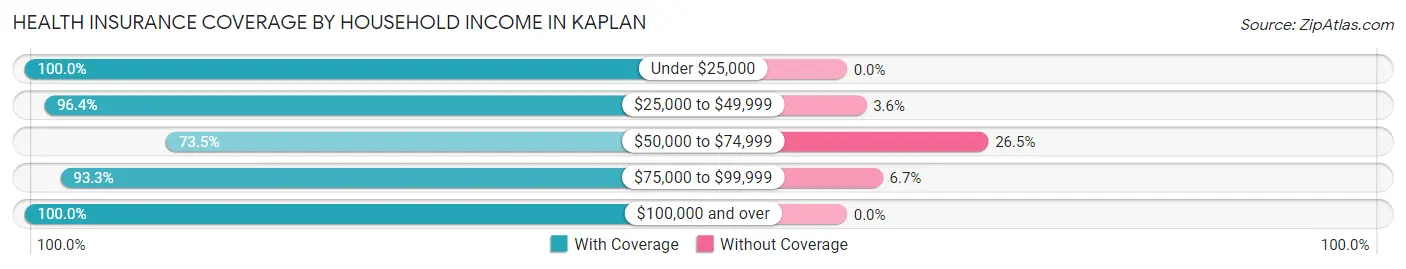
| Household Income | With Coverage | Without Coverage |
| Under $25,000 | 1,040 (100.0%) | 0 (0.0%) |
| $25,000 to $49,999 | 1,084 (96.4%) | 41 (3.6%) |
| $50,000 to $74,999 | 405 (73.5%) | 146 (26.5%) |
| $75,000 to $99,999 | 806 (93.3%) | 58 (6.7%) |
| $100,000 and over | 599 (100.0%) | 0 (0.0%) |
Public vs Private Health Insurance Coverage by Age in Kaplan
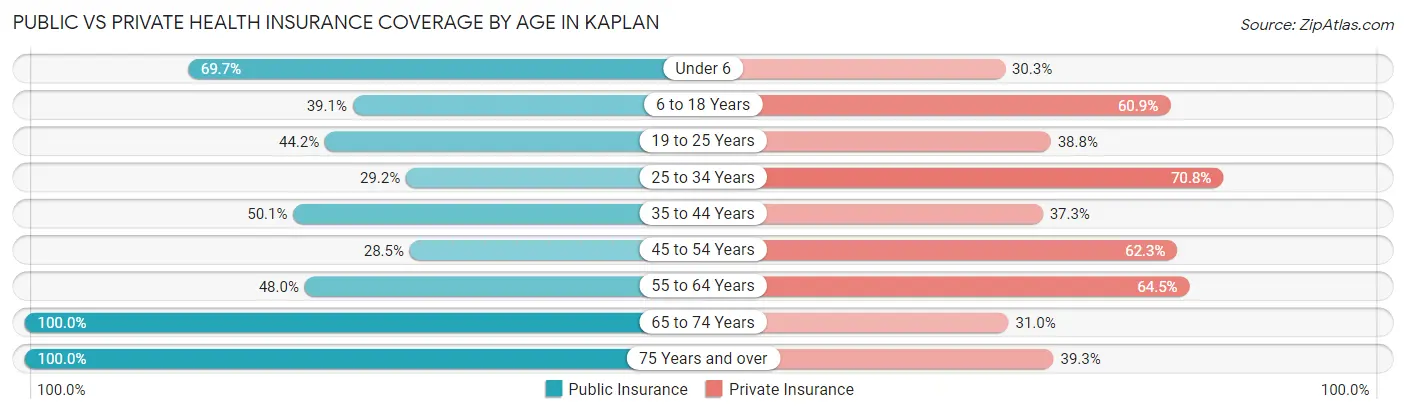
| Age Bracket | Public Insurance | Private Insurance |
| Under 6 | 267 (69.7%) | 116 (30.3%) |
| 6 to 18 Years | 240 (39.1%) | 374 (60.9%) |
| 19 to 25 Years | 203 (44.2%) | 178 (38.8%) |
| 25 to 34 Years | 85 (29.2%) | 206 (70.8%) |
| 35 to 44 Years | 207 (50.1%) | 154 (37.3%) |
| 45 to 54 Years | 108 (28.5%) | 236 (62.3%) |
| 55 to 64 Years | 395 (48.0%) | 531 (64.5%) |
| 65 to 74 Years | 391 (100.0%) | 121 (30.9%) |
| 75 Years and over | 430 (100.0%) | 169 (39.3%) |
| Total | 2,326 (55.6%) | 2,085 (49.8%) |
Disability Status by Sex by Age in Kaplan
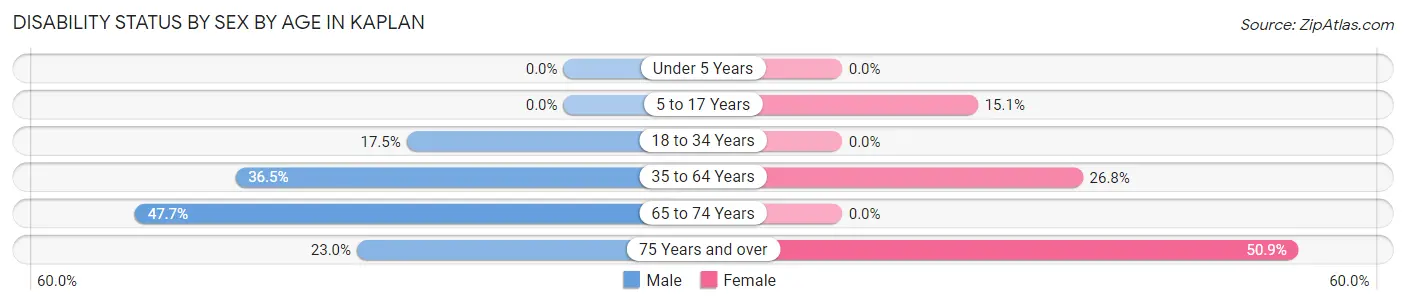
| Age Bracket | Male | Female |
| Under 5 Years | 0 (0.0%) | 0 (0.0%) |
| 5 to 17 Years | 0 (0.0%) | 53 (15.1%) |
| 18 to 34 Years | 77 (17.5%) | 0 (0.0%) |
| 35 to 64 Years | 319 (36.5%) | 199 (26.8%) |
| 65 to 74 Years | 115 (47.7%) | 0 (0.0%) |
| 75 Years and over | 46 (23.0%) | 117 (50.9%) |
Disability Class by Sex by Age in Kaplan
Disability Class: Hearing Difficulty
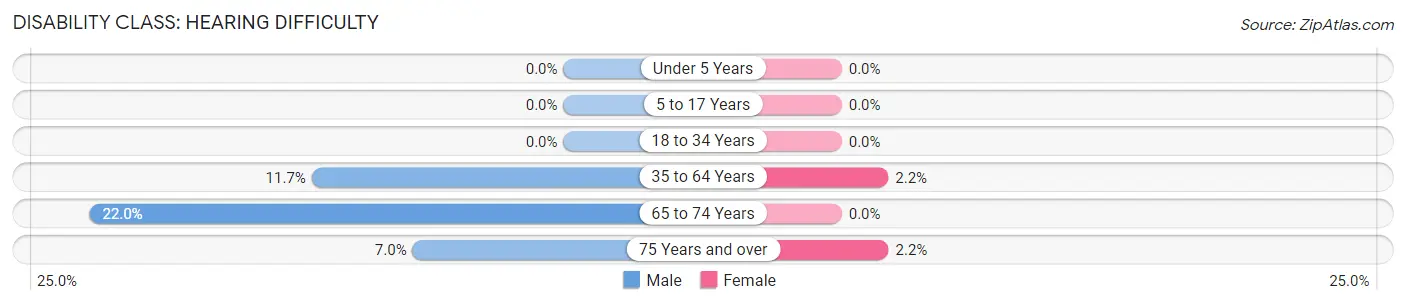
| Age Bracket | Male | Female |
| Under 5 Years | 0 (0.0%) | 0 (0.0%) |
| 5 to 17 Years | 0 (0.0%) | 0 (0.0%) |
| 18 to 34 Years | 0 (0.0%) | 0 (0.0%) |
| 35 to 64 Years | 102 (11.7%) | 16 (2.2%) |
| 65 to 74 Years | 53 (22.0%) | 0 (0.0%) |
| 75 Years and over | 14 (7.0%) | 5 (2.2%) |
Disability Class: Vision Difficulty
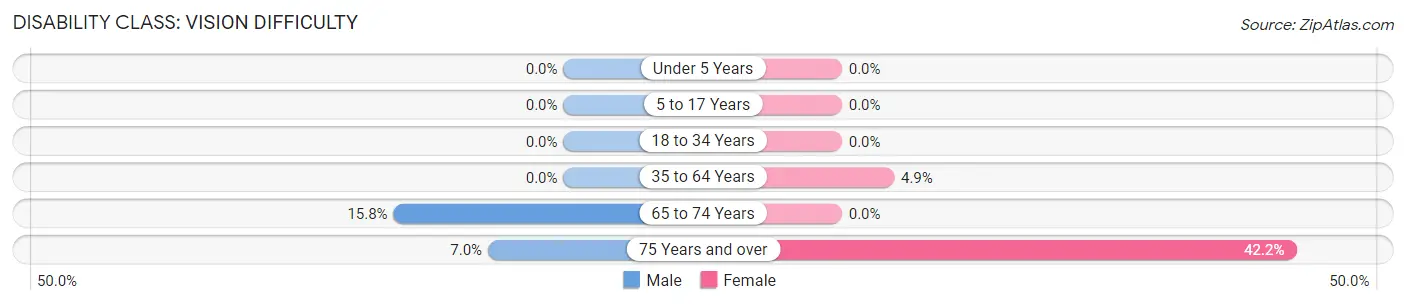
| Age Bracket | Male | Female |
| Under 5 Years | 0 (0.0%) | 0 (0.0%) |
| 5 to 17 Years | 0 (0.0%) | 0 (0.0%) |
| 18 to 34 Years | 0 (0.0%) | 0 (0.0%) |
| 35 to 64 Years | 0 (0.0%) | 36 (4.9%) |
| 65 to 74 Years | 38 (15.8%) | 0 (0.0%) |
| 75 Years and over | 14 (7.0%) | 97 (42.2%) |
Disability Class: Cognitive Difficulty
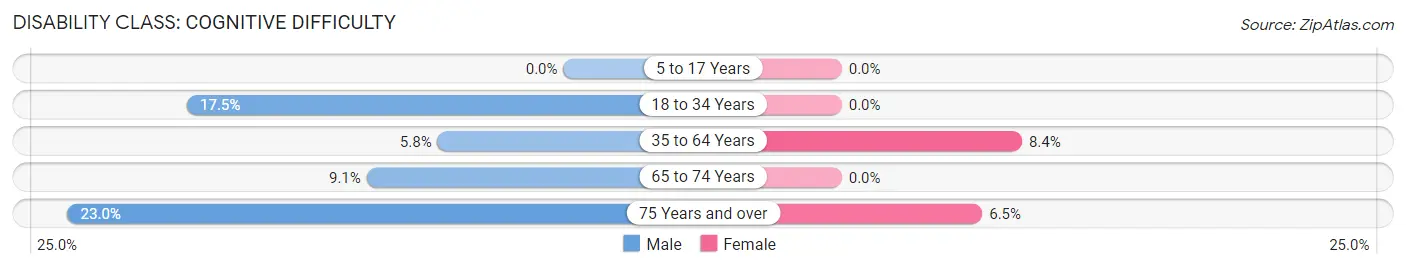
| Age Bracket | Male | Female |
| 5 to 17 Years | 0 (0.0%) | 0 (0.0%) |
| 18 to 34 Years | 77 (17.5%) | 0 (0.0%) |
| 35 to 64 Years | 51 (5.8%) | 62 (8.4%) |
| 65 to 74 Years | 22 (9.1%) | 0 (0.0%) |
| 75 Years and over | 46 (23.0%) | 15 (6.5%) |
Disability Class: Ambulatory Difficulty
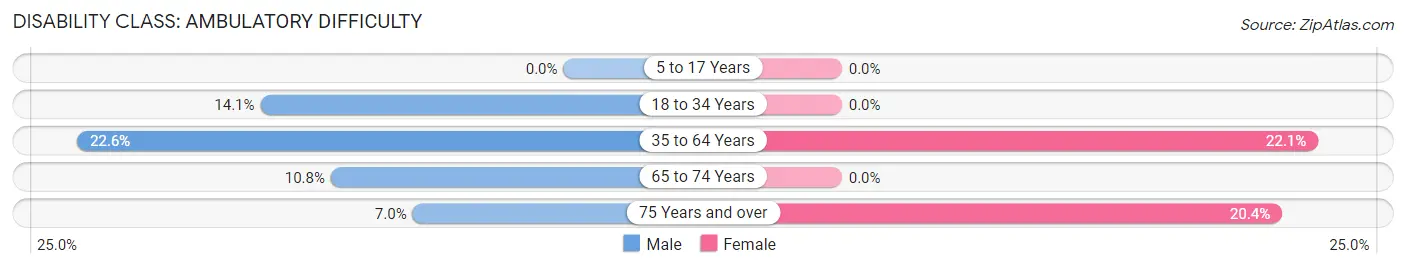
| Age Bracket | Male | Female |
| 5 to 17 Years | 0 (0.0%) | 0 (0.0%) |
| 18 to 34 Years | 62 (14.1%) | 0 (0.0%) |
| 35 to 64 Years | 197 (22.6%) | 164 (22.1%) |
| 65 to 74 Years | 26 (10.8%) | 0 (0.0%) |
| 75 Years and over | 14 (7.0%) | 47 (20.4%) |
Disability Class: Self-Care Difficulty
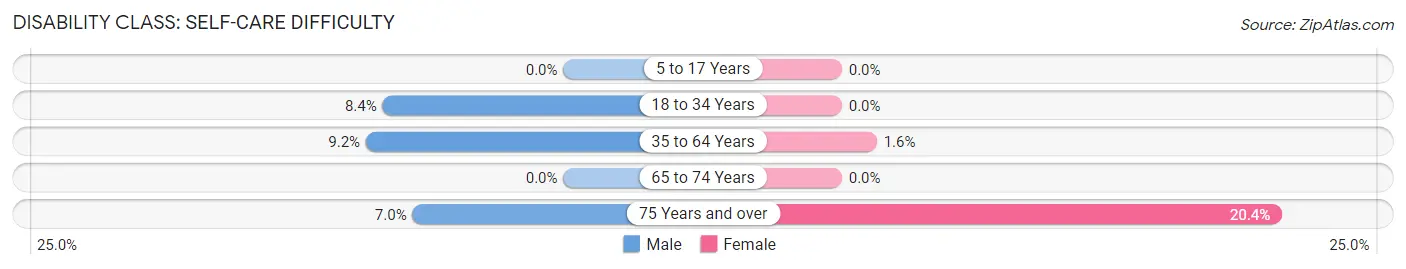
| Age Bracket | Male | Female |
| 5 to 17 Years | 0 (0.0%) | 0 (0.0%) |
| 18 to 34 Years | 37 (8.4%) | 0 (0.0%) |
| 35 to 64 Years | 80 (9.2%) | 12 (1.6%) |
| 65 to 74 Years | 0 (0.0%) | 0 (0.0%) |
| 75 Years and over | 14 (7.0%) | 47 (20.4%) |
Technology Access in Kaplan
Computing Device Access in Kaplan
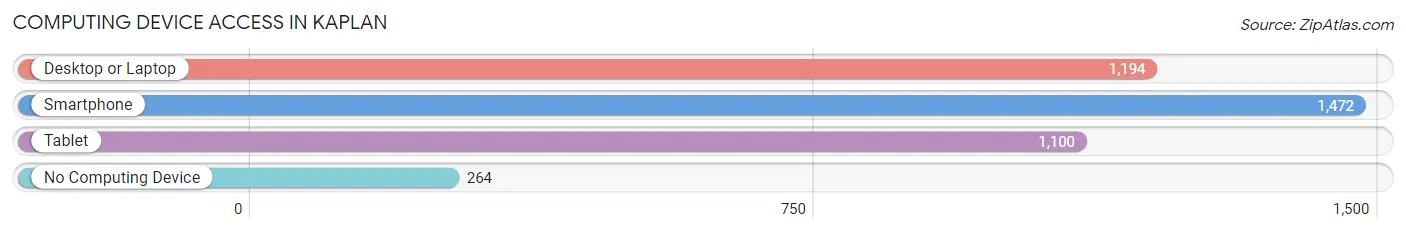
| Device Type | # Households | % Households |
| Desktop or Laptop | 1,194 | 65.5% |
| Smartphone | 1,472 | 80.7% |
| Tablet | 1,100 | 60.3% |
| No Computing Device | 264 | 14.5% |
| Total | 1,823 | 100.0% |
Internet Access in Kaplan
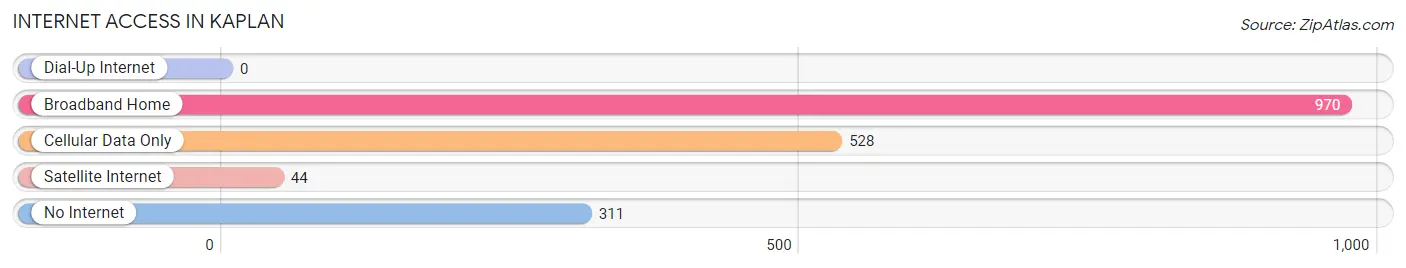
| Internet Type | # Households | % Households |
| Dial-Up Internet | 0 | 0.0% |
| Broadband Home | 970 | 53.2% |
| Cellular Data Only | 528 | 29.0% |
| Satellite Internet | 44 | 2.4% |
| No Internet | 311 | 17.1% |
| Total | 1,823 | 100.0% |
Kaplan Summary
Los Angeles, California, is the second-largest city in the United States and the largest city in the state of California. It is located in the southern part of the state, along the Pacific Ocean. Los Angeles is a major center of business, international trade, entertainment, culture, media, fashion, science, technology, and education. It is home to renowned institutions covering a broad range of professional and cultural fields, and is one of the most substantial economic engines within the United States.
History
The history of Los Angeles dates back to 1781, when Spanish governor Felipe de Neve founded the city as El Pueblo de Nuestra Señora la Reina de los Angeles de Porciuncula. The city was originally a small agricultural community, but it quickly grew into a major port and commercial center. In the late 19th century, Los Angeles was transformed into a major industrial center, with the construction of the Los Angeles Aqueduct in 1913. This allowed the city to become a major producer of oil, citrus, and other agricultural products.
In the early 20th century, Los Angeles experienced a period of rapid growth, becoming the largest city in the western United States by 1930. This growth was fueled by the film industry, which established itself in the city in the 1910s. The city also became a major center of the aerospace industry during World War II, and the city's population continued to grow throughout the 1950s and 1960s.
Geography
Los Angeles is located in the southern part of California, along the Pacific Ocean. The city covers an area of 502 square miles, making it the second-largest city in the United States by area. The city is divided into four distinct regions: the San Fernando Valley, the Conejo Valley, the San Gabriel Valley, and the South Bay. The city is bordered by the San Gabriel Mountains to the north, the Santa Monica Mountains to the south, and the Pacific Ocean to the west.
Economy
Los Angeles is a major center of business, international trade, entertainment, culture, media, fashion, science, technology, and education. The city is home to numerous Fortune 500 companies, including The Walt Disney Company, Northrop Grumman, and Occidental Petroleum. The city is also a major center of the entertainment industry, with numerous film and television studios located in the city.
The Los Angeles economy is highly diversified, with a strong focus on technology, finance, manufacturing, and tourism. The city is home to the Los Angeles Stock Exchange, the largest stock exchange in the western United States. The city is also a major center of international trade, with the Port of Los Angeles being the busiest port in the United States.
Demographics
As of 2019, Los Angeles had an estimated population of 4,000,000 people. The city is highly diverse, with no single racial or ethnic group making up a majority of the population. The largest racial or ethnic groups in the city are Hispanic or Latino (47.7%), White (29.2%), Asian (11.2%), and African American (9.2%).
Los Angeles is also home to a large immigrant population, with over one million foreign-born residents. The largest immigrant groups in the city are from Mexico (31.2%), El Salvador (7.2%), Guatemala (5.2%), and the Philippines (4.2%).
Los Angeles is a major center of education, with numerous universities and colleges located in the city. The largest universities in the city are the University of California, Los Angeles (UCLA), the University of Southern California (USC), and California State University, Los Angeles (CSULA).
Common Questions
What is Per Capita Income in Kaplan?
Per Capita income in Kaplan is $25,808.
What is the Median Family Income in Kaplan?
Median Family Income in Kaplan is $66,045.
What is the Median Household income in Kaplan?
Median Household Income in Kaplan is $38,505.
What is Income or Wage Gap in Kaplan?
Income or Wage Gap in Kaplan is 39.0%.
Women in Kaplan earn 61.0 cents for every dollar earned by a man.
What is Inequality or Gini Index in Kaplan?
Inequality or Gini Index in Kaplan is 0.50.
What is the Total Population of Kaplan?
Total Population of Kaplan is 4,335.
What is the Total Male Population of Kaplan?
Total Male Population of Kaplan is 2,281.
What is the Total Female Population of Kaplan?
Total Female Population of Kaplan is 2,054.
What is the Ratio of Males per 100 Females in Kaplan?
There are 111.05 Males per 100 Females in Kaplan.
What is the Ratio of Females per 100 Males in Kaplan?
There are 90.05 Females per 100 Males in Kaplan.
What is the Median Population Age in Kaplan?
Median Population Age in Kaplan is 43.4 Years.
What is the Average Family Size in Kaplan
Average Family Size in Kaplan is 3.1 People.
What is the Average Household Size in Kaplan
Average Household Size in Kaplan is 2.3 People.
How Large is the Labor Force in Kaplan?
There are 1,449 People in the Labor Forcein in Kaplan.
What is the Percentage of People in the Labor Force in Kaplan?
41.4% of People are in the Labor Force in Kaplan.
What is the Unemployment Rate in Kaplan?
Unemployment Rate in Kaplan is 9.0%.