Iowa, LA Map & Demographics
Iowa Map
Iowa Overview
$29,320
PER CAPITA INCOME
$77,056
AVG FAMILY INCOME
$62,024
AVG HOUSEHOLD INCOME
23.2%
WAGE / INCOME GAP [ % ]
76.8¢/ $1
WAGE / INCOME GAP [ $ ]
0.39
INEQUALITY / GINI INDEX
3,297
TOTAL POPULATION
1,490
MALE POPULATION
1,807
FEMALE POPULATION
82.46
MALES / 100 FEMALES
121.28
FEMALES / 100 MALES
35.3
MEDIAN AGE
3.3
AVG FAMILY SIZE
3.0
AVG HOUSEHOLD SIZE
1,411
LABOR FORCE [ PEOPLE ]
55.8%
PERCENT IN LABOR FORCE
5.2%
UNEMPLOYMENT RATE
Iowa Zip Codes
Iowa Area Codes
Income in Iowa
Income Overview in Iowa
Per Capita Income in Iowa is $29,320, while median incomes of families and households are $77,056 and $62,024 respectively.
| Characteristic | Number | Measure |
| Per Capita Income | 3,297 | $29,320 |
| Median Family Income | 921 | $77,056 |
| Mean Family Income | 921 | $86,940 |
| Median Household Income | 1,094 | $62,024 |
| Mean Household Income | 1,094 | $81,293 |
| Income Deficit | 921 | $0 |
| Wage / Income Gap (%) | 3,297 | 23.16% |
| Wage / Income Gap ($) | 3,297 | 76.84¢ per $1 |
| Gini / Inequality Index | 3,297 | 0.39 |
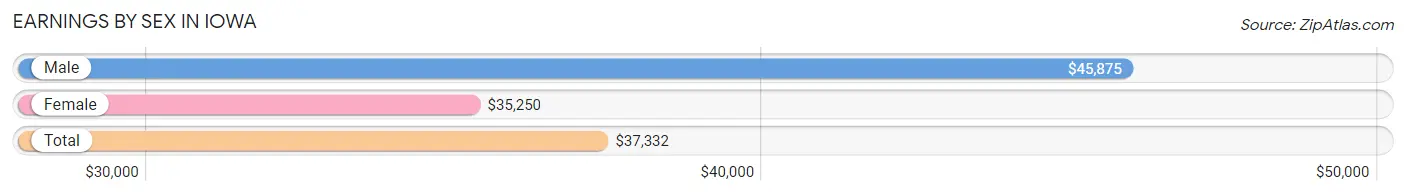
Earnings by Sex in Iowa
Average Earnings in Iowa are $37,332, $45,875 for men and $35,250 for women, a difference of 23.2%.
| Sex | Number | Average Earnings |
| Male | 705 (46.9%) | $45,875 |
| Female | 798 (53.1%) | $35,250 |
| Total | 1,503 (100.0%) | $37,332 |
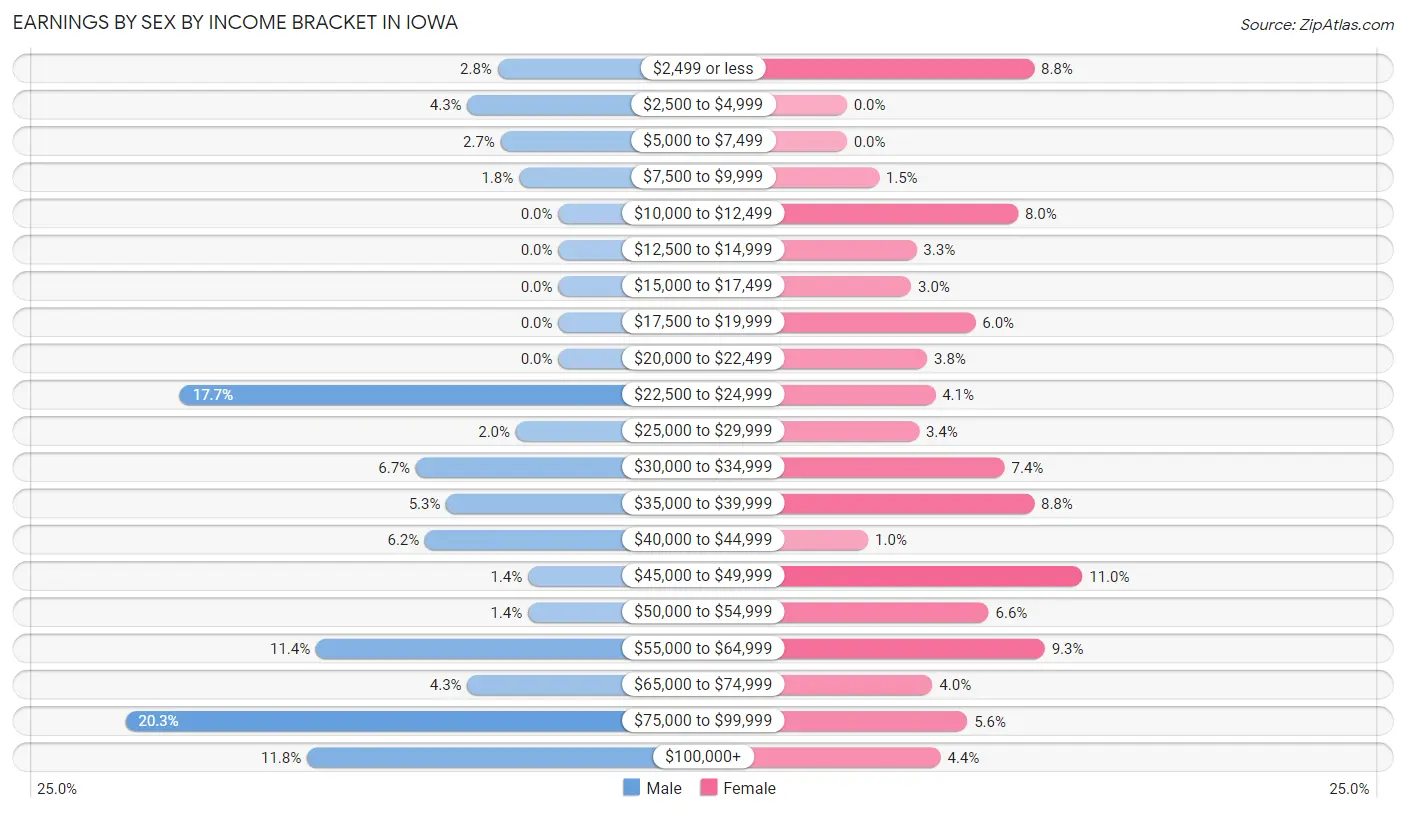
Earnings by Sex by Income Bracket in Iowa
The most common earnings brackets in Iowa are $75,000 to $99,999 for men (143 | 20.3%) and $45,000 to $49,999 for women (88 | 11.0%).
| Income | Male | Female |
| $2,499 or less | 20 (2.8%) | 70 (8.8%) |
| $2,500 to $4,999 | 30 (4.3%) | 0 (0.0%) |
| $5,000 to $7,499 | 19 (2.7%) | 0 (0.0%) |
| $7,500 to $9,999 | 13 (1.8%) | 12 (1.5%) |
| $10,000 to $12,499 | 0 (0.0%) | 64 (8.0%) |
| $12,500 to $14,999 | 0 (0.0%) | 26 (3.3%) |
| $15,000 to $17,499 | 0 (0.0%) | 24 (3.0%) |
| $17,500 to $19,999 | 0 (0.0%) | 48 (6.0%) |
| $20,000 to $22,499 | 0 (0.0%) | 30 (3.8%) |
| $22,500 to $24,999 | 125 (17.7%) | 33 (4.1%) |
| $25,000 to $29,999 | 14 (2.0%) | 27 (3.4%) |
| $30,000 to $34,999 | 47 (6.7%) | 59 (7.4%) |
| $35,000 to $39,999 | 37 (5.2%) | 70 (8.8%) |
| $40,000 to $44,999 | 44 (6.2%) | 8 (1.0%) |
| $45,000 to $49,999 | 10 (1.4%) | 88 (11.0%) |
| $50,000 to $54,999 | 10 (1.4%) | 53 (6.6%) |
| $55,000 to $64,999 | 80 (11.4%) | 74 (9.3%) |
| $65,000 to $74,999 | 30 (4.3%) | 32 (4.0%) |
| $75,000 to $99,999 | 143 (20.3%) | 45 (5.6%) |
| $100,000+ | 83 (11.8%) | 35 (4.4%) |
| Total | 705 (100.0%) | 798 (100.0%) |
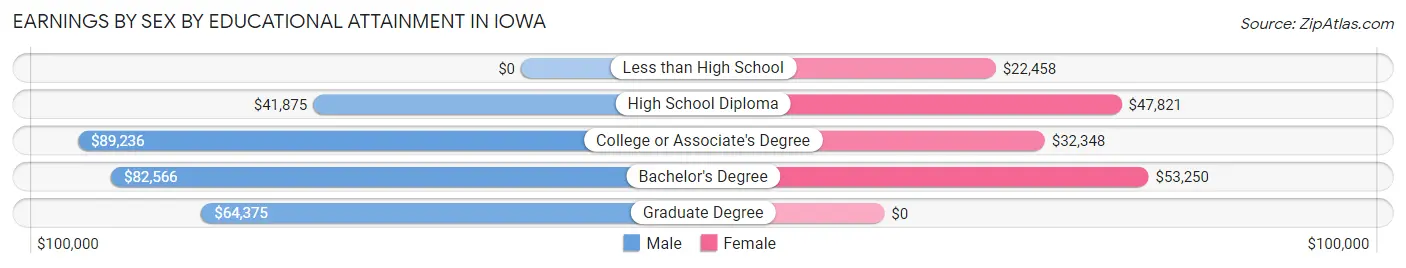
Earnings by Sex by Educational Attainment in Iowa
Average earnings in Iowa are $67,647 for men and $41,250 for women, a difference of 39.0%. Men with an educational attainment of college or associate's degree enjoy the highest average annual earnings of $89,236, while those with high school diploma education earn the least with $41,875. Women with an educational attainment of bachelor's degree earn the most with the average annual earnings of $53,250, while those with less than high school education have the smallest earnings of $22,458.
| Educational Attainment | Male Income | Female Income |
| Less than High School | - | - |
| High School Diploma | $41,875 | $47,821 |
| College or Associate's Degree | $89,236 | $32,348 |
| Bachelor's Degree | $82,566 | $53,250 |
| Graduate Degree | $64,375 | $0 |
| Total | $67,647 | $41,250 |
Family Income in Iowa
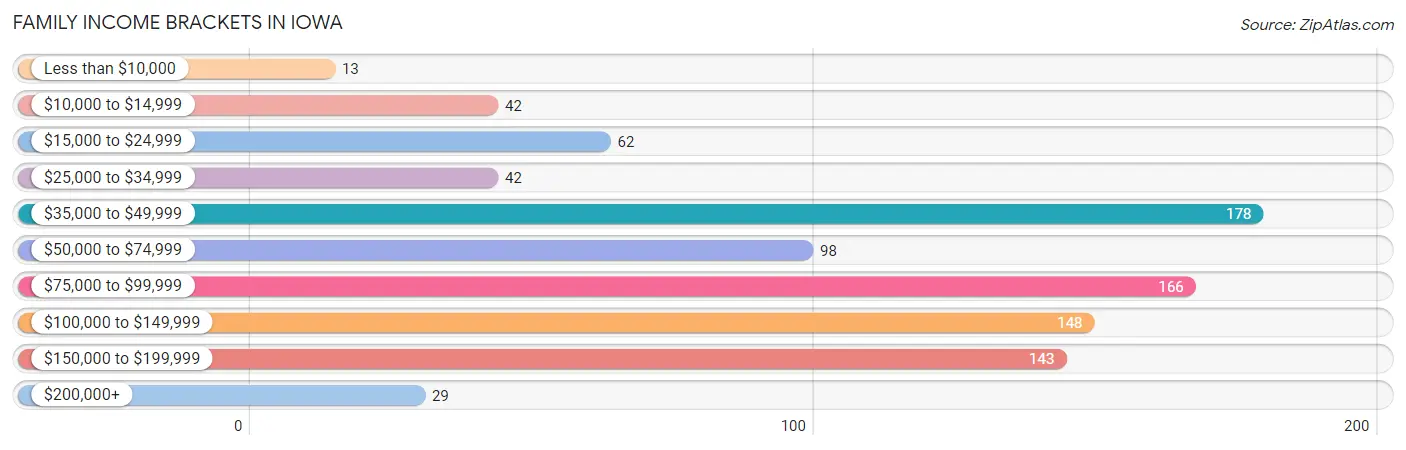
Family Income Brackets in Iowa
According to the Iowa family income data, there are 178 families falling into the $35,000 to $49,999 income range, which is the most common income bracket and makes up 19.3% of all families. Conversely, the less than $10,000 income bracket is the least frequent group with only 13 families (1.4%) belonging to this category.
| Income Bracket | # Families | % Families |
| Less than $10,000 | 13 | 1.4% |
| $10,000 to $14,999 | 42 | 4.6% |
| $15,000 to $24,999 | 62 | 6.7% |
| $25,000 to $34,999 | 42 | 4.6% |
| $35,000 to $49,999 | 178 | 19.3% |
| $50,000 to $74,999 | 98 | 10.6% |
| $75,000 to $99,999 | 166 | 18.0% |
| $100,000 to $149,999 | 148 | 16.1% |
| $150,000 to $199,999 | 143 | 15.5% |
| $200,000+ | 29 | 3.1% |
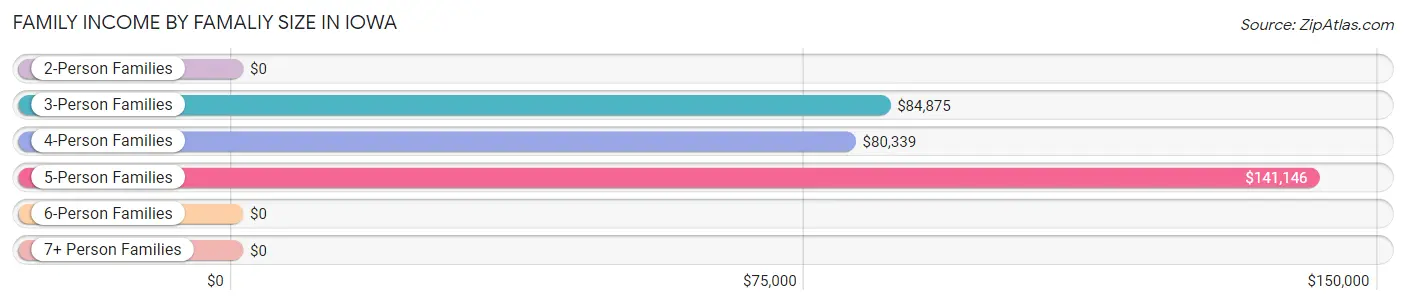
Family Income by Famaliy Size in Iowa
5-person families (64 | 7.0%) account for the highest median family income in Iowa with $141,146 per family, while 3-person families (189 | 20.5%) have the highest median income of $28,292 per family member.
| Income Bracket | # Families | Median Income |
| 2-Person Families | 466 (50.6%) | $0 |
| 3-Person Families | 189 (20.5%) | $84,875 |
| 4-Person Families | 179 (19.4%) | $80,339 |
| 5-Person Families | 64 (7.0%) | $141,146 |
| 6-Person Families | 17 (1.8%) | $0 |
| 7+ Person Families | 6 (0.6%) | $0 |
| Total | 921 (100.0%) | $77,056 |
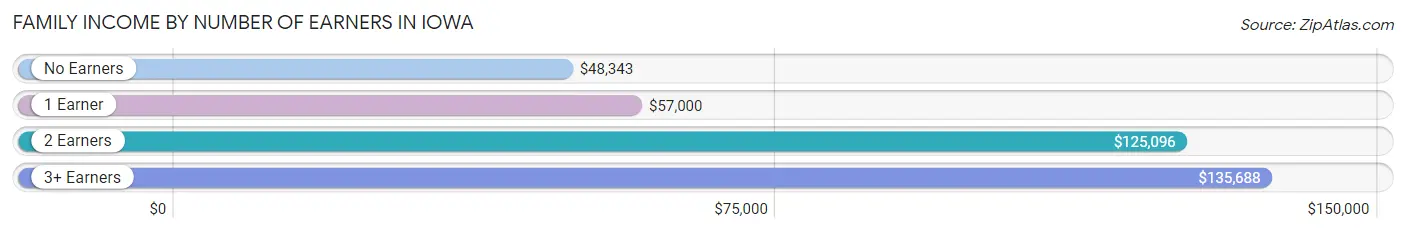
Family Income by Number of Earners in Iowa
The median family income in Iowa is $77,056, with families comprising 3+ earners (75) having the highest median family income of $135,688, while families with no earners (285) have the lowest median family income of $48,343, accounting for 8.1% and 30.9% of families, respectively.
| Number of Earners | # Families | Median Income |
| No Earners | 285 (30.9%) | $48,343 |
| 1 Earner | 222 (24.1%) | $57,000 |
| 2 Earners | 339 (36.8%) | $125,096 |
| 3+ Earners | 75 (8.1%) | $135,688 |
| Total | 921 (100.0%) | $77,056 |
Household Income in Iowa
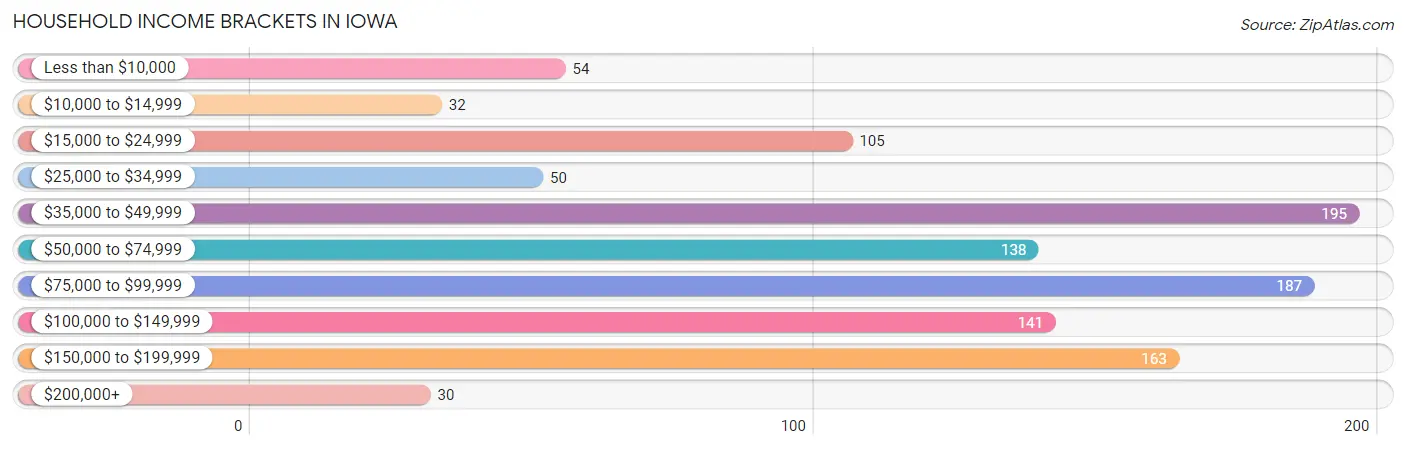
Household Income Brackets in Iowa
With 195 households falling in the category, the $35,000 to $49,999 income range is the most frequent in Iowa, accounting for 17.8% of all households. In contrast, only 30 households (2.7%) fall into the $200,000+ income bracket, making it the least populous group.
| Income Bracket | # Households | % Households |
| Less than $10,000 | 54 | 4.9% |
| $10,000 to $14,999 | 32 | 2.9% |
| $15,000 to $24,999 | 105 | 9.6% |
| $25,000 to $34,999 | 50 | 4.6% |
| $35,000 to $49,999 | 195 | 17.8% |
| $50,000 to $74,999 | 138 | 12.6% |
| $75,000 to $99,999 | 187 | 17.1% |
| $100,000 to $149,999 | 141 | 12.9% |
| $150,000 to $199,999 | 163 | 14.9% |
| $200,000+ | 30 | 2.7% |
Household Income by Householder Age in Iowa
The median household income in Iowa is $62,024, with the highest median household income of $84,103 found in the 45 to 64 years age bracket for the primary householder. A total of 381 households (34.8%) fall into this category. Meanwhile, the 15 to 24 years age bracket for the primary householder has the lowest median household income of $0, with 12 households (1.1%) in this group.
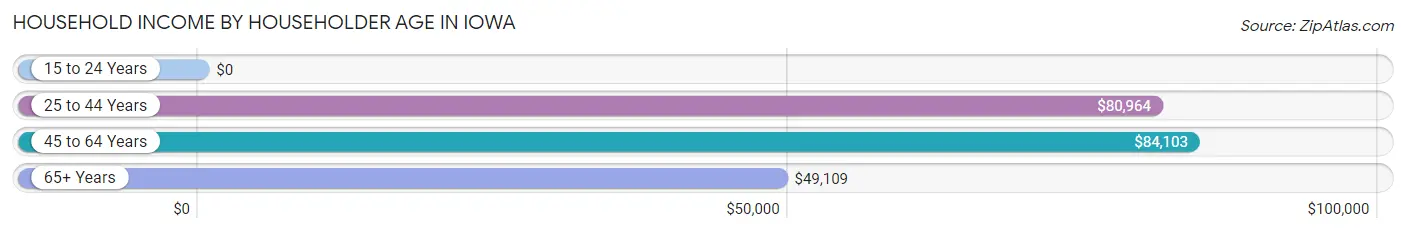
| Income Bracket | # Households | Median Income |
| 15 to 24 Years | 12 (1.1%) | $0 |
| 25 to 44 Years | 335 (30.6%) | $80,964 |
| 45 to 64 Years | 381 (34.8%) | $84,103 |
| 65+ Years | 366 (33.5%) | $49,109 |
| Total | 1,094 (100.0%) | $62,024 |
Poverty in Iowa
Income Below Poverty by Sex and Age in Iowa
With 8.3% poverty level for males and 14.9% for females among the residents of Iowa, 12 to 14 year old males and 5 year old females are the most vulnerable to poverty, with 28 males (29.2%) and 18 females (50.0%) in their respective age groups living below the poverty level.
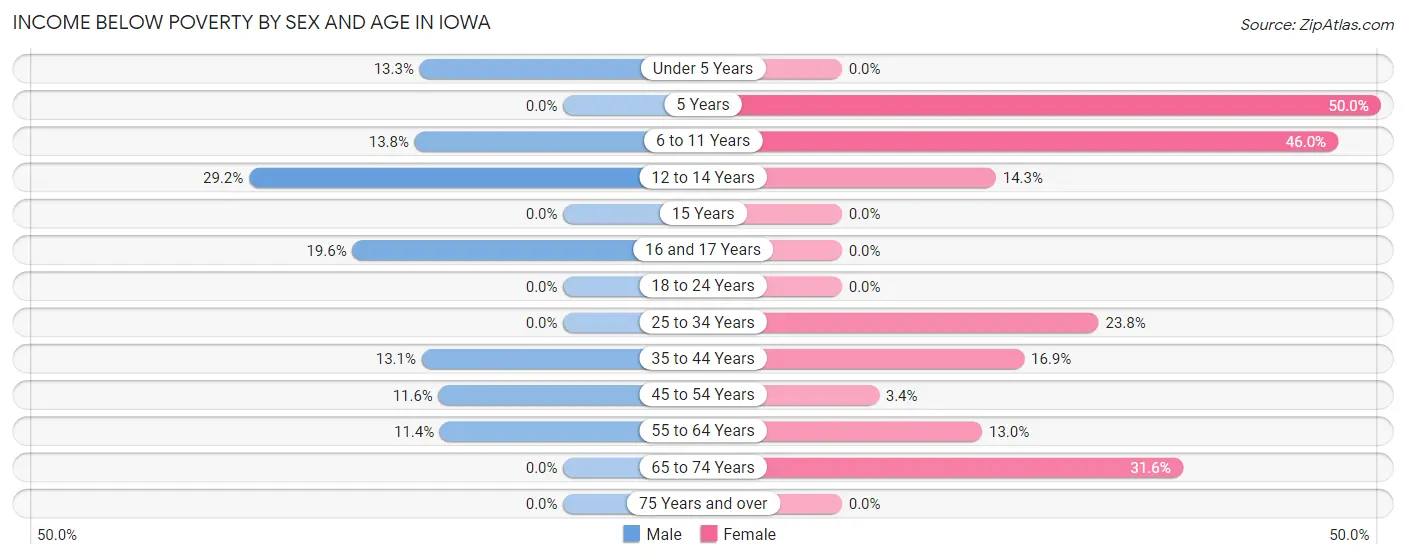
| Age Bracket | Male | Female |
| Under 5 Years | 12 (13.3%) | 0 (0.0%) |
| 5 Years | 0 (0.0%) | 18 (50.0%) |
| 6 to 11 Years | 20 (13.8%) | 64 (46.0%) |
| 12 to 14 Years | 28 (29.2%) | 22 (14.3%) |
| 15 Years | 0 (0.0%) | 0 (0.0%) |
| 16 and 17 Years | 9 (19.6%) | 0 (0.0%) |
| 18 to 24 Years | 0 (0.0%) | 0 (0.0%) |
| 25 to 34 Years | 0 (0.0%) | 61 (23.8%) |
| 35 to 44 Years | 18 (13.1%) | 33 (16.9%) |
| 45 to 54 Years | 14 (11.6%) | 7 (3.4%) |
| 55 to 64 Years | 23 (11.4%) | 22 (13.0%) |
| 65 to 74 Years | 0 (0.0%) | 43 (31.6%) |
| 75 Years and over | 0 (0.0%) | 0 (0.0%) |
| Total | 124 (8.3%) | 270 (14.9%) |
Income Above Poverty by Sex and Age in Iowa
According to the poverty statistics in Iowa, males aged 18 to 24 years and females aged under 5 years are the age groups that are most secure financially, with 100.0% of males and 100.0% of females in these age groups living above the poverty line.
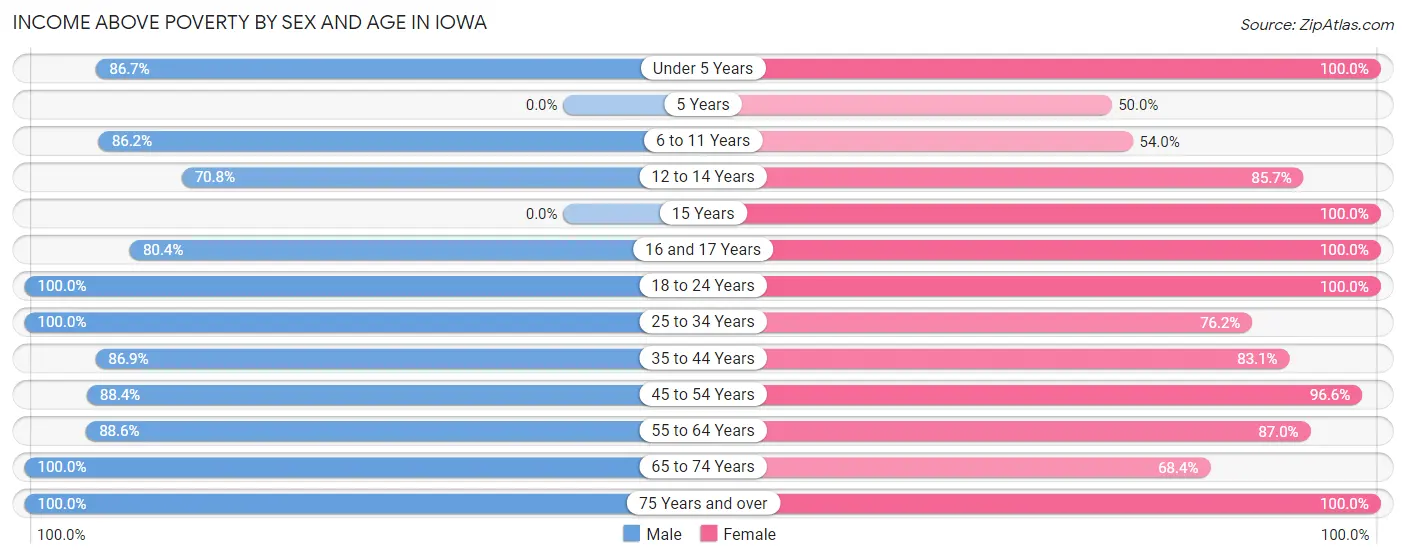
| Age Bracket | Male | Female |
| Under 5 Years | 78 (86.7%) | 102 (100.0%) |
| 5 Years | 0 (0.0%) | 18 (50.0%) |
| 6 to 11 Years | 125 (86.2%) | 75 (54.0%) |
| 12 to 14 Years | 68 (70.8%) | 132 (85.7%) |
| 15 Years | 0 (0.0%) | 7 (100.0%) |
| 16 and 17 Years | 37 (80.4%) | 122 (100.0%) |
| 18 to 24 Years | 213 (100.0%) | 67 (100.0%) |
| 25 to 34 Years | 158 (100.0%) | 195 (76.2%) |
| 35 to 44 Years | 119 (86.9%) | 162 (83.1%) |
| 45 to 54 Years | 107 (88.4%) | 197 (96.6%) |
| 55 to 64 Years | 178 (88.6%) | 147 (87.0%) |
| 65 to 74 Years | 65 (100.0%) | 93 (68.4%) |
| 75 Years and over | 218 (100.0%) | 220 (100.0%) |
| Total | 1,366 (91.7%) | 1,537 (85.1%) |
Income Below Poverty Among Married-Couple Families in Iowa
The poverty statistics for married-couple families in Iowa show that 1.9% or 13 of the total 673 families live below the poverty line. Families with no children have the highest poverty rate of 2.8%, comprising of 13 families. On the other hand, families with 1 or 2 children have the lowest poverty rate of 0.0%, which includes 0 families.
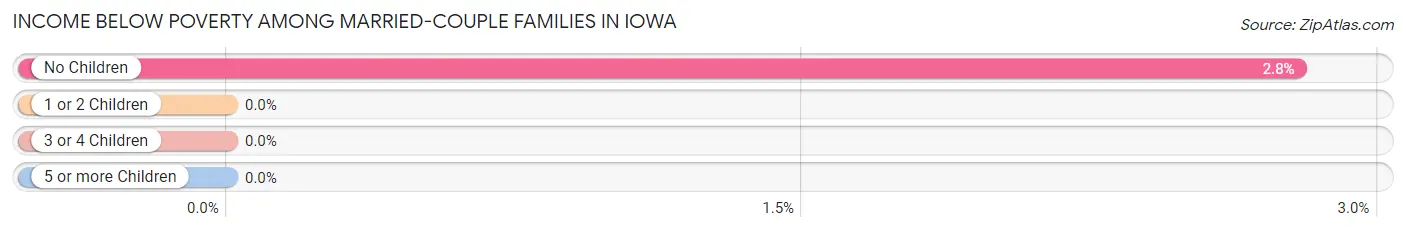
| Children | Above Poverty | Below Poverty |
| No Children | 453 (97.2%) | 13 (2.8%) |
| 1 or 2 Children | 141 (100.0%) | 0 (0.0%) |
| 3 or 4 Children | 66 (100.0%) | 0 (0.0%) |
| 5 or more Children | 0 (0.0%) | 0 (0.0%) |
| Total | 660 (98.1%) | 13 (1.9%) |
Income Below Poverty Among Single-Parent Households in Iowa
According to the poverty data in Iowa, 39.4% or 13 single-father households and 29.3% or 63 single-mother households are living below the poverty line. Among single-father households, those with 1 or 2 children have the highest poverty rate, with 3 households (100.0%) experiencing poverty. Likewise, among single-mother households, those with 3 or 4 children have the highest poverty rate, with 36 households (37.9%) falling below the poverty line.
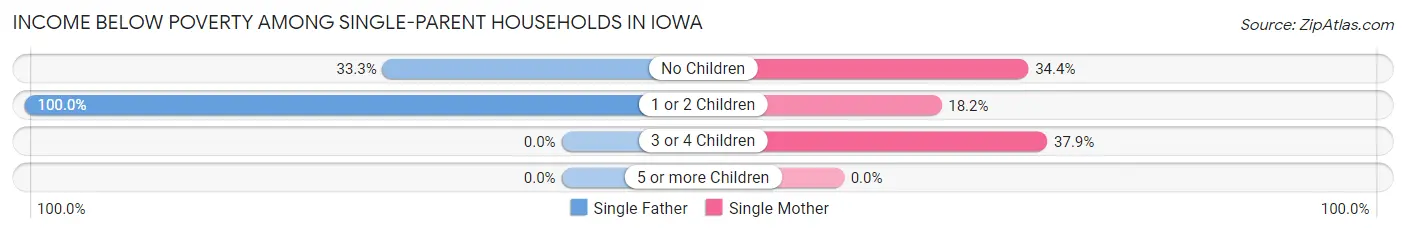
| Children | Single Father | Single Mother |
| No Children | 10 (33.3%) | 11 (34.4%) |
| 1 or 2 Children | 3 (100.0%) | 16 (18.2%) |
| 3 or 4 Children | 0 (0.0%) | 36 (37.9%) |
| 5 or more Children | 0 (0.0%) | 0 (0.0%) |
| Total | 13 (39.4%) | 63 (29.3%) |
Income Below Poverty Among Married-Couple vs Single-Parent Households in Iowa
The poverty data for Iowa shows that 13 of the married-couple family households (1.9%) and 76 of the single-parent households (30.6%) are living below the poverty level. Within the married-couple family households, those with no children have the highest poverty rate, with 13 households (2.8%) falling below the poverty line. Among the single-parent households, those with 3 or 4 children have the highest poverty rate, with 36 household (37.9%) living below poverty.
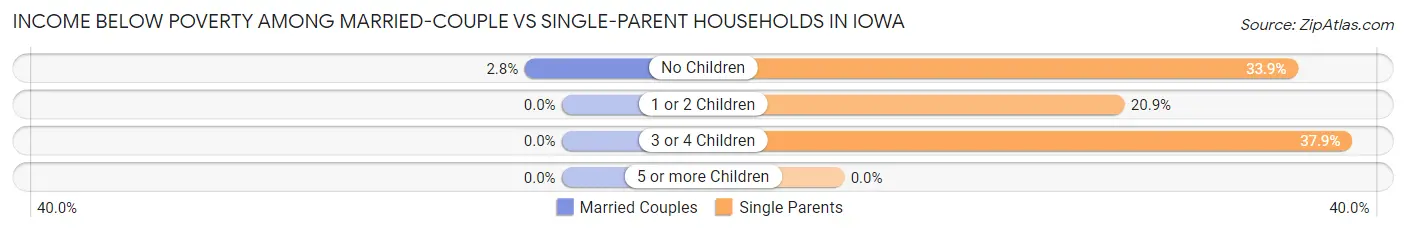
| Children | Married-Couple Families | Single-Parent Households |
| No Children | 13 (2.8%) | 21 (33.9%) |
| 1 or 2 Children | 0 (0.0%) | 19 (20.9%) |
| 3 or 4 Children | 0 (0.0%) | 36 (37.9%) |
| 5 or more Children | 0 (0.0%) | 0 (0.0%) |
| Total | 13 (1.9%) | 76 (30.6%) |
Race in Iowa
The most populous races in Iowa are White / Caucasian (2,205 | 66.9%), Black / African American (964 | 29.2%), and Two or more Races (98 | 3.0%).
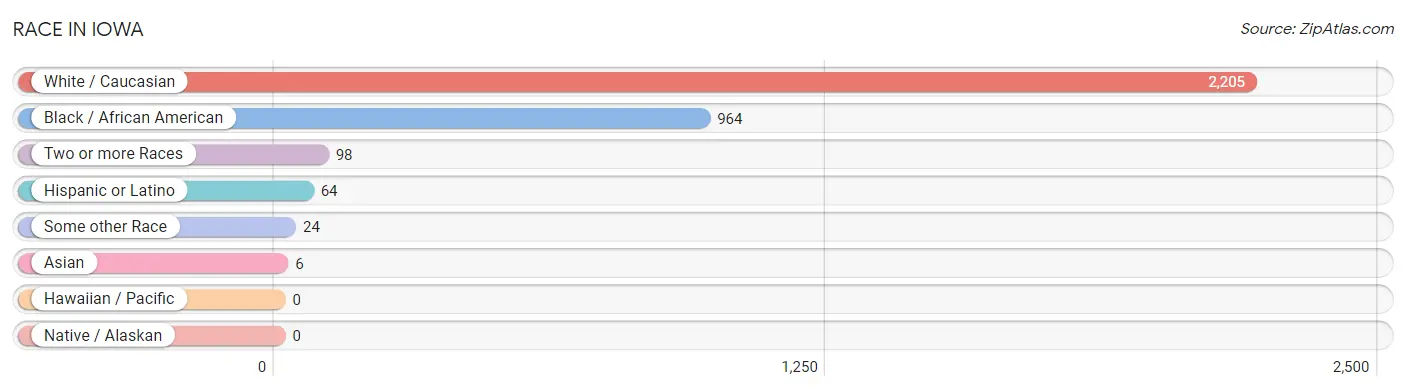
| Race | # Population | % Population |
| Asian | 6 | 0.2% |
| Black / African American | 964 | 29.2% |
| Hawaiian / Pacific | 0 | 0.0% |
| Hispanic or Latino | 64 | 1.9% |
| Native / Alaskan | 0 | 0.0% |
| White / Caucasian | 2,205 | 66.9% |
| Two or more Races | 98 | 3.0% |
| Some other Race | 24 | 0.7% |
| Total | 3,297 | 100.0% |
Ancestry in Iowa
The most populous ancestries reported in Iowa are French (798 | 24.2%), Irish (263 | 8.0%), German (231 | 7.0%), American (224 | 6.8%), and French Canadian (216 | 6.6%), together accounting for 52.5% of all Iowa residents.
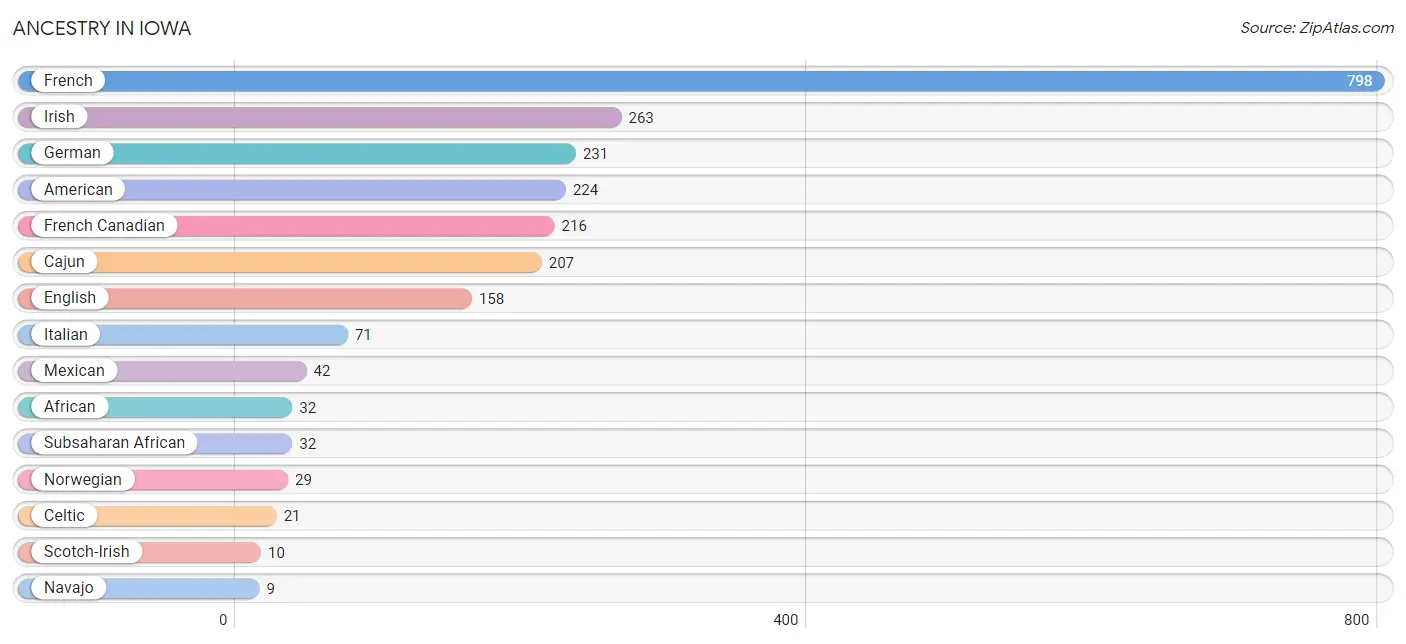
| Ancestry | # Population | % Population |
| African | 32 | 1.0% |
| American | 224 | 6.8% |
| Cajun | 207 | 6.3% |
| Celtic | 21 | 0.6% |
| Central American | 1 | 0.0% |
| English | 158 | 4.8% |
| European | 7 | 0.2% |
| French | 798 | 24.2% |
| French Canadian | 216 | 6.6% |
| German | 231 | 7.0% |
| Guatemalan | 1 | 0.0% |
| Irish | 263 | 8.0% |
| Italian | 71 | 2.1% |
| Korean | 6 | 0.2% |
| Mexican | 42 | 1.3% |
| Navajo | 9 | 0.3% |
| Norwegian | 29 | 0.9% |
| Scotch-Irish | 10 | 0.3% |
| Subsaharan African | 32 | 1.0% | View All 19 Rows |
Immigrants in Iowa
The most numerous immigrant groups reported in Iowa came from Asia (3 | 0.1%), Latin America (3 | 0.1%), Philippines (3 | 0.1%), South Eastern Asia (3 | 0.1%), and Caribbean (2 | 0.1%), together accounting for 0.4% of all Iowa residents.
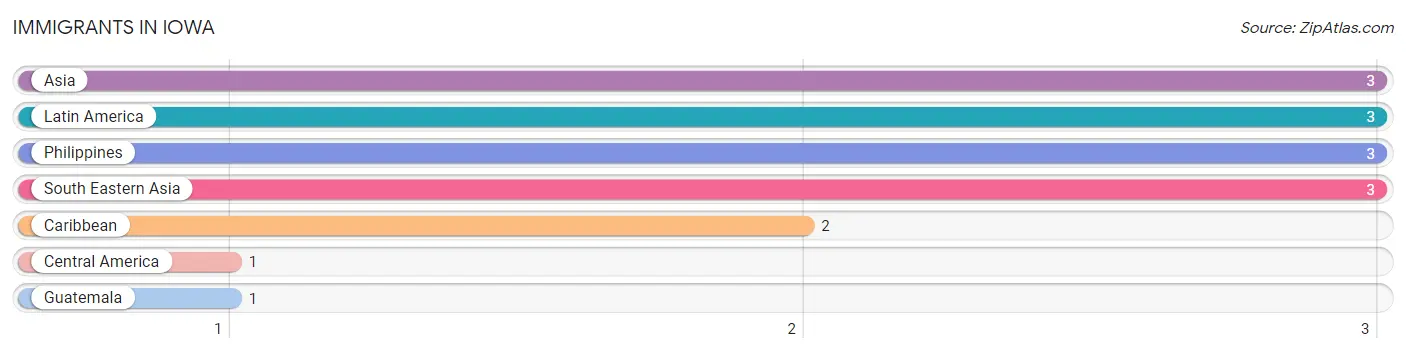
| Immigration Origin | # Population | % Population |
| Asia | 3 | 0.1% |
| Caribbean | 2 | 0.1% |
| Central America | 1 | 0.0% |
| Guatemala | 1 | 0.0% |
| Latin America | 3 | 0.1% |
| Philippines | 3 | 0.1% |
| South Eastern Asia | 3 | 0.1% | View All 7 Rows |
Sex and Age in Iowa
Sex and Age in Iowa
The most populous age groups in Iowa are 10 to 14 Years (196 | 13.2%) for men and 10 to 14 Years (206 | 11.4%) for women.
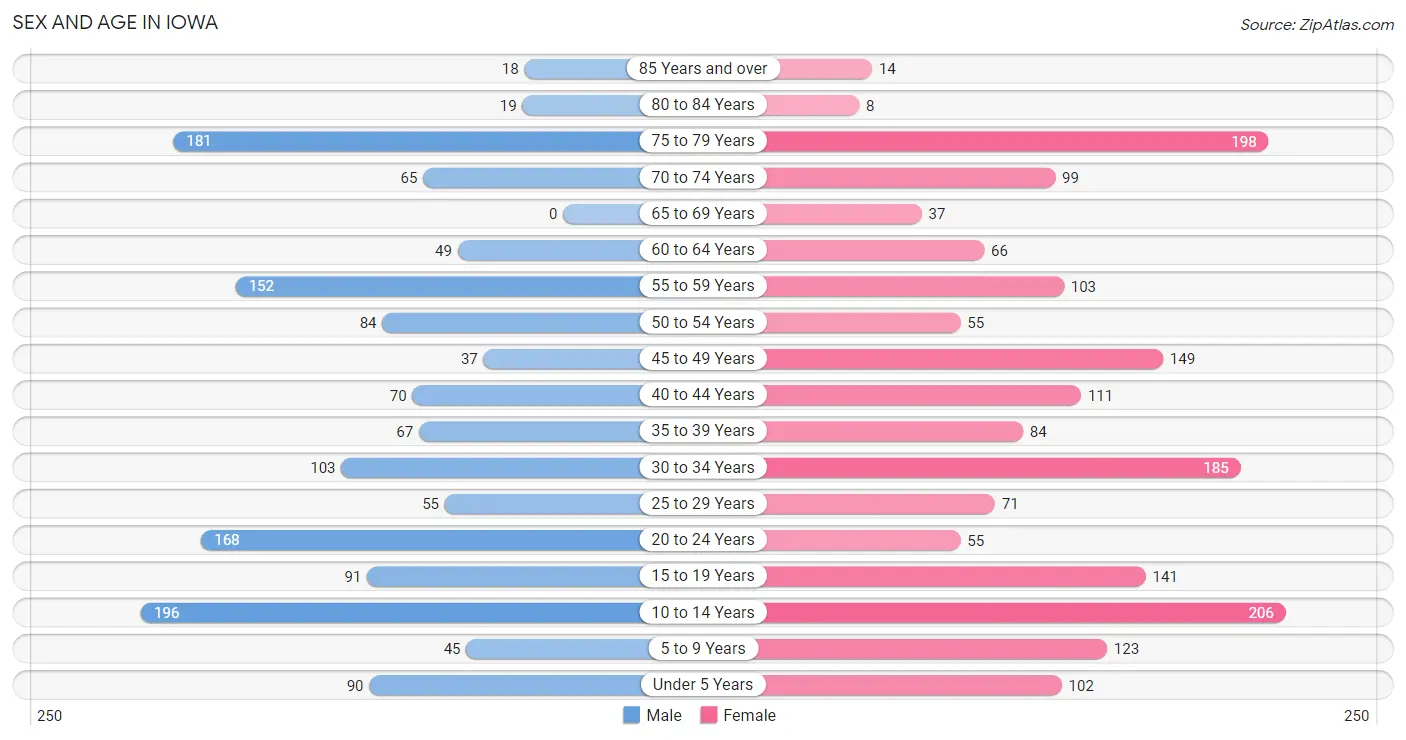
| Age Bracket | Male | Female |
| Under 5 Years | 90 (6.0%) | 102 (5.6%) |
| 5 to 9 Years | 45 (3.0%) | 123 (6.8%) |
| 10 to 14 Years | 196 (13.2%) | 206 (11.4%) |
| 15 to 19 Years | 91 (6.1%) | 141 (7.8%) |
| 20 to 24 Years | 168 (11.3%) | 55 (3.0%) |
| 25 to 29 Years | 55 (3.7%) | 71 (3.9%) |
| 30 to 34 Years | 103 (6.9%) | 185 (10.2%) |
| 35 to 39 Years | 67 (4.5%) | 84 (4.6%) |
| 40 to 44 Years | 70 (4.7%) | 111 (6.1%) |
| 45 to 49 Years | 37 (2.5%) | 149 (8.3%) |
| 50 to 54 Years | 84 (5.6%) | 55 (3.0%) |
| 55 to 59 Years | 152 (10.2%) | 103 (5.7%) |
| 60 to 64 Years | 49 (3.3%) | 66 (3.6%) |
| 65 to 69 Years | 0 (0.0%) | 37 (2.1%) |
| 70 to 74 Years | 65 (4.4%) | 99 (5.5%) |
| 75 to 79 Years | 181 (12.1%) | 198 (11.0%) |
| 80 to 84 Years | 19 (1.3%) | 8 (0.4%) |
| 85 Years and over | 18 (1.2%) | 14 (0.8%) |
| Total | 1,490 (100.0%) | 1,807 (100.0%) |
Families and Households in Iowa
Median Family Size in Iowa
The median family size in Iowa is 3.31 persons per family, with single female/mother families (215 | 23.3%) accounting for the largest median family size of 4.55 persons per family. On the other hand, single male/father families (33 | 3.6%) represent the smallest median family size with 2.73 persons per family.
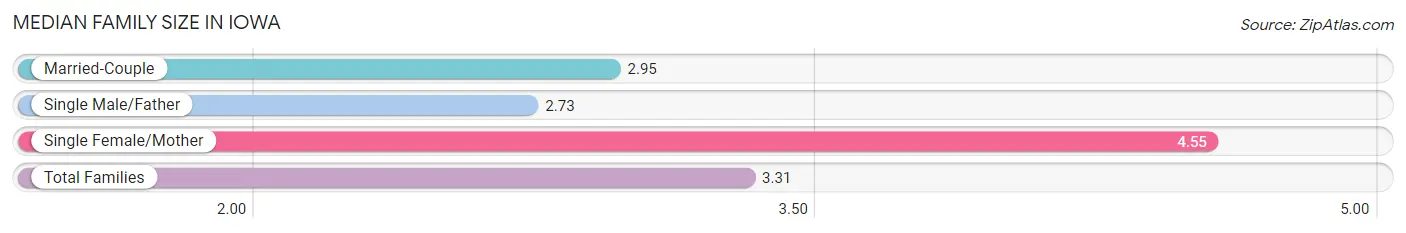
| Family Type | # Families | Family Size |
| Married-Couple | 673 (73.1%) | 2.95 |
| Single Male/Father | 33 (3.6%) | 2.73 |
| Single Female/Mother | 215 (23.3%) | 4.55 |
| Total Families | 921 (100.0%) | 3.31 |
Median Household Size in Iowa
The median household size in Iowa is 3.01 persons per household, with single female/mother households (215 | 19.7%) accounting for the largest median household size of 4.6 persons per household. non-family households (173 | 15.8%) represent the smallest median household size with 1.20 persons per household.
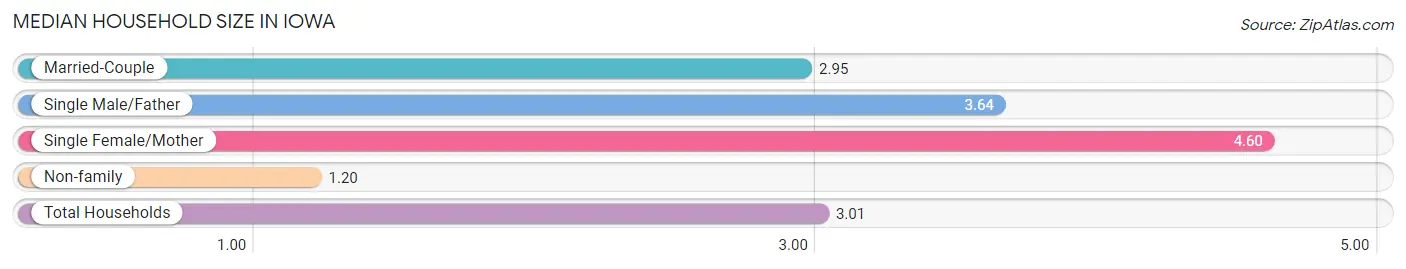
| Household Type | # Households | Household Size |
| Married-Couple | 673 (61.5%) | 2.95 |
| Single Male/Father | 33 (3.0%) | 3.64 |
| Single Female/Mother | 215 (19.7%) | 4.60 |
| Non-family | 173 (15.8%) | 1.20 |
| Total Households | 1,094 (100.0%) | 3.01 |
Household Size by Marriage Status in Iowa
Out of a total of 1,094 households in Iowa, 921 (84.2%) are family households, while 173 (15.8%) are nonfamily households. The most numerous type of family households are 2-person households, comprising 446, and the most common type of nonfamily households are 1-person households, comprising 147.
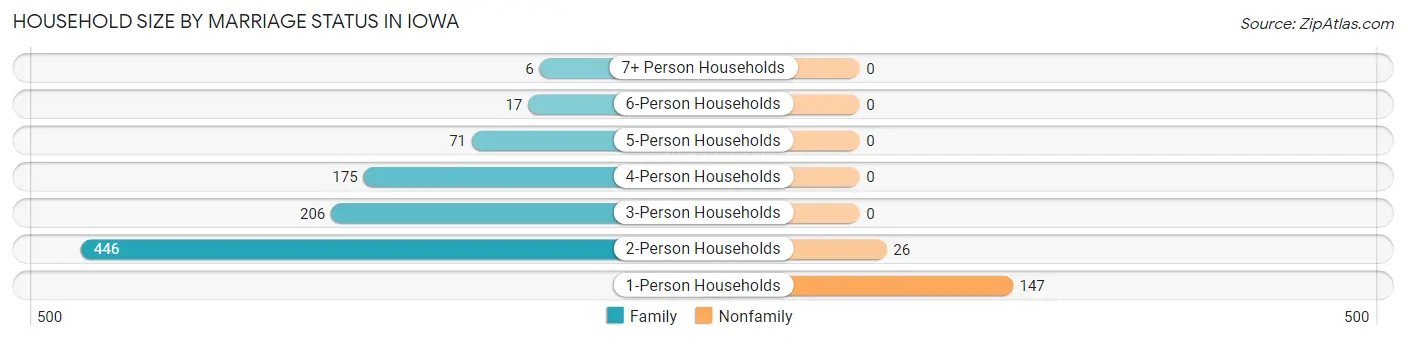
| Household Size | Family Households | Nonfamily Households |
| 1-Person Households | - | 147 (13.4%) |
| 2-Person Households | 446 (40.8%) | 26 (2.4%) |
| 3-Person Households | 206 (18.8%) | 0 (0.0%) |
| 4-Person Households | 175 (16.0%) | 0 (0.0%) |
| 5-Person Households | 71 (6.5%) | 0 (0.0%) |
| 6-Person Households | 17 (1.5%) | 0 (0.0%) |
| 7+ Person Households | 6 (0.5%) | 0 (0.0%) |
| Total | 921 (84.2%) | 173 (15.8%) |
Female Fertility in Iowa
Fertility by Age in Iowa
Average fertility rate in Iowa is 29.0 births per 1,000 women. Women in the age bracket of 20 to 34 years have the highest fertility rate with 77.0 births per 1,000 women. Women in the age bracket of 20 to 34 years acount for 100.0% of all women with births.
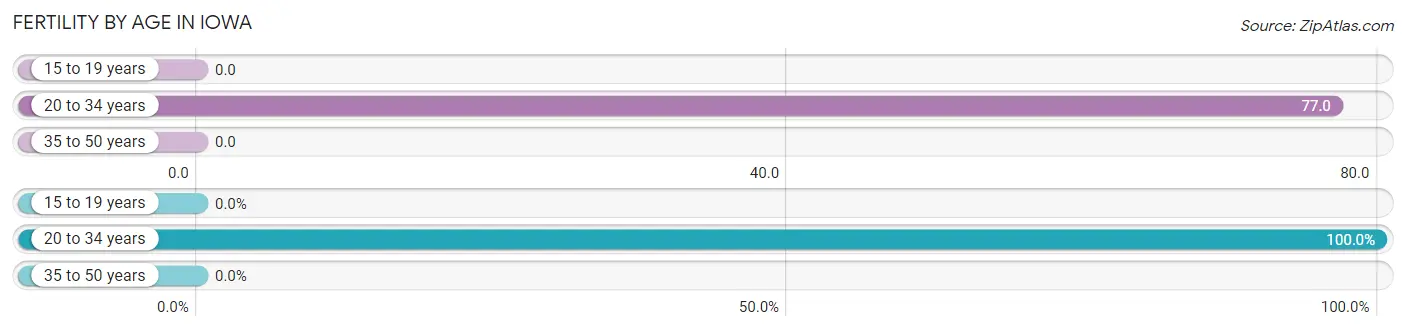
| Age Bracket | Women with Births | Births / 1,000 Women |
| 15 to 19 years | 0 (0.0%) | 0.0 |
| 20 to 34 years | 24 (100.0%) | 77.0 |
| 35 to 50 years | 0 (0.0%) | 0.0 |
| Total | 24 (100.0%) | 29.0 |
Fertility by Age by Marriage Status in Iowa
70.8% of women with births (24) in Iowa are married. The highest percentage of unmarried women with births falls into 20 to 34 years age bracket with 29.2% of them unmarried at the time of birth, while the lowest percentage of unmarried women with births belong to 20 to 34 years age bracket with 29.2% of them unmarried.
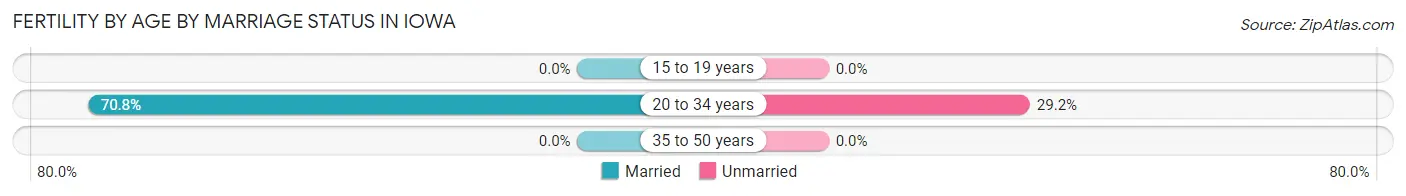
| Age Bracket | Married | Unmarried |
| 15 to 19 years | 0 (0.0%) | 0 (0.0%) |
| 20 to 34 years | 17 (70.8%) | 7 (29.2%) |
| 35 to 50 years | 0 (0.0%) | 0 (0.0%) |
| Total | 17 (70.8%) | 7 (29.2%) |
Fertility by Education in Iowa
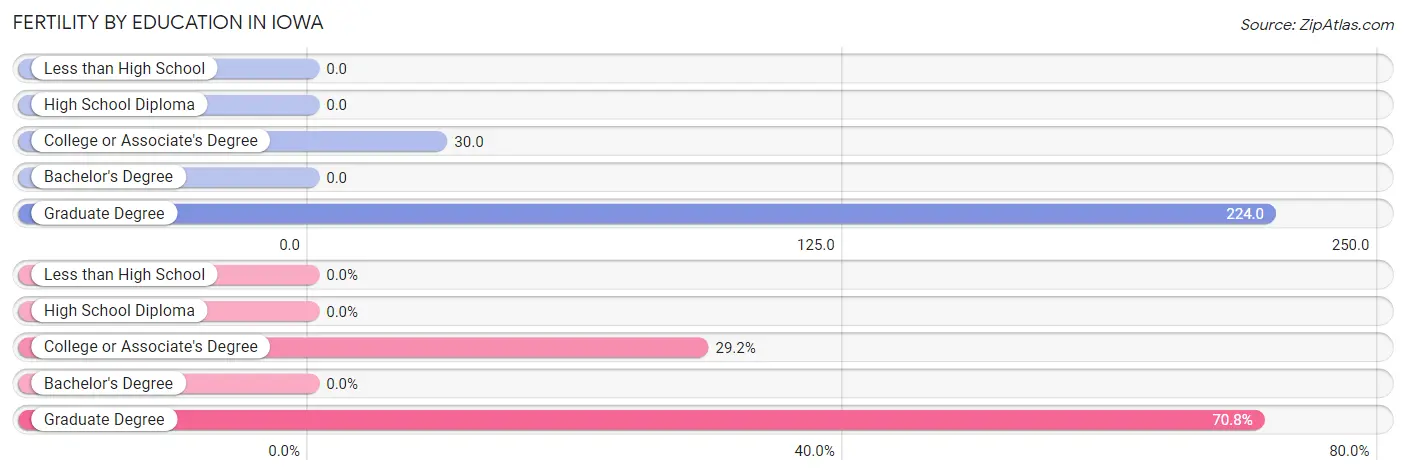
| Educational Attainment | Women with Births | Births / 1,000 Women |
| Less than High School | 0 (0.0%) | 0.0 |
| High School Diploma | 0 (0.0%) | 0.0 |
| College or Associate's Degree | 7 (29.2%) | 30.0 |
| Bachelor's Degree | 0 (0.0%) | 0.0 |
| Graduate Degree | 17 (70.8%) | 224.0 |
| Total | 24 (100.0%) | 29.0 |
Fertility by Education by Marriage Status in Iowa
29.2% of women with births in Iowa are unmarried. Women with the educational attainment of graduate degree are most likely to be married with 100.0% of them married at childbirth, while women with the educational attainment of college or associate's degree are least likely to be married with 100.0% of them unmarried at childbirth.

| Educational Attainment | Married | Unmarried |
| Less than High School | 0 (0.0%) | 0 (0.0%) |
| High School Diploma | 0 (0.0%) | 0 (0.0%) |
| College or Associate's Degree | 0 (0.0%) | 7 (100.0%) |
| Bachelor's Degree | 0 (0.0%) | 0 (0.0%) |
| Graduate Degree | 17 (100.0%) | 0 (0.0%) |
| Total | 17 (70.8%) | 7 (29.2%) |
Employment Characteristics in Iowa
Employment by Class of Employer in Iowa
Among the 1,308 employed individuals in Iowa, private company employees (1,036 | 79.2%), state government employees (103 | 7.9%), and local government employees (96 | 7.3%) make up the most common classes of employment.
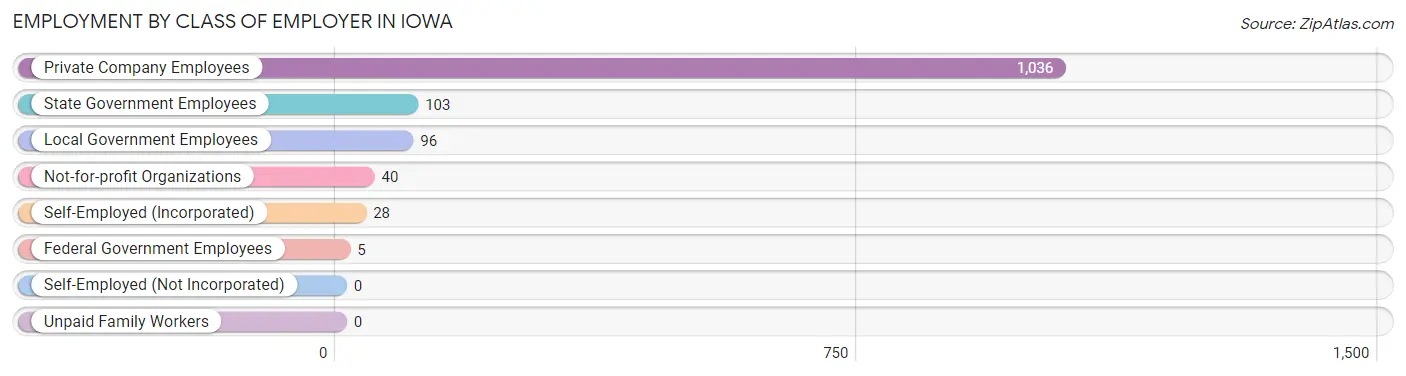
| Employer Class | # Employees | % Employees |
| Private Company Employees | 1,036 | 79.2% |
| Self-Employed (Incorporated) | 28 | 2.1% |
| Self-Employed (Not Incorporated) | 0 | 0.0% |
| Not-for-profit Organizations | 40 | 3.1% |
| Local Government Employees | 96 | 7.3% |
| State Government Employees | 103 | 7.9% |
| Federal Government Employees | 5 | 0.4% |
| Unpaid Family Workers | 0 | 0.0% |
| Total | 1,308 | 100.0% |
Employment Status by Age in Iowa
According to the labor force statistics for Iowa, out of the total population over 16 years of age (2,528), 55.8% or 1,411 individuals are in the labor force, with 5.2% or 73 of them unemployed. The age group with the highest labor force participation rate is 25 to 29 years, with 92.1% or 116 individuals in the labor force. Within the labor force, the 60 to 64 years age range has the highest percentage of unemployed individuals, with 100.0% or 36 of them being unemployed.
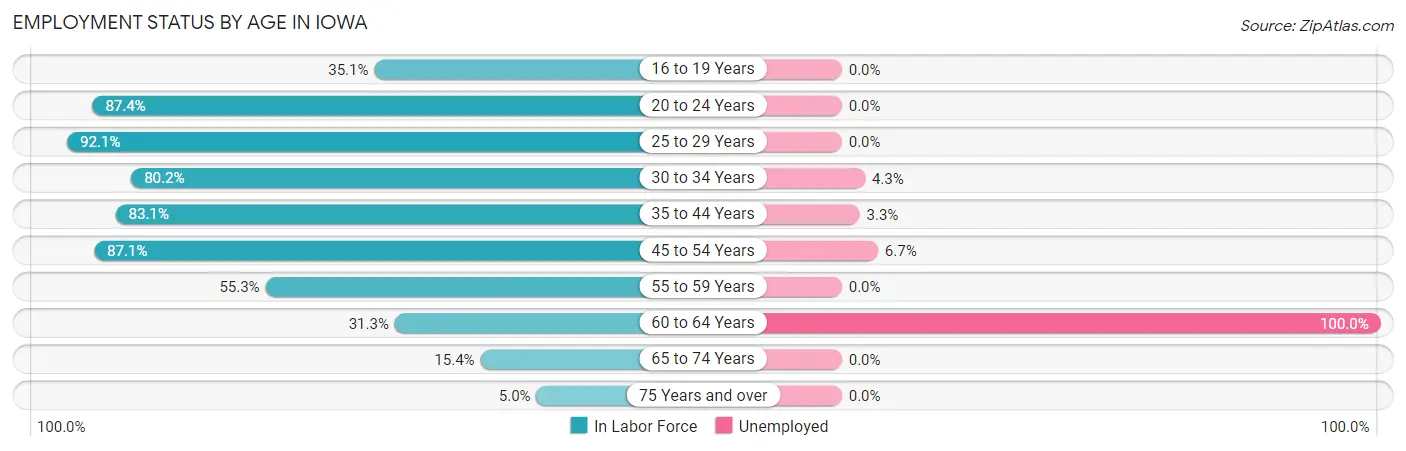
| Age Bracket | In Labor Force | Unemployed |
| 16 to 19 Years | 79 (35.1%) | 0 (0.0%) |
| 20 to 24 Years | 195 (87.4%) | 0 (0.0%) |
| 25 to 29 Years | 116 (92.1%) | 0 (0.0%) |
| 30 to 34 Years | 231 (80.2%) | 10 (4.3%) |
| 35 to 44 Years | 276 (83.1%) | 9 (3.3%) |
| 45 to 54 Years | 283 (87.1%) | 19 (6.7%) |
| 55 to 59 Years | 141 (55.3%) | 0 (0.0%) |
| 60 to 64 Years | 36 (31.3%) | 36 (100.0%) |
| 65 to 74 Years | 31 (15.4%) | 0 (0.0%) |
| 75 Years and over | 22 (5.0%) | 0 (0.0%) |
| Total | 1,411 (55.8%) | 73 (5.2%) |
Employment Status by Educational Attainment in Iowa
According to labor force statistics for Iowa, 75.2% of individuals (1,084) out of the total population between 25 and 64 years of age (1,441) are in the labor force, with 6.8% or 74 of them being unemployed. The group with the highest labor force participation rate are those with the educational attainment of bachelor's degree or higher, with 92.1% or 315 individuals in the labor force. Within the labor force, individuals with high school diploma education have the highest percentage of unemployment, with 15.0% or 45 of them being unemployed.
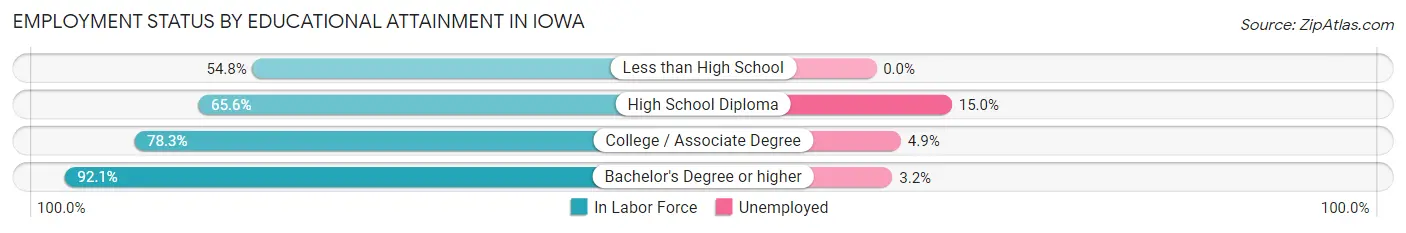
| Educational Attainment | In Labor Force | Unemployed |
| Less than High School | 80 (54.8%) | 0 (0.0%) |
| High School Diploma | 301 (65.6%) | 69 (15.0%) |
| College / Associate Degree | 387 (78.3%) | 24 (4.9%) |
| Bachelor's Degree or higher | 315 (92.1%) | 11 (3.2%) |
| Total | 1,084 (75.2%) | 98 (6.8%) |
Employment Occupations by Sex in Iowa
Management, Business, Science and Arts Occupations
The most common Management, Business, Science and Arts occupations in Iowa are Community & Social Service (172 | 12.9%), Health Diagnosing & Treating (153 | 11.5%), Education Instruction & Library (97 | 7.3%), Computers, Engineering & Science (96 | 7.2%), and Health Technologists (77 | 5.8%).
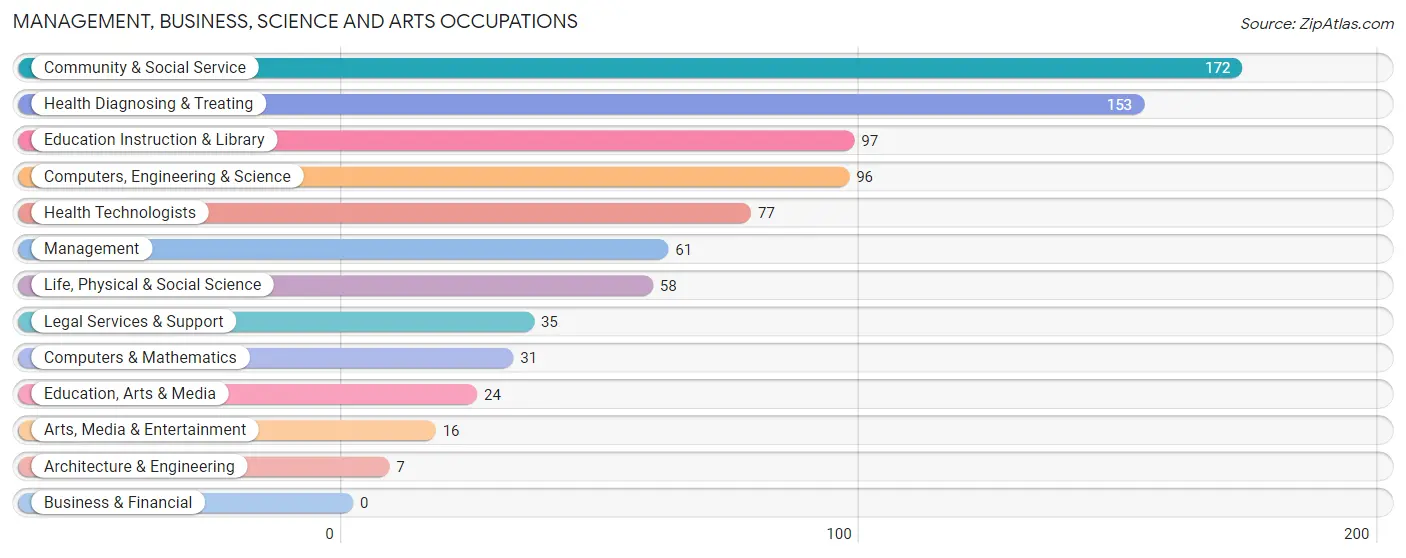
Management, Business, Science and Arts Occupations by Sex
Within the Management, Business, Science and Arts occupations in Iowa, the most male-oriented occupations are Computers & Mathematics (100.0%), Architecture & Engineering (100.0%), and Arts, Media & Entertainment (100.0%), while the most female-oriented occupations are Legal Services & Support (100.0%), Health Technologists (100.0%), and Health Diagnosing & Treating (89.5%).
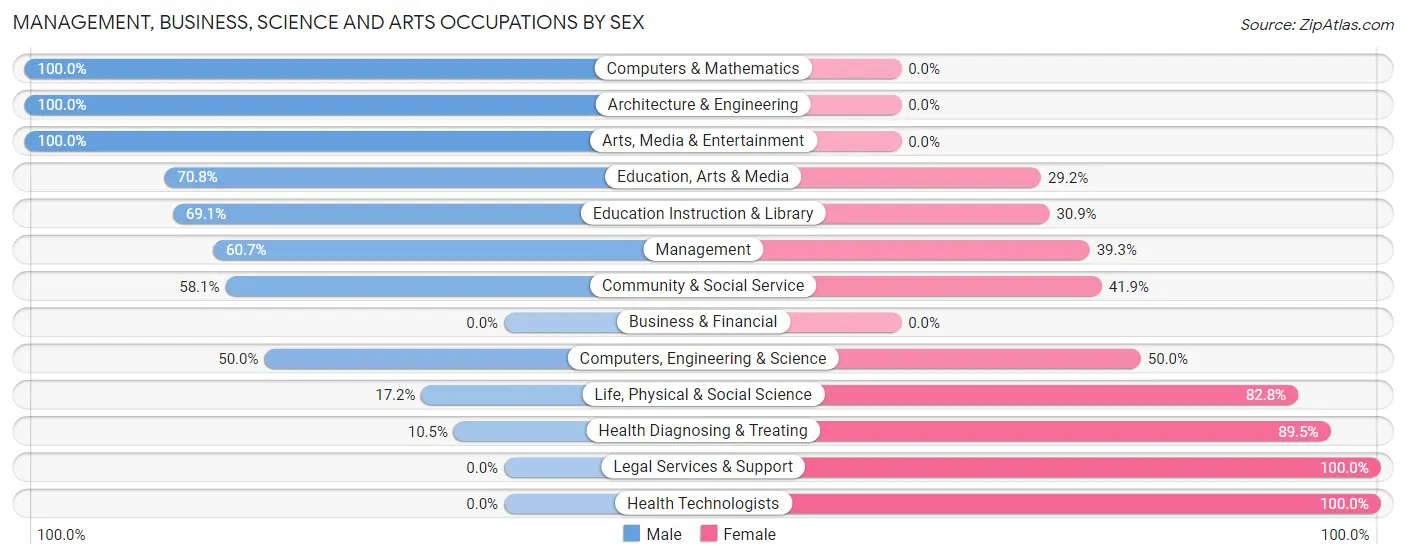
| Occupation | Male | Female |
| Management | 37 (60.7%) | 24 (39.3%) |
| Business & Financial | 0 (0.0%) | 0 (0.0%) |
| Computers, Engineering & Science | 48 (50.0%) | 48 (50.0%) |
| Computers & Mathematics | 31 (100.0%) | 0 (0.0%) |
| Architecture & Engineering | 7 (100.0%) | 0 (0.0%) |
| Life, Physical & Social Science | 10 (17.2%) | 48 (82.8%) |
| Community & Social Service | 100 (58.1%) | 72 (41.9%) |
| Education, Arts & Media | 17 (70.8%) | 7 (29.2%) |
| Legal Services & Support | 0 (0.0%) | 35 (100.0%) |
| Education Instruction & Library | 67 (69.1%) | 30 (30.9%) |
| Arts, Media & Entertainment | 16 (100.0%) | 0 (0.0%) |
| Health Diagnosing & Treating | 16 (10.5%) | 137 (89.5%) |
| Health Technologists | 0 (0.0%) | 77 (100.0%) |
| Total (Category) | 201 (41.7%) | 281 (58.3%) |
| Total (Overall) | 649 (48.6%) | 687 (51.4%) |
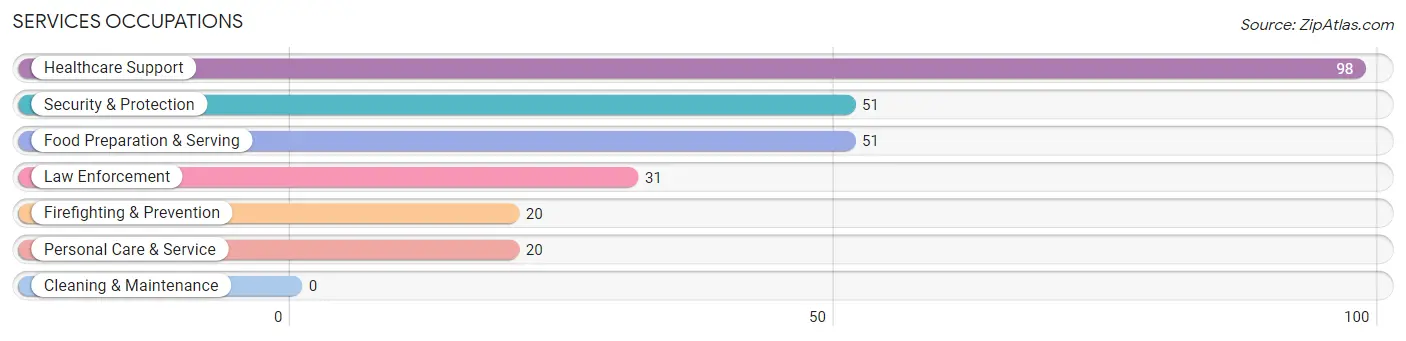
Services Occupations
The most common Services occupations in Iowa are Healthcare Support (98 | 7.3%), Security & Protection (51 | 3.8%), Food Preparation & Serving (51 | 3.8%), Law Enforcement (31 | 2.3%), and Firefighting & Prevention (20 | 1.5%).
Services Occupations by Sex
Within the Services occupations in Iowa, the most male-oriented occupations are Law Enforcement (61.3%), Security & Protection (58.8%), and Firefighting & Prevention (55.0%), while the most female-oriented occupations are Personal Care & Service (100.0%), Healthcare Support (87.8%), and Food Preparation & Serving (62.7%).
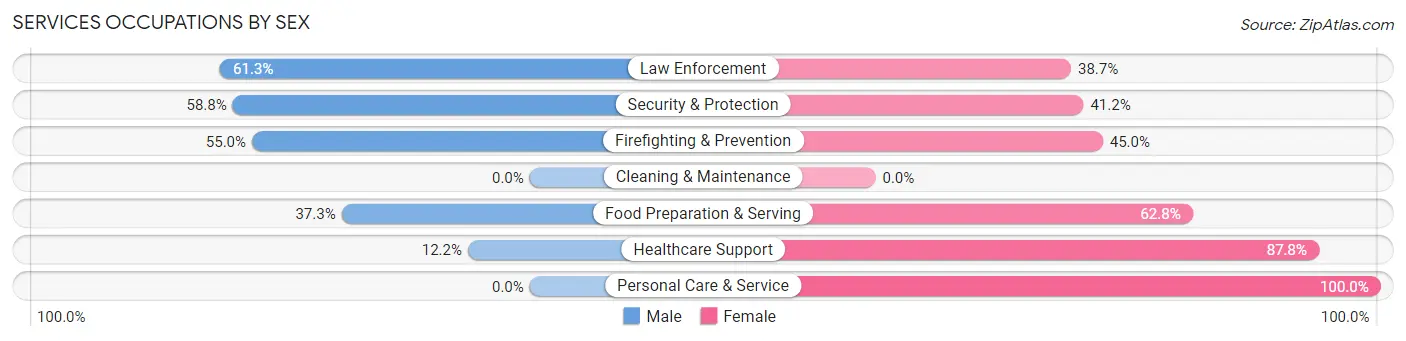
| Occupation | Male | Female |
| Healthcare Support | 12 (12.2%) | 86 (87.8%) |
| Security & Protection | 30 (58.8%) | 21 (41.2%) |
| Firefighting & Prevention | 11 (55.0%) | 9 (45.0%) |
| Law Enforcement | 19 (61.3%) | 12 (38.7%) |
| Food Preparation & Serving | 19 (37.2%) | 32 (62.7%) |
| Cleaning & Maintenance | 0 (0.0%) | 0 (0.0%) |
| Personal Care & Service | 0 (0.0%) | 20 (100.0%) |
| Total (Category) | 61 (27.7%) | 159 (72.3%) |
| Total (Overall) | 649 (48.6%) | 687 (51.4%) |
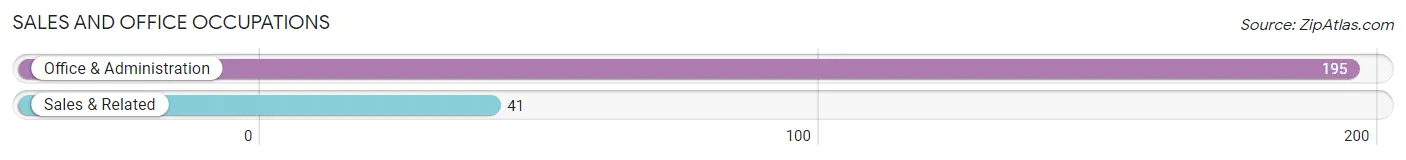
Sales and Office Occupations
The most common Sales and Office occupations in Iowa are Office & Administration (195 | 14.6%), and Sales & Related (41 | 3.1%).
Sales and Office Occupations by Sex
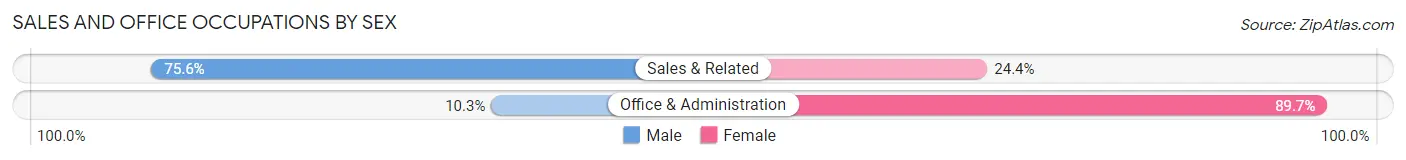
| Occupation | Male | Female |
| Sales & Related | 31 (75.6%) | 10 (24.4%) |
| Office & Administration | 20 (10.3%) | 175 (89.7%) |
| Total (Category) | 51 (21.6%) | 185 (78.4%) |
| Total (Overall) | 649 (48.6%) | 687 (51.4%) |
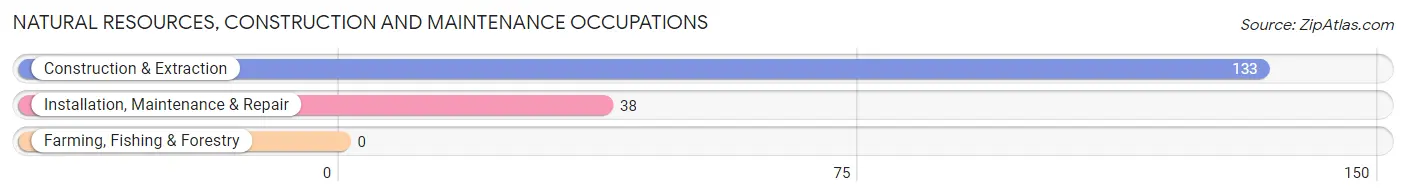
Natural Resources, Construction and Maintenance Occupations
The most common Natural Resources, Construction and Maintenance occupations in Iowa are Construction & Extraction (133 | 10.0%), and Installation, Maintenance & Repair (38 | 2.8%).
Natural Resources, Construction and Maintenance Occupations by Sex
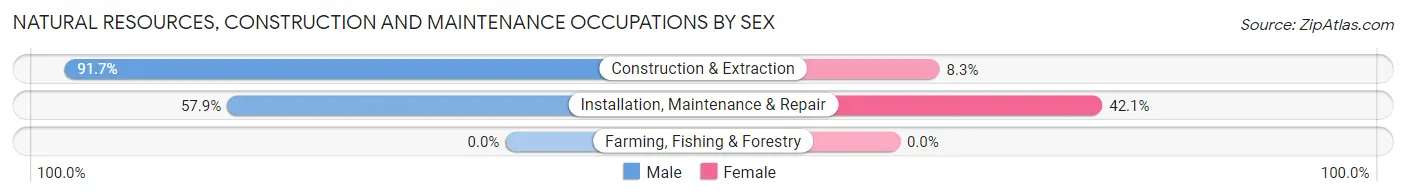
| Occupation | Male | Female |
| Farming, Fishing & Forestry | 0 (0.0%) | 0 (0.0%) |
| Construction & Extraction | 122 (91.7%) | 11 (8.3%) |
| Installation, Maintenance & Repair | 22 (57.9%) | 16 (42.1%) |
| Total (Category) | 144 (84.2%) | 27 (15.8%) |
| Total (Overall) | 649 (48.6%) | 687 (51.4%) |
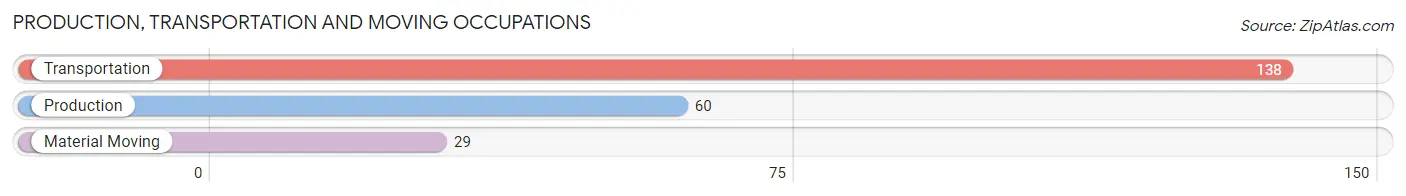
Production, Transportation and Moving Occupations
The most common Production, Transportation and Moving occupations in Iowa are Transportation (138 | 10.3%), Production (60 | 4.5%), and Material Moving (29 | 2.2%).
Production, Transportation and Moving Occupations by Sex
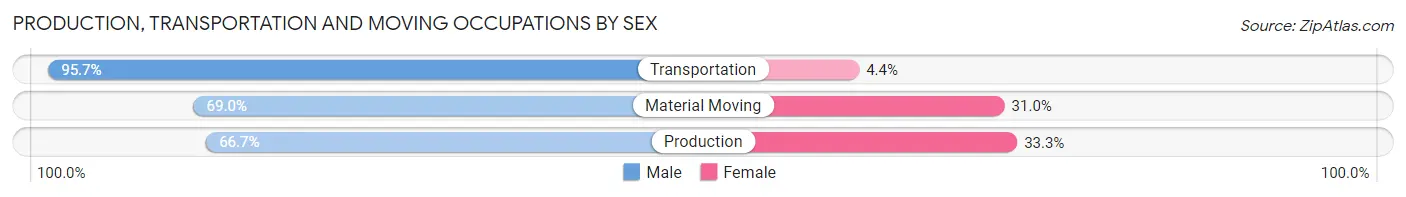
| Occupation | Male | Female |
| Production | 40 (66.7%) | 20 (33.3%) |
| Transportation | 132 (95.7%) | 6 (4.3%) |
| Material Moving | 20 (69.0%) | 9 (31.0%) |
| Total (Category) | 192 (84.6%) | 35 (15.4%) |
| Total (Overall) | 649 (48.6%) | 687 (51.4%) |
Employment Industries by Sex in Iowa
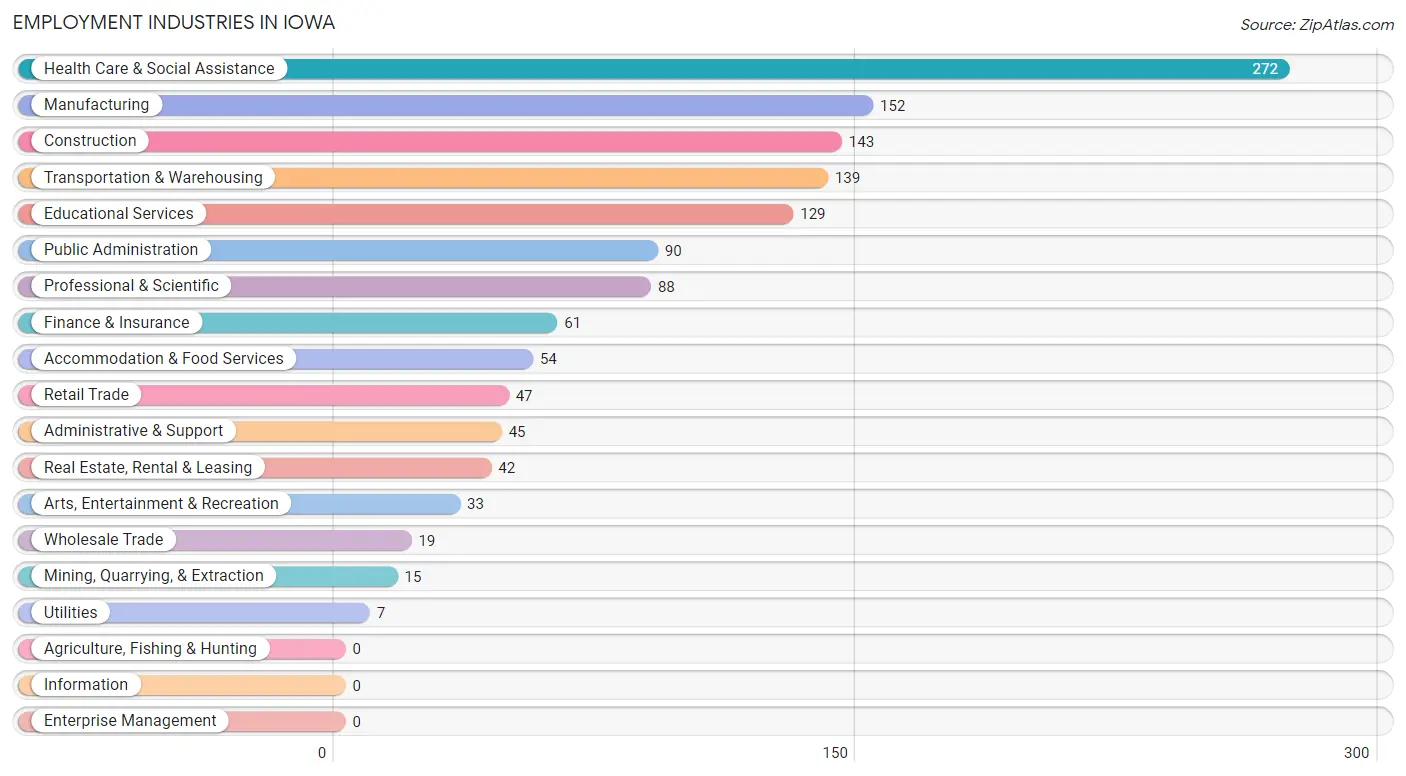
Employment Industries in Iowa
The major employment industries in Iowa include Health Care & Social Assistance (272 | 20.4%), Manufacturing (152 | 11.4%), Construction (143 | 10.7%), Transportation & Warehousing (139 | 10.4%), and Educational Services (129 | 9.7%).
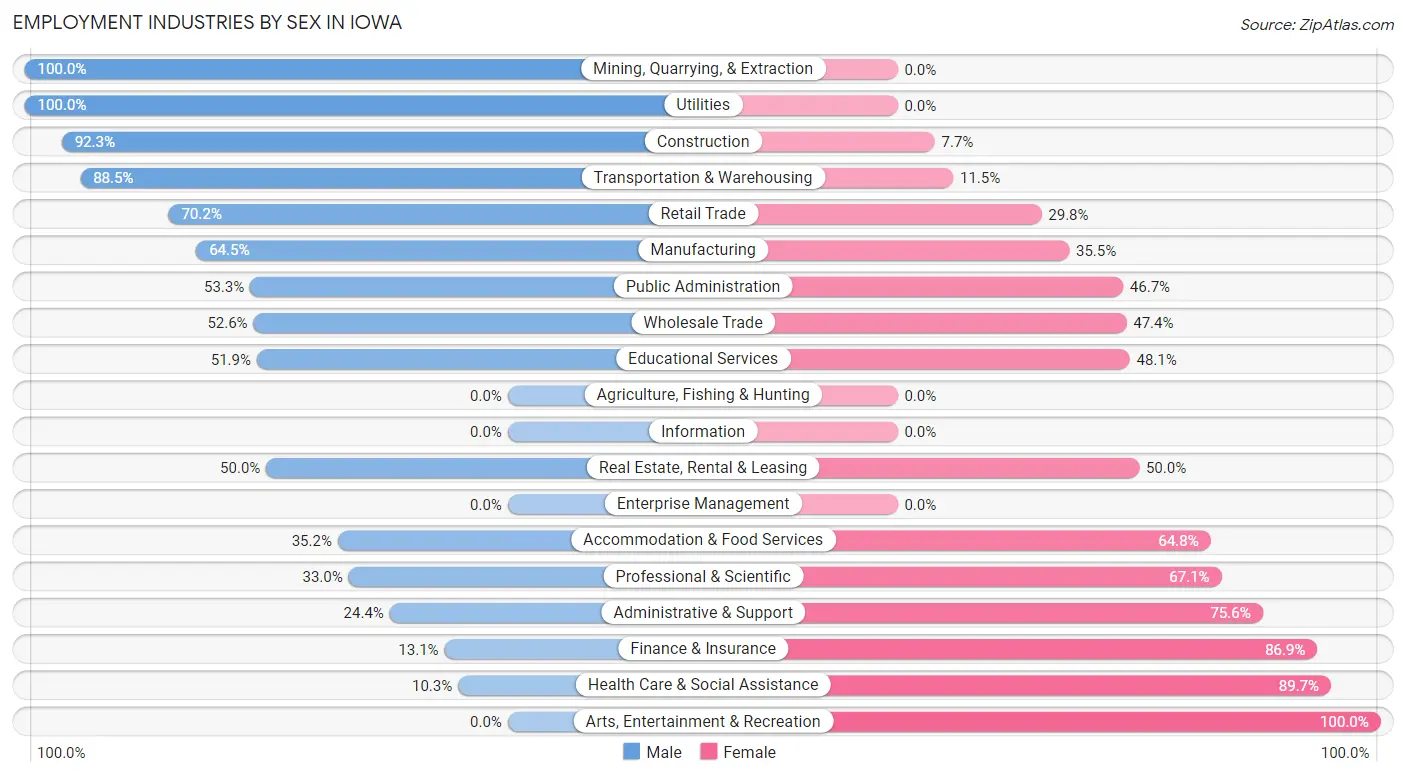
Employment Industries by Sex in Iowa
The Iowa industries that see more men than women are Mining, Quarrying, & Extraction (100.0%), Utilities (100.0%), and Construction (92.3%), whereas the industries that tend to have a higher number of women are Arts, Entertainment & Recreation (100.0%), Health Care & Social Assistance (89.7%), and Finance & Insurance (86.9%).
| Industry | Male | Female |
| Agriculture, Fishing & Hunting | 0 (0.0%) | 0 (0.0%) |
| Mining, Quarrying, & Extraction | 15 (100.0%) | 0 (0.0%) |
| Construction | 132 (92.3%) | 11 (7.7%) |
| Manufacturing | 98 (64.5%) | 54 (35.5%) |
| Wholesale Trade | 10 (52.6%) | 9 (47.4%) |
| Retail Trade | 33 (70.2%) | 14 (29.8%) |
| Transportation & Warehousing | 123 (88.5%) | 16 (11.5%) |
| Utilities | 7 (100.0%) | 0 (0.0%) |
| Information | 0 (0.0%) | 0 (0.0%) |
| Finance & Insurance | 8 (13.1%) | 53 (86.9%) |
| Real Estate, Rental & Leasing | 21 (50.0%) | 21 (50.0%) |
| Professional & Scientific | 29 (33.0%) | 59 (67.0%) |
| Enterprise Management | 0 (0.0%) | 0 (0.0%) |
| Administrative & Support | 11 (24.4%) | 34 (75.6%) |
| Educational Services | 67 (51.9%) | 62 (48.1%) |
| Health Care & Social Assistance | 28 (10.3%) | 244 (89.7%) |
| Arts, Entertainment & Recreation | 0 (0.0%) | 33 (100.0%) |
| Accommodation & Food Services | 19 (35.2%) | 35 (64.8%) |
| Public Administration | 48 (53.3%) | 42 (46.7%) |
| Total | 649 (48.6%) | 687 (51.4%) |
Education in Iowa
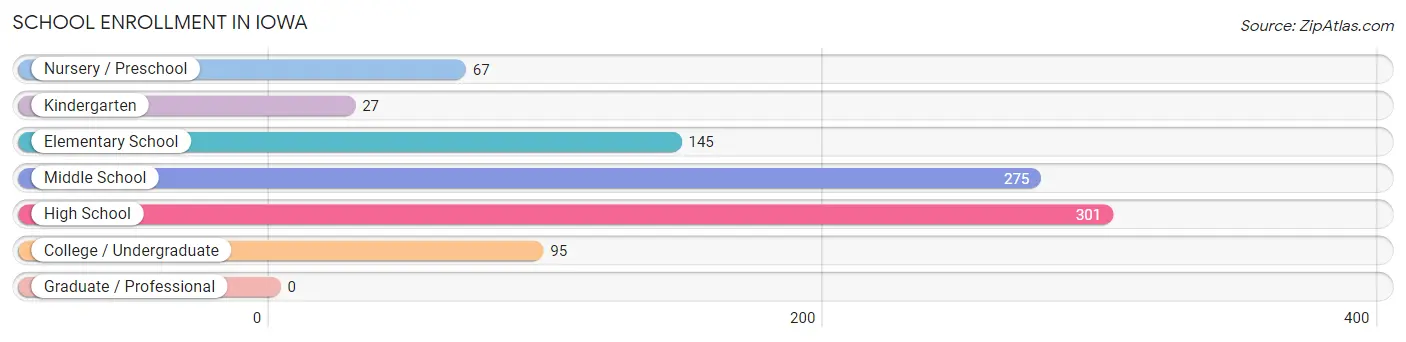
School Enrollment in Iowa
The most common levels of schooling among the 910 students in Iowa are high school (301 | 33.1%), middle school (275 | 30.2%), and elementary school (145 | 15.9%).
| School Level | # Students | % Students |
| Nursery / Preschool | 67 | 7.4% |
| Kindergarten | 27 | 3.0% |
| Elementary School | 145 | 15.9% |
| Middle School | 275 | 30.2% |
| High School | 301 | 33.1% |
| College / Undergraduate | 95 | 10.4% |
| Graduate / Professional | 0 | 0.0% |
| Total | 910 | 100.0% |
School Enrollment by Age by Funding Source in Iowa
Out of a total of 910 students who are enrolled in schools in Iowa, 71 (7.8%) attend a private institution, while the remaining 839 (92.2%) are enrolled in public schools. The age group of 3 to 4 year olds has the highest likelihood of being enrolled in private schools, with 41 (83.7% in the age bracket) enrolled. Conversely, the age group of 15 to 17 year olds has the lowest likelihood of being enrolled in a private school, with 157 (100.0% in the age bracket) attending a public institution.
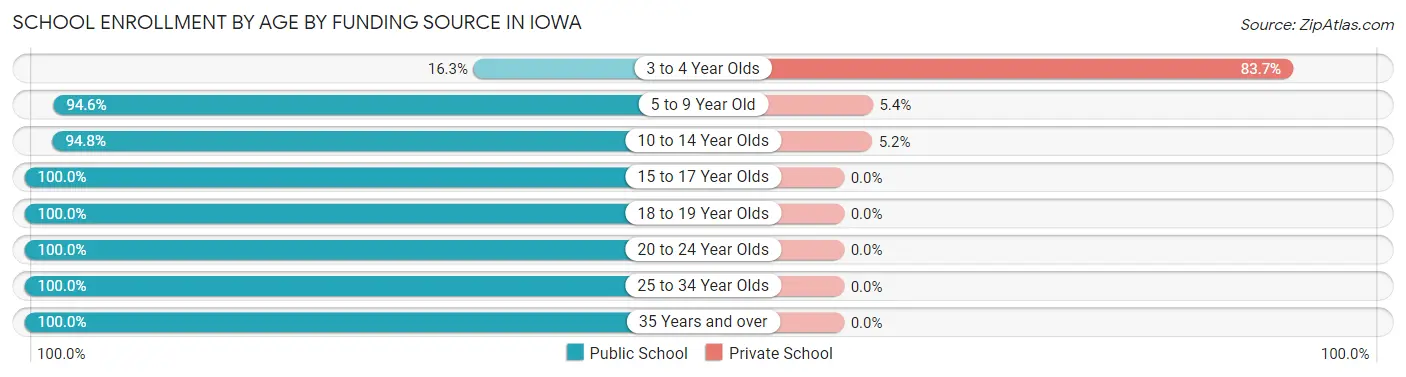
| Age Bracket | Public School | Private School |
| 3 to 4 Year Olds | 8 (16.3%) | 41 (83.7%) |
| 5 to 9 Year Old | 159 (94.6%) | 9 (5.4%) |
| 10 to 14 Year Olds | 381 (94.8%) | 21 (5.2%) |
| 15 to 17 Year Olds | 157 (100.0%) | 0 (0.0%) |
| 18 to 19 Year Olds | 49 (100.0%) | 0 (0.0%) |
| 20 to 24 Year Olds | 58 (100.0%) | 0 (0.0%) |
| 25 to 34 Year Olds | 10 (100.0%) | 0 (0.0%) |
| 35 Years and over | 17 (100.0%) | 0 (0.0%) |
| Total | 839 (92.2%) | 71 (7.8%) |
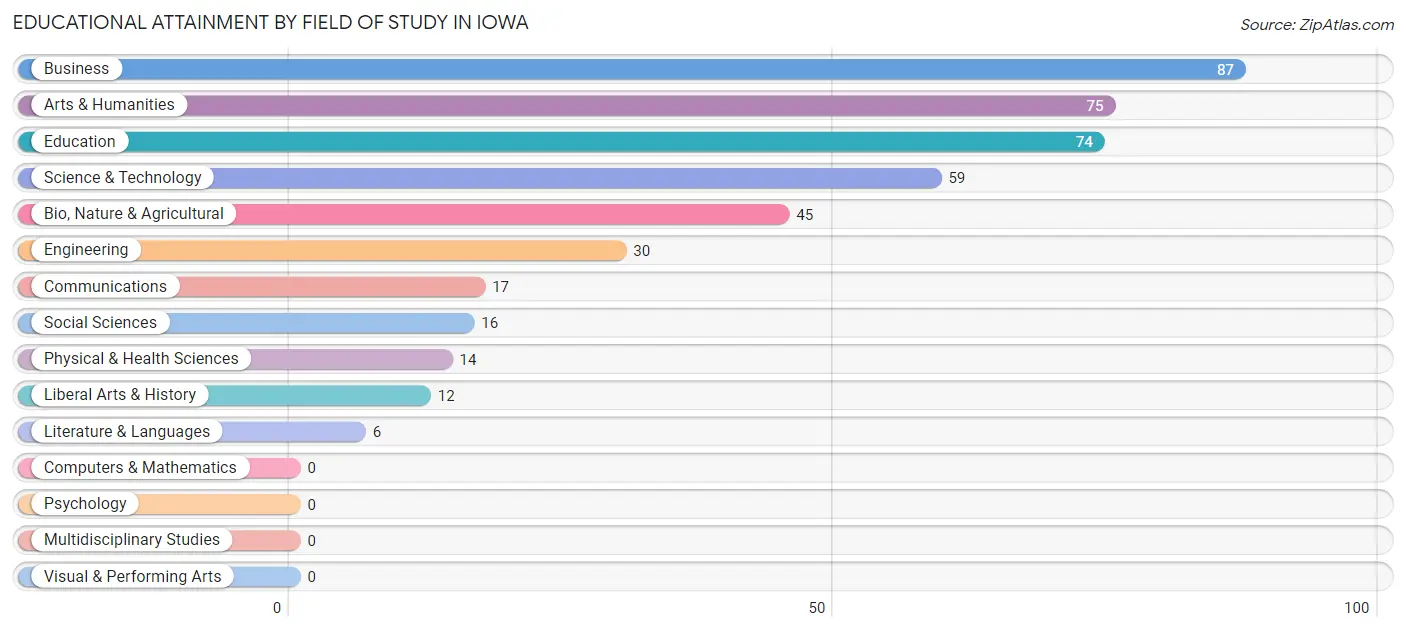
Educational Attainment by Field of Study in Iowa
Business (87 | 20.0%), arts & humanities (75 | 17.2%), education (74 | 17.0%), science & technology (59 | 13.6%), and bio, nature & agricultural (45 | 10.3%) are the most common fields of study among 435 individuals in Iowa who have obtained a bachelor's degree or higher.
| Field of Study | # Graduates | % Graduates |
| Computers & Mathematics | 0 | 0.0% |
| Bio, Nature & Agricultural | 45 | 10.3% |
| Physical & Health Sciences | 14 | 3.2% |
| Psychology | 0 | 0.0% |
| Social Sciences | 16 | 3.7% |
| Engineering | 30 | 6.9% |
| Multidisciplinary Studies | 0 | 0.0% |
| Science & Technology | 59 | 13.6% |
| Business | 87 | 20.0% |
| Education | 74 | 17.0% |
| Literature & Languages | 6 | 1.4% |
| Liberal Arts & History | 12 | 2.8% |
| Visual & Performing Arts | 0 | 0.0% |
| Communications | 17 | 3.9% |
| Arts & Humanities | 75 | 17.2% |
| Total | 435 | 100.0% |
Transportation & Commute in Iowa
Vehicle Availability by Sex in Iowa
The most prevalent vehicle ownership categories in Iowa are males with 2 vehicles (408, accounting for 62.9%) and females with 2 vehicles (277, making up 61.9%).
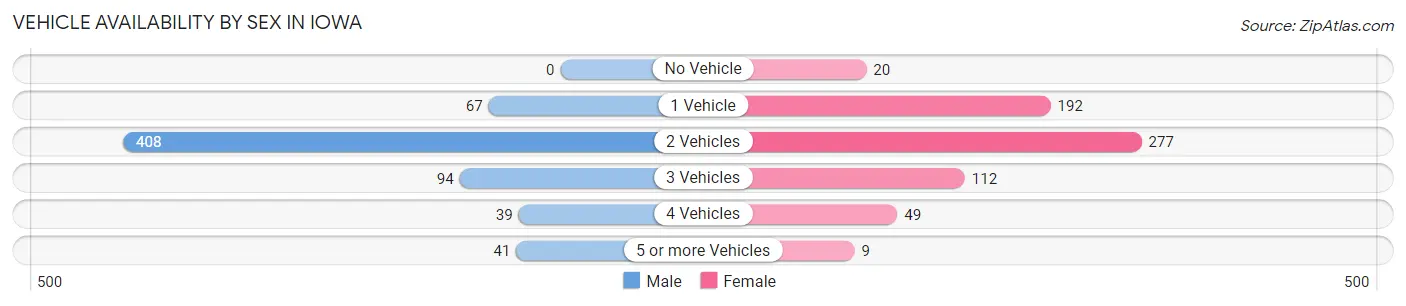
| Vehicles Available | Male | Female |
| No Vehicle | 0 (0.0%) | 20 (3.0%) |
| 1 Vehicle | 67 (10.3%) | 192 (29.1%) |
| 2 Vehicles | 408 (62.9%) | 277 (42.0%) |
| 3 Vehicles | 94 (14.5%) | 112 (17.0%) |
| 4 Vehicles | 39 (6.0%) | 49 (7.4%) |
| 5 or more Vehicles | 41 (6.3%) | 9 (1.4%) |
| Total | 649 (100.0%) | 659 (100.0%) |
Commute Time in Iowa
The most frequently occuring commute durations in Iowa are 30 to 34 minutes (305 commuters, 24.0%), 25 to 29 minutes (287 commuters, 22.6%), and 20 to 24 minutes (203 commuters, 16.0%).
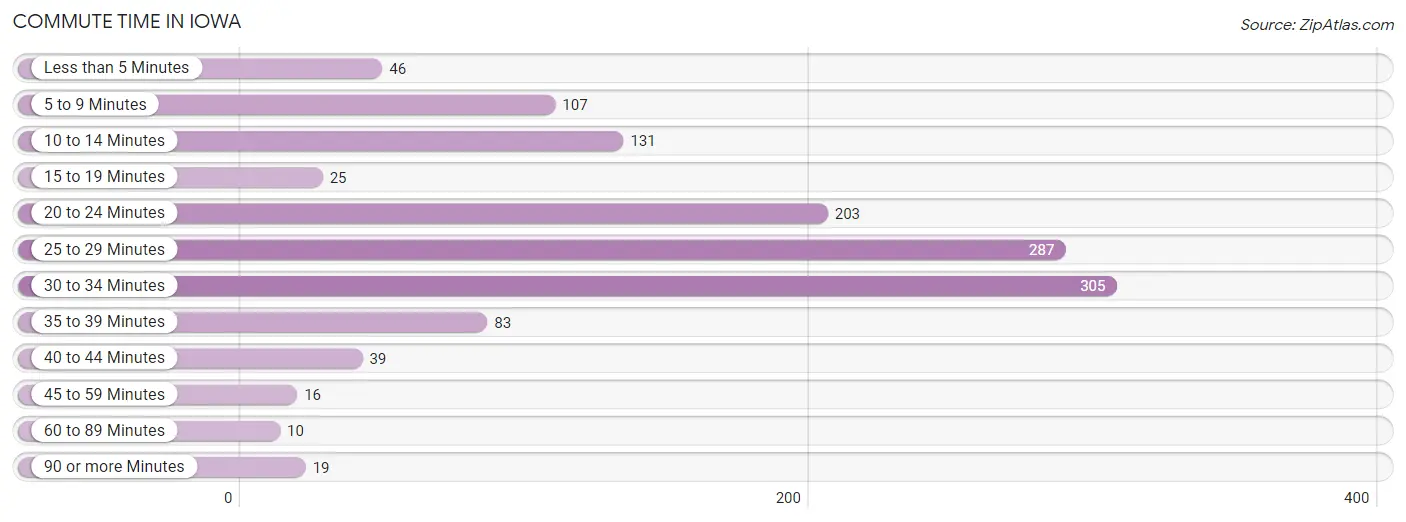
| Commute Time | # Commuters | % Commuters |
| Less than 5 Minutes | 46 | 3.6% |
| 5 to 9 Minutes | 107 | 8.4% |
| 10 to 14 Minutes | 131 | 10.3% |
| 15 to 19 Minutes | 25 | 2.0% |
| 20 to 24 Minutes | 203 | 16.0% |
| 25 to 29 Minutes | 287 | 22.6% |
| 30 to 34 Minutes | 305 | 24.0% |
| 35 to 39 Minutes | 83 | 6.5% |
| 40 to 44 Minutes | 39 | 3.1% |
| 45 to 59 Minutes | 16 | 1.3% |
| 60 to 89 Minutes | 10 | 0.8% |
| 90 or more Minutes | 19 | 1.5% |
Commute Time by Sex in Iowa
The most common commute times in Iowa are 30 to 34 minutes (216 commuters, 33.3%) for males and 20 to 24 minutes (156 commuters, 25.1%) for females.
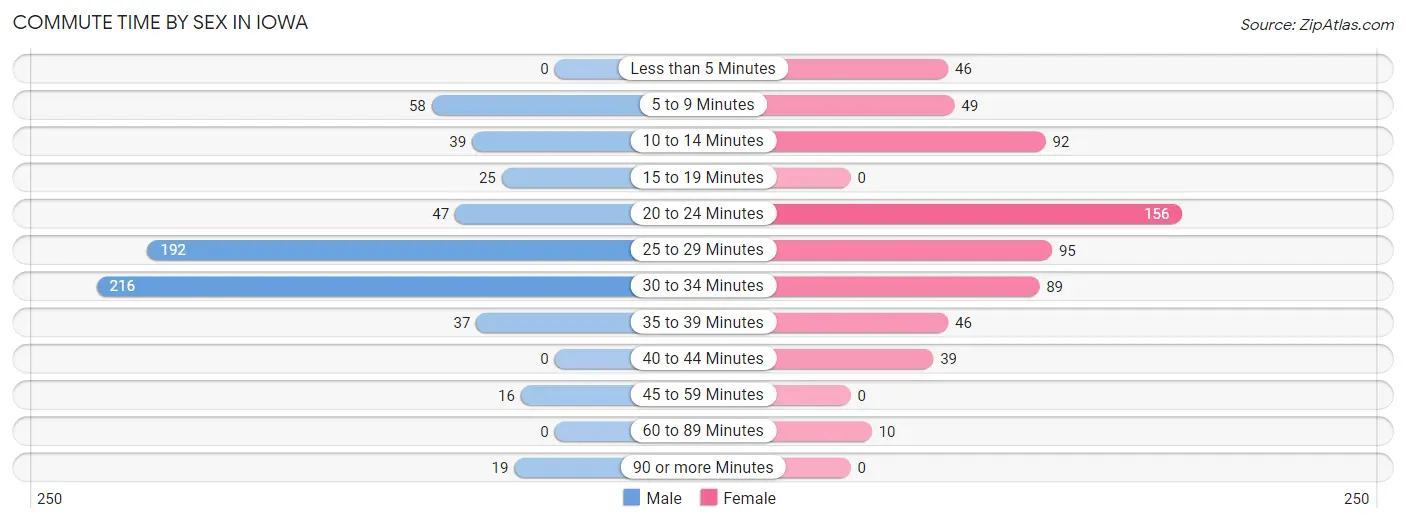
| Commute Time | Male | Female |
| Less than 5 Minutes | 0 (0.0%) | 46 (7.4%) |
| 5 to 9 Minutes | 58 (8.9%) | 49 (7.9%) |
| 10 to 14 Minutes | 39 (6.0%) | 92 (14.8%) |
| 15 to 19 Minutes | 25 (3.8%) | 0 (0.0%) |
| 20 to 24 Minutes | 47 (7.2%) | 156 (25.1%) |
| 25 to 29 Minutes | 192 (29.6%) | 95 (15.3%) |
| 30 to 34 Minutes | 216 (33.3%) | 89 (14.3%) |
| 35 to 39 Minutes | 37 (5.7%) | 46 (7.4%) |
| 40 to 44 Minutes | 0 (0.0%) | 39 (6.3%) |
| 45 to 59 Minutes | 16 (2.5%) | 0 (0.0%) |
| 60 to 89 Minutes | 0 (0.0%) | 10 (1.6%) |
| 90 or more Minutes | 19 (2.9%) | 0 (0.0%) |
Time of Departure to Work by Sex in Iowa
The most frequent times of departure to work in Iowa are 7:30 AM to 7:59 AM (172, 26.5%) for males and 12:00 AM to 4:59 AM (152, 24.4%) for females.
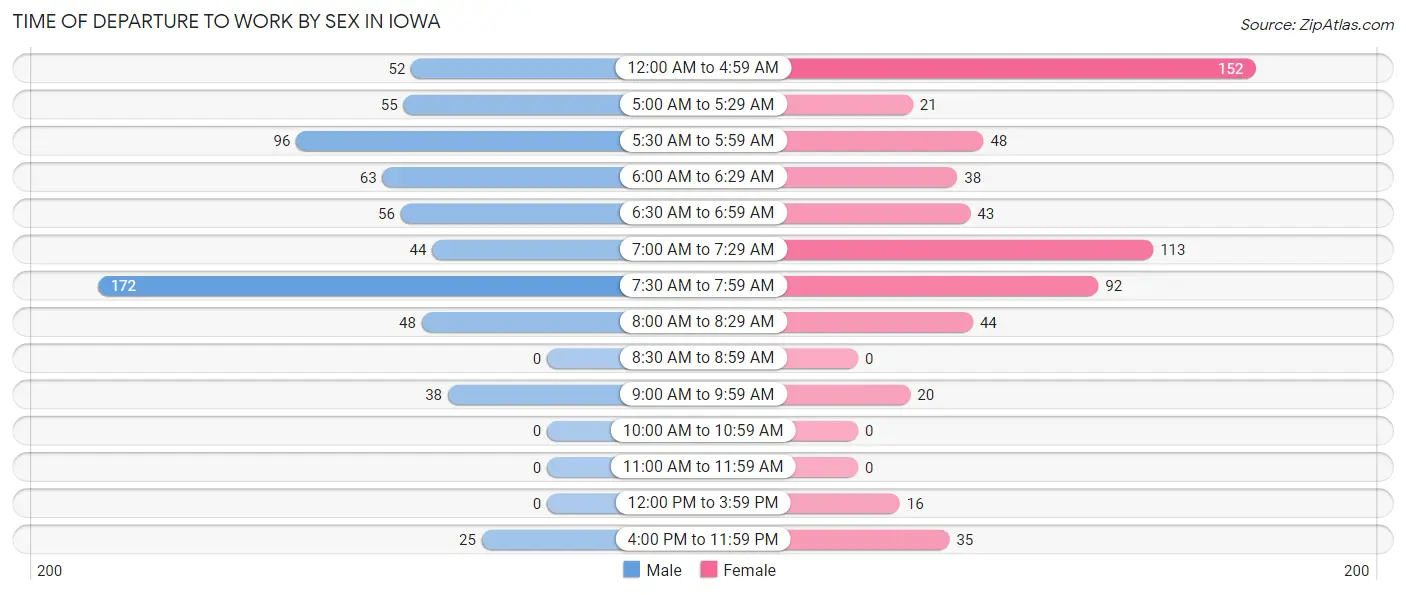
| Time of Departure | Male | Female |
| 12:00 AM to 4:59 AM | 52 (8.0%) | 152 (24.4%) |
| 5:00 AM to 5:29 AM | 55 (8.5%) | 21 (3.4%) |
| 5:30 AM to 5:59 AM | 96 (14.8%) | 48 (7.7%) |
| 6:00 AM to 6:29 AM | 63 (9.7%) | 38 (6.1%) |
| 6:30 AM to 6:59 AM | 56 (8.6%) | 43 (6.9%) |
| 7:00 AM to 7:29 AM | 44 (6.8%) | 113 (18.2%) |
| 7:30 AM to 7:59 AM | 172 (26.5%) | 92 (14.8%) |
| 8:00 AM to 8:29 AM | 48 (7.4%) | 44 (7.1%) |
| 8:30 AM to 8:59 AM | 0 (0.0%) | 0 (0.0%) |
| 9:00 AM to 9:59 AM | 38 (5.9%) | 20 (3.2%) |
| 10:00 AM to 10:59 AM | 0 (0.0%) | 0 (0.0%) |
| 11:00 AM to 11:59 AM | 0 (0.0%) | 0 (0.0%) |
| 12:00 PM to 3:59 PM | 0 (0.0%) | 16 (2.6%) |
| 4:00 PM to 11:59 PM | 25 (3.8%) | 35 (5.6%) |
| Total | 649 (100.0%) | 622 (100.0%) |
Housing Occupancy in Iowa
Occupancy by Ownership in Iowa
Of the total 1,094 dwellings in Iowa, owner-occupied units account for 774 (70.8%), while renter-occupied units make up 320 (29.2%).
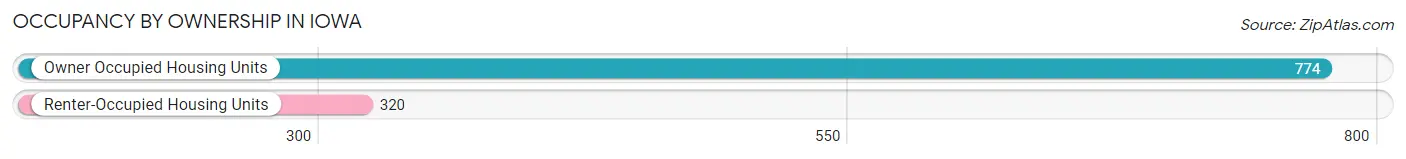
| Occupancy | # Housing Units | % Housing Units |
| Owner Occupied Housing Units | 774 | 70.8% |
| Renter-Occupied Housing Units | 320 | 29.2% |
| Total Occupied Housing Units | 1,094 | 100.0% |
Occupancy by Household Size in Iowa
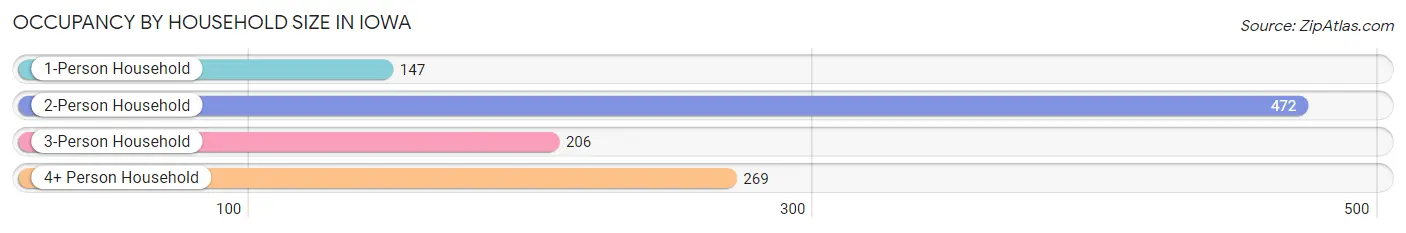
| Household Size | # Housing Units | % Housing Units |
| 1-Person Household | 147 | 13.4% |
| 2-Person Household | 472 | 43.1% |
| 3-Person Household | 206 | 18.8% |
| 4+ Person Household | 269 | 24.6% |
| Total Housing Units | 1,094 | 100.0% |
Occupancy by Ownership by Household Size in Iowa
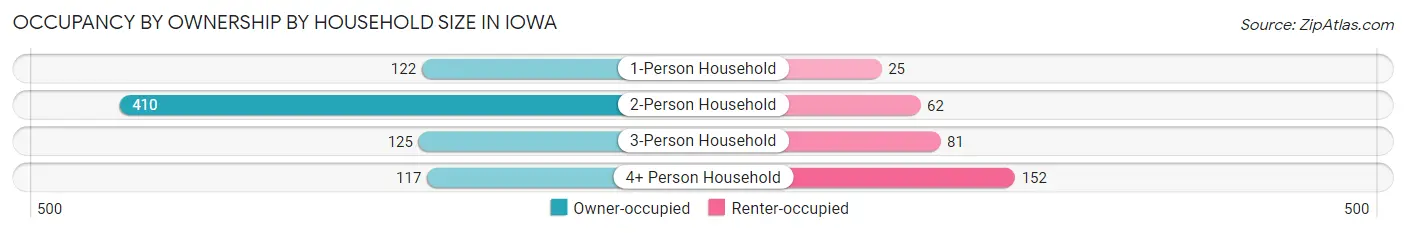
| Household Size | Owner-occupied | Renter-occupied |
| 1-Person Household | 122 (83.0%) | 25 (17.0%) |
| 2-Person Household | 410 (86.9%) | 62 (13.1%) |
| 3-Person Household | 125 (60.7%) | 81 (39.3%) |
| 4+ Person Household | 117 (43.5%) | 152 (56.5%) |
| Total Housing Units | 774 (70.8%) | 320 (29.2%) |
Occupancy by Educational Attainment in Iowa
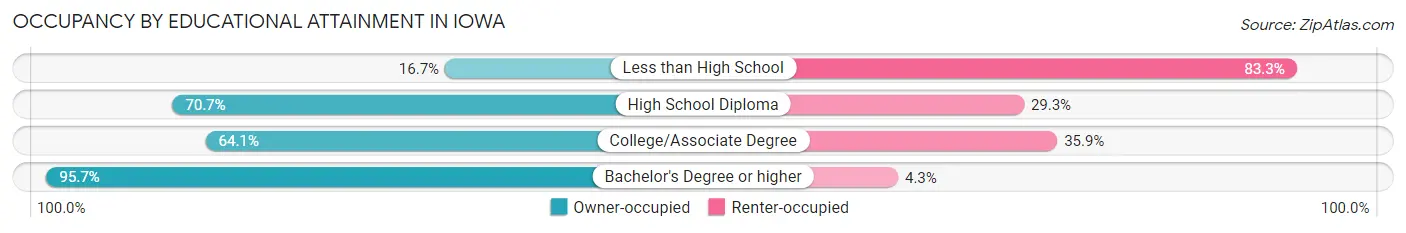
| Household Size | Owner-occupied | Renter-occupied |
| Less than High School | 11 (16.7%) | 55 (83.3%) |
| High School Diploma | 333 (70.7%) | 138 (29.3%) |
| College/Associate Degree | 209 (64.1%) | 117 (35.9%) |
| Bachelor's Degree or higher | 221 (95.7%) | 10 (4.3%) |
Occupancy by Age of Householder in Iowa
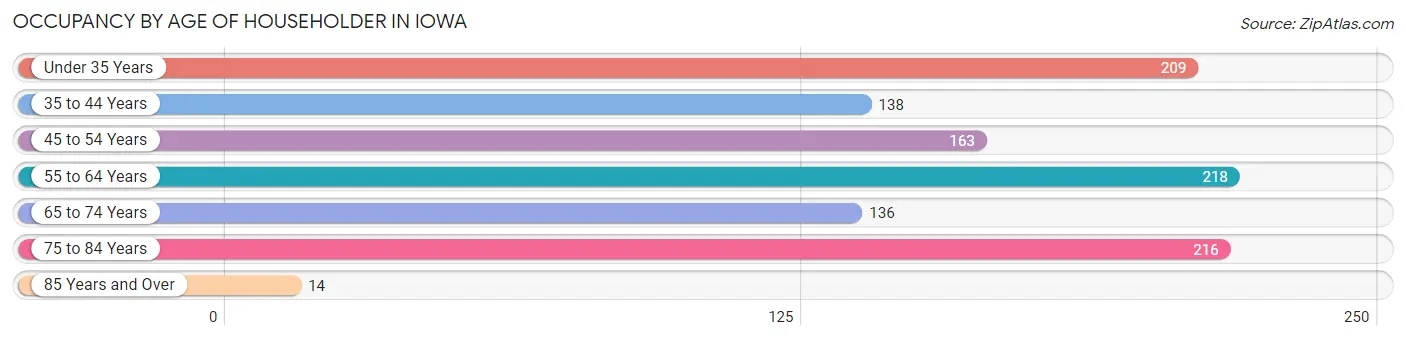
| Age Bracket | # Households | % Households |
| Under 35 Years | 209 | 19.1% |
| 35 to 44 Years | 138 | 12.6% |
| 45 to 54 Years | 163 | 14.9% |
| 55 to 64 Years | 218 | 19.9% |
| 65 to 74 Years | 136 | 12.4% |
| 75 to 84 Years | 216 | 19.7% |
| 85 Years and Over | 14 | 1.3% |
| Total | 1,094 | 100.0% |
Housing Finances in Iowa
Median Income by Occupancy in Iowa
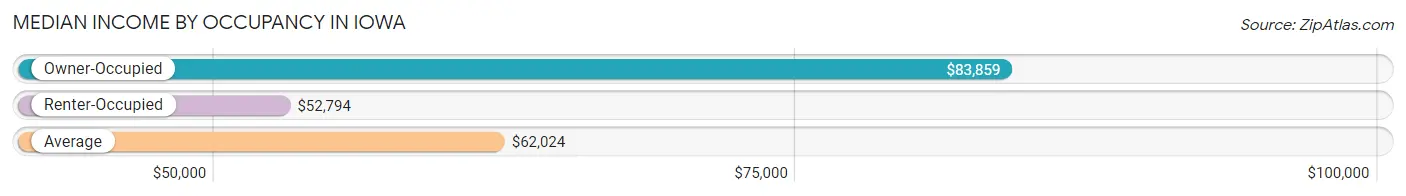
| Occupancy Type | # Households | Median Income |
| Owner-Occupied | 774 (70.8%) | $83,859 |
| Renter-Occupied | 320 (29.2%) | $52,794 |
| Average | 1,094 (100.0%) | $62,024 |
Occupancy by Householder Income Bracket in Iowa
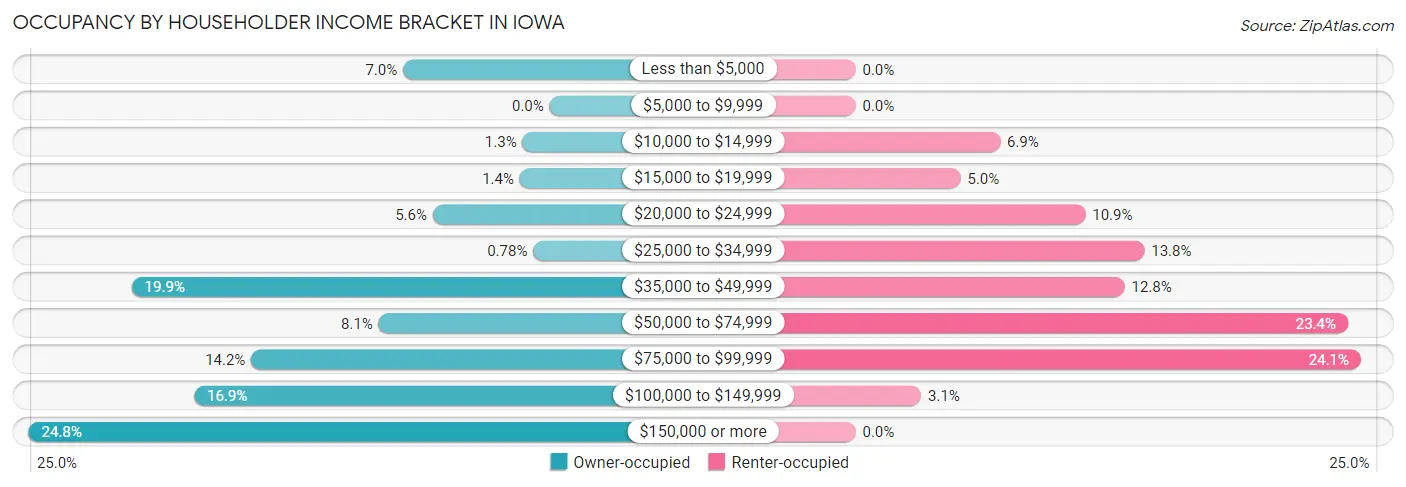
| Income Bracket | Owner-occupied | Renter-occupied |
| Less than $5,000 | 54 (7.0%) | 0 (0.0%) |
| $5,000 to $9,999 | 0 (0.0%) | 0 (0.0%) |
| $10,000 to $14,999 | 10 (1.3%) | 22 (6.9%) |
| $15,000 to $19,999 | 11 (1.4%) | 16 (5.0%) |
| $20,000 to $24,999 | 43 (5.6%) | 35 (10.9%) |
| $25,000 to $34,999 | 6 (0.8%) | 44 (13.8%) |
| $35,000 to $49,999 | 154 (19.9%) | 41 (12.8%) |
| $50,000 to $74,999 | 63 (8.1%) | 75 (23.4%) |
| $75,000 to $99,999 | 110 (14.2%) | 77 (24.1%) |
| $100,000 to $149,999 | 131 (16.9%) | 10 (3.1%) |
| $150,000 or more | 192 (24.8%) | 0 (0.0%) |
| Total | 774 (100.0%) | 320 (100.0%) |
Monthly Housing Cost Tiers in Iowa
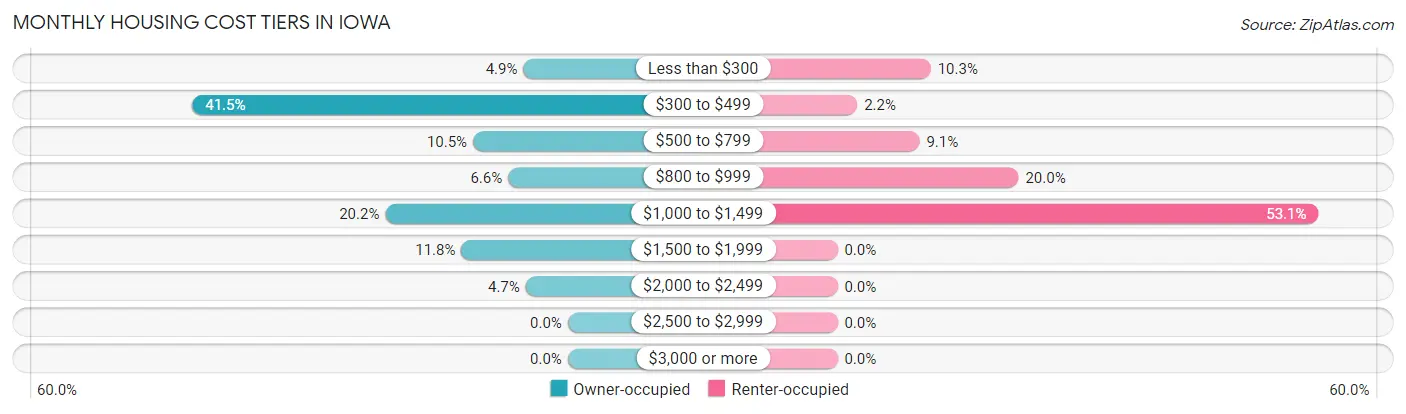
| Monthly Cost | Owner-occupied | Renter-occupied |
| Less than $300 | 38 (4.9%) | 33 (10.3%) |
| $300 to $499 | 321 (41.5%) | 7 (2.2%) |
| $500 to $799 | 81 (10.5%) | 29 (9.1%) |
| $800 to $999 | 51 (6.6%) | 64 (20.0%) |
| $1,000 to $1,499 | 156 (20.2%) | 170 (53.1%) |
| $1,500 to $1,999 | 91 (11.8%) | 0 (0.0%) |
| $2,000 to $2,499 | 36 (4.6%) | 0 (0.0%) |
| $2,500 to $2,999 | 0 (0.0%) | 0 (0.0%) |
| $3,000 or more | 0 (0.0%) | 0 (0.0%) |
| Total | 774 (100.0%) | 320 (100.0%) |
Physical Housing Characteristics in Iowa
Housing Structures in Iowa
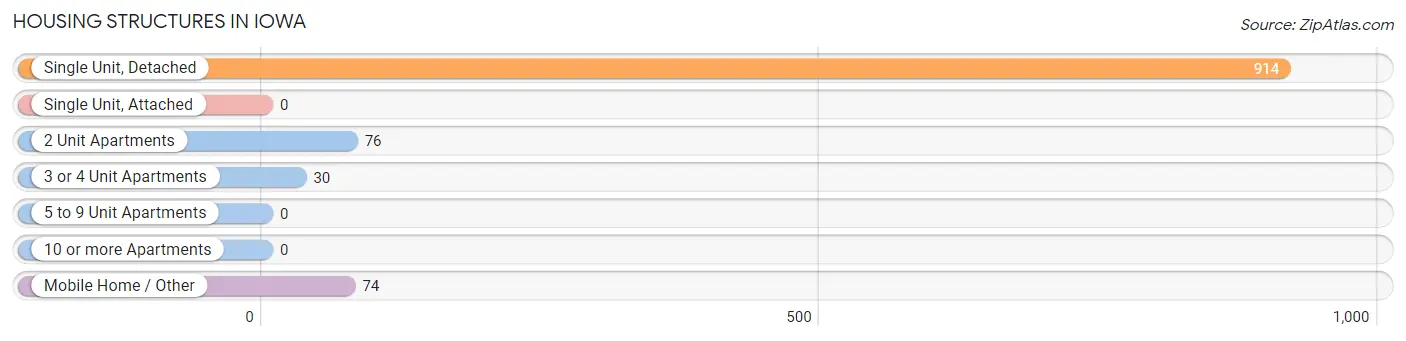
| Structure Type | # Housing Units | % Housing Units |
| Single Unit, Detached | 914 | 83.6% |
| Single Unit, Attached | 0 | 0.0% |
| 2 Unit Apartments | 76 | 7.0% |
| 3 or 4 Unit Apartments | 30 | 2.7% |
| 5 to 9 Unit Apartments | 0 | 0.0% |
| 10 or more Apartments | 0 | 0.0% |
| Mobile Home / Other | 74 | 6.8% |
| Total | 1,094 | 100.0% |
Housing Structures by Occupancy in Iowa
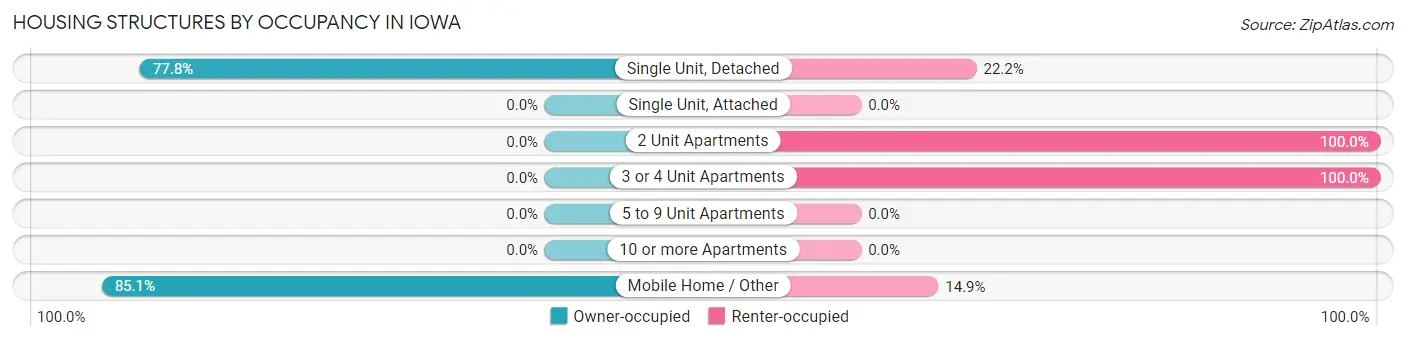
| Structure Type | Owner-occupied | Renter-occupied |
| Single Unit, Detached | 711 (77.8%) | 203 (22.2%) |
| Single Unit, Attached | 0 (0.0%) | 0 (0.0%) |
| 2 Unit Apartments | 0 (0.0%) | 76 (100.0%) |
| 3 or 4 Unit Apartments | 0 (0.0%) | 30 (100.0%) |
| 5 to 9 Unit Apartments | 0 (0.0%) | 0 (0.0%) |
| 10 or more Apartments | 0 (0.0%) | 0 (0.0%) |
| Mobile Home / Other | 63 (85.1%) | 11 (14.9%) |
| Total | 774 (70.8%) | 320 (29.2%) |
Housing Structures by Number of Rooms in Iowa
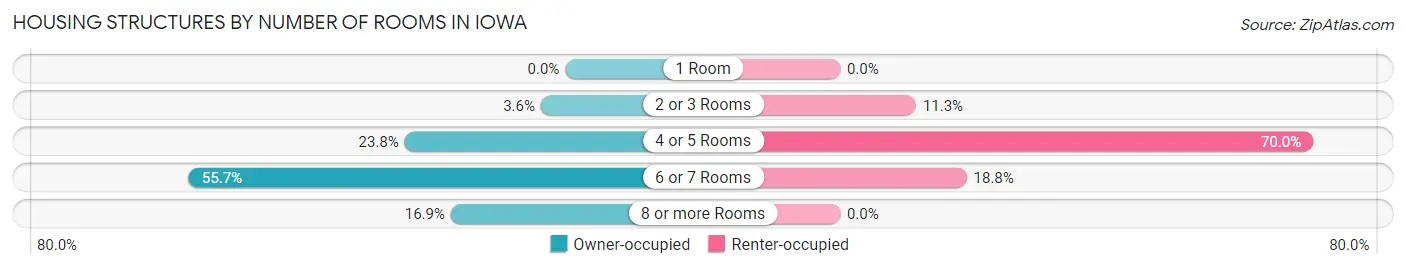
| Number of Rooms | Owner-occupied | Renter-occupied |
| 1 Room | 0 (0.0%) | 0 (0.0%) |
| 2 or 3 Rooms | 28 (3.6%) | 36 (11.3%) |
| 4 or 5 Rooms | 184 (23.8%) | 224 (70.0%) |
| 6 or 7 Rooms | 431 (55.7%) | 60 (18.8%) |
| 8 or more Rooms | 131 (16.9%) | 0 (0.0%) |
| Total | 774 (100.0%) | 320 (100.0%) |
Housing Structure by Heating Type in Iowa
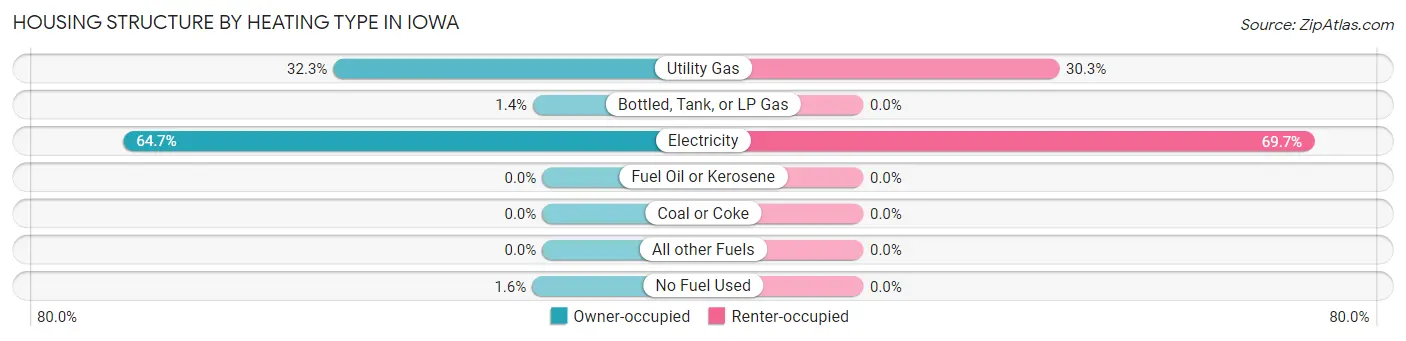
| Heating Type | Owner-occupied | Renter-occupied |
| Utility Gas | 250 (32.3%) | 97 (30.3%) |
| Bottled, Tank, or LP Gas | 11 (1.4%) | 0 (0.0%) |
| Electricity | 501 (64.7%) | 223 (69.7%) |
| Fuel Oil or Kerosene | 0 (0.0%) | 0 (0.0%) |
| Coal or Coke | 0 (0.0%) | 0 (0.0%) |
| All other Fuels | 0 (0.0%) | 0 (0.0%) |
| No Fuel Used | 12 (1.5%) | 0 (0.0%) |
| Total | 774 (100.0%) | 320 (100.0%) |
Household Vehicle Usage in Iowa
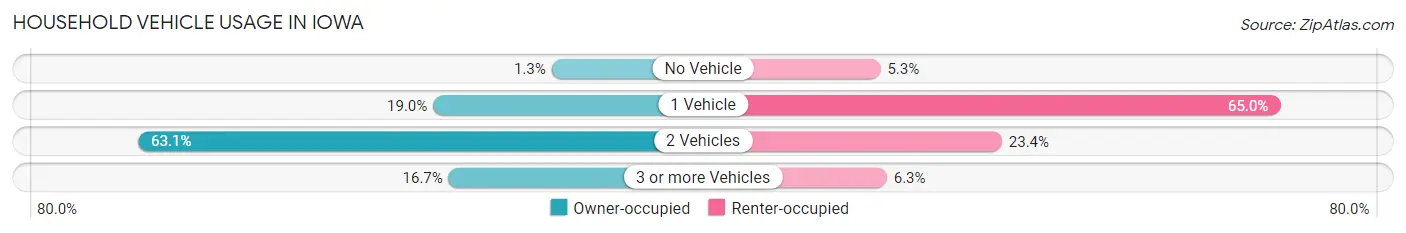
| Vehicles per Household | Owner-occupied | Renter-occupied |
| No Vehicle | 10 (1.3%) | 17 (5.3%) |
| 1 Vehicle | 147 (19.0%) | 208 (65.0%) |
| 2 Vehicles | 488 (63.0%) | 75 (23.4%) |
| 3 or more Vehicles | 129 (16.7%) | 20 (6.2%) |
| Total | 774 (100.0%) | 320 (100.0%) |
Real Estate & Mortgages in Iowa
Real Estate and Mortgage Overview in Iowa
| Characteristic | Without Mortgage | With Mortgage |
| Housing Units | 404 | 370 |
| Median Property Value | $256,700 | $227,200 |
| Median Household Income | $49,554 | $125 |
| Monthly Housing Costs | $349 | $0 |
| Real Estate Taxes | $732 | $0 |
Property Value by Mortgage Status in Iowa
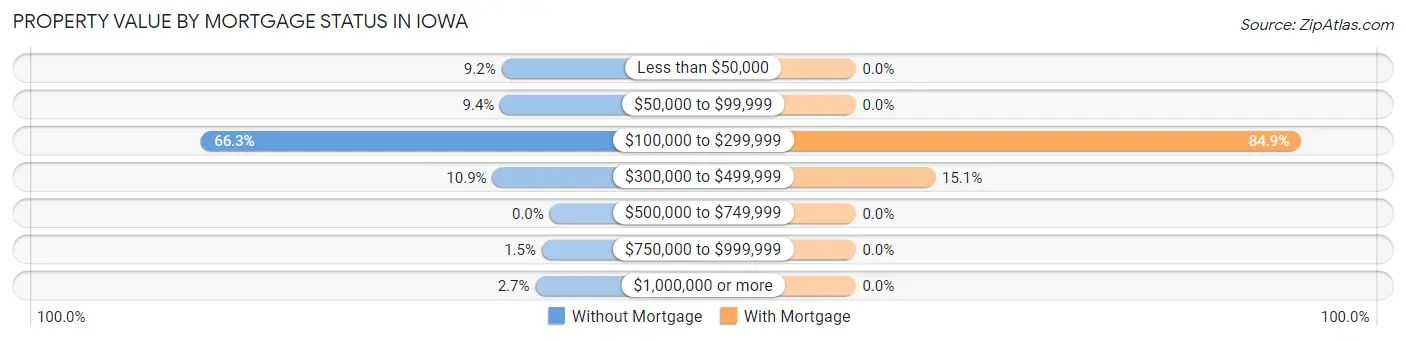
| Property Value | Without Mortgage | With Mortgage |
| Less than $50,000 | 37 (9.2%) | 0 (0.0%) |
| $50,000 to $99,999 | 38 (9.4%) | 0 (0.0%) |
| $100,000 to $299,999 | 268 (66.3%) | 314 (84.9%) |
| $300,000 to $499,999 | 44 (10.9%) | 56 (15.1%) |
| $500,000 to $749,999 | 0 (0.0%) | 0 (0.0%) |
| $750,000 to $999,999 | 6 (1.5%) | 0 (0.0%) |
| $1,000,000 or more | 11 (2.7%) | 0 (0.0%) |
| Total | 404 (100.0%) | 370 (100.0%) |
Household Income by Mortgage Status in Iowa
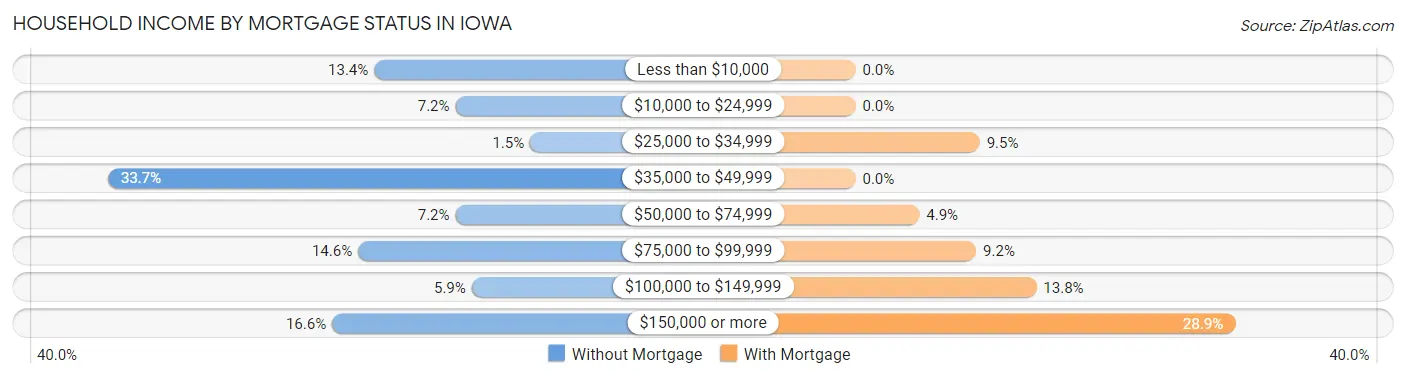
| Household Income | Without Mortgage | With Mortgage |
| Less than $10,000 | 54 (13.4%) | 0 (0.0%) |
| $10,000 to $24,999 | 29 (7.2%) | 0 (0.0%) |
| $25,000 to $34,999 | 6 (1.5%) | 35 (9.5%) |
| $35,000 to $49,999 | 136 (33.7%) | 0 (0.0%) |
| $50,000 to $74,999 | 29 (7.2%) | 18 (4.9%) |
| $75,000 to $99,999 | 59 (14.6%) | 34 (9.2%) |
| $100,000 to $149,999 | 24 (5.9%) | 51 (13.8%) |
| $150,000 or more | 67 (16.6%) | 107 (28.9%) |
| Total | 404 (100.0%) | 370 (100.0%) |
Property Value to Household Income Ratio in Iowa
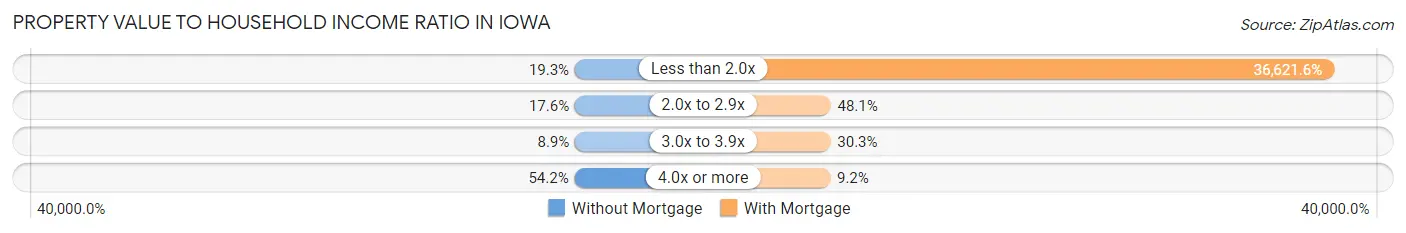
| Value-to-Income Ratio | Without Mortgage | With Mortgage |
| Less than 2.0x | 78 (19.3%) | 135,500 (36,621.6%) |
| 2.0x to 2.9x | 71 (17.6%) | 178 (48.1%) |
| 3.0x to 3.9x | 36 (8.9%) | 112 (30.3%) |
| 4.0x or more | 219 (54.2%) | 34 (9.2%) |
| Total | 404 (100.0%) | 370 (100.0%) |
Real Estate Taxes by Mortgage Status in Iowa
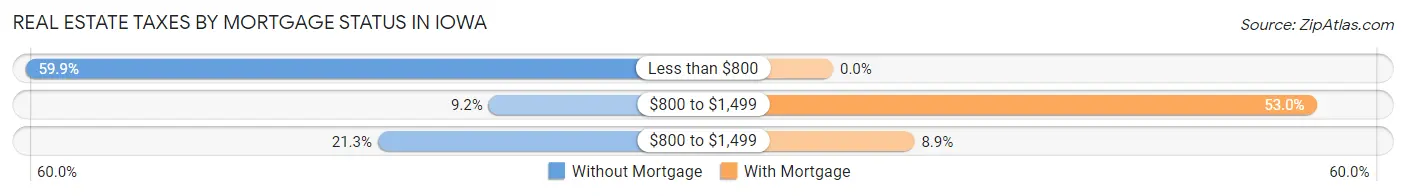
| Property Taxes | Without Mortgage | With Mortgage |
| Less than $800 | 242 (59.9%) | 0 (0.0%) |
| $800 to $1,499 | 37 (9.2%) | 196 (53.0%) |
| $800 to $1,499 | 86 (21.3%) | 33 (8.9%) |
| Total | 404 (100.0%) | 370 (100.0%) |
Health & Disability in Iowa
Health Insurance Coverage by Age in Iowa
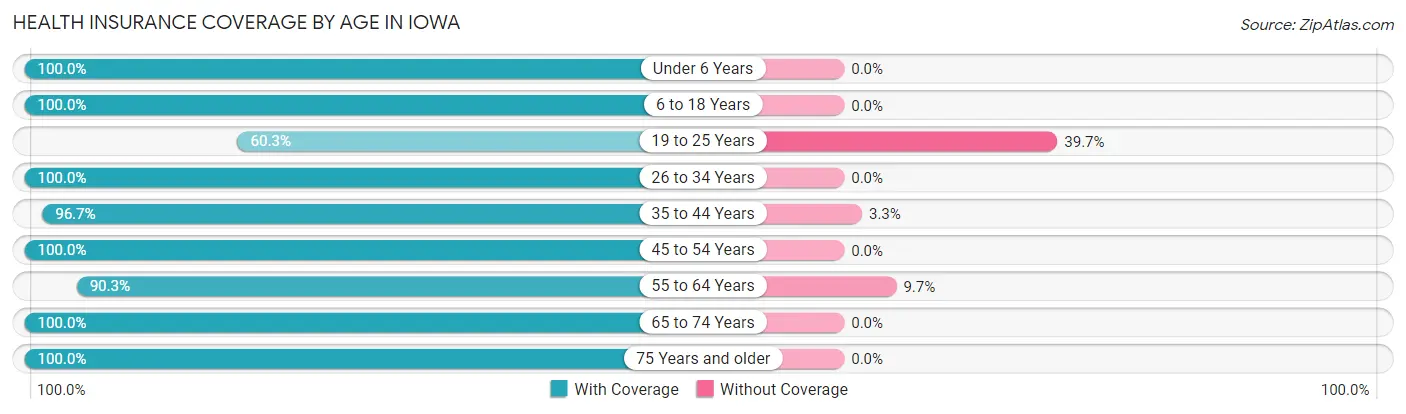
| Age Bracket | With Coverage | Without Coverage |
| Under 6 Years | 228 (100.0%) | 0 (0.0%) |
| 6 to 18 Years | 726 (100.0%) | 0 (0.0%) |
| 19 to 25 Years | 176 (60.3%) | 116 (39.7%) |
| 26 to 34 Years | 385 (100.0%) | 0 (0.0%) |
| 35 to 44 Years | 321 (96.7%) | 11 (3.3%) |
| 45 to 54 Years | 325 (100.0%) | 0 (0.0%) |
| 55 to 64 Years | 334 (90.3%) | 36 (9.7%) |
| 65 to 74 Years | 201 (100.0%) | 0 (0.0%) |
| 75 Years and older | 438 (100.0%) | 0 (0.0%) |
| Total | 3,134 (95.1%) | 163 (4.9%) |
Health Insurance Coverage by Citizenship Status in Iowa
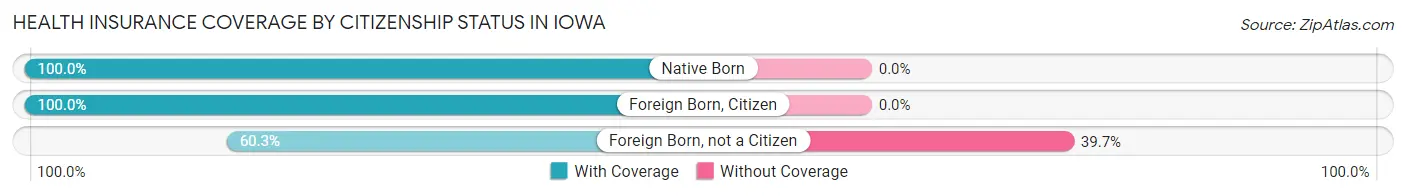
| Citizenship Status | With Coverage | Without Coverage |
| Native Born | 228 (100.0%) | 0 (0.0%) |
| Foreign Born, Citizen | 726 (100.0%) | 0 (0.0%) |
| Foreign Born, not a Citizen | 176 (60.3%) | 116 (39.7%) |
Health Insurance Coverage by Household Income in Iowa
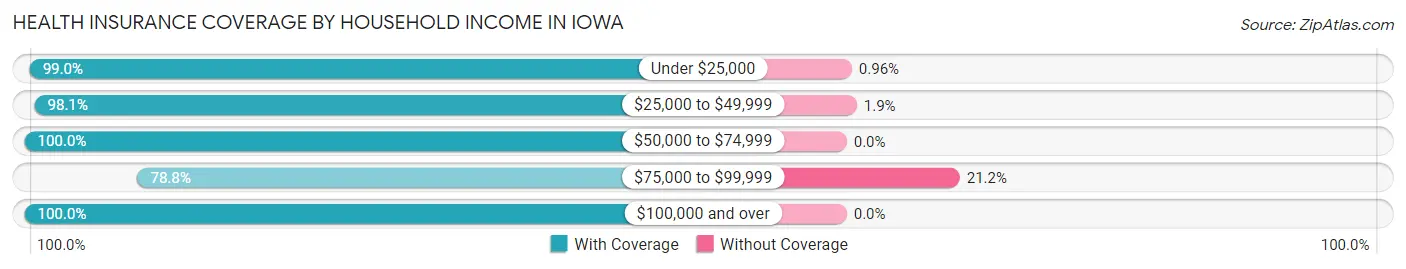
| Household Income | With Coverage | Without Coverage |
| Under $25,000 | 411 (99.0%) | 4 (1.0%) |
| $25,000 to $49,999 | 573 (98.1%) | 11 (1.9%) |
| $50,000 to $74,999 | 516 (100.0%) | 0 (0.0%) |
| $75,000 to $99,999 | 551 (78.8%) | 148 (21.2%) |
| $100,000 and over | 1,083 (100.0%) | 0 (0.0%) |
Public vs Private Health Insurance Coverage by Age in Iowa
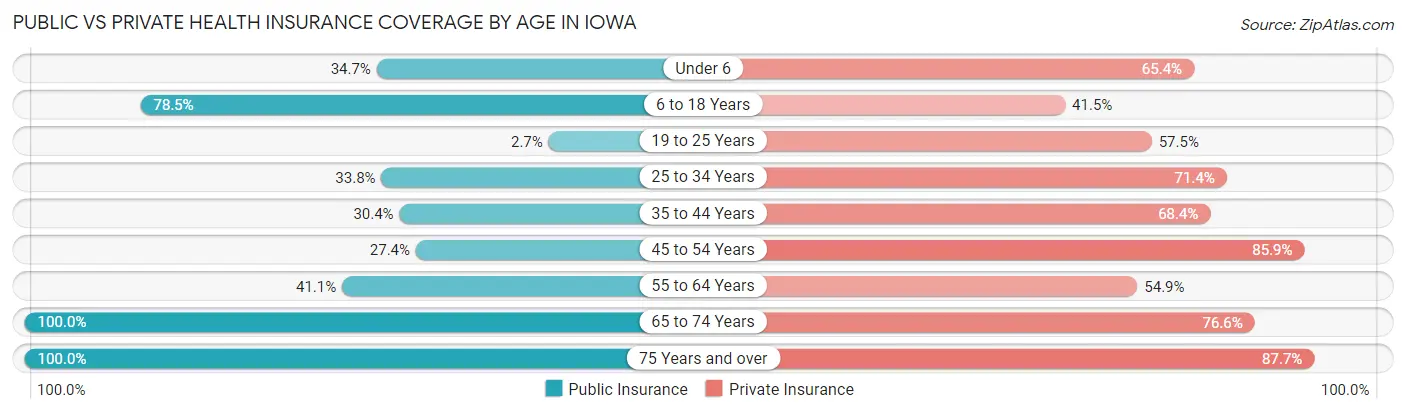
| Age Bracket | Public Insurance | Private Insurance |
| Under 6 | 79 (34.6%) | 149 (65.3%) |
| 6 to 18 Years | 570 (78.5%) | 301 (41.5%) |
| 19 to 25 Years | 8 (2.7%) | 168 (57.5%) |
| 25 to 34 Years | 130 (33.8%) | 275 (71.4%) |
| 35 to 44 Years | 101 (30.4%) | 227 (68.4%) |
| 45 to 54 Years | 89 (27.4%) | 279 (85.9%) |
| 55 to 64 Years | 152 (41.1%) | 203 (54.9%) |
| 65 to 74 Years | 201 (100.0%) | 154 (76.6%) |
| 75 Years and over | 438 (100.0%) | 384 (87.7%) |
| Total | 1,768 (53.6%) | 2,140 (64.9%) |
Disability Status by Sex by Age in Iowa
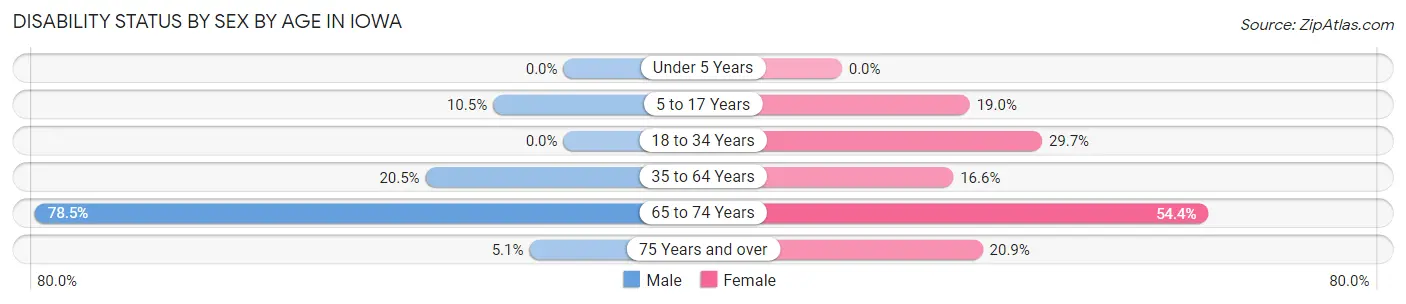
| Age Bracket | Male | Female |
| Under 5 Years | 0 (0.0%) | 0 (0.0%) |
| 5 to 17 Years | 30 (10.4%) | 87 (19.0%) |
| 18 to 34 Years | 0 (0.0%) | 96 (29.7%) |
| 35 to 64 Years | 94 (20.5%) | 94 (16.6%) |
| 65 to 74 Years | 51 (78.5%) | 74 (54.4%) |
| 75 Years and over | 11 (5.1%) | 46 (20.9%) |
Disability Class by Sex by Age in Iowa
Disability Class: Hearing Difficulty
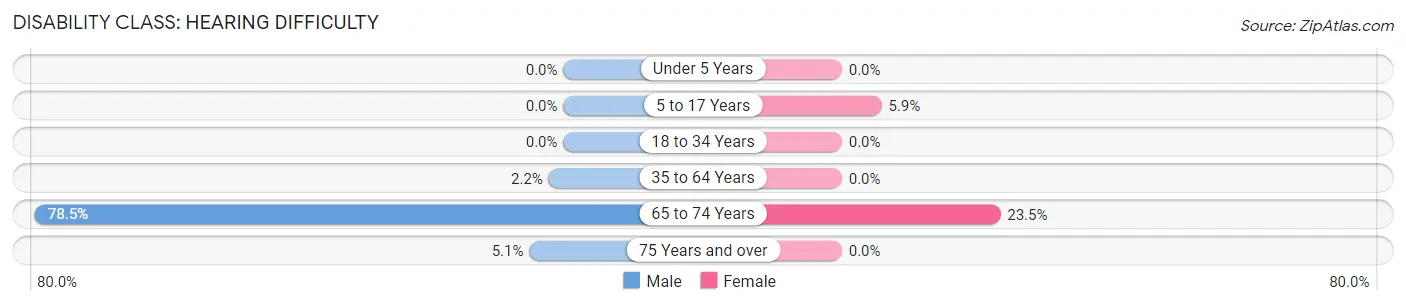
| Age Bracket | Male | Female |
| Under 5 Years | 0 (0.0%) | 0 (0.0%) |
| 5 to 17 Years | 0 (0.0%) | 27 (5.9%) |
| 18 to 34 Years | 0 (0.0%) | 0 (0.0%) |
| 35 to 64 Years | 10 (2.2%) | 0 (0.0%) |
| 65 to 74 Years | 51 (78.5%) | 32 (23.5%) |
| 75 Years and over | 11 (5.1%) | 0 (0.0%) |
Disability Class: Vision Difficulty
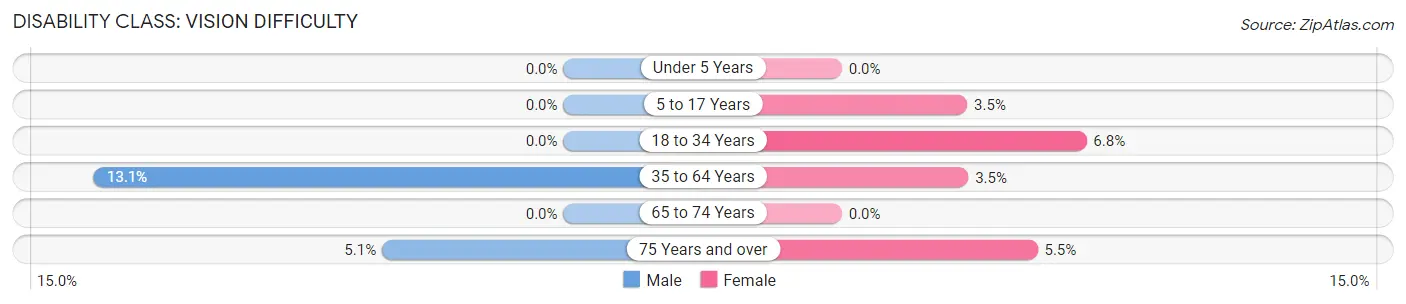
| Age Bracket | Male | Female |
| Under 5 Years | 0 (0.0%) | 0 (0.0%) |
| 5 to 17 Years | 0 (0.0%) | 16 (3.5%) |
| 18 to 34 Years | 0 (0.0%) | 22 (6.8%) |
| 35 to 64 Years | 60 (13.1%) | 20 (3.5%) |
| 65 to 74 Years | 0 (0.0%) | 0 (0.0%) |
| 75 Years and over | 11 (5.1%) | 12 (5.4%) |
Disability Class: Cognitive Difficulty
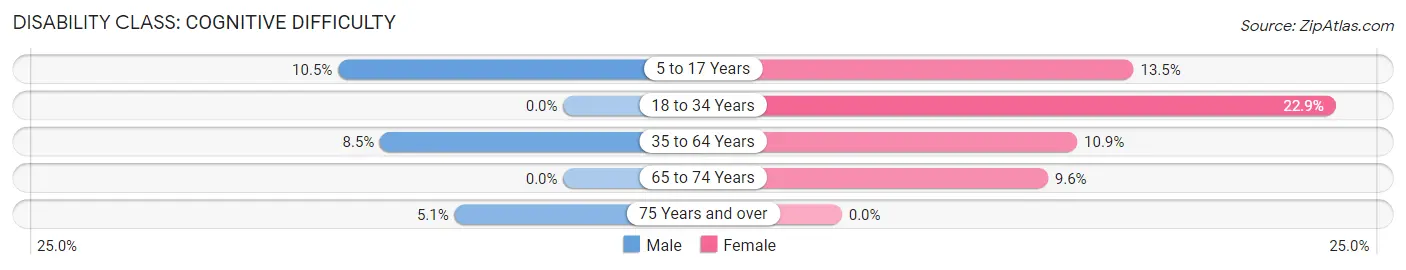
| Age Bracket | Male | Female |
| 5 to 17 Years | 30 (10.4%) | 62 (13.5%) |
| 18 to 34 Years | 0 (0.0%) | 74 (22.9%) |
| 35 to 64 Years | 39 (8.5%) | 62 (10.9%) |
| 65 to 74 Years | 0 (0.0%) | 13 (9.6%) |
| 75 Years and over | 11 (5.1%) | 0 (0.0%) |
Disability Class: Ambulatory Difficulty
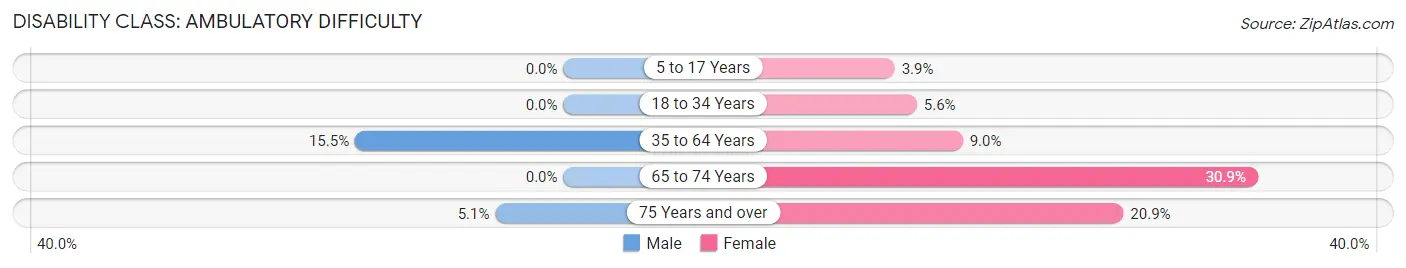
| Age Bracket | Male | Female |
| 5 to 17 Years | 0 (0.0%) | 18 (3.9%) |
| 18 to 34 Years | 0 (0.0%) | 18 (5.6%) |
| 35 to 64 Years | 71 (15.5%) | 51 (9.0%) |
| 65 to 74 Years | 0 (0.0%) | 42 (30.9%) |
| 75 Years and over | 11 (5.1%) | 46 (20.9%) |
Disability Class: Self-Care Difficulty
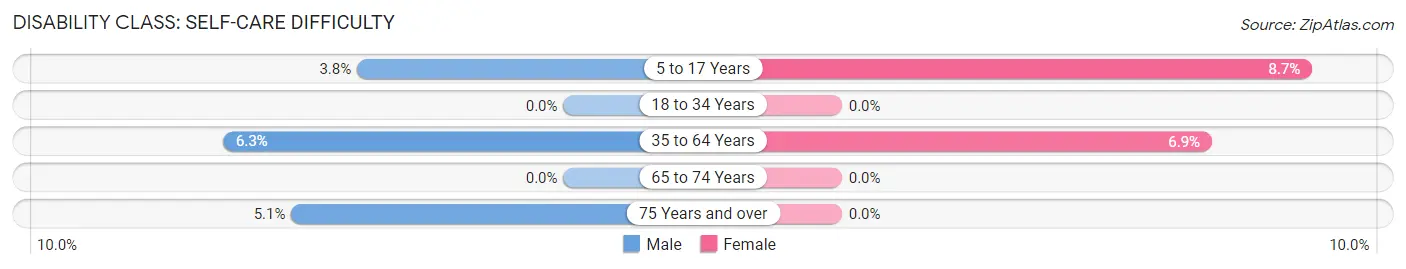
| Age Bracket | Male | Female |
| 5 to 17 Years | 11 (3.8%) | 40 (8.7%) |
| 18 to 34 Years | 0 (0.0%) | 0 (0.0%) |
| 35 to 64 Years | 29 (6.3%) | 39 (6.9%) |
| 65 to 74 Years | 0 (0.0%) | 0 (0.0%) |
| 75 Years and over | 11 (5.1%) | 0 (0.0%) |
Technology Access in Iowa
Computing Device Access in Iowa
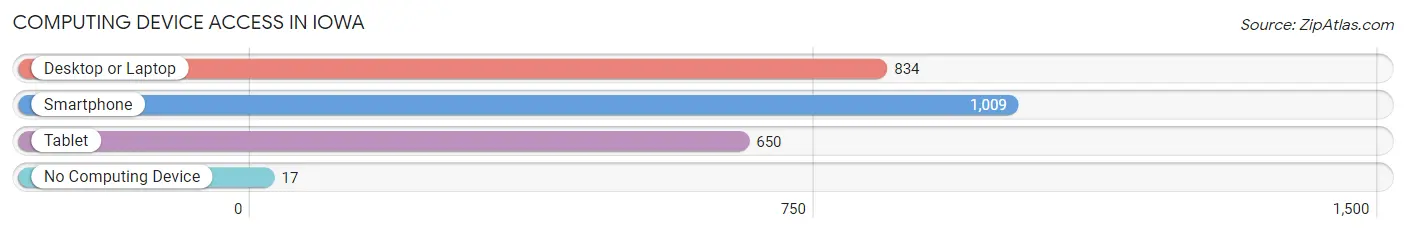
| Device Type | # Households | % Households |
| Desktop or Laptop | 834 | 76.2% |
| Smartphone | 1,009 | 92.2% |
| Tablet | 650 | 59.4% |
| No Computing Device | 17 | 1.5% |
| Total | 1,094 | 100.0% |
Internet Access in Iowa
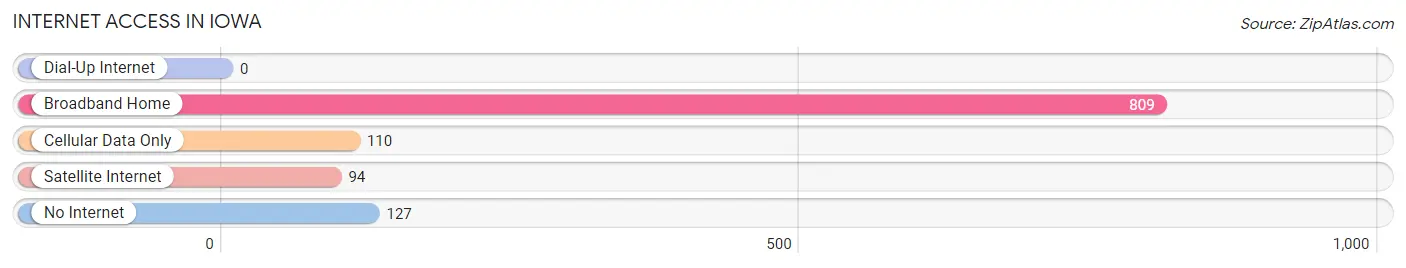
| Internet Type | # Households | % Households |
| Dial-Up Internet | 0 | 0.0% |
| Broadband Home | 809 | 74.0% |
| Cellular Data Only | 110 | 10.1% |
| Satellite Internet | 94 | 8.6% |
| No Internet | 127 | 11.6% |
| Total | 1,094 | 100.0% |
Iowa Summary
Iowa is a state located in the Midwestern United States. It is bordered by Minnesota to the north, Wisconsin and Illinois to the east, Missouri to the south, and South Dakota and Nebraska to the west. Iowa is the 26th most populous state in the United States, with a population of 3.2 million people as of 2019. It is the 30th largest state by land area, covering 56,272 square miles. Iowa is known for its rolling hills, fertile soil, and diverse landscape.
History
The area that is now Iowa was originally inhabited by Native American tribes, including the Sioux, Fox, and Ioway. The first Europeans to explore the area were French explorers in the late 17th century. In 1803, the United States acquired the area as part of the Louisiana Purchase. The first permanent American settlement in Iowa was established in 1833.
Iowa became a state in 1846, and was the 29th state to join the Union. During the Civil War, Iowa was a major supplier of food and other supplies to the Union Army. After the war, Iowa experienced a period of rapid growth and development, becoming an important agricultural and industrial center.
Geography
Iowa is located in the Midwestern United States, bordered by Minnesota to the north, Wisconsin and Illinois to the east, Missouri to the south, and South Dakota and Nebraska to the west. It is the 30th largest state by land area, covering 56,272 square miles.
Iowa is divided into 99 counties, and is home to several major rivers, including the Mississippi, Missouri, and Big Sioux. The state is known for its rolling hills, fertile soil, and diverse landscape. The highest point in Iowa is Hawkeye Point, located in the northwest corner of the state, at 1,670 feet above sea level.
Economy
Iowa has a diversified economy, with a mix of agriculture, manufacturing, and services. Agriculture is the state’s largest industry, accounting for nearly one-third of the state’s total economic output. Iowa is the nation’s leading producer of corn, soybeans, and pork.
Manufacturing is also an important part of the state’s economy, with products ranging from food processing to machinery and chemicals. Iowa is also home to a number of technology companies, including Microsoft, Google, and Apple.
Demographics
As of 2019, Iowa had a population of 3.2 million people. The state is predominantly white, with a population that is 85.3% non-Hispanic white. The largest minority groups in Iowa are Hispanic (4.9%), African American (3.7%), and Asian (2.3%).
The median household income in Iowa is $58,906, and the median home value is $164,800. The state’s poverty rate is 11.2%, slightly lower than the national average of 11.8%. The largest cities in Iowa are Des Moines, Cedar Rapids, Davenport, and Sioux City.
Common Questions
What is Per Capita Income in Iowa?
Per Capita income in Iowa is $29,320.
What is the Median Family Income in Iowa?
Median Family Income in Iowa is $77,056.
What is the Median Household income in Iowa?
Median Household Income in Iowa is $62,024.
What is Income or Wage Gap in Iowa?
Income or Wage Gap in Iowa is 23.2%.
Women in Iowa earn 76.8 cents for every dollar earned by a man.
What is Inequality or Gini Index in Iowa?
Inequality or Gini Index in Iowa is 0.39.
What is the Total Population of Iowa?
Total Population of Iowa is 3,297.
What is the Total Male Population of Iowa?
Total Male Population of Iowa is 1,490.
What is the Total Female Population of Iowa?
Total Female Population of Iowa is 1,807.
What is the Ratio of Males per 100 Females in Iowa?
There are 82.46 Males per 100 Females in Iowa.
What is the Ratio of Females per 100 Males in Iowa?
There are 121.28 Females per 100 Males in Iowa.
What is the Median Population Age in Iowa?
Median Population Age in Iowa is 35.3 Years.
What is the Average Family Size in Iowa
Average Family Size in Iowa is 3.3 People.
What is the Average Household Size in Iowa
Average Household Size in Iowa is 3.0 People.
How Large is the Labor Force in Iowa?
There are 1,411 People in the Labor Forcein in Iowa.
What is the Percentage of People in the Labor Force in Iowa?
55.8% of People are in the Labor Force in Iowa.
What is the Unemployment Rate in Iowa?
Unemployment Rate in Iowa is 5.2%.