Iota, LA Map & Demographics
Iota Map
Iota Overview
$21,231
PER CAPITA INCOME
$48,542
AVG FAMILY INCOME
$37,778
AVG HOUSEHOLD INCOME
7.0%
WAGE / INCOME GAP [ % ]
93.0¢/ $1
WAGE / INCOME GAP [ $ ]
0.47
INEQUALITY / GINI INDEX
1,518
TOTAL POPULATION
746
MALE POPULATION
772
FEMALE POPULATION
96.63
MALES / 100 FEMALES
103.49
FEMALES / 100 MALES
29.7
MEDIAN AGE
3.5
AVG FAMILY SIZE
2.8
AVG HOUSEHOLD SIZE
640
LABOR FORCE [ PEOPLE ]
61.0%
PERCENT IN LABOR FORCE
5.6%
UNEMPLOYMENT RATE
Iota Zip Codes
Iota Area Codes
Income in Iota
Income Overview in Iota
Per Capita Income in Iota is $21,231, while median incomes of families and households are $48,542 and $37,778 respectively.
| Characteristic | Number | Measure |
| Per Capita Income | 1,518 | $21,231 |
| Median Family Income | 359 | $48,542 |
| Mean Family Income | 359 | $66,843 |
| Median Household Income | 550 | $37,778 |
| Mean Household Income | 550 | $58,435 |
| Income Deficit | 359 | $0 |
| Wage / Income Gap (%) | 1,518 | 7.00% |
| Wage / Income Gap ($) | 1,518 | 93.00¢ per $1 |
| Gini / Inequality Index | 1,518 | 0.47 |
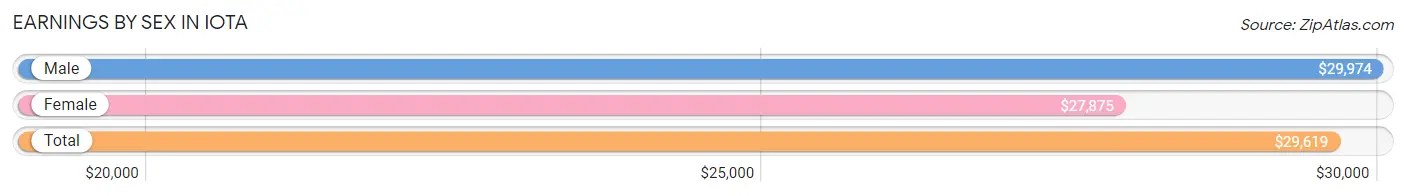
Earnings by Sex in Iota
Average Earnings in Iota are $29,619, $29,974 for men and $27,875 for women, a difference of 7.0%.
| Sex | Number | Average Earnings |
| Male | 319 (48.9%) | $29,974 |
| Female | 333 (51.1%) | $27,875 |
| Total | 652 (100.0%) | $29,619 |
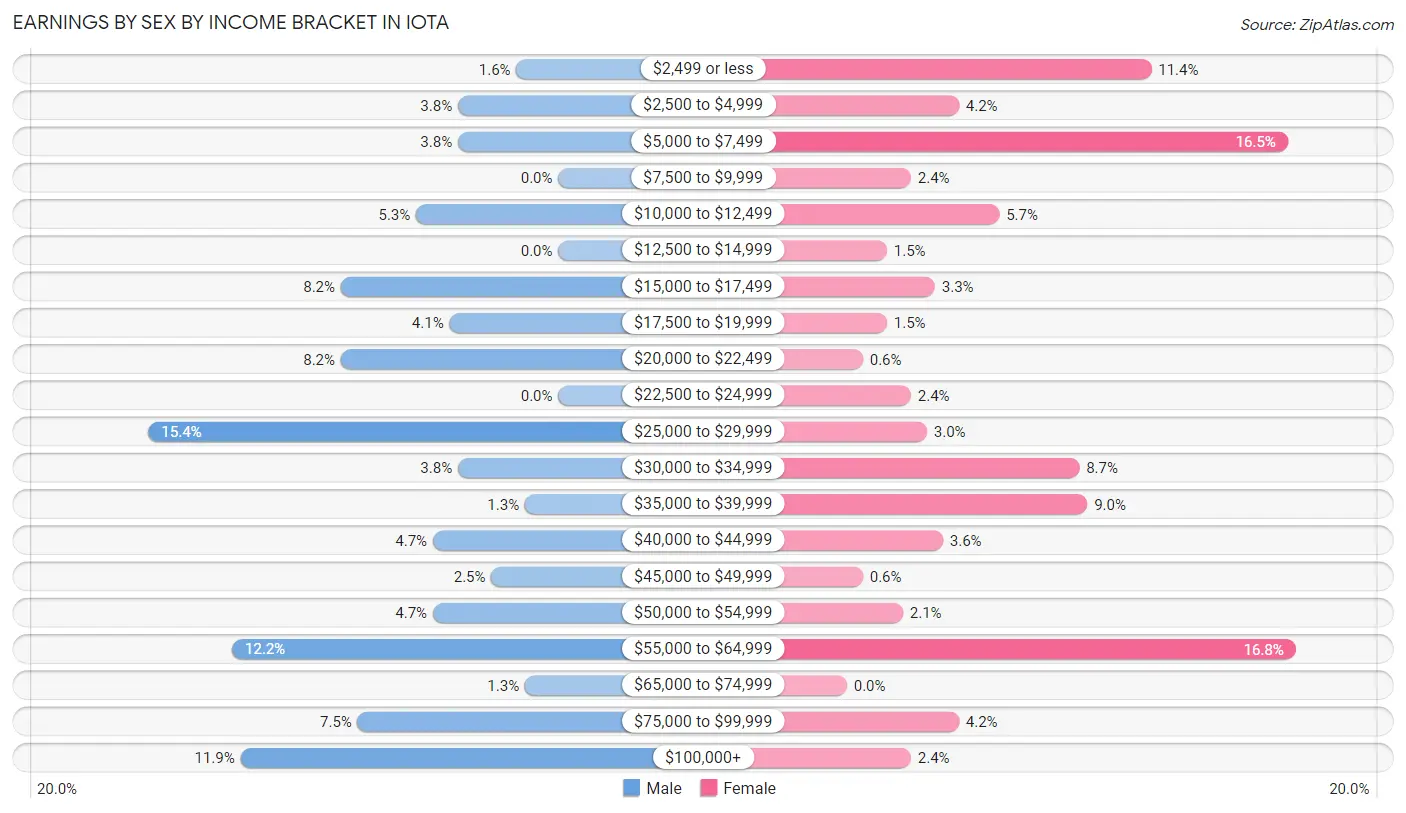
Earnings by Sex by Income Bracket in Iota
The most common earnings brackets in Iota are $25,000 to $29,999 for men (49 | 15.4%) and $55,000 to $64,999 for women (56 | 16.8%).
| Income | Male | Female |
| $2,499 or less | 5 (1.6%) | 38 (11.4%) |
| $2,500 to $4,999 | 12 (3.8%) | 14 (4.2%) |
| $5,000 to $7,499 | 12 (3.8%) | 55 (16.5%) |
| $7,500 to $9,999 | 0 (0.0%) | 8 (2.4%) |
| $10,000 to $12,499 | 17 (5.3%) | 19 (5.7%) |
| $12,500 to $14,999 | 0 (0.0%) | 5 (1.5%) |
| $15,000 to $17,499 | 26 (8.2%) | 11 (3.3%) |
| $17,500 to $19,999 | 13 (4.1%) | 5 (1.5%) |
| $20,000 to $22,499 | 26 (8.2%) | 2 (0.6%) |
| $22,500 to $24,999 | 0 (0.0%) | 8 (2.4%) |
| $25,000 to $29,999 | 49 (15.4%) | 10 (3.0%) |
| $30,000 to $34,999 | 12 (3.8%) | 29 (8.7%) |
| $35,000 to $39,999 | 4 (1.3%) | 30 (9.0%) |
| $40,000 to $44,999 | 15 (4.7%) | 12 (3.6%) |
| $45,000 to $49,999 | 8 (2.5%) | 2 (0.6%) |
| $50,000 to $54,999 | 15 (4.7%) | 7 (2.1%) |
| $55,000 to $64,999 | 39 (12.2%) | 56 (16.8%) |
| $65,000 to $74,999 | 4 (1.3%) | 0 (0.0%) |
| $75,000 to $99,999 | 24 (7.5%) | 14 (4.2%) |
| $100,000+ | 38 (11.9%) | 8 (2.4%) |
| Total | 319 (100.0%) | 333 (100.0%) |
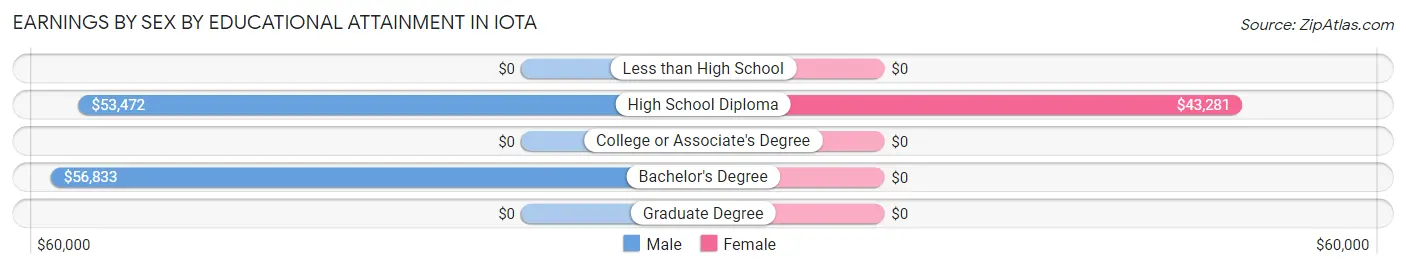
Earnings by Sex by Educational Attainment in Iota
Average earnings in Iota are $45,625 for men and $29,750 for women, a difference of 34.8%. Men with an educational attainment of bachelor's degree enjoy the highest average annual earnings of $56,833, while those with high school diploma education earn the least with $53,472. Women with an educational attainment of high school diploma earn the most with the average annual earnings of $43,281, while those with high school diploma education have the smallest earnings of $43,281.
| Educational Attainment | Male Income | Female Income |
| Less than High School | - | - |
| High School Diploma | $53,472 | $43,281 |
| College or Associate's Degree | - | - |
| Bachelor's Degree | $56,833 | $0 |
| Graduate Degree | - | - |
| Total | $45,625 | $29,750 |
Family Income in Iota
Family Income Brackets in Iota
According to the Iota family income data, there are 111 families falling into the $100,000 to $149,999 income range, which is the most common income bracket and makes up 30.9% of all families. Conversely, the $150,000 to $199,999 income bracket is the least frequent group with only 2 families (0.6%) belonging to this category.
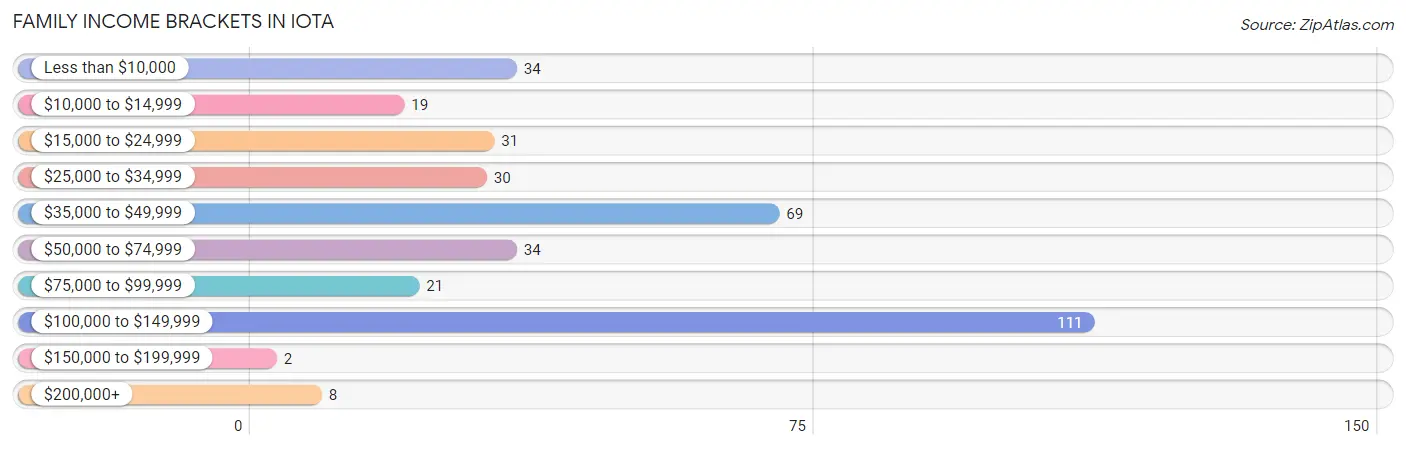
| Income Bracket | # Families | % Families |
| Less than $10,000 | 34 | 9.5% |
| $10,000 to $14,999 | 19 | 5.3% |
| $15,000 to $24,999 | 31 | 8.6% |
| $25,000 to $34,999 | 30 | 8.4% |
| $35,000 to $49,999 | 69 | 19.2% |
| $50,000 to $74,999 | 34 | 9.5% |
| $75,000 to $99,999 | 21 | 5.8% |
| $100,000 to $149,999 | 111 | 30.9% |
| $150,000 to $199,999 | 2 | 0.6% |
| $200,000+ | 8 | 2.2% |
Family Income by Famaliy Size in Iota
4-person families (89 | 24.8%) account for the highest median family income in Iota with $103,185 per family, while 4-person families (89 | 24.8%) have the highest median income of $25,796 per family member.
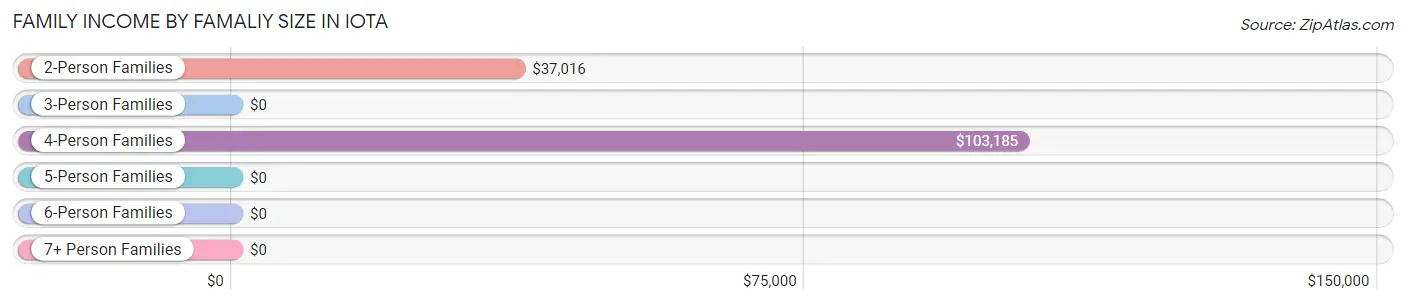
| Income Bracket | # Families | Median Income |
| 2-Person Families | 120 (33.4%) | $37,016 |
| 3-Person Families | 69 (19.2%) | $0 |
| 4-Person Families | 89 (24.8%) | $103,185 |
| 5-Person Families | 59 (16.4%) | $0 |
| 6-Person Families | 22 (6.1%) | $0 |
| 7+ Person Families | 0 (0.0%) | $0 |
| Total | 359 (100.0%) | $48,542 |
Family Income by Number of Earners in Iota
The median family income in Iota is $48,542, with families comprising 3+ earners (53) having the highest median family income of $104,395, while families with 1 earner (156) have the lowest median family income of $35,556, accounting for 14.8% and 43.4% of families, respectively.
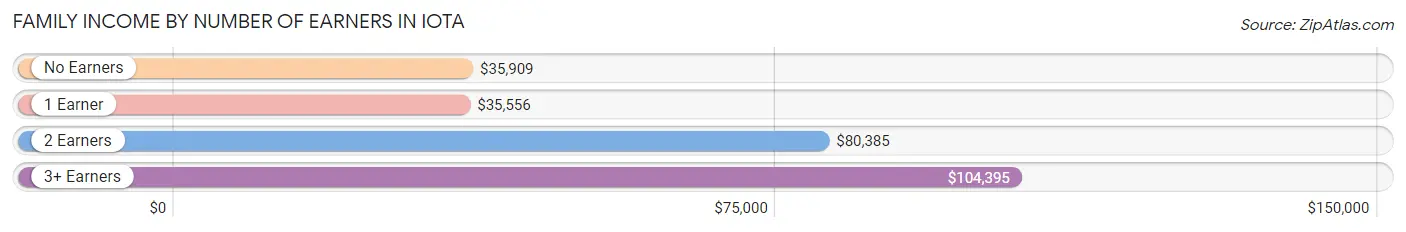
| Number of Earners | # Families | Median Income |
| No Earners | 38 (10.6%) | $35,909 |
| 1 Earner | 156 (43.4%) | $35,556 |
| 2 Earners | 112 (31.2%) | $80,385 |
| 3+ Earners | 53 (14.8%) | $104,395 |
| Total | 359 (100.0%) | $48,542 |
Household Income in Iota
Household Income Brackets in Iota
With 124 households falling in the category, the $100,000 to $149,999 income range is the most frequent in Iota, accounting for 22.6% of all households. In contrast, only 5 households (0.9%) fall into the $150,000 to $199,999 income bracket, making it the least populous group.
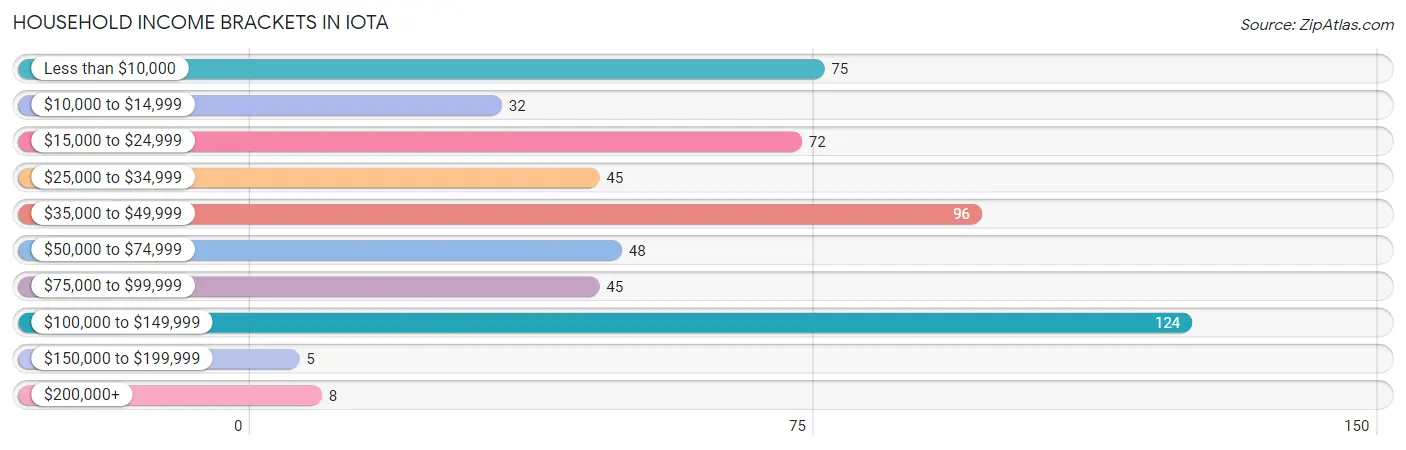
| Income Bracket | # Households | % Households |
| Less than $10,000 | 75 | 13.6% |
| $10,000 to $14,999 | 32 | 5.8% |
| $15,000 to $24,999 | 72 | 13.1% |
| $25,000 to $34,999 | 45 | 8.2% |
| $35,000 to $49,999 | 96 | 17.5% |
| $50,000 to $74,999 | 48 | 8.7% |
| $75,000 to $99,999 | 45 | 8.2% |
| $100,000 to $149,999 | 124 | 22.5% |
| $150,000 to $199,999 | 5 | 0.9% |
| $200,000+ | 8 | 1.5% |
Household Income by Householder Age in Iota
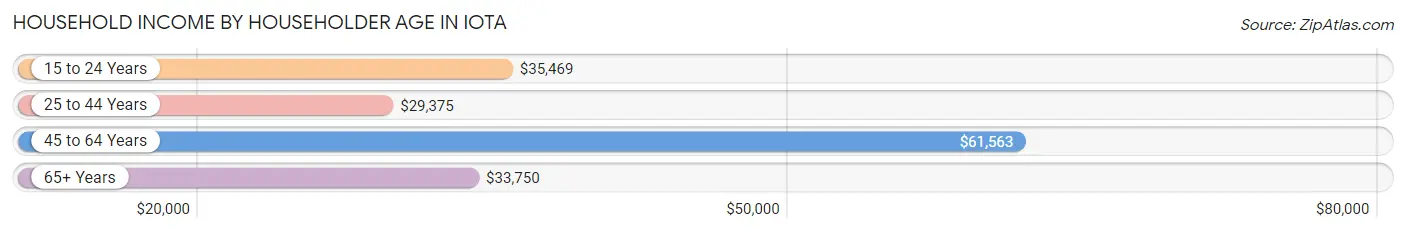
The median household income in Iota is $37,778, with the highest median household income of $61,563 found in the 45 to 64 years age bracket for the primary householder. A total of 194 households (35.3%) fall into this category. Meanwhile, the 25 to 44 years age bracket for the primary householder has the lowest median household income of $29,375, with 213 households (38.7%) in this group.
| Income Bracket | # Households | Median Income |
| 15 to 24 Years | 44 (8.0%) | $35,469 |
| 25 to 44 Years | 213 (38.7%) | $29,375 |
| 45 to 64 Years | 194 (35.3%) | $61,563 |
| 65+ Years | 99 (18.0%) | $33,750 |
| Total | 550 (100.0%) | $37,778 |
Poverty in Iota
Income Below Poverty by Sex and Age in Iota
With 26.0% poverty level for males and 36.7% for females among the residents of Iota, 12 to 14 year old males and 6 to 11 year old females are the most vulnerable to poverty, with 81 males (66.9%) and 92 females (72.4%) in their respective age groups living below the poverty level.
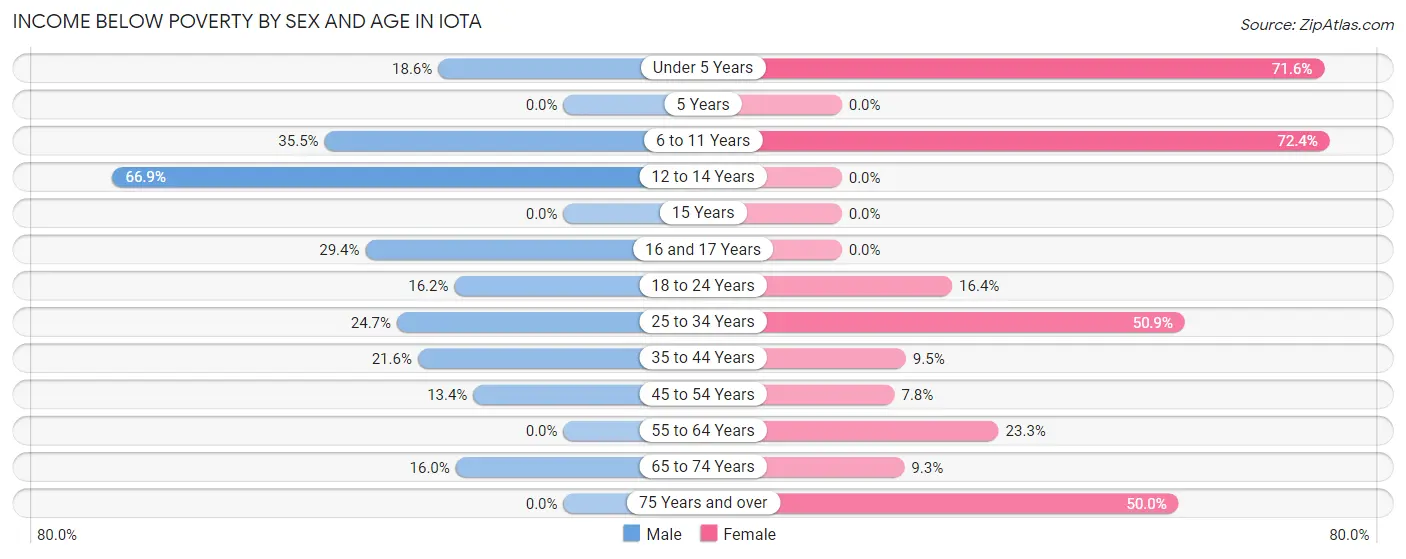
| Age Bracket | Male | Female |
| Under 5 Years | 8 (18.6%) | 53 (71.6%) |
| 5 Years | 0 (0.0%) | 0 (0.0%) |
| 6 to 11 Years | 22 (35.5%) | 92 (72.4%) |
| 12 to 14 Years | 81 (66.9%) | 0 (0.0%) |
| 15 Years | 0 (0.0%) | 0 (0.0%) |
| 16 and 17 Years | 5 (29.4%) | 0 (0.0%) |
| 18 to 24 Years | 17 (16.2%) | 10 (16.4%) |
| 25 to 34 Years | 22 (24.7%) | 82 (50.9%) |
| 35 to 44 Years | 16 (21.6%) | 4 (9.5%) |
| 45 to 54 Years | 15 (13.4%) | 9 (7.8%) |
| 55 to 64 Years | 0 (0.0%) | 17 (23.3%) |
| 65 to 74 Years | 8 (16.0%) | 4 (9.3%) |
| 75 Years and over | 0 (0.0%) | 12 (50.0%) |
| Total | 194 (26.0%) | 283 (36.7%) |
Income Above Poverty by Sex and Age in Iota
According to the poverty statistics in Iota, males aged 15 years and females aged 5 years are the age groups that are most secure financially, with 100.0% of males and 100.0% of females in these age groups living above the poverty line.
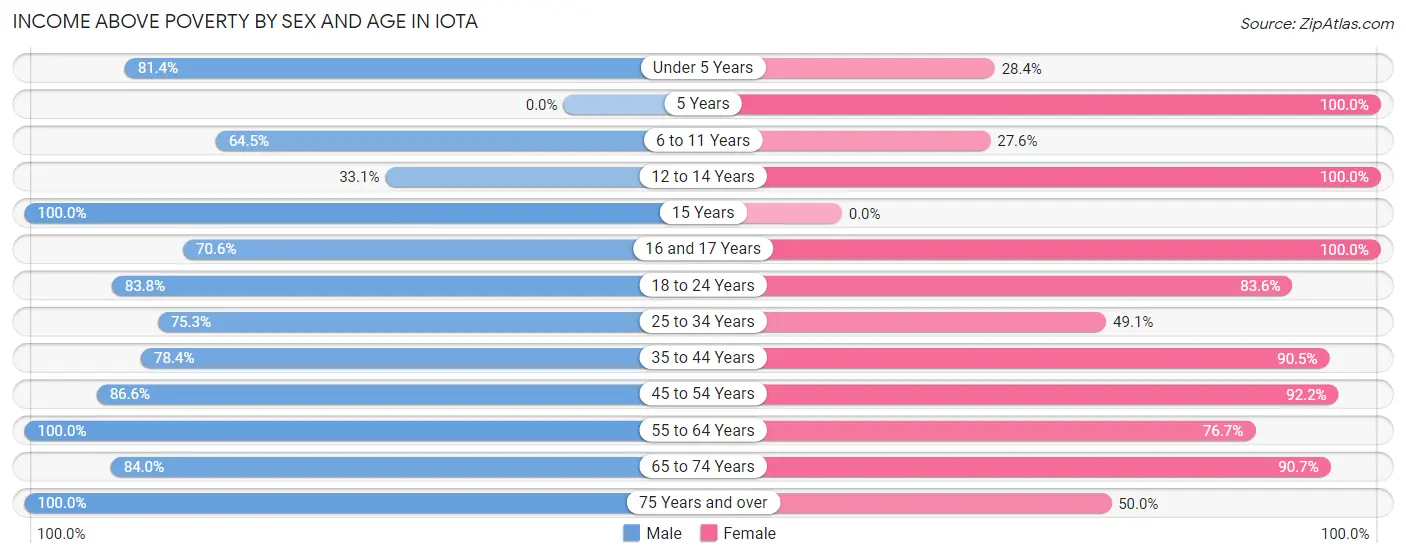
| Age Bracket | Male | Female |
| Under 5 Years | 35 (81.4%) | 21 (28.4%) |
| 5 Years | 0 (0.0%) | 12 (100.0%) |
| 6 to 11 Years | 40 (64.5%) | 35 (27.6%) |
| 12 to 14 Years | 40 (33.1%) | 17 (100.0%) |
| 15 Years | 10 (100.0%) | 0 (0.0%) |
| 16 and 17 Years | 12 (70.6%) | 21 (100.0%) |
| 18 to 24 Years | 88 (83.8%) | 51 (83.6%) |
| 25 to 34 Years | 67 (75.3%) | 79 (49.1%) |
| 35 to 44 Years | 58 (78.4%) | 38 (90.5%) |
| 45 to 54 Years | 97 (86.6%) | 106 (92.2%) |
| 55 to 64 Years | 54 (100.0%) | 56 (76.7%) |
| 65 to 74 Years | 42 (84.0%) | 39 (90.7%) |
| 75 Years and over | 9 (100.0%) | 12 (50.0%) |
| Total | 552 (74.0%) | 487 (63.2%) |
Income Below Poverty Among Married-Couple Families in Iota
The poverty statistics for married-couple families in Iota show that 16.9% or 43 of the total 254 families live below the poverty line. Families with 3 or 4 children have the highest poverty rate of 63.9%, comprising of 23 families. On the other hand, families with no children have the lowest poverty rate of 0.0%, which includes 0 families.
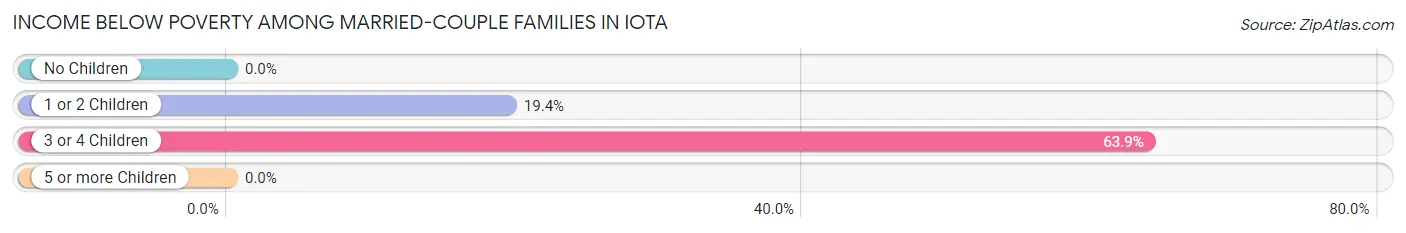
| Children | Above Poverty | Below Poverty |
| No Children | 115 (100.0%) | 0 (0.0%) |
| 1 or 2 Children | 83 (80.6%) | 20 (19.4%) |
| 3 or 4 Children | 13 (36.1%) | 23 (63.9%) |
| 5 or more Children | 0 (0.0%) | 0 (0.0%) |
| Total | 211 (83.1%) | 43 (16.9%) |
Income Below Poverty Among Single-Parent Households in Iota
According to the poverty data in Iota, 25.0% or 1 single-father households and 50.5% or 51 single-mother households are living below the poverty line. Among single-father households, those with 1 or 2 children have the highest poverty rate, with 1 households (100.0%) experiencing poverty. Likewise, among single-mother households, those with 3 or 4 children have the highest poverty rate, with 26 households (100.0%) falling below the poverty line.
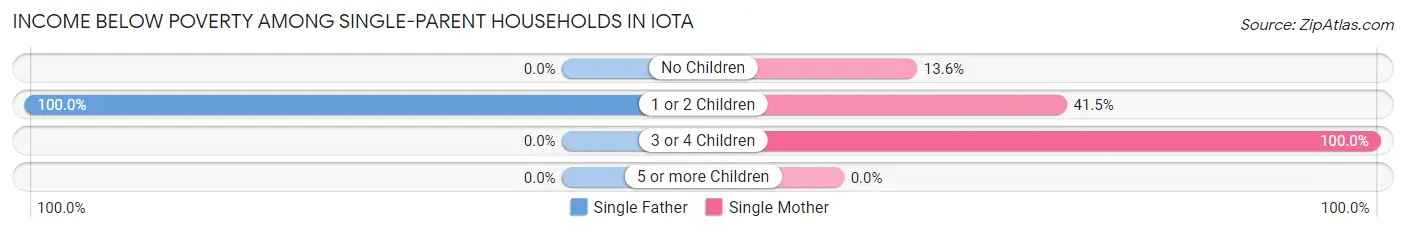
| Children | Single Father | Single Mother |
| No Children | 0 (0.0%) | 3 (13.6%) |
| 1 or 2 Children | 1 (100.0%) | 22 (41.5%) |
| 3 or 4 Children | 0 (0.0%) | 26 (100.0%) |
| 5 or more Children | 0 (0.0%) | 0 (0.0%) |
| Total | 1 (25.0%) | 51 (50.5%) |
Income Below Poverty Among Married-Couple vs Single-Parent Households in Iota
The poverty data for Iota shows that 43 of the married-couple family households (16.9%) and 52 of the single-parent households (49.5%) are living below the poverty level. Within the married-couple family households, those with 3 or 4 children have the highest poverty rate, with 23 households (63.9%) falling below the poverty line. Among the single-parent households, those with 3 or 4 children have the highest poverty rate, with 26 household (100.0%) living below poverty.
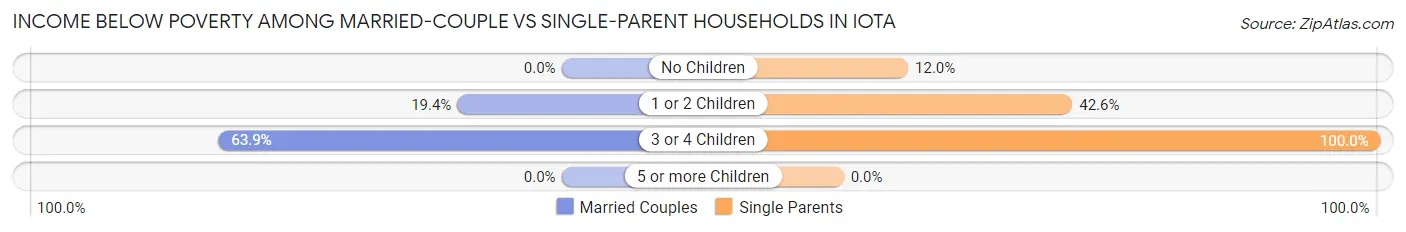
| Children | Married-Couple Families | Single-Parent Households |
| No Children | 0 (0.0%) | 3 (12.0%) |
| 1 or 2 Children | 20 (19.4%) | 23 (42.6%) |
| 3 or 4 Children | 23 (63.9%) | 26 (100.0%) |
| 5 or more Children | 0 (0.0%) | 0 (0.0%) |
| Total | 43 (16.9%) | 52 (49.5%) |
Race in Iota
The most populous races in Iota are White / Caucasian (1,421 | 93.6%), Hispanic or Latino (82 | 5.4%), and Two or more Races (66 | 4.3%).
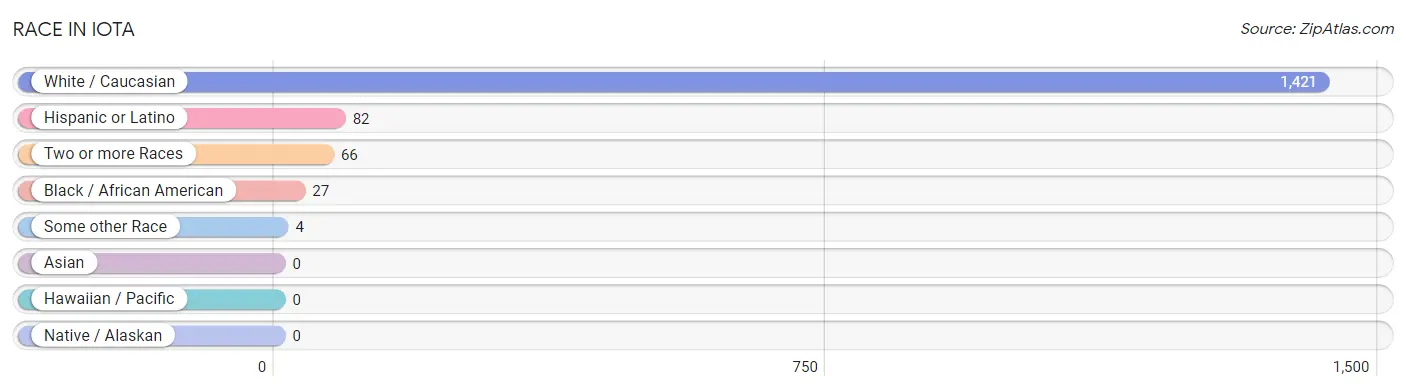
| Race | # Population | % Population |
| Asian | 0 | 0.0% |
| Black / African American | 27 | 1.8% |
| Hawaiian / Pacific | 0 | 0.0% |
| Hispanic or Latino | 82 | 5.4% |
| Native / Alaskan | 0 | 0.0% |
| White / Caucasian | 1,421 | 93.6% |
| Two or more Races | 66 | 4.3% |
| Some other Race | 4 | 0.3% |
| Total | 1,518 | 100.0% |
Ancestry in Iota
The most populous ancestries reported in Iota are French (277 | 18.2%), Cajun (159 | 10.5%), German (118 | 7.8%), American (113 | 7.4%), and Irish (108 | 7.1%), together accounting for 51.0% of all Iota residents.
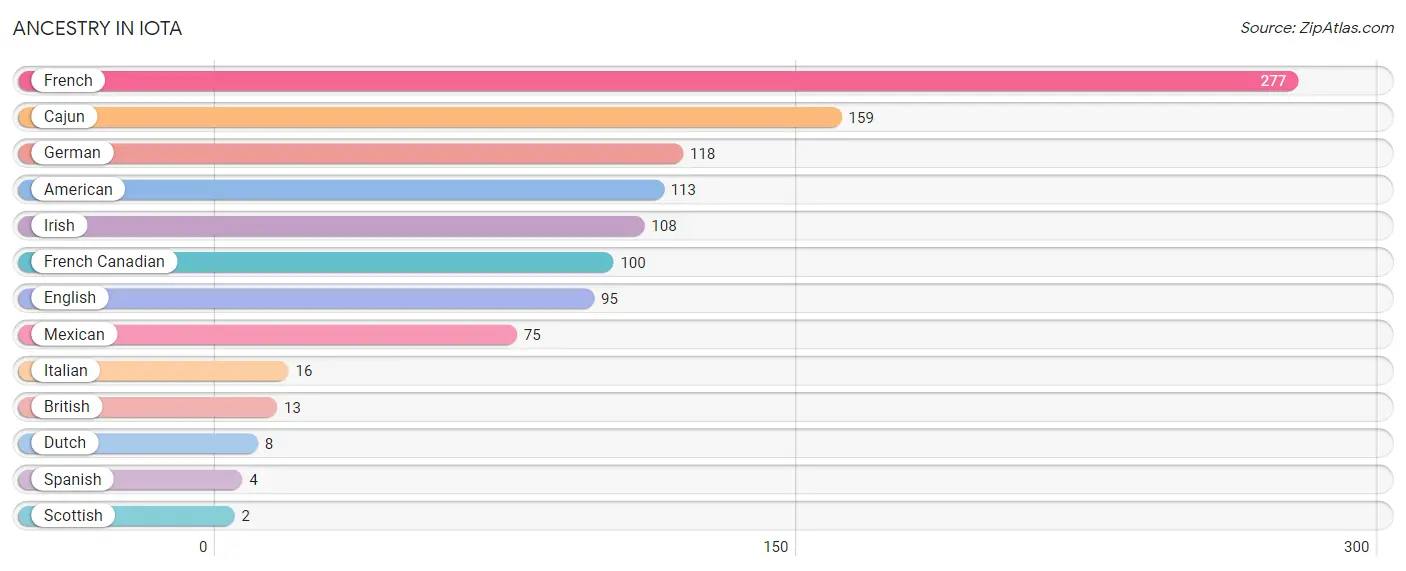
| Ancestry | # Population | % Population |
| American | 113 | 7.4% |
| British | 13 | 0.9% |
| Cajun | 159 | 10.5% |
| Dutch | 8 | 0.5% |
| English | 95 | 6.3% |
| French | 277 | 18.2% |
| French Canadian | 100 | 6.6% |
| German | 118 | 7.8% |
| Irish | 108 | 7.1% |
| Italian | 16 | 1.1% |
| Mexican | 75 | 4.9% |
| Scottish | 2 | 0.1% |
| Spanish | 4 | 0.3% | View All 13 Rows |
Immigrants in Iota
The most numerous immigrant groups reported in Iota came from Central America (27 | 1.8%), Latin America (27 | 1.8%), and Mexico (27 | 1.8%), together accounting for 5.3% of all Iota residents.
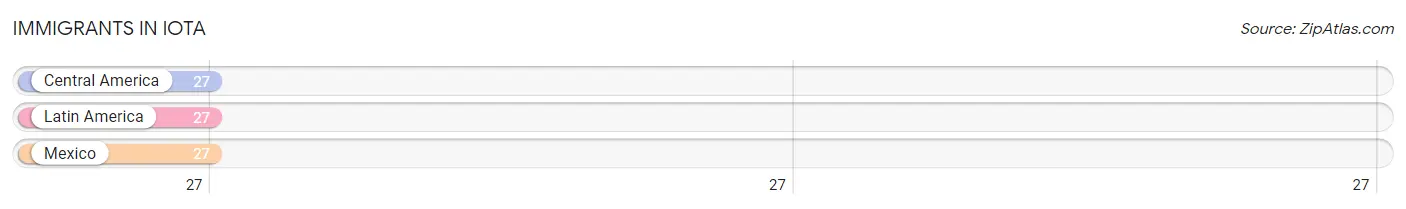
| Immigration Origin | # Population | % Population |
| Central America | 27 | 1.8% |
| Latin America | 27 | 1.8% |
| Mexico | 27 | 1.8% | View All 3 Rows |
Sex and Age in Iota
Sex and Age in Iota
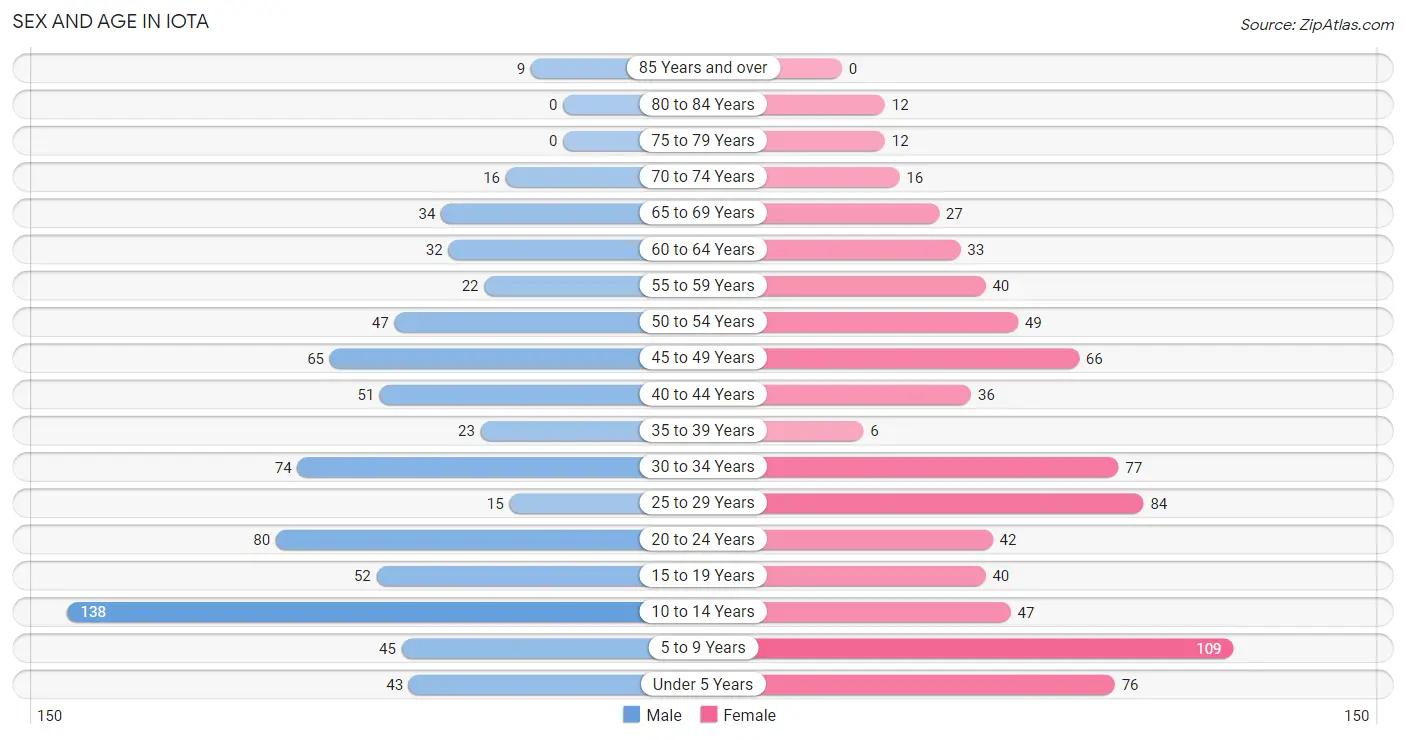
The most populous age groups in Iota are 10 to 14 Years (138 | 18.5%) for men and 5 to 9 Years (109 | 14.1%) for women.
| Age Bracket | Male | Female |
| Under 5 Years | 43 (5.8%) | 76 (9.8%) |
| 5 to 9 Years | 45 (6.0%) | 109 (14.1%) |
| 10 to 14 Years | 138 (18.5%) | 47 (6.1%) |
| 15 to 19 Years | 52 (7.0%) | 40 (5.2%) |
| 20 to 24 Years | 80 (10.7%) | 42 (5.4%) |
| 25 to 29 Years | 15 (2.0%) | 84 (10.9%) |
| 30 to 34 Years | 74 (9.9%) | 77 (10.0%) |
| 35 to 39 Years | 23 (3.1%) | 6 (0.8%) |
| 40 to 44 Years | 51 (6.8%) | 36 (4.7%) |
| 45 to 49 Years | 65 (8.7%) | 66 (8.6%) |
| 50 to 54 Years | 47 (6.3%) | 49 (6.4%) |
| 55 to 59 Years | 22 (2.9%) | 40 (5.2%) |
| 60 to 64 Years | 32 (4.3%) | 33 (4.3%) |
| 65 to 69 Years | 34 (4.6%) | 27 (3.5%) |
| 70 to 74 Years | 16 (2.1%) | 16 (2.1%) |
| 75 to 79 Years | 0 (0.0%) | 12 (1.5%) |
| 80 to 84 Years | 0 (0.0%) | 12 (1.5%) |
| 85 Years and over | 9 (1.2%) | 0 (0.0%) |
| Total | 746 (100.0%) | 772 (100.0%) |
Families and Households in Iota
Median Family Size in Iota
The median family size in Iota is 3.55 persons per family, with single female/mother families (101 | 28.1%) accounting for the largest median family size of 3.69 persons per family. On the other hand, single male/father families (4 | 1.1%) represent the smallest median family size with 2.50 persons per family.
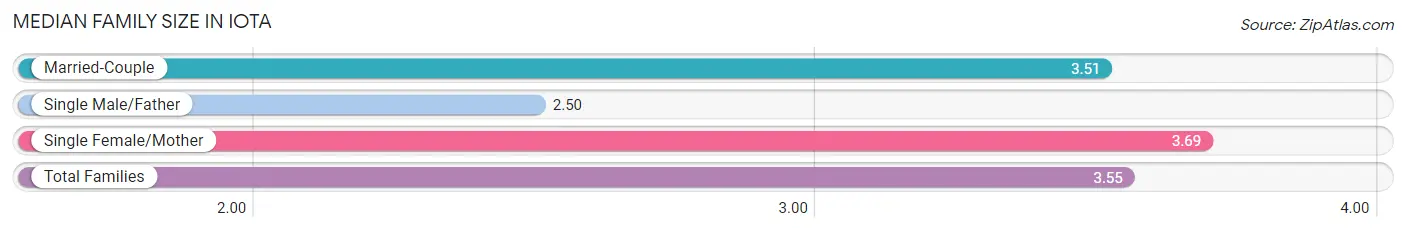
| Family Type | # Families | Family Size |
| Married-Couple | 254 (70.8%) | 3.51 |
| Single Male/Father | 4 (1.1%) | 2.50 |
| Single Female/Mother | 101 (28.1%) | 3.69 |
| Total Families | 359 (100.0%) | 3.55 |
Median Household Size in Iota
The median household size in Iota is 2.76 persons per household, with single female/mother households (101 | 18.4%) accounting for the largest median household size of 3.87 persons per household. non-family households (191 | 34.7%) represent the smallest median household size with 1.17 persons per household.
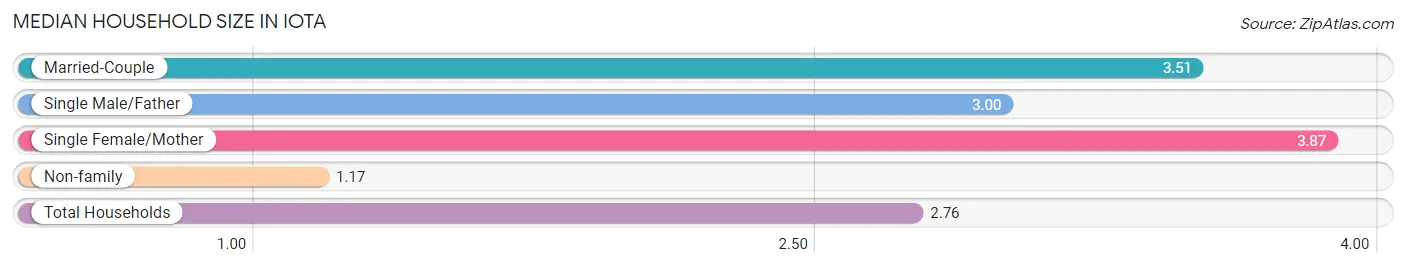
| Household Type | # Households | Household Size |
| Married-Couple | 254 (46.2%) | 3.51 |
| Single Male/Father | 4 (0.7%) | 3.00 |
| Single Female/Mother | 101 (18.4%) | 3.87 |
| Non-family | 191 (34.7%) | 1.17 |
| Total Households | 550 (100.0%) | 2.76 |
Household Size by Marriage Status in Iota
Out of a total of 550 households in Iota, 359 (65.3%) are family households, while 191 (34.7%) are nonfamily households. The most numerous type of family households are 2-person households, comprising 107, and the most common type of nonfamily households are 1-person households, comprising 161.
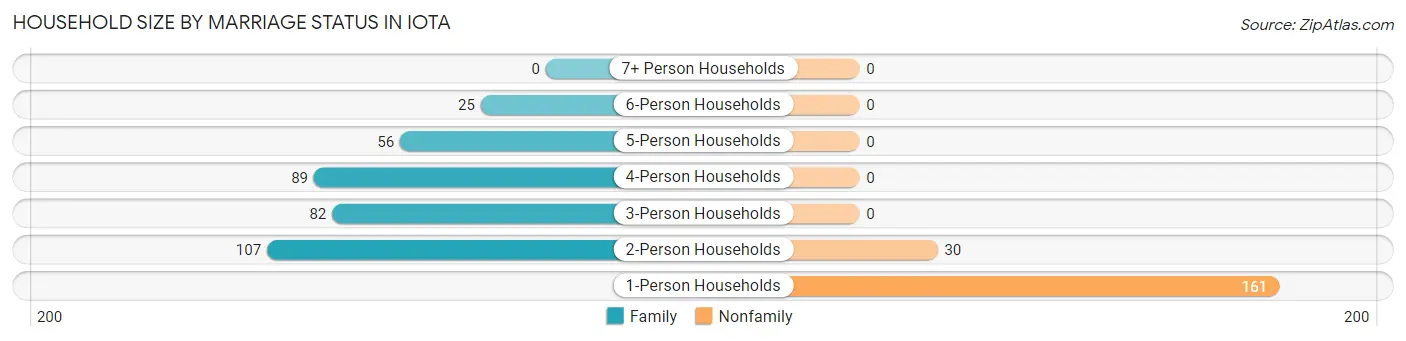
| Household Size | Family Households | Nonfamily Households |
| 1-Person Households | - | 161 (29.3%) |
| 2-Person Households | 107 (19.5%) | 30 (5.4%) |
| 3-Person Households | 82 (14.9%) | 0 (0.0%) |
| 4-Person Households | 89 (16.2%) | 0 (0.0%) |
| 5-Person Households | 56 (10.2%) | 0 (0.0%) |
| 6-Person Households | 25 (4.5%) | 0 (0.0%) |
| 7+ Person Households | 0 (0.0%) | 0 (0.0%) |
| Total | 359 (65.3%) | 191 (34.7%) |
Female Fertility in Iota
Fertility by Age in Iota
Average fertility rate in Iota is 142.0 births per 1,000 women. Women in the age bracket of 20 to 34 years have the highest fertility rate with 236.0 births per 1,000 women. Women in the age bracket of 20 to 34 years acount for 96.0% of all women with births.
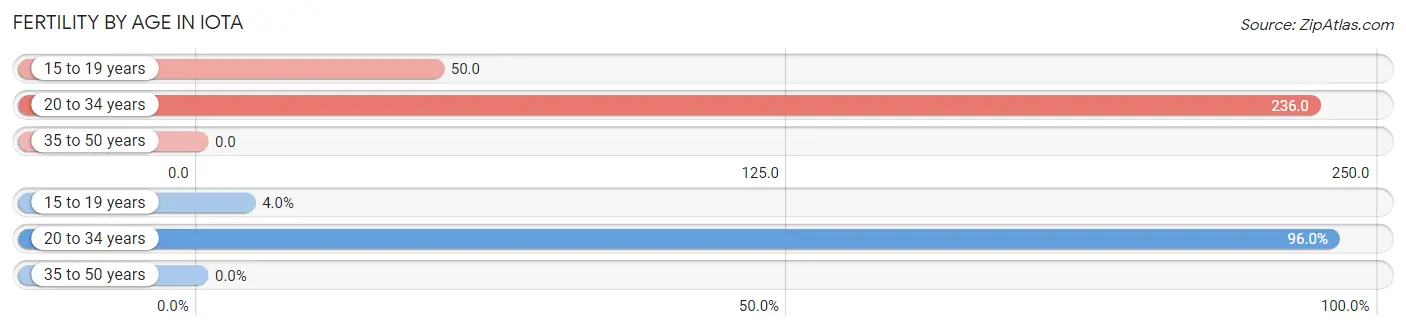
| Age Bracket | Women with Births | Births / 1,000 Women |
| 15 to 19 years | 2 (4.0%) | 50.0 |
| 20 to 34 years | 48 (96.0%) | 236.0 |
| 35 to 50 years | 0 (0.0%) | 0.0 |
| Total | 50 (100.0%) | 142.0 |
Fertility by Age by Marriage Status in Iota
96.0% of women with births (50) in Iota are married. The highest percentage of unmarried women with births falls into 15 to 19 years age bracket with 100.0% of them unmarried at the time of birth, while the lowest percentage of unmarried women with births belong to 20 to 34 years age bracket with 0.0% of them unmarried.
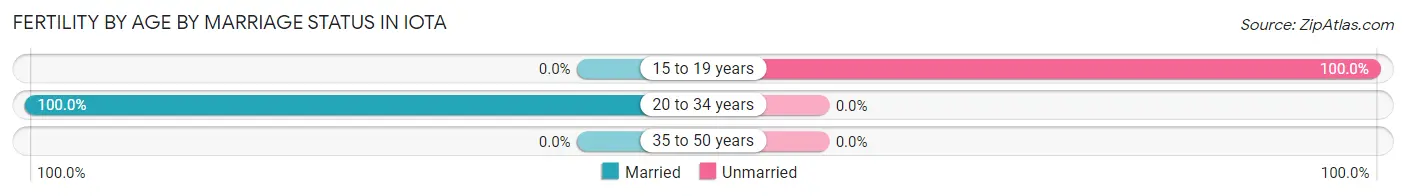
| Age Bracket | Married | Unmarried |
| 15 to 19 years | 0 (0.0%) | 2 (100.0%) |
| 20 to 34 years | 48 (100.0%) | 0 (0.0%) |
| 35 to 50 years | 0 (0.0%) | 0 (0.0%) |
| Total | 48 (96.0%) | 2 (4.0%) |
Fertility by Education in Iota
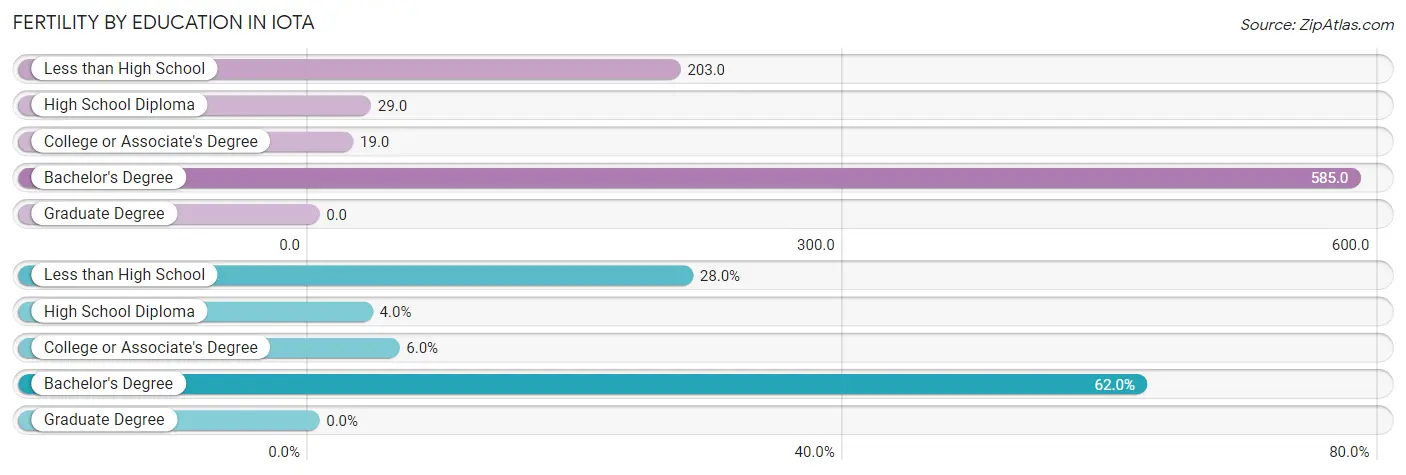
| Educational Attainment | Women with Births | Births / 1,000 Women |
| Less than High School | 14 (28.0%) | 203.0 |
| High School Diploma | 2 (4.0%) | 29.0 |
| College or Associate's Degree | 3 (6.0%) | 19.0 |
| Bachelor's Degree | 31 (62.0%) | 585.0 |
| Graduate Degree | 0 (0.0%) | 0.0 |
| Total | 50 (100.0%) | 142.0 |
Fertility by Education by Marriage Status in Iota
4.0% of women with births in Iota are unmarried. Women with the educational attainment of less than high school are most likely to be married with 100.0% of them married at childbirth, while women with the educational attainment of high school diploma are least likely to be married with 100.0% of them unmarried at childbirth.
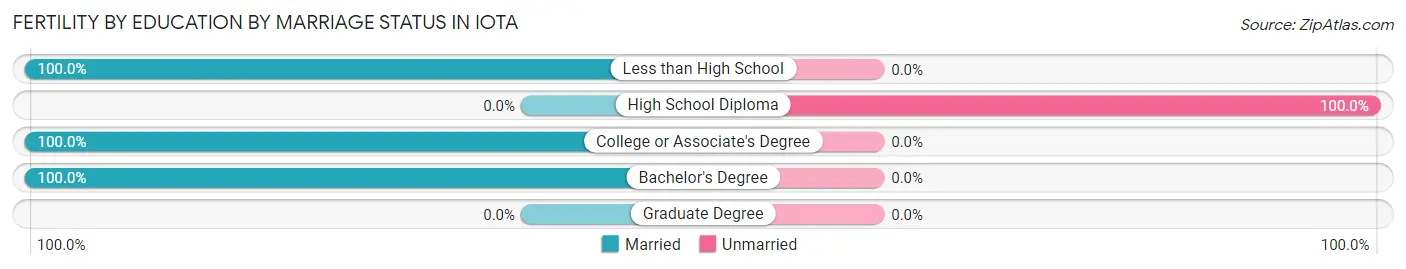
| Educational Attainment | Married | Unmarried |
| Less than High School | 14 (100.0%) | 0 (0.0%) |
| High School Diploma | 0 (0.0%) | 2 (100.0%) |
| College or Associate's Degree | 3 (100.0%) | 0 (0.0%) |
| Bachelor's Degree | 31 (100.0%) | 0 (0.0%) |
| Graduate Degree | 0 (0.0%) | 0 (0.0%) |
| Total | 48 (96.0%) | 2 (4.0%) |
Employment Characteristics in Iota
Employment by Class of Employer in Iota
Among the 599 employed individuals in Iota, private company employees (424 | 70.8%), self-employed (incorporated) (42 | 7.0%), and self-employed (not incorporated) (41 | 6.8%) make up the most common classes of employment.
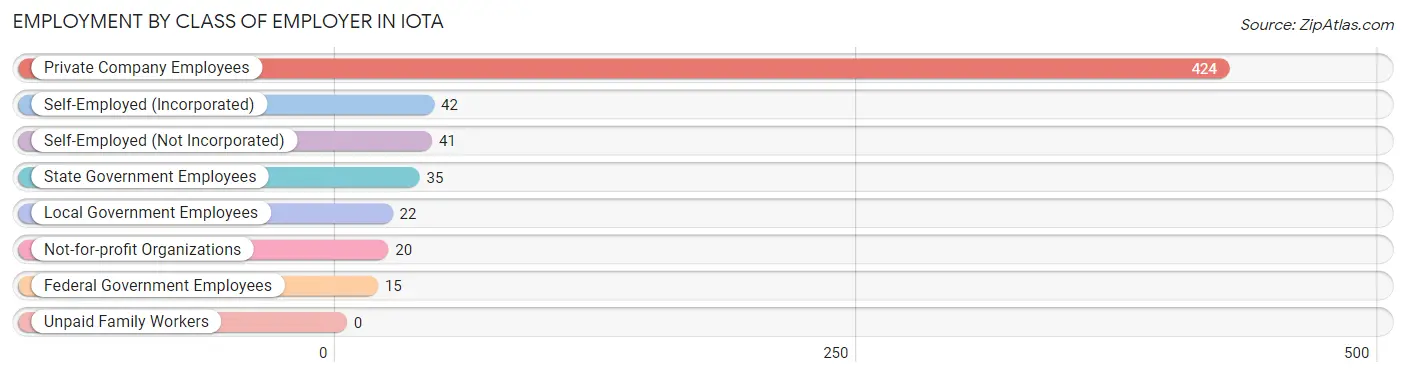
| Employer Class | # Employees | % Employees |
| Private Company Employees | 424 | 70.8% |
| Self-Employed (Incorporated) | 42 | 7.0% |
| Self-Employed (Not Incorporated) | 41 | 6.8% |
| Not-for-profit Organizations | 20 | 3.3% |
| Local Government Employees | 22 | 3.7% |
| State Government Employees | 35 | 5.8% |
| Federal Government Employees | 15 | 2.5% |
| Unpaid Family Workers | 0 | 0.0% |
| Total | 599 | 100.0% |
Employment Status by Age in Iota
According to the labor force statistics for Iota, out of the total population over 16 years of age (1,050), 61.0% or 640 individuals are in the labor force, with 5.6% or 36 of them unemployed. The age group with the highest labor force participation rate is 30 to 34 years, with 94.0% or 142 individuals in the labor force. Within the labor force, the 35 to 44 years age range has the highest percentage of unemployed individuals, with 21.8% or 19 of them being unemployed.
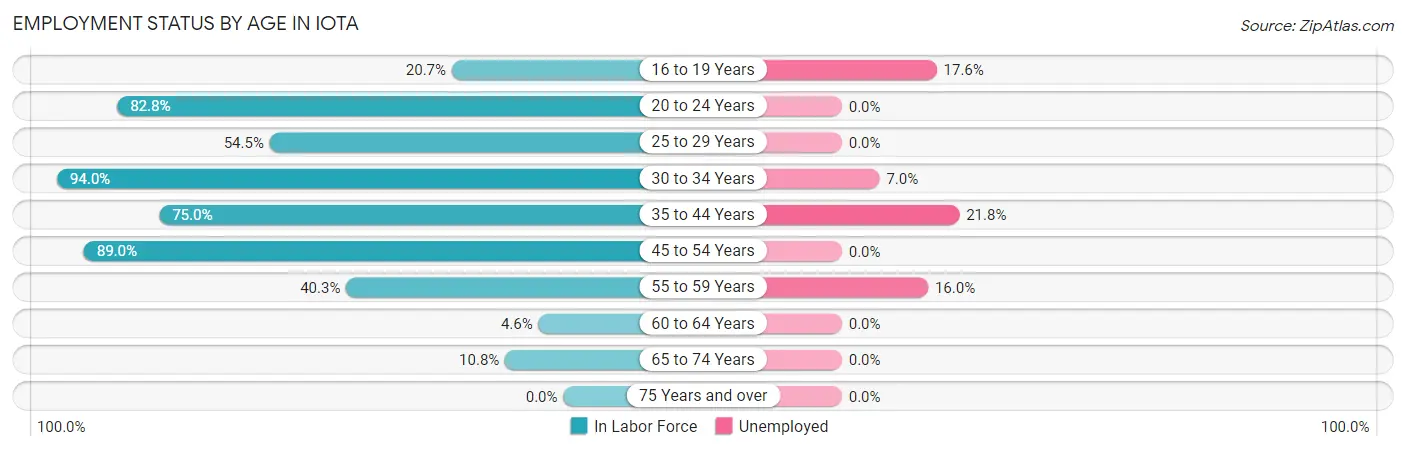
| Age Bracket | In Labor Force | Unemployed |
| 16 to 19 Years | 17 (20.7%) | 3 (17.6%) |
| 20 to 24 Years | 101 (82.8%) | 0 (0.0%) |
| 25 to 29 Years | 54 (54.5%) | 0 (0.0%) |
| 30 to 34 Years | 142 (94.0%) | 10 (7.0%) |
| 35 to 44 Years | 87 (75.0%) | 19 (21.8%) |
| 45 to 54 Years | 202 (89.0%) | 0 (0.0%) |
| 55 to 59 Years | 25 (40.3%) | 4 (16.0%) |
| 60 to 64 Years | 3 (4.6%) | 0 (0.0%) |
| 65 to 74 Years | 10 (10.8%) | 0 (0.0%) |
| 75 Years and over | 0 (0.0%) | 0 (0.0%) |
| Total | 640 (61.0%) | 36 (5.6%) |
Employment Status by Educational Attainment in Iota
According to labor force statistics for Iota, 71.3% of individuals (513) out of the total population between 25 and 64 years of age (720) are in the labor force, with 6.4% or 33 of them being unemployed. The group with the highest labor force participation rate are those with the educational attainment of college / associate degree, with 92.1% or 223 individuals in the labor force. Within the labor force, individuals with college / associate degree education have the highest percentage of unemployment, with 15.2% or 34 of them being unemployed.
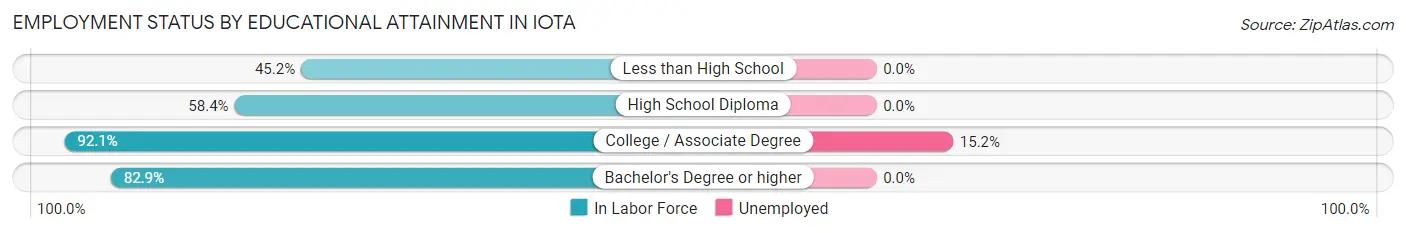
| Educational Attainment | In Labor Force | Unemployed |
| Less than High School | 61 (45.2%) | 0 (0.0%) |
| High School Diploma | 132 (58.4%) | 0 (0.0%) |
| College / Associate Degree | 223 (92.1%) | 37 (15.2%) |
| Bachelor's Degree or higher | 97 (82.9%) | 0 (0.0%) |
| Total | 513 (71.3%) | 46 (6.4%) |
Employment Occupations by Sex in Iota
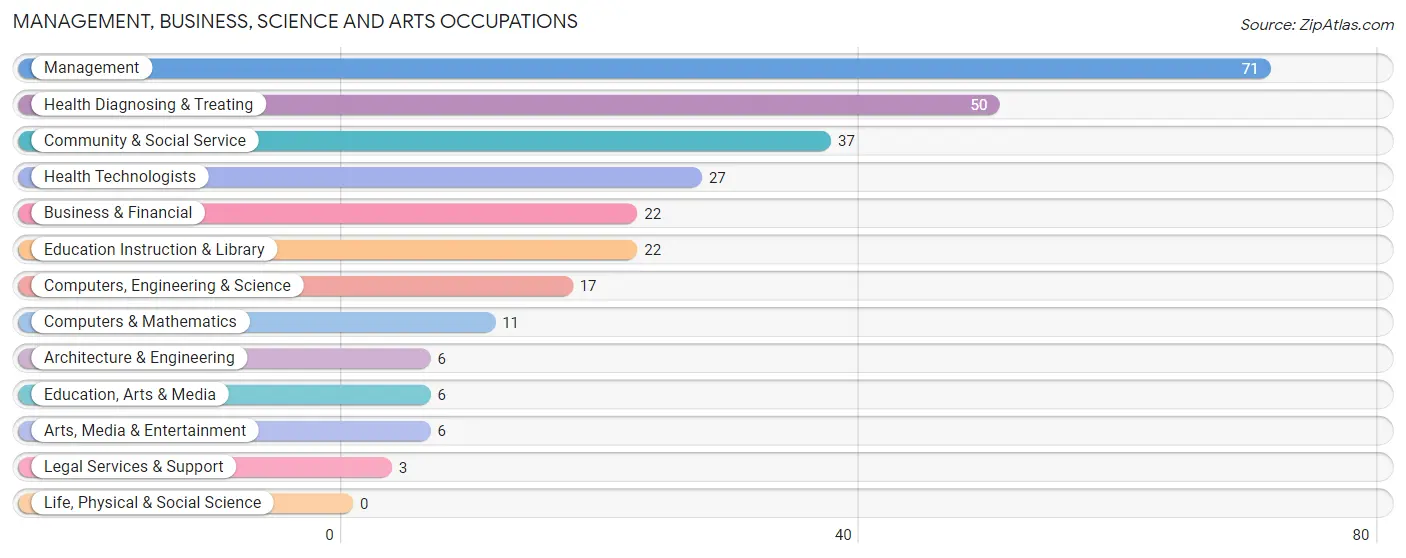
Management, Business, Science and Arts Occupations
The most common Management, Business, Science and Arts occupations in Iota are Management (71 | 12.0%), Health Diagnosing & Treating (50 | 8.4%), Community & Social Service (37 | 6.2%), Health Technologists (27 | 4.5%), and Business & Financial (22 | 3.7%).
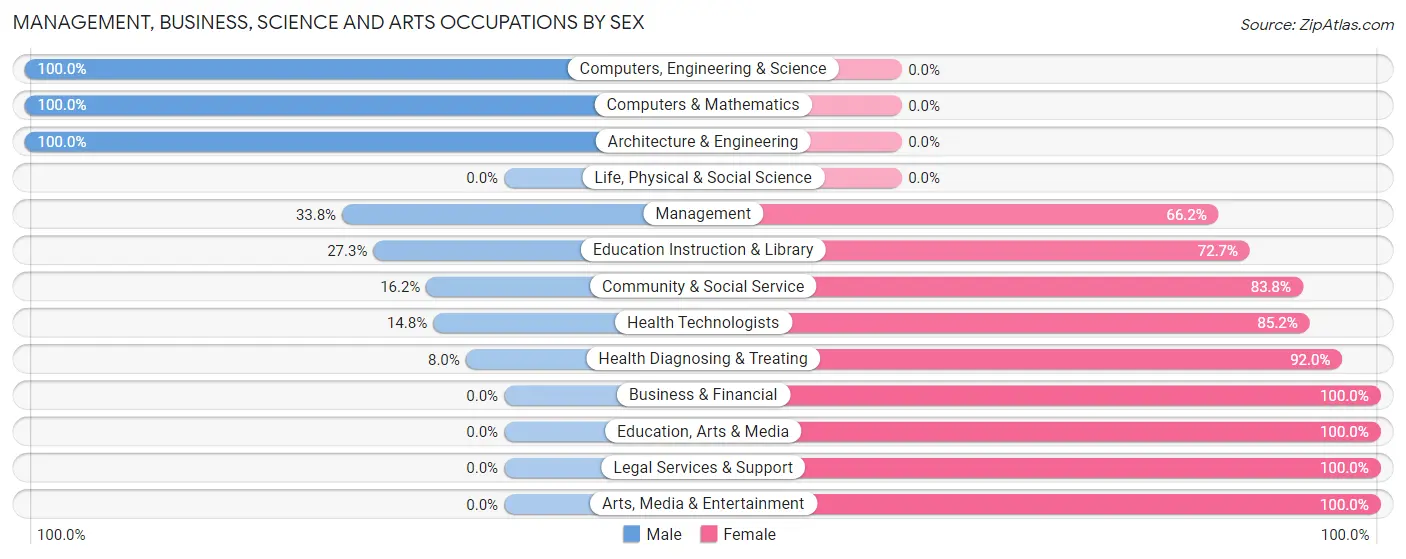
Management, Business, Science and Arts Occupations by Sex
Within the Management, Business, Science and Arts occupations in Iota, the most male-oriented occupations are Computers, Engineering & Science (100.0%), Computers & Mathematics (100.0%), and Architecture & Engineering (100.0%), while the most female-oriented occupations are Business & Financial (100.0%), Education, Arts & Media (100.0%), and Legal Services & Support (100.0%).
| Occupation | Male | Female |
| Management | 24 (33.8%) | 47 (66.2%) |
| Business & Financial | 0 (0.0%) | 22 (100.0%) |
| Computers, Engineering & Science | 17 (100.0%) | 0 (0.0%) |
| Computers & Mathematics | 11 (100.0%) | 0 (0.0%) |
| Architecture & Engineering | 6 (100.0%) | 0 (0.0%) |
| Life, Physical & Social Science | 0 (0.0%) | 0 (0.0%) |
| Community & Social Service | 6 (16.2%) | 31 (83.8%) |
| Education, Arts & Media | 0 (0.0%) | 6 (100.0%) |
| Legal Services & Support | 0 (0.0%) | 3 (100.0%) |
| Education Instruction & Library | 6 (27.3%) | 16 (72.7%) |
| Arts, Media & Entertainment | 0 (0.0%) | 6 (100.0%) |
| Health Diagnosing & Treating | 4 (8.0%) | 46 (92.0%) |
| Health Technologists | 4 (14.8%) | 23 (85.2%) |
| Total (Category) | 51 (25.9%) | 146 (74.1%) |
| Total (Overall) | 289 (48.7%) | 304 (51.3%) |
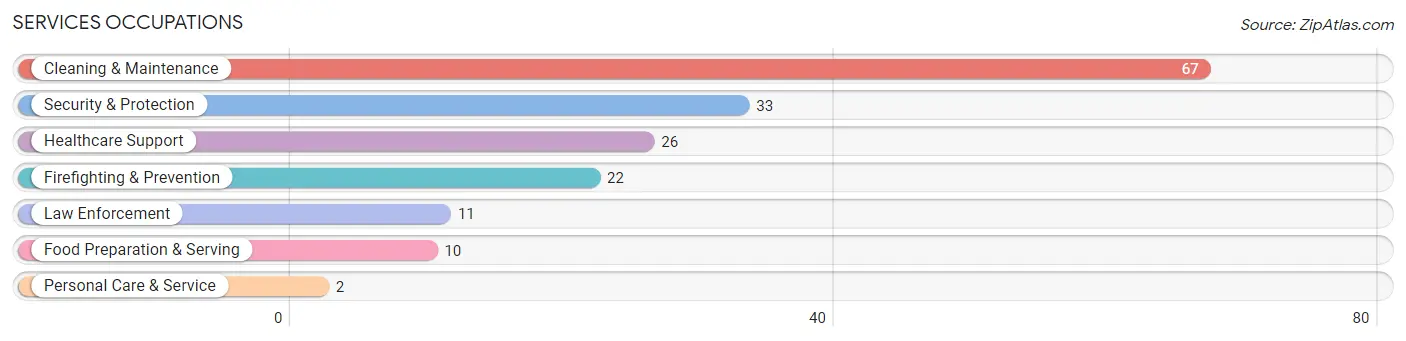
Services Occupations
The most common Services occupations in Iota are Cleaning & Maintenance (67 | 11.3%), Security & Protection (33 | 5.6%), Healthcare Support (26 | 4.4%), Firefighting & Prevention (22 | 3.7%), and Law Enforcement (11 | 1.8%).
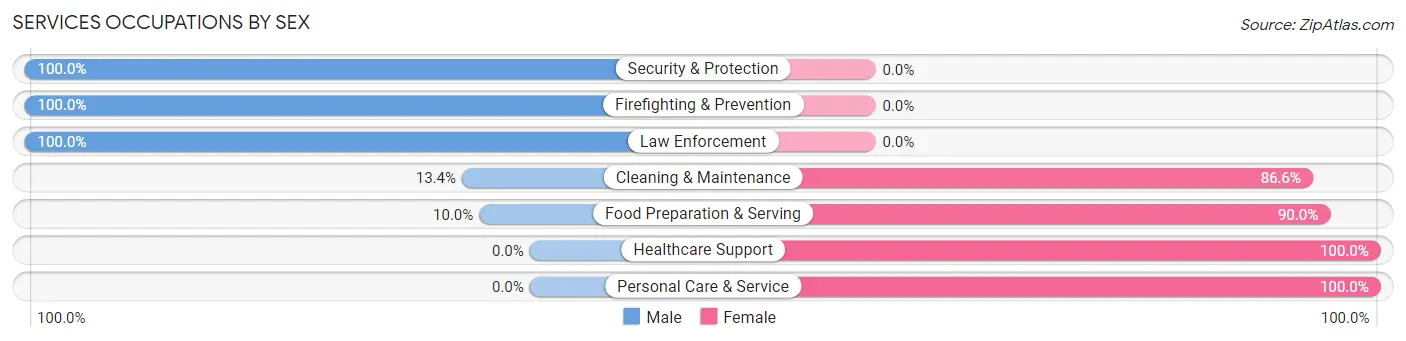
Services Occupations by Sex
Within the Services occupations in Iota, the most male-oriented occupations are Security & Protection (100.0%), Firefighting & Prevention (100.0%), and Law Enforcement (100.0%), while the most female-oriented occupations are Healthcare Support (100.0%), Personal Care & Service (100.0%), and Food Preparation & Serving (90.0%).
| Occupation | Male | Female |
| Healthcare Support | 0 (0.0%) | 26 (100.0%) |
| Security & Protection | 33 (100.0%) | 0 (0.0%) |
| Firefighting & Prevention | 22 (100.0%) | 0 (0.0%) |
| Law Enforcement | 11 (100.0%) | 0 (0.0%) |
| Food Preparation & Serving | 1 (10.0%) | 9 (90.0%) |
| Cleaning & Maintenance | 9 (13.4%) | 58 (86.6%) |
| Personal Care & Service | 0 (0.0%) | 2 (100.0%) |
| Total (Category) | 43 (31.2%) | 95 (68.8%) |
| Total (Overall) | 289 (48.7%) | 304 (51.3%) |
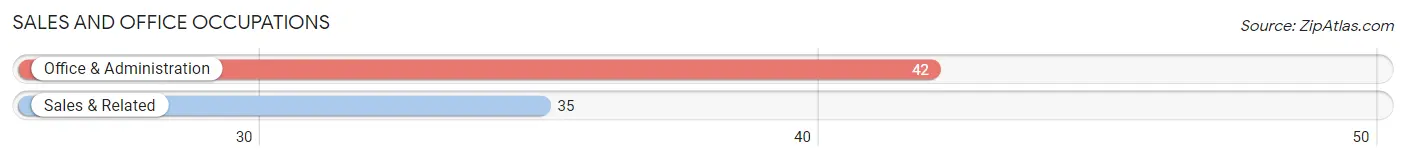
Sales and Office Occupations
The most common Sales and Office occupations in Iota are Office & Administration (42 | 7.1%), and Sales & Related (35 | 5.9%).
Sales and Office Occupations by Sex
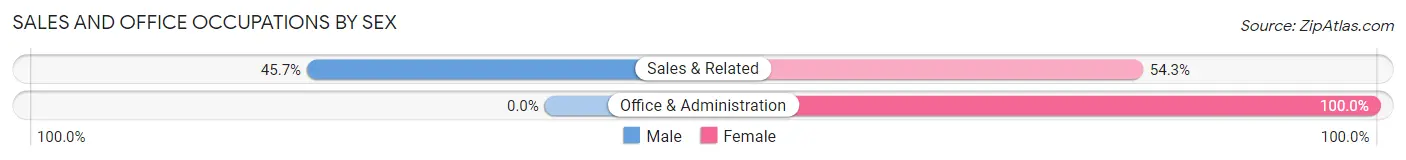
| Occupation | Male | Female |
| Sales & Related | 16 (45.7%) | 19 (54.3%) |
| Office & Administration | 0 (0.0%) | 42 (100.0%) |
| Total (Category) | 16 (20.8%) | 61 (79.2%) |
| Total (Overall) | 289 (48.7%) | 304 (51.3%) |
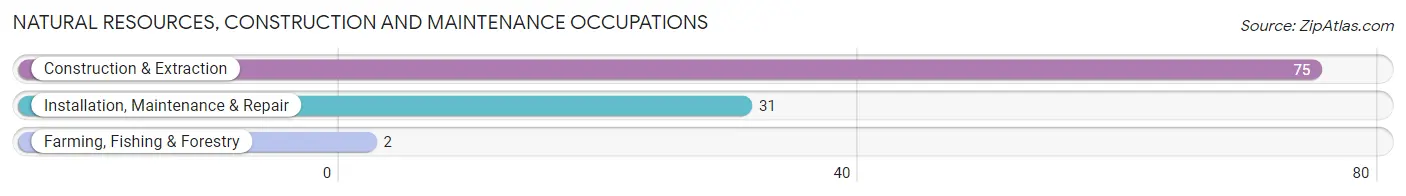
Natural Resources, Construction and Maintenance Occupations
The most common Natural Resources, Construction and Maintenance occupations in Iota are Construction & Extraction (75 | 12.7%), Installation, Maintenance & Repair (31 | 5.2%), and Farming, Fishing & Forestry (2 | 0.3%).
Natural Resources, Construction and Maintenance Occupations by Sex
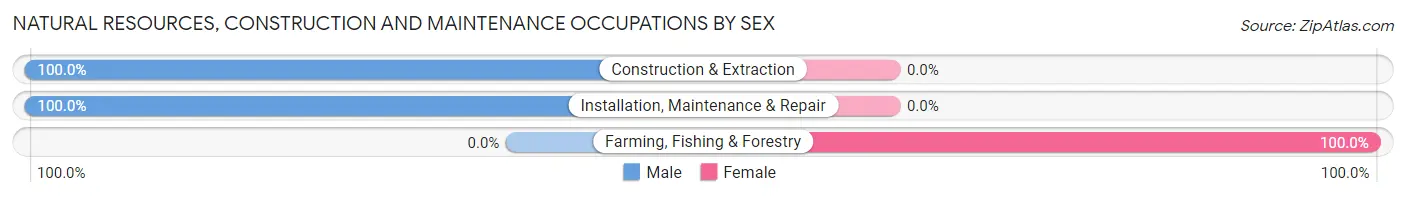
| Occupation | Male | Female |
| Farming, Fishing & Forestry | 0 (0.0%) | 2 (100.0%) |
| Construction & Extraction | 75 (100.0%) | 0 (0.0%) |
| Installation, Maintenance & Repair | 31 (100.0%) | 0 (0.0%) |
| Total (Category) | 106 (98.2%) | 2 (1.8%) |
| Total (Overall) | 289 (48.7%) | 304 (51.3%) |
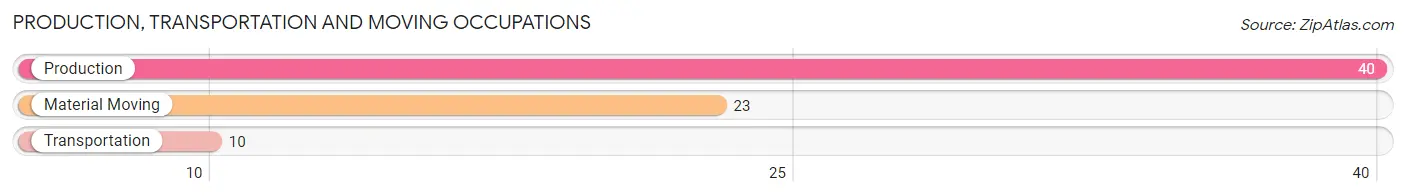
Production, Transportation and Moving Occupations
The most common Production, Transportation and Moving occupations in Iota are Production (40 | 6.8%), Material Moving (23 | 3.9%), and Transportation (10 | 1.7%).
Production, Transportation and Moving Occupations by Sex
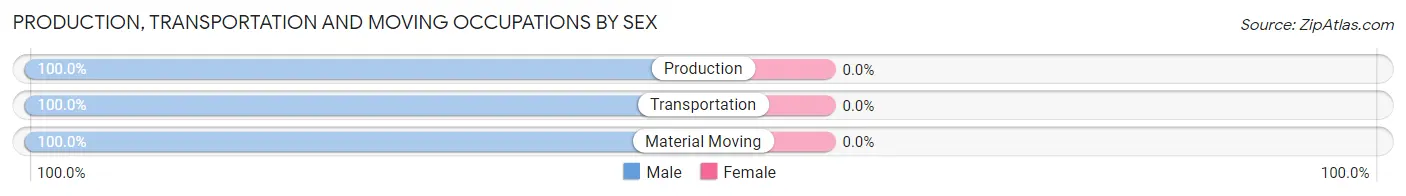
| Occupation | Male | Female |
| Production | 40 (100.0%) | 0 (0.0%) |
| Transportation | 10 (100.0%) | 0 (0.0%) |
| Material Moving | 23 (100.0%) | 0 (0.0%) |
| Total (Category) | 73 (100.0%) | 0 (0.0%) |
| Total (Overall) | 289 (48.7%) | 304 (51.3%) |
Employment Industries by Sex in Iota
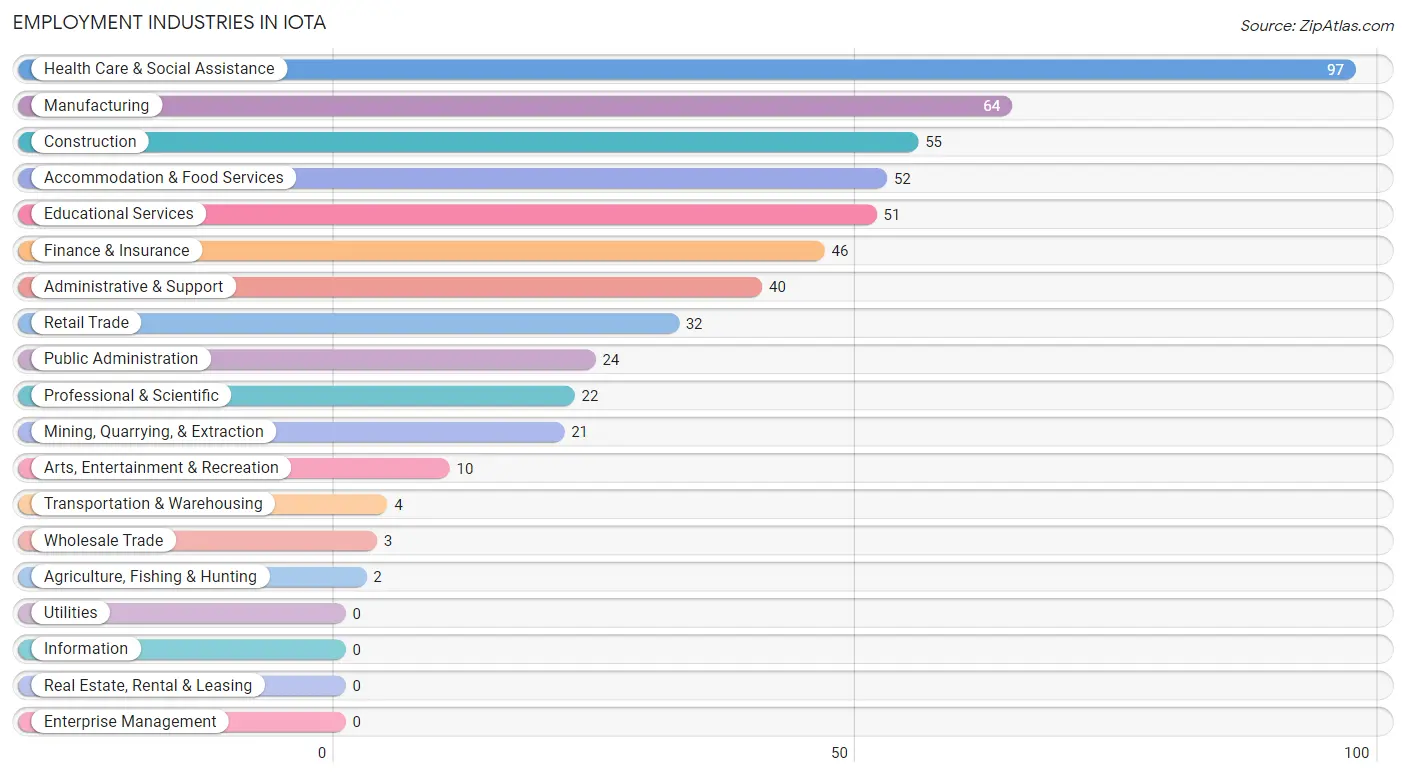
Employment Industries in Iota
The major employment industries in Iota include Health Care & Social Assistance (97 | 16.4%), Manufacturing (64 | 10.8%), Construction (55 | 9.3%), Accommodation & Food Services (52 | 8.8%), and Educational Services (51 | 8.6%).
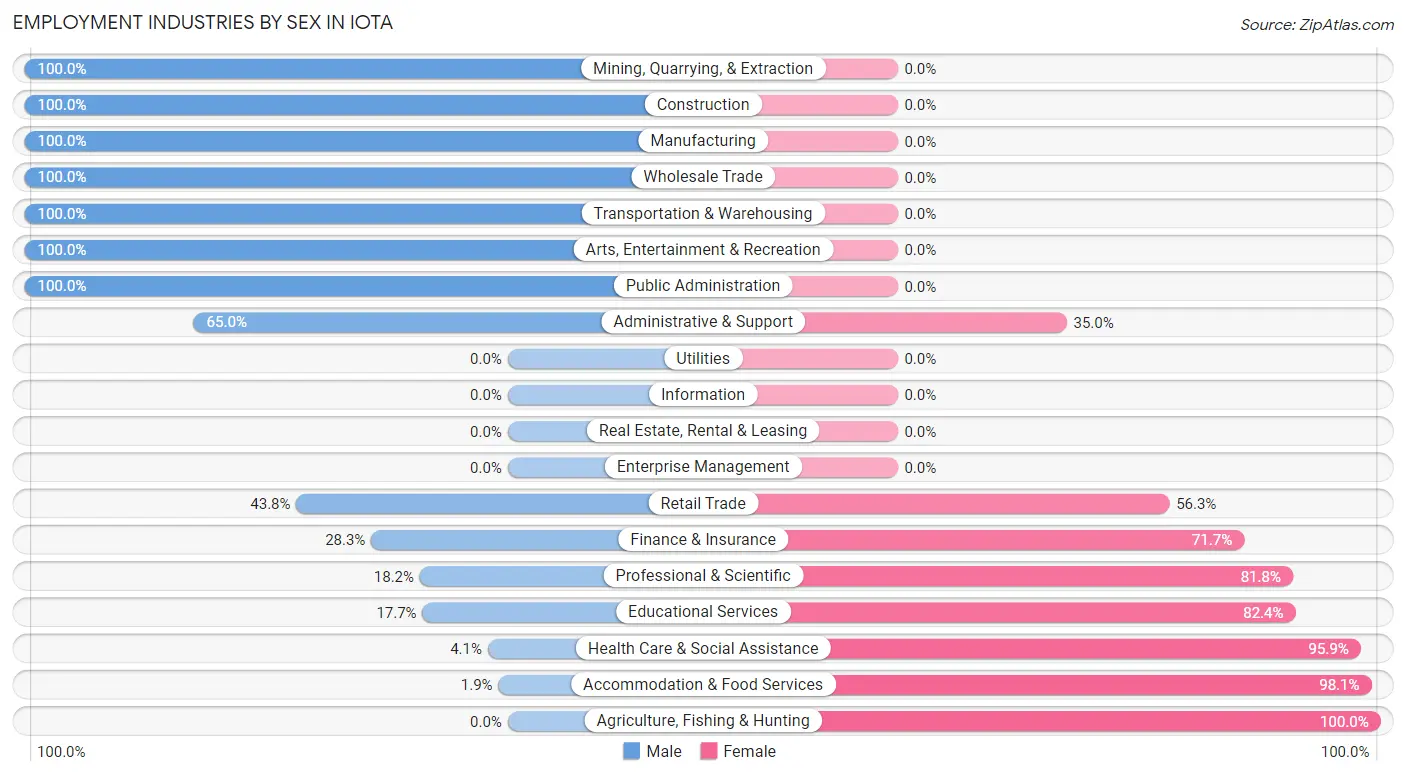
Employment Industries by Sex in Iota
The Iota industries that see more men than women are Mining, Quarrying, & Extraction (100.0%), Construction (100.0%), and Manufacturing (100.0%), whereas the industries that tend to have a higher number of women are Agriculture, Fishing & Hunting (100.0%), Accommodation & Food Services (98.1%), and Health Care & Social Assistance (95.9%).
| Industry | Male | Female |
| Agriculture, Fishing & Hunting | 0 (0.0%) | 2 (100.0%) |
| Mining, Quarrying, & Extraction | 21 (100.0%) | 0 (0.0%) |
| Construction | 55 (100.0%) | 0 (0.0%) |
| Manufacturing | 64 (100.0%) | 0 (0.0%) |
| Wholesale Trade | 3 (100.0%) | 0 (0.0%) |
| Retail Trade | 14 (43.8%) | 18 (56.2%) |
| Transportation & Warehousing | 4 (100.0%) | 0 (0.0%) |
| Utilities | 0 (0.0%) | 0 (0.0%) |
| Information | 0 (0.0%) | 0 (0.0%) |
| Finance & Insurance | 13 (28.3%) | 33 (71.7%) |
| Real Estate, Rental & Leasing | 0 (0.0%) | 0 (0.0%) |
| Professional & Scientific | 4 (18.2%) | 18 (81.8%) |
| Enterprise Management | 0 (0.0%) | 0 (0.0%) |
| Administrative & Support | 26 (65.0%) | 14 (35.0%) |
| Educational Services | 9 (17.6%) | 42 (82.4%) |
| Health Care & Social Assistance | 4 (4.1%) | 93 (95.9%) |
| Arts, Entertainment & Recreation | 10 (100.0%) | 0 (0.0%) |
| Accommodation & Food Services | 1 (1.9%) | 51 (98.1%) |
| Public Administration | 24 (100.0%) | 0 (0.0%) |
| Total | 289 (48.7%) | 304 (51.3%) |
Education in Iota
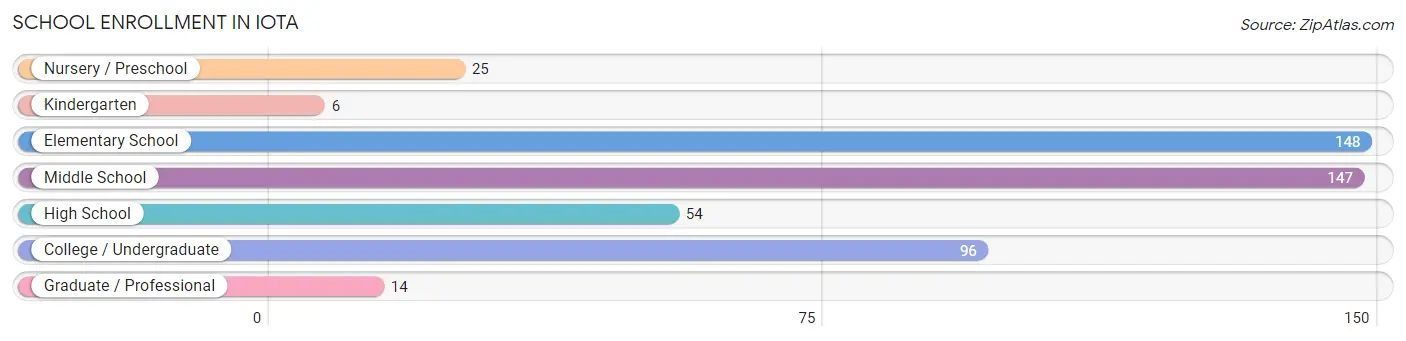
School Enrollment in Iota
The most common levels of schooling among the 490 students in Iota are elementary school (148 | 30.2%), middle school (147 | 30.0%), and college / undergraduate (96 | 19.6%).
| School Level | # Students | % Students |
| Nursery / Preschool | 25 | 5.1% |
| Kindergarten | 6 | 1.2% |
| Elementary School | 148 | 30.2% |
| Middle School | 147 | 30.0% |
| High School | 54 | 11.0% |
| College / Undergraduate | 96 | 19.6% |
| Graduate / Professional | 14 | 2.9% |
| Total | 490 | 100.0% |
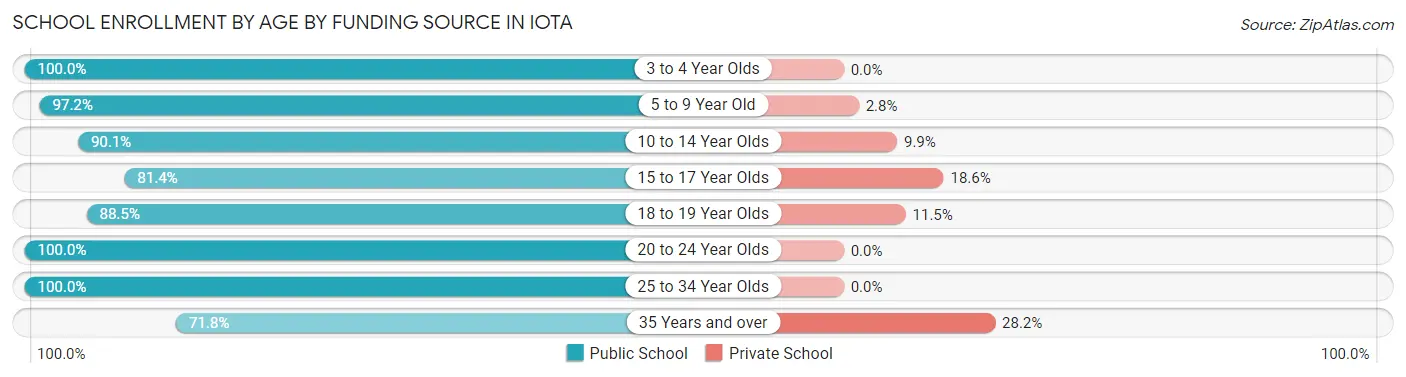
School Enrollment by Age by Funding Source in Iota
Out of a total of 490 students who are enrolled in schools in Iota, 44 (9.0%) attend a private institution, while the remaining 446 (91.0%) are enrolled in public schools. The age group of 35 years and over has the highest likelihood of being enrolled in private schools, with 11 (28.2% in the age bracket) enrolled. Conversely, the age group of 3 to 4 year olds has the lowest likelihood of being enrolled in a private school, with 2 (100.0% in the age bracket) attending a public institution.
| Age Bracket | Public School | Private School |
| 3 to 4 Year Olds | 2 (100.0%) | 0 (0.0%) |
| 5 to 9 Year Old | 139 (97.2%) | 4 (2.8%) |
| 10 to 14 Year Olds | 163 (90.1%) | 18 (9.9%) |
| 15 to 17 Year Olds | 35 (81.4%) | 8 (18.6%) |
| 18 to 19 Year Olds | 23 (88.5%) | 3 (11.5%) |
| 20 to 24 Year Olds | 45 (100.0%) | 0 (0.0%) |
| 25 to 34 Year Olds | 11 (100.0%) | 0 (0.0%) |
| 35 Years and over | 28 (71.8%) | 11 (28.2%) |
| Total | 446 (91.0%) | 44 (9.0%) |
Educational Attainment by Field of Study in Iota
Business (44 | 30.3%), education (32 | 22.1%), science & technology (23 | 15.9%), liberal arts & history (18 | 12.4%), and psychology (14 | 9.7%) are the most common fields of study among 145 individuals in Iota who have obtained a bachelor's degree or higher.
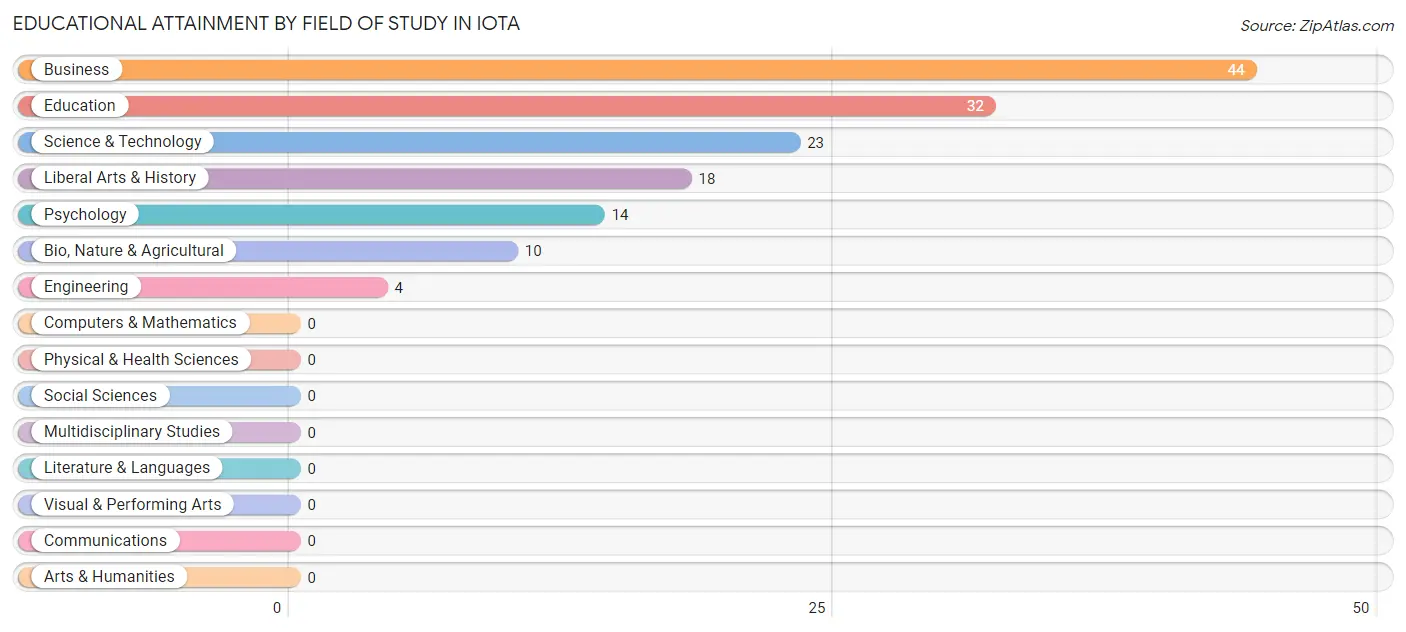
| Field of Study | # Graduates | % Graduates |
| Computers & Mathematics | 0 | 0.0% |
| Bio, Nature & Agricultural | 10 | 6.9% |
| Physical & Health Sciences | 0 | 0.0% |
| Psychology | 14 | 9.7% |
| Social Sciences | 0 | 0.0% |
| Engineering | 4 | 2.8% |
| Multidisciplinary Studies | 0 | 0.0% |
| Science & Technology | 23 | 15.9% |
| Business | 44 | 30.3% |
| Education | 32 | 22.1% |
| Literature & Languages | 0 | 0.0% |
| Liberal Arts & History | 18 | 12.4% |
| Visual & Performing Arts | 0 | 0.0% |
| Communications | 0 | 0.0% |
| Arts & Humanities | 0 | 0.0% |
| Total | 145 | 100.0% |
Transportation & Commute in Iota
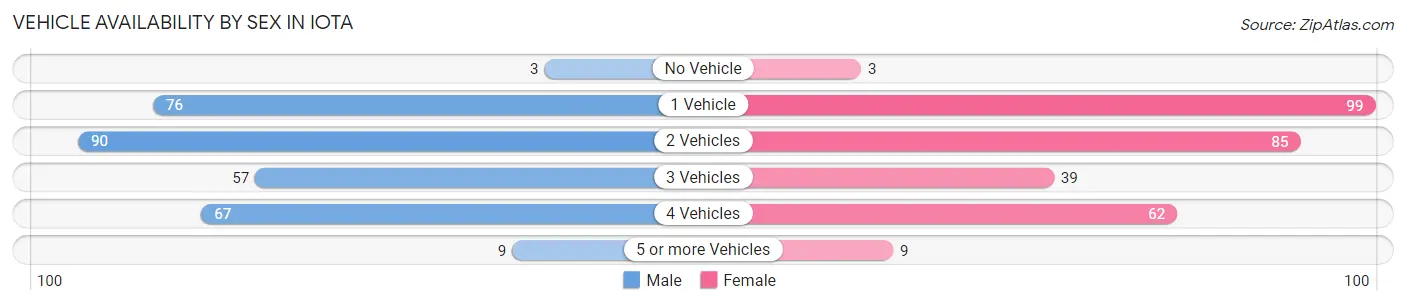
Vehicle Availability by Sex in Iota
The most prevalent vehicle ownership categories in Iota are males with 2 vehicles (90, accounting for 29.8%) and females with 2 vehicles (85, making up 30.3%).
| Vehicles Available | Male | Female |
| No Vehicle | 3 (1.0%) | 3 (1.0%) |
| 1 Vehicle | 76 (25.2%) | 99 (33.3%) |
| 2 Vehicles | 90 (29.8%) | 85 (28.6%) |
| 3 Vehicles | 57 (18.9%) | 39 (13.1%) |
| 4 Vehicles | 67 (22.2%) | 62 (20.9%) |
| 5 or more Vehicles | 9 (3.0%) | 9 (3.0%) |
| Total | 302 (100.0%) | 297 (100.0%) |
Commute Time in Iota
The most frequently occuring commute durations in Iota are 20 to 24 minutes (92 commuters, 17.6%), 60 to 89 minutes (92 commuters, 17.6%), and 30 to 34 minutes (76 commuters, 14.5%).
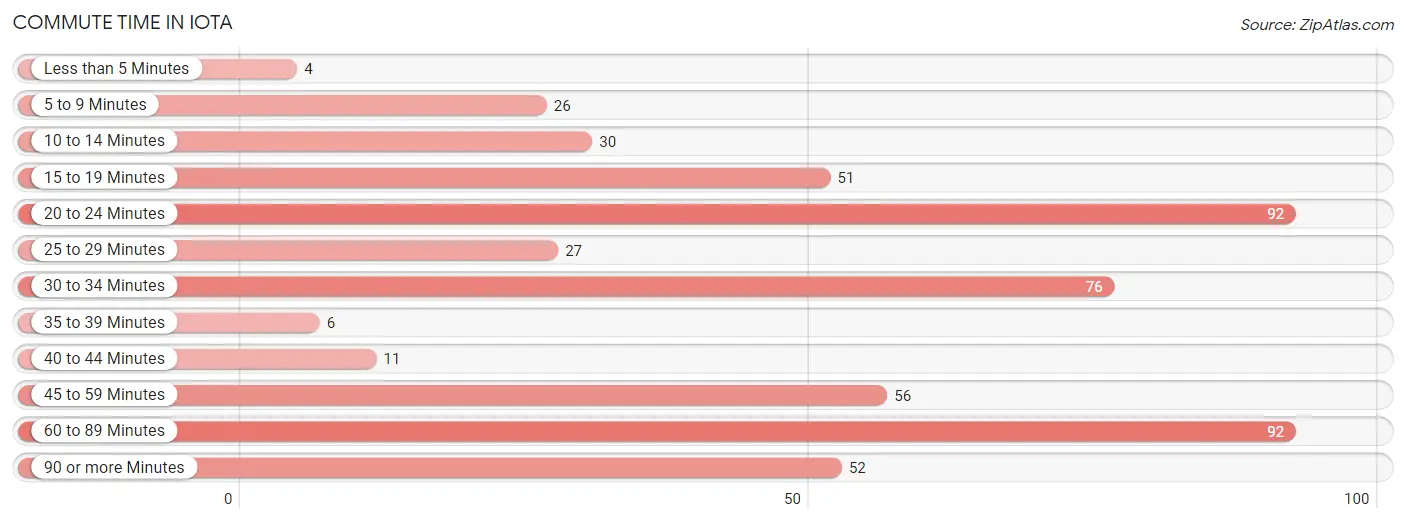
| Commute Time | # Commuters | % Commuters |
| Less than 5 Minutes | 4 | 0.8% |
| 5 to 9 Minutes | 26 | 5.0% |
| 10 to 14 Minutes | 30 | 5.7% |
| 15 to 19 Minutes | 51 | 9.8% |
| 20 to 24 Minutes | 92 | 17.6% |
| 25 to 29 Minutes | 27 | 5.2% |
| 30 to 34 Minutes | 76 | 14.5% |
| 35 to 39 Minutes | 6 | 1.1% |
| 40 to 44 Minutes | 11 | 2.1% |
| 45 to 59 Minutes | 56 | 10.7% |
| 60 to 89 Minutes | 92 | 17.6% |
| 90 or more Minutes | 52 | 9.9% |
Commute Time by Sex in Iota
The most common commute times in Iota are 60 to 89 minutes (57 commuters, 22.3%) for males and 20 to 24 minutes (65 commuters, 24.3%) for females.
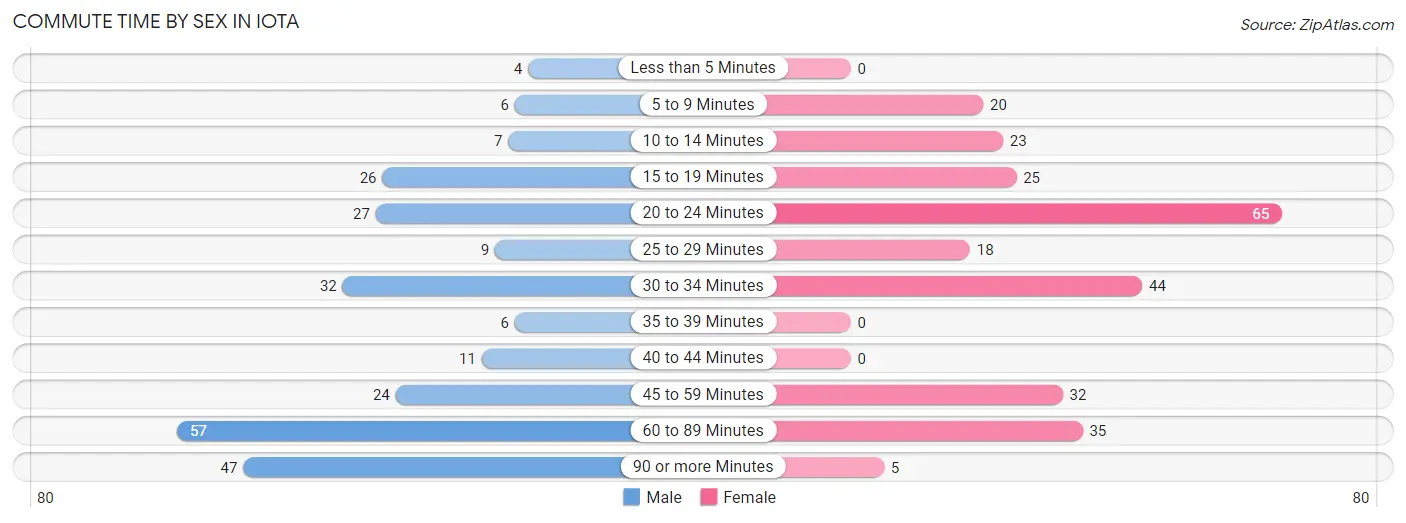
| Commute Time | Male | Female |
| Less than 5 Minutes | 4 (1.6%) | 0 (0.0%) |
| 5 to 9 Minutes | 6 (2.3%) | 20 (7.5%) |
| 10 to 14 Minutes | 7 (2.7%) | 23 (8.6%) |
| 15 to 19 Minutes | 26 (10.2%) | 25 (9.4%) |
| 20 to 24 Minutes | 27 (10.5%) | 65 (24.3%) |
| 25 to 29 Minutes | 9 (3.5%) | 18 (6.7%) |
| 30 to 34 Minutes | 32 (12.5%) | 44 (16.5%) |
| 35 to 39 Minutes | 6 (2.3%) | 0 (0.0%) |
| 40 to 44 Minutes | 11 (4.3%) | 0 (0.0%) |
| 45 to 59 Minutes | 24 (9.4%) | 32 (12.0%) |
| 60 to 89 Minutes | 57 (22.3%) | 35 (13.1%) |
| 90 or more Minutes | 47 (18.4%) | 5 (1.9%) |
Time of Departure to Work by Sex in Iota
The most frequent times of departure to work in Iota are 5:00 AM to 5:29 AM (69, 27.0%) for males and 7:00 AM to 7:29 AM (62, 23.2%) for females.
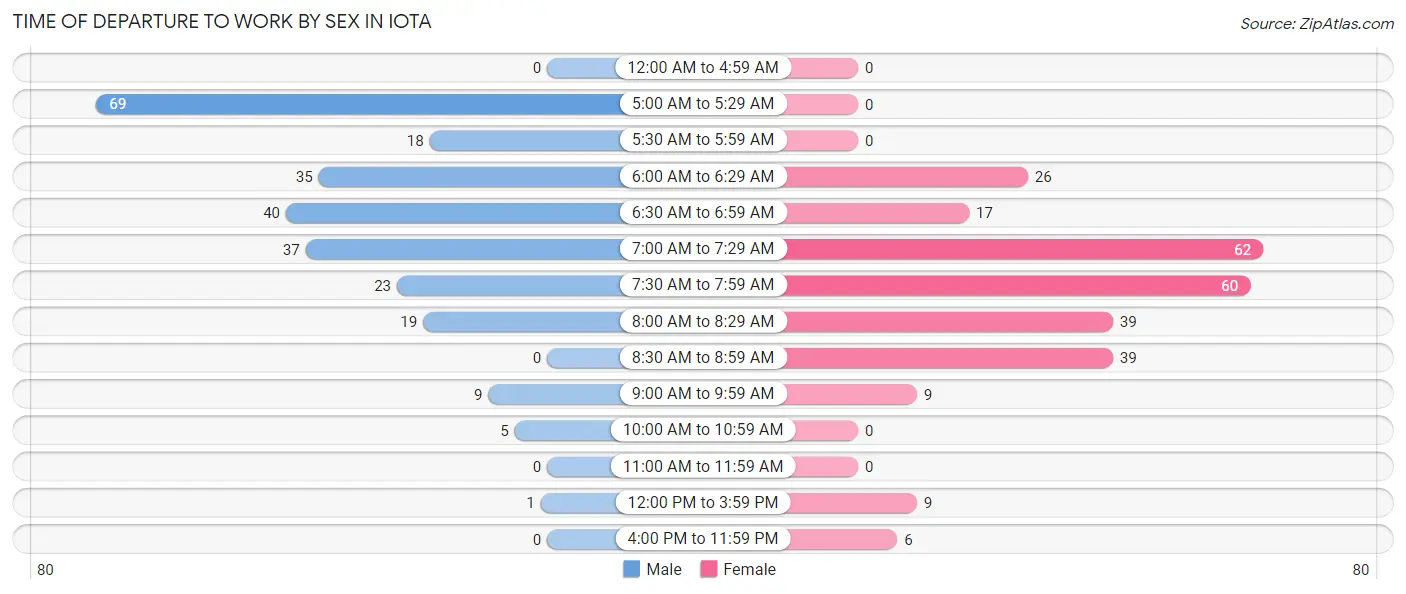
| Time of Departure | Male | Female |
| 12:00 AM to 4:59 AM | 0 (0.0%) | 0 (0.0%) |
| 5:00 AM to 5:29 AM | 69 (27.0%) | 0 (0.0%) |
| 5:30 AM to 5:59 AM | 18 (7.0%) | 0 (0.0%) |
| 6:00 AM to 6:29 AM | 35 (13.7%) | 26 (9.7%) |
| 6:30 AM to 6:59 AM | 40 (15.6%) | 17 (6.4%) |
| 7:00 AM to 7:29 AM | 37 (14.4%) | 62 (23.2%) |
| 7:30 AM to 7:59 AM | 23 (9.0%) | 60 (22.5%) |
| 8:00 AM to 8:29 AM | 19 (7.4%) | 39 (14.6%) |
| 8:30 AM to 8:59 AM | 0 (0.0%) | 39 (14.6%) |
| 9:00 AM to 9:59 AM | 9 (3.5%) | 9 (3.4%) |
| 10:00 AM to 10:59 AM | 5 (1.9%) | 0 (0.0%) |
| 11:00 AM to 11:59 AM | 0 (0.0%) | 0 (0.0%) |
| 12:00 PM to 3:59 PM | 1 (0.4%) | 9 (3.4%) |
| 4:00 PM to 11:59 PM | 0 (0.0%) | 6 (2.2%) |
| Total | 256 (100.0%) | 267 (100.0%) |
Housing Occupancy in Iota
Occupancy by Ownership in Iota
Of the total 550 dwellings in Iota, owner-occupied units account for 302 (54.9%), while renter-occupied units make up 248 (45.1%).
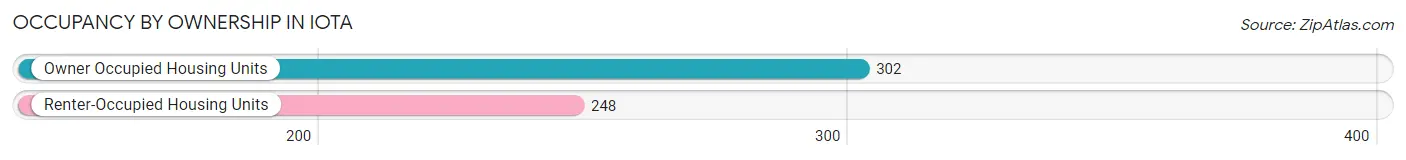
| Occupancy | # Housing Units | % Housing Units |
| Owner Occupied Housing Units | 302 | 54.9% |
| Renter-Occupied Housing Units | 248 | 45.1% |
| Total Occupied Housing Units | 550 | 100.0% |
Occupancy by Household Size in Iota
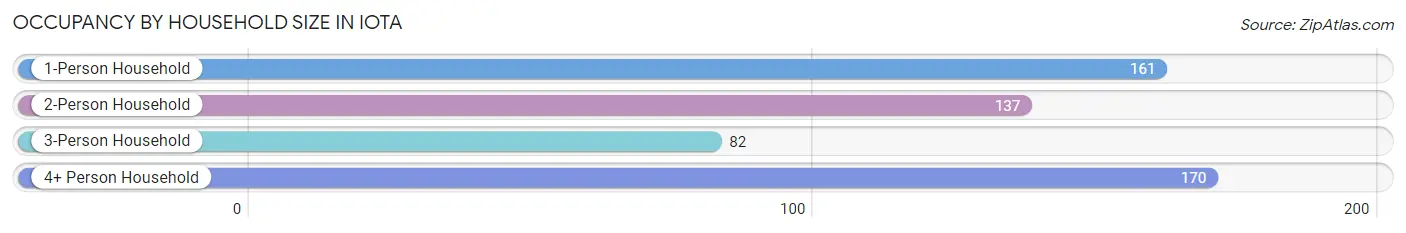
| Household Size | # Housing Units | % Housing Units |
| 1-Person Household | 161 | 29.3% |
| 2-Person Household | 137 | 24.9% |
| 3-Person Household | 82 | 14.9% |
| 4+ Person Household | 170 | 30.9% |
| Total Housing Units | 550 | 100.0% |
Occupancy by Ownership by Household Size in Iota
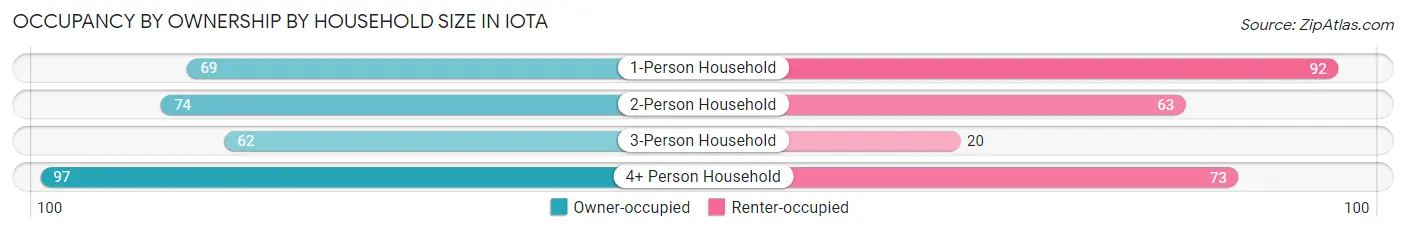
| Household Size | Owner-occupied | Renter-occupied |
| 1-Person Household | 69 (42.9%) | 92 (57.1%) |
| 2-Person Household | 74 (54.0%) | 63 (46.0%) |
| 3-Person Household | 62 (75.6%) | 20 (24.4%) |
| 4+ Person Household | 97 (57.1%) | 73 (42.9%) |
| Total Housing Units | 302 (54.9%) | 248 (45.1%) |
Occupancy by Educational Attainment in Iota
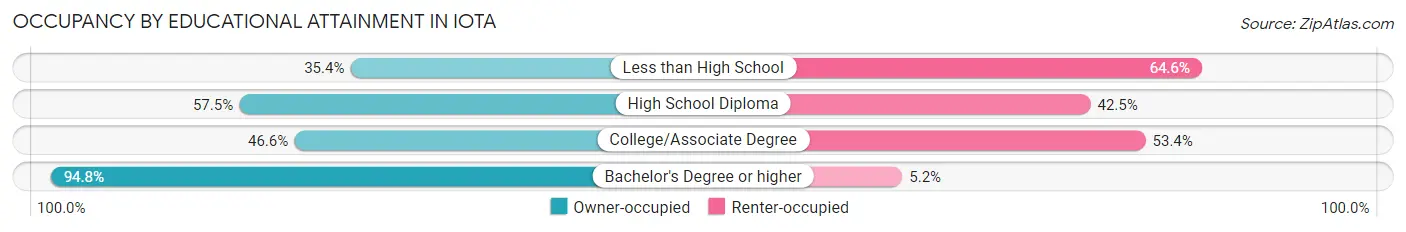
| Household Size | Owner-occupied | Renter-occupied |
| Less than High School | 28 (35.4%) | 51 (64.6%) |
| High School Diploma | 92 (57.5%) | 68 (42.5%) |
| College/Associate Degree | 109 (46.6%) | 125 (53.4%) |
| Bachelor's Degree or higher | 73 (94.8%) | 4 (5.2%) |
Occupancy by Age of Householder in Iota
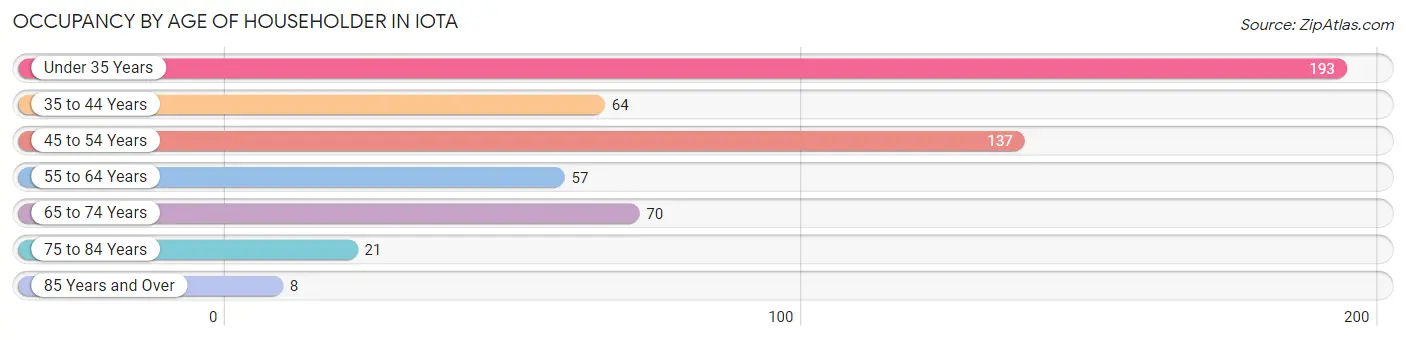
| Age Bracket | # Households | % Households |
| Under 35 Years | 193 | 35.1% |
| 35 to 44 Years | 64 | 11.6% |
| 45 to 54 Years | 137 | 24.9% |
| 55 to 64 Years | 57 | 10.4% |
| 65 to 74 Years | 70 | 12.7% |
| 75 to 84 Years | 21 | 3.8% |
| 85 Years and Over | 8 | 1.5% |
| Total | 550 | 100.0% |
Housing Finances in Iota
Median Income by Occupancy in Iota
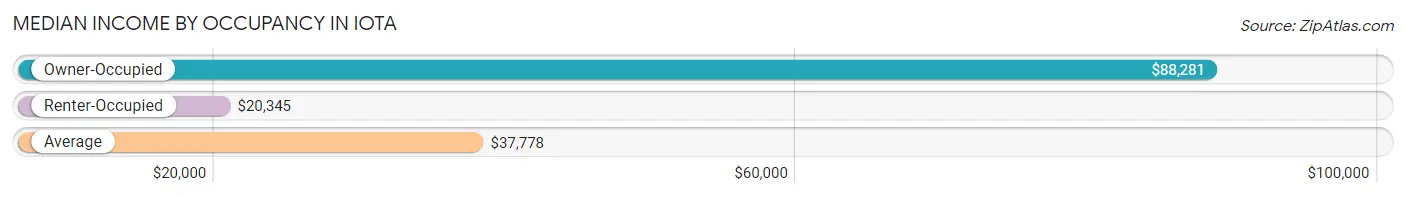
| Occupancy Type | # Households | Median Income |
| Owner-Occupied | 302 (54.9%) | $88,281 |
| Renter-Occupied | 248 (45.1%) | $20,345 |
| Average | 550 (100.0%) | $37,778 |
Occupancy by Householder Income Bracket in Iota
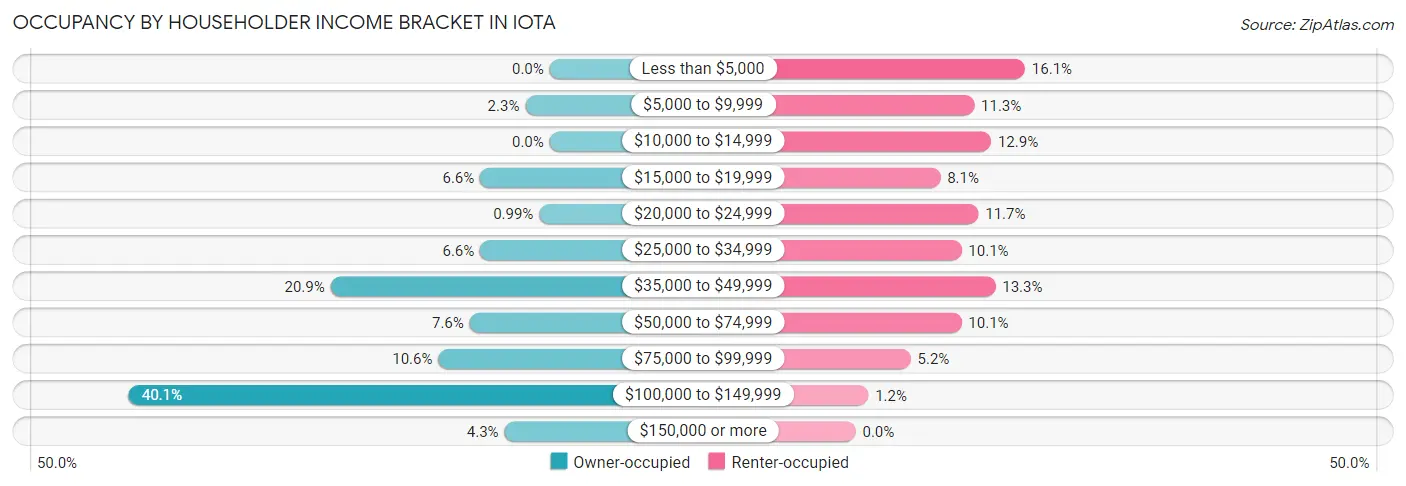
| Income Bracket | Owner-occupied | Renter-occupied |
| Less than $5,000 | 0 (0.0%) | 40 (16.1%) |
| $5,000 to $9,999 | 7 (2.3%) | 28 (11.3%) |
| $10,000 to $14,999 | 0 (0.0%) | 32 (12.9%) |
| $15,000 to $19,999 | 20 (6.6%) | 20 (8.1%) |
| $20,000 to $24,999 | 3 (1.0%) | 29 (11.7%) |
| $25,000 to $34,999 | 20 (6.6%) | 25 (10.1%) |
| $35,000 to $49,999 | 63 (20.9%) | 33 (13.3%) |
| $50,000 to $74,999 | 23 (7.6%) | 25 (10.1%) |
| $75,000 to $99,999 | 32 (10.6%) | 13 (5.2%) |
| $100,000 to $149,999 | 121 (40.1%) | 3 (1.2%) |
| $150,000 or more | 13 (4.3%) | 0 (0.0%) |
| Total | 302 (100.0%) | 248 (100.0%) |
Monthly Housing Cost Tiers in Iota
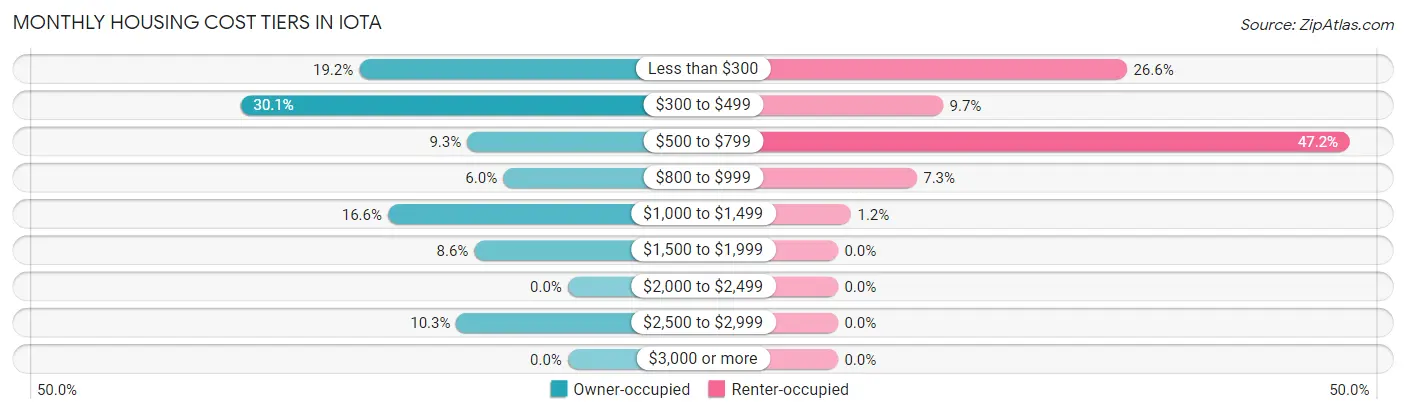
| Monthly Cost | Owner-occupied | Renter-occupied |
| Less than $300 | 58 (19.2%) | 66 (26.6%) |
| $300 to $499 | 91 (30.1%) | 24 (9.7%) |
| $500 to $799 | 28 (9.3%) | 117 (47.2%) |
| $800 to $999 | 18 (6.0%) | 18 (7.3%) |
| $1,000 to $1,499 | 50 (16.6%) | 3 (1.2%) |
| $1,500 to $1,999 | 26 (8.6%) | 0 (0.0%) |
| $2,000 to $2,499 | 0 (0.0%) | 0 (0.0%) |
| $2,500 to $2,999 | 31 (10.3%) | 0 (0.0%) |
| $3,000 or more | 0 (0.0%) | 0 (0.0%) |
| Total | 302 (100.0%) | 248 (100.0%) |
Physical Housing Characteristics in Iota
Housing Structures in Iota
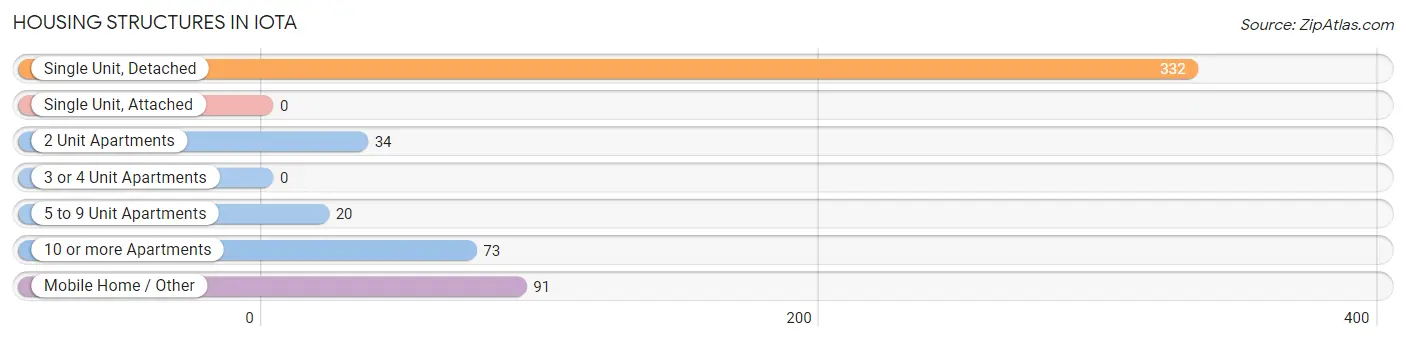
| Structure Type | # Housing Units | % Housing Units |
| Single Unit, Detached | 332 | 60.4% |
| Single Unit, Attached | 0 | 0.0% |
| 2 Unit Apartments | 34 | 6.2% |
| 3 or 4 Unit Apartments | 0 | 0.0% |
| 5 to 9 Unit Apartments | 20 | 3.6% |
| 10 or more Apartments | 73 | 13.3% |
| Mobile Home / Other | 91 | 16.6% |
| Total | 550 | 100.0% |
Housing Structures by Occupancy in Iota
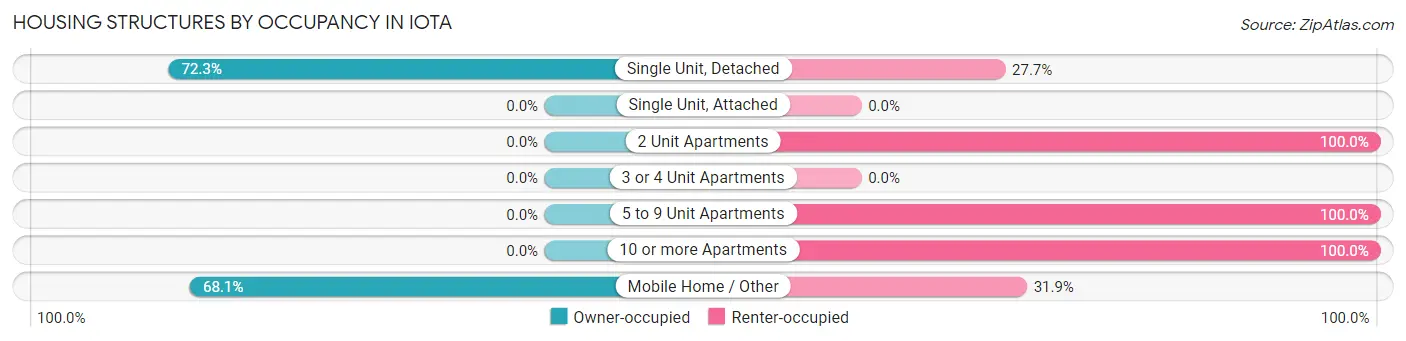
| Structure Type | Owner-occupied | Renter-occupied |
| Single Unit, Detached | 240 (72.3%) | 92 (27.7%) |
| Single Unit, Attached | 0 (0.0%) | 0 (0.0%) |
| 2 Unit Apartments | 0 (0.0%) | 34 (100.0%) |
| 3 or 4 Unit Apartments | 0 (0.0%) | 0 (0.0%) |
| 5 to 9 Unit Apartments | 0 (0.0%) | 20 (100.0%) |
| 10 or more Apartments | 0 (0.0%) | 73 (100.0%) |
| Mobile Home / Other | 62 (68.1%) | 29 (31.9%) |
| Total | 302 (54.9%) | 248 (45.1%) |
Housing Structures by Number of Rooms in Iota
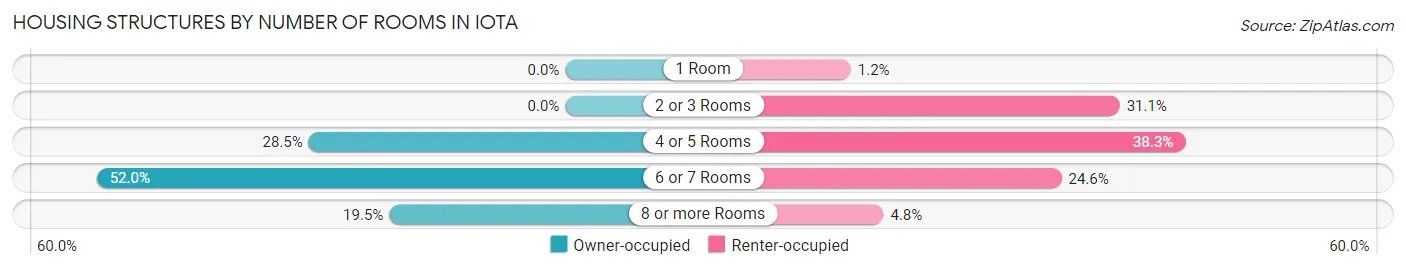
| Number of Rooms | Owner-occupied | Renter-occupied |
| 1 Room | 0 (0.0%) | 3 (1.2%) |
| 2 or 3 Rooms | 0 (0.0%) | 77 (31.0%) |
| 4 or 5 Rooms | 86 (28.5%) | 95 (38.3%) |
| 6 or 7 Rooms | 157 (52.0%) | 61 (24.6%) |
| 8 or more Rooms | 59 (19.5%) | 12 (4.8%) |
| Total | 302 (100.0%) | 248 (100.0%) |
Housing Structure by Heating Type in Iota
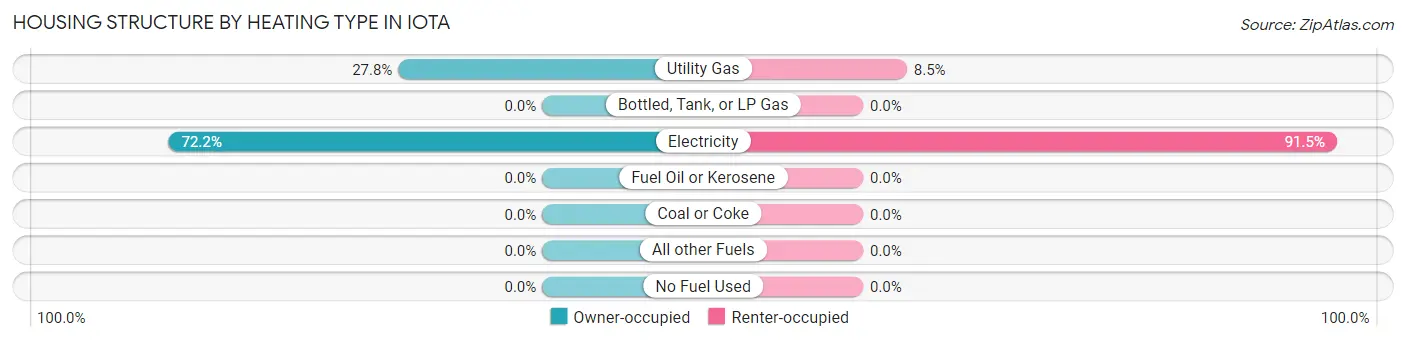
| Heating Type | Owner-occupied | Renter-occupied |
| Utility Gas | 84 (27.8%) | 21 (8.5%) |
| Bottled, Tank, or LP Gas | 0 (0.0%) | 0 (0.0%) |
| Electricity | 218 (72.2%) | 227 (91.5%) |
| Fuel Oil or Kerosene | 0 (0.0%) | 0 (0.0%) |
| Coal or Coke | 0 (0.0%) | 0 (0.0%) |
| All other Fuels | 0 (0.0%) | 0 (0.0%) |
| No Fuel Used | 0 (0.0%) | 0 (0.0%) |
| Total | 302 (100.0%) | 248 (100.0%) |
Household Vehicle Usage in Iota
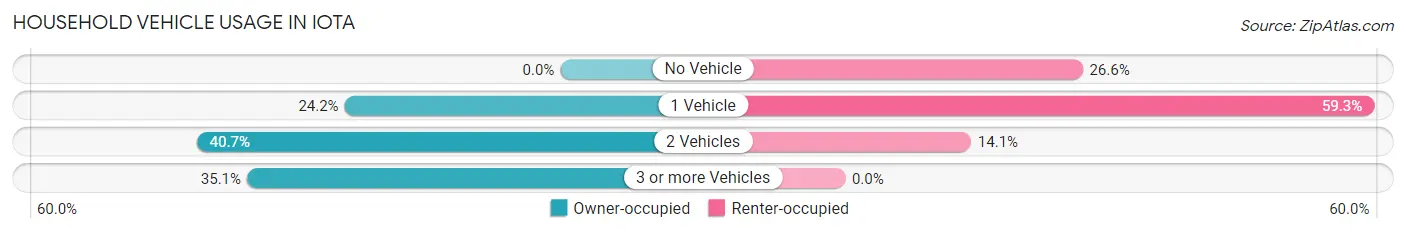
| Vehicles per Household | Owner-occupied | Renter-occupied |
| No Vehicle | 0 (0.0%) | 66 (26.6%) |
| 1 Vehicle | 73 (24.2%) | 147 (59.3%) |
| 2 Vehicles | 123 (40.7%) | 35 (14.1%) |
| 3 or more Vehicles | 106 (35.1%) | 0 (0.0%) |
| Total | 302 (100.0%) | 248 (100.0%) |
Real Estate & Mortgages in Iota
Real Estate and Mortgage Overview in Iota
| Characteristic | Without Mortgage | With Mortgage |
| Housing Units | 168 | 134 |
| Median Property Value | $81,800 | $250,000 |
| Median Household Income | $51,250 | $8 |
| Monthly Housing Costs | $379 | $0 |
| Real Estate Taxes | $308 | $0 |
Property Value by Mortgage Status in Iota
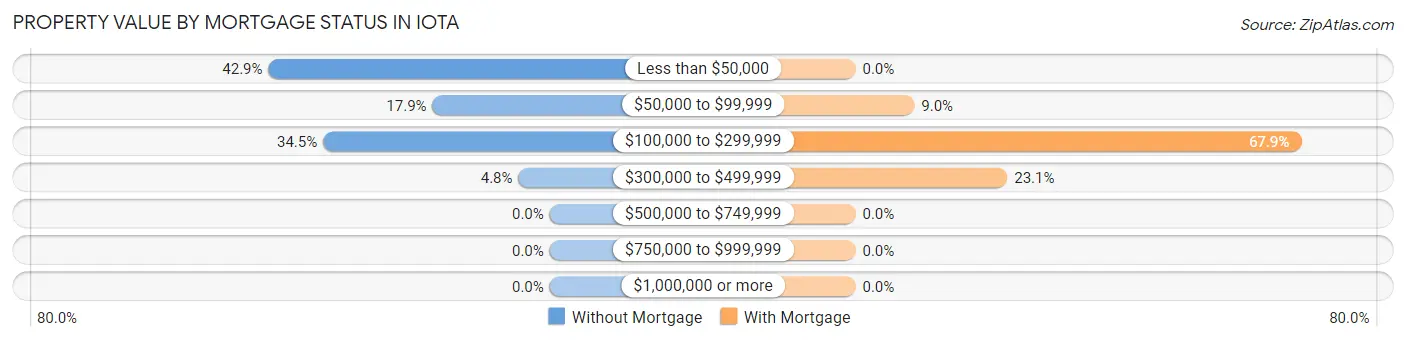
| Property Value | Without Mortgage | With Mortgage |
| Less than $50,000 | 72 (42.9%) | 0 (0.0%) |
| $50,000 to $99,999 | 30 (17.9%) | 12 (9.0%) |
| $100,000 to $299,999 | 58 (34.5%) | 91 (67.9%) |
| $300,000 to $499,999 | 8 (4.8%) | 31 (23.1%) |
| $500,000 to $749,999 | 0 (0.0%) | 0 (0.0%) |
| $750,000 to $999,999 | 0 (0.0%) | 0 (0.0%) |
| $1,000,000 or more | 0 (0.0%) | 0 (0.0%) |
| Total | 168 (100.0%) | 134 (100.0%) |
Household Income by Mortgage Status in Iota
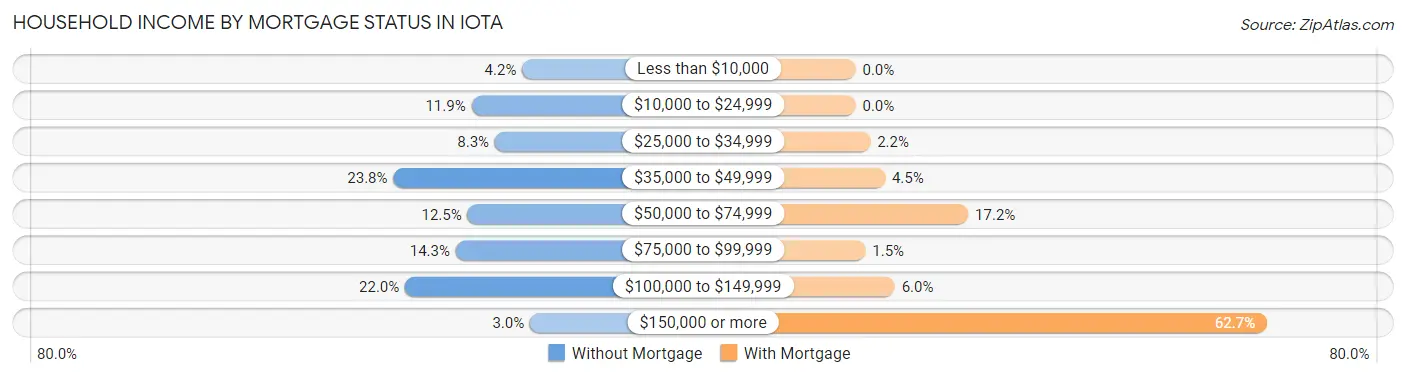
| Household Income | Without Mortgage | With Mortgage |
| Less than $10,000 | 7 (4.2%) | 0 (0.0%) |
| $10,000 to $24,999 | 20 (11.9%) | 0 (0.0%) |
| $25,000 to $34,999 | 14 (8.3%) | 3 (2.2%) |
| $35,000 to $49,999 | 40 (23.8%) | 6 (4.5%) |
| $50,000 to $74,999 | 21 (12.5%) | 23 (17.2%) |
| $75,000 to $99,999 | 24 (14.3%) | 2 (1.5%) |
| $100,000 to $149,999 | 37 (22.0%) | 8 (6.0%) |
| $150,000 or more | 5 (3.0%) | 84 (62.7%) |
| Total | 168 (100.0%) | 134 (100.0%) |
Property Value to Household Income Ratio in Iota
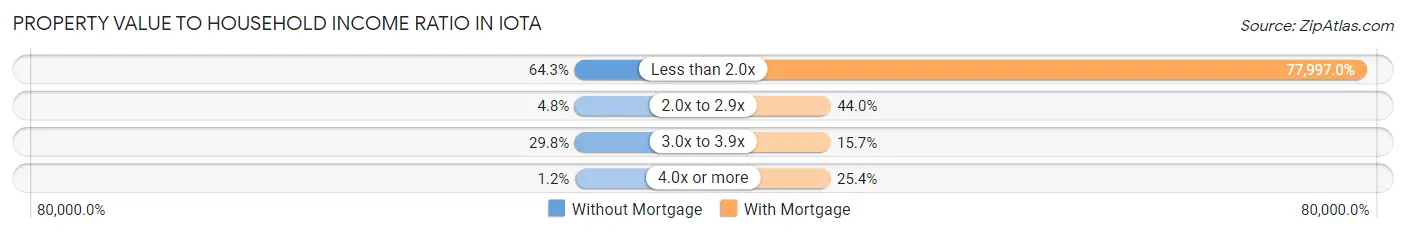
| Value-to-Income Ratio | Without Mortgage | With Mortgage |
| Less than 2.0x | 108 (64.3%) | 104,516 (77,997.0%) |
| 2.0x to 2.9x | 8 (4.8%) | 59 (44.0%) |
| 3.0x to 3.9x | 50 (29.8%) | 21 (15.7%) |
| 4.0x or more | 2 (1.2%) | 34 (25.4%) |
| Total | 168 (100.0%) | 134 (100.0%) |
Real Estate Taxes by Mortgage Status in Iota
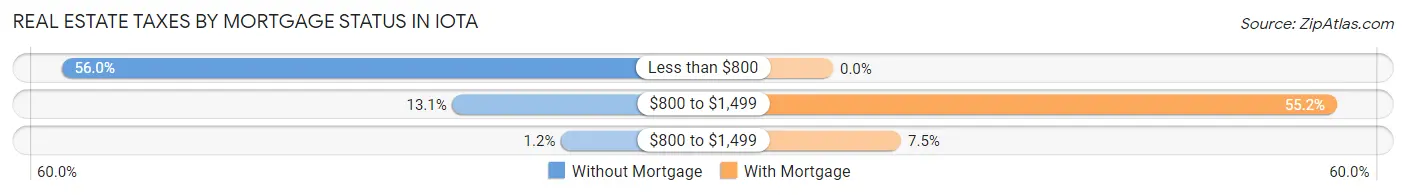
| Property Taxes | Without Mortgage | With Mortgage |
| Less than $800 | 94 (55.9%) | 0 (0.0%) |
| $800 to $1,499 | 22 (13.1%) | 74 (55.2%) |
| $800 to $1,499 | 2 (1.2%) | 10 (7.5%) |
| Total | 168 (100.0%) | 134 (100.0%) |
Health & Disability in Iota
Health Insurance Coverage by Age in Iota
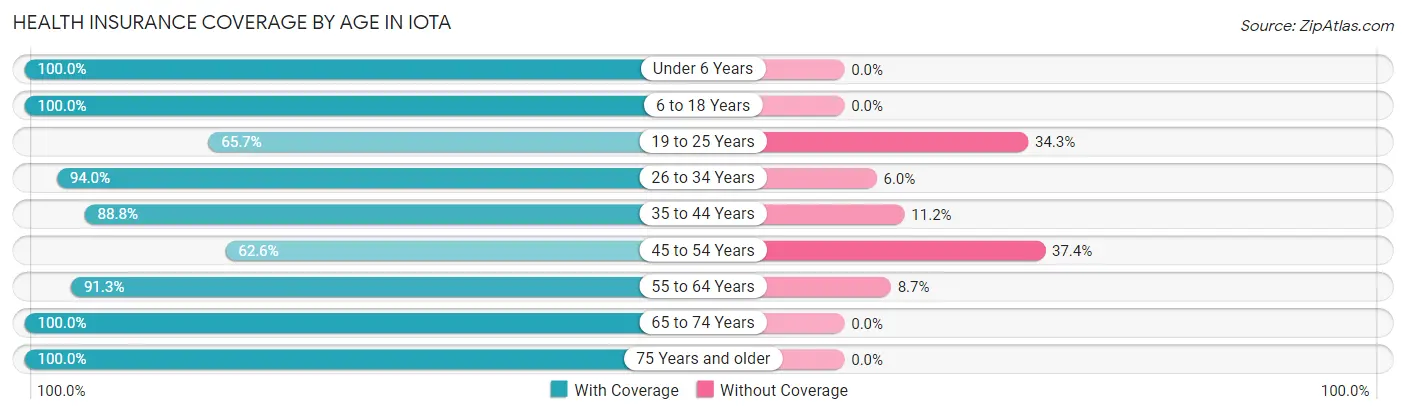
| Age Bracket | With Coverage | Without Coverage |
| Under 6 Years | 131 (100.0%) | 0 (0.0%) |
| 6 to 18 Years | 402 (100.0%) | 0 (0.0%) |
| 19 to 25 Years | 94 (65.7%) | 49 (34.3%) |
| 26 to 34 Years | 219 (94.0%) | 14 (6.0%) |
| 35 to 44 Years | 103 (88.8%) | 13 (11.2%) |
| 45 to 54 Years | 142 (62.6%) | 85 (37.4%) |
| 55 to 64 Years | 116 (91.3%) | 11 (8.7%) |
| 65 to 74 Years | 93 (100.0%) | 0 (0.0%) |
| 75 Years and older | 33 (100.0%) | 0 (0.0%) |
| Total | 1,333 (88.6%) | 172 (11.4%) |
Health Insurance Coverage by Citizenship Status in Iota
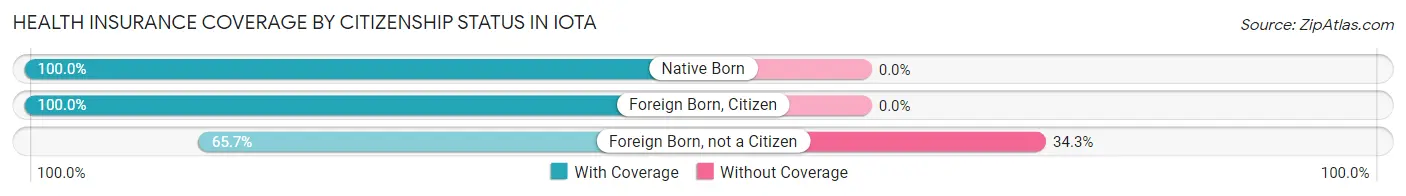
| Citizenship Status | With Coverage | Without Coverage |
| Native Born | 131 (100.0%) | 0 (0.0%) |
| Foreign Born, Citizen | 402 (100.0%) | 0 (0.0%) |
| Foreign Born, not a Citizen | 94 (65.7%) | 49 (34.3%) |
Health Insurance Coverage by Household Income in Iota
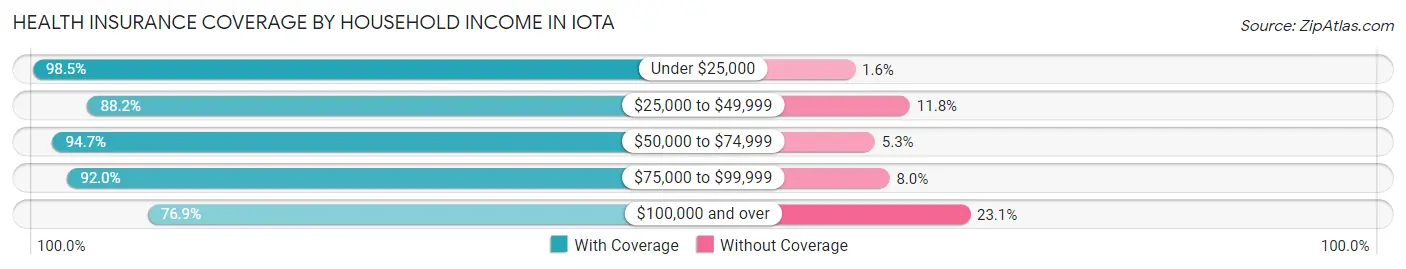
| Household Income | With Coverage | Without Coverage |
| Under $25,000 | 446 (98.5%) | 7 (1.5%) |
| $25,000 to $49,999 | 306 (88.2%) | 41 (11.8%) |
| $50,000 to $74,999 | 126 (94.7%) | 7 (5.3%) |
| $75,000 to $99,999 | 92 (92.0%) | 8 (8.0%) |
| $100,000 and over | 363 (76.9%) | 109 (23.1%) |
Public vs Private Health Insurance Coverage by Age in Iota
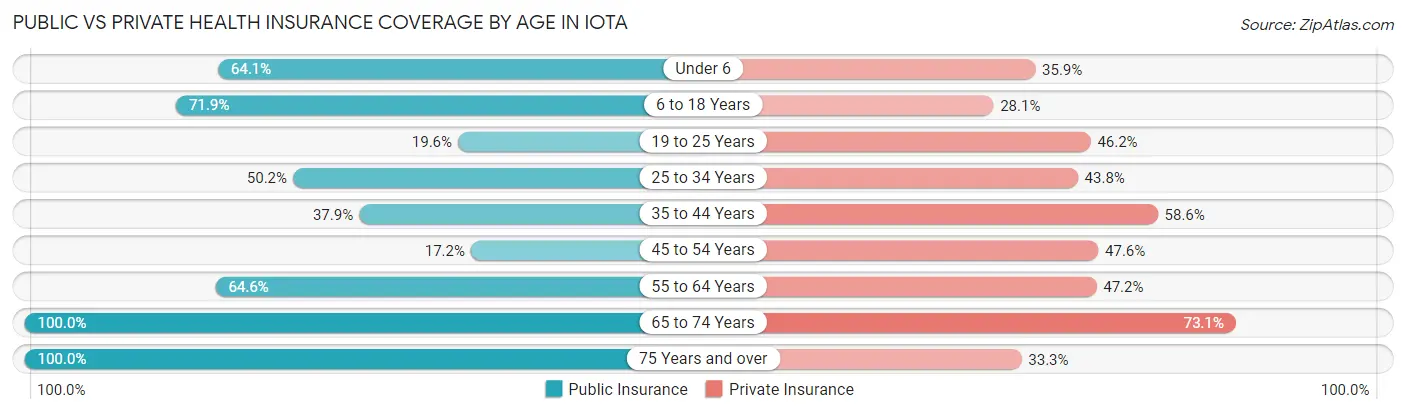
| Age Bracket | Public Insurance | Private Insurance |
| Under 6 | 84 (64.1%) | 47 (35.9%) |
| 6 to 18 Years | 289 (71.9%) | 113 (28.1%) |
| 19 to 25 Years | 28 (19.6%) | 66 (46.2%) |
| 25 to 34 Years | 117 (50.2%) | 102 (43.8%) |
| 35 to 44 Years | 44 (37.9%) | 68 (58.6%) |
| 45 to 54 Years | 39 (17.2%) | 108 (47.6%) |
| 55 to 64 Years | 82 (64.6%) | 60 (47.2%) |
| 65 to 74 Years | 93 (100.0%) | 68 (73.1%) |
| 75 Years and over | 33 (100.0%) | 11 (33.3%) |
| Total | 809 (53.7%) | 643 (42.7%) |
Disability Status by Sex by Age in Iota
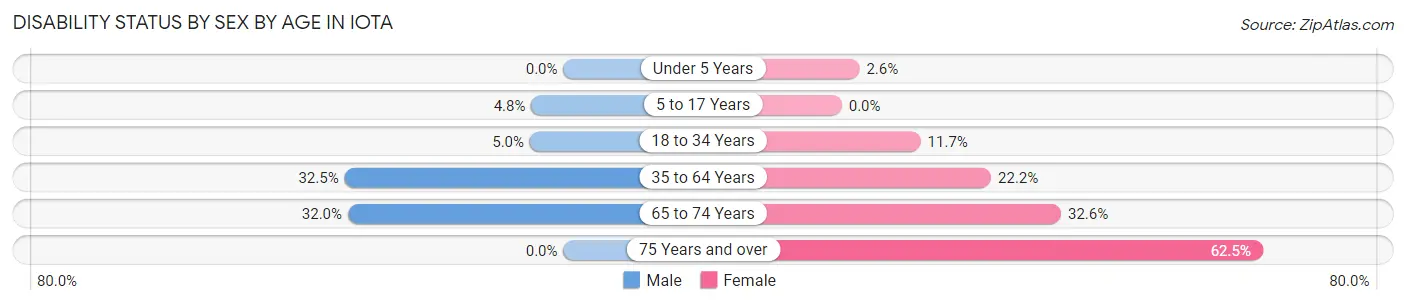
| Age Bracket | Male | Female |
| Under 5 Years | 0 (0.0%) | 2 (2.6%) |
| 5 to 17 Years | 10 (4.8%) | 0 (0.0%) |
| 18 to 34 Years | 9 (5.0%) | 26 (11.7%) |
| 35 to 64 Years | 78 (32.5%) | 51 (22.2%) |
| 65 to 74 Years | 16 (32.0%) | 14 (32.6%) |
| 75 Years and over | 0 (0.0%) | 15 (62.5%) |
Disability Class by Sex by Age in Iota
Disability Class: Hearing Difficulty
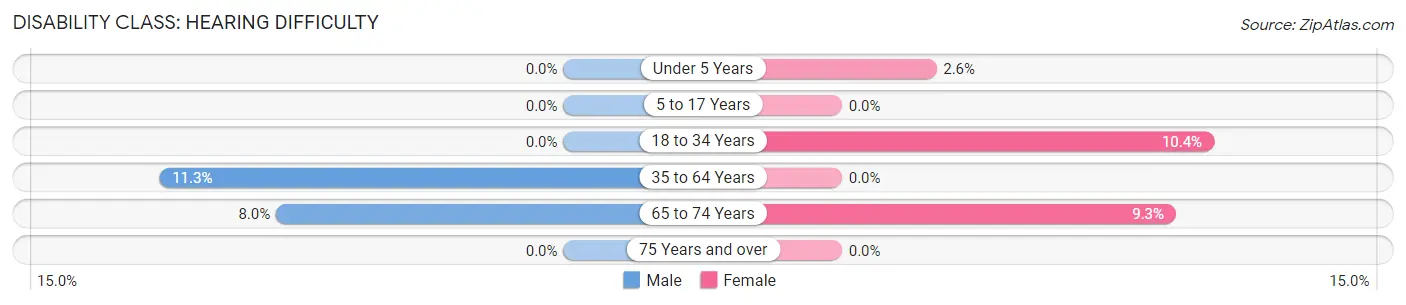
| Age Bracket | Male | Female |
| Under 5 Years | 0 (0.0%) | 2 (2.6%) |
| 5 to 17 Years | 0 (0.0%) | 0 (0.0%) |
| 18 to 34 Years | 0 (0.0%) | 23 (10.4%) |
| 35 to 64 Years | 27 (11.3%) | 0 (0.0%) |
| 65 to 74 Years | 4 (8.0%) | 4 (9.3%) |
| 75 Years and over | 0 (0.0%) | 0 (0.0%) |
Disability Class: Vision Difficulty
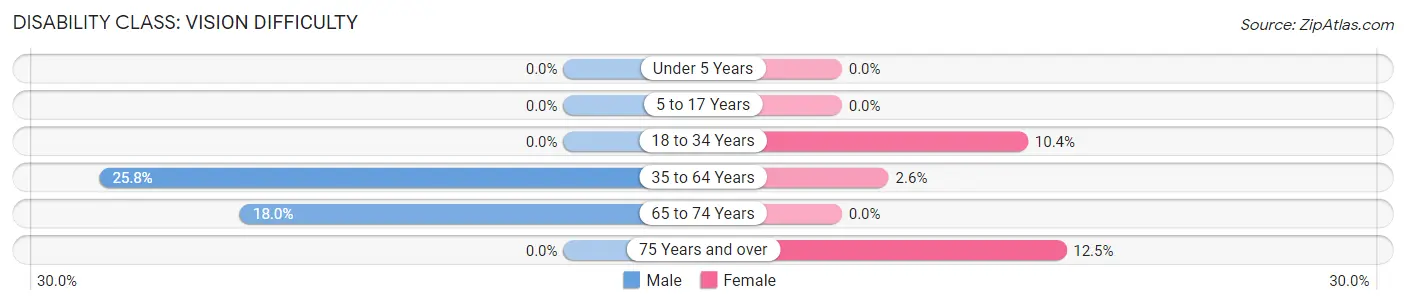
| Age Bracket | Male | Female |
| Under 5 Years | 0 (0.0%) | 0 (0.0%) |
| 5 to 17 Years | 0 (0.0%) | 0 (0.0%) |
| 18 to 34 Years | 0 (0.0%) | 23 (10.4%) |
| 35 to 64 Years | 62 (25.8%) | 6 (2.6%) |
| 65 to 74 Years | 9 (18.0%) | 0 (0.0%) |
| 75 Years and over | 0 (0.0%) | 3 (12.5%) |
Disability Class: Cognitive Difficulty
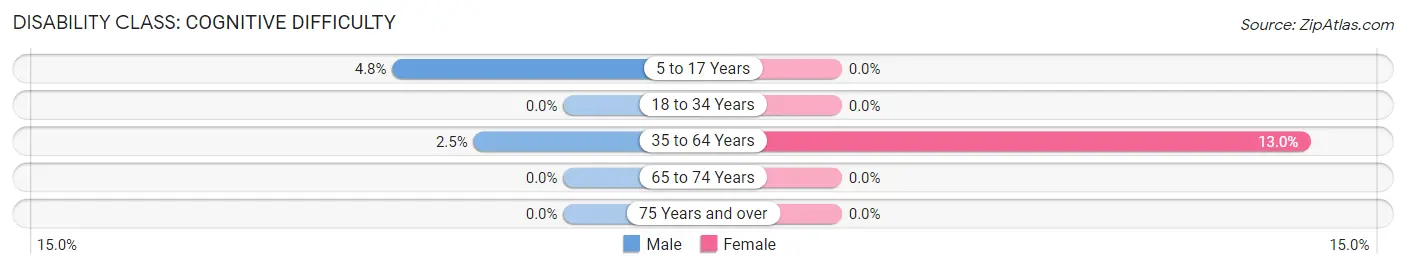
| Age Bracket | Male | Female |
| 5 to 17 Years | 10 (4.8%) | 0 (0.0%) |
| 18 to 34 Years | 0 (0.0%) | 0 (0.0%) |
| 35 to 64 Years | 6 (2.5%) | 30 (13.0%) |
| 65 to 74 Years | 0 (0.0%) | 0 (0.0%) |
| 75 Years and over | 0 (0.0%) | 0 (0.0%) |
Disability Class: Ambulatory Difficulty
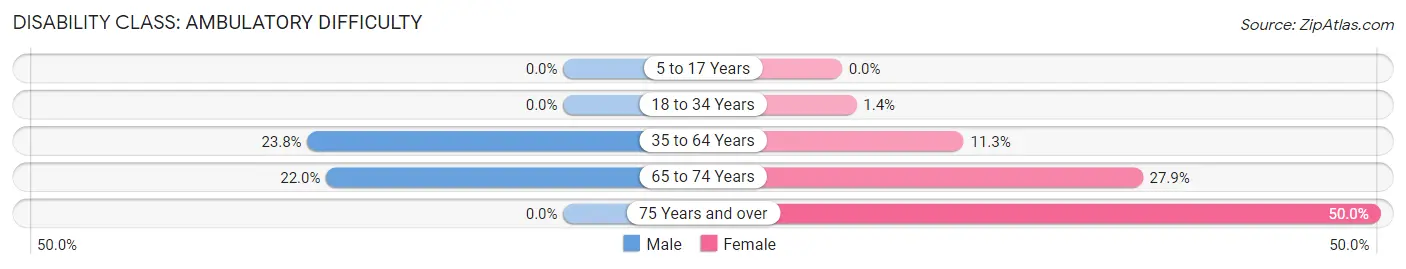
| Age Bracket | Male | Female |
| 5 to 17 Years | 0 (0.0%) | 0 (0.0%) |
| 18 to 34 Years | 0 (0.0%) | 3 (1.3%) |
| 35 to 64 Years | 57 (23.7%) | 26 (11.3%) |
| 65 to 74 Years | 11 (22.0%) | 12 (27.9%) |
| 75 Years and over | 0 (0.0%) | 12 (50.0%) |
Disability Class: Self-Care Difficulty
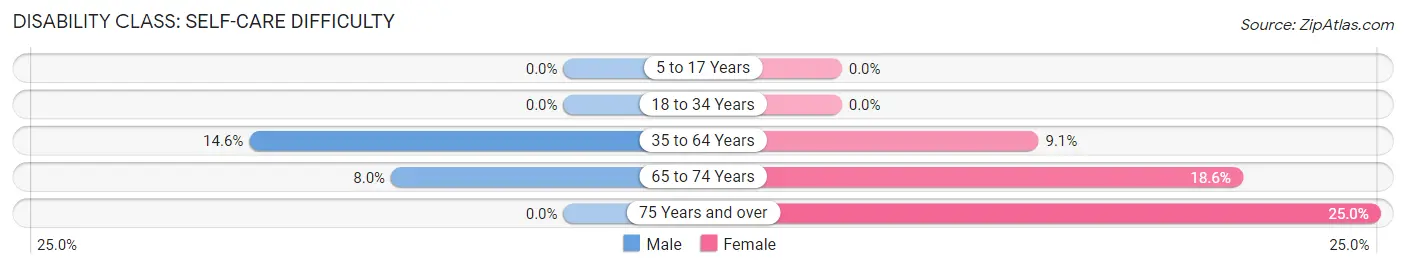
| Age Bracket | Male | Female |
| 5 to 17 Years | 0 (0.0%) | 0 (0.0%) |
| 18 to 34 Years | 0 (0.0%) | 0 (0.0%) |
| 35 to 64 Years | 35 (14.6%) | 21 (9.1%) |
| 65 to 74 Years | 4 (8.0%) | 8 (18.6%) |
| 75 Years and over | 0 (0.0%) | 6 (25.0%) |
Technology Access in Iota
Computing Device Access in Iota
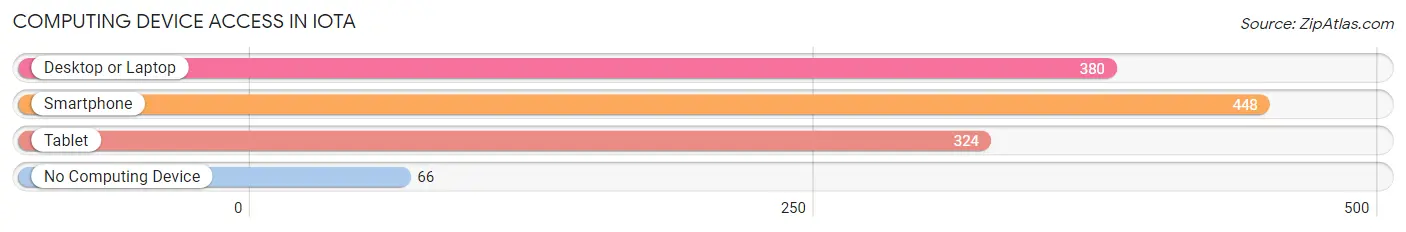
| Device Type | # Households | % Households |
| Desktop or Laptop | 380 | 69.1% |
| Smartphone | 448 | 81.5% |
| Tablet | 324 | 58.9% |
| No Computing Device | 66 | 12.0% |
| Total | 550 | 100.0% |
Internet Access in Iota
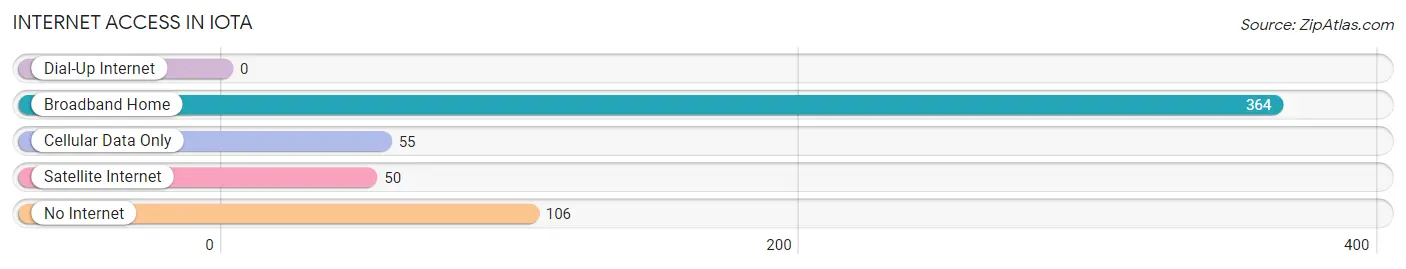
| Internet Type | # Households | % Households |
| Dial-Up Internet | 0 | 0.0% |
| Broadband Home | 364 | 66.2% |
| Cellular Data Only | 55 | 10.0% |
| Satellite Internet | 50 | 9.1% |
| No Internet | 106 | 19.3% |
| Total | 550 | 100.0% |
Iota Summary
Iota is a small town located in Acadia Parish, Louisiana. It is situated in the southwestern part of the state, approximately 20 miles from the city of Lafayette. The town has a population of 1,845 people, according to the 2010 census.
Geography
Iota is located in the southwestern part of Acadia Parish, Louisiana. It is situated on the banks of the Mermentau River, which flows through the town. The town is surrounded by agricultural land, with the nearest major city being Lafayette, which is located approximately 20 miles to the northeast. The town is located at an elevation of approximately 30 feet above sea level.
History
Iota was founded in 1883 by a group of French-speaking settlers from the nearby town of Eunice. The town was named after the Greek letter “iota”, which was chosen to represent the first letter of the French word “Iota”, meaning “small”. The town was incorporated in 1891 and has remained relatively unchanged since then.
Economy
Iota’s economy is largely based on agriculture. The town is home to several large farms, which produce a variety of crops, including corn, soybeans, and cotton. The town is also home to several small businesses, including a grocery store, a hardware store, and a few restaurants.
Demographics
According to the 2010 census, Iota has a population of 1,845 people. The town is predominantly white, with approximately 85% of the population being of Caucasian descent. The remaining 15% of the population is made up of African Americans, Hispanics, and other ethnicities. The median household income in Iota is $37,000, and the median age is 37.
Conclusion
Iota is a small town located in Acadia Parish, Louisiana. It is situated on the banks of the Mermentau River and is surrounded by agricultural land. The town has a population of 1,845 people, and the economy is largely based on agriculture. The town is predominantly white, with the median household income being $37,000 and the median age being 37.
Common Questions
What is Per Capita Income in Iota?
Per Capita income in Iota is $21,231.
What is the Median Family Income in Iota?
Median Family Income in Iota is $48,542.
What is the Median Household income in Iota?
Median Household Income in Iota is $37,778.
What is Income or Wage Gap in Iota?
Income or Wage Gap in Iota is 7.0%.
Women in Iota earn 93.0 cents for every dollar earned by a man.
What is Inequality or Gini Index in Iota?
Inequality or Gini Index in Iota is 0.47.
What is the Total Population of Iota?
Total Population of Iota is 1,518.
What is the Total Male Population of Iota?
Total Male Population of Iota is 746.
What is the Total Female Population of Iota?
Total Female Population of Iota is 772.
What is the Ratio of Males per 100 Females in Iota?
There are 96.63 Males per 100 Females in Iota.
What is the Ratio of Females per 100 Males in Iota?
There are 103.49 Females per 100 Males in Iota.
What is the Median Population Age in Iota?
Median Population Age in Iota is 29.7 Years.
What is the Average Family Size in Iota
Average Family Size in Iota is 3.5 People.
What is the Average Household Size in Iota
Average Household Size in Iota is 2.8 People.
How Large is the Labor Force in Iota?
There are 640 People in the Labor Forcein in Iota.
What is the Percentage of People in the Labor Force in Iota?
61.0% of People are in the Labor Force in Iota.
What is the Unemployment Rate in Iota?
Unemployment Rate in Iota is 5.6%.