Garyville, LA Map & Demographics
Garyville Map
Garyville Overview
$31,663
PER CAPITA INCOME
$105,750
AVG FAMILY INCOME
$64,261
AVG HOUSEHOLD INCOME
0.44
INEQUALITY / GINI INDEX
2,108
TOTAL POPULATION
859
MALE POPULATION
1,249
FEMALE POPULATION
68.78
MALES / 100 FEMALES
145.40
FEMALES / 100 MALES
41.9
MEDIAN AGE
4.2
AVG FAMILY SIZE
3.1
AVG HOUSEHOLD SIZE
773
LABOR FORCE [ PEOPLE ]
47.7%
PERCENT IN LABOR FORCE
3.7%
UNEMPLOYMENT RATE
Garyville Zip Codes
Garyville Area Codes
Income in Garyville
Income Overview in Garyville
Per Capita Income in Garyville is $31,663, while median incomes of families and households are $105,750 and $64,261 respectively.
| Characteristic | Number | Measure |
| Per Capita Income | 2,108 | $31,663 |
| Median Family Income | 376 | $105,750 |
| Mean Family Income | 376 | $111,837 |
| Median Household Income | 686 | $64,261 |
| Mean Household Income | 686 | $88,693 |
| Income Deficit | 376 | $0 |
| Wage / Income Gap (%) | 2,108 | 0.00% |
| Wage / Income Gap ($) | 2,108 | 100.00¢ per $1 |
| Gini / Inequality Index | 2,108 | 0.44 |
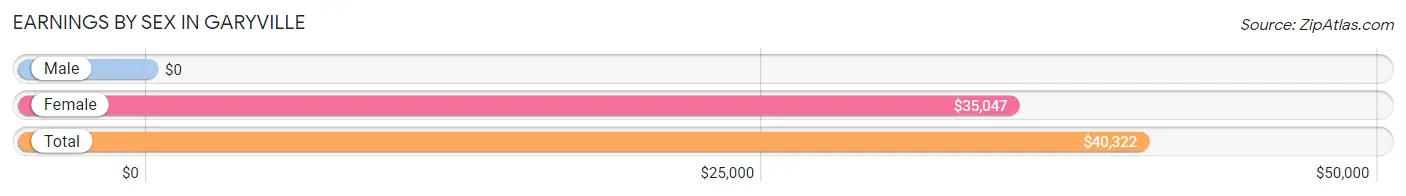
Earnings by Sex in Garyville
| Sex | Number | Average Earnings |
| Male | 423 (49.2%) | $0 |
| Female | 436 (50.8%) | $35,047 |
| Total | 859 (100.0%) | $40,322 |
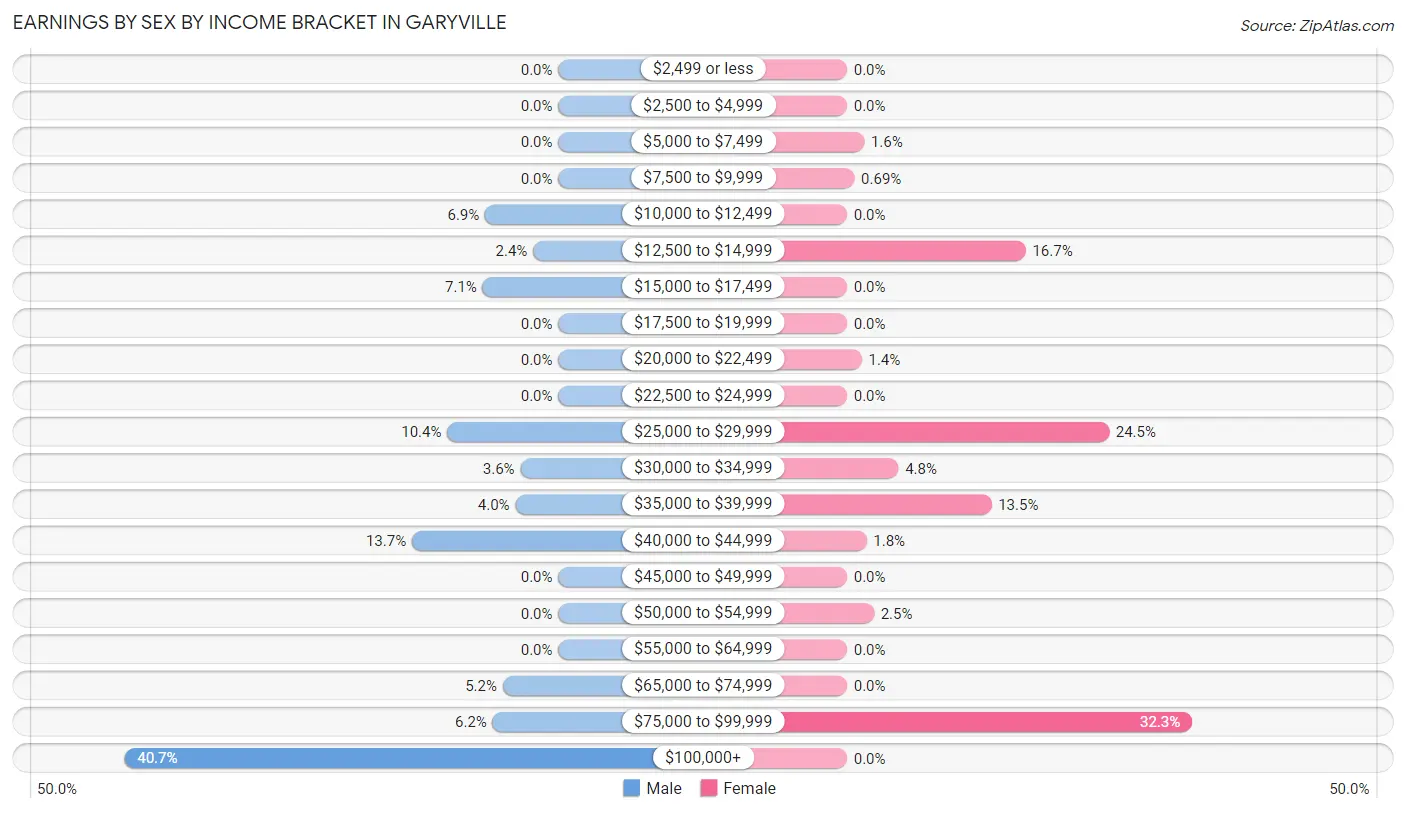
Earnings by Sex by Income Bracket in Garyville
The most common earnings brackets in Garyville are $100,000+ for men (172 | 40.7%) and $75,000 to $99,999 for women (141 | 32.3%).
| Income | Male | Female |
| $2,499 or less | 0 (0.0%) | 0 (0.0%) |
| $2,500 to $4,999 | 0 (0.0%) | 0 (0.0%) |
| $5,000 to $7,499 | 0 (0.0%) | 7 (1.6%) |
| $7,500 to $9,999 | 0 (0.0%) | 3 (0.7%) |
| $10,000 to $12,499 | 29 (6.9%) | 0 (0.0%) |
| $12,500 to $14,999 | 10 (2.4%) | 73 (16.7%) |
| $15,000 to $17,499 | 30 (7.1%) | 0 (0.0%) |
| $17,500 to $19,999 | 0 (0.0%) | 0 (0.0%) |
| $20,000 to $22,499 | 0 (0.0%) | 6 (1.4%) |
| $22,500 to $24,999 | 0 (0.0%) | 0 (0.0%) |
| $25,000 to $29,999 | 44 (10.4%) | 107 (24.5%) |
| $30,000 to $34,999 | 15 (3.5%) | 21 (4.8%) |
| $35,000 to $39,999 | 17 (4.0%) | 59 (13.5%) |
| $40,000 to $44,999 | 58 (13.7%) | 8 (1.8%) |
| $45,000 to $49,999 | 0 (0.0%) | 0 (0.0%) |
| $50,000 to $54,999 | 0 (0.0%) | 11 (2.5%) |
| $55,000 to $64,999 | 0 (0.0%) | 0 (0.0%) |
| $65,000 to $74,999 | 22 (5.2%) | 0 (0.0%) |
| $75,000 to $99,999 | 26 (6.1%) | 141 (32.3%) |
| $100,000+ | 172 (40.7%) | 0 (0.0%) |
| Total | 423 (100.0%) | 436 (100.0%) |
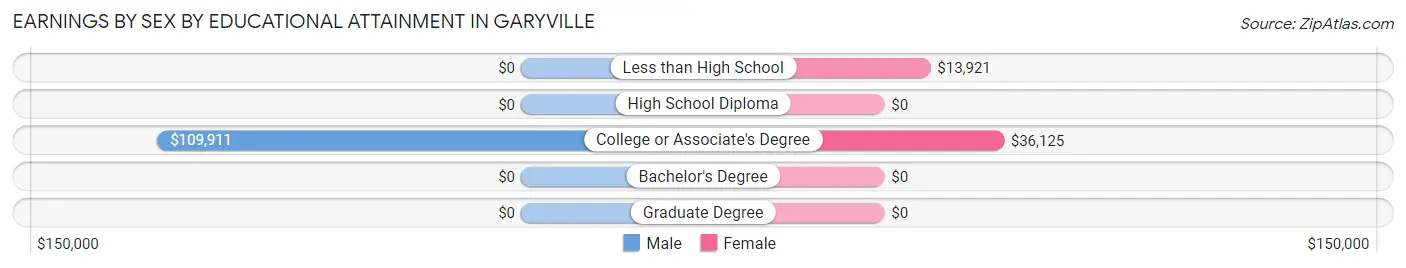
Earnings by Sex by Educational Attainment in Garyville
Average earnings in Garyville are $93,194 for men and $35,330 for women, a difference of 62.1%. Men with an educational attainment of college or associate's degree enjoy the highest average annual earnings of $109,911, while those with college or associate's degree education earn the least with $109,911. Women with an educational attainment of college or associate's degree earn the most with the average annual earnings of $36,125, while those with less than high school education have the smallest earnings of $13,921.
| Educational Attainment | Male Income | Female Income |
| Less than High School | - | - |
| High School Diploma | - | - |
| College or Associate's Degree | $109,911 | $36,125 |
| Bachelor's Degree | - | - |
| Graduate Degree | - | - |
| Total | $93,194 | $35,330 |
Family Income in Garyville
Family Income Brackets in Garyville
According to the Garyville family income data, there are 97 families falling into the $50,000 to $74,999 income range, which is the most common income bracket and makes up 25.8% of all families.
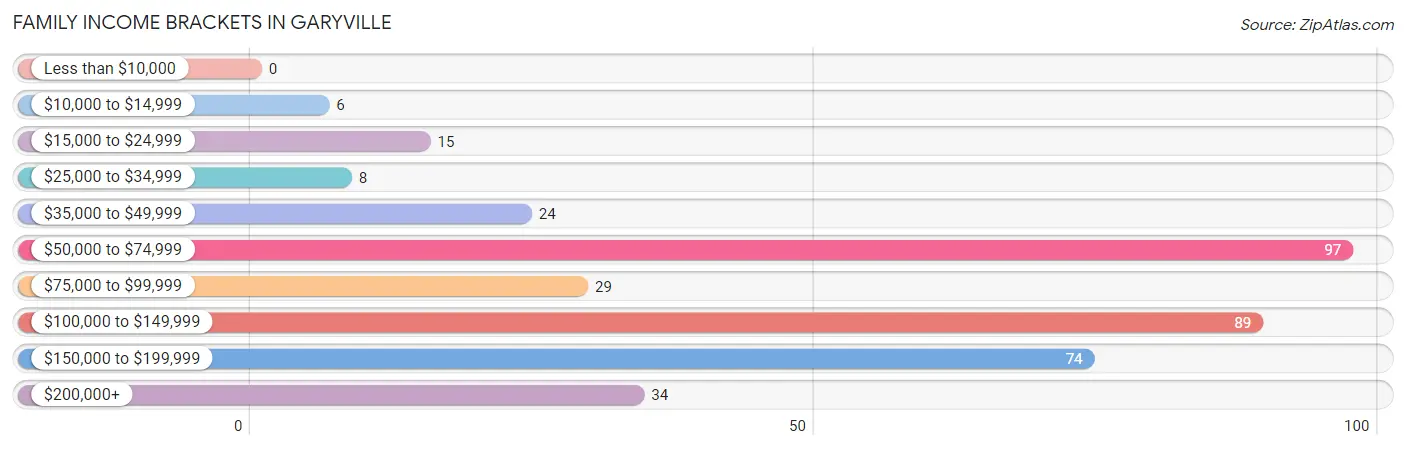
| Income Bracket | # Families | % Families |
| Less than $10,000 | 0 | 0.0% |
| $10,000 to $14,999 | 6 | 1.6% |
| $15,000 to $24,999 | 15 | 4.0% |
| $25,000 to $34,999 | 8 | 2.1% |
| $35,000 to $49,999 | 24 | 6.4% |
| $50,000 to $74,999 | 97 | 25.8% |
| $75,000 to $99,999 | 29 | 7.7% |
| $100,000 to $149,999 | 89 | 23.7% |
| $150,000 to $199,999 | 74 | 19.7% |
| $200,000+ | 34 | 9.0% |
Family Income by Famaliy Size in Garyville
4-person families (61 | 16.2%) account for the highest median family income in Garyville with $166,125 per family, while 4-person families (61 | 16.2%) have the highest median income of $41,531 per family member.
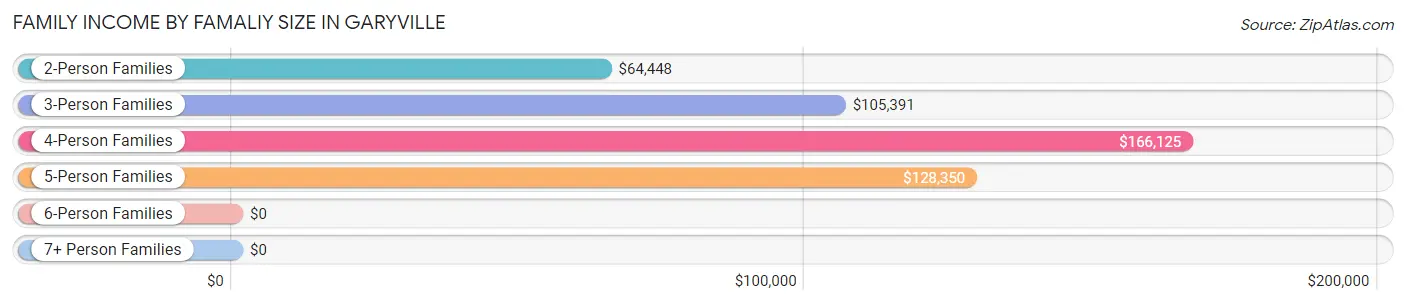
| Income Bracket | # Families | Median Income |
| 2-Person Families | 139 (37.0%) | $64,448 |
| 3-Person Families | 87 (23.1%) | $105,391 |
| 4-Person Families | 61 (16.2%) | $166,125 |
| 5-Person Families | 89 (23.7%) | $128,350 |
| 6-Person Families | 0 (0.0%) | $0 |
| 7+ Person Families | 0 (0.0%) | $0 |
| Total | 376 (100.0%) | $105,750 |
Family Income by Number of Earners in Garyville
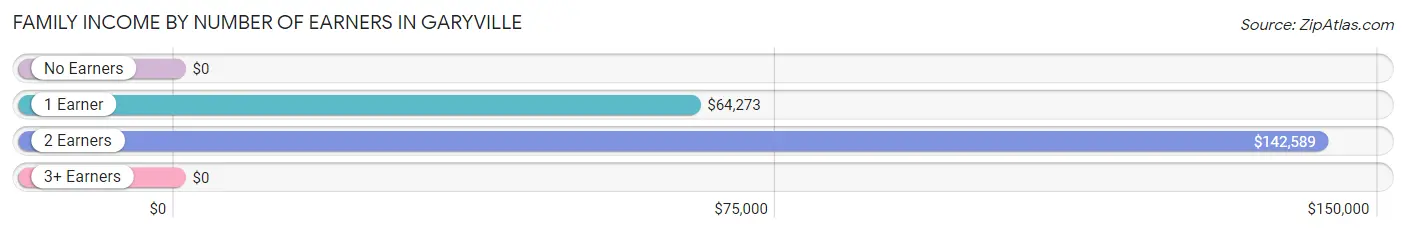
| Number of Earners | # Families | Median Income |
| No Earners | 46 (12.2%) | $0 |
| 1 Earner | 91 (24.2%) | $64,273 |
| 2 Earners | 210 (55.8%) | $142,589 |
| 3+ Earners | 29 (7.7%) | $0 |
| Total | 376 (100.0%) | $105,750 |
Household Income in Garyville
Household Income Brackets in Garyville
With 143 households falling in the category, the $150,000 to $199,999 income range is the most frequent in Garyville, accounting for 20.8% of all households. In contrast, only 8 households (1.2%) fall into the $25,000 to $34,999 income bracket, making it the least populous group.
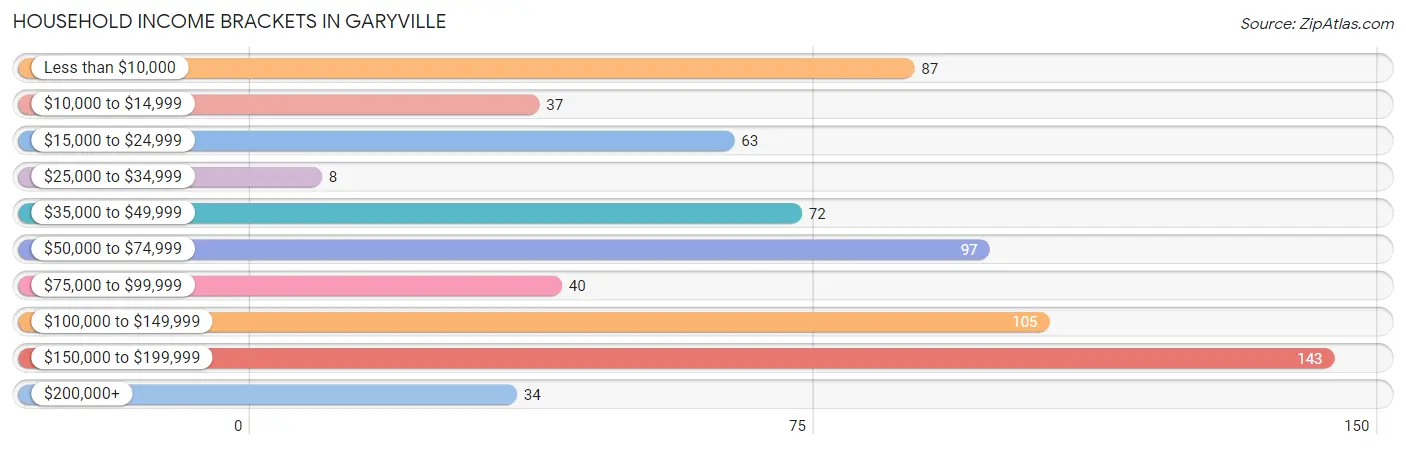
| Income Bracket | # Households | % Households |
| Less than $10,000 | 87 | 12.7% |
| $10,000 to $14,999 | 37 | 5.4% |
| $15,000 to $24,999 | 63 | 9.2% |
| $25,000 to $34,999 | 8 | 1.2% |
| $35,000 to $49,999 | 72 | 10.5% |
| $50,000 to $74,999 | 97 | 14.1% |
| $75,000 to $99,999 | 40 | 5.8% |
| $100,000 to $149,999 | 105 | 15.3% |
| $150,000 to $199,999 | 143 | 20.8% |
| $200,000+ | 34 | 5.0% |
Household Income by Householder Age in Garyville
The median household income in Garyville is $64,261, with the highest median household income of $143,259 found in the 25 to 44 years age bracket for the primary householder. A total of 109 households (15.9%) fall into this category.
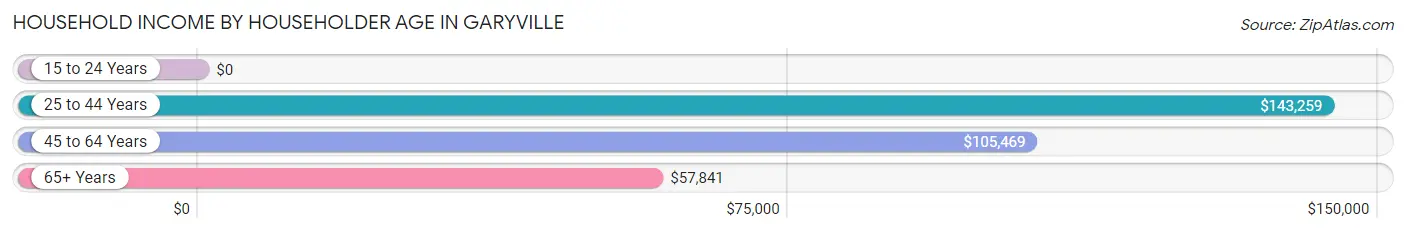
| Income Bracket | # Households | Median Income |
| 15 to 24 Years | 0 (0.0%) | $0 |
| 25 to 44 Years | 109 (15.9%) | $143,259 |
| 45 to 64 Years | 282 (41.1%) | $105,469 |
| 65+ Years | 295 (43.0%) | $57,841 |
| Total | 686 (100.0%) | $64,261 |
Poverty in Garyville
Income Below Poverty by Sex and Age in Garyville
With 11.1% poverty level for males and 25.9% for females among the residents of Garyville, under 5 year old males and 75 year old and over females are the most vulnerable to poverty, with 4 males (100.0%) and 65 females (69.2%) in their respective age groups living below the poverty level.
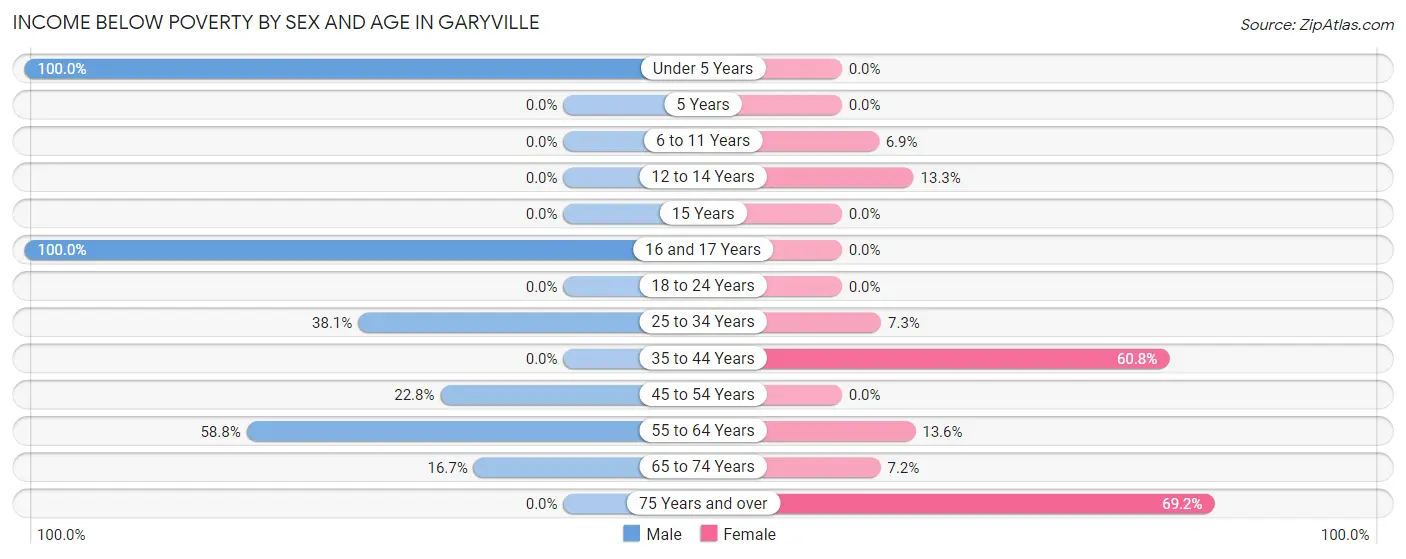
| Age Bracket | Male | Female |
| Under 5 Years | 4 (100.0%) | 0 (0.0%) |
| 5 Years | 0 (0.0%) | 0 (0.0%) |
| 6 to 11 Years | 0 (0.0%) | 10 (6.9%) |
| 12 to 14 Years | 0 (0.0%) | 14 (13.3%) |
| 15 Years | 0 (0.0%) | 0 (0.0%) |
| 16 and 17 Years | 17 (100.0%) | 0 (0.0%) |
| 18 to 24 Years | 0 (0.0%) | 0 (0.0%) |
| 25 to 34 Years | 8 (38.1%) | 7 (7.3%) |
| 35 to 44 Years | 0 (0.0%) | 195 (60.8%) |
| 45 to 54 Years | 45 (22.8%) | 0 (0.0%) |
| 55 to 64 Years | 10 (58.8%) | 21 (13.6%) |
| 65 to 74 Years | 11 (16.7%) | 11 (7.2%) |
| 75 Years and over | 0 (0.0%) | 65 (69.2%) |
| Total | 95 (11.1%) | 323 (25.9%) |
Income Above Poverty by Sex and Age in Garyville
According to the poverty statistics in Garyville, males aged 5 years and females aged under 5 years are the age groups that are most secure financially, with 100.0% of males and 100.0% of females in these age groups living above the poverty line.
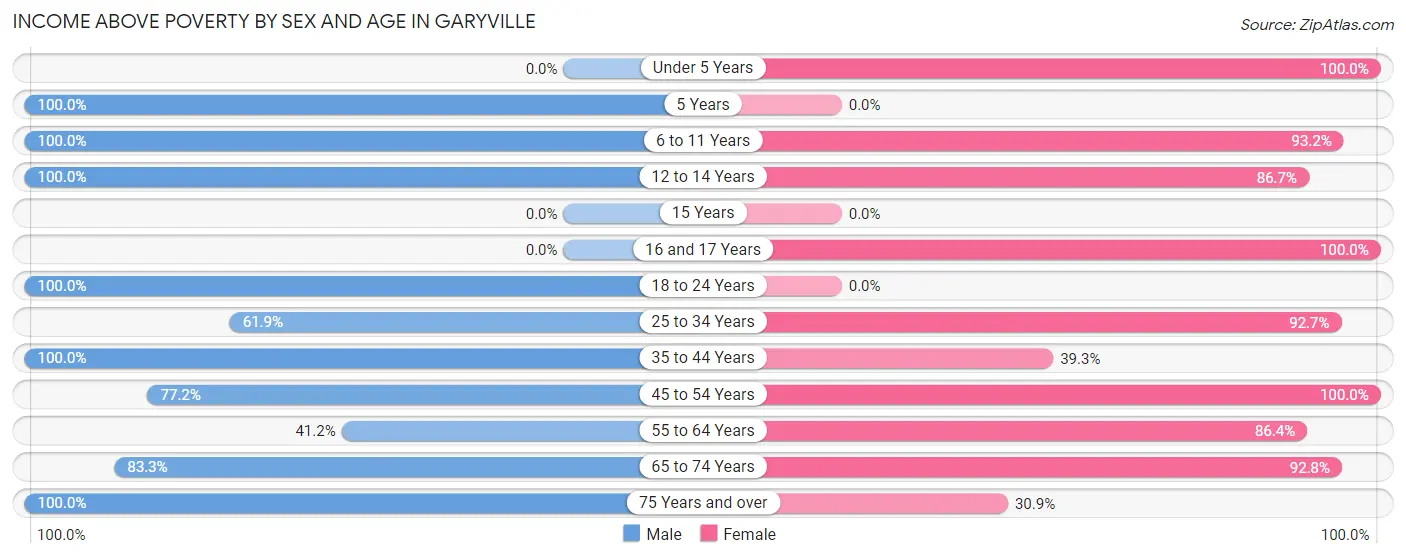
| Age Bracket | Male | Female |
| Under 5 Years | 0 (0.0%) | 49 (100.0%) |
| 5 Years | 8 (100.0%) | 0 (0.0%) |
| 6 to 11 Years | 107 (100.0%) | 136 (93.1%) |
| 12 to 14 Years | 68 (100.0%) | 91 (86.7%) |
| 15 Years | 0 (0.0%) | 0 (0.0%) |
| 16 and 17 Years | 0 (0.0%) | 31 (100.0%) |
| 18 to 24 Years | 79 (100.0%) | 0 (0.0%) |
| 25 to 34 Years | 13 (61.9%) | 89 (92.7%) |
| 35 to 44 Years | 223 (100.0%) | 126 (39.3%) |
| 45 to 54 Years | 152 (77.2%) | 100 (100.0%) |
| 55 to 64 Years | 7 (41.2%) | 133 (86.4%) |
| 65 to 74 Years | 55 (83.3%) | 142 (92.8%) |
| 75 Years and over | 52 (100.0%) | 29 (30.8%) |
| Total | 764 (88.9%) | 926 (74.1%) |
Income Below Poverty Among Married-Couple Families in Garyville
The poverty statistics for married-couple families in Garyville show that 8.9% or 23 of the total 259 families live below the poverty line. Families with 3 or 4 children have the highest poverty rate of 22.2%, comprising of 8 families. On the other hand, families with no children have the lowest poverty rate of 3.7%, which includes 5 families.
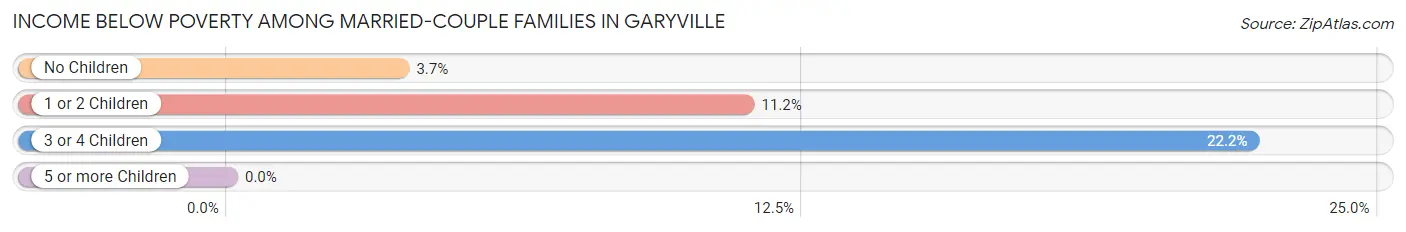
| Children | Above Poverty | Below Poverty |
| No Children | 129 (96.3%) | 5 (3.7%) |
| 1 or 2 Children | 79 (88.8%) | 10 (11.2%) |
| 3 or 4 Children | 28 (77.8%) | 8 (22.2%) |
| 5 or more Children | 0 (0.0%) | 0 (0.0%) |
| Total | 236 (91.1%) | 23 (8.9%) |
Income Below Poverty Among Single-Parent Households in Garyville
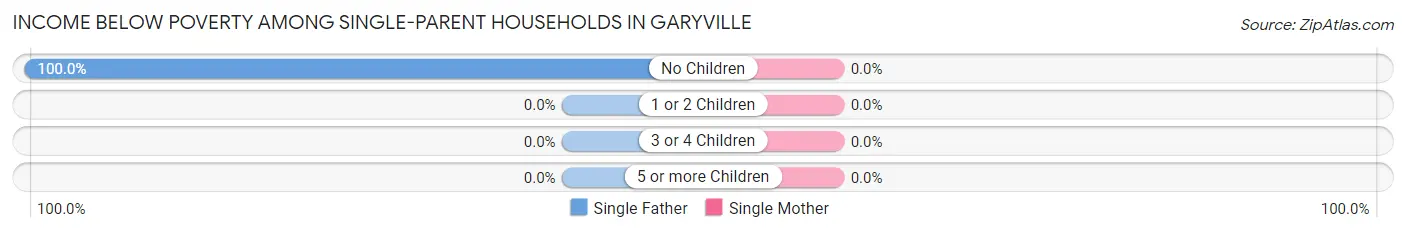
| Children | Single Father | Single Mother |
| No Children | 6 (100.0%) | 0 (0.0%) |
| 1 or 2 Children | 0 (0.0%) | 0 (0.0%) |
| 3 or 4 Children | 0 (0.0%) | 0 (0.0%) |
| 5 or more Children | 0 (0.0%) | 0 (0.0%) |
| Total | 6 (100.0%) | 0 (0.0%) |
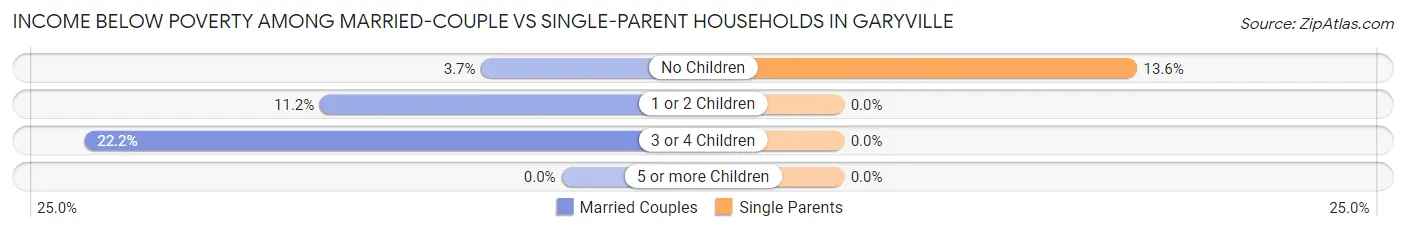
Income Below Poverty Among Married-Couple vs Single-Parent Households in Garyville
The poverty data for Garyville shows that 23 of the married-couple family households (8.9%) and 6 of the single-parent households (5.1%) are living below the poverty level. Within the married-couple family households, those with 3 or 4 children have the highest poverty rate, with 8 households (22.2%) falling below the poverty line. Among the single-parent households, those with no children have the highest poverty rate, with 6 household (13.6%) living below poverty.
| Children | Married-Couple Families | Single-Parent Households |
| No Children | 5 (3.7%) | 6 (13.6%) |
| 1 or 2 Children | 10 (11.2%) | 0 (0.0%) |
| 3 or 4 Children | 8 (22.2%) | 0 (0.0%) |
| 5 or more Children | 0 (0.0%) | 0 (0.0%) |
| Total | 23 (8.9%) | 6 (5.1%) |
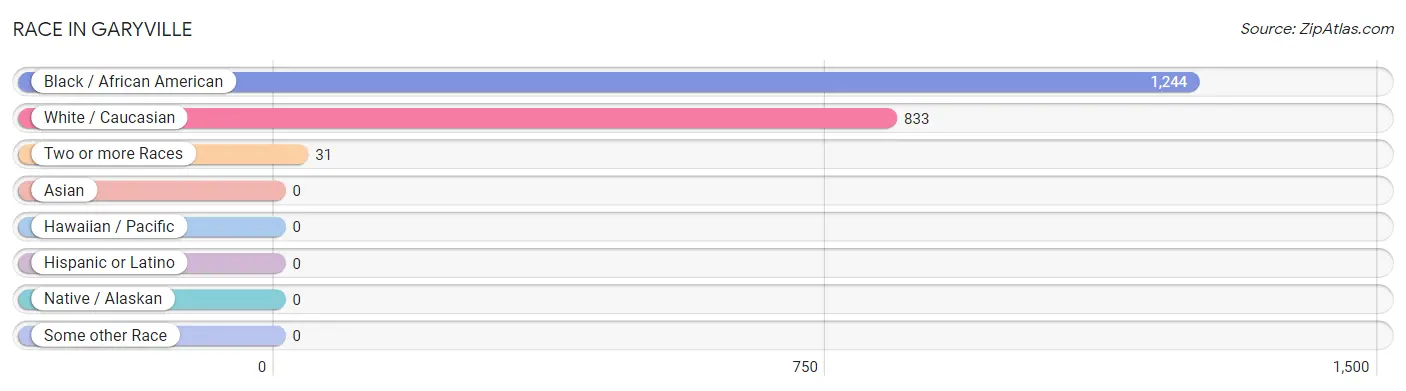
Race in Garyville
The most populous races in Garyville are Black / African American (1,244 | 59.0%), White / Caucasian (833 | 39.5%), and Two or more Races (31 | 1.5%).
| Race | # Population | % Population |
| Asian | 0 | 0.0% |
| Black / African American | 1,244 | 59.0% |
| Hawaiian / Pacific | 0 | 0.0% |
| Hispanic or Latino | 0 | 0.0% |
| Native / Alaskan | 0 | 0.0% |
| White / Caucasian | 833 | 39.5% |
| Two or more Races | 31 | 1.5% |
| Some other Race | 0 | 0.0% |
| Total | 2,108 | 100.0% |
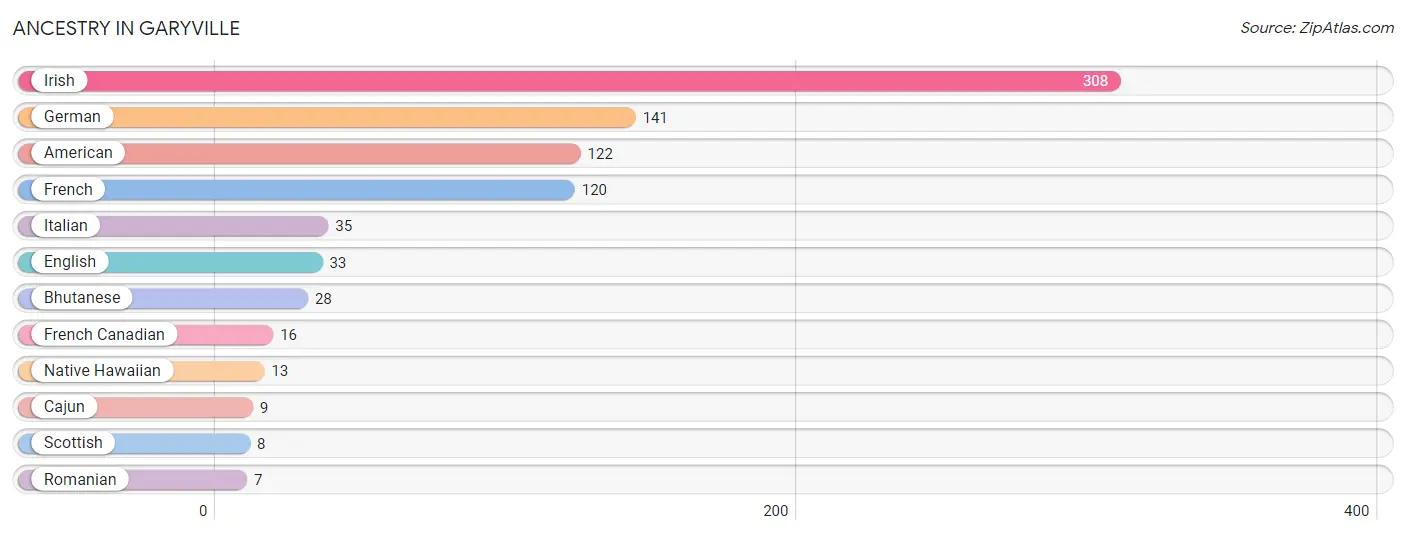
Ancestry in Garyville
The most populous ancestries reported in Garyville are Irish (308 | 14.6%), German (141 | 6.7%), American (122 | 5.8%), French (120 | 5.7%), and Italian (35 | 1.7%), together accounting for 34.4% of all Garyville residents.
| Ancestry | # Population | % Population |
| American | 122 | 5.8% |
| Bhutanese | 28 | 1.3% |
| Cajun | 9 | 0.4% |
| English | 33 | 1.6% |
| French | 120 | 5.7% |
| French Canadian | 16 | 0.8% |
| German | 141 | 6.7% |
| Irish | 308 | 14.6% |
| Italian | 35 | 1.7% |
| Native Hawaiian | 13 | 0.6% |
| Romanian | 7 | 0.3% |
| Scottish | 8 | 0.4% | View All 12 Rows |
Immigrants in Garyville

| Immigration Origin | # Population | % Population | View All 0 Rows |
Sex and Age in Garyville
Sex and Age in Garyville
The most populous age groups in Garyville are 35 to 39 Years (140 | 16.3%) for men and 40 to 44 Years (271 | 21.7%) for women.
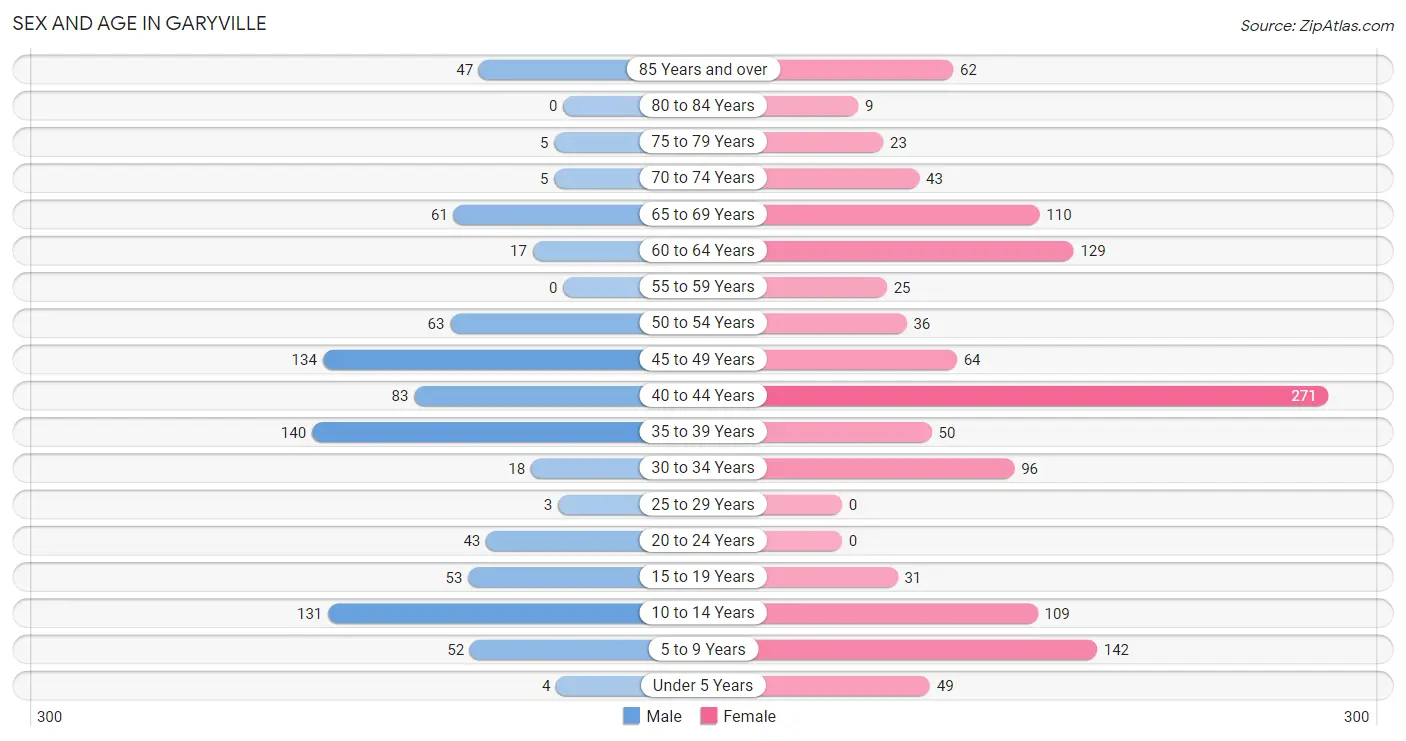
| Age Bracket | Male | Female |
| Under 5 Years | 4 (0.5%) | 49 (3.9%) |
| 5 to 9 Years | 52 (6.0%) | 142 (11.4%) |
| 10 to 14 Years | 131 (15.2%) | 109 (8.7%) |
| 15 to 19 Years | 53 (6.2%) | 31 (2.5%) |
| 20 to 24 Years | 43 (5.0%) | 0 (0.0%) |
| 25 to 29 Years | 3 (0.4%) | 0 (0.0%) |
| 30 to 34 Years | 18 (2.1%) | 96 (7.7%) |
| 35 to 39 Years | 140 (16.3%) | 50 (4.0%) |
| 40 to 44 Years | 83 (9.7%) | 271 (21.7%) |
| 45 to 49 Years | 134 (15.6%) | 64 (5.1%) |
| 50 to 54 Years | 63 (7.3%) | 36 (2.9%) |
| 55 to 59 Years | 0 (0.0%) | 25 (2.0%) |
| 60 to 64 Years | 17 (2.0%) | 129 (10.3%) |
| 65 to 69 Years | 61 (7.1%) | 110 (8.8%) |
| 70 to 74 Years | 5 (0.6%) | 43 (3.4%) |
| 75 to 79 Years | 5 (0.6%) | 23 (1.8%) |
| 80 to 84 Years | 0 (0.0%) | 9 (0.7%) |
| 85 Years and over | 47 (5.5%) | 62 (5.0%) |
| Total | 859 (100.0%) | 1,249 (100.0%) |
Families and Households in Garyville
Median Family Size in Garyville
The median family size in Garyville is 4.25 persons per family, with single female/mother families (111 | 29.5%) accounting for the largest median family size of 5.42 persons per family. On the other hand, single male/father families (6 | 1.6%) represent the smallest median family size with 3.33 persons per family.
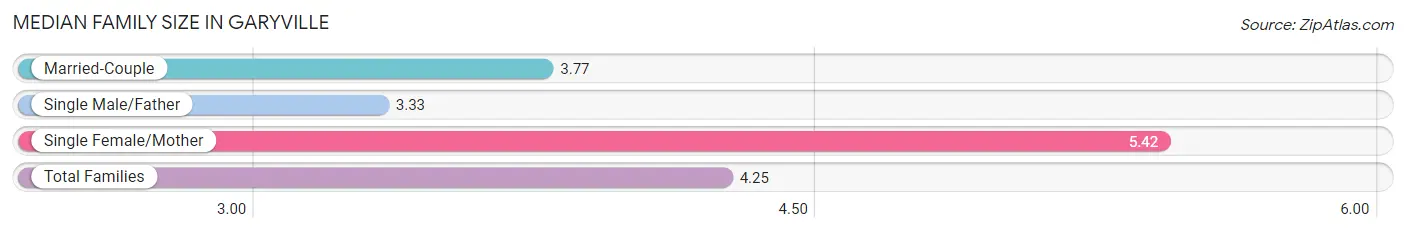
| Family Type | # Families | Family Size |
| Married-Couple | 259 (68.9%) | 3.77 |
| Single Male/Father | 6 (1.6%) | 3.33 |
| Single Female/Mother | 111 (29.5%) | 5.42 |
| Total Families | 376 (100.0%) | 4.25 |
Median Household Size in Garyville
The median household size in Garyville is 3.07 persons per household, with single female/mother households (111 | 16.2%) accounting for the largest median household size of 5.51 persons per household. non-family households (310 | 45.2%) represent the smallest median household size with 1.58 persons per household.
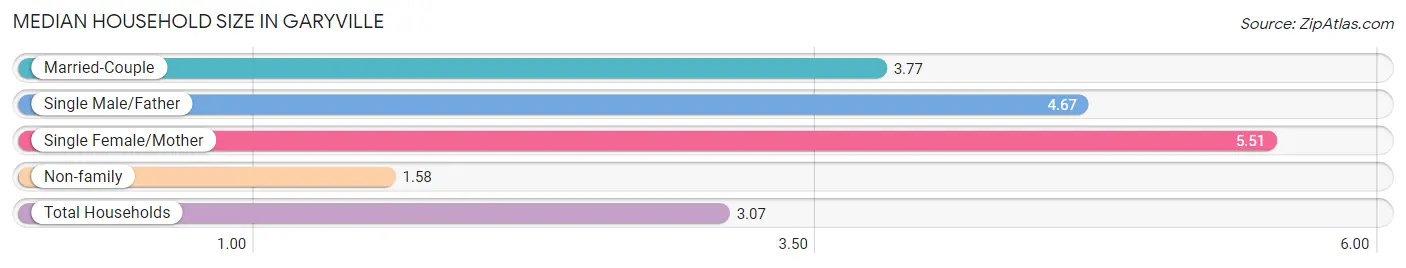
| Household Type | # Households | Household Size |
| Married-Couple | 259 (37.8%) | 3.77 |
| Single Male/Father | 6 (0.9%) | 4.67 |
| Single Female/Mother | 111 (16.2%) | 5.51 |
| Non-family | 310 (45.2%) | 1.58 |
| Total Households | 686 (100.0%) | 3.07 |
Household Size by Marriage Status in Garyville
Out of a total of 686 households in Garyville, 376 (54.8%) are family households, while 310 (45.2%) are nonfamily households. The most numerous type of family households are 2-person households, comprising 133, and the most common type of nonfamily households are 1-person households, comprising 241.
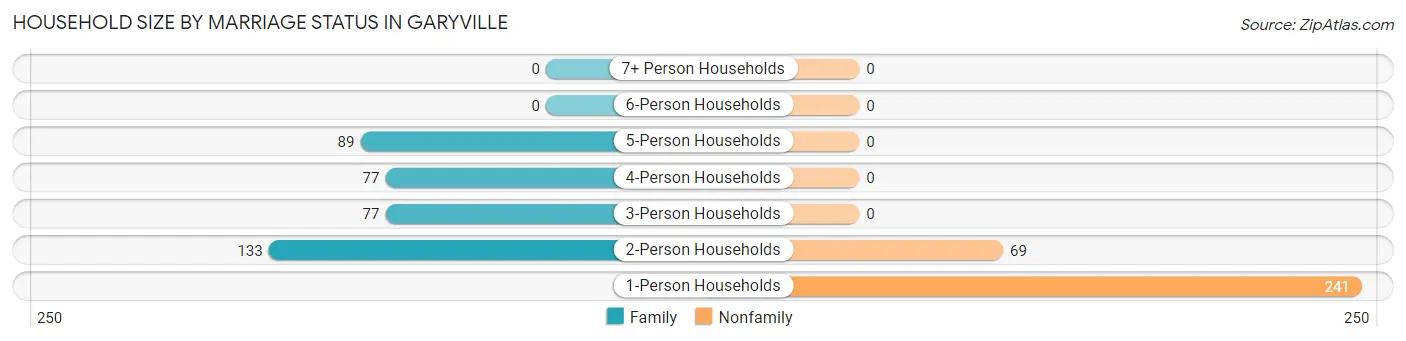
| Household Size | Family Households | Nonfamily Households |
| 1-Person Households | - | 241 (35.1%) |
| 2-Person Households | 133 (19.4%) | 69 (10.1%) |
| 3-Person Households | 77 (11.2%) | 0 (0.0%) |
| 4-Person Households | 77 (11.2%) | 0 (0.0%) |
| 5-Person Households | 89 (13.0%) | 0 (0.0%) |
| 6-Person Households | 0 (0.0%) | 0 (0.0%) |
| 7+ Person Households | 0 (0.0%) | 0 (0.0%) |
| Total | 376 (54.8%) | 310 (45.2%) |
Female Fertility in Garyville
Fertility by Age in Garyville
| Age Bracket | Women with Births | Births / 1,000 Women |
| 15 to 19 years | 0 (0.0%) | 0.0 |
| 20 to 34 years | 0 (0.0%) | 0.0 |
| 35 to 50 years | 0 (0.0%) | 0.0 |
| Total | 0 (0.0%) | 0.0 |
Fertility by Age by Marriage Status in Garyville
| Age Bracket | Married | Unmarried |
| 15 to 19 years | 0 (0.0%) | 0 (0.0%) |
| 20 to 34 years | 0 (0.0%) | 0 (0.0%) |
| 35 to 50 years | 0 (0.0%) | 0 (0.0%) |
| Total | 0 (0.0%) | 0 (0.0%) |
Fertility by Education in Garyville
| Educational Attainment | Women with Births | Births / 1,000 Women |
| Less than High School | 0 (0.0%) | 0.0 |
| High School Diploma | 0 (0.0%) | 0.0 |
| College or Associate's Degree | 0 (0.0%) | 0.0 |
| Bachelor's Degree | 0 (0.0%) | 0.0 |
| Graduate Degree | 0 (0.0%) | 0.0 |
| Total | 0 (0.0%) | 0.0 |
Fertility by Education by Marriage Status in Garyville
| Educational Attainment | Married | Unmarried |
| Less than High School | 0 (0.0%) | 0 (0.0%) |
| High School Diploma | 0 (0.0%) | 0 (0.0%) |
| College or Associate's Degree | 0 (0.0%) | 0 (0.0%) |
| Bachelor's Degree | 0 (0.0%) | 0 (0.0%) |
| Graduate Degree | 0 (0.0%) | 0 (0.0%) |
| Total | 0 (0.0%) | 0 (0.0%) |
Employment Characteristics in Garyville
Employment by Class of Employer in Garyville
Among the 745 employed individuals in Garyville, private company employees (492 | 66.0%), not-for-profit organizations (105 | 14.1%), and self-employed (not incorporated) (57 | 7.6%) make up the most common classes of employment.
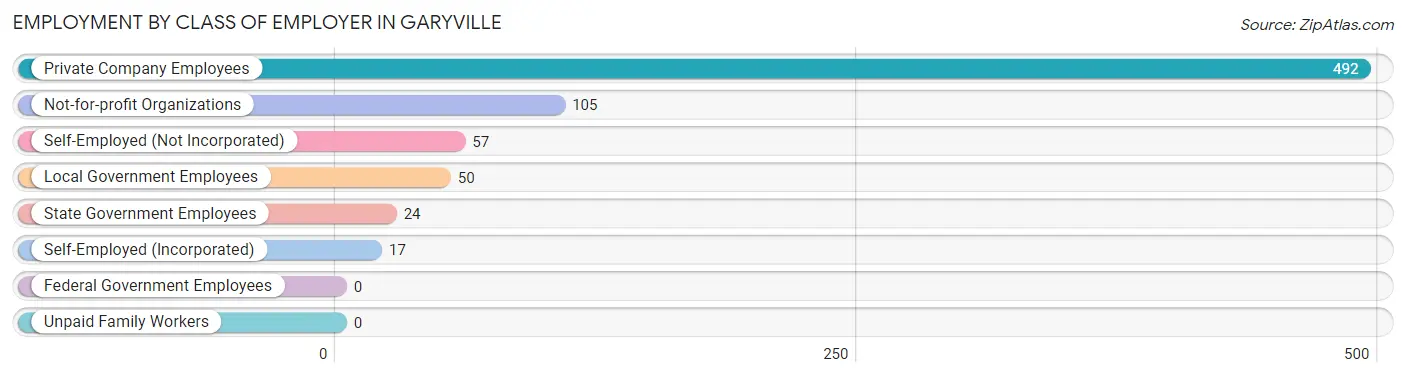
| Employer Class | # Employees | % Employees |
| Private Company Employees | 492 | 66.0% |
| Self-Employed (Incorporated) | 17 | 2.3% |
| Self-Employed (Not Incorporated) | 57 | 7.6% |
| Not-for-profit Organizations | 105 | 14.1% |
| Local Government Employees | 50 | 6.7% |
| State Government Employees | 24 | 3.2% |
| Federal Government Employees | 0 | 0.0% |
| Unpaid Family Workers | 0 | 0.0% |
| Total | 745 | 100.0% |
Employment Status by Age in Garyville
According to the labor force statistics for Garyville, out of the total population over 16 years of age (1,621), 47.7% or 773 individuals are in the labor force, with 3.7% or 29 of them unemployed. The age group with the highest labor force participation rate is 20 to 24 years, with 100.0% or 43 individuals in the labor force. Within the labor force, the 35 to 44 years age range has the highest percentage of unemployed individuals, with 11.4% or 29 of them being unemployed.
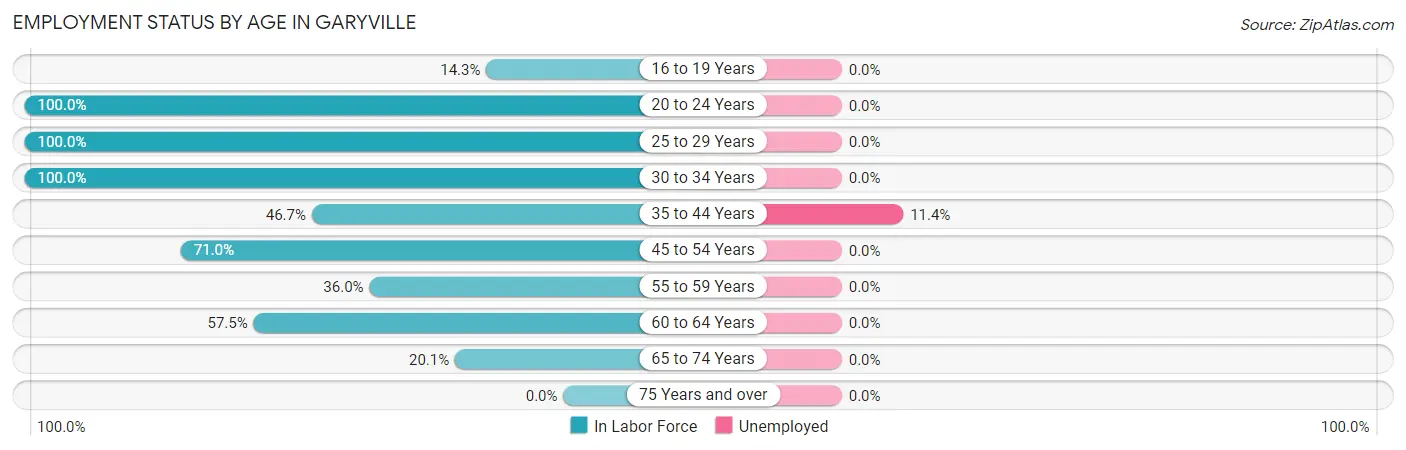
| Age Bracket | In Labor Force | Unemployed |
| 16 to 19 Years | 12 (14.3%) | 0 (0.0%) |
| 20 to 24 Years | 43 (100.0%) | 0 (0.0%) |
| 25 to 29 Years | 3 (100.0%) | 0 (0.0%) |
| 30 to 34 Years | 114 (100.0%) | 0 (0.0%) |
| 35 to 44 Years | 254 (46.7%) | 29 (11.4%) |
| 45 to 54 Years | 211 (71.0%) | 0 (0.0%) |
| 55 to 59 Years | 9 (36.0%) | 0 (0.0%) |
| 60 to 64 Years | 84 (57.5%) | 0 (0.0%) |
| 65 to 74 Years | 44 (20.1%) | 0 (0.0%) |
| 75 Years and over | 0 (0.0%) | 0 (0.0%) |
| Total | 773 (47.7%) | 29 (3.7%) |
Employment Status by Educational Attainment in Garyville
According to labor force statistics for Garyville, 59.8% of individuals (675) out of the total population between 25 and 64 years of age (1,129) are in the labor force, with 4.3% or 29 of them being unemployed. The group with the highest labor force participation rate are those with the educational attainment of bachelor's degree or higher, with 100.0% or 81 individuals in the labor force. Within the labor force, individuals with less than high school education have the highest percentage of unemployment, with 8.1% or 11 of them being unemployed.
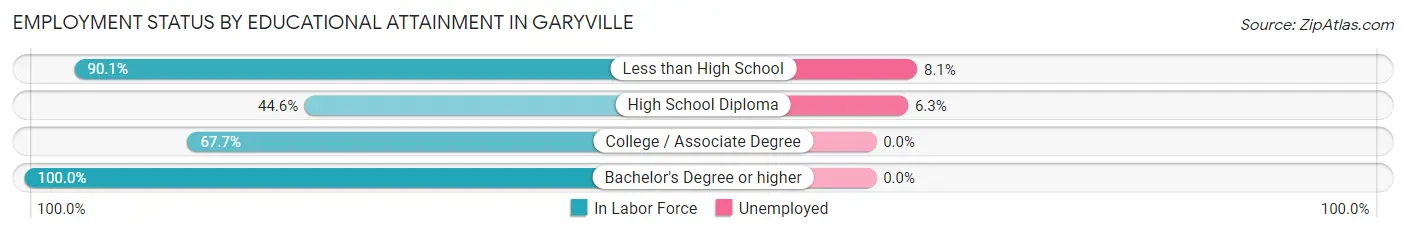
| Educational Attainment | In Labor Force | Unemployed |
| Less than High School | 136 (90.1%) | 12 (8.1%) |
| High School Diploma | 288 (44.6%) | 41 (6.3%) |
| College / Associate Degree | 170 (67.7%) | 0 (0.0%) |
| Bachelor's Degree or higher | 81 (100.0%) | 0 (0.0%) |
| Total | 675 (59.8%) | 49 (4.3%) |
Employment Occupations by Sex in Garyville
Management, Business, Science and Arts Occupations
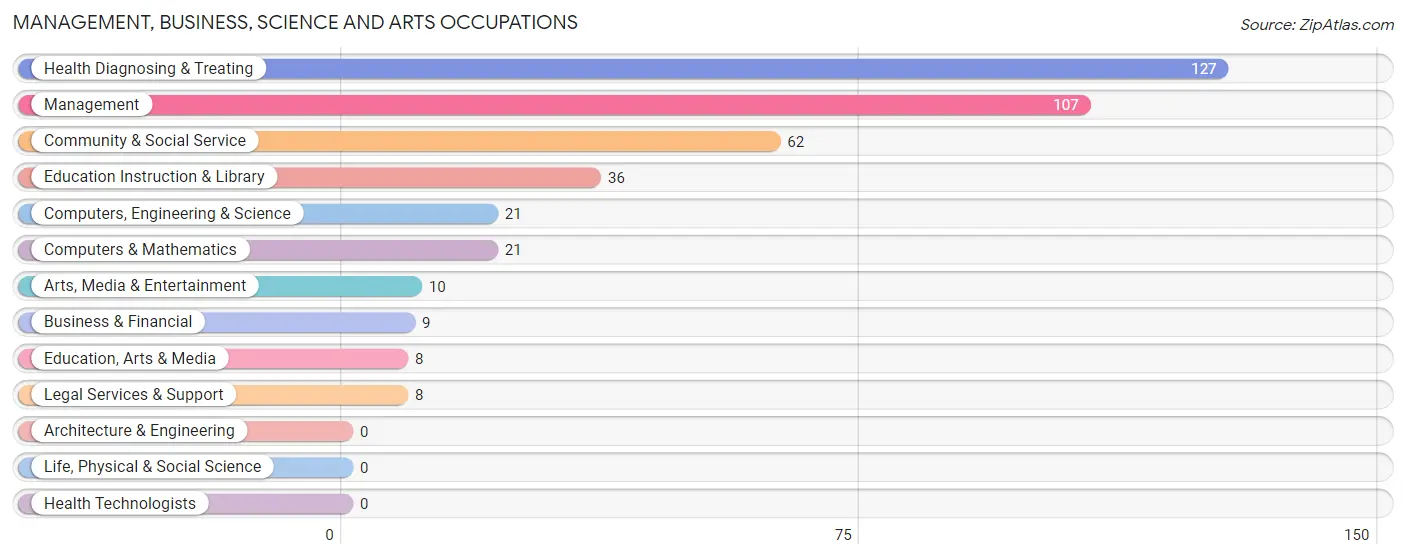
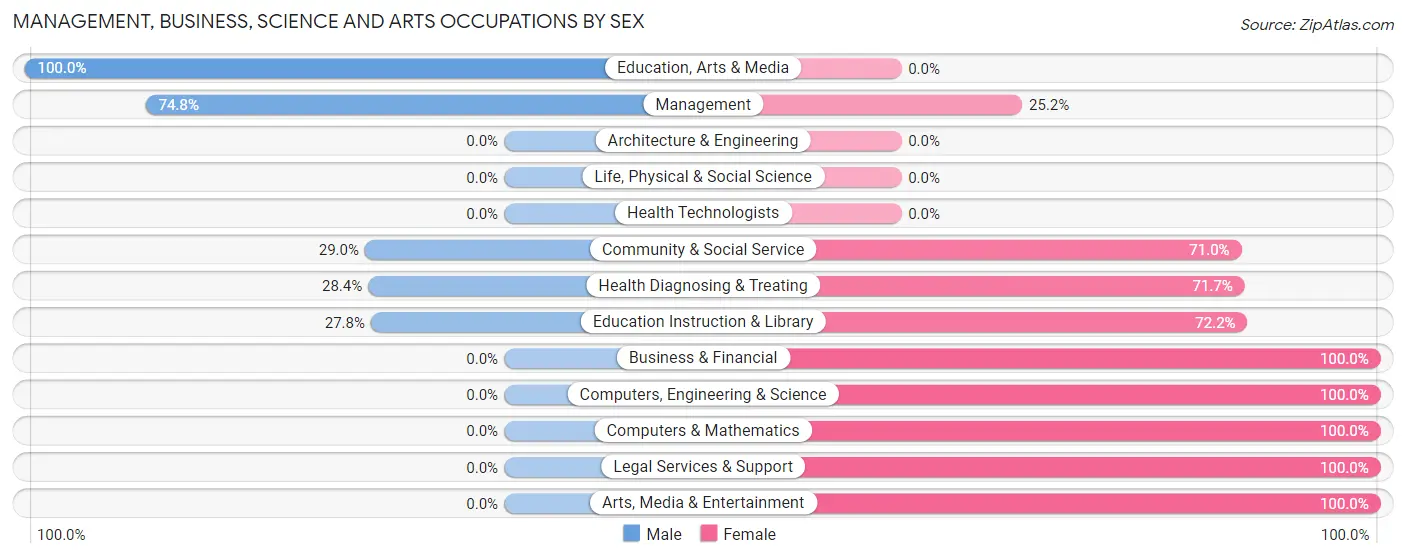
The most common Management, Business, Science and Arts occupations in Garyville are Health Diagnosing & Treating (127 | 17.1%), Management (107 | 14.4%), Community & Social Service (62 | 8.3%), Education Instruction & Library (36 | 4.8%), and Computers, Engineering & Science (21 | 2.8%).
Management, Business, Science and Arts Occupations by Sex
Within the Management, Business, Science and Arts occupations in Garyville, the most male-oriented occupations are Education, Arts & Media (100.0%), Management (74.8%), and Community & Social Service (29.0%), while the most female-oriented occupations are Business & Financial (100.0%), Computers, Engineering & Science (100.0%), and Computers & Mathematics (100.0%).
| Occupation | Male | Female |
| Management | 80 (74.8%) | 27 (25.2%) |
| Business & Financial | 0 (0.0%) | 9 (100.0%) |
| Computers, Engineering & Science | 0 (0.0%) | 21 (100.0%) |
| Computers & Mathematics | 0 (0.0%) | 21 (100.0%) |
| Architecture & Engineering | 0 (0.0%) | 0 (0.0%) |
| Life, Physical & Social Science | 0 (0.0%) | 0 (0.0%) |
| Community & Social Service | 18 (29.0%) | 44 (71.0%) |
| Education, Arts & Media | 8 (100.0%) | 0 (0.0%) |
| Legal Services & Support | 0 (0.0%) | 8 (100.0%) |
| Education Instruction & Library | 10 (27.8%) | 26 (72.2%) |
| Arts, Media & Entertainment | 0 (0.0%) | 10 (100.0%) |
| Health Diagnosing & Treating | 36 (28.3%) | 91 (71.7%) |
| Health Technologists | 0 (0.0%) | 0 (0.0%) |
| Total (Category) | 134 (41.1%) | 192 (58.9%) |
| Total (Overall) | 359 (48.2%) | 386 (51.8%) |
Services Occupations
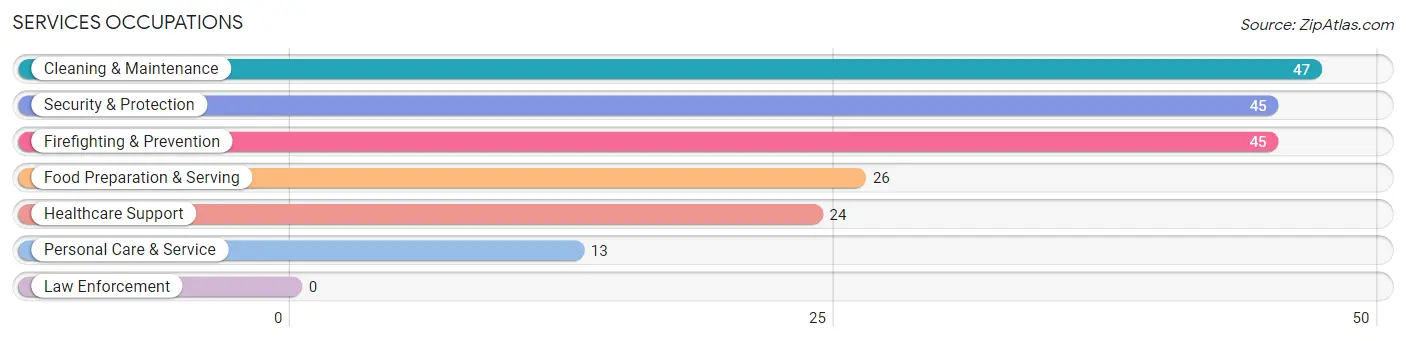
The most common Services occupations in Garyville are Cleaning & Maintenance (47 | 6.3%), Security & Protection (45 | 6.0%), Firefighting & Prevention (45 | 6.0%), Food Preparation & Serving (26 | 3.5%), and Healthcare Support (24 | 3.2%).
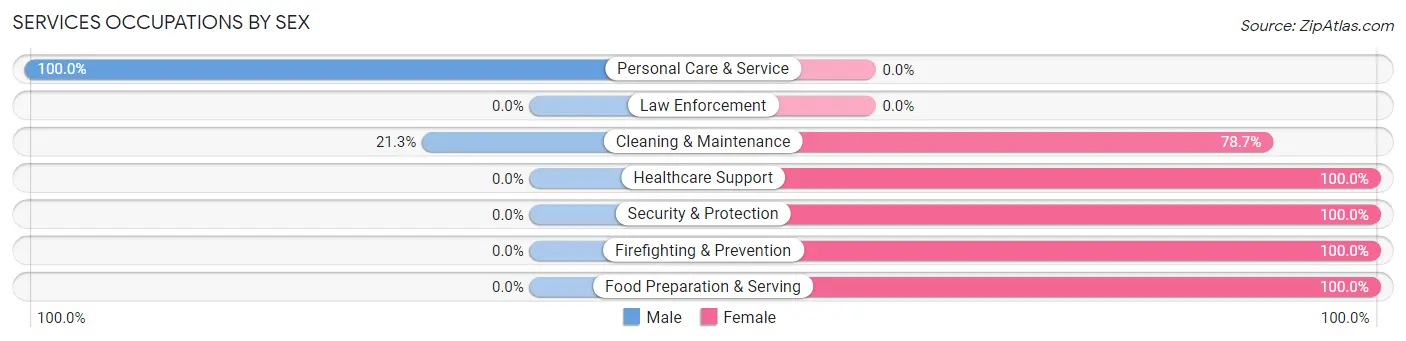
Services Occupations by Sex
Within the Services occupations in Garyville, the most male-oriented occupations are Personal Care & Service (100.0%), and Cleaning & Maintenance (21.3%), while the most female-oriented occupations are Healthcare Support (100.0%), Security & Protection (100.0%), and Firefighting & Prevention (100.0%).
| Occupation | Male | Female |
| Healthcare Support | 0 (0.0%) | 24 (100.0%) |
| Security & Protection | 0 (0.0%) | 45 (100.0%) |
| Firefighting & Prevention | 0 (0.0%) | 45 (100.0%) |
| Law Enforcement | 0 (0.0%) | 0 (0.0%) |
| Food Preparation & Serving | 0 (0.0%) | 26 (100.0%) |
| Cleaning & Maintenance | 10 (21.3%) | 37 (78.7%) |
| Personal Care & Service | 13 (100.0%) | 0 (0.0%) |
| Total (Category) | 23 (14.8%) | 132 (85.2%) |
| Total (Overall) | 359 (48.2%) | 386 (51.8%) |
Sales and Office Occupations
The most common Sales and Office occupations in Garyville are Office & Administration (50 | 6.7%), and Sales & Related (40 | 5.4%).

Sales and Office Occupations by Sex

| Occupation | Male | Female |
| Sales & Related | 0 (0.0%) | 40 (100.0%) |
| Office & Administration | 34 (68.0%) | 16 (32.0%) |
| Total (Category) | 34 (37.8%) | 56 (62.2%) |
| Total (Overall) | 359 (48.2%) | 386 (51.8%) |
Natural Resources, Construction and Maintenance Occupations
The most common Natural Resources, Construction and Maintenance occupations in Garyville are Installation, Maintenance & Repair (9 | 1.2%), and Construction & Extraction (6 | 0.8%).

Natural Resources, Construction and Maintenance Occupations by Sex

| Occupation | Male | Female |
| Farming, Fishing & Forestry | 0 (0.0%) | 0 (0.0%) |
| Construction & Extraction | 6 (100.0%) | 0 (0.0%) |
| Installation, Maintenance & Repair | 3 (33.3%) | 6 (66.7%) |
| Total (Category) | 9 (60.0%) | 6 (40.0%) |
| Total (Overall) | 359 (48.2%) | 386 (51.8%) |
Production, Transportation and Moving Occupations
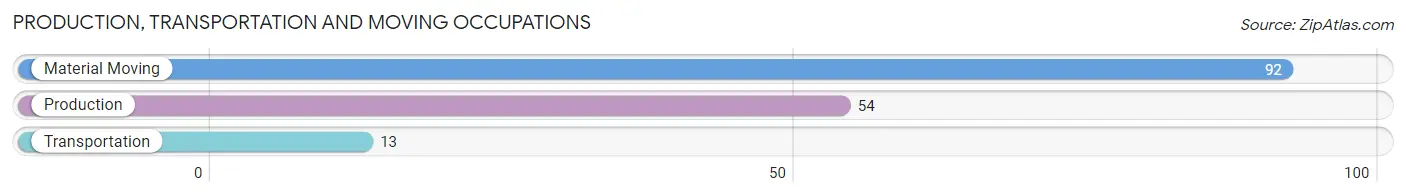
The most common Production, Transportation and Moving occupations in Garyville are Material Moving (92 | 12.3%), Production (54 | 7.2%), and Transportation (13 | 1.7%).
Production, Transportation and Moving Occupations by Sex
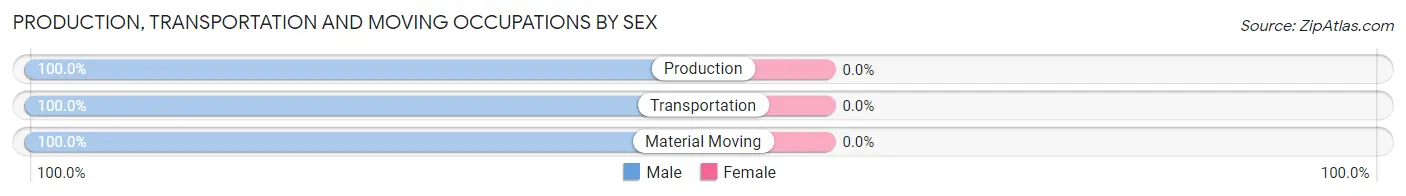
| Occupation | Male | Female |
| Production | 54 (100.0%) | 0 (0.0%) |
| Transportation | 13 (100.0%) | 0 (0.0%) |
| Material Moving | 92 (100.0%) | 0 (0.0%) |
| Total (Category) | 159 (100.0%) | 0 (0.0%) |
| Total (Overall) | 359 (48.2%) | 386 (51.8%) |
Employment Industries by Sex in Garyville
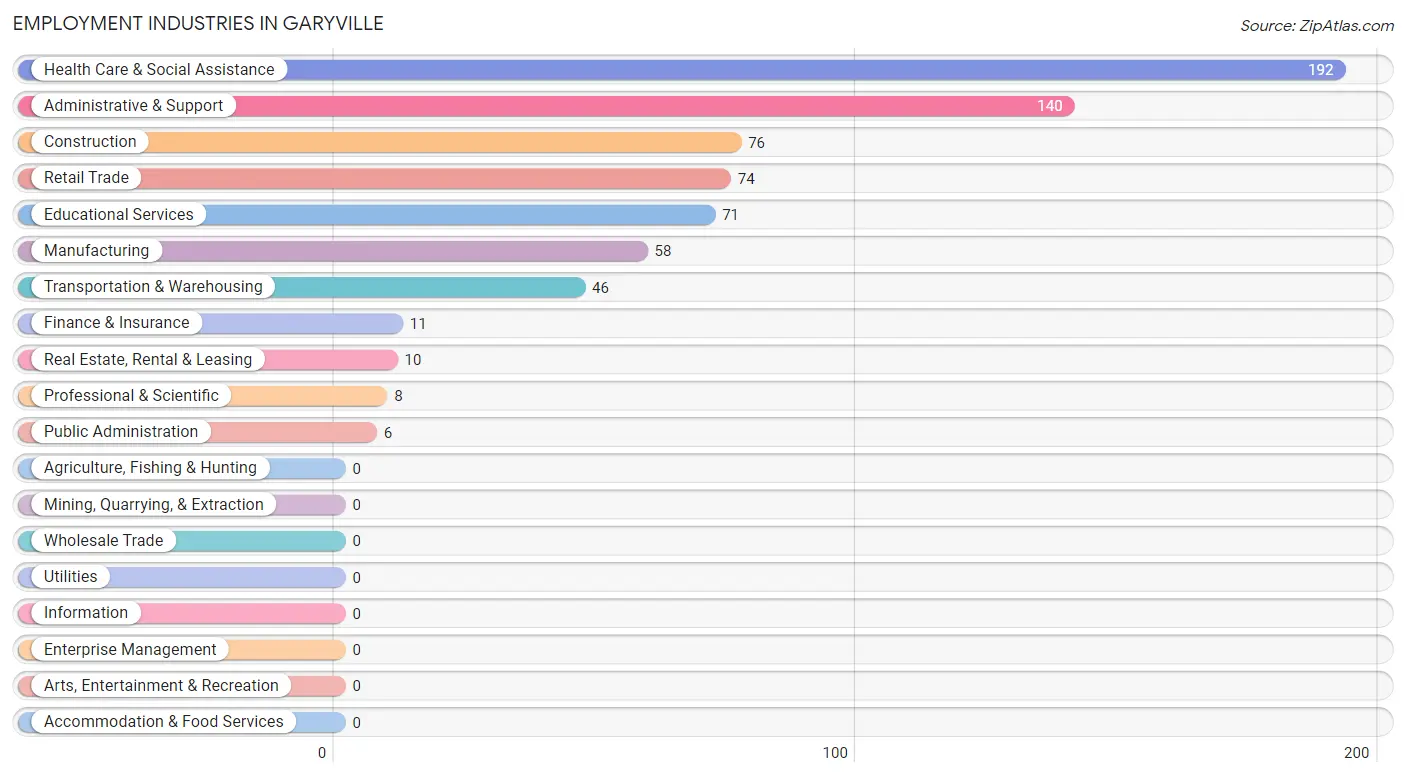
Employment Industries in Garyville
The major employment industries in Garyville include Health Care & Social Assistance (192 | 25.8%), Administrative & Support (140 | 18.8%), Construction (76 | 10.2%), Retail Trade (74 | 9.9%), and Educational Services (71 | 9.5%).
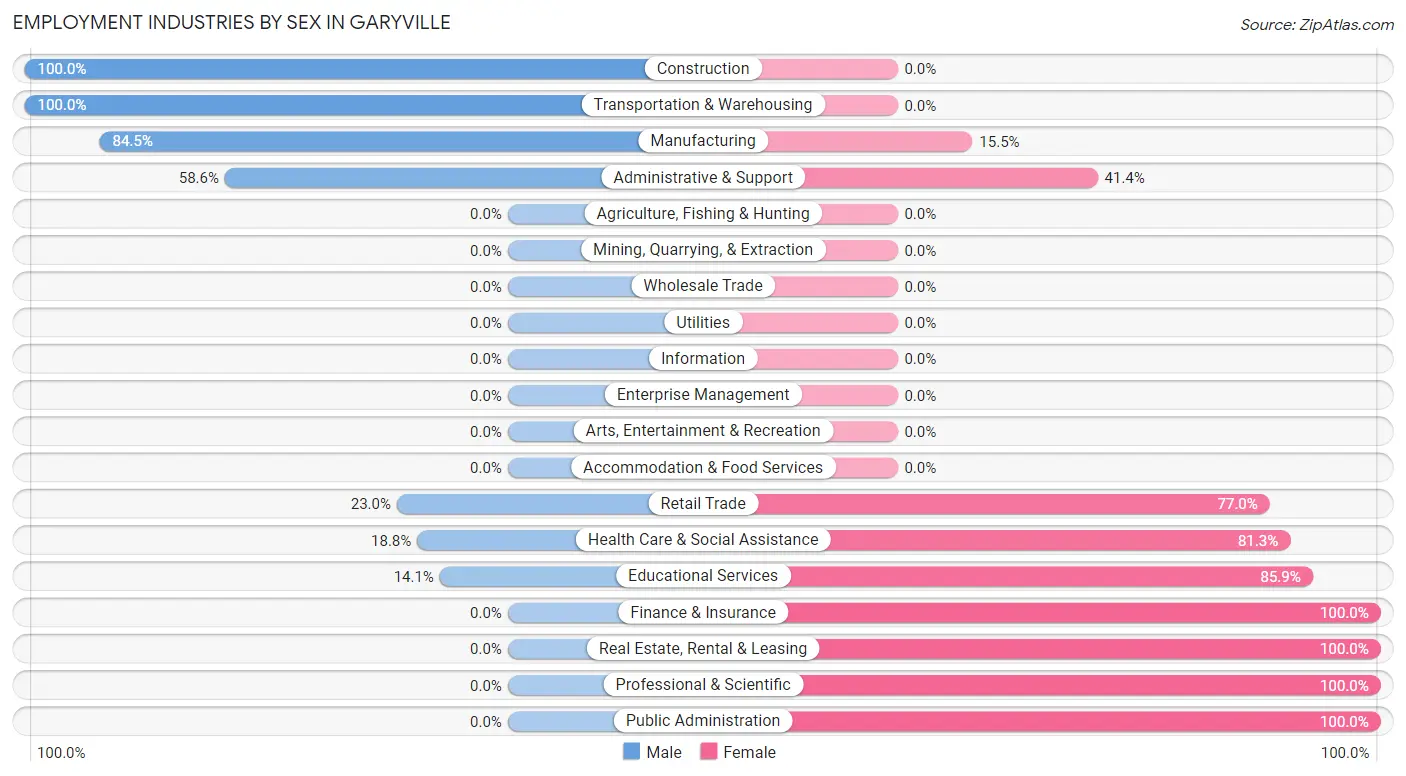
Employment Industries by Sex in Garyville
The Garyville industries that see more men than women are Construction (100.0%), Transportation & Warehousing (100.0%), and Manufacturing (84.5%), whereas the industries that tend to have a higher number of women are Finance & Insurance (100.0%), Real Estate, Rental & Leasing (100.0%), and Professional & Scientific (100.0%).
| Industry | Male | Female |
| Agriculture, Fishing & Hunting | 0 (0.0%) | 0 (0.0%) |
| Mining, Quarrying, & Extraction | 0 (0.0%) | 0 (0.0%) |
| Construction | 76 (100.0%) | 0 (0.0%) |
| Manufacturing | 49 (84.5%) | 9 (15.5%) |
| Wholesale Trade | 0 (0.0%) | 0 (0.0%) |
| Retail Trade | 17 (23.0%) | 57 (77.0%) |
| Transportation & Warehousing | 46 (100.0%) | 0 (0.0%) |
| Utilities | 0 (0.0%) | 0 (0.0%) |
| Information | 0 (0.0%) | 0 (0.0%) |
| Finance & Insurance | 0 (0.0%) | 11 (100.0%) |
| Real Estate, Rental & Leasing | 0 (0.0%) | 10 (100.0%) |
| Professional & Scientific | 0 (0.0%) | 8 (100.0%) |
| Enterprise Management | 0 (0.0%) | 0 (0.0%) |
| Administrative & Support | 82 (58.6%) | 58 (41.4%) |
| Educational Services | 10 (14.1%) | 61 (85.9%) |
| Health Care & Social Assistance | 36 (18.8%) | 156 (81.2%) |
| Arts, Entertainment & Recreation | 0 (0.0%) | 0 (0.0%) |
| Accommodation & Food Services | 0 (0.0%) | 0 (0.0%) |
| Public Administration | 0 (0.0%) | 6 (100.0%) |
| Total | 359 (48.2%) | 386 (51.8%) |
Education in Garyville
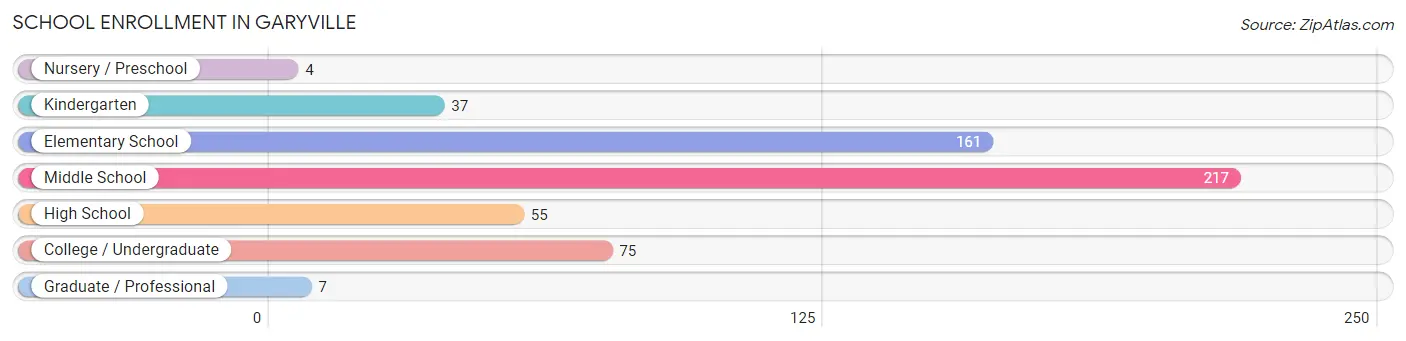
School Enrollment in Garyville
The most common levels of schooling among the 556 students in Garyville are middle school (217 | 39.0%), elementary school (161 | 29.0%), and college / undergraduate (75 | 13.5%).
| School Level | # Students | % Students |
| Nursery / Preschool | 4 | 0.7% |
| Kindergarten | 37 | 6.7% |
| Elementary School | 161 | 29.0% |
| Middle School | 217 | 39.0% |
| High School | 55 | 9.9% |
| College / Undergraduate | 75 | 13.5% |
| Graduate / Professional | 7 | 1.3% |
| Total | 556 | 100.0% |
School Enrollment by Age by Funding Source in Garyville
Out of a total of 556 students who are enrolled in schools in Garyville, 144 (25.9%) attend a private institution, while the remaining 412 (74.1%) are enrolled in public schools. The age group of 15 to 17 year olds has the highest likelihood of being enrolled in private schools, with 19 (52.8% in the age bracket) enrolled. Conversely, the age group of 3 to 4 year olds has the lowest likelihood of being enrolled in a private school, with 4 (100.0% in the age bracket) attending a public institution.
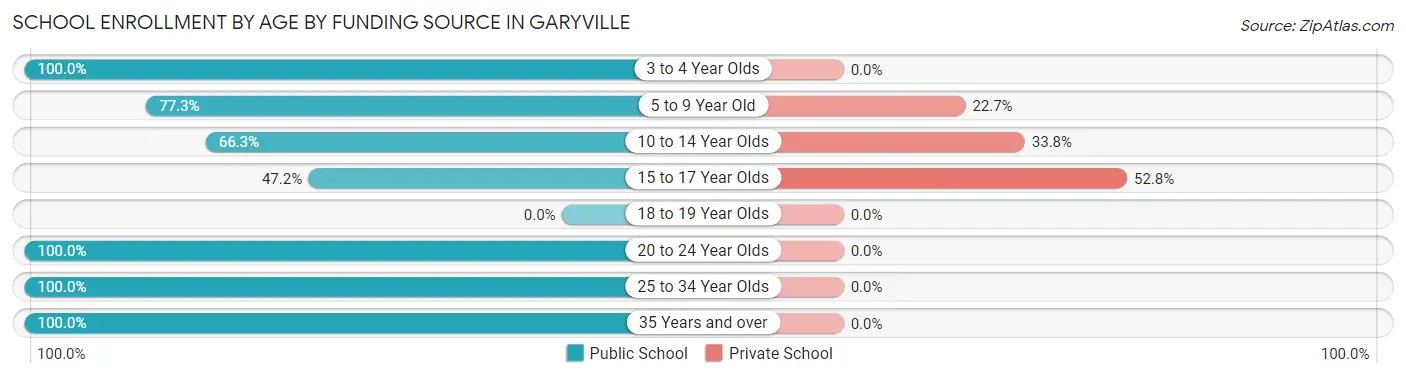
| Age Bracket | Public School | Private School |
| 3 to 4 Year Olds | 4 (100.0%) | 0 (0.0%) |
| 5 to 9 Year Old | 150 (77.3%) | 44 (22.7%) |
| 10 to 14 Year Olds | 159 (66.2%) | 81 (33.8%) |
| 15 to 17 Year Olds | 17 (47.2%) | 19 (52.8%) |
| 18 to 19 Year Olds | 0 (0.0%) | 0 (0.0%) |
| 20 to 24 Year Olds | 7 (100.0%) | 0 (0.0%) |
| 25 to 34 Year Olds | 37 (100.0%) | 0 (0.0%) |
| 35 Years and over | 38 (100.0%) | 0 (0.0%) |
| Total | 412 (74.1%) | 144 (25.9%) |
Educational Attainment by Field of Study in Garyville
Education (61 | 40.1%), science & technology (21 | 13.8%), business (21 | 13.8%), communications (15 | 9.9%), and social sciences (10 | 6.6%) are the most common fields of study among 152 individuals in Garyville who have obtained a bachelor's degree or higher.
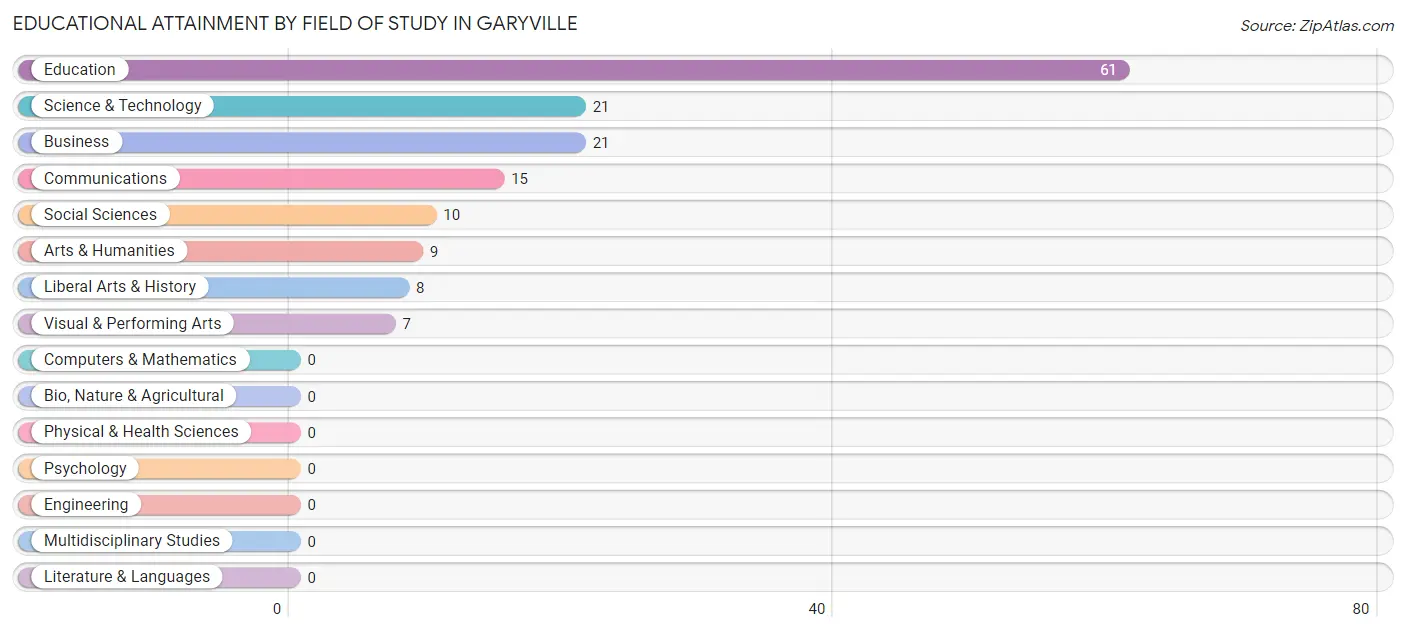
| Field of Study | # Graduates | % Graduates |
| Computers & Mathematics | 0 | 0.0% |
| Bio, Nature & Agricultural | 0 | 0.0% |
| Physical & Health Sciences | 0 | 0.0% |
| Psychology | 0 | 0.0% |
| Social Sciences | 10 | 6.6% |
| Engineering | 0 | 0.0% |
| Multidisciplinary Studies | 0 | 0.0% |
| Science & Technology | 21 | 13.8% |
| Business | 21 | 13.8% |
| Education | 61 | 40.1% |
| Literature & Languages | 0 | 0.0% |
| Liberal Arts & History | 8 | 5.3% |
| Visual & Performing Arts | 7 | 4.6% |
| Communications | 15 | 9.9% |
| Arts & Humanities | 9 | 5.9% |
| Total | 152 | 100.0% |
Transportation & Commute in Garyville
Vehicle Availability by Sex in Garyville
The most prevalent vehicle ownership categories in Garyville are males with 2 vehicles (153, accounting for 42.6%) and females with 2 vehicles (160, making up 39.6%).
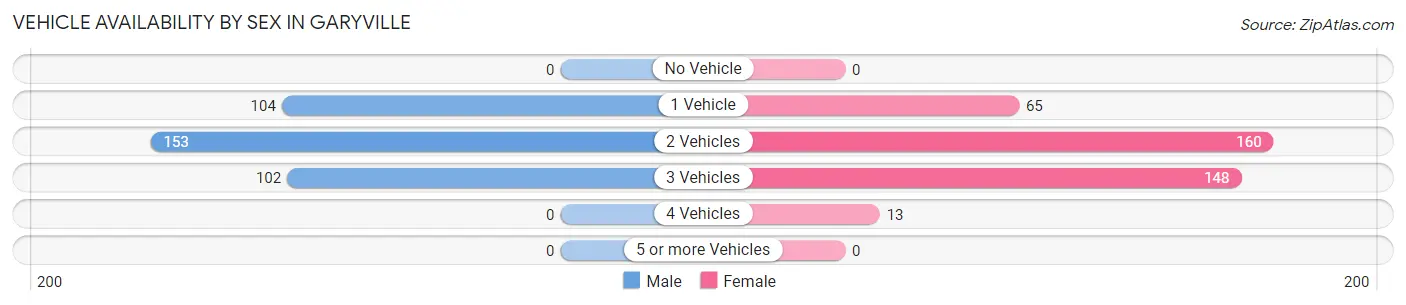
| Vehicles Available | Male | Female |
| No Vehicle | 0 (0.0%) | 0 (0.0%) |
| 1 Vehicle | 104 (29.0%) | 65 (16.8%) |
| 2 Vehicles | 153 (42.6%) | 160 (41.4%) |
| 3 Vehicles | 102 (28.4%) | 148 (38.3%) |
| 4 Vehicles | 0 (0.0%) | 13 (3.4%) |
| 5 or more Vehicles | 0 (0.0%) | 0 (0.0%) |
| Total | 359 (100.0%) | 386 (100.0%) |
Commute Time in Garyville
The most frequently occuring commute durations in Garyville are 20 to 24 minutes (216 commuters, 30.1%), 5 to 9 minutes (134 commuters, 18.7%), and 15 to 19 minutes (82 commuters, 11.4%).
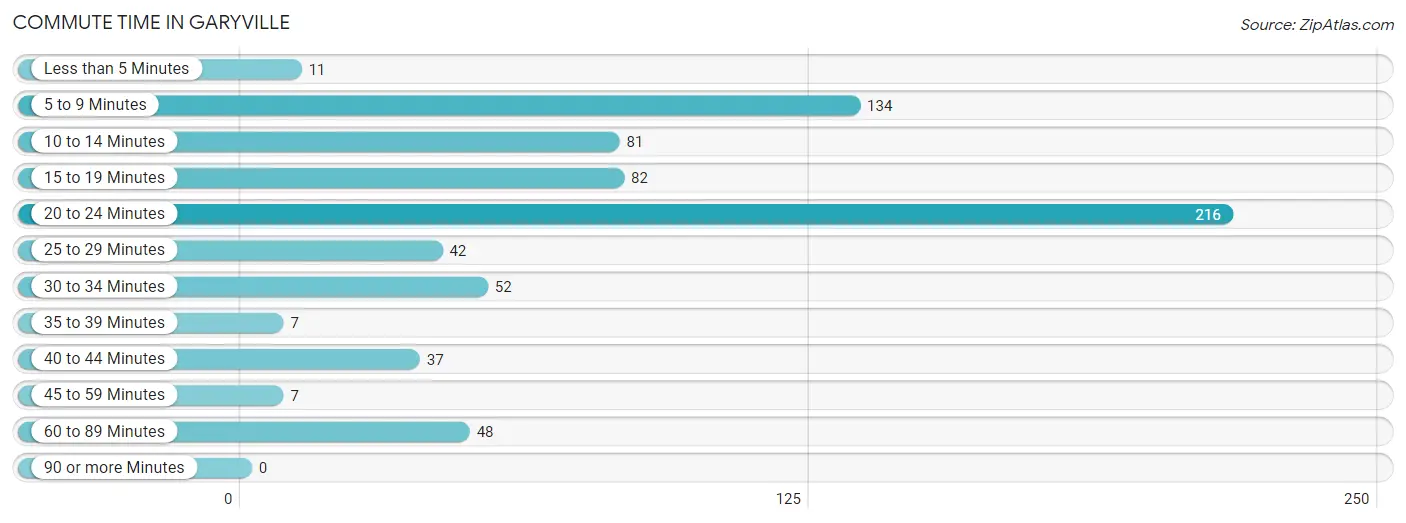
| Commute Time | # Commuters | % Commuters |
| Less than 5 Minutes | 11 | 1.5% |
| 5 to 9 Minutes | 134 | 18.7% |
| 10 to 14 Minutes | 81 | 11.3% |
| 15 to 19 Minutes | 82 | 11.4% |
| 20 to 24 Minutes | 216 | 30.1% |
| 25 to 29 Minutes | 42 | 5.9% |
| 30 to 34 Minutes | 52 | 7.2% |
| 35 to 39 Minutes | 7 | 1.0% |
| 40 to 44 Minutes | 37 | 5.2% |
| 45 to 59 Minutes | 7 | 1.0% |
| 60 to 89 Minutes | 48 | 6.7% |
| 90 or more Minutes | 0 | 0.0% |
Commute Time by Sex in Garyville
The most common commute times in Garyville are 20 to 24 minutes (128 commuters, 35.6%) for males and 20 to 24 minutes (88 commuters, 24.6%) for females.
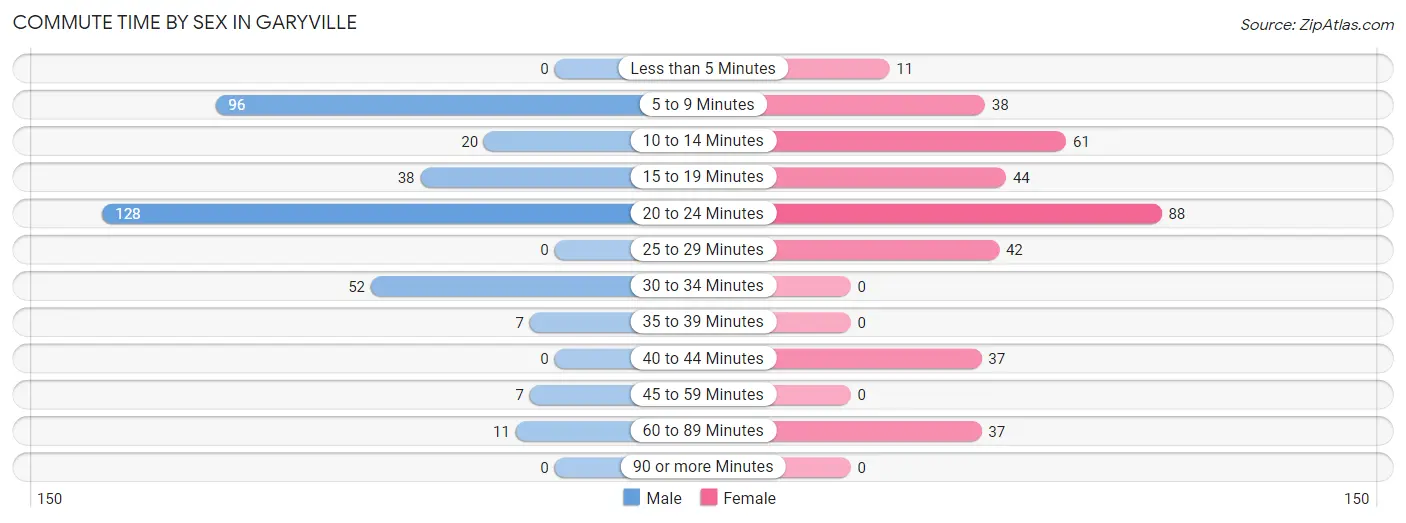
| Commute Time | Male | Female |
| Less than 5 Minutes | 0 (0.0%) | 11 (3.1%) |
| 5 to 9 Minutes | 96 (26.7%) | 38 (10.6%) |
| 10 to 14 Minutes | 20 (5.6%) | 61 (17.0%) |
| 15 to 19 Minutes | 38 (10.6%) | 44 (12.3%) |
| 20 to 24 Minutes | 128 (35.6%) | 88 (24.6%) |
| 25 to 29 Minutes | 0 (0.0%) | 42 (11.7%) |
| 30 to 34 Minutes | 52 (14.5%) | 0 (0.0%) |
| 35 to 39 Minutes | 7 (1.9%) | 0 (0.0%) |
| 40 to 44 Minutes | 0 (0.0%) | 37 (10.3%) |
| 45 to 59 Minutes | 7 (1.9%) | 0 (0.0%) |
| 60 to 89 Minutes | 11 (3.1%) | 37 (10.3%) |
| 90 or more Minutes | 0 (0.0%) | 0 (0.0%) |
Time of Departure to Work by Sex in Garyville
The most frequent times of departure to work in Garyville are 6:00 AM to 6:29 AM (77, 21.4%) for males and 6:00 AM to 6:29 AM (80, 22.4%) for females.
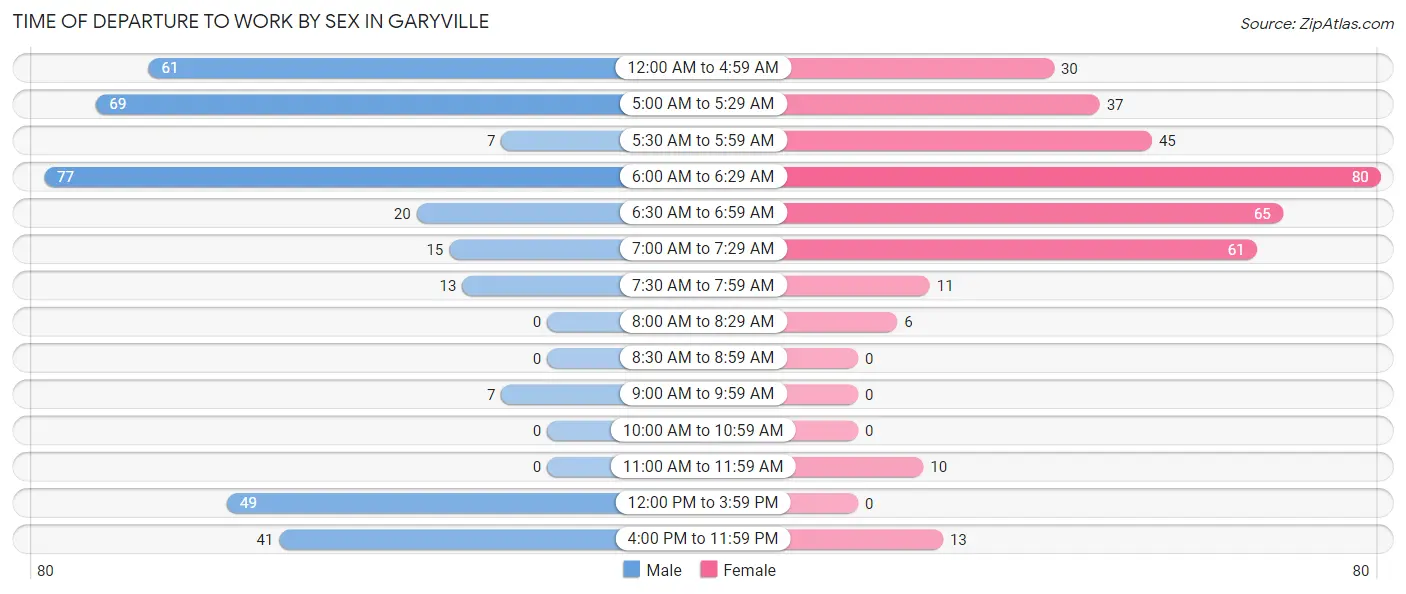
| Time of Departure | Male | Female |
| 12:00 AM to 4:59 AM | 61 (17.0%) | 30 (8.4%) |
| 5:00 AM to 5:29 AM | 69 (19.2%) | 37 (10.3%) |
| 5:30 AM to 5:59 AM | 7 (1.9%) | 45 (12.6%) |
| 6:00 AM to 6:29 AM | 77 (21.4%) | 80 (22.4%) |
| 6:30 AM to 6:59 AM | 20 (5.6%) | 65 (18.2%) |
| 7:00 AM to 7:29 AM | 15 (4.2%) | 61 (17.0%) |
| 7:30 AM to 7:59 AM | 13 (3.6%) | 11 (3.1%) |
| 8:00 AM to 8:29 AM | 0 (0.0%) | 6 (1.7%) |
| 8:30 AM to 8:59 AM | 0 (0.0%) | 0 (0.0%) |
| 9:00 AM to 9:59 AM | 7 (1.9%) | 0 (0.0%) |
| 10:00 AM to 10:59 AM | 0 (0.0%) | 0 (0.0%) |
| 11:00 AM to 11:59 AM | 0 (0.0%) | 10 (2.8%) |
| 12:00 PM to 3:59 PM | 49 (13.7%) | 0 (0.0%) |
| 4:00 PM to 11:59 PM | 41 (11.4%) | 13 (3.6%) |
| Total | 359 (100.0%) | 358 (100.0%) |
Housing Occupancy in Garyville
Occupancy by Ownership in Garyville
Of the total 686 dwellings in Garyville, owner-occupied units account for 607 (88.5%), while renter-occupied units make up 79 (11.5%).
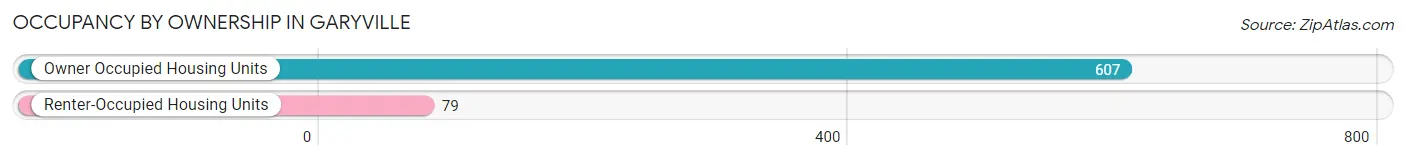
| Occupancy | # Housing Units | % Housing Units |
| Owner Occupied Housing Units | 607 | 88.5% |
| Renter-Occupied Housing Units | 79 | 11.5% |
| Total Occupied Housing Units | 686 | 100.0% |
Occupancy by Household Size in Garyville
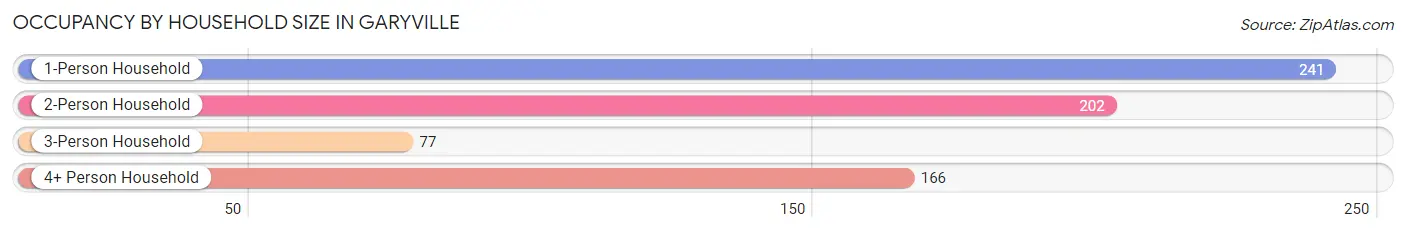
| Household Size | # Housing Units | % Housing Units |
| 1-Person Household | 241 | 35.1% |
| 2-Person Household | 202 | 29.4% |
| 3-Person Household | 77 | 11.2% |
| 4+ Person Household | 166 | 24.2% |
| Total Housing Units | 686 | 100.0% |
Occupancy by Ownership by Household Size in Garyville
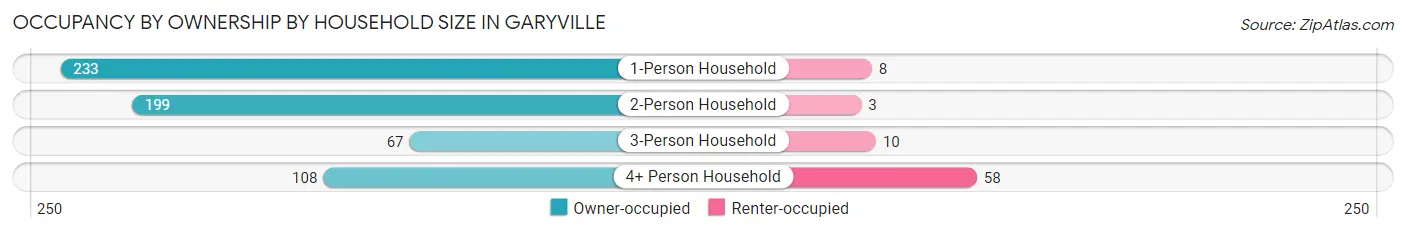
| Household Size | Owner-occupied | Renter-occupied |
| 1-Person Household | 233 (96.7%) | 8 (3.3%) |
| 2-Person Household | 199 (98.5%) | 3 (1.5%) |
| 3-Person Household | 67 (87.0%) | 10 (13.0%) |
| 4+ Person Household | 108 (65.1%) | 58 (34.9%) |
| Total Housing Units | 607 (88.5%) | 79 (11.5%) |
Occupancy by Educational Attainment in Garyville
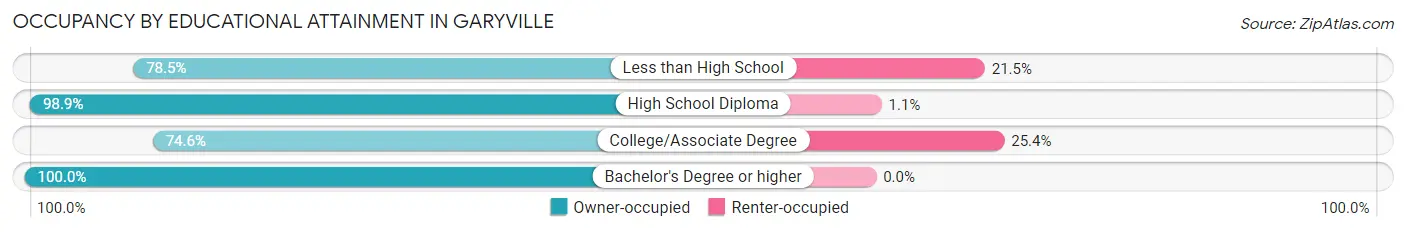
| Household Size | Owner-occupied | Renter-occupied |
| Less than High School | 102 (78.5%) | 28 (21.5%) |
| High School Diploma | 274 (98.9%) | 3 (1.1%) |
| College/Associate Degree | 141 (74.6%) | 48 (25.4%) |
| Bachelor's Degree or higher | 90 (100.0%) | 0 (0.0%) |
Occupancy by Age of Householder in Garyville
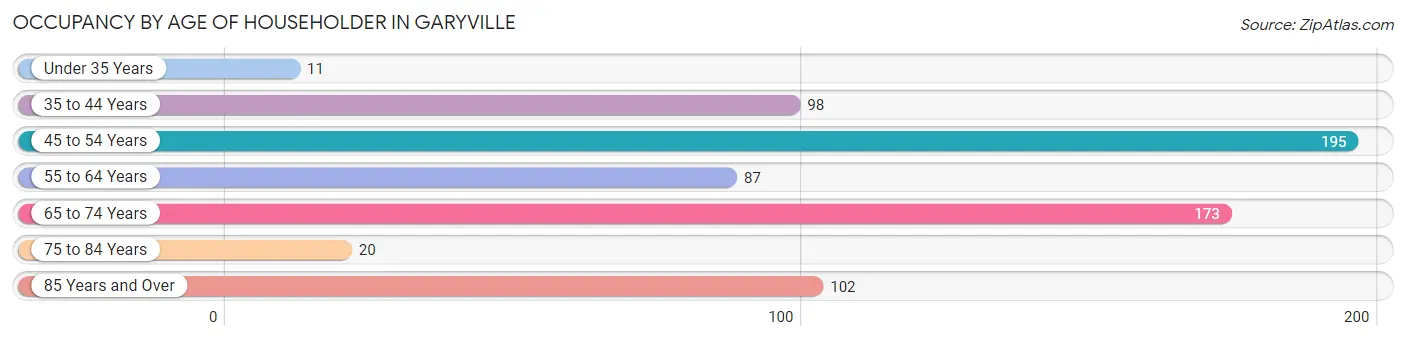
| Age Bracket | # Households | % Households |
| Under 35 Years | 11 | 1.6% |
| 35 to 44 Years | 98 | 14.3% |
| 45 to 54 Years | 195 | 28.4% |
| 55 to 64 Years | 87 | 12.7% |
| 65 to 74 Years | 173 | 25.2% |
| 75 to 84 Years | 20 | 2.9% |
| 85 Years and Over | 102 | 14.9% |
| Total | 686 | 100.0% |
Housing Finances in Garyville
Median Income by Occupancy in Garyville
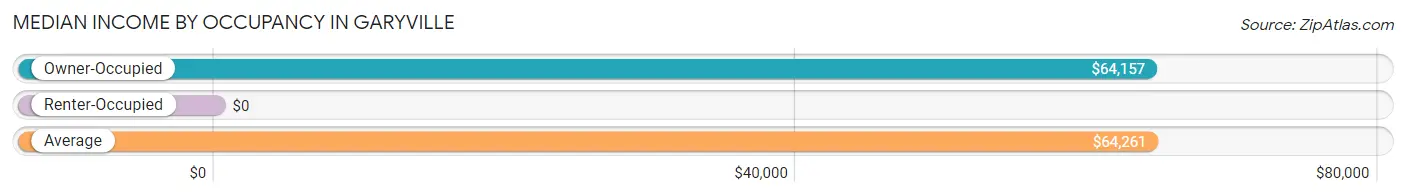
| Occupancy Type | # Households | Median Income |
| Owner-Occupied | 607 (88.5%) | $64,157 |
| Renter-Occupied | 79 (11.5%) | $0 |
| Average | 686 (100.0%) | $64,261 |
Occupancy by Householder Income Bracket in Garyville
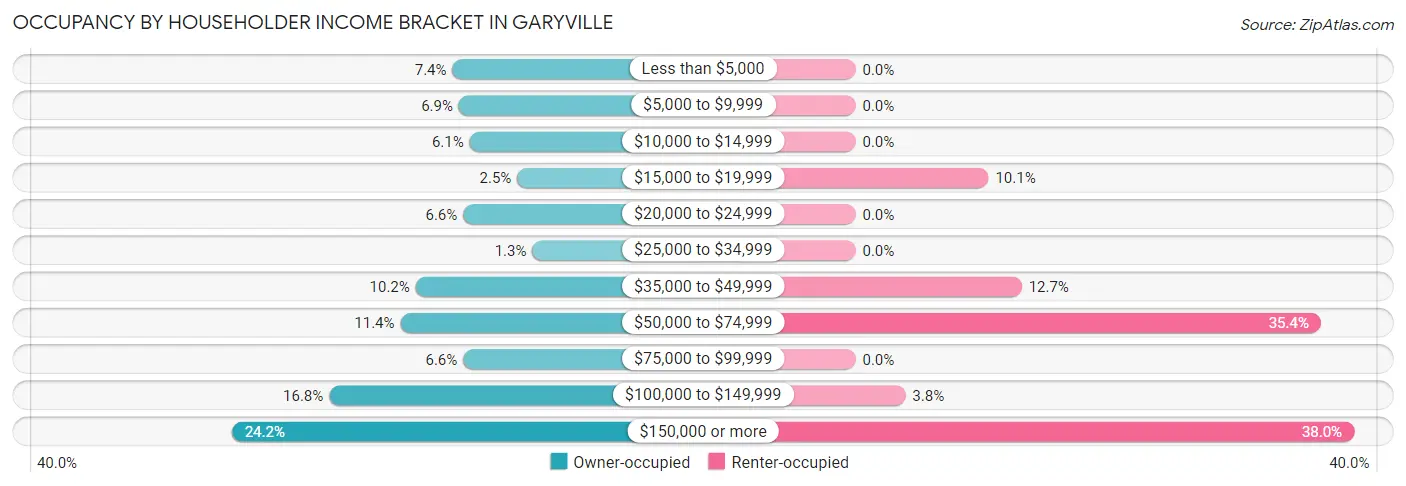
| Income Bracket | Owner-occupied | Renter-occupied |
| Less than $5,000 | 45 (7.4%) | 0 (0.0%) |
| $5,000 to $9,999 | 42 (6.9%) | 0 (0.0%) |
| $10,000 to $14,999 | 37 (6.1%) | 0 (0.0%) |
| $15,000 to $19,999 | 15 (2.5%) | 8 (10.1%) |
| $20,000 to $24,999 | 40 (6.6%) | 0 (0.0%) |
| $25,000 to $34,999 | 8 (1.3%) | 0 (0.0%) |
| $35,000 to $49,999 | 62 (10.2%) | 10 (12.7%) |
| $50,000 to $74,999 | 69 (11.4%) | 28 (35.4%) |
| $75,000 to $99,999 | 40 (6.6%) | 0 (0.0%) |
| $100,000 to $149,999 | 102 (16.8%) | 3 (3.8%) |
| $150,000 or more | 147 (24.2%) | 30 (38.0%) |
| Total | 607 (100.0%) | 79 (100.0%) |
Monthly Housing Cost Tiers in Garyville
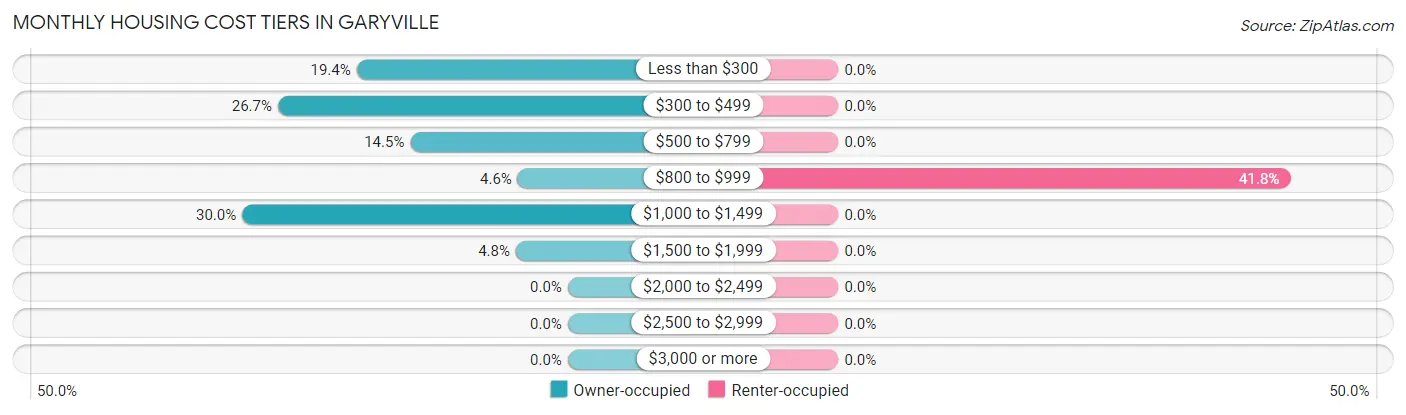
| Monthly Cost | Owner-occupied | Renter-occupied |
| Less than $300 | 118 (19.4%) | 0 (0.0%) |
| $300 to $499 | 162 (26.7%) | 0 (0.0%) |
| $500 to $799 | 88 (14.5%) | 0 (0.0%) |
| $800 to $999 | 28 (4.6%) | 33 (41.8%) |
| $1,000 to $1,499 | 182 (30.0%) | 0 (0.0%) |
| $1,500 to $1,999 | 29 (4.8%) | 0 (0.0%) |
| $2,000 to $2,499 | 0 (0.0%) | 0 (0.0%) |
| $2,500 to $2,999 | 0 (0.0%) | 0 (0.0%) |
| $3,000 or more | 0 (0.0%) | 0 (0.0%) |
| Total | 607 (100.0%) | 79 (100.0%) |
Physical Housing Characteristics in Garyville
Housing Structures in Garyville
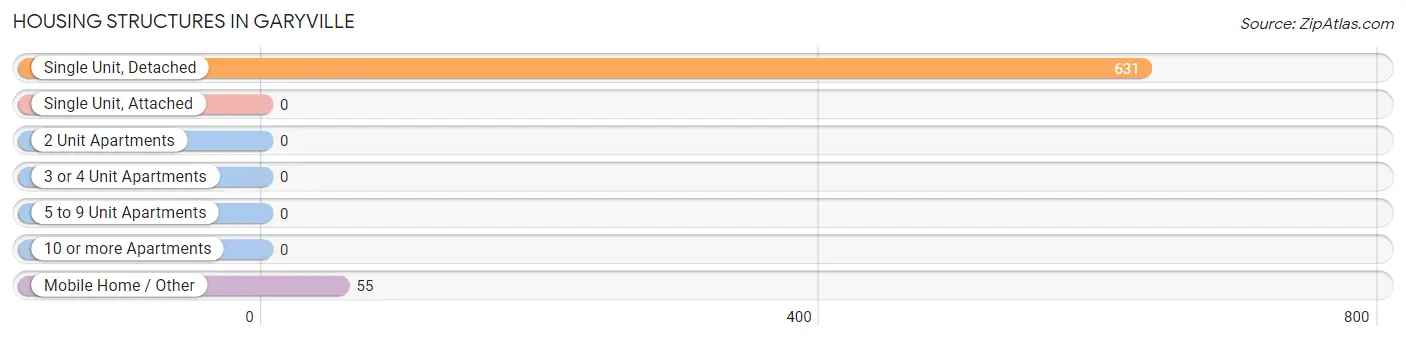
| Structure Type | # Housing Units | % Housing Units |
| Single Unit, Detached | 631 | 92.0% |
| Single Unit, Attached | 0 | 0.0% |
| 2 Unit Apartments | 0 | 0.0% |
| 3 or 4 Unit Apartments | 0 | 0.0% |
| 5 to 9 Unit Apartments | 0 | 0.0% |
| 10 or more Apartments | 0 | 0.0% |
| Mobile Home / Other | 55 | 8.0% |
| Total | 686 | 100.0% |
Housing Structures by Occupancy in Garyville
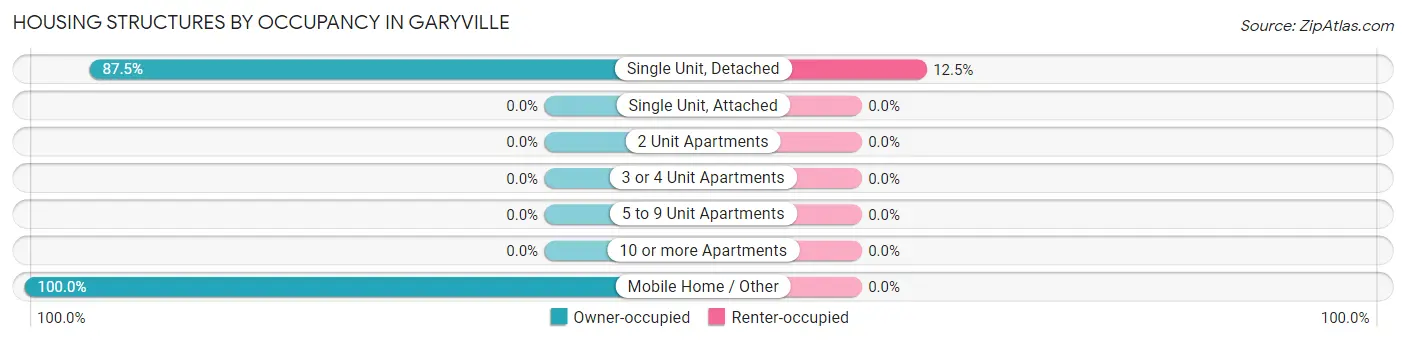
| Structure Type | Owner-occupied | Renter-occupied |
| Single Unit, Detached | 552 (87.5%) | 79 (12.5%) |
| Single Unit, Attached | 0 (0.0%) | 0 (0.0%) |
| 2 Unit Apartments | 0 (0.0%) | 0 (0.0%) |
| 3 or 4 Unit Apartments | 0 (0.0%) | 0 (0.0%) |
| 5 to 9 Unit Apartments | 0 (0.0%) | 0 (0.0%) |
| 10 or more Apartments | 0 (0.0%) | 0 (0.0%) |
| Mobile Home / Other | 55 (100.0%) | 0 (0.0%) |
| Total | 607 (88.5%) | 79 (11.5%) |
Housing Structures by Number of Rooms in Garyville
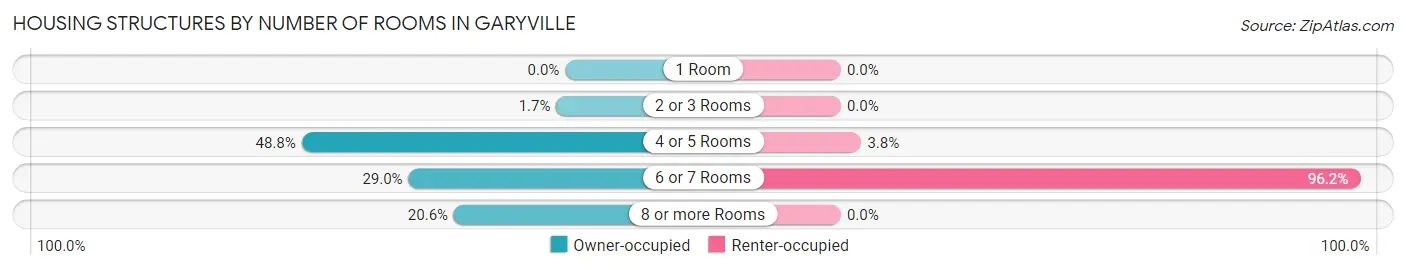
| Number of Rooms | Owner-occupied | Renter-occupied |
| 1 Room | 0 (0.0%) | 0 (0.0%) |
| 2 or 3 Rooms | 10 (1.7%) | 0 (0.0%) |
| 4 or 5 Rooms | 296 (48.8%) | 3 (3.8%) |
| 6 or 7 Rooms | 176 (29.0%) | 76 (96.2%) |
| 8 or more Rooms | 125 (20.6%) | 0 (0.0%) |
| Total | 607 (100.0%) | 79 (100.0%) |
Housing Structure by Heating Type in Garyville
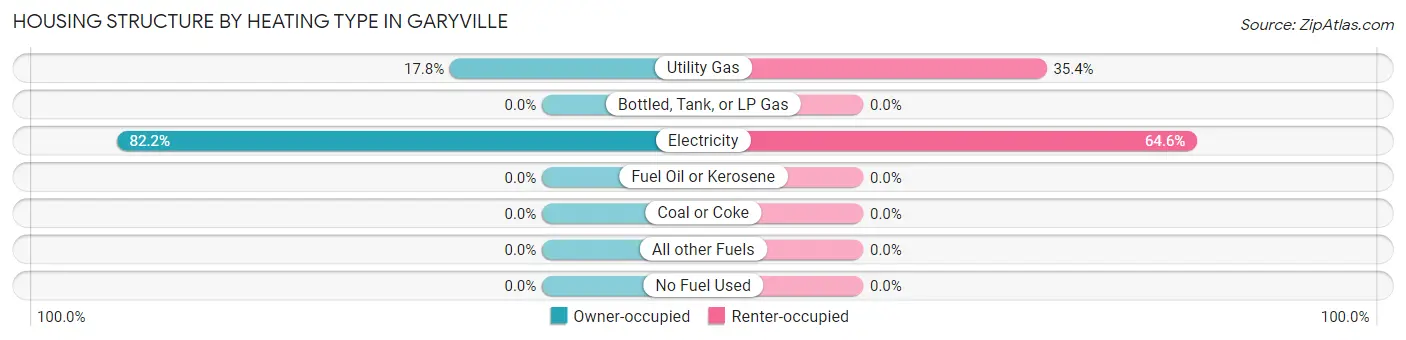
| Heating Type | Owner-occupied | Renter-occupied |
| Utility Gas | 108 (17.8%) | 28 (35.4%) |
| Bottled, Tank, or LP Gas | 0 (0.0%) | 0 (0.0%) |
| Electricity | 499 (82.2%) | 51 (64.6%) |
| Fuel Oil or Kerosene | 0 (0.0%) | 0 (0.0%) |
| Coal or Coke | 0 (0.0%) | 0 (0.0%) |
| All other Fuels | 0 (0.0%) | 0 (0.0%) |
| No Fuel Used | 0 (0.0%) | 0 (0.0%) |
| Total | 607 (100.0%) | 79 (100.0%) |
Household Vehicle Usage in Garyville
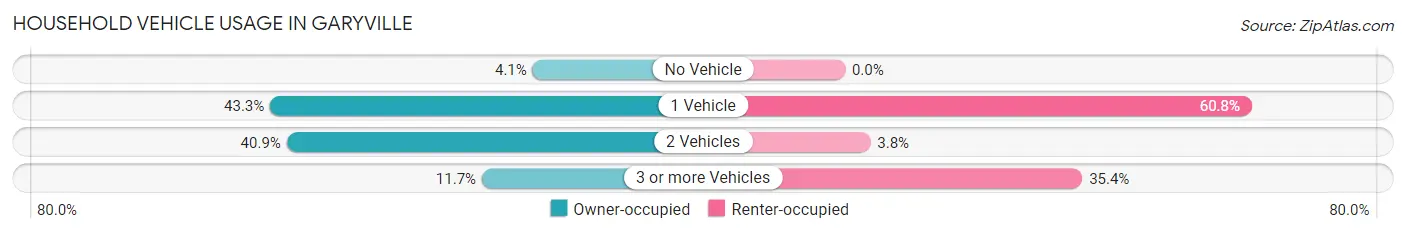
| Vehicles per Household | Owner-occupied | Renter-occupied |
| No Vehicle | 25 (4.1%) | 0 (0.0%) |
| 1 Vehicle | 263 (43.3%) | 48 (60.8%) |
| 2 Vehicles | 248 (40.9%) | 3 (3.8%) |
| 3 or more Vehicles | 71 (11.7%) | 28 (35.4%) |
| Total | 607 (100.0%) | 79 (100.0%) |
Real Estate & Mortgages in Garyville
Real Estate and Mortgage Overview in Garyville
| Characteristic | Without Mortgage | With Mortgage |
| Housing Units | 356 | 251 |
| Median Property Value | $148,700 | $133,700 |
| Median Household Income | - | - |
| Monthly Housing Costs | $415 | $0 |
| Real Estate Taxes | $902 | $130 |
Property Value by Mortgage Status in Garyville
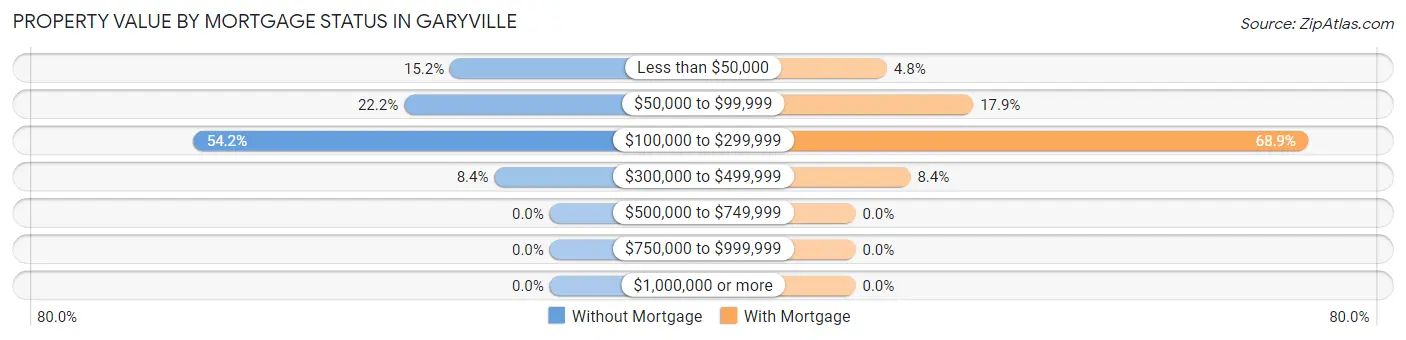
| Property Value | Without Mortgage | With Mortgage |
| Less than $50,000 | 54 (15.2%) | 12 (4.8%) |
| $50,000 to $99,999 | 79 (22.2%) | 45 (17.9%) |
| $100,000 to $299,999 | 193 (54.2%) | 173 (68.9%) |
| $300,000 to $499,999 | 30 (8.4%) | 21 (8.4%) |
| $500,000 to $749,999 | 0 (0.0%) | 0 (0.0%) |
| $750,000 to $999,999 | 0 (0.0%) | 0 (0.0%) |
| $1,000,000 or more | 0 (0.0%) | 0 (0.0%) |
| Total | 356 (100.0%) | 251 (100.0%) |
Household Income by Mortgage Status in Garyville
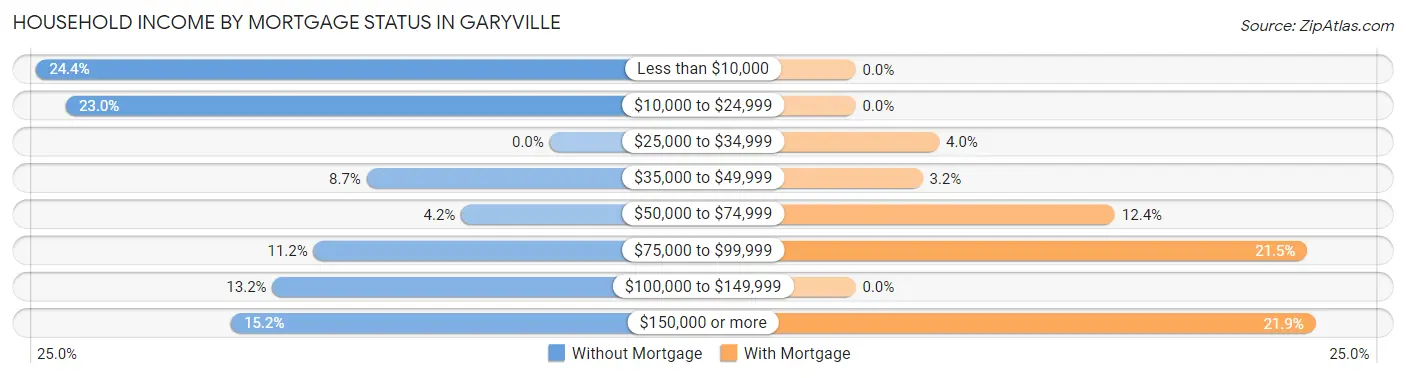
| Household Income | Without Mortgage | With Mortgage |
| Less than $10,000 | 87 (24.4%) | 0 (0.0%) |
| $10,000 to $24,999 | 82 (23.0%) | 0 (0.0%) |
| $25,000 to $34,999 | 0 (0.0%) | 10 (4.0%) |
| $35,000 to $49,999 | 31 (8.7%) | 8 (3.2%) |
| $50,000 to $74,999 | 15 (4.2%) | 31 (12.3%) |
| $75,000 to $99,999 | 40 (11.2%) | 54 (21.5%) |
| $100,000 to $149,999 | 47 (13.2%) | 0 (0.0%) |
| $150,000 or more | 54 (15.2%) | 55 (21.9%) |
| Total | 356 (100.0%) | 251 (100.0%) |
Property Value to Household Income Ratio in Garyville
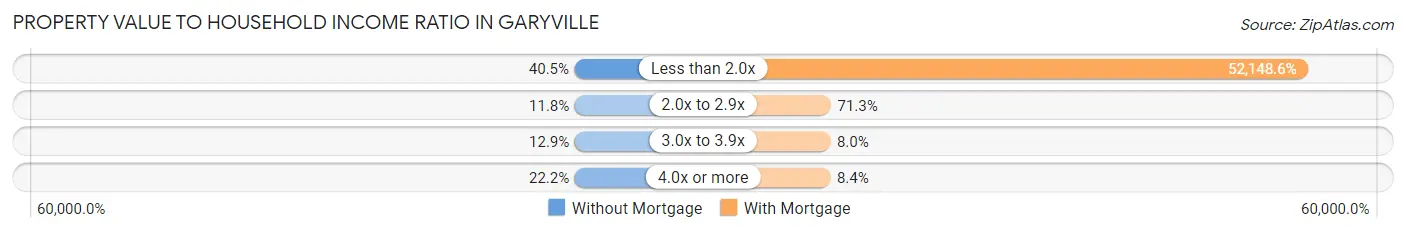
| Value-to-Income Ratio | Without Mortgage | With Mortgage |
| Less than 2.0x | 144 (40.5%) | 130,893 (52,148.6%) |
| 2.0x to 2.9x | 42 (11.8%) | 179 (71.3%) |
| 3.0x to 3.9x | 46 (12.9%) | 20 (8.0%) |
| 4.0x or more | 79 (22.2%) | 21 (8.4%) |
| Total | 356 (100.0%) | 251 (100.0%) |
Real Estate Taxes by Mortgage Status in Garyville
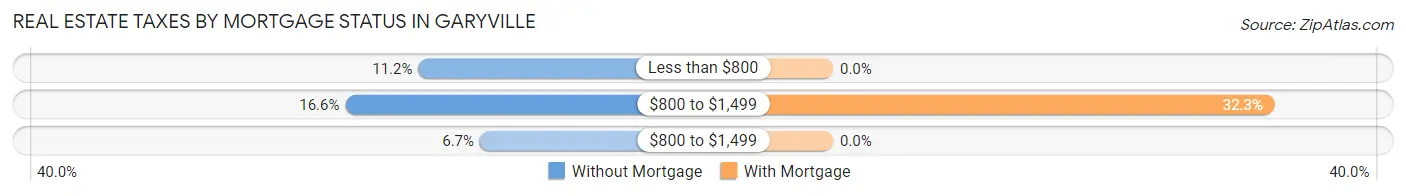
| Property Taxes | Without Mortgage | With Mortgage |
| Less than $800 | 40 (11.2%) | 0 (0.0%) |
| $800 to $1,499 | 59 (16.6%) | 81 (32.3%) |
| $800 to $1,499 | 24 (6.7%) | 0 (0.0%) |
| Total | 356 (100.0%) | 251 (100.0%) |
Health & Disability in Garyville
Health Insurance Coverage by Age in Garyville
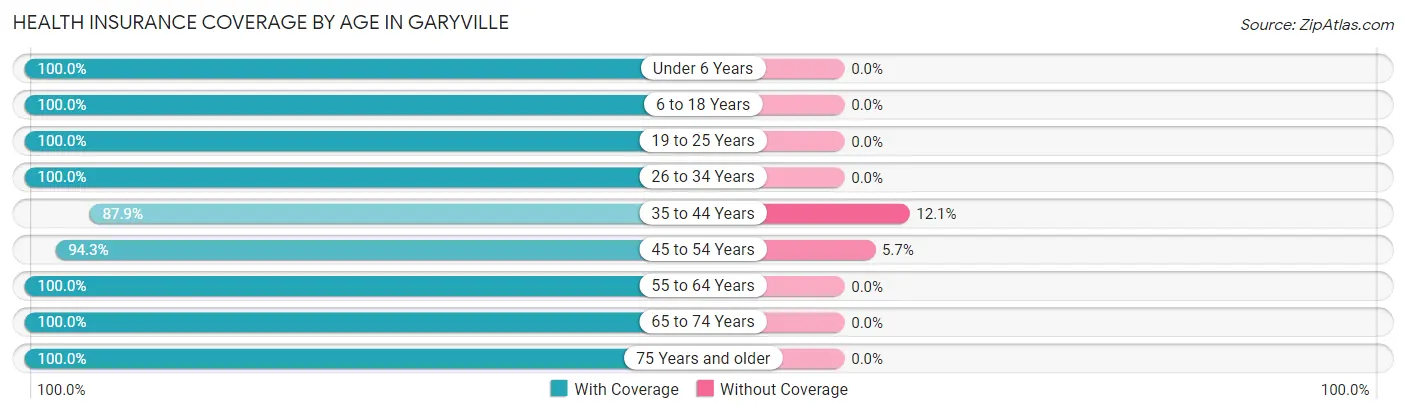
| Age Bracket | With Coverage | Without Coverage |
| Under 6 Years | 61 (100.0%) | 0 (0.0%) |
| 6 to 18 Years | 474 (100.0%) | 0 (0.0%) |
| 19 to 25 Years | 79 (100.0%) | 0 (0.0%) |
| 26 to 34 Years | 117 (100.0%) | 0 (0.0%) |
| 35 to 44 Years | 478 (87.9%) | 66 (12.1%) |
| 45 to 54 Years | 280 (94.3%) | 17 (5.7%) |
| 55 to 64 Years | 171 (100.0%) | 0 (0.0%) |
| 65 to 74 Years | 219 (100.0%) | 0 (0.0%) |
| 75 Years and older | 146 (100.0%) | 0 (0.0%) |
| Total | 2,025 (96.1%) | 83 (3.9%) |
Health Insurance Coverage by Citizenship Status in Garyville
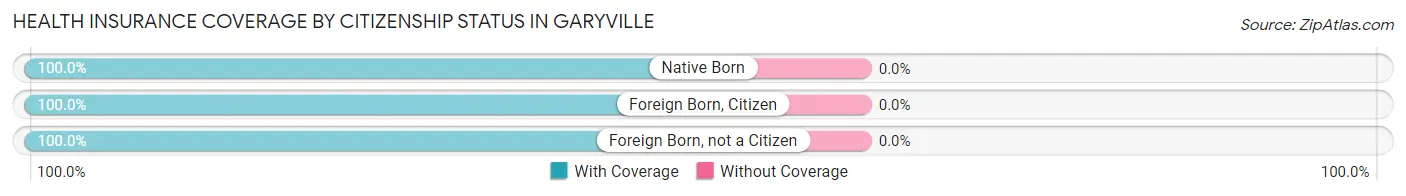
| Citizenship Status | With Coverage | Without Coverage |
| Native Born | 61 (100.0%) | 0 (0.0%) |
| Foreign Born, Citizen | 474 (100.0%) | 0 (0.0%) |
| Foreign Born, not a Citizen | 79 (100.0%) | 0 (0.0%) |
Health Insurance Coverage by Household Income in Garyville
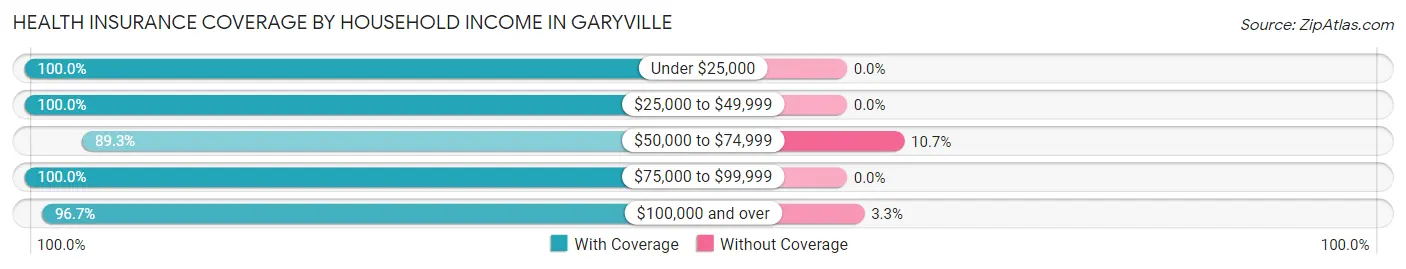
| Household Income | With Coverage | Without Coverage |
| Under $25,000 | 236 (100.0%) | 0 (0.0%) |
| $25,000 to $49,999 | 144 (100.0%) | 0 (0.0%) |
| $50,000 to $74,999 | 349 (89.3%) | 42 (10.7%) |
| $75,000 to $99,999 | 79 (100.0%) | 0 (0.0%) |
| $100,000 and over | 1,217 (96.7%) | 41 (3.3%) |
Public vs Private Health Insurance Coverage by Age in Garyville
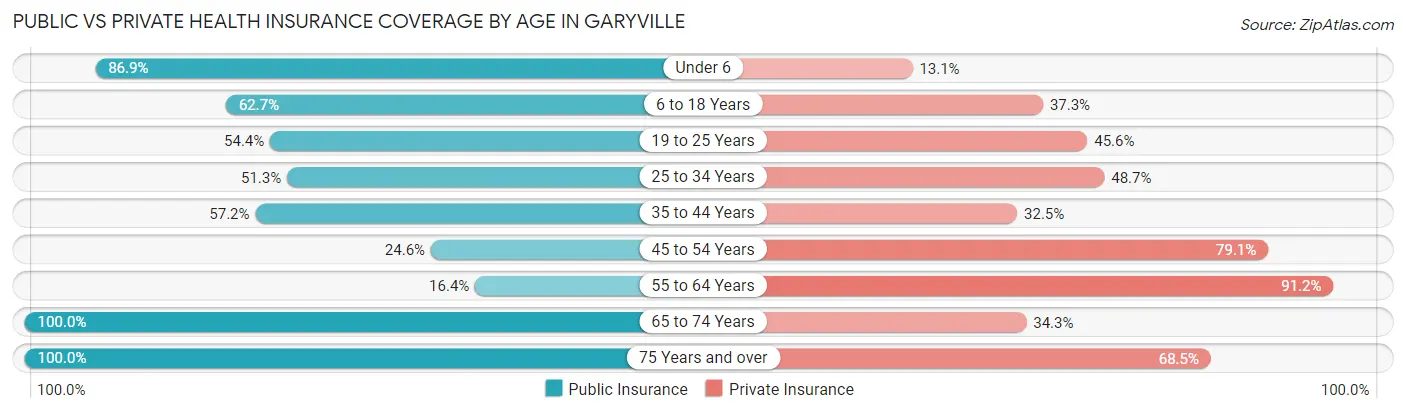
| Age Bracket | Public Insurance | Private Insurance |
| Under 6 | 53 (86.9%) | 8 (13.1%) |
| 6 to 18 Years | 297 (62.7%) | 177 (37.3%) |
| 19 to 25 Years | 43 (54.4%) | 36 (45.6%) |
| 25 to 34 Years | 60 (51.3%) | 57 (48.7%) |
| 35 to 44 Years | 311 (57.2%) | 177 (32.5%) |
| 45 to 54 Years | 73 (24.6%) | 235 (79.1%) |
| 55 to 64 Years | 28 (16.4%) | 156 (91.2%) |
| 65 to 74 Years | 219 (100.0%) | 75 (34.3%) |
| 75 Years and over | 146 (100.0%) | 100 (68.5%) |
| Total | 1,230 (58.4%) | 1,021 (48.4%) |
Disability Status by Sex by Age in Garyville
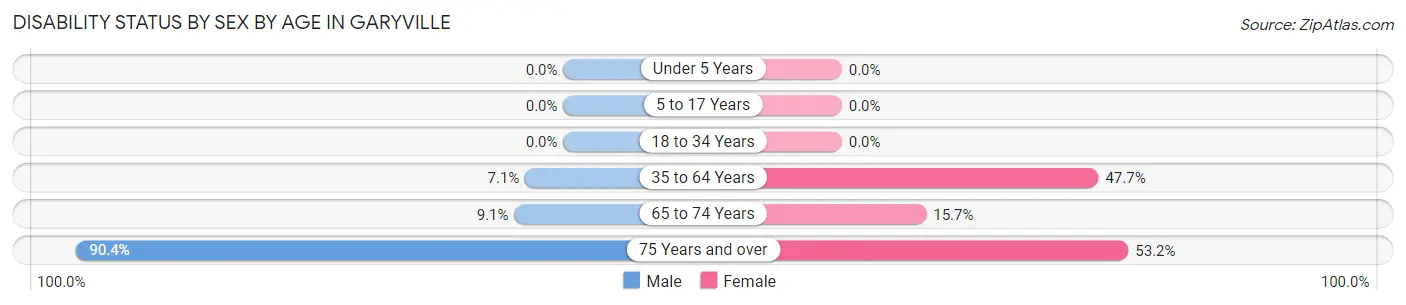
| Age Bracket | Male | Female |
| Under 5 Years | 0 (0.0%) | 0 (0.0%) |
| 5 to 17 Years | 0 (0.0%) | 0 (0.0%) |
| 18 to 34 Years | 0 (0.0%) | 0 (0.0%) |
| 35 to 64 Years | 31 (7.1%) | 274 (47.6%) |
| 65 to 74 Years | 6 (9.1%) | 24 (15.7%) |
| 75 Years and over | 47 (90.4%) | 50 (53.2%) |
Disability Class by Sex by Age in Garyville
Disability Class: Hearing Difficulty
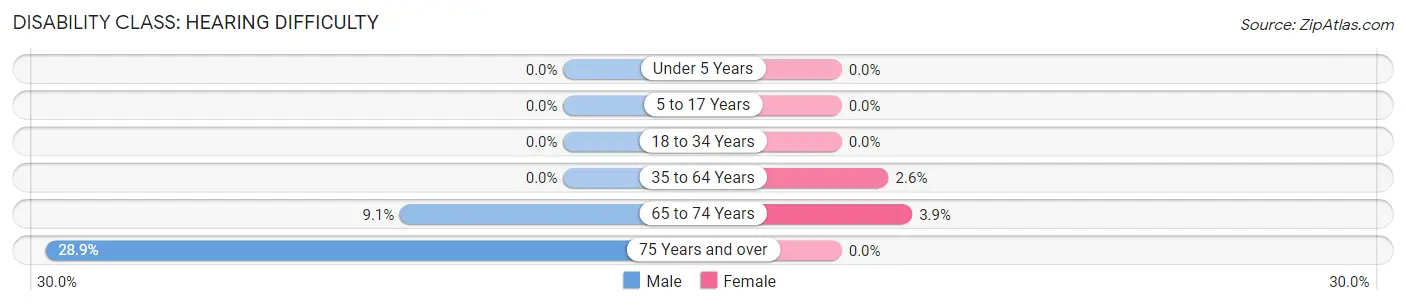
| Age Bracket | Male | Female |
| Under 5 Years | 0 (0.0%) | 0 (0.0%) |
| 5 to 17 Years | 0 (0.0%) | 0 (0.0%) |
| 18 to 34 Years | 0 (0.0%) | 0 (0.0%) |
| 35 to 64 Years | 0 (0.0%) | 15 (2.6%) |
| 65 to 74 Years | 6 (9.1%) | 6 (3.9%) |
| 75 Years and over | 15 (28.8%) | 0 (0.0%) |
Disability Class: Vision Difficulty
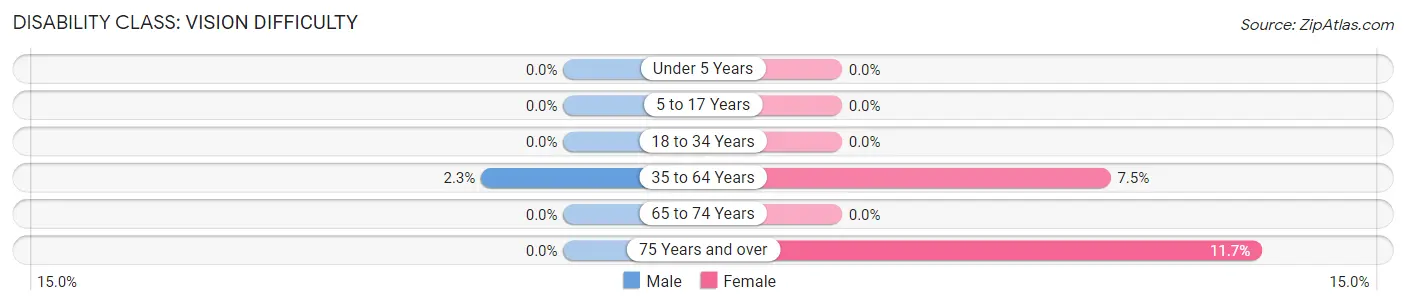
| Age Bracket | Male | Female |
| Under 5 Years | 0 (0.0%) | 0 (0.0%) |
| 5 to 17 Years | 0 (0.0%) | 0 (0.0%) |
| 18 to 34 Years | 0 (0.0%) | 0 (0.0%) |
| 35 to 64 Years | 10 (2.3%) | 43 (7.5%) |
| 65 to 74 Years | 0 (0.0%) | 0 (0.0%) |
| 75 Years and over | 0 (0.0%) | 11 (11.7%) |
Disability Class: Cognitive Difficulty
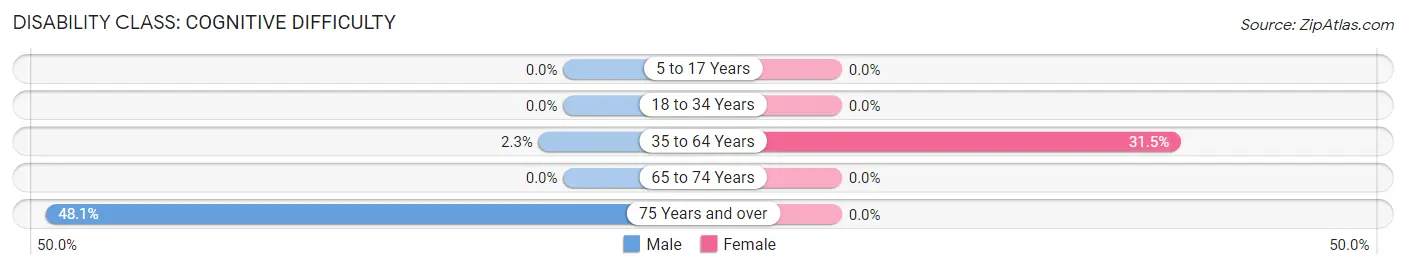
| Age Bracket | Male | Female |
| 5 to 17 Years | 0 (0.0%) | 0 (0.0%) |
| 18 to 34 Years | 0 (0.0%) | 0 (0.0%) |
| 35 to 64 Years | 10 (2.3%) | 181 (31.5%) |
| 65 to 74 Years | 0 (0.0%) | 0 (0.0%) |
| 75 Years and over | 25 (48.1%) | 0 (0.0%) |
Disability Class: Ambulatory Difficulty
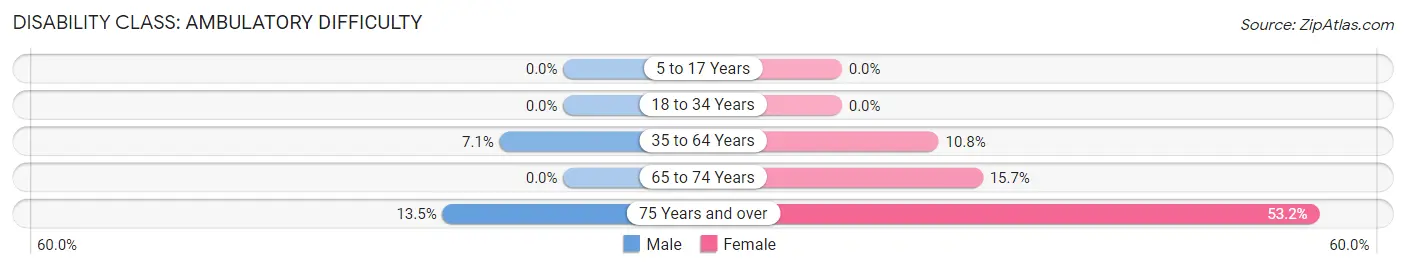
| Age Bracket | Male | Female |
| 5 to 17 Years | 0 (0.0%) | 0 (0.0%) |
| 18 to 34 Years | 0 (0.0%) | 0 (0.0%) |
| 35 to 64 Years | 31 (7.1%) | 62 (10.8%) |
| 65 to 74 Years | 0 (0.0%) | 24 (15.7%) |
| 75 Years and over | 7 (13.5%) | 50 (53.2%) |
Disability Class: Self-Care Difficulty
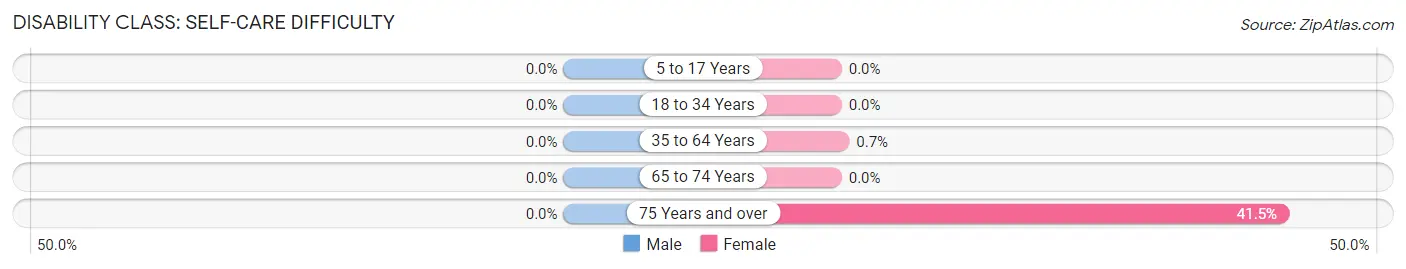
| Age Bracket | Male | Female |
| 5 to 17 Years | 0 (0.0%) | 0 (0.0%) |
| 18 to 34 Years | 0 (0.0%) | 0 (0.0%) |
| 35 to 64 Years | 0 (0.0%) | 4 (0.7%) |
| 65 to 74 Years | 0 (0.0%) | 0 (0.0%) |
| 75 Years and over | 0 (0.0%) | 39 (41.5%) |
Technology Access in Garyville
Computing Device Access in Garyville
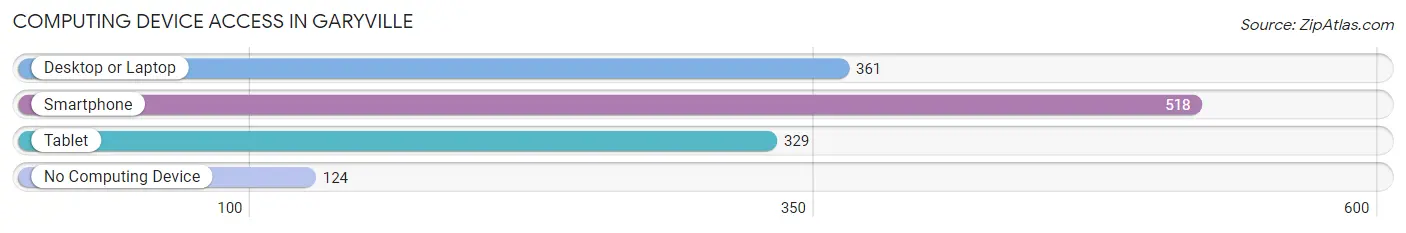
| Device Type | # Households | % Households |
| Desktop or Laptop | 361 | 52.6% |
| Smartphone | 518 | 75.5% |
| Tablet | 329 | 48.0% |
| No Computing Device | 124 | 18.1% |
| Total | 686 | 100.0% |
Internet Access in Garyville
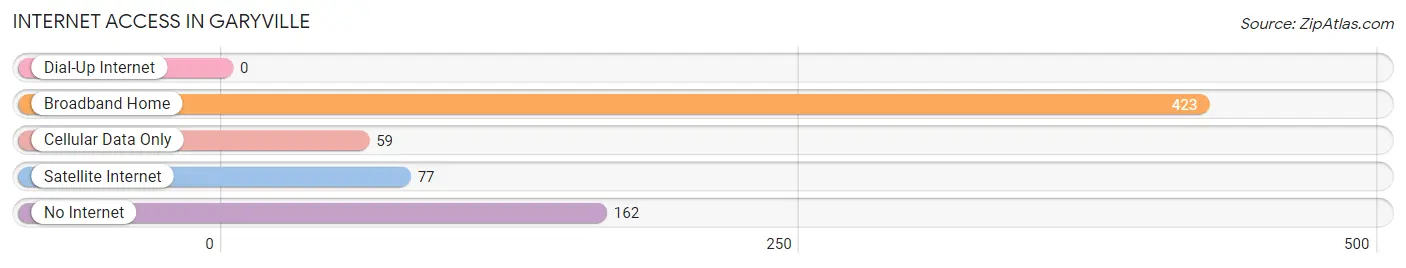
| Internet Type | # Households | % Households |
| Dial-Up Internet | 0 | 0.0% |
| Broadband Home | 423 | 61.7% |
| Cellular Data Only | 59 | 8.6% |
| Satellite Internet | 77 | 11.2% |
| No Internet | 162 | 23.6% |
| Total | 686 | 100.0% |
Garyville Summary
GARYVILLE LOUISIANA
History
Garyville, Louisiana is a small town located in St. John the Baptist Parish, Louisiana. It is located on the east bank of the Mississippi River, about 25 miles west of New Orleans. The town was founded in 1854 by William Gary, a planter from Georgia. Gary purchased the land from the local Native Americans and named the town after himself.
The town grew slowly over the years, but it was not until the late 19th century that it began to experience significant growth. In 1883, the New Orleans, Mobile and Texas Railroad was built through the town, connecting it to New Orleans and other cities in the region. This allowed for the development of the town’s economy, as it became a hub for the transportation of goods and services.
In the early 20th century, Garyville experienced a period of rapid growth. The town was incorporated in 1912 and the population grew from 1,000 to over 5,000 by the mid-1920s. This growth was largely due to the development of the local sugar industry, which provided jobs for many of the town’s residents.
The town continued to grow throughout the 20th century, reaching a peak population of 8,000 in the 1970s. Since then, the population has declined slightly, but Garyville remains an important part of the local economy.
Geography
Garyville is located in St. John the Baptist Parish, Louisiana, on the east bank of the Mississippi River. The town is situated at an elevation of 10 feet above sea level. The town is bordered by the towns of LaPlace and Reserve to the north, and by the city of New Orleans to the south.
The town is located in a humid subtropical climate zone, with hot, humid summers and mild winters. The average annual temperature is 73°F, with an average high of 87°F in the summer and an average low of 59°F in the winter. The average annual precipitation is 62 inches, with most of the rain falling in the summer months.
Economy
Garyville’s economy is largely based on the sugar industry. The town is home to several sugar mills, which process sugar cane grown in the surrounding area. The mills provide jobs for many of the town’s residents, as well as providing a source of income for the local economy.
In addition to the sugar industry, Garyville is also home to several other businesses. These include a variety of retail stores, restaurants, and other services. The town is also home to a number of manufacturing plants, which produce a variety of products, including paper products, plastics, and chemicals.
Demographics
As of the 2010 census, Garyville had a population of 6,845. The racial makeup of the town was 79.3% White, 17.2% African American, 0.7% Native American, 0.3% Asian, 0.1% Pacific Islander, and 2.4% from other races. Hispanic or Latino of any race were 3.2% of the population.
The median household income in Garyville was $37,917, and the median family income was $45,938. The per capita income was $18,945. About 17.2% of families and 20.3% of the population were below the poverty line, including 28.2% of those under age 18 and 11.2% of those age 65 or over.
Conclusion
Garyville, Louisiana is a small town located in St. John the Baptist Parish, Louisiana. It is located on the east bank of the Mississippi River, about 25 miles west of New Orleans. The town was founded in 1854 by William Gary, a planter from Georgia. Garyville has a humid subtropical climate, with hot, humid summers and mild winters. The town’s economy is largely based on the sugar industry, with several sugar mills providing jobs for many of the town’s residents. As of the 2010 census, Garyville had a population of 6,845, with a median household income of $37,917.
Common Questions
What is Per Capita Income in Garyville?
Per Capita income in Garyville is $31,663.
What is the Median Family Income in Garyville?
Median Family Income in Garyville is $105,750.
What is the Median Household income in Garyville?
Median Household Income in Garyville is $64,261.
What is Inequality or Gini Index in Garyville?
Inequality or Gini Index in Garyville is 0.44.
What is the Total Population of Garyville?
Total Population of Garyville is 2,108.
What is the Total Male Population of Garyville?
Total Male Population of Garyville is 859.
What is the Total Female Population of Garyville?
Total Female Population of Garyville is 1,249.
What is the Ratio of Males per 100 Females in Garyville?
There are 68.78 Males per 100 Females in Garyville.
What is the Ratio of Females per 100 Males in Garyville?
There are 145.40 Females per 100 Males in Garyville.
What is the Median Population Age in Garyville?
Median Population Age in Garyville is 41.9 Years.
What is the Average Family Size in Garyville
Average Family Size in Garyville is 4.2 People.
What is the Average Household Size in Garyville
Average Household Size in Garyville is 3.1 People.
How Large is the Labor Force in Garyville?
There are 773 People in the Labor Forcein in Garyville.
What is the Percentage of People in the Labor Force in Garyville?
47.7% of People are in the Labor Force in Garyville.
What is the Unemployment Rate in Garyville?
Unemployment Rate in Garyville is 3.7%.