Franklin, LA Map & Demographics
Franklin Map
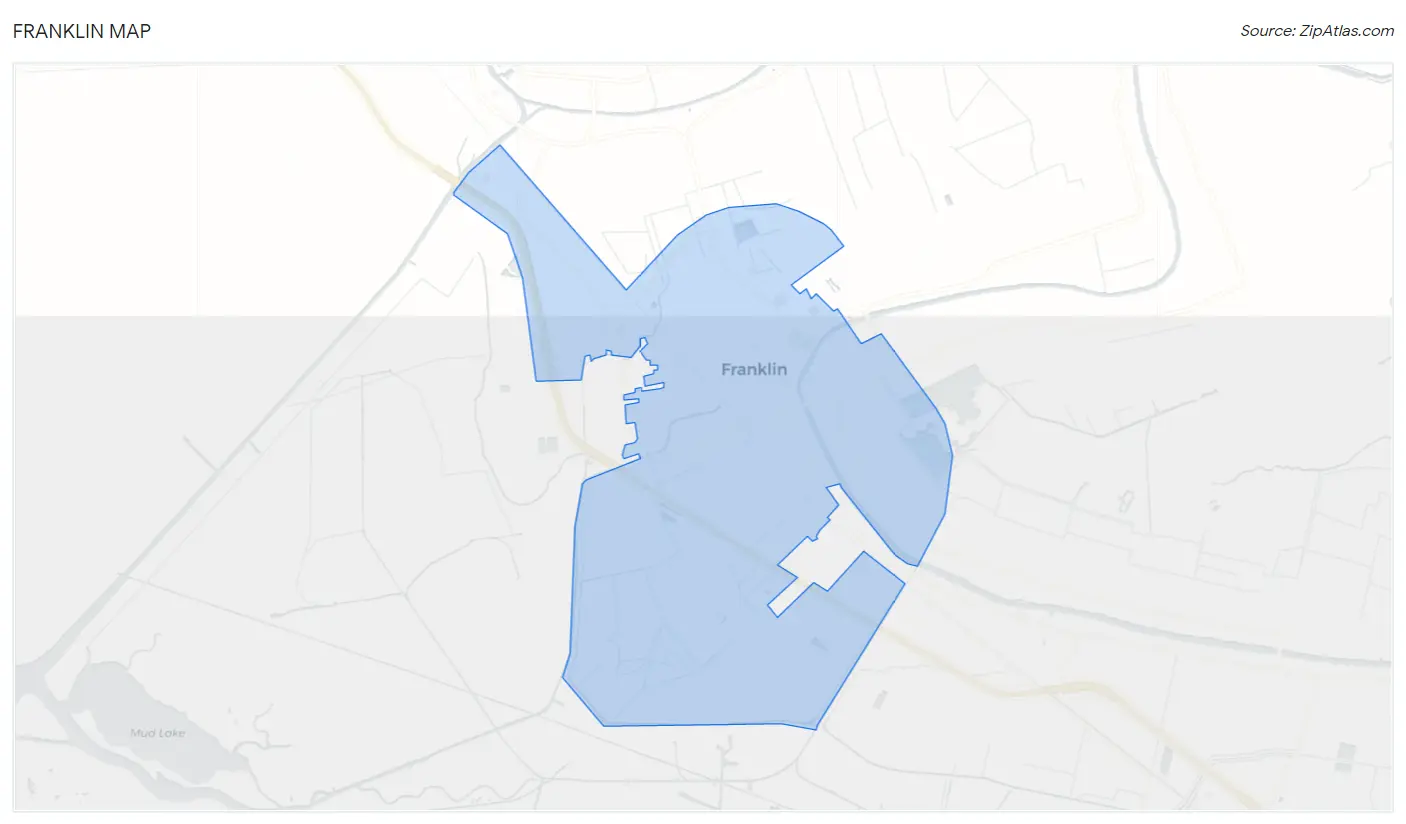
Franklin Overview
$24,673
PER CAPITA INCOME
$51,250
AVG FAMILY INCOME
$39,068
AVG HOUSEHOLD INCOME
45.2%
WAGE / INCOME GAP [ % ]
54.8¢/ $1
WAGE / INCOME GAP [ $ ]
0.51
INEQUALITY / GINI INDEX
6,666
TOTAL POPULATION
3,290
MALE POPULATION
3,376
FEMALE POPULATION
97.45
MALES / 100 FEMALES
102.61
FEMALES / 100 MALES
39.5
MEDIAN AGE
3.4
AVG FAMILY SIZE
2.5
AVG HOUSEHOLD SIZE
2,730
LABOR FORCE [ PEOPLE ]
52.4%
PERCENT IN LABOR FORCE
2.7%
UNEMPLOYMENT RATE
Franklin Zip Codes
Franklin Area Codes
Income in Franklin
Income Overview in Franklin
Per Capita Income in Franklin is $24,673, while median incomes of families and households are $51,250 and $39,068 respectively.
| Characteristic | Number | Measure |
| Per Capita Income | 6,666 | $24,673 |
| Median Family Income | 1,582 | $51,250 |
| Mean Family Income | 1,582 | $76,866 |
| Median Household Income | 2,576 | $39,068 |
| Mean Household Income | 2,576 | $58,049 |
| Income Deficit | 1,582 | $0 |
| Wage / Income Gap (%) | 6,666 | 45.15% |
| Wage / Income Gap ($) | 6,666 | 54.85¢ per $1 |
| Gini / Inequality Index | 6,666 | 0.51 |
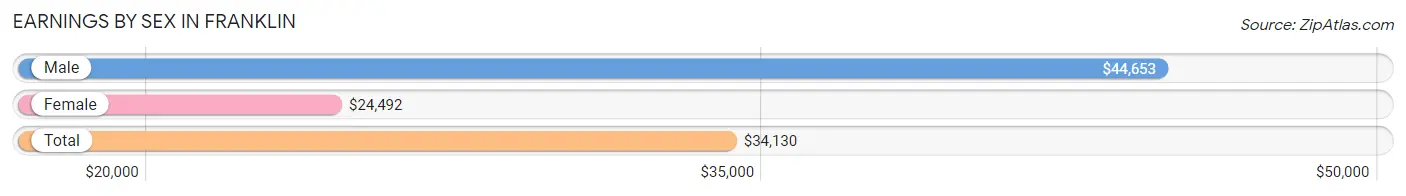
Earnings by Sex in Franklin
Average Earnings in Franklin are $34,130, $44,653 for men and $24,492 for women, a difference of 45.2%.
| Sex | Number | Average Earnings |
| Male | 1,360 (47.7%) | $44,653 |
| Female | 1,488 (52.2%) | $24,492 |
| Total | 2,848 (100.0%) | $34,130 |
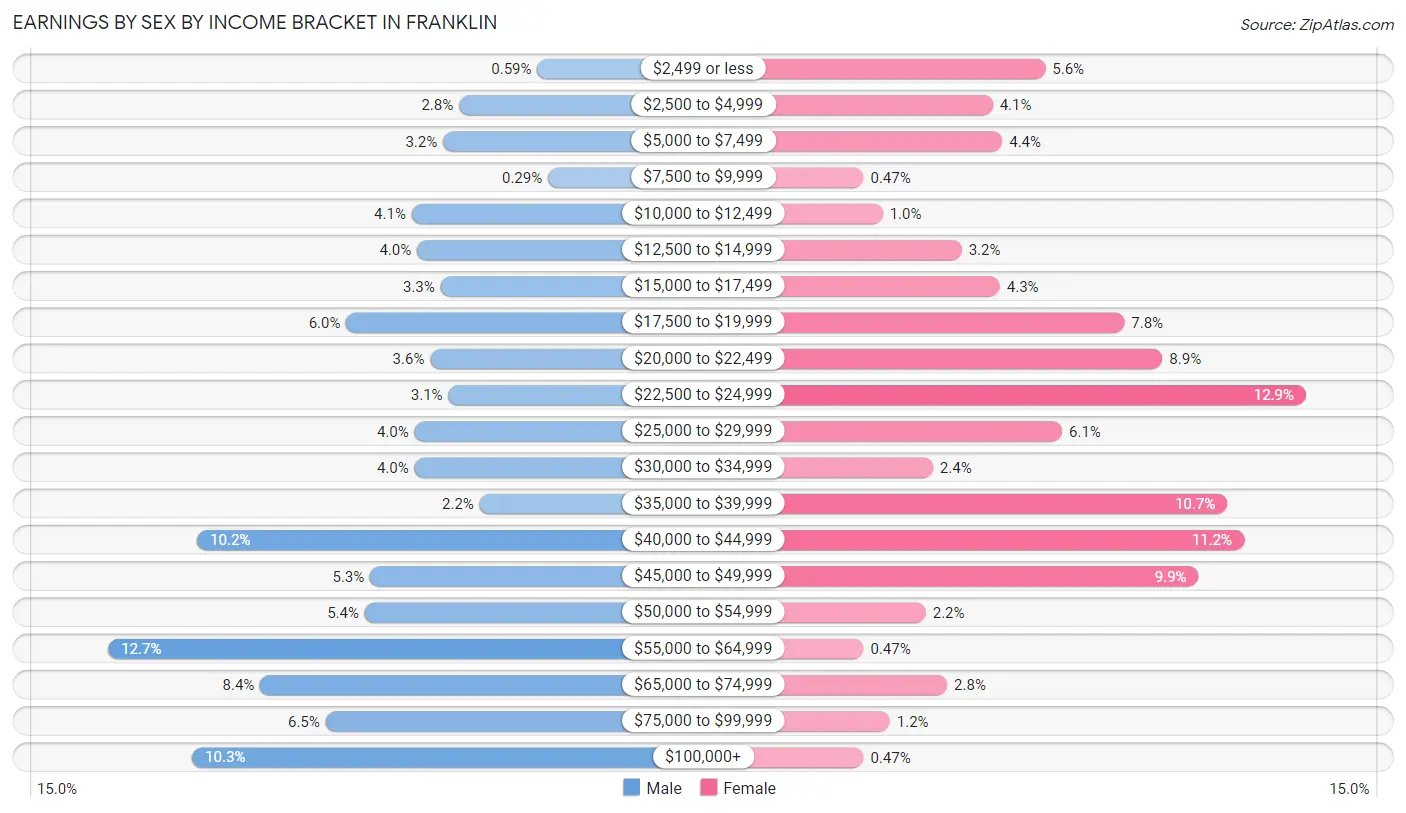
Earnings by Sex by Income Bracket in Franklin
The most common earnings brackets in Franklin are $55,000 to $64,999 for men (172 | 12.7%) and $22,500 to $24,999 for women (192 | 12.9%).
| Income | Male | Female |
| $2,499 or less | 8 (0.6%) | 83 (5.6%) |
| $2,500 to $4,999 | 38 (2.8%) | 61 (4.1%) |
| $5,000 to $7,499 | 44 (3.2%) | 65 (4.4%) |
| $7,500 to $9,999 | 4 (0.3%) | 7 (0.5%) |
| $10,000 to $12,499 | 56 (4.1%) | 15 (1.0%) |
| $12,500 to $14,999 | 54 (4.0%) | 48 (3.2%) |
| $15,000 to $17,499 | 45 (3.3%) | 64 (4.3%) |
| $17,500 to $19,999 | 81 (6.0%) | 116 (7.8%) |
| $20,000 to $22,499 | 49 (3.6%) | 132 (8.9%) |
| $22,500 to $24,999 | 42 (3.1%) | 192 (12.9%) |
| $25,000 to $29,999 | 55 (4.0%) | 90 (6.0%) |
| $30,000 to $34,999 | 55 (4.0%) | 36 (2.4%) |
| $35,000 to $39,999 | 30 (2.2%) | 159 (10.7%) |
| $40,000 to $44,999 | 138 (10.2%) | 166 (11.2%) |
| $45,000 to $49,999 | 72 (5.3%) | 147 (9.9%) |
| $50,000 to $54,999 | 74 (5.4%) | 33 (2.2%) |
| $55,000 to $64,999 | 172 (12.7%) | 7 (0.5%) |
| $65,000 to $74,999 | 114 (8.4%) | 42 (2.8%) |
| $75,000 to $99,999 | 89 (6.5%) | 18 (1.2%) |
| $100,000+ | 140 (10.3%) | 7 (0.5%) |
| Total | 1,360 (100.0%) | 1,488 (100.0%) |
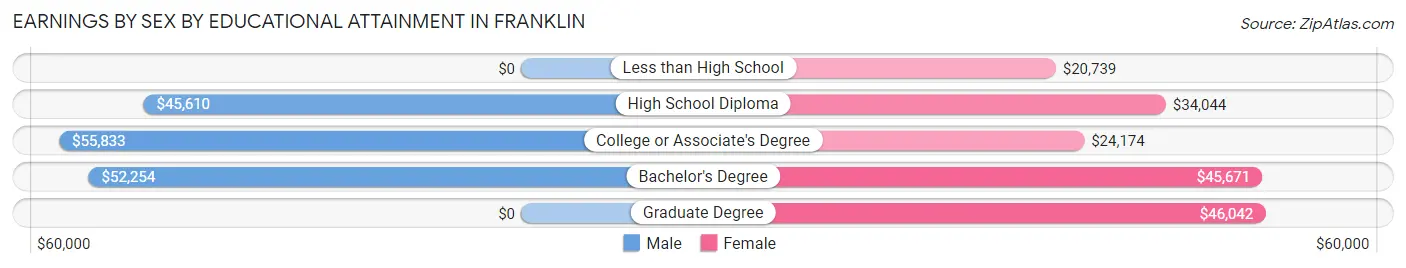
Earnings by Sex by Educational Attainment in Franklin
Average earnings in Franklin are $47,483 for men and $26,059 for women, a difference of 45.1%. Men with an educational attainment of college or associate's degree enjoy the highest average annual earnings of $55,833, while those with high school diploma education earn the least with $45,610. Women with an educational attainment of graduate degree earn the most with the average annual earnings of $46,042, while those with less than high school education have the smallest earnings of $20,739.
| Educational Attainment | Male Income | Female Income |
| Less than High School | - | - |
| High School Diploma | $45,610 | $34,044 |
| College or Associate's Degree | $55,833 | $24,174 |
| Bachelor's Degree | $52,254 | $45,671 |
| Graduate Degree | - | - |
| Total | $47,483 | $26,059 |
Family Income in Franklin
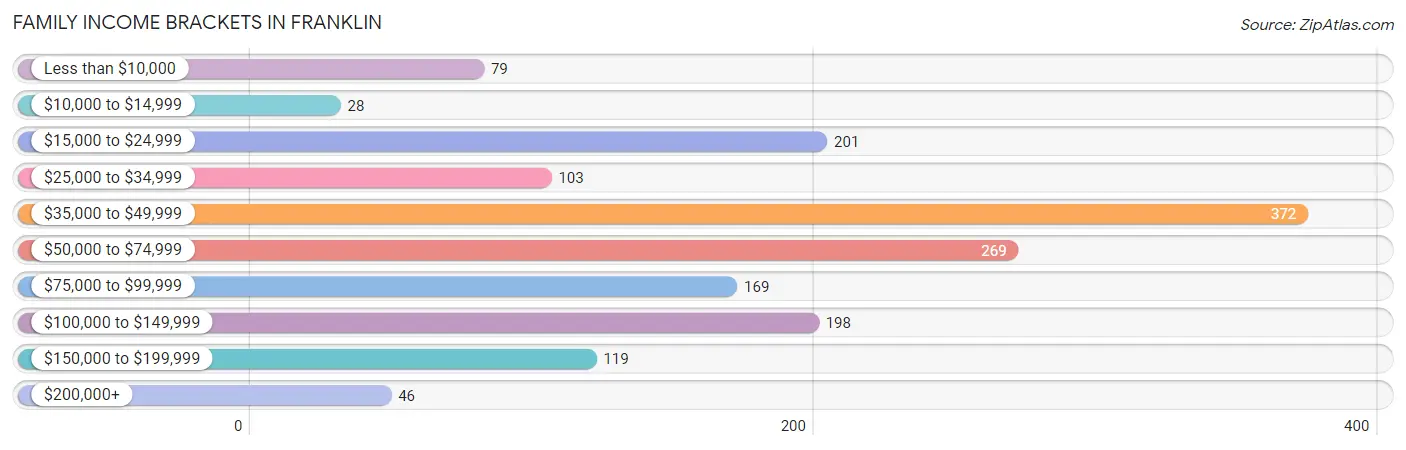
Family Income Brackets in Franklin
According to the Franklin family income data, there are 372 families falling into the $35,000 to $49,999 income range, which is the most common income bracket and makes up 23.5% of all families. Conversely, the $10,000 to $14,999 income bracket is the least frequent group with only 28 families (1.8%) belonging to this category.
| Income Bracket | # Families | % Families |
| Less than $10,000 | 79 | 5.0% |
| $10,000 to $14,999 | 28 | 1.8% |
| $15,000 to $24,999 | 201 | 12.7% |
| $25,000 to $34,999 | 103 | 6.5% |
| $35,000 to $49,999 | 372 | 23.5% |
| $50,000 to $74,999 | 269 | 17.0% |
| $75,000 to $99,999 | 169 | 10.7% |
| $100,000 to $149,999 | 198 | 12.5% |
| $150,000 to $199,999 | 119 | 7.5% |
| $200,000+ | 46 | 2.9% |
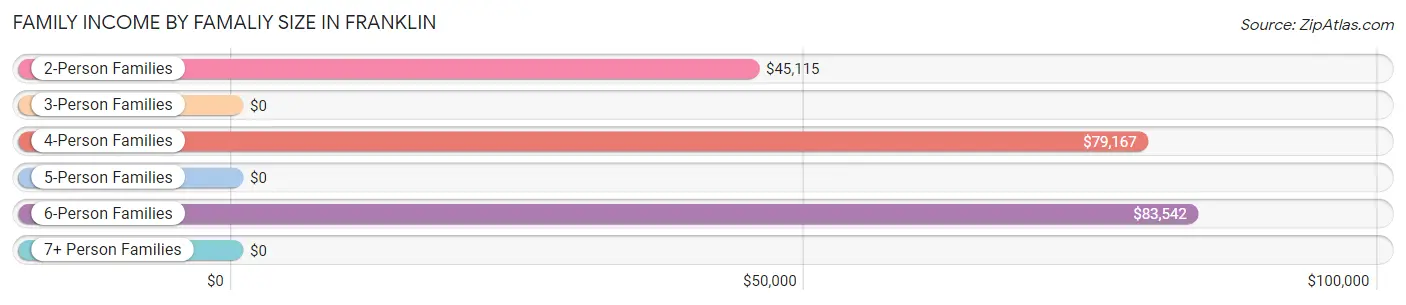
Family Income by Famaliy Size in Franklin
6-person families (36 | 2.3%) account for the highest median family income in Franklin with $83,542 per family, while 2-person families (752 | 47.5%) have the highest median income of $22,558 per family member.
| Income Bracket | # Families | Median Income |
| 2-Person Families | 752 (47.5%) | $45,115 |
| 3-Person Families | 458 (28.9%) | $0 |
| 4-Person Families | 156 (9.9%) | $79,167 |
| 5-Person Families | 121 (7.6%) | $0 |
| 6-Person Families | 36 (2.3%) | $83,542 |
| 7+ Person Families | 59 (3.7%) | $0 |
| Total | 1,582 (100.0%) | $51,250 |
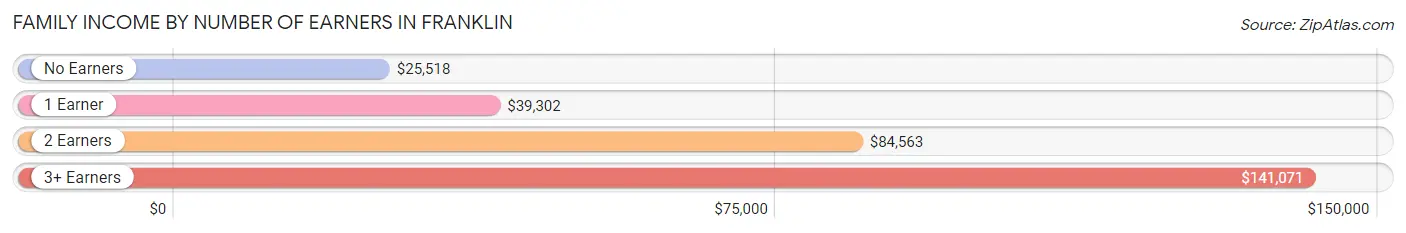
Family Income by Number of Earners in Franklin
The median family income in Franklin is $51,250, with families comprising 3+ earners (174) having the highest median family income of $141,071, while families with no earners (295) have the lowest median family income of $25,518, accounting for 11.0% and 18.6% of families, respectively.
| Number of Earners | # Families | Median Income |
| No Earners | 295 (18.6%) | $25,518 |
| 1 Earner | 702 (44.4%) | $39,302 |
| 2 Earners | 411 (26.0%) | $84,563 |
| 3+ Earners | 174 (11.0%) | $141,071 |
| Total | 1,582 (100.0%) | $51,250 |
Household Income in Franklin
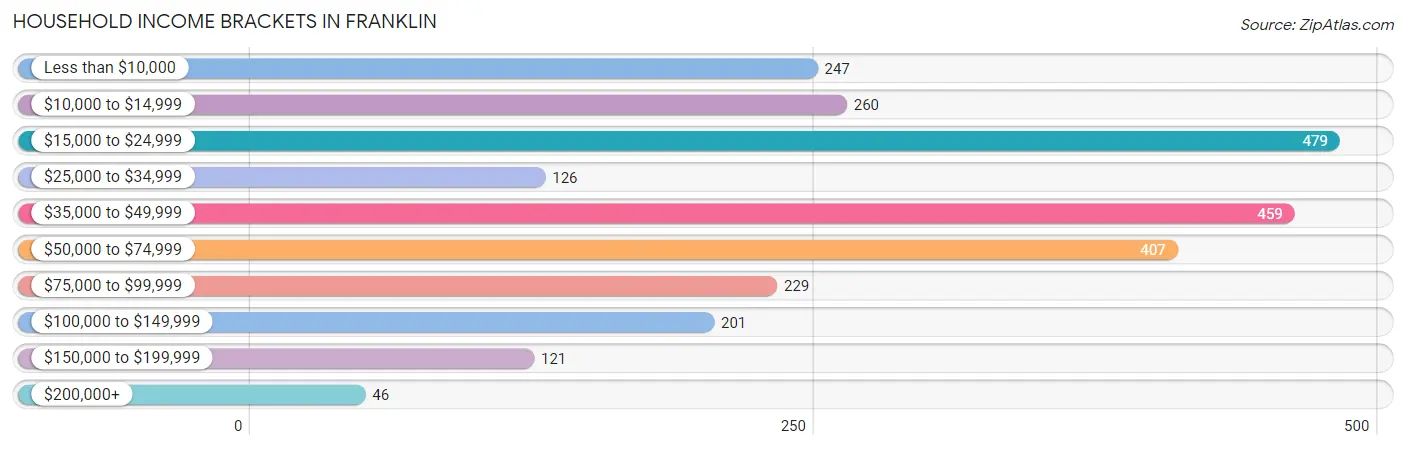
Household Income Brackets in Franklin
With 479 households falling in the category, the $15,000 to $24,999 income range is the most frequent in Franklin, accounting for 18.6% of all households. In contrast, only 46 households (1.8%) fall into the $200,000+ income bracket, making it the least populous group.
| Income Bracket | # Households | % Households |
| Less than $10,000 | 247 | 9.6% |
| $10,000 to $14,999 | 260 | 10.1% |
| $15,000 to $24,999 | 479 | 18.6% |
| $25,000 to $34,999 | 126 | 4.9% |
| $35,000 to $49,999 | 459 | 17.8% |
| $50,000 to $74,999 | 407 | 15.8% |
| $75,000 to $99,999 | 229 | 8.9% |
| $100,000 to $149,999 | 201 | 7.8% |
| $150,000 to $199,999 | 121 | 4.7% |
| $200,000+ | 46 | 1.8% |
Household Income by Householder Age in Franklin
The median household income in Franklin is $39,068, with the highest median household income of $58,656 found in the 25 to 44 years age bracket for the primary householder. A total of 693 households (26.9%) fall into this category. Meanwhile, the 65+ years age bracket for the primary householder has the lowest median household income of $23,699, with 759 households (29.5%) in this group.
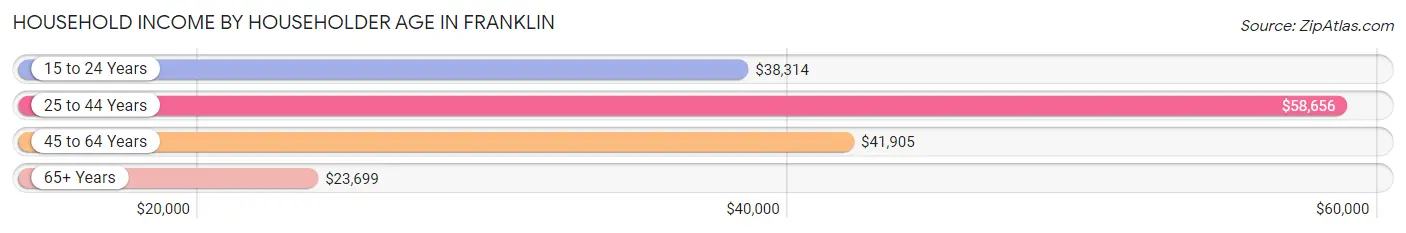
| Income Bracket | # Households | Median Income |
| 15 to 24 Years | 98 (3.8%) | $38,314 |
| 25 to 44 Years | 693 (26.9%) | $58,656 |
| 45 to 64 Years | 1,026 (39.8%) | $41,905 |
| 65+ Years | 759 (29.5%) | $23,699 |
| Total | 2,576 (100.0%) | $39,068 |
Poverty in Franklin
Income Below Poverty by Sex and Age in Franklin
With 18.3% poverty level for males and 22.8% for females among the residents of Franklin, 12 to 14 year old males and 16 and 17 year old females are the most vulnerable to poverty, with 83 males (37.2%) and 52 females (43.3%) in their respective age groups living below the poverty level.
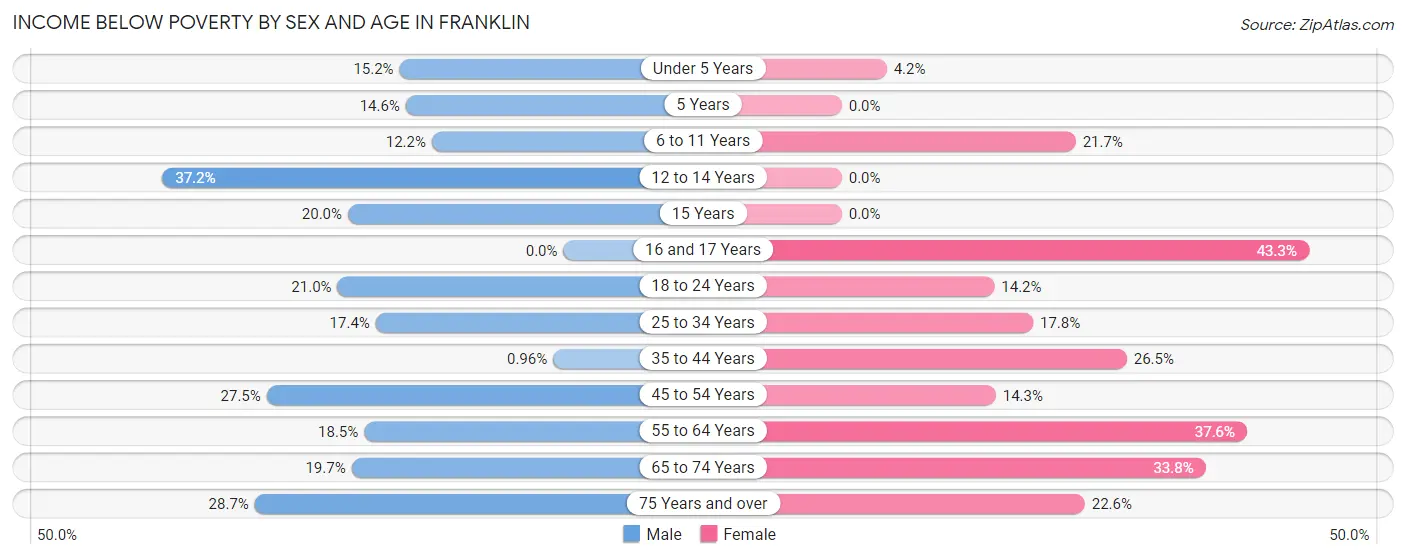
| Age Bracket | Male | Female |
| Under 5 Years | 54 (15.2%) | 6 (4.2%) |
| 5 Years | 6 (14.6%) | 0 (0.0%) |
| 6 to 11 Years | 26 (12.2%) | 71 (21.7%) |
| 12 to 14 Years | 83 (37.2%) | 0 (0.0%) |
| 15 Years | 2 (20.0%) | 0 (0.0%) |
| 16 and 17 Years | 0 (0.0%) | 52 (43.3%) |
| 18 to 24 Years | 56 (21.0%) | 47 (14.2%) |
| 25 to 34 Years | 58 (17.4%) | 63 (17.7%) |
| 35 to 44 Years | 3 (1.0%) | 123 (26.5%) |
| 45 to 54 Years | 95 (27.5%) | 55 (14.3%) |
| 55 to 64 Years | 88 (18.5%) | 165 (37.6%) |
| 65 to 74 Years | 70 (19.7%) | 108 (33.8%) |
| 75 Years and over | 51 (28.6%) | 62 (22.6%) |
| Total | 592 (18.3%) | 752 (22.8%) |
Income Above Poverty by Sex and Age in Franklin
According to the poverty statistics in Franklin, males aged 16 and 17 years and females aged 5 years are the age groups that are most secure financially, with 100.0% of males and 100.0% of females in these age groups living above the poverty line.
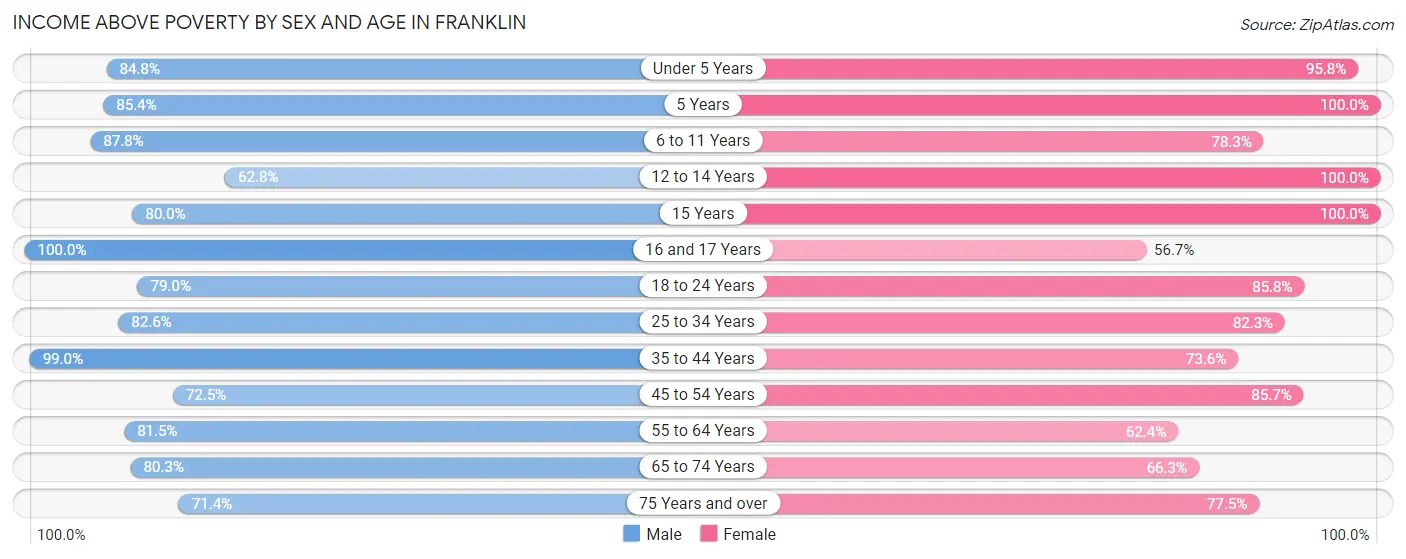
| Age Bracket | Male | Female |
| Under 5 Years | 301 (84.8%) | 138 (95.8%) |
| 5 Years | 35 (85.4%) | 18 (100.0%) |
| 6 to 11 Years | 187 (87.8%) | 256 (78.3%) |
| 12 to 14 Years | 140 (62.8%) | 57 (100.0%) |
| 15 Years | 8 (80.0%) | 63 (100.0%) |
| 16 and 17 Years | 124 (100.0%) | 68 (56.7%) |
| 18 to 24 Years | 211 (79.0%) | 285 (85.8%) |
| 25 to 34 Years | 275 (82.6%) | 292 (82.3%) |
| 35 to 44 Years | 310 (99.0%) | 342 (73.6%) |
| 45 to 54 Years | 250 (72.5%) | 330 (85.7%) |
| 55 to 64 Years | 388 (81.5%) | 274 (62.4%) |
| 65 to 74 Years | 286 (80.3%) | 212 (66.2%) |
| 75 Years and over | 127 (71.4%) | 213 (77.4%) |
| Total | 2,642 (81.7%) | 2,548 (77.2%) |
Income Below Poverty Among Married-Couple Families in Franklin
The poverty statistics for married-couple families in Franklin show that 4.6% or 43 of the total 934 families live below the poverty line. Families with 1 or 2 children have the highest poverty rate of 6.2%, comprising of 17 families. On the other hand, families with 3 or 4 children have the lowest poverty rate of 0.0%, which includes 0 families.
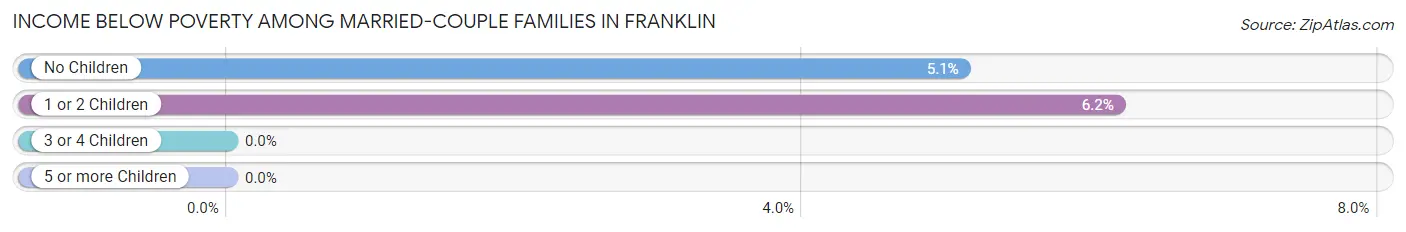
| Children | Above Poverty | Below Poverty |
| No Children | 484 (94.9%) | 26 (5.1%) |
| 1 or 2 Children | 258 (93.8%) | 17 (6.2%) |
| 3 or 4 Children | 94 (100.0%) | 0 (0.0%) |
| 5 or more Children | 55 (100.0%) | 0 (0.0%) |
| Total | 891 (95.4%) | 43 (4.6%) |
Income Below Poverty Among Single-Parent Households in Franklin
According to the poverty data in Franklin, 3.5% or 4 single-father households and 35.1% or 187 single-mother households are living below the poverty line. Among single-father households, those with 1 or 2 children have the highest poverty rate, with 4 households (15.4%) experiencing poverty. Likewise, among single-mother households, those with 3 or 4 children have the highest poverty rate, with 26 households (100.0%) falling below the poverty line.
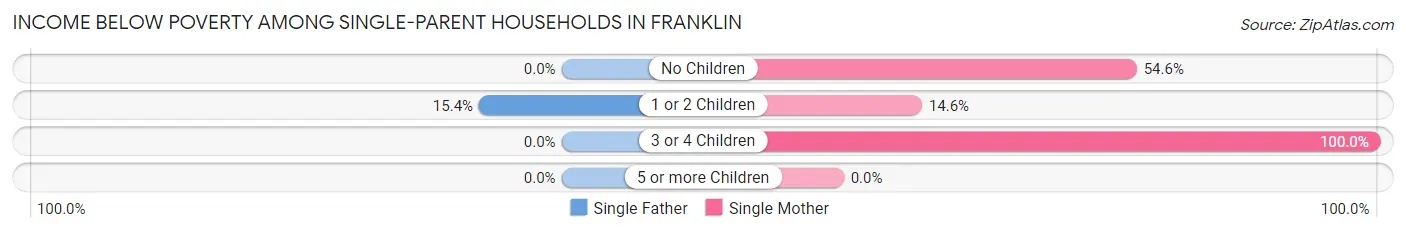
| Children | Single Father | Single Mother |
| No Children | 0 (0.0%) | 119 (54.6%) |
| 1 or 2 Children | 4 (15.4%) | 42 (14.6%) |
| 3 or 4 Children | 0 (0.0%) | 26 (100.0%) |
| 5 or more Children | 0 (0.0%) | 0 (0.0%) |
| Total | 4 (3.5%) | 187 (35.1%) |
Income Below Poverty Among Married-Couple vs Single-Parent Households in Franklin
The poverty data for Franklin shows that 43 of the married-couple family households (4.6%) and 191 of the single-parent households (29.5%) are living below the poverty level. Within the married-couple family households, those with 1 or 2 children have the highest poverty rate, with 17 households (6.2%) falling below the poverty line. Among the single-parent households, those with 3 or 4 children have the highest poverty rate, with 26 household (100.0%) living below poverty.
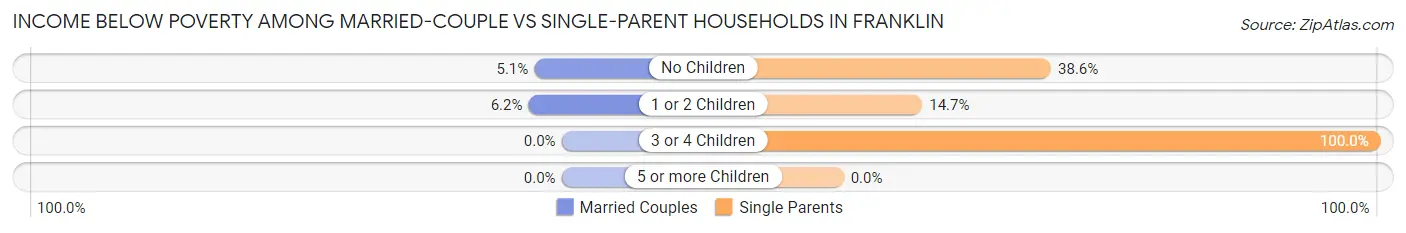
| Children | Married-Couple Families | Single-Parent Households |
| No Children | 26 (5.1%) | 119 (38.6%) |
| 1 or 2 Children | 17 (6.2%) | 46 (14.6%) |
| 3 or 4 Children | 0 (0.0%) | 26 (100.0%) |
| 5 or more Children | 0 (0.0%) | 0 (0.0%) |
| Total | 43 (4.6%) | 191 (29.5%) |
Race in Franklin
The most populous races in Franklin are Black / African American (3,369 | 50.5%), White / Caucasian (2,718 | 40.8%), and Two or more Races (402 | 6.0%).
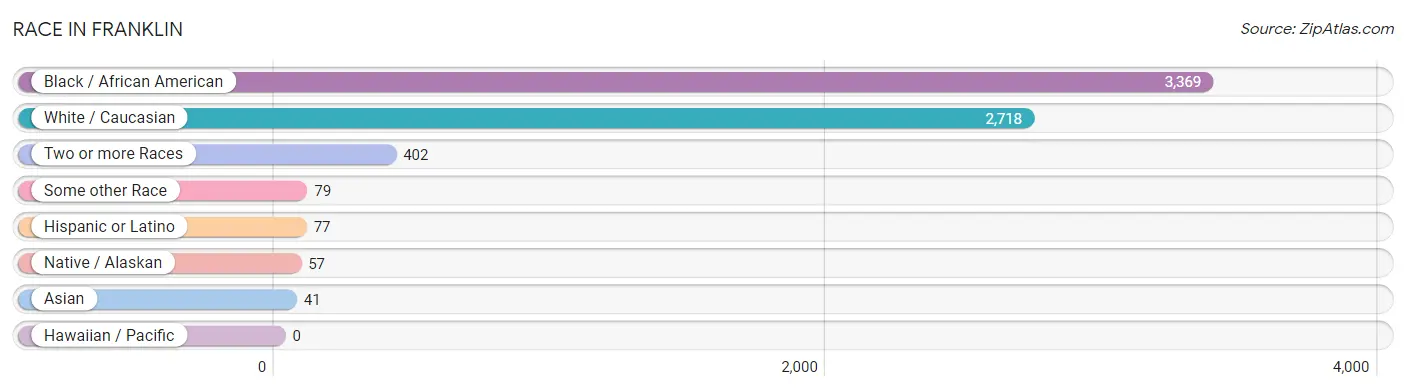
| Race | # Population | % Population |
| Asian | 41 | 0.6% |
| Black / African American | 3,369 | 50.5% |
| Hawaiian / Pacific | 0 | 0.0% |
| Hispanic or Latino | 77 | 1.2% |
| Native / Alaskan | 57 | 0.9% |
| White / Caucasian | 2,718 | 40.8% |
| Two or more Races | 402 | 6.0% |
| Some other Race | 79 | 1.2% |
| Total | 6,666 | 100.0% |
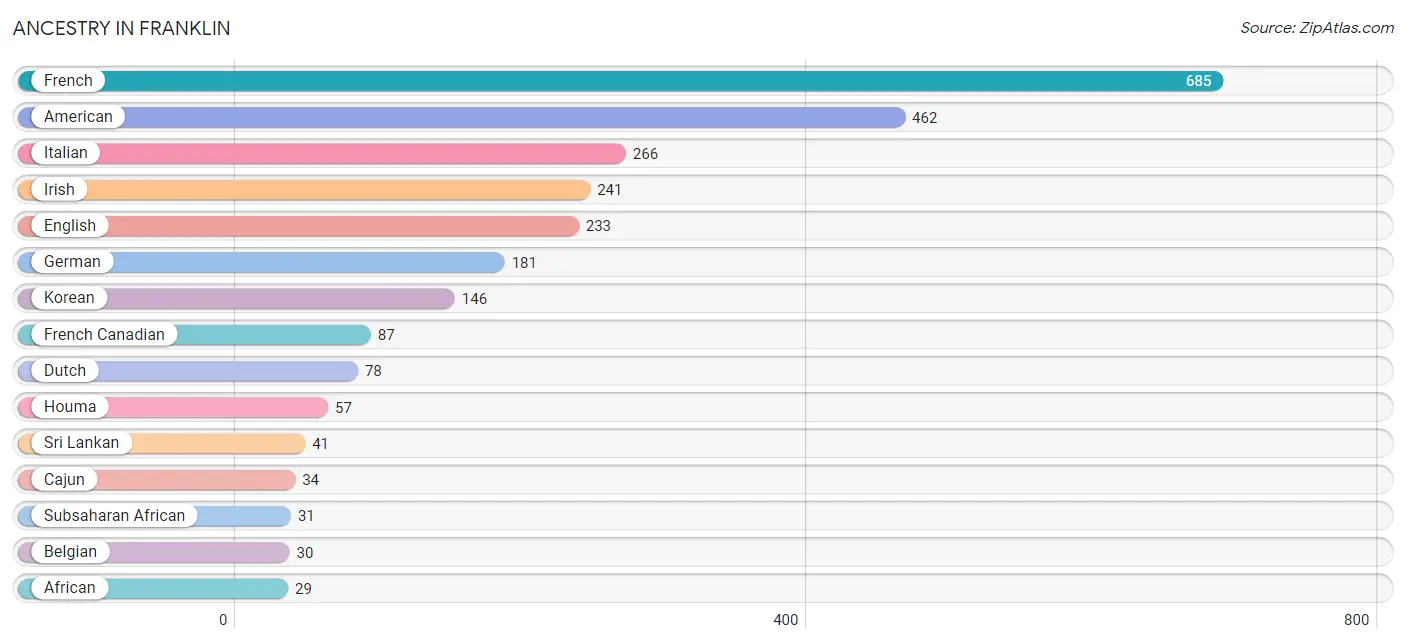
Ancestry in Franklin
The most populous ancestries reported in Franklin are French (685 | 10.3%), American (462 | 6.9%), Italian (266 | 4.0%), Irish (241 | 3.6%), and English (233 | 3.5%), together accounting for 28.3% of all Franklin residents.
| Ancestry | # Population | % Population |
| African | 29 | 0.4% |
| American | 462 | 6.9% |
| Belgian | 30 | 0.4% |
| British | 8 | 0.1% |
| Cajun | 34 | 0.5% |
| Canadian | 6 | 0.1% |
| Celtic | 5 | 0.1% |
| Central American | 12 | 0.2% |
| Cuban | 21 | 0.3% |
| Danish | 23 | 0.4% |
| Dutch | 78 | 1.2% |
| English | 233 | 3.5% |
| European | 14 | 0.2% |
| French | 685 | 10.3% |
| French Canadian | 87 | 1.3% |
| German | 181 | 2.7% |
| Haitian | 2 | 0.0% |
| Houma | 57 | 0.9% |
| Irish | 241 | 3.6% |
| Italian | 266 | 4.0% |
| Korean | 146 | 2.2% |
| Macedonian | 8 | 0.1% |
| Mexican | 29 | 0.4% |
| Nigerian | 2 | 0.0% |
| Norwegian | 9 | 0.1% |
| Panamanian | 12 | 0.2% |
| Scottish | 19 | 0.3% |
| Serbian | 8 | 0.1% |
| Spanish | 12 | 0.2% |
| Sri Lankan | 41 | 0.6% |
| Subsaharan African | 31 | 0.5% |
| Swedish | 9 | 0.1% | View All 32 Rows |
Immigrants in Franklin
The most numerous immigrant groups reported in Franklin came from Latin America (44 | 0.7%), Asia (33 | 0.5%), South Eastern Asia (33 | 0.5%), Vietnam (33 | 0.5%), and Europe (31 | 0.5%), together accounting for 2.6% of all Franklin residents.
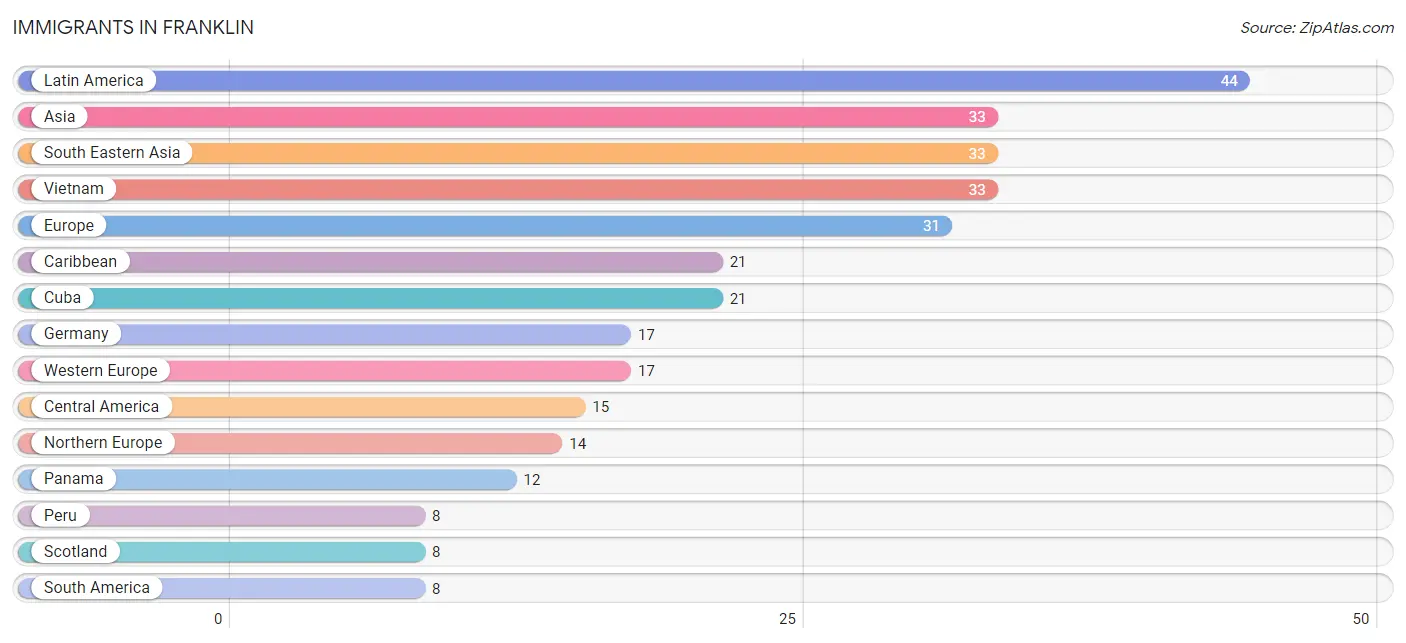
| Immigration Origin | # Population | % Population |
| Africa | 2 | 0.0% |
| Asia | 33 | 0.5% |
| Caribbean | 21 | 0.3% |
| Central America | 15 | 0.2% |
| Cuba | 21 | 0.3% |
| Europe | 31 | 0.5% |
| Germany | 17 | 0.3% |
| Ireland | 6 | 0.1% |
| Latin America | 44 | 0.7% |
| Mexico | 3 | 0.1% |
| Nigeria | 2 | 0.0% |
| Northern Europe | 14 | 0.2% |
| Panama | 12 | 0.2% |
| Peru | 8 | 0.1% |
| Scotland | 8 | 0.1% |
| South America | 8 | 0.1% |
| South Eastern Asia | 33 | 0.5% |
| Vietnam | 33 | 0.5% |
| Western Africa | 2 | 0.0% |
| Western Europe | 17 | 0.3% | View All 20 Rows |
Sex and Age in Franklin
Sex and Age in Franklin
The most populous age groups in Franklin are 10 to 14 Years (357 | 10.8%) for men and 15 to 19 Years (293 | 8.7%) for women.
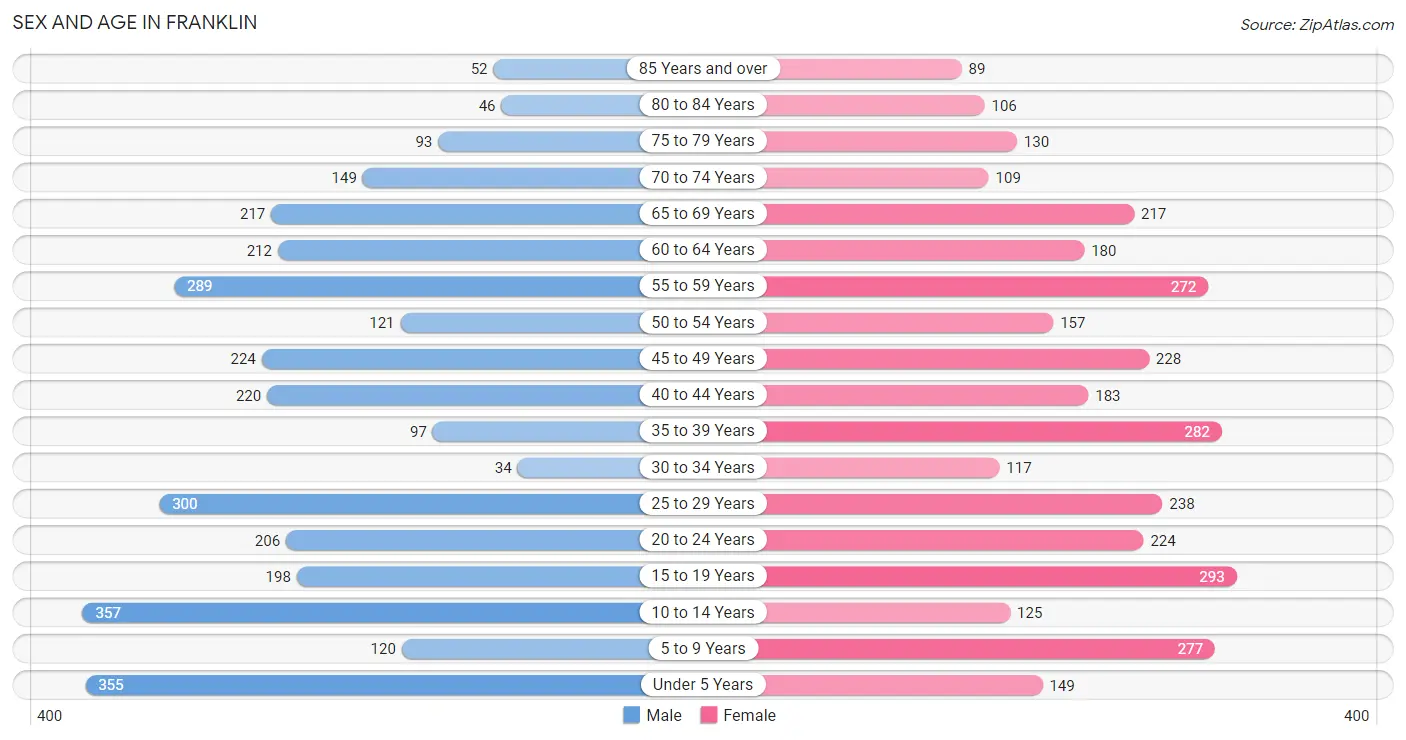
| Age Bracket | Male | Female |
| Under 5 Years | 355 (10.8%) | 149 (4.4%) |
| 5 to 9 Years | 120 (3.6%) | 277 (8.2%) |
| 10 to 14 Years | 357 (10.8%) | 125 (3.7%) |
| 15 to 19 Years | 198 (6.0%) | 293 (8.7%) |
| 20 to 24 Years | 206 (6.3%) | 224 (6.6%) |
| 25 to 29 Years | 300 (9.1%) | 238 (7.0%) |
| 30 to 34 Years | 34 (1.0%) | 117 (3.5%) |
| 35 to 39 Years | 97 (2.9%) | 282 (8.4%) |
| 40 to 44 Years | 220 (6.7%) | 183 (5.4%) |
| 45 to 49 Years | 224 (6.8%) | 228 (6.8%) |
| 50 to 54 Years | 121 (3.7%) | 157 (4.6%) |
| 55 to 59 Years | 289 (8.8%) | 272 (8.1%) |
| 60 to 64 Years | 212 (6.4%) | 180 (5.3%) |
| 65 to 69 Years | 217 (6.6%) | 217 (6.4%) |
| 70 to 74 Years | 149 (4.5%) | 109 (3.2%) |
| 75 to 79 Years | 93 (2.8%) | 130 (3.8%) |
| 80 to 84 Years | 46 (1.4%) | 106 (3.1%) |
| 85 Years and over | 52 (1.6%) | 89 (2.6%) |
| Total | 3,290 (100.0%) | 3,376 (100.0%) |
Families and Households in Franklin
Median Family Size in Franklin
The median family size in Franklin is 3.38 persons per family, with married-couple families (934 | 59.0%) accounting for the largest median family size of 3.57 persons per family. On the other hand, single female/mother families (532 | 33.6%) represent the smallest median family size with 3.08 persons per family.
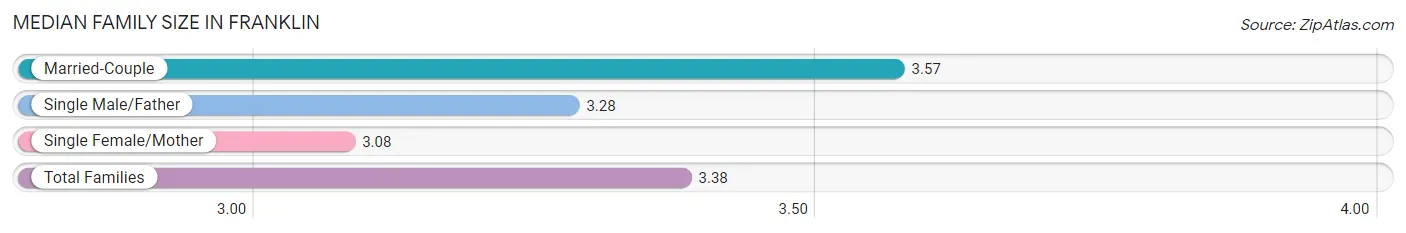
| Family Type | # Families | Family Size |
| Married-Couple | 934 (59.0%) | 3.57 |
| Single Male/Father | 116 (7.3%) | 3.28 |
| Single Female/Mother | 532 (33.6%) | 3.08 |
| Total Families | 1,582 (100.0%) | 3.38 |
Median Household Size in Franklin
The median household size in Franklin is 2.52 persons per household, with married-couple households (934 | 36.3%) accounting for the largest median household size of 3.57 persons per household. non-family households (994 | 38.6%) represent the smallest median household size with 1.08 persons per household.
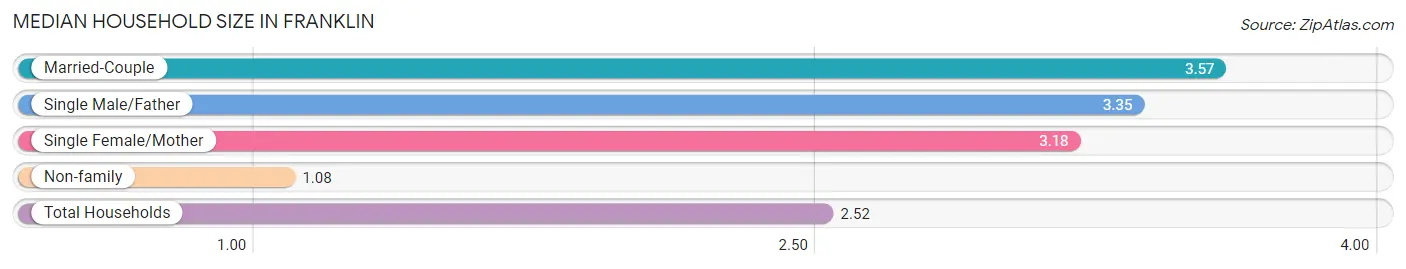
| Household Type | # Households | Household Size |
| Married-Couple | 934 (36.3%) | 3.57 |
| Single Male/Father | 116 (4.5%) | 3.35 |
| Single Female/Mother | 532 (20.6%) | 3.18 |
| Non-family | 994 (38.6%) | 1.08 |
| Total Households | 2,576 (100.0%) | 2.52 |
Household Size by Marriage Status in Franklin
Out of a total of 2,576 households in Franklin, 1,582 (61.4%) are family households, while 994 (38.6%) are nonfamily households. The most numerous type of family households are 2-person households, comprising 737, and the most common type of nonfamily households are 1-person households, comprising 925.
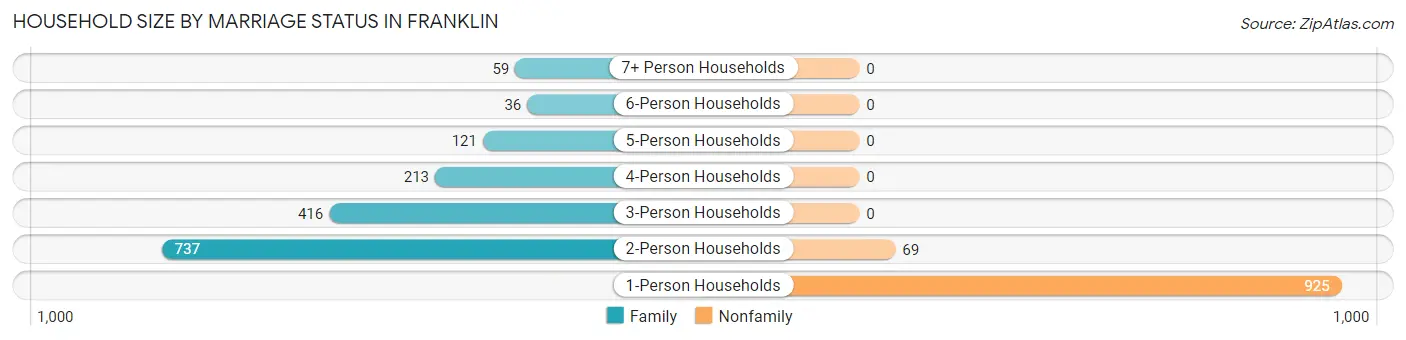
| Household Size | Family Households | Nonfamily Households |
| 1-Person Households | - | 925 (35.9%) |
| 2-Person Households | 737 (28.6%) | 69 (2.7%) |
| 3-Person Households | 416 (16.2%) | 0 (0.0%) |
| 4-Person Households | 213 (8.3%) | 0 (0.0%) |
| 5-Person Households | 121 (4.7%) | 0 (0.0%) |
| 6-Person Households | 36 (1.4%) | 0 (0.0%) |
| 7+ Person Households | 59 (2.3%) | 0 (0.0%) |
| Total | 1,582 (61.4%) | 994 (38.6%) |
Female Fertility in Franklin
Fertility by Age in Franklin
Average fertility rate in Franklin is 86.0 births per 1,000 women. Women in the age bracket of 20 to 34 years have the highest fertility rate with 238.0 births per 1,000 women. Women in the age bracket of 20 to 34 years acount for 100.0% of all women with births.
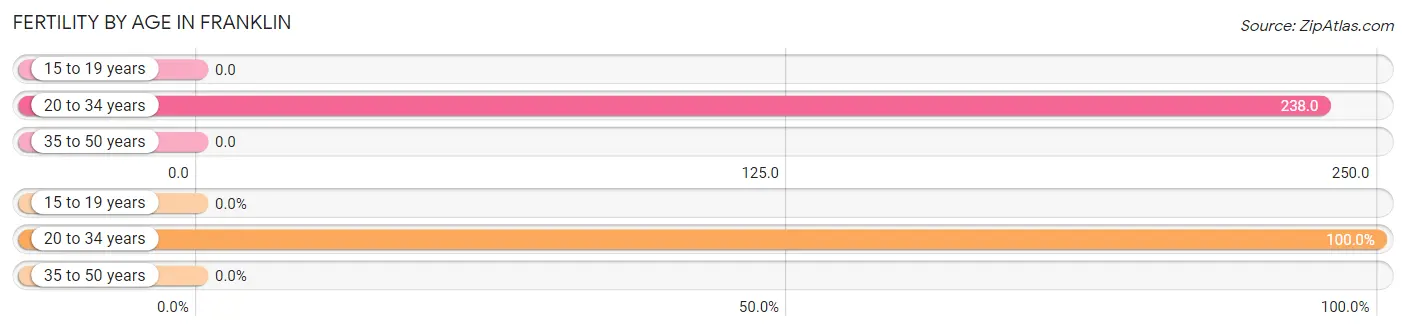
| Age Bracket | Women with Births | Births / 1,000 Women |
| 15 to 19 years | 0 (0.0%) | 0.0 |
| 20 to 34 years | 138 (100.0%) | 238.0 |
| 35 to 50 years | 0 (0.0%) | 0.0 |
| Total | 138 (100.0%) | 86.0 |
Fertility by Age by Marriage Status in Franklin
13.8% of women with births (138) in Franklin are married. The highest percentage of unmarried women with births falls into 20 to 34 years age bracket with 86.2% of them unmarried at the time of birth, while the lowest percentage of unmarried women with births belong to 20 to 34 years age bracket with 86.2% of them unmarried.
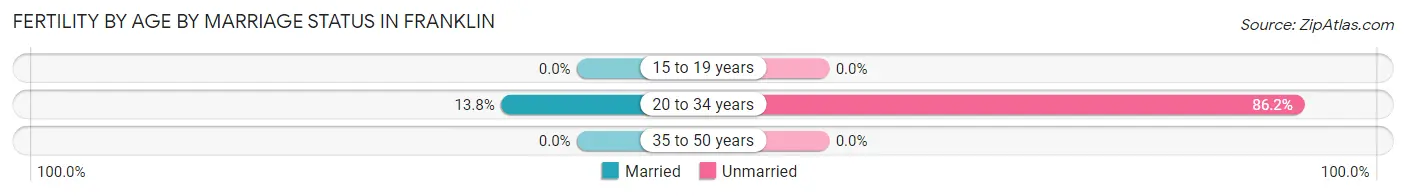
| Age Bracket | Married | Unmarried |
| 15 to 19 years | 0 (0.0%) | 0 (0.0%) |
| 20 to 34 years | 19 (13.8%) | 119 (86.2%) |
| 35 to 50 years | 0 (0.0%) | 0 (0.0%) |
| Total | 19 (13.8%) | 119 (86.2%) |
Fertility by Education in Franklin
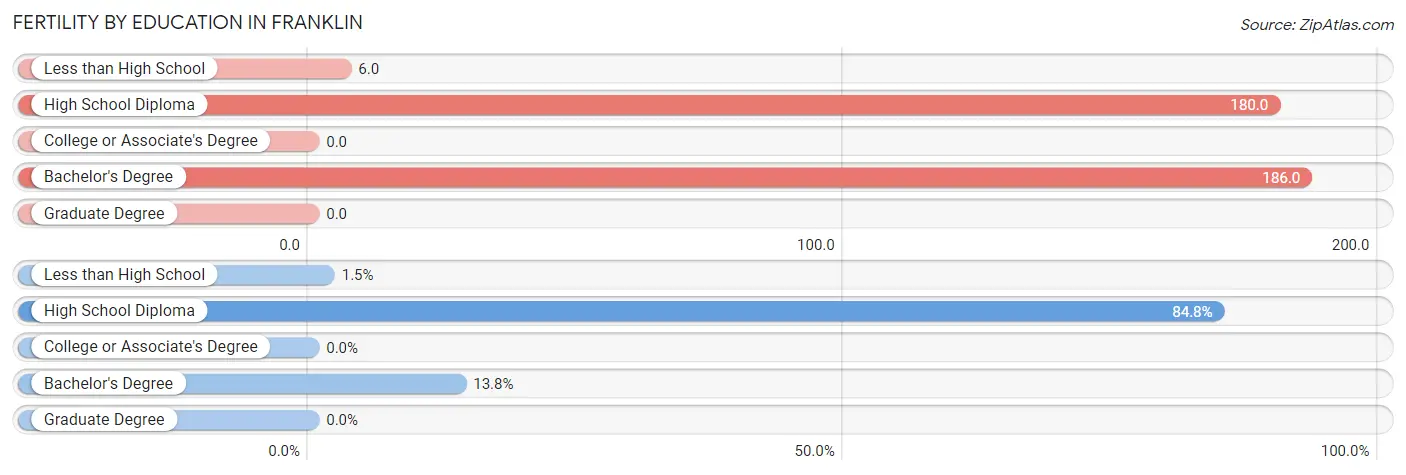
| Educational Attainment | Women with Births | Births / 1,000 Women |
| Less than High School | 2 (1.5%) | 6.0 |
| High School Diploma | 117 (84.8%) | 180.0 |
| College or Associate's Degree | 0 (0.0%) | 0.0 |
| Bachelor's Degree | 19 (13.8%) | 186.0 |
| Graduate Degree | 0 (0.0%) | 0.0 |
| Total | 138 (100.0%) | 86.0 |
Fertility by Education by Marriage Status in Franklin
86.2% of women with births in Franklin are unmarried. Women with the educational attainment of bachelor's degree are most likely to be married with 100.0% of them married at childbirth, while women with the educational attainment of less than high school are least likely to be married with 100.0% of them unmarried at childbirth.
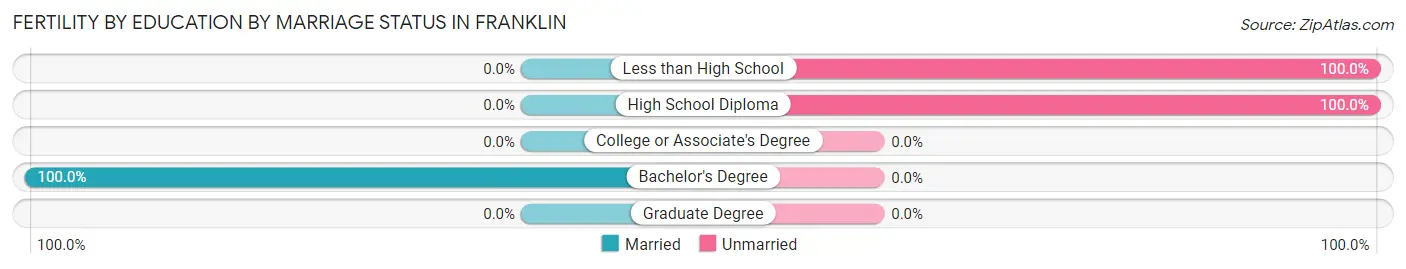
| Educational Attainment | Married | Unmarried |
| Less than High School | 0 (0.0%) | 2 (100.0%) |
| High School Diploma | 0 (0.0%) | 117 (100.0%) |
| College or Associate's Degree | 0 (0.0%) | 0 (0.0%) |
| Bachelor's Degree | 19 (100.0%) | 0 (0.0%) |
| Graduate Degree | 0 (0.0%) | 0 (0.0%) |
| Total | 19 (13.8%) | 119 (86.2%) |
Employment Characteristics in Franklin
Employment by Class of Employer in Franklin
Among the 2,590 employed individuals in Franklin, private company employees (1,769 | 68.3%), local government employees (326 | 12.6%), and not-for-profit organizations (185 | 7.1%) make up the most common classes of employment.
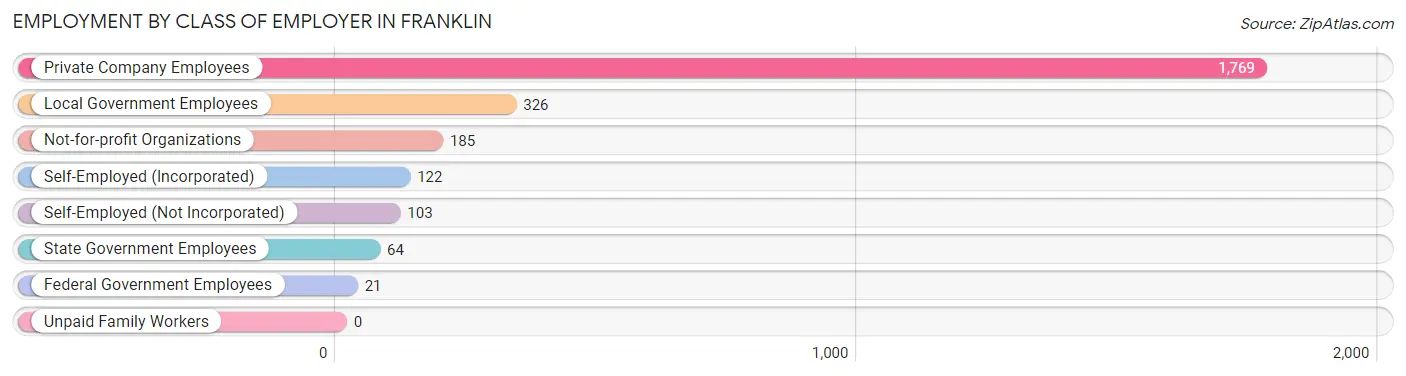
| Employer Class | # Employees | % Employees |
| Private Company Employees | 1,769 | 68.3% |
| Self-Employed (Incorporated) | 122 | 4.7% |
| Self-Employed (Not Incorporated) | 103 | 4.0% |
| Not-for-profit Organizations | 185 | 7.1% |
| Local Government Employees | 326 | 12.6% |
| State Government Employees | 64 | 2.5% |
| Federal Government Employees | 21 | 0.8% |
| Unpaid Family Workers | 0 | 0.0% |
| Total | 2,590 | 100.0% |
Employment Status by Age in Franklin
According to the labor force statistics for Franklin, out of the total population over 16 years of age (5,210), 52.4% or 2,730 individuals are in the labor force, with 2.7% or 74 of them unemployed. The age group with the highest labor force participation rate is 25 to 29 years, with 80.5% or 433 individuals in the labor force. Within the labor force, the 65 to 74 years age range has the highest percentage of unemployed individuals, with 8.0% or 12 of them being unemployed.
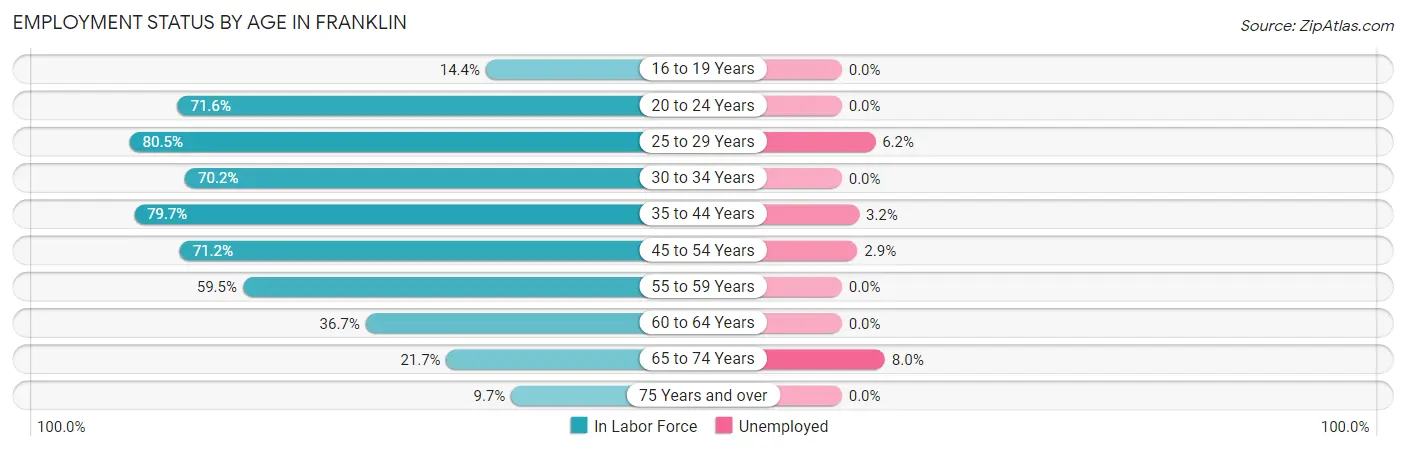
| Age Bracket | In Labor Force | Unemployed |
| 16 to 19 Years | 60 (14.4%) | 0 (0.0%) |
| 20 to 24 Years | 308 (71.6%) | 0 (0.0%) |
| 25 to 29 Years | 433 (80.5%) | 27 (6.2%) |
| 30 to 34 Years | 106 (70.2%) | 0 (0.0%) |
| 35 to 44 Years | 623 (79.7%) | 20 (3.2%) |
| 45 to 54 Years | 520 (71.2%) | 15 (2.9%) |
| 55 to 59 Years | 334 (59.5%) | 0 (0.0%) |
| 60 to 64 Years | 144 (36.7%) | 0 (0.0%) |
| 65 to 74 Years | 150 (21.7%) | 12 (8.0%) |
| 75 Years and over | 50 (9.7%) | 0 (0.0%) |
| Total | 2,730 (52.4%) | 74 (2.7%) |
Employment Status by Educational Attainment in Franklin
According to labor force statistics for Franklin, 68.5% of individuals (2,160) out of the total population between 25 and 64 years of age (3,154) are in the labor force, with 2.9% or 63 of them being unemployed. The group with the highest labor force participation rate are those with the educational attainment of bachelor's degree or higher, with 88.1% or 348 individuals in the labor force. Within the labor force, individuals with college / associate degree education have the highest percentage of unemployment, with 4.1% or 25 of them being unemployed.
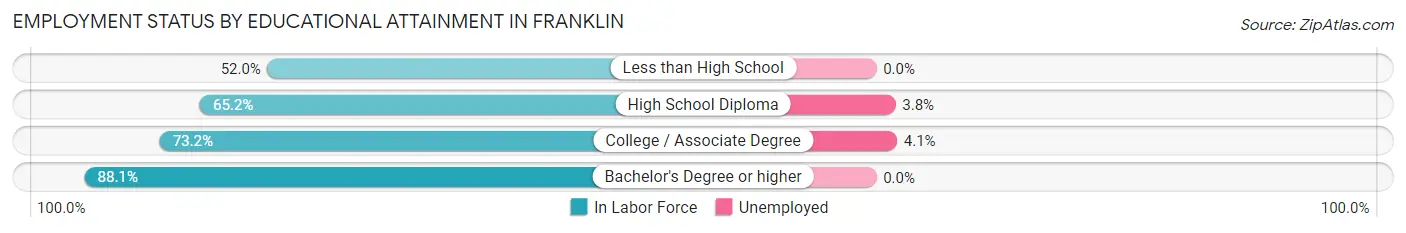
| Educational Attainment | In Labor Force | Unemployed |
| Less than High School | 211 (52.0%) | 0 (0.0%) |
| High School Diploma | 986 (65.2%) | 57 (3.8%) |
| College / Associate Degree | 615 (73.2%) | 34 (4.1%) |
| Bachelor's Degree or higher | 348 (88.1%) | 0 (0.0%) |
| Total | 2,160 (68.5%) | 91 (2.9%) |
Employment Occupations by Sex in Franklin
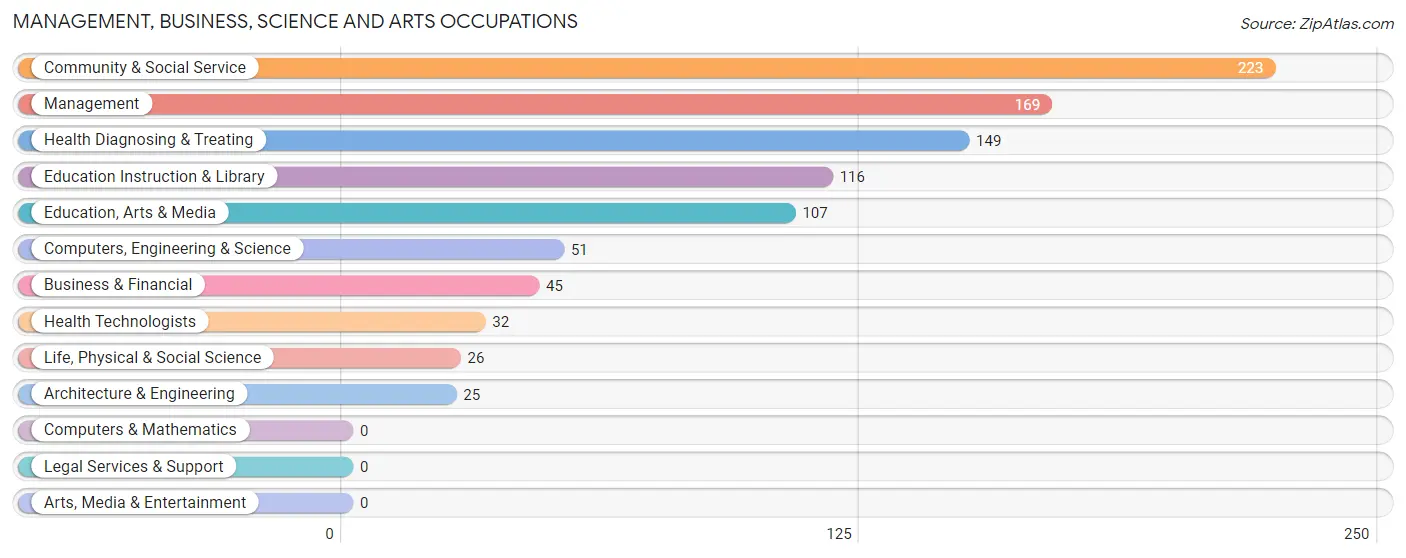
Management, Business, Science and Arts Occupations
The most common Management, Business, Science and Arts occupations in Franklin are Community & Social Service (223 | 8.4%), Management (169 | 6.4%), Health Diagnosing & Treating (149 | 5.6%), Education Instruction & Library (116 | 4.4%), and Education, Arts & Media (107 | 4.0%).
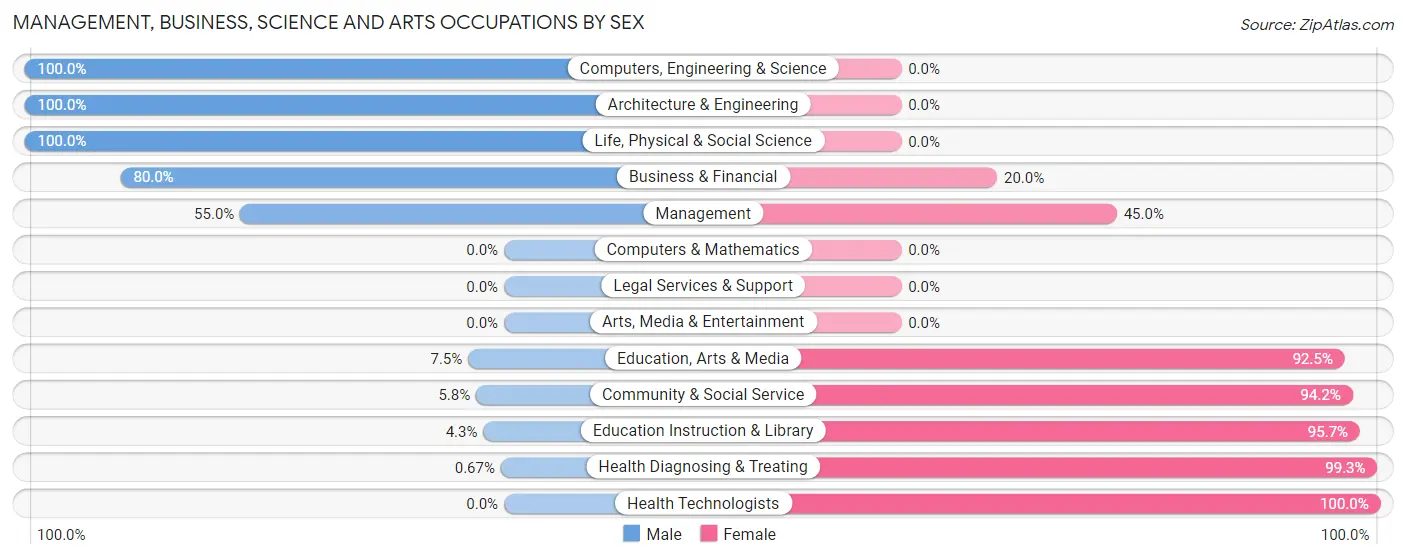
Management, Business, Science and Arts Occupations by Sex
Within the Management, Business, Science and Arts occupations in Franklin, the most male-oriented occupations are Computers, Engineering & Science (100.0%), Architecture & Engineering (100.0%), and Life, Physical & Social Science (100.0%), while the most female-oriented occupations are Health Technologists (100.0%), Health Diagnosing & Treating (99.3%), and Education Instruction & Library (95.7%).
| Occupation | Male | Female |
| Management | 93 (55.0%) | 76 (45.0%) |
| Business & Financial | 36 (80.0%) | 9 (20.0%) |
| Computers, Engineering & Science | 51 (100.0%) | 0 (0.0%) |
| Computers & Mathematics | 0 (0.0%) | 0 (0.0%) |
| Architecture & Engineering | 25 (100.0%) | 0 (0.0%) |
| Life, Physical & Social Science | 26 (100.0%) | 0 (0.0%) |
| Community & Social Service | 13 (5.8%) | 210 (94.2%) |
| Education, Arts & Media | 8 (7.5%) | 99 (92.5%) |
| Legal Services & Support | 0 (0.0%) | 0 (0.0%) |
| Education Instruction & Library | 5 (4.3%) | 111 (95.7%) |
| Arts, Media & Entertainment | 0 (0.0%) | 0 (0.0%) |
| Health Diagnosing & Treating | 1 (0.7%) | 148 (99.3%) |
| Health Technologists | 0 (0.0%) | 32 (100.0%) |
| Total (Category) | 194 (30.5%) | 443 (69.5%) |
| Total (Overall) | 1,265 (47.7%) | 1,389 (52.3%) |
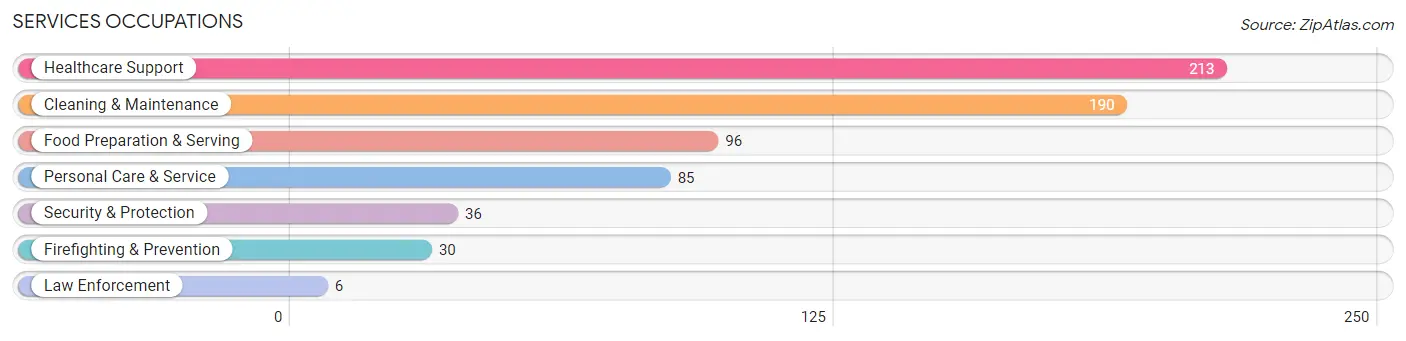
Services Occupations
The most common Services occupations in Franklin are Healthcare Support (213 | 8.0%), Cleaning & Maintenance (190 | 7.2%), Food Preparation & Serving (96 | 3.6%), Personal Care & Service (85 | 3.2%), and Security & Protection (36 | 1.4%).
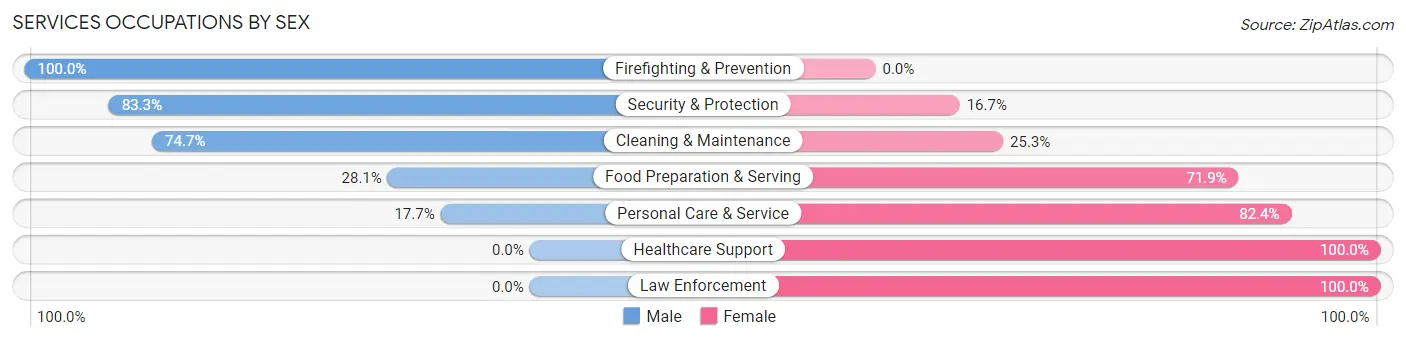
Services Occupations by Sex
Within the Services occupations in Franklin, the most male-oriented occupations are Firefighting & Prevention (100.0%), Security & Protection (83.3%), and Cleaning & Maintenance (74.7%), while the most female-oriented occupations are Healthcare Support (100.0%), Law Enforcement (100.0%), and Personal Care & Service (82.4%).
| Occupation | Male | Female |
| Healthcare Support | 0 (0.0%) | 213 (100.0%) |
| Security & Protection | 30 (83.3%) | 6 (16.7%) |
| Firefighting & Prevention | 30 (100.0%) | 0 (0.0%) |
| Law Enforcement | 0 (0.0%) | 6 (100.0%) |
| Food Preparation & Serving | 27 (28.1%) | 69 (71.9%) |
| Cleaning & Maintenance | 142 (74.7%) | 48 (25.3%) |
| Personal Care & Service | 15 (17.6%) | 70 (82.4%) |
| Total (Category) | 214 (34.5%) | 406 (65.5%) |
| Total (Overall) | 1,265 (47.7%) | 1,389 (52.3%) |
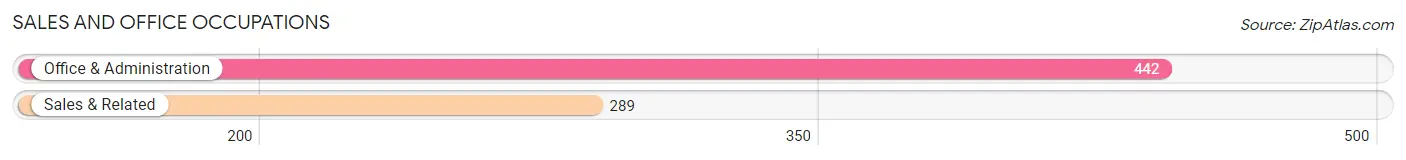
Sales and Office Occupations
The most common Sales and Office occupations in Franklin are Office & Administration (442 | 16.7%), and Sales & Related (289 | 10.9%).
Sales and Office Occupations by Sex
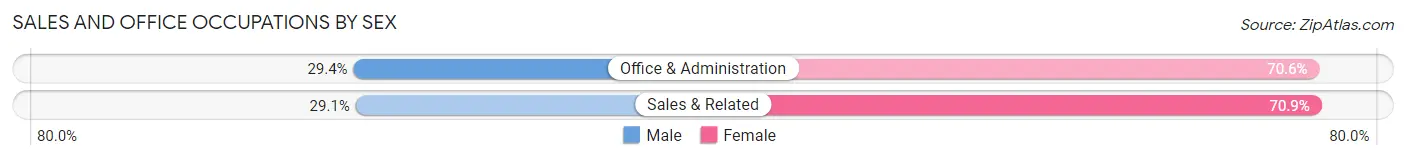
| Occupation | Male | Female |
| Sales & Related | 84 (29.1%) | 205 (70.9%) |
| Office & Administration | 130 (29.4%) | 312 (70.6%) |
| Total (Category) | 214 (29.3%) | 517 (70.7%) |
| Total (Overall) | 1,265 (47.7%) | 1,389 (52.3%) |
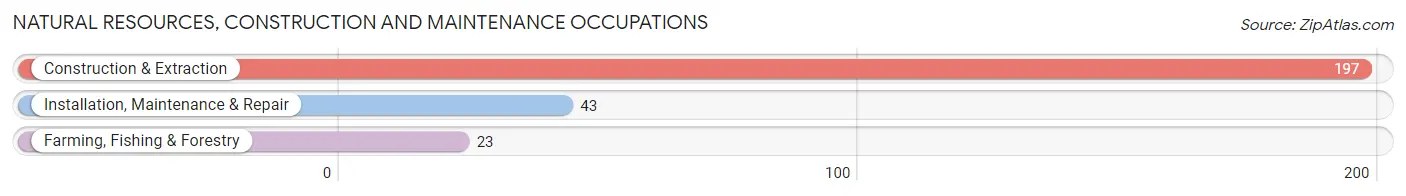
Natural Resources, Construction and Maintenance Occupations
The most common Natural Resources, Construction and Maintenance occupations in Franklin are Construction & Extraction (197 | 7.4%), Installation, Maintenance & Repair (43 | 1.6%), and Farming, Fishing & Forestry (23 | 0.9%).
Natural Resources, Construction and Maintenance Occupations by Sex
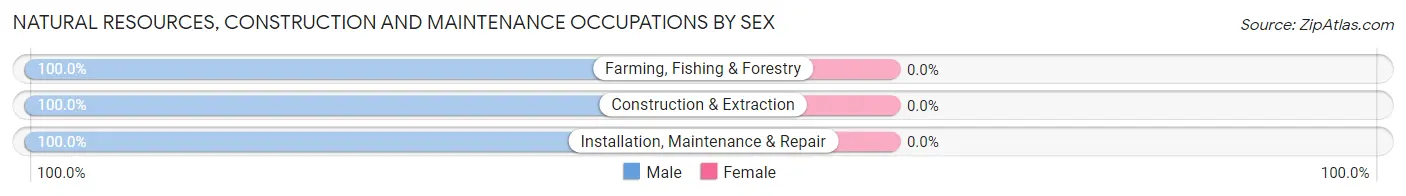
| Occupation | Male | Female |
| Farming, Fishing & Forestry | 23 (100.0%) | 0 (0.0%) |
| Construction & Extraction | 197 (100.0%) | 0 (0.0%) |
| Installation, Maintenance & Repair | 43 (100.0%) | 0 (0.0%) |
| Total (Category) | 263 (100.0%) | 0 (0.0%) |
| Total (Overall) | 1,265 (47.7%) | 1,389 (52.3%) |
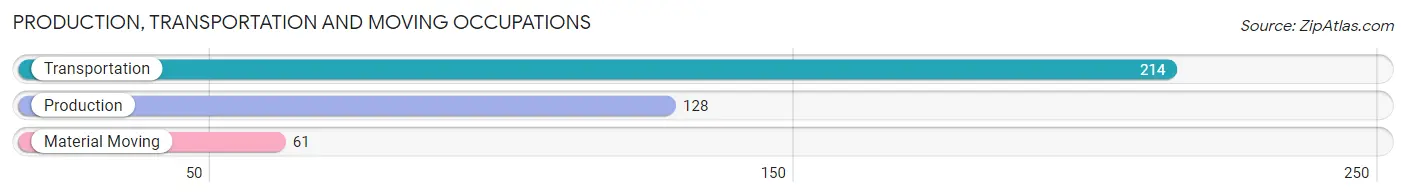
Production, Transportation and Moving Occupations
The most common Production, Transportation and Moving occupations in Franklin are Transportation (214 | 8.1%), Production (128 | 4.8%), and Material Moving (61 | 2.3%).
Production, Transportation and Moving Occupations by Sex
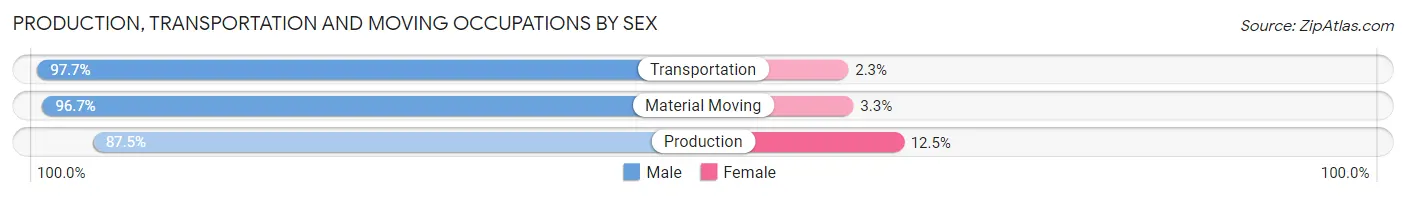
| Occupation | Male | Female |
| Production | 112 (87.5%) | 16 (12.5%) |
| Transportation | 209 (97.7%) | 5 (2.3%) |
| Material Moving | 59 (96.7%) | 2 (3.3%) |
| Total (Category) | 380 (94.3%) | 23 (5.7%) |
| Total (Overall) | 1,265 (47.7%) | 1,389 (52.3%) |
Employment Industries by Sex in Franklin
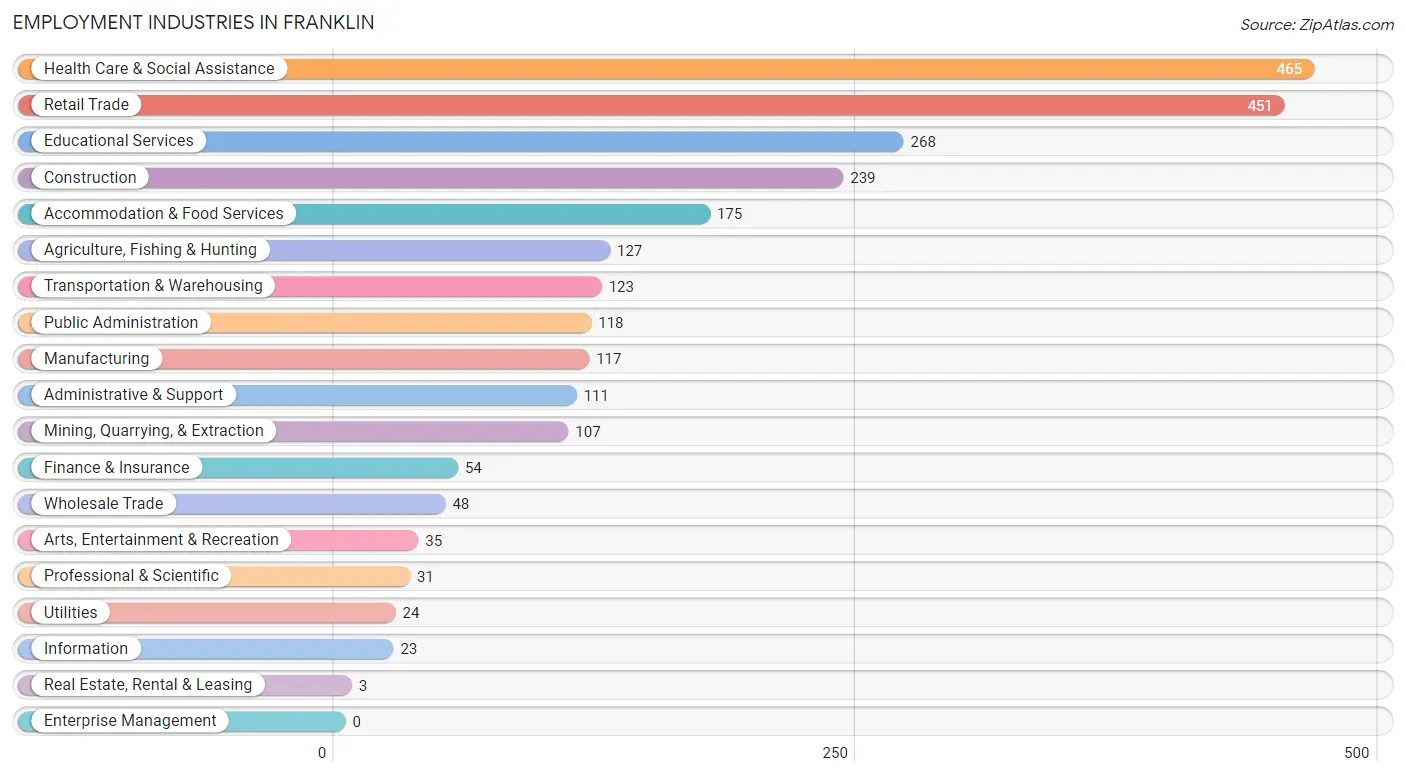
Employment Industries in Franklin
The major employment industries in Franklin include Health Care & Social Assistance (465 | 17.5%), Retail Trade (451 | 17.0%), Educational Services (268 | 10.1%), Construction (239 | 9.0%), and Accommodation & Food Services (175 | 6.6%).
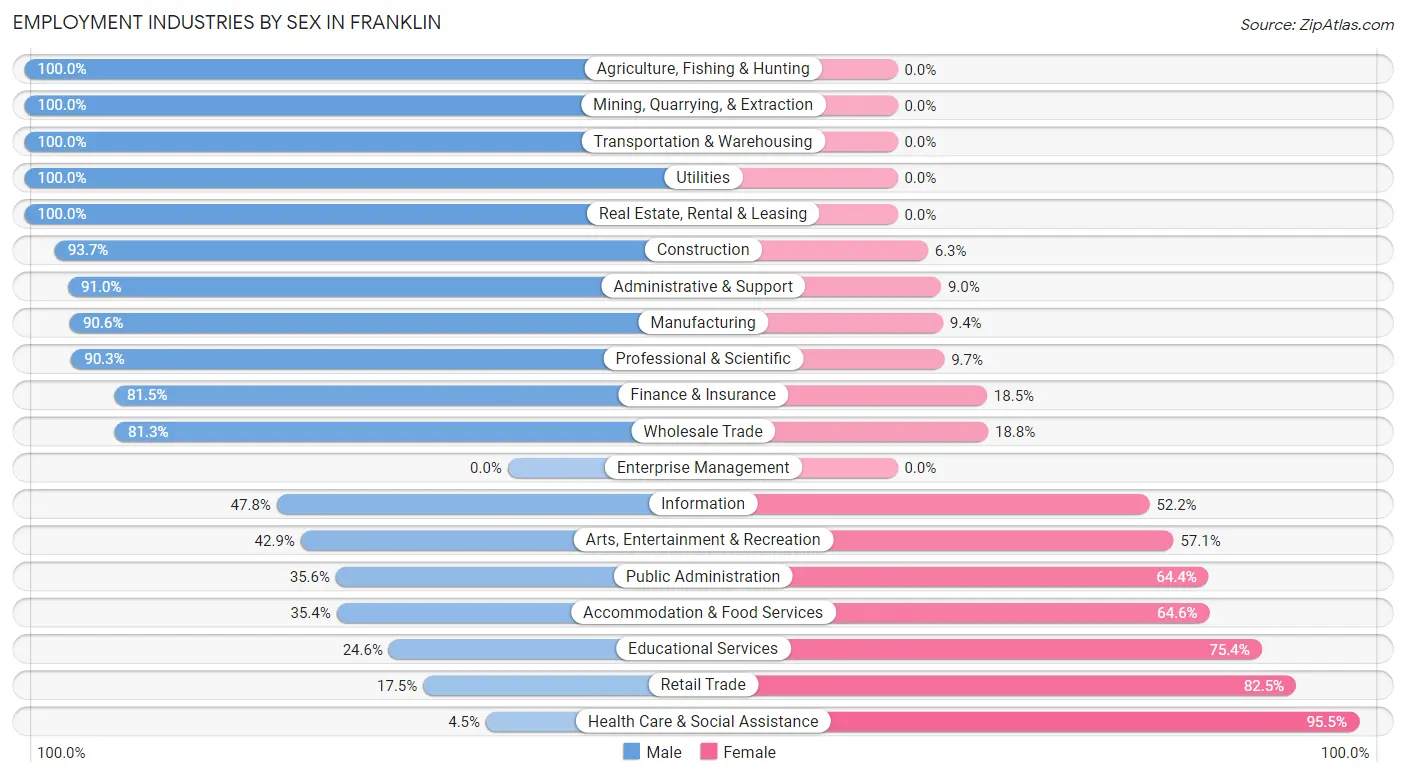
Employment Industries by Sex in Franklin
The Franklin industries that see more men than women are Agriculture, Fishing & Hunting (100.0%), Mining, Quarrying, & Extraction (100.0%), and Transportation & Warehousing (100.0%), whereas the industries that tend to have a higher number of women are Health Care & Social Assistance (95.5%), Retail Trade (82.5%), and Educational Services (75.4%).
| Industry | Male | Female |
| Agriculture, Fishing & Hunting | 127 (100.0%) | 0 (0.0%) |
| Mining, Quarrying, & Extraction | 107 (100.0%) | 0 (0.0%) |
| Construction | 224 (93.7%) | 15 (6.3%) |
| Manufacturing | 106 (90.6%) | 11 (9.4%) |
| Wholesale Trade | 39 (81.2%) | 9 (18.8%) |
| Retail Trade | 79 (17.5%) | 372 (82.5%) |
| Transportation & Warehousing | 123 (100.0%) | 0 (0.0%) |
| Utilities | 24 (100.0%) | 0 (0.0%) |
| Information | 11 (47.8%) | 12 (52.2%) |
| Finance & Insurance | 44 (81.5%) | 10 (18.5%) |
| Real Estate, Rental & Leasing | 3 (100.0%) | 0 (0.0%) |
| Professional & Scientific | 28 (90.3%) | 3 (9.7%) |
| Enterprise Management | 0 (0.0%) | 0 (0.0%) |
| Administrative & Support | 101 (91.0%) | 10 (9.0%) |
| Educational Services | 66 (24.6%) | 202 (75.4%) |
| Health Care & Social Assistance | 21 (4.5%) | 444 (95.5%) |
| Arts, Entertainment & Recreation | 15 (42.9%) | 20 (57.1%) |
| Accommodation & Food Services | 62 (35.4%) | 113 (64.6%) |
| Public Administration | 42 (35.6%) | 76 (64.4%) |
| Total | 1,265 (47.7%) | 1,389 (52.3%) |
Education in Franklin
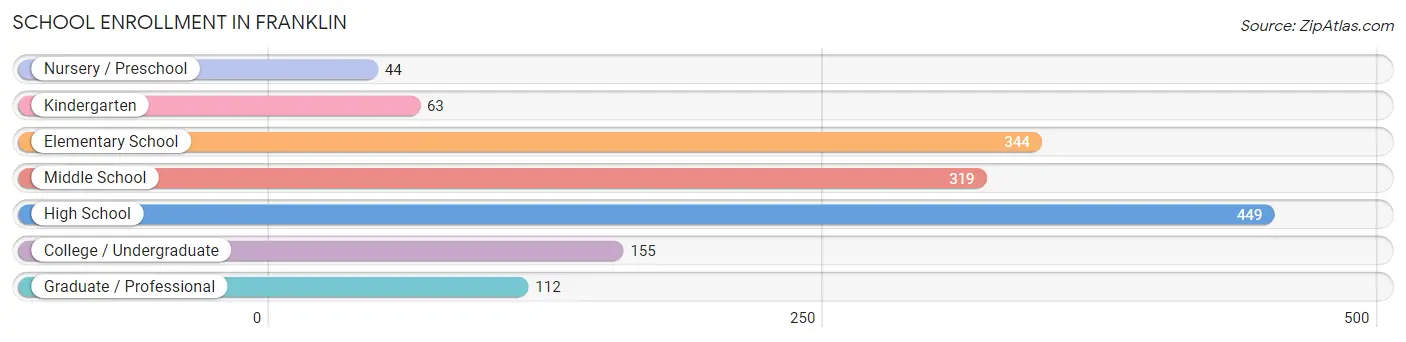
School Enrollment in Franklin
The most common levels of schooling among the 1,486 students in Franklin are high school (449 | 30.2%), elementary school (344 | 23.2%), and middle school (319 | 21.5%).
| School Level | # Students | % Students |
| Nursery / Preschool | 44 | 3.0% |
| Kindergarten | 63 | 4.2% |
| Elementary School | 344 | 23.2% |
| Middle School | 319 | 21.5% |
| High School | 449 | 30.2% |
| College / Undergraduate | 155 | 10.4% |
| Graduate / Professional | 112 | 7.5% |
| Total | 1,486 | 100.0% |
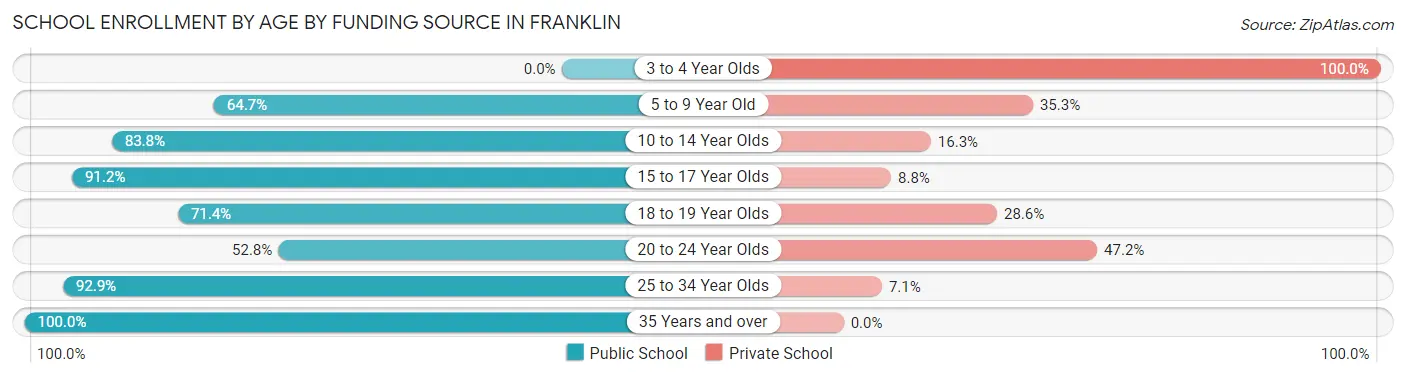
School Enrollment by Age by Funding Source in Franklin
Out of a total of 1,486 students who are enrolled in schools in Franklin, 330 (22.2%) attend a private institution, while the remaining 1,156 (77.8%) are enrolled in public schools. The age group of 3 to 4 year olds has the highest likelihood of being enrolled in private schools, with 38 (100.0% in the age bracket) enrolled. Conversely, the age group of 35 years and over has the lowest likelihood of being enrolled in a private school, with 17 (100.0% in the age bracket) attending a public institution.
| Age Bracket | Public School | Private School |
| 3 to 4 Year Olds | 0 (0.0%) | 38 (100.0%) |
| 5 to 9 Year Old | 257 (64.7%) | 140 (35.3%) |
| 10 to 14 Year Olds | 371 (83.8%) | 72 (16.3%) |
| 15 to 17 Year Olds | 289 (91.2%) | 28 (8.8%) |
| 18 to 19 Year Olds | 60 (71.4%) | 24 (28.6%) |
| 20 to 24 Year Olds | 19 (52.8%) | 17 (47.2%) |
| 25 to 34 Year Olds | 143 (92.9%) | 11 (7.1%) |
| 35 Years and over | 17 (100.0%) | 0 (0.0%) |
| Total | 1,156 (77.8%) | 330 (22.2%) |
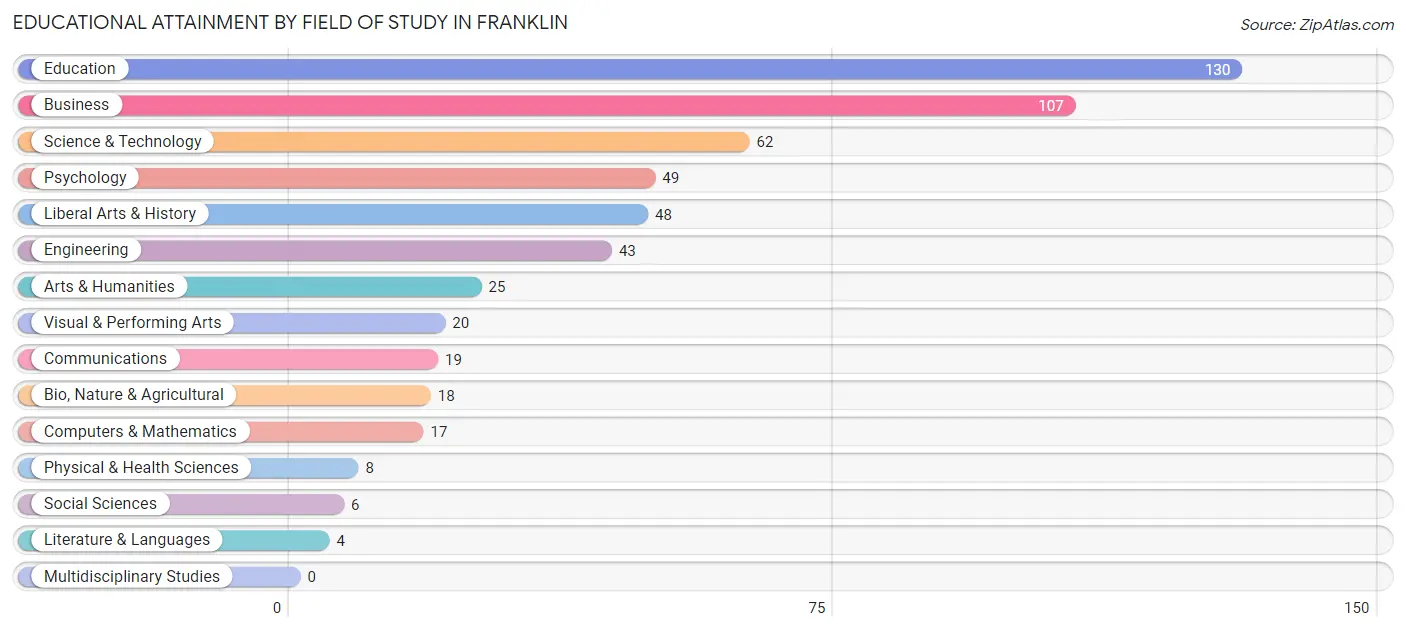
Educational Attainment by Field of Study in Franklin
Education (130 | 23.4%), business (107 | 19.2%), science & technology (62 | 11.2%), psychology (49 | 8.8%), and liberal arts & history (48 | 8.6%) are the most common fields of study among 556 individuals in Franklin who have obtained a bachelor's degree or higher.
| Field of Study | # Graduates | % Graduates |
| Computers & Mathematics | 17 | 3.1% |
| Bio, Nature & Agricultural | 18 | 3.2% |
| Physical & Health Sciences | 8 | 1.4% |
| Psychology | 49 | 8.8% |
| Social Sciences | 6 | 1.1% |
| Engineering | 43 | 7.7% |
| Multidisciplinary Studies | 0 | 0.0% |
| Science & Technology | 62 | 11.2% |
| Business | 107 | 19.2% |
| Education | 130 | 23.4% |
| Literature & Languages | 4 | 0.7% |
| Liberal Arts & History | 48 | 8.6% |
| Visual & Performing Arts | 20 | 3.6% |
| Communications | 19 | 3.4% |
| Arts & Humanities | 25 | 4.5% |
| Total | 556 | 100.0% |
Transportation & Commute in Franklin
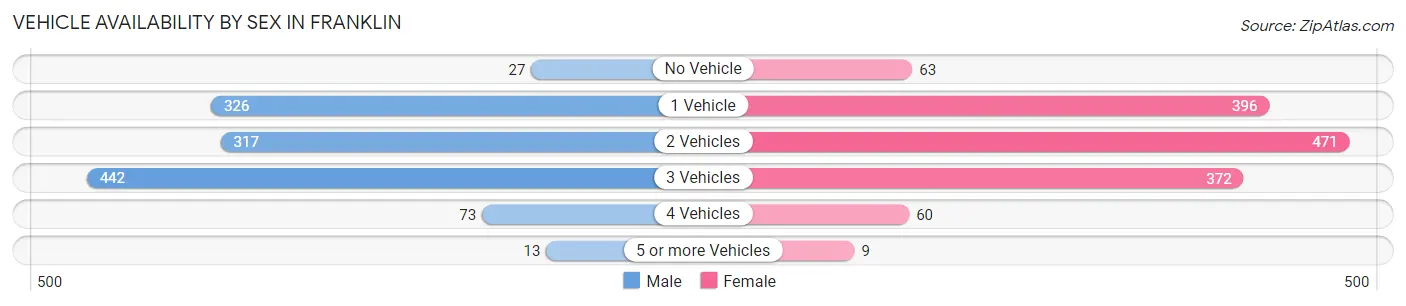
Vehicle Availability by Sex in Franklin
The most prevalent vehicle ownership categories in Franklin are males with 3 vehicles (442, accounting for 36.9%) and females with 3 vehicles (372, making up 32.2%).
| Vehicles Available | Male | Female |
| No Vehicle | 27 (2.2%) | 63 (4.6%) |
| 1 Vehicle | 326 (27.2%) | 396 (28.9%) |
| 2 Vehicles | 317 (26.5%) | 471 (34.4%) |
| 3 Vehicles | 442 (36.9%) | 372 (27.1%) |
| 4 Vehicles | 73 (6.1%) | 60 (4.4%) |
| 5 or more Vehicles | 13 (1.1%) | 9 (0.7%) |
| Total | 1,198 (100.0%) | 1,371 (100.0%) |
Commute Time in Franklin
The most frequently occuring commute durations in Franklin are 5 to 9 minutes (627 commuters, 24.7%), 10 to 14 minutes (489 commuters, 19.3%), and 15 to 19 minutes (464 commuters, 18.3%).
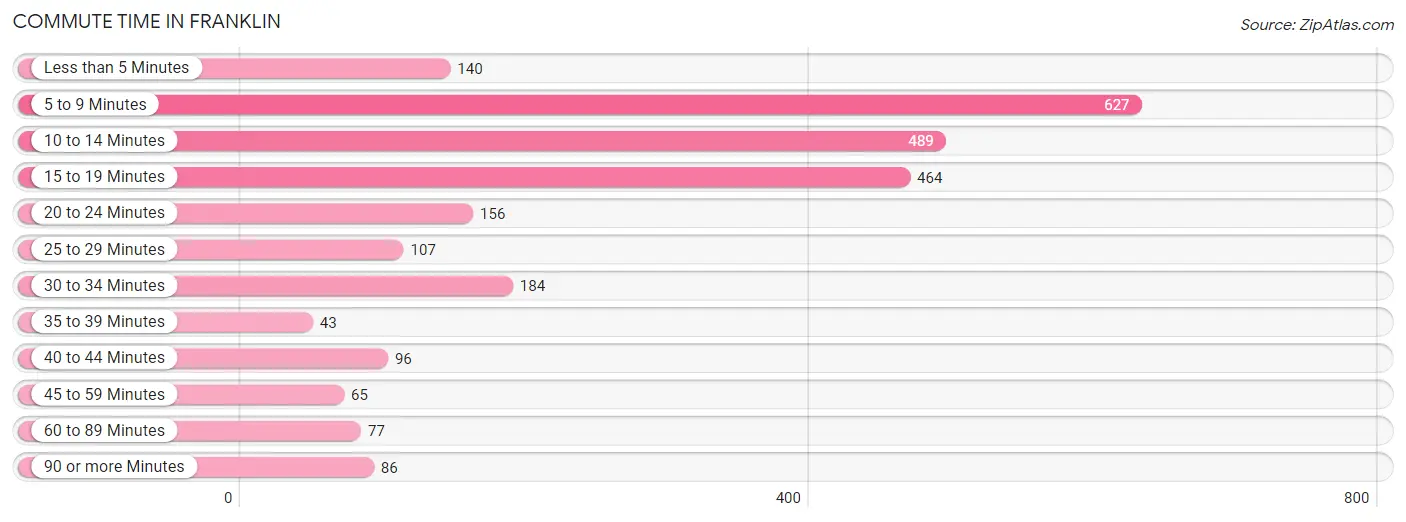
| Commute Time | # Commuters | % Commuters |
| Less than 5 Minutes | 140 | 5.5% |
| 5 to 9 Minutes | 627 | 24.7% |
| 10 to 14 Minutes | 489 | 19.3% |
| 15 to 19 Minutes | 464 | 18.3% |
| 20 to 24 Minutes | 156 | 6.2% |
| 25 to 29 Minutes | 107 | 4.2% |
| 30 to 34 Minutes | 184 | 7.3% |
| 35 to 39 Minutes | 43 | 1.7% |
| 40 to 44 Minutes | 96 | 3.8% |
| 45 to 59 Minutes | 65 | 2.6% |
| 60 to 89 Minutes | 77 | 3.0% |
| 90 or more Minutes | 86 | 3.4% |
Commute Time by Sex in Franklin
The most common commute times in Franklin are 15 to 19 minutes (281 commuters, 23.8%) for males and 5 to 9 minutes (423 commuters, 31.2%) for females.
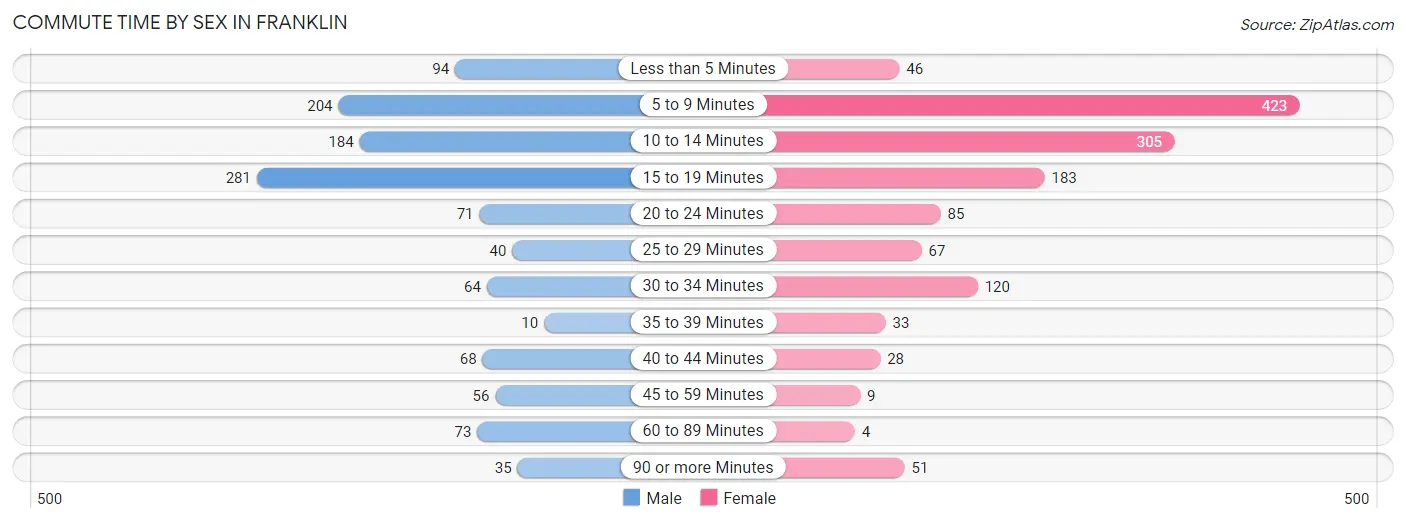
| Commute Time | Male | Female |
| Less than 5 Minutes | 94 (8.0%) | 46 (3.4%) |
| 5 to 9 Minutes | 204 (17.3%) | 423 (31.2%) |
| 10 to 14 Minutes | 184 (15.6%) | 305 (22.5%) |
| 15 to 19 Minutes | 281 (23.8%) | 183 (13.5%) |
| 20 to 24 Minutes | 71 (6.0%) | 85 (6.3%) |
| 25 to 29 Minutes | 40 (3.4%) | 67 (5.0%) |
| 30 to 34 Minutes | 64 (5.4%) | 120 (8.9%) |
| 35 to 39 Minutes | 10 (0.9%) | 33 (2.4%) |
| 40 to 44 Minutes | 68 (5.8%) | 28 (2.1%) |
| 45 to 59 Minutes | 56 (4.8%) | 9 (0.7%) |
| 60 to 89 Minutes | 73 (6.2%) | 4 (0.3%) |
| 90 or more Minutes | 35 (3.0%) | 51 (3.8%) |
Time of Departure to Work by Sex in Franklin
The most frequent times of departure to work in Franklin are 6:00 AM to 6:29 AM (257, 21.8%) for males and 7:00 AM to 7:29 AM (295, 21.8%) for females.
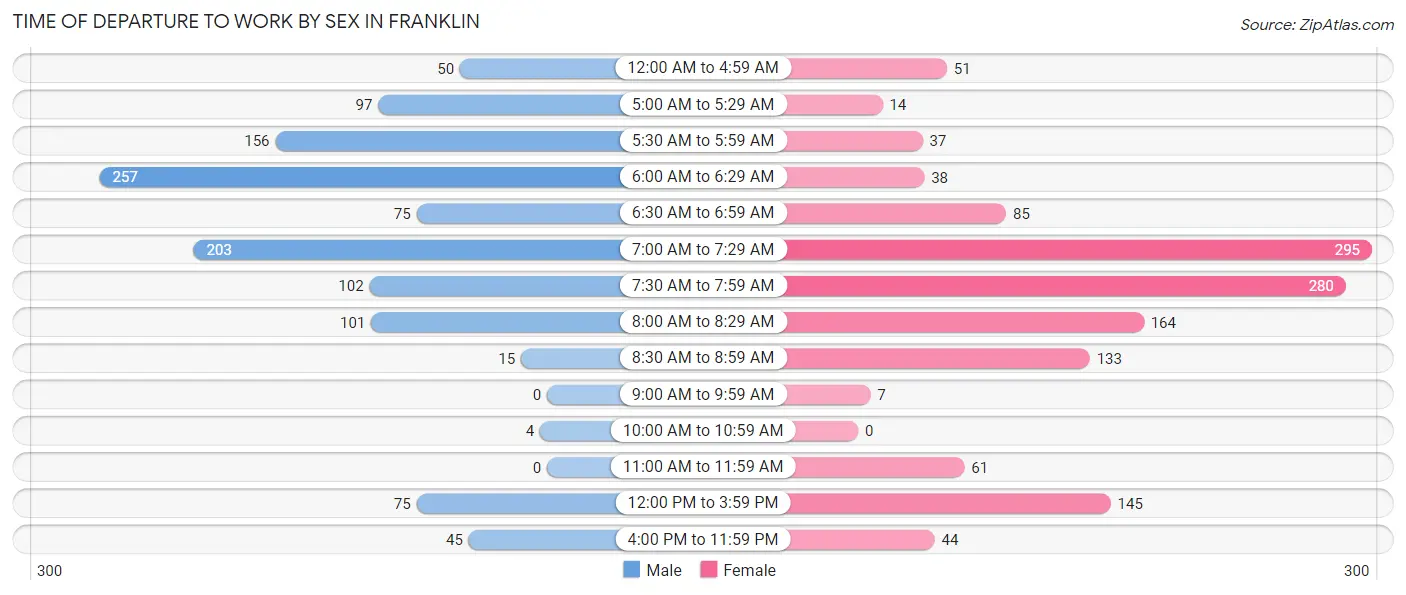
| Time of Departure | Male | Female |
| 12:00 AM to 4:59 AM | 50 (4.2%) | 51 (3.8%) |
| 5:00 AM to 5:29 AM | 97 (8.2%) | 14 (1.0%) |
| 5:30 AM to 5:59 AM | 156 (13.2%) | 37 (2.7%) |
| 6:00 AM to 6:29 AM | 257 (21.8%) | 38 (2.8%) |
| 6:30 AM to 6:59 AM | 75 (6.4%) | 85 (6.3%) |
| 7:00 AM to 7:29 AM | 203 (17.2%) | 295 (21.8%) |
| 7:30 AM to 7:59 AM | 102 (8.6%) | 280 (20.7%) |
| 8:00 AM to 8:29 AM | 101 (8.6%) | 164 (12.1%) |
| 8:30 AM to 8:59 AM | 15 (1.3%) | 133 (9.8%) |
| 9:00 AM to 9:59 AM | 0 (0.0%) | 7 (0.5%) |
| 10:00 AM to 10:59 AM | 4 (0.3%) | 0 (0.0%) |
| 11:00 AM to 11:59 AM | 0 (0.0%) | 61 (4.5%) |
| 12:00 PM to 3:59 PM | 75 (6.4%) | 145 (10.7%) |
| 4:00 PM to 11:59 PM | 45 (3.8%) | 44 (3.3%) |
| Total | 1,180 (100.0%) | 1,354 (100.0%) |
Housing Occupancy in Franklin
Occupancy by Ownership in Franklin
Of the total 2,576 dwellings in Franklin, owner-occupied units account for 1,544 (59.9%), while renter-occupied units make up 1,032 (40.1%).
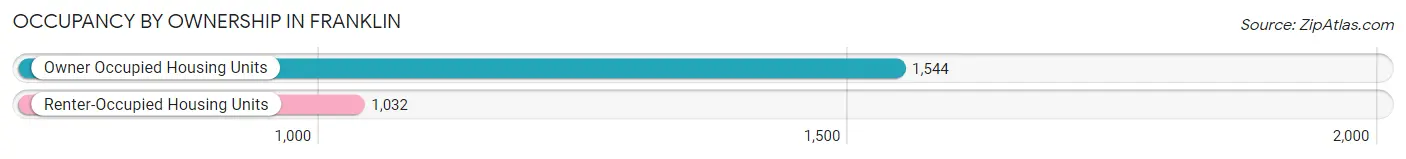
| Occupancy | # Housing Units | % Housing Units |
| Owner Occupied Housing Units | 1,544 | 59.9% |
| Renter-Occupied Housing Units | 1,032 | 40.1% |
| Total Occupied Housing Units | 2,576 | 100.0% |
Occupancy by Household Size in Franklin
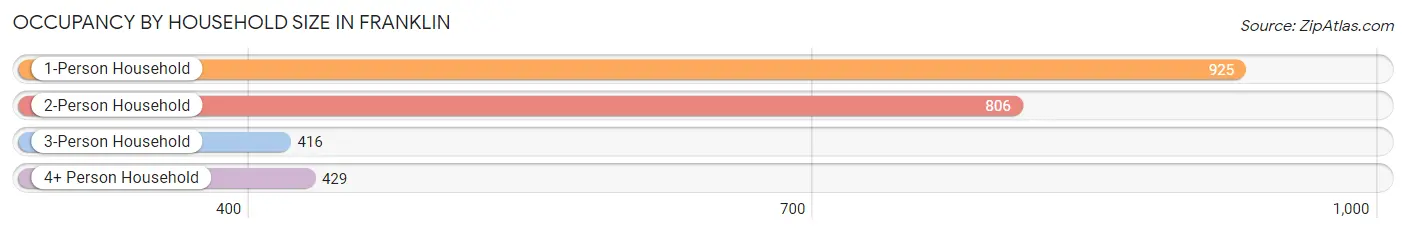
| Household Size | # Housing Units | % Housing Units |
| 1-Person Household | 925 | 35.9% |
| 2-Person Household | 806 | 31.3% |
| 3-Person Household | 416 | 16.2% |
| 4+ Person Household | 429 | 16.7% |
| Total Housing Units | 2,576 | 100.0% |
Occupancy by Ownership by Household Size in Franklin
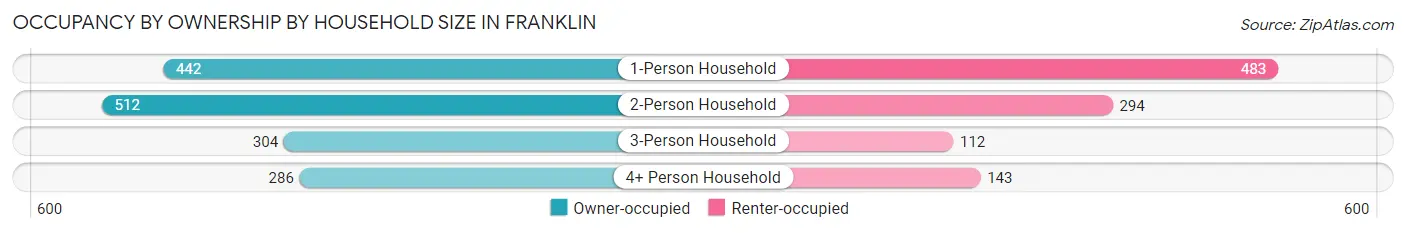
| Household Size | Owner-occupied | Renter-occupied |
| 1-Person Household | 442 (47.8%) | 483 (52.2%) |
| 2-Person Household | 512 (63.5%) | 294 (36.5%) |
| 3-Person Household | 304 (73.1%) | 112 (26.9%) |
| 4+ Person Household | 286 (66.7%) | 143 (33.3%) |
| Total Housing Units | 1,544 (59.9%) | 1,032 (40.1%) |
Occupancy by Educational Attainment in Franklin
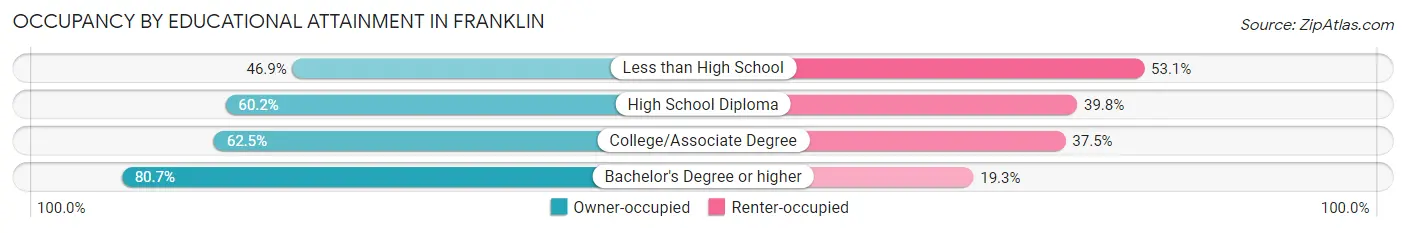
| Household Size | Owner-occupied | Renter-occupied |
| Less than High School | 255 (46.9%) | 289 (53.1%) |
| High School Diploma | 659 (60.2%) | 436 (39.8%) |
| College/Associate Degree | 433 (62.5%) | 260 (37.5%) |
| Bachelor's Degree or higher | 197 (80.7%) | 47 (19.3%) |
Occupancy by Age of Householder in Franklin
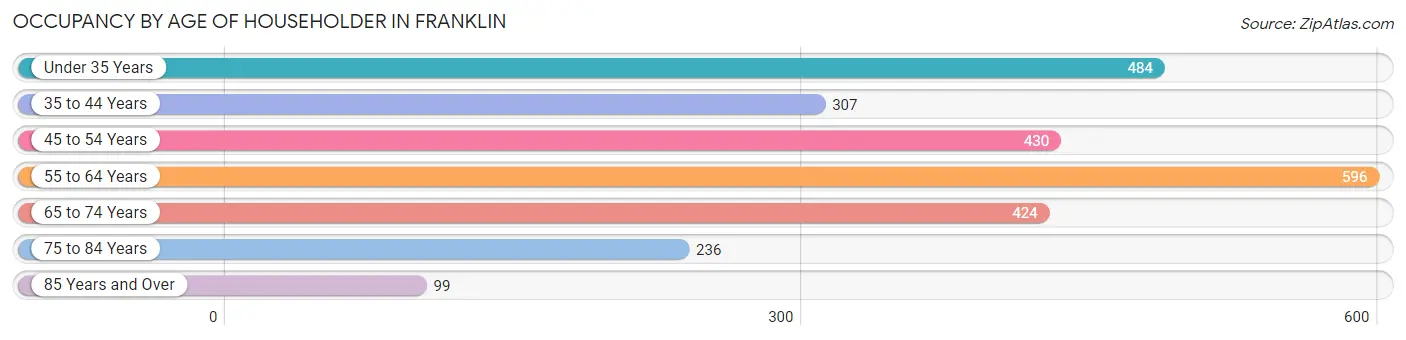
| Age Bracket | # Households | % Households |
| Under 35 Years | 484 | 18.8% |
| 35 to 44 Years | 307 | 11.9% |
| 45 to 54 Years | 430 | 16.7% |
| 55 to 64 Years | 596 | 23.1% |
| 65 to 74 Years | 424 | 16.5% |
| 75 to 84 Years | 236 | 9.2% |
| 85 Years and Over | 99 | 3.8% |
| Total | 2,576 | 100.0% |
Housing Finances in Franklin
Median Income by Occupancy in Franklin
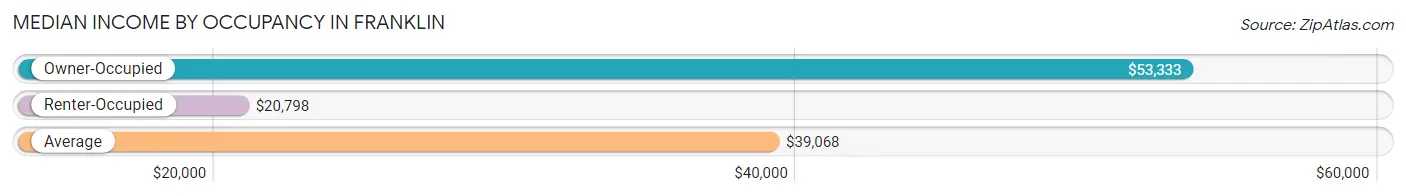
| Occupancy Type | # Households | Median Income |
| Owner-Occupied | 1,544 (59.9%) | $53,333 |
| Renter-Occupied | 1,032 (40.1%) | $20,798 |
| Average | 2,576 (100.0%) | $39,068 |
Occupancy by Householder Income Bracket in Franklin
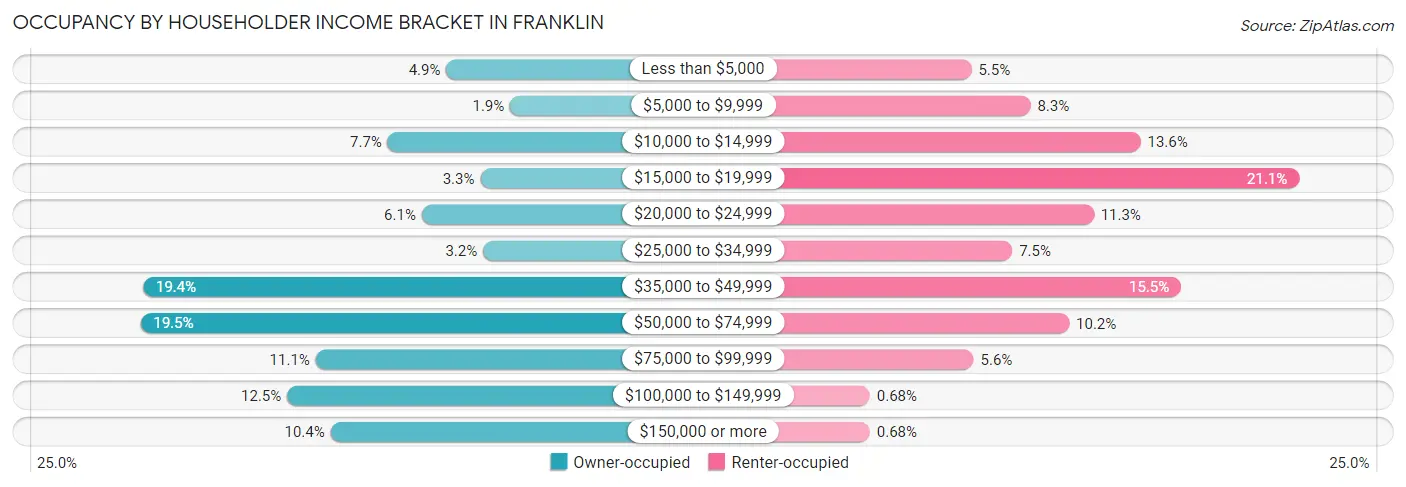
| Income Bracket | Owner-occupied | Renter-occupied |
| Less than $5,000 | 76 (4.9%) | 57 (5.5%) |
| $5,000 to $9,999 | 29 (1.9%) | 86 (8.3%) |
| $10,000 to $14,999 | 119 (7.7%) | 140 (13.6%) |
| $15,000 to $19,999 | 51 (3.3%) | 218 (21.1%) |
| $20,000 to $24,999 | 94 (6.1%) | 117 (11.3%) |
| $25,000 to $34,999 | 49 (3.2%) | 77 (7.5%) |
| $35,000 to $49,999 | 299 (19.4%) | 160 (15.5%) |
| $50,000 to $74,999 | 301 (19.5%) | 105 (10.2%) |
| $75,000 to $99,999 | 172 (11.1%) | 58 (5.6%) |
| $100,000 to $149,999 | 193 (12.5%) | 7 (0.7%) |
| $150,000 or more | 161 (10.4%) | 7 (0.7%) |
| Total | 1,544 (100.0%) | 1,032 (100.0%) |
Monthly Housing Cost Tiers in Franklin
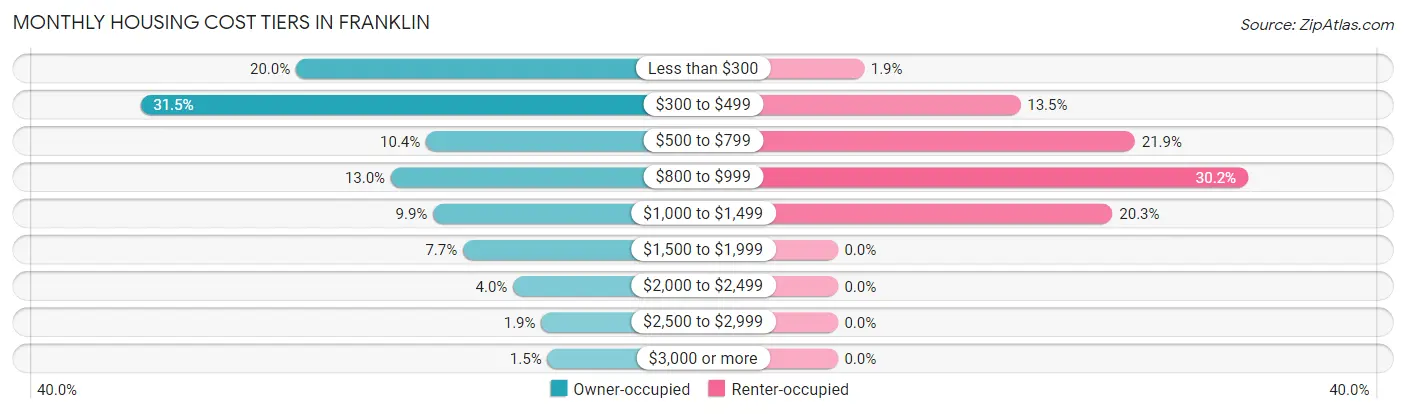
| Monthly Cost | Owner-occupied | Renter-occupied |
| Less than $300 | 309 (20.0%) | 20 (1.9%) |
| $300 to $499 | 486 (31.5%) | 139 (13.5%) |
| $500 to $799 | 161 (10.4%) | 226 (21.9%) |
| $800 to $999 | 201 (13.0%) | 312 (30.2%) |
| $1,000 to $1,499 | 153 (9.9%) | 209 (20.3%) |
| $1,500 to $1,999 | 119 (7.7%) | 0 (0.0%) |
| $2,000 to $2,499 | 62 (4.0%) | 0 (0.0%) |
| $2,500 to $2,999 | 30 (1.9%) | 0 (0.0%) |
| $3,000 or more | 23 (1.5%) | 0 (0.0%) |
| Total | 1,544 (100.0%) | 1,032 (100.0%) |
Physical Housing Characteristics in Franklin
Housing Structures in Franklin
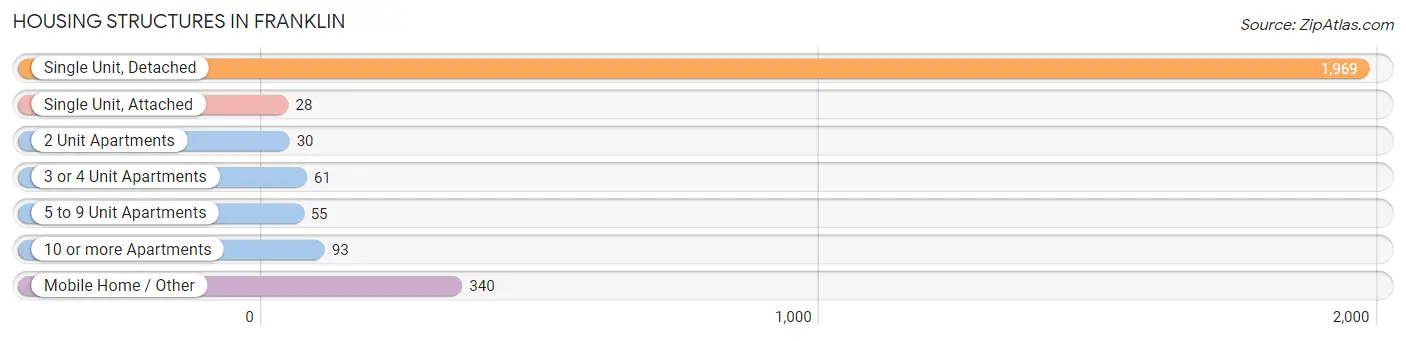
| Structure Type | # Housing Units | % Housing Units |
| Single Unit, Detached | 1,969 | 76.4% |
| Single Unit, Attached | 28 | 1.1% |
| 2 Unit Apartments | 30 | 1.2% |
| 3 or 4 Unit Apartments | 61 | 2.4% |
| 5 to 9 Unit Apartments | 55 | 2.1% |
| 10 or more Apartments | 93 | 3.6% |
| Mobile Home / Other | 340 | 13.2% |
| Total | 2,576 | 100.0% |
Housing Structures by Occupancy in Franklin
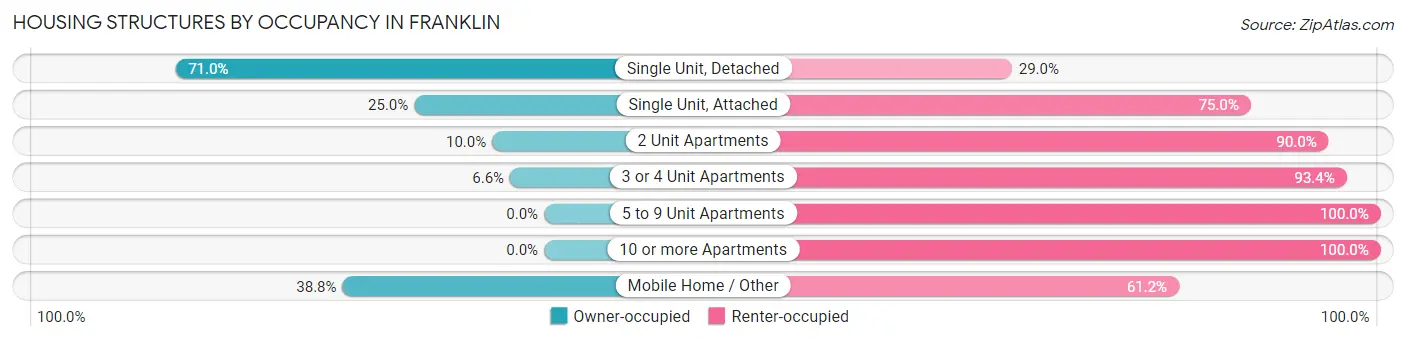
| Structure Type | Owner-occupied | Renter-occupied |
| Single Unit, Detached | 1,398 (71.0%) | 571 (29.0%) |
| Single Unit, Attached | 7 (25.0%) | 21 (75.0%) |
| 2 Unit Apartments | 3 (10.0%) | 27 (90.0%) |
| 3 or 4 Unit Apartments | 4 (6.6%) | 57 (93.4%) |
| 5 to 9 Unit Apartments | 0 (0.0%) | 55 (100.0%) |
| 10 or more Apartments | 0 (0.0%) | 93 (100.0%) |
| Mobile Home / Other | 132 (38.8%) | 208 (61.2%) |
| Total | 1,544 (59.9%) | 1,032 (40.1%) |
Housing Structures by Number of Rooms in Franklin
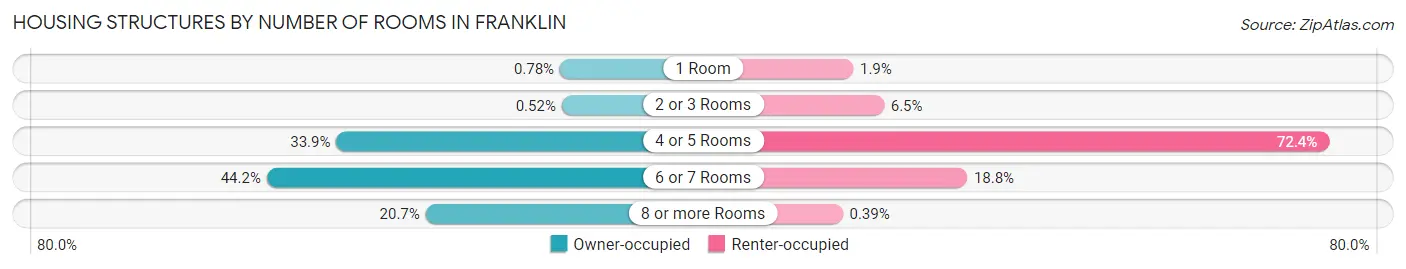
| Number of Rooms | Owner-occupied | Renter-occupied |
| 1 Room | 12 (0.8%) | 20 (1.9%) |
| 2 or 3 Rooms | 8 (0.5%) | 67 (6.5%) |
| 4 or 5 Rooms | 523 (33.9%) | 747 (72.4%) |
| 6 or 7 Rooms | 682 (44.2%) | 194 (18.8%) |
| 8 or more Rooms | 319 (20.7%) | 4 (0.4%) |
| Total | 1,544 (100.0%) | 1,032 (100.0%) |
Housing Structure by Heating Type in Franklin
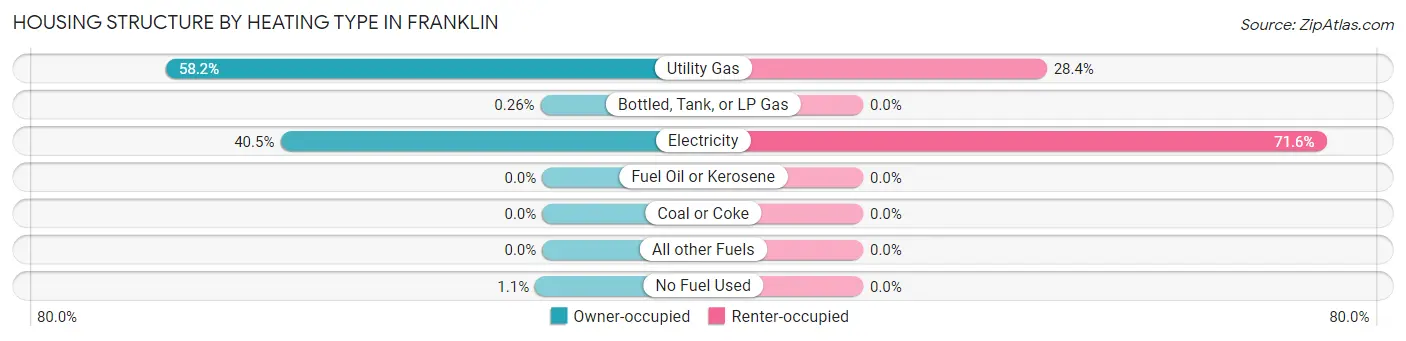
| Heating Type | Owner-occupied | Renter-occupied |
| Utility Gas | 898 (58.2%) | 293 (28.4%) |
| Bottled, Tank, or LP Gas | 4 (0.3%) | 0 (0.0%) |
| Electricity | 625 (40.5%) | 739 (71.6%) |
| Fuel Oil or Kerosene | 0 (0.0%) | 0 (0.0%) |
| Coal or Coke | 0 (0.0%) | 0 (0.0%) |
| All other Fuels | 0 (0.0%) | 0 (0.0%) |
| No Fuel Used | 17 (1.1%) | 0 (0.0%) |
| Total | 1,544 (100.0%) | 1,032 (100.0%) |
Household Vehicle Usage in Franklin
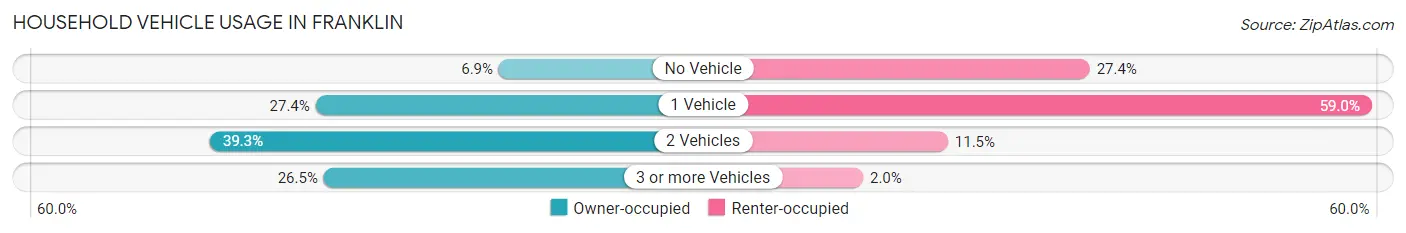
| Vehicles per Household | Owner-occupied | Renter-occupied |
| No Vehicle | 106 (6.9%) | 283 (27.4%) |
| 1 Vehicle | 423 (27.4%) | 609 (59.0%) |
| 2 Vehicles | 606 (39.3%) | 119 (11.5%) |
| 3 or more Vehicles | 409 (26.5%) | 21 (2.0%) |
| Total | 1,544 (100.0%) | 1,032 (100.0%) |
Real Estate & Mortgages in Franklin
Real Estate and Mortgage Overview in Franklin
| Characteristic | Without Mortgage | With Mortgage |
| Housing Units | 894 | 650 |
| Median Property Value | $81,100 | $130,400 |
| Median Household Income | $47,228 | $41 |
| Monthly Housing Costs | $389 | $23 |
| Real Estate Taxes | $199 | $21 |
Property Value by Mortgage Status in Franklin
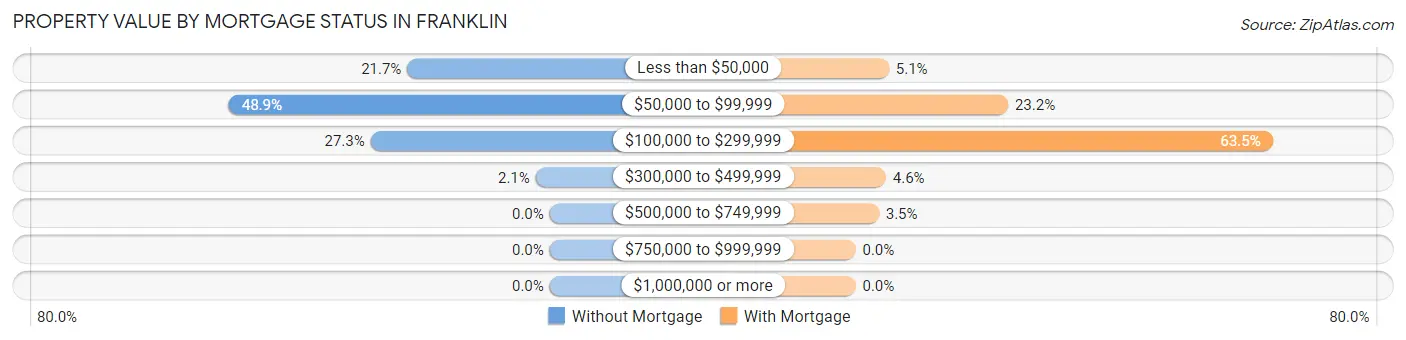
| Property Value | Without Mortgage | With Mortgage |
| Less than $50,000 | 194 (21.7%) | 33 (5.1%) |
| $50,000 to $99,999 | 437 (48.9%) | 151 (23.2%) |
| $100,000 to $299,999 | 244 (27.3%) | 413 (63.5%) |
| $300,000 to $499,999 | 19 (2.1%) | 30 (4.6%) |
| $500,000 to $749,999 | 0 (0.0%) | 23 (3.5%) |
| $750,000 to $999,999 | 0 (0.0%) | 0 (0.0%) |
| $1,000,000 or more | 0 (0.0%) | 0 (0.0%) |
| Total | 894 (100.0%) | 650 (100.0%) |
Household Income by Mortgage Status in Franklin
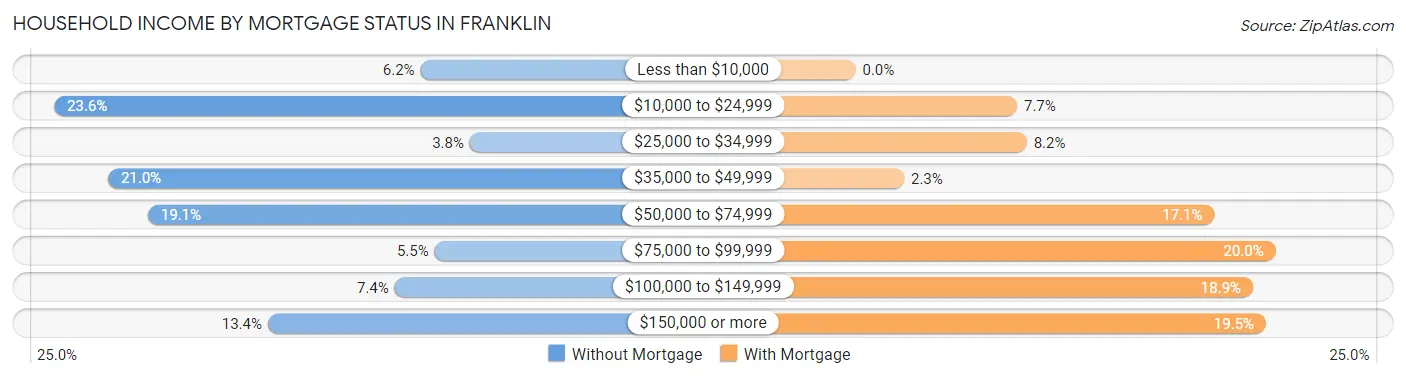
| Household Income | Without Mortgage | With Mortgage |
| Less than $10,000 | 55 (6.1%) | 0 (0.0%) |
| $10,000 to $24,999 | 211 (23.6%) | 50 (7.7%) |
| $25,000 to $34,999 | 34 (3.8%) | 53 (8.2%) |
| $35,000 to $49,999 | 188 (21.0%) | 15 (2.3%) |
| $50,000 to $74,999 | 171 (19.1%) | 111 (17.1%) |
| $75,000 to $99,999 | 49 (5.5%) | 130 (20.0%) |
| $100,000 to $149,999 | 66 (7.4%) | 123 (18.9%) |
| $150,000 or more | 120 (13.4%) | 127 (19.5%) |
| Total | 894 (100.0%) | 650 (100.0%) |
Property Value to Household Income Ratio in Franklin
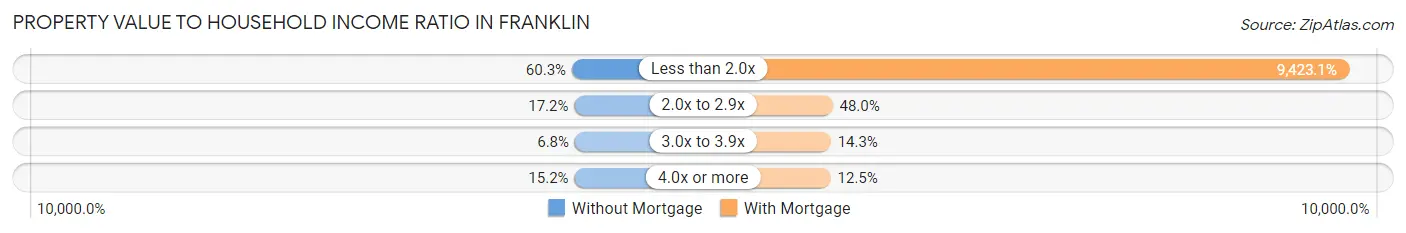
| Value-to-Income Ratio | Without Mortgage | With Mortgage |
| Less than 2.0x | 539 (60.3%) | 61,250 (9,423.1%) |
| 2.0x to 2.9x | 154 (17.2%) | 312 (48.0%) |
| 3.0x to 3.9x | 61 (6.8%) | 93 (14.3%) |
| 4.0x or more | 136 (15.2%) | 81 (12.5%) |
| Total | 894 (100.0%) | 650 (100.0%) |
Real Estate Taxes by Mortgage Status in Franklin
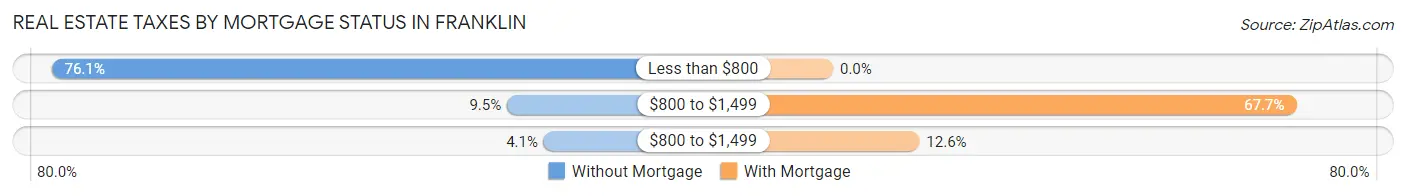
| Property Taxes | Without Mortgage | With Mortgage |
| Less than $800 | 680 (76.1%) | 0 (0.0%) |
| $800 to $1,499 | 85 (9.5%) | 440 (67.7%) |
| $800 to $1,499 | 37 (4.1%) | 82 (12.6%) |
| Total | 894 (100.0%) | 650 (100.0%) |
Health & Disability in Franklin
Health Insurance Coverage by Age in Franklin
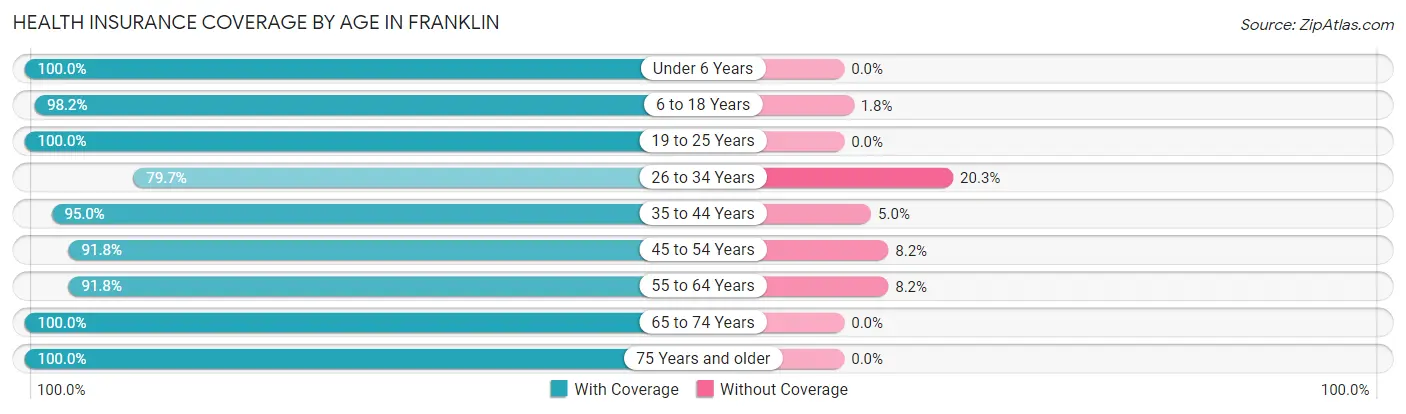
| Age Bracket | With Coverage | Without Coverage |
| Under 6 Years | 563 (100.0%) | 0 (0.0%) |
| 6 to 18 Years | 1,226 (98.2%) | 22 (1.8%) |
| 19 to 25 Years | 501 (100.0%) | 0 (0.0%) |
| 26 to 34 Years | 538 (79.7%) | 137 (20.3%) |
| 35 to 44 Years | 739 (95.0%) | 39 (5.0%) |
| 45 to 54 Years | 670 (91.8%) | 60 (8.2%) |
| 55 to 64 Years | 840 (91.8%) | 75 (8.2%) |
| 65 to 74 Years | 676 (100.0%) | 0 (0.0%) |
| 75 Years and older | 453 (100.0%) | 0 (0.0%) |
| Total | 6,206 (94.9%) | 333 (5.1%) |
Health Insurance Coverage by Citizenship Status in Franklin
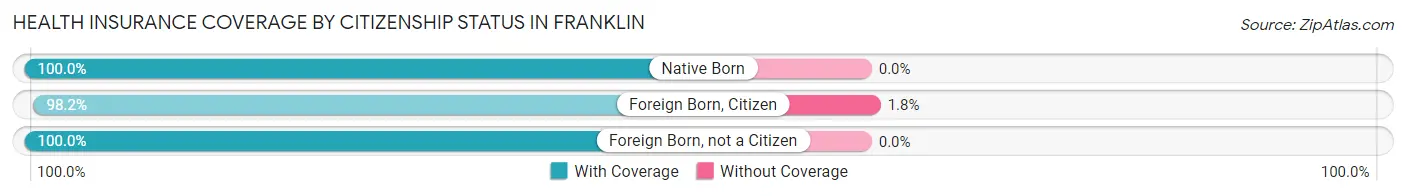
| Citizenship Status | With Coverage | Without Coverage |
| Native Born | 563 (100.0%) | 0 (0.0%) |
| Foreign Born, Citizen | 1,226 (98.2%) | 22 (1.8%) |
| Foreign Born, not a Citizen | 501 (100.0%) | 0 (0.0%) |
Health Insurance Coverage by Household Income in Franklin
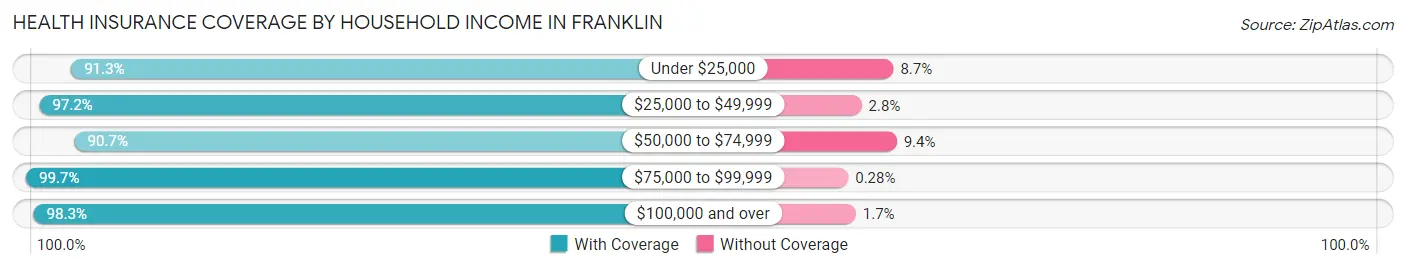
| Household Income | With Coverage | Without Coverage |
| Under $25,000 | 1,535 (91.3%) | 147 (8.7%) |
| $25,000 to $49,999 | 1,644 (97.2%) | 47 (2.8%) |
| $50,000 to $74,999 | 999 (90.6%) | 103 (9.3%) |
| $75,000 to $99,999 | 718 (99.7%) | 2 (0.3%) |
| $100,000 and over | 1,271 (98.3%) | 22 (1.7%) |
Public vs Private Health Insurance Coverage by Age in Franklin
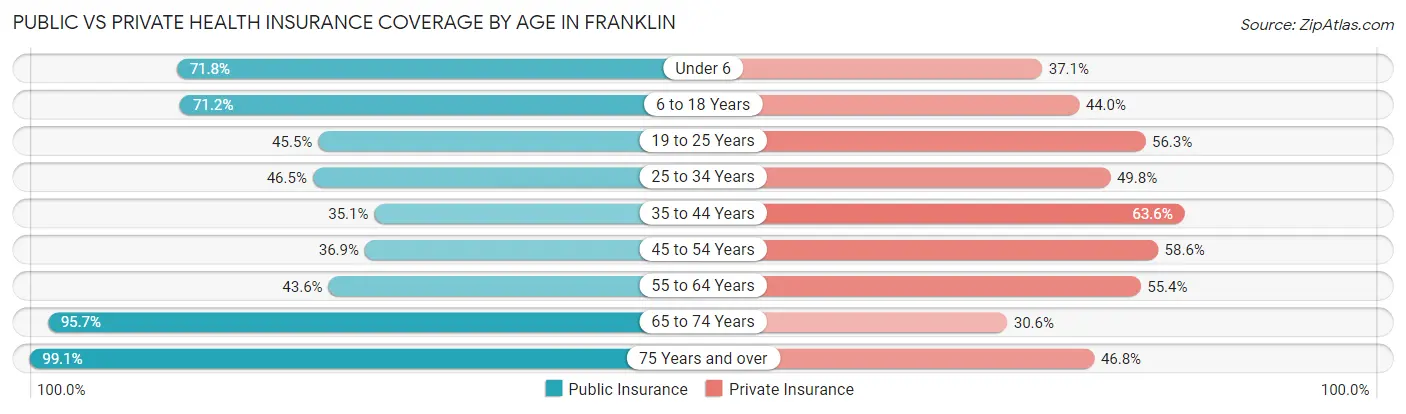
| Age Bracket | Public Insurance | Private Insurance |
| Under 6 | 404 (71.8%) | 209 (37.1%) |
| 6 to 18 Years | 888 (71.2%) | 549 (44.0%) |
| 19 to 25 Years | 228 (45.5%) | 282 (56.3%) |
| 25 to 34 Years | 314 (46.5%) | 336 (49.8%) |
| 35 to 44 Years | 273 (35.1%) | 495 (63.6%) |
| 45 to 54 Years | 269 (36.8%) | 428 (58.6%) |
| 55 to 64 Years | 399 (43.6%) | 507 (55.4%) |
| 65 to 74 Years | 647 (95.7%) | 207 (30.6%) |
| 75 Years and over | 449 (99.1%) | 212 (46.8%) |
| Total | 3,871 (59.2%) | 3,225 (49.3%) |
Disability Status by Sex by Age in Franklin
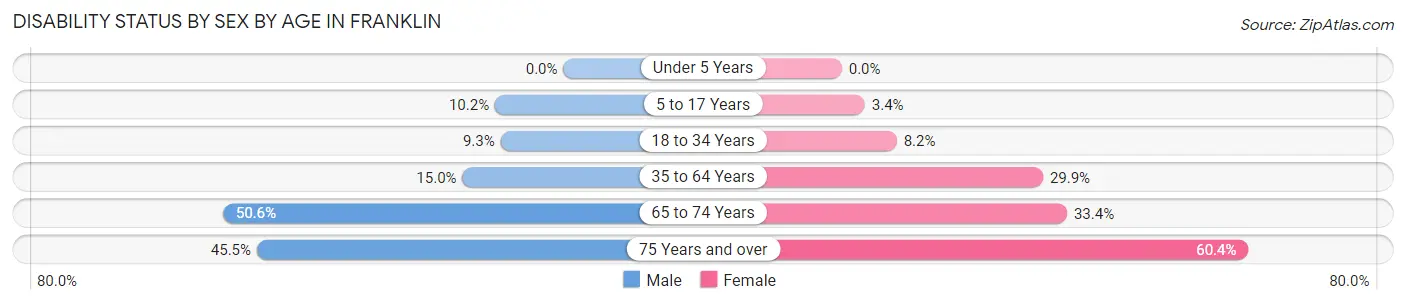
| Age Bracket | Male | Female |
| Under 5 Years | 0 (0.0%) | 0 (0.0%) |
| 5 to 17 Years | 62 (10.2%) | 20 (3.4%) |
| 18 to 34 Years | 56 (9.3%) | 56 (8.2%) |
| 35 to 64 Years | 170 (15.0%) | 385 (29.9%) |
| 65 to 74 Years | 180 (50.6%) | 107 (33.4%) |
| 75 Years and over | 81 (45.5%) | 166 (60.4%) |
Disability Class by Sex by Age in Franklin
Disability Class: Hearing Difficulty
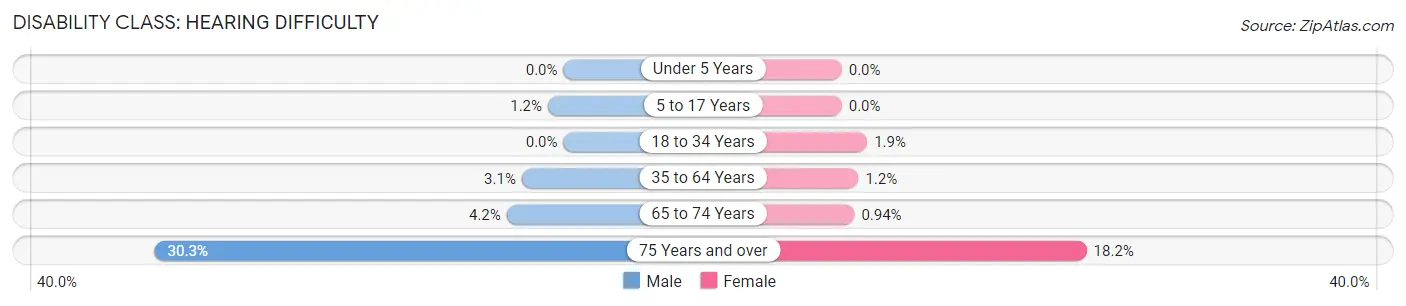
| Age Bracket | Male | Female |
| Under 5 Years | 0 (0.0%) | 0 (0.0%) |
| 5 to 17 Years | 7 (1.1%) | 0 (0.0%) |
| 18 to 34 Years | 0 (0.0%) | 13 (1.9%) |
| 35 to 64 Years | 35 (3.1%) | 16 (1.2%) |
| 65 to 74 Years | 15 (4.2%) | 3 (0.9%) |
| 75 Years and over | 54 (30.3%) | 50 (18.2%) |
Disability Class: Vision Difficulty
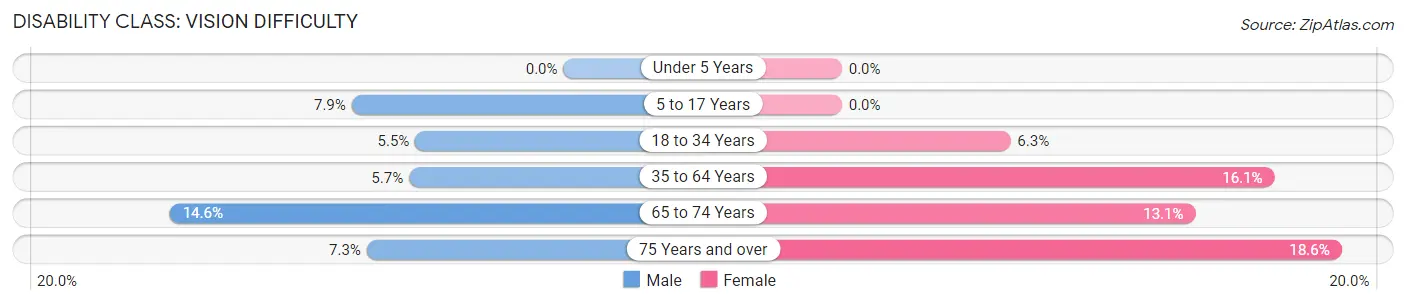
| Age Bracket | Male | Female |
| Under 5 Years | 0 (0.0%) | 0 (0.0%) |
| 5 to 17 Years | 48 (7.9%) | 0 (0.0%) |
| 18 to 34 Years | 33 (5.5%) | 43 (6.3%) |
| 35 to 64 Years | 65 (5.7%) | 207 (16.1%) |
| 65 to 74 Years | 52 (14.6%) | 42 (13.1%) |
| 75 Years and over | 13 (7.3%) | 51 (18.5%) |
Disability Class: Cognitive Difficulty
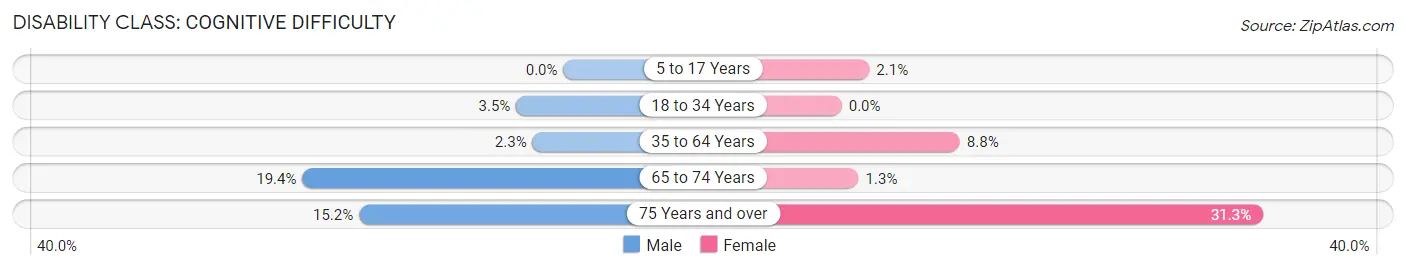
| Age Bracket | Male | Female |
| 5 to 17 Years | 0 (0.0%) | 12 (2.1%) |
| 18 to 34 Years | 21 (3.5%) | 0 (0.0%) |
| 35 to 64 Years | 26 (2.3%) | 113 (8.8%) |
| 65 to 74 Years | 69 (19.4%) | 4 (1.3%) |
| 75 Years and over | 27 (15.2%) | 86 (31.3%) |
Disability Class: Ambulatory Difficulty
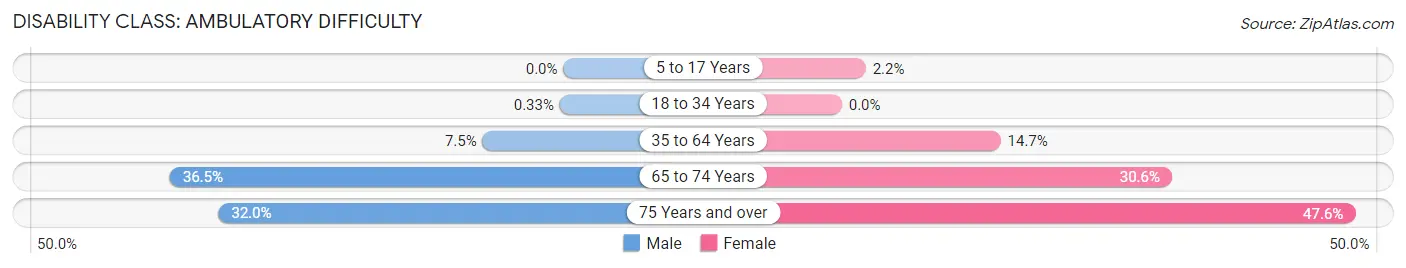
| Age Bracket | Male | Female |
| 5 to 17 Years | 0 (0.0%) | 13 (2.2%) |
| 18 to 34 Years | 2 (0.3%) | 0 (0.0%) |
| 35 to 64 Years | 85 (7.5%) | 190 (14.7%) |
| 65 to 74 Years | 130 (36.5%) | 98 (30.6%) |
| 75 Years and over | 57 (32.0%) | 131 (47.6%) |
Disability Class: Self-Care Difficulty
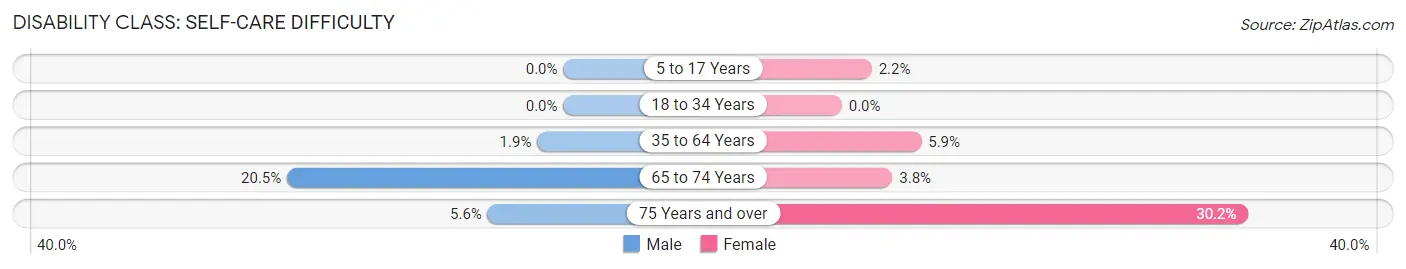
| Age Bracket | Male | Female |
| 5 to 17 Years | 0 (0.0%) | 13 (2.2%) |
| 18 to 34 Years | 0 (0.0%) | 0 (0.0%) |
| 35 to 64 Years | 22 (1.9%) | 76 (5.9%) |
| 65 to 74 Years | 73 (20.5%) | 12 (3.7%) |
| 75 Years and over | 10 (5.6%) | 83 (30.2%) |
Technology Access in Franklin
Computing Device Access in Franklin
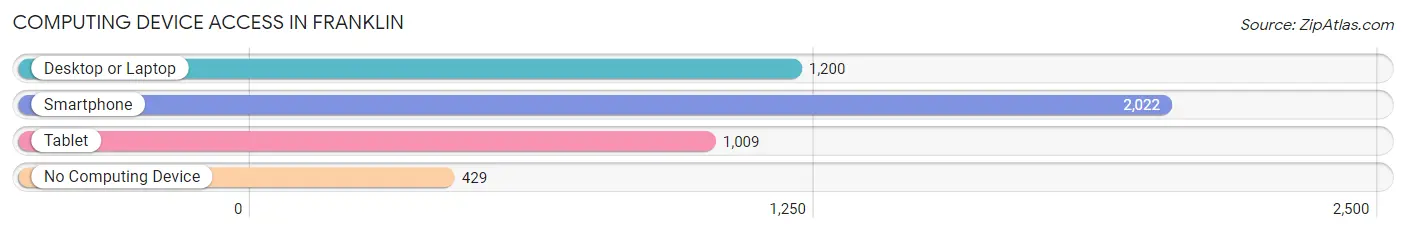
| Device Type | # Households | % Households |
| Desktop or Laptop | 1,200 | 46.6% |
| Smartphone | 2,022 | 78.5% |
| Tablet | 1,009 | 39.2% |
| No Computing Device | 429 | 16.7% |
| Total | 2,576 | 100.0% |
Internet Access in Franklin
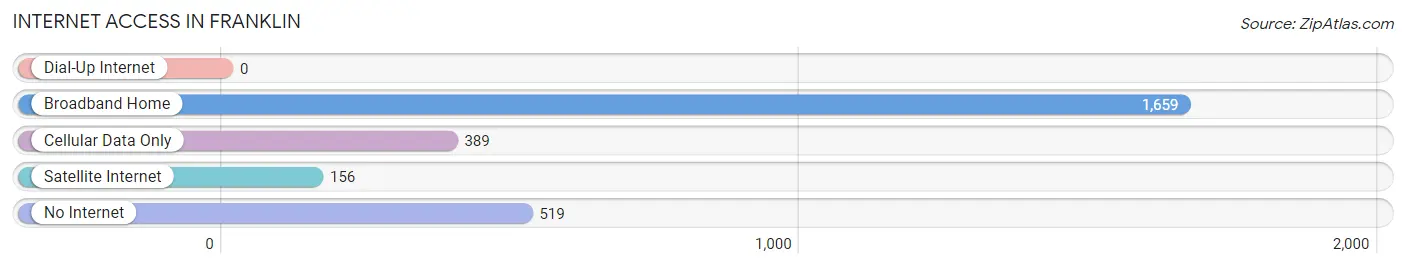
| Internet Type | # Households | % Households |
| Dial-Up Internet | 0 | 0.0% |
| Broadband Home | 1,659 | 64.4% |
| Cellular Data Only | 389 | 15.1% |
| Satellite Internet | 156 | 6.1% |
| No Internet | 519 | 20.2% |
| Total | 2,576 | 100.0% |
Franklin Summary
Franklin, Louisiana is a small city located in St. Mary Parish in the southeastern part of the state. It is situated on the banks of the Bayou Teche, a tributary of the Atchafalaya River. The city has a population of 8,541 as of the 2010 census, making it the largest city in St. Mary Parish.
Geography
Franklin is located at 29°48'N, 91°37'W, about 40 miles southwest of Baton Rouge and about 60 miles northwest of New Orleans. The city is situated on the banks of the Bayou Teche, a tributary of the Atchafalaya River. The city is surrounded by swampland and is located in the heart of Cajun Country.
History
Franklin was founded in 1808 by a group of French-speaking settlers from Nova Scotia. The city was named after Benjamin Franklin, one of the Founding Fathers of the United States. The city was incorporated in 1820 and has been the parish seat of St. Mary Parish since 1822.
The city was an important port during the 19th century, and it was a major center for the sugar and cotton industries. During the Civil War, the city was occupied by Union forces and was the site of several battles.
Economy
Franklin is a small city with a diverse economy. The city is home to several manufacturing companies, including a paper mill, a chemical plant, and a plastics plant. The city is also home to several oil and gas companies, as well as a number of agricultural businesses.
The city is also home to several retail stores, restaurants, and other businesses. The city is served by the Franklin Regional Airport, which offers flights to several major cities in the region.
Demographics
As of the 2010 census, Franklin had a population of 8,541. The racial makeup of the city was 65.3% White, 28.2% African American, 0.3% Native American, 0.7% Asian, 0.1% Pacific Islander, 4.2% from other races, and 1.4% from two or more races. Hispanic or Latino of any race were 8.2% of the population.
The median income for a household in the city was $30,945, and the median income for a family was $37,917. The per capita income for the city was $17,845. About 22.2% of families and 25.3% of the population were below the poverty line, including 36.2% of those under age 18 and 16.2% of those age 65 or over.
Conclusion
Franklin, Louisiana is a small city located in St. Mary Parish in the southeastern part of the state. It is situated on the banks of the Bayou Teche, a tributary of the Atchafalaya River. The city has a population of 8,541 as of the 2010 census, making it the largest city in St. Mary Parish. The city has a diverse economy, with several manufacturing companies, oil and gas companies, agricultural businesses, and retail stores. The racial makeup of the city is 65.3% White, 28.2% African American, 0.3% Native American, 0.7% Asian, 0.1% Pacific Islander, 4.2% from other races, and 1.4% from two or more races. The median income for a household in the city was $30,945, and the median income for a family was $37,917. About 22.2% of families and 25.3% of the population were below the poverty line.
Common Questions
What is Per Capita Income in Franklin?
Per Capita income in Franklin is $24,673.
What is the Median Family Income in Franklin?
Median Family Income in Franklin is $51,250.
What is the Median Household income in Franklin?
Median Household Income in Franklin is $39,068.
What is Income or Wage Gap in Franklin?
Income or Wage Gap in Franklin is 45.2%.
Women in Franklin earn 54.8 cents for every dollar earned by a man.
What is Inequality or Gini Index in Franklin?
Inequality or Gini Index in Franklin is 0.51.
What is the Total Population of Franklin?
Total Population of Franklin is 6,666.
What is the Total Male Population of Franklin?
Total Male Population of Franklin is 3,290.
What is the Total Female Population of Franklin?
Total Female Population of Franklin is 3,376.
What is the Ratio of Males per 100 Females in Franklin?
There are 97.45 Males per 100 Females in Franklin.
What is the Ratio of Females per 100 Males in Franklin?
There are 102.61 Females per 100 Males in Franklin.
What is the Median Population Age in Franklin?
Median Population Age in Franklin is 39.5 Years.
What is the Average Family Size in Franklin
Average Family Size in Franklin is 3.4 People.
What is the Average Household Size in Franklin
Average Household Size in Franklin is 2.5 People.
How Large is the Labor Force in Franklin?
There are 2,730 People in the Labor Forcein in Franklin.
What is the Percentage of People in the Labor Force in Franklin?
52.4% of People are in the Labor Force in Franklin.
What is the Unemployment Rate in Franklin?
Unemployment Rate in Franklin is 2.7%.