Eunice, LA Map & Demographics
Eunice Map
Eunice Overview
$25,265
PER CAPITA INCOME
$48,533
AVG FAMILY INCOME
$37,828
AVG HOUSEHOLD INCOME
52.6%
WAGE / INCOME GAP [ % ]
47.4¢/ $1
WAGE / INCOME GAP [ $ ]
$12,491
FAMILY INCOME DEFICIT
0.57
INEQUALITY / GINI INDEX
9,440
TOTAL POPULATION
4,523
MALE POPULATION
4,917
FEMALE POPULATION
91.99
MALES / 100 FEMALES
108.71
FEMALES / 100 MALES
35.5
MEDIAN AGE
3.2
AVG FAMILY SIZE
2.5
AVG HOUSEHOLD SIZE
4,090
LABOR FORCE [ PEOPLE ]
57.4%
PERCENT IN LABOR FORCE
12.6%
UNEMPLOYMENT RATE
Eunice Zip Codes
Eunice Area Codes
Income in Eunice
Income Overview in Eunice
Per Capita Income in Eunice is $25,265, while median incomes of families and households are $48,533 and $37,828 respectively.
| Characteristic | Number | Measure |
| Per Capita Income | 9,440 | $25,265 |
| Median Family Income | 2,243 | $48,533 |
| Mean Family Income | 2,243 | $59,801 |
| Median Household Income | 3,771 | $37,828 |
| Mean Household Income | 3,771 | $60,527 |
| Income Deficit | 2,243 | $12,491 |
| Wage / Income Gap (%) | 9,440 | 52.58% |
| Wage / Income Gap ($) | 9,440 | 47.42¢ per $1 |
| Gini / Inequality Index | 9,440 | 0.57 |
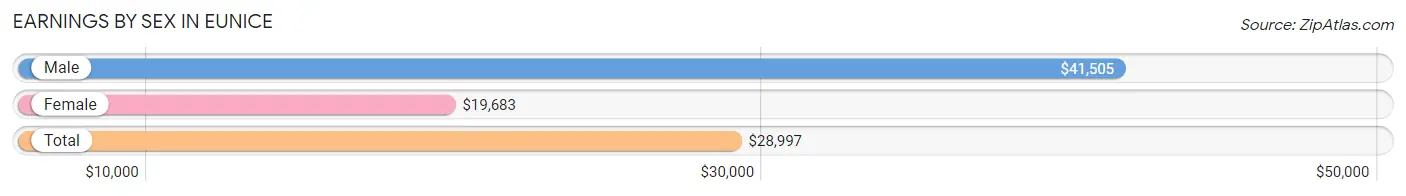
Earnings by Sex in Eunice
Average Earnings in Eunice are $28,997, $41,505 for men and $19,683 for women, a difference of 52.6%.
| Sex | Number | Average Earnings |
| Male | 1,964 (49.0%) | $41,505 |
| Female | 2,043 (51.0%) | $19,683 |
| Total | 4,007 (100.0%) | $28,997 |
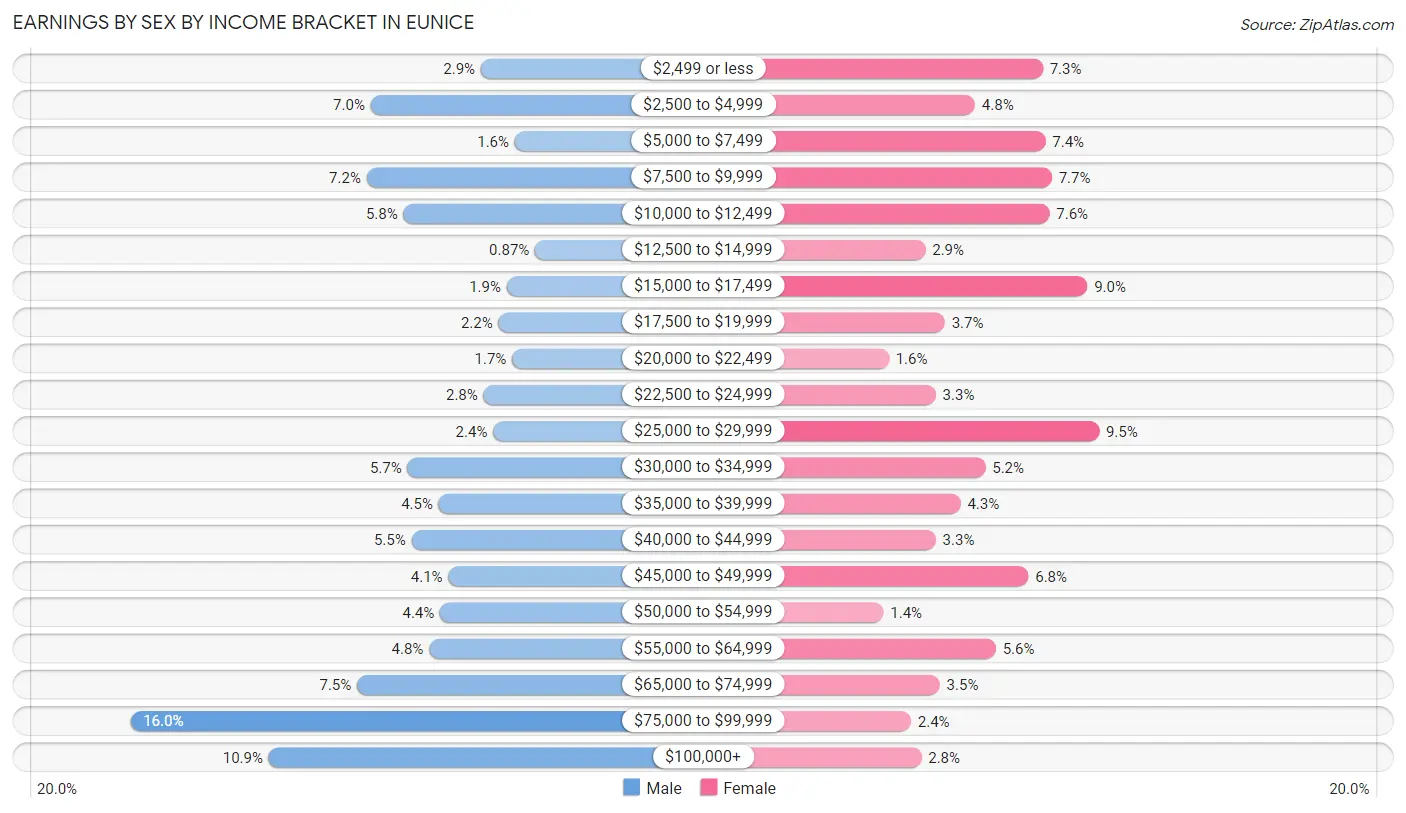
Earnings by Sex by Income Bracket in Eunice
The most common earnings brackets in Eunice are $75,000 to $99,999 for men (315 | 16.0%) and $25,000 to $29,999 for women (193 | 9.5%).
| Income | Male | Female |
| $2,499 or less | 57 (2.9%) | 150 (7.3%) |
| $2,500 to $4,999 | 138 (7.0%) | 98 (4.8%) |
| $5,000 to $7,499 | 32 (1.6%) | 152 (7.4%) |
| $7,500 to $9,999 | 141 (7.2%) | 157 (7.7%) |
| $10,000 to $12,499 | 114 (5.8%) | 155 (7.6%) |
| $12,500 to $14,999 | 17 (0.9%) | 60 (2.9%) |
| $15,000 to $17,499 | 38 (1.9%) | 184 (9.0%) |
| $17,500 to $19,999 | 44 (2.2%) | 75 (3.7%) |
| $20,000 to $22,499 | 34 (1.7%) | 32 (1.6%) |
| $22,500 to $24,999 | 55 (2.8%) | 68 (3.3%) |
| $25,000 to $29,999 | 48 (2.4%) | 193 (9.5%) |
| $30,000 to $34,999 | 111 (5.7%) | 106 (5.2%) |
| $35,000 to $39,999 | 88 (4.5%) | 87 (4.3%) |
| $40,000 to $44,999 | 108 (5.5%) | 68 (3.3%) |
| $45,000 to $49,999 | 81 (4.1%) | 139 (6.8%) |
| $50,000 to $54,999 | 87 (4.4%) | 28 (1.4%) |
| $55,000 to $64,999 | 95 (4.8%) | 114 (5.6%) |
| $65,000 to $74,999 | 148 (7.5%) | 71 (3.5%) |
| $75,000 to $99,999 | 315 (16.0%) | 49 (2.4%) |
| $100,000+ | 213 (10.8%) | 57 (2.8%) |
| Total | 1,964 (100.0%) | 2,043 (100.0%) |
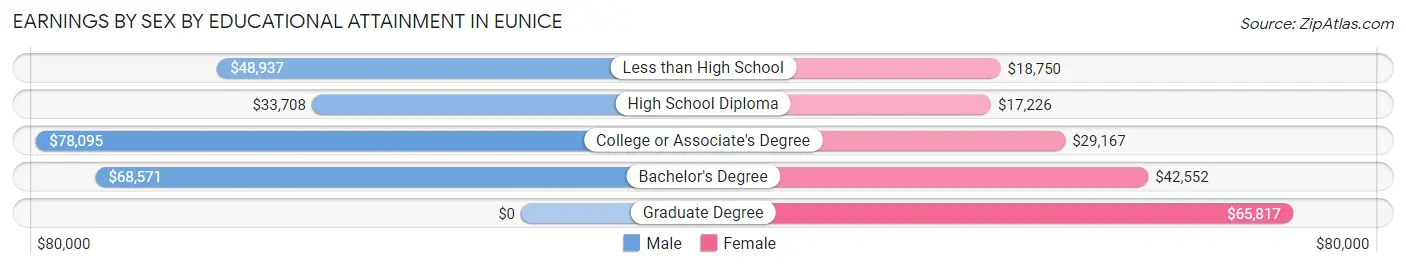
Earnings by Sex by Educational Attainment in Eunice
Average earnings in Eunice are $52,422 for men and $26,944 for women, a difference of 48.6%. Men with an educational attainment of college or associate's degree enjoy the highest average annual earnings of $78,095, while those with high school diploma education earn the least with $33,708. Women with an educational attainment of graduate degree earn the most with the average annual earnings of $65,817, while those with high school diploma education have the smallest earnings of $17,226.
| Educational Attainment | Male Income | Female Income |
| Less than High School | $48,937 | $18,750 |
| High School Diploma | $33,708 | $17,226 |
| College or Associate's Degree | $78,095 | $29,167 |
| Bachelor's Degree | $68,571 | $42,552 |
| Graduate Degree | - | - |
| Total | $52,422 | $26,944 |
Family Income in Eunice
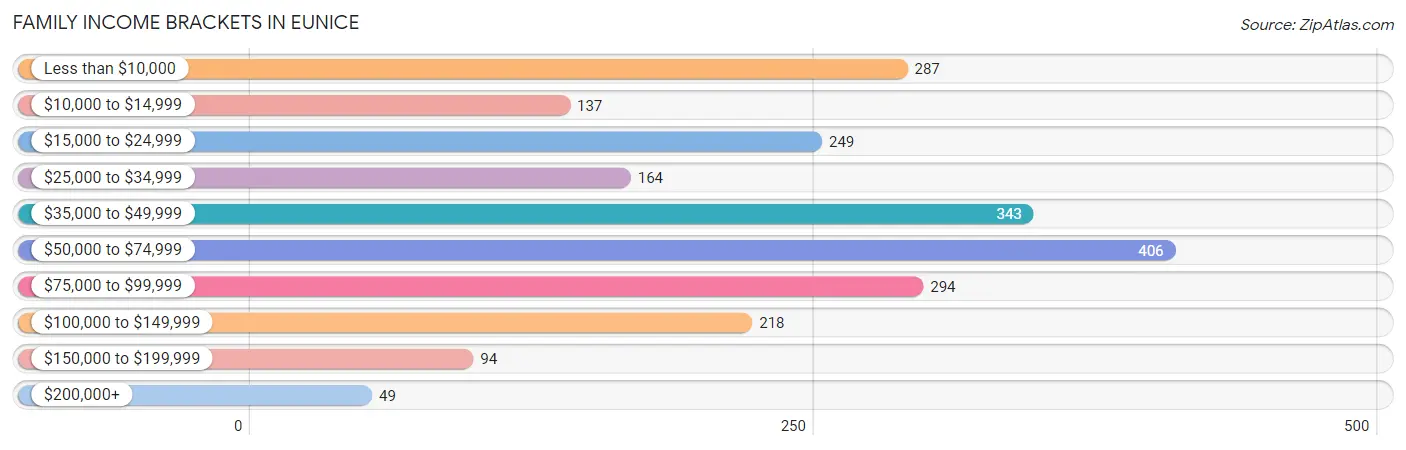
Family Income Brackets in Eunice
According to the Eunice family income data, there are 406 families falling into the $50,000 to $74,999 income range, which is the most common income bracket and makes up 18.1% of all families. Conversely, the $200,000+ income bracket is the least frequent group with only 49 families (2.2%) belonging to this category.
| Income Bracket | # Families | % Families |
| Less than $10,000 | 287 | 12.8% |
| $10,000 to $14,999 | 137 | 6.1% |
| $15,000 to $24,999 | 249 | 11.1% |
| $25,000 to $34,999 | 164 | 7.3% |
| $35,000 to $49,999 | 343 | 15.3% |
| $50,000 to $74,999 | 406 | 18.1% |
| $75,000 to $99,999 | 294 | 13.1% |
| $100,000 to $149,999 | 218 | 9.7% |
| $150,000 to $199,999 | 94 | 4.2% |
| $200,000+ | 49 | 2.2% |
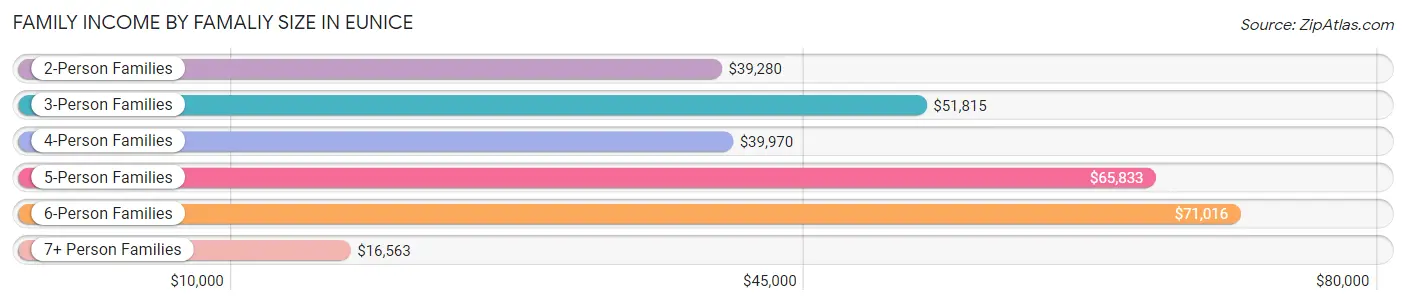
Family Income by Famaliy Size in Eunice
6-person families (53 | 2.4%) account for the highest median family income in Eunice with $71,016 per family, while 2-person families (1,204 | 53.7%) have the highest median income of $19,640 per family member.
| Income Bracket | # Families | Median Income |
| 2-Person Families | 1,204 (53.7%) | $39,280 |
| 3-Person Families | 433 (19.3%) | $51,815 |
| 4-Person Families | 373 (16.6%) | $39,970 |
| 5-Person Families | 160 (7.1%) | $65,833 |
| 6-Person Families | 53 (2.4%) | $71,016 |
| 7+ Person Families | 20 (0.9%) | $16,563 |
| Total | 2,243 (100.0%) | $48,533 |
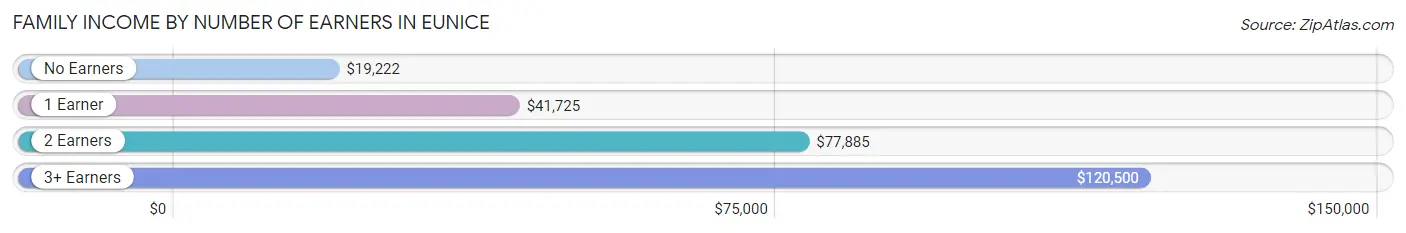
Family Income by Number of Earners in Eunice
The median family income in Eunice is $48,533, with families comprising 3+ earners (112) having the highest median family income of $120,500, while families with no earners (464) have the lowest median family income of $19,222, accounting for 5.0% and 20.7% of families, respectively.
| Number of Earners | # Families | Median Income |
| No Earners | 464 (20.7%) | $19,222 |
| 1 Earner | 963 (42.9%) | $41,725 |
| 2 Earners | 704 (31.4%) | $77,885 |
| 3+ Earners | 112 (5.0%) | $120,500 |
| Total | 2,243 (100.0%) | $48,533 |
Household Income in Eunice
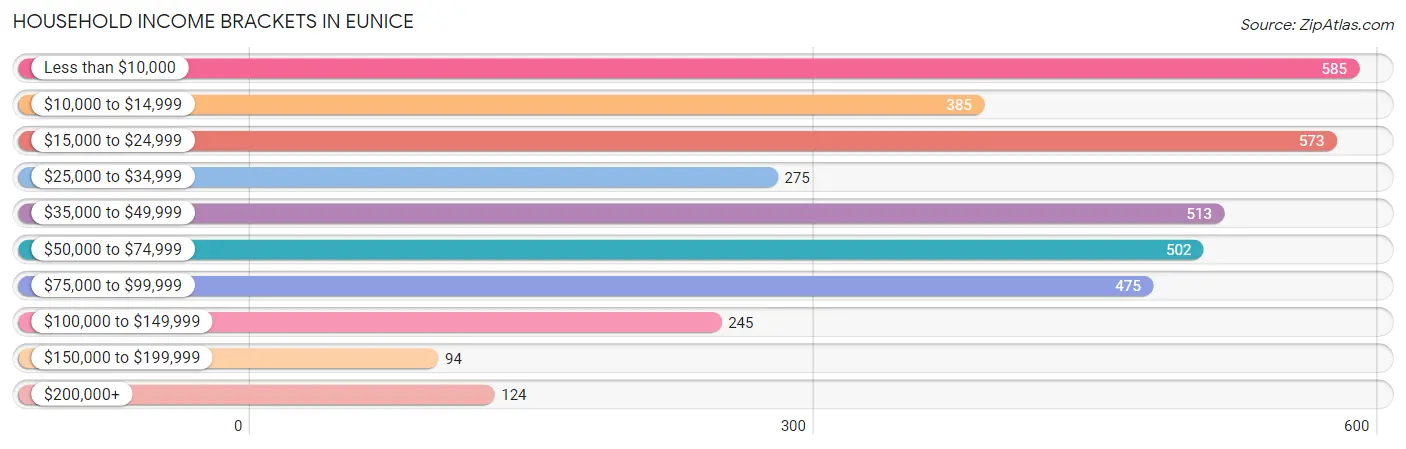
Household Income Brackets in Eunice
With 585 households falling in the category, the less than $10,000 income range is the most frequent in Eunice, accounting for 15.5% of all households. In contrast, only 94 households (2.5%) fall into the $150,000 to $199,999 income bracket, making it the least populous group.
| Income Bracket | # Households | % Households |
| Less than $10,000 | 585 | 15.5% |
| $10,000 to $14,999 | 385 | 10.2% |
| $15,000 to $24,999 | 573 | 15.2% |
| $25,000 to $34,999 | 275 | 7.3% |
| $35,000 to $49,999 | 513 | 13.6% |
| $50,000 to $74,999 | 502 | 13.3% |
| $75,000 to $99,999 | 475 | 12.6% |
| $100,000 to $149,999 | 245 | 6.5% |
| $150,000 to $199,999 | 94 | 2.5% |
| $200,000+ | 124 | 3.3% |
Household Income by Householder Age in Eunice
The median household income in Eunice is $37,828, with the highest median household income of $49,639 found in the 45 to 64 years age bracket for the primary householder. A total of 1,401 households (37.1%) fall into this category. Meanwhile, the 15 to 24 years age bracket for the primary householder has the lowest median household income of $0, with 303 households (8.0%) in this group.
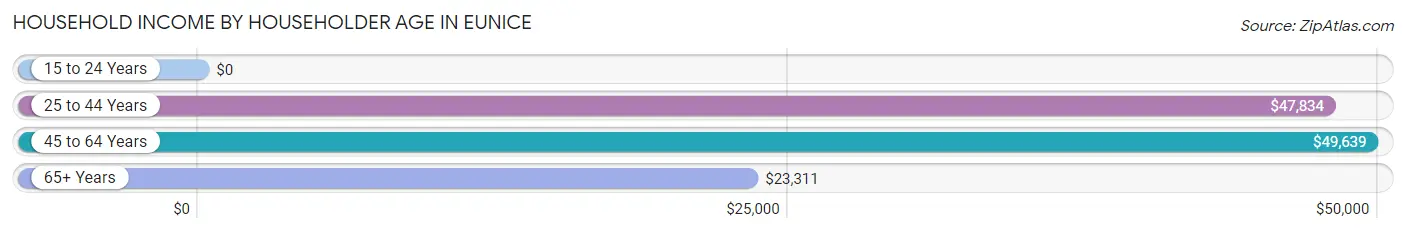
| Income Bracket | # Households | Median Income |
| 15 to 24 Years | 303 (8.0%) | $0 |
| 25 to 44 Years | 1,039 (27.6%) | $47,834 |
| 45 to 64 Years | 1,401 (37.1%) | $49,639 |
| 65+ Years | 1,028 (27.3%) | $23,311 |
| Total | 3,771 (100.0%) | $37,828 |
Poverty in Eunice
Income Below Poverty by Sex and Age in Eunice
With 30.1% poverty level for males and 40.0% for females among the residents of Eunice, under 5 year old males and 5 year old females are the most vulnerable to poverty, with 190 males (62.1%) and 7 females (100.0%) in their respective age groups living below the poverty level.
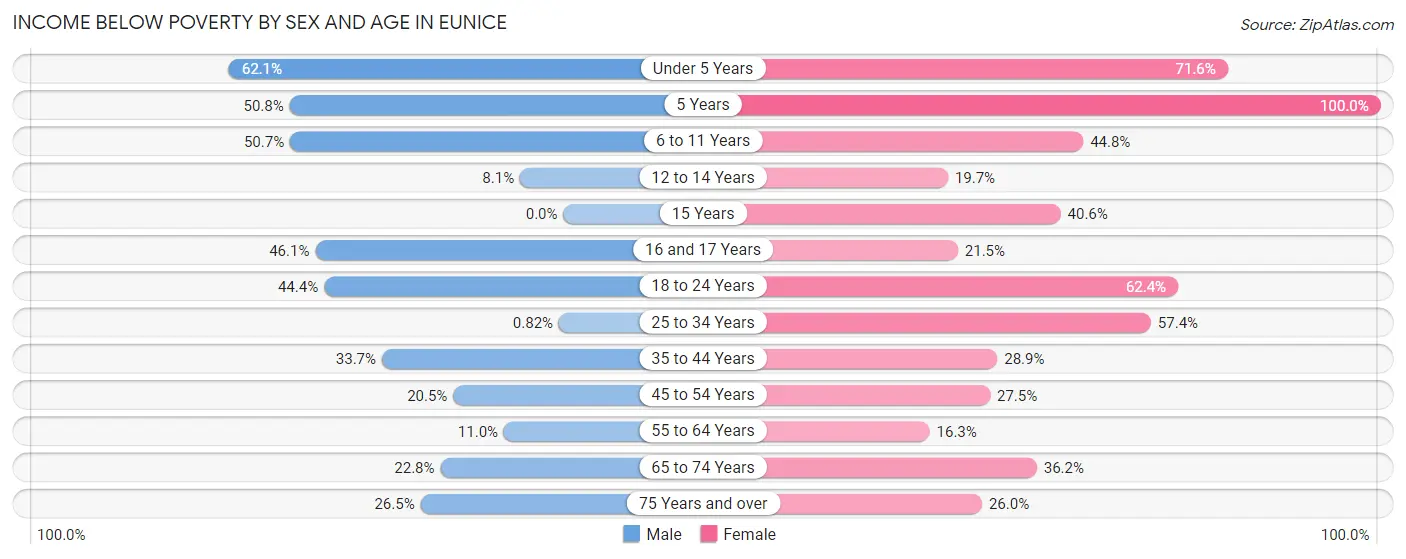
| Age Bracket | Male | Female |
| Under 5 Years | 190 (62.1%) | 280 (71.6%) |
| 5 Years | 31 (50.8%) | 7 (100.0%) |
| 6 to 11 Years | 241 (50.7%) | 259 (44.8%) |
| 12 to 14 Years | 12 (8.1%) | 39 (19.7%) |
| 15 Years | 0 (0.0%) | 13 (40.6%) |
| 16 and 17 Years | 70 (46.1%) | 14 (21.5%) |
| 18 to 24 Years | 267 (44.4%) | 287 (62.4%) |
| 25 to 34 Years | 3 (0.8%) | 381 (57.4%) |
| 35 to 44 Years | 158 (33.7%) | 151 (28.9%) |
| 45 to 54 Years | 153 (20.4%) | 159 (27.5%) |
| 55 to 64 Years | 47 (11.0%) | 75 (16.3%) |
| 65 to 74 Years | 92 (22.8%) | 148 (36.2%) |
| 75 Years and over | 48 (26.5%) | 127 (26.0%) |
| Total | 1,312 (30.1%) | 1,940 (40.0%) |
Income Above Poverty by Sex and Age in Eunice
According to the poverty statistics in Eunice, males aged 15 years and females aged 55 to 64 years are the age groups that are most secure financially, with 100.0% of males and 83.7% of females in these age groups living above the poverty line.
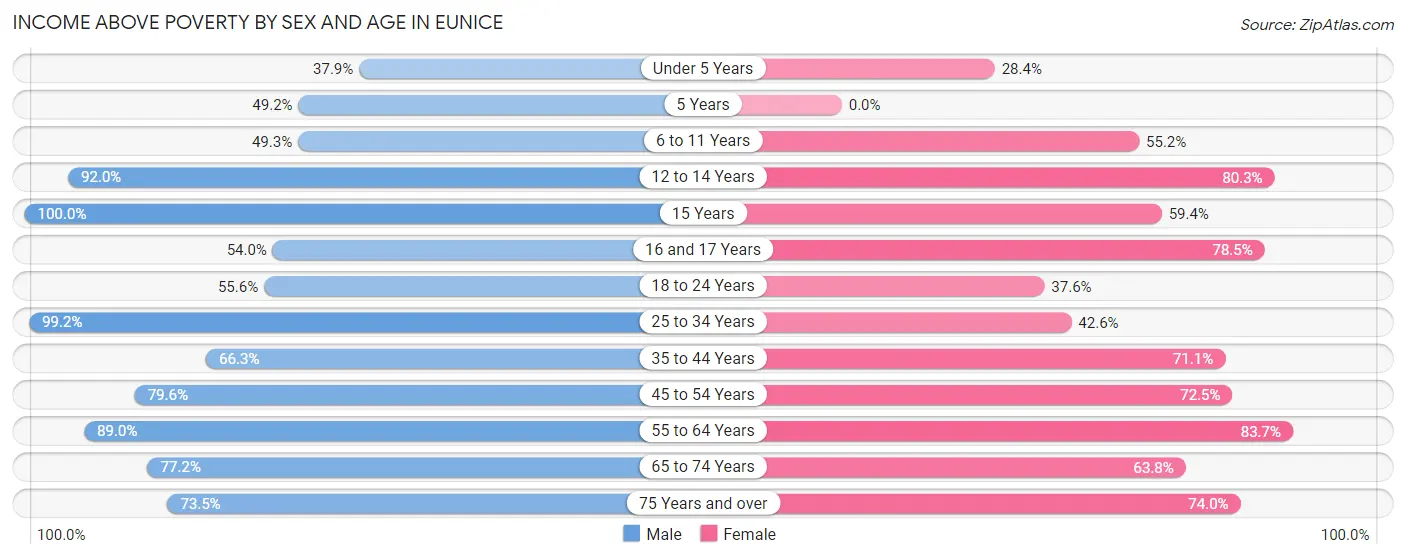
| Age Bracket | Male | Female |
| Under 5 Years | 116 (37.9%) | 111 (28.4%) |
| 5 Years | 30 (49.2%) | 0 (0.0%) |
| 6 to 11 Years | 234 (49.3%) | 319 (55.2%) |
| 12 to 14 Years | 137 (91.9%) | 159 (80.3%) |
| 15 Years | 23 (100.0%) | 19 (59.4%) |
| 16 and 17 Years | 82 (53.9%) | 51 (78.5%) |
| 18 to 24 Years | 334 (55.6%) | 173 (37.6%) |
| 25 to 34 Years | 362 (99.2%) | 283 (42.6%) |
| 35 to 44 Years | 311 (66.3%) | 372 (71.1%) |
| 45 to 54 Years | 595 (79.5%) | 419 (72.5%) |
| 55 to 64 Years | 379 (89.0%) | 385 (83.7%) |
| 65 to 74 Years | 311 (77.2%) | 261 (63.8%) |
| 75 Years and over | 133 (73.5%) | 361 (74.0%) |
| Total | 3,047 (69.9%) | 2,913 (60.0%) |
Income Below Poverty Among Married-Couple Families in Eunice
The poverty statistics for married-couple families in Eunice show that 8.8% or 111 of the total 1,255 families live below the poverty line. Families with 5 or more children have the highest poverty rate of 100.0%, comprising of 10 families. On the other hand, families with 1 or 2 children have the lowest poverty rate of 3.9%, which includes 14 families.
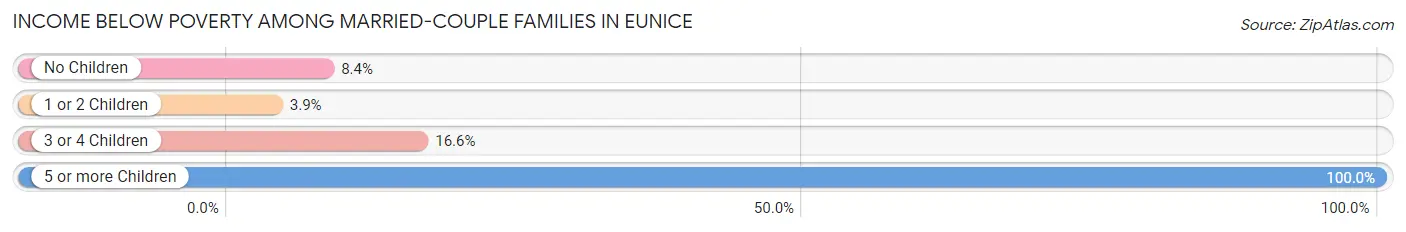
| Children | Above Poverty | Below Poverty |
| No Children | 668 (91.6%) | 61 (8.4%) |
| 1 or 2 Children | 345 (96.1%) | 14 (3.9%) |
| 3 or 4 Children | 131 (83.4%) | 26 (16.6%) |
| 5 or more Children | 0 (0.0%) | 10 (100.0%) |
| Total | 1,144 (91.2%) | 111 (8.8%) |
Income Below Poverty Among Single-Parent Households in Eunice
According to the poverty data in Eunice, 47.1% or 107 single-father households and 56.0% or 426 single-mother households are living below the poverty line. Among single-father households, those with 1 or 2 children have the highest poverty rate, with 49 households (80.3%) experiencing poverty. Likewise, among single-mother households, those with 3 or 4 children have the highest poverty rate, with 98 households (73.7%) falling below the poverty line.
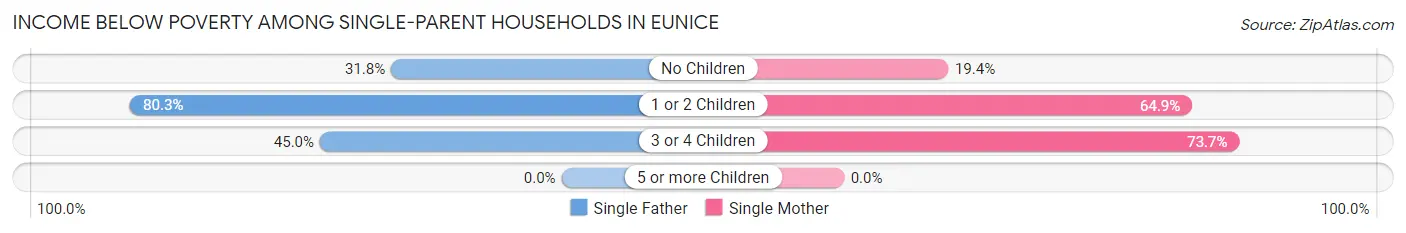
| Children | Single Father | Single Mother |
| No Children | 40 (31.8%) | 34 (19.4%) |
| 1 or 2 Children | 49 (80.3%) | 294 (64.9%) |
| 3 or 4 Children | 18 (45.0%) | 98 (73.7%) |
| 5 or more Children | 0 (0.0%) | 0 (0.0%) |
| Total | 107 (47.1%) | 426 (56.0%) |
Income Below Poverty Among Married-Couple vs Single-Parent Households in Eunice
The poverty data for Eunice shows that 111 of the married-couple family households (8.8%) and 533 of the single-parent households (53.9%) are living below the poverty level. Within the married-couple family households, those with 5 or more children have the highest poverty rate, with 10 households (100.0%) falling below the poverty line. Among the single-parent households, those with 3 or 4 children have the highest poverty rate, with 116 household (67.0%) living below poverty.
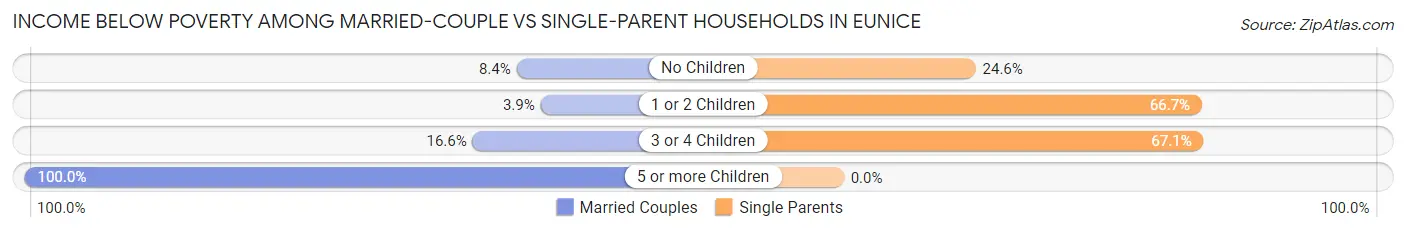
| Children | Married-Couple Families | Single-Parent Households |
| No Children | 61 (8.4%) | 74 (24.6%) |
| 1 or 2 Children | 14 (3.9%) | 343 (66.7%) |
| 3 or 4 Children | 26 (16.6%) | 116 (67.0%) |
| 5 or more Children | 10 (100.0%) | 0 (0.0%) |
| Total | 111 (8.8%) | 533 (53.9%) |
Race in Eunice
The most populous races in Eunice are White / Caucasian (5,321 | 56.4%), Black / African American (3,429 | 36.3%), and Two or more Races (649 | 6.9%).
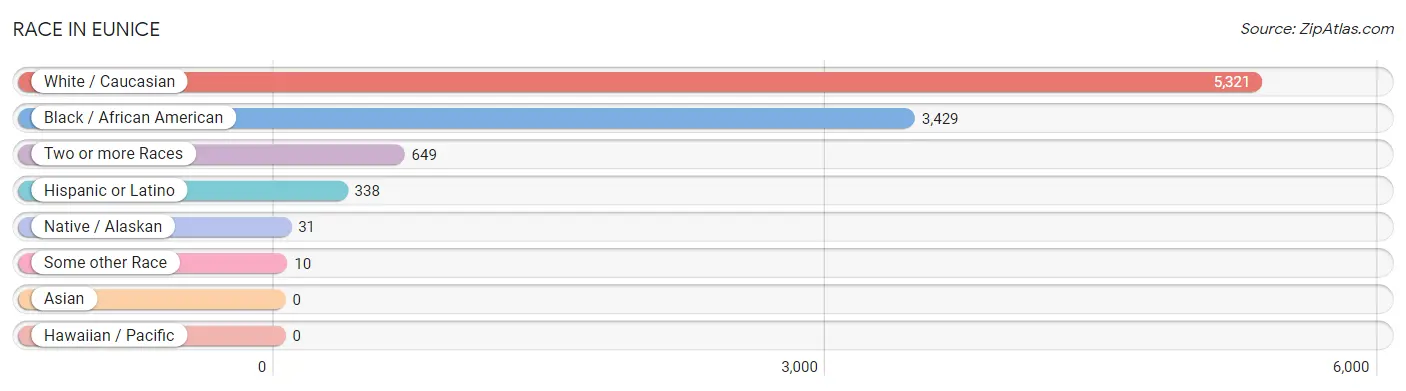
| Race | # Population | % Population |
| Asian | 0 | 0.0% |
| Black / African American | 3,429 | 36.3% |
| Hawaiian / Pacific | 0 | 0.0% |
| Hispanic or Latino | 338 | 3.6% |
| Native / Alaskan | 31 | 0.3% |
| White / Caucasian | 5,321 | 56.4% |
| Two or more Races | 649 | 6.9% |
| Some other Race | 10 | 0.1% |
| Total | 9,440 | 100.0% |
Ancestry in Eunice
The most populous ancestries reported in Eunice are French (1,370 | 14.5%), French Canadian (931 | 9.9%), English (452 | 4.8%), German (442 | 4.7%), and Irish (393 | 4.2%), together accounting for 38.0% of all Eunice residents.
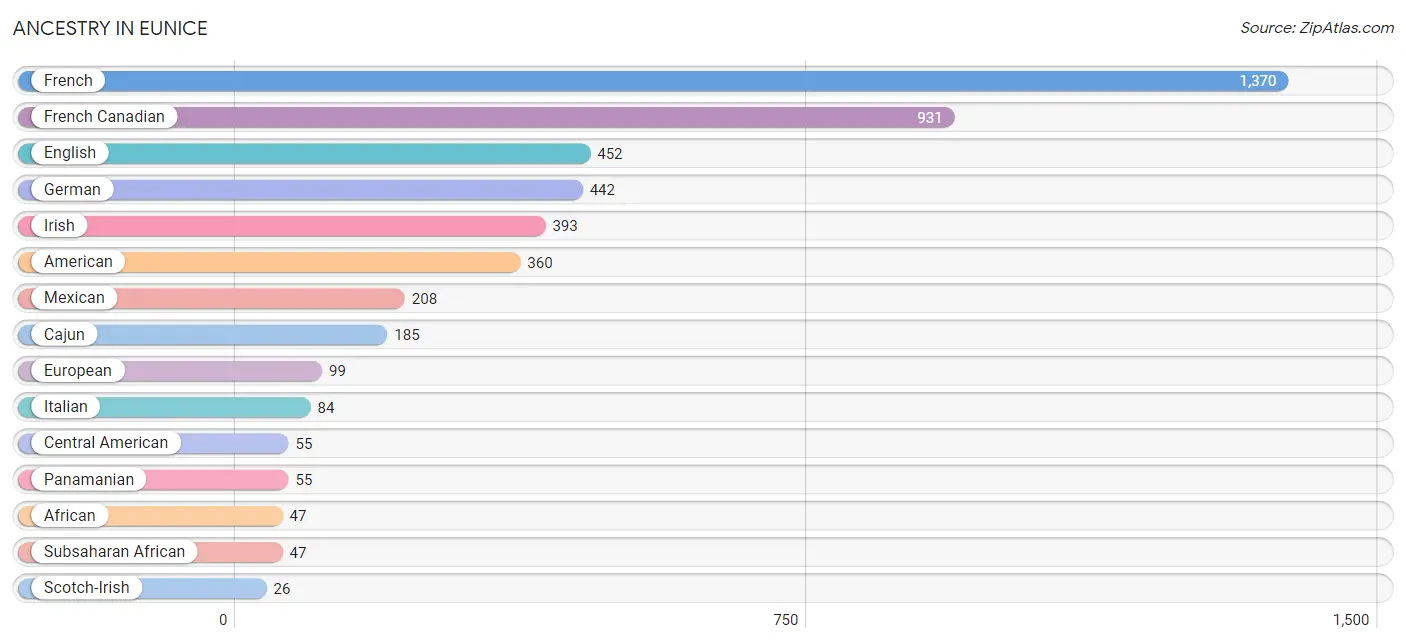
| Ancestry | # Population | % Population |
| African | 47 | 0.5% |
| American | 360 | 3.8% |
| Arab | 1 | 0.0% |
| Cajun | 185 | 2.0% |
| Central American | 55 | 0.6% |
| Cuban | 5 | 0.1% |
| English | 452 | 4.8% |
| European | 99 | 1.1% |
| French | 1,370 | 14.5% |
| French American Indian | 1 | 0.0% |
| French Canadian | 931 | 9.9% |
| German | 442 | 4.7% |
| Irish | 393 | 4.2% |
| Italian | 84 | 0.9% |
| Lebanese | 1 | 0.0% |
| Mexican | 208 | 2.2% |
| Norwegian | 17 | 0.2% |
| Panamanian | 55 | 0.6% |
| Polish | 4 | 0.0% |
| Puerto Rican | 7 | 0.1% |
| Russian | 8 | 0.1% |
| Scotch-Irish | 26 | 0.3% |
| Seminole | 17 | 0.2% |
| Slovak | 8 | 0.1% |
| Spaniard | 9 | 0.1% |
| Spanish | 20 | 0.2% |
| Subsaharan African | 47 | 0.5% |
| Thai | 3 | 0.0% | View All 28 Rows |
Immigrants in Eunice
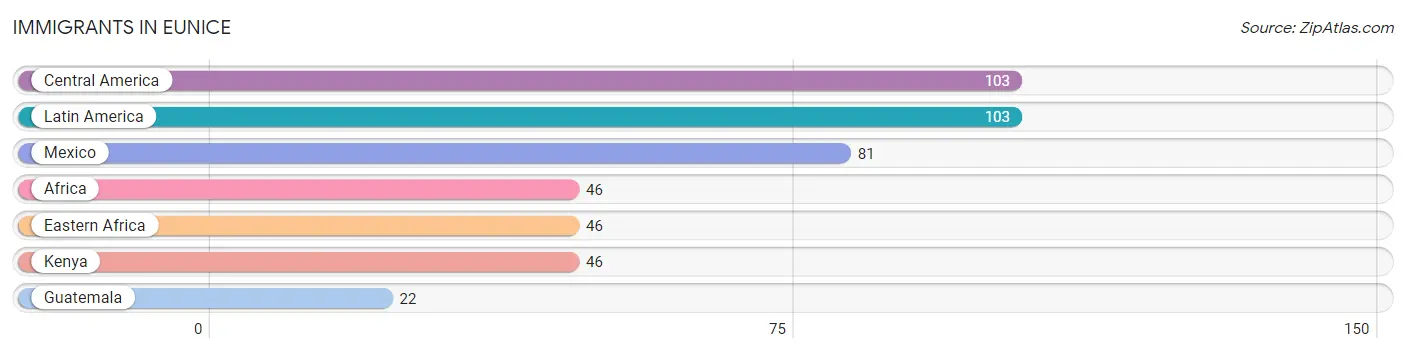
The most numerous immigrant groups reported in Eunice came from Central America (103 | 1.1%), Latin America (103 | 1.1%), Mexico (81 | 0.9%), Africa (46 | 0.5%), and Eastern Africa (46 | 0.5%), together accounting for 4.0% of all Eunice residents.
| Immigration Origin | # Population | % Population |
| Africa | 46 | 0.5% |
| Central America | 103 | 1.1% |
| Eastern Africa | 46 | 0.5% |
| Guatemala | 22 | 0.2% |
| Kenya | 46 | 0.5% |
| Latin America | 103 | 1.1% |
| Mexico | 81 | 0.9% | View All 7 Rows |
Sex and Age in Eunice
Sex and Age in Eunice
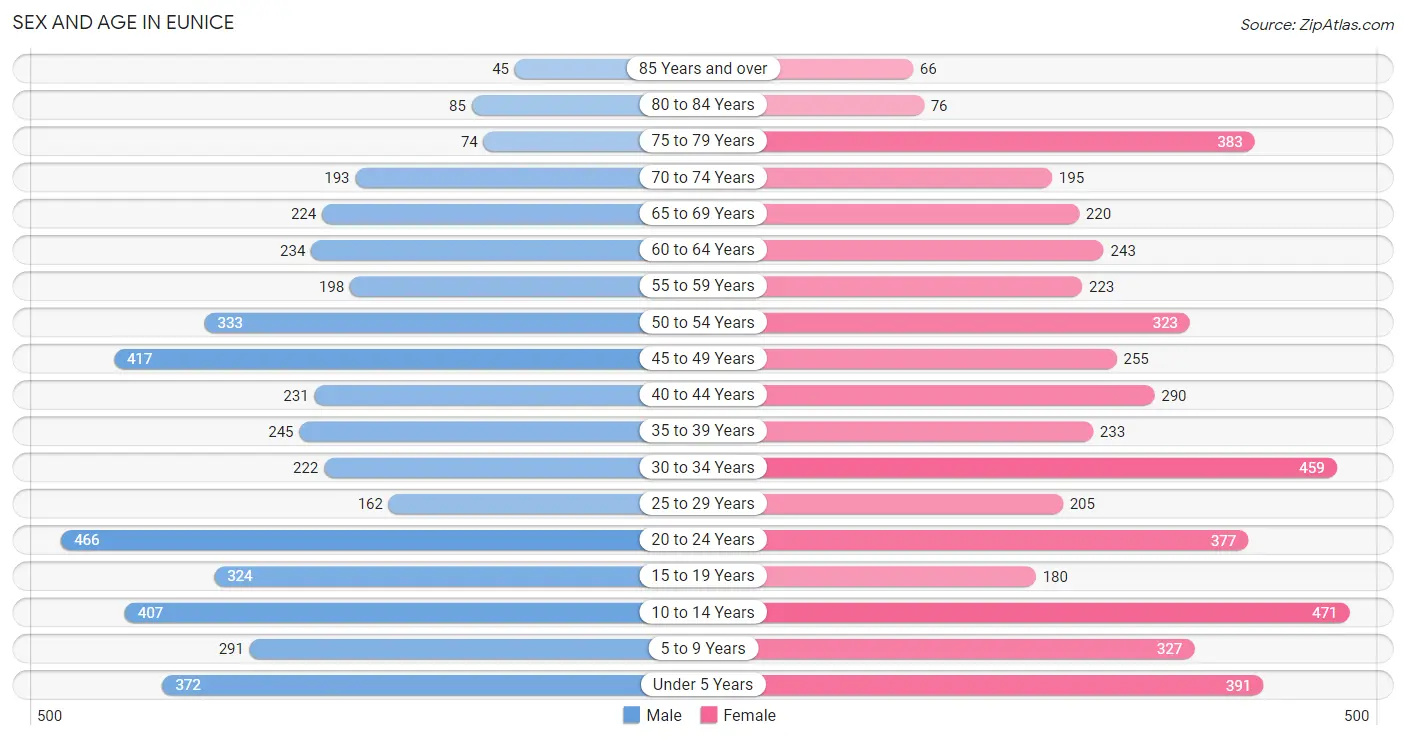
The most populous age groups in Eunice are 20 to 24 Years (466 | 10.3%) for men and 10 to 14 Years (471 | 9.6%) for women.
| Age Bracket | Male | Female |
| Under 5 Years | 372 (8.2%) | 391 (8.0%) |
| 5 to 9 Years | 291 (6.4%) | 327 (6.7%) |
| 10 to 14 Years | 407 (9.0%) | 471 (9.6%) |
| 15 to 19 Years | 324 (7.2%) | 180 (3.7%) |
| 20 to 24 Years | 466 (10.3%) | 377 (7.7%) |
| 25 to 29 Years | 162 (3.6%) | 205 (4.2%) |
| 30 to 34 Years | 222 (4.9%) | 459 (9.3%) |
| 35 to 39 Years | 245 (5.4%) | 233 (4.7%) |
| 40 to 44 Years | 231 (5.1%) | 290 (5.9%) |
| 45 to 49 Years | 417 (9.2%) | 255 (5.2%) |
| 50 to 54 Years | 333 (7.4%) | 323 (6.6%) |
| 55 to 59 Years | 198 (4.4%) | 223 (4.5%) |
| 60 to 64 Years | 234 (5.2%) | 243 (4.9%) |
| 65 to 69 Years | 224 (5.0%) | 220 (4.5%) |
| 70 to 74 Years | 193 (4.3%) | 195 (4.0%) |
| 75 to 79 Years | 74 (1.6%) | 383 (7.8%) |
| 80 to 84 Years | 85 (1.9%) | 76 (1.5%) |
| 85 Years and over | 45 (1.0%) | 66 (1.3%) |
| Total | 4,523 (100.0%) | 4,917 (100.0%) |
Families and Households in Eunice
Median Family Size in Eunice
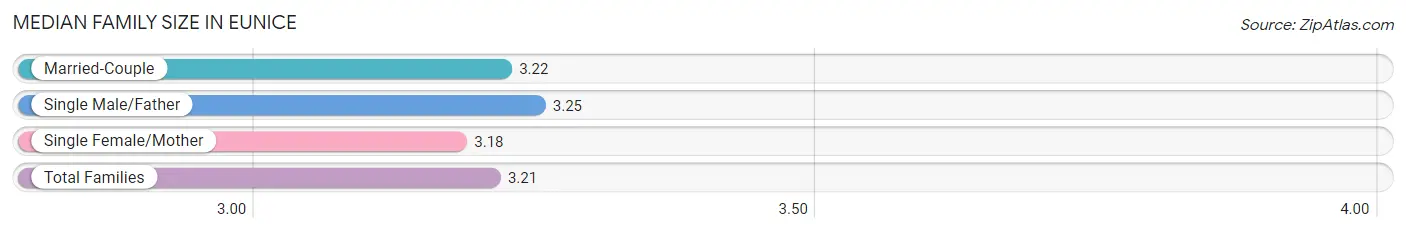
The median family size in Eunice is 3.21 persons per family, with single male/father families (227 | 10.1%) accounting for the largest median family size of 3.25 persons per family. On the other hand, single female/mother families (761 | 33.9%) represent the smallest median family size with 3.18 persons per family.
| Family Type | # Families | Family Size |
| Married-Couple | 1,255 (55.9%) | 3.22 |
| Single Male/Father | 227 (10.1%) | 3.25 |
| Single Female/Mother | 761 (33.9%) | 3.18 |
| Total Families | 2,243 (100.0%) | 3.21 |
Median Household Size in Eunice
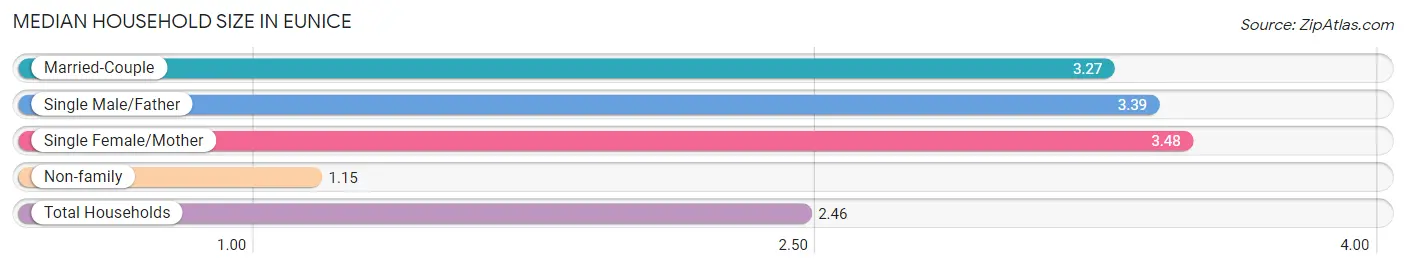
The median household size in Eunice is 2.46 persons per household, with single female/mother households (761 | 20.2%) accounting for the largest median household size of 3.48 persons per household. non-family households (1,528 | 40.5%) represent the smallest median household size with 1.15 persons per household.
| Household Type | # Households | Household Size |
| Married-Couple | 1,255 (33.3%) | 3.27 |
| Single Male/Father | 227 (6.0%) | 3.39 |
| Single Female/Mother | 761 (20.2%) | 3.48 |
| Non-family | 1,528 (40.5%) | 1.15 |
| Total Households | 3,771 (100.0%) | 2.46 |
Household Size by Marriage Status in Eunice
Out of a total of 3,771 households in Eunice, 2,243 (59.5%) are family households, while 1,528 (40.5%) are nonfamily households. The most numerous type of family households are 2-person households, comprising 1,122, and the most common type of nonfamily households are 1-person households, comprising 1,372.
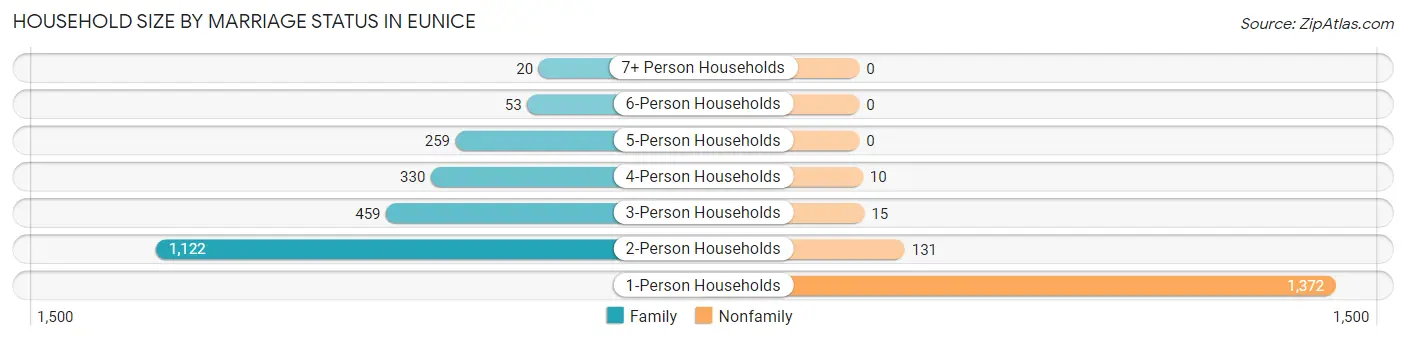
| Household Size | Family Households | Nonfamily Households |
| 1-Person Households | - | 1,372 (36.4%) |
| 2-Person Households | 1,122 (29.7%) | 131 (3.5%) |
| 3-Person Households | 459 (12.2%) | 15 (0.4%) |
| 4-Person Households | 330 (8.7%) | 10 (0.3%) |
| 5-Person Households | 259 (6.9%) | 0 (0.0%) |
| 6-Person Households | 53 (1.4%) | 0 (0.0%) |
| 7+ Person Households | 20 (0.5%) | 0 (0.0%) |
| Total | 2,243 (59.5%) | 1,528 (40.5%) |
Female Fertility in Eunice
Fertility by Age in Eunice
Average fertility rate in Eunice is 59.0 births per 1,000 women. Women in the age bracket of 20 to 34 years have the highest fertility rate with 112.0 births per 1,000 women. Women in the age bracket of 20 to 34 years acount for 97.5% of all women with births.
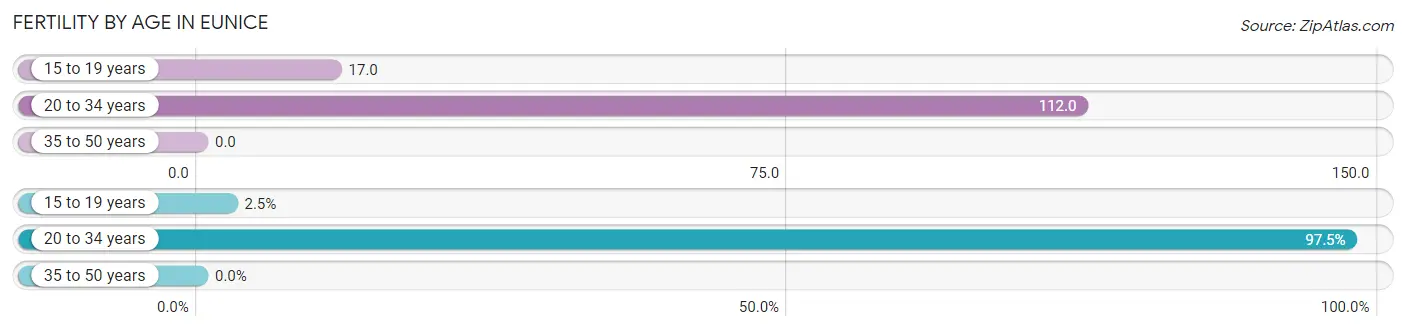
| Age Bracket | Women with Births | Births / 1,000 Women |
| 15 to 19 years | 3 (2.5%) | 17.0 |
| 20 to 34 years | 117 (97.5%) | 112.0 |
| 35 to 50 years | 0 (0.0%) | 0.0 |
| Total | 120 (100.0%) | 59.0 |
Fertility by Age by Marriage Status in Eunice
35.8% of women with births (120) in Eunice are married. The highest percentage of unmarried women with births falls into 15 to 19 years age bracket with 100.0% of them unmarried at the time of birth, while the lowest percentage of unmarried women with births belong to 20 to 34 years age bracket with 63.3% of them unmarried.
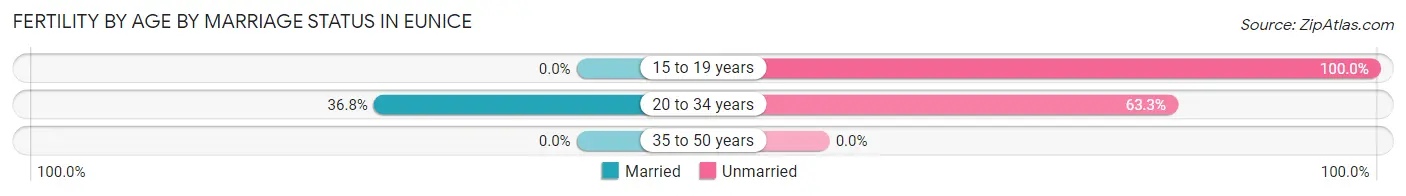
| Age Bracket | Married | Unmarried |
| 15 to 19 years | 0 (0.0%) | 3 (100.0%) |
| 20 to 34 years | 43 (36.7%) | 74 (63.2%) |
| 35 to 50 years | 0 (0.0%) | 0 (0.0%) |
| Total | 43 (35.8%) | 77 (64.2%) |
Fertility by Education in Eunice
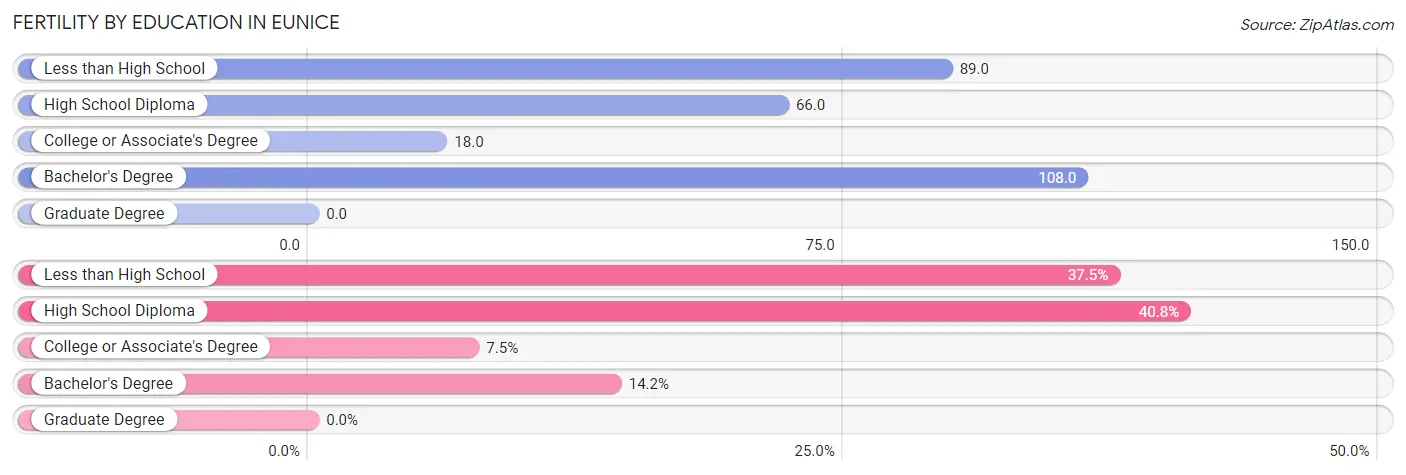
| Educational Attainment | Women with Births | Births / 1,000 Women |
| Less than High School | 45 (37.5%) | 89.0 |
| High School Diploma | 49 (40.8%) | 66.0 |
| College or Associate's Degree | 9 (7.5%) | 18.0 |
| Bachelor's Degree | 17 (14.2%) | 108.0 |
| Graduate Degree | 0 (0.0%) | 0.0 |
| Total | 120 (100.0%) | 59.0 |
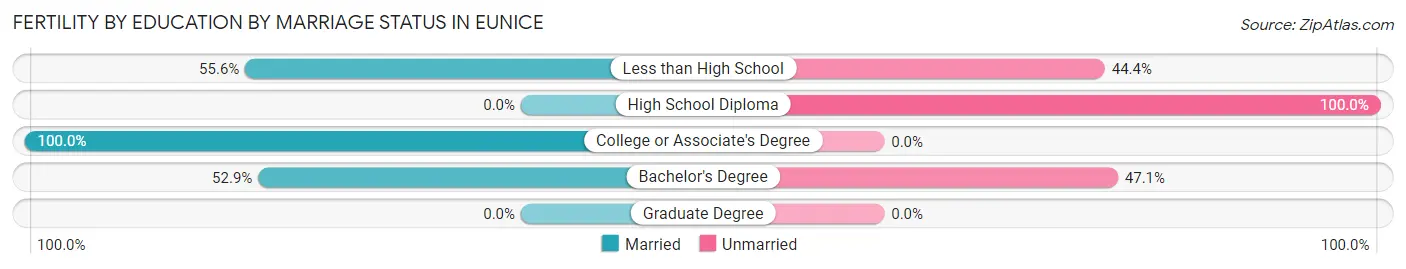
Fertility by Education by Marriage Status in Eunice
64.2% of women with births in Eunice are unmarried. Women with the educational attainment of college or associate's degree are most likely to be married with 100.0% of them married at childbirth, while women with the educational attainment of high school diploma are least likely to be married with 100.0% of them unmarried at childbirth.
| Educational Attainment | Married | Unmarried |
| Less than High School | 25 (55.6%) | 20 (44.4%) |
| High School Diploma | 0 (0.0%) | 49 (100.0%) |
| College or Associate's Degree | 9 (100.0%) | 0 (0.0%) |
| Bachelor's Degree | 9 (52.9%) | 8 (47.1%) |
| Graduate Degree | 0 (0.0%) | 0 (0.0%) |
| Total | 43 (35.8%) | 77 (64.2%) |
Employment Characteristics in Eunice
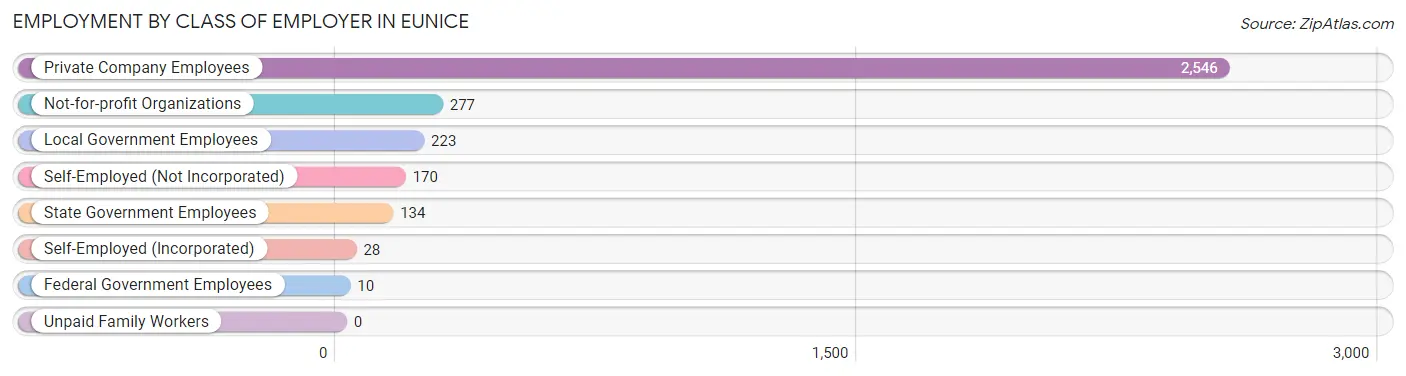
Employment by Class of Employer in Eunice
Among the 3,388 employed individuals in Eunice, private company employees (2,546 | 75.1%), not-for-profit organizations (277 | 8.2%), and local government employees (223 | 6.6%) make up the most common classes of employment.
| Employer Class | # Employees | % Employees |
| Private Company Employees | 2,546 | 75.1% |
| Self-Employed (Incorporated) | 28 | 0.8% |
| Self-Employed (Not Incorporated) | 170 | 5.0% |
| Not-for-profit Organizations | 277 | 8.2% |
| Local Government Employees | 223 | 6.6% |
| State Government Employees | 134 | 4.0% |
| Federal Government Employees | 10 | 0.3% |
| Unpaid Family Workers | 0 | 0.0% |
| Total | 3,388 | 100.0% |
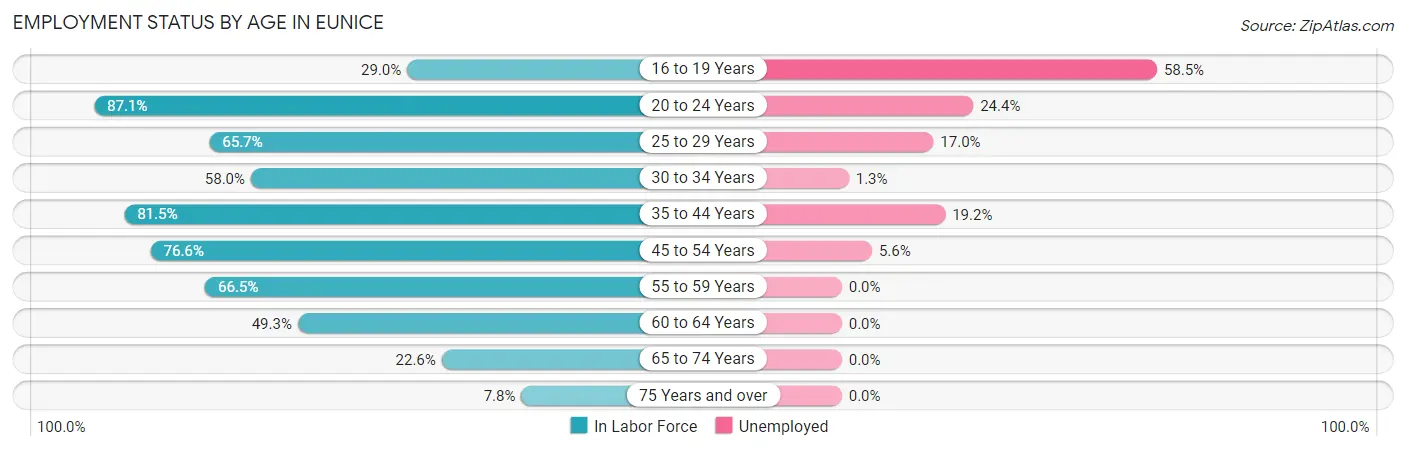
Employment Status by Age in Eunice
According to the labor force statistics for Eunice, out of the total population over 16 years of age (7,126), 57.4% or 4,090 individuals are in the labor force, with 12.6% or 515 of them unemployed. The age group with the highest labor force participation rate is 20 to 24 years, with 87.1% or 734 individuals in the labor force. Within the labor force, the 16 to 19 years age range has the highest percentage of unemployed individuals, with 58.5% or 76 of them being unemployed.
| Age Bracket | In Labor Force | Unemployed |
| 16 to 19 Years | 130 (29.0%) | 76 (58.5%) |
| 20 to 24 Years | 734 (87.1%) | 179 (24.4%) |
| 25 to 29 Years | 241 (65.7%) | 41 (17.0%) |
| 30 to 34 Years | 395 (58.0%) | 5 (1.3%) |
| 35 to 44 Years | 814 (81.5%) | 156 (19.2%) |
| 45 to 54 Years | 1,017 (76.6%) | 57 (5.6%) |
| 55 to 59 Years | 280 (66.5%) | 0 (0.0%) |
| 60 to 64 Years | 235 (49.3%) | 0 (0.0%) |
| 65 to 74 Years | 188 (22.6%) | 0 (0.0%) |
| 75 Years and over | 57 (7.8%) | 0 (0.0%) |
| Total | 4,090 (57.4%) | 515 (12.6%) |
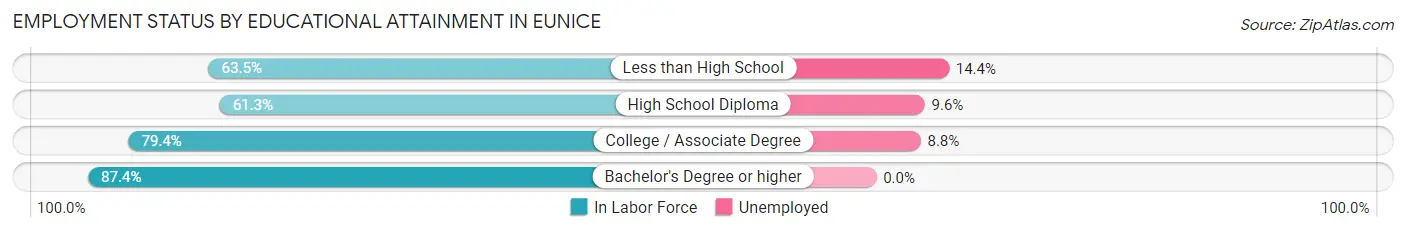
Employment Status by Educational Attainment in Eunice
According to labor force statistics for Eunice, 69.8% of individuals (2,983) out of the total population between 25 and 64 years of age (4,273) are in the labor force, with 8.7% or 260 of them being unemployed. The group with the highest labor force participation rate are those with the educational attainment of bachelor's degree or higher, with 87.4% or 550 individuals in the labor force. Within the labor force, individuals with less than high school education have the highest percentage of unemployment, with 14.4% or 95 of them being unemployed.
| Educational Attainment | In Labor Force | Unemployed |
| Less than High School | 659 (63.5%) | 149 (14.4%) |
| High School Diploma | 1,000 (61.3%) | 157 (9.6%) |
| College / Associate Degree | 773 (79.4%) | 86 (8.8%) |
| Bachelor's Degree or higher | 550 (87.4%) | 0 (0.0%) |
| Total | 2,983 (69.8%) | 372 (8.7%) |
Employment Occupations by Sex in Eunice
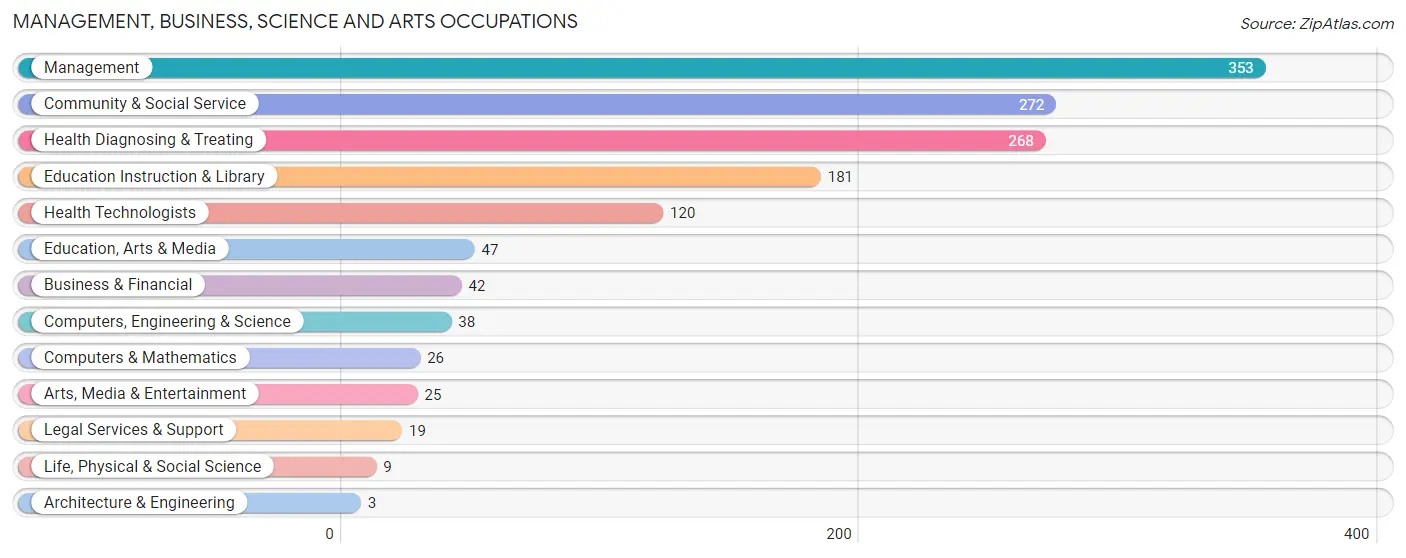
Management, Business, Science and Arts Occupations
The most common Management, Business, Science and Arts occupations in Eunice are Management (353 | 9.9%), Community & Social Service (272 | 7.6%), Health Diagnosing & Treating (268 | 7.5%), Education Instruction & Library (181 | 5.1%), and Health Technologists (120 | 3.4%).
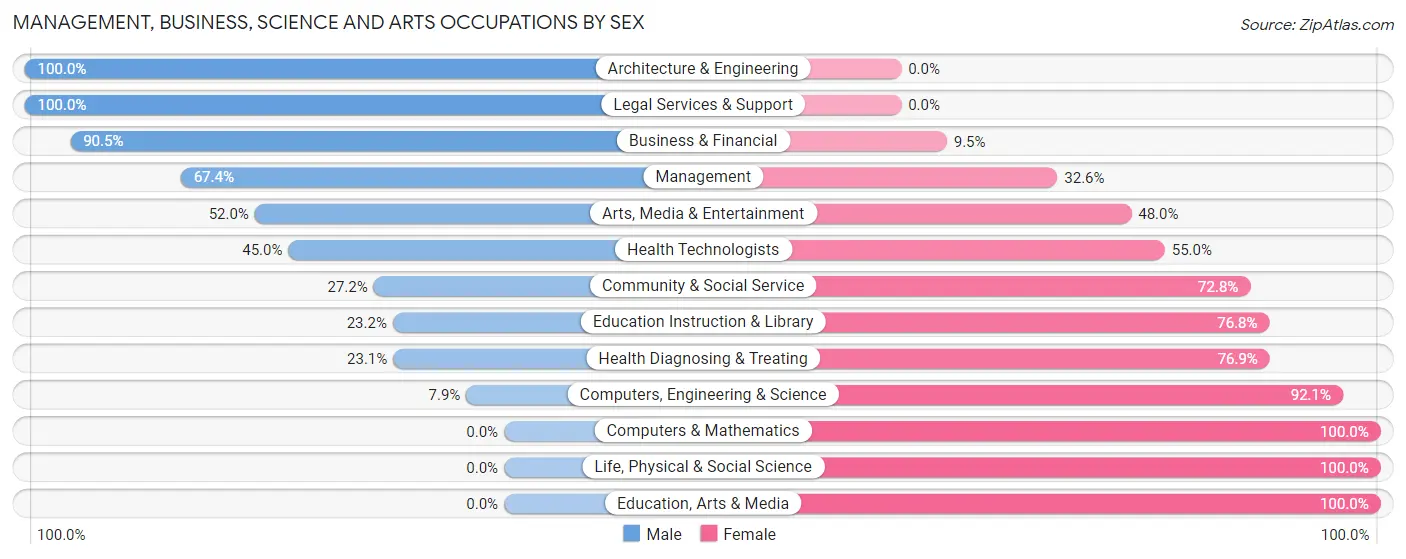
Management, Business, Science and Arts Occupations by Sex
Within the Management, Business, Science and Arts occupations in Eunice, the most male-oriented occupations are Architecture & Engineering (100.0%), Legal Services & Support (100.0%), and Business & Financial (90.5%), while the most female-oriented occupations are Computers & Mathematics (100.0%), Life, Physical & Social Science (100.0%), and Education, Arts & Media (100.0%).
| Occupation | Male | Female |
| Management | 238 (67.4%) | 115 (32.6%) |
| Business & Financial | 38 (90.5%) | 4 (9.5%) |
| Computers, Engineering & Science | 3 (7.9%) | 35 (92.1%) |
| Computers & Mathematics | 0 (0.0%) | 26 (100.0%) |
| Architecture & Engineering | 3 (100.0%) | 0 (0.0%) |
| Life, Physical & Social Science | 0 (0.0%) | 9 (100.0%) |
| Community & Social Service | 74 (27.2%) | 198 (72.8%) |
| Education, Arts & Media | 0 (0.0%) | 47 (100.0%) |
| Legal Services & Support | 19 (100.0%) | 0 (0.0%) |
| Education Instruction & Library | 42 (23.2%) | 139 (76.8%) |
| Arts, Media & Entertainment | 13 (52.0%) | 12 (48.0%) |
| Health Diagnosing & Treating | 62 (23.1%) | 206 (76.9%) |
| Health Technologists | 54 (45.0%) | 66 (55.0%) |
| Total (Category) | 415 (42.6%) | 558 (57.4%) |
| Total (Overall) | 1,753 (49.0%) | 1,824 (51.0%) |
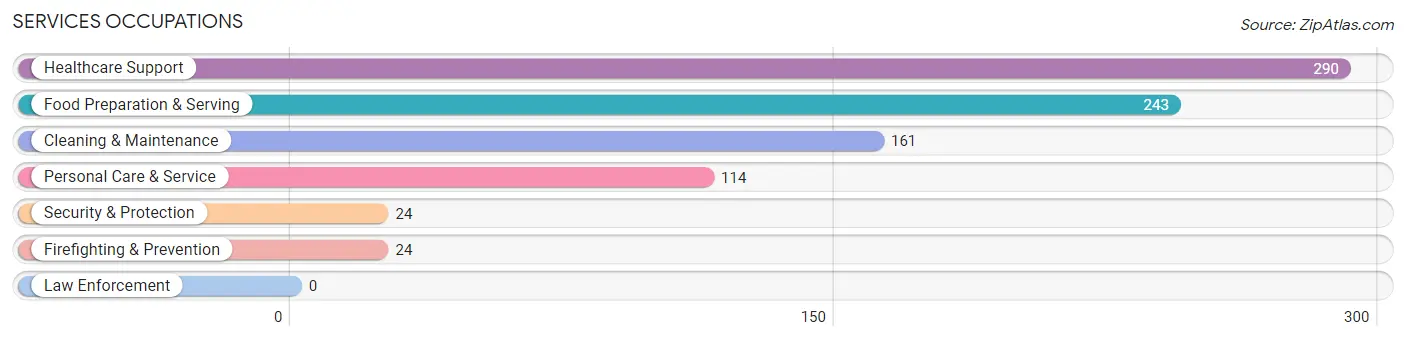
Services Occupations
The most common Services occupations in Eunice are Healthcare Support (290 | 8.1%), Food Preparation & Serving (243 | 6.8%), Cleaning & Maintenance (161 | 4.5%), Personal Care & Service (114 | 3.2%), and Security & Protection (24 | 0.7%).
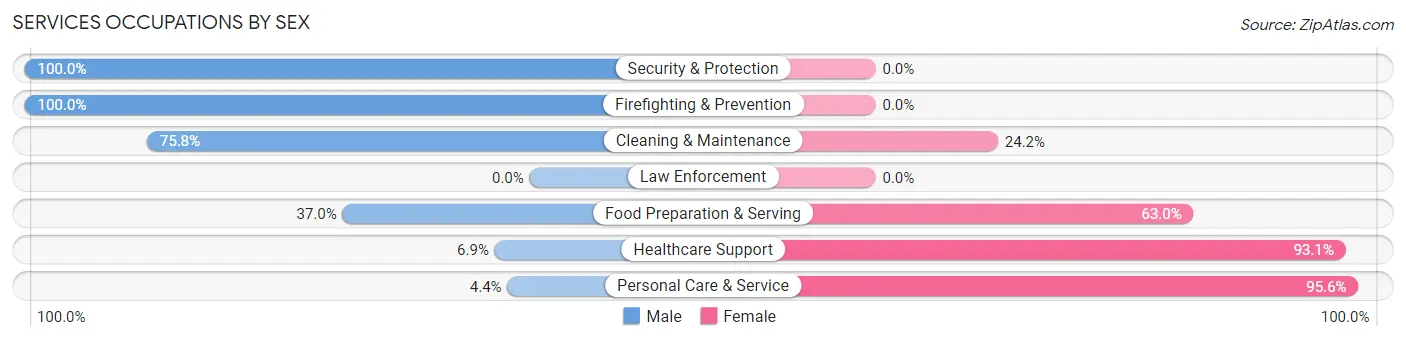
Services Occupations by Sex
Within the Services occupations in Eunice, the most male-oriented occupations are Security & Protection (100.0%), Firefighting & Prevention (100.0%), and Cleaning & Maintenance (75.8%), while the most female-oriented occupations are Personal Care & Service (95.6%), Healthcare Support (93.1%), and Food Preparation & Serving (63.0%).
| Occupation | Male | Female |
| Healthcare Support | 20 (6.9%) | 270 (93.1%) |
| Security & Protection | 24 (100.0%) | 0 (0.0%) |
| Firefighting & Prevention | 24 (100.0%) | 0 (0.0%) |
| Law Enforcement | 0 (0.0%) | 0 (0.0%) |
| Food Preparation & Serving | 90 (37.0%) | 153 (63.0%) |
| Cleaning & Maintenance | 122 (75.8%) | 39 (24.2%) |
| Personal Care & Service | 5 (4.4%) | 109 (95.6%) |
| Total (Category) | 261 (31.4%) | 571 (68.6%) |
| Total (Overall) | 1,753 (49.0%) | 1,824 (51.0%) |
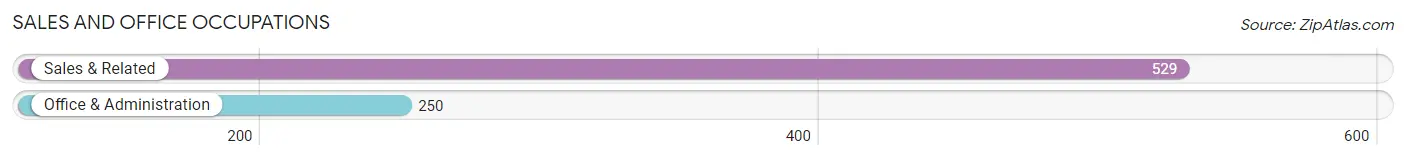
Sales and Office Occupations
The most common Sales and Office occupations in Eunice are Sales & Related (529 | 14.8%), and Office & Administration (250 | 7.0%).
Sales and Office Occupations by Sex
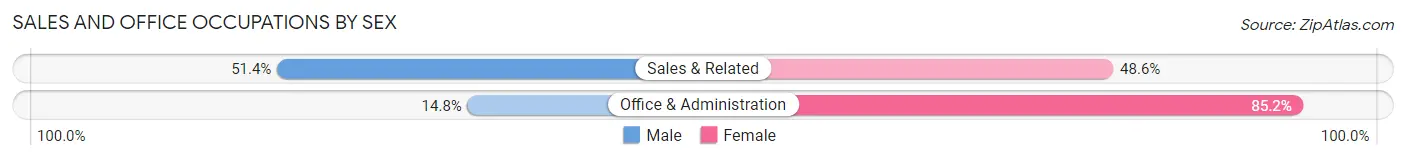
| Occupation | Male | Female |
| Sales & Related | 272 (51.4%) | 257 (48.6%) |
| Office & Administration | 37 (14.8%) | 213 (85.2%) |
| Total (Category) | 309 (39.7%) | 470 (60.3%) |
| Total (Overall) | 1,753 (49.0%) | 1,824 (51.0%) |
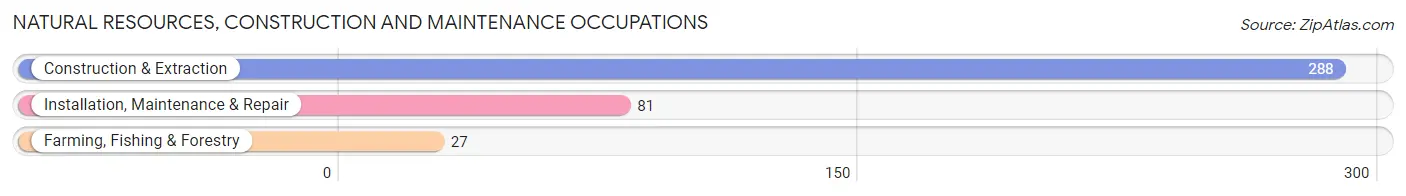
Natural Resources, Construction and Maintenance Occupations
The most common Natural Resources, Construction and Maintenance occupations in Eunice are Construction & Extraction (288 | 8.1%), Installation, Maintenance & Repair (81 | 2.3%), and Farming, Fishing & Forestry (27 | 0.7%).
Natural Resources, Construction and Maintenance Occupations by Sex
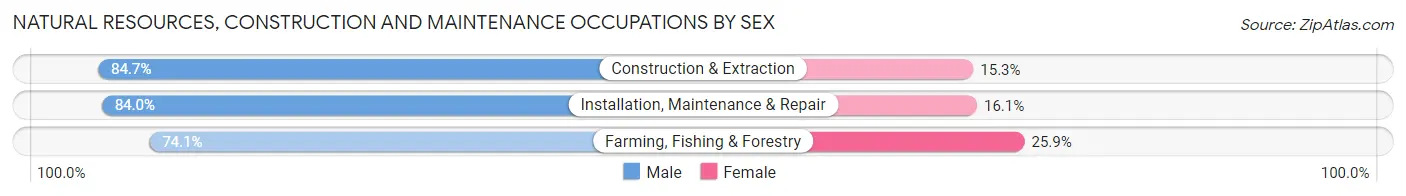
| Occupation | Male | Female |
| Farming, Fishing & Forestry | 20 (74.1%) | 7 (25.9%) |
| Construction & Extraction | 244 (84.7%) | 44 (15.3%) |
| Installation, Maintenance & Repair | 68 (84.0%) | 13 (16.1%) |
| Total (Category) | 332 (83.8%) | 64 (16.2%) |
| Total (Overall) | 1,753 (49.0%) | 1,824 (51.0%) |
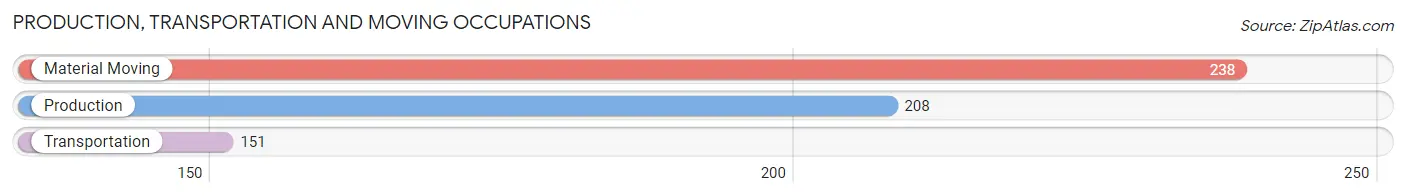
Production, Transportation and Moving Occupations
The most common Production, Transportation and Moving occupations in Eunice are Material Moving (238 | 6.7%), Production (208 | 5.8%), and Transportation (151 | 4.2%).
Production, Transportation and Moving Occupations by Sex
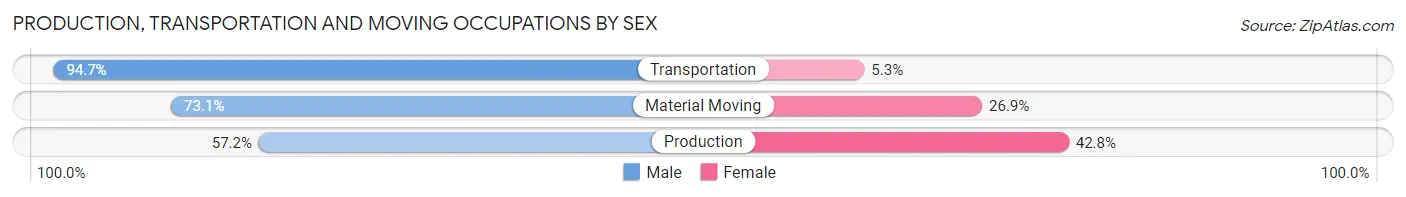
| Occupation | Male | Female |
| Production | 119 (57.2%) | 89 (42.8%) |
| Transportation | 143 (94.7%) | 8 (5.3%) |
| Material Moving | 174 (73.1%) | 64 (26.9%) |
| Total (Category) | 436 (73.0%) | 161 (27.0%) |
| Total (Overall) | 1,753 (49.0%) | 1,824 (51.0%) |
Employment Industries by Sex in Eunice
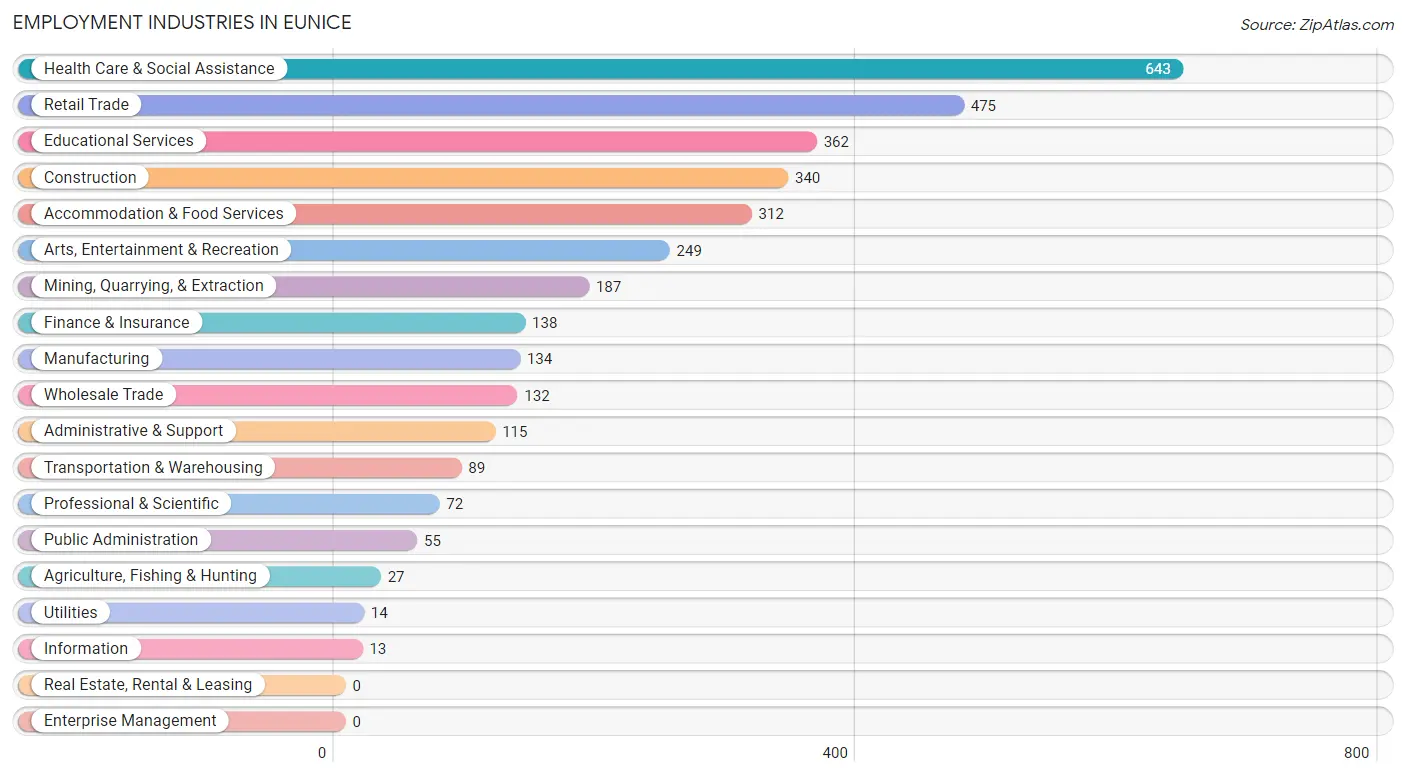
Employment Industries in Eunice
The major employment industries in Eunice include Health Care & Social Assistance (643 | 18.0%), Retail Trade (475 | 13.3%), Educational Services (362 | 10.1%), Construction (340 | 9.5%), and Accommodation & Food Services (312 | 8.7%).
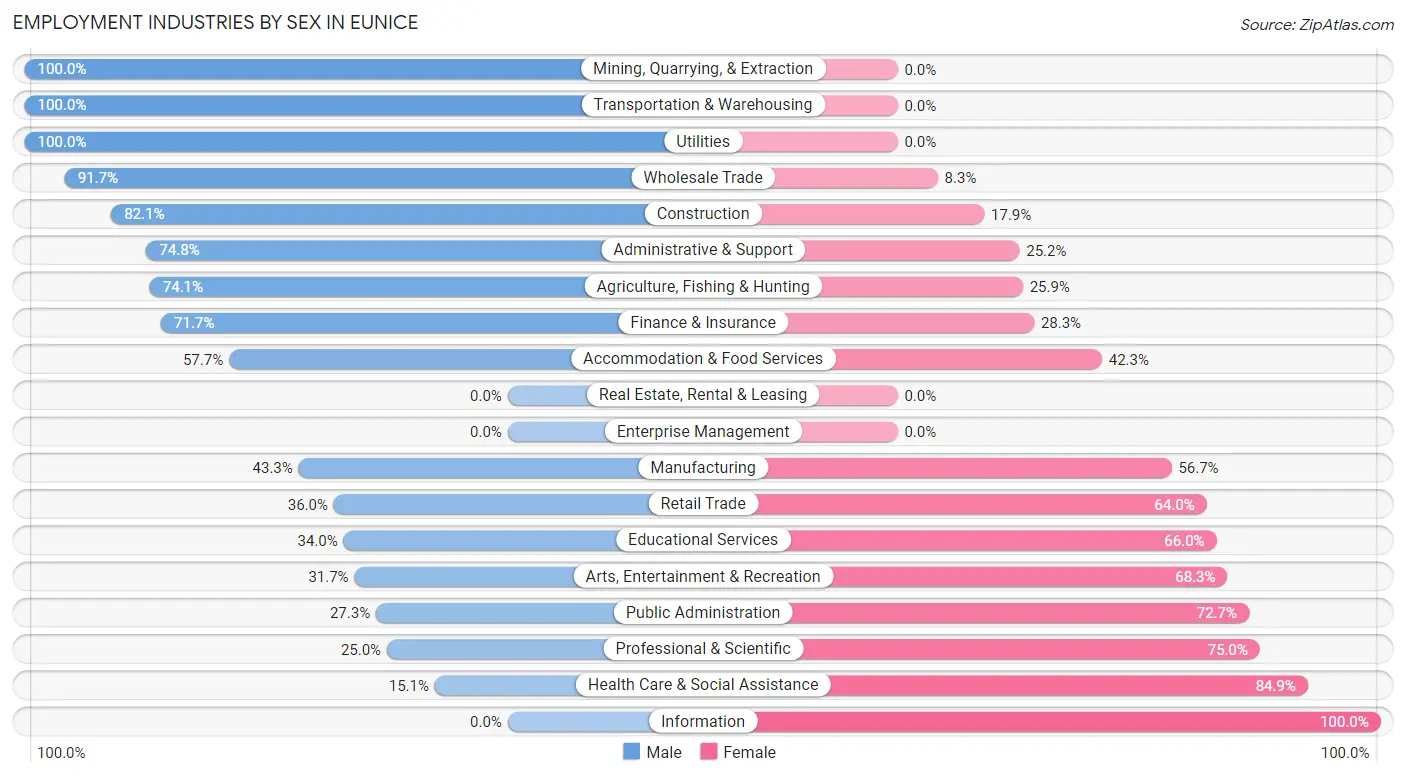
Employment Industries by Sex in Eunice
The Eunice industries that see more men than women are Mining, Quarrying, & Extraction (100.0%), Transportation & Warehousing (100.0%), and Utilities (100.0%), whereas the industries that tend to have a higher number of women are Information (100.0%), Health Care & Social Assistance (84.9%), and Professional & Scientific (75.0%).
| Industry | Male | Female |
| Agriculture, Fishing & Hunting | 20 (74.1%) | 7 (25.9%) |
| Mining, Quarrying, & Extraction | 187 (100.0%) | 0 (0.0%) |
| Construction | 279 (82.1%) | 61 (17.9%) |
| Manufacturing | 58 (43.3%) | 76 (56.7%) |
| Wholesale Trade | 121 (91.7%) | 11 (8.3%) |
| Retail Trade | 171 (36.0%) | 304 (64.0%) |
| Transportation & Warehousing | 89 (100.0%) | 0 (0.0%) |
| Utilities | 14 (100.0%) | 0 (0.0%) |
| Information | 0 (0.0%) | 13 (100.0%) |
| Finance & Insurance | 99 (71.7%) | 39 (28.3%) |
| Real Estate, Rental & Leasing | 0 (0.0%) | 0 (0.0%) |
| Professional & Scientific | 18 (25.0%) | 54 (75.0%) |
| Enterprise Management | 0 (0.0%) | 0 (0.0%) |
| Administrative & Support | 86 (74.8%) | 29 (25.2%) |
| Educational Services | 123 (34.0%) | 239 (66.0%) |
| Health Care & Social Assistance | 97 (15.1%) | 546 (84.9%) |
| Arts, Entertainment & Recreation | 79 (31.7%) | 170 (68.3%) |
| Accommodation & Food Services | 180 (57.7%) | 132 (42.3%) |
| Public Administration | 15 (27.3%) | 40 (72.7%) |
| Total | 1,753 (49.0%) | 1,824 (51.0%) |
Education in Eunice
School Enrollment in Eunice
The most common levels of schooling among the 2,125 students in Eunice are elementary school (759 | 35.7%), middle school (628 | 29.5%), and high school (353 | 16.6%).
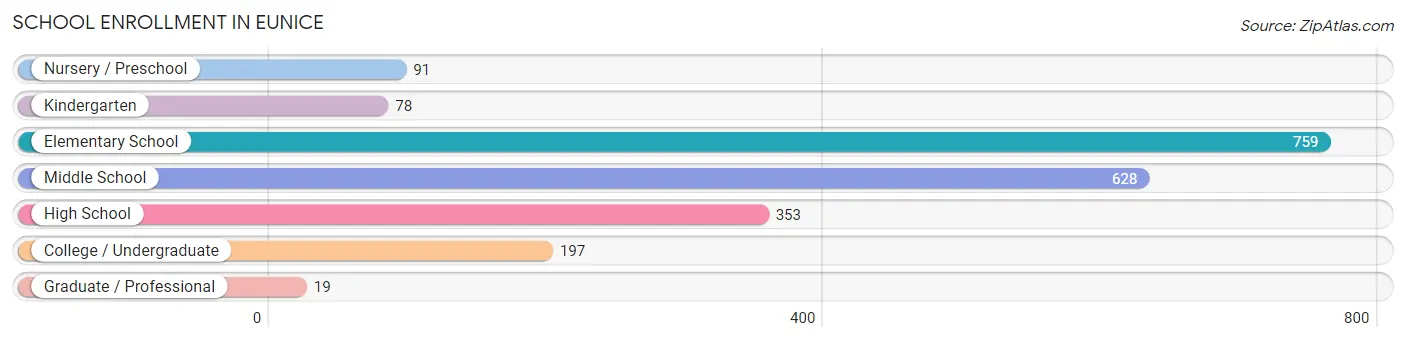
| School Level | # Students | % Students |
| Nursery / Preschool | 91 | 4.3% |
| Kindergarten | 78 | 3.7% |
| Elementary School | 759 | 35.7% |
| Middle School | 628 | 29.5% |
| High School | 353 | 16.6% |
| College / Undergraduate | 197 | 9.3% |
| Graduate / Professional | 19 | 0.9% |
| Total | 2,125 | 100.0% |
School Enrollment by Age by Funding Source in Eunice
Out of a total of 2,125 students who are enrolled in schools in Eunice, 249 (11.7%) attend a private institution, while the remaining 1,876 (88.3%) are enrolled in public schools. The age group of 25 to 34 year olds has the highest likelihood of being enrolled in private schools, with 11 (91.7% in the age bracket) enrolled. Conversely, the age group of 5 to 9 year old has the lowest likelihood of being enrolled in a private school, with 618 (100.0% in the age bracket) attending a public institution.
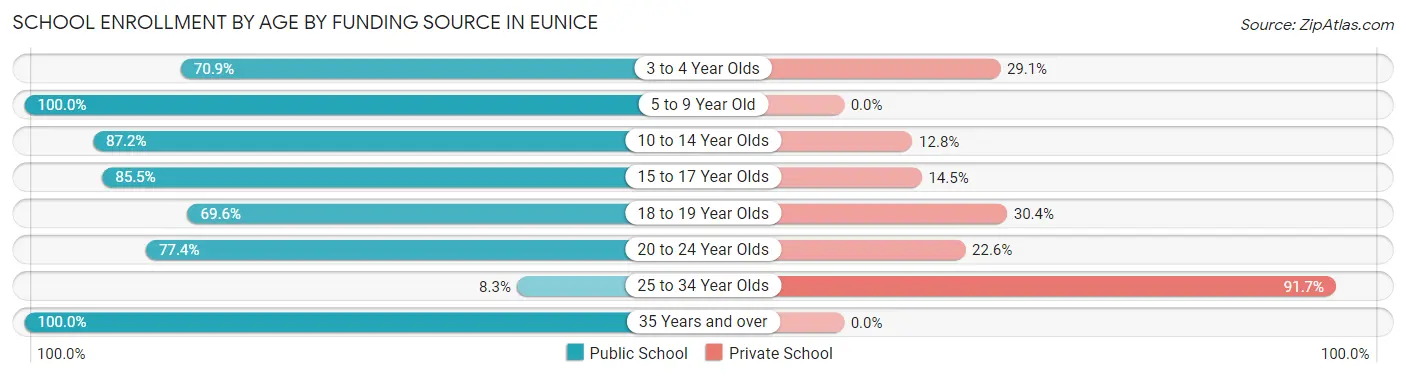
| Age Bracket | Public School | Private School |
| 3 to 4 Year Olds | 56 (70.9%) | 23 (29.1%) |
| 5 to 9 Year Old | 618 (100.0%) | 0 (0.0%) |
| 10 to 14 Year Olds | 766 (87.2%) | 112 (12.8%) |
| 15 to 17 Year Olds | 236 (85.5%) | 40 (14.5%) |
| 18 to 19 Year Olds | 55 (69.6%) | 24 (30.4%) |
| 20 to 24 Year Olds | 130 (77.4%) | 38 (22.6%) |
| 25 to 34 Year Olds | 1 (8.3%) | 11 (91.7%) |
| 35 Years and over | 15 (100.0%) | 0 (0.0%) |
| Total | 1,876 (88.3%) | 249 (11.7%) |
Educational Attainment by Field of Study in Eunice
Education (245 | 25.8%), science & technology (180 | 18.9%), business (174 | 18.3%), social sciences (114 | 12.0%), and liberal arts & history (83 | 8.7%) are the most common fields of study among 951 individuals in Eunice who have obtained a bachelor's degree or higher.
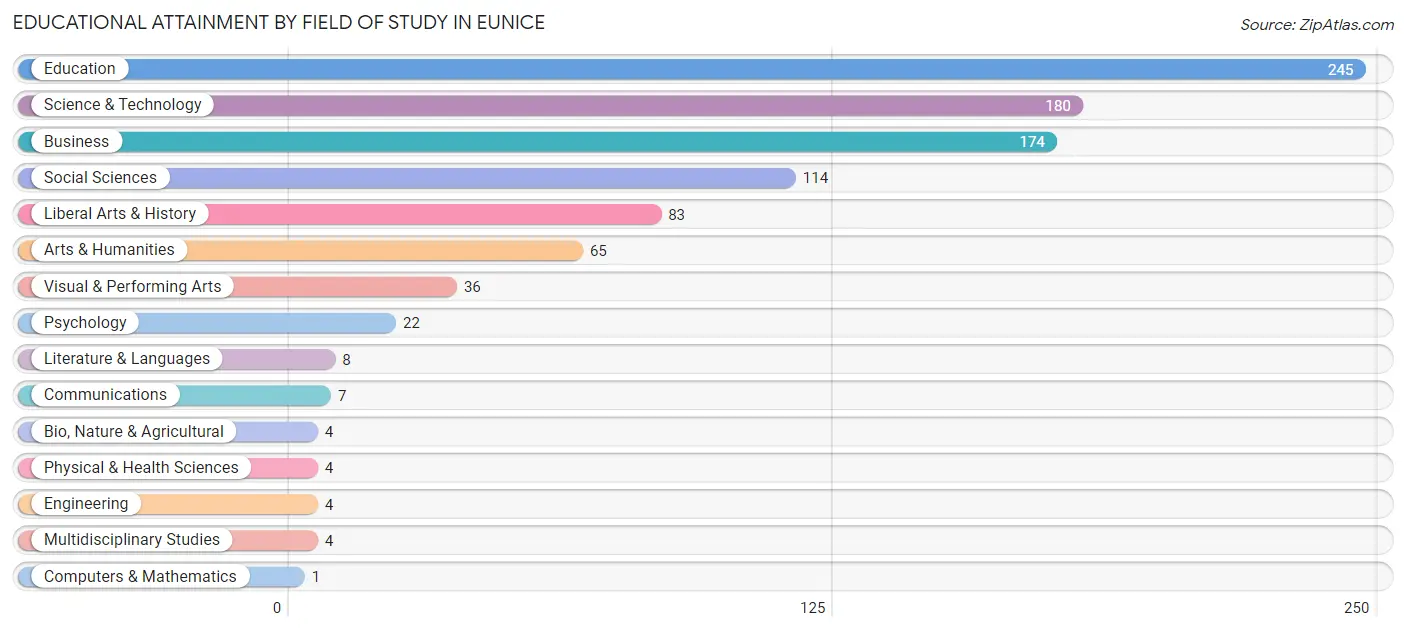
| Field of Study | # Graduates | % Graduates |
| Computers & Mathematics | 1 | 0.1% |
| Bio, Nature & Agricultural | 4 | 0.4% |
| Physical & Health Sciences | 4 | 0.4% |
| Psychology | 22 | 2.3% |
| Social Sciences | 114 | 12.0% |
| Engineering | 4 | 0.4% |
| Multidisciplinary Studies | 4 | 0.4% |
| Science & Technology | 180 | 18.9% |
| Business | 174 | 18.3% |
| Education | 245 | 25.8% |
| Literature & Languages | 8 | 0.8% |
| Liberal Arts & History | 83 | 8.7% |
| Visual & Performing Arts | 36 | 3.8% |
| Communications | 7 | 0.7% |
| Arts & Humanities | 65 | 6.8% |
| Total | 951 | 100.0% |
Transportation & Commute in Eunice
Vehicle Availability by Sex in Eunice
The most prevalent vehicle ownership categories in Eunice are males with 2 vehicles (703, accounting for 41.2%) and females with 2 vehicles (452, making up 41.9%).
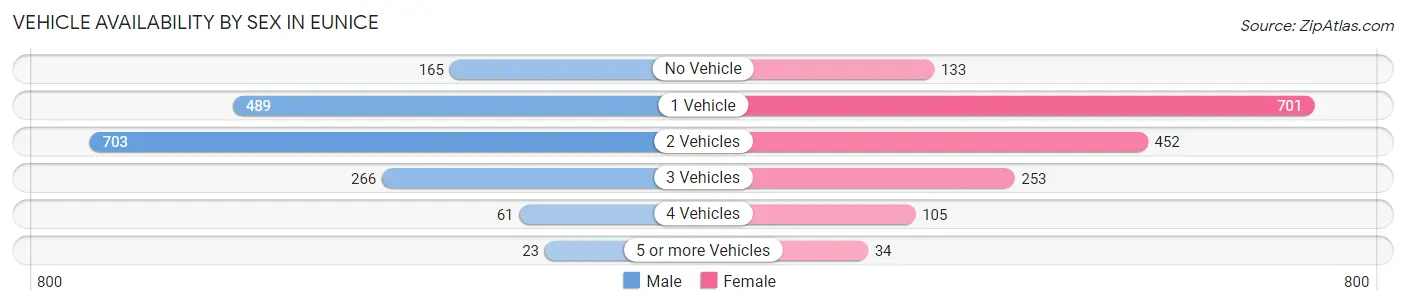
| Vehicles Available | Male | Female |
| No Vehicle | 165 (9.7%) | 133 (7.9%) |
| 1 Vehicle | 489 (28.6%) | 701 (41.8%) |
| 2 Vehicles | 703 (41.2%) | 452 (26.9%) |
| 3 Vehicles | 266 (15.6%) | 253 (15.1%) |
| 4 Vehicles | 61 (3.6%) | 105 (6.3%) |
| 5 or more Vehicles | 23 (1.3%) | 34 (2.0%) |
| Total | 1,707 (100.0%) | 1,678 (100.0%) |
Commute Time in Eunice
The most frequently occuring commute durations in Eunice are 5 to 9 minutes (697 commuters, 21.1%), 10 to 14 minutes (497 commuters, 15.1%), and 20 to 24 minutes (429 commuters, 13.0%).
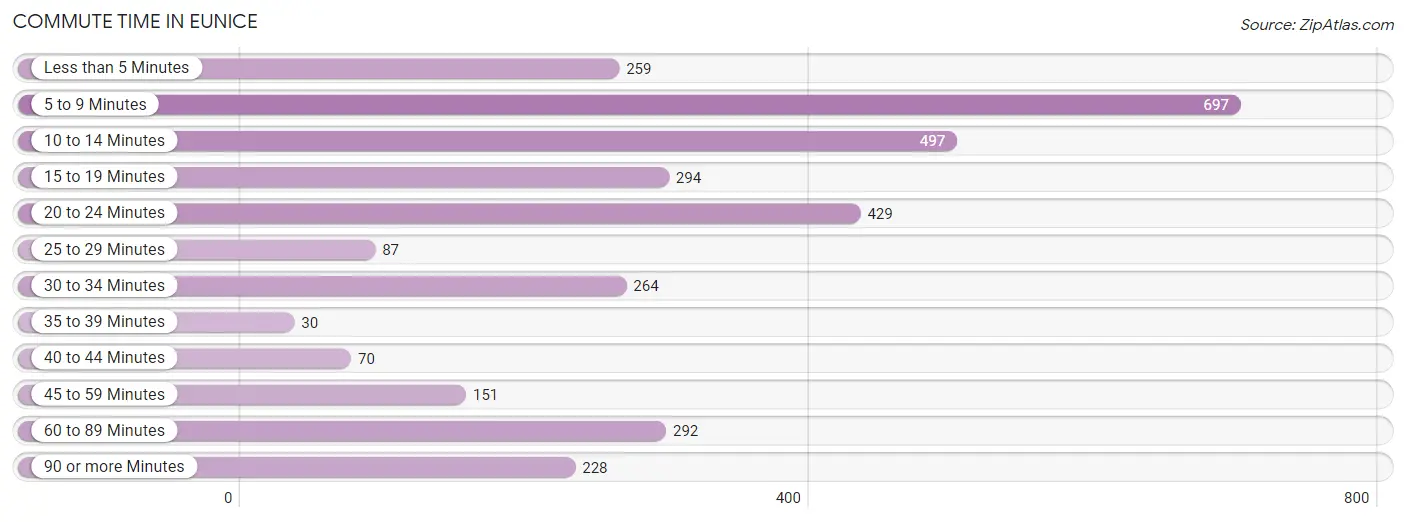
| Commute Time | # Commuters | % Commuters |
| Less than 5 Minutes | 259 | 7.9% |
| 5 to 9 Minutes | 697 | 21.1% |
| 10 to 14 Minutes | 497 | 15.1% |
| 15 to 19 Minutes | 294 | 8.9% |
| 20 to 24 Minutes | 429 | 13.0% |
| 25 to 29 Minutes | 87 | 2.6% |
| 30 to 34 Minutes | 264 | 8.0% |
| 35 to 39 Minutes | 30 | 0.9% |
| 40 to 44 Minutes | 70 | 2.1% |
| 45 to 59 Minutes | 151 | 4.6% |
| 60 to 89 Minutes | 292 | 8.8% |
| 90 or more Minutes | 228 | 6.9% |
Commute Time by Sex in Eunice
The most common commute times in Eunice are 10 to 14 minutes (285 commuters, 16.8%) for males and 5 to 9 minutes (475 commuters, 29.8%) for females.
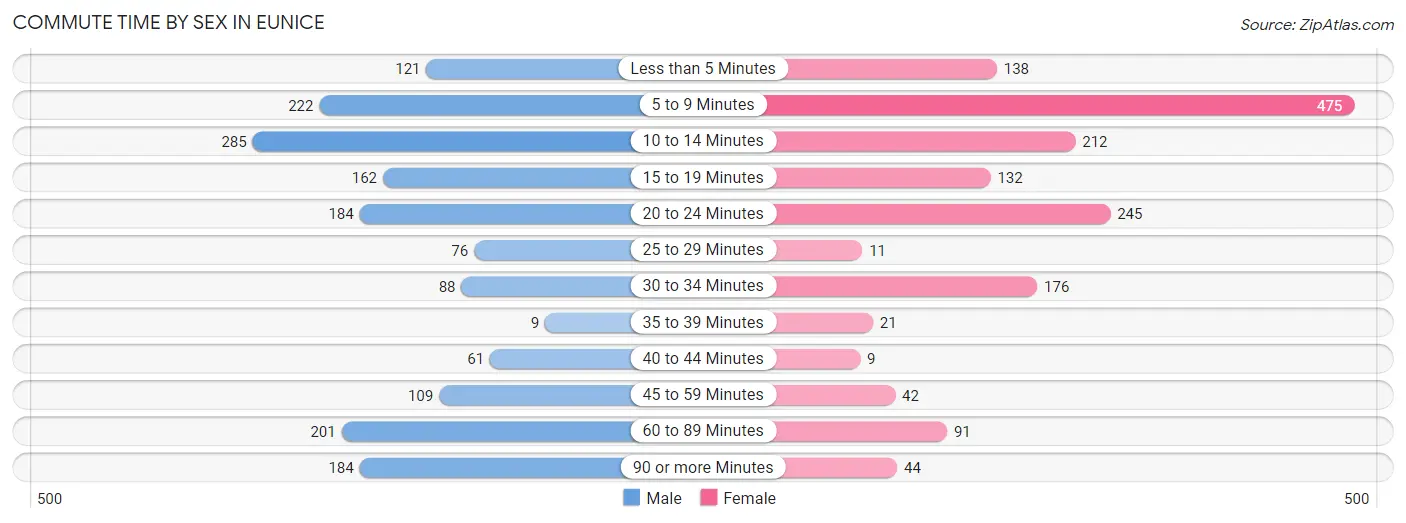
| Commute Time | Male | Female |
| Less than 5 Minutes | 121 (7.1%) | 138 (8.6%) |
| 5 to 9 Minutes | 222 (13.0%) | 475 (29.8%) |
| 10 to 14 Minutes | 285 (16.8%) | 212 (13.3%) |
| 15 to 19 Minutes | 162 (9.5%) | 132 (8.3%) |
| 20 to 24 Minutes | 184 (10.8%) | 245 (15.3%) |
| 25 to 29 Minutes | 76 (4.5%) | 11 (0.7%) |
| 30 to 34 Minutes | 88 (5.2%) | 176 (11.0%) |
| 35 to 39 Minutes | 9 (0.5%) | 21 (1.3%) |
| 40 to 44 Minutes | 61 (3.6%) | 9 (0.6%) |
| 45 to 59 Minutes | 109 (6.4%) | 42 (2.6%) |
| 60 to 89 Minutes | 201 (11.8%) | 91 (5.7%) |
| 90 or more Minutes | 184 (10.8%) | 44 (2.8%) |
Time of Departure to Work by Sex in Eunice
The most frequent times of departure to work in Eunice are 12:00 AM to 4:59 AM (320, 18.8%) for males and 7:00 AM to 7:29 AM (315, 19.7%) for females.
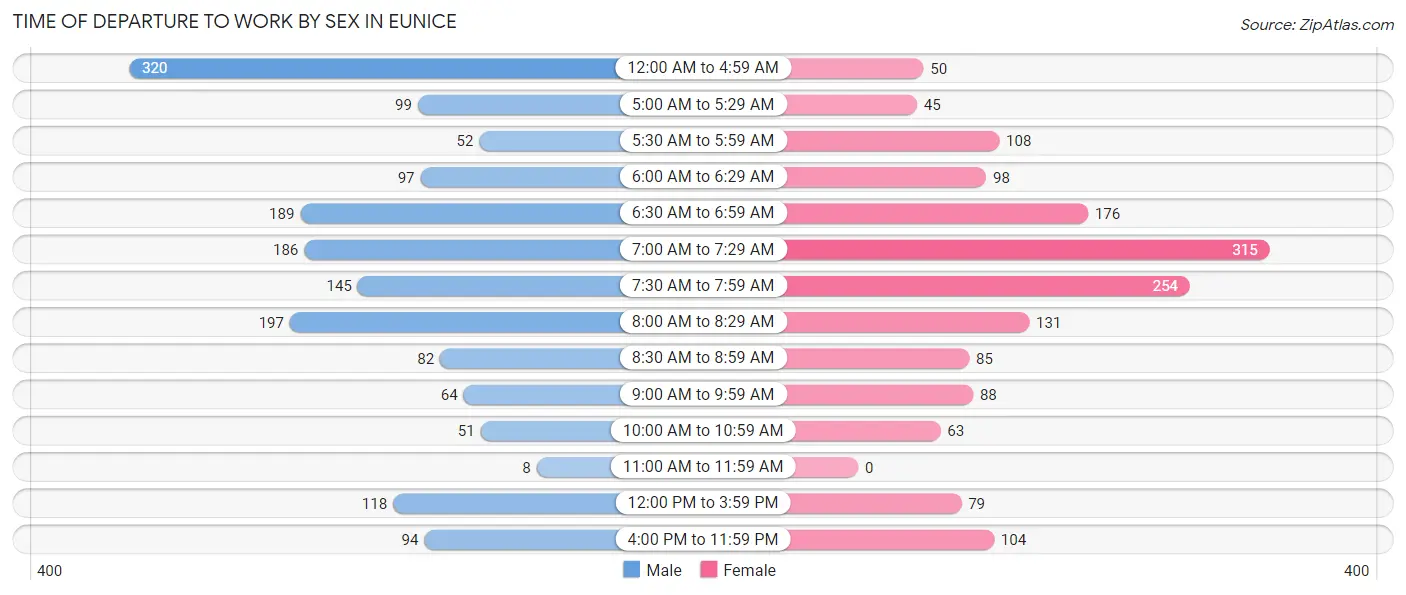
| Time of Departure | Male | Female |
| 12:00 AM to 4:59 AM | 320 (18.8%) | 50 (3.1%) |
| 5:00 AM to 5:29 AM | 99 (5.8%) | 45 (2.8%) |
| 5:30 AM to 5:59 AM | 52 (3.1%) | 108 (6.8%) |
| 6:00 AM to 6:29 AM | 97 (5.7%) | 98 (6.1%) |
| 6:30 AM to 6:59 AM | 189 (11.1%) | 176 (11.0%) |
| 7:00 AM to 7:29 AM | 186 (10.9%) | 315 (19.7%) |
| 7:30 AM to 7:59 AM | 145 (8.5%) | 254 (15.9%) |
| 8:00 AM to 8:29 AM | 197 (11.6%) | 131 (8.2%) |
| 8:30 AM to 8:59 AM | 82 (4.8%) | 85 (5.3%) |
| 9:00 AM to 9:59 AM | 64 (3.8%) | 88 (5.5%) |
| 10:00 AM to 10:59 AM | 51 (3.0%) | 63 (4.0%) |
| 11:00 AM to 11:59 AM | 8 (0.5%) | 0 (0.0%) |
| 12:00 PM to 3:59 PM | 118 (6.9%) | 79 (5.0%) |
| 4:00 PM to 11:59 PM | 94 (5.5%) | 104 (6.5%) |
| Total | 1,702 (100.0%) | 1,596 (100.0%) |
Housing Occupancy in Eunice
Occupancy by Ownership in Eunice
Of the total 3,771 dwellings in Eunice, owner-occupied units account for 1,913 (50.7%), while renter-occupied units make up 1,858 (49.3%).
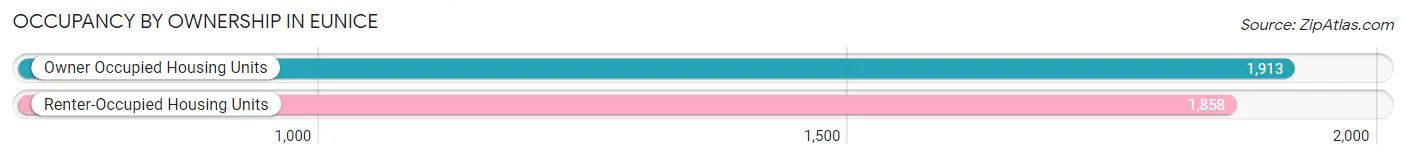
| Occupancy | # Housing Units | % Housing Units |
| Owner Occupied Housing Units | 1,913 | 50.7% |
| Renter-Occupied Housing Units | 1,858 | 49.3% |
| Total Occupied Housing Units | 3,771 | 100.0% |
Occupancy by Household Size in Eunice
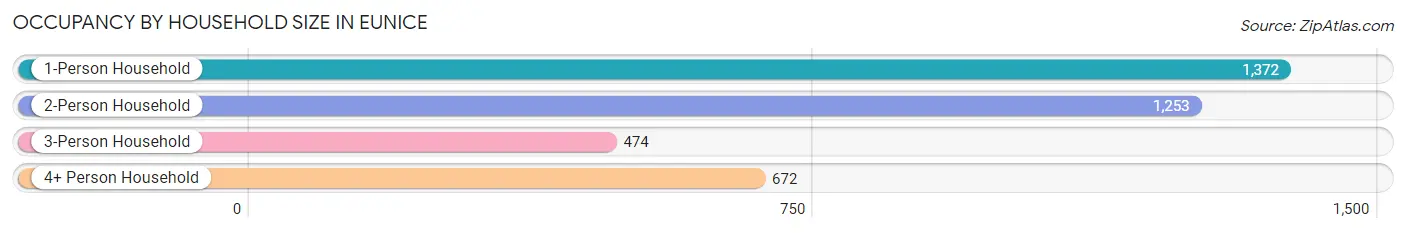
| Household Size | # Housing Units | % Housing Units |
| 1-Person Household | 1,372 | 36.4% |
| 2-Person Household | 1,253 | 33.2% |
| 3-Person Household | 474 | 12.6% |
| 4+ Person Household | 672 | 17.8% |
| Total Housing Units | 3,771 | 100.0% |
Occupancy by Ownership by Household Size in Eunice
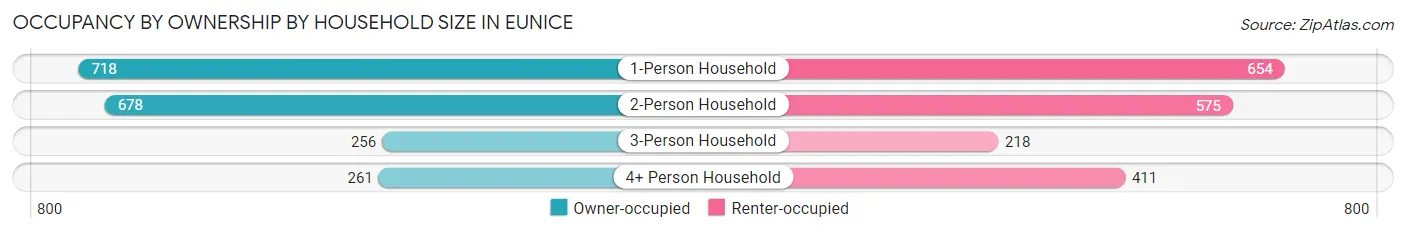
| Household Size | Owner-occupied | Renter-occupied |
| 1-Person Household | 718 (52.3%) | 654 (47.7%) |
| 2-Person Household | 678 (54.1%) | 575 (45.9%) |
| 3-Person Household | 256 (54.0%) | 218 (46.0%) |
| 4+ Person Household | 261 (38.8%) | 411 (61.2%) |
| Total Housing Units | 1,913 (50.7%) | 1,858 (49.3%) |
Occupancy by Educational Attainment in Eunice
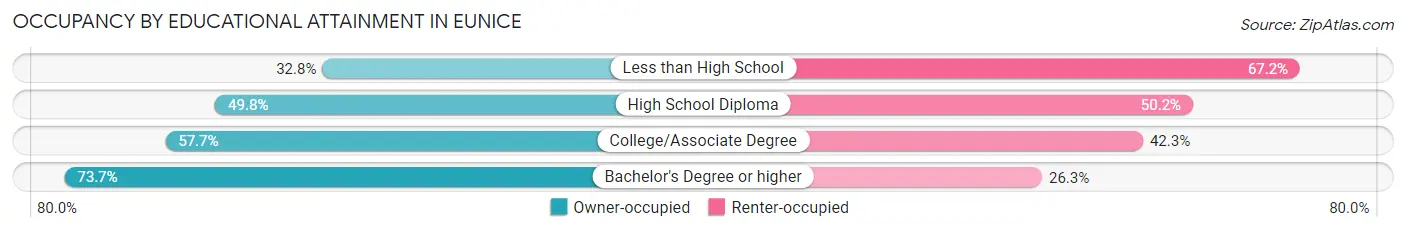
| Household Size | Owner-occupied | Renter-occupied |
| Less than High School | 320 (32.8%) | 656 (67.2%) |
| High School Diploma | 661 (49.8%) | 667 (50.2%) |
| College/Associate Degree | 537 (57.7%) | 394 (42.3%) |
| Bachelor's Degree or higher | 395 (73.7%) | 141 (26.3%) |
Occupancy by Age of Householder in Eunice
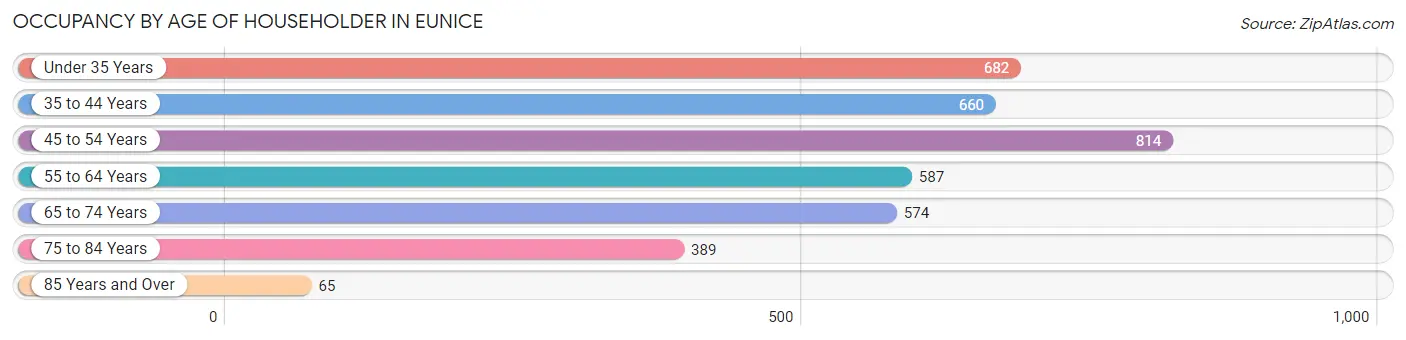
| Age Bracket | # Households | % Households |
| Under 35 Years | 682 | 18.1% |
| 35 to 44 Years | 660 | 17.5% |
| 45 to 54 Years | 814 | 21.6% |
| 55 to 64 Years | 587 | 15.6% |
| 65 to 74 Years | 574 | 15.2% |
| 75 to 84 Years | 389 | 10.3% |
| 85 Years and Over | 65 | 1.7% |
| Total | 3,771 | 100.0% |
Housing Finances in Eunice
Median Income by Occupancy in Eunice
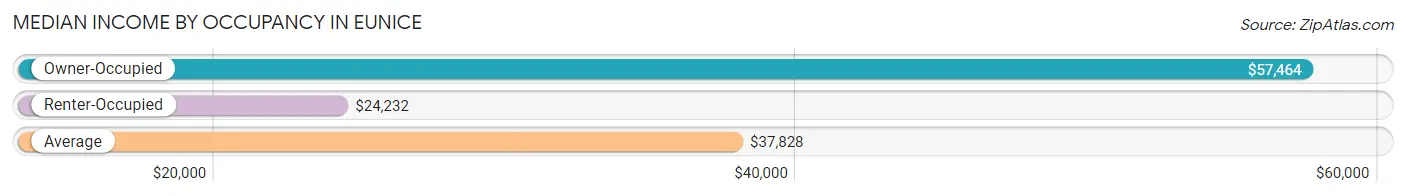
| Occupancy Type | # Households | Median Income |
| Owner-Occupied | 1,913 (50.7%) | $57,464 |
| Renter-Occupied | 1,858 (49.3%) | $24,232 |
| Average | 3,771 (100.0%) | $37,828 |
Occupancy by Householder Income Bracket in Eunice
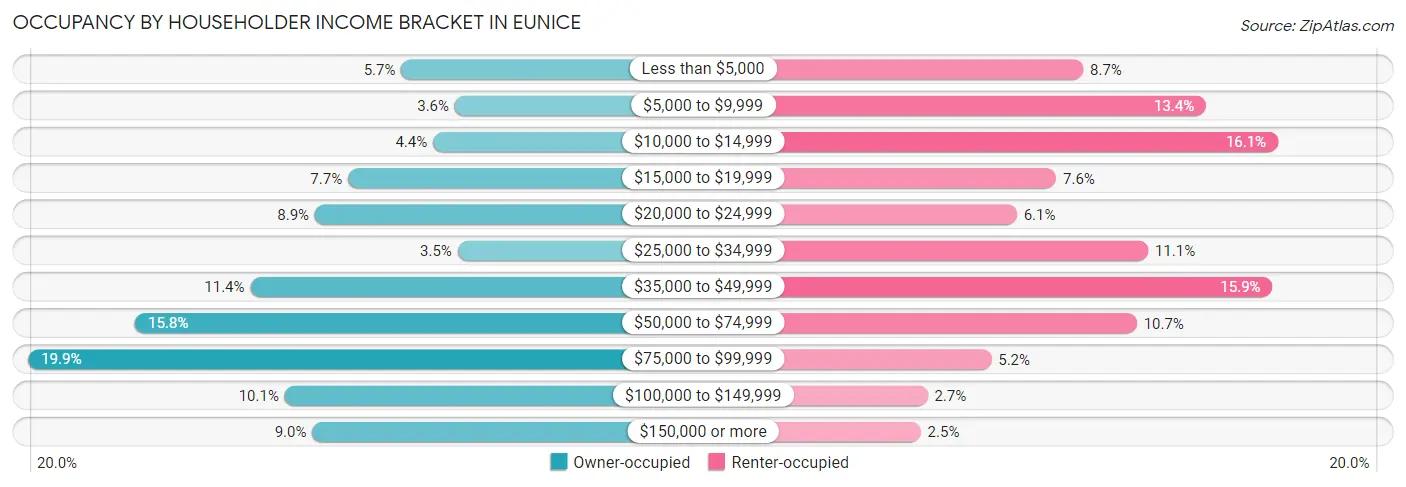
| Income Bracket | Owner-occupied | Renter-occupied |
| Less than $5,000 | 108 (5.7%) | 161 (8.7%) |
| $5,000 to $9,999 | 69 (3.6%) | 248 (13.4%) |
| $10,000 to $14,999 | 85 (4.4%) | 299 (16.1%) |
| $15,000 to $19,999 | 147 (7.7%) | 142 (7.6%) |
| $20,000 to $24,999 | 171 (8.9%) | 114 (6.1%) |
| $25,000 to $34,999 | 67 (3.5%) | 207 (11.1%) |
| $35,000 to $49,999 | 218 (11.4%) | 295 (15.9%) |
| $50,000 to $74,999 | 302 (15.8%) | 199 (10.7%) |
| $75,000 to $99,999 | 380 (19.9%) | 96 (5.2%) |
| $100,000 to $149,999 | 193 (10.1%) | 51 (2.7%) |
| $150,000 or more | 173 (9.0%) | 46 (2.5%) |
| Total | 1,913 (100.0%) | 1,858 (100.0%) |
Monthly Housing Cost Tiers in Eunice
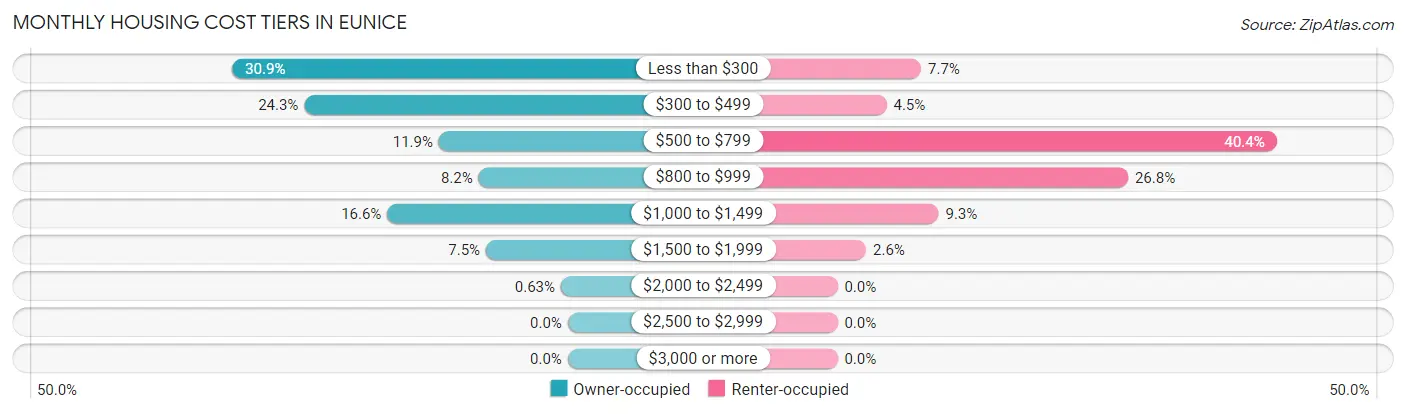
| Monthly Cost | Owner-occupied | Renter-occupied |
| Less than $300 | 591 (30.9%) | 143 (7.7%) |
| $300 to $499 | 464 (24.3%) | 84 (4.5%) |
| $500 to $799 | 227 (11.9%) | 751 (40.4%) |
| $800 to $999 | 157 (8.2%) | 497 (26.8%) |
| $1,000 to $1,499 | 318 (16.6%) | 173 (9.3%) |
| $1,500 to $1,999 | 144 (7.5%) | 49 (2.6%) |
| $2,000 to $2,499 | 12 (0.6%) | 0 (0.0%) |
| $2,500 to $2,999 | 0 (0.0%) | 0 (0.0%) |
| $3,000 or more | 0 (0.0%) | 0 (0.0%) |
| Total | 1,913 (100.0%) | 1,858 (100.0%) |
Physical Housing Characteristics in Eunice
Housing Structures in Eunice
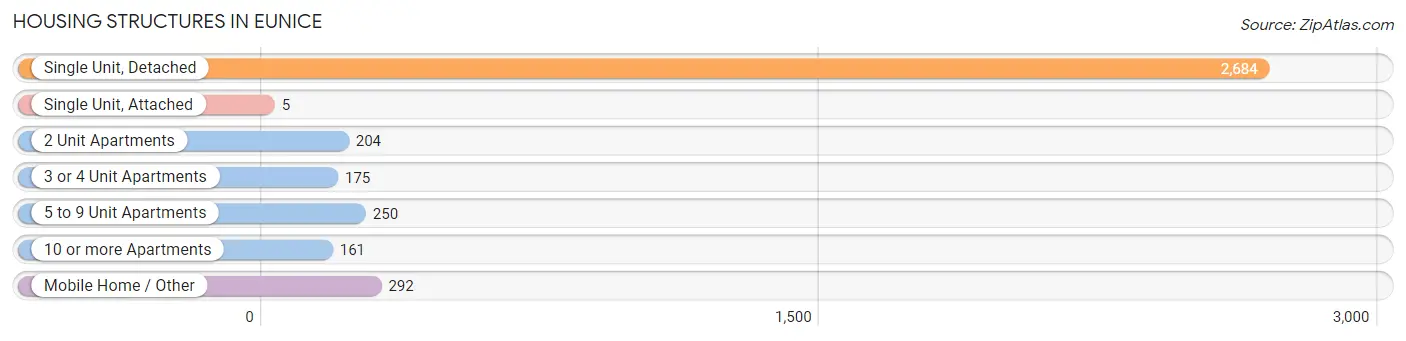
| Structure Type | # Housing Units | % Housing Units |
| Single Unit, Detached | 2,684 | 71.2% |
| Single Unit, Attached | 5 | 0.1% |
| 2 Unit Apartments | 204 | 5.4% |
| 3 or 4 Unit Apartments | 175 | 4.6% |
| 5 to 9 Unit Apartments | 250 | 6.6% |
| 10 or more Apartments | 161 | 4.3% |
| Mobile Home / Other | 292 | 7.7% |
| Total | 3,771 | 100.0% |
Housing Structures by Occupancy in Eunice
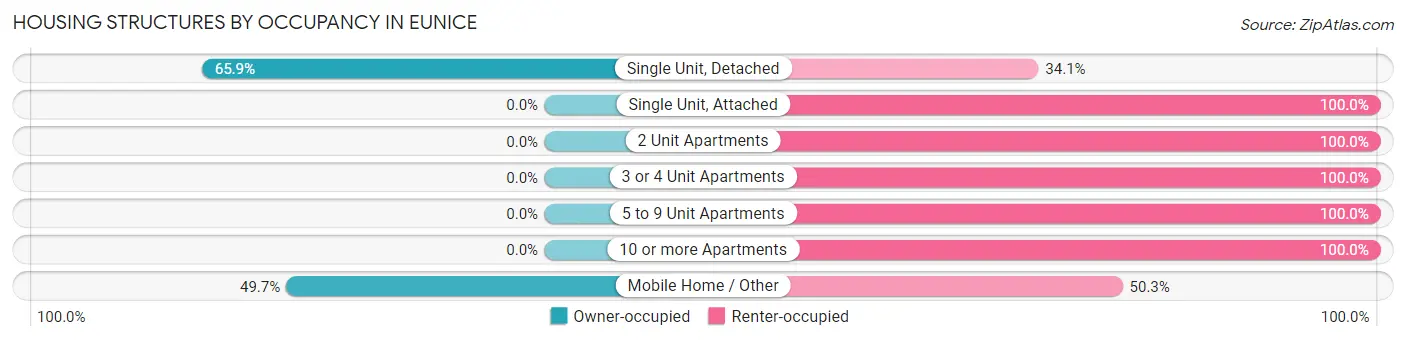
| Structure Type | Owner-occupied | Renter-occupied |
| Single Unit, Detached | 1,768 (65.9%) | 916 (34.1%) |
| Single Unit, Attached | 0 (0.0%) | 5 (100.0%) |
| 2 Unit Apartments | 0 (0.0%) | 204 (100.0%) |
| 3 or 4 Unit Apartments | 0 (0.0%) | 175 (100.0%) |
| 5 to 9 Unit Apartments | 0 (0.0%) | 250 (100.0%) |
| 10 or more Apartments | 0 (0.0%) | 161 (100.0%) |
| Mobile Home / Other | 145 (49.7%) | 147 (50.3%) |
| Total | 1,913 (50.7%) | 1,858 (49.3%) |
Housing Structures by Number of Rooms in Eunice
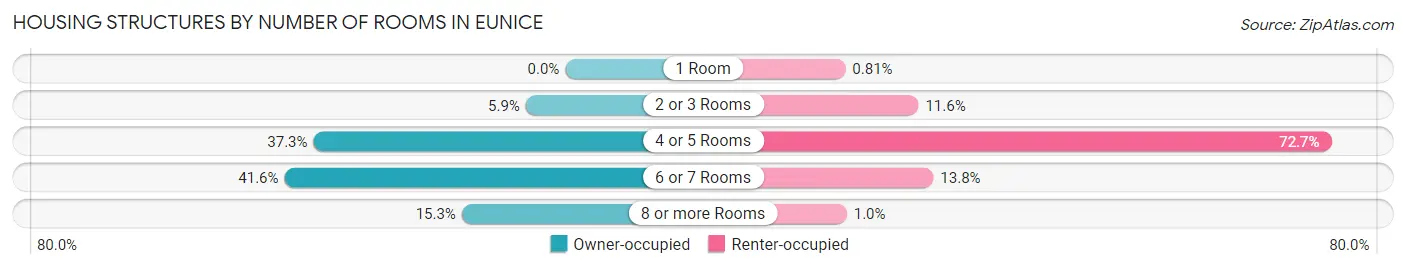
| Number of Rooms | Owner-occupied | Renter-occupied |
| 1 Room | 0 (0.0%) | 15 (0.8%) |
| 2 or 3 Rooms | 112 (5.9%) | 216 (11.6%) |
| 4 or 5 Rooms | 713 (37.3%) | 1,351 (72.7%) |
| 6 or 7 Rooms | 795 (41.6%) | 257 (13.8%) |
| 8 or more Rooms | 293 (15.3%) | 19 (1.0%) |
| Total | 1,913 (100.0%) | 1,858 (100.0%) |
Housing Structure by Heating Type in Eunice
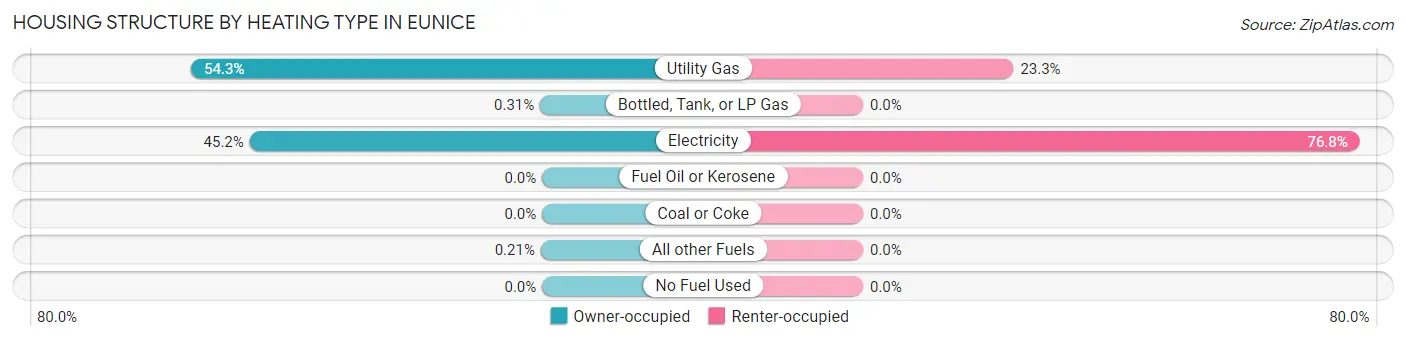
| Heating Type | Owner-occupied | Renter-occupied |
| Utility Gas | 1,038 (54.3%) | 432 (23.3%) |
| Bottled, Tank, or LP Gas | 6 (0.3%) | 0 (0.0%) |
| Electricity | 865 (45.2%) | 1,426 (76.7%) |
| Fuel Oil or Kerosene | 0 (0.0%) | 0 (0.0%) |
| Coal or Coke | 0 (0.0%) | 0 (0.0%) |
| All other Fuels | 4 (0.2%) | 0 (0.0%) |
| No Fuel Used | 0 (0.0%) | 0 (0.0%) |
| Total | 1,913 (100.0%) | 1,858 (100.0%) |
Household Vehicle Usage in Eunice
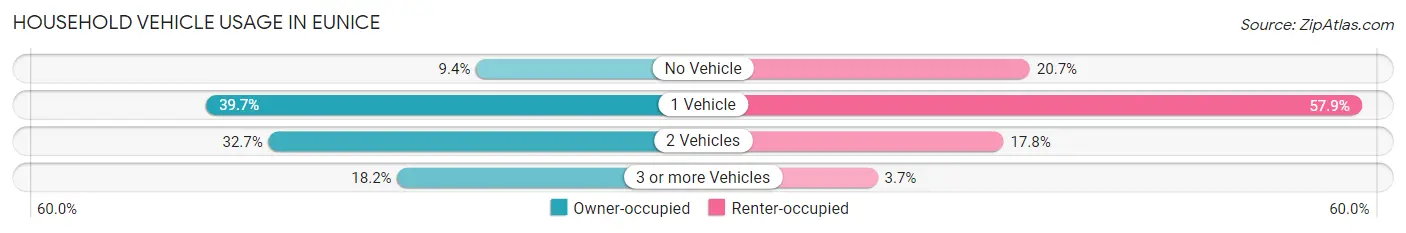
| Vehicles per Household | Owner-occupied | Renter-occupied |
| No Vehicle | 180 (9.4%) | 385 (20.7%) |
| 1 Vehicle | 759 (39.7%) | 1,075 (57.9%) |
| 2 Vehicles | 625 (32.7%) | 330 (17.8%) |
| 3 or more Vehicles | 349 (18.2%) | 68 (3.7%) |
| Total | 1,913 (100.0%) | 1,858 (100.0%) |
Real Estate & Mortgages in Eunice
Real Estate and Mortgage Overview in Eunice
| Characteristic | Without Mortgage | With Mortgage |
| Housing Units | 1,238 | 675 |
| Median Property Value | $102,900 | $165,000 |
| Median Household Income | $38,704 | $112 |
| Monthly Housing Costs | $314 | $0 |
| Real Estate Taxes | $199 | $165 |
Property Value by Mortgage Status in Eunice
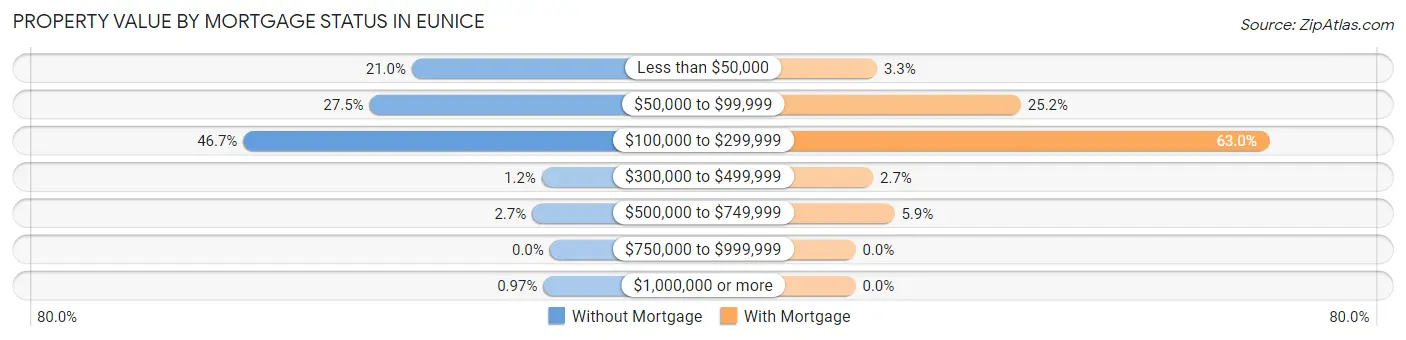
| Property Value | Without Mortgage | With Mortgage |
| Less than $50,000 | 260 (21.0%) | 22 (3.3%) |
| $50,000 to $99,999 | 340 (27.5%) | 170 (25.2%) |
| $100,000 to $299,999 | 578 (46.7%) | 425 (63.0%) |
| $300,000 to $499,999 | 15 (1.2%) | 18 (2.7%) |
| $500,000 to $749,999 | 33 (2.7%) | 40 (5.9%) |
| $750,000 to $999,999 | 0 (0.0%) | 0 (0.0%) |
| $1,000,000 or more | 12 (1.0%) | 0 (0.0%) |
| Total | 1,238 (100.0%) | 675 (100.0%) |
Household Income by Mortgage Status in Eunice
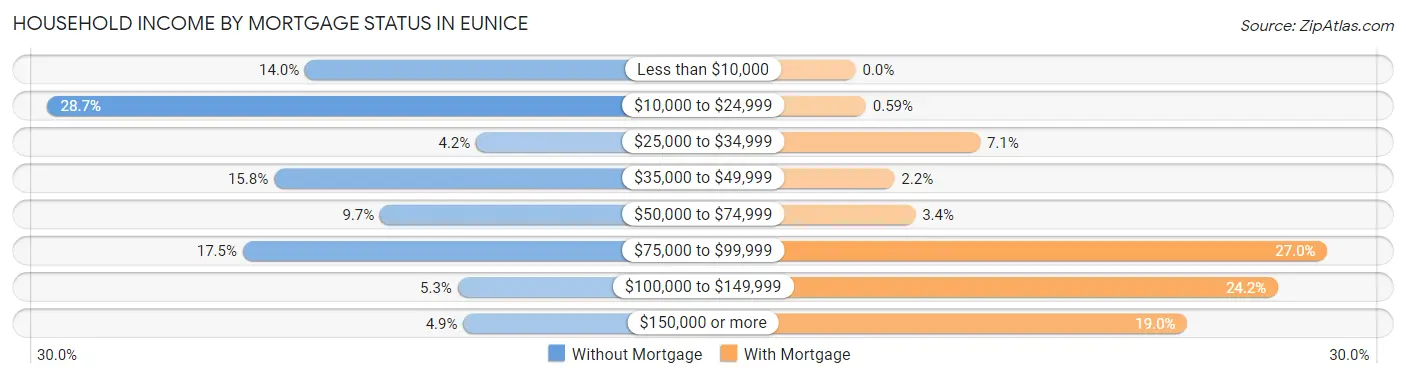
| Household Income | Without Mortgage | With Mortgage |
| Less than $10,000 | 173 (14.0%) | 0 (0.0%) |
| $10,000 to $24,999 | 355 (28.7%) | 4 (0.6%) |
| $25,000 to $34,999 | 52 (4.2%) | 48 (7.1%) |
| $35,000 to $49,999 | 195 (15.8%) | 15 (2.2%) |
| $50,000 to $74,999 | 120 (9.7%) | 23 (3.4%) |
| $75,000 to $99,999 | 217 (17.5%) | 182 (27.0%) |
| $100,000 to $149,999 | 65 (5.2%) | 163 (24.1%) |
| $150,000 or more | 61 (4.9%) | 128 (19.0%) |
| Total | 1,238 (100.0%) | 675 (100.0%) |
Property Value to Household Income Ratio in Eunice
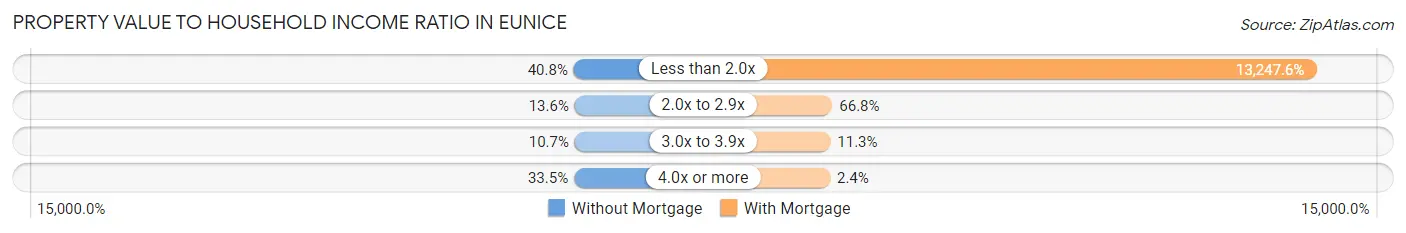
| Value-to-Income Ratio | Without Mortgage | With Mortgage |
| Less than 2.0x | 505 (40.8%) | 89,421 (13,247.6%) |
| 2.0x to 2.9x | 168 (13.6%) | 451 (66.8%) |
| 3.0x to 3.9x | 132 (10.7%) | 76 (11.3%) |
| 4.0x or more | 415 (33.5%) | 16 (2.4%) |
| Total | 1,238 (100.0%) | 675 (100.0%) |
Real Estate Taxes by Mortgage Status in Eunice
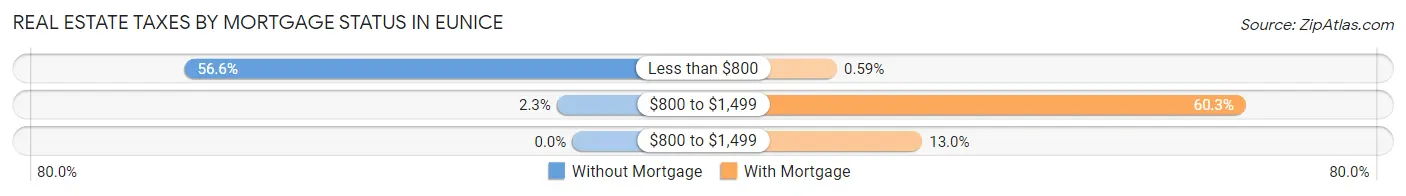
| Property Taxes | Without Mortgage | With Mortgage |
| Less than $800 | 701 (56.6%) | 4 (0.6%) |
| $800 to $1,499 | 28 (2.3%) | 407 (60.3%) |
| $800 to $1,499 | 0 (0.0%) | 88 (13.0%) |
| Total | 1,238 (100.0%) | 675 (100.0%) |
Health & Disability in Eunice
Health Insurance Coverage by Age in Eunice
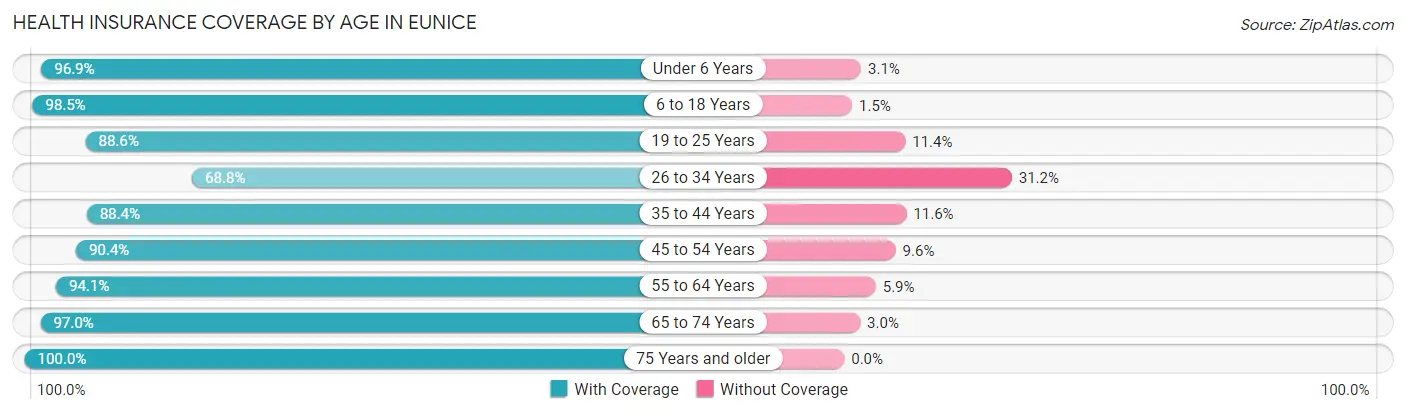
| Age Bracket | With Coverage | Without Coverage |
| Under 6 Years | 805 (96.9%) | 26 (3.1%) |
| 6 to 18 Years | 1,750 (98.5%) | 26 (1.5%) |
| 19 to 25 Years | 935 (88.6%) | 120 (11.4%) |
| 26 to 34 Years | 656 (68.8%) | 298 (31.2%) |
| 35 to 44 Years | 877 (88.4%) | 115 (11.6%) |
| 45 to 54 Years | 1,199 (90.4%) | 127 (9.6%) |
| 55 to 64 Years | 834 (94.1%) | 52 (5.9%) |
| 65 to 74 Years | 788 (97.0%) | 24 (3.0%) |
| 75 Years and older | 669 (100.0%) | 0 (0.0%) |
| Total | 8,513 (91.5%) | 788 (8.5%) |
Health Insurance Coverage by Citizenship Status in Eunice
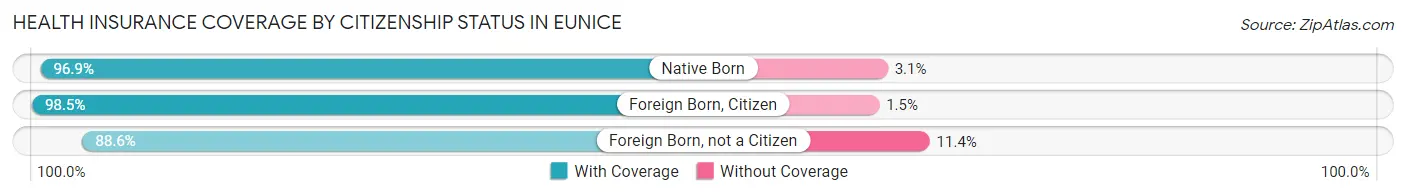
| Citizenship Status | With Coverage | Without Coverage |
| Native Born | 805 (96.9%) | 26 (3.1%) |
| Foreign Born, Citizen | 1,750 (98.5%) | 26 (1.5%) |
| Foreign Born, not a Citizen | 935 (88.6%) | 120 (11.4%) |
Health Insurance Coverage by Household Income in Eunice
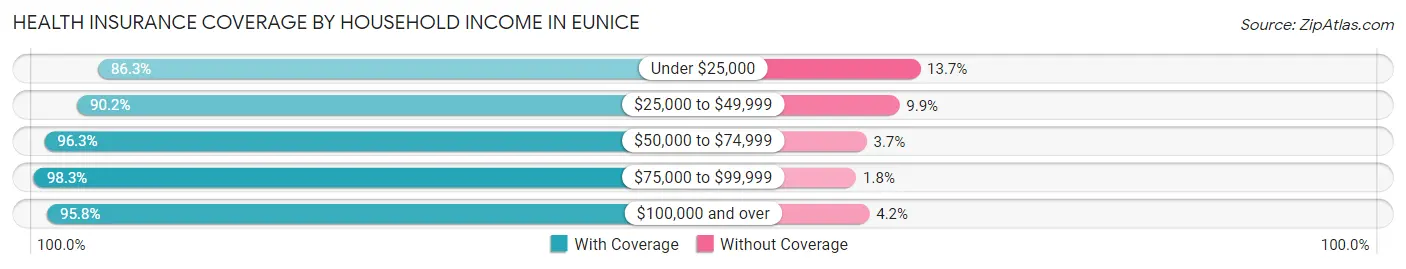
| Household Income | With Coverage | Without Coverage |
| Under $25,000 | 2,862 (86.3%) | 456 (13.7%) |
| $25,000 to $49,999 | 1,813 (90.1%) | 198 (9.9%) |
| $50,000 to $74,999 | 1,405 (96.3%) | 54 (3.7%) |
| $75,000 to $99,999 | 1,069 (98.3%) | 19 (1.8%) |
| $100,000 and over | 1,343 (95.8%) | 59 (4.2%) |
Public vs Private Health Insurance Coverage by Age in Eunice
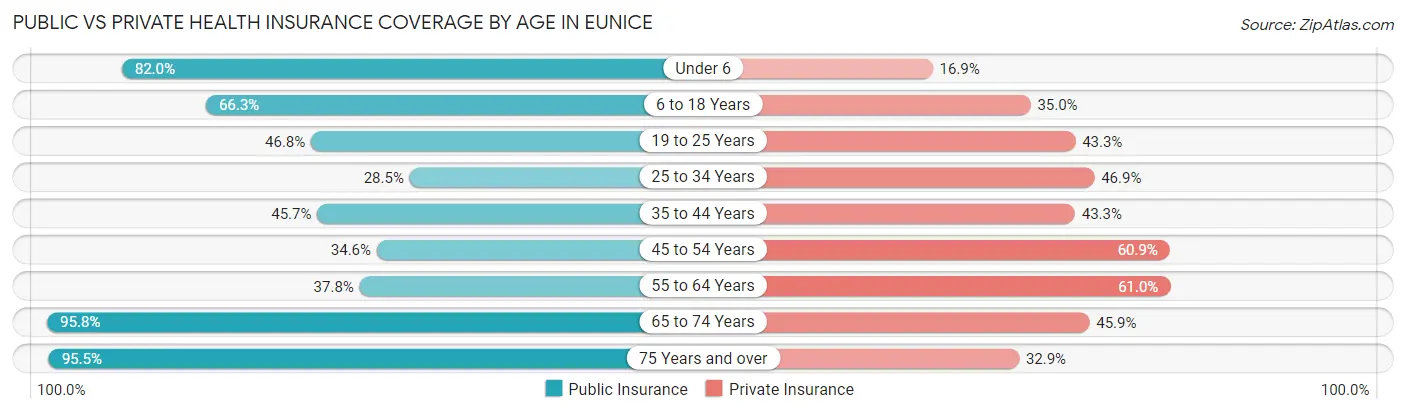
| Age Bracket | Public Insurance | Private Insurance |
| Under 6 | 681 (82.0%) | 140 (16.9%) |
| 6 to 18 Years | 1,178 (66.3%) | 622 (35.0%) |
| 19 to 25 Years | 494 (46.8%) | 457 (43.3%) |
| 25 to 34 Years | 272 (28.5%) | 447 (46.9%) |
| 35 to 44 Years | 453 (45.7%) | 429 (43.2%) |
| 45 to 54 Years | 459 (34.6%) | 807 (60.9%) |
| 55 to 64 Years | 335 (37.8%) | 540 (61.0%) |
| 65 to 74 Years | 778 (95.8%) | 373 (45.9%) |
| 75 Years and over | 639 (95.5%) | 220 (32.9%) |
| Total | 5,289 (56.9%) | 4,035 (43.4%) |
Disability Status by Sex by Age in Eunice
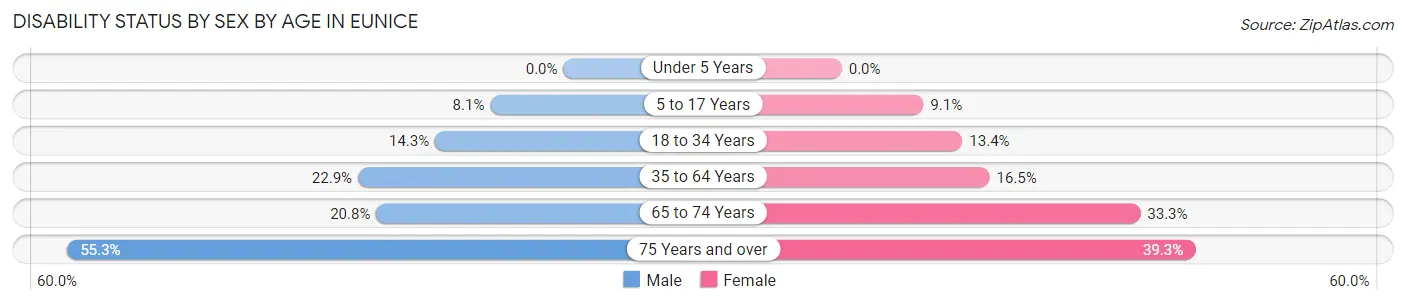
| Age Bracket | Male | Female |
| Under 5 Years | 0 (0.0%) | 0 (0.0%) |
| 5 to 17 Years | 71 (8.1%) | 81 (9.1%) |
| 18 to 34 Years | 138 (14.3%) | 151 (13.4%) |
| 35 to 64 Years | 376 (22.9%) | 257 (16.5%) |
| 65 to 74 Years | 84 (20.8%) | 136 (33.3%) |
| 75 Years and over | 100 (55.2%) | 192 (39.3%) |
Disability Class by Sex by Age in Eunice
Disability Class: Hearing Difficulty
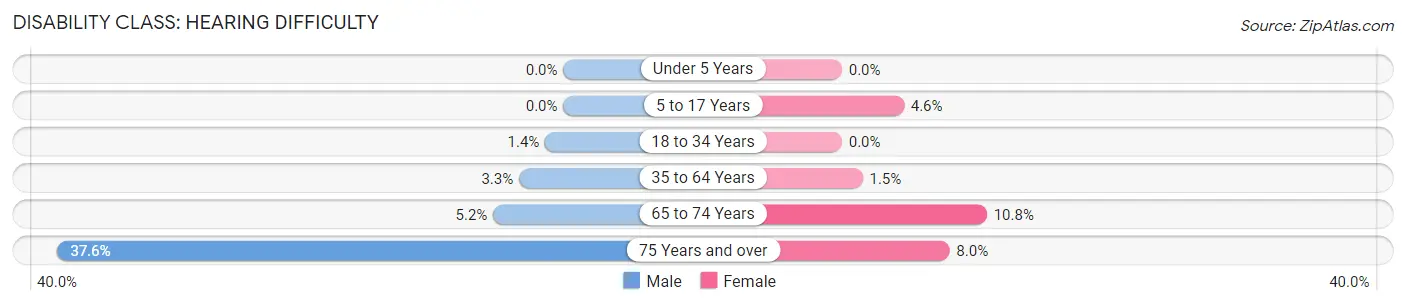
| Age Bracket | Male | Female |
| Under 5 Years | 0 (0.0%) | 0 (0.0%) |
| 5 to 17 Years | 0 (0.0%) | 41 (4.6%) |
| 18 to 34 Years | 13 (1.3%) | 0 (0.0%) |
| 35 to 64 Years | 54 (3.3%) | 24 (1.5%) |
| 65 to 74 Years | 21 (5.2%) | 44 (10.8%) |
| 75 Years and over | 68 (37.6%) | 39 (8.0%) |
Disability Class: Vision Difficulty
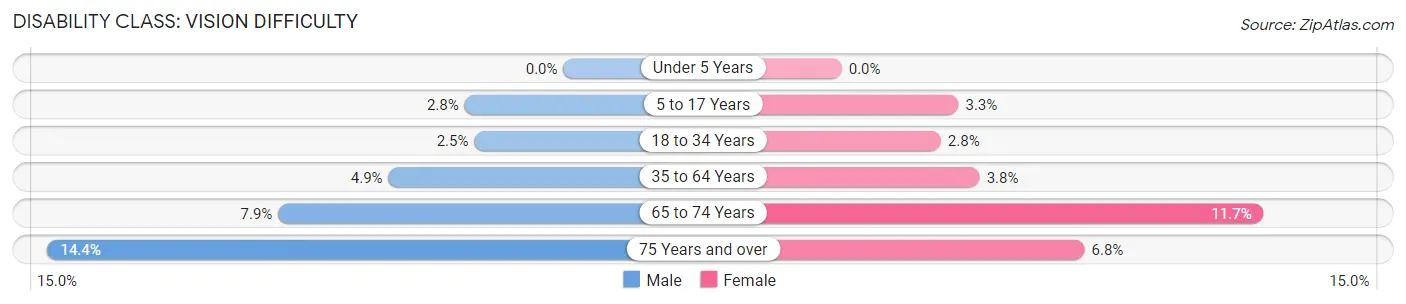
| Age Bracket | Male | Female |
| Under 5 Years | 0 (0.0%) | 0 (0.0%) |
| 5 to 17 Years | 24 (2.8%) | 29 (3.3%) |
| 18 to 34 Years | 24 (2.5%) | 31 (2.8%) |
| 35 to 64 Years | 80 (4.9%) | 60 (3.8%) |
| 65 to 74 Years | 32 (7.9%) | 48 (11.7%) |
| 75 Years and over | 26 (14.4%) | 33 (6.8%) |
Disability Class: Cognitive Difficulty
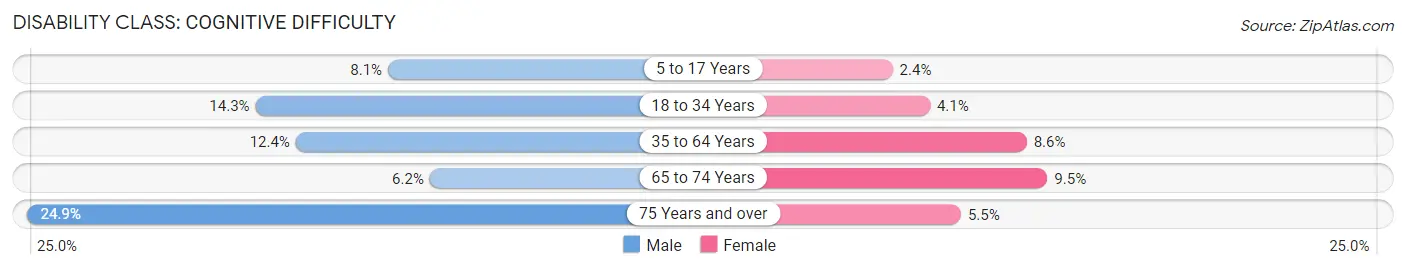
| Age Bracket | Male | Female |
| 5 to 17 Years | 71 (8.1%) | 21 (2.4%) |
| 18 to 34 Years | 138 (14.3%) | 46 (4.1%) |
| 35 to 64 Years | 204 (12.4%) | 134 (8.6%) |
| 65 to 74 Years | 25 (6.2%) | 39 (9.5%) |
| 75 Years and over | 45 (24.9%) | 27 (5.5%) |
Disability Class: Ambulatory Difficulty
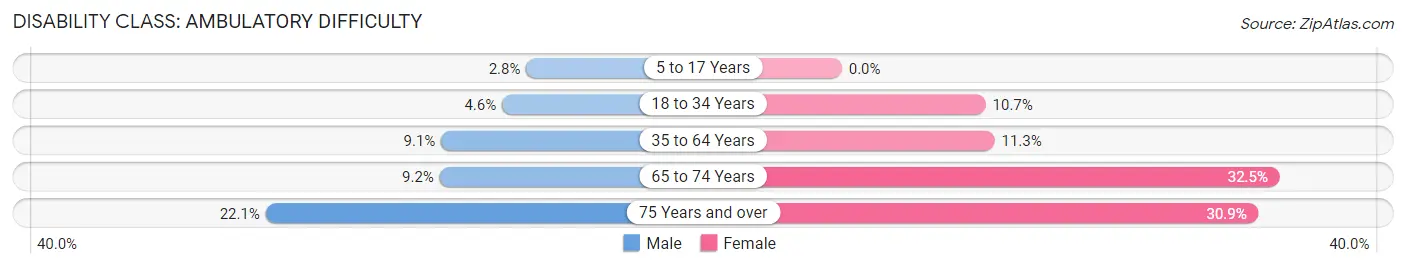
| Age Bracket | Male | Female |
| 5 to 17 Years | 24 (2.8%) | 0 (0.0%) |
| 18 to 34 Years | 44 (4.5%) | 120 (10.7%) |
| 35 to 64 Years | 149 (9.1%) | 177 (11.3%) |
| 65 to 74 Years | 37 (9.2%) | 133 (32.5%) |
| 75 Years and over | 40 (22.1%) | 151 (30.9%) |
Disability Class: Self-Care Difficulty
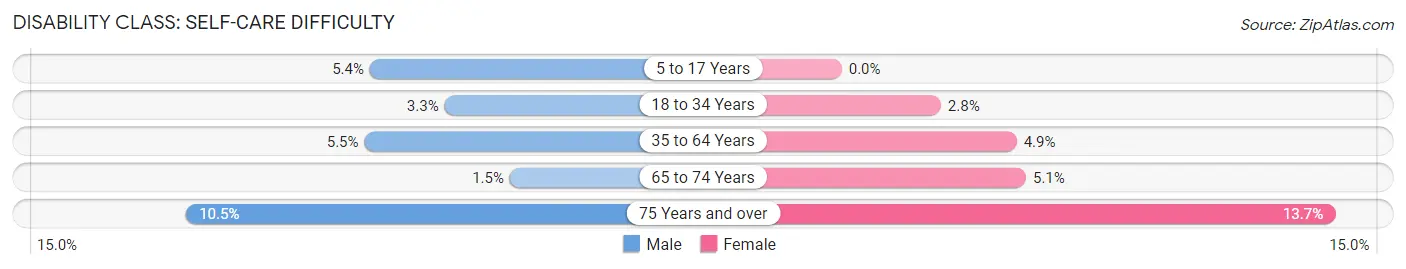
| Age Bracket | Male | Female |
| 5 to 17 Years | 47 (5.4%) | 0 (0.0%) |
| 18 to 34 Years | 32 (3.3%) | 31 (2.8%) |
| 35 to 64 Years | 91 (5.5%) | 76 (4.9%) |
| 65 to 74 Years | 6 (1.5%) | 21 (5.1%) |
| 75 Years and over | 19 (10.5%) | 67 (13.7%) |
Technology Access in Eunice
Computing Device Access in Eunice
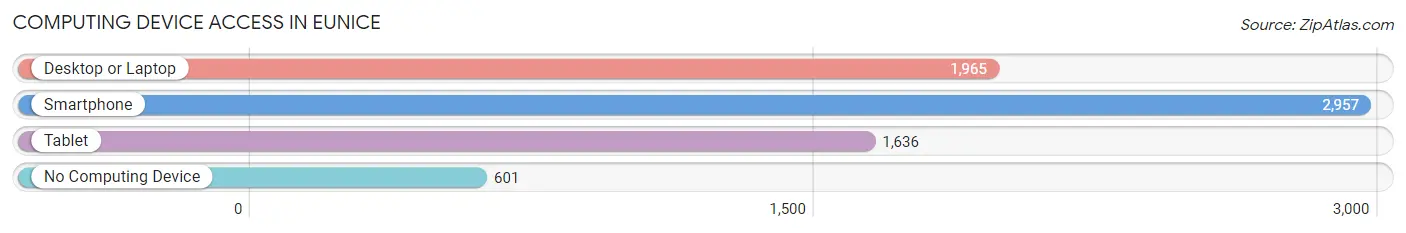
| Device Type | # Households | % Households |
| Desktop or Laptop | 1,965 | 52.1% |
| Smartphone | 2,957 | 78.4% |
| Tablet | 1,636 | 43.4% |
| No Computing Device | 601 | 15.9% |
| Total | 3,771 | 100.0% |
Internet Access in Eunice
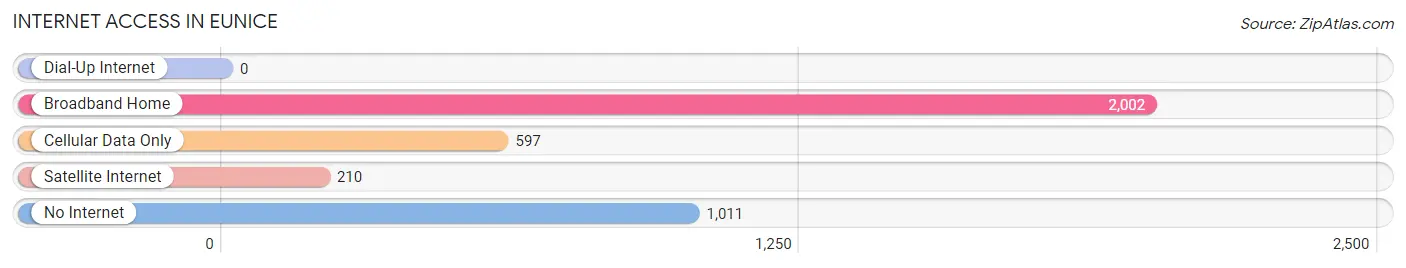
| Internet Type | # Households | % Households |
| Dial-Up Internet | 0 | 0.0% |
| Broadband Home | 2,002 | 53.1% |
| Cellular Data Only | 597 | 15.8% |
| Satellite Internet | 210 | 5.6% |
| No Internet | 1,011 | 26.8% |
| Total | 3,771 | 100.0% |
Eunice Summary
Eunice is a city located in St. Landry Parish, Louisiana. It is the parish seat and the largest city in the parish. The population of Eunice was 8,398 at the 2010 census.
Geography
Eunice is located at 30°30'25" North, 92°11'17" West (30.506944, -92.188056). It is situated at the intersection of U.S. Route 190 and Louisiana Highway 13. The city is located in the heart of Cajun Country, and is surrounded by the prairies and marshes of the Atchafalaya Basin.
History
Eunice was founded in 1883 by the Southern Pacific Railroad. The city was named after Eunice, the daughter of the railroad's president. The city was incorporated in 1894.
In the early 20th century, Eunice was a major center for the lumber industry. The city was also home to a large number of sawmills and other wood-related businesses.
Economy
Eunice is the economic hub of St. Landry Parish. The city is home to a variety of businesses, including manufacturing, retail, and service industries. The city is also home to a number of oil and gas companies.
The city is home to the Eunice Industrial Park, which is home to a variety of businesses, including a plastics manufacturer, a food processor, and a printing company.
Demographics
As of the 2010 census, the population of Eunice was 8,398. The racial makeup of the city was 70.2% White, 24.2% African American, 0.4% Native American, 0.7% Asian, 0.1% Pacific Islander, 2.2% from other races, and 2.2% from two or more races. Hispanic or Latino of any race were 4.7% of the population.
The median income for a household in the city was $30,938, and the median income for a family was $37,917. The per capita income for the city was $17,845. About 19.2% of families and 22.2% of the population were below the poverty line, including 33.3% of those under age 18 and 16.2% of those age 65 or over.
Education
Eunice is served by the St. Landry Parish School District. The city is home to two public schools: Eunice High School and Eunice Junior High School. The city is also home to a number of private schools, including St. Edmund Catholic School and Eunice Christian Academy.
The city is home to a branch of South Louisiana Community College, which offers a variety of associate degree and certificate programs.
Conclusion
Eunice is a city located in St. Landry Parish, Louisiana. It is the parish seat and the largest city in the parish. The city is located in the heart of Cajun Country, and is surrounded by the prairies and marshes of the Atchafalaya Basin. The city was founded in 1883 by the Southern Pacific Railroad, and was incorporated in 1894. The city is the economic hub of St. Landry Parish, and is home to a variety of businesses, including manufacturing, retail, and service industries. The population of Eunice was 8,398 at the 2010 census. The city is served by the St. Landry Parish School District, and is home to a branch of South Louisiana Community College.
Common Questions
What is Per Capita Income in Eunice?
Per Capita income in Eunice is $25,265.
What is the Median Family Income in Eunice?
Median Family Income in Eunice is $48,533.
What is the Median Household income in Eunice?
Median Household Income in Eunice is $37,828.
What is Income or Wage Gap in Eunice?
Income or Wage Gap in Eunice is 52.6%.
Women in Eunice earn 47.4 cents for every dollar earned by a man.
What is Family Income Deficit in Eunice?
Family Income Deficit in Eunice is $12,491.
Families that are below poverty line in Eunice earn $12,491 less on average than the poverty threshold level.
What is Inequality or Gini Index in Eunice?
Inequality or Gini Index in Eunice is 0.57.
What is the Total Population of Eunice?
Total Population of Eunice is 9,440.
What is the Total Male Population of Eunice?
Total Male Population of Eunice is 4,523.
What is the Total Female Population of Eunice?
Total Female Population of Eunice is 4,917.
What is the Ratio of Males per 100 Females in Eunice?
There are 91.99 Males per 100 Females in Eunice.
What is the Ratio of Females per 100 Males in Eunice?
There are 108.71 Females per 100 Males in Eunice.
What is the Median Population Age in Eunice?
Median Population Age in Eunice is 35.5 Years.
What is the Average Family Size in Eunice
Average Family Size in Eunice is 3.2 People.
What is the Average Household Size in Eunice
Average Household Size in Eunice is 2.5 People.
How Large is the Labor Force in Eunice?
There are 4,090 People in the Labor Forcein in Eunice.
What is the Percentage of People in the Labor Force in Eunice?
57.4% of People are in the Labor Force in Eunice.
What is the Unemployment Rate in Eunice?
Unemployment Rate in Eunice is 12.6%.