Empire, LA Map & Demographics
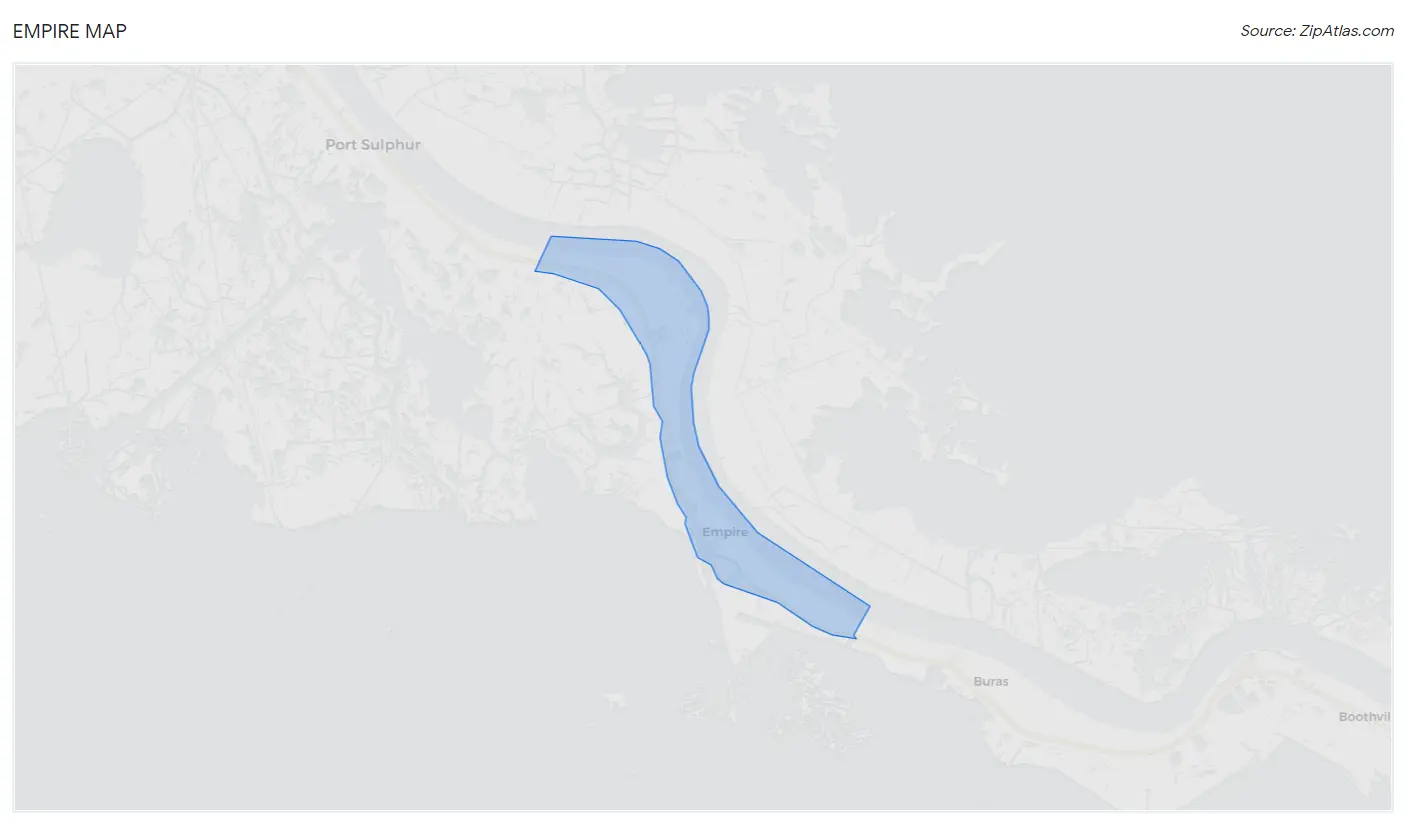
Empire Map
Empire Overview
$17,538
PER CAPITA INCOME
$31,328
AVG FAMILY INCOME
$25,950
AVG HOUSEHOLD INCOME
6.7%
WAGE / INCOME GAP [ % ]
93.3¢/ $1
WAGE / INCOME GAP [ $ ]
0.57
INEQUALITY / GINI INDEX
999
TOTAL POPULATION
517
MALE POPULATION
482
FEMALE POPULATION
107.26
MALES / 100 FEMALES
93.23
FEMALES / 100 MALES
33.9
MEDIAN AGE
3.3
AVG FAMILY SIZE
2.4
AVG HOUSEHOLD SIZE
440
LABOR FORCE [ PEOPLE ]
54.5%
PERCENT IN LABOR FORCE
5.5%
UNEMPLOYMENT RATE
Empire Zip Codes
Income in Empire
Income Overview in Empire
Per Capita Income in Empire is $17,538, while median incomes of families and households are $31,328 and $25,950 respectively.
| Characteristic | Number | Measure |
| Per Capita Income | 999 | $17,538 |
| Median Family Income | 224 | $31,328 |
| Mean Family Income | 224 | $44,186 |
| Median Household Income | 421 | $25,950 |
| Mean Household Income | 421 | $36,866 |
| Income Deficit | 224 | $0 |
| Wage / Income Gap (%) | 999 | 6.73% |
| Wage / Income Gap ($) | 999 | 93.27¢ per $1 |
| Gini / Inequality Index | 999 | 0.57 |
Earnings by Sex in Empire
Average Earnings in Empire are $24,072, $23,761 for men and $25,476 for women, a difference of 6.7%.
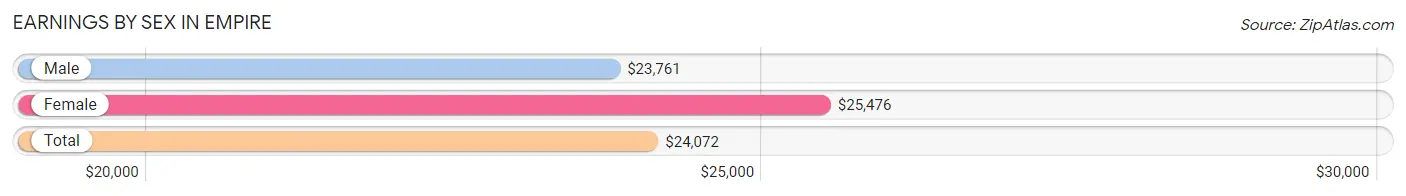
| Sex | Number | Average Earnings |
| Male | 274 (64.3%) | $23,761 |
| Female | 152 (35.7%) | $25,476 |
| Total | 426 (100.0%) | $24,072 |
Earnings by Sex by Income Bracket in Empire
The most common earnings brackets in Empire are $22,500 to $24,999 for men (115 | 42.0%) and $25,000 to $29,999 for women (42 | 27.6%).
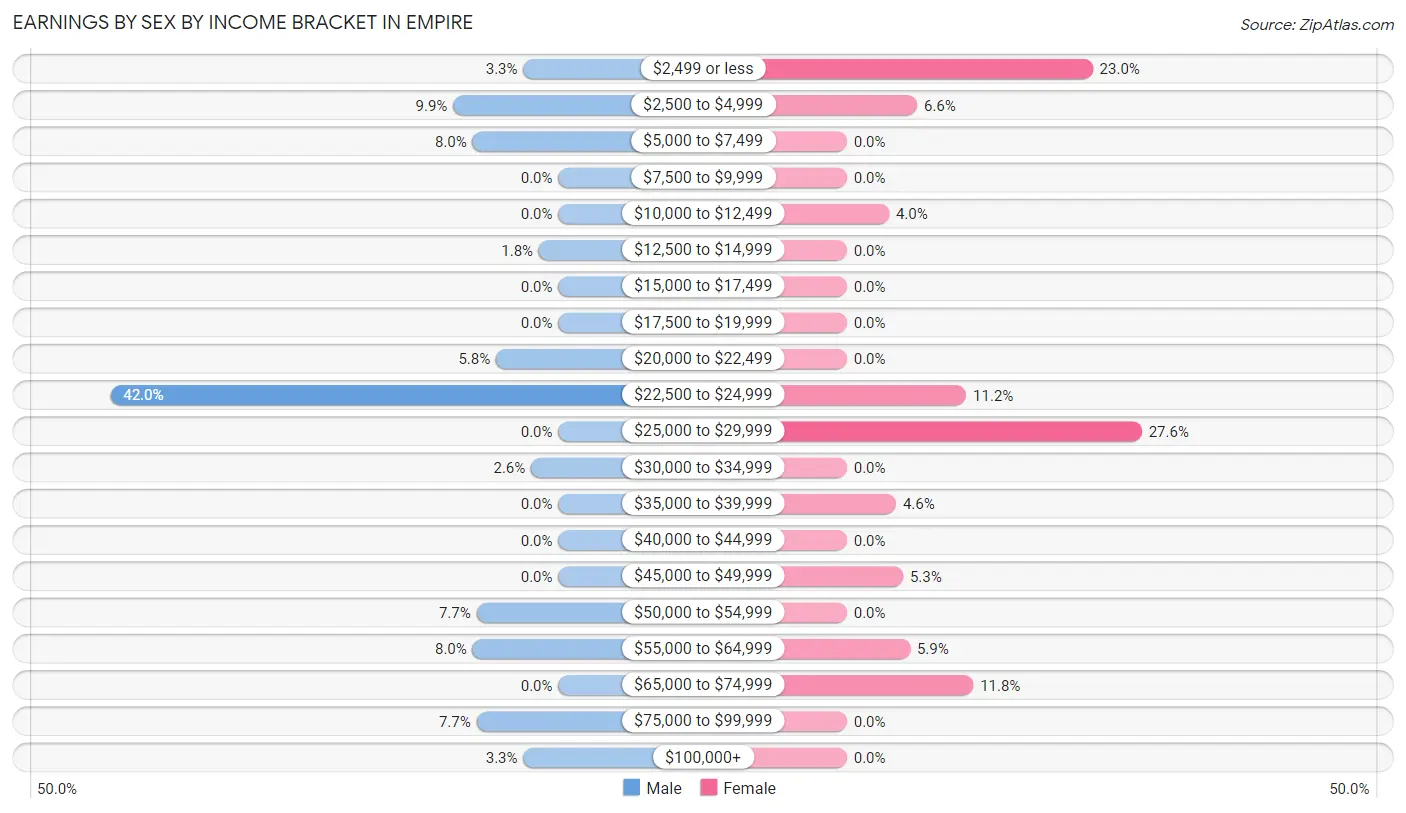
| Income | Male | Female |
| $2,499 or less | 9 (3.3%) | 35 (23.0%) |
| $2,500 to $4,999 | 27 (9.9%) | 10 (6.6%) |
| $5,000 to $7,499 | 22 (8.0%) | 0 (0.0%) |
| $7,500 to $9,999 | 0 (0.0%) | 0 (0.0%) |
| $10,000 to $12,499 | 0 (0.0%) | 6 (4.0%) |
| $12,500 to $14,999 | 5 (1.8%) | 0 (0.0%) |
| $15,000 to $17,499 | 0 (0.0%) | 0 (0.0%) |
| $17,500 to $19,999 | 0 (0.0%) | 0 (0.0%) |
| $20,000 to $22,499 | 16 (5.8%) | 0 (0.0%) |
| $22,500 to $24,999 | 115 (42.0%) | 17 (11.2%) |
| $25,000 to $29,999 | 0 (0.0%) | 42 (27.6%) |
| $30,000 to $34,999 | 7 (2.5%) | 0 (0.0%) |
| $35,000 to $39,999 | 0 (0.0%) | 7 (4.6%) |
| $40,000 to $44,999 | 0 (0.0%) | 0 (0.0%) |
| $45,000 to $49,999 | 0 (0.0%) | 8 (5.3%) |
| $50,000 to $54,999 | 21 (7.7%) | 0 (0.0%) |
| $55,000 to $64,999 | 22 (8.0%) | 9 (5.9%) |
| $65,000 to $74,999 | 0 (0.0%) | 18 (11.8%) |
| $75,000 to $99,999 | 21 (7.7%) | 0 (0.0%) |
| $100,000+ | 9 (3.3%) | 0 (0.0%) |
| Total | 274 (100.0%) | 152 (100.0%) |
Earnings by Sex by Educational Attainment in Empire
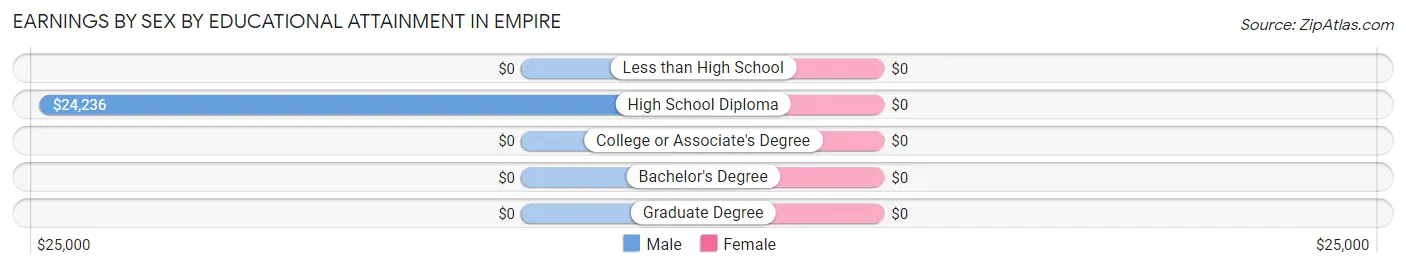
| Educational Attainment | Male Income | Female Income |
| Less than High School | - | - |
| High School Diploma | $24,236 | $0 |
| College or Associate's Degree | - | - |
| Bachelor's Degree | - | - |
| Graduate Degree | - | - |
| Total | $33,393 | $26,055 |
Family Income in Empire
Family Income Brackets in Empire
According to the Empire family income data, there are 72 families falling into the less than $10,000 income range, which is the most common income bracket and makes up 32.1% of all families.
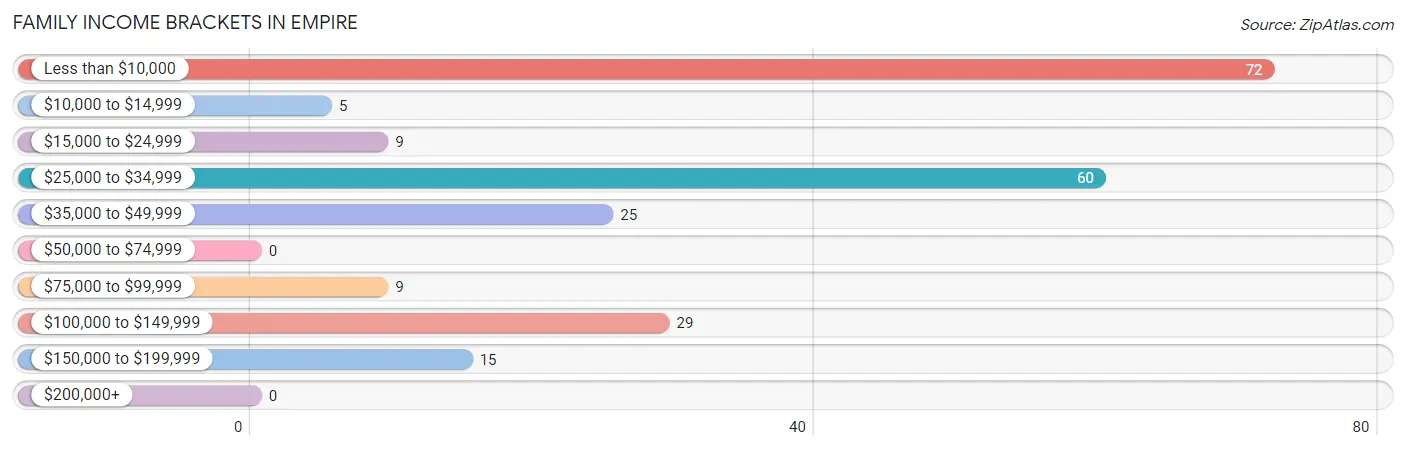
| Income Bracket | # Families | % Families |
| Less than $10,000 | 72 | 32.1% |
| $10,000 to $14,999 | 5 | 2.2% |
| $15,000 to $24,999 | 9 | 4.0% |
| $25,000 to $34,999 | 60 | 26.8% |
| $35,000 to $49,999 | 25 | 11.2% |
| $50,000 to $74,999 | 0 | 0.0% |
| $75,000 to $99,999 | 9 | 4.0% |
| $100,000 to $149,999 | 29 | 12.9% |
| $150,000 to $199,999 | 15 | 6.7% |
| $200,000+ | 0 | 0.0% |
Family Income by Famaliy Size in Empire
2-person families (132 | 58.9%) account for the highest median family income in Empire with $32,266 per family, while 2-person families (132 | 58.9%) have the highest median income of $16,133 per family member.
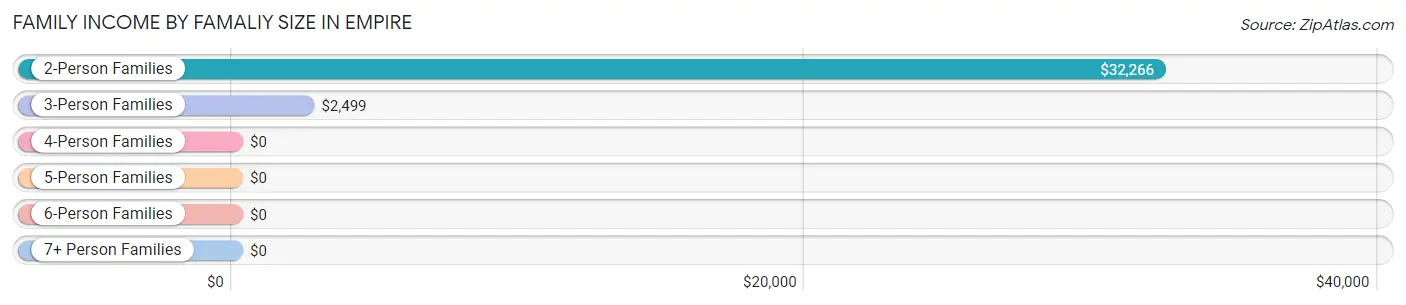
| Income Bracket | # Families | Median Income |
| 2-Person Families | 132 (58.9%) | $32,266 |
| 3-Person Families | 37 (16.5%) | $2,499 |
| 4-Person Families | 16 (7.1%) | $0 |
| 5-Person Families | 0 (0.0%) | $0 |
| 6-Person Families | 27 (12.0%) | $0 |
| 7+ Person Families | 12 (5.4%) | $0 |
| Total | 224 (100.0%) | $31,328 |
Family Income by Number of Earners in Empire
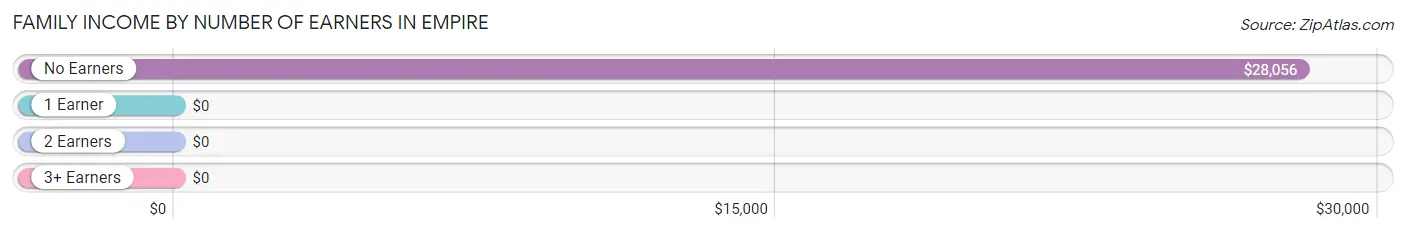
| Number of Earners | # Families | Median Income |
| No Earners | 66 (29.5%) | $28,056 |
| 1 Earner | 113 (50.4%) | $0 |
| 2 Earners | 30 (13.4%) | $0 |
| 3+ Earners | 15 (6.7%) | $0 |
| Total | 224 (100.0%) | $31,328 |
Household Income in Empire
Household Income Brackets in Empire
With 152 households falling in the category, the less than $10,000 income range is the most frequent in Empire, accounting for 36.1% of all households.
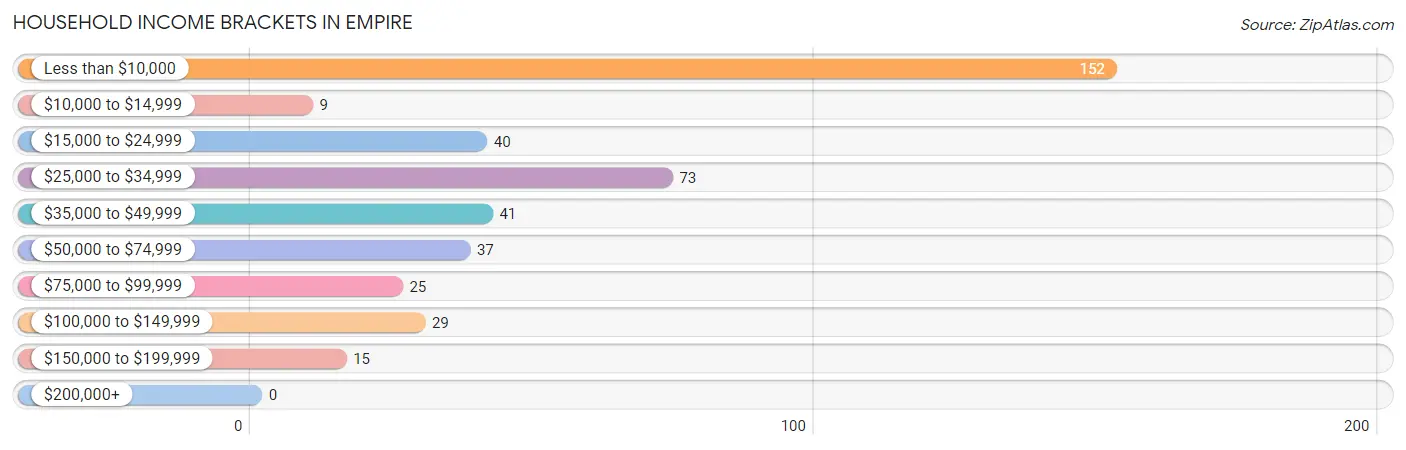
| Income Bracket | # Households | % Households |
| Less than $10,000 | 152 | 36.1% |
| $10,000 to $14,999 | 9 | 2.1% |
| $15,000 to $24,999 | 40 | 9.5% |
| $25,000 to $34,999 | 73 | 17.3% |
| $35,000 to $49,999 | 41 | 9.7% |
| $50,000 to $74,999 | 37 | 8.8% |
| $75,000 to $99,999 | 25 | 5.9% |
| $100,000 to $149,999 | 29 | 6.9% |
| $150,000 to $199,999 | 15 | 3.6% |
| $200,000+ | 0 | 0.0% |
Household Income by Householder Age in Empire
The median household income in Empire is $25,950, with the highest median household income of $30,547 found in the 25 to 44 years age bracket for the primary householder. A total of 106 households (25.2%) fall into this category.
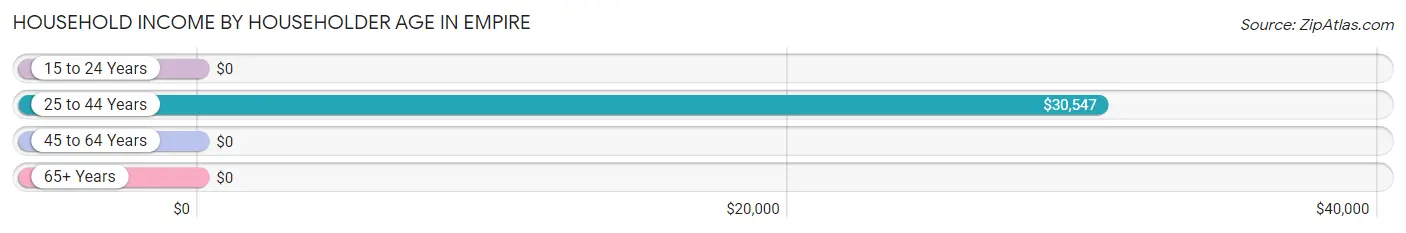
| Income Bracket | # Households | Median Income |
| 15 to 24 Years | 0 (0.0%) | $0 |
| 25 to 44 Years | 106 (25.2%) | $30,547 |
| 45 to 64 Years | 185 (43.9%) | $0 |
| 65+ Years | 130 (30.9%) | $0 |
| Total | 421 (100.0%) | $25,950 |
Poverty in Empire
Income Below Poverty by Sex and Age in Empire
With 40.4% poverty level for males and 59.5% for females among the residents of Empire, 6 to 11 year old males and 5 year old females are the most vulnerable to poverty, with 27 males (100.0%) and 10 females (100.0%) in their respective age groups living below the poverty level.
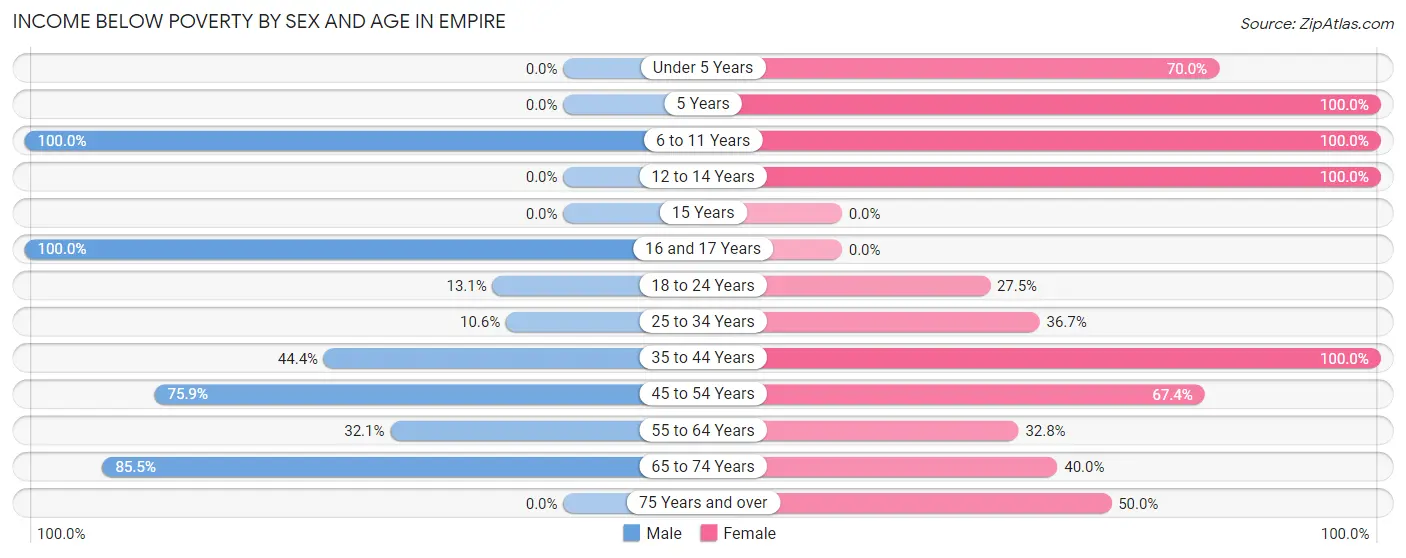
| Age Bracket | Male | Female |
| Under 5 Years | 0 (0.0%) | 21 (70.0%) |
| 5 Years | 0 (0.0%) | 10 (100.0%) |
| 6 to 11 Years | 27 (100.0%) | 80 (100.0%) |
| 12 to 14 Years | 0 (0.0%) | 38 (100.0%) |
| 15 Years | 0 (0.0%) | 0 (0.0%) |
| 16 and 17 Years | 5 (100.0%) | 0 (0.0%) |
| 18 to 24 Years | 18 (13.1%) | 11 (27.5%) |
| 25 to 34 Years | 5 (10.6%) | 29 (36.7%) |
| 35 to 44 Years | 8 (44.4%) | 12 (100.0%) |
| 45 to 54 Years | 22 (75.9%) | 33 (67.3%) |
| 55 to 64 Years | 53 (32.1%) | 20 (32.8%) |
| 65 to 74 Years | 71 (85.5%) | 24 (40.0%) |
| 75 Years and over | 0 (0.0%) | 9 (50.0%) |
| Total | 209 (40.4%) | 287 (59.5%) |
Income Above Poverty by Sex and Age in Empire
According to the poverty statistics in Empire, males aged under 5 years and females aged 16 and 17 years are the age groups that are most secure financially, with 100.0% of males and 100.0% of females in these age groups living above the poverty line.
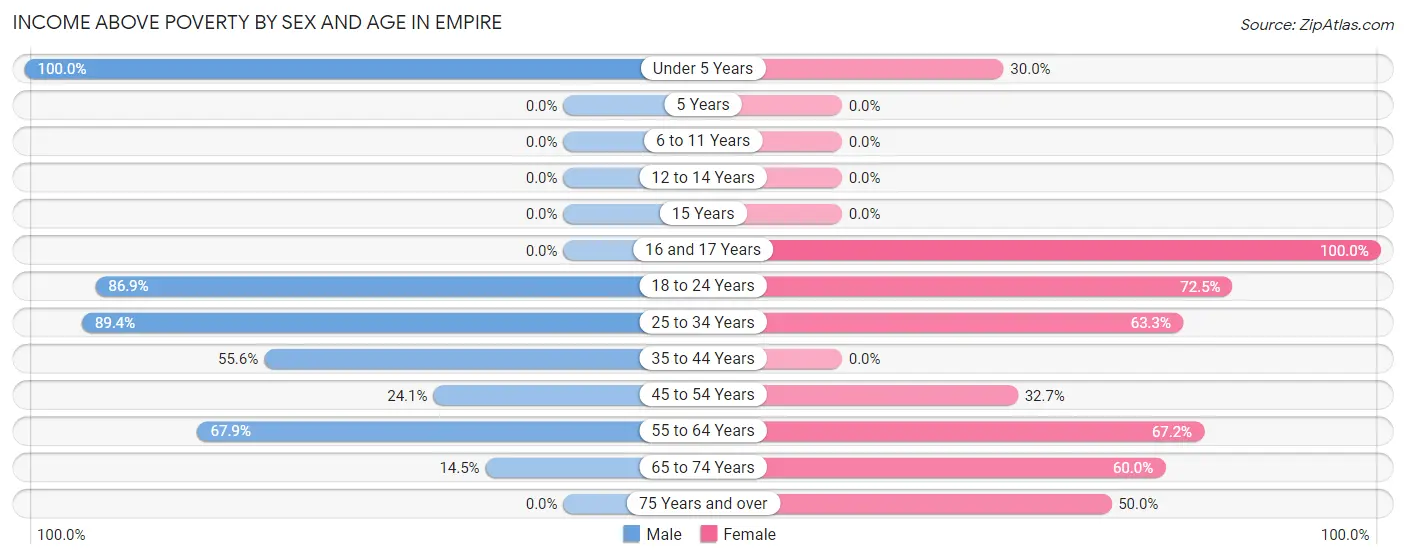
| Age Bracket | Male | Female |
| Under 5 Years | 6 (100.0%) | 9 (30.0%) |
| 5 Years | 0 (0.0%) | 0 (0.0%) |
| 6 to 11 Years | 0 (0.0%) | 0 (0.0%) |
| 12 to 14 Years | 0 (0.0%) | 0 (0.0%) |
| 15 Years | 0 (0.0%) | 0 (0.0%) |
| 16 and 17 Years | 0 (0.0%) | 5 (100.0%) |
| 18 to 24 Years | 119 (86.9%) | 29 (72.5%) |
| 25 to 34 Years | 42 (89.4%) | 50 (63.3%) |
| 35 to 44 Years | 10 (55.6%) | 0 (0.0%) |
| 45 to 54 Years | 7 (24.1%) | 16 (32.7%) |
| 55 to 64 Years | 112 (67.9%) | 41 (67.2%) |
| 65 to 74 Years | 12 (14.5%) | 36 (60.0%) |
| 75 Years and over | 0 (0.0%) | 9 (50.0%) |
| Total | 308 (59.6%) | 195 (40.5%) |
Income Below Poverty Among Married-Couple Families in Empire
The poverty statistics for married-couple families in Empire show that 34.4% or 41 of the total 119 families live below the poverty line. Families with 3 or 4 children have the highest poverty rate of 100.0%, comprising of 27 families. On the other hand, families with 1 or 2 children have the lowest poverty rate of 0.0%, which includes 0 families.
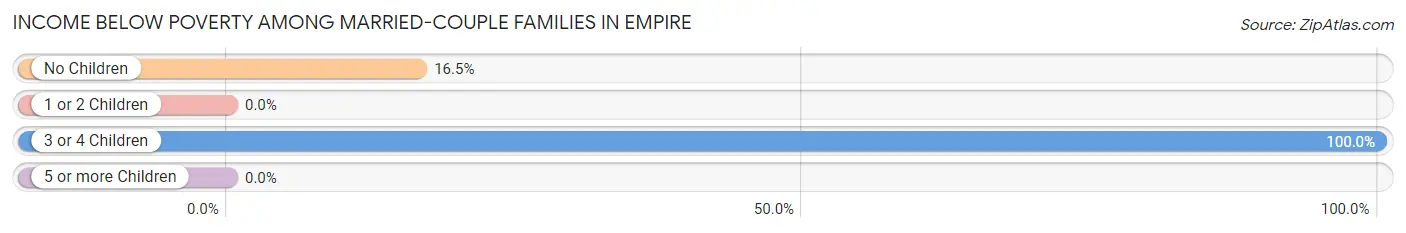
| Children | Above Poverty | Below Poverty |
| No Children | 71 (83.5%) | 14 (16.5%) |
| 1 or 2 Children | 7 (100.0%) | 0 (0.0%) |
| 3 or 4 Children | 0 (0.0%) | 27 (100.0%) |
| 5 or more Children | 0 (0.0%) | 0 (0.0%) |
| Total | 78 (65.5%) | 41 (34.4%) |
Income Below Poverty Among Single-Parent Households in Empire
According to the poverty data in Empire, 100.0% or 13 single-father households and 38.0% or 35 single-mother households are living below the poverty line. Among single-father households, those with no children have the highest poverty rate, with 8 households (100.0%) experiencing poverty. Likewise, among single-mother households, those with 1 or 2 children have the highest poverty rate, with 35 households (52.2%) falling below the poverty line.
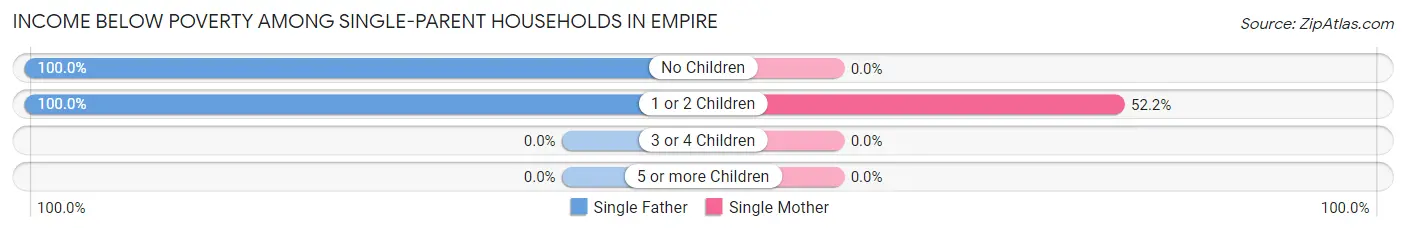
| Children | Single Father | Single Mother |
| No Children | 8 (100.0%) | 0 (0.0%) |
| 1 or 2 Children | 5 (100.0%) | 35 (52.2%) |
| 3 or 4 Children | 0 (0.0%) | 0 (0.0%) |
| 5 or more Children | 0 (0.0%) | 0 (0.0%) |
| Total | 13 (100.0%) | 35 (38.0%) |
Income Below Poverty Among Married-Couple vs Single-Parent Households in Empire
The poverty data for Empire shows that 41 of the married-couple family households (34.4%) and 48 of the single-parent households (45.7%) are living below the poverty level. Within the married-couple family households, those with 3 or 4 children have the highest poverty rate, with 27 households (100.0%) falling below the poverty line. Among the single-parent households, those with 1 or 2 children have the highest poverty rate, with 40 household (55.6%) living below poverty.
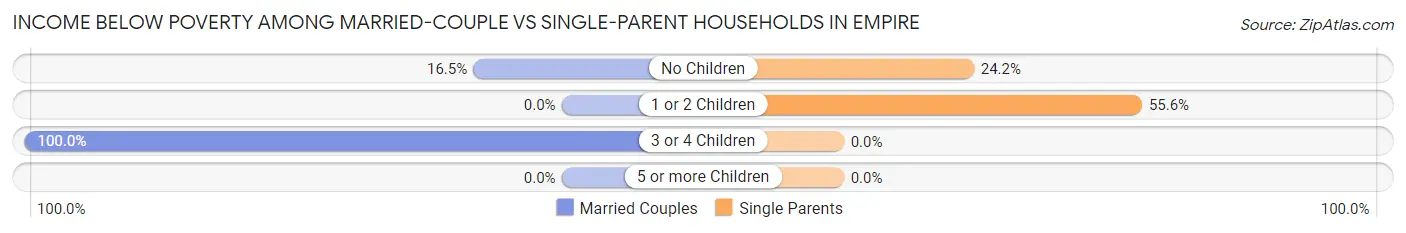
| Children | Married-Couple Families | Single-Parent Households |
| No Children | 14 (16.5%) | 8 (24.2%) |
| 1 or 2 Children | 0 (0.0%) | 40 (55.6%) |
| 3 or 4 Children | 27 (100.0%) | 0 (0.0%) |
| 5 or more Children | 0 (0.0%) | 0 (0.0%) |
| Total | 41 (34.4%) | 48 (45.7%) |
Race in Empire
The most populous races in Empire are White / Caucasian (516 | 51.6%), Black / African American (272 | 27.2%), and Asian (138 | 13.8%).
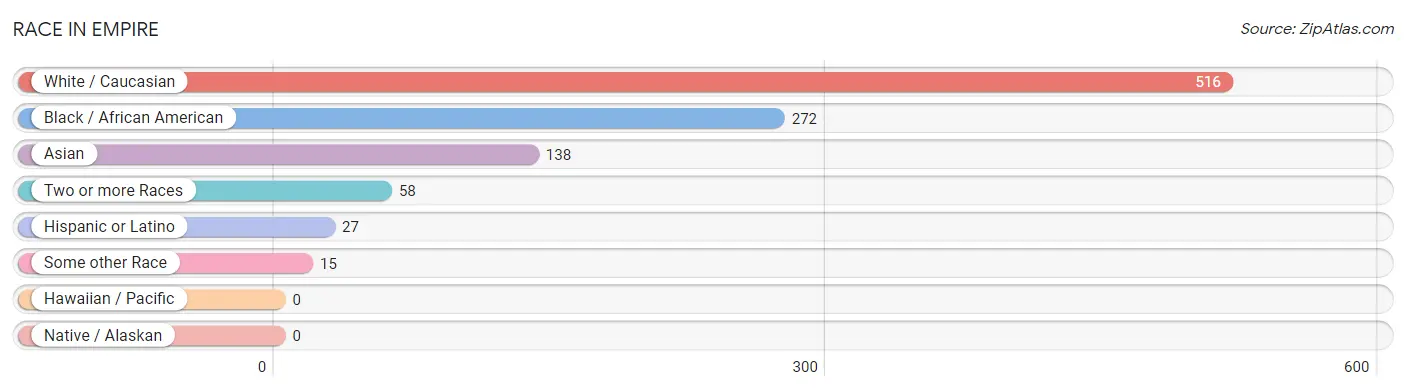
| Race | # Population | % Population |
| Asian | 138 | 13.8% |
| Black / African American | 272 | 27.2% |
| Hawaiian / Pacific | 0 | 0.0% |
| Hispanic or Latino | 27 | 2.7% |
| Native / Alaskan | 0 | 0.0% |
| White / Caucasian | 516 | 51.6% |
| Two or more Races | 58 | 5.8% |
| Some other Race | 15 | 1.5% |
| Total | 999 | 100.0% |
Ancestry in Empire
The most populous ancestries reported in Empire are French (306 | 30.6%), Sri Lankan (138 | 13.8%), German (111 | 11.1%), American (63 | 6.3%), and Italian (62 | 6.2%), together accounting for 68.1% of all Empire residents.
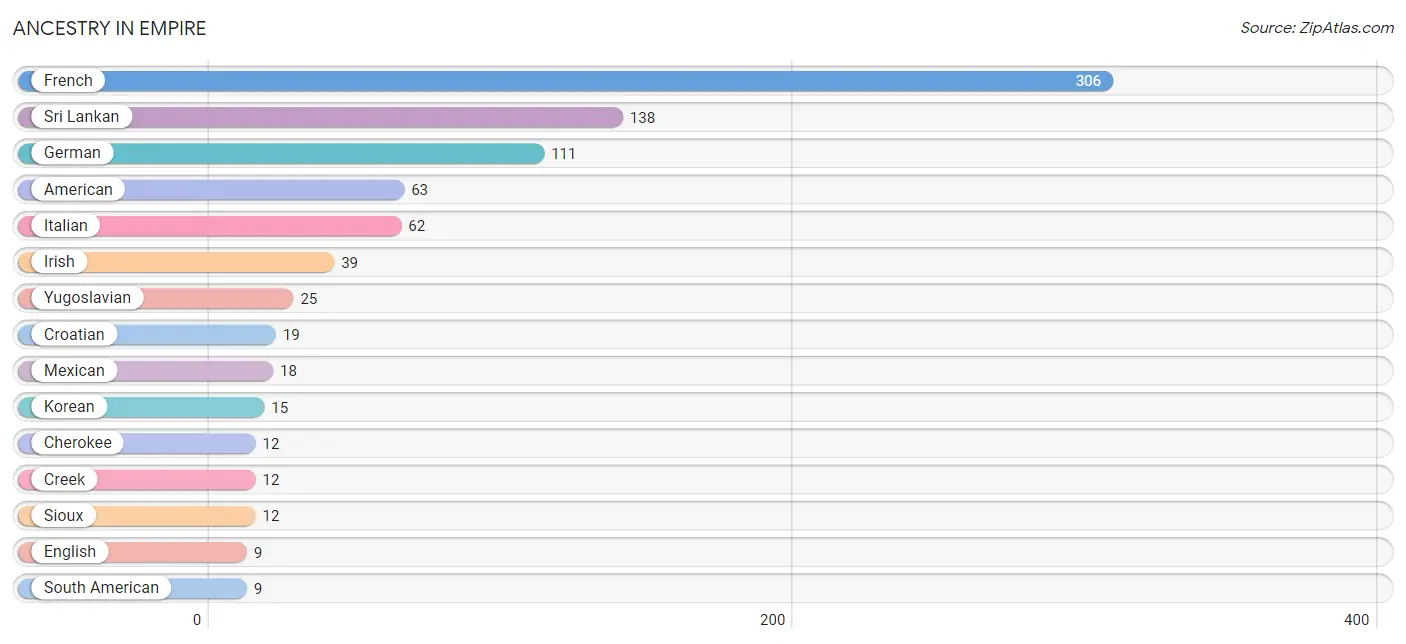
| Ancestry | # Population | % Population |
| American | 63 | 6.3% |
| Austrian | 7 | 0.7% |
| Cherokee | 12 | 1.2% |
| Creek | 12 | 1.2% |
| Croatian | 19 | 1.9% |
| English | 9 | 0.9% |
| French | 306 | 30.6% |
| German | 111 | 11.1% |
| Irish | 39 | 3.9% |
| Italian | 62 | 6.2% |
| Korean | 15 | 1.5% |
| Mexican | 18 | 1.8% |
| Sioux | 12 | 1.2% |
| South American | 9 | 0.9% |
| Sri Lankan | 138 | 13.8% |
| Uruguayan | 9 | 0.9% |
| Yugoslavian | 25 | 2.5% | View All 17 Rows |
Immigrants in Empire
The most numerous immigrant groups reported in Empire came from Asia (41 | 4.1%), South Eastern Asia (41 | 4.1%), Vietnam (41 | 4.1%), Latin America (27 | 2.7%), and Central America (18 | 1.8%), together accounting for 16.8% of all Empire residents.
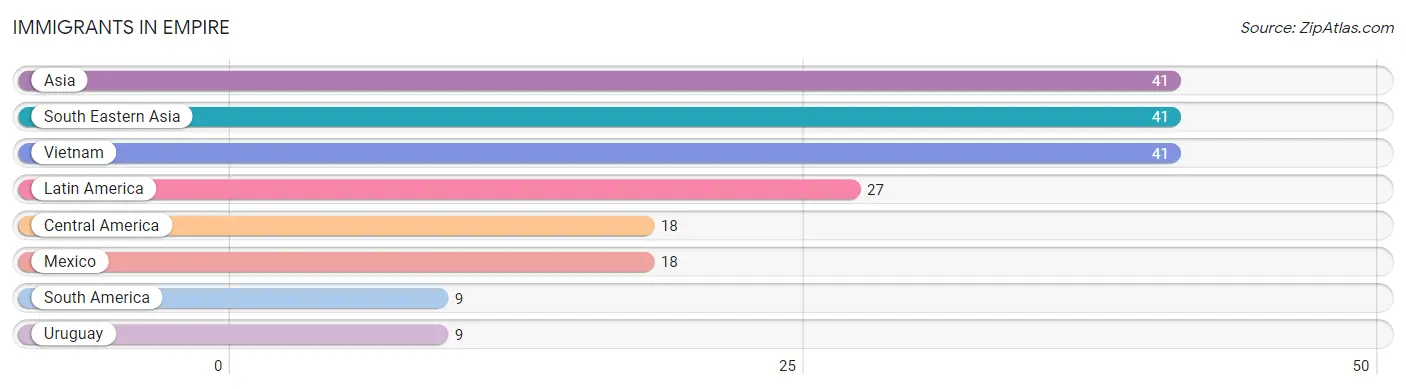
| Immigration Origin | # Population | % Population |
| Asia | 41 | 4.1% |
| Central America | 18 | 1.8% |
| Latin America | 27 | 2.7% |
| Mexico | 18 | 1.8% |
| South America | 9 | 0.9% |
| South Eastern Asia | 41 | 4.1% |
| Uruguay | 9 | 0.9% |
| Vietnam | 41 | 4.1% | View All 8 Rows |
Sex and Age in Empire
Sex and Age in Empire
The most populous age groups in Empire are 20 to 24 Years (125 | 24.2%) for men and 5 to 9 Years (90 | 18.7%) for women.
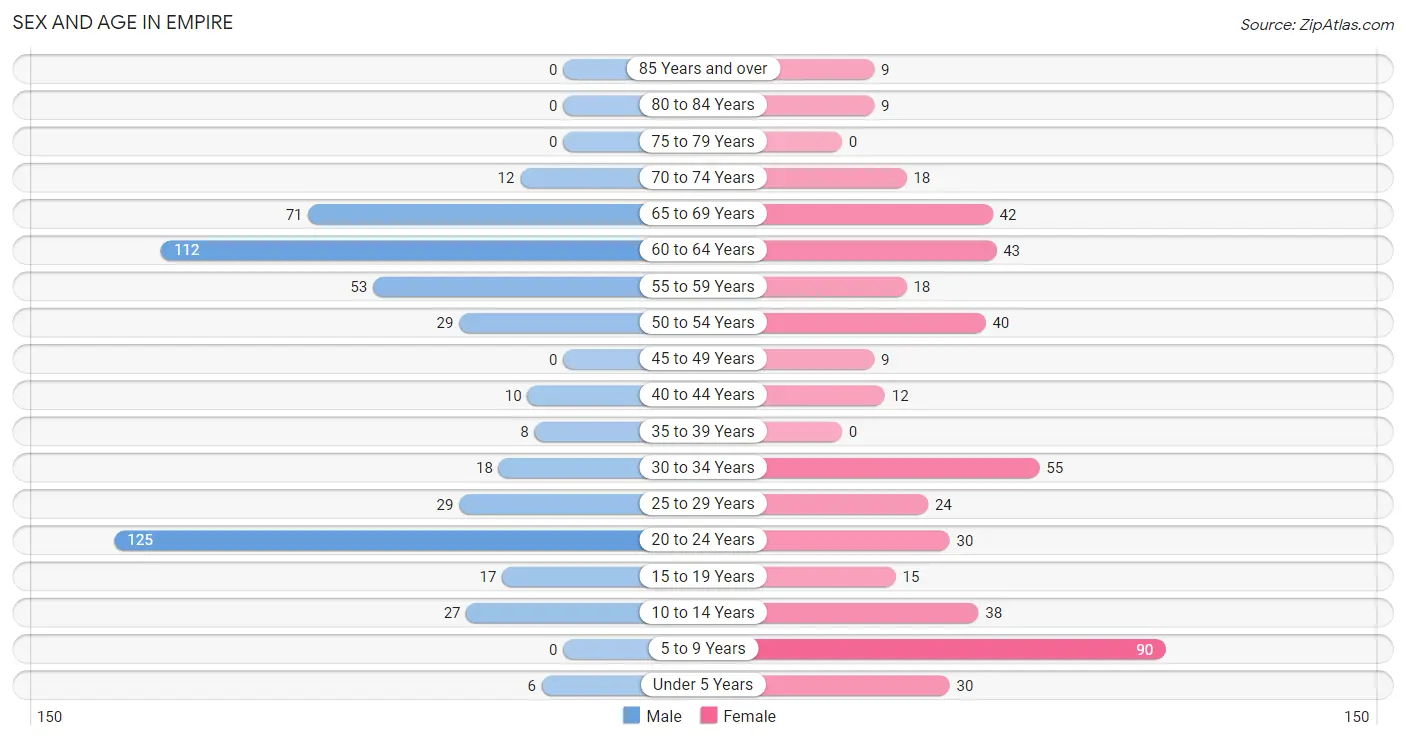
| Age Bracket | Male | Female |
| Under 5 Years | 6 (1.2%) | 30 (6.2%) |
| 5 to 9 Years | 0 (0.0%) | 90 (18.7%) |
| 10 to 14 Years | 27 (5.2%) | 38 (7.9%) |
| 15 to 19 Years | 17 (3.3%) | 15 (3.1%) |
| 20 to 24 Years | 125 (24.2%) | 30 (6.2%) |
| 25 to 29 Years | 29 (5.6%) | 24 (5.0%) |
| 30 to 34 Years | 18 (3.5%) | 55 (11.4%) |
| 35 to 39 Years | 8 (1.5%) | 0 (0.0%) |
| 40 to 44 Years | 10 (1.9%) | 12 (2.5%) |
| 45 to 49 Years | 0 (0.0%) | 9 (1.9%) |
| 50 to 54 Years | 29 (5.6%) | 40 (8.3%) |
| 55 to 59 Years | 53 (10.2%) | 18 (3.7%) |
| 60 to 64 Years | 112 (21.7%) | 43 (8.9%) |
| 65 to 69 Years | 71 (13.7%) | 42 (8.7%) |
| 70 to 74 Years | 12 (2.3%) | 18 (3.7%) |
| 75 to 79 Years | 0 (0.0%) | 0 (0.0%) |
| 80 to 84 Years | 0 (0.0%) | 9 (1.9%) |
| 85 Years and over | 0 (0.0%) | 9 (1.9%) |
| Total | 517 (100.0%) | 482 (100.0%) |
Families and Households in Empire
Median Family Size in Empire
The median family size in Empire is 3.26 persons per family, with single female/mother families (92 | 41.1%) accounting for the largest median family size of 3.52 persons per family. On the other hand, married-couple families (119 | 53.1%) represent the smallest median family size with 3.08 persons per family.
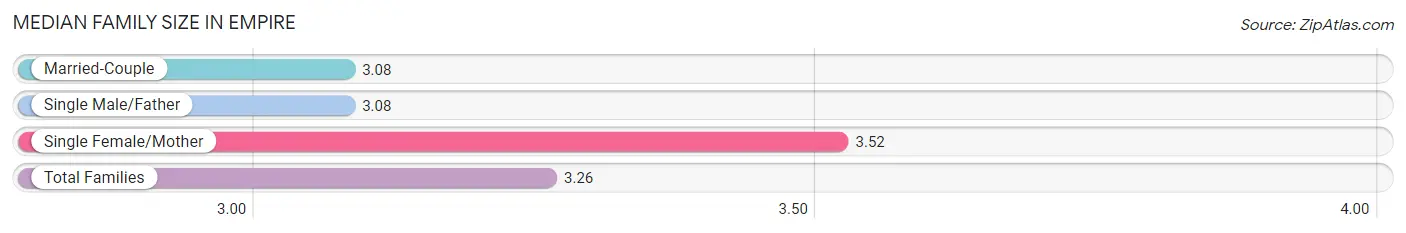
| Family Type | # Families | Family Size |
| Married-Couple | 119 (53.1%) | 3.08 |
| Single Male/Father | 13 (5.8%) | 3.08 |
| Single Female/Mother | 92 (41.1%) | 3.52 |
| Total Families | 224 (100.0%) | 3.26 |
Median Household Size in Empire
The median household size in Empire is 2.37 persons per household, with single female/mother households (92 | 21.8%) accounting for the largest median household size of 3.75 persons per household. non-family households (197 | 46.8%) represent the smallest median household size with 1.19 persons per household.
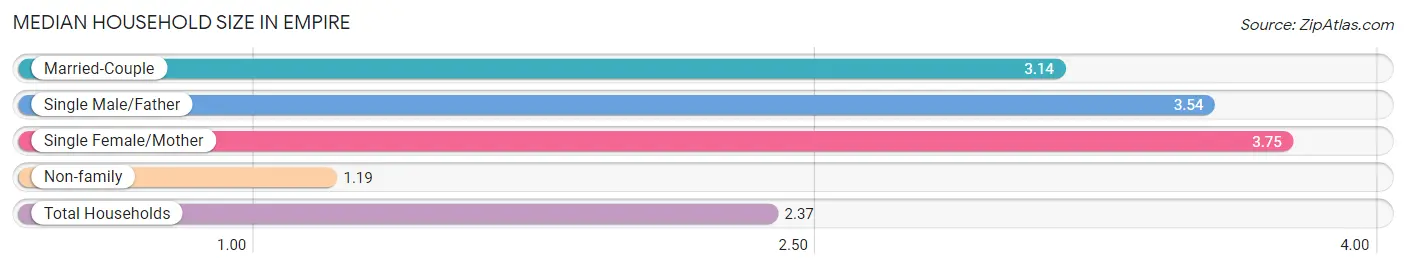
| Household Type | # Households | Household Size |
| Married-Couple | 119 (28.3%) | 3.14 |
| Single Male/Father | 13 (3.1%) | 3.54 |
| Single Female/Mother | 92 (21.8%) | 3.75 |
| Non-family | 197 (46.8%) | 1.19 |
| Total Households | 421 (100.0%) | 2.37 |
Household Size by Marriage Status in Empire
Out of a total of 421 households in Empire, 224 (53.2%) are family households, while 197 (46.8%) are nonfamily households. The most numerous type of family households are 2-person households, comprising 127, and the most common type of nonfamily households are 1-person households, comprising 160.
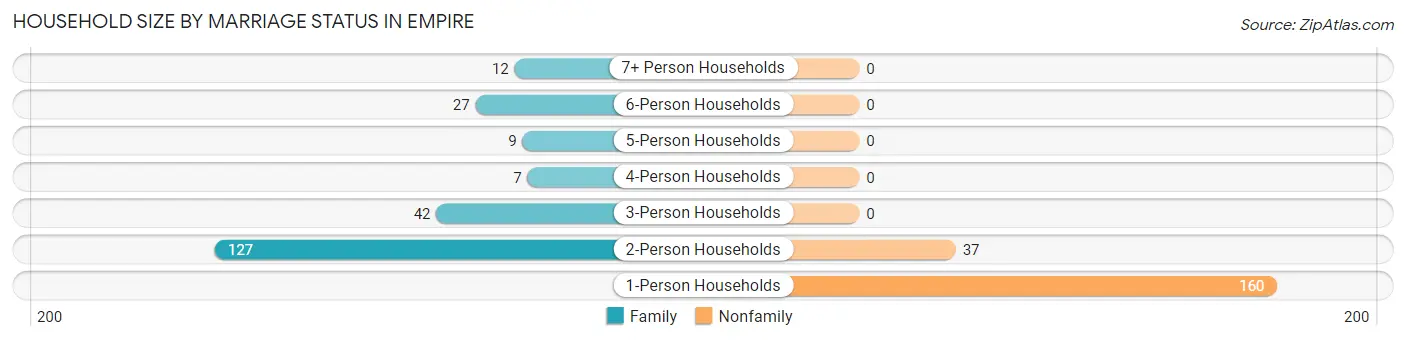
| Household Size | Family Households | Nonfamily Households |
| 1-Person Households | - | 160 (38.0%) |
| 2-Person Households | 127 (30.2%) | 37 (8.8%) |
| 3-Person Households | 42 (10.0%) | 0 (0.0%) |
| 4-Person Households | 7 (1.7%) | 0 (0.0%) |
| 5-Person Households | 9 (2.1%) | 0 (0.0%) |
| 6-Person Households | 27 (6.4%) | 0 (0.0%) |
| 7+ Person Households | 12 (2.9%) | 0 (0.0%) |
| Total | 224 (53.2%) | 197 (46.8%) |
Female Fertility in Empire
Fertility by Age in Empire
Average fertility rate in Empire is 59.0 births per 1,000 women. Women in the age bracket of 20 to 34 years have the highest fertility rate with 83.0 births per 1,000 women. Women in the age bracket of 20 to 34 years acount for 100.0% of all women with births.
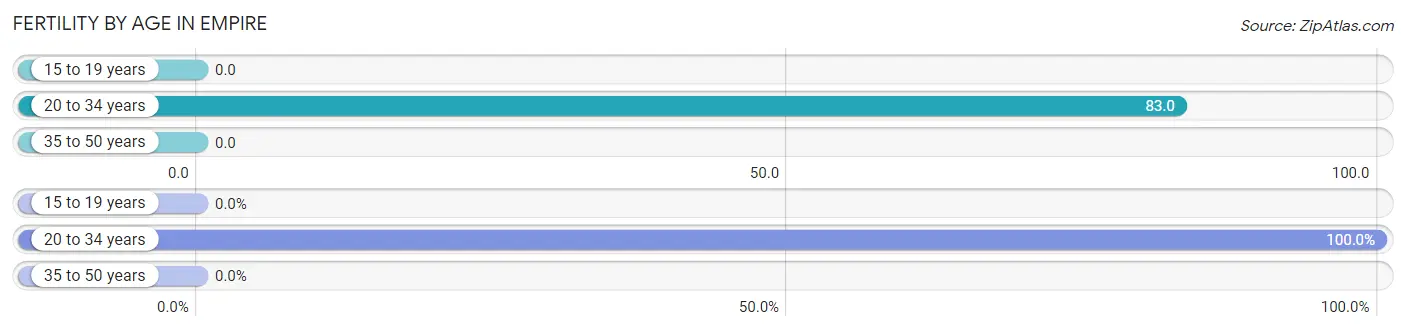
| Age Bracket | Women with Births | Births / 1,000 Women |
| 15 to 19 years | 0 (0.0%) | 0.0 |
| 20 to 34 years | 9 (100.0%) | 83.0 |
| 35 to 50 years | 0 (0.0%) | 0.0 |
| Total | 9 (100.0%) | 59.0 |
Fertility by Age by Marriage Status in Empire
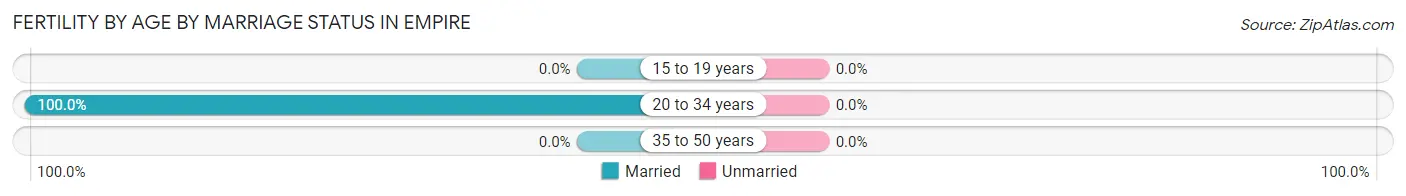
| Age Bracket | Married | Unmarried |
| 15 to 19 years | 0 (0.0%) | 0 (0.0%) |
| 20 to 34 years | 9 (100.0%) | 0 (0.0%) |
| 35 to 50 years | 0 (0.0%) | 0 (0.0%) |
| Total | 9 (100.0%) | 0 (0.0%) |
Fertility by Education in Empire
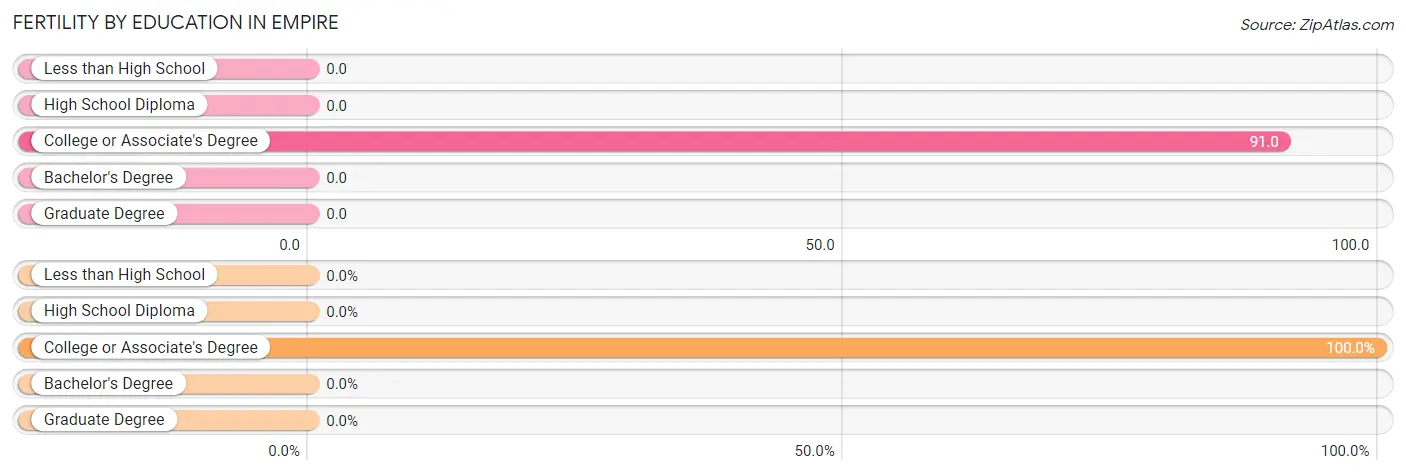
| Educational Attainment | Women with Births | Births / 1,000 Women |
| Less than High School | 0 (0.0%) | 0.0 |
| High School Diploma | 0 (0.0%) | 0.0 |
| College or Associate's Degree | 9 (100.0%) | 91.0 |
| Bachelor's Degree | 0 (0.0%) | 0.0 |
| Graduate Degree | 0 (0.0%) | 0.0 |
| Total | 9 (100.0%) | 59.0 |
Fertility by Education by Marriage Status in Empire
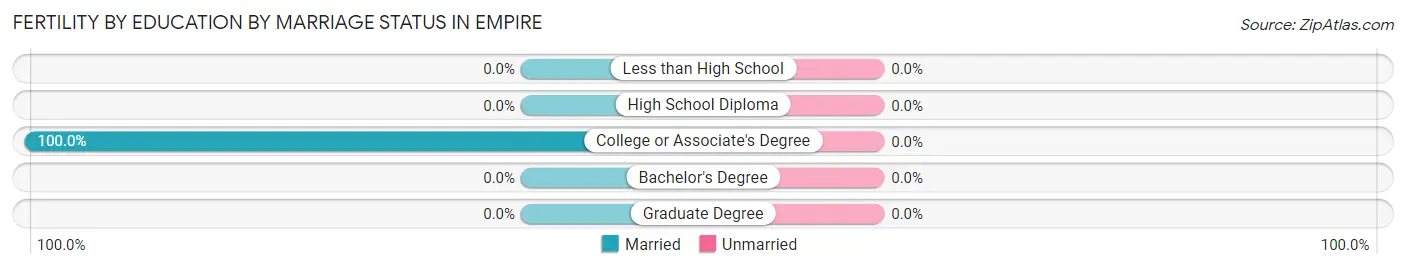
| Educational Attainment | Married | Unmarried |
| Less than High School | 0 (0.0%) | 0 (0.0%) |
| High School Diploma | 0 (0.0%) | 0 (0.0%) |
| College or Associate's Degree | 9 (100.0%) | 0 (0.0%) |
| Bachelor's Degree | 0 (0.0%) | 0 (0.0%) |
| Graduate Degree | 0 (0.0%) | 0 (0.0%) |
| Total | 9 (100.0%) | 0 (0.0%) |
Employment Characteristics in Empire
Employment by Class of Employer in Empire
Among the 279 employed individuals in Empire, private company employees (173 | 62.0%), local government employees (40 | 14.3%), and federal government employees (27 | 9.7%) make up the most common classes of employment.
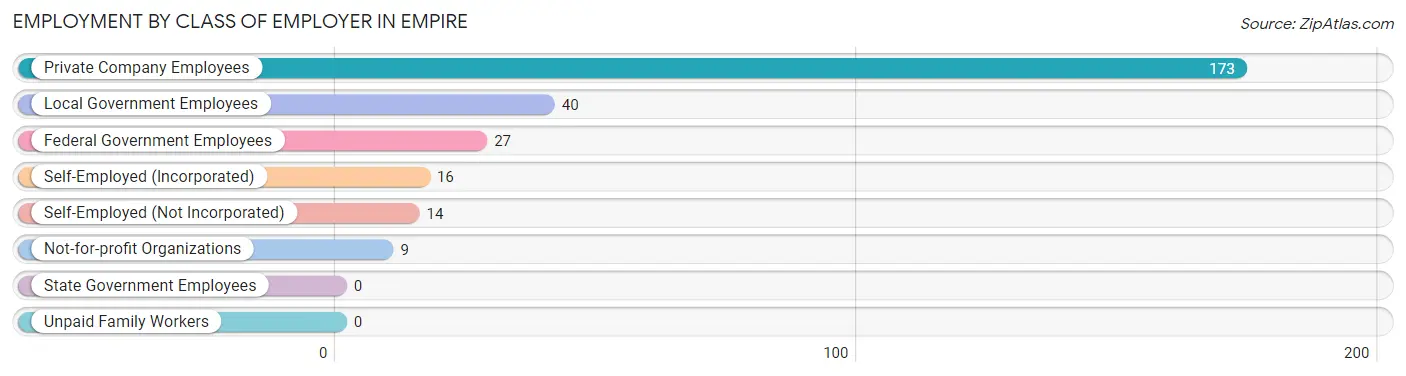
| Employer Class | # Employees | % Employees |
| Private Company Employees | 173 | 62.0% |
| Self-Employed (Incorporated) | 16 | 5.7% |
| Self-Employed (Not Incorporated) | 14 | 5.0% |
| Not-for-profit Organizations | 9 | 3.2% |
| Local Government Employees | 40 | 14.3% |
| State Government Employees | 0 | 0.0% |
| Federal Government Employees | 27 | 9.7% |
| Unpaid Family Workers | 0 | 0.0% |
| Total | 279 | 100.0% |
Employment Status by Age in Empire
According to the labor force statistics for Empire, out of the total population over 16 years of age (808), 54.5% or 440 individuals are in the labor force, with 5.5% or 24 of them unemployed. The age group with the highest labor force participation rate is 25 to 29 years, with 100.0% or 53 individuals in the labor force. Within the labor force, the 35 to 44 years age range has the highest percentage of unemployed individuals, with 40.0% or 8 of them being unemployed.
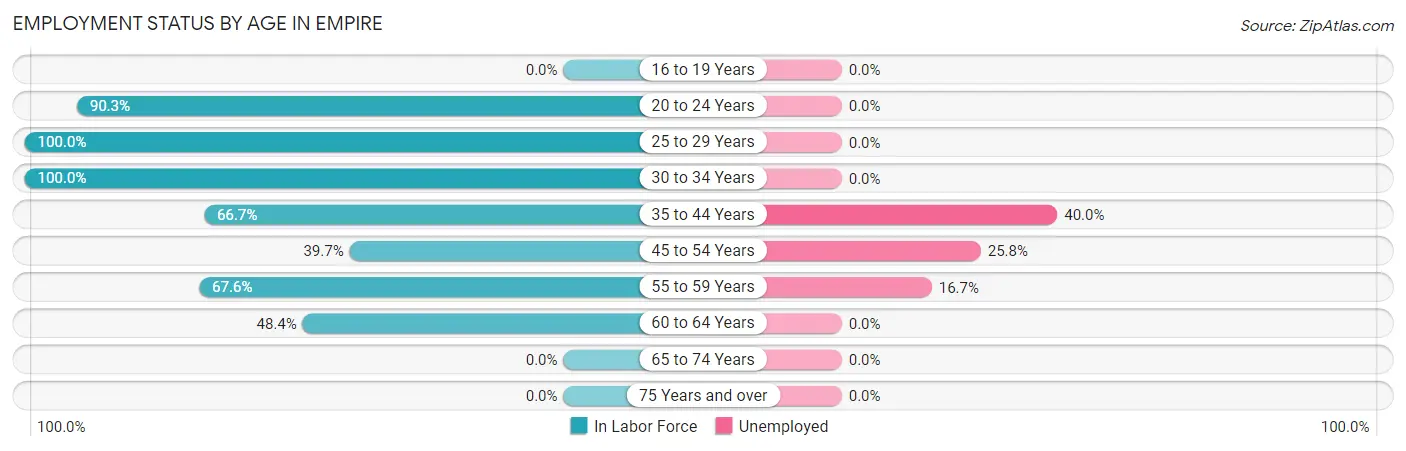
| Age Bracket | In Labor Force | Unemployed |
| 16 to 19 Years | 0 (0.0%) | 0 (0.0%) |
| 20 to 24 Years | 140 (90.3%) | 0 (0.0%) |
| 25 to 29 Years | 53 (100.0%) | 0 (0.0%) |
| 30 to 34 Years | 73 (100.0%) | 0 (0.0%) |
| 35 to 44 Years | 20 (66.7%) | 8 (40.0%) |
| 45 to 54 Years | 31 (39.7%) | 8 (25.8%) |
| 55 to 59 Years | 48 (67.6%) | 8 (16.7%) |
| 60 to 64 Years | 75 (48.4%) | 0 (0.0%) |
| 65 to 74 Years | 0 (0.0%) | 0 (0.0%) |
| 75 Years and over | 0 (0.0%) | 0 (0.0%) |
| Total | 440 (54.5%) | 24 (5.5%) |
Employment Status by Educational Attainment in Empire
According to labor force statistics for Empire, 65.2% of individuals (300) out of the total population between 25 and 64 years of age (460) are in the labor force, with 8.2% or 25 of them being unemployed. The group with the highest labor force participation rate are those with the educational attainment of college / associate degree, with 89.8% or 106 individuals in the labor force. Within the labor force, individuals with less than high school education have the highest percentage of unemployment, with 22.5% or 16 of them being unemployed.
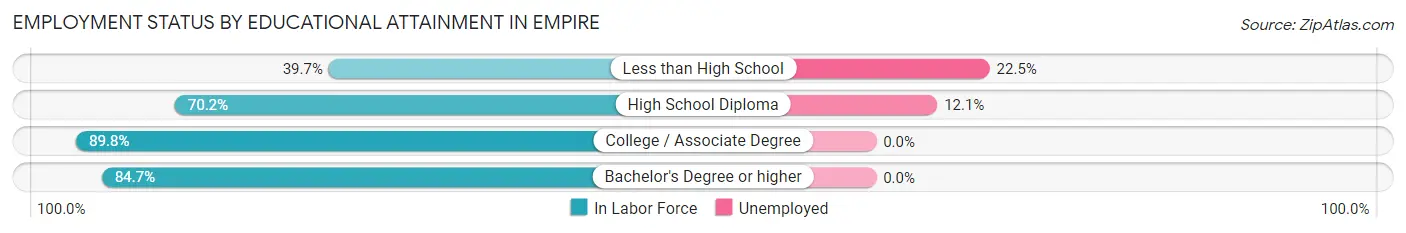
| Educational Attainment | In Labor Force | Unemployed |
| Less than High School | 71 (39.7%) | 40 (22.5%) |
| High School Diploma | 73 (70.2%) | 13 (12.1%) |
| College / Associate Degree | 106 (89.8%) | 0 (0.0%) |
| Bachelor's Degree or higher | 50 (84.7%) | 0 (0.0%) |
| Total | 300 (65.2%) | 38 (8.2%) |
Employment Occupations by Sex in Empire
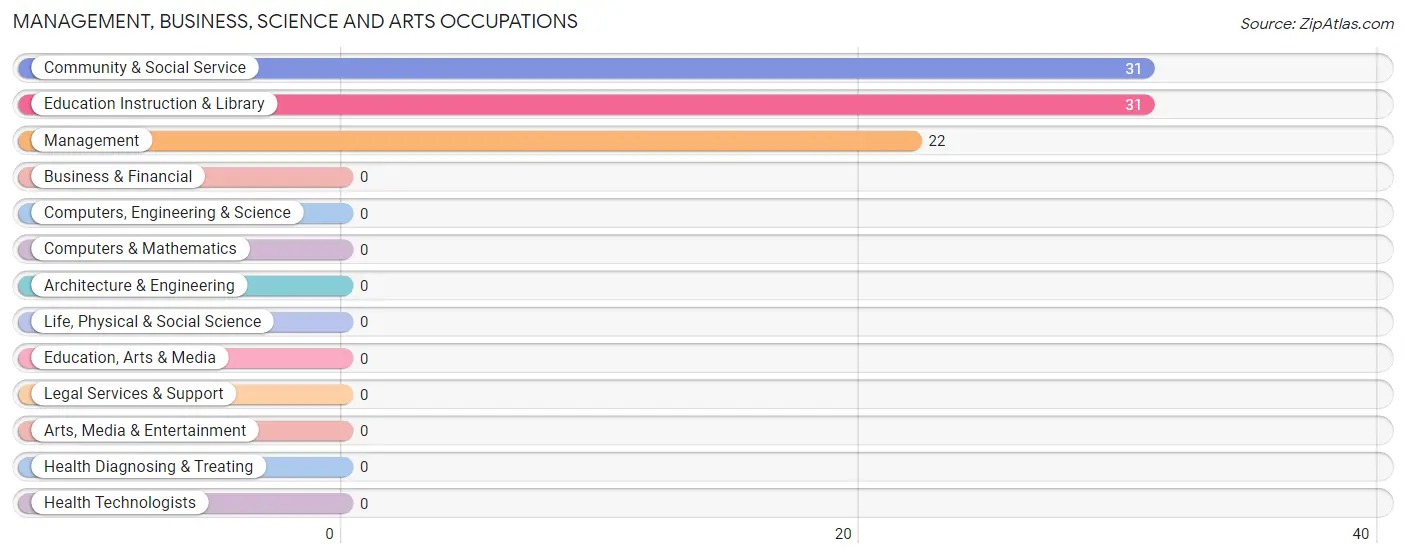
Management, Business, Science and Arts Occupations
The most common Management, Business, Science and Arts occupations in Empire are Community & Social Service (31 | 7.6%), Education Instruction & Library (31 | 7.6%), and Management (22 | 5.4%).
Management, Business, Science and Arts Occupations by Sex
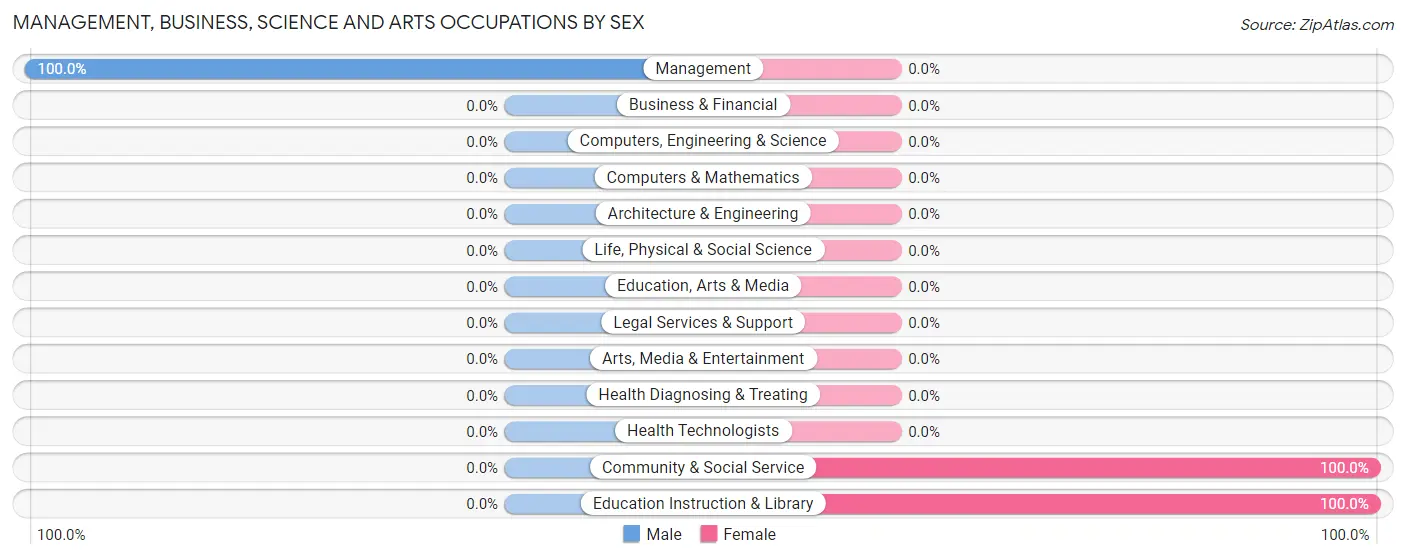
| Occupation | Male | Female |
| Management | 22 (100.0%) | 0 (0.0%) |
| Business & Financial | 0 (0.0%) | 0 (0.0%) |
| Computers, Engineering & Science | 0 (0.0%) | 0 (0.0%) |
| Computers & Mathematics | 0 (0.0%) | 0 (0.0%) |
| Architecture & Engineering | 0 (0.0%) | 0 (0.0%) |
| Life, Physical & Social Science | 0 (0.0%) | 0 (0.0%) |
| Community & Social Service | 0 (0.0%) | 31 (100.0%) |
| Education, Arts & Media | 0 (0.0%) | 0 (0.0%) |
| Legal Services & Support | 0 (0.0%) | 0 (0.0%) |
| Education Instruction & Library | 0 (0.0%) | 31 (100.0%) |
| Arts, Media & Entertainment | 0 (0.0%) | 0 (0.0%) |
| Health Diagnosing & Treating | 0 (0.0%) | 0 (0.0%) |
| Health Technologists | 0 (0.0%) | 0 (0.0%) |
| Total (Category) | 22 (41.5%) | 31 (58.5%) |
| Total (Overall) | 267 (65.3%) | 142 (34.7%) |
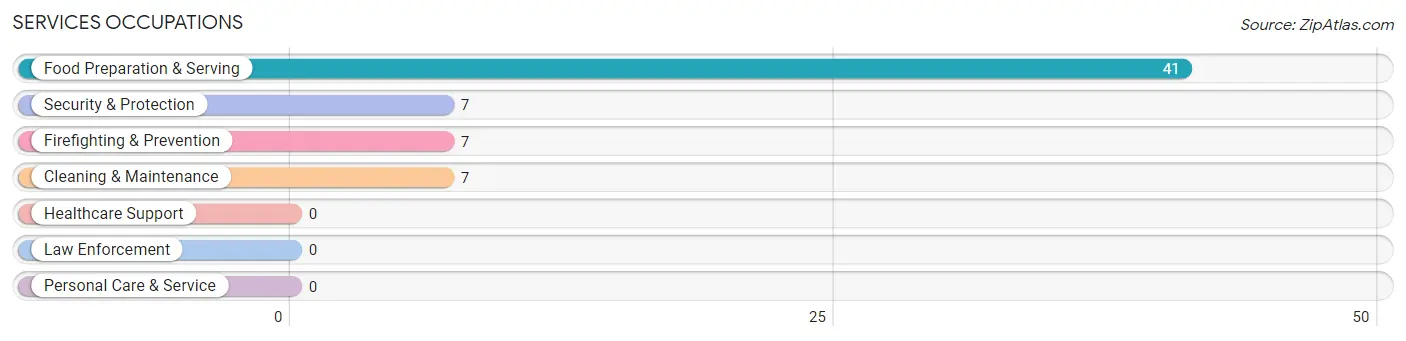
Services Occupations
The most common Services occupations in Empire are Food Preparation & Serving (41 | 10.0%), Security & Protection (7 | 1.7%), Firefighting & Prevention (7 | 1.7%), and Cleaning & Maintenance (7 | 1.7%).
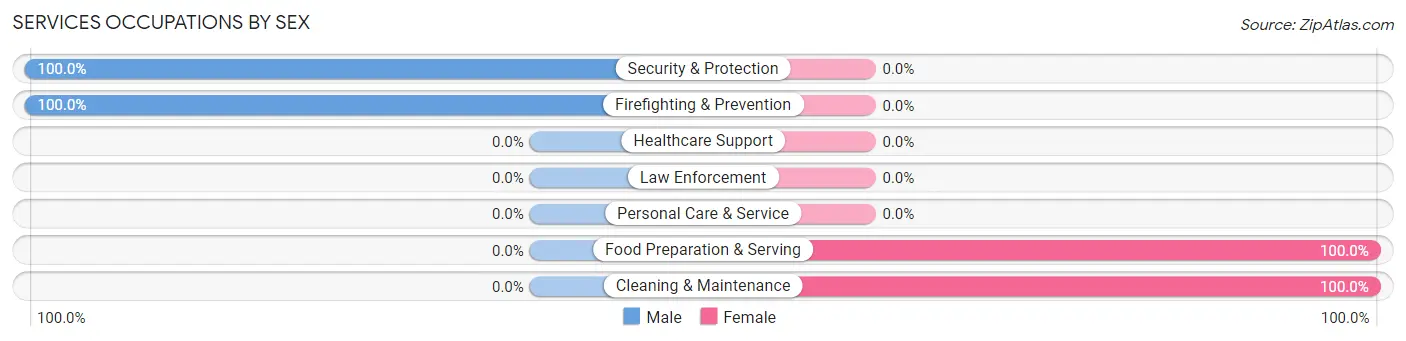
Services Occupations by Sex
Within the Services occupations in Empire, the most male-oriented occupations are Security & Protection (100.0%), and Firefighting & Prevention (100.0%), while the most female-oriented occupations are Food Preparation & Serving (100.0%), and Cleaning & Maintenance (100.0%).
| Occupation | Male | Female |
| Healthcare Support | 0 (0.0%) | 0 (0.0%) |
| Security & Protection | 7 (100.0%) | 0 (0.0%) |
| Firefighting & Prevention | 7 (100.0%) | 0 (0.0%) |
| Law Enforcement | 0 (0.0%) | 0 (0.0%) |
| Food Preparation & Serving | 0 (0.0%) | 41 (100.0%) |
| Cleaning & Maintenance | 0 (0.0%) | 7 (100.0%) |
| Personal Care & Service | 0 (0.0%) | 0 (0.0%) |
| Total (Category) | 7 (12.7%) | 48 (87.3%) |
| Total (Overall) | 267 (65.3%) | 142 (34.7%) |
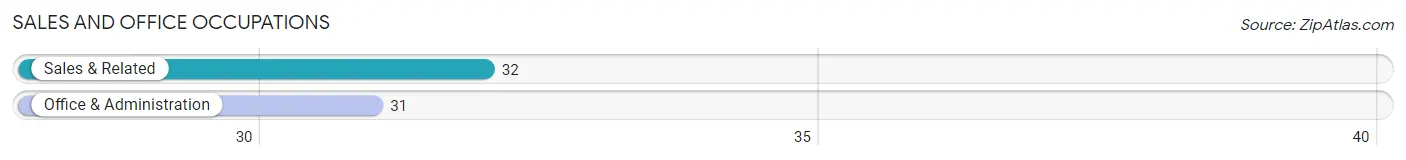
Sales and Office Occupations
The most common Sales and Office occupations in Empire are Sales & Related (32 | 7.8%), and Office & Administration (31 | 7.6%).
Sales and Office Occupations by Sex
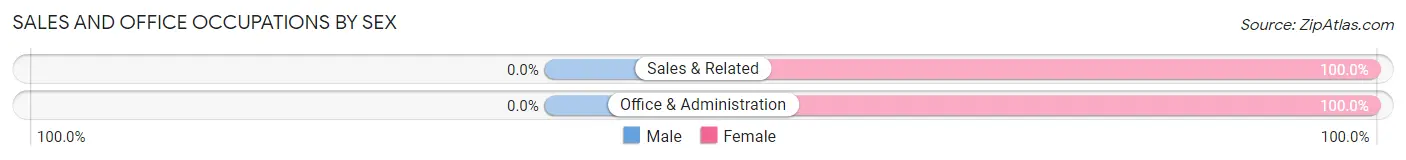
| Occupation | Male | Female |
| Sales & Related | 0 (0.0%) | 32 (100.0%) |
| Office & Administration | 0 (0.0%) | 31 (100.0%) |
| Total (Category) | 0 (0.0%) | 63 (100.0%) |
| Total (Overall) | 267 (65.3%) | 142 (34.7%) |
Natural Resources, Construction and Maintenance Occupations
The most common Natural Resources, Construction and Maintenance occupations in Empire are Construction & Extraction (59 | 14.4%), and Farming, Fishing & Forestry (34 | 8.3%).
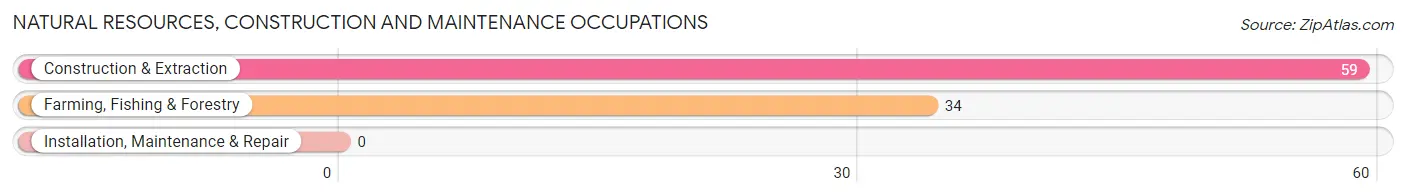
Natural Resources, Construction and Maintenance Occupations by Sex
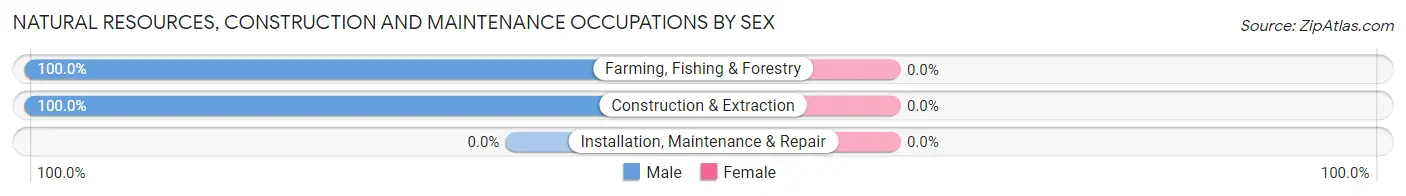
| Occupation | Male | Female |
| Farming, Fishing & Forestry | 34 (100.0%) | 0 (0.0%) |
| Construction & Extraction | 59 (100.0%) | 0 (0.0%) |
| Installation, Maintenance & Repair | 0 (0.0%) | 0 (0.0%) |
| Total (Category) | 93 (100.0%) | 0 (0.0%) |
| Total (Overall) | 267 (65.3%) | 142 (34.7%) |
Production, Transportation and Moving Occupations
The most common Production, Transportation and Moving occupations in Empire are Transportation (110 | 26.9%), and Production (35 | 8.6%).
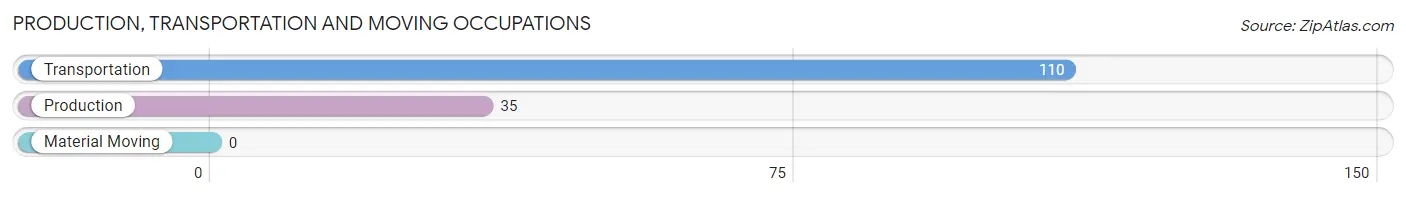
Production, Transportation and Moving Occupations by Sex
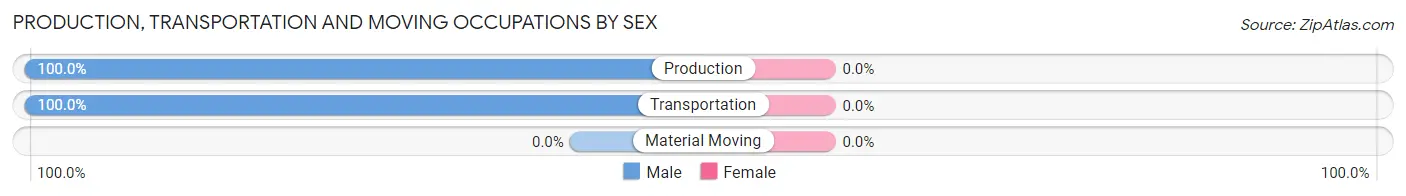
| Occupation | Male | Female |
| Production | 35 (100.0%) | 0 (0.0%) |
| Transportation | 110 (100.0%) | 0 (0.0%) |
| Material Moving | 0 (0.0%) | 0 (0.0%) |
| Total (Category) | 145 (100.0%) | 0 (0.0%) |
| Total (Overall) | 267 (65.3%) | 142 (34.7%) |
Employment Industries by Sex in Empire
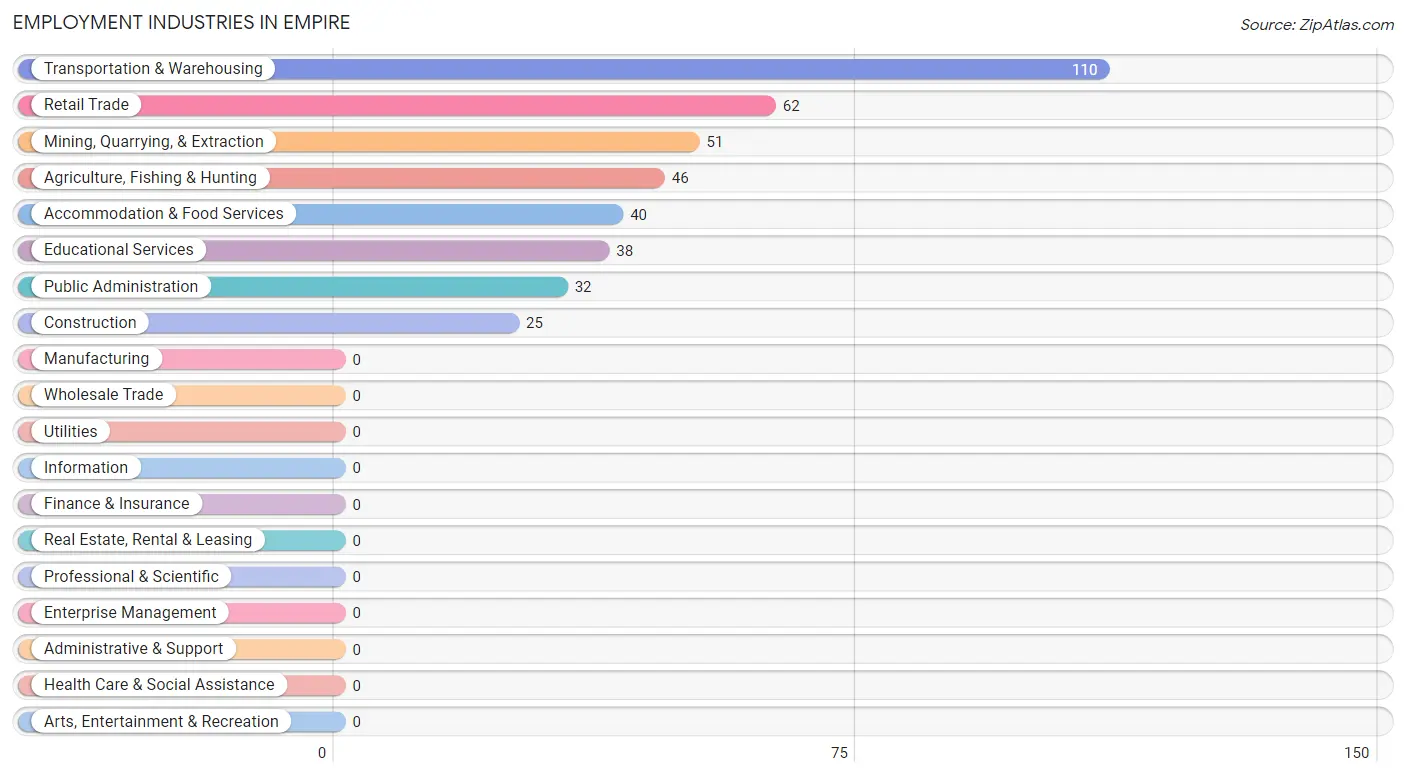
Employment Industries in Empire
The major employment industries in Empire include Transportation & Warehousing (110 | 26.9%), Retail Trade (62 | 15.2%), Mining, Quarrying, & Extraction (51 | 12.5%), Agriculture, Fishing & Hunting (46 | 11.3%), and Accommodation & Food Services (40 | 9.8%).
Employment Industries by Sex in Empire
The Empire industries that see more men than women are Construction (100.0%), Transportation & Warehousing (100.0%), and Mining, Quarrying, & Extraction (84.3%), whereas the industries that tend to have a higher number of women are Educational Services (100.0%), Retail Trade (88.7%), and Accommodation & Food Services (45.0%).
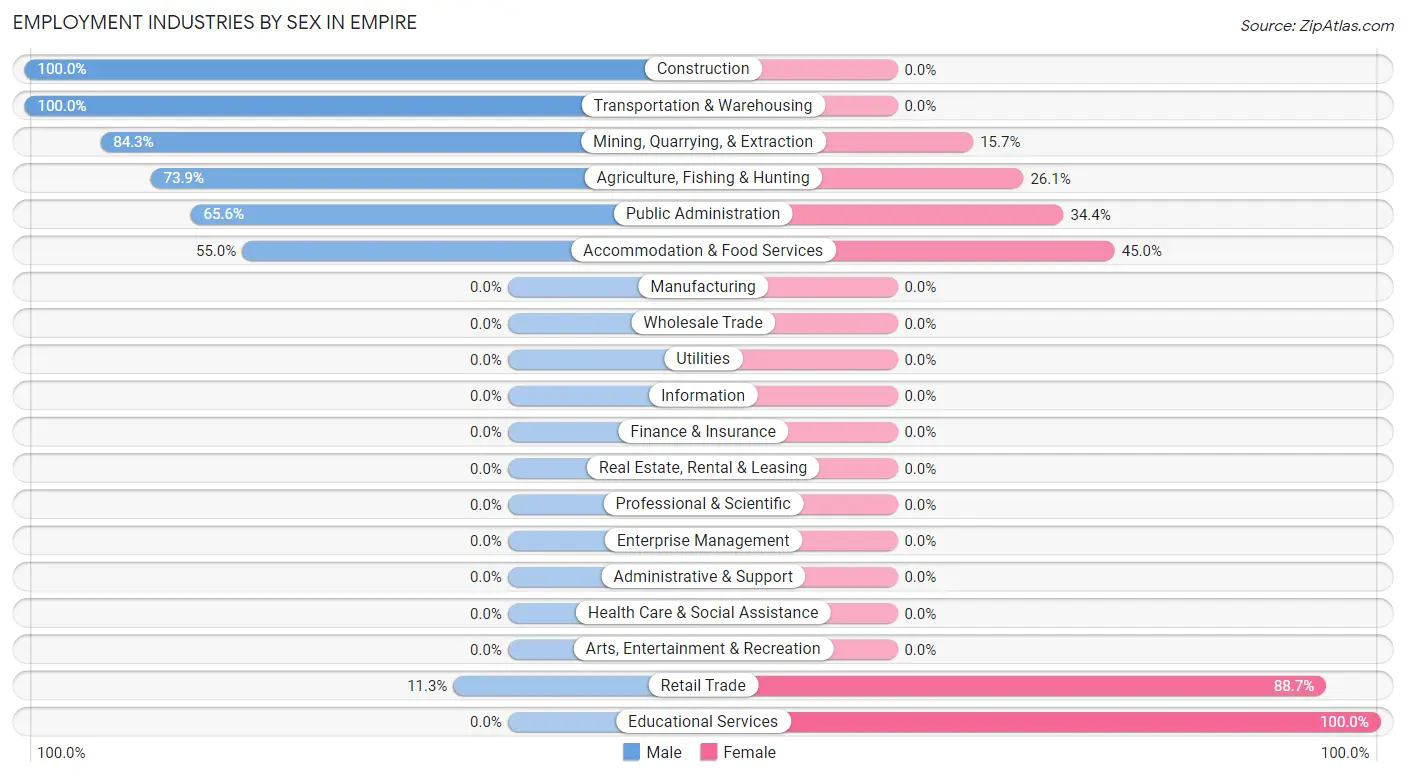
| Industry | Male | Female |
| Agriculture, Fishing & Hunting | 34 (73.9%) | 12 (26.1%) |
| Mining, Quarrying, & Extraction | 43 (84.3%) | 8 (15.7%) |
| Construction | 25 (100.0%) | 0 (0.0%) |
| Manufacturing | 0 (0.0%) | 0 (0.0%) |
| Wholesale Trade | 0 (0.0%) | 0 (0.0%) |
| Retail Trade | 7 (11.3%) | 55 (88.7%) |
| Transportation & Warehousing | 110 (100.0%) | 0 (0.0%) |
| Utilities | 0 (0.0%) | 0 (0.0%) |
| Information | 0 (0.0%) | 0 (0.0%) |
| Finance & Insurance | 0 (0.0%) | 0 (0.0%) |
| Real Estate, Rental & Leasing | 0 (0.0%) | 0 (0.0%) |
| Professional & Scientific | 0 (0.0%) | 0 (0.0%) |
| Enterprise Management | 0 (0.0%) | 0 (0.0%) |
| Administrative & Support | 0 (0.0%) | 0 (0.0%) |
| Educational Services | 0 (0.0%) | 38 (100.0%) |
| Health Care & Social Assistance | 0 (0.0%) | 0 (0.0%) |
| Arts, Entertainment & Recreation | 0 (0.0%) | 0 (0.0%) |
| Accommodation & Food Services | 22 (55.0%) | 18 (45.0%) |
| Public Administration | 21 (65.6%) | 11 (34.4%) |
| Total | 267 (65.3%) | 142 (34.7%) |
Education in Empire
School Enrollment in Empire
The most common levels of schooling among the 268 students in Empire are high school (52 | 19.4%), middle school (46 | 17.2%), and kindergarten (40 | 14.9%).
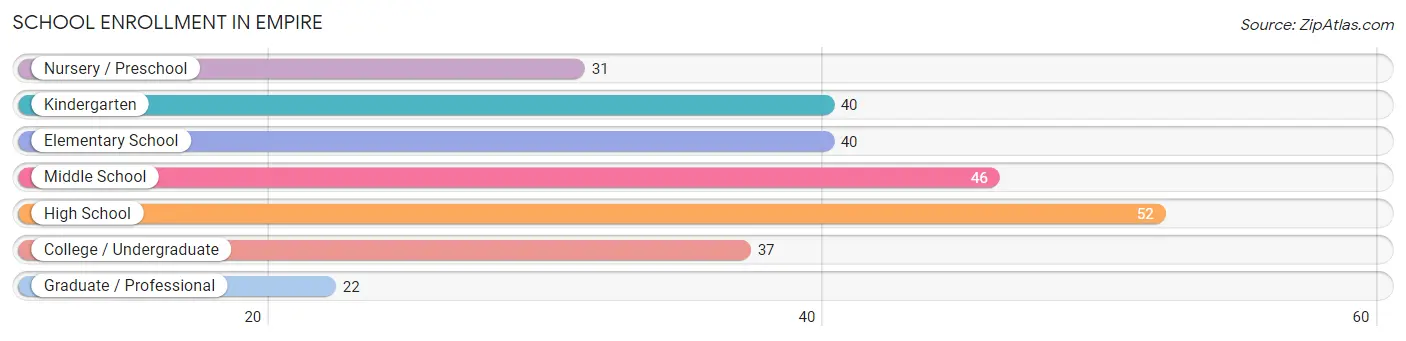
| School Level | # Students | % Students |
| Nursery / Preschool | 31 | 11.6% |
| Kindergarten | 40 | 14.9% |
| Elementary School | 40 | 14.9% |
| Middle School | 46 | 17.2% |
| High School | 52 | 19.4% |
| College / Undergraduate | 37 | 13.8% |
| Graduate / Professional | 22 | 8.2% |
| Total | 268 | 100.0% |
School Enrollment by Age by Funding Source in Empire
Out of a total of 268 students who are enrolled in schools in Empire, 41 (15.3%) attend a private institution, while the remaining 227 (84.7%) are enrolled in public schools. The age group of 20 to 24 year olds has the highest likelihood of being enrolled in private schools, with 31 (73.8% in the age bracket) enrolled. Conversely, the age group of 3 to 4 year olds has the lowest likelihood of being enrolled in a private school, with 21 (100.0% in the age bracket) attending a public institution.
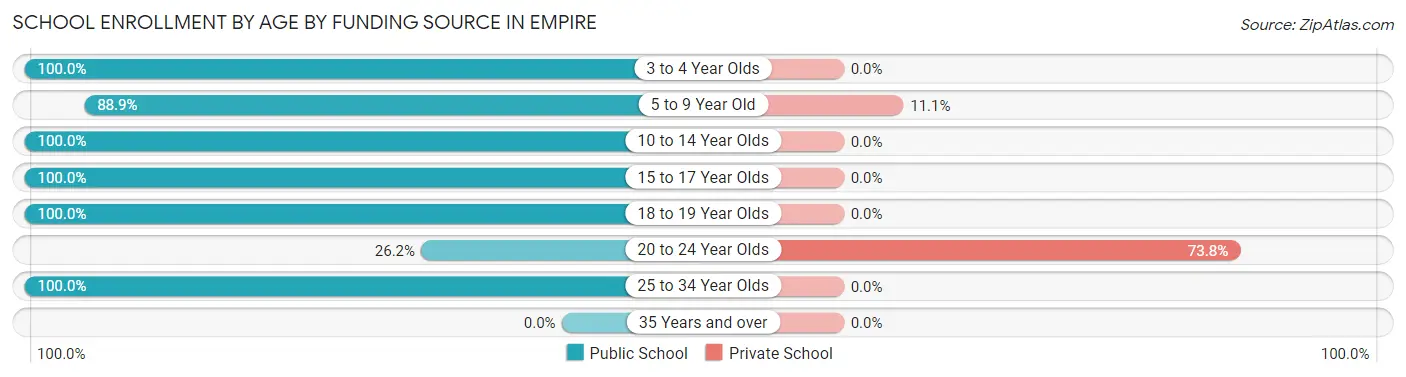
| Age Bracket | Public School | Private School |
| 3 to 4 Year Olds | 21 (100.0%) | 0 (0.0%) |
| 5 to 9 Year Old | 80 (88.9%) | 10 (11.1%) |
| 10 to 14 Year Olds | 65 (100.0%) | 0 (0.0%) |
| 15 to 17 Year Olds | 10 (100.0%) | 0 (0.0%) |
| 18 to 19 Year Olds | 22 (100.0%) | 0 (0.0%) |
| 20 to 24 Year Olds | 11 (26.2%) | 31 (73.8%) |
| 25 to 34 Year Olds | 18 (100.0%) | 0 (0.0%) |
| 35 Years and over | 0 (0.0%) | 0 (0.0%) |
| Total | 227 (84.7%) | 41 (15.3%) |
Educational Attainment by Field of Study in Empire
Liberal arts & history (23 | 34.8%), science & technology (21 | 31.8%), education (15 | 22.7%), and business (7 | 10.6%) are the most common fields of study among 66 individuals in Empire who have obtained a bachelor's degree or higher.
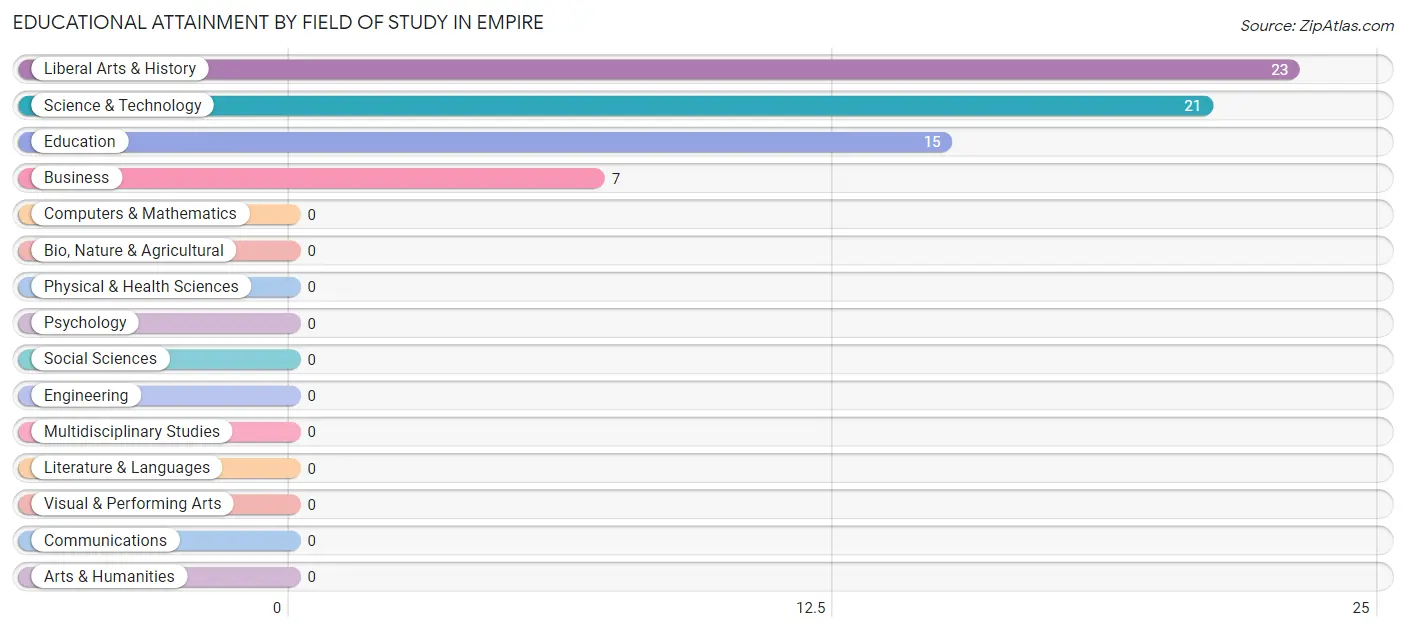
| Field of Study | # Graduates | % Graduates |
| Computers & Mathematics | 0 | 0.0% |
| Bio, Nature & Agricultural | 0 | 0.0% |
| Physical & Health Sciences | 0 | 0.0% |
| Psychology | 0 | 0.0% |
| Social Sciences | 0 | 0.0% |
| Engineering | 0 | 0.0% |
| Multidisciplinary Studies | 0 | 0.0% |
| Science & Technology | 21 | 31.8% |
| Business | 7 | 10.6% |
| Education | 15 | 22.7% |
| Literature & Languages | 0 | 0.0% |
| Liberal Arts & History | 23 | 34.8% |
| Visual & Performing Arts | 0 | 0.0% |
| Communications | 0 | 0.0% |
| Arts & Humanities | 0 | 0.0% |
| Total | 66 | 100.0% |
Transportation & Commute in Empire
Vehicle Availability by Sex in Empire
The most prevalent vehicle ownership categories in Empire are males with 1 vehicle (43, accounting for 27.7%) and females with 1 vehicle (62, making up 34.7%).
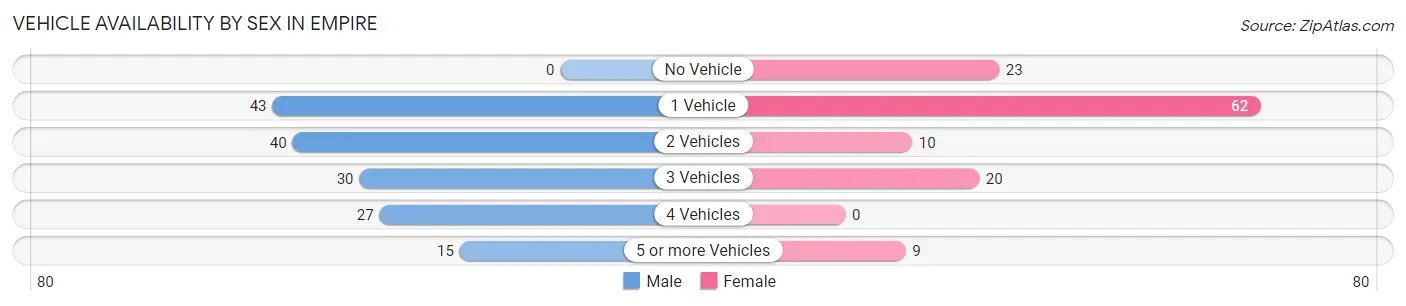
| Vehicles Available | Male | Female |
| No Vehicle | 0 (0.0%) | 23 (18.5%) |
| 1 Vehicle | 43 (27.7%) | 62 (50.0%) |
| 2 Vehicles | 40 (25.8%) | 10 (8.1%) |
| 3 Vehicles | 30 (19.4%) | 20 (16.1%) |
| 4 Vehicles | 27 (17.4%) | 0 (0.0%) |
| 5 or more Vehicles | 15 (9.7%) | 9 (7.3%) |
| Total | 155 (100.0%) | 124 (100.0%) |
Commute Time in Empire
The most frequently occuring commute durations in Empire are 5 to 9 minutes (97 commuters, 36.5%), 30 to 34 minutes (85 commuters, 32.0%), and 60 to 89 minutes (23 commuters, 8.6%).
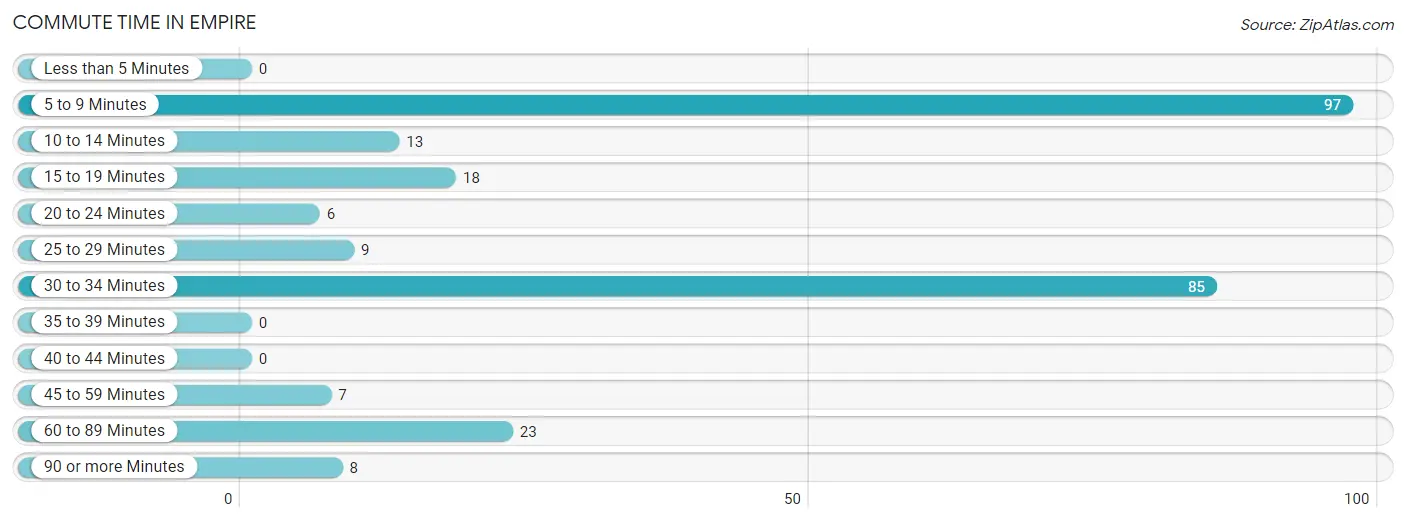
| Commute Time | # Commuters | % Commuters |
| Less than 5 Minutes | 0 | 0.0% |
| 5 to 9 Minutes | 97 | 36.5% |
| 10 to 14 Minutes | 13 | 4.9% |
| 15 to 19 Minutes | 18 | 6.8% |
| 20 to 24 Minutes | 6 | 2.3% |
| 25 to 29 Minutes | 9 | 3.4% |
| 30 to 34 Minutes | 85 | 32.0% |
| 35 to 39 Minutes | 0 | 0.0% |
| 40 to 44 Minutes | 0 | 0.0% |
| 45 to 59 Minutes | 7 | 2.6% |
| 60 to 89 Minutes | 23 | 8.6% |
| 90 or more Minutes | 8 | 3.0% |
Commute Time by Sex in Empire
The most common commute times in Empire are 5 to 9 minutes (75 commuters, 50.0%) for males and 30 to 34 minutes (41 commuters, 35.3%) for females.
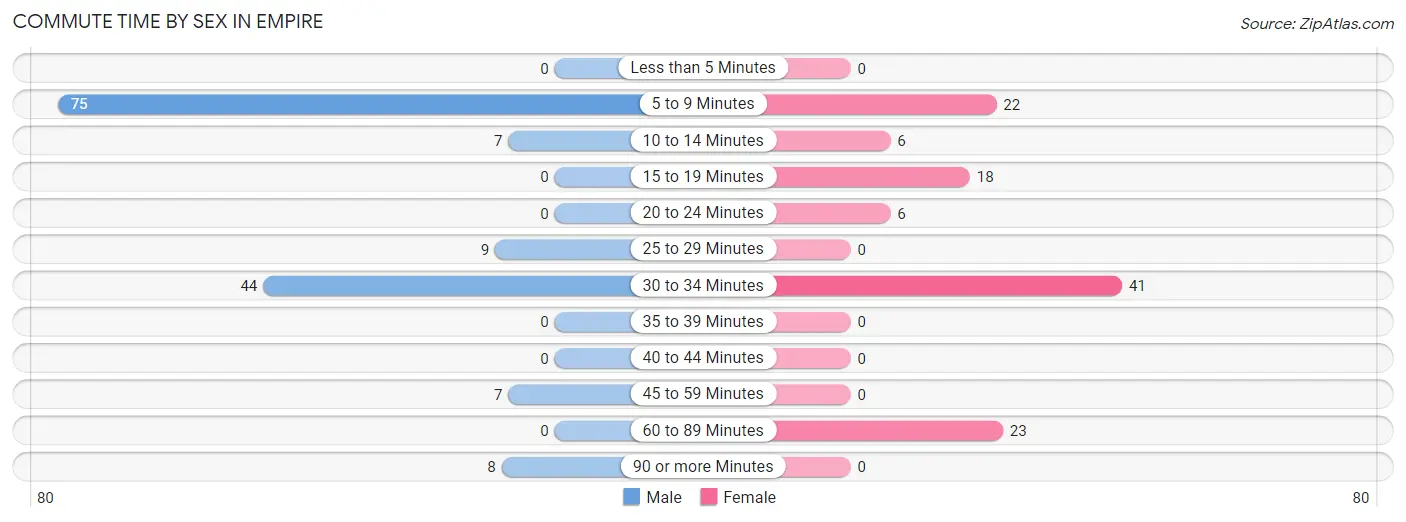
| Commute Time | Male | Female |
| Less than 5 Minutes | 0 (0.0%) | 0 (0.0%) |
| 5 to 9 Minutes | 75 (50.0%) | 22 (19.0%) |
| 10 to 14 Minutes | 7 (4.7%) | 6 (5.2%) |
| 15 to 19 Minutes | 0 (0.0%) | 18 (15.5%) |
| 20 to 24 Minutes | 0 (0.0%) | 6 (5.2%) |
| 25 to 29 Minutes | 9 (6.0%) | 0 (0.0%) |
| 30 to 34 Minutes | 44 (29.3%) | 41 (35.3%) |
| 35 to 39 Minutes | 0 (0.0%) | 0 (0.0%) |
| 40 to 44 Minutes | 0 (0.0%) | 0 (0.0%) |
| 45 to 59 Minutes | 7 (4.7%) | 0 (0.0%) |
| 60 to 89 Minutes | 0 (0.0%) | 23 (19.8%) |
| 90 or more Minutes | 8 (5.3%) | 0 (0.0%) |
Time of Departure to Work by Sex in Empire
The most frequent times of departure to work in Empire are 5:30 AM to 5:59 AM (43, 28.7%) for males and 8:00 AM to 8:29 AM (66, 56.9%) for females.
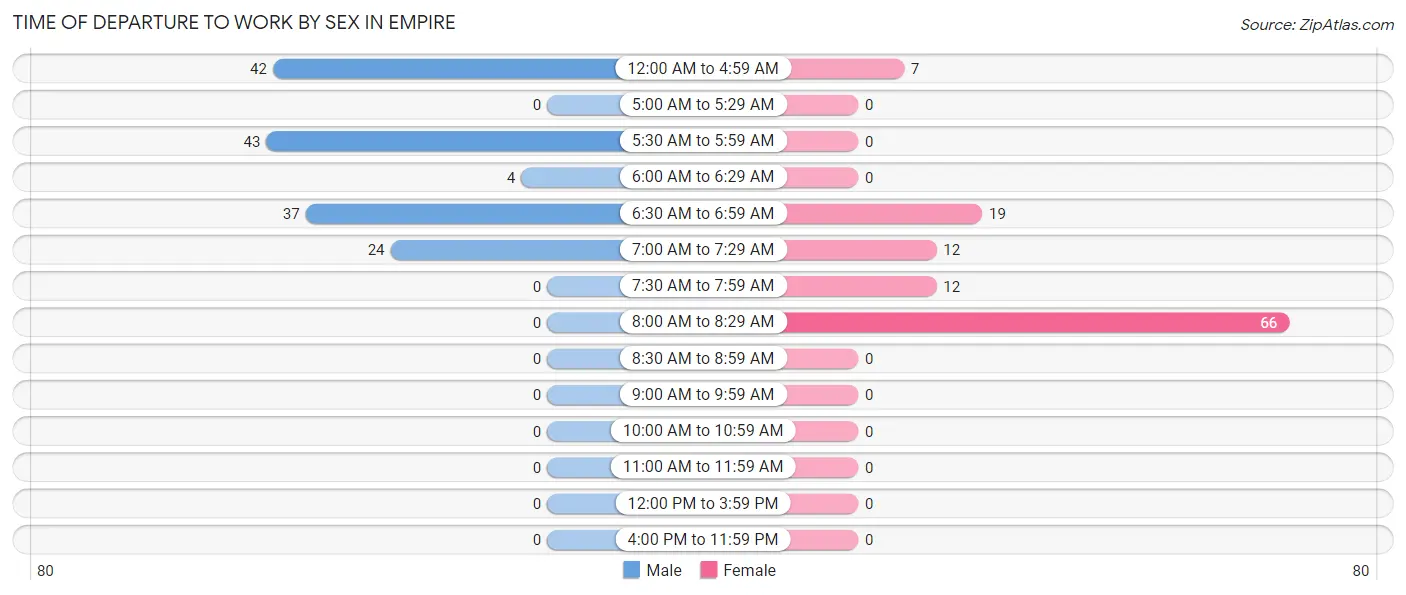
| Time of Departure | Male | Female |
| 12:00 AM to 4:59 AM | 42 (28.0%) | 7 (6.0%) |
| 5:00 AM to 5:29 AM | 0 (0.0%) | 0 (0.0%) |
| 5:30 AM to 5:59 AM | 43 (28.7%) | 0 (0.0%) |
| 6:00 AM to 6:29 AM | 4 (2.7%) | 0 (0.0%) |
| 6:30 AM to 6:59 AM | 37 (24.7%) | 19 (16.4%) |
| 7:00 AM to 7:29 AM | 24 (16.0%) | 12 (10.3%) |
| 7:30 AM to 7:59 AM | 0 (0.0%) | 12 (10.3%) |
| 8:00 AM to 8:29 AM | 0 (0.0%) | 66 (56.9%) |
| 8:30 AM to 8:59 AM | 0 (0.0%) | 0 (0.0%) |
| 9:00 AM to 9:59 AM | 0 (0.0%) | 0 (0.0%) |
| 10:00 AM to 10:59 AM | 0 (0.0%) | 0 (0.0%) |
| 11:00 AM to 11:59 AM | 0 (0.0%) | 0 (0.0%) |
| 12:00 PM to 3:59 PM | 0 (0.0%) | 0 (0.0%) |
| 4:00 PM to 11:59 PM | 0 (0.0%) | 0 (0.0%) |
| Total | 150 (100.0%) | 116 (100.0%) |
Housing Occupancy in Empire
Occupancy by Ownership in Empire
Of the total 421 dwellings in Empire, owner-occupied units account for 340 (80.8%), while renter-occupied units make up 81 (19.2%).
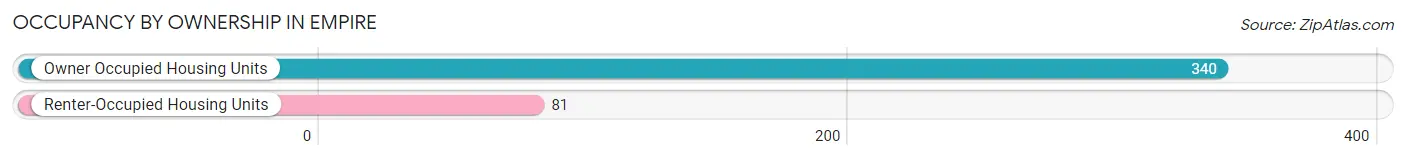
| Occupancy | # Housing Units | % Housing Units |
| Owner Occupied Housing Units | 340 | 80.8% |
| Renter-Occupied Housing Units | 81 | 19.2% |
| Total Occupied Housing Units | 421 | 100.0% |
Occupancy by Household Size in Empire
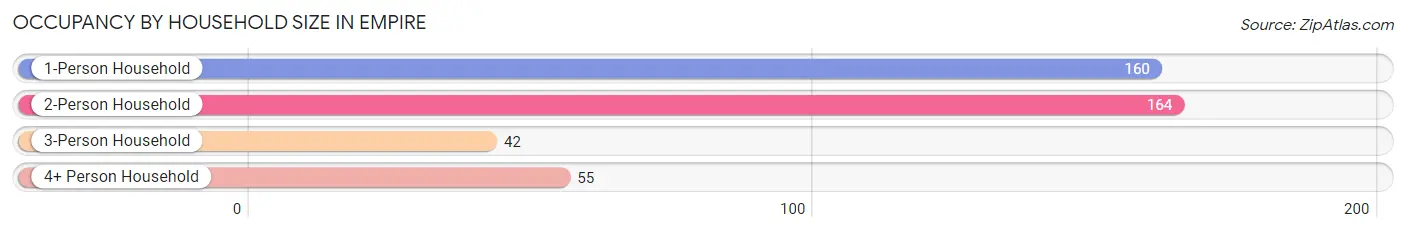
| Household Size | # Housing Units | % Housing Units |
| 1-Person Household | 160 | 38.0% |
| 2-Person Household | 164 | 39.0% |
| 3-Person Household | 42 | 10.0% |
| 4+ Person Household | 55 | 13.1% |
| Total Housing Units | 421 | 100.0% |
Occupancy by Ownership by Household Size in Empire
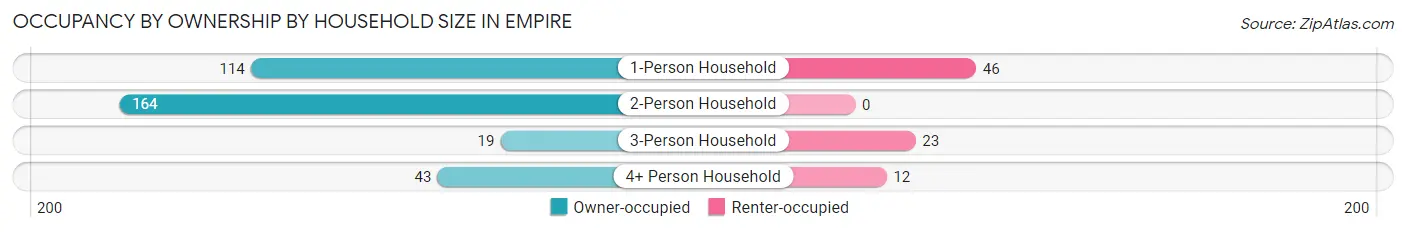
| Household Size | Owner-occupied | Renter-occupied |
| 1-Person Household | 114 (71.3%) | 46 (28.7%) |
| 2-Person Household | 164 (100.0%) | 0 (0.0%) |
| 3-Person Household | 19 (45.2%) | 23 (54.8%) |
| 4+ Person Household | 43 (78.2%) | 12 (21.8%) |
| Total Housing Units | 340 (80.8%) | 81 (19.2%) |
Occupancy by Educational Attainment in Empire
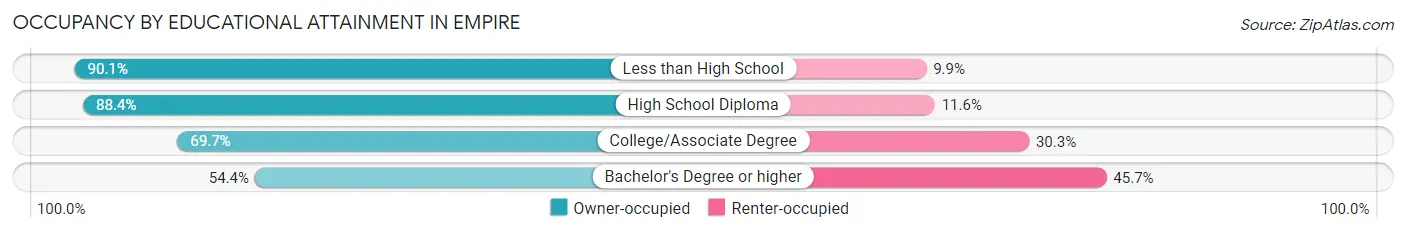
| Household Size | Owner-occupied | Renter-occupied |
| Less than High School | 109 (90.1%) | 12 (9.9%) |
| High School Diploma | 137 (88.4%) | 18 (11.6%) |
| College/Associate Degree | 69 (69.7%) | 30 (30.3%) |
| Bachelor's Degree or higher | 25 (54.3%) | 21 (45.7%) |
Occupancy by Age of Householder in Empire
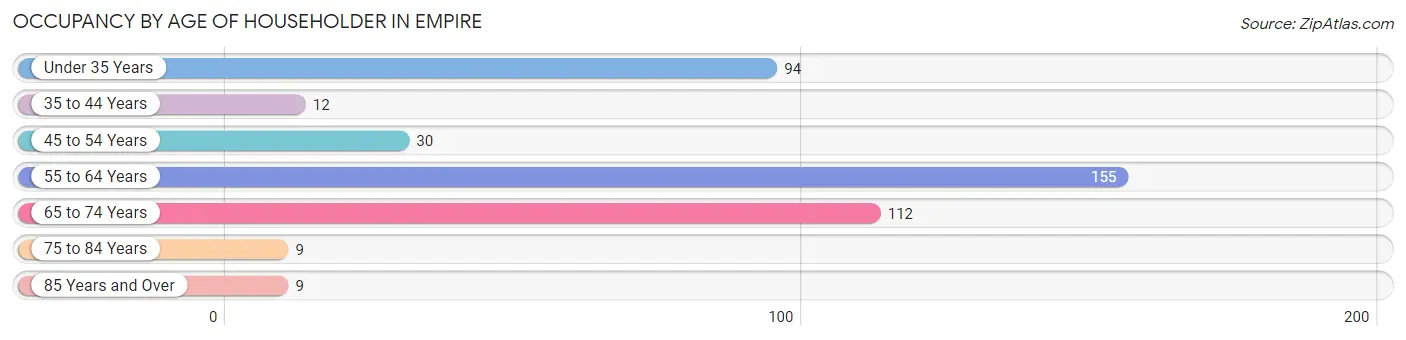
| Age Bracket | # Households | % Households |
| Under 35 Years | 94 | 22.3% |
| 35 to 44 Years | 12 | 2.9% |
| 45 to 54 Years | 30 | 7.1% |
| 55 to 64 Years | 155 | 36.8% |
| 65 to 74 Years | 112 | 26.6% |
| 75 to 84 Years | 9 | 2.1% |
| 85 Years and Over | 9 | 2.1% |
| Total | 421 | 100.0% |
Housing Finances in Empire
Median Income by Occupancy in Empire
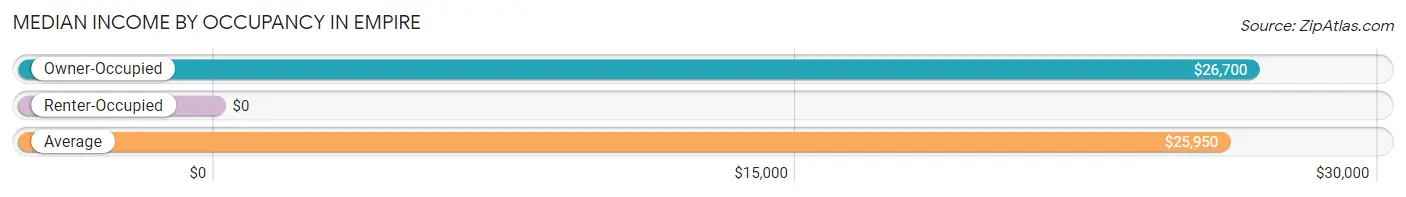
| Occupancy Type | # Households | Median Income |
| Owner-Occupied | 340 (80.8%) | $26,700 |
| Renter-Occupied | 81 (19.2%) | $0 |
| Average | 421 (100.0%) | $25,950 |
Occupancy by Householder Income Bracket in Empire
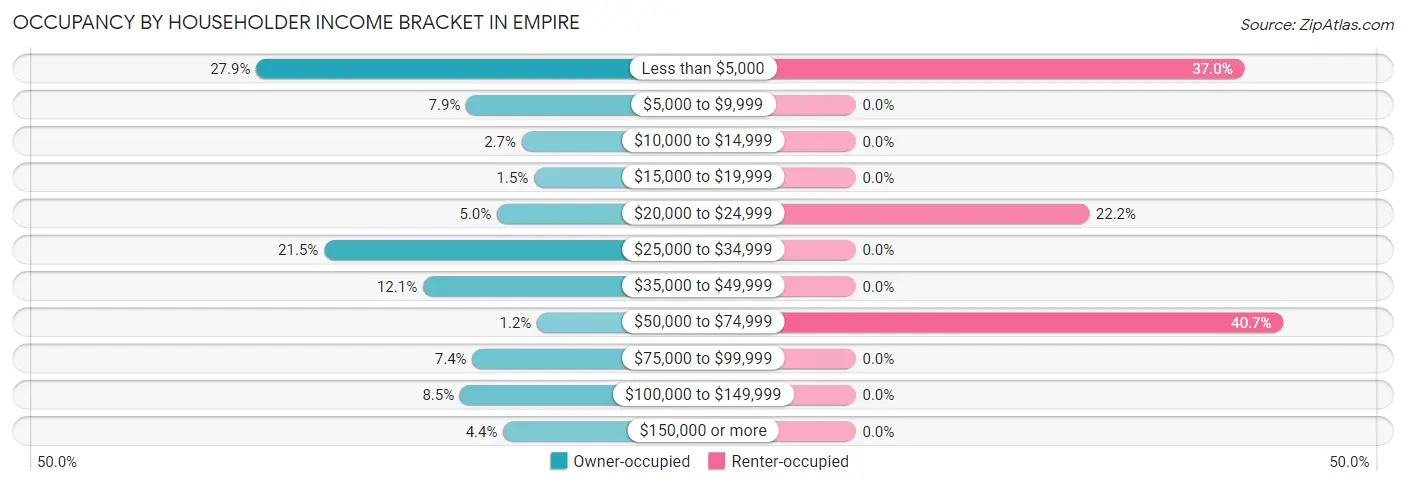
| Income Bracket | Owner-occupied | Renter-occupied |
| Less than $5,000 | 95 (27.9%) | 30 (37.0%) |
| $5,000 to $9,999 | 27 (7.9%) | 0 (0.0%) |
| $10,000 to $14,999 | 9 (2.6%) | 0 (0.0%) |
| $15,000 to $19,999 | 5 (1.5%) | 0 (0.0%) |
| $20,000 to $24,999 | 17 (5.0%) | 18 (22.2%) |
| $25,000 to $34,999 | 73 (21.5%) | 0 (0.0%) |
| $35,000 to $49,999 | 41 (12.1%) | 0 (0.0%) |
| $50,000 to $74,999 | 4 (1.2%) | 33 (40.7%) |
| $75,000 to $99,999 | 25 (7.3%) | 0 (0.0%) |
| $100,000 to $149,999 | 29 (8.5%) | 0 (0.0%) |
| $150,000 or more | 15 (4.4%) | 0 (0.0%) |
| Total | 340 (100.0%) | 81 (100.0%) |
Monthly Housing Cost Tiers in Empire
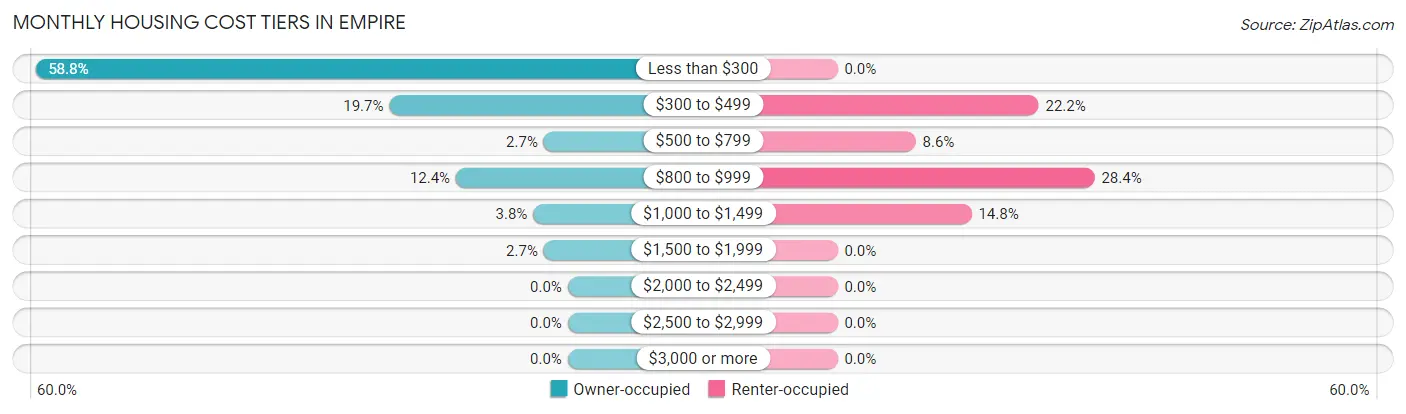
| Monthly Cost | Owner-occupied | Renter-occupied |
| Less than $300 | 200 (58.8%) | 0 (0.0%) |
| $300 to $499 | 67 (19.7%) | 18 (22.2%) |
| $500 to $799 | 9 (2.6%) | 7 (8.6%) |
| $800 to $999 | 42 (12.3%) | 23 (28.4%) |
| $1,000 to $1,499 | 13 (3.8%) | 12 (14.8%) |
| $1,500 to $1,999 | 9 (2.6%) | 0 (0.0%) |
| $2,000 to $2,499 | 0 (0.0%) | 0 (0.0%) |
| $2,500 to $2,999 | 0 (0.0%) | 0 (0.0%) |
| $3,000 or more | 0 (0.0%) | 0 (0.0%) |
| Total | 340 (100.0%) | 81 (100.0%) |
Physical Housing Characteristics in Empire
Housing Structures in Empire
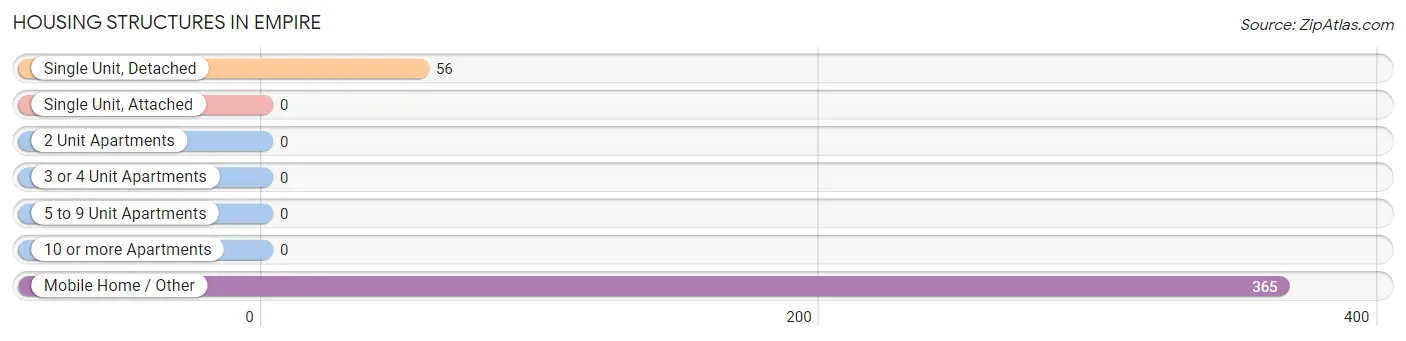
| Structure Type | # Housing Units | % Housing Units |
| Single Unit, Detached | 56 | 13.3% |
| Single Unit, Attached | 0 | 0.0% |
| 2 Unit Apartments | 0 | 0.0% |
| 3 or 4 Unit Apartments | 0 | 0.0% |
| 5 to 9 Unit Apartments | 0 | 0.0% |
| 10 or more Apartments | 0 | 0.0% |
| Mobile Home / Other | 365 | 86.7% |
| Total | 421 | 100.0% |
Housing Structures by Occupancy in Empire
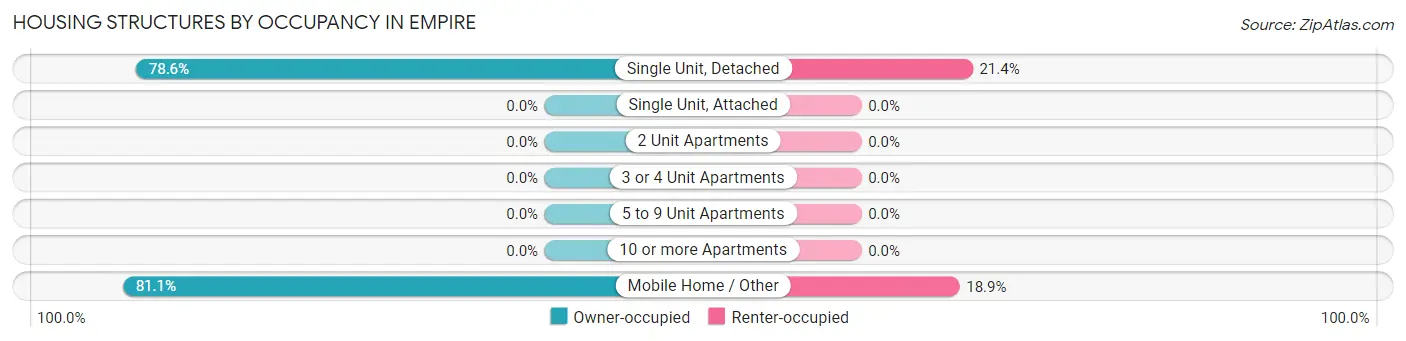
| Structure Type | Owner-occupied | Renter-occupied |
| Single Unit, Detached | 44 (78.6%) | 12 (21.4%) |
| Single Unit, Attached | 0 (0.0%) | 0 (0.0%) |
| 2 Unit Apartments | 0 (0.0%) | 0 (0.0%) |
| 3 or 4 Unit Apartments | 0 (0.0%) | 0 (0.0%) |
| 5 to 9 Unit Apartments | 0 (0.0%) | 0 (0.0%) |
| 10 or more Apartments | 0 (0.0%) | 0 (0.0%) |
| Mobile Home / Other | 296 (81.1%) | 69 (18.9%) |
| Total | 340 (80.8%) | 81 (19.2%) |
Housing Structures by Number of Rooms in Empire
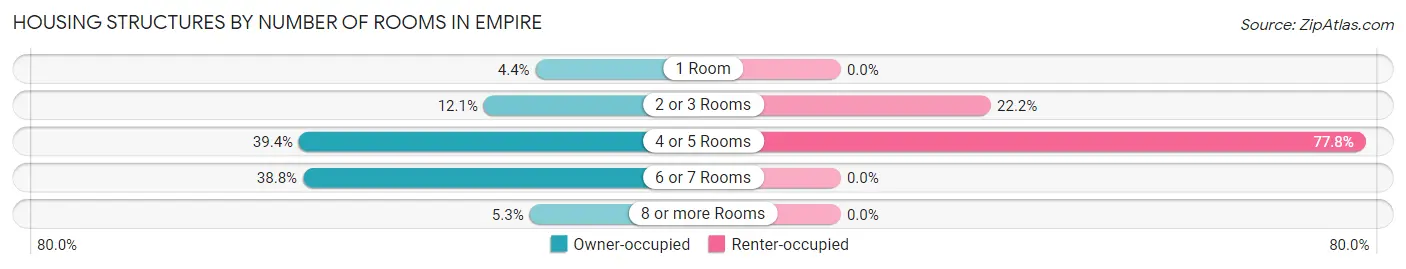
| Number of Rooms | Owner-occupied | Renter-occupied |
| 1 Room | 15 (4.4%) | 0 (0.0%) |
| 2 or 3 Rooms | 41 (12.1%) | 18 (22.2%) |
| 4 or 5 Rooms | 134 (39.4%) | 63 (77.8%) |
| 6 or 7 Rooms | 132 (38.8%) | 0 (0.0%) |
| 8 or more Rooms | 18 (5.3%) | 0 (0.0%) |
| Total | 340 (100.0%) | 81 (100.0%) |
Housing Structure by Heating Type in Empire
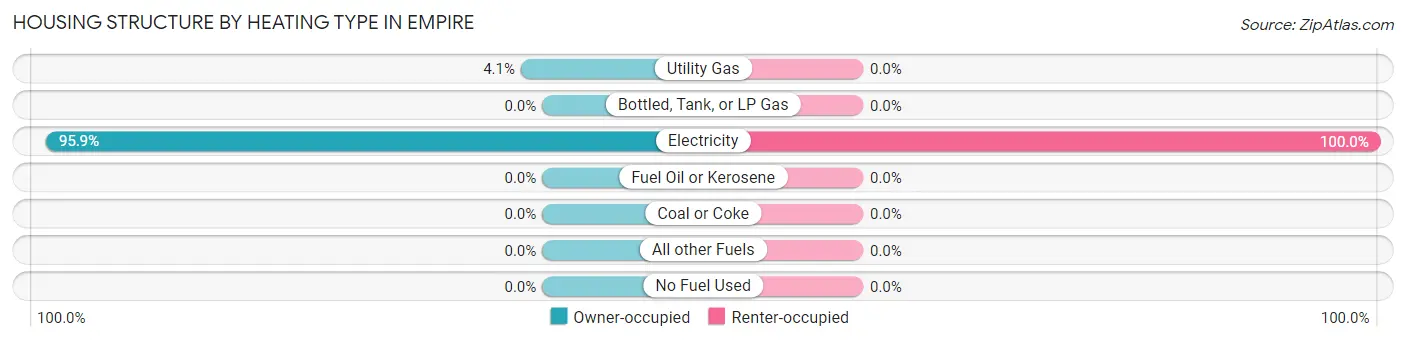
| Heating Type | Owner-occupied | Renter-occupied |
| Utility Gas | 14 (4.1%) | 0 (0.0%) |
| Bottled, Tank, or LP Gas | 0 (0.0%) | 0 (0.0%) |
| Electricity | 326 (95.9%) | 81 (100.0%) |
| Fuel Oil or Kerosene | 0 (0.0%) | 0 (0.0%) |
| Coal or Coke | 0 (0.0%) | 0 (0.0%) |
| All other Fuels | 0 (0.0%) | 0 (0.0%) |
| No Fuel Used | 0 (0.0%) | 0 (0.0%) |
| Total | 340 (100.0%) | 81 (100.0%) |
Household Vehicle Usage in Empire
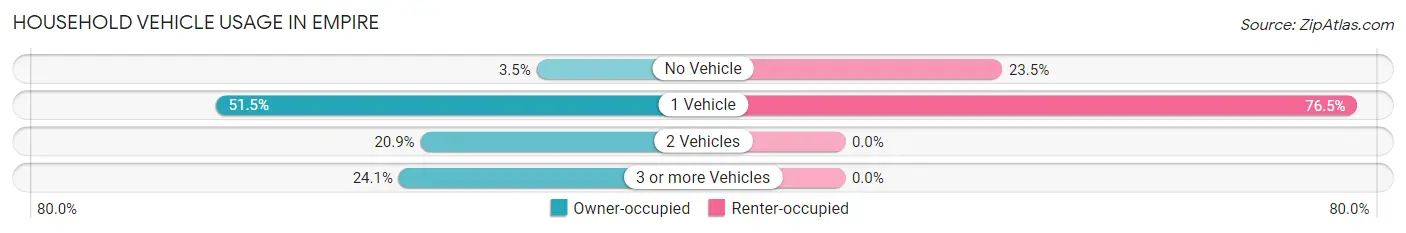
| Vehicles per Household | Owner-occupied | Renter-occupied |
| No Vehicle | 12 (3.5%) | 19 (23.5%) |
| 1 Vehicle | 175 (51.5%) | 62 (76.5%) |
| 2 Vehicles | 71 (20.9%) | 0 (0.0%) |
| 3 or more Vehicles | 82 (24.1%) | 0 (0.0%) |
| Total | 340 (100.0%) | 81 (100.0%) |
Real Estate & Mortgages in Empire
Real Estate and Mortgage Overview in Empire
| Characteristic | Without Mortgage | With Mortgage |
| Housing Units | 276 | 64 |
| Median Property Value | - | - |
| Median Household Income | - | - |
| Monthly Housing Costs | $239 | $0 |
| Real Estate Taxes | $199 | $16 |
Property Value by Mortgage Status in Empire
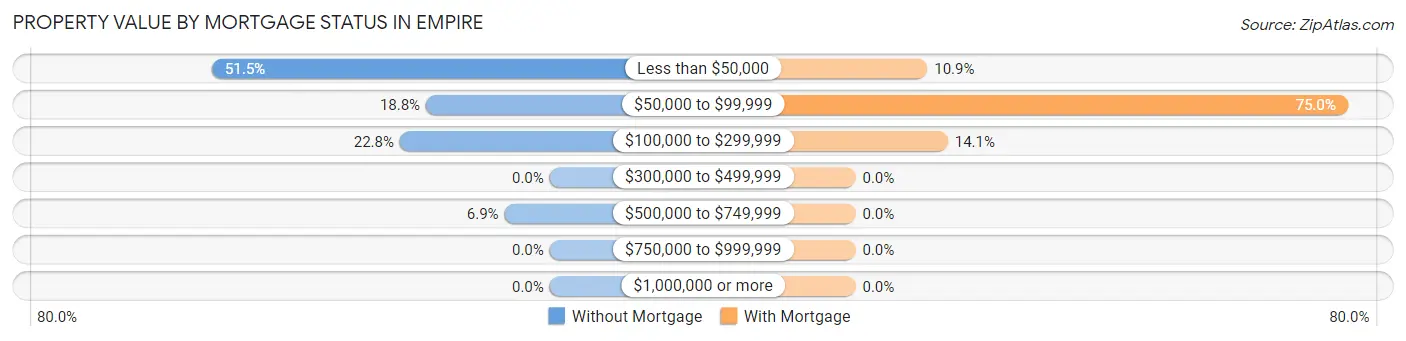
| Property Value | Without Mortgage | With Mortgage |
| Less than $50,000 | 142 (51.4%) | 7 (10.9%) |
| $50,000 to $99,999 | 52 (18.8%) | 48 (75.0%) |
| $100,000 to $299,999 | 63 (22.8%) | 9 (14.1%) |
| $300,000 to $499,999 | 0 (0.0%) | 0 (0.0%) |
| $500,000 to $749,999 | 19 (6.9%) | 0 (0.0%) |
| $750,000 to $999,999 | 0 (0.0%) | 0 (0.0%) |
| $1,000,000 or more | 0 (0.0%) | 0 (0.0%) |
| Total | 276 (100.0%) | 64 (100.0%) |
Household Income by Mortgage Status in Empire
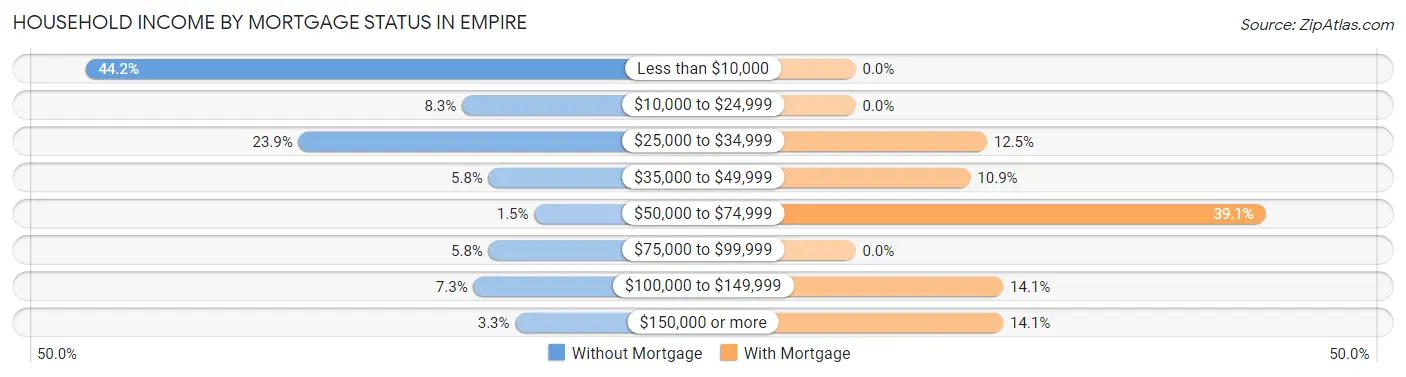
| Household Income | Without Mortgage | With Mortgage |
| Less than $10,000 | 122 (44.2%) | 0 (0.0%) |
| $10,000 to $24,999 | 23 (8.3%) | 0 (0.0%) |
| $25,000 to $34,999 | 66 (23.9%) | 8 (12.5%) |
| $35,000 to $49,999 | 16 (5.8%) | 7 (10.9%) |
| $50,000 to $74,999 | 4 (1.5%) | 25 (39.1%) |
| $75,000 to $99,999 | 16 (5.8%) | 0 (0.0%) |
| $100,000 to $149,999 | 20 (7.2%) | 9 (14.1%) |
| $150,000 or more | 9 (3.3%) | 9 (14.1%) |
| Total | 276 (100.0%) | 64 (100.0%) |
Property Value to Household Income Ratio in Empire
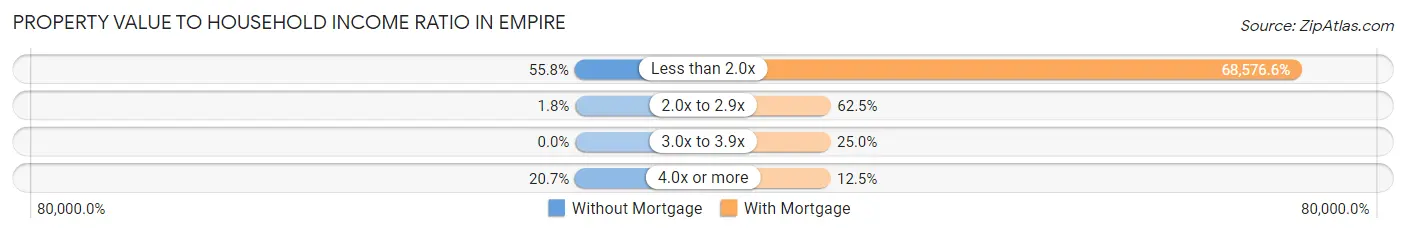
| Value-to-Income Ratio | Without Mortgage | With Mortgage |
| Less than 2.0x | 154 (55.8%) | 43,889 (68,576.6%) |
| 2.0x to 2.9x | 5 (1.8%) | 40 (62.5%) |
| 3.0x to 3.9x | 0 (0.0%) | 16 (25.0%) |
| 4.0x or more | 57 (20.6%) | 8 (12.5%) |
| Total | 276 (100.0%) | 64 (100.0%) |
Real Estate Taxes by Mortgage Status in Empire
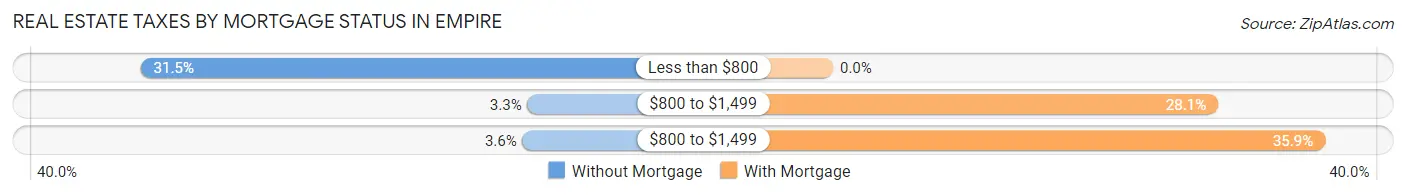
| Property Taxes | Without Mortgage | With Mortgage |
| Less than $800 | 87 (31.5%) | 0 (0.0%) |
| $800 to $1,499 | 9 (3.3%) | 18 (28.1%) |
| $800 to $1,499 | 10 (3.6%) | 23 (35.9%) |
| Total | 276 (100.0%) | 64 (100.0%) |
Health & Disability in Empire
Health Insurance Coverage by Age in Empire
| Age Bracket | With Coverage | Without Coverage |
| Under 6 Years | 46 (100.0%) | 0 (0.0%) |
| 6 to 18 Years | 161 (100.0%) | 0 (0.0%) |
| 19 to 25 Years | 157 (87.7%) | 22 (12.3%) |
| 26 to 34 Years | 93 (83.8%) | 18 (16.2%) |
| 35 to 44 Years | 30 (100.0%) | 0 (0.0%) |
| 45 to 54 Years | 78 (100.0%) | 0 (0.0%) |
| 55 to 64 Years | 226 (100.0%) | 0 (0.0%) |
| 65 to 74 Years | 143 (100.0%) | 0 (0.0%) |
| 75 Years and older | 18 (100.0%) | 0 (0.0%) |
| Total | 952 (96.0%) | 40 (4.0%) |
Health Insurance Coverage by Citizenship Status in Empire
| Citizenship Status | With Coverage | Without Coverage |
| Native Born | 46 (100.0%) | 0 (0.0%) |
| Foreign Born, Citizen | 161 (100.0%) | 0 (0.0%) |
| Foreign Born, not a Citizen | 157 (87.7%) | 22 (12.3%) |
Health Insurance Coverage by Household Income in Empire
| Household Income | With Coverage | Without Coverage |
| Under $25,000 | 406 (95.8%) | 18 (4.3%) |
| $25,000 to $49,999 | 280 (100.0%) | 0 (0.0%) |
| $50,000 to $74,999 | 113 (100.0%) | 0 (0.0%) |
| $75,000 to $99,999 | 35 (100.0%) | 0 (0.0%) |
| $100,000 and over | 118 (84.3%) | 22 (15.7%) |
Public vs Private Health Insurance Coverage by Age in Empire
| Age Bracket | Public Insurance | Private Insurance |
| Under 6 | 31 (67.4%) | 25 (54.3%) |
| 6 to 18 Years | 77 (47.8%) | 84 (52.2%) |
| 19 to 25 Years | 120 (67.0%) | 37 (20.7%) |
| 25 to 34 Years | 78 (70.3%) | 15 (13.5%) |
| 35 to 44 Years | 30 (100.0%) | 0 (0.0%) |
| 45 to 54 Years | 55 (70.5%) | 23 (29.5%) |
| 55 to 64 Years | 75 (33.2%) | 155 (68.6%) |
| 65 to 74 Years | 119 (83.2%) | 31 (21.7%) |
| 75 Years and over | 18 (100.0%) | 0 (0.0%) |
| Total | 603 (60.8%) | 370 (37.3%) |
Disability Status by Sex by Age in Empire
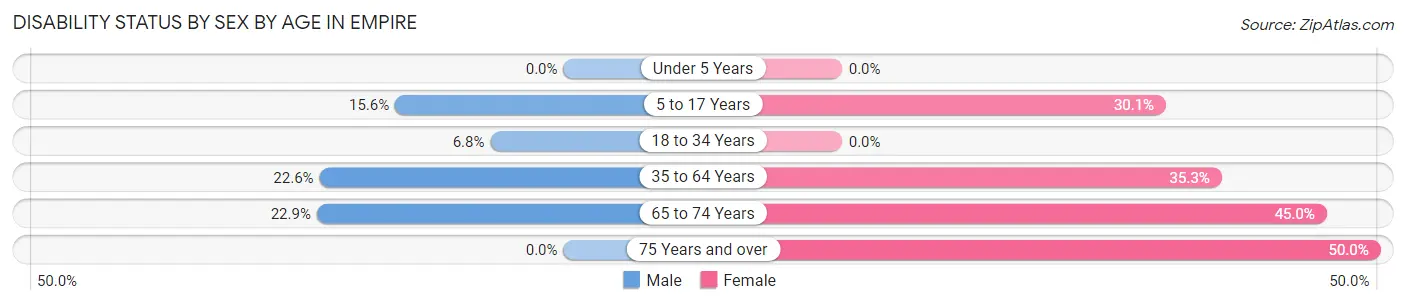
| Age Bracket | Male | Female |
| Under 5 Years | 0 (0.0%) | 0 (0.0%) |
| 5 to 17 Years | 5 (15.6%) | 40 (30.1%) |
| 18 to 34 Years | 12 (6.8%) | 0 (0.0%) |
| 35 to 64 Years | 48 (22.6%) | 43 (35.2%) |
| 65 to 74 Years | 19 (22.9%) | 27 (45.0%) |
| 75 Years and over | 0 (0.0%) | 9 (50.0%) |
Disability Class by Sex by Age in Empire
Disability Class: Hearing Difficulty
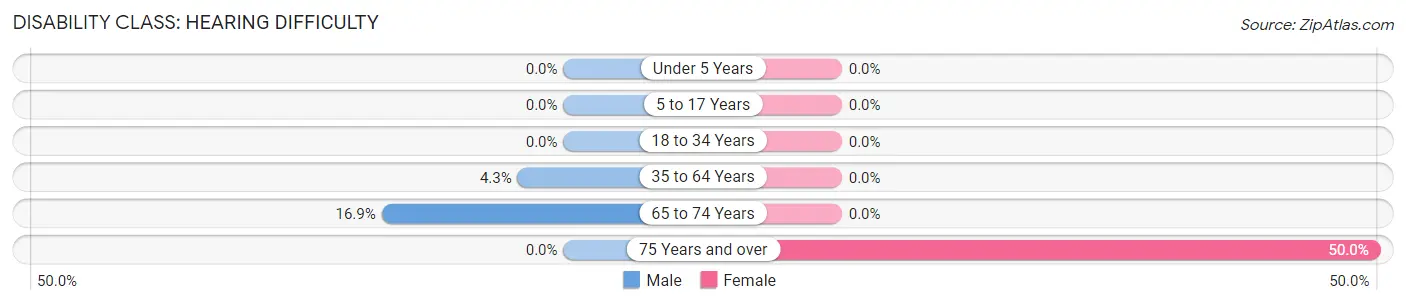
| Age Bracket | Male | Female |
| Under 5 Years | 0 (0.0%) | 0 (0.0%) |
| 5 to 17 Years | 0 (0.0%) | 0 (0.0%) |
| 18 to 34 Years | 0 (0.0%) | 0 (0.0%) |
| 35 to 64 Years | 9 (4.3%) | 0 (0.0%) |
| 65 to 74 Years | 14 (16.9%) | 0 (0.0%) |
| 75 Years and over | 0 (0.0%) | 9 (50.0%) |
Disability Class: Vision Difficulty
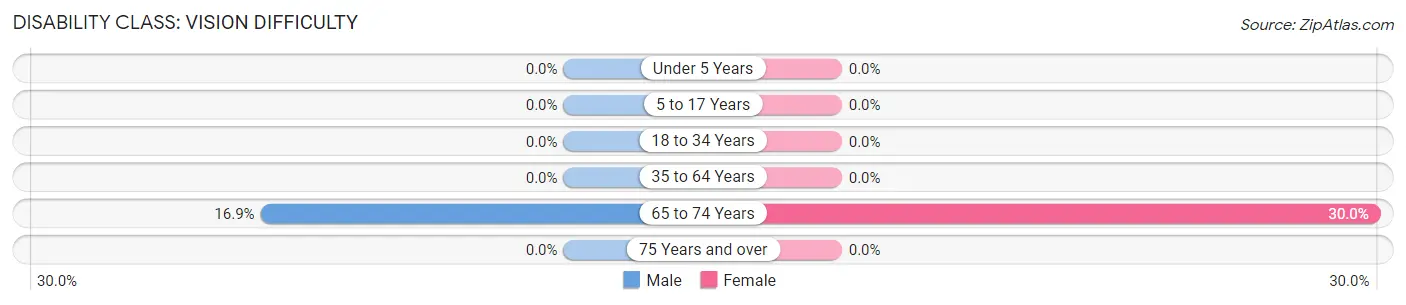
| Age Bracket | Male | Female |
| Under 5 Years | 0 (0.0%) | 0 (0.0%) |
| 5 to 17 Years | 0 (0.0%) | 0 (0.0%) |
| 18 to 34 Years | 0 (0.0%) | 0 (0.0%) |
| 35 to 64 Years | 0 (0.0%) | 0 (0.0%) |
| 65 to 74 Years | 14 (16.9%) | 18 (30.0%) |
| 75 Years and over | 0 (0.0%) | 0 (0.0%) |
Disability Class: Cognitive Difficulty
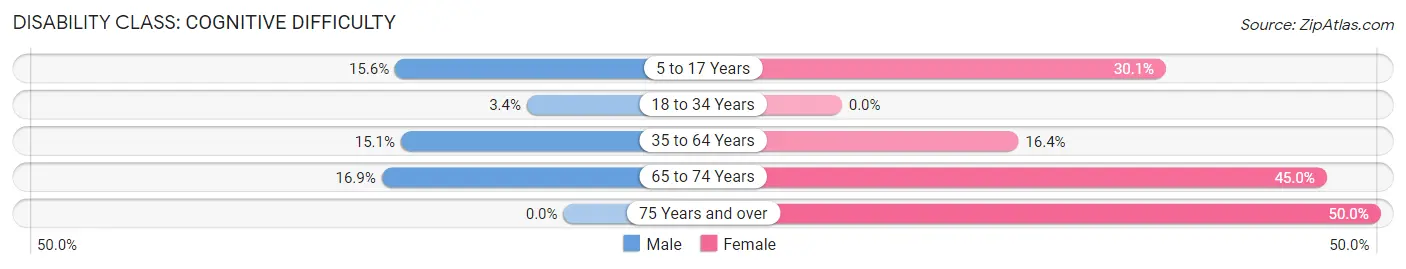
| Age Bracket | Male | Female |
| 5 to 17 Years | 5 (15.6%) | 40 (30.1%) |
| 18 to 34 Years | 6 (3.4%) | 0 (0.0%) |
| 35 to 64 Years | 32 (15.1%) | 20 (16.4%) |
| 65 to 74 Years | 14 (16.9%) | 27 (45.0%) |
| 75 Years and over | 0 (0.0%) | 9 (50.0%) |
Disability Class: Ambulatory Difficulty
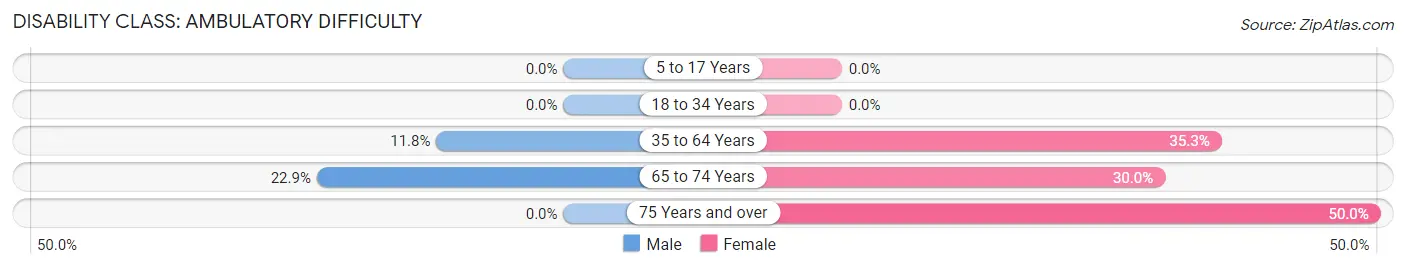
| Age Bracket | Male | Female |
| 5 to 17 Years | 0 (0.0%) | 0 (0.0%) |
| 18 to 34 Years | 0 (0.0%) | 0 (0.0%) |
| 35 to 64 Years | 25 (11.8%) | 43 (35.2%) |
| 65 to 74 Years | 19 (22.9%) | 18 (30.0%) |
| 75 Years and over | 0 (0.0%) | 9 (50.0%) |
Disability Class: Self-Care Difficulty
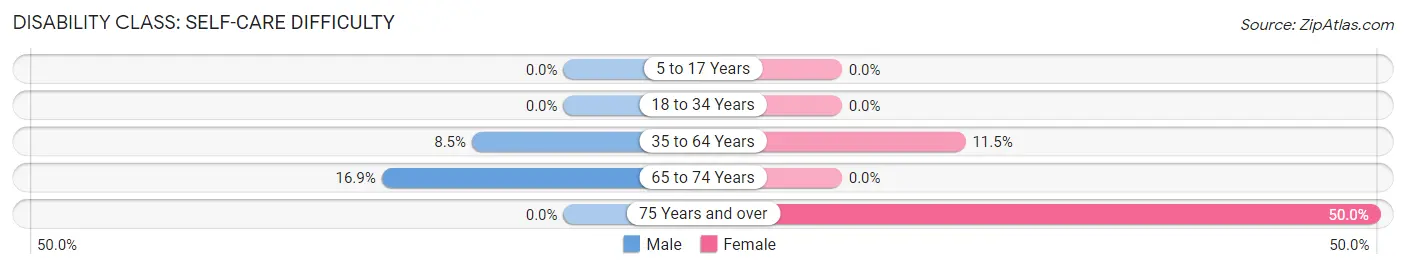
| Age Bracket | Male | Female |
| 5 to 17 Years | 0 (0.0%) | 0 (0.0%) |
| 18 to 34 Years | 0 (0.0%) | 0 (0.0%) |
| 35 to 64 Years | 18 (8.5%) | 14 (11.5%) |
| 65 to 74 Years | 14 (16.9%) | 0 (0.0%) |
| 75 Years and over | 0 (0.0%) | 9 (50.0%) |
Technology Access in Empire
Computing Device Access in Empire
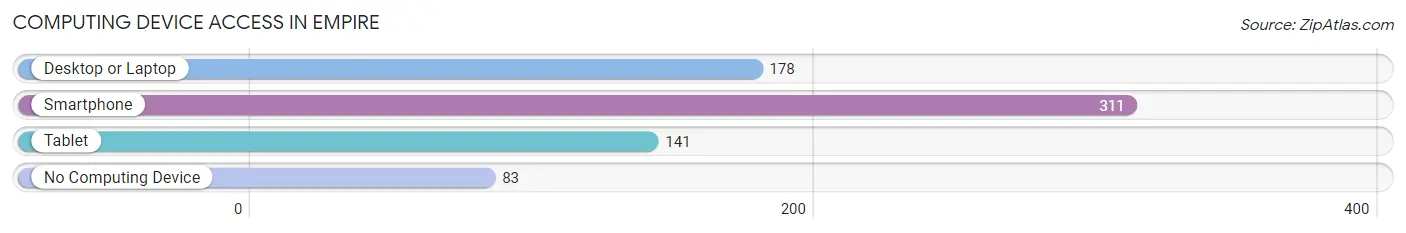
| Device Type | # Households | % Households |
| Desktop or Laptop | 178 | 42.3% |
| Smartphone | 311 | 73.9% |
| Tablet | 141 | 33.5% |
| No Computing Device | 83 | 19.7% |
| Total | 421 | 100.0% |
Internet Access in Empire
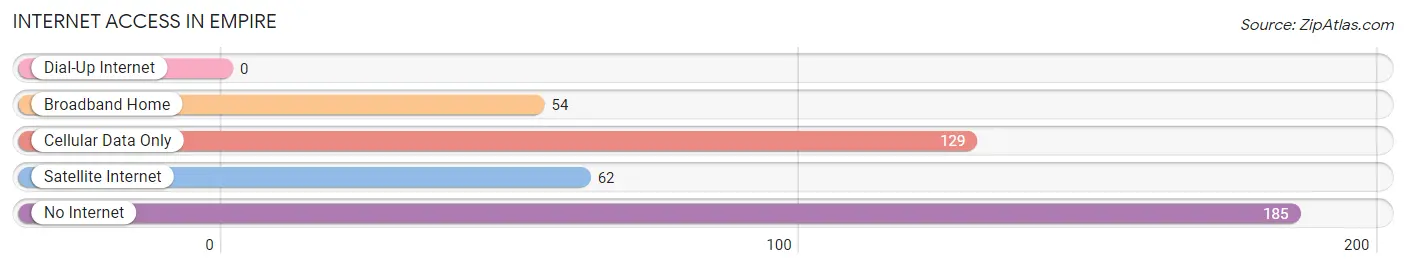
| Internet Type | # Households | % Households |
| Dial-Up Internet | 0 | 0.0% |
| Broadband Home | 54 | 12.8% |
| Cellular Data Only | 129 | 30.6% |
| Satellite Internet | 62 | 14.7% |
| No Internet | 185 | 43.9% |
| Total | 421 | 100.0% |
Empire Summary
Empire is a small town located in Plaquemines Parish, Louisiana. It is situated on the west bank of the Mississippi River, approximately 25 miles south of New Orleans. The town has a population of 1,845 people, according to the 2010 census.
Geography
Empire is located in the southeastern corner of Plaquemines Parish, Louisiana. It is situated on the west bank of the Mississippi River, approximately 25 miles south of New Orleans. The town is bordered by the Mississippi River to the east, the Gulf of Mexico to the south, and the towns of Buras and Boothville to the north and west, respectively. The town is located in a low-lying area, with an elevation of only 4 feet above sea level.
The town is located in a humid subtropical climate zone, with hot, humid summers and mild winters. The average annual temperature is 68°F, with an average high of 87°F in the summer and an average low of 48°F in the winter. The average annual precipitation is 62 inches, with most of the rain falling in the summer months.
Economy
Empire’s economy is largely based on fishing and tourism. The town is home to several seafood processing plants, which employ many of the town’s residents. The town is also home to several marinas, which attract tourists from all over the world.
The town is also home to several oil and gas production facilities, which provide jobs for many of the town’s residents. The town is also home to several retail stores, restaurants, and other businesses, which provide additional employment opportunities.
Demographics
As of the 2010 census, Empire had a population of 1,845 people. The racial makeup of the town was 79.3% White, 17.2% African American, 0.7% Native American, 0.3% Asian, 0.1% Pacific Islander, and 2.4% from other races. Hispanic or Latino of any race were 3.2% of the population.
The median income for a household in the town was $37,500, and the median income for a family was $45,000. The per capita income for the town was $18,000. About 17.2% of families and 20.2% of the population were below the poverty line, including 28.3% of those under age 18 and 11.2% of those age 65 or over.
Conclusion
Empire is a small town located in Plaquemines Parish, Louisiana. It is situated on the west bank of the Mississippi River, approximately 25 miles south of New Orleans. The town has a population of 1,845 people, according to the 2010 census. The town’s economy is largely based on fishing and tourism, and it is home to several seafood processing plants, marinas, oil and gas production facilities, and other businesses. The town’s population is mostly White, with a significant African American population. The median income for a household in the town was $37,500, and the median income for a family was $45,000. About 17.2% of families and 20.2% of the population were below the poverty line.
Common Questions
What is Per Capita Income in Empire?
Per Capita income in Empire is $17,538.
What is the Median Family Income in Empire?
Median Family Income in Empire is $31,328.
What is the Median Household income in Empire?
Median Household Income in Empire is $25,950.
What is Income or Wage Gap in Empire?
Income or Wage Gap in Empire is 6.7%.
Women in Empire earn 93.3 cents for every dollar earned by a man.
What is Inequality or Gini Index in Empire?
Inequality or Gini Index in Empire is 0.57.
What is the Total Population of Empire?
Total Population of Empire is 999.
What is the Total Male Population of Empire?
Total Male Population of Empire is 517.
What is the Total Female Population of Empire?
Total Female Population of Empire is 482.
What is the Ratio of Males per 100 Females in Empire?
There are 107.26 Males per 100 Females in Empire.
What is the Ratio of Females per 100 Males in Empire?
There are 93.23 Females per 100 Males in Empire.
What is the Median Population Age in Empire?
Median Population Age in Empire is 33.9 Years.
What is the Average Family Size in Empire
Average Family Size in Empire is 3.3 People.
What is the Average Household Size in Empire
Average Household Size in Empire is 2.4 People.
How Large is the Labor Force in Empire?
There are 440 People in the Labor Forcein in Empire.
What is the Percentage of People in the Labor Force in Empire?
54.5% of People are in the Labor Force in Empire.
What is the Unemployment Rate in Empire?
Unemployment Rate in Empire is 5.5%.