Elizabeth, LA Map & Demographics
Elizabeth Map
Elizabeth Overview
$23,582
PER CAPITA INCOME
$37,250
AVG FAMILY INCOME
$34,792
AVG HOUSEHOLD INCOME
0.49
INEQUALITY / GINI INDEX
488
TOTAL POPULATION
243
MALE POPULATION
245
FEMALE POPULATION
99.18
MALES / 100 FEMALES
100.82
FEMALES / 100 MALES
28.8
MEDIAN AGE
3.1
AVG FAMILY SIZE
2.6
AVG HOUSEHOLD SIZE
205
LABOR FORCE [ PEOPLE ]
59.9%
PERCENT IN LABOR FORCE
9.3%
UNEMPLOYMENT RATE
Elizabeth Zip Codes
Income in Elizabeth
Income Overview in Elizabeth
Per Capita Income in Elizabeth is $23,582, while median incomes of families and households are $37,250 and $34,792 respectively.
| Characteristic | Number | Measure |
| Per Capita Income | 488 | $23,582 |
| Median Family Income | 137 | $37,250 |
| Mean Family Income | 137 | $67,239 |
| Median Household Income | 189 | $34,792 |
| Mean Household Income | 189 | $59,422 |
| Income Deficit | 137 | $0 |
| Wage / Income Gap (%) | 488 | 0.00% |
| Wage / Income Gap ($) | 488 | 100.00¢ per $1 |
| Gini / Inequality Index | 488 | 0.49 |
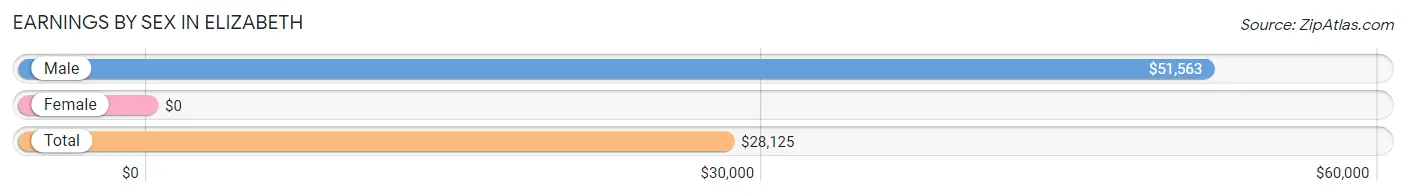
Earnings by Sex in Elizabeth
| Sex | Number | Average Earnings |
| Male | 127 (57.7%) | $51,563 |
| Female | 93 (42.3%) | $0 |
| Total | 220 (100.0%) | $28,125 |
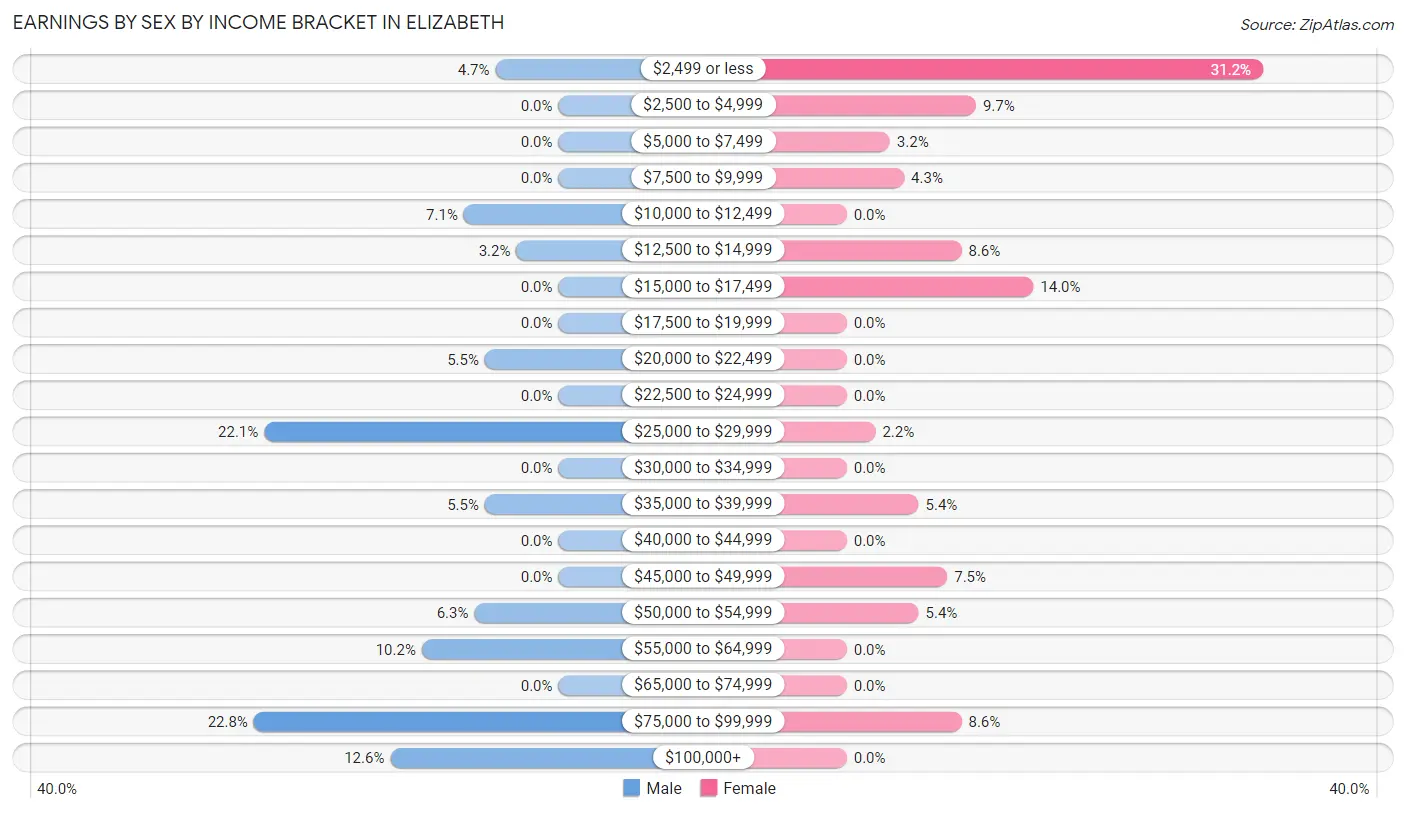
Earnings by Sex by Income Bracket in Elizabeth
The most common earnings brackets in Elizabeth are $75,000 to $99,999 for men (29 | 22.8%) and $2,499 or less for women (29 | 31.2%).
| Income | Male | Female |
| $2,499 or less | 6 (4.7%) | 29 (31.2%) |
| $2,500 to $4,999 | 0 (0.0%) | 9 (9.7%) |
| $5,000 to $7,499 | 0 (0.0%) | 3 (3.2%) |
| $7,500 to $9,999 | 0 (0.0%) | 4 (4.3%) |
| $10,000 to $12,499 | 9 (7.1%) | 0 (0.0%) |
| $12,500 to $14,999 | 4 (3.2%) | 8 (8.6%) |
| $15,000 to $17,499 | 0 (0.0%) | 13 (14.0%) |
| $17,500 to $19,999 | 0 (0.0%) | 0 (0.0%) |
| $20,000 to $22,499 | 7 (5.5%) | 0 (0.0%) |
| $22,500 to $24,999 | 0 (0.0%) | 0 (0.0%) |
| $25,000 to $29,999 | 28 (22.1%) | 2 (2.1%) |
| $30,000 to $34,999 | 0 (0.0%) | 0 (0.0%) |
| $35,000 to $39,999 | 7 (5.5%) | 5 (5.4%) |
| $40,000 to $44,999 | 0 (0.0%) | 0 (0.0%) |
| $45,000 to $49,999 | 0 (0.0%) | 7 (7.5%) |
| $50,000 to $54,999 | 8 (6.3%) | 5 (5.4%) |
| $55,000 to $64,999 | 13 (10.2%) | 0 (0.0%) |
| $65,000 to $74,999 | 0 (0.0%) | 0 (0.0%) |
| $75,000 to $99,999 | 29 (22.8%) | 8 (8.6%) |
| $100,000+ | 16 (12.6%) | 0 (0.0%) |
| Total | 127 (100.0%) | 93 (100.0%) |
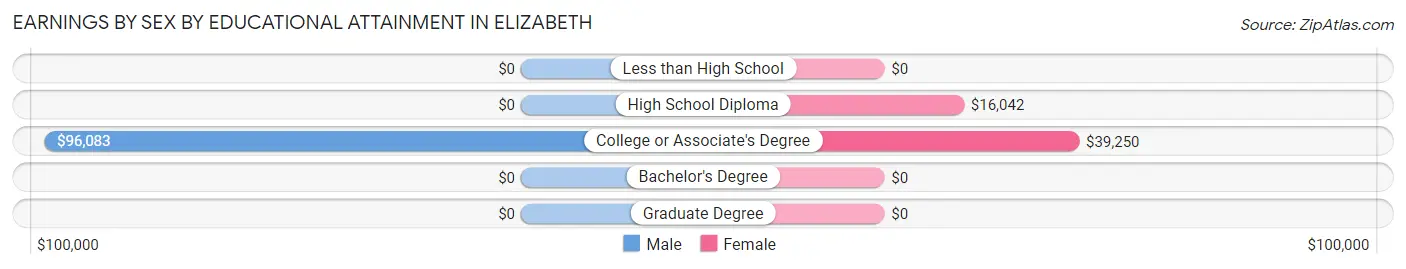
Earnings by Sex by Educational Attainment in Elizabeth
| Educational Attainment | Male Income | Female Income |
| Less than High School | - | - |
| High School Diploma | - | - |
| College or Associate's Degree | $96,083 | $39,250 |
| Bachelor's Degree | - | - |
| Graduate Degree | - | - |
| Total | $61,058 | $0 |
Family Income in Elizabeth
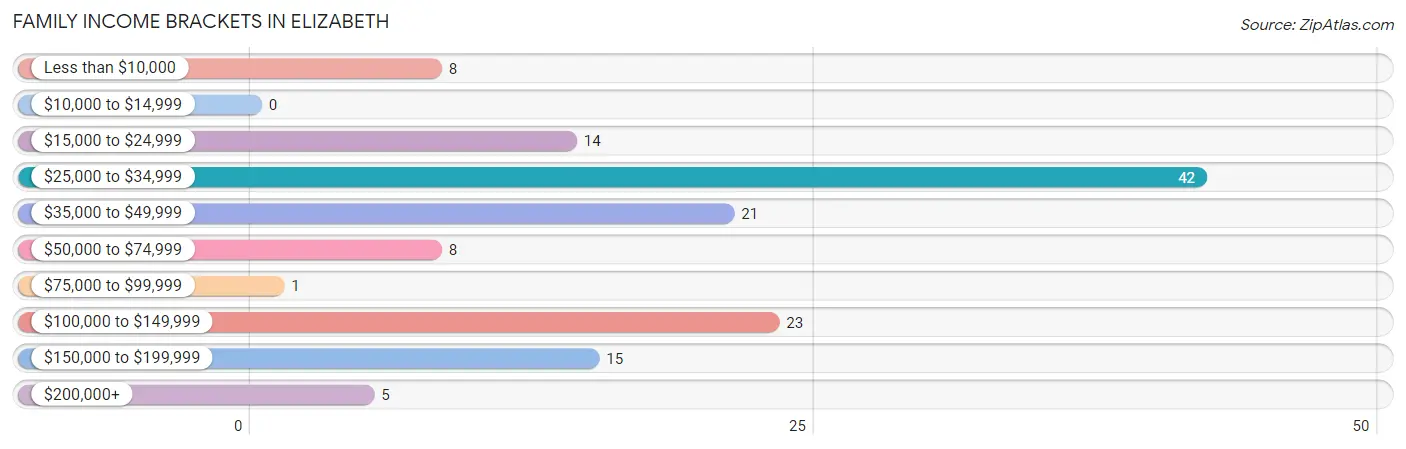
Family Income Brackets in Elizabeth
According to the Elizabeth family income data, there are 42 families falling into the $25,000 to $34,999 income range, which is the most common income bracket and makes up 30.7% of all families.
| Income Bracket | # Families | % Families |
| Less than $10,000 | 8 | 5.8% |
| $10,000 to $14,999 | 0 | 0.0% |
| $15,000 to $24,999 | 14 | 10.2% |
| $25,000 to $34,999 | 42 | 30.7% |
| $35,000 to $49,999 | 21 | 15.3% |
| $50,000 to $74,999 | 8 | 5.8% |
| $75,000 to $99,999 | 1 | 0.7% |
| $100,000 to $149,999 | 23 | 16.8% |
| $150,000 to $199,999 | 15 | 10.9% |
| $200,000+ | 5 | 3.6% |
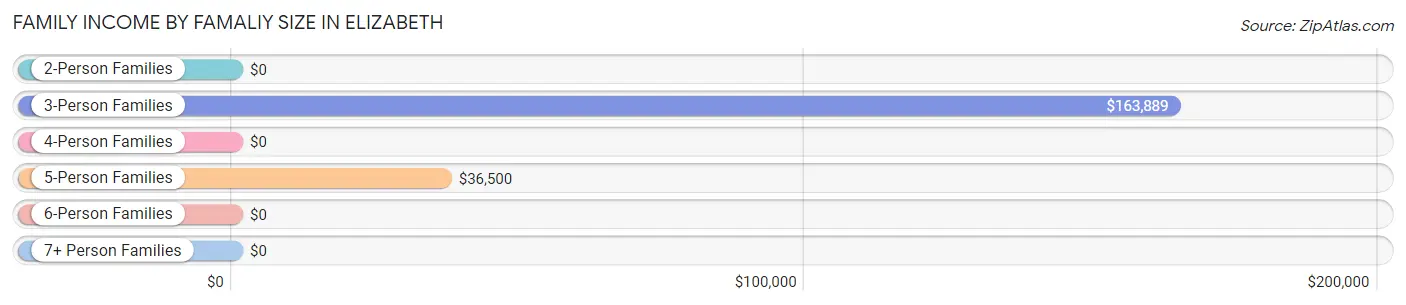
Family Income by Famaliy Size in Elizabeth
3-person families (18 | 13.1%) account for the highest median family income in Elizabeth with $163,889 per family, while 3-person families (18 | 13.1%) have the highest median income of $54,630 per family member.
| Income Bracket | # Families | Median Income |
| 2-Person Families | 50 (36.5%) | $0 |
| 3-Person Families | 18 (13.1%) | $163,889 |
| 4-Person Families | 15 (11.0%) | $0 |
| 5-Person Families | 54 (39.4%) | $36,500 |
| 6-Person Families | 0 (0.0%) | $0 |
| 7+ Person Families | 0 (0.0%) | $0 |
| Total | 137 (100.0%) | $37,250 |
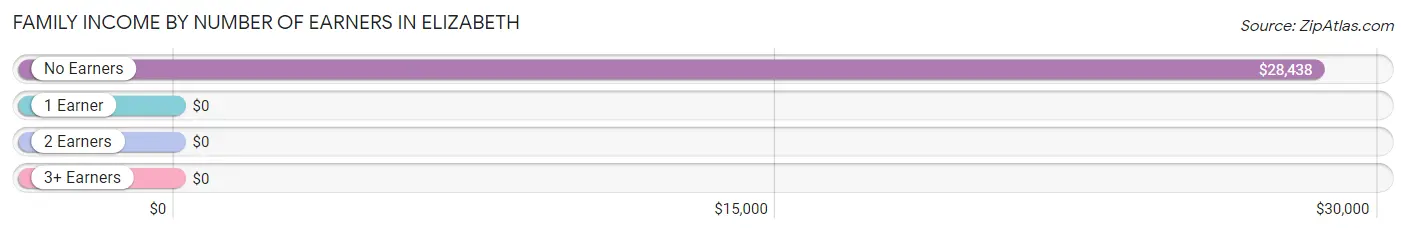
Family Income by Number of Earners in Elizabeth
| Number of Earners | # Families | Median Income |
| No Earners | 32 (23.4%) | $28,438 |
| 1 Earner | 23 (16.8%) | $0 |
| 2 Earners | 66 (48.2%) | $0 |
| 3+ Earners | 16 (11.7%) | $0 |
| Total | 137 (100.0%) | $37,250 |
Household Income in Elizabeth
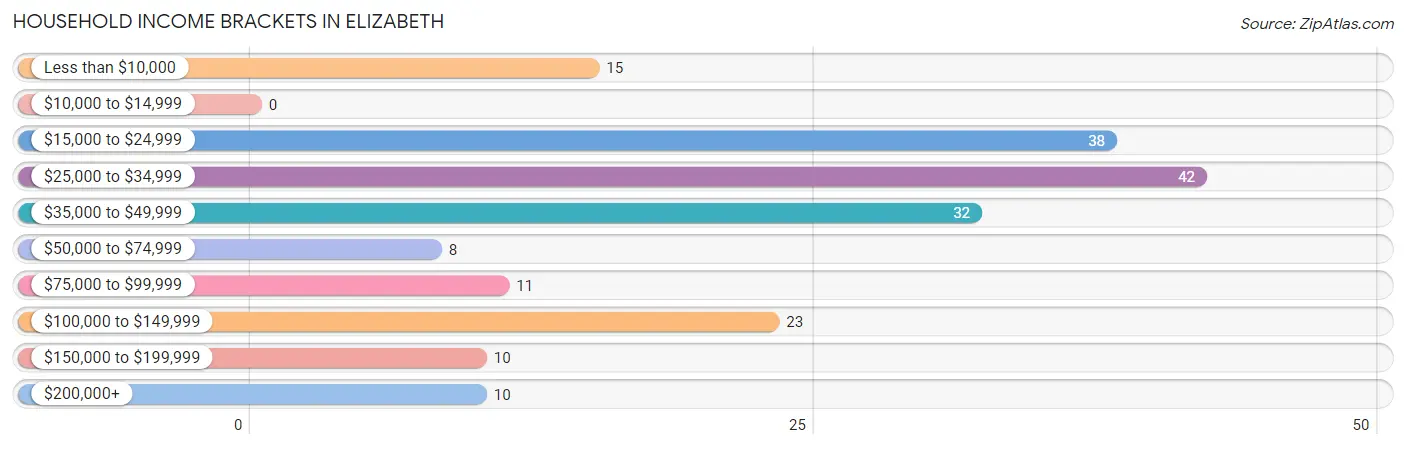
Household Income Brackets in Elizabeth
With 42 households falling in the category, the $25,000 to $34,999 income range is the most frequent in Elizabeth, accounting for 22.2% of all households.
| Income Bracket | # Households | % Households |
| Less than $10,000 | 15 | 7.9% |
| $10,000 to $14,999 | 0 | 0.0% |
| $15,000 to $24,999 | 38 | 20.1% |
| $25,000 to $34,999 | 42 | 22.2% |
| $35,000 to $49,999 | 32 | 16.9% |
| $50,000 to $74,999 | 8 | 4.2% |
| $75,000 to $99,999 | 11 | 5.8% |
| $100,000 to $149,999 | 23 | 12.2% |
| $150,000 to $199,999 | 10 | 5.3% |
| $200,000+ | 10 | 5.3% |
Household Income by Householder Age in Elizabeth
The median household income in Elizabeth is $34,792, with the highest median household income of $42,500 found in the 45 to 64 years age bracket for the primary householder. A total of 62 households (32.8%) fall into this category. Meanwhile, the 15 to 24 years age bracket for the primary householder has the lowest median household income of $0, with 9 households (4.8%) in this group.
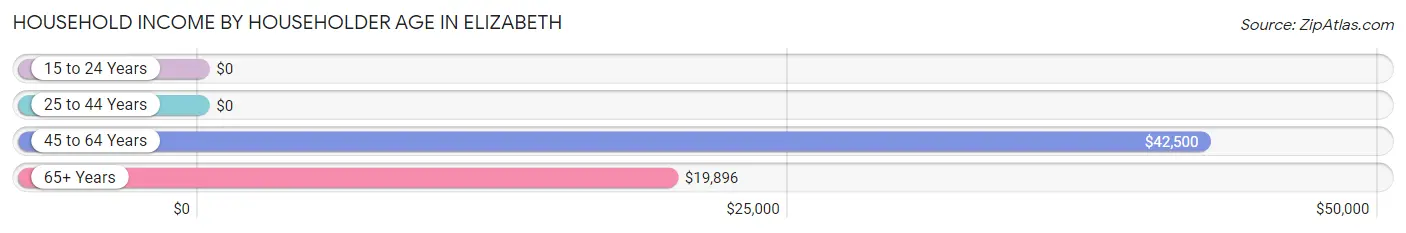
| Income Bracket | # Households | Median Income |
| 15 to 24 Years | 9 (4.8%) | $0 |
| 25 to 44 Years | 85 (45.0%) | $0 |
| 45 to 64 Years | 62 (32.8%) | $42,500 |
| 65+ Years | 33 (17.5%) | $19,896 |
| Total | 189 (100.0%) | $34,792 |
Poverty in Elizabeth
Income Below Poverty by Sex and Age in Elizabeth
With 22.7% poverty level for males and 26.5% for females among the residents of Elizabeth, 5 year old males and 25 to 34 year old females are the most vulnerable to poverty, with 1 males (100.0%) and 27 females (79.4%) in their respective age groups living below the poverty level.
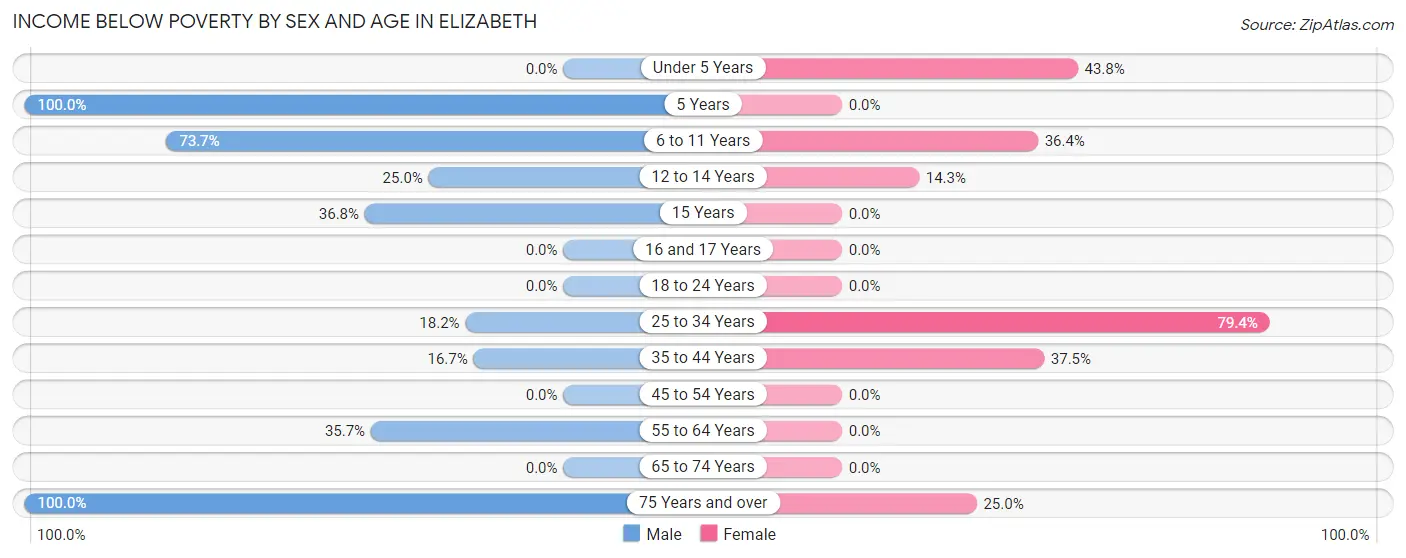
| Age Bracket | Male | Female |
| Under 5 Years | 0 (0.0%) | 7 (43.8%) |
| 5 Years | 1 (100.0%) | 0 (0.0%) |
| 6 to 11 Years | 14 (73.7%) | 12 (36.4%) |
| 12 to 14 Years | 9 (25.0%) | 2 (14.3%) |
| 15 Years | 7 (36.8%) | 0 (0.0%) |
| 16 and 17 Years | 0 (0.0%) | 0 (0.0%) |
| 18 to 24 Years | 0 (0.0%) | 0 (0.0%) |
| 25 to 34 Years | 12 (18.2%) | 27 (79.4%) |
| 35 to 44 Years | 3 (16.7%) | 12 (37.5%) |
| 45 to 54 Years | 0 (0.0%) | 0 (0.0%) |
| 55 to 64 Years | 5 (35.7%) | 0 (0.0%) |
| 65 to 74 Years | 0 (0.0%) | 0 (0.0%) |
| 75 Years and over | 4 (100.0%) | 5 (25.0%) |
| Total | 55 (22.7%) | 65 (26.5%) |
Income Above Poverty by Sex and Age in Elizabeth
According to the poverty statistics in Elizabeth, males aged 16 and 17 years and females aged 15 years are the age groups that are most secure financially, with 100.0% of males and 100.0% of females in these age groups living above the poverty line.
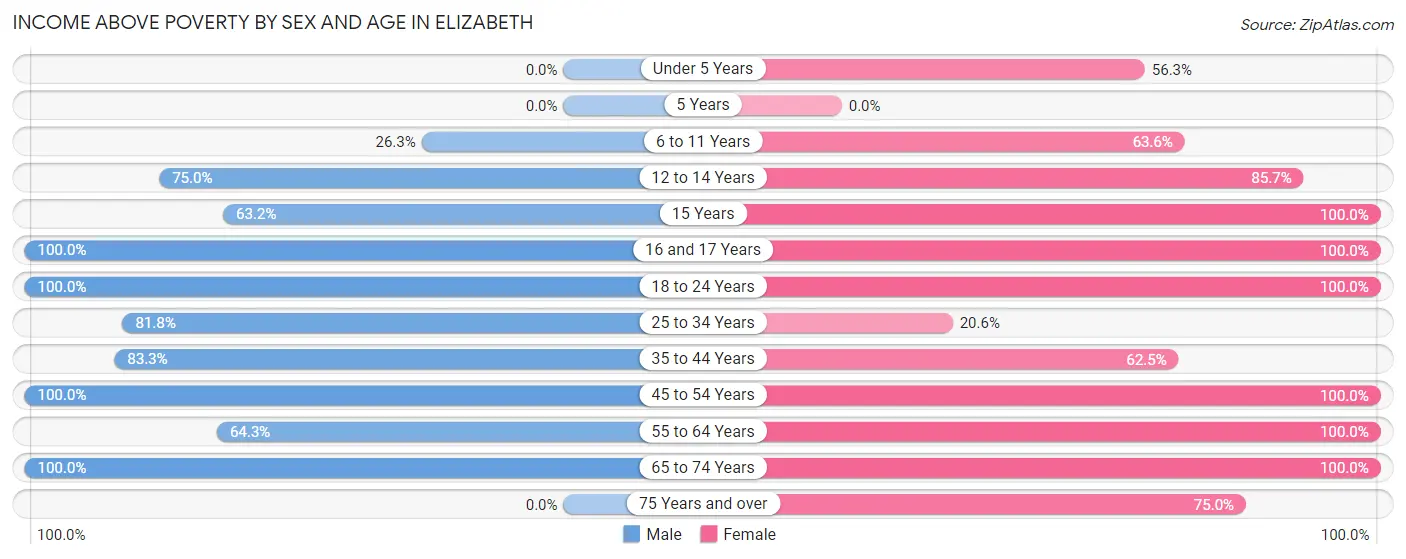
| Age Bracket | Male | Female |
| Under 5 Years | 0 (0.0%) | 9 (56.2%) |
| 5 Years | 0 (0.0%) | 0 (0.0%) |
| 6 to 11 Years | 5 (26.3%) | 21 (63.6%) |
| 12 to 14 Years | 27 (75.0%) | 12 (85.7%) |
| 15 Years | 12 (63.2%) | 7 (100.0%) |
| 16 and 17 Years | 2 (100.0%) | 17 (100.0%) |
| 18 to 24 Years | 22 (100.0%) | 29 (100.0%) |
| 25 to 34 Years | 54 (81.8%) | 7 (20.6%) |
| 35 to 44 Years | 15 (83.3%) | 20 (62.5%) |
| 45 to 54 Years | 26 (100.0%) | 5 (100.0%) |
| 55 to 64 Years | 9 (64.3%) | 30 (100.0%) |
| 65 to 74 Years | 15 (100.0%) | 8 (100.0%) |
| 75 Years and over | 0 (0.0%) | 15 (75.0%) |
| Total | 187 (77.3%) | 180 (73.5%) |
Income Below Poverty Among Married-Couple Families in Elizabeth
The poverty statistics for married-couple families in Elizabeth show that 35.3% or 24 of the total 68 families live below the poverty line. Families with 3 or 4 children have the highest poverty rate of 65.5%, comprising of 19 families. On the other hand, families with 1 or 2 children have the lowest poverty rate of 0.0%, which includes 0 families.
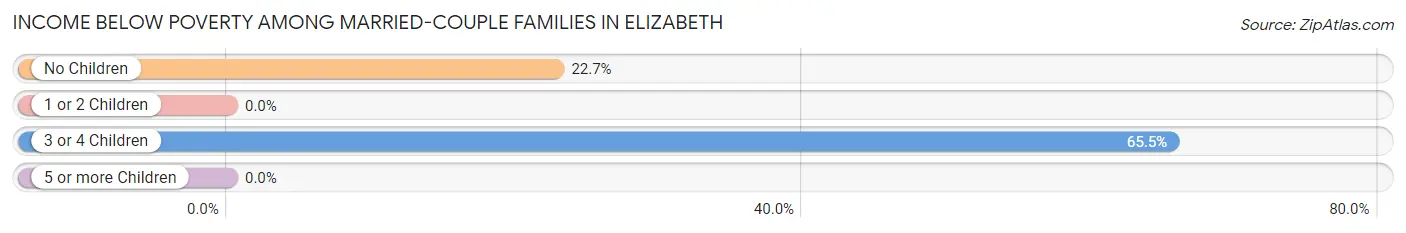
| Children | Above Poverty | Below Poverty |
| No Children | 17 (77.3%) | 5 (22.7%) |
| 1 or 2 Children | 17 (100.0%) | 0 (0.0%) |
| 3 or 4 Children | 10 (34.5%) | 19 (65.5%) |
| 5 or more Children | 0 (0.0%) | 0 (0.0%) |
| Total | 44 (64.7%) | 24 (35.3%) |
Income Below Poverty Among Single-Parent Households in Elizabeth
According to the poverty data in Elizabeth, 11.6% or 5 single-father households and 46.2% or 12 single-mother households are living below the poverty line. Among single-father households, those with 1 or 2 children have the highest poverty rate, with 5 households (26.3%) experiencing poverty. Likewise, among single-mother households, those with 3 or 4 children have the highest poverty rate, with 9 households (100.0%) falling below the poverty line.
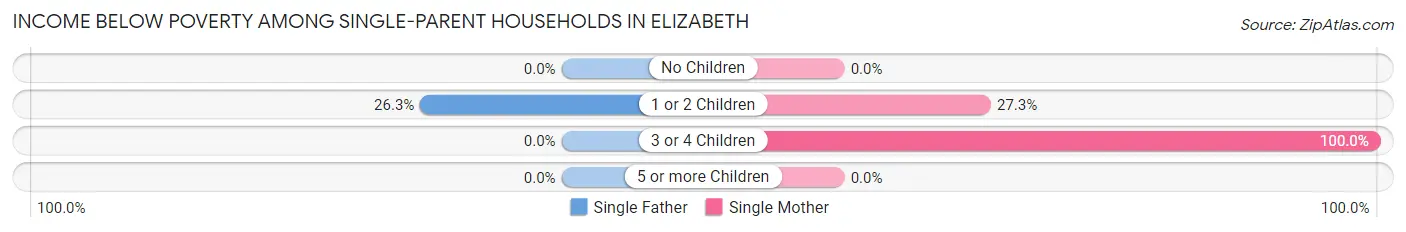
| Children | Single Father | Single Mother |
| No Children | 0 (0.0%) | 0 (0.0%) |
| 1 or 2 Children | 5 (26.3%) | 3 (27.3%) |
| 3 or 4 Children | 0 (0.0%) | 9 (100.0%) |
| 5 or more Children | 0 (0.0%) | 0 (0.0%) |
| Total | 5 (11.6%) | 12 (46.2%) |
Income Below Poverty Among Married-Couple vs Single-Parent Households in Elizabeth
The poverty data for Elizabeth shows that 24 of the married-couple family households (35.3%) and 17 of the single-parent households (24.6%) are living below the poverty level. Within the married-couple family households, those with 3 or 4 children have the highest poverty rate, with 19 households (65.5%) falling below the poverty line. Among the single-parent households, those with 3 or 4 children have the highest poverty rate, with 9 household (100.0%) living below poverty.
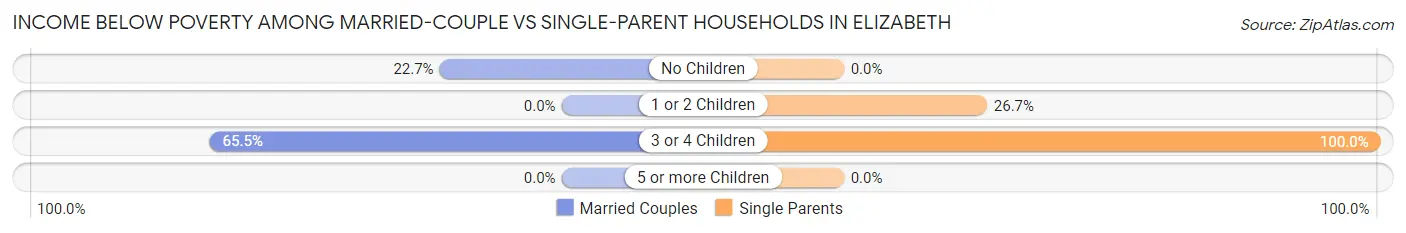
| Children | Married-Couple Families | Single-Parent Households |
| No Children | 5 (22.7%) | 0 (0.0%) |
| 1 or 2 Children | 0 (0.0%) | 8 (26.7%) |
| 3 or 4 Children | 19 (65.5%) | 9 (100.0%) |
| 5 or more Children | 0 (0.0%) | 0 (0.0%) |
| Total | 24 (35.3%) | 17 (24.6%) |
Race in Elizabeth
The most populous races in Elizabeth are White / Caucasian (439 | 90.0%), Two or more Races (31 | 6.4%), and Black / African American (12 | 2.5%).
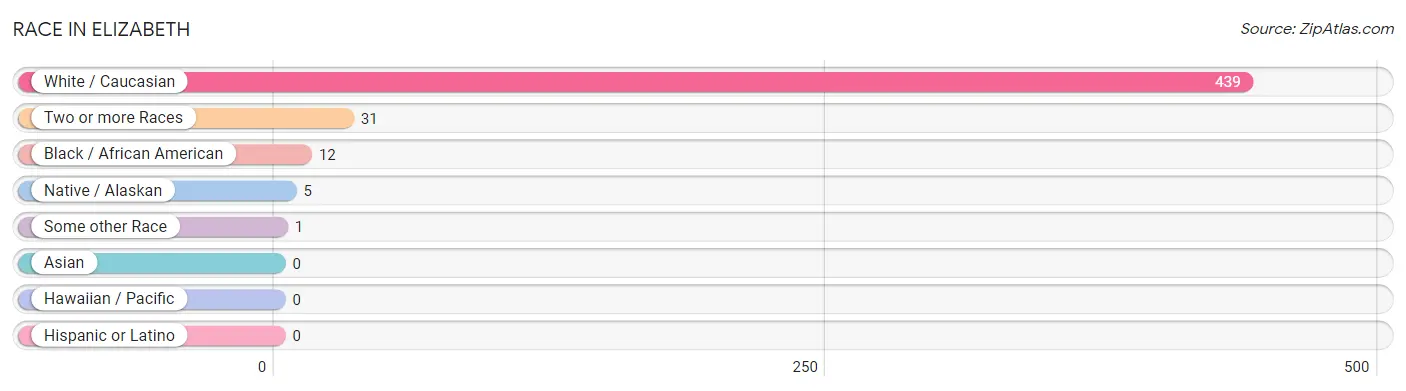
| Race | # Population | % Population |
| Asian | 0 | 0.0% |
| Black / African American | 12 | 2.5% |
| Hawaiian / Pacific | 0 | 0.0% |
| Hispanic or Latino | 0 | 0.0% |
| Native / Alaskan | 5 | 1.0% |
| White / Caucasian | 439 | 90.0% |
| Two or more Races | 31 | 6.4% |
| Some other Race | 1 | 0.2% |
| Total | 488 | 100.0% |
Ancestry in Elizabeth
The most populous ancestries reported in Elizabeth are Irish (86 | 17.6%), German (63 | 12.9%), English (55 | 11.3%), French (46 | 9.4%), and American (30 | 6.1%), together accounting for 57.4% of all Elizabeth residents.
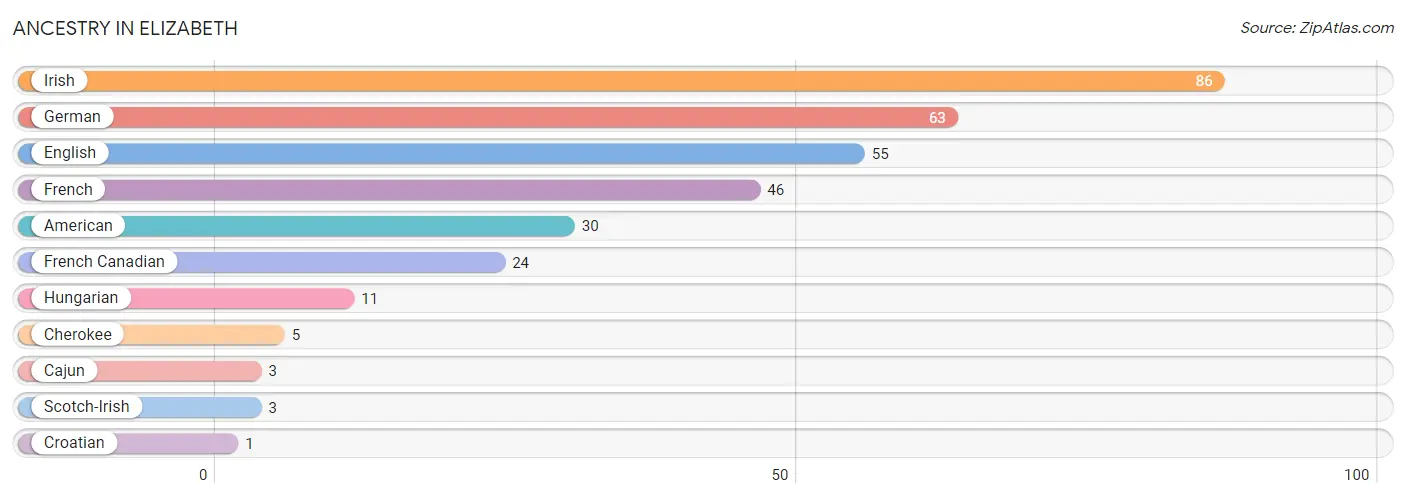
| Ancestry | # Population | % Population |
| American | 30 | 6.1% |
| Cajun | 3 | 0.6% |
| Cherokee | 5 | 1.0% |
| Croatian | 1 | 0.2% |
| English | 55 | 11.3% |
| French | 46 | 9.4% |
| French Canadian | 24 | 4.9% |
| German | 63 | 12.9% |
| Hungarian | 11 | 2.2% |
| Irish | 86 | 17.6% |
| Scotch-Irish | 3 | 0.6% | View All 11 Rows |
Immigrants in Elizabeth

| Immigration Origin | # Population | % Population | View All 0 Rows |
Sex and Age in Elizabeth
Sex and Age in Elizabeth
The most populous age groups in Elizabeth are 10 to 14 Years (46 | 18.9%) for men and 15 to 19 Years (37 | 15.1%) for women.
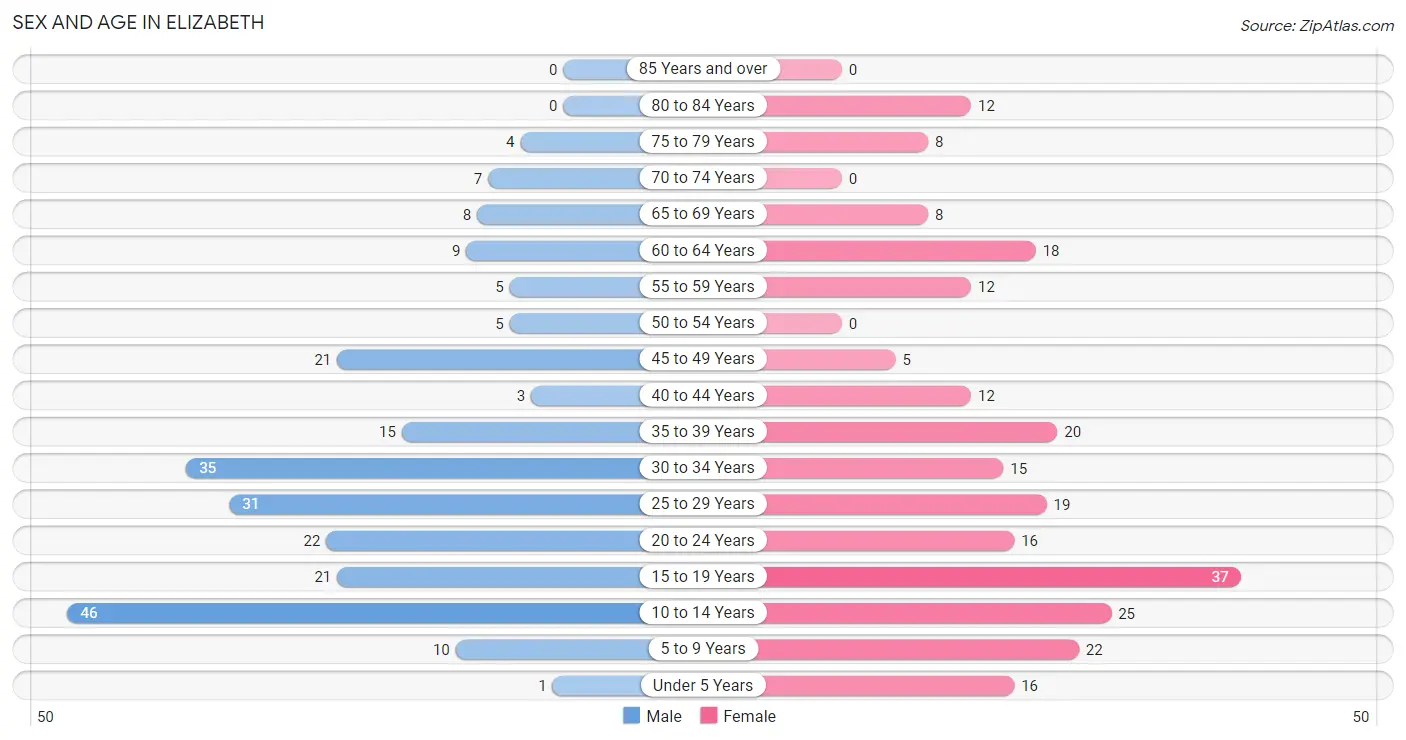
| Age Bracket | Male | Female |
| Under 5 Years | 1 (0.4%) | 16 (6.5%) |
| 5 to 9 Years | 10 (4.1%) | 22 (9.0%) |
| 10 to 14 Years | 46 (18.9%) | 25 (10.2%) |
| 15 to 19 Years | 21 (8.6%) | 37 (15.1%) |
| 20 to 24 Years | 22 (9.0%) | 16 (6.5%) |
| 25 to 29 Years | 31 (12.8%) | 19 (7.8%) |
| 30 to 34 Years | 35 (14.4%) | 15 (6.1%) |
| 35 to 39 Years | 15 (6.2%) | 20 (8.2%) |
| 40 to 44 Years | 3 (1.2%) | 12 (4.9%) |
| 45 to 49 Years | 21 (8.6%) | 5 (2.0%) |
| 50 to 54 Years | 5 (2.1%) | 0 (0.0%) |
| 55 to 59 Years | 5 (2.1%) | 12 (4.9%) |
| 60 to 64 Years | 9 (3.7%) | 18 (7.3%) |
| 65 to 69 Years | 8 (3.3%) | 8 (3.3%) |
| 70 to 74 Years | 7 (2.9%) | 0 (0.0%) |
| 75 to 79 Years | 4 (1.7%) | 8 (3.3%) |
| 80 to 84 Years | 0 (0.0%) | 12 (4.9%) |
| 85 Years and over | 0 (0.0%) | 0 (0.0%) |
| Total | 243 (100.0%) | 245 (100.0%) |
Families and Households in Elizabeth
Median Family Size in Elizabeth
The median family size in Elizabeth is 3.12 persons per family, with single female/mother families (26 | 19.0%) accounting for the largest median family size of 3.69 persons per family. On the other hand, single male/father families (43 | 31.4%) represent the smallest median family size with 2.56 persons per family.
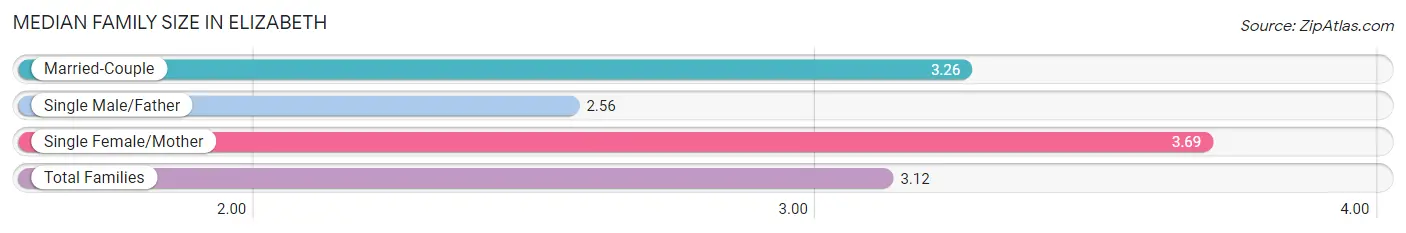
| Family Type | # Families | Family Size |
| Married-Couple | 68 (49.6%) | 3.26 |
| Single Male/Father | 43 (31.4%) | 2.56 |
| Single Female/Mother | 26 (19.0%) | 3.69 |
| Total Families | 137 (100.0%) | 3.12 |
Median Household Size in Elizabeth
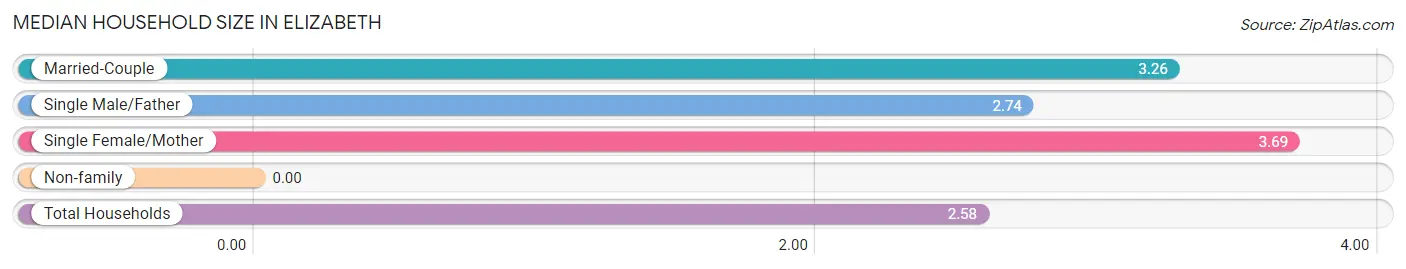
| Household Type | # Households | Household Size |
| Married-Couple | 68 (36.0%) | 3.26 |
| Single Male/Father | 43 (22.8%) | 2.74 |
| Single Female/Mother | 26 (13.8%) | 3.69 |
| Non-family | 52 (27.5%) | - |
| Total Households | 189 (100.0%) | 2.58 |
Household Size by Marriage Status in Elizabeth
Out of a total of 189 households in Elizabeth, 137 (72.5%) are family households, while 52 (27.5%) are nonfamily households. The most numerous type of family households are 5-person households, comprising 54, and the most common type of nonfamily households are 1-person households, comprising 52.
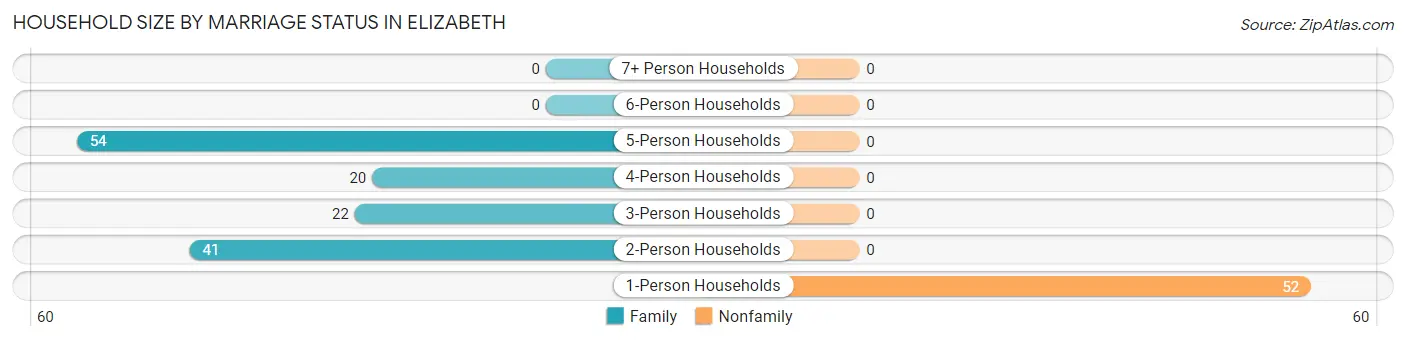
| Household Size | Family Households | Nonfamily Households |
| 1-Person Households | - | 52 (27.5%) |
| 2-Person Households | 41 (21.7%) | 0 (0.0%) |
| 3-Person Households | 22 (11.6%) | 0 (0.0%) |
| 4-Person Households | 20 (10.6%) | 0 (0.0%) |
| 5-Person Households | 54 (28.6%) | 0 (0.0%) |
| 6-Person Households | 0 (0.0%) | 0 (0.0%) |
| 7+ Person Households | 0 (0.0%) | 0 (0.0%) |
| Total | 137 (72.5%) | 52 (27.5%) |
Female Fertility in Elizabeth
Fertility by Age in Elizabeth
Average fertility rate in Elizabeth is 16.0 births per 1,000 women. Women in the age bracket of 15 to 19 years have the highest fertility rate with 54.0 births per 1,000 women. Women in the age bracket of 15 to 19 years acount for 100.0% of all women with births.
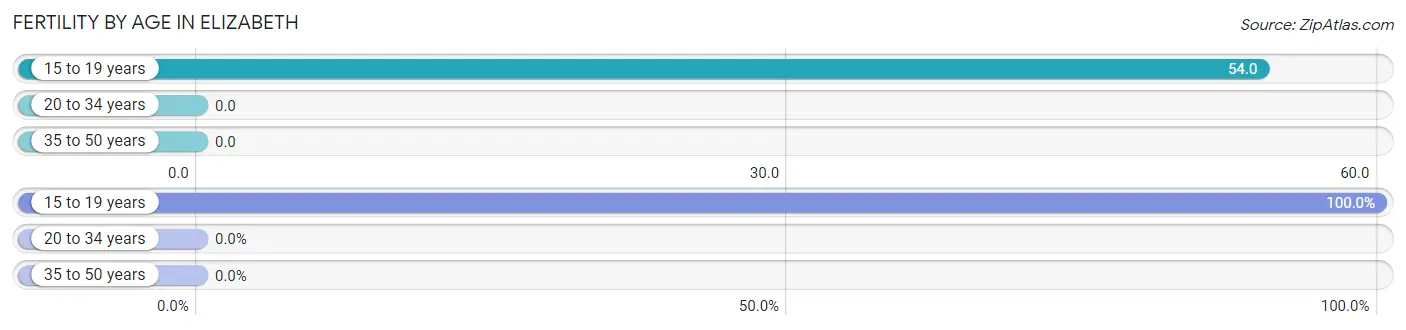
| Age Bracket | Women with Births | Births / 1,000 Women |
| 15 to 19 years | 2 (100.0%) | 54.0 |
| 20 to 34 years | 0 (0.0%) | 0.0 |
| 35 to 50 years | 0 (0.0%) | 0.0 |
| Total | 2 (100.0%) | 16.0 |
Fertility by Age by Marriage Status in Elizabeth
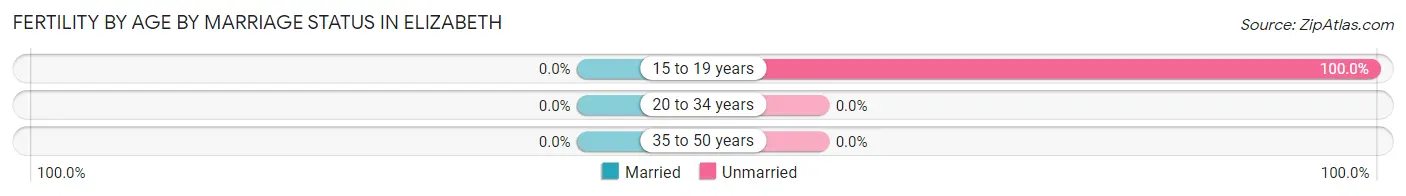
| Age Bracket | Married | Unmarried |
| 15 to 19 years | 0 (0.0%) | 2 (100.0%) |
| 20 to 34 years | 0 (0.0%) | 0 (0.0%) |
| 35 to 50 years | 0 (0.0%) | 0 (0.0%) |
| Total | 0 (0.0%) | 2 (100.0%) |
Fertility by Education in Elizabeth
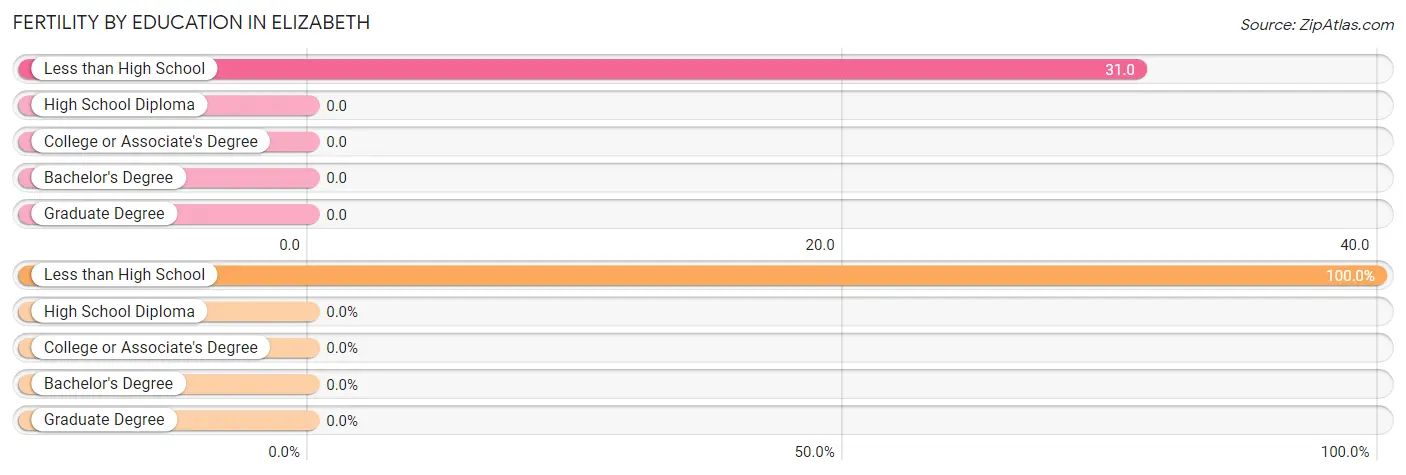
| Educational Attainment | Women with Births | Births / 1,000 Women |
| Less than High School | 2 (100.0%) | 31.0 |
| High School Diploma | 0 (0.0%) | 0.0 |
| College or Associate's Degree | 0 (0.0%) | 0.0 |
| Bachelor's Degree | 0 (0.0%) | 0.0 |
| Graduate Degree | 0 (0.0%) | 0.0 |
| Total | 2 (100.0%) | 16.0 |
Fertility by Education by Marriage Status in Elizabeth
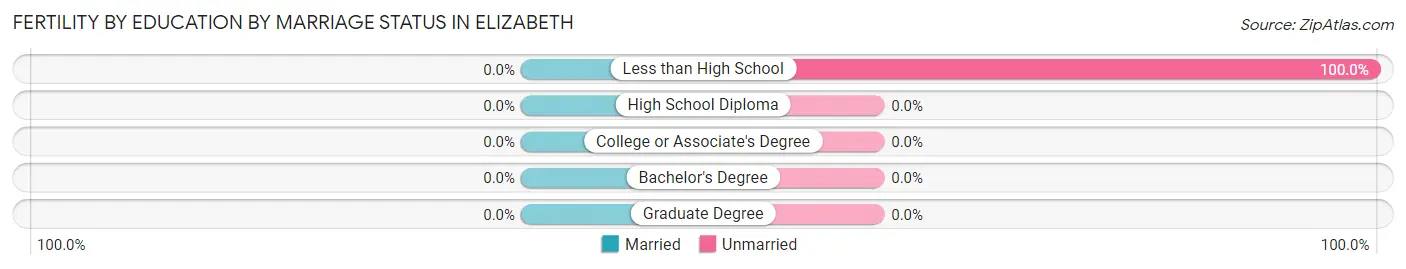
| Educational Attainment | Married | Unmarried |
| Less than High School | 0 (0.0%) | 2 (100.0%) |
| High School Diploma | 0 (0.0%) | 0 (0.0%) |
| College or Associate's Degree | 0 (0.0%) | 0 (0.0%) |
| Bachelor's Degree | 0 (0.0%) | 0 (0.0%) |
| Graduate Degree | 0 (0.0%) | 0 (0.0%) |
| Total | 0 (0.0%) | 2 (100.0%) |
Employment Characteristics in Elizabeth
Employment by Class of Employer in Elizabeth
Among the 182 employed individuals in Elizabeth, private company employees (138 | 75.8%), self-employed (not incorporated) (19 | 10.4%), and state government employees (11 | 6.0%) make up the most common classes of employment.
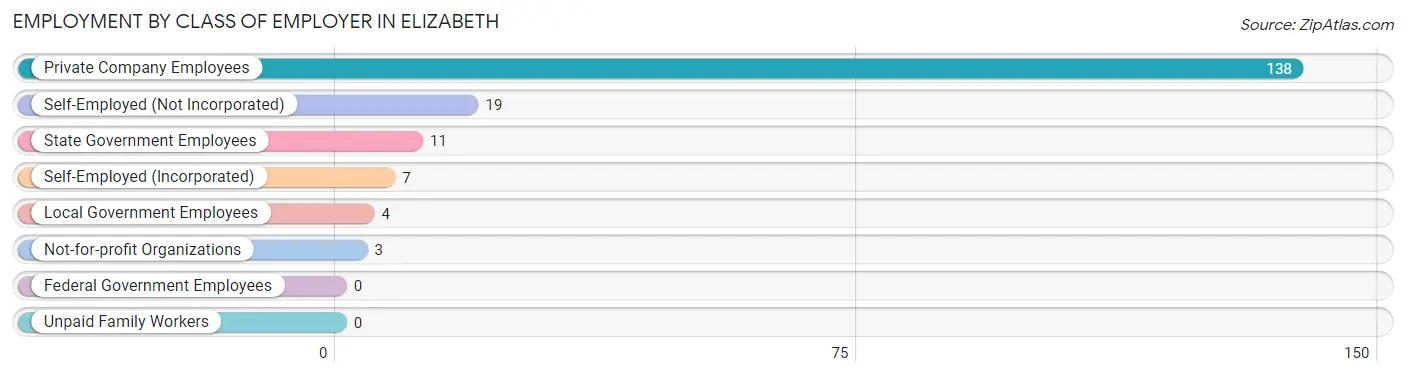
| Employer Class | # Employees | % Employees |
| Private Company Employees | 138 | 75.8% |
| Self-Employed (Incorporated) | 7 | 3.8% |
| Self-Employed (Not Incorporated) | 19 | 10.4% |
| Not-for-profit Organizations | 3 | 1.7% |
| Local Government Employees | 4 | 2.2% |
| State Government Employees | 11 | 6.0% |
| Federal Government Employees | 0 | 0.0% |
| Unpaid Family Workers | 0 | 0.0% |
| Total | 182 | 100.0% |
Employment Status by Age in Elizabeth
According to the labor force statistics for Elizabeth, out of the total population over 16 years of age (342), 59.9% or 205 individuals are in the labor force, with 9.3% or 19 of them unemployed. The age group with the highest labor force participation rate is 30 to 34 years, with 90.0% or 45 individuals in the labor force. Within the labor force, the 25 to 29 years age range has the highest percentage of unemployed individuals, with 29.0% or 9 of them being unemployed.
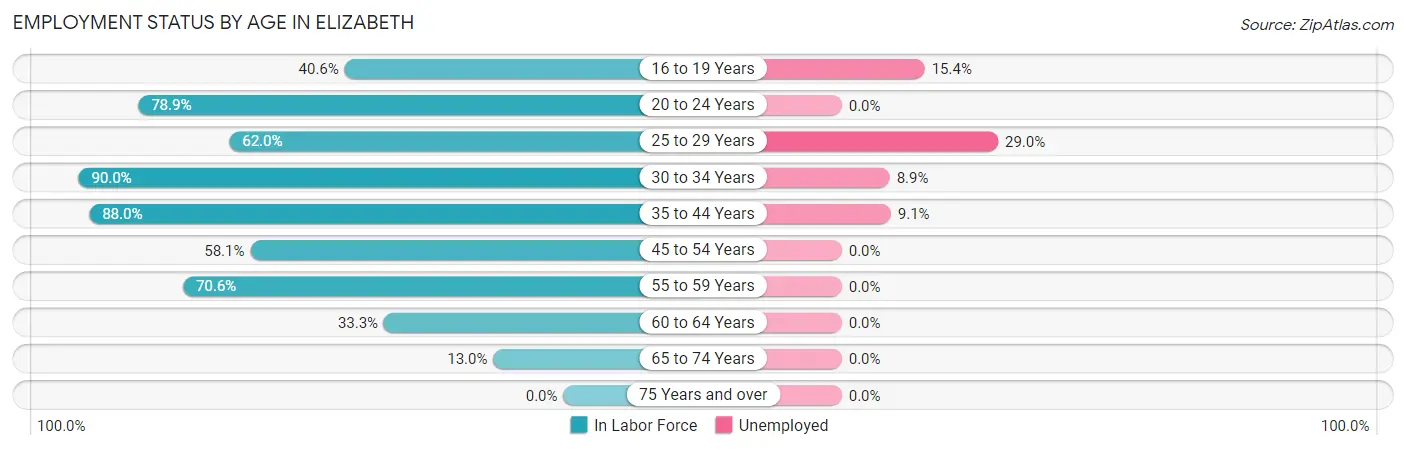
| Age Bracket | In Labor Force | Unemployed |
| 16 to 19 Years | 13 (40.6%) | 2 (15.4%) |
| 20 to 24 Years | 30 (78.9%) | 0 (0.0%) |
| 25 to 29 Years | 31 (62.0%) | 9 (29.0%) |
| 30 to 34 Years | 45 (90.0%) | 4 (8.9%) |
| 35 to 44 Years | 44 (88.0%) | 4 (9.1%) |
| 45 to 54 Years | 18 (58.1%) | 0 (0.0%) |
| 55 to 59 Years | 12 (70.6%) | 0 (0.0%) |
| 60 to 64 Years | 9 (33.3%) | 0 (0.0%) |
| 65 to 74 Years | 3 (13.0%) | 0 (0.0%) |
| 75 Years and over | 0 (0.0%) | 0 (0.0%) |
| Total | 205 (59.9%) | 19 (9.3%) |
Employment Status by Educational Attainment in Elizabeth
According to labor force statistics for Elizabeth, 70.7% of individuals (159) out of the total population between 25 and 64 years of age (225) are in the labor force, with 10.7% or 17 of them being unemployed. The group with the highest labor force participation rate are those with the educational attainment of bachelor's degree or higher, with 100.0% or 9 individuals in the labor force. Within the labor force, individuals with less than high school education have the highest percentage of unemployment, with 25.0% or 4 of them being unemployed.
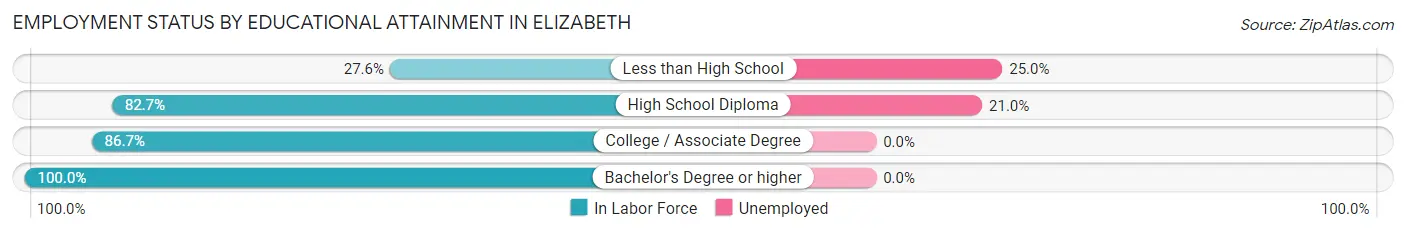
| Educational Attainment | In Labor Force | Unemployed |
| Less than High School | 16 (27.6%) | 14 (25.0%) |
| High School Diploma | 62 (82.7%) | 16 (21.0%) |
| College / Associate Degree | 72 (86.7%) | 0 (0.0%) |
| Bachelor's Degree or higher | 9 (100.0%) | 0 (0.0%) |
| Total | 159 (70.7%) | 24 (10.7%) |
Employment Occupations by Sex in Elizabeth
Management, Business, Science and Arts Occupations
The most common Management, Business, Science and Arts occupations in Elizabeth are Management (15 | 8.1%), Community & Social Service (13 | 7.0%), Education Instruction & Library (9 | 4.8%), Business & Financial (5 | 2.7%), and Arts, Media & Entertainment (4 | 2.1%).
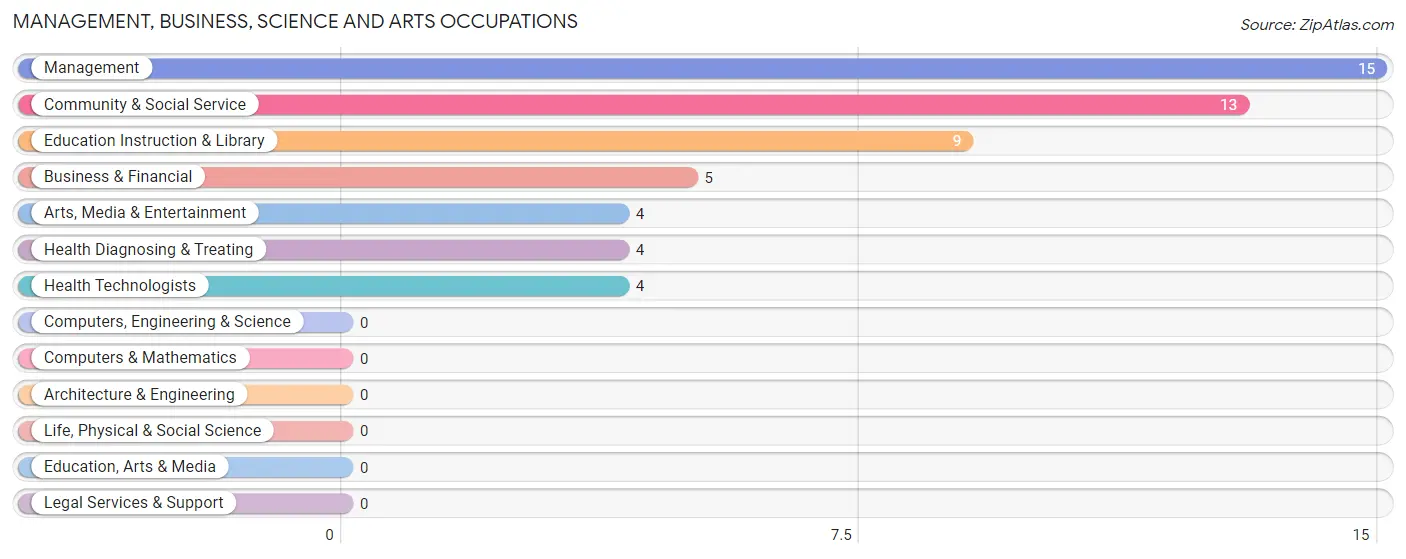
Management, Business, Science and Arts Occupations by Sex
Within the Management, Business, Science and Arts occupations in Elizabeth, the most male-oriented occupations are Management (100.0%), Education Instruction & Library (88.9%), and Community & Social Service (61.5%), while the most female-oriented occupations are Business & Financial (100.0%), Arts, Media & Entertainment (100.0%), and Health Diagnosing & Treating (100.0%).
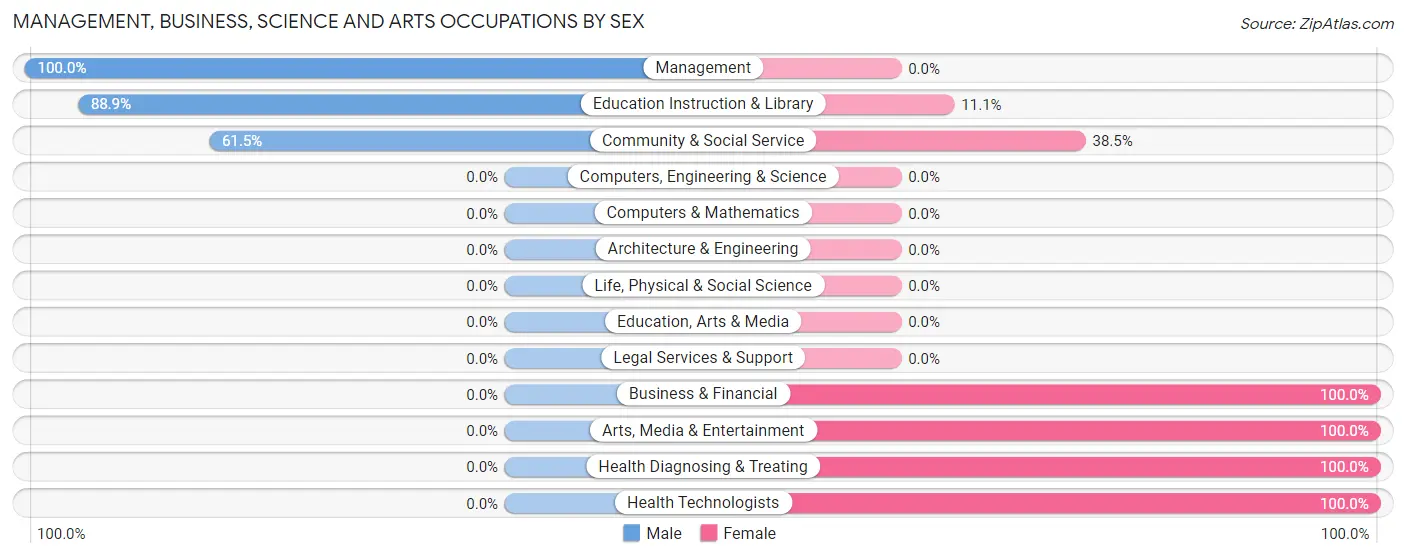
| Occupation | Male | Female |
| Management | 15 (100.0%) | 0 (0.0%) |
| Business & Financial | 0 (0.0%) | 5 (100.0%) |
| Computers, Engineering & Science | 0 (0.0%) | 0 (0.0%) |
| Computers & Mathematics | 0 (0.0%) | 0 (0.0%) |
| Architecture & Engineering | 0 (0.0%) | 0 (0.0%) |
| Life, Physical & Social Science | 0 (0.0%) | 0 (0.0%) |
| Community & Social Service | 8 (61.5%) | 5 (38.5%) |
| Education, Arts & Media | 0 (0.0%) | 0 (0.0%) |
| Legal Services & Support | 0 (0.0%) | 0 (0.0%) |
| Education Instruction & Library | 8 (88.9%) | 1 (11.1%) |
| Arts, Media & Entertainment | 0 (0.0%) | 4 (100.0%) |
| Health Diagnosing & Treating | 0 (0.0%) | 4 (100.0%) |
| Health Technologists | 0 (0.0%) | 4 (100.0%) |
| Total (Category) | 23 (62.2%) | 14 (37.8%) |
| Total (Overall) | 118 (63.4%) | 68 (36.6%) |
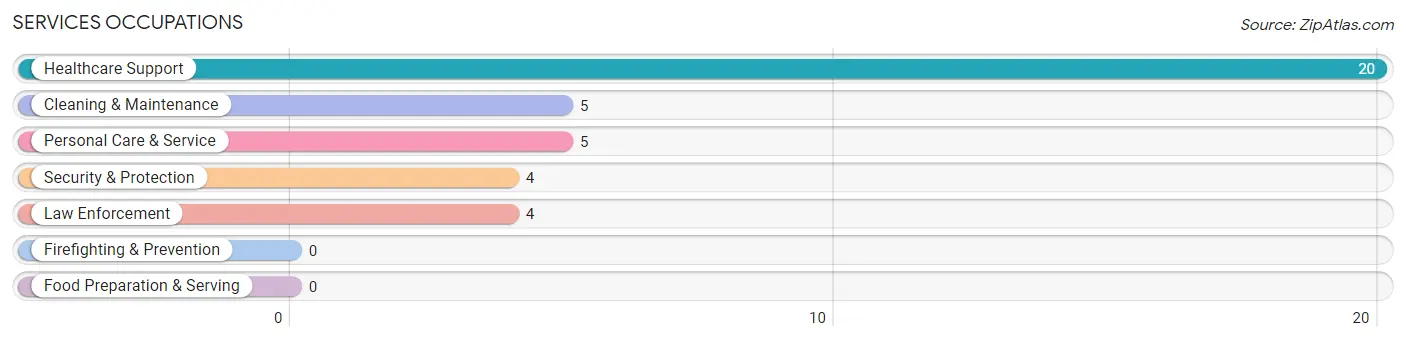
Services Occupations
The most common Services occupations in Elizabeth are Healthcare Support (20 | 10.7%), Cleaning & Maintenance (5 | 2.7%), Personal Care & Service (5 | 2.7%), Security & Protection (4 | 2.1%), and Law Enforcement (4 | 2.1%).
Services Occupations by Sex
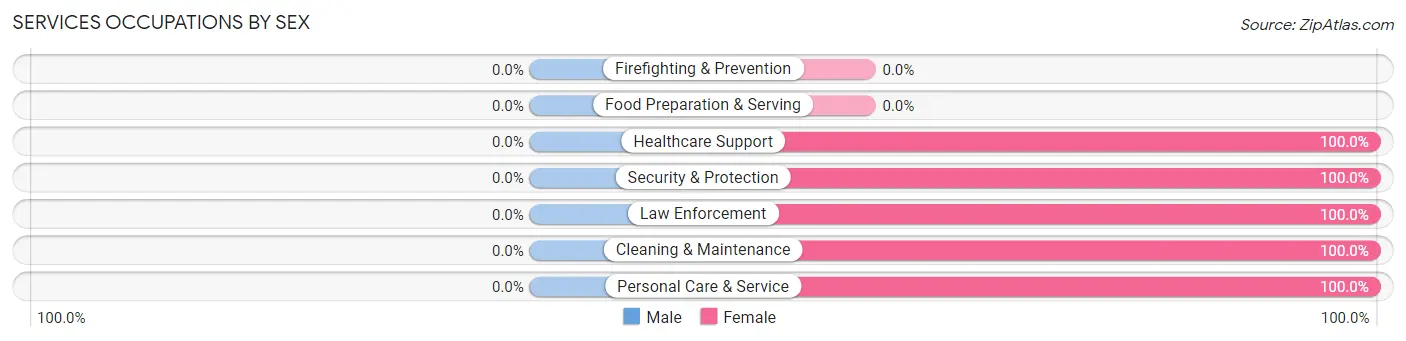
| Occupation | Male | Female |
| Healthcare Support | 0 (0.0%) | 20 (100.0%) |
| Security & Protection | 0 (0.0%) | 4 (100.0%) |
| Firefighting & Prevention | 0 (0.0%) | 0 (0.0%) |
| Law Enforcement | 0 (0.0%) | 4 (100.0%) |
| Food Preparation & Serving | 0 (0.0%) | 0 (0.0%) |
| Cleaning & Maintenance | 0 (0.0%) | 5 (100.0%) |
| Personal Care & Service | 0 (0.0%) | 5 (100.0%) |
| Total (Category) | 0 (0.0%) | 34 (100.0%) |
| Total (Overall) | 118 (63.4%) | 68 (36.6%) |
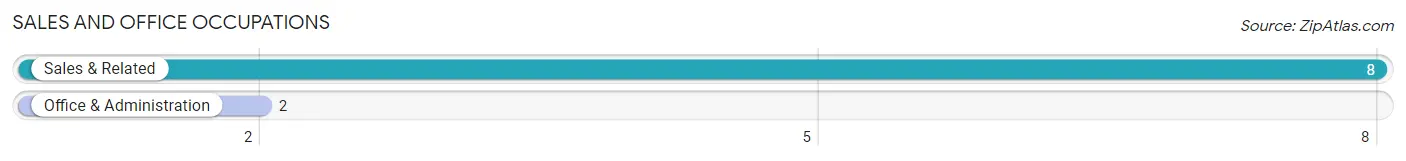
Sales and Office Occupations
The most common Sales and Office occupations in Elizabeth are Sales & Related (8 | 4.3%), and Office & Administration (2 | 1.1%).
Sales and Office Occupations by Sex
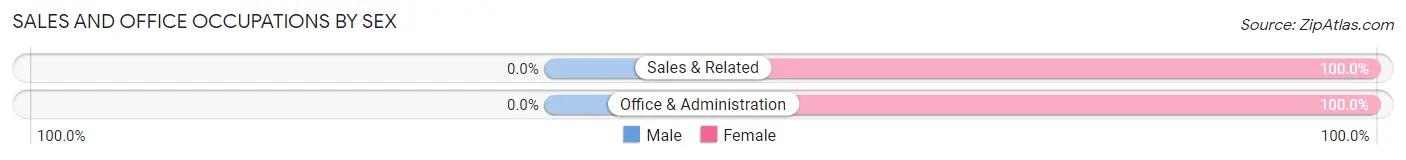
| Occupation | Male | Female |
| Sales & Related | 0 (0.0%) | 8 (100.0%) |
| Office & Administration | 0 (0.0%) | 2 (100.0%) |
| Total (Category) | 0 (0.0%) | 10 (100.0%) |
| Total (Overall) | 118 (63.4%) | 68 (36.6%) |
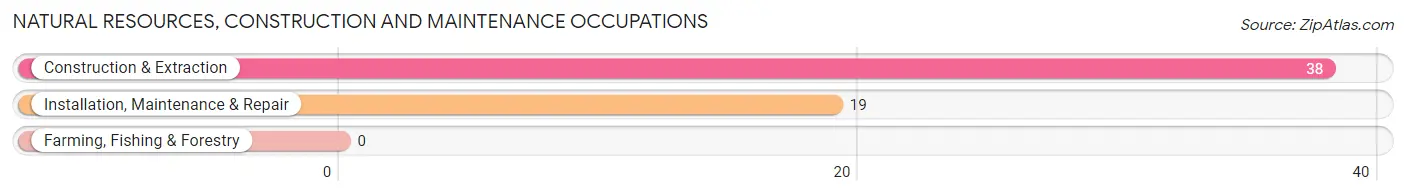
Natural Resources, Construction and Maintenance Occupations
The most common Natural Resources, Construction and Maintenance occupations in Elizabeth are Construction & Extraction (38 | 20.4%), and Installation, Maintenance & Repair (19 | 10.2%).
Natural Resources, Construction and Maintenance Occupations by Sex
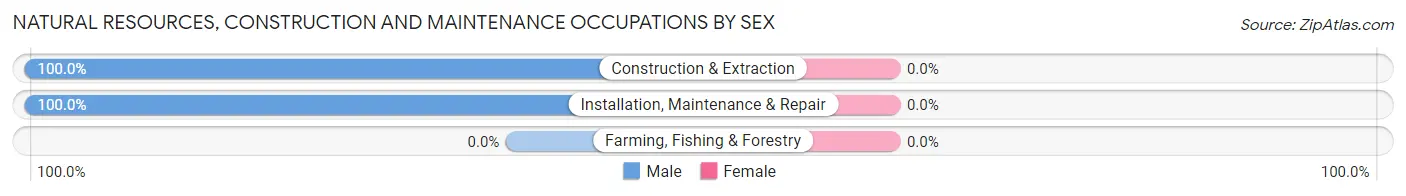
| Occupation | Male | Female |
| Farming, Fishing & Forestry | 0 (0.0%) | 0 (0.0%) |
| Construction & Extraction | 38 (100.0%) | 0 (0.0%) |
| Installation, Maintenance & Repair | 19 (100.0%) | 0 (0.0%) |
| Total (Category) | 57 (100.0%) | 0 (0.0%) |
| Total (Overall) | 118 (63.4%) | 68 (36.6%) |
Production, Transportation and Moving Occupations
The most common Production, Transportation and Moving occupations in Elizabeth are Production (20 | 10.7%), Transportation (20 | 10.7%), and Material Moving (8 | 4.3%).
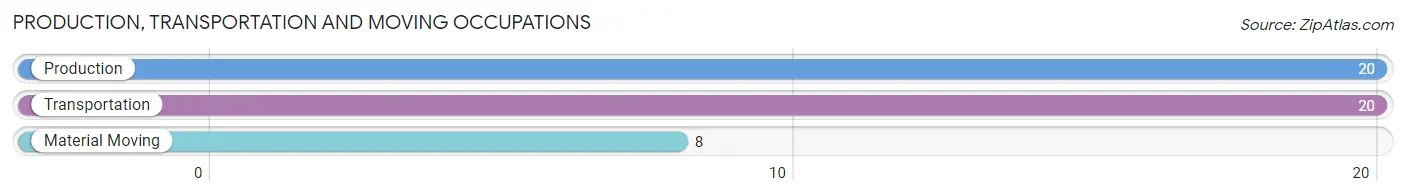
Production, Transportation and Moving Occupations by Sex
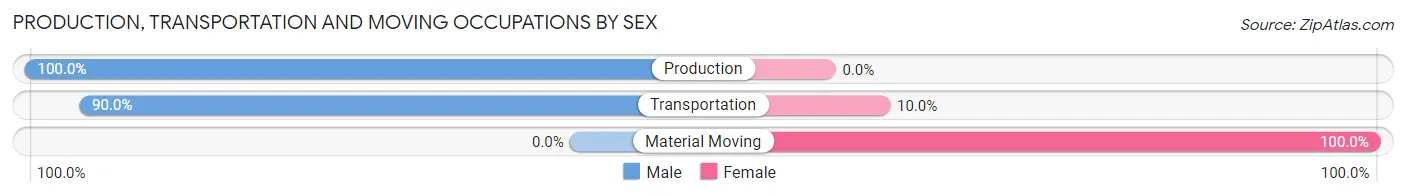
| Occupation | Male | Female |
| Production | 20 (100.0%) | 0 (0.0%) |
| Transportation | 18 (90.0%) | 2 (10.0%) |
| Material Moving | 0 (0.0%) | 8 (100.0%) |
| Total (Category) | 38 (79.2%) | 10 (20.8%) |
| Total (Overall) | 118 (63.4%) | 68 (36.6%) |
Employment Industries by Sex in Elizabeth
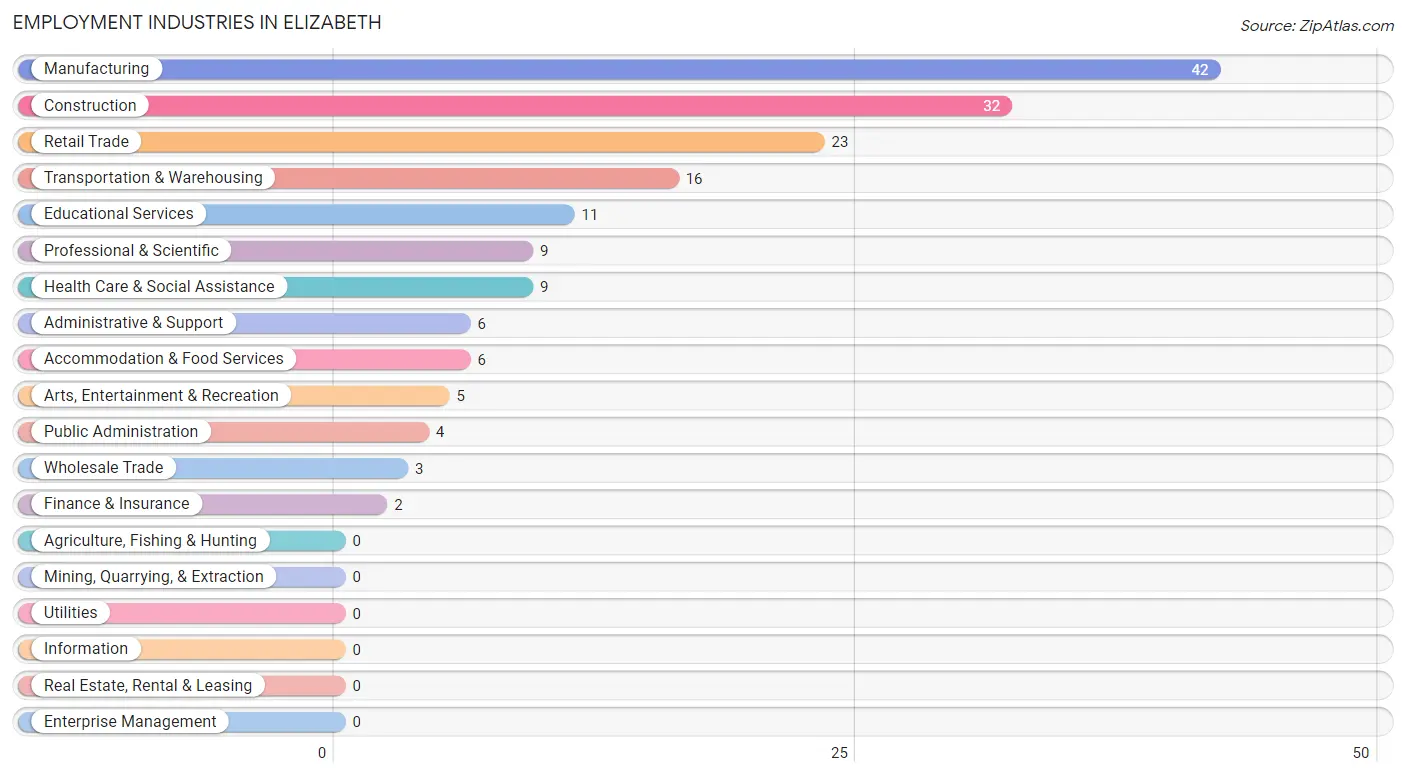
Employment Industries in Elizabeth
The major employment industries in Elizabeth include Manufacturing (42 | 22.6%), Construction (32 | 17.2%), Retail Trade (23 | 12.4%), Transportation & Warehousing (16 | 8.6%), and Educational Services (11 | 5.9%).
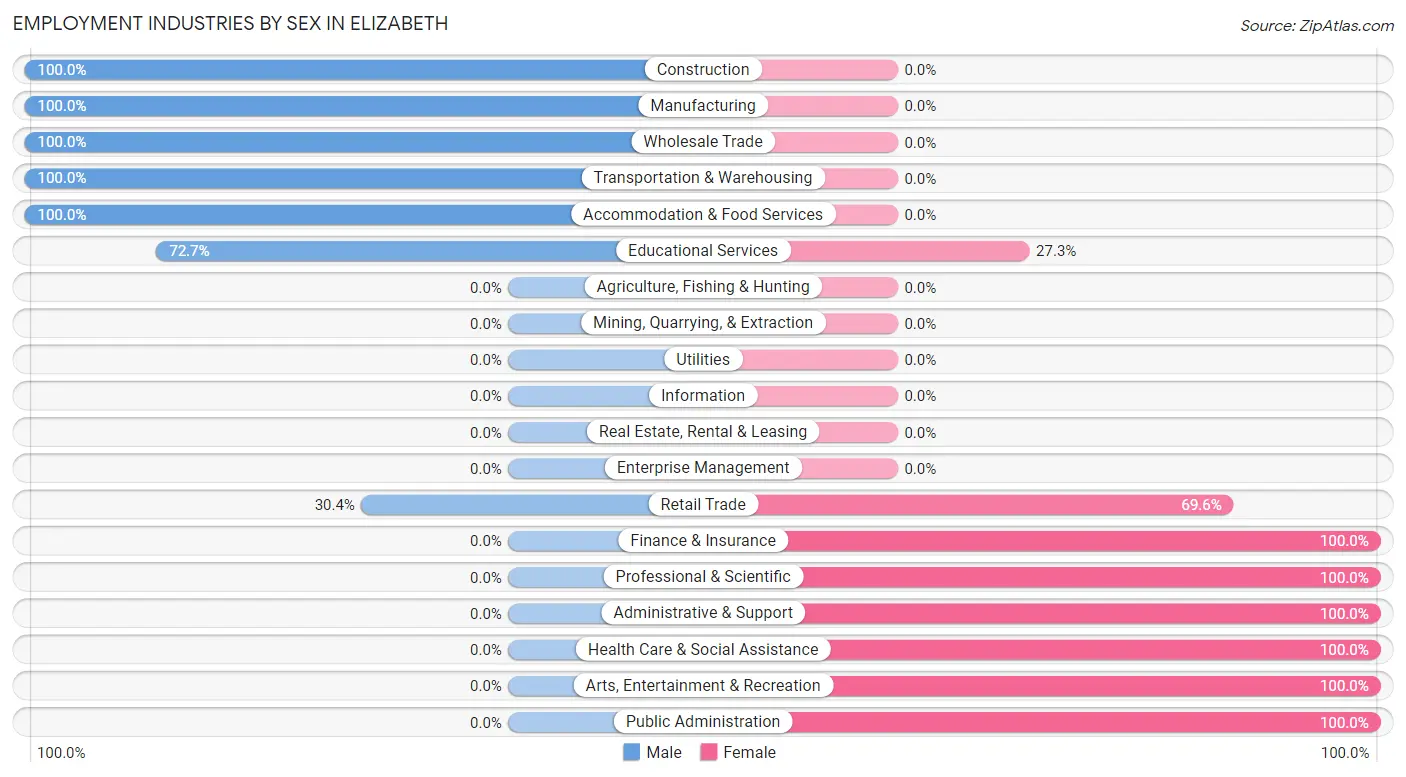
Employment Industries by Sex in Elizabeth
The Elizabeth industries that see more men than women are Construction (100.0%), Manufacturing (100.0%), and Wholesale Trade (100.0%), whereas the industries that tend to have a higher number of women are Finance & Insurance (100.0%), Professional & Scientific (100.0%), and Administrative & Support (100.0%).
| Industry | Male | Female |
| Agriculture, Fishing & Hunting | 0 (0.0%) | 0 (0.0%) |
| Mining, Quarrying, & Extraction | 0 (0.0%) | 0 (0.0%) |
| Construction | 32 (100.0%) | 0 (0.0%) |
| Manufacturing | 42 (100.0%) | 0 (0.0%) |
| Wholesale Trade | 3 (100.0%) | 0 (0.0%) |
| Retail Trade | 7 (30.4%) | 16 (69.6%) |
| Transportation & Warehousing | 16 (100.0%) | 0 (0.0%) |
| Utilities | 0 (0.0%) | 0 (0.0%) |
| Information | 0 (0.0%) | 0 (0.0%) |
| Finance & Insurance | 0 (0.0%) | 2 (100.0%) |
| Real Estate, Rental & Leasing | 0 (0.0%) | 0 (0.0%) |
| Professional & Scientific | 0 (0.0%) | 9 (100.0%) |
| Enterprise Management | 0 (0.0%) | 0 (0.0%) |
| Administrative & Support | 0 (0.0%) | 6 (100.0%) |
| Educational Services | 8 (72.7%) | 3 (27.3%) |
| Health Care & Social Assistance | 0 (0.0%) | 9 (100.0%) |
| Arts, Entertainment & Recreation | 0 (0.0%) | 5 (100.0%) |
| Accommodation & Food Services | 6 (100.0%) | 0 (0.0%) |
| Public Administration | 0 (0.0%) | 4 (100.0%) |
| Total | 118 (63.4%) | 68 (36.6%) |
Education in Elizabeth
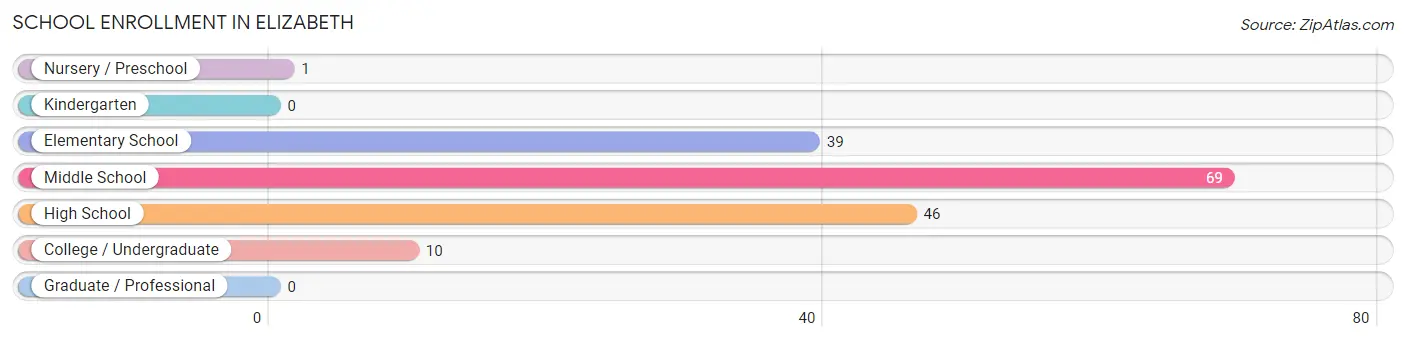
School Enrollment in Elizabeth
The most common levels of schooling among the 165 students in Elizabeth are middle school (69 | 41.8%), high school (46 | 27.9%), and elementary school (39 | 23.6%).
| School Level | # Students | % Students |
| Nursery / Preschool | 1 | 0.6% |
| Kindergarten | 0 | 0.0% |
| Elementary School | 39 | 23.6% |
| Middle School | 69 | 41.8% |
| High School | 46 | 27.9% |
| College / Undergraduate | 10 | 6.1% |
| Graduate / Professional | 0 | 0.0% |
| Total | 165 | 100.0% |
School Enrollment by Age by Funding Source in Elizabeth
Out of a total of 165 students who are enrolled in schools in Elizabeth, 2 (1.2%) attend a private institution, while the remaining 163 (98.8%) are enrolled in public schools. The age group of 18 to 19 year olds has the highest likelihood of being enrolled in private schools, with 2 (28.6% in the age bracket) enrolled. Conversely, the age group of 5 to 9 year old has the lowest likelihood of being enrolled in a private school, with 32 (100.0% in the age bracket) attending a public institution.
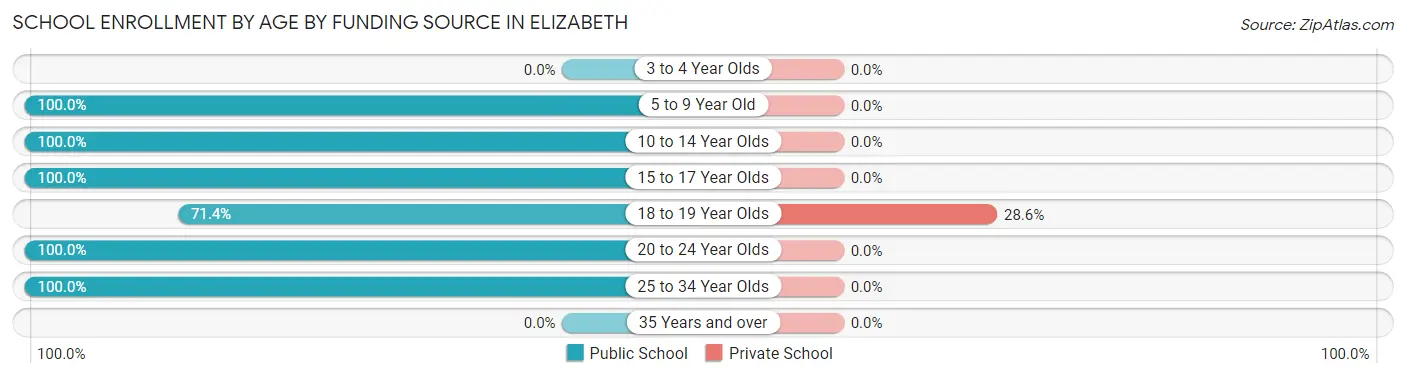
| Age Bracket | Public School | Private School |
| 3 to 4 Year Olds | 0 (0.0%) | 0 (0.0%) |
| 5 to 9 Year Old | 32 (100.0%) | 0 (0.0%) |
| 10 to 14 Year Olds | 71 (100.0%) | 0 (0.0%) |
| 15 to 17 Year Olds | 45 (100.0%) | 0 (0.0%) |
| 18 to 19 Year Olds | 5 (71.4%) | 2 (28.6%) |
| 20 to 24 Year Olds | 6 (100.0%) | 0 (0.0%) |
| 25 to 34 Year Olds | 4 (100.0%) | 0 (0.0%) |
| 35 Years and over | 0 (0.0%) | 0 (0.0%) |
| Total | 163 (98.8%) | 2 (1.2%) |
Educational Attainment by Field of Study in Elizabeth
Liberal arts & history (7 | 77.8%), bio, nature & agricultural (1 | 11.1%), and education (1 | 11.1%) are the most common fields of study among 9 individuals in Elizabeth who have obtained a bachelor's degree or higher.
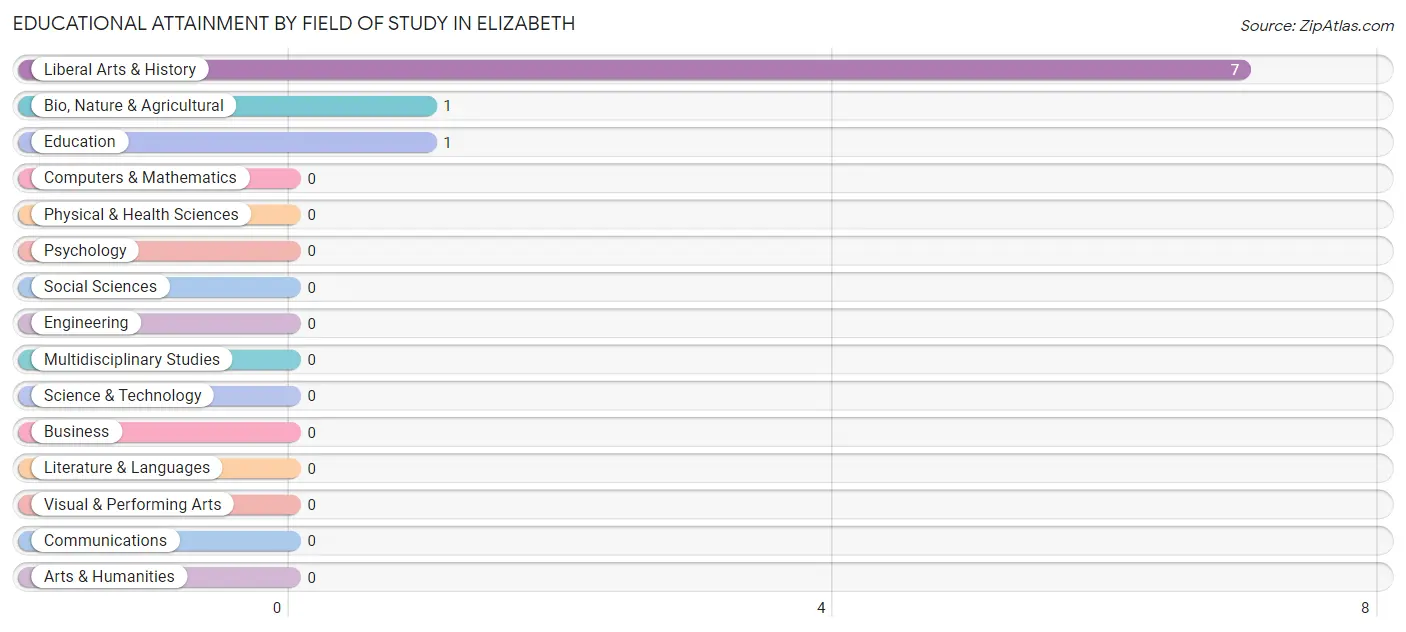
| Field of Study | # Graduates | % Graduates |
| Computers & Mathematics | 0 | 0.0% |
| Bio, Nature & Agricultural | 1 | 11.1% |
| Physical & Health Sciences | 0 | 0.0% |
| Psychology | 0 | 0.0% |
| Social Sciences | 0 | 0.0% |
| Engineering | 0 | 0.0% |
| Multidisciplinary Studies | 0 | 0.0% |
| Science & Technology | 0 | 0.0% |
| Business | 0 | 0.0% |
| Education | 1 | 11.1% |
| Literature & Languages | 0 | 0.0% |
| Liberal Arts & History | 7 | 77.8% |
| Visual & Performing Arts | 0 | 0.0% |
| Communications | 0 | 0.0% |
| Arts & Humanities | 0 | 0.0% |
| Total | 9 | 100.0% |
Transportation & Commute in Elizabeth
Vehicle Availability by Sex in Elizabeth
The most prevalent vehicle ownership categories in Elizabeth are males with 2 vehicles (43, accounting for 37.7%) and females with 2 vehicles (16, making up 63.2%).
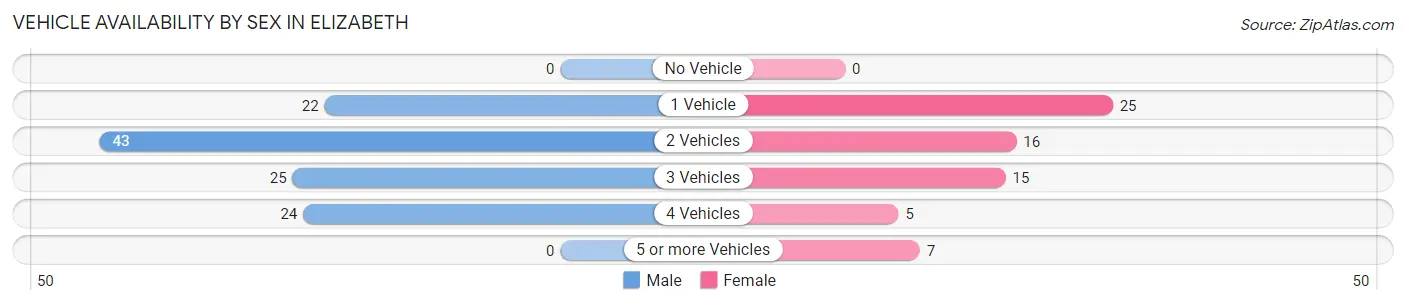
| Vehicles Available | Male | Female |
| No Vehicle | 0 (0.0%) | 0 (0.0%) |
| 1 Vehicle | 22 (19.3%) | 25 (36.8%) |
| 2 Vehicles | 43 (37.7%) | 16 (23.5%) |
| 3 Vehicles | 25 (21.9%) | 15 (22.1%) |
| 4 Vehicles | 24 (21.0%) | 5 (7.3%) |
| 5 or more Vehicles | 0 (0.0%) | 7 (10.3%) |
| Total | 114 (100.0%) | 68 (100.0%) |
Commute Time in Elizabeth
The most frequently occuring commute durations in Elizabeth are less than 5 minutes (42 commuters, 23.6%), 60 to 89 minutes (24 commuters, 13.5%), and 90 or more minutes (22 commuters, 12.4%).
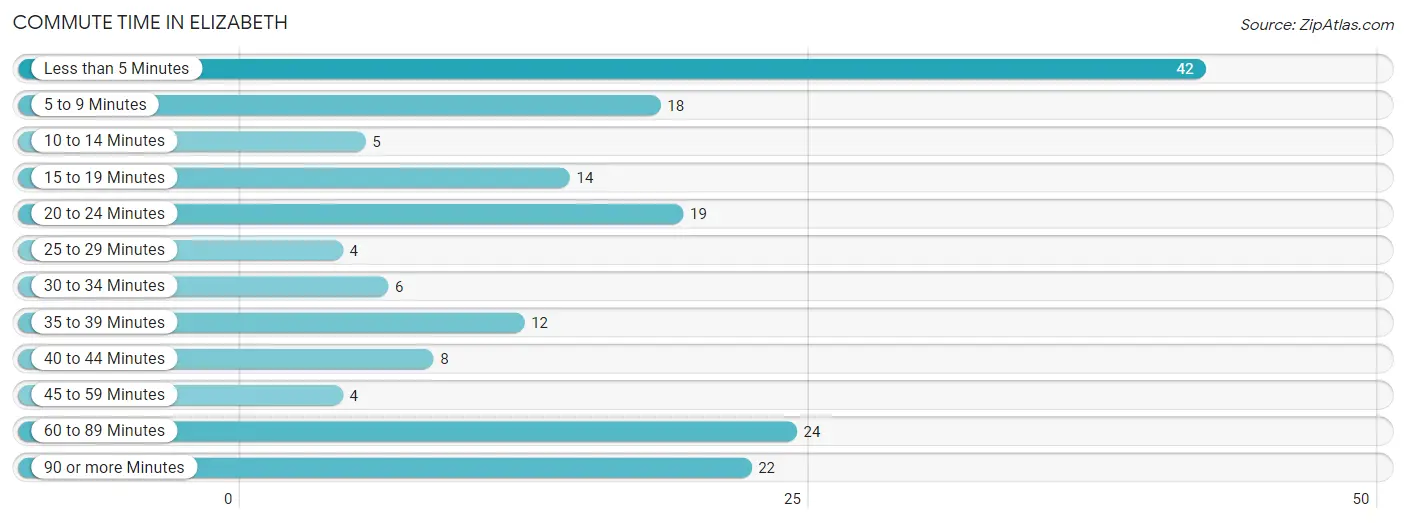
| Commute Time | # Commuters | % Commuters |
| Less than 5 Minutes | 42 | 23.6% |
| 5 to 9 Minutes | 18 | 10.1% |
| 10 to 14 Minutes | 5 | 2.8% |
| 15 to 19 Minutes | 14 | 7.9% |
| 20 to 24 Minutes | 19 | 10.7% |
| 25 to 29 Minutes | 4 | 2.2% |
| 30 to 34 Minutes | 6 | 3.4% |
| 35 to 39 Minutes | 12 | 6.7% |
| 40 to 44 Minutes | 8 | 4.5% |
| 45 to 59 Minutes | 4 | 2.2% |
| 60 to 89 Minutes | 24 | 13.5% |
| 90 or more Minutes | 22 | 12.4% |
Commute Time by Sex in Elizabeth
The most common commute times in Elizabeth are 60 to 89 minutes (24 commuters, 21.0%) for males and less than 5 minutes (22 commuters, 34.4%) for females.
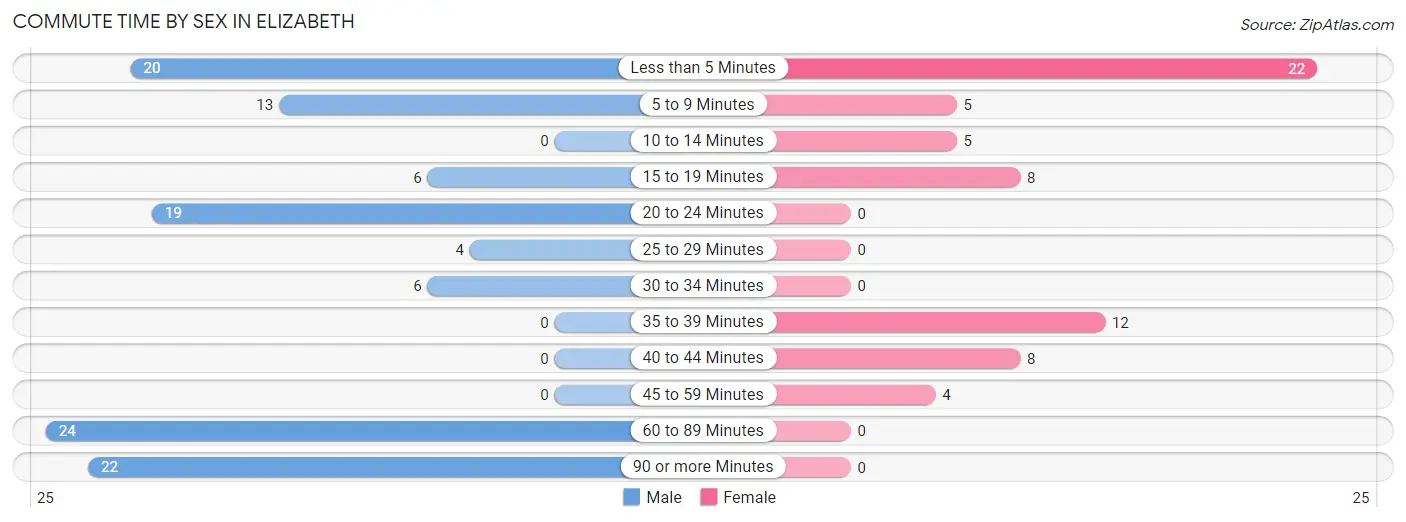
| Commute Time | Male | Female |
| Less than 5 Minutes | 20 (17.5%) | 22 (34.4%) |
| 5 to 9 Minutes | 13 (11.4%) | 5 (7.8%) |
| 10 to 14 Minutes | 0 (0.0%) | 5 (7.8%) |
| 15 to 19 Minutes | 6 (5.3%) | 8 (12.5%) |
| 20 to 24 Minutes | 19 (16.7%) | 0 (0.0%) |
| 25 to 29 Minutes | 4 (3.5%) | 0 (0.0%) |
| 30 to 34 Minutes | 6 (5.3%) | 0 (0.0%) |
| 35 to 39 Minutes | 0 (0.0%) | 12 (18.8%) |
| 40 to 44 Minutes | 0 (0.0%) | 8 (12.5%) |
| 45 to 59 Minutes | 0 (0.0%) | 4 (6.2%) |
| 60 to 89 Minutes | 24 (21.0%) | 0 (0.0%) |
| 90 or more Minutes | 22 (19.3%) | 0 (0.0%) |
Time of Departure to Work by Sex in Elizabeth
The most frequent times of departure to work in Elizabeth are 12:00 AM to 4:59 AM (28, 24.6%) for males and 12:00 PM to 3:59 PM (28, 43.8%) for females.
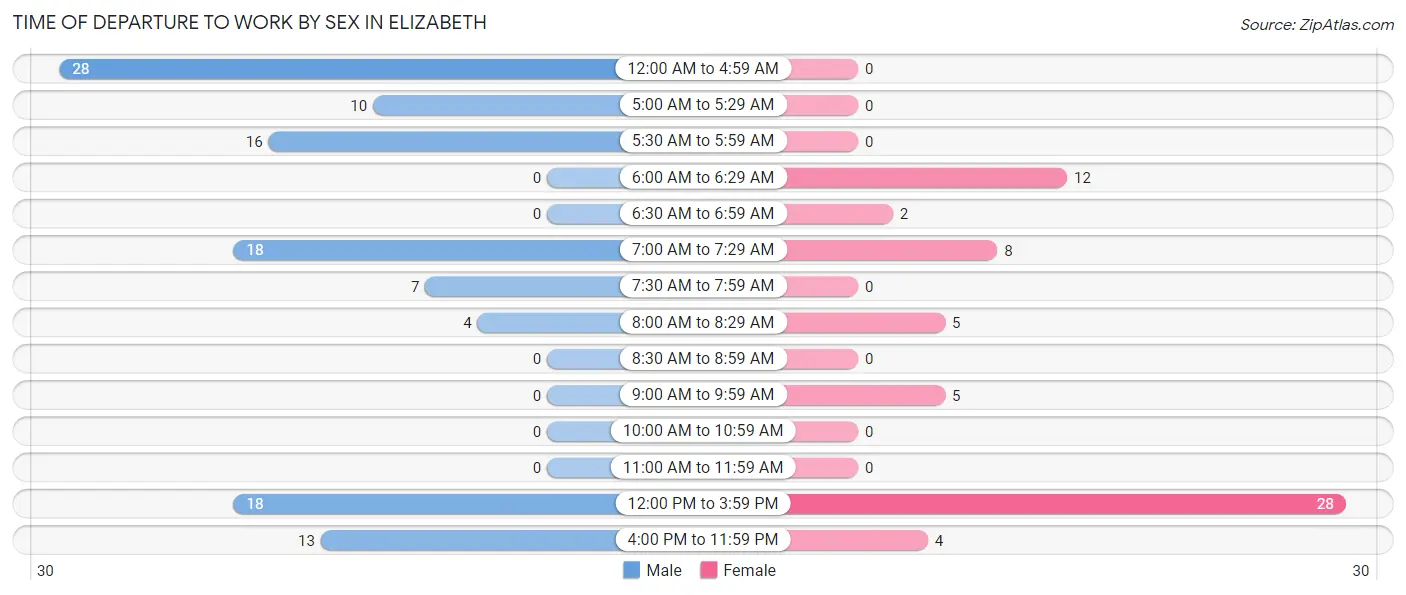
| Time of Departure | Male | Female |
| 12:00 AM to 4:59 AM | 28 (24.6%) | 0 (0.0%) |
| 5:00 AM to 5:29 AM | 10 (8.8%) | 0 (0.0%) |
| 5:30 AM to 5:59 AM | 16 (14.0%) | 0 (0.0%) |
| 6:00 AM to 6:29 AM | 0 (0.0%) | 12 (18.8%) |
| 6:30 AM to 6:59 AM | 0 (0.0%) | 2 (3.1%) |
| 7:00 AM to 7:29 AM | 18 (15.8%) | 8 (12.5%) |
| 7:30 AM to 7:59 AM | 7 (6.1%) | 0 (0.0%) |
| 8:00 AM to 8:29 AM | 4 (3.5%) | 5 (7.8%) |
| 8:30 AM to 8:59 AM | 0 (0.0%) | 0 (0.0%) |
| 9:00 AM to 9:59 AM | 0 (0.0%) | 5 (7.8%) |
| 10:00 AM to 10:59 AM | 0 (0.0%) | 0 (0.0%) |
| 11:00 AM to 11:59 AM | 0 (0.0%) | 0 (0.0%) |
| 12:00 PM to 3:59 PM | 18 (15.8%) | 28 (43.8%) |
| 4:00 PM to 11:59 PM | 13 (11.4%) | 4 (6.2%) |
| Total | 114 (100.0%) | 64 (100.0%) |
Housing Occupancy in Elizabeth
Occupancy by Ownership in Elizabeth
Of the total 189 dwellings in Elizabeth, owner-occupied units account for 120 (63.5%), while renter-occupied units make up 69 (36.5%).
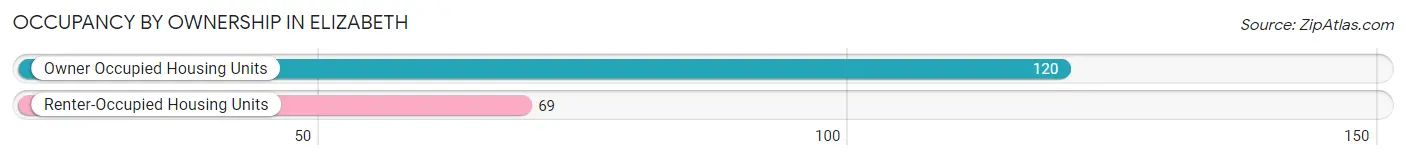
| Occupancy | # Housing Units | % Housing Units |
| Owner Occupied Housing Units | 120 | 63.5% |
| Renter-Occupied Housing Units | 69 | 36.5% |
| Total Occupied Housing Units | 189 | 100.0% |
Occupancy by Household Size in Elizabeth
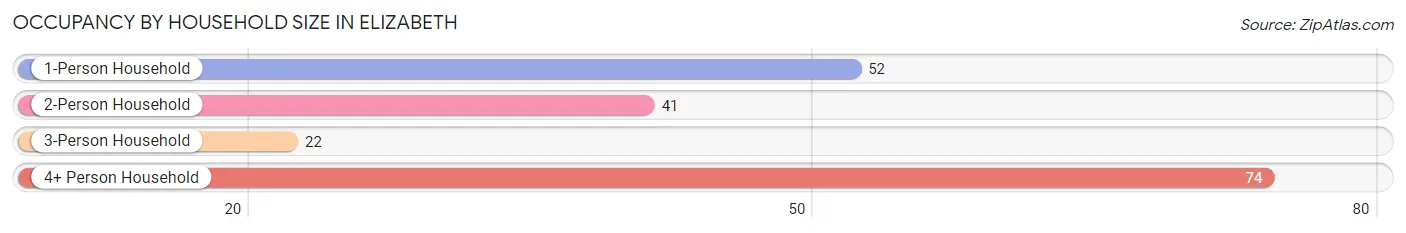
| Household Size | # Housing Units | % Housing Units |
| 1-Person Household | 52 | 27.5% |
| 2-Person Household | 41 | 21.7% |
| 3-Person Household | 22 | 11.6% |
| 4+ Person Household | 74 | 39.2% |
| Total Housing Units | 189 | 100.0% |
Occupancy by Ownership by Household Size in Elizabeth
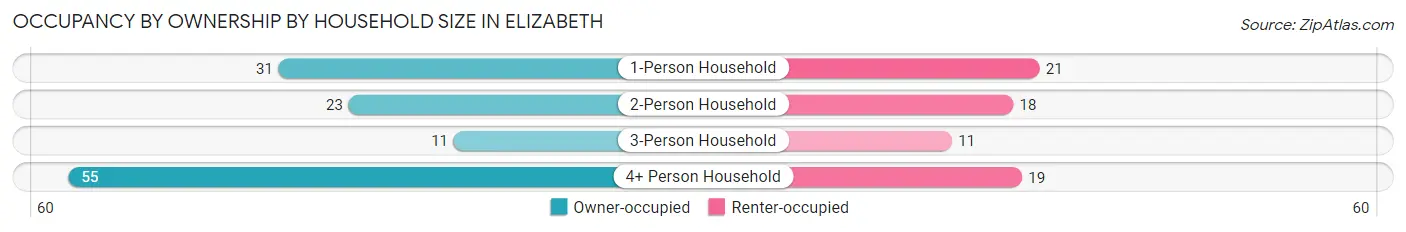
| Household Size | Owner-occupied | Renter-occupied |
| 1-Person Household | 31 (59.6%) | 21 (40.4%) |
| 2-Person Household | 23 (56.1%) | 18 (43.9%) |
| 3-Person Household | 11 (50.0%) | 11 (50.0%) |
| 4+ Person Household | 55 (74.3%) | 19 (25.7%) |
| Total Housing Units | 120 (63.5%) | 69 (36.5%) |
Occupancy by Educational Attainment in Elizabeth
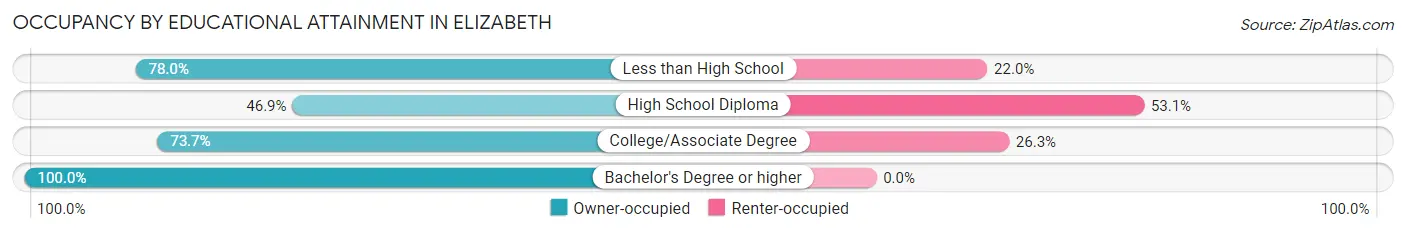
| Household Size | Owner-occupied | Renter-occupied |
| Less than High School | 39 (78.0%) | 11 (22.0%) |
| High School Diploma | 38 (46.9%) | 43 (53.1%) |
| College/Associate Degree | 42 (73.7%) | 15 (26.3%) |
| Bachelor's Degree or higher | 1 (100.0%) | 0 (0.0%) |
Occupancy by Age of Householder in Elizabeth
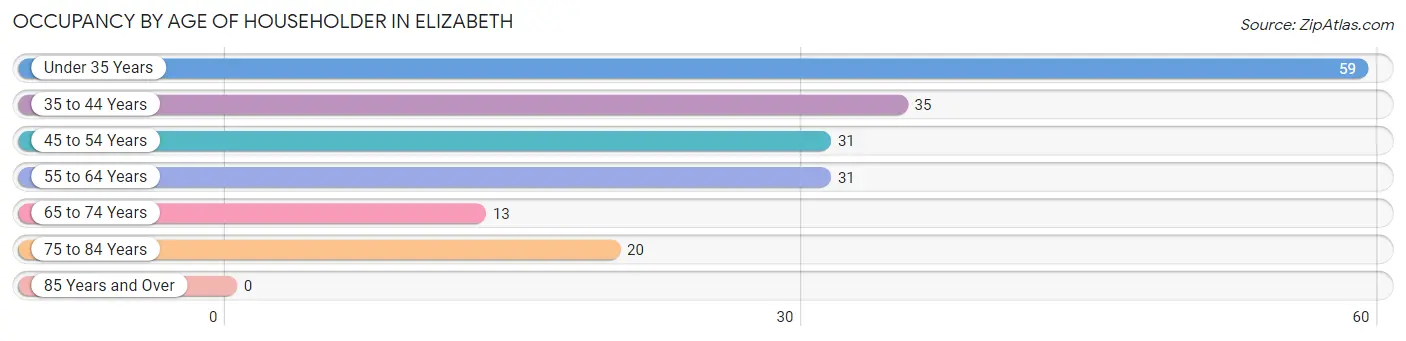
| Age Bracket | # Households | % Households |
| Under 35 Years | 59 | 31.2% |
| 35 to 44 Years | 35 | 18.5% |
| 45 to 54 Years | 31 | 16.4% |
| 55 to 64 Years | 31 | 16.4% |
| 65 to 74 Years | 13 | 6.9% |
| 75 to 84 Years | 20 | 10.6% |
| 85 Years and Over | 0 | 0.0% |
| Total | 189 | 100.0% |
Housing Finances in Elizabeth
Median Income by Occupancy in Elizabeth
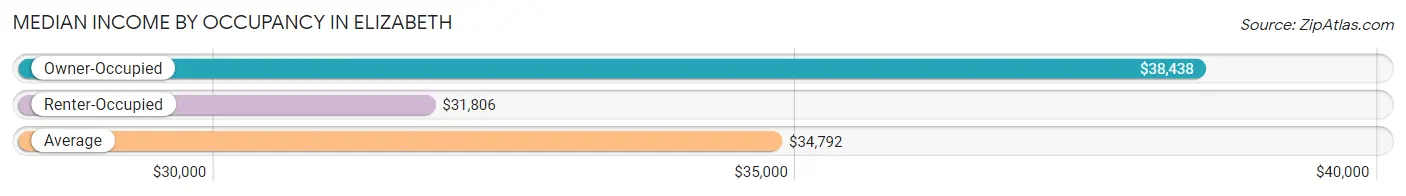
| Occupancy Type | # Households | Median Income |
| Owner-Occupied | 120 (63.5%) | $38,438 |
| Renter-Occupied | 69 (36.5%) | $31,806 |
| Average | 189 (100.0%) | $34,792 |
Occupancy by Householder Income Bracket in Elizabeth
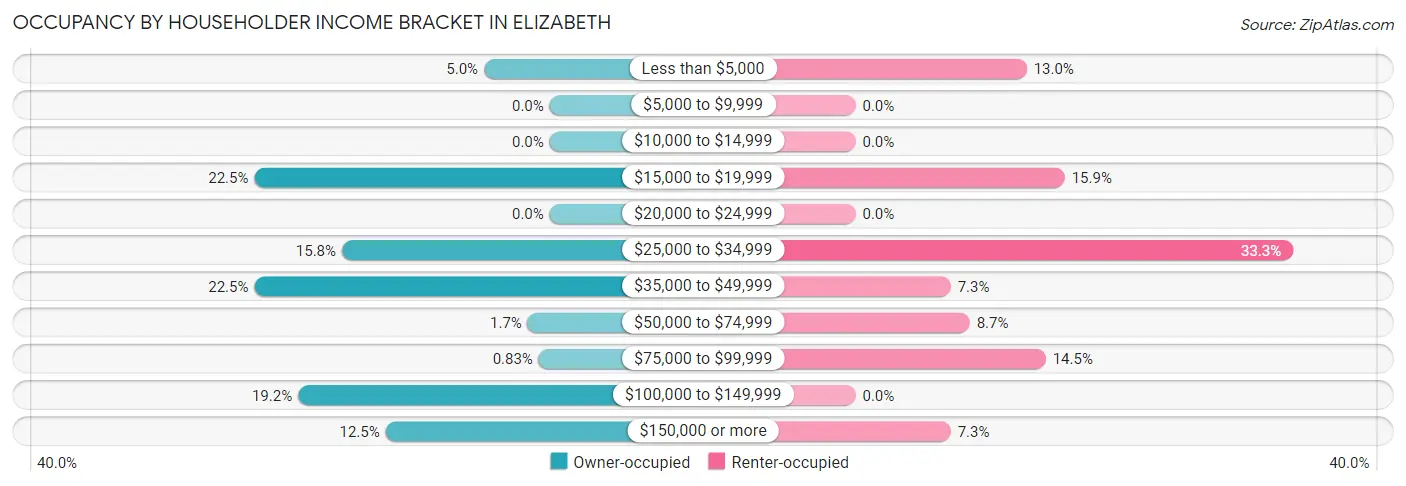
| Income Bracket | Owner-occupied | Renter-occupied |
| Less than $5,000 | 6 (5.0%) | 9 (13.0%) |
| $5,000 to $9,999 | 0 (0.0%) | 0 (0.0%) |
| $10,000 to $14,999 | 0 (0.0%) | 0 (0.0%) |
| $15,000 to $19,999 | 27 (22.5%) | 11 (15.9%) |
| $20,000 to $24,999 | 0 (0.0%) | 0 (0.0%) |
| $25,000 to $34,999 | 19 (15.8%) | 23 (33.3%) |
| $35,000 to $49,999 | 27 (22.5%) | 5 (7.2%) |
| $50,000 to $74,999 | 2 (1.7%) | 6 (8.7%) |
| $75,000 to $99,999 | 1 (0.8%) | 10 (14.5%) |
| $100,000 to $149,999 | 23 (19.2%) | 0 (0.0%) |
| $150,000 or more | 15 (12.5%) | 5 (7.2%) |
| Total | 120 (100.0%) | 69 (100.0%) |
Monthly Housing Cost Tiers in Elizabeth
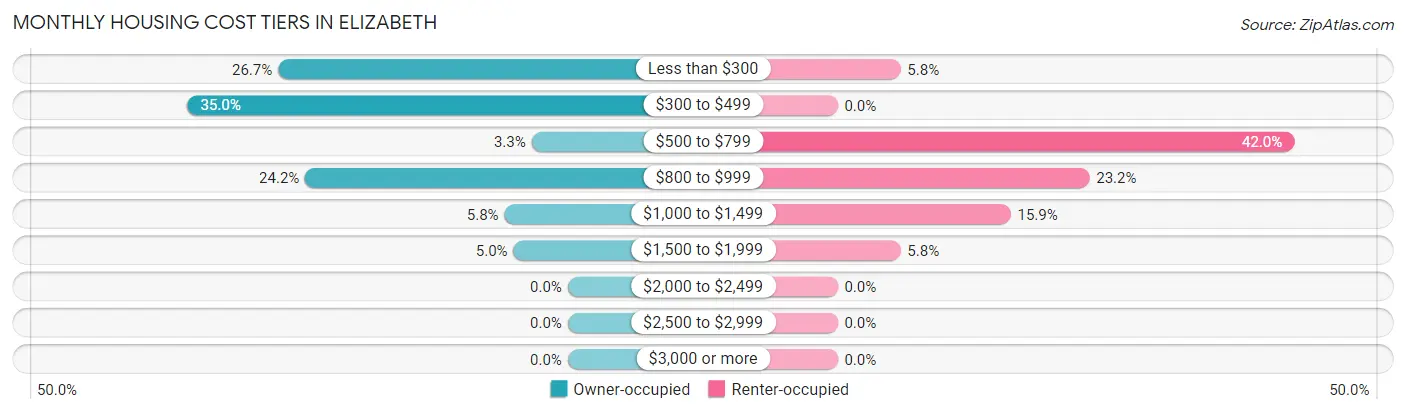
| Monthly Cost | Owner-occupied | Renter-occupied |
| Less than $300 | 32 (26.7%) | 4 (5.8%) |
| $300 to $499 | 42 (35.0%) | 0 (0.0%) |
| $500 to $799 | 4 (3.3%) | 29 (42.0%) |
| $800 to $999 | 29 (24.2%) | 16 (23.2%) |
| $1,000 to $1,499 | 7 (5.8%) | 11 (15.9%) |
| $1,500 to $1,999 | 6 (5.0%) | 4 (5.8%) |
| $2,000 to $2,499 | 0 (0.0%) | 0 (0.0%) |
| $2,500 to $2,999 | 0 (0.0%) | 0 (0.0%) |
| $3,000 or more | 0 (0.0%) | 0 (0.0%) |
| Total | 120 (100.0%) | 69 (100.0%) |
Physical Housing Characteristics in Elizabeth
Housing Structures in Elizabeth
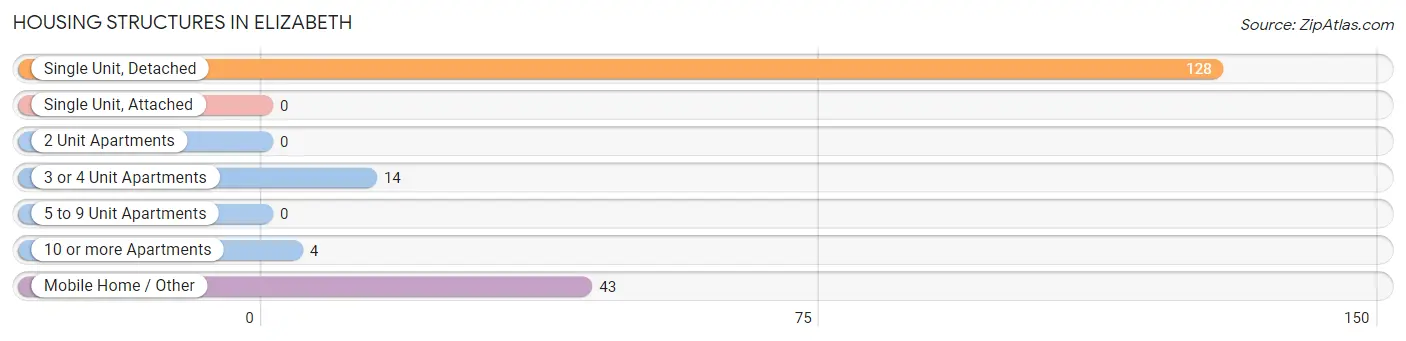
| Structure Type | # Housing Units | % Housing Units |
| Single Unit, Detached | 128 | 67.7% |
| Single Unit, Attached | 0 | 0.0% |
| 2 Unit Apartments | 0 | 0.0% |
| 3 or 4 Unit Apartments | 14 | 7.4% |
| 5 to 9 Unit Apartments | 0 | 0.0% |
| 10 or more Apartments | 4 | 2.1% |
| Mobile Home / Other | 43 | 22.8% |
| Total | 189 | 100.0% |
Housing Structures by Occupancy in Elizabeth
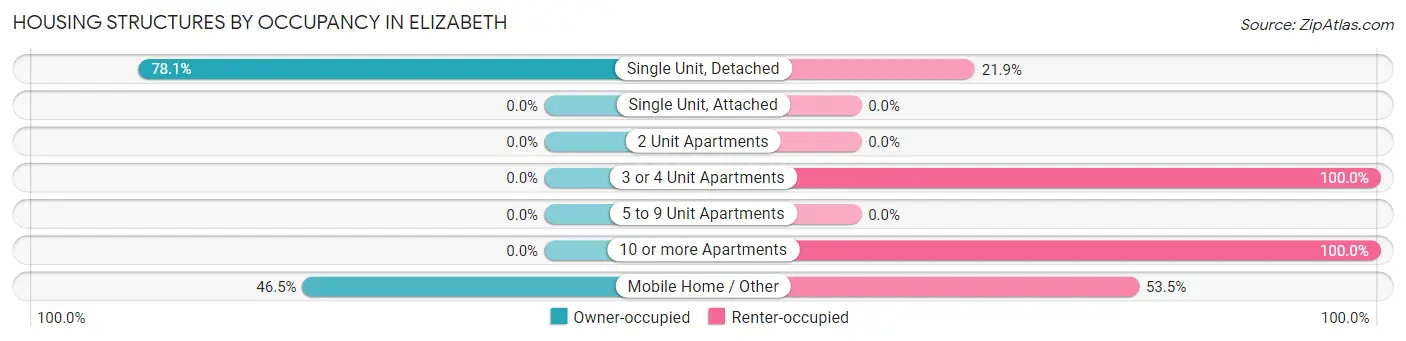
| Structure Type | Owner-occupied | Renter-occupied |
| Single Unit, Detached | 100 (78.1%) | 28 (21.9%) |
| Single Unit, Attached | 0 (0.0%) | 0 (0.0%) |
| 2 Unit Apartments | 0 (0.0%) | 0 (0.0%) |
| 3 or 4 Unit Apartments | 0 (0.0%) | 14 (100.0%) |
| 5 to 9 Unit Apartments | 0 (0.0%) | 0 (0.0%) |
| 10 or more Apartments | 0 (0.0%) | 4 (100.0%) |
| Mobile Home / Other | 20 (46.5%) | 23 (53.5%) |
| Total | 120 (63.5%) | 69 (36.5%) |
Housing Structures by Number of Rooms in Elizabeth
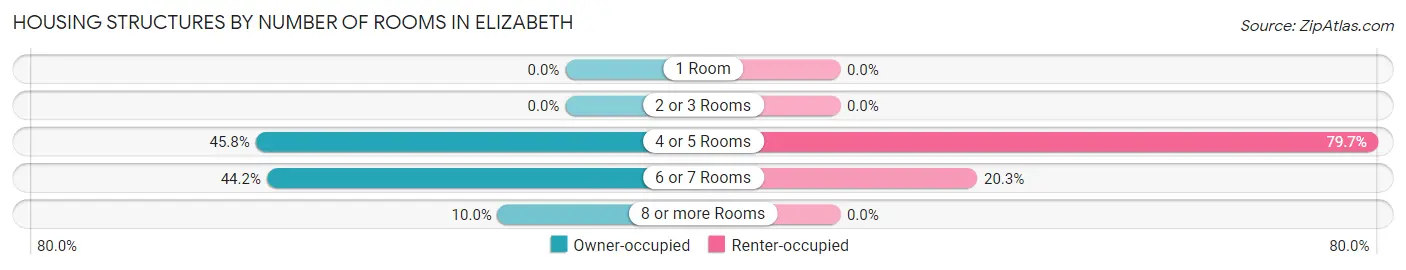
| Number of Rooms | Owner-occupied | Renter-occupied |
| 1 Room | 0 (0.0%) | 0 (0.0%) |
| 2 or 3 Rooms | 0 (0.0%) | 0 (0.0%) |
| 4 or 5 Rooms | 55 (45.8%) | 55 (79.7%) |
| 6 or 7 Rooms | 53 (44.2%) | 14 (20.3%) |
| 8 or more Rooms | 12 (10.0%) | 0 (0.0%) |
| Total | 120 (100.0%) | 69 (100.0%) |
Housing Structure by Heating Type in Elizabeth
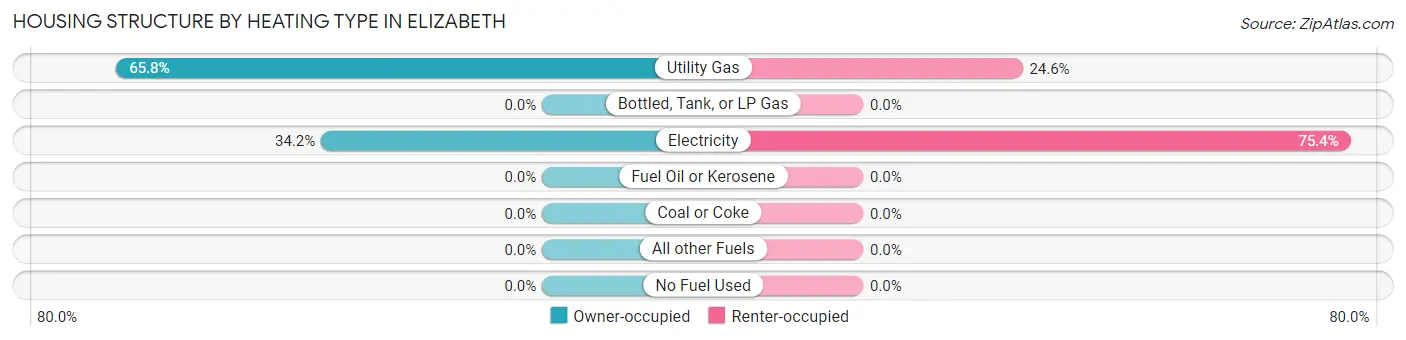
| Heating Type | Owner-occupied | Renter-occupied |
| Utility Gas | 79 (65.8%) | 17 (24.6%) |
| Bottled, Tank, or LP Gas | 0 (0.0%) | 0 (0.0%) |
| Electricity | 41 (34.2%) | 52 (75.4%) |
| Fuel Oil or Kerosene | 0 (0.0%) | 0 (0.0%) |
| Coal or Coke | 0 (0.0%) | 0 (0.0%) |
| All other Fuels | 0 (0.0%) | 0 (0.0%) |
| No Fuel Used | 0 (0.0%) | 0 (0.0%) |
| Total | 120 (100.0%) | 69 (100.0%) |
Household Vehicle Usage in Elizabeth
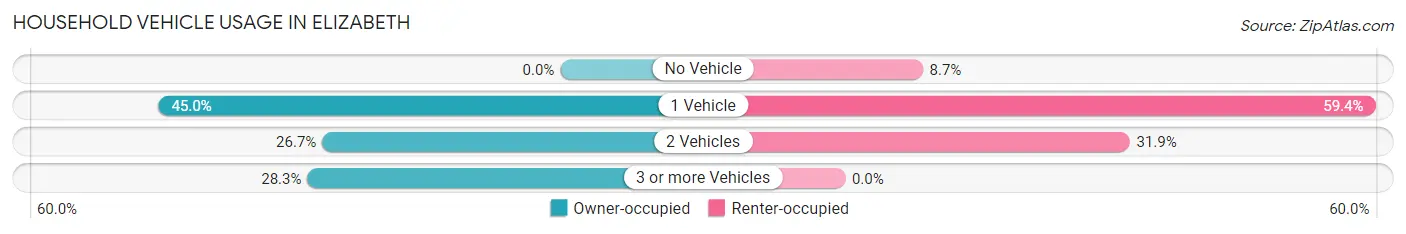
| Vehicles per Household | Owner-occupied | Renter-occupied |
| No Vehicle | 0 (0.0%) | 6 (8.7%) |
| 1 Vehicle | 54 (45.0%) | 41 (59.4%) |
| 2 Vehicles | 32 (26.7%) | 22 (31.9%) |
| 3 or more Vehicles | 34 (28.3%) | 0 (0.0%) |
| Total | 120 (100.0%) | 69 (100.0%) |
Real Estate & Mortgages in Elizabeth
Real Estate and Mortgage Overview in Elizabeth
| Characteristic | Without Mortgage | With Mortgage |
| Housing Units | 78 | 42 |
| Median Property Value | $47,900 | $103,100 |
| Median Household Income | $28,684 | $11 |
| Monthly Housing Costs | $364 | $0 |
| Real Estate Taxes | $199 | $15 |
Property Value by Mortgage Status in Elizabeth
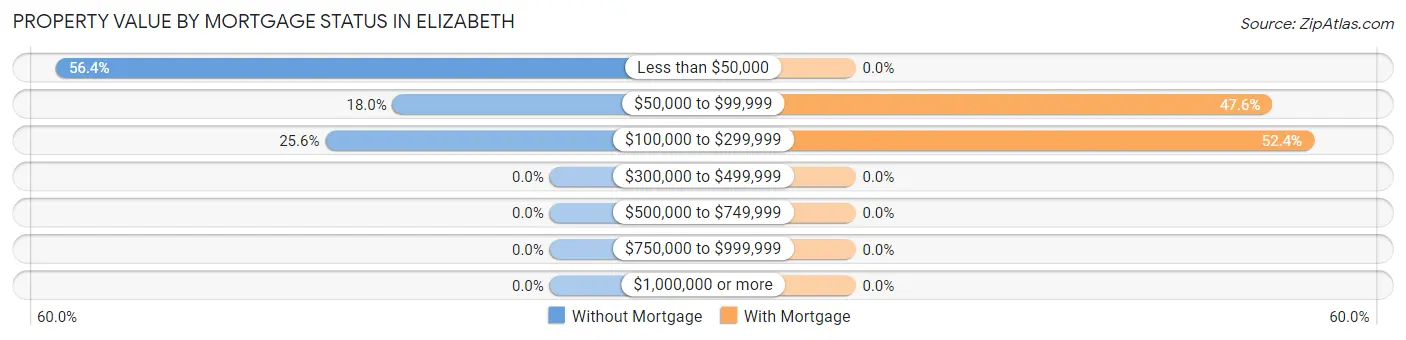
| Property Value | Without Mortgage | With Mortgage |
| Less than $50,000 | 44 (56.4%) | 0 (0.0%) |
| $50,000 to $99,999 | 14 (17.9%) | 20 (47.6%) |
| $100,000 to $299,999 | 20 (25.6%) | 22 (52.4%) |
| $300,000 to $499,999 | 0 (0.0%) | 0 (0.0%) |
| $500,000 to $749,999 | 0 (0.0%) | 0 (0.0%) |
| $750,000 to $999,999 | 0 (0.0%) | 0 (0.0%) |
| $1,000,000 or more | 0 (0.0%) | 0 (0.0%) |
| Total | 78 (100.0%) | 42 (100.0%) |
Household Income by Mortgage Status in Elizabeth
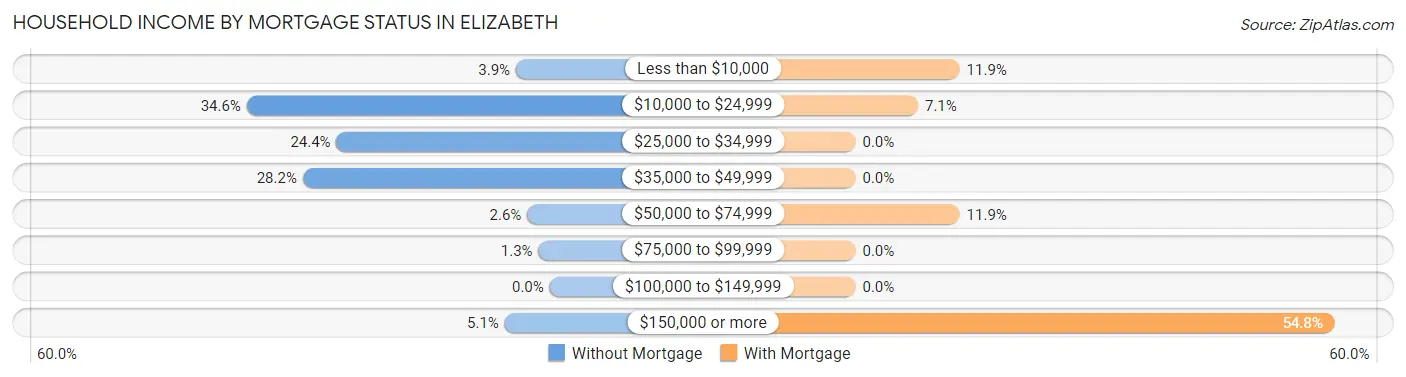
| Household Income | Without Mortgage | With Mortgage |
| Less than $10,000 | 3 (3.8%) | 5 (11.9%) |
| $10,000 to $24,999 | 27 (34.6%) | 3 (7.1%) |
| $25,000 to $34,999 | 19 (24.4%) | 0 (0.0%) |
| $35,000 to $49,999 | 22 (28.2%) | 0 (0.0%) |
| $50,000 to $74,999 | 2 (2.6%) | 5 (11.9%) |
| $75,000 to $99,999 | 1 (1.3%) | 0 (0.0%) |
| $100,000 to $149,999 | 0 (0.0%) | 0 (0.0%) |
| $150,000 or more | 4 (5.1%) | 23 (54.8%) |
| Total | 78 (100.0%) | 42 (100.0%) |
Property Value to Household Income Ratio in Elizabeth
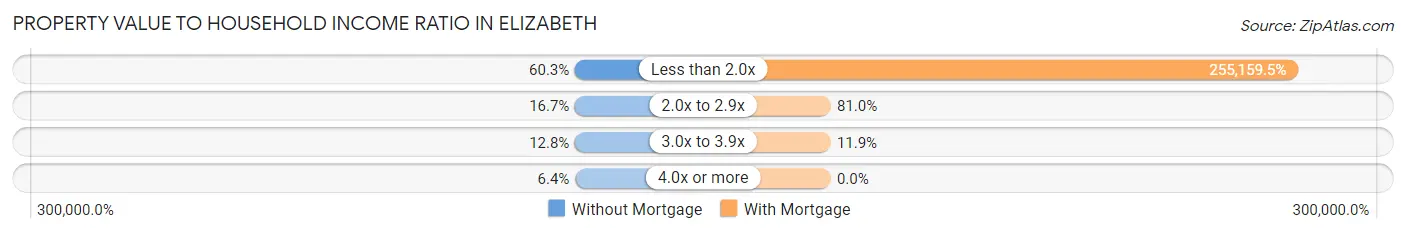
| Value-to-Income Ratio | Without Mortgage | With Mortgage |
| Less than 2.0x | 47 (60.3%) | 107,167 (255,159.5%) |
| 2.0x to 2.9x | 13 (16.7%) | 34 (80.9%) |
| 3.0x to 3.9x | 10 (12.8%) | 5 (11.9%) |
| 4.0x or more | 5 (6.4%) | 0 (0.0%) |
| Total | 78 (100.0%) | 42 (100.0%) |
Real Estate Taxes by Mortgage Status in Elizabeth
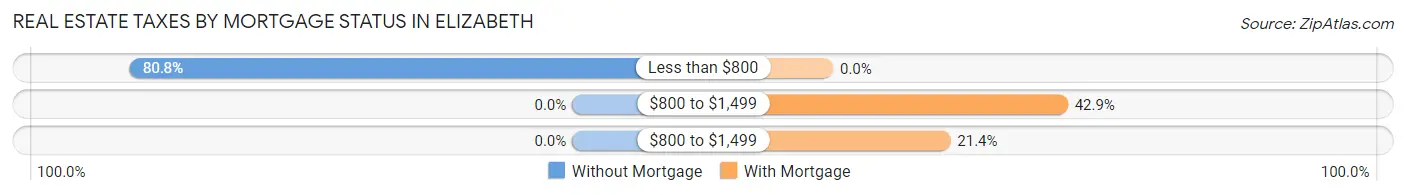
| Property Taxes | Without Mortgage | With Mortgage |
| Less than $800 | 63 (80.8%) | 0 (0.0%) |
| $800 to $1,499 | 0 (0.0%) | 18 (42.9%) |
| $800 to $1,499 | 0 (0.0%) | 9 (21.4%) |
| Total | 78 (100.0%) | 42 (100.0%) |
Health & Disability in Elizabeth
Health Insurance Coverage by Age in Elizabeth
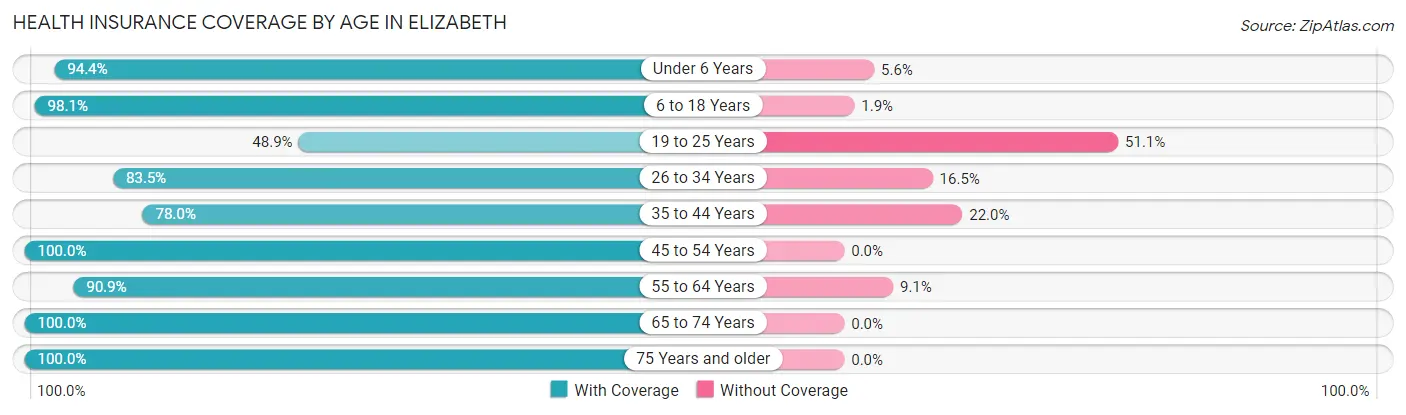
| Age Bracket | With Coverage | Without Coverage |
| Under 6 Years | 17 (94.4%) | 1 (5.6%) |
| 6 to 18 Years | 157 (98.1%) | 3 (1.9%) |
| 19 to 25 Years | 23 (48.9%) | 24 (51.1%) |
| 26 to 34 Years | 76 (83.5%) | 15 (16.5%) |
| 35 to 44 Years | 39 (78.0%) | 11 (22.0%) |
| 45 to 54 Years | 31 (100.0%) | 0 (0.0%) |
| 55 to 64 Years | 40 (90.9%) | 4 (9.1%) |
| 65 to 74 Years | 23 (100.0%) | 0 (0.0%) |
| 75 Years and older | 24 (100.0%) | 0 (0.0%) |
| Total | 430 (88.1%) | 58 (11.9%) |
Health Insurance Coverage by Citizenship Status in Elizabeth
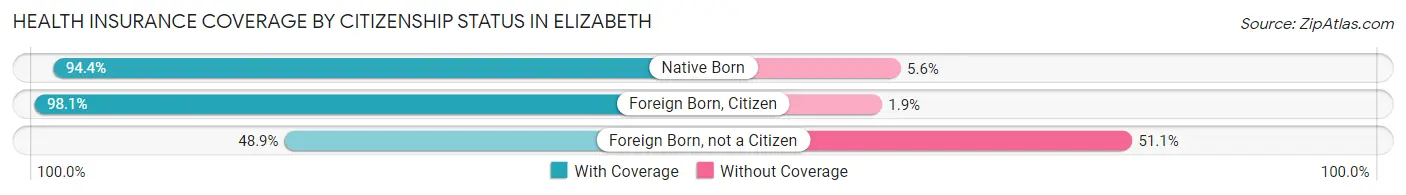
| Citizenship Status | With Coverage | Without Coverage |
| Native Born | 17 (94.4%) | 1 (5.6%) |
| Foreign Born, Citizen | 157 (98.1%) | 3 (1.9%) |
| Foreign Born, not a Citizen | 23 (48.9%) | 24 (51.1%) |
Health Insurance Coverage by Household Income in Elizabeth
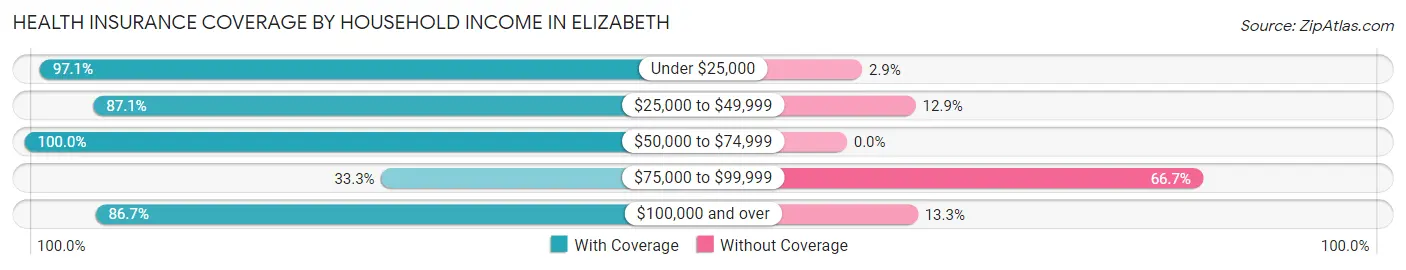
| Household Income | With Coverage | Without Coverage |
| Under $25,000 | 102 (97.1%) | 3 (2.9%) |
| $25,000 to $49,999 | 162 (87.1%) | 24 (12.9%) |
| $50,000 to $74,999 | 24 (100.0%) | 0 (0.0%) |
| $75,000 to $99,999 | 5 (33.3%) | 10 (66.7%) |
| $100,000 and over | 137 (86.7%) | 21 (13.3%) |
Public vs Private Health Insurance Coverage by Age in Elizabeth
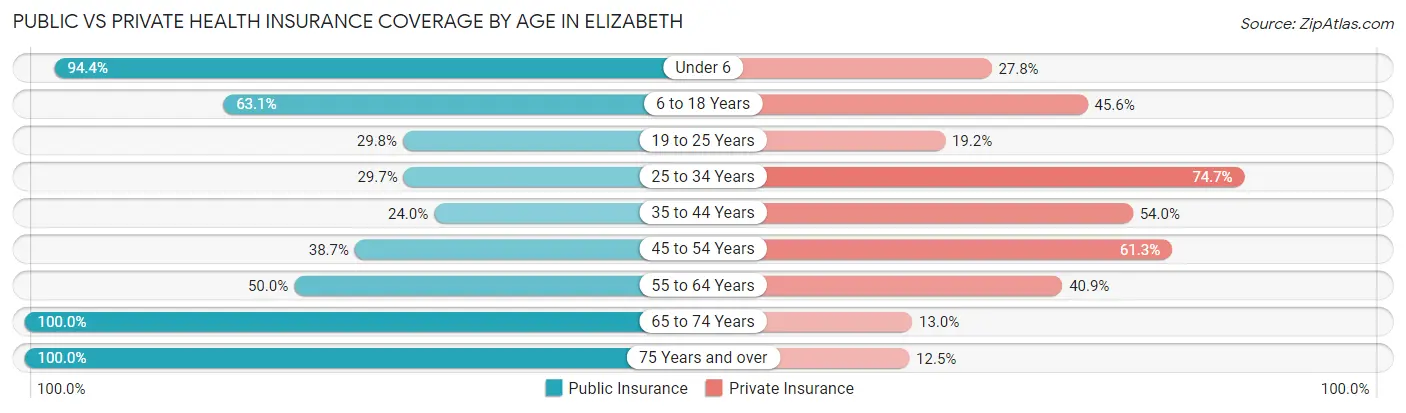
| Age Bracket | Public Insurance | Private Insurance |
| Under 6 | 17 (94.4%) | 5 (27.8%) |
| 6 to 18 Years | 101 (63.1%) | 73 (45.6%) |
| 19 to 25 Years | 14 (29.8%) | 9 (19.2%) |
| 25 to 34 Years | 27 (29.7%) | 68 (74.7%) |
| 35 to 44 Years | 12 (24.0%) | 27 (54.0%) |
| 45 to 54 Years | 12 (38.7%) | 19 (61.3%) |
| 55 to 64 Years | 22 (50.0%) | 18 (40.9%) |
| 65 to 74 Years | 23 (100.0%) | 3 (13.0%) |
| 75 Years and over | 24 (100.0%) | 3 (12.5%) |
| Total | 252 (51.6%) | 225 (46.1%) |
Disability Status by Sex by Age in Elizabeth
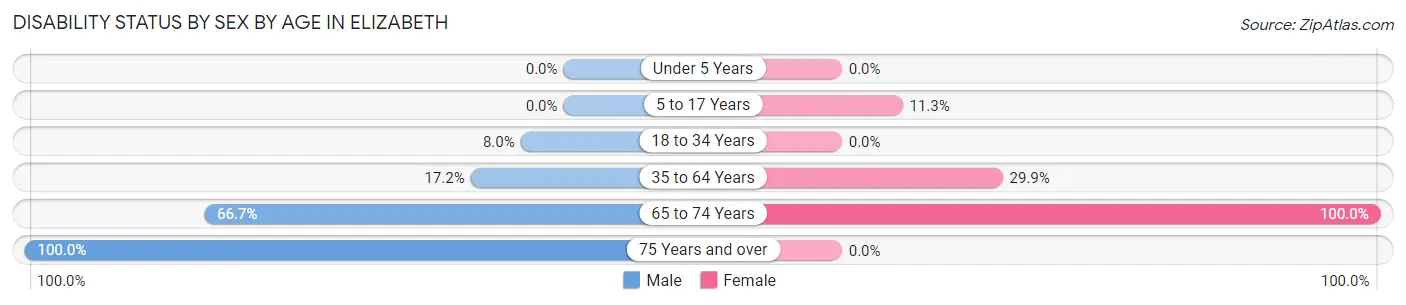
| Age Bracket | Male | Female |
| Under 5 Years | 0 (0.0%) | 0 (0.0%) |
| 5 to 17 Years | 0 (0.0%) | 8 (11.3%) |
| 18 to 34 Years | 7 (8.0%) | 0 (0.0%) |
| 35 to 64 Years | 10 (17.2%) | 20 (29.8%) |
| 65 to 74 Years | 10 (66.7%) | 8 (100.0%) |
| 75 Years and over | 4 (100.0%) | 0 (0.0%) |
Disability Class by Sex by Age in Elizabeth
Disability Class: Hearing Difficulty
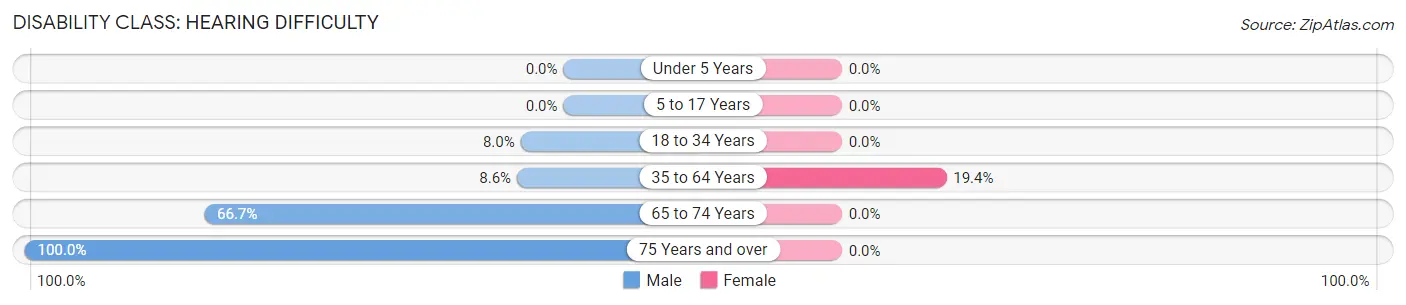
| Age Bracket | Male | Female |
| Under 5 Years | 0 (0.0%) | 0 (0.0%) |
| 5 to 17 Years | 0 (0.0%) | 0 (0.0%) |
| 18 to 34 Years | 7 (8.0%) | 0 (0.0%) |
| 35 to 64 Years | 5 (8.6%) | 13 (19.4%) |
| 65 to 74 Years | 10 (66.7%) | 0 (0.0%) |
| 75 Years and over | 4 (100.0%) | 0 (0.0%) |
Disability Class: Vision Difficulty
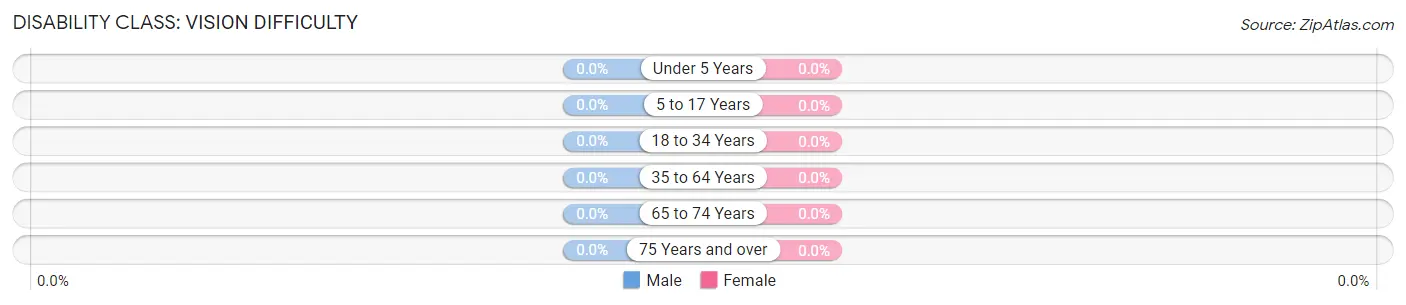
| Age Bracket | Male | Female |
| Under 5 Years | 0 (0.0%) | 0 (0.0%) |
| 5 to 17 Years | 0 (0.0%) | 0 (0.0%) |
| 18 to 34 Years | 0 (0.0%) | 0 (0.0%) |
| 35 to 64 Years | 0 (0.0%) | 0 (0.0%) |
| 65 to 74 Years | 0 (0.0%) | 0 (0.0%) |
| 75 Years and over | 0 (0.0%) | 0 (0.0%) |
Disability Class: Cognitive Difficulty
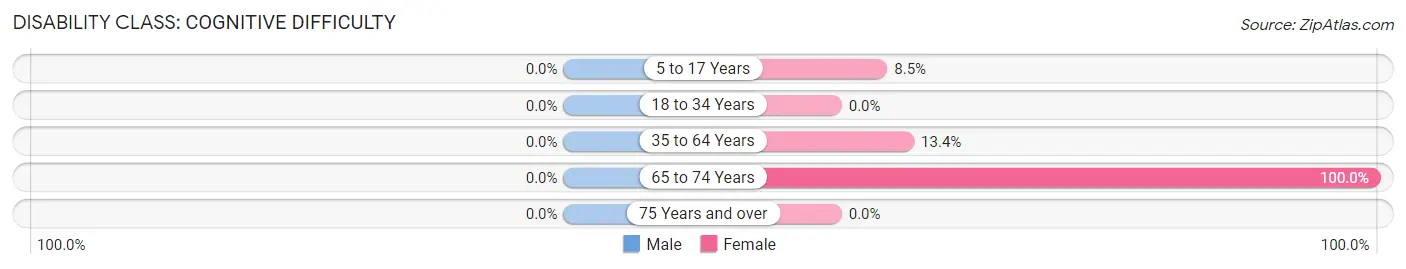
| Age Bracket | Male | Female |
| 5 to 17 Years | 0 (0.0%) | 6 (8.5%) |
| 18 to 34 Years | 0 (0.0%) | 0 (0.0%) |
| 35 to 64 Years | 0 (0.0%) | 9 (13.4%) |
| 65 to 74 Years | 0 (0.0%) | 8 (100.0%) |
| 75 Years and over | 0 (0.0%) | 0 (0.0%) |
Disability Class: Ambulatory Difficulty
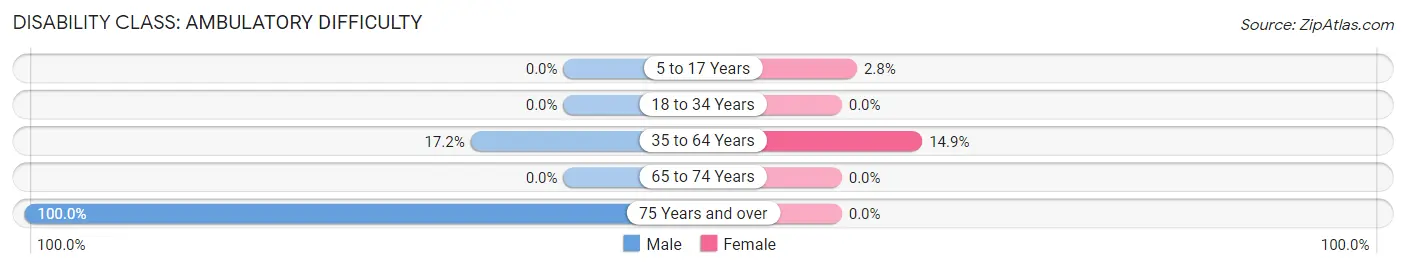
| Age Bracket | Male | Female |
| 5 to 17 Years | 0 (0.0%) | 2 (2.8%) |
| 18 to 34 Years | 0 (0.0%) | 0 (0.0%) |
| 35 to 64 Years | 10 (17.2%) | 10 (14.9%) |
| 65 to 74 Years | 0 (0.0%) | 0 (0.0%) |
| 75 Years and over | 4 (100.0%) | 0 (0.0%) |
Disability Class: Self-Care Difficulty
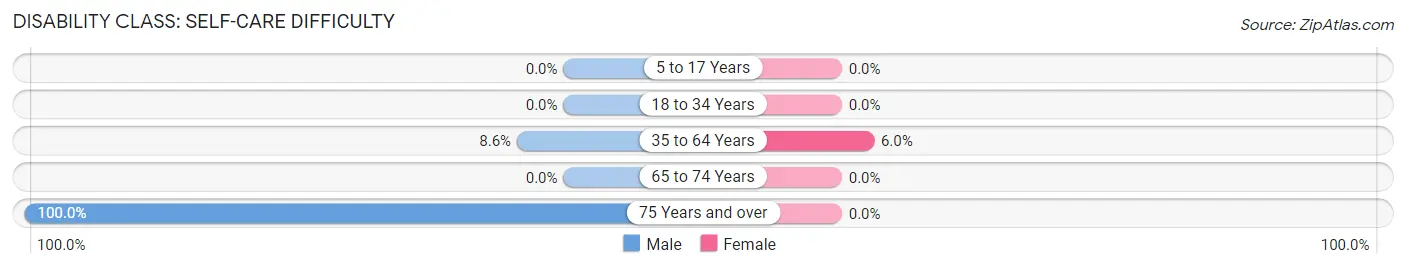
| Age Bracket | Male | Female |
| 5 to 17 Years | 0 (0.0%) | 0 (0.0%) |
| 18 to 34 Years | 0 (0.0%) | 0 (0.0%) |
| 35 to 64 Years | 5 (8.6%) | 4 (6.0%) |
| 65 to 74 Years | 0 (0.0%) | 0 (0.0%) |
| 75 Years and over | 4 (100.0%) | 0 (0.0%) |
Technology Access in Elizabeth
Computing Device Access in Elizabeth
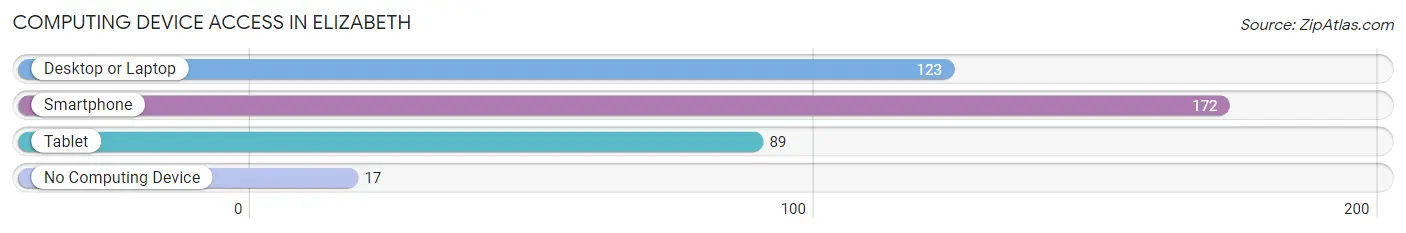
| Device Type | # Households | % Households |
| Desktop or Laptop | 123 | 65.1% |
| Smartphone | 172 | 91.0% |
| Tablet | 89 | 47.1% |
| No Computing Device | 17 | 9.0% |
| Total | 189 | 100.0% |
Internet Access in Elizabeth
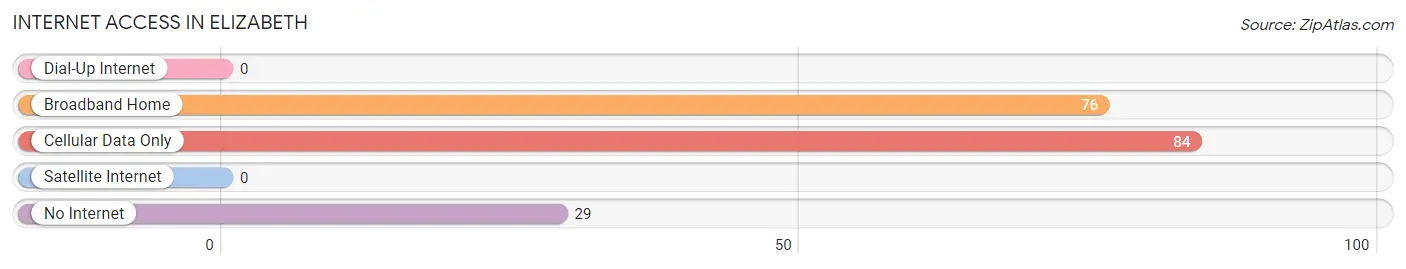
| Internet Type | # Households | % Households |
| Dial-Up Internet | 0 | 0.0% |
| Broadband Home | 76 | 40.2% |
| Cellular Data Only | 84 | 44.4% |
| Satellite Internet | 0 | 0.0% |
| No Internet | 29 | 15.3% |
| Total | 189 | 100.0% |
Elizabeth Summary
Elizabeth, Louisiana is a small town located in the northeastern corner of the state, in the heart of the Mississippi Delta. It is situated on the banks of the Mississippi River, and is part of the larger region known as the Delta Parishes. The town has a population of just over 1,000 people, and is the seat of St. John the Baptist Parish.
History
The area that is now Elizabeth was first settled in the early 1800s by French-speaking Acadians, who were fleeing the British in Canada. The town was originally known as La Pointe, and was later renamed Elizabeth in honor of the wife of the first postmaster, who was a prominent local landowner.
In the late 1800s, the town became a major port for the cotton industry, and was home to several large plantations. The town was also a major stop on the Mississippi River for steamboats, and was a popular destination for travelers.
In the early 1900s, the town was hit hard by the Great Mississippi Flood of 1927, which caused extensive damage to the town and its economy. The town was rebuilt, and the economy slowly recovered.
Geography
Elizabeth is located in the northeastern corner of Louisiana, in the heart of the Mississippi Delta. It is situated on the banks of the Mississippi River, and is part of the larger region known as the Delta Parishes. The town is located about 40 miles south of Baton Rouge, and about 60 miles north of New Orleans.
The town is surrounded by a number of small towns and villages, including Reserve, LaPlace, and Garyville. The town is also close to the Atchafalaya Basin, which is the largest wetland in the United States.
Economy
The economy of Elizabeth is largely based on agriculture, with the town being home to several large farms and plantations. The town is also home to a number of small businesses, including restaurants, shops, and other services.
The town is also home to a number of manufacturing companies, including a paper mill and a chemical plant. The town is also home to a number of oil and gas companies, which are involved in the exploration and production of oil and gas in the region.
Demographics
As of the 2010 census, the population of Elizabeth was 1,072. The town is predominantly white, with the majority of the population being of French descent. The town also has a small African American population, as well as a small Hispanic population.
The median household income in Elizabeth is $37,000, and the median home value is $90,000. The town has a poverty rate of 22.5%, which is higher than the national average.
Conclusion
Elizabeth, Louisiana is a small town located in the northeastern corner of the state, in the heart of the Mississippi Delta. It is situated on the banks of the Mississippi River, and is part of the larger region known as the Delta Parishes. The town has a population of just over 1,000 people, and is the seat of St. John the Baptist Parish. The economy of Elizabeth is largely based on agriculture, with the town being home to several large farms and plantations. The town is also home to a number of small businesses, including restaurants, shops, and other services. The town is predominantly white, with the majority of the population being of French descent. The town also has a small African American population, as well as a small Hispanic population.
Common Questions
What is Per Capita Income in Elizabeth?
Per Capita income in Elizabeth is $23,582.
What is the Median Family Income in Elizabeth?
Median Family Income in Elizabeth is $37,250.
What is the Median Household income in Elizabeth?
Median Household Income in Elizabeth is $34,792.
What is Inequality or Gini Index in Elizabeth?
Inequality or Gini Index in Elizabeth is 0.49.
What is the Total Population of Elizabeth?
Total Population of Elizabeth is 488.
What is the Total Male Population of Elizabeth?
Total Male Population of Elizabeth is 243.
What is the Total Female Population of Elizabeth?
Total Female Population of Elizabeth is 245.
What is the Ratio of Males per 100 Females in Elizabeth?
There are 99.18 Males per 100 Females in Elizabeth.
What is the Ratio of Females per 100 Males in Elizabeth?
There are 100.82 Females per 100 Males in Elizabeth.
What is the Median Population Age in Elizabeth?
Median Population Age in Elizabeth is 28.8 Years.
What is the Average Family Size in Elizabeth
Average Family Size in Elizabeth is 3.1 People.
What is the Average Household Size in Elizabeth
Average Household Size in Elizabeth is 2.6 People.
How Large is the Labor Force in Elizabeth?
There are 205 People in the Labor Forcein in Elizabeth.
What is the Percentage of People in the Labor Force in Elizabeth?
59.9% of People are in the Labor Force in Elizabeth.
What is the Unemployment Rate in Elizabeth?
Unemployment Rate in Elizabeth is 9.3%.