Egan, LA Map & Demographics
Egan Map
Egan Overview
$39,691
PER CAPITA INCOME
$86,345
AVG FAMILY INCOME
$86,329
AVG HOUSEHOLD INCOME
0.06
INEQUALITY / GINI INDEX
833
TOTAL POPULATION
365
MALE POPULATION
468
FEMALE POPULATION
77.99
MALES / 100 FEMALES
128.22
FEMALES / 100 MALES
36.3
MEDIAN AGE
2.4
AVG FAMILY SIZE
2.4
AVG HOUSEHOLD SIZE
384
LABOR FORCE [ PEOPLE ]
61.8%
PERCENT IN LABOR FORCE
8.1%
UNEMPLOYMENT RATE
Egan Zip Codes
Egan Area Codes
Income in Egan
Income Overview in Egan
Per Capita Income in Egan is $39,691, while median incomes of families and households are $86,345 and $86,329 respectively.
| Characteristic | Number | Measure |
| Per Capita Income | 833 | $39,691 |
| Median Family Income | 351 | $86,345 |
| Mean Family Income | 351 | $92,751 |
| Median Household Income | 355 | $86,329 |
| Mean Household Income | 355 | $92,261 |
| Income Deficit | 351 | $0 |
| Wage / Income Gap (%) | 833 | 0.00% |
| Wage / Income Gap ($) | 833 | 100.00¢ per $1 |
| Gini / Inequality Index | 833 | 0.06 |
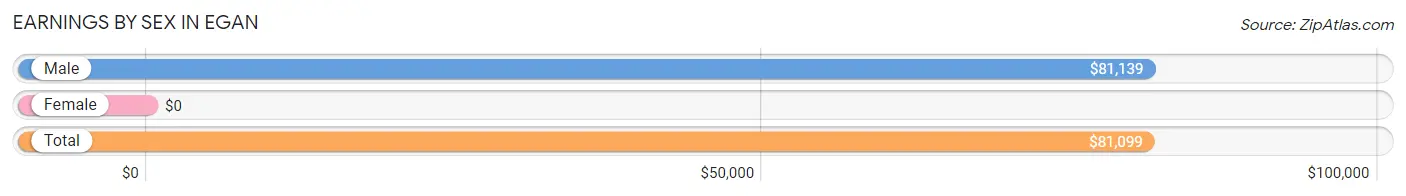
Earnings by Sex in Egan
| Sex | Number | Average Earnings |
| Male | 343 (97.2%) | $81,139 |
| Female | 10 (2.8%) | $0 |
| Total | 353 (100.0%) | $81,099 |
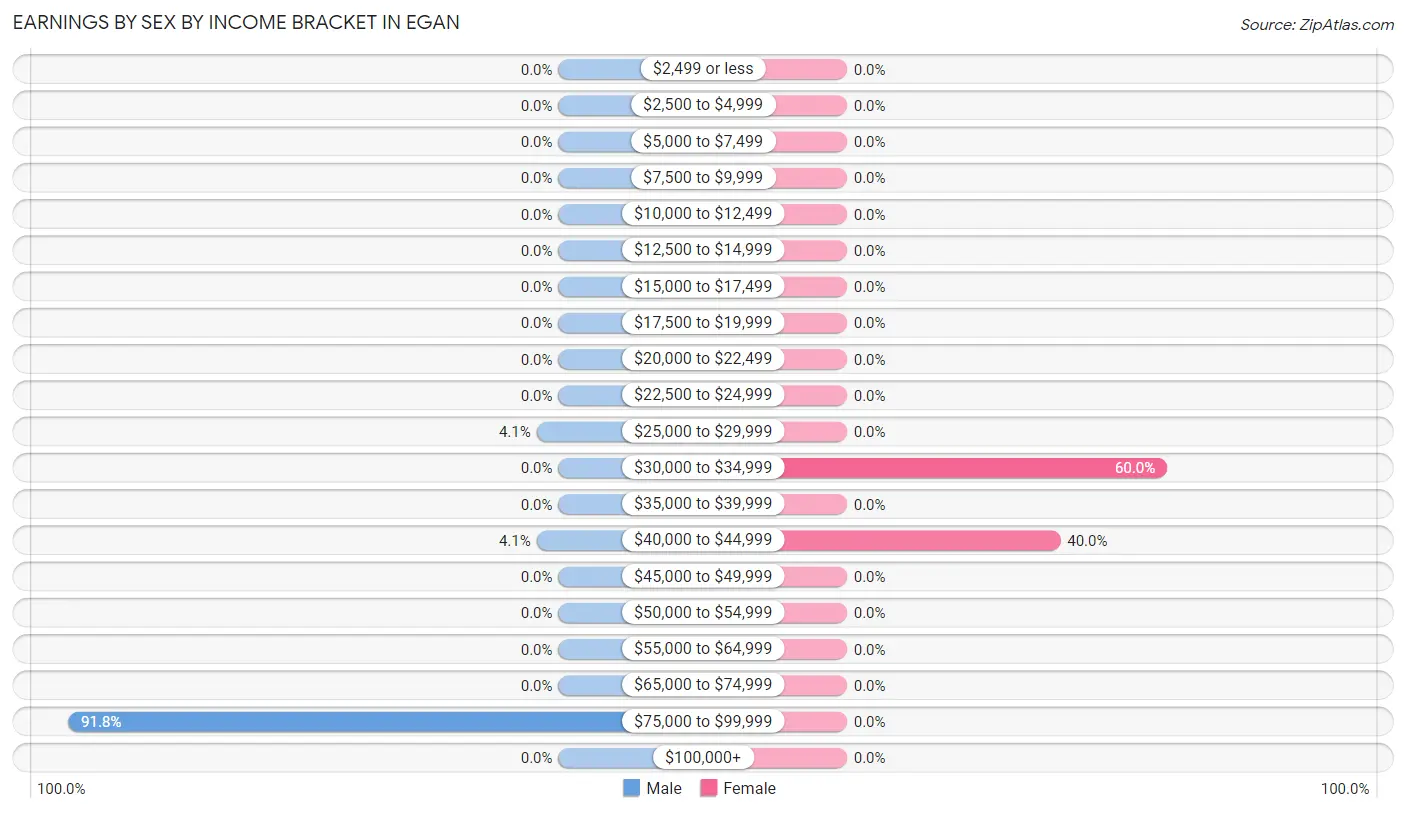
Earnings by Sex by Income Bracket in Egan
The most common earnings brackets in Egan are $75,000 to $99,999 for men (315 | 91.8%) and $30,000 to $34,999 for women (6 | 60.0%).
| Income | Male | Female |
| $2,499 or less | 0 (0.0%) | 0 (0.0%) |
| $2,500 to $4,999 | 0 (0.0%) | 0 (0.0%) |
| $5,000 to $7,499 | 0 (0.0%) | 0 (0.0%) |
| $7,500 to $9,999 | 0 (0.0%) | 0 (0.0%) |
| $10,000 to $12,499 | 0 (0.0%) | 0 (0.0%) |
| $12,500 to $14,999 | 0 (0.0%) | 0 (0.0%) |
| $15,000 to $17,499 | 0 (0.0%) | 0 (0.0%) |
| $17,500 to $19,999 | 0 (0.0%) | 0 (0.0%) |
| $20,000 to $22,499 | 0 (0.0%) | 0 (0.0%) |
| $22,500 to $24,999 | 0 (0.0%) | 0 (0.0%) |
| $25,000 to $29,999 | 14 (4.1%) | 0 (0.0%) |
| $30,000 to $34,999 | 0 (0.0%) | 6 (60.0%) |
| $35,000 to $39,999 | 0 (0.0%) | 0 (0.0%) |
| $40,000 to $44,999 | 14 (4.1%) | 4 (40.0%) |
| $45,000 to $49,999 | 0 (0.0%) | 0 (0.0%) |
| $50,000 to $54,999 | 0 (0.0%) | 0 (0.0%) |
| $55,000 to $64,999 | 0 (0.0%) | 0 (0.0%) |
| $65,000 to $74,999 | 0 (0.0%) | 0 (0.0%) |
| $75,000 to $99,999 | 315 (91.8%) | 0 (0.0%) |
| $100,000+ | 0 (0.0%) | 0 (0.0%) |
| Total | 343 (100.0%) | 10 (100.0%) |
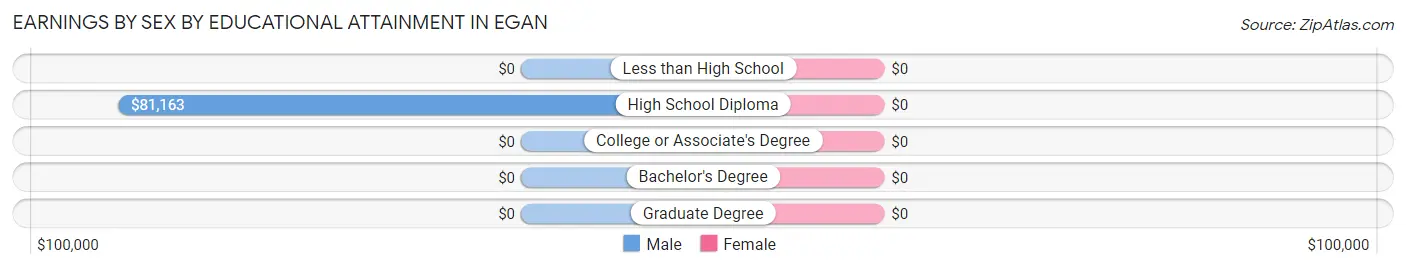
Earnings by Sex by Educational Attainment in Egan
| Educational Attainment | Male Income | Female Income |
| Less than High School | - | - |
| High School Diploma | $81,163 | $0 |
| College or Associate's Degree | - | - |
| Bachelor's Degree | - | - |
| Graduate Degree | - | - |
| Total | $81,139 | $0 |
Family Income in Egan
Family Income Brackets in Egan
According to the Egan family income data, there are 329 families falling into the $75,000 to $99,999 income range, which is the most common income bracket and makes up 93.7% of all families.
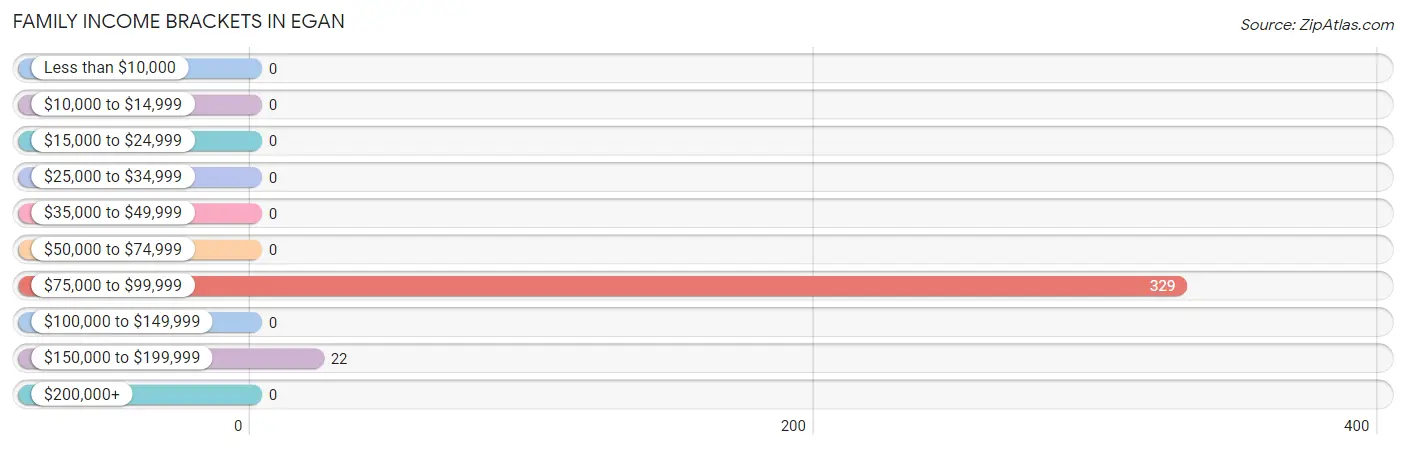
| Income Bracket | # Families | % Families |
| Less than $10,000 | 0 | 0.0% |
| $10,000 to $14,999 | 0 | 0.0% |
| $15,000 to $24,999 | 0 | 0.0% |
| $25,000 to $34,999 | 0 | 0.0% |
| $35,000 to $49,999 | 0 | 0.0% |
| $50,000 to $74,999 | 0 | 0.0% |
| $75,000 to $99,999 | 329 | 93.7% |
| $100,000 to $149,999 | 0 | 0.0% |
| $150,000 to $199,999 | 22 | 6.3% |
| $200,000+ | 0 | 0.0% |
Family Income by Famaliy Size in Egan
| Income Bracket | # Families | Median Income |
| 2-Person Families | 30 (8.6%) | $0 |
| 3-Person Families | 315 (89.7%) | $0 |
| 4-Person Families | 6 (1.7%) | $0 |
| 5-Person Families | 0 (0.0%) | $0 |
| 6-Person Families | 0 (0.0%) | $0 |
| 7+ Person Families | 0 (0.0%) | $0 |
| Total | 351 (100.0%) | $86,345 |
Family Income by Number of Earners in Egan
| Number of Earners | # Families | Median Income |
| No Earners | 22 (6.3%) | $0 |
| 1 Earner | 315 (89.7%) | $0 |
| 2 Earners | 14 (4.0%) | $0 |
| 3+ Earners | 0 (0.0%) | $0 |
| Total | 351 (100.0%) | $86,345 |
Household Income in Egan
Household Income Brackets in Egan
With 329 households falling in the category, the $75,000 to $99,999 income range is the most frequent in Egan, accounting for 92.7% of all households.
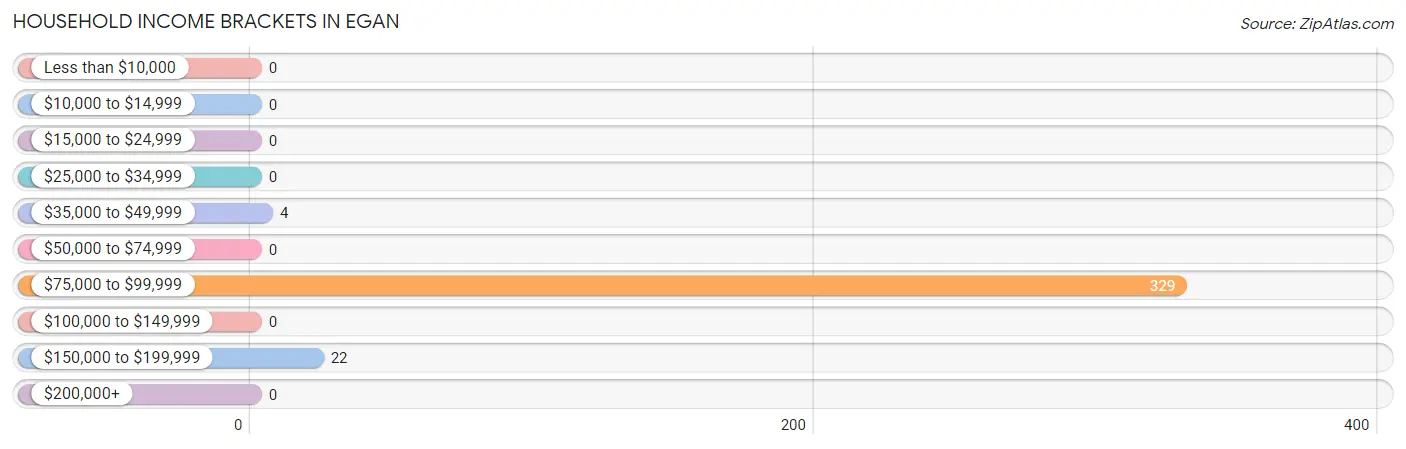
| Income Bracket | # Households | % Households |
| Less than $10,000 | 0 | 0.0% |
| $10,000 to $14,999 | 0 | 0.0% |
| $15,000 to $24,999 | 0 | 0.0% |
| $25,000 to $34,999 | 0 | 0.0% |
| $35,000 to $49,999 | 4 | 1.1% |
| $50,000 to $74,999 | 0 | 0.0% |
| $75,000 to $99,999 | 329 | 92.7% |
| $100,000 to $149,999 | 0 | 0.0% |
| $150,000 to $199,999 | 22 | 6.2% |
| $200,000+ | 0 | 0.0% |
Household Income by Householder Age in Egan
| Income Bracket | # Households | Median Income |
| 15 to 24 Years | 0 (0.0%) | $0 |
| 25 to 44 Years | 315 (88.7%) | $0 |
| 45 to 64 Years | 28 (7.9%) | $0 |
| 65+ Years | 12 (3.4%) | $0 |
| Total | 355 (100.0%) | $86,329 |
Poverty in Egan
Income Below Poverty by Sex and Age in Egan
| Age Bracket | Male | Female |
| Under 5 Years | 0 (0.0%) | 0 (0.0%) |
| 5 Years | 0 (0.0%) | 0 (0.0%) |
| 6 to 11 Years | 0 (0.0%) | 0 (0.0%) |
| 12 to 14 Years | 0 (0.0%) | 0 (0.0%) |
| 15 Years | 0 (0.0%) | 0 (0.0%) |
| 16 and 17 Years | 0 (0.0%) | 0 (0.0%) |
| 18 to 24 Years | 0 (0.0%) | 0 (0.0%) |
| 25 to 34 Years | 0 (0.0%) | 0 (0.0%) |
| 35 to 44 Years | 0 (0.0%) | 0 (0.0%) |
| 45 to 54 Years | 0 (0.0%) | 0 (0.0%) |
| 55 to 64 Years | 0 (0.0%) | 0 (0.0%) |
| 65 to 74 Years | 0 (0.0%) | 0 (0.0%) |
| 75 Years and over | 0 (0.0%) | 0 (0.0%) |
| Total | 0 (0.0%) | 0 (0.0%) |
Income Above Poverty by Sex and Age in Egan
According to the poverty statistics in Egan, males aged 25 to 34 years and females aged 12 to 14 years are the age groups that are most secure financially, with 100.0% of males and 100.0% of females in these age groups living above the poverty line.
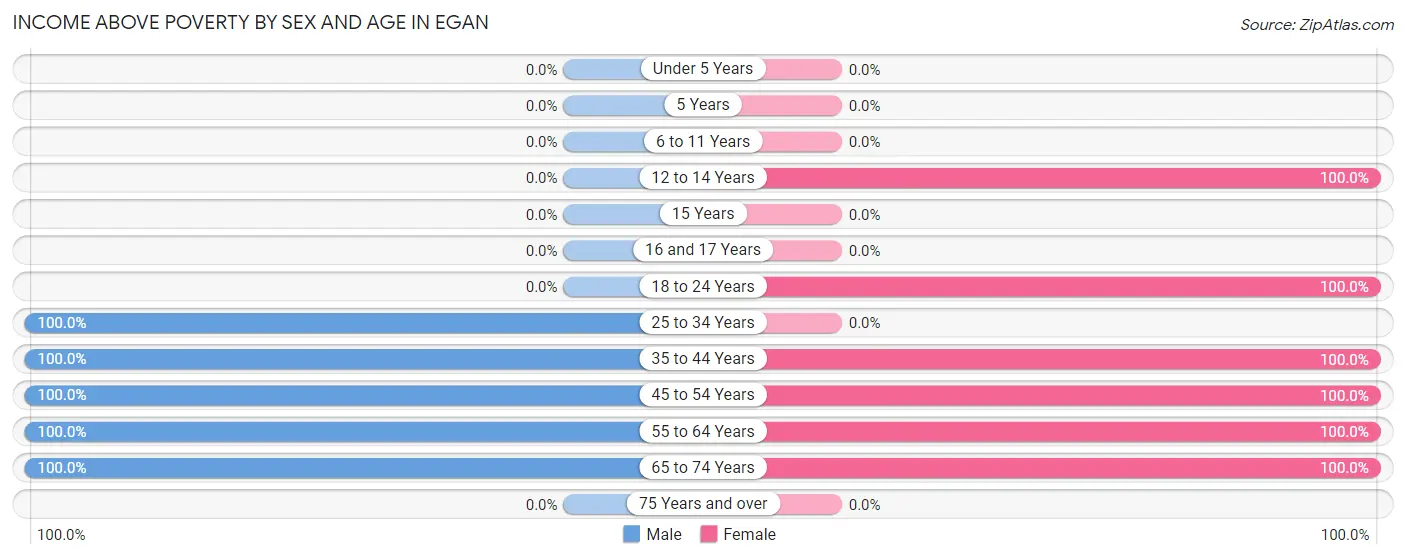
| Age Bracket | Male | Female |
| Under 5 Years | 0 (0.0%) | 0 (0.0%) |
| 5 Years | 0 (0.0%) | 0 (0.0%) |
| 6 to 11 Years | 0 (0.0%) | 0 (0.0%) |
| 12 to 14 Years | 0 (0.0%) | 212 (100.0%) |
| 15 Years | 0 (0.0%) | 0 (0.0%) |
| 16 and 17 Years | 0 (0.0%) | 0 (0.0%) |
| 18 to 24 Years | 0 (0.0%) | 12 (100.0%) |
| 25 to 34 Years | 14 (100.0%) | 0 (0.0%) |
| 35 to 44 Years | 315 (100.0%) | 214 (100.0%) |
| 45 to 54 Years | 6 (100.0%) | 3 (100.0%) |
| 55 to 64 Years | 22 (100.0%) | 23 (100.0%) |
| 65 to 74 Years | 8 (100.0%) | 4 (100.0%) |
| 75 Years and over | 0 (0.0%) | 0 (0.0%) |
| Total | 365 (100.0%) | 468 (100.0%) |
Income Below Poverty Among Married-Couple Families in Egan
| Children | Above Poverty | Below Poverty |
| No Children | 28 (100.0%) | 0 (0.0%) |
| 1 or 2 Children | 315 (100.0%) | 0 (0.0%) |
| 3 or 4 Children | 0 (0.0%) | 0 (0.0%) |
| 5 or more Children | 0 (0.0%) | 0 (0.0%) |
| Total | 343 (100.0%) | 0 (0.0%) |
Income Below Poverty Among Single-Parent Households in Egan
| Children | Single Father | Single Mother |
| No Children | 0 (0.0%) | 0 (0.0%) |
| 1 or 2 Children | 0 (0.0%) | 0 (0.0%) |
| 3 or 4 Children | 0 (0.0%) | 0 (0.0%) |
| 5 or more Children | 0 (0.0%) | 0 (0.0%) |
| Total | 0 (0.0%) | 0 (0.0%) |
Income Below Poverty Among Married-Couple vs Single-Parent Households in Egan
| Children | Married-Couple Families | Single-Parent Households |
| No Children | 0 (0.0%) | 0 (0.0%) |
| 1 or 2 Children | 0 (0.0%) | 0 (0.0%) |
| 3 or 4 Children | 0 (0.0%) | 0 (0.0%) |
| 5 or more Children | 0 (0.0%) | 0 (0.0%) |
| Total | 0 (0.0%) | 0 (0.0%) |
Race in Egan
The most populous races in Egan are , and White / Caucasian (833 | 100.0%).
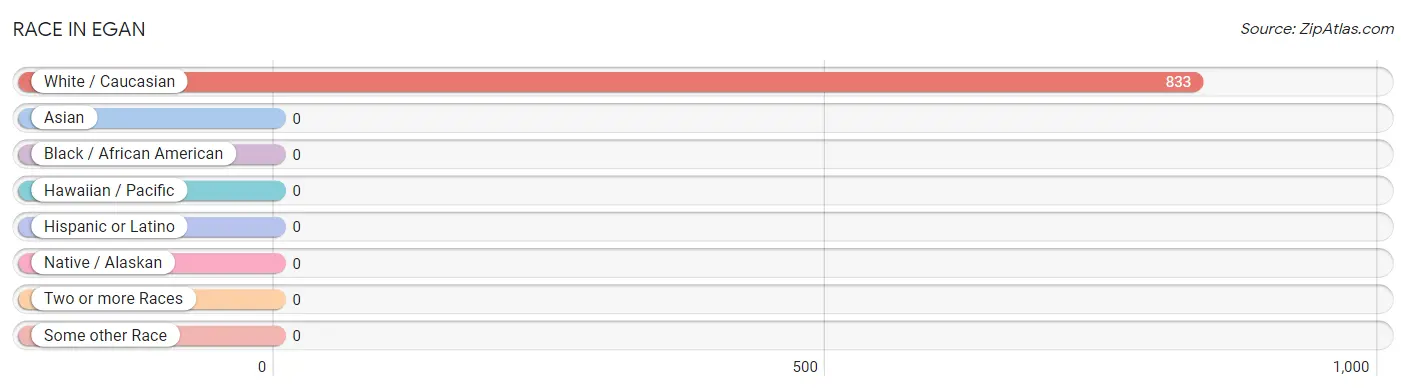
| Race | # Population | % Population |
| Asian | 0 | 0.0% |
| Black / African American | 0 | 0.0% |
| Hawaiian / Pacific | 0 | 0.0% |
| Hispanic or Latino | 0 | 0.0% |
| Native / Alaskan | 0 | 0.0% |
| White / Caucasian | 833 | 100.0% |
| Two or more Races | 0 | 0.0% |
| Some other Race | 0 | 0.0% |
| Total | 833 | 100.0% |
Ancestry in Egan
The most populous ancestries reported in Egan are French Canadian (43 | 5.2%), Italian (38 | 4.6%), and American (4 | 0.5%), together accounting for 10.2% of all Egan residents.
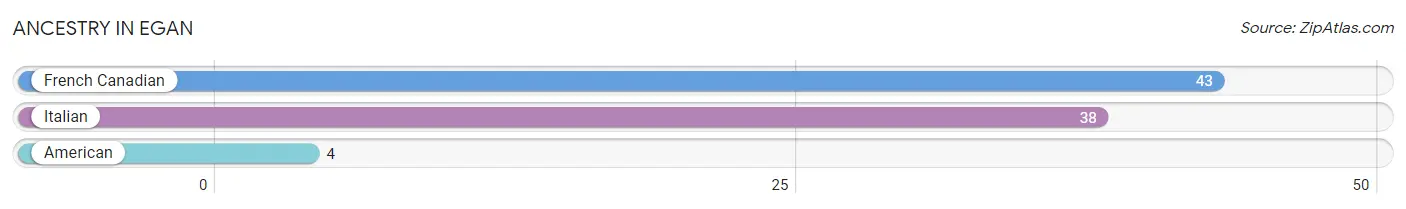
| Ancestry | # Population | % Population |
| American | 4 | 0.5% |
| French Canadian | 43 | 5.2% |
| Italian | 38 | 4.6% | View All 3 Rows |
Immigrants in Egan

| Immigration Origin | # Population | % Population | View All 0 Rows |
Sex and Age in Egan
Sex and Age in Egan
The most populous age groups in Egan are 35 to 39 Years (315 | 86.3%) for men and 35 to 39 Years (214 | 45.7%) for women.
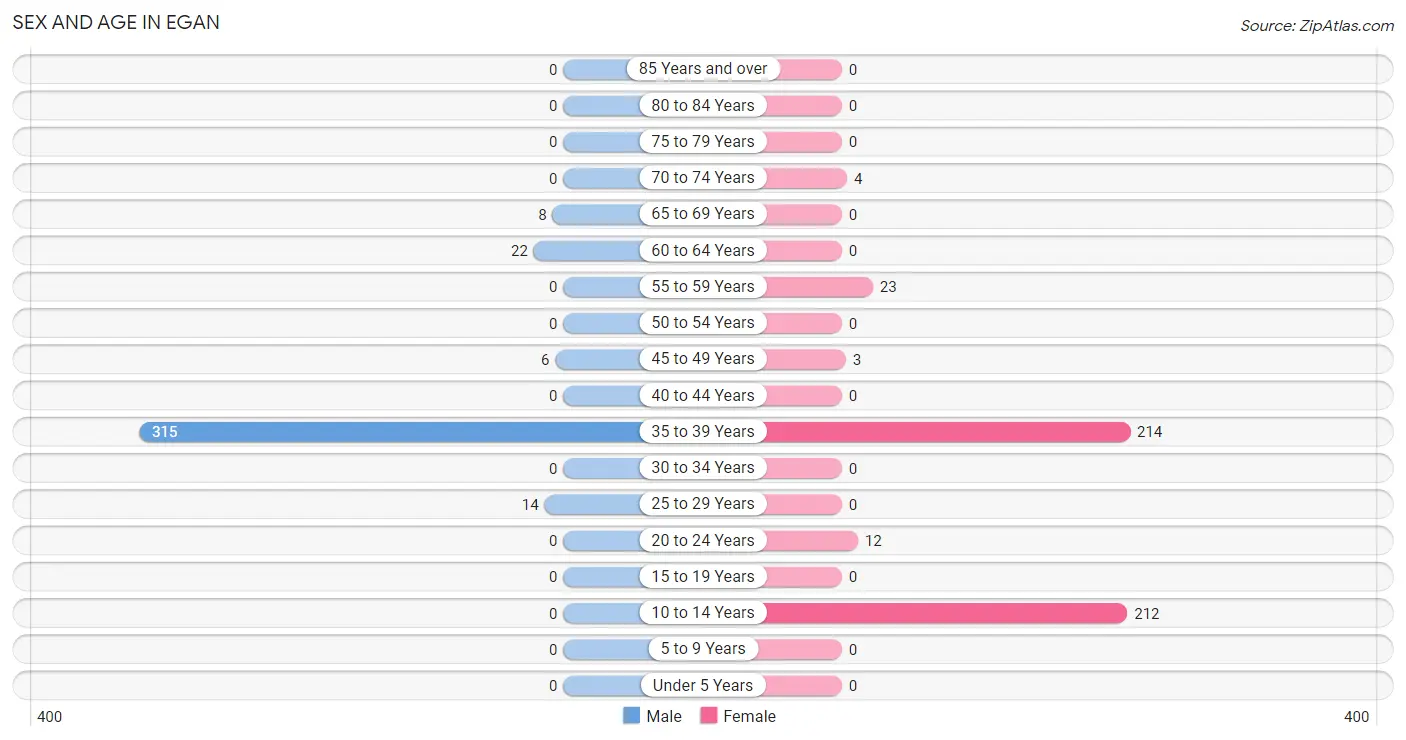
| Age Bracket | Male | Female |
| Under 5 Years | 0 (0.0%) | 0 (0.0%) |
| 5 to 9 Years | 0 (0.0%) | 0 (0.0%) |
| 10 to 14 Years | 0 (0.0%) | 212 (45.3%) |
| 15 to 19 Years | 0 (0.0%) | 0 (0.0%) |
| 20 to 24 Years | 0 (0.0%) | 12 (2.6%) |
| 25 to 29 Years | 14 (3.8%) | 0 (0.0%) |
| 30 to 34 Years | 0 (0.0%) | 0 (0.0%) |
| 35 to 39 Years | 315 (86.3%) | 214 (45.7%) |
| 40 to 44 Years | 0 (0.0%) | 0 (0.0%) |
| 45 to 49 Years | 6 (1.6%) | 3 (0.6%) |
| 50 to 54 Years | 0 (0.0%) | 0 (0.0%) |
| 55 to 59 Years | 0 (0.0%) | 23 (4.9%) |
| 60 to 64 Years | 22 (6.0%) | 0 (0.0%) |
| 65 to 69 Years | 8 (2.2%) | 0 (0.0%) |
| 70 to 74 Years | 0 (0.0%) | 4 (0.9%) |
| 75 to 79 Years | 0 (0.0%) | 0 (0.0%) |
| 80 to 84 Years | 0 (0.0%) | 0 (0.0%) |
| 85 Years and over | 0 (0.0%) | 0 (0.0%) |
| Total | 365 (100.0%) | 468 (100.0%) |
Families and Households in Egan
Median Family Size in Egan
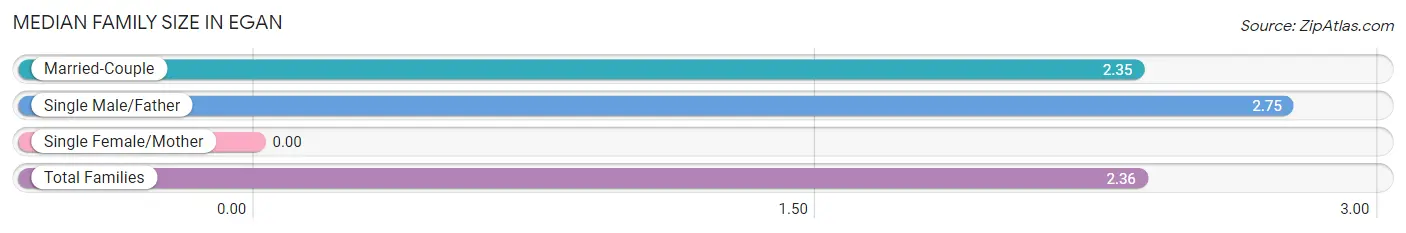
| Family Type | # Families | Family Size |
| Married-Couple | 343 (97.7%) | 2.35 |
| Single Male/Father | 8 (2.3%) | 2.75 |
| Single Female/Mother | 0 (0.0%) | - |
| Total Families | 351 (100.0%) | 2.36 |
Median Household Size in Egan
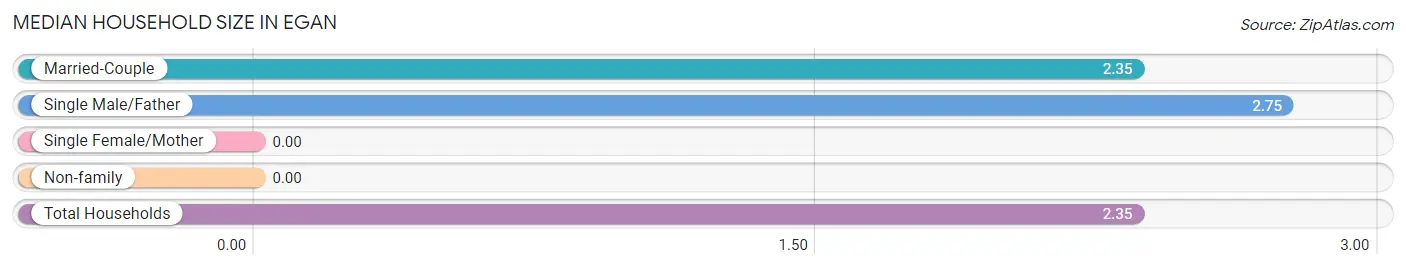
| Household Type | # Households | Household Size |
| Married-Couple | 343 (96.6%) | 2.35 |
| Single Male/Father | 8 (2.2%) | 2.75 |
| Single Female/Mother | 0 (0.0%) | - |
| Non-family | 4 (1.1%) | - |
| Total Households | 355 (100.0%) | 2.35 |
Household Size by Marriage Status in Egan
Out of a total of 355 households in Egan, 351 (98.9%) are family households, while 4 (1.1%) are nonfamily households. The most numerous type of family households are 3-person households, comprising 315, and the most common type of nonfamily households are 1-person households, comprising 4.
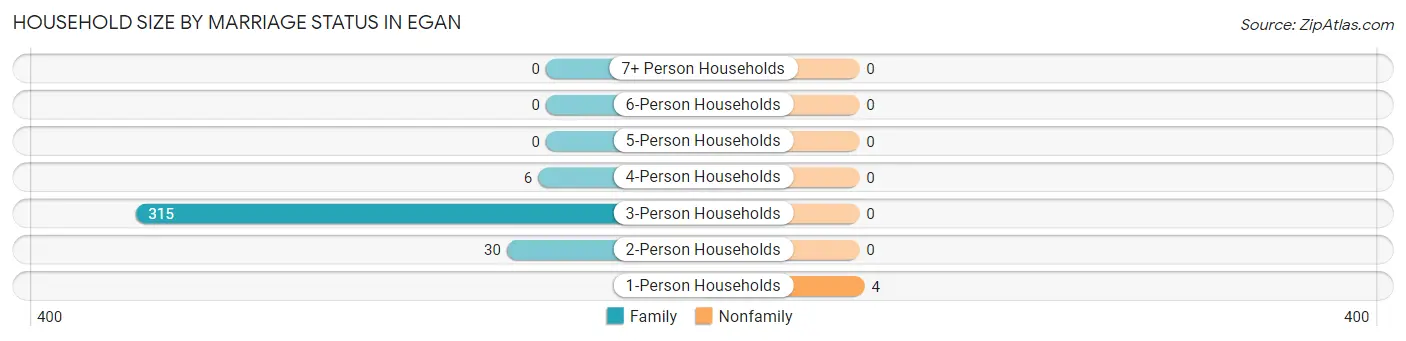
| Household Size | Family Households | Nonfamily Households |
| 1-Person Households | - | 4 (1.1%) |
| 2-Person Households | 30 (8.5%) | 0 (0.0%) |
| 3-Person Households | 315 (88.7%) | 0 (0.0%) |
| 4-Person Households | 6 (1.7%) | 0 (0.0%) |
| 5-Person Households | 0 (0.0%) | 0 (0.0%) |
| 6-Person Households | 0 (0.0%) | 0 (0.0%) |
| 7+ Person Households | 0 (0.0%) | 0 (0.0%) |
| Total | 351 (98.9%) | 4 (1.1%) |
Female Fertility in Egan
Fertility by Age in Egan
| Age Bracket | Women with Births | Births / 1,000 Women |
| 15 to 19 years | 0 (0.0%) | 0.0 |
| 20 to 34 years | 0 (0.0%) | 0.0 |
| 35 to 50 years | 0 (0.0%) | 0.0 |
| Total | 0 (0.0%) | 0.0 |
Fertility by Age by Marriage Status in Egan
| Age Bracket | Married | Unmarried |
| 15 to 19 years | 0 (0.0%) | 0 (0.0%) |
| 20 to 34 years | 0 (0.0%) | 0 (0.0%) |
| 35 to 50 years | 0 (0.0%) | 0 (0.0%) |
| Total | 0 (0.0%) | 0 (0.0%) |
Fertility by Education in Egan
| Educational Attainment | Women with Births | Births / 1,000 Women |
| Less than High School | 0 (0.0%) | 0.0 |
| High School Diploma | 0 (0.0%) | 0.0 |
| College or Associate's Degree | 0 (0.0%) | 0.0 |
| Bachelor's Degree | 0 (0.0%) | 0.0 |
| Graduate Degree | 0 (0.0%) | 0.0 |
| Total | 0 (0.0%) | 0.0 |
Fertility by Education by Marriage Status in Egan
| Educational Attainment | Married | Unmarried |
| Less than High School | 0 (0.0%) | 0 (0.0%) |
| High School Diploma | 0 (0.0%) | 0 (0.0%) |
| College or Associate's Degree | 0 (0.0%) | 0 (0.0%) |
| Bachelor's Degree | 0 (0.0%) | 0 (0.0%) |
| Graduate Degree | 0 (0.0%) | 0 (0.0%) |
| Total | 0 (0.0%) | 0 (0.0%) |
Employment Characteristics in Egan
Employment by Class of Employer in Egan
Among the 353 employed individuals in Egan, private company employees (329 | 93.2%), self-employed (not incorporated) (14 | 4.0%), and state government employees (6 | 1.7%) make up the most common classes of employment.
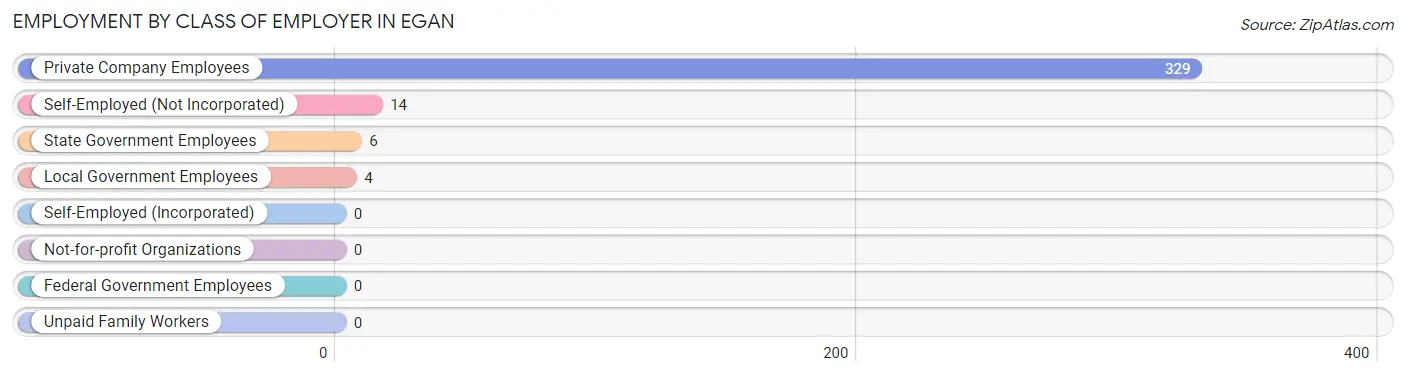
| Employer Class | # Employees | % Employees |
| Private Company Employees | 329 | 93.2% |
| Self-Employed (Incorporated) | 0 | 0.0% |
| Self-Employed (Not Incorporated) | 14 | 4.0% |
| Not-for-profit Organizations | 0 | 0.0% |
| Local Government Employees | 4 | 1.1% |
| State Government Employees | 6 | 1.7% |
| Federal Government Employees | 0 | 0.0% |
| Unpaid Family Workers | 0 | 0.0% |
| Total | 353 | 100.0% |
Employment Status by Age in Egan
According to the labor force statistics for Egan, out of the total population over 16 years of age (621), 61.8% or 384 individuals are in the labor force, with 8.1% or 31 of them unemployed. The age group with the highest labor force participation rate is 20 to 24 years, with 100.0% or 12 individuals in the labor force. Within the labor force, the 60 to 64 years age range has the highest percentage of unemployed individuals, with 100.0% or 22 of them being unemployed.
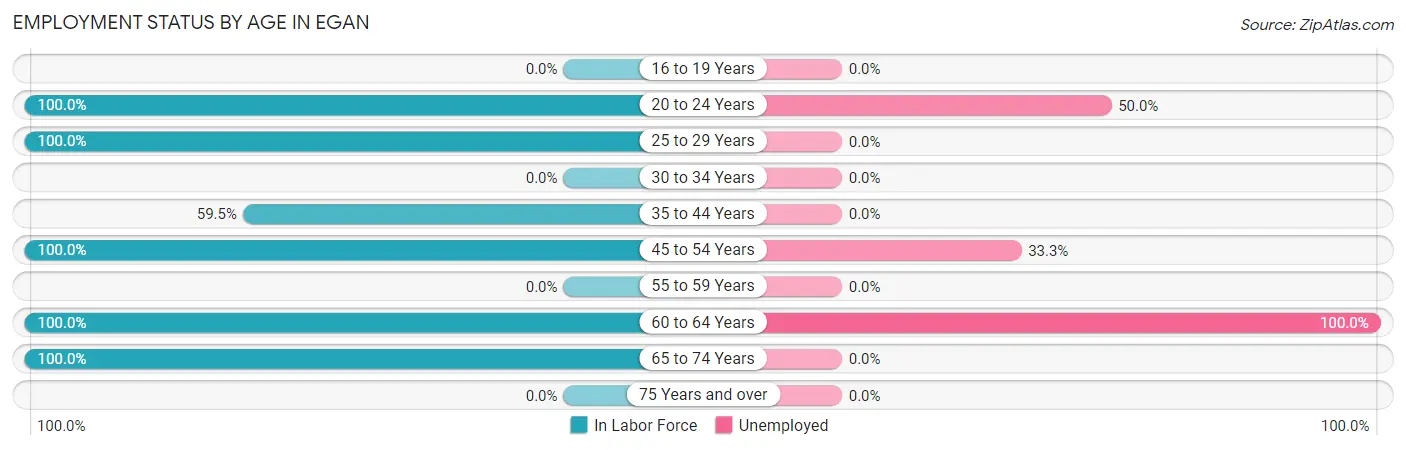
| Age Bracket | In Labor Force | Unemployed |
| 16 to 19 Years | 0 (0.0%) | 0 (0.0%) |
| 20 to 24 Years | 12 (100.0%) | 6 (50.0%) |
| 25 to 29 Years | 14 (100.0%) | 0 (0.0%) |
| 30 to 34 Years | 0 (0.0%) | 0 (0.0%) |
| 35 to 44 Years | 315 (59.5%) | 0 (0.0%) |
| 45 to 54 Years | 9 (100.0%) | 3 (33.3%) |
| 55 to 59 Years | 0 (0.0%) | 0 (0.0%) |
| 60 to 64 Years | 22 (100.0%) | 22 (100.0%) |
| 65 to 74 Years | 12 (100.0%) | 0 (0.0%) |
| 75 Years and over | 0 (0.0%) | 0 (0.0%) |
| Total | 384 (61.8%) | 31 (8.1%) |
Employment Status by Educational Attainment in Egan
According to labor force statistics for Egan, 60.3% of individuals (360) out of the total population between 25 and 64 years of age (597) are in the labor force, with 6.9% or 25 of them being unemployed. The group with the highest labor force participation rate are those with the educational attainment of college / associate degree, with 100.0% or 28 individuals in the labor force. Within the labor force, individuals with bachelor's degree or higher education have the highest percentage of unemployment, with 100.0% or 3 of them being unemployed.
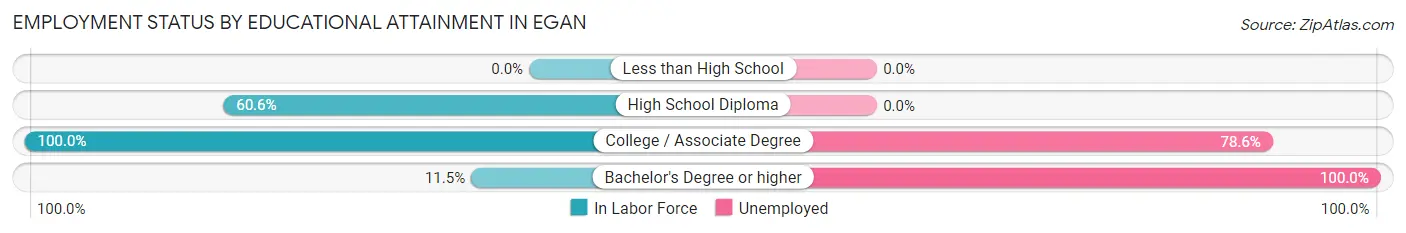
| Educational Attainment | In Labor Force | Unemployed |
| Less than High School | 0 (0.0%) | 0 (0.0%) |
| High School Diploma | 329 (60.6%) | 0 (0.0%) |
| College / Associate Degree | 28 (100.0%) | 22 (78.6%) |
| Bachelor's Degree or higher | 3 (11.5%) | 26 (100.0%) |
| Total | 360 (60.3%) | 41 (6.9%) |
Employment Occupations by Sex in Egan
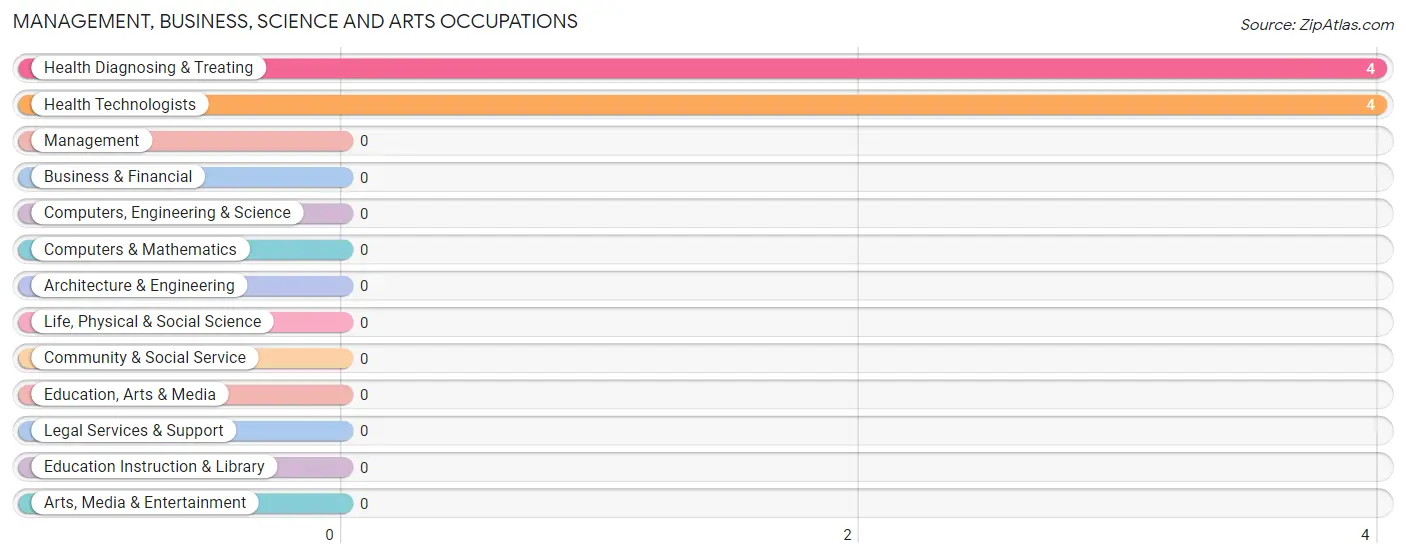
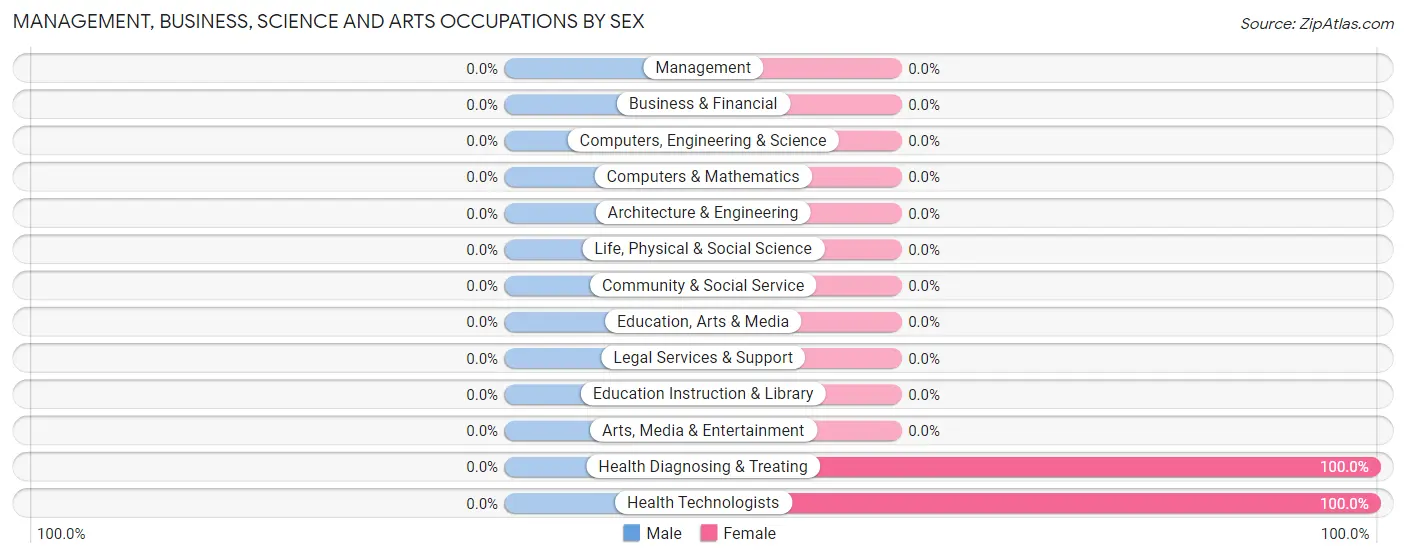
Management, Business, Science and Arts Occupations
The most common Management, Business, Science and Arts occupations in Egan are Health Diagnosing & Treating (4 | 1.1%), and Health Technologists (4 | 1.1%).
Management, Business, Science and Arts Occupations by Sex
| Occupation | Male | Female |
| Management | 0 (0.0%) | 0 (0.0%) |
| Business & Financial | 0 (0.0%) | 0 (0.0%) |
| Computers, Engineering & Science | 0 (0.0%) | 0 (0.0%) |
| Computers & Mathematics | 0 (0.0%) | 0 (0.0%) |
| Architecture & Engineering | 0 (0.0%) | 0 (0.0%) |
| Life, Physical & Social Science | 0 (0.0%) | 0 (0.0%) |
| Community & Social Service | 0 (0.0%) | 0 (0.0%) |
| Education, Arts & Media | 0 (0.0%) | 0 (0.0%) |
| Legal Services & Support | 0 (0.0%) | 0 (0.0%) |
| Education Instruction & Library | 0 (0.0%) | 0 (0.0%) |
| Arts, Media & Entertainment | 0 (0.0%) | 0 (0.0%) |
| Health Diagnosing & Treating | 0 (0.0%) | 4 (100.0%) |
| Health Technologists | 0 (0.0%) | 4 (100.0%) |
| Total (Category) | 0 (0.0%) | 4 (100.0%) |
| Total (Overall) | 343 (97.2%) | 10 (2.8%) |
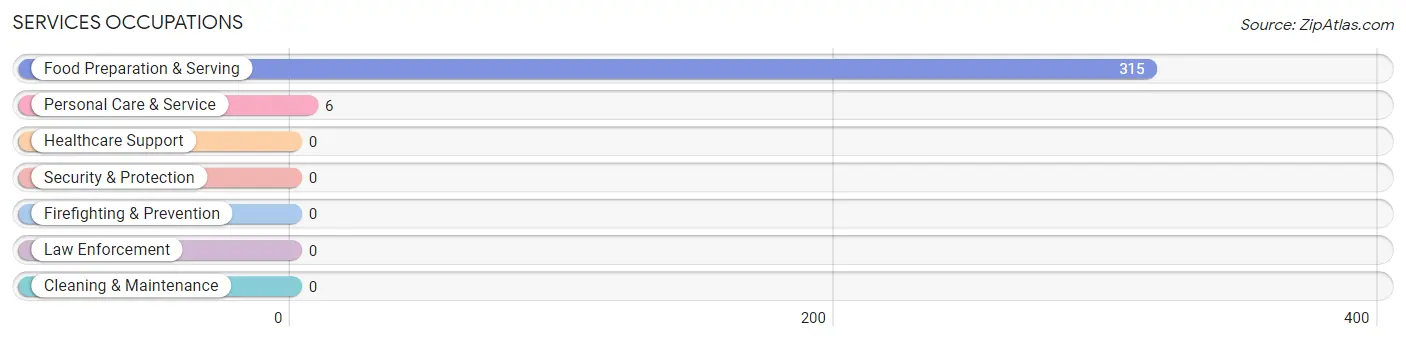
Services Occupations
The most common Services occupations in Egan are Food Preparation & Serving (315 | 89.2%), and Personal Care & Service (6 | 1.7%).
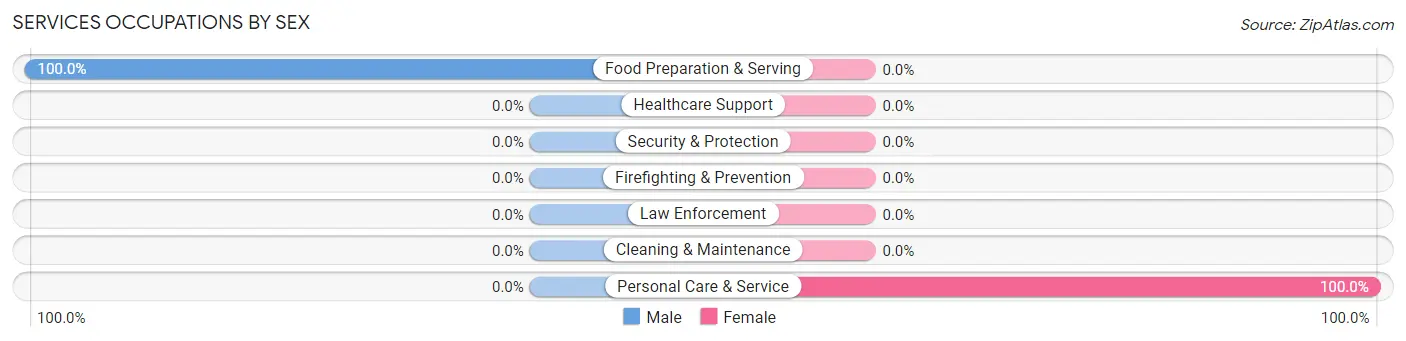
Services Occupations by Sex
| Occupation | Male | Female |
| Healthcare Support | 0 (0.0%) | 0 (0.0%) |
| Security & Protection | 0 (0.0%) | 0 (0.0%) |
| Firefighting & Prevention | 0 (0.0%) | 0 (0.0%) |
| Law Enforcement | 0 (0.0%) | 0 (0.0%) |
| Food Preparation & Serving | 315 (100.0%) | 0 (0.0%) |
| Cleaning & Maintenance | 0 (0.0%) | 0 (0.0%) |
| Personal Care & Service | 0 (0.0%) | 6 (100.0%) |
| Total (Category) | 315 (98.1%) | 6 (1.9%) |
| Total (Overall) | 343 (97.2%) | 10 (2.8%) |
Sales and Office Occupations
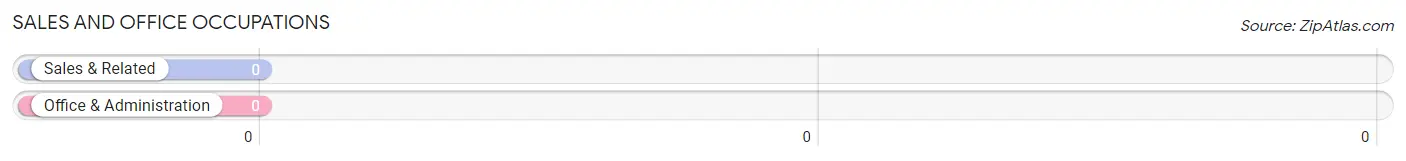
Sales and Office Occupations by Sex
| Occupation | Male | Female |
| Sales & Related | 0 (0.0%) | 0 (0.0%) |
| Office & Administration | 0 (0.0%) | 0 (0.0%) |
| Total (Category) | 0 (0.0%) | 0 (0.0%) |
| Total (Overall) | 343 (97.2%) | 10 (2.8%) |
Natural Resources, Construction and Maintenance Occupations
The most common Natural Resources, Construction and Maintenance occupations in Egan are , and Installation, Maintenance & Repair (20 | 5.7%).
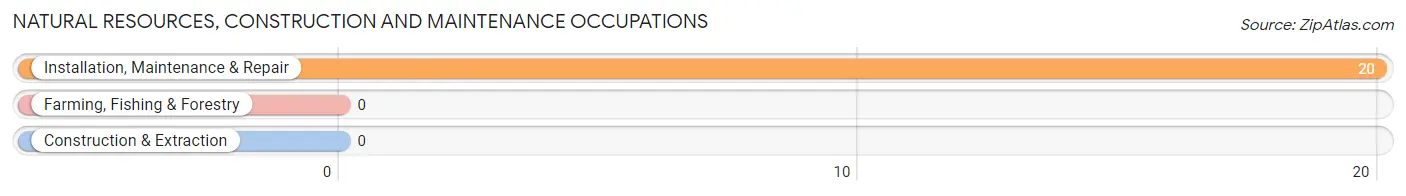
Natural Resources, Construction and Maintenance Occupations by Sex
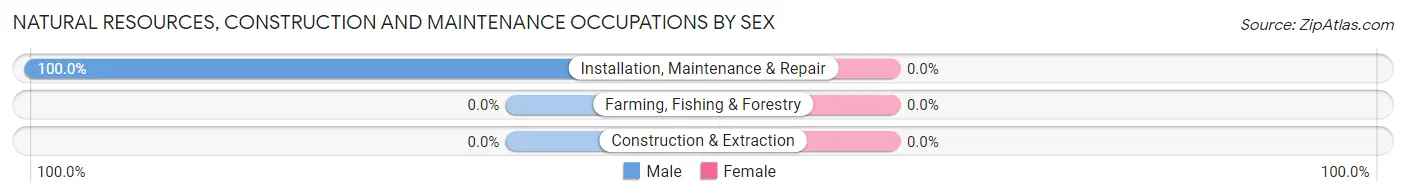
| Occupation | Male | Female |
| Farming, Fishing & Forestry | 0 (0.0%) | 0 (0.0%) |
| Construction & Extraction | 0 (0.0%) | 0 (0.0%) |
| Installation, Maintenance & Repair | 20 (100.0%) | 0 (0.0%) |
| Total (Category) | 20 (100.0%) | 0 (0.0%) |
| Total (Overall) | 343 (97.2%) | 10 (2.8%) |
Production, Transportation and Moving Occupations
The most common Production, Transportation and Moving occupations in Egan are , and Production (8 | 2.3%).
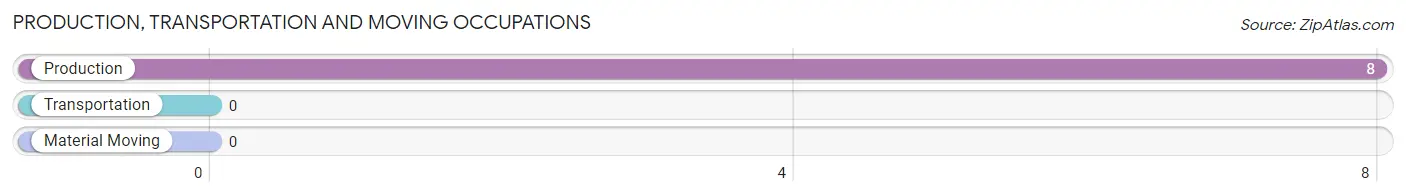
Production, Transportation and Moving Occupations by Sex
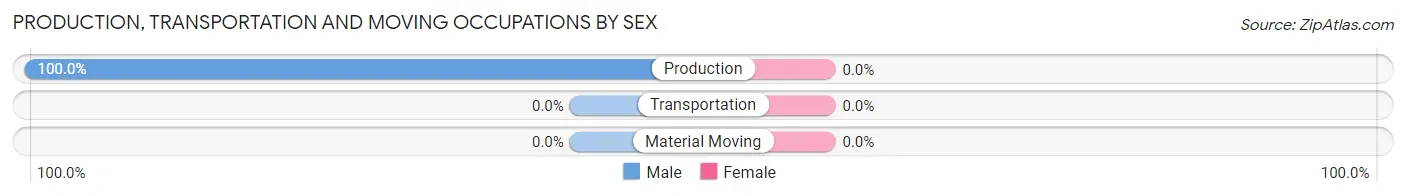
| Occupation | Male | Female |
| Production | 8 (100.0%) | 0 (0.0%) |
| Transportation | 0 (0.0%) | 0 (0.0%) |
| Material Moving | 0 (0.0%) | 0 (0.0%) |
| Total (Category) | 8 (100.0%) | 0 (0.0%) |
| Total (Overall) | 343 (97.2%) | 10 (2.8%) |
Employment Industries by Sex in Egan
Employment Industries in Egan
The major employment industries in Egan include Arts, Entertainment & Recreation (315 | 89.2%), Educational Services (10 | 2.8%), and Wholesale Trade (8 | 2.3%).
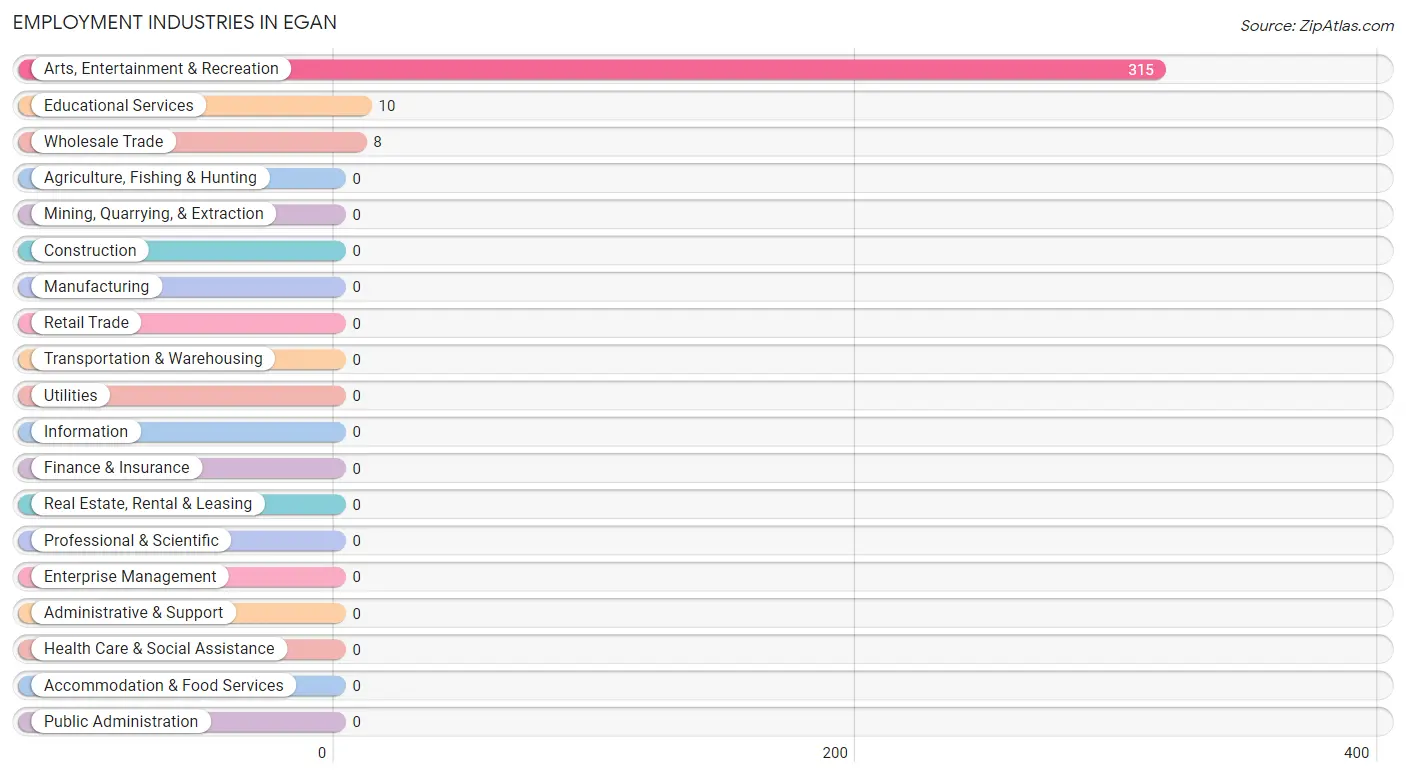
Employment Industries by Sex in Egan
| Industry | Male | Female |
| Agriculture, Fishing & Hunting | 0 (0.0%) | 0 (0.0%) |
| Mining, Quarrying, & Extraction | 0 (0.0%) | 0 (0.0%) |
| Construction | 0 (0.0%) | 0 (0.0%) |
| Manufacturing | 0 (0.0%) | 0 (0.0%) |
| Wholesale Trade | 8 (100.0%) | 0 (0.0%) |
| Retail Trade | 0 (0.0%) | 0 (0.0%) |
| Transportation & Warehousing | 0 (0.0%) | 0 (0.0%) |
| Utilities | 0 (0.0%) | 0 (0.0%) |
| Information | 0 (0.0%) | 0 (0.0%) |
| Finance & Insurance | 0 (0.0%) | 0 (0.0%) |
| Real Estate, Rental & Leasing | 0 (0.0%) | 0 (0.0%) |
| Professional & Scientific | 0 (0.0%) | 0 (0.0%) |
| Enterprise Management | 0 (0.0%) | 0 (0.0%) |
| Administrative & Support | 0 (0.0%) | 0 (0.0%) |
| Educational Services | 0 (0.0%) | 10 (100.0%) |
| Health Care & Social Assistance | 0 (0.0%) | 0 (0.0%) |
| Arts, Entertainment & Recreation | 315 (100.0%) | 0 (0.0%) |
| Accommodation & Food Services | 0 (0.0%) | 0 (0.0%) |
| Public Administration | 0 (0.0%) | 0 (0.0%) |
| Total | 343 (97.2%) | 10 (2.8%) |
Education in Egan
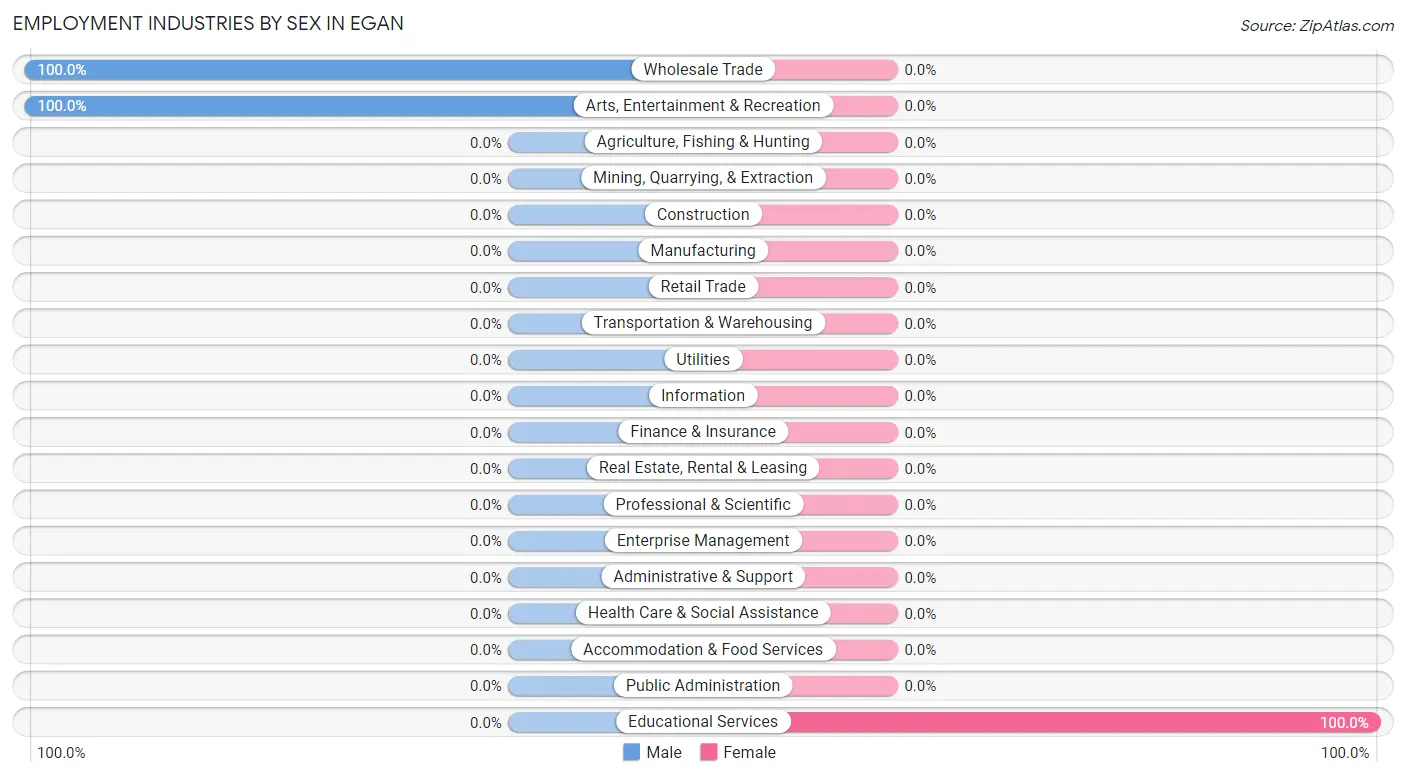
School Enrollment in Egan
The most common levels of schooling among the 218 students in Egan are middle school (212 | 97.3%), and college / undergraduate (6 | 2.8%).
| School Level | # Students | % Students |
| Nursery / Preschool | 0 | 0.0% |
| Kindergarten | 0 | 0.0% |
| Elementary School | 0 | 0.0% |
| Middle School | 212 | 97.3% |
| High School | 0 | 0.0% |
| College / Undergraduate | 6 | 2.8% |
| Graduate / Professional | 0 | 0.0% |
| Total | 218 | 100.0% |
School Enrollment by Age by Funding Source in Egan
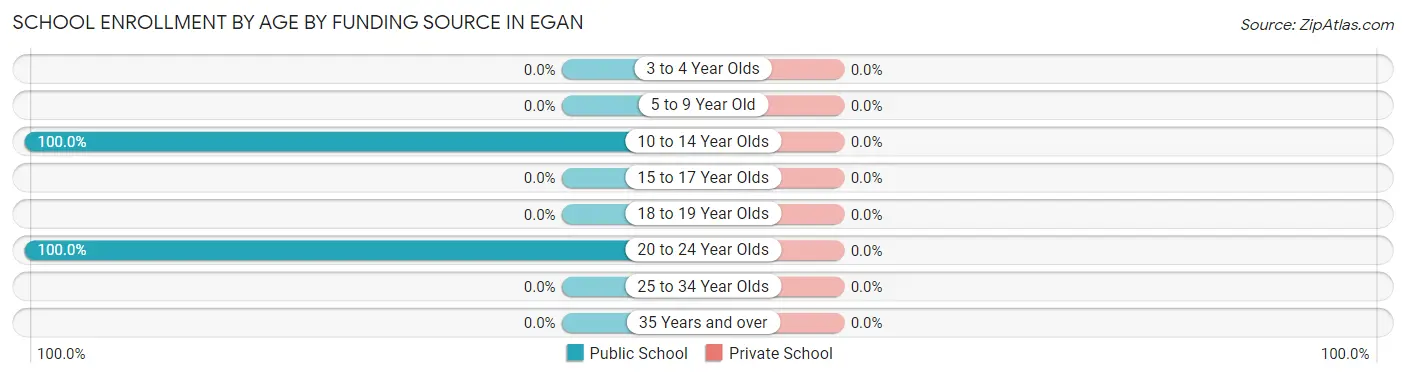
| Age Bracket | Public School | Private School |
| 3 to 4 Year Olds | 0 (0.0%) | 0 (0.0%) |
| 5 to 9 Year Old | 0 (0.0%) | 0 (0.0%) |
| 10 to 14 Year Olds | 212 (100.0%) | 0 (0.0%) |
| 15 to 17 Year Olds | 0 (0.0%) | 0 (0.0%) |
| 18 to 19 Year Olds | 0 (0.0%) | 0 (0.0%) |
| 20 to 24 Year Olds | 6 (100.0%) | 0 (0.0%) |
| 25 to 34 Year Olds | 0 (0.0%) | 0 (0.0%) |
| 35 Years and over | 0 (0.0%) | 0 (0.0%) |
| Total | 218 (100.0%) | 0 (0.0%) |
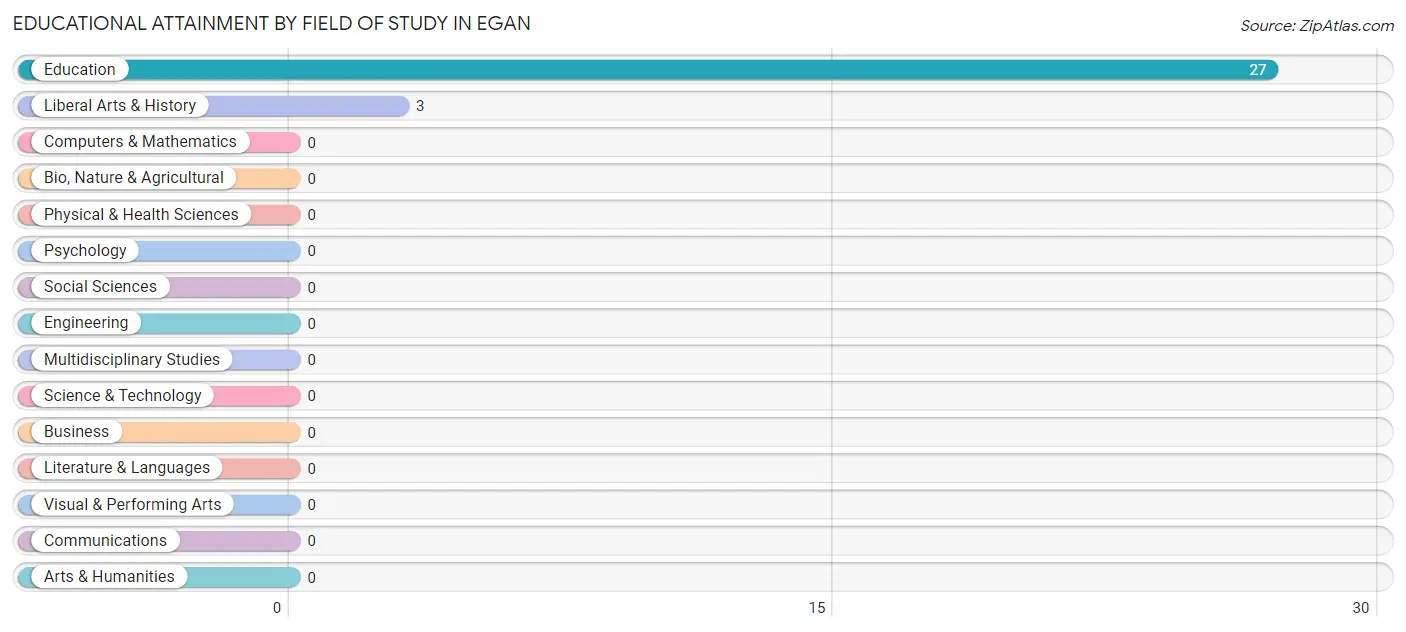
Educational Attainment by Field of Study in Egan
Education (27 | 90.0%), and liberal arts & history (3 | 10.0%) are the most common fields of study among 30 individuals in Egan who have obtained a bachelor's degree or higher.
| Field of Study | # Graduates | % Graduates |
| Computers & Mathematics | 0 | 0.0% |
| Bio, Nature & Agricultural | 0 | 0.0% |
| Physical & Health Sciences | 0 | 0.0% |
| Psychology | 0 | 0.0% |
| Social Sciences | 0 | 0.0% |
| Engineering | 0 | 0.0% |
| Multidisciplinary Studies | 0 | 0.0% |
| Science & Technology | 0 | 0.0% |
| Business | 0 | 0.0% |
| Education | 27 | 90.0% |
| Literature & Languages | 0 | 0.0% |
| Liberal Arts & History | 3 | 10.0% |
| Visual & Performing Arts | 0 | 0.0% |
| Communications | 0 | 0.0% |
| Arts & Humanities | 0 | 0.0% |
| Total | 30 | 100.0% |
Transportation & Commute in Egan
Vehicle Availability by Sex in Egan
The most prevalent vehicle ownership categories in Egan are males with 1 vehicle (315, accounting for 91.8%) and females with 1 vehicle (4, making up 3,150.0%).
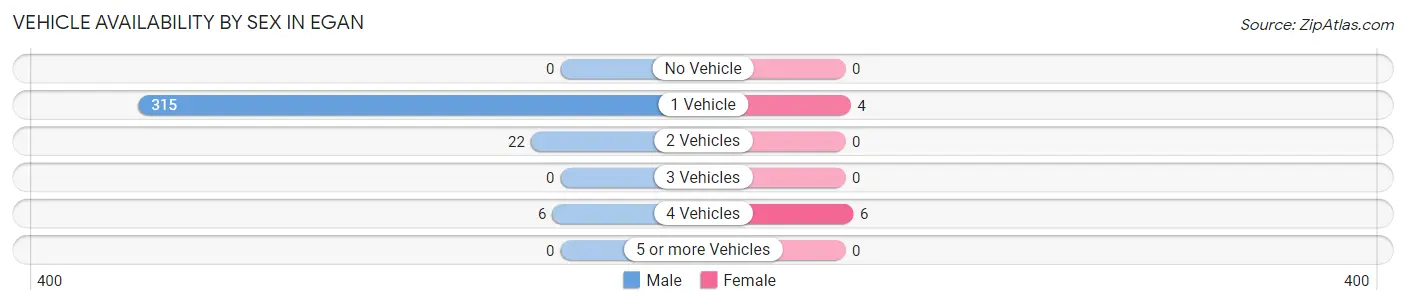
| Vehicles Available | Male | Female |
| No Vehicle | 0 (0.0%) | 0 (0.0%) |
| 1 Vehicle | 315 (91.8%) | 4 (40.0%) |
| 2 Vehicles | 22 (6.4%) | 0 (0.0%) |
| 3 Vehicles | 0 (0.0%) | 0 (0.0%) |
| 4 Vehicles | 6 (1.8%) | 6 (60.0%) |
| 5 or more Vehicles | 0 (0.0%) | 0 (0.0%) |
| Total | 343 (100.0%) | 10 (100.0%) |
Commute Time in Egan
The most frequently occuring commute durations in Egan are 20 to 24 minutes (315 commuters, 89.2%), 10 to 14 minutes (14 commuters, 4.0%), and 25 to 29 minutes (14 commuters, 4.0%).
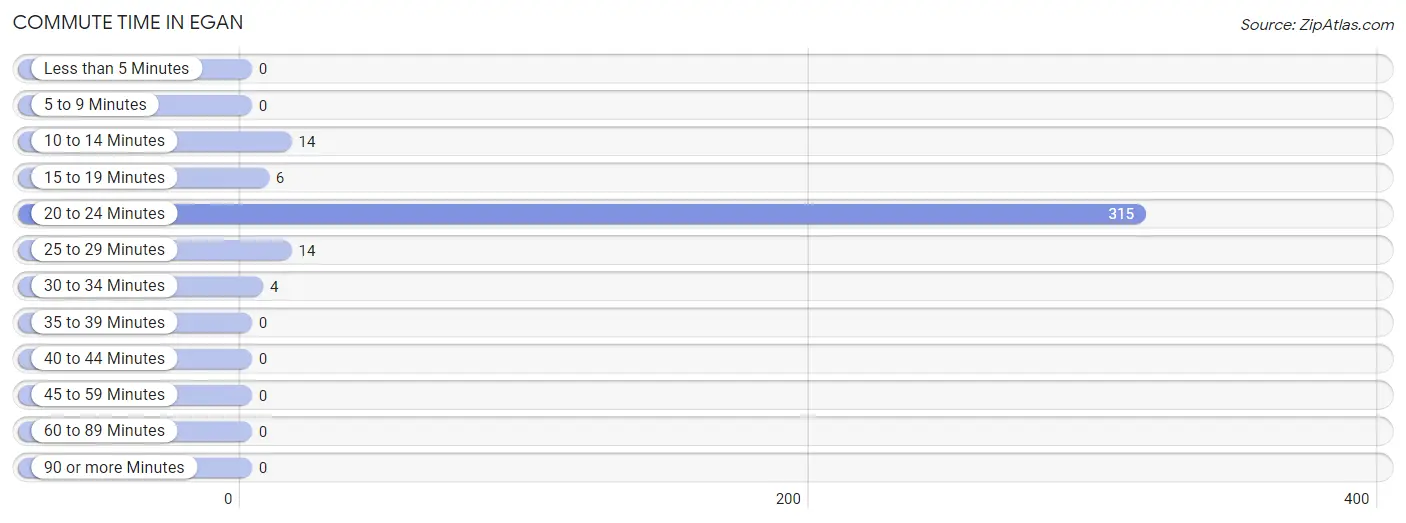
| Commute Time | # Commuters | % Commuters |
| Less than 5 Minutes | 0 | 0.0% |
| 5 to 9 Minutes | 0 | 0.0% |
| 10 to 14 Minutes | 14 | 4.0% |
| 15 to 19 Minutes | 6 | 1.7% |
| 20 to 24 Minutes | 315 | 89.2% |
| 25 to 29 Minutes | 14 | 4.0% |
| 30 to 34 Minutes | 4 | 1.1% |
| 35 to 39 Minutes | 0 | 0.0% |
| 40 to 44 Minutes | 0 | 0.0% |
| 45 to 59 Minutes | 0 | 0.0% |
| 60 to 89 Minutes | 0 | 0.0% |
| 90 or more Minutes | 0 | 0.0% |
Commute Time by Sex in Egan
The most common commute times in Egan are 20 to 24 minutes (315 commuters, 91.8%) for males and 15 to 19 minutes (6 commuters, 60.0%) for females.
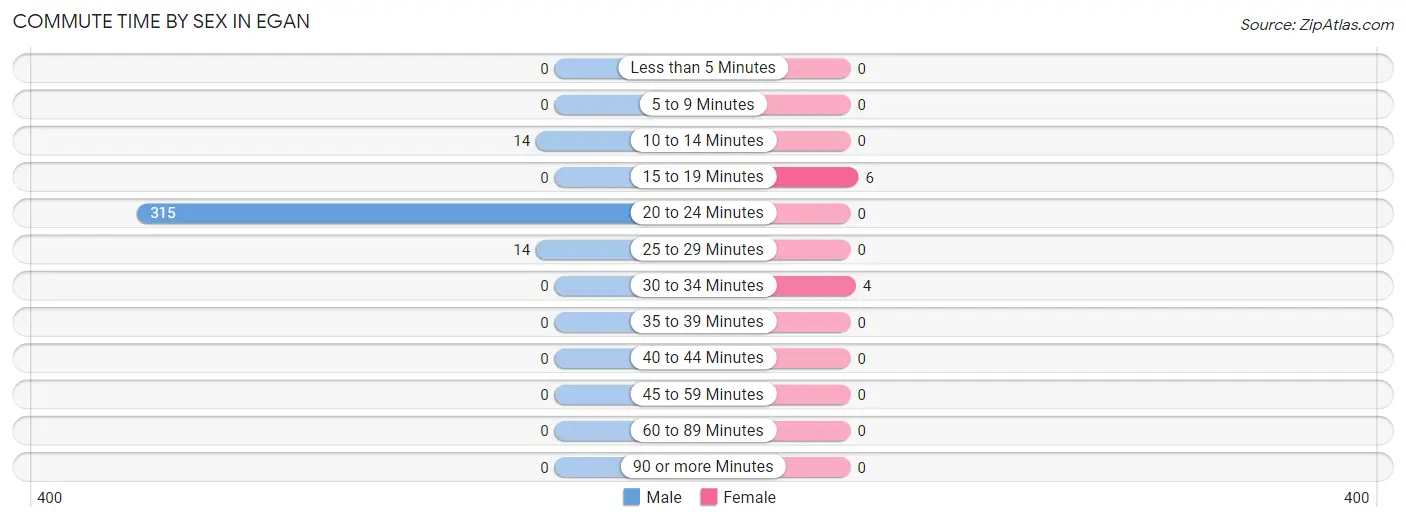
| Commute Time | Male | Female |
| Less than 5 Minutes | 0 (0.0%) | 0 (0.0%) |
| 5 to 9 Minutes | 0 (0.0%) | 0 (0.0%) |
| 10 to 14 Minutes | 14 (4.1%) | 0 (0.0%) |
| 15 to 19 Minutes | 0 (0.0%) | 6 (60.0%) |
| 20 to 24 Minutes | 315 (91.8%) | 0 (0.0%) |
| 25 to 29 Minutes | 14 (4.1%) | 0 (0.0%) |
| 30 to 34 Minutes | 0 (0.0%) | 4 (40.0%) |
| 35 to 39 Minutes | 0 (0.0%) | 0 (0.0%) |
| 40 to 44 Minutes | 0 (0.0%) | 0 (0.0%) |
| 45 to 59 Minutes | 0 (0.0%) | 0 (0.0%) |
| 60 to 89 Minutes | 0 (0.0%) | 0 (0.0%) |
| 90 or more Minutes | 0 (0.0%) | 0 (0.0%) |
Time of Departure to Work by Sex in Egan
The most frequent times of departure to work in Egan are 5:30 AM to 5:59 AM (315, 91.8%) for males and 8:00 AM to 8:29 AM (6, 60.0%) for females.
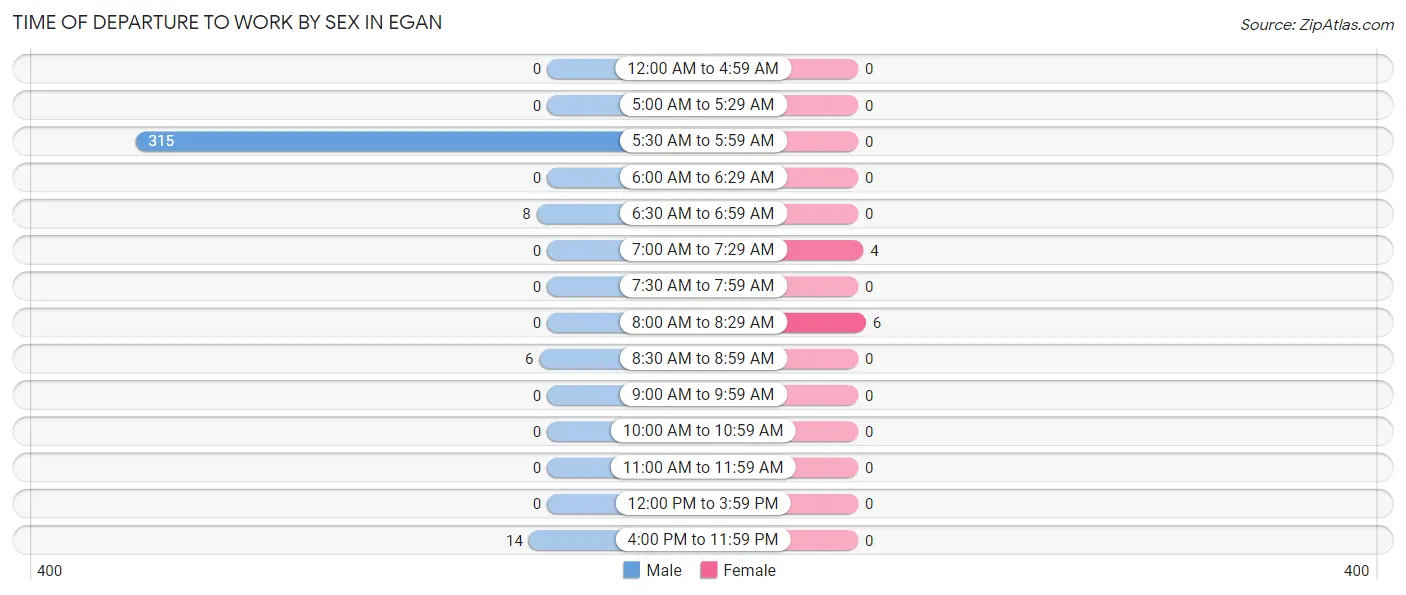
| Time of Departure | Male | Female |
| 12:00 AM to 4:59 AM | 0 (0.0%) | 0 (0.0%) |
| 5:00 AM to 5:29 AM | 0 (0.0%) | 0 (0.0%) |
| 5:30 AM to 5:59 AM | 315 (91.8%) | 0 (0.0%) |
| 6:00 AM to 6:29 AM | 0 (0.0%) | 0 (0.0%) |
| 6:30 AM to 6:59 AM | 8 (2.3%) | 0 (0.0%) |
| 7:00 AM to 7:29 AM | 0 (0.0%) | 4 (40.0%) |
| 7:30 AM to 7:59 AM | 0 (0.0%) | 0 (0.0%) |
| 8:00 AM to 8:29 AM | 0 (0.0%) | 6 (60.0%) |
| 8:30 AM to 8:59 AM | 6 (1.8%) | 0 (0.0%) |
| 9:00 AM to 9:59 AM | 0 (0.0%) | 0 (0.0%) |
| 10:00 AM to 10:59 AM | 0 (0.0%) | 0 (0.0%) |
| 11:00 AM to 11:59 AM | 0 (0.0%) | 0 (0.0%) |
| 12:00 PM to 3:59 PM | 0 (0.0%) | 0 (0.0%) |
| 4:00 PM to 11:59 PM | 14 (4.1%) | 0 (0.0%) |
| Total | 343 (100.0%) | 10 (100.0%) |
Housing Occupancy in Egan
Occupancy by Ownership in Egan
Of the total 355 dwellings in Egan, owner-occupied units account for 349 (98.3%), while renter-occupied units make up 6 (1.7%).
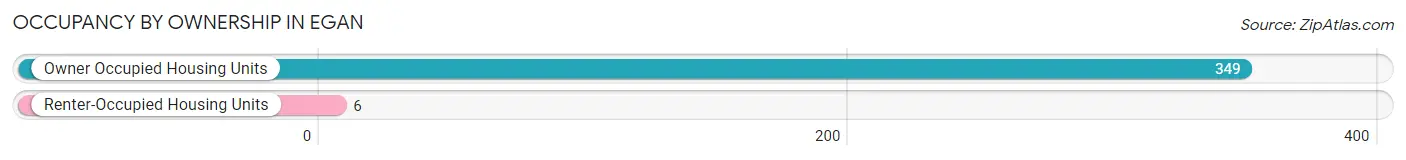
| Occupancy | # Housing Units | % Housing Units |
| Owner Occupied Housing Units | 349 | 98.3% |
| Renter-Occupied Housing Units | 6 | 1.7% |
| Total Occupied Housing Units | 355 | 100.0% |
Occupancy by Household Size in Egan
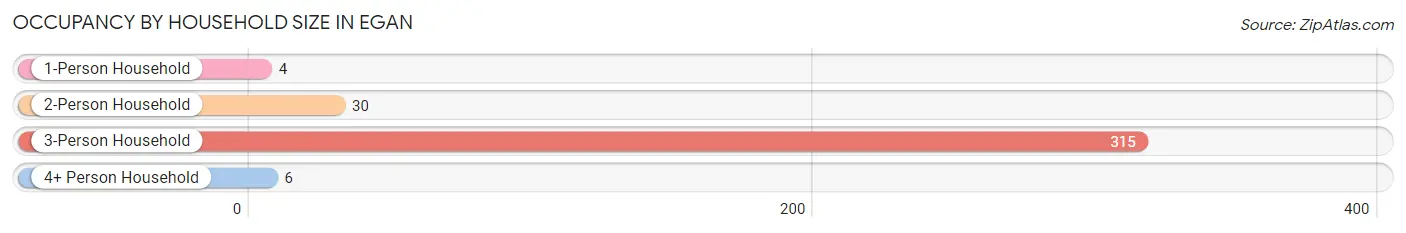
| Household Size | # Housing Units | % Housing Units |
| 1-Person Household | 4 | 1.1% |
| 2-Person Household | 30 | 8.5% |
| 3-Person Household | 315 | 88.7% |
| 4+ Person Household | 6 | 1.7% |
| Total Housing Units | 355 | 100.0% |
Occupancy by Ownership by Household Size in Egan
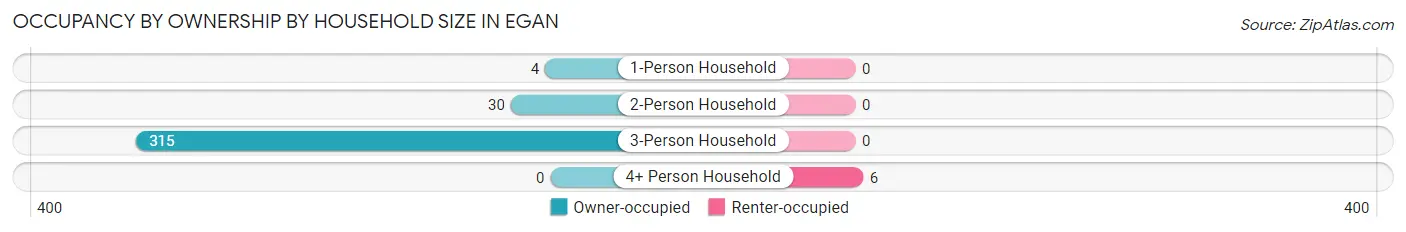
| Household Size | Owner-occupied | Renter-occupied |
| 1-Person Household | 4 (100.0%) | 0 (0.0%) |
| 2-Person Household | 30 (100.0%) | 0 (0.0%) |
| 3-Person Household | 315 (100.0%) | 0 (0.0%) |
| 4+ Person Household | 0 (0.0%) | 6 (100.0%) |
| Total Housing Units | 349 (98.3%) | 6 (1.7%) |
Occupancy by Educational Attainment in Egan
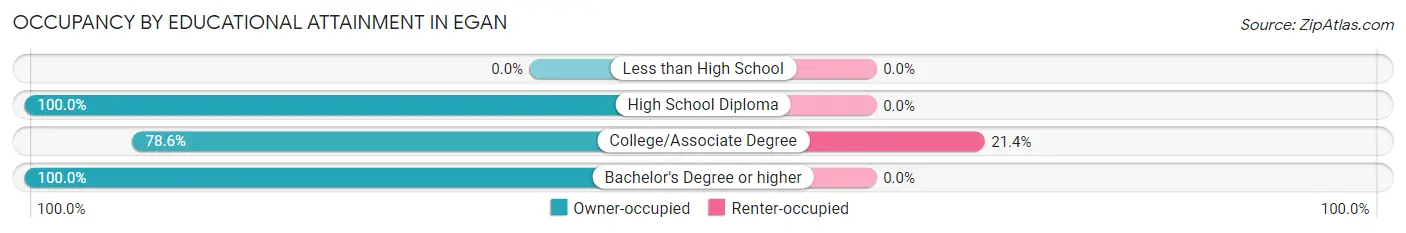
| Household Size | Owner-occupied | Renter-occupied |
| Less than High School | 0 (0.0%) | 0 (0.0%) |
| High School Diploma | 323 (100.0%) | 0 (0.0%) |
| College/Associate Degree | 22 (78.6%) | 6 (21.4%) |
| Bachelor's Degree or higher | 4 (100.0%) | 0 (0.0%) |
Occupancy by Age of Householder in Egan
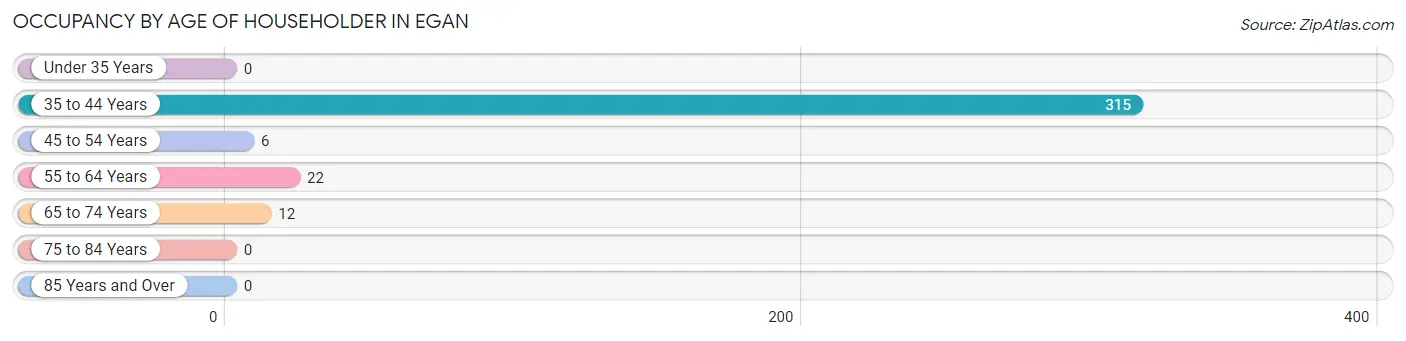
| Age Bracket | # Households | % Households |
| Under 35 Years | 0 | 0.0% |
| 35 to 44 Years | 315 | 88.7% |
| 45 to 54 Years | 6 | 1.7% |
| 55 to 64 Years | 22 | 6.2% |
| 65 to 74 Years | 12 | 3.4% |
| 75 to 84 Years | 0 | 0.0% |
| 85 Years and Over | 0 | 0.0% |
| Total | 355 | 100.0% |
Housing Finances in Egan
Median Income by Occupancy in Egan
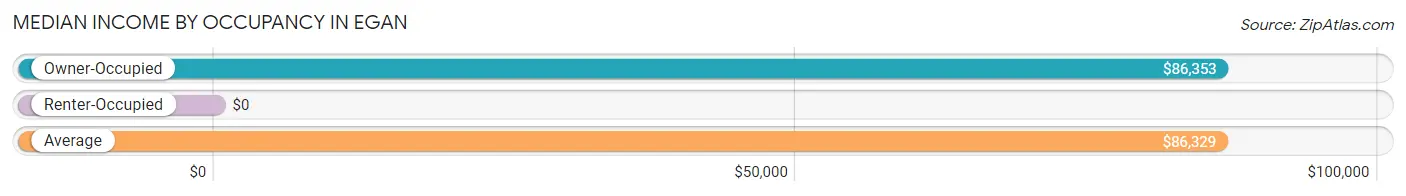
| Occupancy Type | # Households | Median Income |
| Owner-Occupied | 349 (98.3%) | $86,353 |
| Renter-Occupied | 6 (1.7%) | $0 |
| Average | 355 (100.0%) | $86,329 |
Occupancy by Householder Income Bracket in Egan
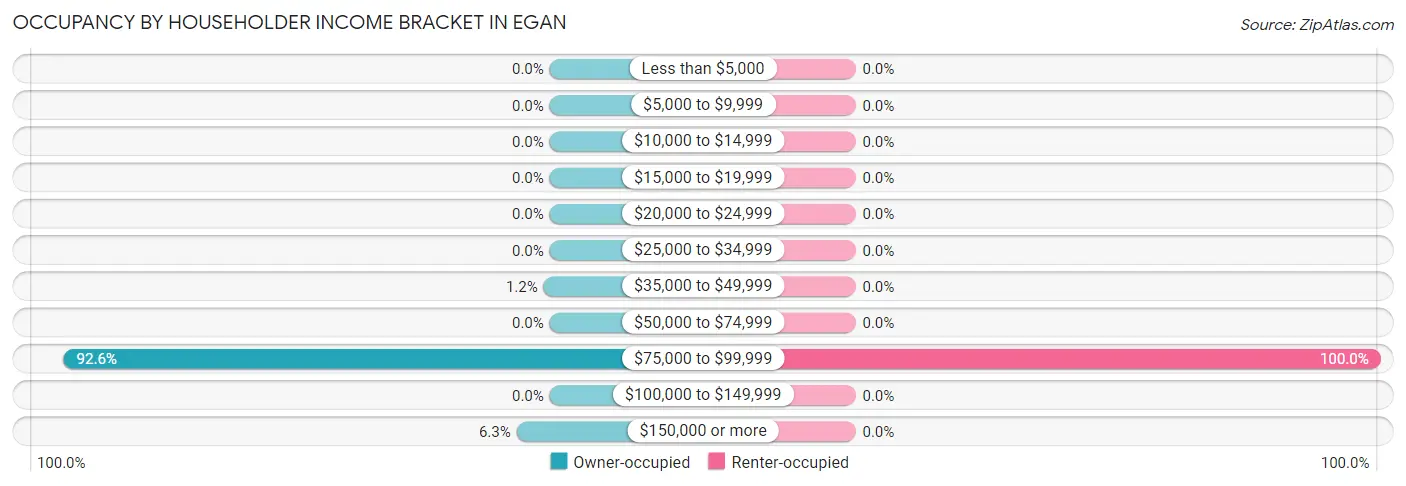
| Income Bracket | Owner-occupied | Renter-occupied |
| Less than $5,000 | 0 (0.0%) | 0 (0.0%) |
| $5,000 to $9,999 | 0 (0.0%) | 0 (0.0%) |
| $10,000 to $14,999 | 0 (0.0%) | 0 (0.0%) |
| $15,000 to $19,999 | 0 (0.0%) | 0 (0.0%) |
| $20,000 to $24,999 | 0 (0.0%) | 0 (0.0%) |
| $25,000 to $34,999 | 0 (0.0%) | 0 (0.0%) |
| $35,000 to $49,999 | 4 (1.1%) | 0 (0.0%) |
| $50,000 to $74,999 | 0 (0.0%) | 0 (0.0%) |
| $75,000 to $99,999 | 323 (92.5%) | 6 (100.0%) |
| $100,000 to $149,999 | 0 (0.0%) | 0 (0.0%) |
| $150,000 or more | 22 (6.3%) | 0 (0.0%) |
| Total | 349 (100.0%) | 6 (100.0%) |
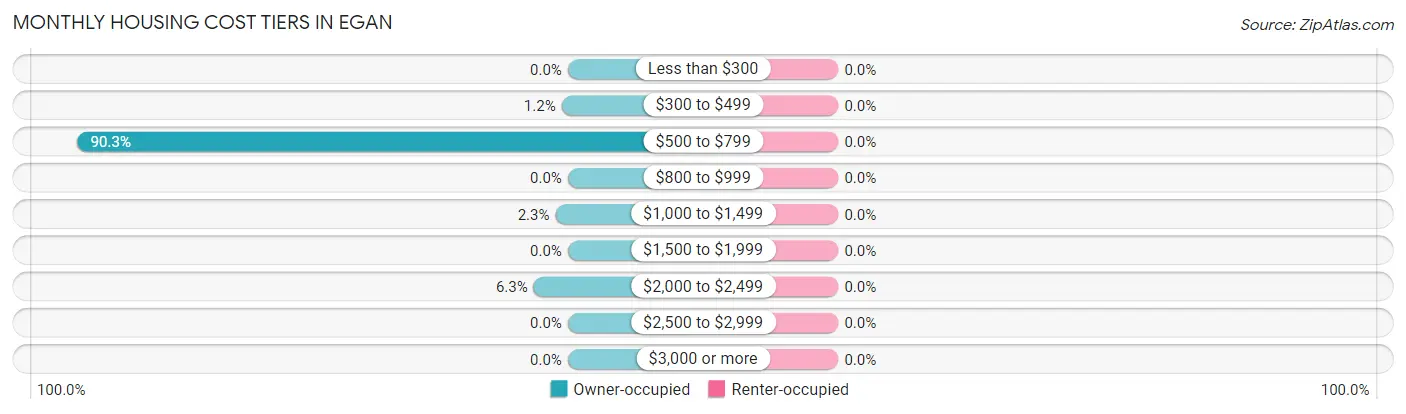
Monthly Housing Cost Tiers in Egan
| Monthly Cost | Owner-occupied | Renter-occupied |
| Less than $300 | 0 (0.0%) | 0 (0.0%) |
| $300 to $499 | 4 (1.1%) | 0 (0.0%) |
| $500 to $799 | 315 (90.3%) | 0 (0.0%) |
| $800 to $999 | 0 (0.0%) | 0 (0.0%) |
| $1,000 to $1,499 | 8 (2.3%) | 0 (0.0%) |
| $1,500 to $1,999 | 0 (0.0%) | 0 (0.0%) |
| $2,000 to $2,499 | 22 (6.3%) | 0 (0.0%) |
| $2,500 to $2,999 | 0 (0.0%) | 0 (0.0%) |
| $3,000 or more | 0 (0.0%) | 0 (0.0%) |
| Total | 349 (100.0%) | 6 (100.0%) |
Physical Housing Characteristics in Egan
Housing Structures in Egan
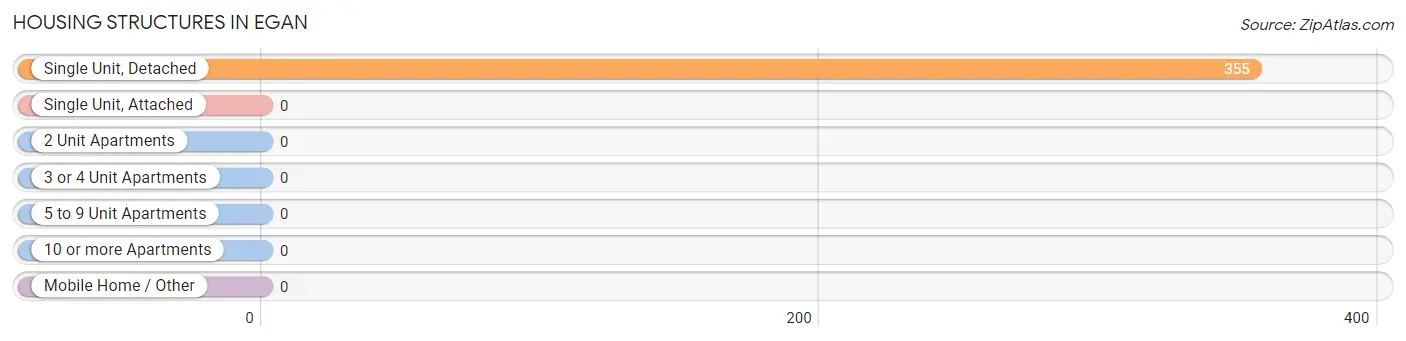
| Structure Type | # Housing Units | % Housing Units |
| Single Unit, Detached | 355 | 100.0% |
| Single Unit, Attached | 0 | 0.0% |
| 2 Unit Apartments | 0 | 0.0% |
| 3 or 4 Unit Apartments | 0 | 0.0% |
| 5 to 9 Unit Apartments | 0 | 0.0% |
| 10 or more Apartments | 0 | 0.0% |
| Mobile Home / Other | 0 | 0.0% |
| Total | 355 | 100.0% |
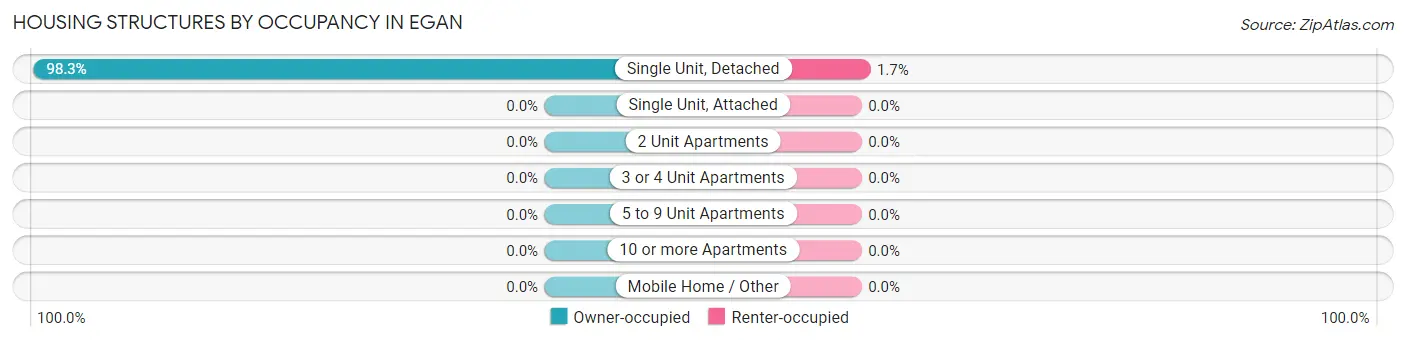
Housing Structures by Occupancy in Egan
| Structure Type | Owner-occupied | Renter-occupied |
| Single Unit, Detached | 349 (98.3%) | 6 (1.7%) |
| Single Unit, Attached | 0 (0.0%) | 0 (0.0%) |
| 2 Unit Apartments | 0 (0.0%) | 0 (0.0%) |
| 3 or 4 Unit Apartments | 0 (0.0%) | 0 (0.0%) |
| 5 to 9 Unit Apartments | 0 (0.0%) | 0 (0.0%) |
| 10 or more Apartments | 0 (0.0%) | 0 (0.0%) |
| Mobile Home / Other | 0 (0.0%) | 0 (0.0%) |
| Total | 349 (98.3%) | 6 (1.7%) |
Housing Structures by Number of Rooms in Egan
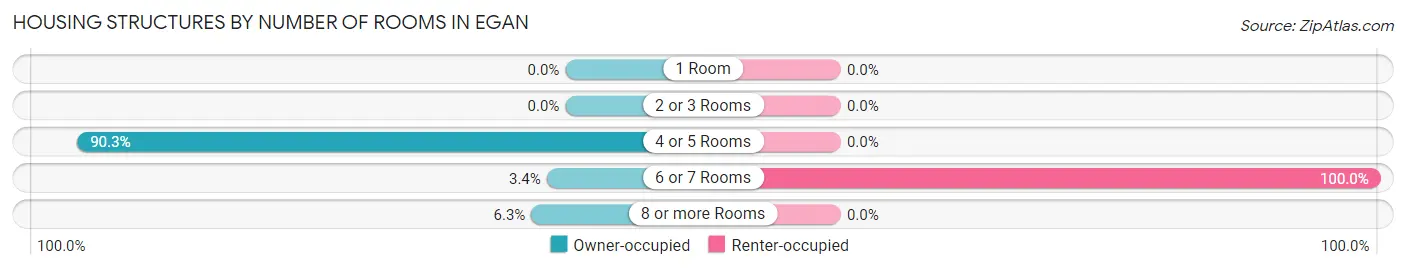
| Number of Rooms | Owner-occupied | Renter-occupied |
| 1 Room | 0 (0.0%) | 0 (0.0%) |
| 2 or 3 Rooms | 0 (0.0%) | 0 (0.0%) |
| 4 or 5 Rooms | 315 (90.3%) | 0 (0.0%) |
| 6 or 7 Rooms | 12 (3.4%) | 6 (100.0%) |
| 8 or more Rooms | 22 (6.3%) | 0 (0.0%) |
| Total | 349 (100.0%) | 6 (100.0%) |
Housing Structure by Heating Type in Egan
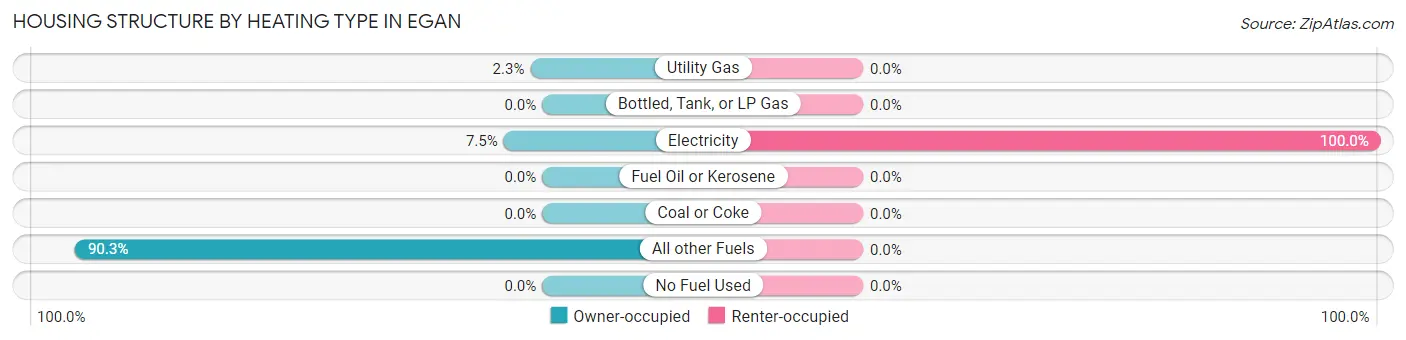
| Heating Type | Owner-occupied | Renter-occupied |
| Utility Gas | 8 (2.3%) | 0 (0.0%) |
| Bottled, Tank, or LP Gas | 0 (0.0%) | 0 (0.0%) |
| Electricity | 26 (7.4%) | 6 (100.0%) |
| Fuel Oil or Kerosene | 0 (0.0%) | 0 (0.0%) |
| Coal or Coke | 0 (0.0%) | 0 (0.0%) |
| All other Fuels | 315 (90.3%) | 0 (0.0%) |
| No Fuel Used | 0 (0.0%) | 0 (0.0%) |
| Total | 349 (100.0%) | 6 (100.0%) |
Household Vehicle Usage in Egan
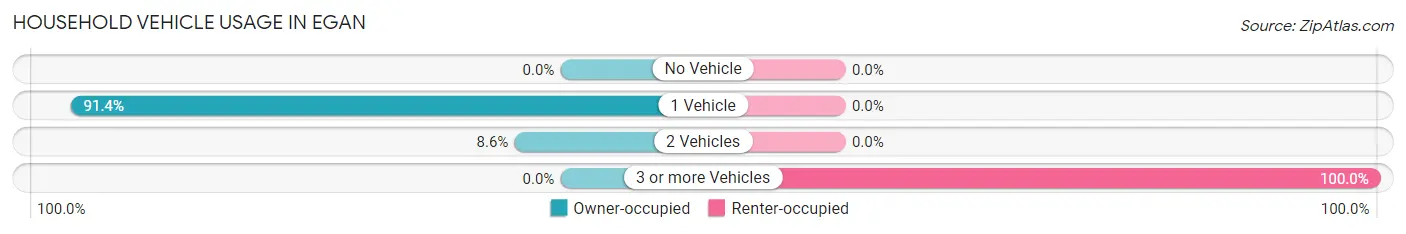
| Vehicles per Household | Owner-occupied | Renter-occupied |
| No Vehicle | 0 (0.0%) | 0 (0.0%) |
| 1 Vehicle | 319 (91.4%) | 0 (0.0%) |
| 2 Vehicles | 30 (8.6%) | 0 (0.0%) |
| 3 or more Vehicles | 0 (0.0%) | 6 (100.0%) |
| Total | 349 (100.0%) | 6 (100.0%) |
Real Estate & Mortgages in Egan
Real Estate and Mortgage Overview in Egan
| Characteristic | Without Mortgage | With Mortgage |
| Housing Units | 12 | 337 |
| Median Property Value | - | - |
| Median Household Income | - | - |
| Monthly Housing Costs | - | - |
| Real Estate Taxes | - | - |
Property Value by Mortgage Status in Egan
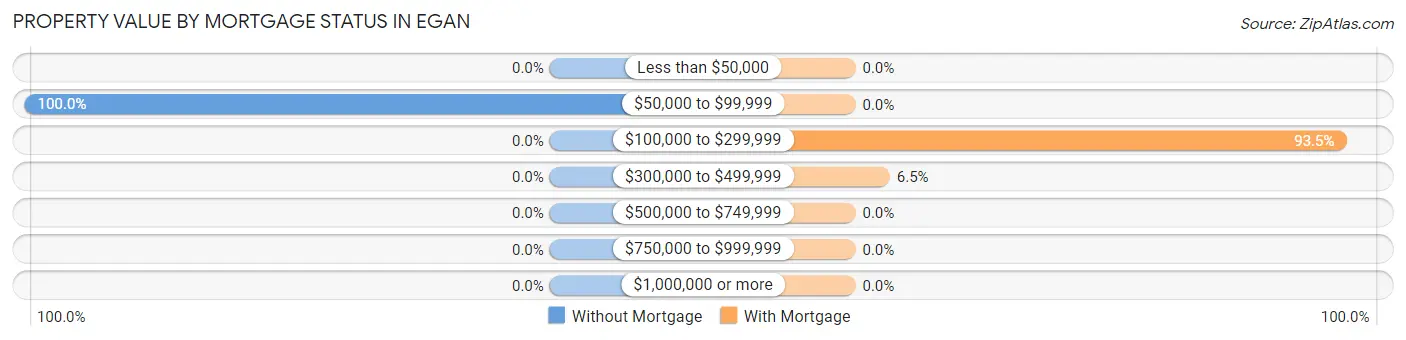
| Property Value | Without Mortgage | With Mortgage |
| Less than $50,000 | 0 (0.0%) | 0 (0.0%) |
| $50,000 to $99,999 | 12 (100.0%) | 0 (0.0%) |
| $100,000 to $299,999 | 0 (0.0%) | 315 (93.5%) |
| $300,000 to $499,999 | 0 (0.0%) | 22 (6.5%) |
| $500,000 to $749,999 | 0 (0.0%) | 0 (0.0%) |
| $750,000 to $999,999 | 0 (0.0%) | 0 (0.0%) |
| $1,000,000 or more | 0 (0.0%) | 0 (0.0%) |
| Total | 12 (100.0%) | 337 (100.0%) |
Household Income by Mortgage Status in Egan
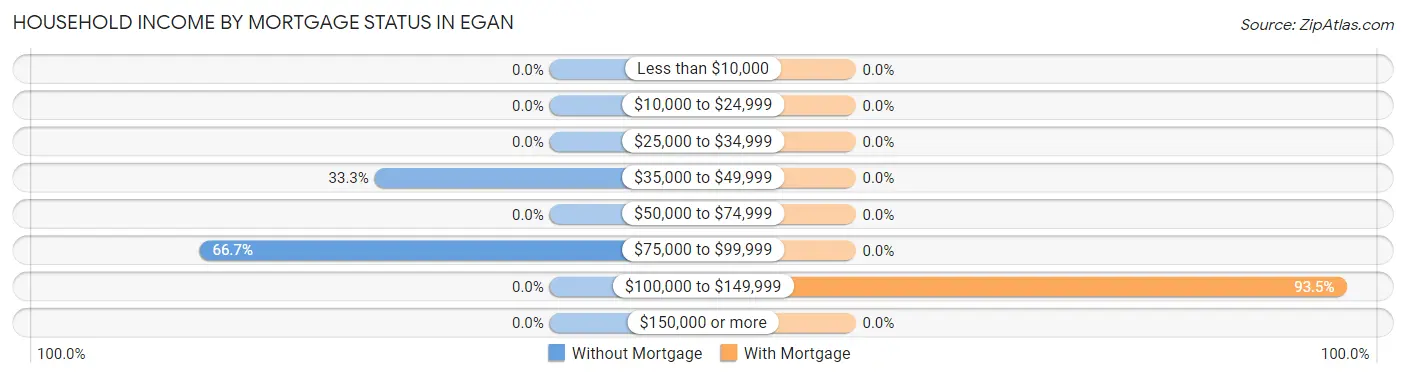
| Household Income | Without Mortgage | With Mortgage |
| Less than $10,000 | 0 (0.0%) | 0 (0.0%) |
| $10,000 to $24,999 | 0 (0.0%) | 0 (0.0%) |
| $25,000 to $34,999 | 0 (0.0%) | 0 (0.0%) |
| $35,000 to $49,999 | 4 (33.3%) | 0 (0.0%) |
| $50,000 to $74,999 | 0 (0.0%) | 0 (0.0%) |
| $75,000 to $99,999 | 8 (66.7%) | 0 (0.0%) |
| $100,000 to $149,999 | 0 (0.0%) | 315 (93.5%) |
| $150,000 or more | 0 (0.0%) | 0 (0.0%) |
| Total | 12 (100.0%) | 337 (100.0%) |
Property Value to Household Income Ratio in Egan
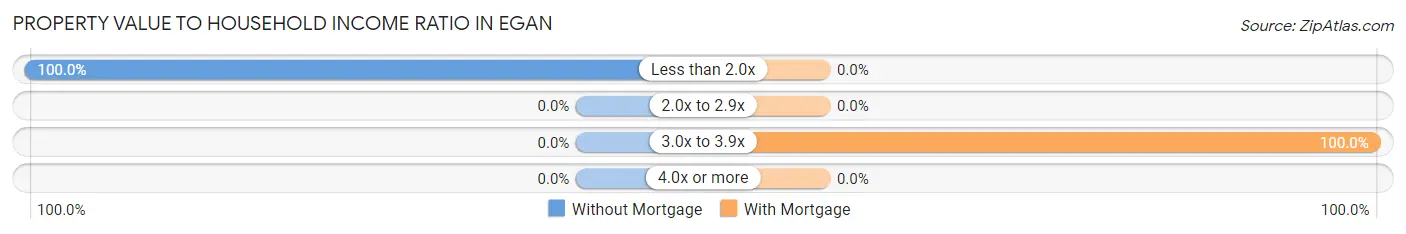
| Value-to-Income Ratio | Without Mortgage | With Mortgage |
| Less than 2.0x | 12 (100.0%) | 0 (0.0%) |
| 2.0x to 2.9x | 0 (0.0%) | 0 (0.0%) |
| 3.0x to 3.9x | 0 (0.0%) | 337 (100.0%) |
| 4.0x or more | 0 (0.0%) | 0 (0.0%) |
| Total | 12 (100.0%) | 337 (100.0%) |
Real Estate Taxes by Mortgage Status in Egan
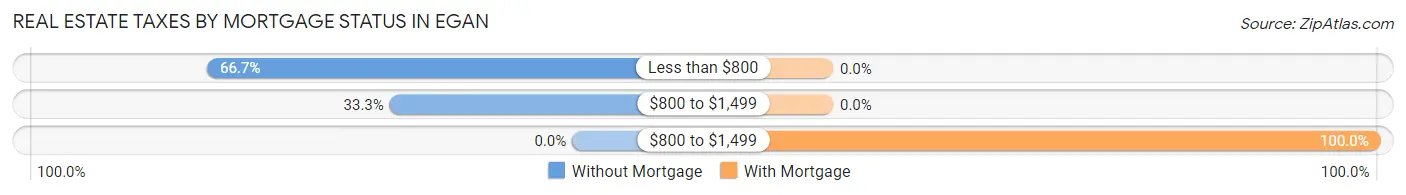
| Property Taxes | Without Mortgage | With Mortgage |
| Less than $800 | 8 (66.7%) | 0 (0.0%) |
| $800 to $1,499 | 4 (33.3%) | 0 (0.0%) |
| $800 to $1,499 | 0 (0.0%) | 337 (100.0%) |
| Total | 12 (100.0%) | 337 (100.0%) |
Health & Disability in Egan
Health Insurance Coverage by Age in Egan
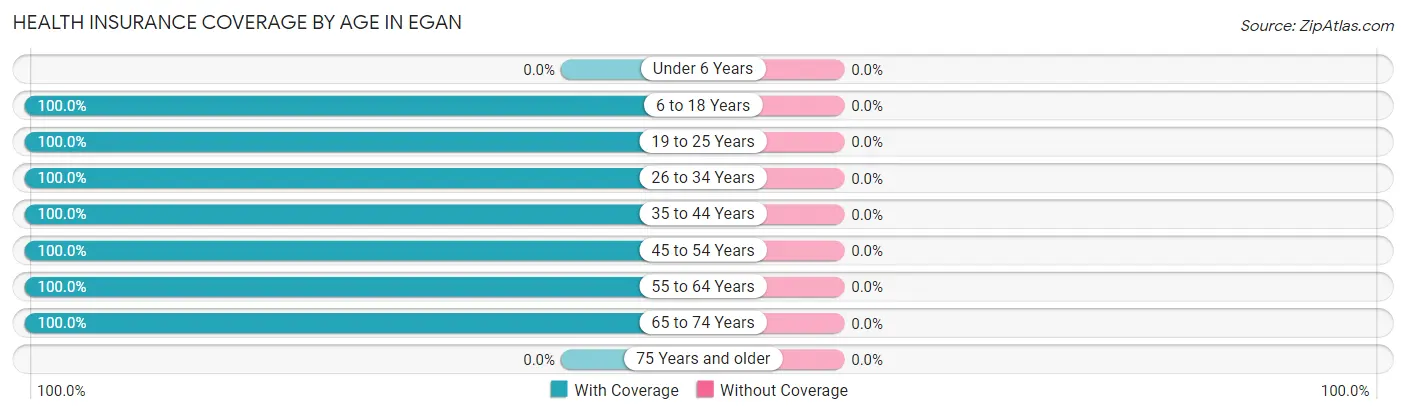
| Age Bracket | With Coverage | Without Coverage |
| Under 6 Years | 0 (0.0%) | 0 (0.0%) |
| 6 to 18 Years | 212 (100.0%) | 0 (0.0%) |
| 19 to 25 Years | 12 (100.0%) | 0 (0.0%) |
| 26 to 34 Years | 14 (100.0%) | 0 (0.0%) |
| 35 to 44 Years | 529 (100.0%) | 0 (0.0%) |
| 45 to 54 Years | 9 (100.0%) | 0 (0.0%) |
| 55 to 64 Years | 45 (100.0%) | 0 (0.0%) |
| 65 to 74 Years | 12 (100.0%) | 0 (0.0%) |
| 75 Years and older | 0 (0.0%) | 0 (0.0%) |
| Total | 833 (100.0%) | 0 (0.0%) |
Health Insurance Coverage by Citizenship Status in Egan
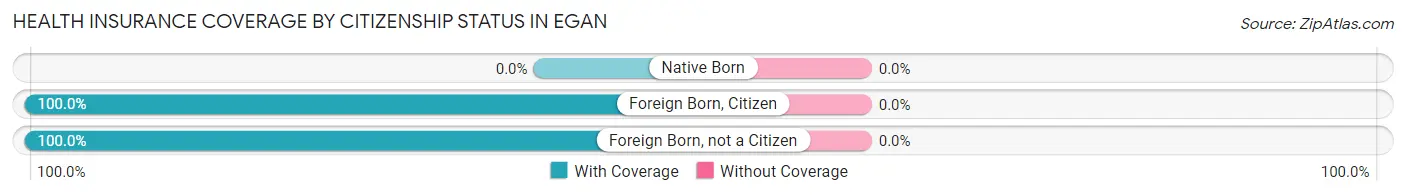
| Citizenship Status | With Coverage | Without Coverage |
| Native Born | 0 (0.0%) | 0 (0.0%) |
| Foreign Born, Citizen | 212 (100.0%) | 0 (0.0%) |
| Foreign Born, not a Citizen | 12 (100.0%) | 0 (0.0%) |
Health Insurance Coverage by Household Income in Egan
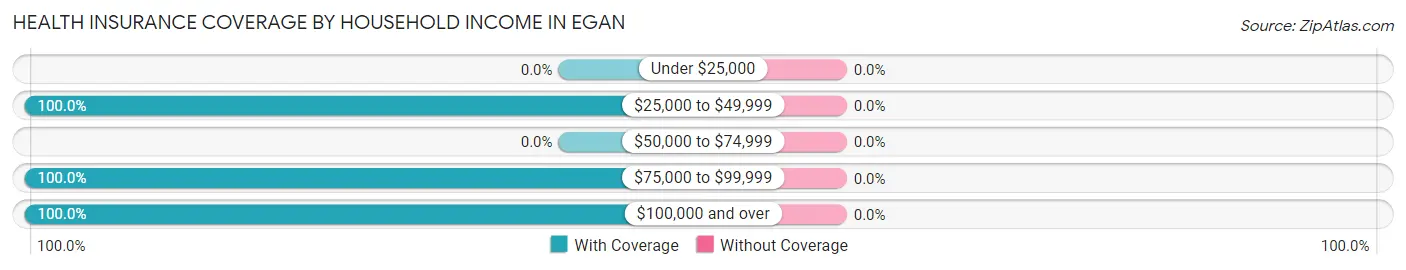
| Household Income | With Coverage | Without Coverage |
| Under $25,000 | 0 (0.0%) | 0 (0.0%) |
| $25,000 to $49,999 | 4 (100.0%) | 0 (0.0%) |
| $50,000 to $74,999 | 0 (0.0%) | 0 (0.0%) |
| $75,000 to $99,999 | 784 (100.0%) | 0 (0.0%) |
| $100,000 and over | 45 (100.0%) | 0 (0.0%) |
Public vs Private Health Insurance Coverage by Age in Egan
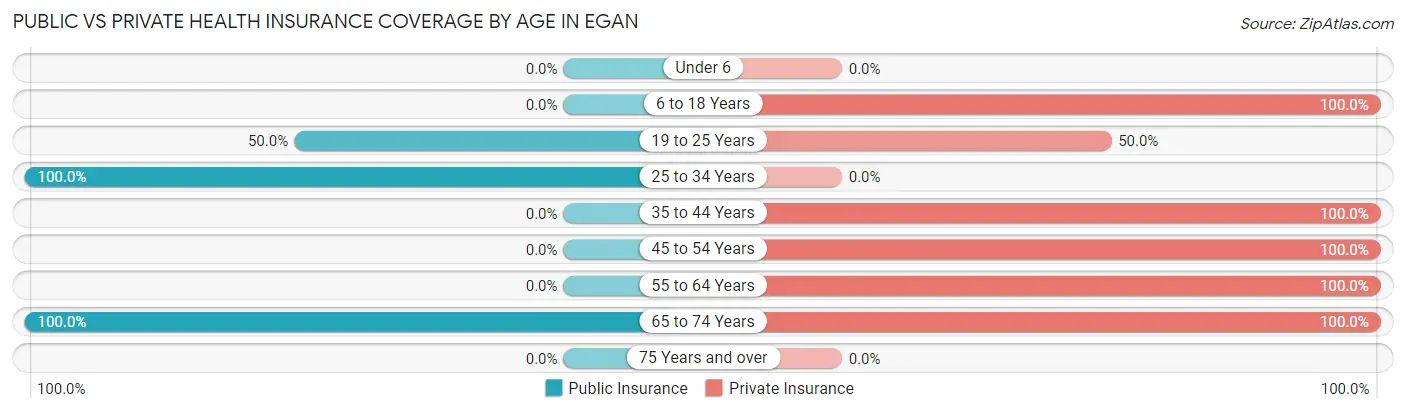
| Age Bracket | Public Insurance | Private Insurance |
| Under 6 | 0 (0.0%) | 0 (0.0%) |
| 6 to 18 Years | 0 (0.0%) | 212 (100.0%) |
| 19 to 25 Years | 6 (50.0%) | 6 (50.0%) |
| 25 to 34 Years | 14 (100.0%) | 0 (0.0%) |
| 35 to 44 Years | 0 (0.0%) | 529 (100.0%) |
| 45 to 54 Years | 0 (0.0%) | 9 (100.0%) |
| 55 to 64 Years | 0 (0.0%) | 45 (100.0%) |
| 65 to 74 Years | 12 (100.0%) | 12 (100.0%) |
| 75 Years and over | 0 (0.0%) | 0 (0.0%) |
| Total | 32 (3.8%) | 813 (97.6%) |
Disability Status by Sex by Age in Egan
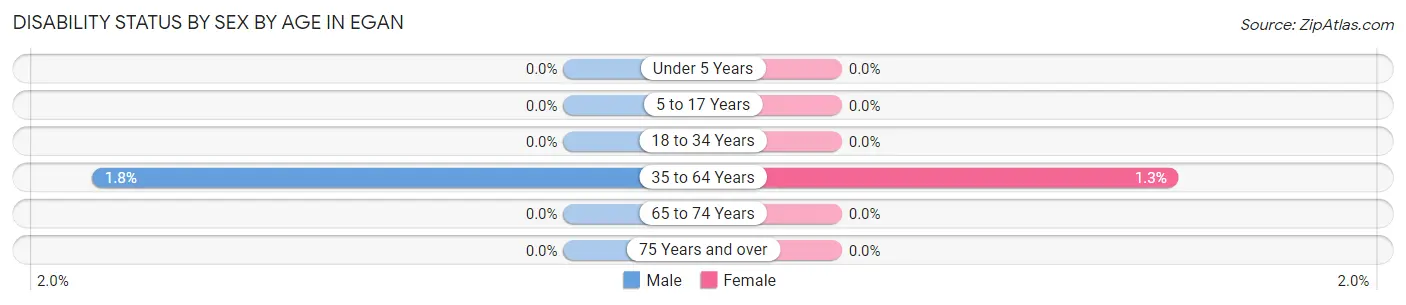
| Age Bracket | Male | Female |
| Under 5 Years | 0 (0.0%) | 0 (0.0%) |
| 5 to 17 Years | 0 (0.0%) | 0 (0.0%) |
| 18 to 34 Years | 0 (0.0%) | 0 (0.0%) |
| 35 to 64 Years | 6 (1.8%) | 3 (1.3%) |
| 65 to 74 Years | 0 (0.0%) | 0 (0.0%) |
| 75 Years and over | 0 (0.0%) | 0 (0.0%) |
Disability Class by Sex by Age in Egan
Disability Class: Hearing Difficulty
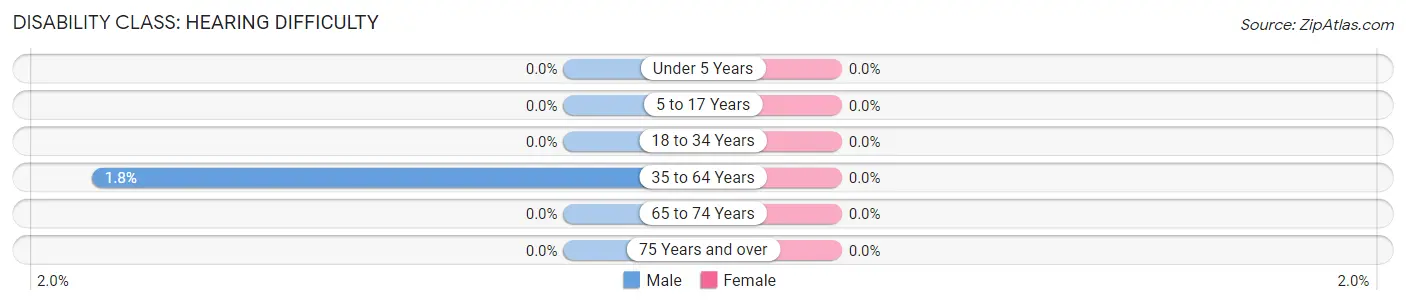
| Age Bracket | Male | Female |
| Under 5 Years | 0 (0.0%) | 0 (0.0%) |
| 5 to 17 Years | 0 (0.0%) | 0 (0.0%) |
| 18 to 34 Years | 0 (0.0%) | 0 (0.0%) |
| 35 to 64 Years | 6 (1.8%) | 0 (0.0%) |
| 65 to 74 Years | 0 (0.0%) | 0 (0.0%) |
| 75 Years and over | 0 (0.0%) | 0 (0.0%) |
Disability Class: Vision Difficulty
| Age Bracket | Male | Female |
| Under 5 Years | 0 (0.0%) | 0 (0.0%) |
| 5 to 17 Years | 0 (0.0%) | 0 (0.0%) |
| 18 to 34 Years | 0 (0.0%) | 0 (0.0%) |
| 35 to 64 Years | 0 (0.0%) | 0 (0.0%) |
| 65 to 74 Years | 0 (0.0%) | 0 (0.0%) |
| 75 Years and over | 0 (0.0%) | 0 (0.0%) |
Disability Class: Cognitive Difficulty
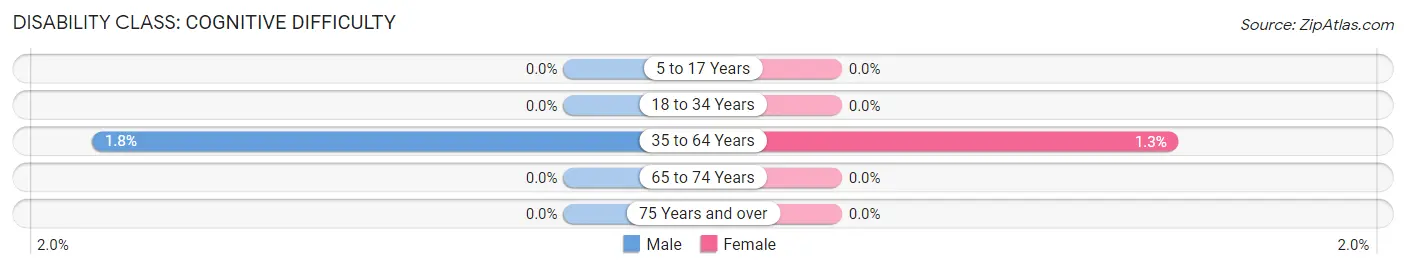
| Age Bracket | Male | Female |
| 5 to 17 Years | 0 (0.0%) | 0 (0.0%) |
| 18 to 34 Years | 0 (0.0%) | 0 (0.0%) |
| 35 to 64 Years | 6 (1.8%) | 3 (1.3%) |
| 65 to 74 Years | 0 (0.0%) | 0 (0.0%) |
| 75 Years and over | 0 (0.0%) | 0 (0.0%) |
Disability Class: Ambulatory Difficulty
| Age Bracket | Male | Female |
| 5 to 17 Years | 0 (0.0%) | 0 (0.0%) |
| 18 to 34 Years | 0 (0.0%) | 0 (0.0%) |
| 35 to 64 Years | 0 (0.0%) | 0 (0.0%) |
| 65 to 74 Years | 0 (0.0%) | 0 (0.0%) |
| 75 Years and over | 0 (0.0%) | 0 (0.0%) |
Disability Class: Self-Care Difficulty
| Age Bracket | Male | Female |
| 5 to 17 Years | 0 (0.0%) | 0 (0.0%) |
| 18 to 34 Years | 0 (0.0%) | 0 (0.0%) |
| 35 to 64 Years | 0 (0.0%) | 0 (0.0%) |
| 65 to 74 Years | 0 (0.0%) | 0 (0.0%) |
| 75 Years and over | 0 (0.0%) | 0 (0.0%) |
Technology Access in Egan
Computing Device Access in Egan
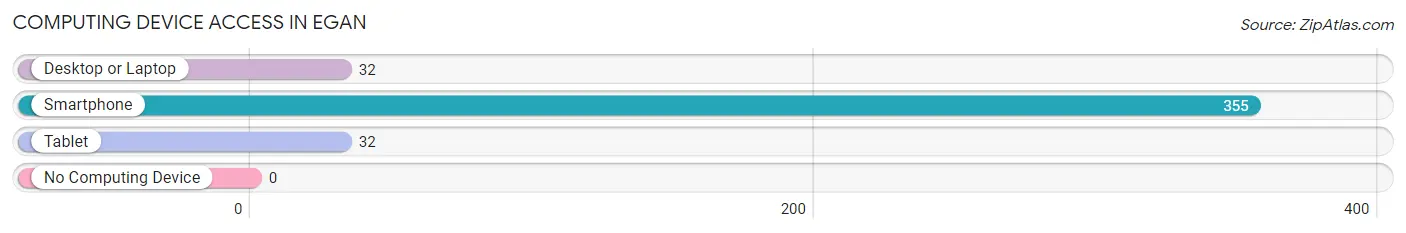
| Device Type | # Households | % Households |
| Desktop or Laptop | 32 | 9.0% |
| Smartphone | 355 | 100.0% |
| Tablet | 32 | 9.0% |
| No Computing Device | 0 | 0.0% |
| Total | 355 | 100.0% |
Internet Access in Egan
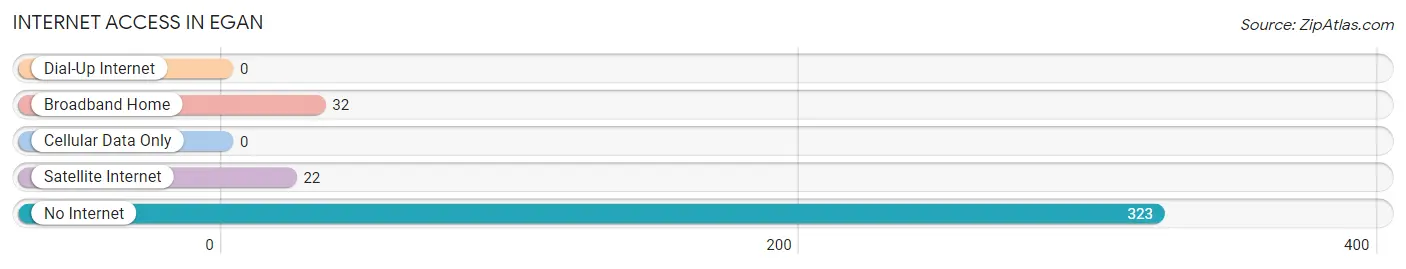
| Internet Type | # Households | % Households |
| Dial-Up Internet | 0 | 0.0% |
| Broadband Home | 32 | 9.0% |
| Cellular Data Only | 0 | 0.0% |
| Satellite Internet | 22 | 6.2% |
| No Internet | 323 | 91.0% |
| Total | 355 | 100.0% |
Egan Summary
Egan is a small town located in the state of Louisiana, in the United States. It is situated in the parish of Iberia, and is part of the New Iberia Metropolitan Statistical Area. The town has a population of approximately 1,000 people, and is located about 30 miles south of Lafayette.
History
Egan was founded in 1883 by a group of French settlers who had come to the area from Canada. The town was named after the Egan family, who were among the first settlers. The town was originally a farming community, and the main crops grown were cotton, corn, and sugar cane. In the early 1900s, the town began to grow and develop, and by the 1920s, it had become a thriving community.
In the 1950s, the town began to experience a decline in population, as many of the residents moved away to larger cities. However, in the late 1970s, the town began to experience a resurgence in population, as many people moved back to the area. Today, Egan is a small, but vibrant community, with a population of around 1,000 people.
Geography
Egan is located in the southeastern part of the state of Louisiana, in the parish of Iberia. The town is situated on the banks of the Bayou Teche, and is surrounded by a number of small towns and villages. The town is located about 30 miles south of Lafayette, and is part of the New Iberia Metropolitan Statistical Area.
The climate in Egan is humid subtropical, with hot, humid summers and mild winters. The average annual temperature is around 70 degrees Fahrenheit, and the average annual precipitation is around 50 inches.
Economy
The economy of Egan is largely based on agriculture, with the main crops being cotton, corn, and sugar cane. The town also has a number of small businesses, including restaurants, retail stores, and service providers. In recent years, the town has seen an increase in tourism, as more people visit the area to take advantage of the town’s natural beauty and outdoor activities.
Demographics
As of the 2010 census, the population of Egan was 1,000 people. The racial makeup of the town was 79.2% White, 17.2% African American, 0.7% Native American, 0.3% Asian, and 2.6% from other races. The median household income was $31,250, and the median family income was $37,500. The per capita income was $15,000.
Egan is a small, but vibrant community, with a rich history and a bright future. The town has a diverse population, and a strong economy based on agriculture and tourism. The town is a great place to live, work, and raise a family, and is a great example of the beauty and charm of small-town Louisiana.
Common Questions
What is Per Capita Income in Egan?
Per Capita income in Egan is $39,691.
What is the Median Family Income in Egan?
Median Family Income in Egan is $86,345.
What is the Median Household income in Egan?
Median Household Income in Egan is $86,329.
What is Inequality or Gini Index in Egan?
Inequality or Gini Index in Egan is 0.06.
What is the Total Population of Egan?
Total Population of Egan is 833.
What is the Total Male Population of Egan?
Total Male Population of Egan is 365.
What is the Total Female Population of Egan?
Total Female Population of Egan is 468.
What is the Ratio of Males per 100 Females in Egan?
There are 77.99 Males per 100 Females in Egan.
What is the Ratio of Females per 100 Males in Egan?
There are 128.22 Females per 100 Males in Egan.
What is the Median Population Age in Egan?
Median Population Age in Egan is 36.3 Years.
What is the Average Family Size in Egan
Average Family Size in Egan is 2.4 People.
What is the Average Household Size in Egan
Average Household Size in Egan is 2.4 People.
How Large is the Labor Force in Egan?
There are 384 People in the Labor Forcein in Egan.
What is the Percentage of People in the Labor Force in Egan?
61.8% of People are in the Labor Force in Egan.
What is the Unemployment Rate in Egan?
Unemployment Rate in Egan is 8.1%.