Dulac, LA Map & Demographics
Dulac Map
Dulac Overview
$17,216
PER CAPITA INCOME
$35,754
AVG FAMILY INCOME
$33,750
AVG HOUSEHOLD INCOME
69.4%
WAGE / INCOME GAP [ % ]
30.6¢/ $1
WAGE / INCOME GAP [ $ ]
$4,547
FAMILY INCOME DEFICIT
0.38
INEQUALITY / GINI INDEX
844
TOTAL POPULATION
528
MALE POPULATION
316
FEMALE POPULATION
167.09
MALES / 100 FEMALES
59.85
FEMALES / 100 MALES
45.1
MEDIAN AGE
2.8
AVG FAMILY SIZE
2.4
AVG HOUSEHOLD SIZE
327
LABOR FORCE [ PEOPLE ]
45.4%
PERCENT IN LABOR FORCE
19.6%
UNEMPLOYMENT RATE
Dulac Zip Codes
Dulac Area Codes
Income in Dulac
Income Overview in Dulac
Per Capita Income in Dulac is $17,216, while median incomes of families and households are $35,754 and $33,750 respectively.
| Characteristic | Number | Measure |
| Per Capita Income | 844 | $17,216 |
| Median Family Income | 229 | $35,754 |
| Mean Family Income | 229 | $43,255 |
| Median Household Income | 346 | $33,750 |
| Mean Household Income | 346 | $39,516 |
| Income Deficit | 229 | $4,547 |
| Wage / Income Gap (%) | 844 | 69.43% |
| Wage / Income Gap ($) | 844 | 30.57¢ per $1 |
| Gini / Inequality Index | 844 | 0.38 |
Earnings by Sex in Dulac
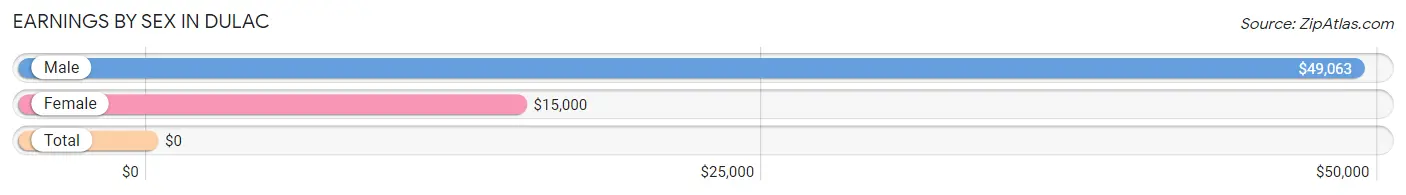
| Sex | Number | Average Earnings |
| Male | 199 (75.7%) | $49,063 |
| Female | 64 (24.3%) | $15,000 |
| Total | 263 (100.0%) | $0 |
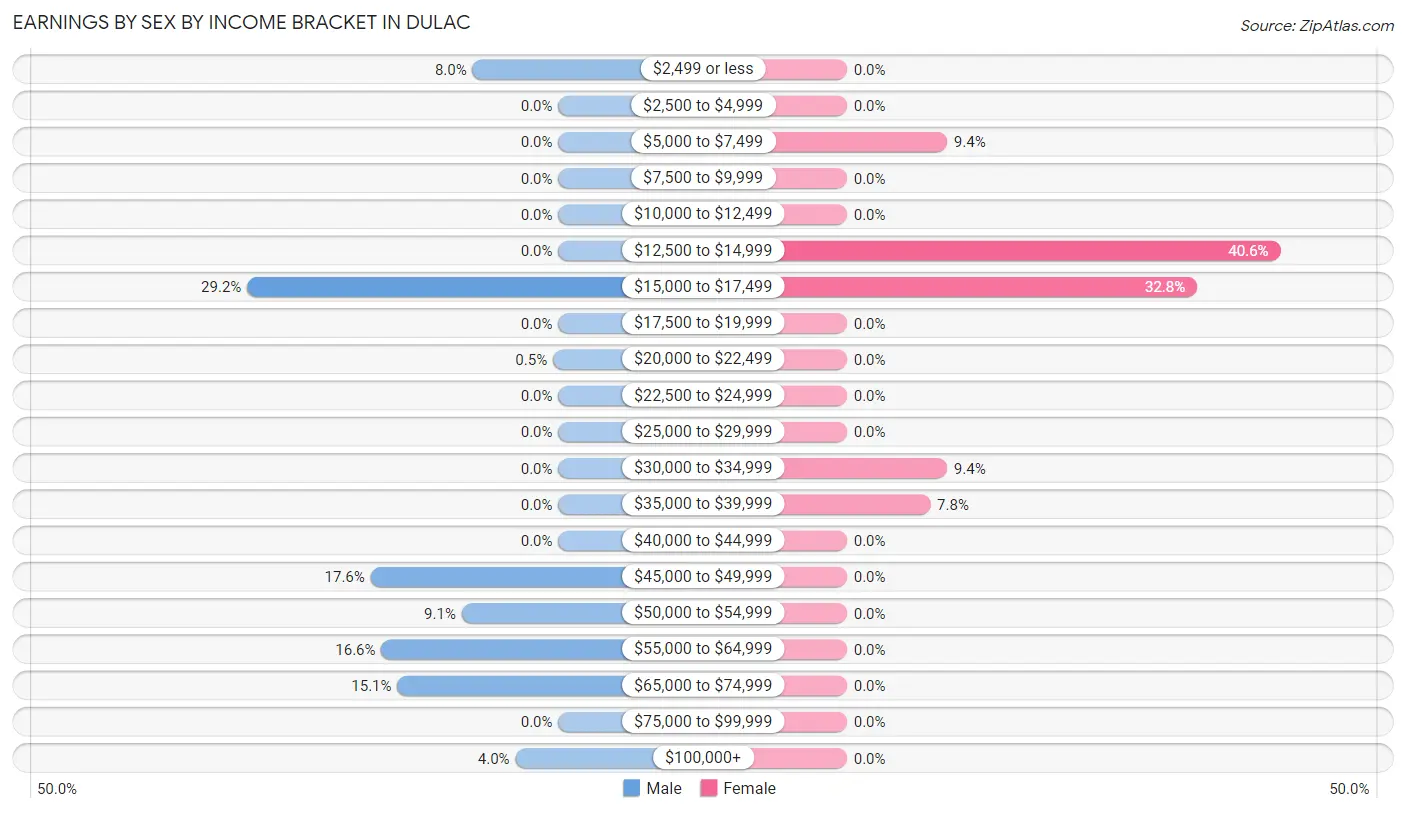
Earnings by Sex by Income Bracket in Dulac
The most common earnings brackets in Dulac are $15,000 to $17,499 for men (58 | 29.1%) and $12,500 to $14,999 for women (26 | 40.6%).
| Income | Male | Female |
| $2,499 or less | 16 (8.0%) | 0 (0.0%) |
| $2,500 to $4,999 | 0 (0.0%) | 0 (0.0%) |
| $5,000 to $7,499 | 0 (0.0%) | 6 (9.4%) |
| $7,500 to $9,999 | 0 (0.0%) | 0 (0.0%) |
| $10,000 to $12,499 | 0 (0.0%) | 0 (0.0%) |
| $12,500 to $14,999 | 0 (0.0%) | 26 (40.6%) |
| $15,000 to $17,499 | 58 (29.1%) | 21 (32.8%) |
| $17,500 to $19,999 | 0 (0.0%) | 0 (0.0%) |
| $20,000 to $22,499 | 1 (0.5%) | 0 (0.0%) |
| $22,500 to $24,999 | 0 (0.0%) | 0 (0.0%) |
| $25,000 to $29,999 | 0 (0.0%) | 0 (0.0%) |
| $30,000 to $34,999 | 0 (0.0%) | 6 (9.4%) |
| $35,000 to $39,999 | 0 (0.0%) | 5 (7.8%) |
| $40,000 to $44,999 | 0 (0.0%) | 0 (0.0%) |
| $45,000 to $49,999 | 35 (17.6%) | 0 (0.0%) |
| $50,000 to $54,999 | 18 (9.0%) | 0 (0.0%) |
| $55,000 to $64,999 | 33 (16.6%) | 0 (0.0%) |
| $65,000 to $74,999 | 30 (15.1%) | 0 (0.0%) |
| $75,000 to $99,999 | 0 (0.0%) | 0 (0.0%) |
| $100,000+ | 8 (4.0%) | 0 (0.0%) |
| Total | 199 (100.0%) | 64 (100.0%) |
Earnings by Sex by Educational Attainment in Dulac
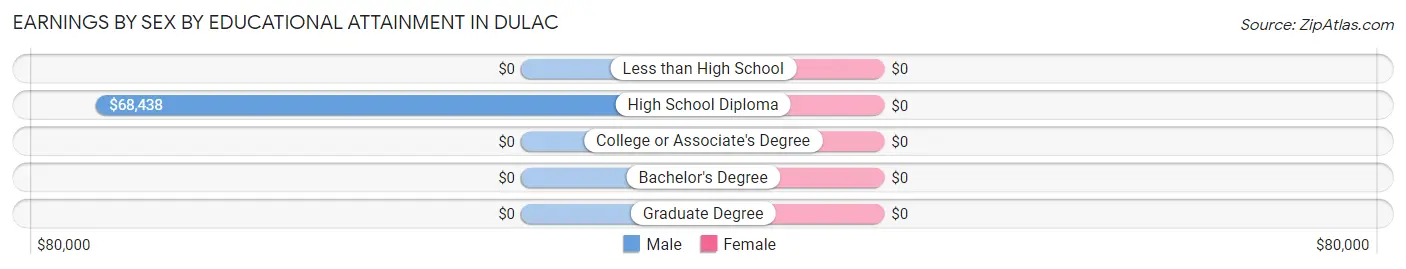
| Educational Attainment | Male Income | Female Income |
| Less than High School | - | - |
| High School Diploma | $68,438 | $0 |
| College or Associate's Degree | - | - |
| Bachelor's Degree | - | - |
| Graduate Degree | - | - |
| Total | $49,063 | $15,147 |
Family Income in Dulac
Family Income Brackets in Dulac
According to the Dulac family income data, there are 69 families falling into the $15,000 to $24,999 income range, which is the most common income bracket and makes up 30.1% of all families.
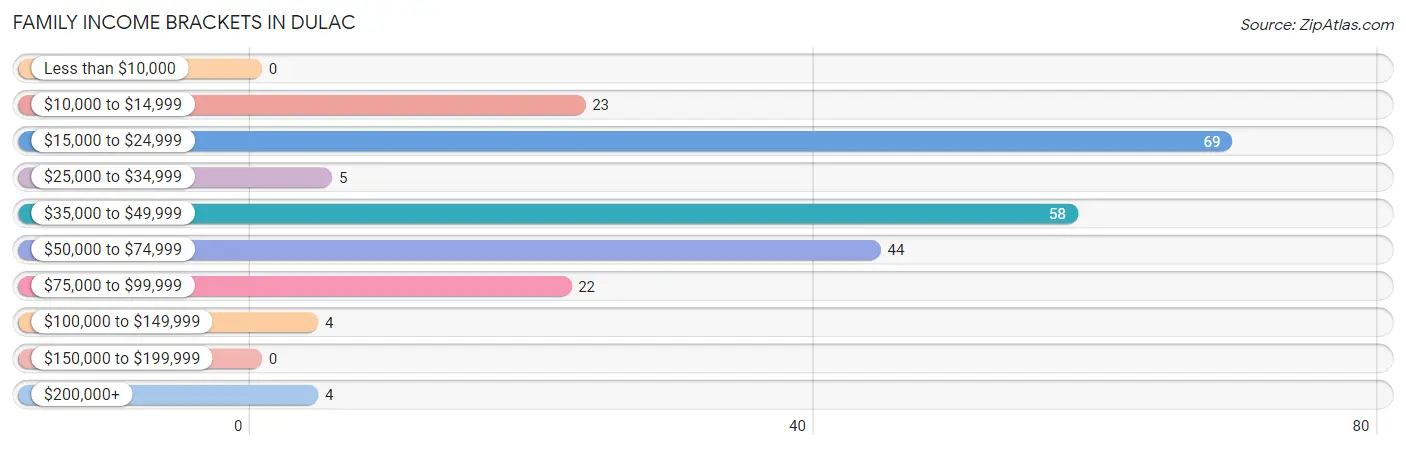
| Income Bracket | # Families | % Families |
| Less than $10,000 | 0 | 0.0% |
| $10,000 to $14,999 | 23 | 10.0% |
| $15,000 to $24,999 | 69 | 30.1% |
| $25,000 to $34,999 | 5 | 2.2% |
| $35,000 to $49,999 | 58 | 25.3% |
| $50,000 to $74,999 | 44 | 19.2% |
| $75,000 to $99,999 | 22 | 9.6% |
| $100,000 to $149,999 | 4 | 1.7% |
| $150,000 to $199,999 | 0 | 0.0% |
| $200,000+ | 4 | 1.7% |
Family Income by Famaliy Size in Dulac
2-person families (109 | 47.6%) account for the highest median family income in Dulac with $36,142 per family, while 2-person families (109 | 47.6%) have the highest median income of $18,071 per family member.
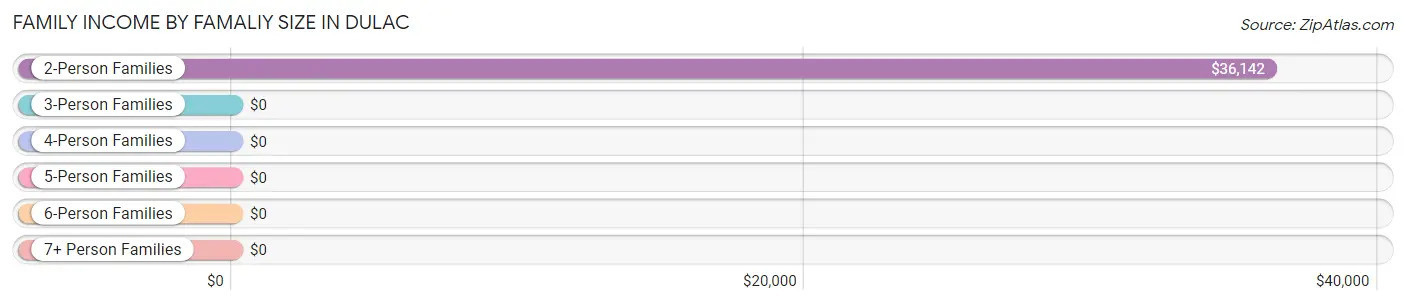
| Income Bracket | # Families | Median Income |
| 2-Person Families | 109 (47.6%) | $36,142 |
| 3-Person Families | 92 (40.2%) | $0 |
| 4-Person Families | 18 (7.9%) | $0 |
| 5-Person Families | 10 (4.4%) | $0 |
| 6-Person Families | 0 (0.0%) | $0 |
| 7+ Person Families | 0 (0.0%) | $0 |
| Total | 229 (100.0%) | $35,754 |
Family Income by Number of Earners in Dulac
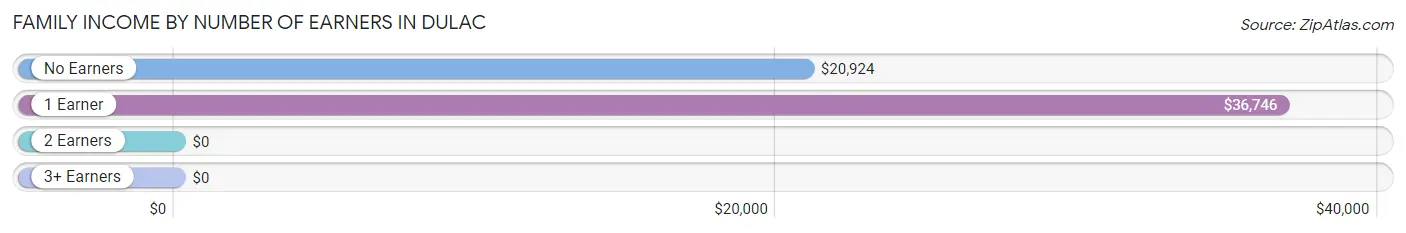
| Number of Earners | # Families | Median Income |
| No Earners | 97 (42.4%) | $20,924 |
| 1 Earner | 81 (35.4%) | $36,746 |
| 2 Earners | 34 (14.8%) | $0 |
| 3+ Earners | 17 (7.4%) | $0 |
| Total | 229 (100.0%) | $35,754 |
Household Income in Dulac
Household Income Brackets in Dulac
With 119 households falling in the category, the $15,000 to $24,999 income range is the most frequent in Dulac, accounting for 34.4% of all households.
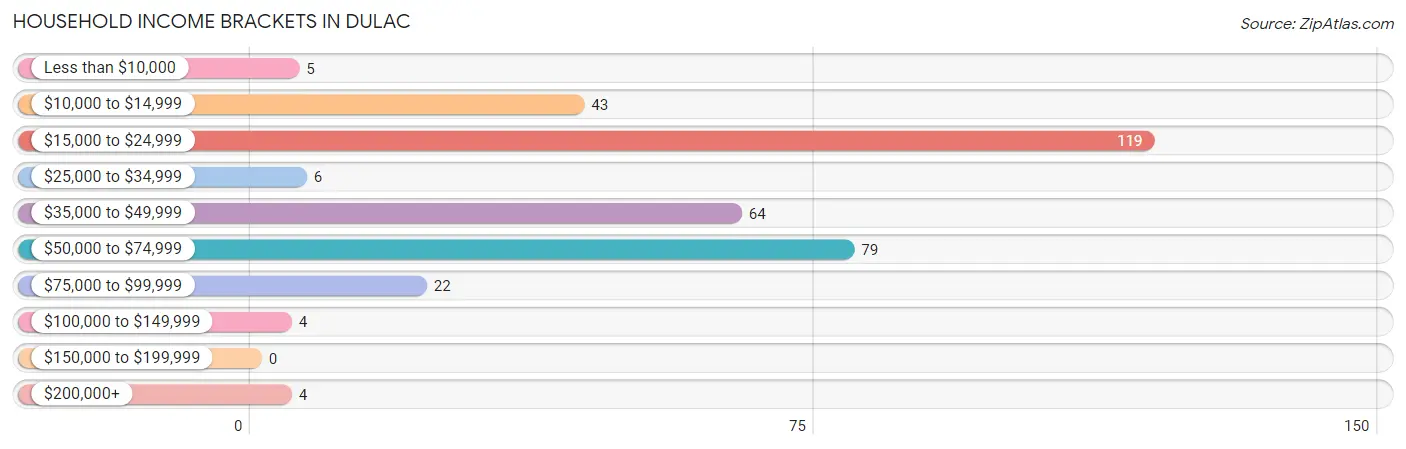
| Income Bracket | # Households | % Households |
| Less than $10,000 | 5 | 1.4% |
| $10,000 to $14,999 | 43 | 12.4% |
| $15,000 to $24,999 | 119 | 34.4% |
| $25,000 to $34,999 | 6 | 1.7% |
| $35,000 to $49,999 | 64 | 18.5% |
| $50,000 to $74,999 | 79 | 22.8% |
| $75,000 to $99,999 | 22 | 6.4% |
| $100,000 to $149,999 | 4 | 1.2% |
| $150,000 to $199,999 | 0 | 0.0% |
| $200,000+ | 4 | 1.2% |
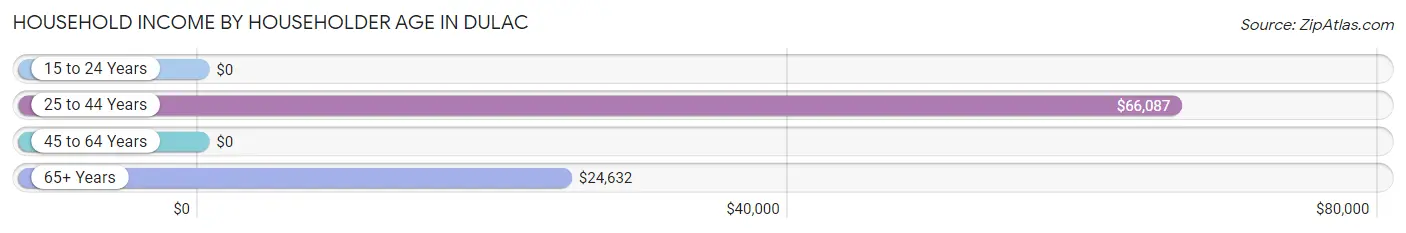
Household Income by Householder Age in Dulac
The median household income in Dulac is $33,750, with the highest median household income of $66,087 found in the 25 to 44 years age bracket for the primary householder. A total of 34 households (9.8%) fall into this category.
| Income Bracket | # Households | Median Income |
| 15 to 24 Years | 0 (0.0%) | $0 |
| 25 to 44 Years | 34 (9.8%) | $66,087 |
| 45 to 64 Years | 123 (35.5%) | $0 |
| 65+ Years | 189 (54.6%) | $24,632 |
| Total | 346 (100.0%) | $33,750 |
Poverty in Dulac
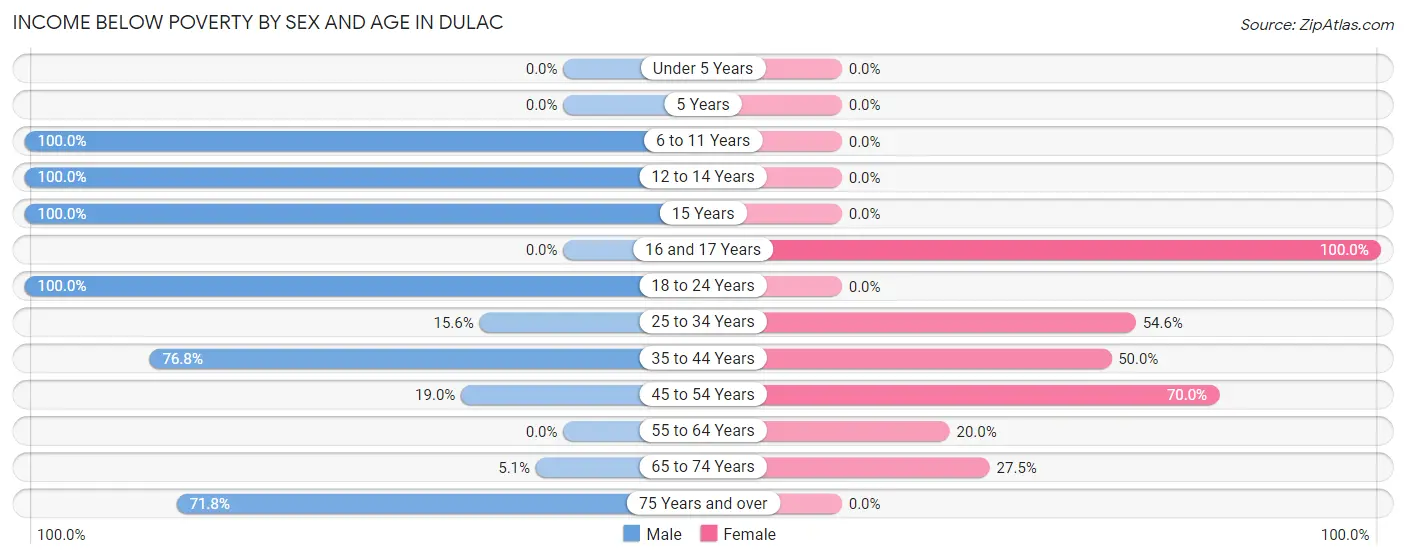
Income Below Poverty by Sex and Age in Dulac
With 51.5% poverty level for males and 47.8% for females among the residents of Dulac, 6 to 11 year old males and 16 and 17 year old females are the most vulnerable to poverty, with 63 males (100.0%) and 23 females (100.0%) in their respective age groups living below the poverty level.
| Age Bracket | Male | Female |
| Under 5 Years | 0 (0.0%) | 0 (0.0%) |
| 5 Years | 0 (0.0%) | 0 (0.0%) |
| 6 to 11 Years | 63 (100.0%) | 0 (0.0%) |
| 12 to 14 Years | 20 (100.0%) | 0 (0.0%) |
| 15 Years | 24 (100.0%) | 0 (0.0%) |
| 16 and 17 Years | 0 (0.0%) | 23 (100.0%) |
| 18 to 24 Years | 61 (100.0%) | 0 (0.0%) |
| 25 to 34 Years | 7 (15.6%) | 6 (54.5%) |
| 35 to 44 Years | 53 (76.8%) | 23 (50.0%) |
| 45 to 54 Years | 11 (19.0%) | 84 (70.0%) |
| 55 to 64 Years | 0 (0.0%) | 1 (20.0%) |
| 65 to 74 Years | 5 (5.1%) | 14 (27.5%) |
| 75 Years and over | 28 (71.8%) | 0 (0.0%) |
| Total | 272 (51.5%) | 151 (47.8%) |
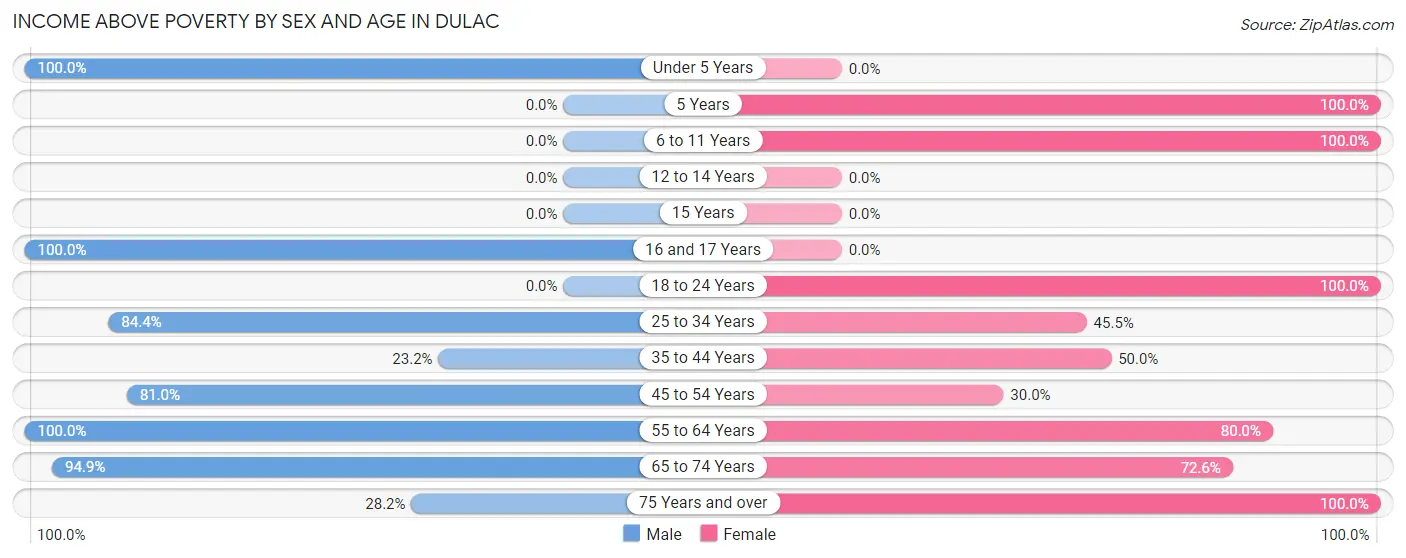
Income Above Poverty by Sex and Age in Dulac
According to the poverty statistics in Dulac, males aged under 5 years and females aged 5 years are the age groups that are most secure financially, with 100.0% of males and 100.0% of females in these age groups living above the poverty line.
| Age Bracket | Male | Female |
| Under 5 Years | 3 (100.0%) | 0 (0.0%) |
| 5 Years | 0 (0.0%) | 4 (100.0%) |
| 6 to 11 Years | 0 (0.0%) | 9 (100.0%) |
| 12 to 14 Years | 0 (0.0%) | 0 (0.0%) |
| 15 Years | 0 (0.0%) | 0 (0.0%) |
| 16 and 17 Years | 26 (100.0%) | 0 (0.0%) |
| 18 to 24 Years | 0 (0.0%) | 10 (100.0%) |
| 25 to 34 Years | 38 (84.4%) | 5 (45.5%) |
| 35 to 44 Years | 16 (23.2%) | 23 (50.0%) |
| 45 to 54 Years | 47 (81.0%) | 36 (30.0%) |
| 55 to 64 Years | 22 (100.0%) | 4 (80.0%) |
| 65 to 74 Years | 93 (94.9%) | 37 (72.6%) |
| 75 Years and over | 11 (28.2%) | 37 (100.0%) |
| Total | 256 (48.5%) | 165 (52.2%) |
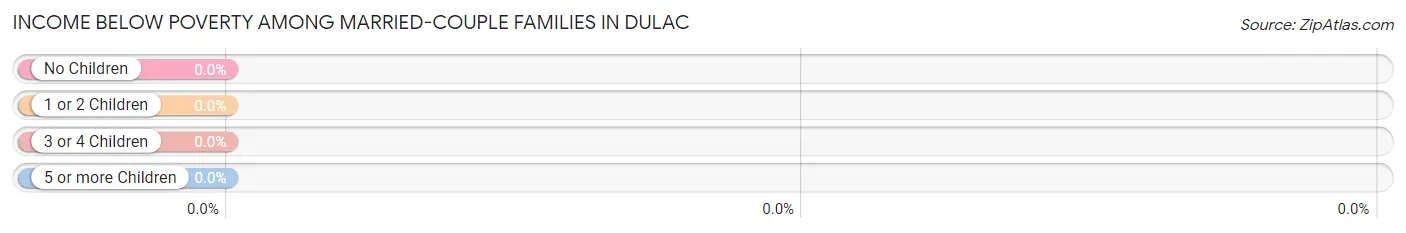
Income Below Poverty Among Married-Couple Families in Dulac
| Children | Above Poverty | Below Poverty |
| No Children | 92 (100.0%) | 0 (0.0%) |
| 1 or 2 Children | 40 (100.0%) | 0 (0.0%) |
| 3 or 4 Children | 0 (0.0%) | 0 (0.0%) |
| 5 or more Children | 0 (0.0%) | 0 (0.0%) |
| Total | 132 (100.0%) | 0 (0.0%) |
Income Below Poverty Among Single-Parent Households in Dulac
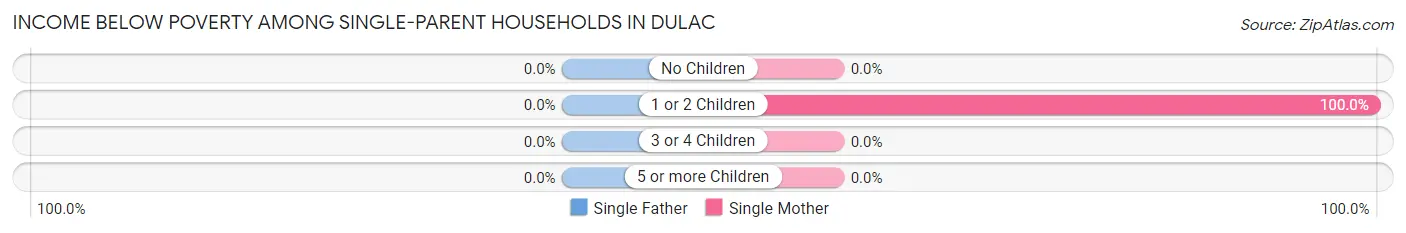
| Children | Single Father | Single Mother |
| No Children | 0 (0.0%) | 0 (0.0%) |
| 1 or 2 Children | 0 (0.0%) | 92 (100.0%) |
| 3 or 4 Children | 0 (0.0%) | 0 (0.0%) |
| 5 or more Children | 0 (0.0%) | 0 (0.0%) |
| Total | 0 (0.0%) | 92 (94.9%) |
Income Below Poverty Among Married-Couple vs Single-Parent Households in Dulac
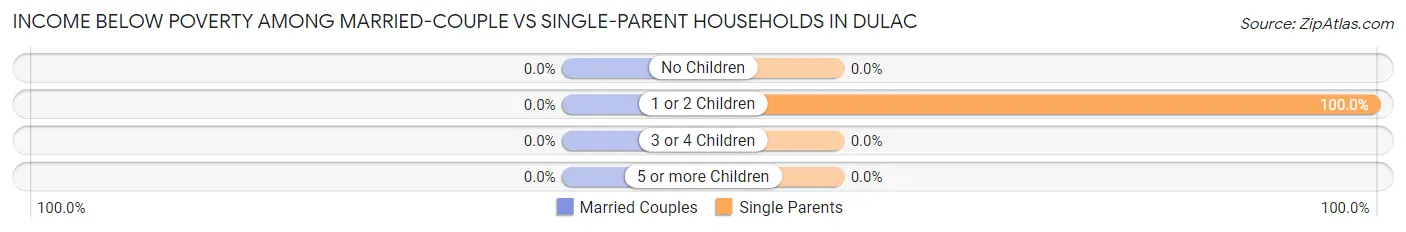
| Children | Married-Couple Families | Single-Parent Households |
| No Children | 0 (0.0%) | 0 (0.0%) |
| 1 or 2 Children | 0 (0.0%) | 92 (100.0%) |
| 3 or 4 Children | 0 (0.0%) | 0 (0.0%) |
| 5 or more Children | 0 (0.0%) | 0 (0.0%) |
| Total | 0 (0.0%) | 92 (94.9%) |
Race in Dulac
The most populous races in Dulac are White / Caucasian (421 | 49.9%), Native / Alaskan (415 | 49.2%), and Hispanic or Latino (71 | 8.4%).
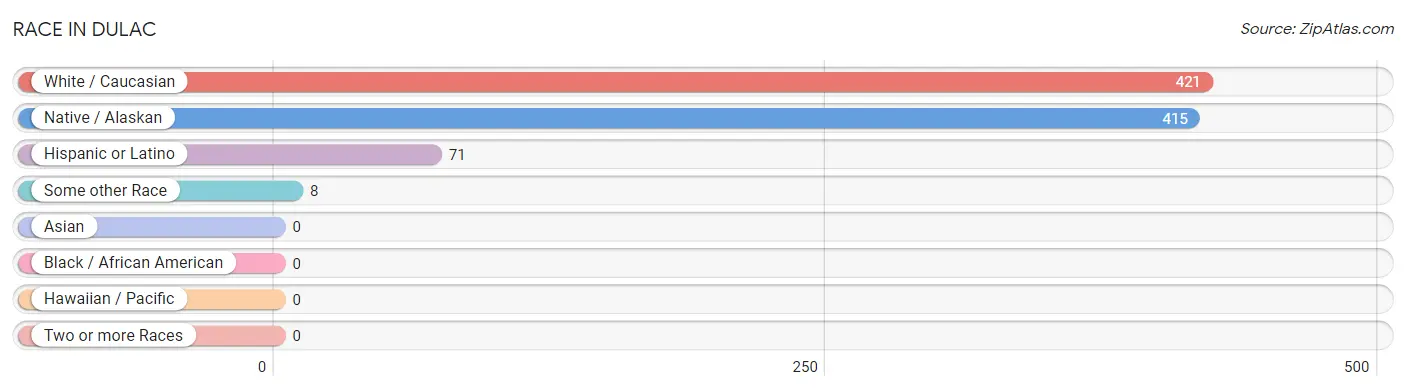
| Race | # Population | % Population |
| Asian | 0 | 0.0% |
| Black / African American | 0 | 0.0% |
| Hawaiian / Pacific | 0 | 0.0% |
| Hispanic or Latino | 71 | 8.4% |
| Native / Alaskan | 415 | 49.2% |
| White / Caucasian | 421 | 49.9% |
| Two or more Races | 0 | 0.0% |
| Some other Race | 8 | 0.9% |
| Total | 844 | 100.0% |
Ancestry in Dulac
The most populous ancestries reported in Dulac are Houma (345 | 40.9%), French (191 | 22.6%), Mexican (63 | 7.5%), Irish (47 | 5.6%), and Italian (14 | 1.7%), together accounting for 78.2% of all Dulac residents.
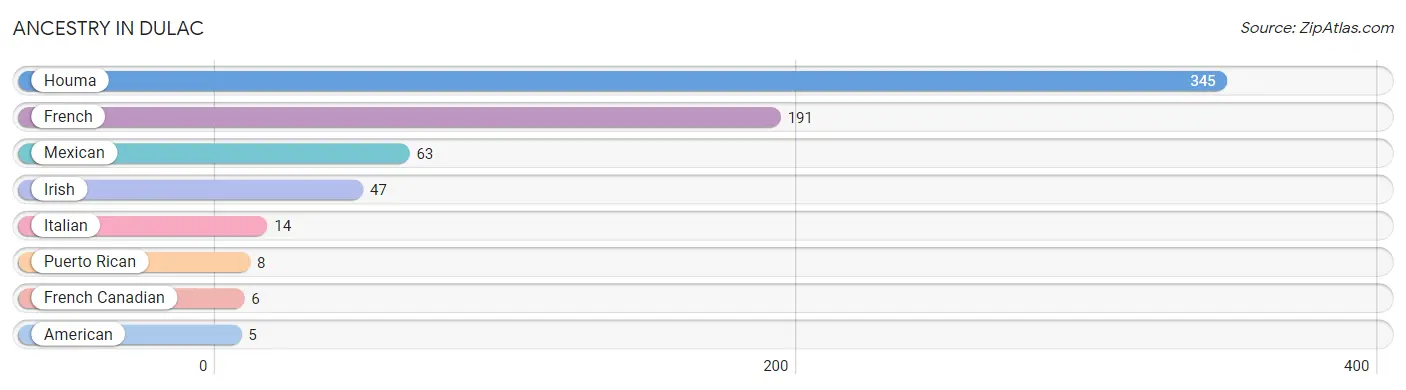
| Ancestry | # Population | % Population |
| American | 5 | 0.6% |
| French | 191 | 22.6% |
| French Canadian | 6 | 0.7% |
| Houma | 345 | 40.9% |
| Irish | 47 | 5.6% |
| Italian | 14 | 1.7% |
| Mexican | 63 | 7.5% |
| Puerto Rican | 8 | 0.9% | View All 8 Rows |
Immigrants in Dulac

| Immigration Origin | # Population | % Population | View All 0 Rows |
Sex and Age in Dulac
Sex and Age in Dulac
The most populous age groups in Dulac are 10 to 14 Years (83 | 15.7%) for men and 45 to 49 Years (63 | 19.9%) for women.
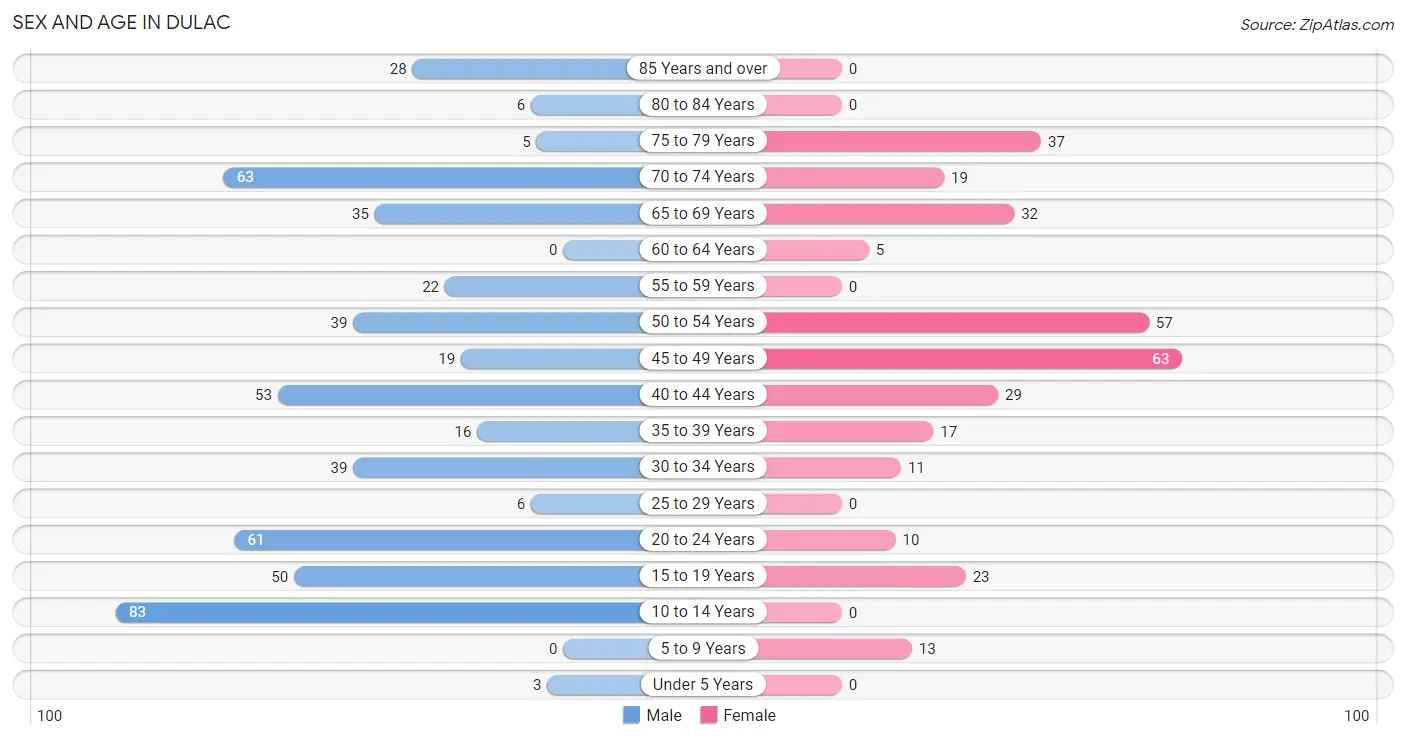
| Age Bracket | Male | Female |
| Under 5 Years | 3 (0.6%) | 0 (0.0%) |
| 5 to 9 Years | 0 (0.0%) | 13 (4.1%) |
| 10 to 14 Years | 83 (15.7%) | 0 (0.0%) |
| 15 to 19 Years | 50 (9.5%) | 23 (7.3%) |
| 20 to 24 Years | 61 (11.6%) | 10 (3.2%) |
| 25 to 29 Years | 6 (1.1%) | 0 (0.0%) |
| 30 to 34 Years | 39 (7.4%) | 11 (3.5%) |
| 35 to 39 Years | 16 (3.0%) | 17 (5.4%) |
| 40 to 44 Years | 53 (10.0%) | 29 (9.2%) |
| 45 to 49 Years | 19 (3.6%) | 63 (19.9%) |
| 50 to 54 Years | 39 (7.4%) | 57 (18.0%) |
| 55 to 59 Years | 22 (4.2%) | 0 (0.0%) |
| 60 to 64 Years | 0 (0.0%) | 5 (1.6%) |
| 65 to 69 Years | 35 (6.6%) | 32 (10.1%) |
| 70 to 74 Years | 63 (11.9%) | 19 (6.0%) |
| 75 to 79 Years | 5 (0.9%) | 37 (11.7%) |
| 80 to 84 Years | 6 (1.1%) | 0 (0.0%) |
| 85 Years and over | 28 (5.3%) | 0 (0.0%) |
| Total | 528 (100.0%) | 316 (100.0%) |
Families and Households in Dulac
Median Family Size in Dulac
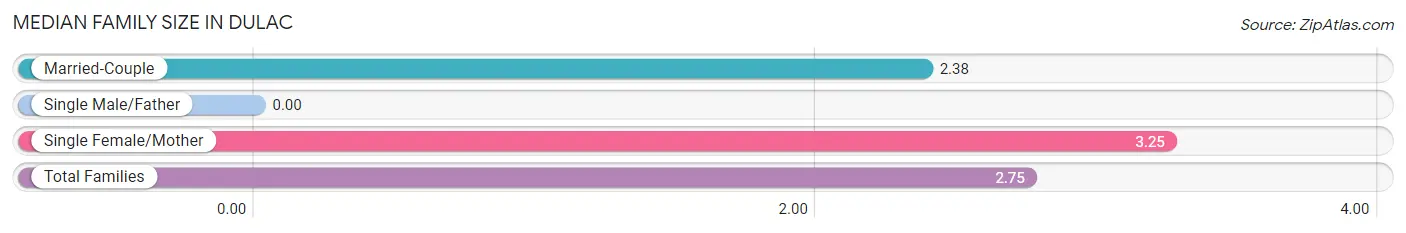
| Family Type | # Families | Family Size |
| Married-Couple | 132 (57.6%) | 2.38 |
| Single Male/Father | 0 (0.0%) | - |
| Single Female/Mother | 97 (42.4%) | 3.25 |
| Total Families | 229 (100.0%) | 2.75 |
Median Household Size in Dulac
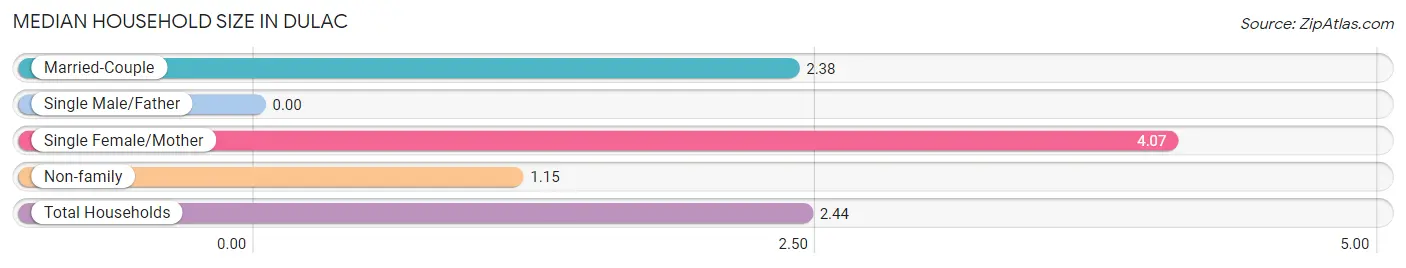
| Household Type | # Households | Household Size |
| Married-Couple | 132 (38.2%) | 2.38 |
| Single Male/Father | 0 (0.0%) | - |
| Single Female/Mother | 97 (28.0%) | 4.07 |
| Non-family | 117 (33.8%) | 1.15 |
| Total Households | 346 (100.0%) | 2.44 |
Household Size by Marriage Status in Dulac
Out of a total of 346 households in Dulac, 229 (66.2%) are family households, while 117 (33.8%) are nonfamily households. The most numerous type of family households are 2-person households, comprising 86, and the most common type of nonfamily households are 1-person households, comprising 101.
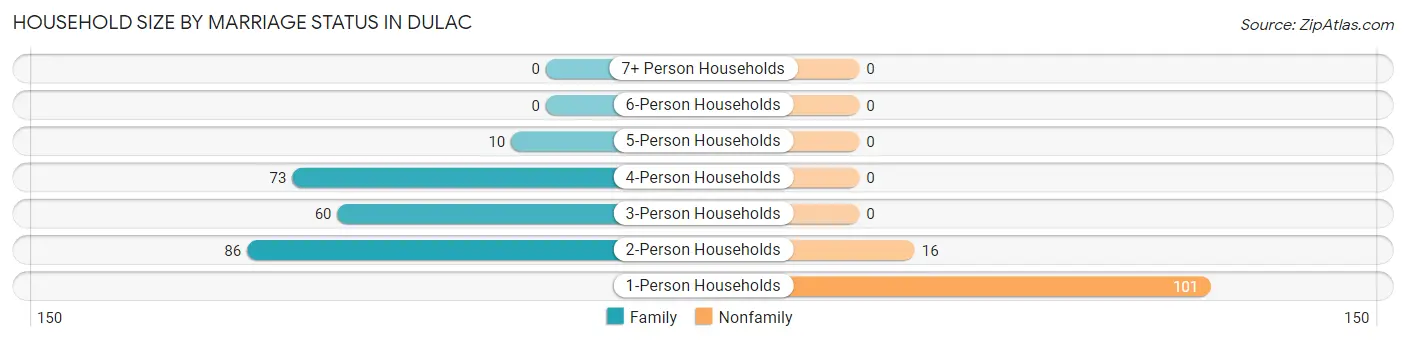
| Household Size | Family Households | Nonfamily Households |
| 1-Person Households | - | 101 (29.2%) |
| 2-Person Households | 86 (24.9%) | 16 (4.6%) |
| 3-Person Households | 60 (17.3%) | 0 (0.0%) |
| 4-Person Households | 73 (21.1%) | 0 (0.0%) |
| 5-Person Households | 10 (2.9%) | 0 (0.0%) |
| 6-Person Households | 0 (0.0%) | 0 (0.0%) |
| 7+ Person Households | 0 (0.0%) | 0 (0.0%) |
| Total | 229 (66.2%) | 117 (33.8%) |
Female Fertility in Dulac
Fertility by Age in Dulac
Average fertility rate in Dulac is 33.0 births per 1,000 women. Women in the age bracket of 20 to 34 years have the highest fertility rate with 238.0 births per 1,000 women. Women in the age bracket of 20 to 34 years acount for 100.0% of all women with births.
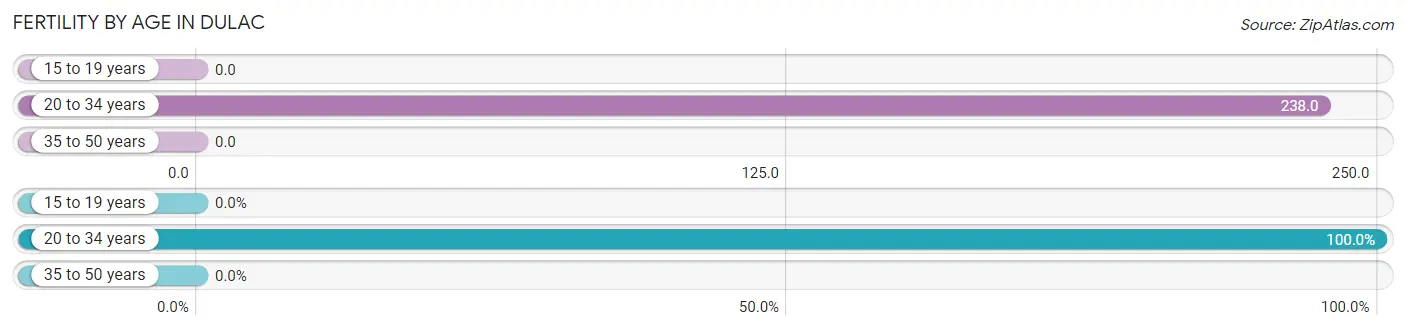
| Age Bracket | Women with Births | Births / 1,000 Women |
| 15 to 19 years | 0 (0.0%) | 0.0 |
| 20 to 34 years | 5 (100.0%) | 238.0 |
| 35 to 50 years | 0 (0.0%) | 0.0 |
| Total | 5 (100.0%) | 33.0 |
Fertility by Age by Marriage Status in Dulac
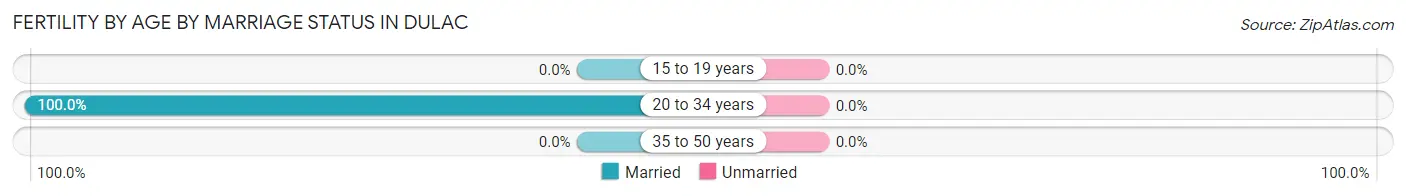
| Age Bracket | Married | Unmarried |
| 15 to 19 years | 0 (0.0%) | 0 (0.0%) |
| 20 to 34 years | 5 (100.0%) | 0 (0.0%) |
| 35 to 50 years | 0 (0.0%) | 0 (0.0%) |
| Total | 5 (100.0%) | 0 (0.0%) |
Fertility by Education in Dulac
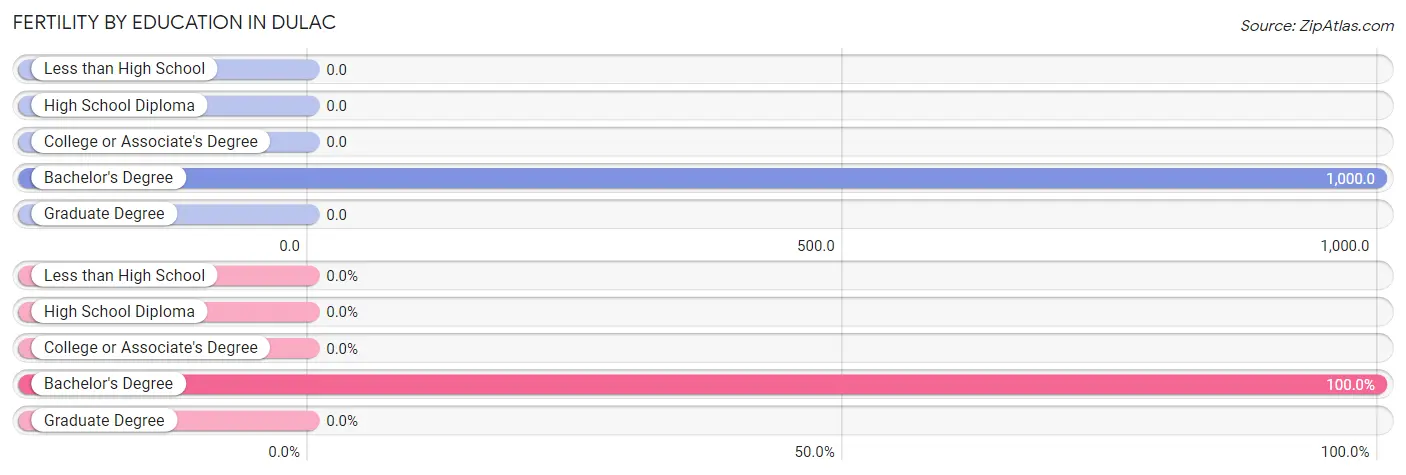
| Educational Attainment | Women with Births | Births / 1,000 Women |
| Less than High School | 0 (0.0%) | 0.0 |
| High School Diploma | 0 (0.0%) | 0.0 |
| College or Associate's Degree | 0 (0.0%) | 0.0 |
| Bachelor's Degree | 5 (100.0%) | 1,000.0 |
| Graduate Degree | 0 (0.0%) | 0.0 |
| Total | 5 (100.0%) | 33.0 |
Fertility by Education by Marriage Status in Dulac
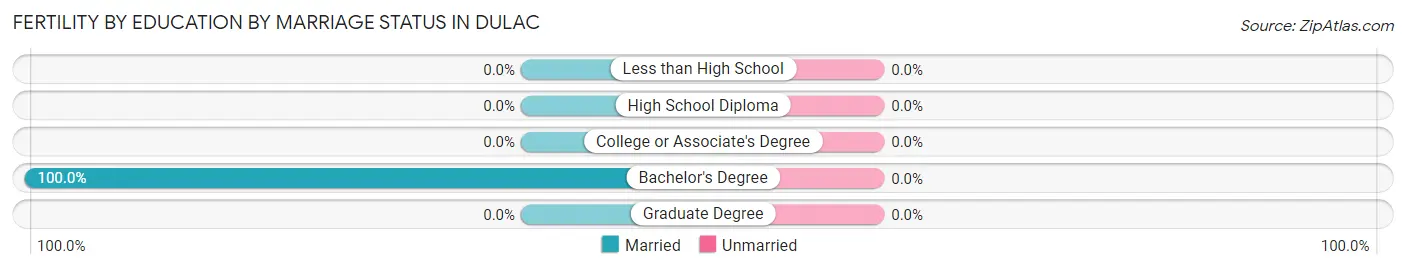
| Educational Attainment | Married | Unmarried |
| Less than High School | 0 (0.0%) | 0 (0.0%) |
| High School Diploma | 0 (0.0%) | 0 (0.0%) |
| College or Associate's Degree | 0 (0.0%) | 0 (0.0%) |
| Bachelor's Degree | 5 (100.0%) | 0 (0.0%) |
| Graduate Degree | 0 (0.0%) | 0 (0.0%) |
| Total | 5 (100.0%) | 0 (0.0%) |
Employment Characteristics in Dulac
Employment by Class of Employer in Dulac
Among the 205 employed individuals in Dulac, private company employees (136 | 66.3%), self-employed (not incorporated) (52 | 25.4%), and unpaid family workers (17 | 8.3%) make up the most common classes of employment.
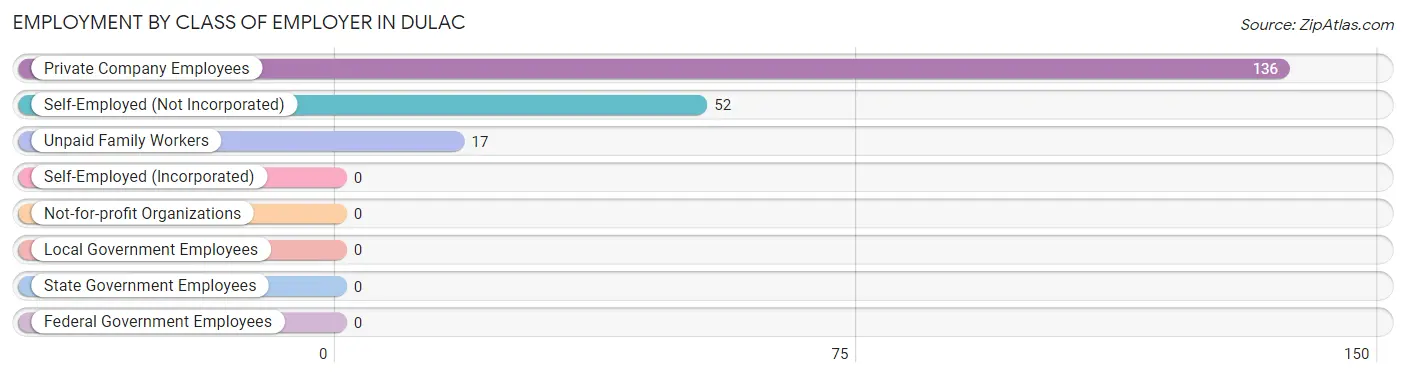
| Employer Class | # Employees | % Employees |
| Private Company Employees | 136 | 66.3% |
| Self-Employed (Incorporated) | 0 | 0.0% |
| Self-Employed (Not Incorporated) | 52 | 25.4% |
| Not-for-profit Organizations | 0 | 0.0% |
| Local Government Employees | 0 | 0.0% |
| State Government Employees | 0 | 0.0% |
| Federal Government Employees | 0 | 0.0% |
| Unpaid Family Workers | 17 | 8.3% |
| Total | 205 | 100.0% |
Employment Status by Age in Dulac
According to the labor force statistics for Dulac, out of the total population over 16 years of age (721), 45.4% or 327 individuals are in the labor force, with 19.6% or 64 of them unemployed. The age group with the highest labor force participation rate is 25 to 29 years, with 100.0% or 6 individuals in the labor force. Within the labor force, the 35 to 44 years age range has the highest percentage of unemployed individuals, with 57.6% or 53 of them being unemployed.
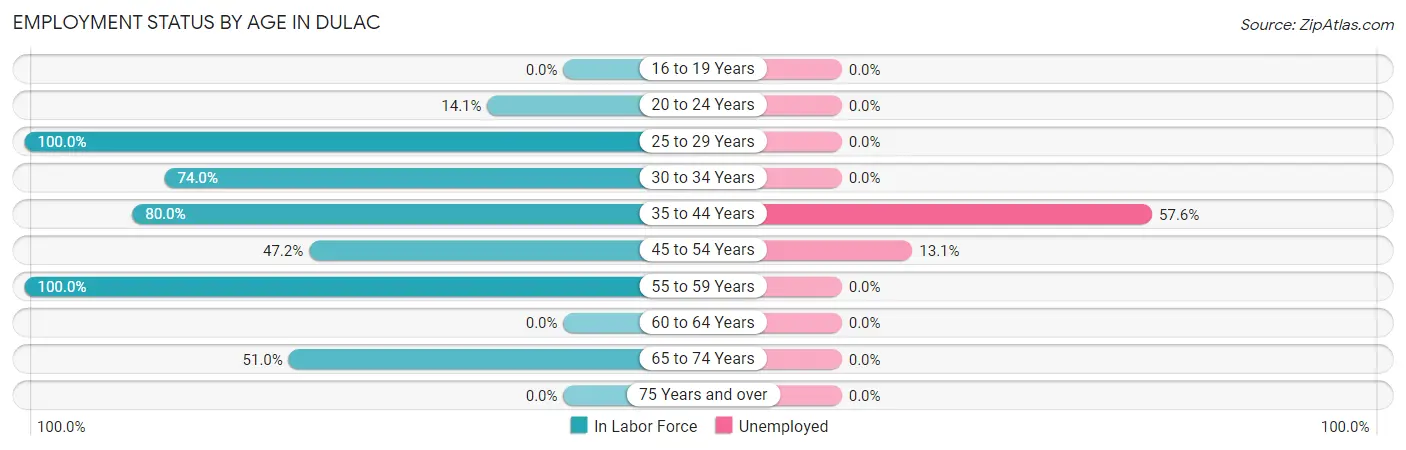
| Age Bracket | In Labor Force | Unemployed |
| 16 to 19 Years | 0 (0.0%) | 0 (0.0%) |
| 20 to 24 Years | 10 (14.1%) | 0 (0.0%) |
| 25 to 29 Years | 6 (100.0%) | 0 (0.0%) |
| 30 to 34 Years | 37 (74.0%) | 0 (0.0%) |
| 35 to 44 Years | 92 (80.0%) | 53 (57.6%) |
| 45 to 54 Years | 84 (47.2%) | 11 (13.1%) |
| 55 to 59 Years | 22 (100.0%) | 0 (0.0%) |
| 60 to 64 Years | 0 (0.0%) | 0 (0.0%) |
| 65 to 74 Years | 76 (51.0%) | 0 (0.0%) |
| 75 Years and over | 0 (0.0%) | 0 (0.0%) |
| Total | 327 (45.4%) | 64 (19.6%) |
Employment Status by Educational Attainment in Dulac
According to labor force statistics for Dulac, 64.1% of individuals (241) out of the total population between 25 and 64 years of age (376) are in the labor force, with 26.6% or 64 of them being unemployed. The group with the highest labor force participation rate are those with the educational attainment of bachelor's degree or higher, with 100.0% or 9 individuals in the labor force. Within the labor force, individuals with less than high school education have the highest percentage of unemployment, with 48.5% or 64 of them being unemployed.
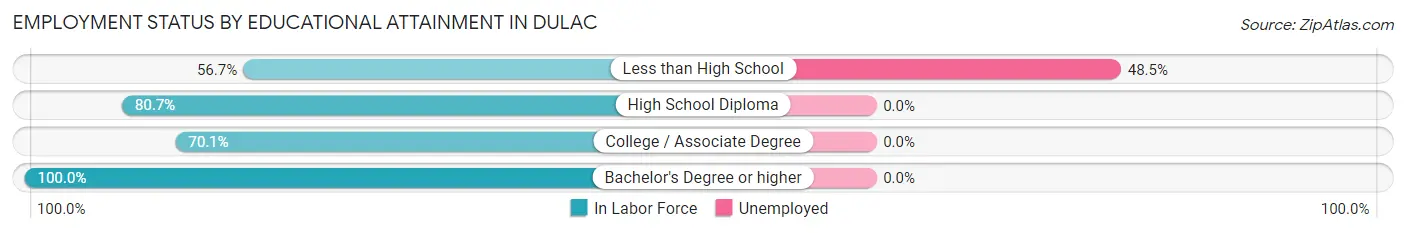
| Educational Attainment | In Labor Force | Unemployed |
| Less than High School | 132 (56.7%) | 113 (48.5%) |
| High School Diploma | 46 (80.7%) | 0 (0.0%) |
| College / Associate Degree | 54 (70.1%) | 0 (0.0%) |
| Bachelor's Degree or higher | 9 (100.0%) | 0 (0.0%) |
| Total | 241 (64.1%) | 100 (26.6%) |
Employment Occupations by Sex in Dulac
Management, Business, Science and Arts Occupations
The most common Management, Business, Science and Arts occupations in Dulac are Business & Financial (13 | 4.9%), and Management (7 | 2.7%).
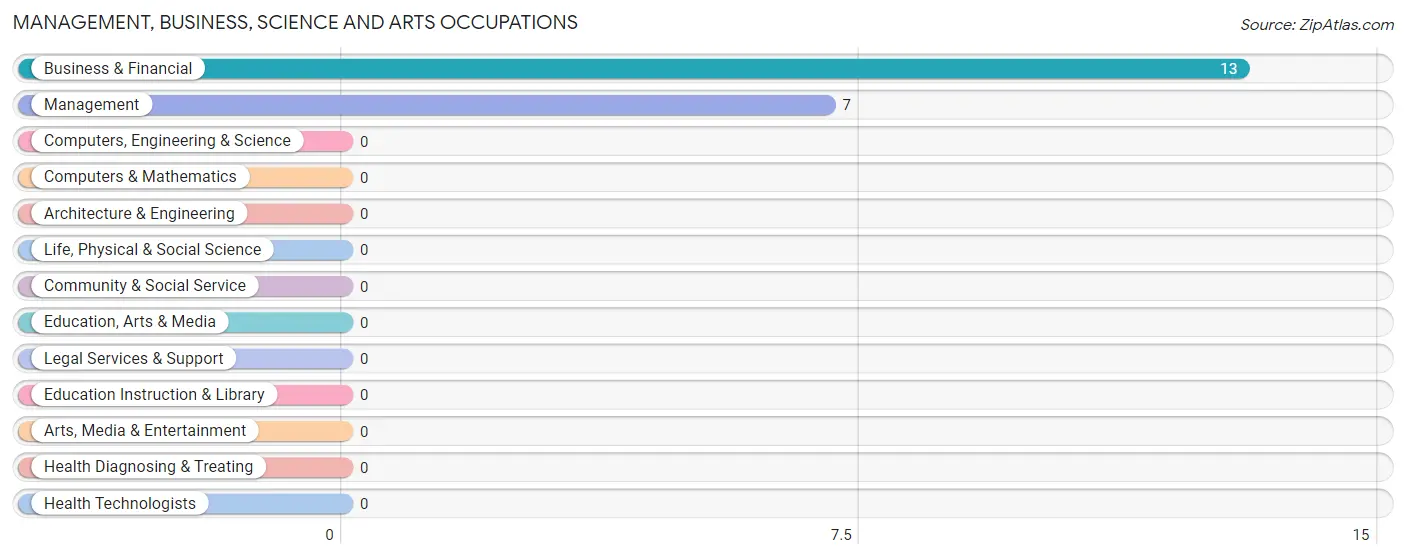
Management, Business, Science and Arts Occupations by Sex
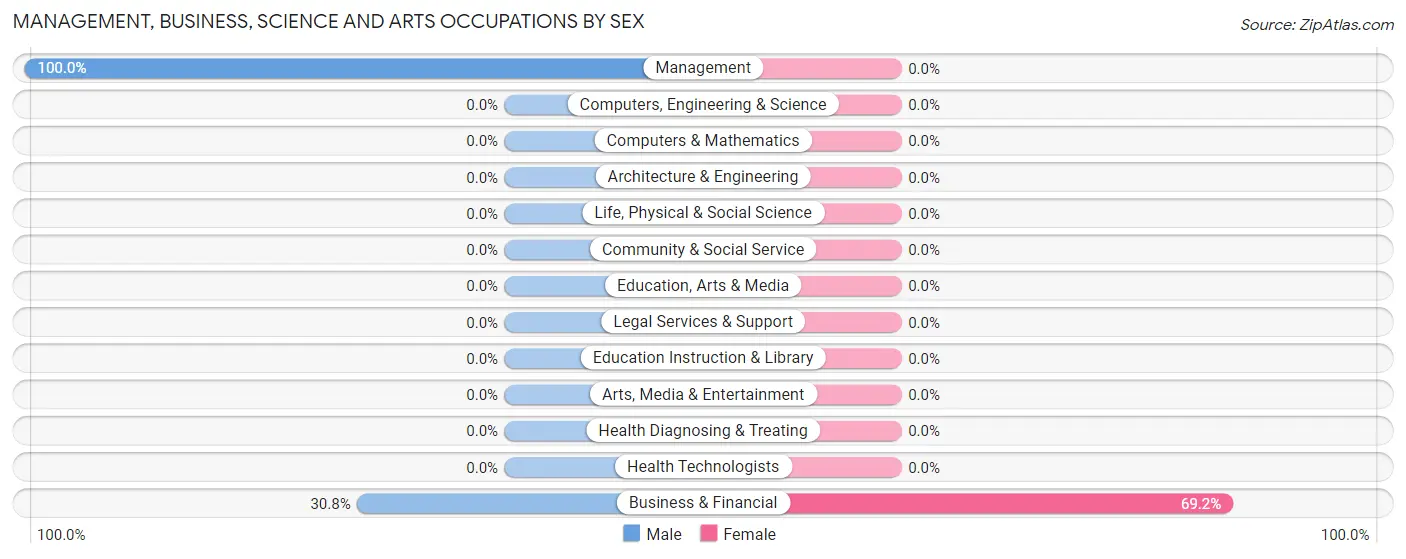
| Occupation | Male | Female |
| Management | 7 (100.0%) | 0 (0.0%) |
| Business & Financial | 4 (30.8%) | 9 (69.2%) |
| Computers, Engineering & Science | 0 (0.0%) | 0 (0.0%) |
| Computers & Mathematics | 0 (0.0%) | 0 (0.0%) |
| Architecture & Engineering | 0 (0.0%) | 0 (0.0%) |
| Life, Physical & Social Science | 0 (0.0%) | 0 (0.0%) |
| Community & Social Service | 0 (0.0%) | 0 (0.0%) |
| Education, Arts & Media | 0 (0.0%) | 0 (0.0%) |
| Legal Services & Support | 0 (0.0%) | 0 (0.0%) |
| Education Instruction & Library | 0 (0.0%) | 0 (0.0%) |
| Arts, Media & Entertainment | 0 (0.0%) | 0 (0.0%) |
| Health Diagnosing & Treating | 0 (0.0%) | 0 (0.0%) |
| Health Technologists | 0 (0.0%) | 0 (0.0%) |
| Total (Category) | 11 (55.0%) | 9 (45.0%) |
| Total (Overall) | 199 (75.7%) | 64 (24.3%) |
Services Occupations
The most common Services occupations in Dulac are Healthcare Support (26 | 9.9%), and Food Preparation & Serving (6 | 2.3%).
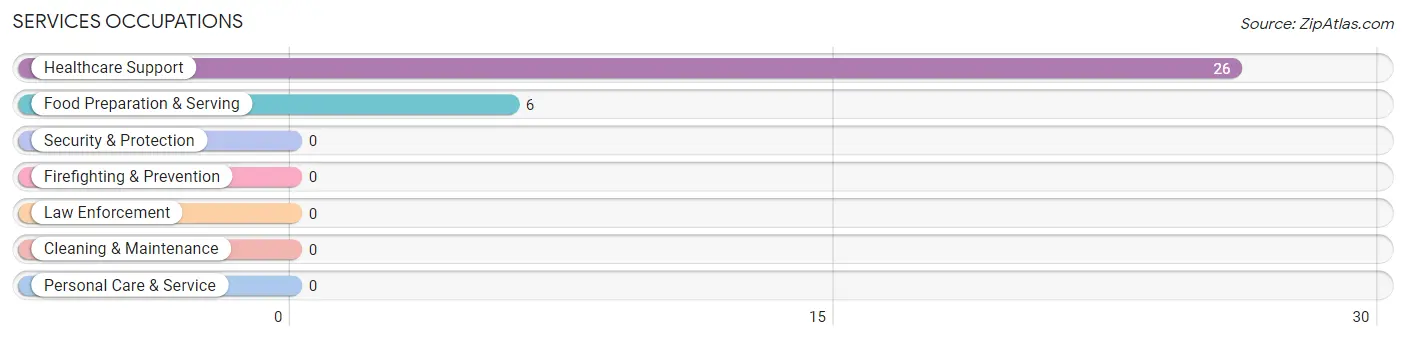
Services Occupations by Sex
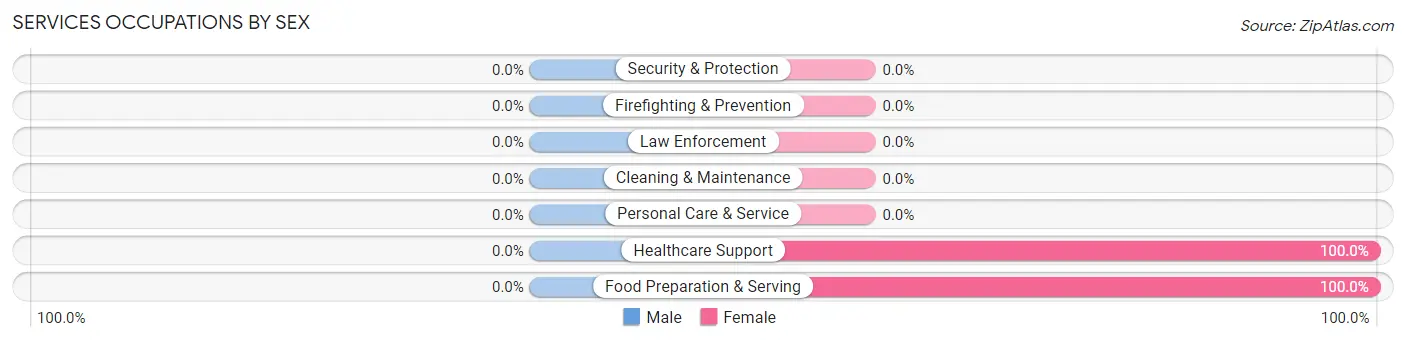
| Occupation | Male | Female |
| Healthcare Support | 0 (0.0%) | 26 (100.0%) |
| Security & Protection | 0 (0.0%) | 0 (0.0%) |
| Firefighting & Prevention | 0 (0.0%) | 0 (0.0%) |
| Law Enforcement | 0 (0.0%) | 0 (0.0%) |
| Food Preparation & Serving | 0 (0.0%) | 6 (100.0%) |
| Cleaning & Maintenance | 0 (0.0%) | 0 (0.0%) |
| Personal Care & Service | 0 (0.0%) | 0 (0.0%) |
| Total (Category) | 0 (0.0%) | 32 (100.0%) |
| Total (Overall) | 199 (75.7%) | 64 (24.3%) |
Sales and Office Occupations
The most common Sales and Office occupations in Dulac are , and Sales & Related (6 | 2.3%).
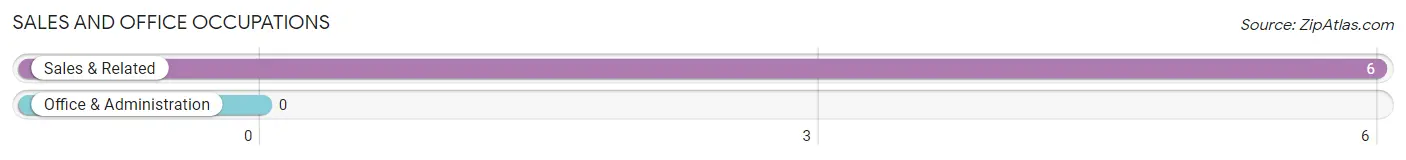
Sales and Office Occupations by Sex
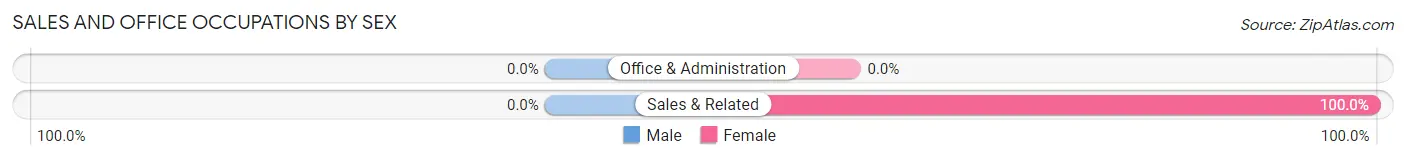
| Occupation | Male | Female |
| Sales & Related | 0 (0.0%) | 6 (100.0%) |
| Office & Administration | 0 (0.0%) | 0 (0.0%) |
| Total (Category) | 0 (0.0%) | 6 (100.0%) |
| Total (Overall) | 199 (75.7%) | 64 (24.3%) |
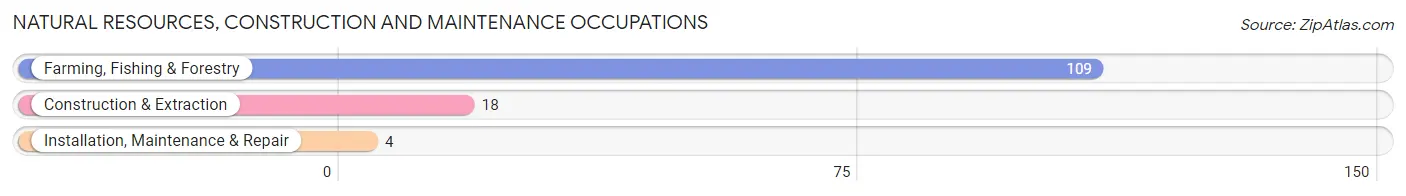
Natural Resources, Construction and Maintenance Occupations
The most common Natural Resources, Construction and Maintenance occupations in Dulac are Farming, Fishing & Forestry (109 | 41.4%), Construction & Extraction (18 | 6.8%), and Installation, Maintenance & Repair (4 | 1.5%).
Natural Resources, Construction and Maintenance Occupations by Sex
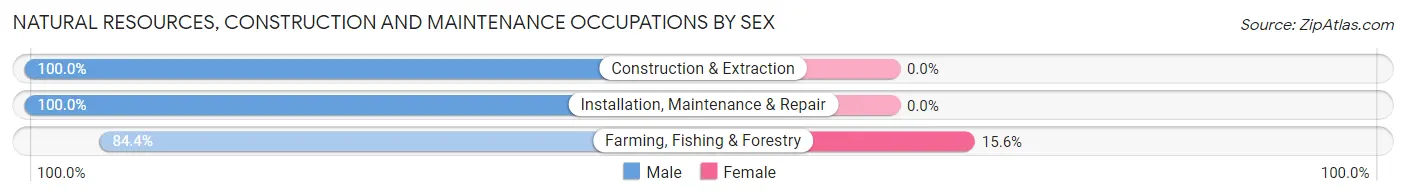
| Occupation | Male | Female |
| Farming, Fishing & Forestry | 92 (84.4%) | 17 (15.6%) |
| Construction & Extraction | 18 (100.0%) | 0 (0.0%) |
| Installation, Maintenance & Repair | 4 (100.0%) | 0 (0.0%) |
| Total (Category) | 114 (87.0%) | 17 (13.0%) |
| Total (Overall) | 199 (75.7%) | 64 (24.3%) |
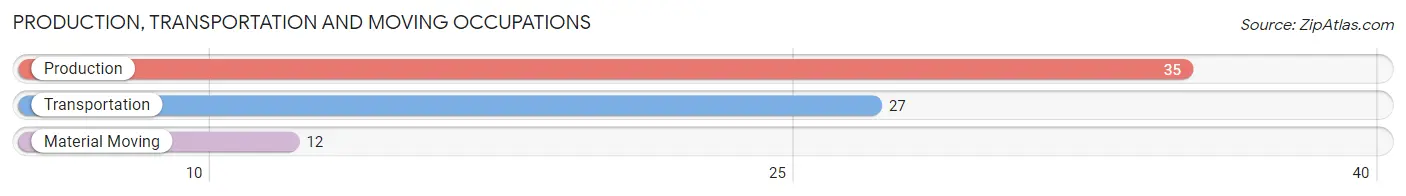
Production, Transportation and Moving Occupations
The most common Production, Transportation and Moving occupations in Dulac are Production (35 | 13.3%), Transportation (27 | 10.3%), and Material Moving (12 | 4.6%).
Production, Transportation and Moving Occupations by Sex
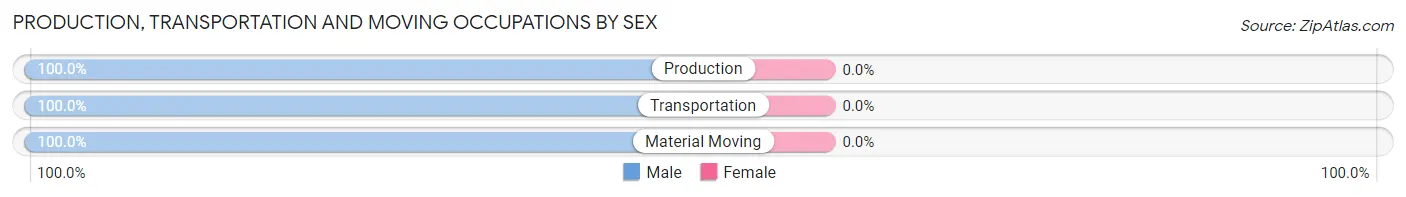
| Occupation | Male | Female |
| Production | 35 (100.0%) | 0 (0.0%) |
| Transportation | 27 (100.0%) | 0 (0.0%) |
| Material Moving | 12 (100.0%) | 0 (0.0%) |
| Total (Category) | 74 (100.0%) | 0 (0.0%) |
| Total (Overall) | 199 (75.7%) | 64 (24.3%) |
Employment Industries by Sex in Dulac
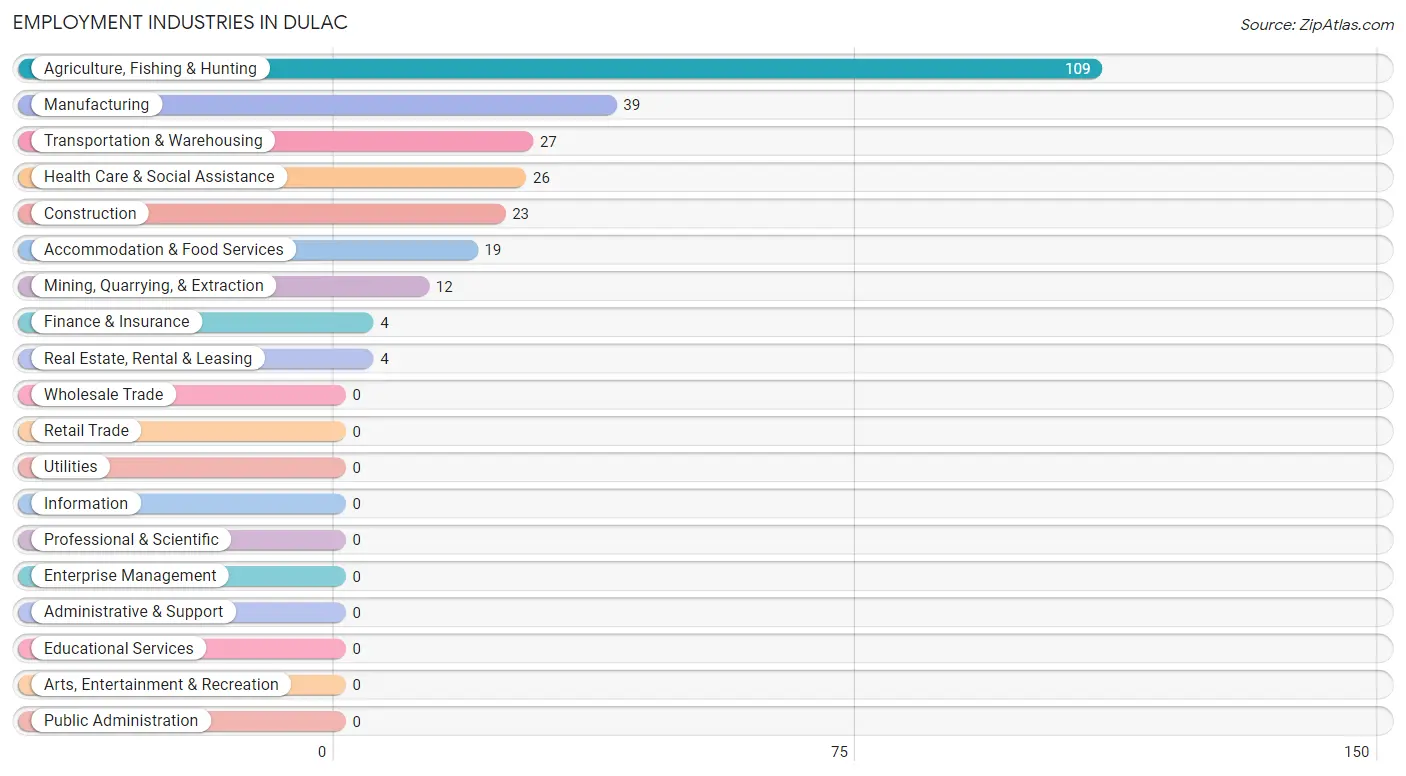
Employment Industries in Dulac
The major employment industries in Dulac include Agriculture, Fishing & Hunting (109 | 41.4%), Manufacturing (39 | 14.8%), Transportation & Warehousing (27 | 10.3%), Health Care & Social Assistance (26 | 9.9%), and Construction (23 | 8.7%).
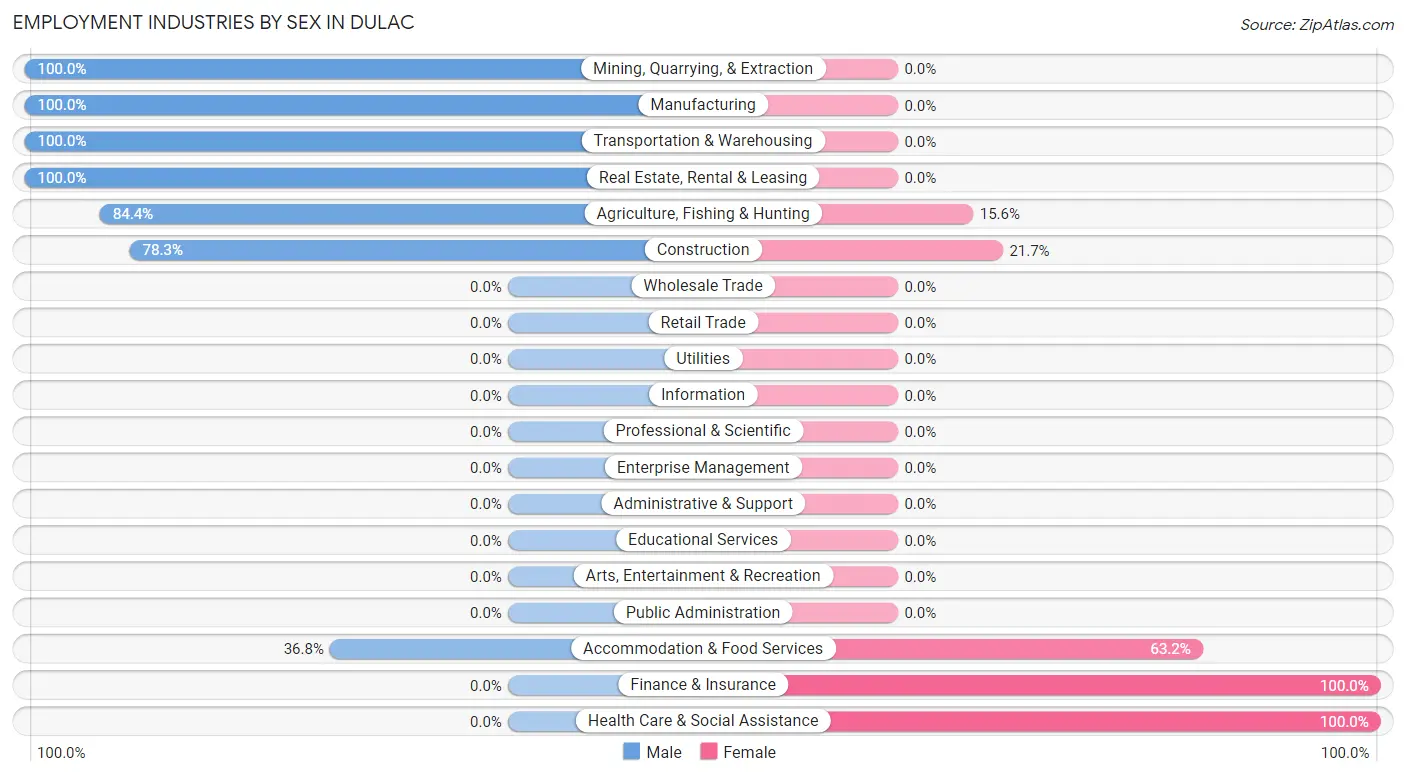
Employment Industries by Sex in Dulac
The Dulac industries that see more men than women are Mining, Quarrying, & Extraction (100.0%), Manufacturing (100.0%), and Transportation & Warehousing (100.0%), whereas the industries that tend to have a higher number of women are Finance & Insurance (100.0%), Health Care & Social Assistance (100.0%), and Accommodation & Food Services (63.2%).
| Industry | Male | Female |
| Agriculture, Fishing & Hunting | 92 (84.4%) | 17 (15.6%) |
| Mining, Quarrying, & Extraction | 12 (100.0%) | 0 (0.0%) |
| Construction | 18 (78.3%) | 5 (21.7%) |
| Manufacturing | 39 (100.0%) | 0 (0.0%) |
| Wholesale Trade | 0 (0.0%) | 0 (0.0%) |
| Retail Trade | 0 (0.0%) | 0 (0.0%) |
| Transportation & Warehousing | 27 (100.0%) | 0 (0.0%) |
| Utilities | 0 (0.0%) | 0 (0.0%) |
| Information | 0 (0.0%) | 0 (0.0%) |
| Finance & Insurance | 0 (0.0%) | 4 (100.0%) |
| Real Estate, Rental & Leasing | 4 (100.0%) | 0 (0.0%) |
| Professional & Scientific | 0 (0.0%) | 0 (0.0%) |
| Enterprise Management | 0 (0.0%) | 0 (0.0%) |
| Administrative & Support | 0 (0.0%) | 0 (0.0%) |
| Educational Services | 0 (0.0%) | 0 (0.0%) |
| Health Care & Social Assistance | 0 (0.0%) | 26 (100.0%) |
| Arts, Entertainment & Recreation | 0 (0.0%) | 0 (0.0%) |
| Accommodation & Food Services | 7 (36.8%) | 12 (63.2%) |
| Public Administration | 0 (0.0%) | 0 (0.0%) |
| Total | 199 (75.7%) | 64 (24.3%) |
Education in Dulac
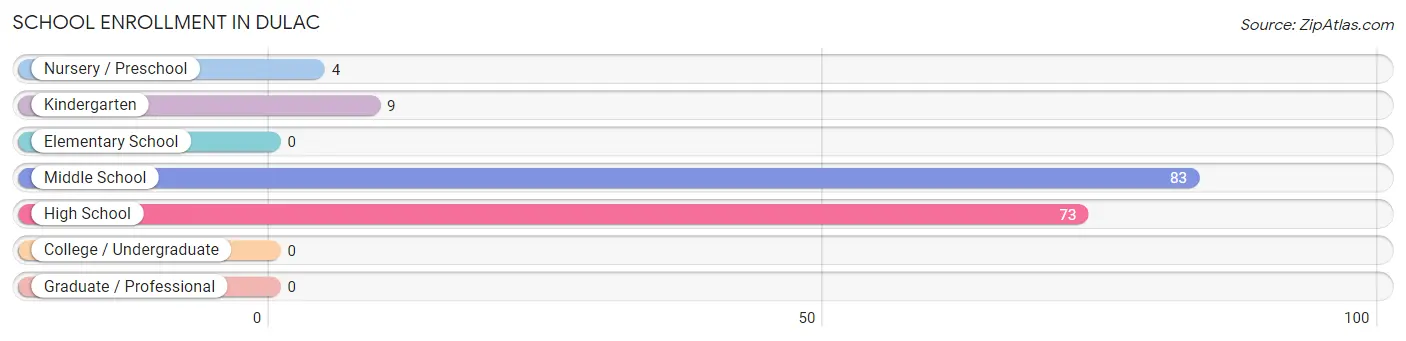
School Enrollment in Dulac
The most common levels of schooling among the 169 students in Dulac are middle school (83 | 49.1%), high school (73 | 43.2%), and kindergarten (9 | 5.3%).
| School Level | # Students | % Students |
| Nursery / Preschool | 4 | 2.4% |
| Kindergarten | 9 | 5.3% |
| Elementary School | 0 | 0.0% |
| Middle School | 83 | 49.1% |
| High School | 73 | 43.2% |
| College / Undergraduate | 0 | 0.0% |
| Graduate / Professional | 0 | 0.0% |
| Total | 169 | 100.0% |
School Enrollment by Age by Funding Source in Dulac
Out of a total of 169 students who are enrolled in schools in Dulac, 4 (2.4%) attend a private institution, while the remaining 165 (97.6%) are enrolled in public schools. The age group of 5 to 9 year old has the highest likelihood of being enrolled in private schools, with 4 (30.8% in the age bracket) enrolled. Conversely, the age group of 10 to 14 year olds has the lowest likelihood of being enrolled in a private school, with 83 (100.0% in the age bracket) attending a public institution.
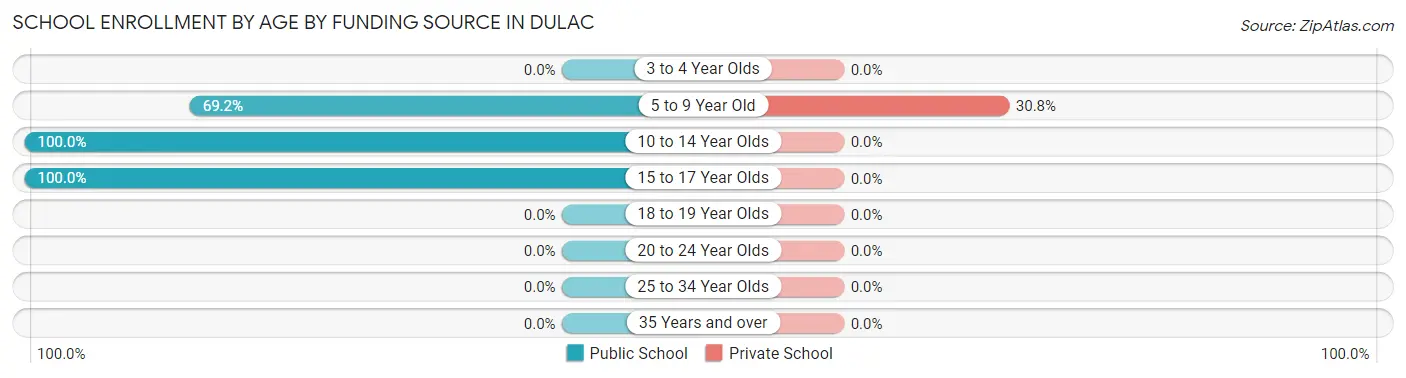
| Age Bracket | Public School | Private School |
| 3 to 4 Year Olds | 0 (0.0%) | 0 (0.0%) |
| 5 to 9 Year Old | 9 (69.2%) | 4 (30.8%) |
| 10 to 14 Year Olds | 83 (100.0%) | 0 (0.0%) |
| 15 to 17 Year Olds | 73 (100.0%) | 0 (0.0%) |
| 18 to 19 Year Olds | 0 (0.0%) | 0 (0.0%) |
| 20 to 24 Year Olds | 0 (0.0%) | 0 (0.0%) |
| 25 to 34 Year Olds | 0 (0.0%) | 0 (0.0%) |
| 35 Years and over | 0 (0.0%) | 0 (0.0%) |
| Total | 165 (97.6%) | 4 (2.4%) |
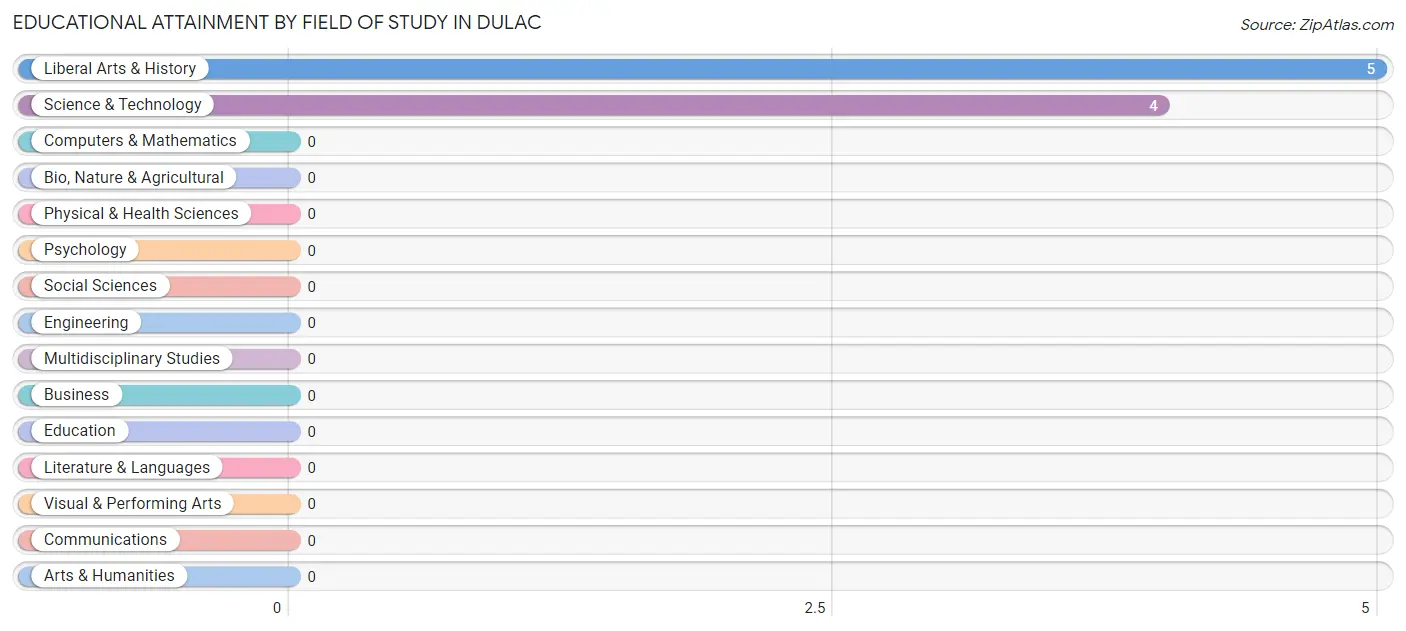
Educational Attainment by Field of Study in Dulac
Liberal arts & history (5 | 55.6%), and science & technology (4 | 44.4%) are the most common fields of study among 9 individuals in Dulac who have obtained a bachelor's degree or higher.
| Field of Study | # Graduates | % Graduates |
| Computers & Mathematics | 0 | 0.0% |
| Bio, Nature & Agricultural | 0 | 0.0% |
| Physical & Health Sciences | 0 | 0.0% |
| Psychology | 0 | 0.0% |
| Social Sciences | 0 | 0.0% |
| Engineering | 0 | 0.0% |
| Multidisciplinary Studies | 0 | 0.0% |
| Science & Technology | 4 | 44.4% |
| Business | 0 | 0.0% |
| Education | 0 | 0.0% |
| Literature & Languages | 0 | 0.0% |
| Liberal Arts & History | 5 | 55.6% |
| Visual & Performing Arts | 0 | 0.0% |
| Communications | 0 | 0.0% |
| Arts & Humanities | 0 | 0.0% |
| Total | 9 | 100.0% |
Transportation & Commute in Dulac
Vehicle Availability by Sex in Dulac
The most prevalent vehicle ownership categories in Dulac are males with 1 vehicle (80, accounting for 56.7%) and females with 1 vehicle (17, making up 125.0%).
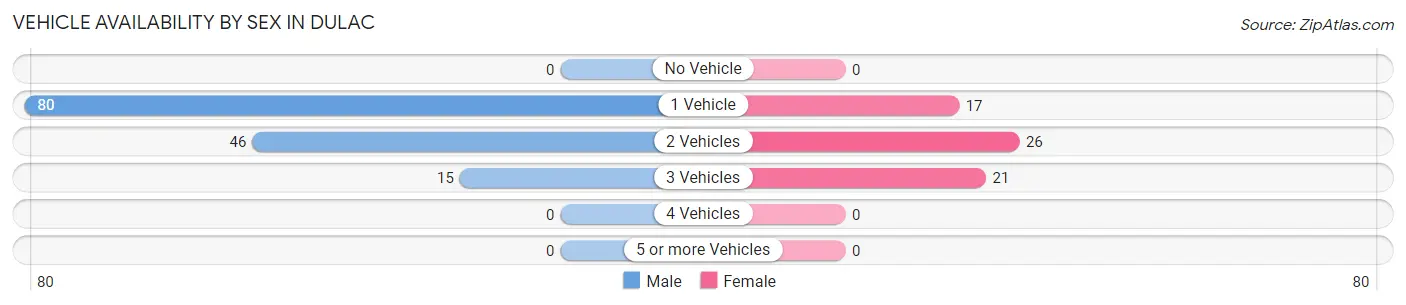
| Vehicles Available | Male | Female |
| No Vehicle | 0 (0.0%) | 0 (0.0%) |
| 1 Vehicle | 80 (56.7%) | 17 (26.6%) |
| 2 Vehicles | 46 (32.6%) | 26 (40.6%) |
| 3 Vehicles | 15 (10.6%) | 21 (32.8%) |
| 4 Vehicles | 0 (0.0%) | 0 (0.0%) |
| 5 or more Vehicles | 0 (0.0%) | 0 (0.0%) |
| Total | 141 (100.0%) | 64 (100.0%) |
Commute Time in Dulac
The most frequently occuring commute durations in Dulac are 10 to 14 minutes (47 commuters, 22.9%), 35 to 39 minutes (44 commuters, 21.5%), and 90 or more minutes (27 commuters, 13.2%).
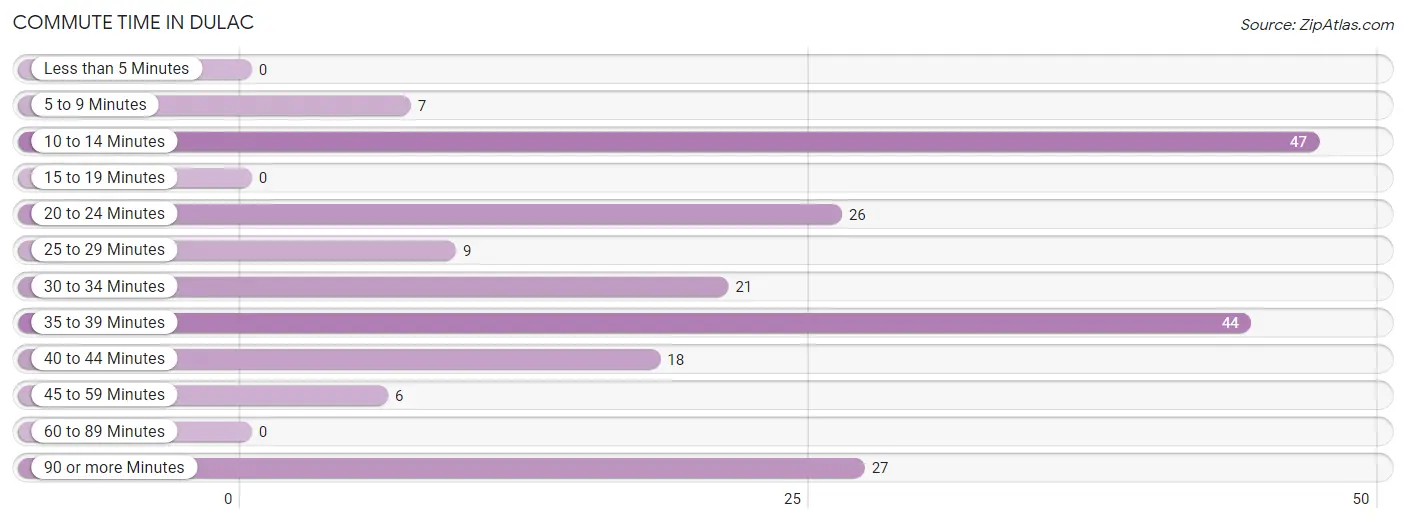
| Commute Time | # Commuters | % Commuters |
| Less than 5 Minutes | 0 | 0.0% |
| 5 to 9 Minutes | 7 | 3.4% |
| 10 to 14 Minutes | 47 | 22.9% |
| 15 to 19 Minutes | 0 | 0.0% |
| 20 to 24 Minutes | 26 | 12.7% |
| 25 to 29 Minutes | 9 | 4.4% |
| 30 to 34 Minutes | 21 | 10.2% |
| 35 to 39 Minutes | 44 | 21.5% |
| 40 to 44 Minutes | 18 | 8.8% |
| 45 to 59 Minutes | 6 | 2.9% |
| 60 to 89 Minutes | 0 | 0.0% |
| 90 or more Minutes | 27 | 13.2% |
Commute Time by Sex in Dulac
The most common commute times in Dulac are 10 to 14 minutes (47 commuters, 33.3%) for males and 20 to 24 minutes (26 commuters, 40.6%) for females.
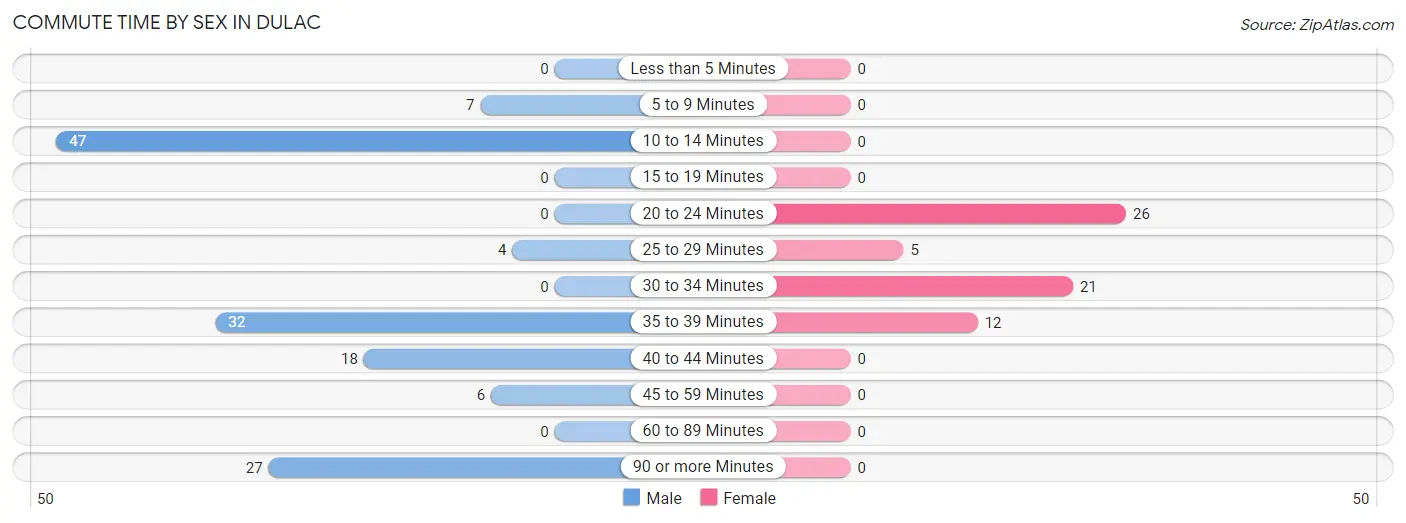
| Commute Time | Male | Female |
| Less than 5 Minutes | 0 (0.0%) | 0 (0.0%) |
| 5 to 9 Minutes | 7 (5.0%) | 0 (0.0%) |
| 10 to 14 Minutes | 47 (33.3%) | 0 (0.0%) |
| 15 to 19 Minutes | 0 (0.0%) | 0 (0.0%) |
| 20 to 24 Minutes | 0 (0.0%) | 26 (40.6%) |
| 25 to 29 Minutes | 4 (2.8%) | 5 (7.8%) |
| 30 to 34 Minutes | 0 (0.0%) | 21 (32.8%) |
| 35 to 39 Minutes | 32 (22.7%) | 12 (18.8%) |
| 40 to 44 Minutes | 18 (12.8%) | 0 (0.0%) |
| 45 to 59 Minutes | 6 (4.3%) | 0 (0.0%) |
| 60 to 89 Minutes | 0 (0.0%) | 0 (0.0%) |
| 90 or more Minutes | 27 (19.2%) | 0 (0.0%) |
Time of Departure to Work by Sex in Dulac
The most frequent times of departure to work in Dulac are 12:00 AM to 4:59 AM (39, 27.7%) for males and 7:00 AM to 7:29 AM (30, 46.9%) for females.
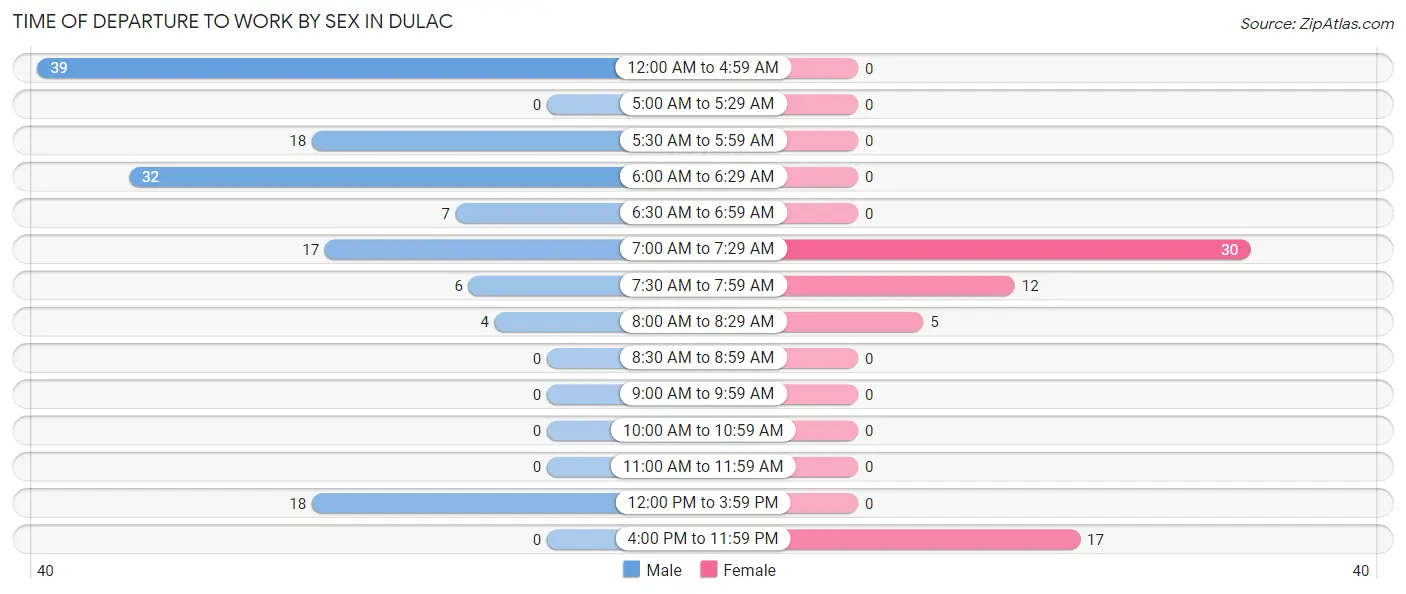
| Time of Departure | Male | Female |
| 12:00 AM to 4:59 AM | 39 (27.7%) | 0 (0.0%) |
| 5:00 AM to 5:29 AM | 0 (0.0%) | 0 (0.0%) |
| 5:30 AM to 5:59 AM | 18 (12.8%) | 0 (0.0%) |
| 6:00 AM to 6:29 AM | 32 (22.7%) | 0 (0.0%) |
| 6:30 AM to 6:59 AM | 7 (5.0%) | 0 (0.0%) |
| 7:00 AM to 7:29 AM | 17 (12.1%) | 30 (46.9%) |
| 7:30 AM to 7:59 AM | 6 (4.3%) | 12 (18.8%) |
| 8:00 AM to 8:29 AM | 4 (2.8%) | 5 (7.8%) |
| 8:30 AM to 8:59 AM | 0 (0.0%) | 0 (0.0%) |
| 9:00 AM to 9:59 AM | 0 (0.0%) | 0 (0.0%) |
| 10:00 AM to 10:59 AM | 0 (0.0%) | 0 (0.0%) |
| 11:00 AM to 11:59 AM | 0 (0.0%) | 0 (0.0%) |
| 12:00 PM to 3:59 PM | 18 (12.8%) | 0 (0.0%) |
| 4:00 PM to 11:59 PM | 0 (0.0%) | 17 (26.6%) |
| Total | 141 (100.0%) | 64 (100.0%) |
Housing Occupancy in Dulac
Occupancy by Ownership in Dulac
Of the total 346 dwellings in Dulac, owner-occupied units account for 315 (91.0%), while renter-occupied units make up 31 (9.0%).
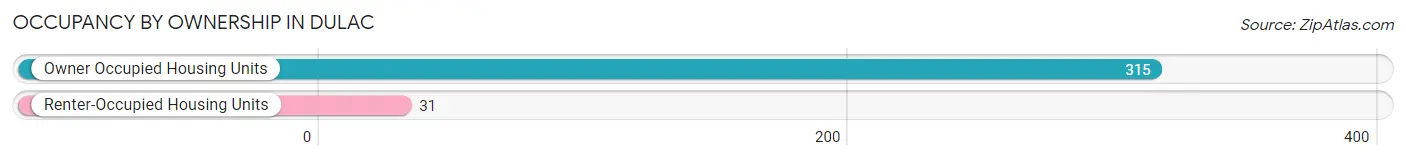
| Occupancy | # Housing Units | % Housing Units |
| Owner Occupied Housing Units | 315 | 91.0% |
| Renter-Occupied Housing Units | 31 | 9.0% |
| Total Occupied Housing Units | 346 | 100.0% |
Occupancy by Household Size in Dulac
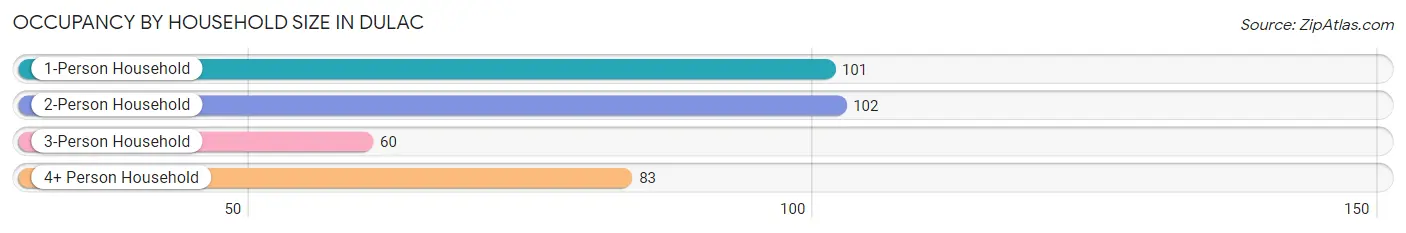
| Household Size | # Housing Units | % Housing Units |
| 1-Person Household | 101 | 29.2% |
| 2-Person Household | 102 | 29.5% |
| 3-Person Household | 60 | 17.3% |
| 4+ Person Household | 83 | 24.0% |
| Total Housing Units | 346 | 100.0% |
Occupancy by Ownership by Household Size in Dulac
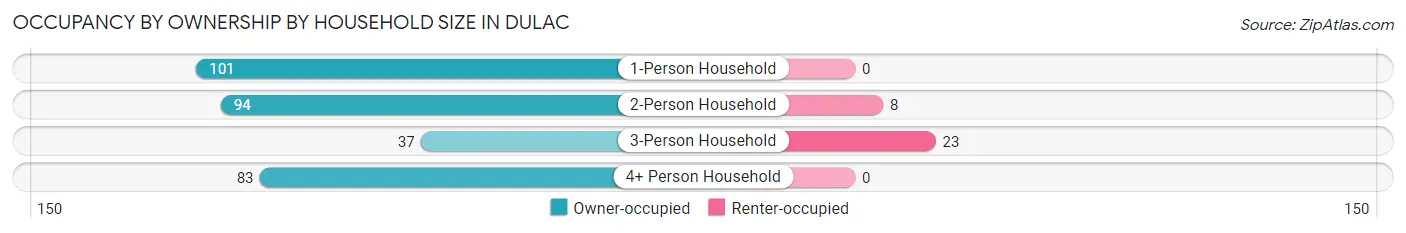
| Household Size | Owner-occupied | Renter-occupied |
| 1-Person Household | 101 (100.0%) | 0 (0.0%) |
| 2-Person Household | 94 (92.2%) | 8 (7.8%) |
| 3-Person Household | 37 (61.7%) | 23 (38.3%) |
| 4+ Person Household | 83 (100.0%) | 0 (0.0%) |
| Total Housing Units | 315 (91.0%) | 31 (9.0%) |
Occupancy by Educational Attainment in Dulac
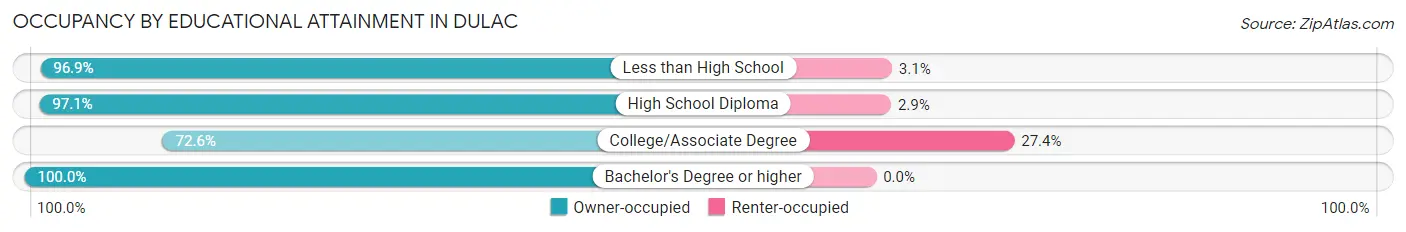
| Household Size | Owner-occupied | Renter-occupied |
| Less than High School | 217 (96.9%) | 7 (3.1%) |
| High School Diploma | 33 (97.1%) | 1 (2.9%) |
| College/Associate Degree | 61 (72.6%) | 23 (27.4%) |
| Bachelor's Degree or higher | 4 (100.0%) | 0 (0.0%) |
Occupancy by Age of Householder in Dulac
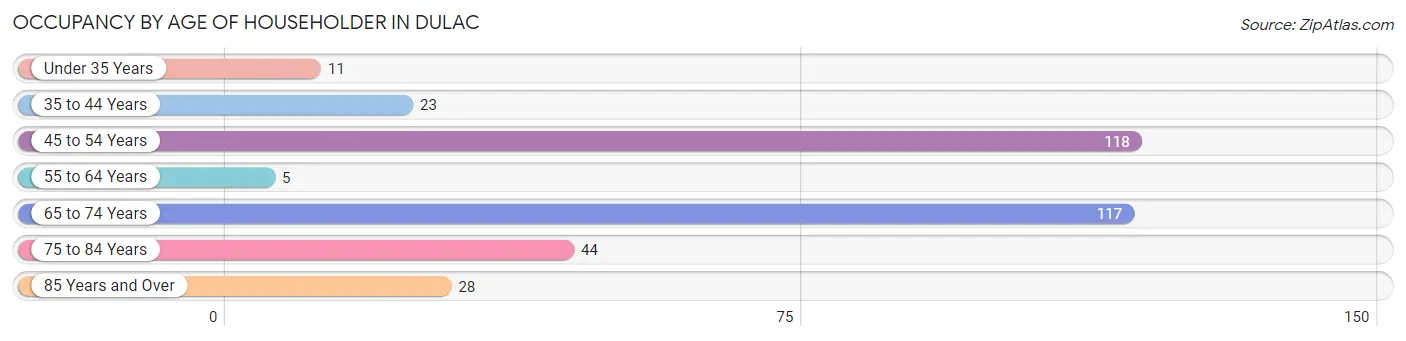
| Age Bracket | # Households | % Households |
| Under 35 Years | 11 | 3.2% |
| 35 to 44 Years | 23 | 6.7% |
| 45 to 54 Years | 118 | 34.1% |
| 55 to 64 Years | 5 | 1.5% |
| 65 to 74 Years | 117 | 33.8% |
| 75 to 84 Years | 44 | 12.7% |
| 85 Years and Over | 28 | 8.1% |
| Total | 346 | 100.0% |
Housing Finances in Dulac
Median Income by Occupancy in Dulac
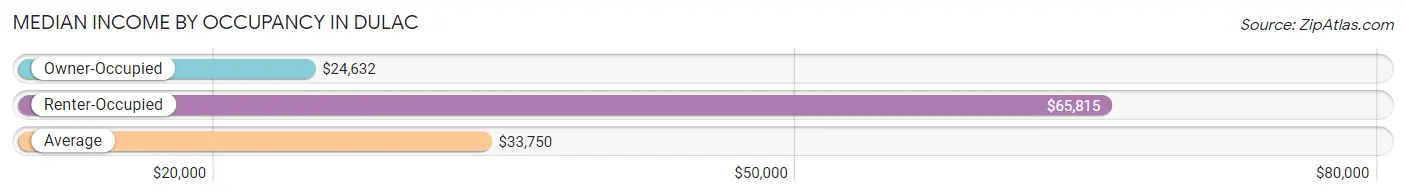
| Occupancy Type | # Households | Median Income |
| Owner-Occupied | 315 (91.0%) | $24,632 |
| Renter-Occupied | 31 (9.0%) | $65,815 |
| Average | 346 (100.0%) | $33,750 |
Occupancy by Householder Income Bracket in Dulac
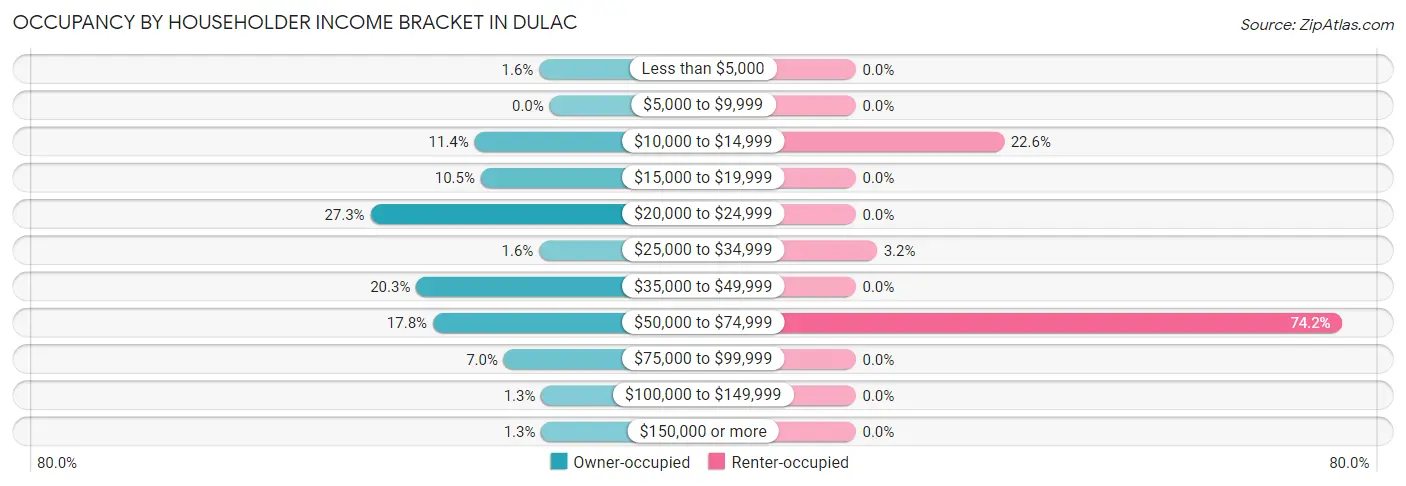
| Income Bracket | Owner-occupied | Renter-occupied |
| Less than $5,000 | 5 (1.6%) | 0 (0.0%) |
| $5,000 to $9,999 | 0 (0.0%) | 0 (0.0%) |
| $10,000 to $14,999 | 36 (11.4%) | 7 (22.6%) |
| $15,000 to $19,999 | 33 (10.5%) | 0 (0.0%) |
| $20,000 to $24,999 | 86 (27.3%) | 0 (0.0%) |
| $25,000 to $34,999 | 5 (1.6%) | 1 (3.2%) |
| $35,000 to $49,999 | 64 (20.3%) | 0 (0.0%) |
| $50,000 to $74,999 | 56 (17.8%) | 23 (74.2%) |
| $75,000 to $99,999 | 22 (7.0%) | 0 (0.0%) |
| $100,000 to $149,999 | 4 (1.3%) | 0 (0.0%) |
| $150,000 or more | 4 (1.3%) | 0 (0.0%) |
| Total | 315 (100.0%) | 31 (100.0%) |
Monthly Housing Cost Tiers in Dulac
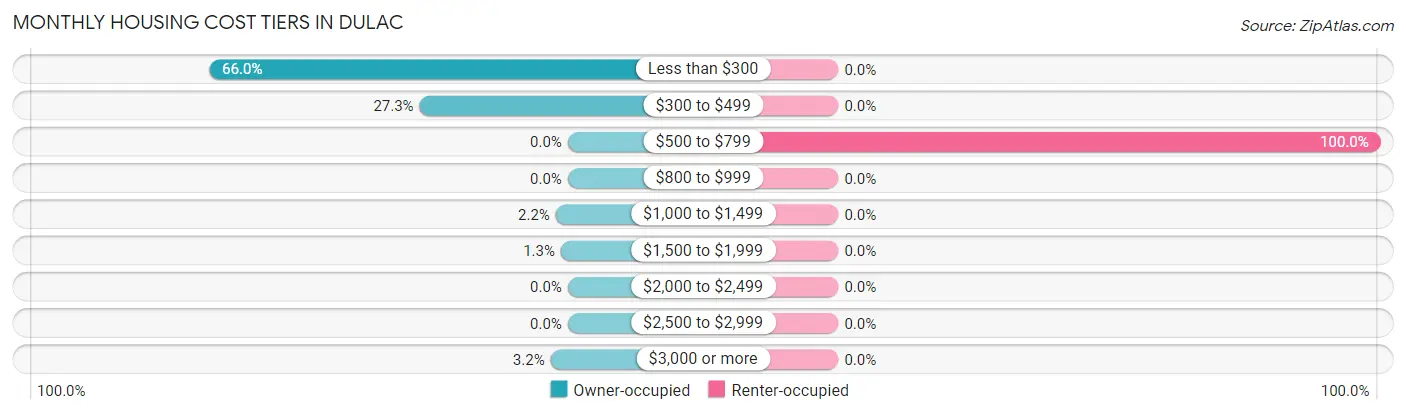
| Monthly Cost | Owner-occupied | Renter-occupied |
| Less than $300 | 208 (66.0%) | 0 (0.0%) |
| $300 to $499 | 86 (27.3%) | 0 (0.0%) |
| $500 to $799 | 0 (0.0%) | 31 (100.0%) |
| $800 to $999 | 0 (0.0%) | 0 (0.0%) |
| $1,000 to $1,499 | 7 (2.2%) | 0 (0.0%) |
| $1,500 to $1,999 | 4 (1.3%) | 0 (0.0%) |
| $2,000 to $2,499 | 0 (0.0%) | 0 (0.0%) |
| $2,500 to $2,999 | 0 (0.0%) | 0 (0.0%) |
| $3,000 or more | 10 (3.2%) | 0 (0.0%) |
| Total | 315 (100.0%) | 31 (100.0%) |
Physical Housing Characteristics in Dulac
Housing Structures in Dulac
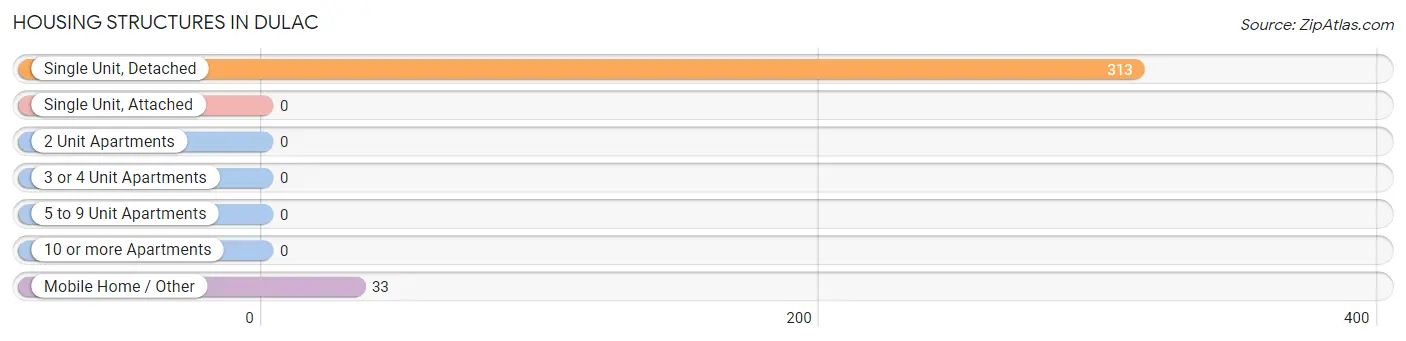
| Structure Type | # Housing Units | % Housing Units |
| Single Unit, Detached | 313 | 90.5% |
| Single Unit, Attached | 0 | 0.0% |
| 2 Unit Apartments | 0 | 0.0% |
| 3 or 4 Unit Apartments | 0 | 0.0% |
| 5 to 9 Unit Apartments | 0 | 0.0% |
| 10 or more Apartments | 0 | 0.0% |
| Mobile Home / Other | 33 | 9.5% |
| Total | 346 | 100.0% |
Housing Structures by Occupancy in Dulac
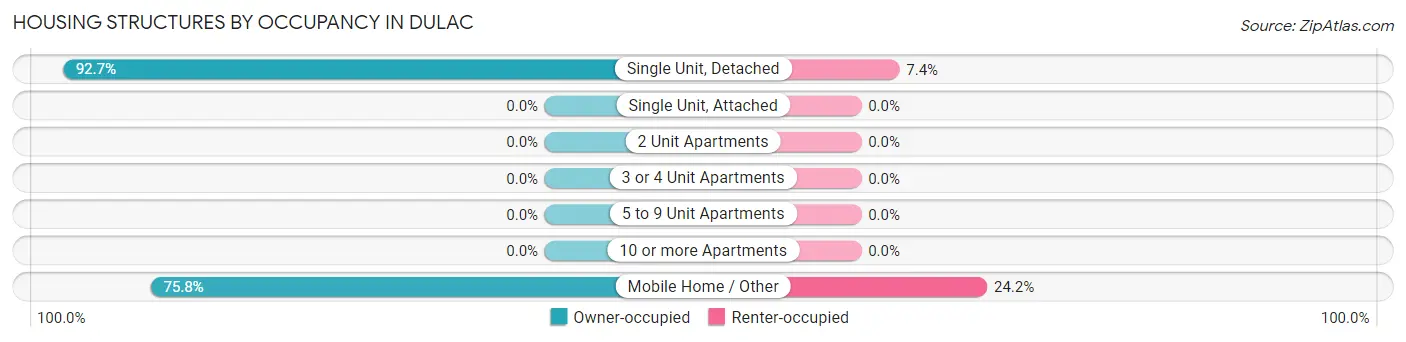
| Structure Type | Owner-occupied | Renter-occupied |
| Single Unit, Detached | 290 (92.6%) | 23 (7.3%) |
| Single Unit, Attached | 0 (0.0%) | 0 (0.0%) |
| 2 Unit Apartments | 0 (0.0%) | 0 (0.0%) |
| 3 or 4 Unit Apartments | 0 (0.0%) | 0 (0.0%) |
| 5 to 9 Unit Apartments | 0 (0.0%) | 0 (0.0%) |
| 10 or more Apartments | 0 (0.0%) | 0 (0.0%) |
| Mobile Home / Other | 25 (75.8%) | 8 (24.2%) |
| Total | 315 (91.0%) | 31 (9.0%) |
Housing Structures by Number of Rooms in Dulac
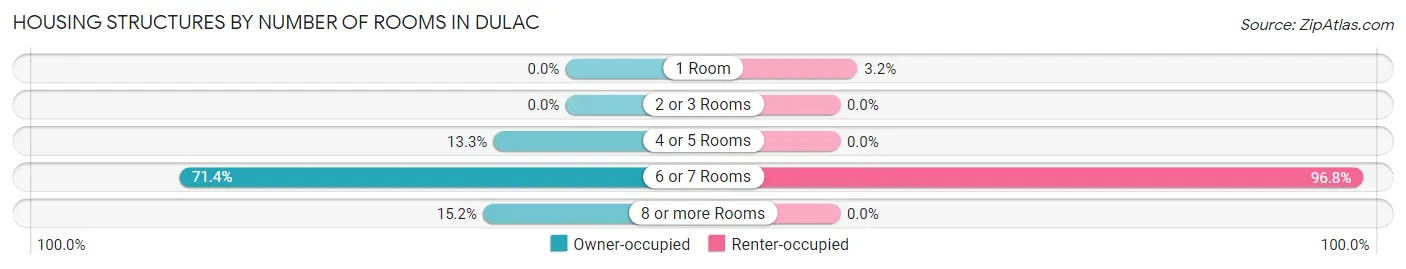
| Number of Rooms | Owner-occupied | Renter-occupied |
| 1 Room | 0 (0.0%) | 1 (3.2%) |
| 2 or 3 Rooms | 0 (0.0%) | 0 (0.0%) |
| 4 or 5 Rooms | 42 (13.3%) | 0 (0.0%) |
| 6 or 7 Rooms | 225 (71.4%) | 30 (96.8%) |
| 8 or more Rooms | 48 (15.2%) | 0 (0.0%) |
| Total | 315 (100.0%) | 31 (100.0%) |
Housing Structure by Heating Type in Dulac
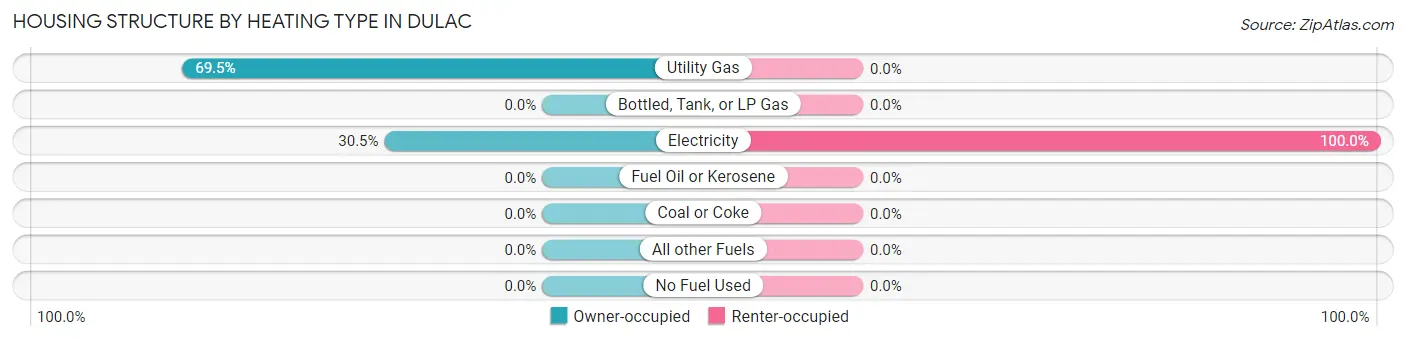
| Heating Type | Owner-occupied | Renter-occupied |
| Utility Gas | 219 (69.5%) | 0 (0.0%) |
| Bottled, Tank, or LP Gas | 0 (0.0%) | 0 (0.0%) |
| Electricity | 96 (30.5%) | 31 (100.0%) |
| Fuel Oil or Kerosene | 0 (0.0%) | 0 (0.0%) |
| Coal or Coke | 0 (0.0%) | 0 (0.0%) |
| All other Fuels | 0 (0.0%) | 0 (0.0%) |
| No Fuel Used | 0 (0.0%) | 0 (0.0%) |
| Total | 315 (100.0%) | 31 (100.0%) |
Household Vehicle Usage in Dulac
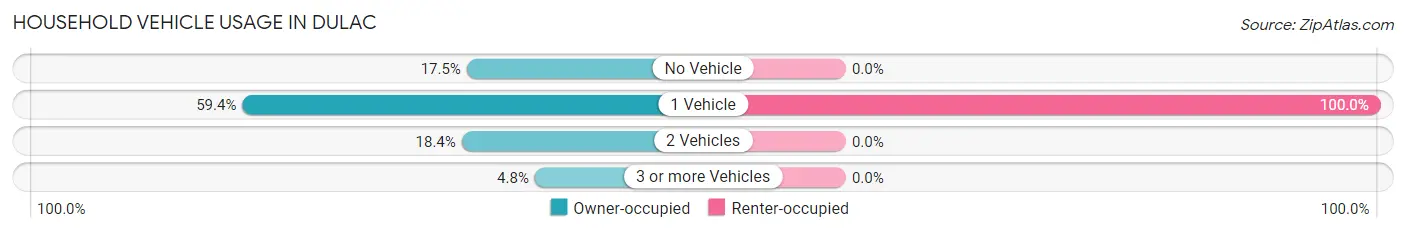
| Vehicles per Household | Owner-occupied | Renter-occupied |
| No Vehicle | 55 (17.5%) | 0 (0.0%) |
| 1 Vehicle | 187 (59.4%) | 31 (100.0%) |
| 2 Vehicles | 58 (18.4%) | 0 (0.0%) |
| 3 or more Vehicles | 15 (4.8%) | 0 (0.0%) |
| Total | 315 (100.0%) | 31 (100.0%) |
Real Estate & Mortgages in Dulac
Real Estate and Mortgage Overview in Dulac
| Characteristic | Without Mortgage | With Mortgage |
| Housing Units | 294 | 21 |
| Median Property Value | $87,300 | $165,400 |
| Median Household Income | $23,088 | $0 |
| Monthly Housing Costs | $267 | $10 |
| Real Estate Taxes | $272 | $0 |
Property Value by Mortgage Status in Dulac
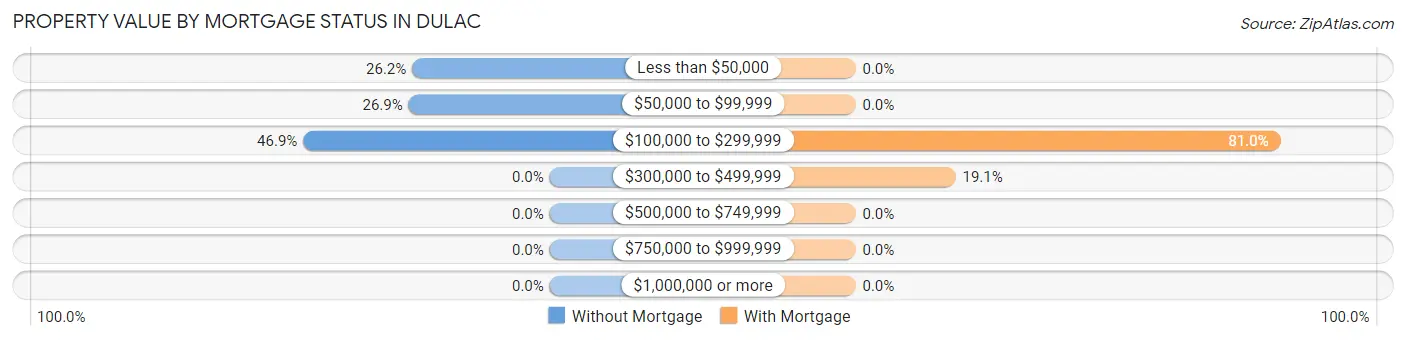
| Property Value | Without Mortgage | With Mortgage |
| Less than $50,000 | 77 (26.2%) | 0 (0.0%) |
| $50,000 to $99,999 | 79 (26.9%) | 0 (0.0%) |
| $100,000 to $299,999 | 138 (46.9%) | 17 (80.9%) |
| $300,000 to $499,999 | 0 (0.0%) | 4 (19.1%) |
| $500,000 to $749,999 | 0 (0.0%) | 0 (0.0%) |
| $750,000 to $999,999 | 0 (0.0%) | 0 (0.0%) |
| $1,000,000 or more | 0 (0.0%) | 0 (0.0%) |
| Total | 294 (100.0%) | 21 (100.0%) |
Household Income by Mortgage Status in Dulac
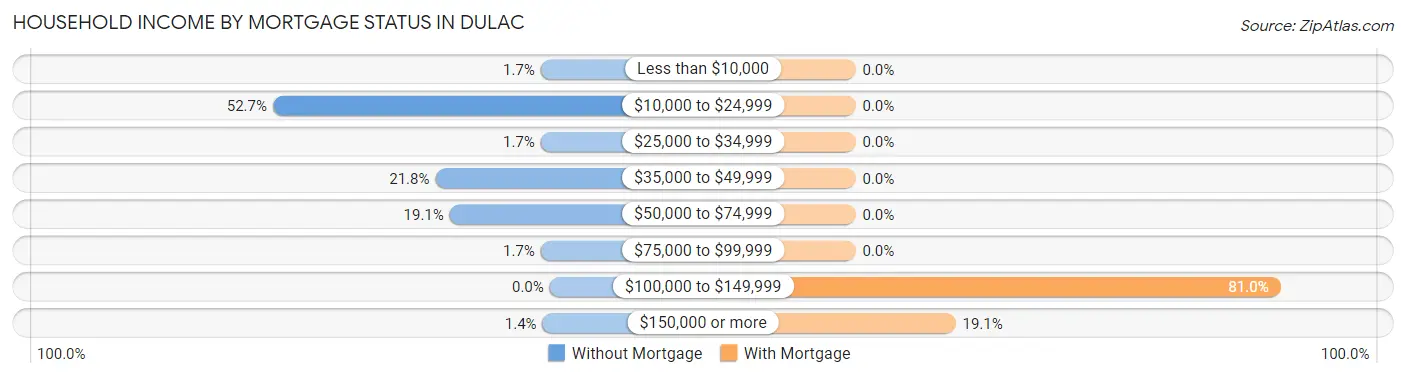
| Household Income | Without Mortgage | With Mortgage |
| Less than $10,000 | 5 (1.7%) | 0 (0.0%) |
| $10,000 to $24,999 | 155 (52.7%) | 0 (0.0%) |
| $25,000 to $34,999 | 5 (1.7%) | 0 (0.0%) |
| $35,000 to $49,999 | 64 (21.8%) | 0 (0.0%) |
| $50,000 to $74,999 | 56 (19.1%) | 0 (0.0%) |
| $75,000 to $99,999 | 5 (1.7%) | 0 (0.0%) |
| $100,000 to $149,999 | 0 (0.0%) | 17 (80.9%) |
| $150,000 or more | 4 (1.4%) | 4 (19.1%) |
| Total | 294 (100.0%) | 21 (100.0%) |
Property Value to Household Income Ratio in Dulac
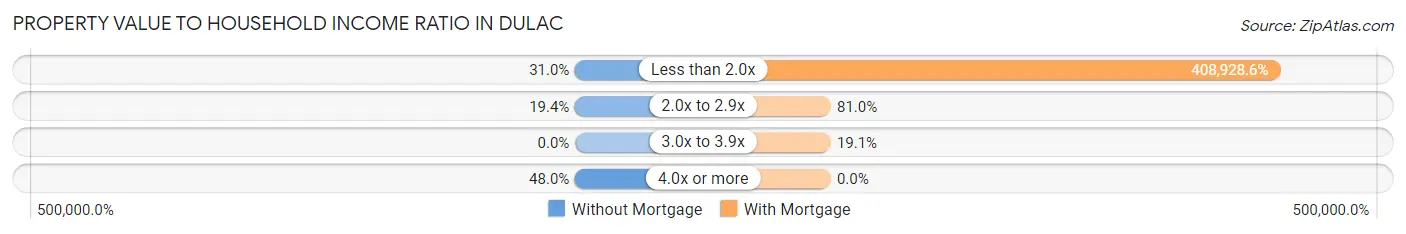
| Value-to-Income Ratio | Without Mortgage | With Mortgage |
| Less than 2.0x | 91 (30.9%) | 85,875 (408,928.6%) |
| 2.0x to 2.9x | 57 (19.4%) | 17 (80.9%) |
| 3.0x to 3.9x | 0 (0.0%) | 4 (19.1%) |
| 4.0x or more | 141 (48.0%) | 0 (0.0%) |
| Total | 294 (100.0%) | 21 (100.0%) |
Real Estate Taxes by Mortgage Status in Dulac
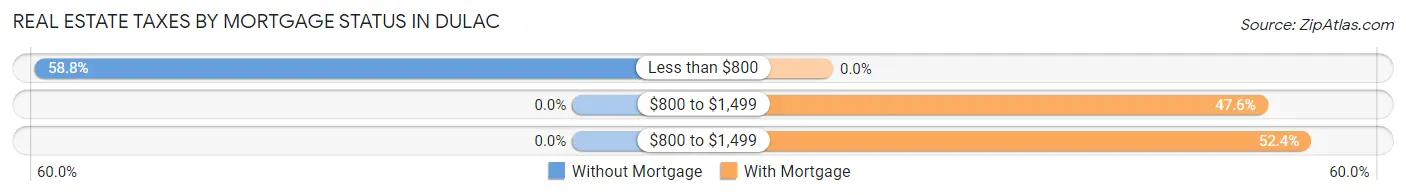
| Property Taxes | Without Mortgage | With Mortgage |
| Less than $800 | 173 (58.8%) | 0 (0.0%) |
| $800 to $1,499 | 0 (0.0%) | 10 (47.6%) |
| $800 to $1,499 | 0 (0.0%) | 11 (52.4%) |
| Total | 294 (100.0%) | 21 (100.0%) |
Health & Disability in Dulac
Health Insurance Coverage by Age in Dulac
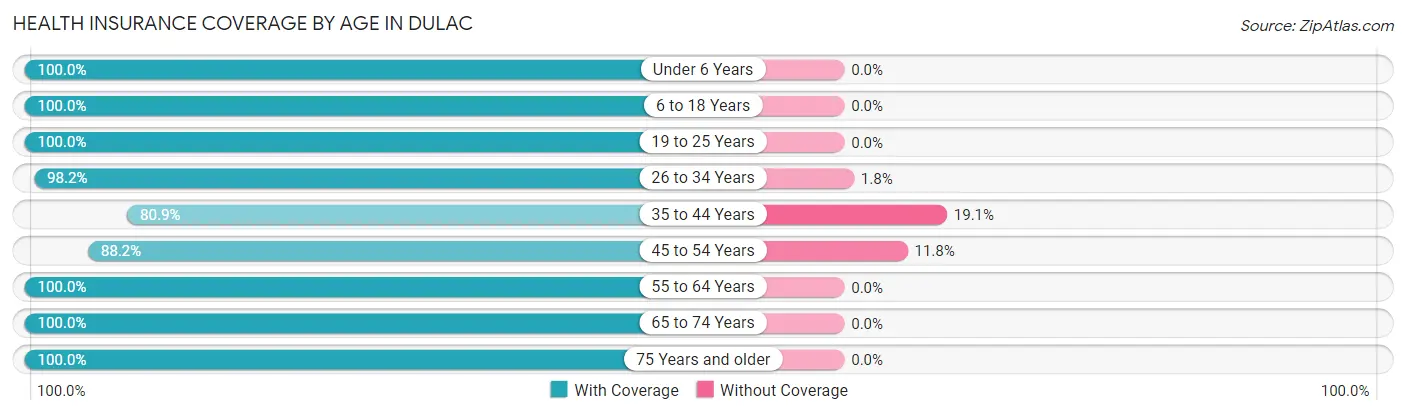
| Age Bracket | With Coverage | Without Coverage |
| Under 6 Years | 7 (100.0%) | 0 (0.0%) |
| 6 to 18 Years | 165 (100.0%) | 0 (0.0%) |
| 19 to 25 Years | 71 (100.0%) | 0 (0.0%) |
| 26 to 34 Years | 55 (98.2%) | 1 (1.8%) |
| 35 to 44 Years | 93 (80.9%) | 22 (19.1%) |
| 45 to 54 Years | 157 (88.2%) | 21 (11.8%) |
| 55 to 64 Years | 27 (100.0%) | 0 (0.0%) |
| 65 to 74 Years | 149 (100.0%) | 0 (0.0%) |
| 75 Years and older | 76 (100.0%) | 0 (0.0%) |
| Total | 800 (94.8%) | 44 (5.2%) |
Health Insurance Coverage by Citizenship Status in Dulac
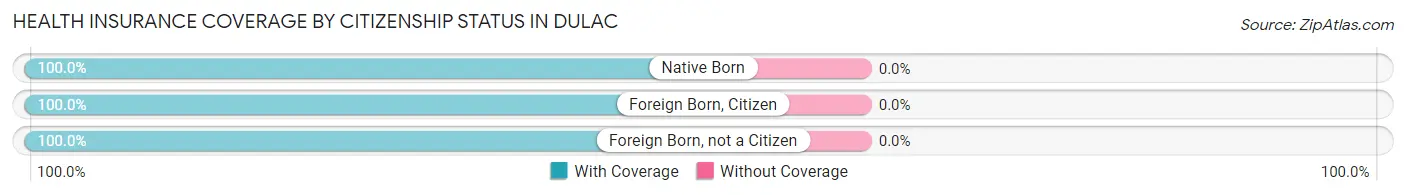
| Citizenship Status | With Coverage | Without Coverage |
| Native Born | 7 (100.0%) | 0 (0.0%) |
| Foreign Born, Citizen | 165 (100.0%) | 0 (0.0%) |
| Foreign Born, not a Citizen | 71 (100.0%) | 0 (0.0%) |
Health Insurance Coverage by Household Income in Dulac
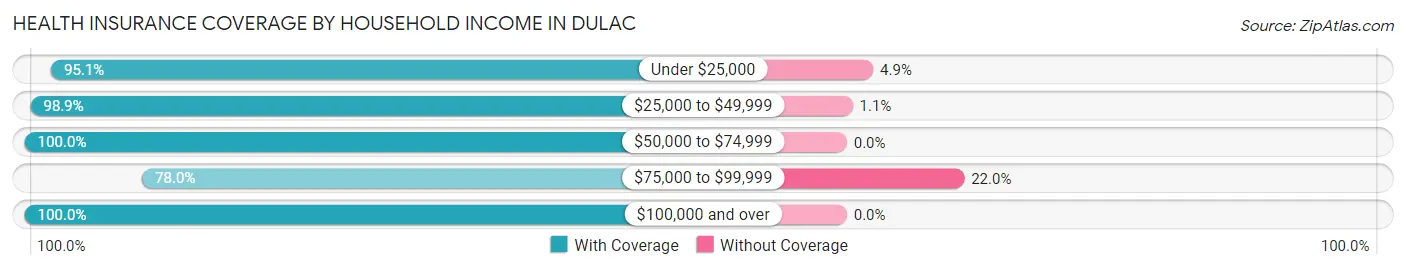
| Household Income | With Coverage | Without Coverage |
| Under $25,000 | 404 (95.1%) | 21 (4.9%) |
| $25,000 to $49,999 | 91 (98.9%) | 1 (1.1%) |
| $50,000 to $74,999 | 199 (100.0%) | 0 (0.0%) |
| $75,000 to $99,999 | 78 (78.0%) | 22 (22.0%) |
| $100,000 and over | 28 (100.0%) | 0 (0.0%) |
Public vs Private Health Insurance Coverage by Age in Dulac
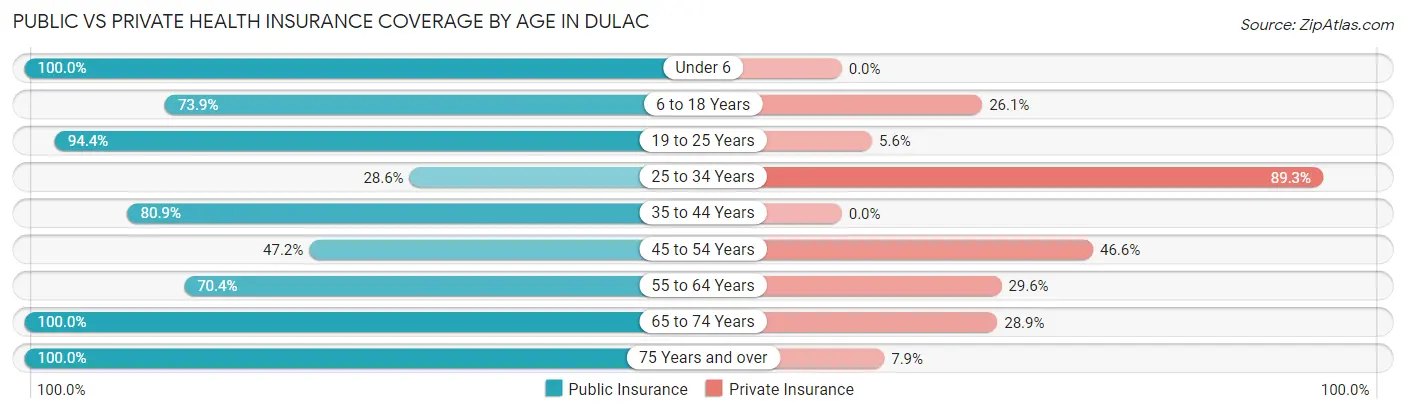
| Age Bracket | Public Insurance | Private Insurance |
| Under 6 | 7 (100.0%) | 0 (0.0%) |
| 6 to 18 Years | 122 (73.9%) | 43 (26.1%) |
| 19 to 25 Years | 67 (94.4%) | 4 (5.6%) |
| 25 to 34 Years | 16 (28.6%) | 50 (89.3%) |
| 35 to 44 Years | 93 (80.9%) | 0 (0.0%) |
| 45 to 54 Years | 84 (47.2%) | 83 (46.6%) |
| 55 to 64 Years | 19 (70.4%) | 8 (29.6%) |
| 65 to 74 Years | 149 (100.0%) | 43 (28.9%) |
| 75 Years and over | 76 (100.0%) | 6 (7.9%) |
| Total | 633 (75.0%) | 237 (28.1%) |
Disability Status by Sex by Age in Dulac
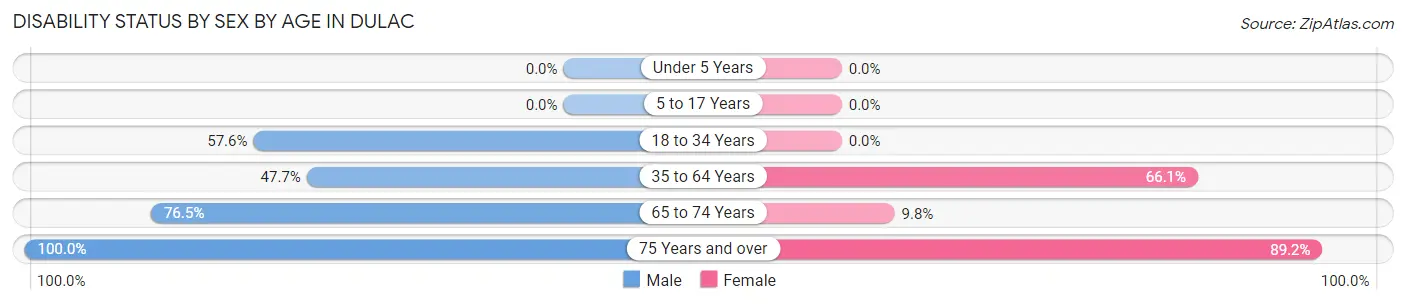
| Age Bracket | Male | Female |
| Under 5 Years | 0 (0.0%) | 0 (0.0%) |
| 5 to 17 Years | 0 (0.0%) | 0 (0.0%) |
| 18 to 34 Years | 61 (57.6%) | 0 (0.0%) |
| 35 to 64 Years | 71 (47.6%) | 113 (66.1%) |
| 65 to 74 Years | 75 (76.5%) | 5 (9.8%) |
| 75 Years and over | 39 (100.0%) | 33 (89.2%) |
Disability Class by Sex by Age in Dulac
Disability Class: Hearing Difficulty
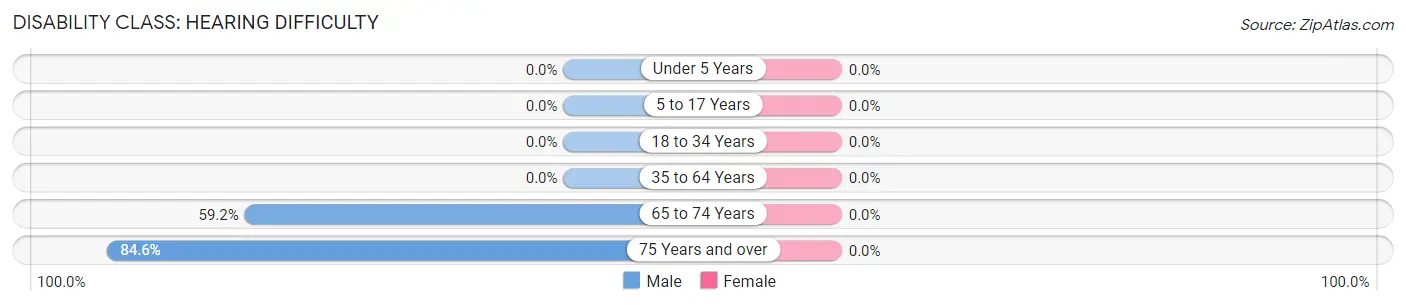
| Age Bracket | Male | Female |
| Under 5 Years | 0 (0.0%) | 0 (0.0%) |
| 5 to 17 Years | 0 (0.0%) | 0 (0.0%) |
| 18 to 34 Years | 0 (0.0%) | 0 (0.0%) |
| 35 to 64 Years | 0 (0.0%) | 0 (0.0%) |
| 65 to 74 Years | 58 (59.2%) | 0 (0.0%) |
| 75 Years and over | 33 (84.6%) | 0 (0.0%) |
Disability Class: Vision Difficulty
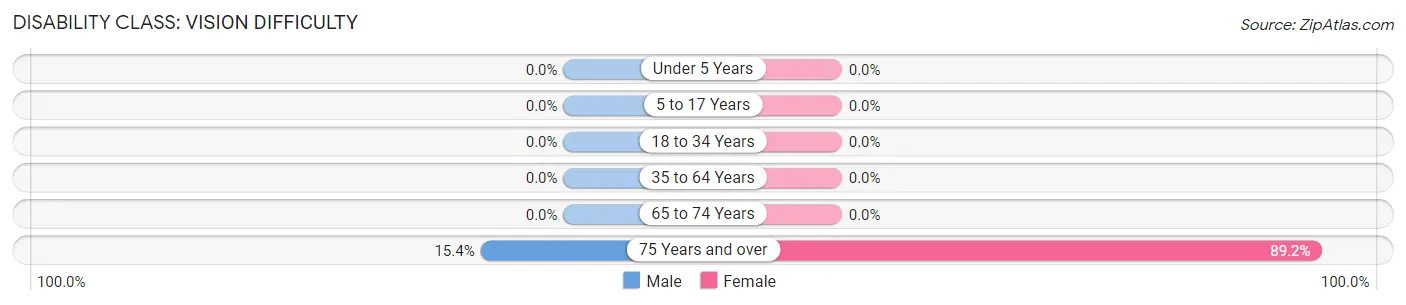
| Age Bracket | Male | Female |
| Under 5 Years | 0 (0.0%) | 0 (0.0%) |
| 5 to 17 Years | 0 (0.0%) | 0 (0.0%) |
| 18 to 34 Years | 0 (0.0%) | 0 (0.0%) |
| 35 to 64 Years | 0 (0.0%) | 0 (0.0%) |
| 65 to 74 Years | 0 (0.0%) | 0 (0.0%) |
| 75 Years and over | 6 (15.4%) | 33 (89.2%) |
Disability Class: Cognitive Difficulty
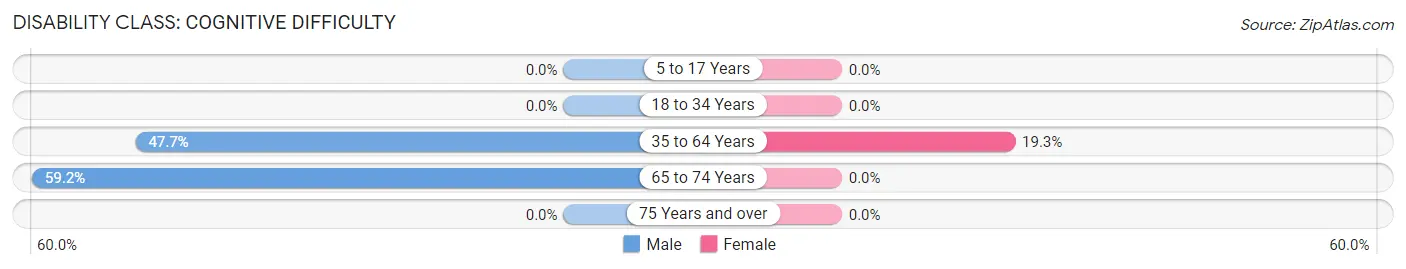
| Age Bracket | Male | Female |
| 5 to 17 Years | 0 (0.0%) | 0 (0.0%) |
| 18 to 34 Years | 0 (0.0%) | 0 (0.0%) |
| 35 to 64 Years | 71 (47.6%) | 33 (19.3%) |
| 65 to 74 Years | 58 (59.2%) | 0 (0.0%) |
| 75 Years and over | 0 (0.0%) | 0 (0.0%) |
Disability Class: Ambulatory Difficulty
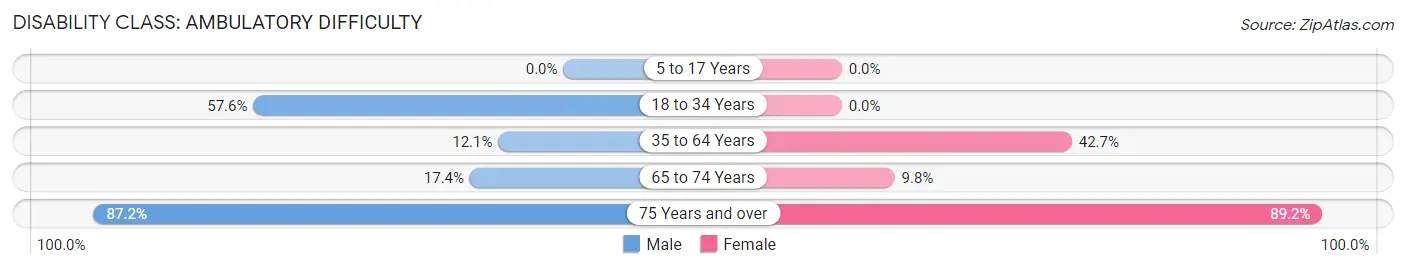
| Age Bracket | Male | Female |
| 5 to 17 Years | 0 (0.0%) | 0 (0.0%) |
| 18 to 34 Years | 61 (57.6%) | 0 (0.0%) |
| 35 to 64 Years | 18 (12.1%) | 73 (42.7%) |
| 65 to 74 Years | 17 (17.3%) | 5 (9.8%) |
| 75 Years and over | 34 (87.2%) | 33 (89.2%) |
Disability Class: Self-Care Difficulty
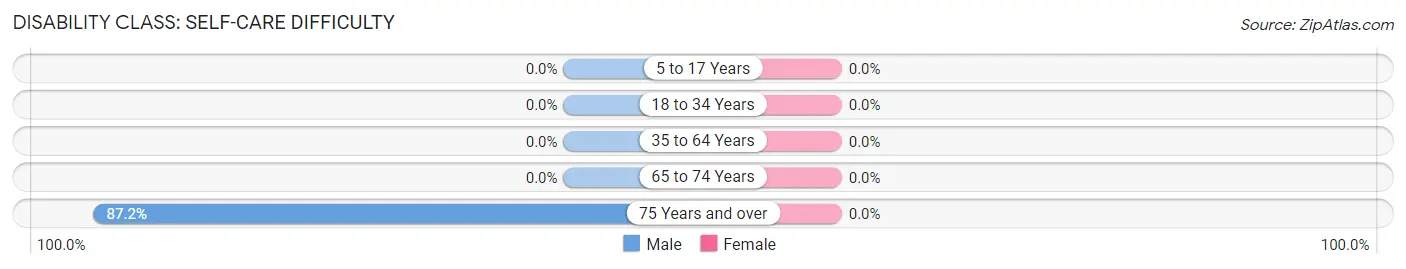
| Age Bracket | Male | Female |
| 5 to 17 Years | 0 (0.0%) | 0 (0.0%) |
| 18 to 34 Years | 0 (0.0%) | 0 (0.0%) |
| 35 to 64 Years | 0 (0.0%) | 0 (0.0%) |
| 65 to 74 Years | 0 (0.0%) | 0 (0.0%) |
| 75 Years and over | 34 (87.2%) | 0 (0.0%) |
Technology Access in Dulac
Computing Device Access in Dulac
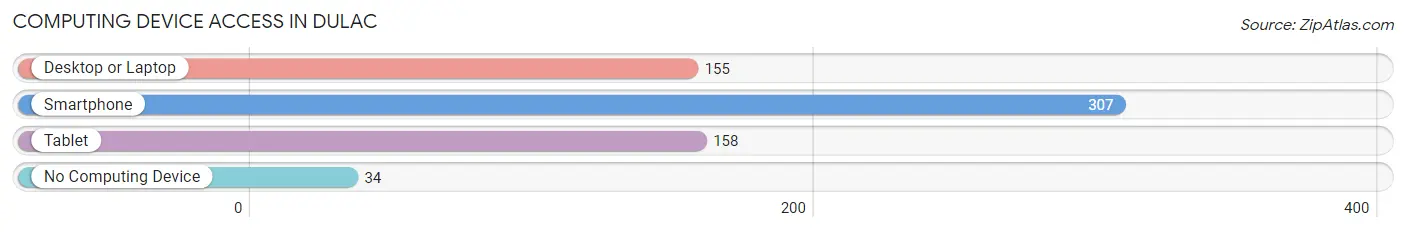
| Device Type | # Households | % Households |
| Desktop or Laptop | 155 | 44.8% |
| Smartphone | 307 | 88.7% |
| Tablet | 158 | 45.7% |
| No Computing Device | 34 | 9.8% |
| Total | 346 | 100.0% |
Internet Access in Dulac
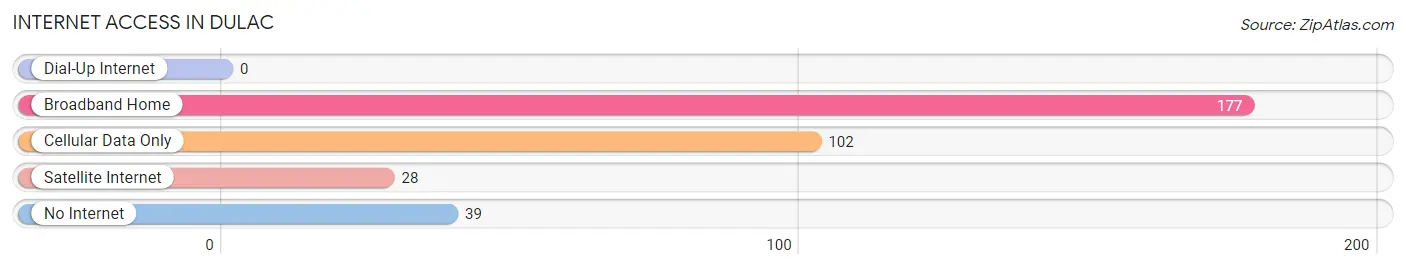
| Internet Type | # Households | % Households |
| Dial-Up Internet | 0 | 0.0% |
| Broadband Home | 177 | 51.2% |
| Cellular Data Only | 102 | 29.5% |
| Satellite Internet | 28 | 8.1% |
| No Internet | 39 | 11.3% |
| Total | 346 | 100.0% |
Dulac Summary
Dulac is a small unincorporated community located in Terrebonne Parish, Louisiana. It is situated on the banks of Bayou Grand Caillou, approximately 25 miles southwest of Houma, the parish seat. The population of Dulac was 2,845 at the 2010 census.
History
The area now known as Dulac was originally inhabited by the Chitimacha Indians. The first European settlers arrived in the area in the late 1700s, and the community was officially established in 1883. The name “Dulac” is derived from the French phrase “du lac”, which means “of the lake”.
The area was originally a fishing and shrimping community, and the economy was largely based on the seafood industry. In the early 1900s, the area began to develop as a tourist destination, and the first hotel was built in the area in 1910.
In the 1950s, the area began to experience a population boom as oil and gas exploration increased in the region. This led to the development of several new businesses, including a grocery store, a gas station, and a post office.
Geography
Dulac is located in Terrebonne Parish, Louisiana, approximately 25 miles southwest of Houma, the parish seat. It is situated on the banks of Bayou Grand Caillou, a tributary of the Gulf of Mexico. The area is characterized by flat, marshy terrain, and is home to a variety of wildlife, including alligators, turtles, and a variety of birds.
Economy
The economy of Dulac is largely based on the seafood industry. The area is home to a number of seafood processing plants, as well as several commercial fishing operations. In addition, the area is home to a number of small businesses, including restaurants, convenience stores, and gas stations.
Demographics
As of the 2010 census, the population of Dulac was 2,845. The racial makeup of the town was 79.3% White, 17.2% African American, 0.7% Native American, 0.3% Asian, 0.1% Pacific Islander, and 2.4% from other races. The median household income was $30,938, and the median family income was $37,813.
Conclusion
Dulac is a small unincorporated community located in Terrebonne Parish, Louisiana. It is situated on the banks of Bayou Grand Caillou, approximately 25 miles southwest of Houma, the parish seat. The population of Dulac was 2,845 at the 2010 census. The economy of Dulac is largely based on the seafood industry, and the area is home to a number of small businesses. The racial makeup of the town was 79.3% White, 17.2% African American, 0.7% Native American, 0.3% Asian, 0.1% Pacific Islander, and 2.4% from other races. The median household income was $30,938, and the median family income was $37,813.
Common Questions
What is Per Capita Income in Dulac?
Per Capita income in Dulac is $17,216.
What is the Median Family Income in Dulac?
Median Family Income in Dulac is $35,754.
What is the Median Household income in Dulac?
Median Household Income in Dulac is $33,750.
What is Income or Wage Gap in Dulac?
Income or Wage Gap in Dulac is 69.4%.
Women in Dulac earn 30.6 cents for every dollar earned by a man.
What is Family Income Deficit in Dulac?
Family Income Deficit in Dulac is $4,547.
Families that are below poverty line in Dulac earn $4,547 less on average than the poverty threshold level.
What is Inequality or Gini Index in Dulac?
Inequality or Gini Index in Dulac is 0.38.
What is the Total Population of Dulac?
Total Population of Dulac is 844.
What is the Total Male Population of Dulac?
Total Male Population of Dulac is 528.
What is the Total Female Population of Dulac?
Total Female Population of Dulac is 316.
What is the Ratio of Males per 100 Females in Dulac?
There are 167.09 Males per 100 Females in Dulac.
What is the Ratio of Females per 100 Males in Dulac?
There are 59.85 Females per 100 Males in Dulac.
What is the Median Population Age in Dulac?
Median Population Age in Dulac is 45.1 Years.
What is the Average Family Size in Dulac
Average Family Size in Dulac is 2.8 People.
What is the Average Household Size in Dulac
Average Household Size in Dulac is 2.4 People.
How Large is the Labor Force in Dulac?
There are 327 People in the Labor Forcein in Dulac.
What is the Percentage of People in the Labor Force in Dulac?
45.4% of People are in the Labor Force in Dulac.
What is the Unemployment Rate in Dulac?
Unemployment Rate in Dulac is 19.6%.