Des Allemands, LA Map & Demographics
Des Allemands Map
Des Allemands Overview
$62,413
PER CAPITA INCOME
$65,821
AVG FAMILY INCOME
$67,429
AVG HOUSEHOLD INCOME
28.6%
WAGE / INCOME GAP [ % ]
71.4¢/ $1
WAGE / INCOME GAP [ $ ]
0.61
INEQUALITY / GINI INDEX
2,340
TOTAL POPULATION
1,109
MALE POPULATION
1,231
FEMALE POPULATION
90.09
MALES / 100 FEMALES
111.00
FEMALES / 100 MALES
39.9
MEDIAN AGE
3.1
AVG FAMILY SIZE
2.8
AVG HOUSEHOLD SIZE
1,121
LABOR FORCE [ PEOPLE ]
56.9%
PERCENT IN LABOR FORCE
5.7%
UNEMPLOYMENT RATE
Des Allemands Zip Codes
Des Allemands Area Codes
Income in Des Allemands
Income Overview in Des Allemands
Per Capita Income in Des Allemands is $62,413, while median incomes of families and households are $65,821 and $67,429 respectively.
| Characteristic | Number | Measure |
| Per Capita Income | 2,340 | $62,413 |
| Median Family Income | 647 | $65,821 |
| Mean Family Income | 647 | $91,583 |
| Median Household Income | 846 | $67,429 |
| Mean Household Income | 846 | $168,016 |
| Income Deficit | 647 | $0 |
| Wage / Income Gap (%) | 2,340 | 28.60% |
| Wage / Income Gap ($) | 2,340 | 71.40¢ per $1 |
| Gini / Inequality Index | 2,340 | 0.61 |
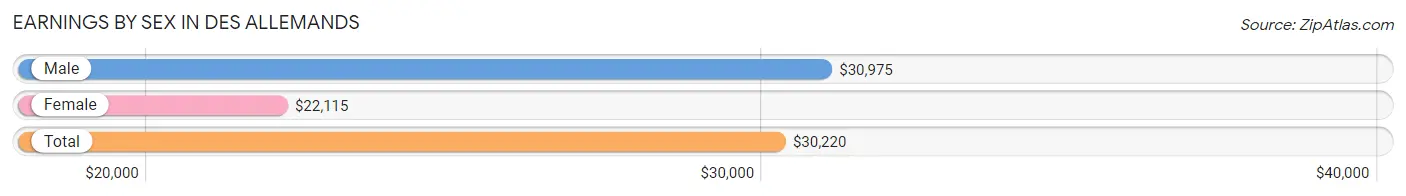
Earnings by Sex in Des Allemands
Average Earnings in Des Allemands are $30,220, $30,975 for men and $22,115 for women, a difference of 28.6%.
| Sex | Number | Average Earnings |
| Male | 713 (52.2%) | $30,975 |
| Female | 654 (47.8%) | $22,115 |
| Total | 1,367 (100.0%) | $30,220 |
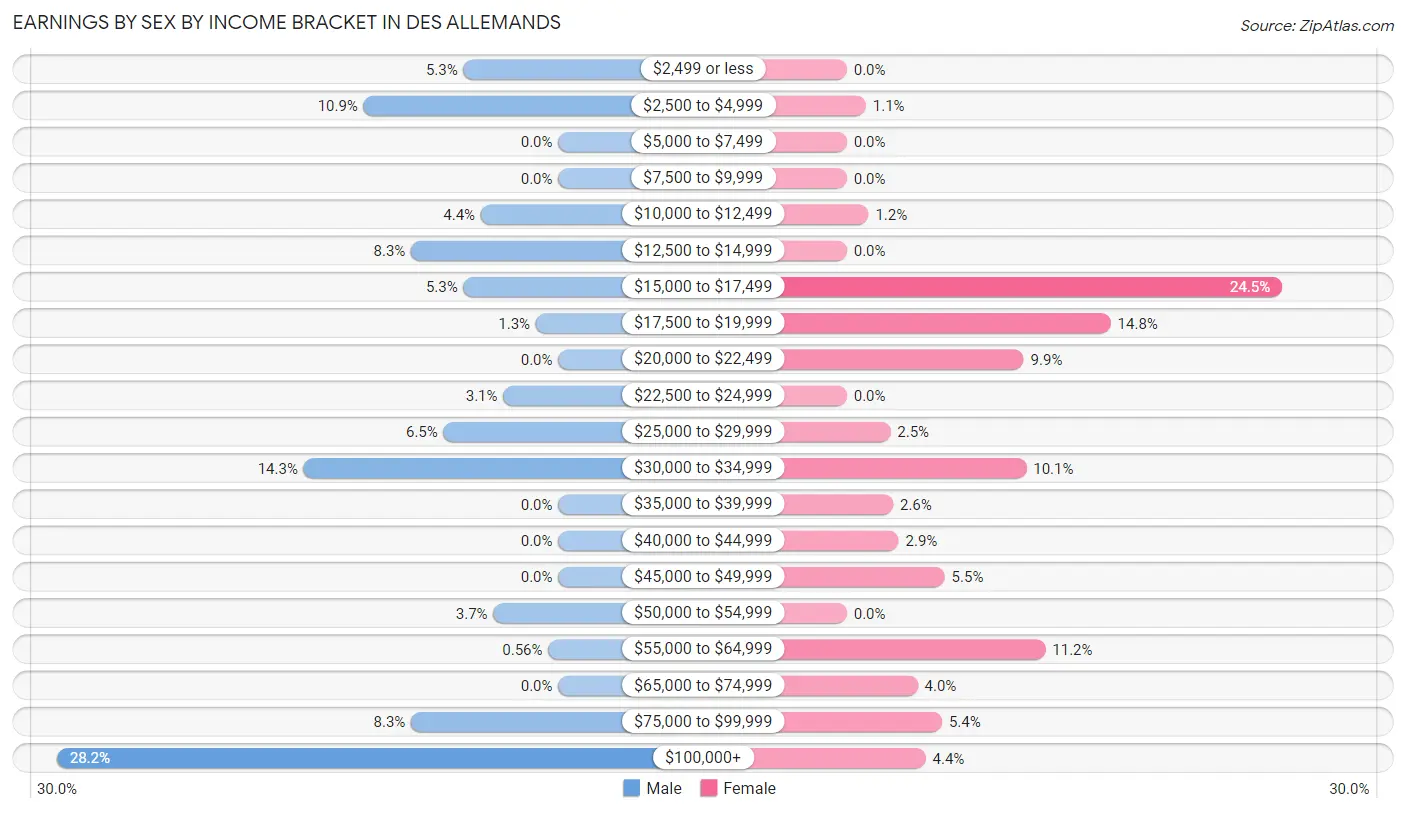
Earnings by Sex by Income Bracket in Des Allemands
The most common earnings brackets in Des Allemands are $100,000+ for men (201 | 28.2%) and $15,000 to $17,499 for women (160 | 24.5%).
| Income | Male | Female |
| $2,499 or less | 38 (5.3%) | 0 (0.0%) |
| $2,500 to $4,999 | 78 (10.9%) | 7 (1.1%) |
| $5,000 to $7,499 | 0 (0.0%) | 0 (0.0%) |
| $7,500 to $9,999 | 0 (0.0%) | 0 (0.0%) |
| $10,000 to $12,499 | 31 (4.3%) | 8 (1.2%) |
| $12,500 to $14,999 | 59 (8.3%) | 0 (0.0%) |
| $15,000 to $17,499 | 38 (5.3%) | 160 (24.5%) |
| $17,500 to $19,999 | 9 (1.3%) | 97 (14.8%) |
| $20,000 to $22,499 | 0 (0.0%) | 65 (9.9%) |
| $22,500 to $24,999 | 22 (3.1%) | 0 (0.0%) |
| $25,000 to $29,999 | 46 (6.5%) | 16 (2.5%) |
| $30,000 to $34,999 | 102 (14.3%) | 66 (10.1%) |
| $35,000 to $39,999 | 0 (0.0%) | 17 (2.6%) |
| $40,000 to $44,999 | 0 (0.0%) | 19 (2.9%) |
| $45,000 to $49,999 | 0 (0.0%) | 36 (5.5%) |
| $50,000 to $54,999 | 26 (3.6%) | 0 (0.0%) |
| $55,000 to $64,999 | 4 (0.6%) | 73 (11.2%) |
| $65,000 to $74,999 | 0 (0.0%) | 26 (4.0%) |
| $75,000 to $99,999 | 59 (8.3%) | 35 (5.3%) |
| $100,000+ | 201 (28.2%) | 29 (4.4%) |
| Total | 713 (100.0%) | 654 (100.0%) |
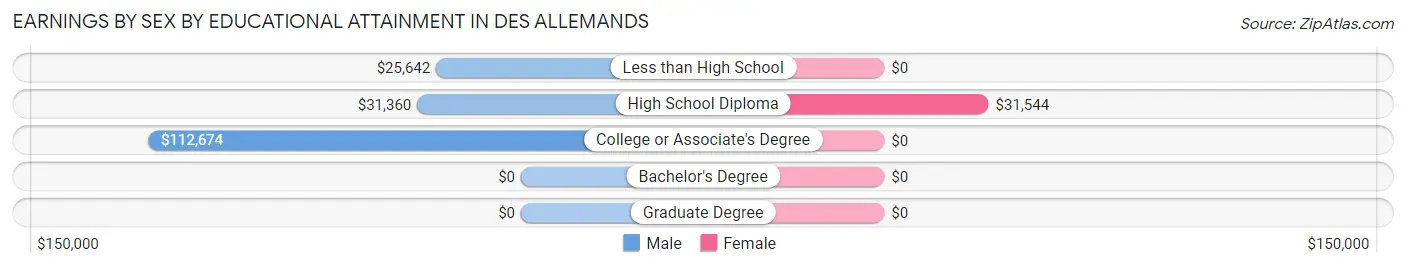
Earnings by Sex by Educational Attainment in Des Allemands
| Educational Attainment | Male Income | Female Income |
| Less than High School | $25,642 | $0 |
| High School Diploma | $31,360 | $31,544 |
| College or Associate's Degree | $112,674 | $0 |
| Bachelor's Degree | - | - |
| Graduate Degree | - | - |
| Total | - | - |
Family Income in Des Allemands
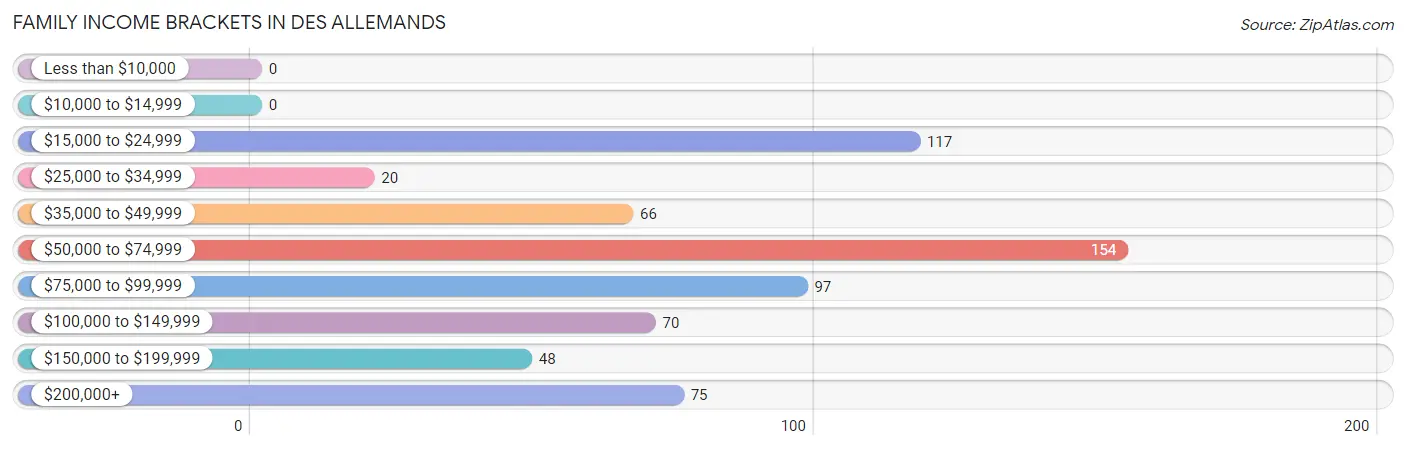
Family Income Brackets in Des Allemands
According to the Des Allemands family income data, there are 154 families falling into the $50,000 to $74,999 income range, which is the most common income bracket and makes up 23.8% of all families.
| Income Bracket | # Families | % Families |
| Less than $10,000 | 0 | 0.0% |
| $10,000 to $14,999 | 0 | 0.0% |
| $15,000 to $24,999 | 117 | 18.1% |
| $25,000 to $34,999 | 20 | 3.1% |
| $35,000 to $49,999 | 66 | 10.2% |
| $50,000 to $74,999 | 154 | 23.8% |
| $75,000 to $99,999 | 97 | 15.0% |
| $100,000 to $149,999 | 70 | 10.8% |
| $150,000 to $199,999 | 48 | 7.4% |
| $200,000+ | 75 | 11.6% |
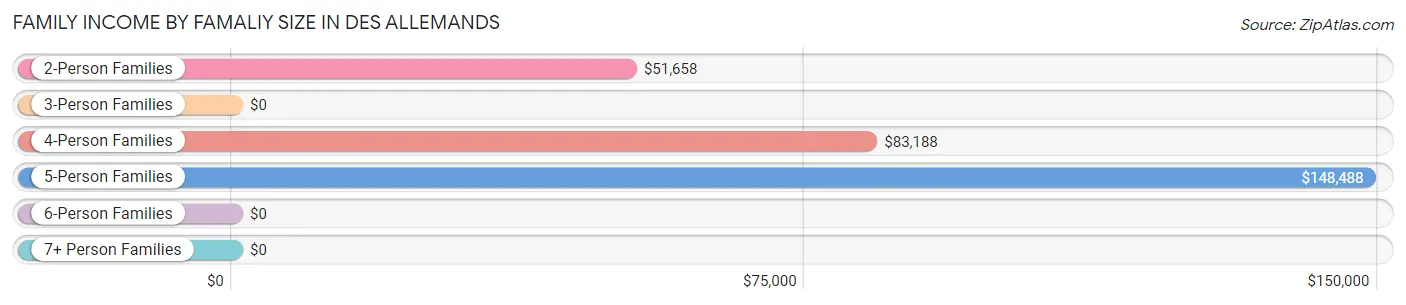
Family Income by Famaliy Size in Des Allemands
5-person families (90 | 13.9%) account for the highest median family income in Des Allemands with $148,488 per family, while 5-person families (90 | 13.9%) have the highest median income of $29,698 per family member.
| Income Bracket | # Families | Median Income |
| 2-Person Families | 311 (48.1%) | $51,658 |
| 3-Person Families | 135 (20.9%) | $0 |
| 4-Person Families | 111 (17.2%) | $83,188 |
| 5-Person Families | 90 (13.9%) | $148,488 |
| 6-Person Families | 0 (0.0%) | $0 |
| 7+ Person Families | 0 (0.0%) | $0 |
| Total | 647 (100.0%) | $65,821 |
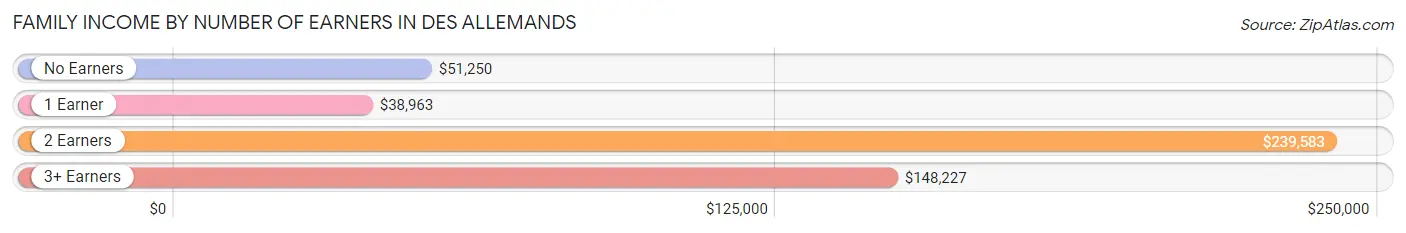
Family Income by Number of Earners in Des Allemands
The median family income in Des Allemands is $65,821, with families comprising 2 earners (123) having the highest median family income of $239,583, while families with 1 earner (295) have the lowest median family income of $38,963, accounting for 19.0% and 45.6% of families, respectively.
| Number of Earners | # Families | Median Income |
| No Earners | 84 (13.0%) | $51,250 |
| 1 Earner | 295 (45.6%) | $38,963 |
| 2 Earners | 123 (19.0%) | $239,583 |
| 3+ Earners | 145 (22.4%) | $148,227 |
| Total | 647 (100.0%) | $65,821 |
Household Income in Des Allemands
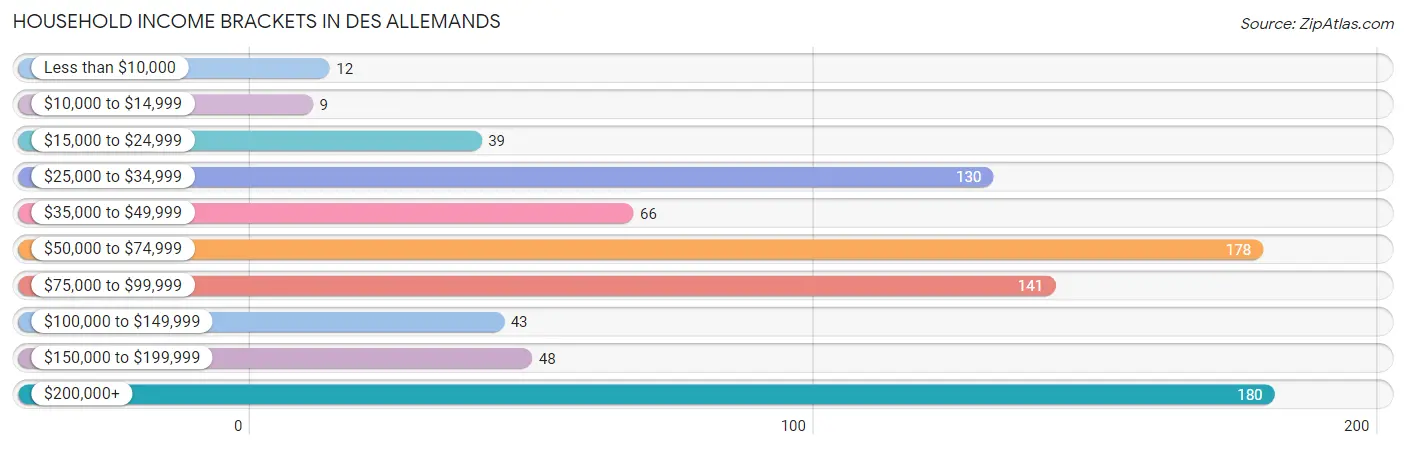
Household Income Brackets in Des Allemands
With 180 households falling in the category, the $200,000+ income range is the most frequent in Des Allemands, accounting for 21.3% of all households. In contrast, only 9 households (1.1%) fall into the $10,000 to $14,999 income bracket, making it the least populous group.
| Income Bracket | # Households | % Households |
| Less than $10,000 | 12 | 1.4% |
| $10,000 to $14,999 | 9 | 1.1% |
| $15,000 to $24,999 | 39 | 4.6% |
| $25,000 to $34,999 | 130 | 15.4% |
| $35,000 to $49,999 | 66 | 7.8% |
| $50,000 to $74,999 | 178 | 21.0% |
| $75,000 to $99,999 | 141 | 16.7% |
| $100,000 to $149,999 | 43 | 5.1% |
| $150,000 to $199,999 | 48 | 5.7% |
| $200,000+ | 180 | 21.3% |
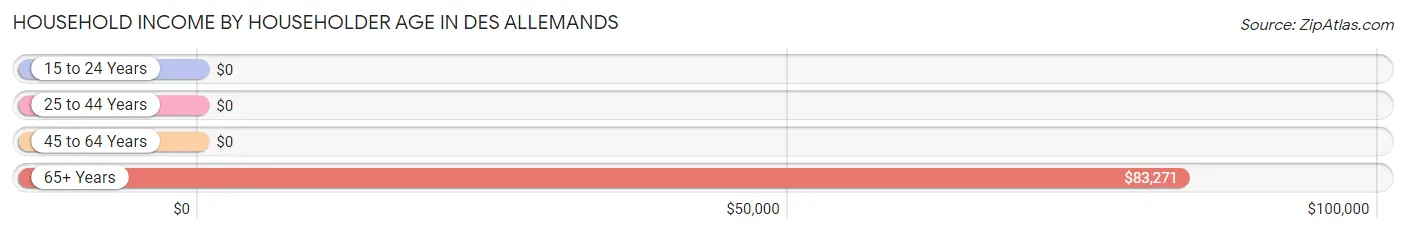
Household Income by Householder Age in Des Allemands
The median household income in Des Allemands is $67,429, with the highest median household income of $83,271 found in the 65+ years age bracket for the primary householder. A total of 379 households (44.8%) fall into this category. Meanwhile, the 15 to 24 years age bracket for the primary householder has the lowest median household income of $0, with 97 households (11.5%) in this group.
| Income Bracket | # Households | Median Income |
| 15 to 24 Years | 97 (11.5%) | $0 |
| 25 to 44 Years | 181 (21.4%) | $0 |
| 45 to 64 Years | 189 (22.3%) | $0 |
| 65+ Years | 379 (44.8%) | $83,271 |
| Total | 846 (100.0%) | $67,429 |
Poverty in Des Allemands
Income Below Poverty by Sex and Age in Des Allemands
With 18.5% poverty level for males and 13.8% for females among the residents of Des Allemands, under 5 year old males and 16 and 17 year old females are the most vulnerable to poverty, with 65 males (76.5%) and 10 females (100.0%) in their respective age groups living below the poverty level.
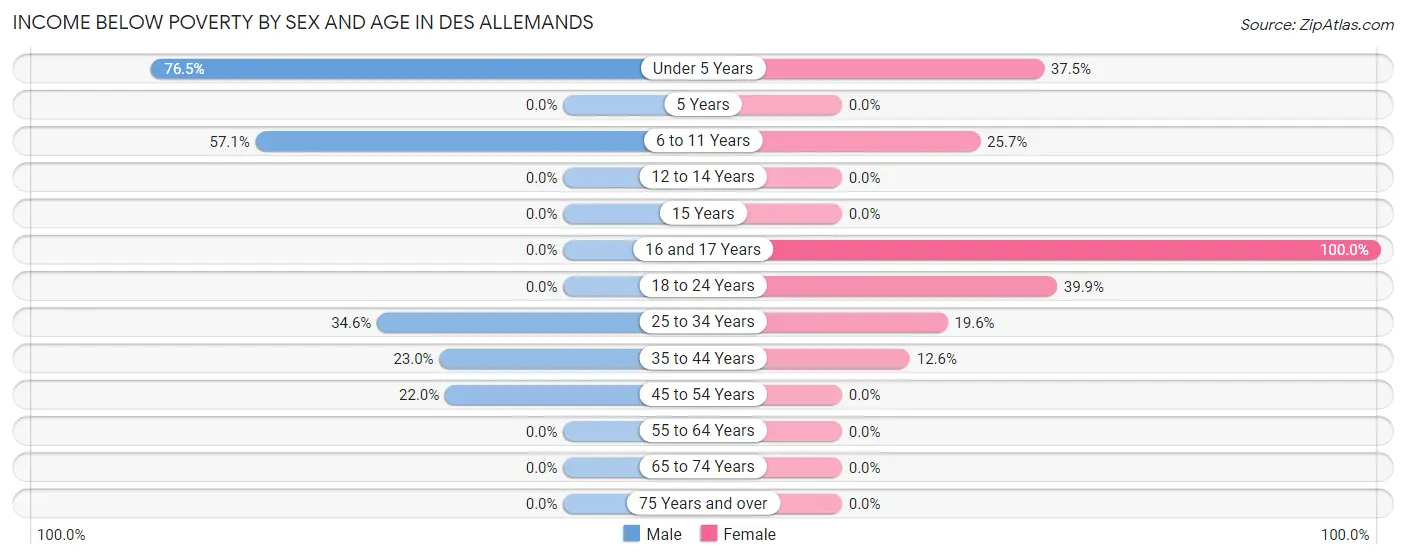
| Age Bracket | Male | Female |
| Under 5 Years | 65 (76.5%) | 9 (37.5%) |
| 5 Years | 0 (0.0%) | 0 (0.0%) |
| 6 to 11 Years | 32 (57.1%) | 19 (25.7%) |
| 12 to 14 Years | 0 (0.0%) | 0 (0.0%) |
| 15 Years | 0 (0.0%) | 0 (0.0%) |
| 16 and 17 Years | 0 (0.0%) | 10 (100.0%) |
| 18 to 24 Years | 0 (0.0%) | 97 (39.9%) |
| 25 to 34 Years | 76 (34.5%) | 20 (19.6%) |
| 35 to 44 Years | 23 (23.0%) | 12 (12.6%) |
| 45 to 54 Years | 9 (22.0%) | 0 (0.0%) |
| 55 to 64 Years | 0 (0.0%) | 0 (0.0%) |
| 65 to 74 Years | 0 (0.0%) | 0 (0.0%) |
| 75 Years and over | 0 (0.0%) | 0 (0.0%) |
| Total | 205 (18.5%) | 167 (13.8%) |
Income Above Poverty by Sex and Age in Des Allemands
According to the poverty statistics in Des Allemands, males aged 15 years and females aged 5 years are the age groups that are most secure financially, with 100.0% of males and 100.0% of females in these age groups living above the poverty line.
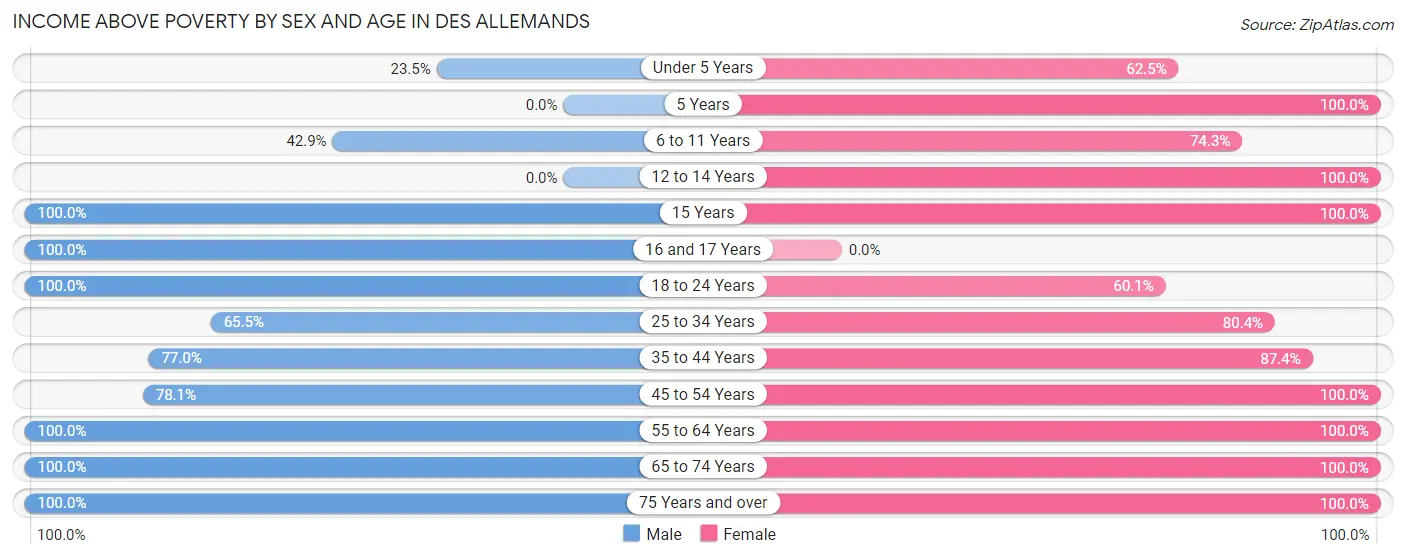
| Age Bracket | Male | Female |
| Under 5 Years | 20 (23.5%) | 15 (62.5%) |
| 5 Years | 0 (0.0%) | 10 (100.0%) |
| 6 to 11 Years | 24 (42.9%) | 55 (74.3%) |
| 12 to 14 Years | 0 (0.0%) | 49 (100.0%) |
| 15 Years | 24 (100.0%) | 29 (100.0%) |
| 16 and 17 Years | 10 (100.0%) | 0 (0.0%) |
| 18 to 24 Years | 141 (100.0%) | 146 (60.1%) |
| 25 to 34 Years | 144 (65.4%) | 82 (80.4%) |
| 35 to 44 Years | 77 (77.0%) | 83 (87.4%) |
| 45 to 54 Years | 32 (78.0%) | 114 (100.0%) |
| 55 to 64 Years | 182 (100.0%) | 138 (100.0%) |
| 65 to 74 Years | 164 (100.0%) | 168 (100.0%) |
| 75 Years and over | 86 (100.0%) | 157 (100.0%) |
| Total | 904 (81.5%) | 1,046 (86.2%) |
Income Below Poverty Among Married-Couple Families in Des Allemands
The poverty statistics for married-couple families in Des Allemands show that 2.4% or 8 of the total 335 families live below the poverty line. Families with 1 or 2 children have the highest poverty rate of 13.8%, comprising of 8 families. On the other hand, families with no children have the lowest poverty rate of 0.0%, which includes 0 families.
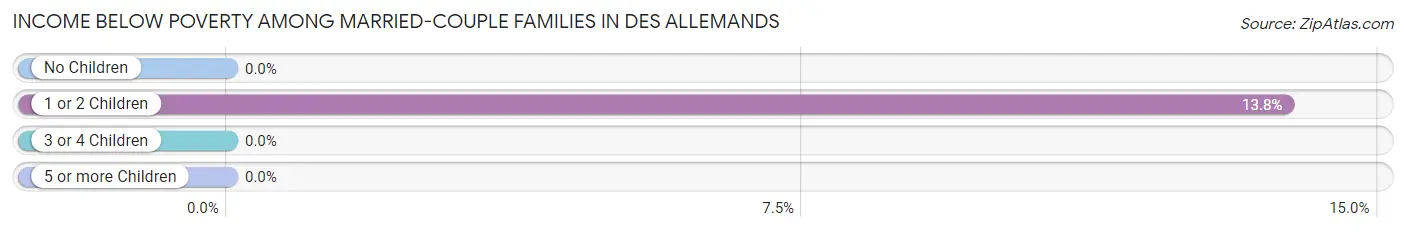
| Children | Above Poverty | Below Poverty |
| No Children | 277 (100.0%) | 0 (0.0%) |
| 1 or 2 Children | 50 (86.2%) | 8 (13.8%) |
| 3 or 4 Children | 0 (0.0%) | 0 (0.0%) |
| 5 or more Children | 0 (0.0%) | 0 (0.0%) |
| Total | 327 (97.6%) | 8 (2.4%) |
Income Below Poverty Among Single-Parent Households in Des Allemands
According to the poverty data in Des Allemands, 46.0% or 23 single-father households and 37.0% or 97 single-mother households are living below the poverty line. Among single-father households, those with 3 or 4 children have the highest poverty rate, with 11 households (100.0%) experiencing poverty. Likewise, among single-mother households, those with 1 or 2 children have the highest poverty rate, with 97 households (93.3%) falling below the poverty line.
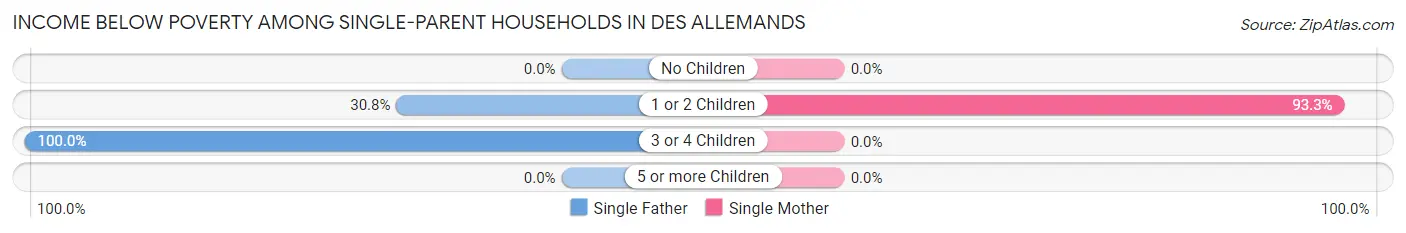
| Children | Single Father | Single Mother |
| No Children | 0 (0.0%) | 0 (0.0%) |
| 1 or 2 Children | 12 (30.8%) | 97 (93.3%) |
| 3 or 4 Children | 11 (100.0%) | 0 (0.0%) |
| 5 or more Children | 0 (0.0%) | 0 (0.0%) |
| Total | 23 (46.0%) | 97 (37.0%) |
Income Below Poverty Among Married-Couple vs Single-Parent Households in Des Allemands
The poverty data for Des Allemands shows that 8 of the married-couple family households (2.4%) and 120 of the single-parent households (38.5%) are living below the poverty level. Within the married-couple family households, those with 1 or 2 children have the highest poverty rate, with 8 households (13.8%) falling below the poverty line. Among the single-parent households, those with 1 or 2 children have the highest poverty rate, with 109 household (76.2%) living below poverty.
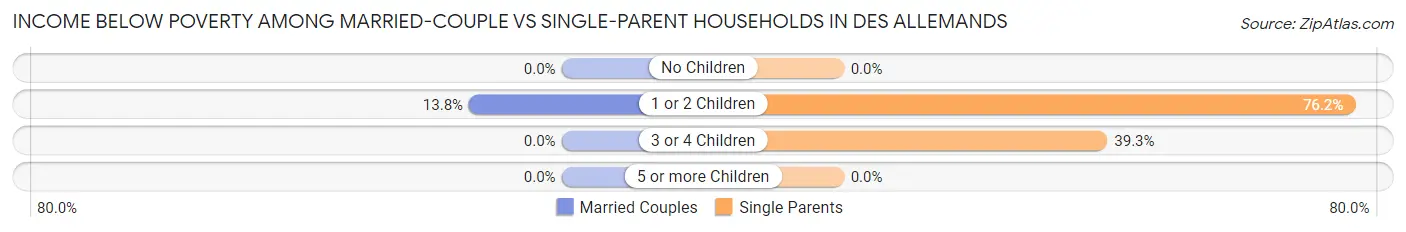
| Children | Married-Couple Families | Single-Parent Households |
| No Children | 0 (0.0%) | 0 (0.0%) |
| 1 or 2 Children | 8 (13.8%) | 109 (76.2%) |
| 3 or 4 Children | 0 (0.0%) | 11 (39.3%) |
| 5 or more Children | 0 (0.0%) | 0 (0.0%) |
| Total | 8 (2.4%) | 120 (38.5%) |
Race in Des Allemands
The most populous races in Des Allemands are White / Caucasian (1,889 | 80.7%), Two or more Races (259 | 11.1%), and Black / African American (118 | 5.0%).
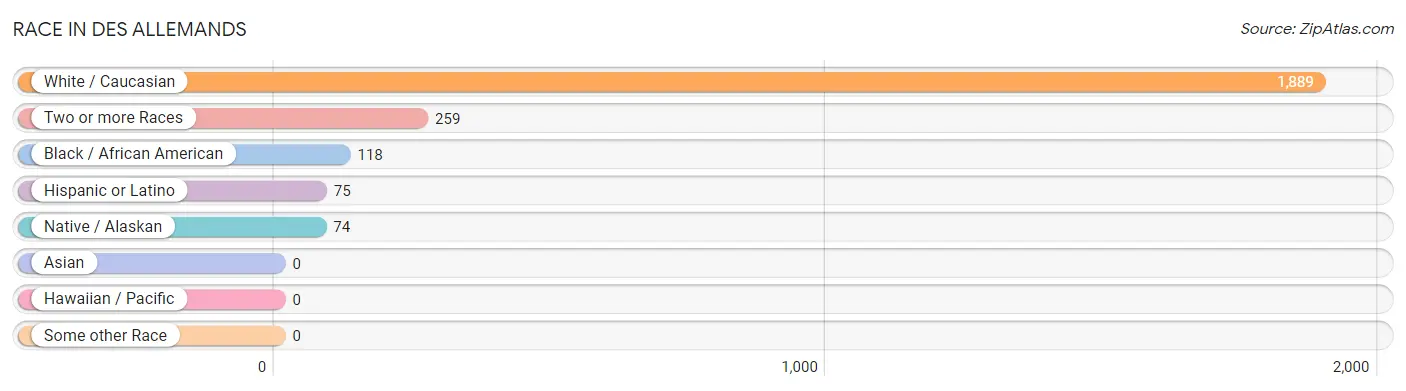
| Race | # Population | % Population |
| Asian | 0 | 0.0% |
| Black / African American | 118 | 5.0% |
| Hawaiian / Pacific | 0 | 0.0% |
| Hispanic or Latino | 75 | 3.2% |
| Native / Alaskan | 74 | 3.2% |
| White / Caucasian | 1,889 | 80.7% |
| Two or more Races | 259 | 11.1% |
| Some other Race | 0 | 0.0% |
| Total | 2,340 | 100.0% |
Ancestry in Des Allemands
The most populous ancestries reported in Des Allemands are French (528 | 22.6%), German (400 | 17.1%), Irish (257 | 11.0%), Polish (214 | 9.1%), and French Canadian (211 | 9.0%), together accounting for 68.8% of all Des Allemands residents.
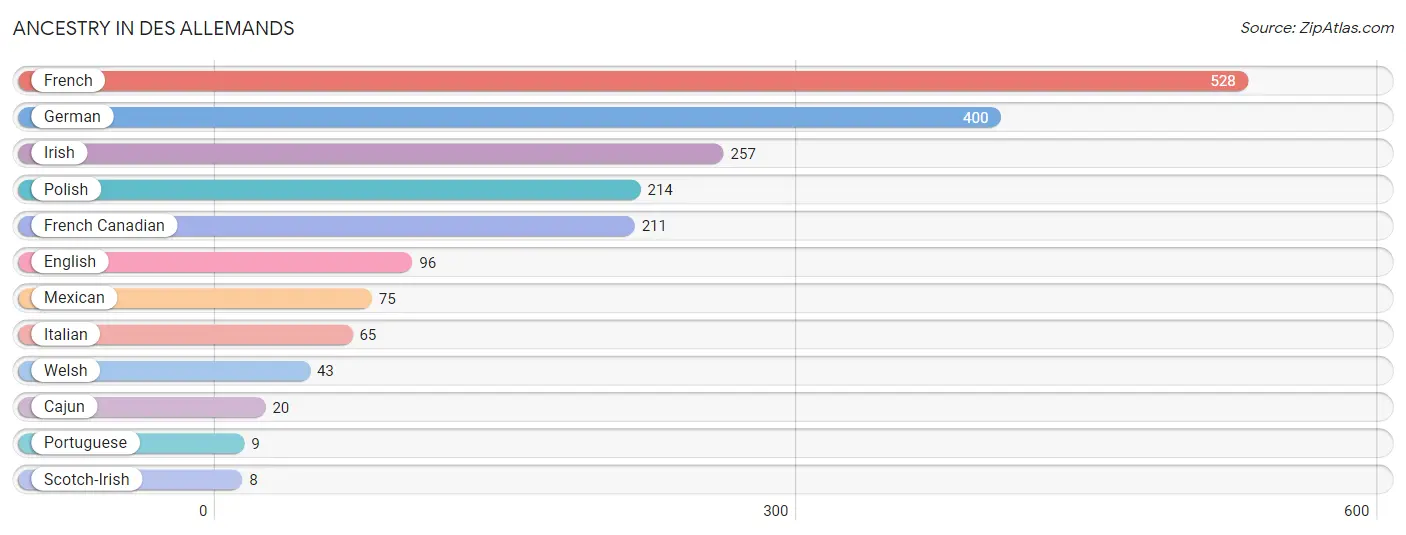
| Ancestry | # Population | % Population |
| Cajun | 20 | 0.9% |
| English | 96 | 4.1% |
| French | 528 | 22.6% |
| French Canadian | 211 | 9.0% |
| German | 400 | 17.1% |
| Irish | 257 | 11.0% |
| Italian | 65 | 2.8% |
| Mexican | 75 | 3.2% |
| Polish | 214 | 9.1% |
| Portuguese | 9 | 0.4% |
| Scotch-Irish | 8 | 0.3% |
| Welsh | 43 | 1.8% | View All 12 Rows |
Immigrants in Des Allemands

| Immigration Origin | # Population | % Population | View All 0 Rows |
Sex and Age in Des Allemands
Sex and Age in Des Allemands
The most populous age groups in Des Allemands are 65 to 69 Years (164 | 14.8%) for men and 20 to 24 Years (214 | 17.4%) for women.
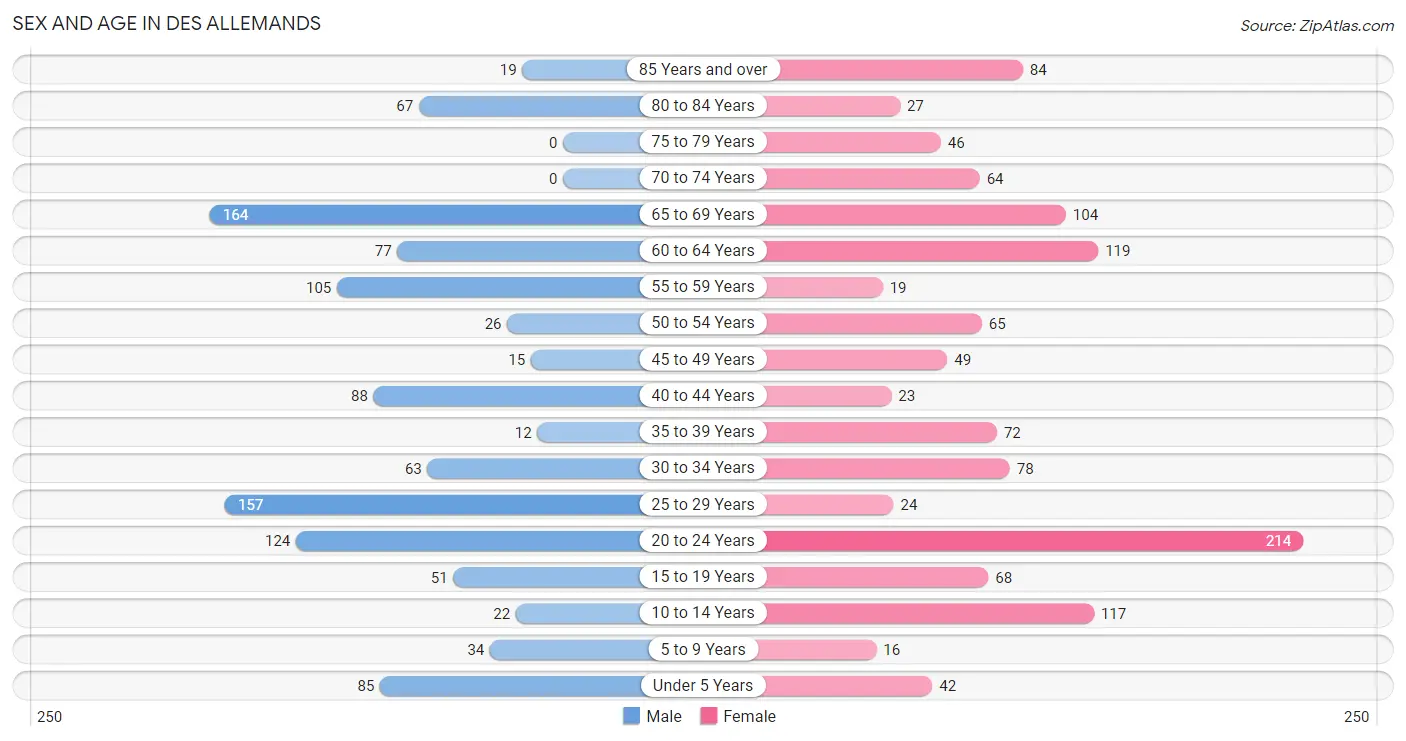
| Age Bracket | Male | Female |
| Under 5 Years | 85 (7.7%) | 42 (3.4%) |
| 5 to 9 Years | 34 (3.1%) | 16 (1.3%) |
| 10 to 14 Years | 22 (2.0%) | 117 (9.5%) |
| 15 to 19 Years | 51 (4.6%) | 68 (5.5%) |
| 20 to 24 Years | 124 (11.2%) | 214 (17.4%) |
| 25 to 29 Years | 157 (14.2%) | 24 (1.9%) |
| 30 to 34 Years | 63 (5.7%) | 78 (6.3%) |
| 35 to 39 Years | 12 (1.1%) | 72 (5.9%) |
| 40 to 44 Years | 88 (7.9%) | 23 (1.9%) |
| 45 to 49 Years | 15 (1.3%) | 49 (4.0%) |
| 50 to 54 Years | 26 (2.3%) | 65 (5.3%) |
| 55 to 59 Years | 105 (9.5%) | 19 (1.5%) |
| 60 to 64 Years | 77 (6.9%) | 119 (9.7%) |
| 65 to 69 Years | 164 (14.8%) | 104 (8.5%) |
| 70 to 74 Years | 0 (0.0%) | 64 (5.2%) |
| 75 to 79 Years | 0 (0.0%) | 46 (3.7%) |
| 80 to 84 Years | 67 (6.0%) | 27 (2.2%) |
| 85 Years and over | 19 (1.7%) | 84 (6.8%) |
| Total | 1,109 (100.0%) | 1,231 (100.0%) |
Families and Households in Des Allemands
Median Family Size in Des Allemands
The median family size in Des Allemands is 3.09 persons per family, with single male/father families (50 | 7.7%) accounting for the largest median family size of 3.52 persons per family. On the other hand, single female/mother families (262 | 40.5%) represent the smallest median family size with 2.51 persons per family.
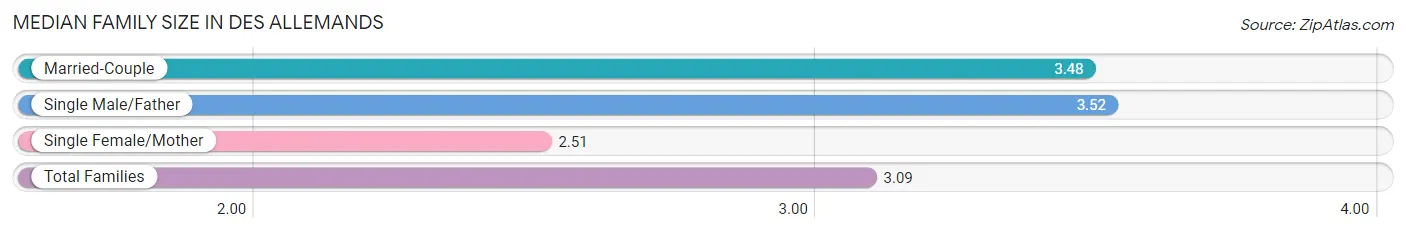
| Family Type | # Families | Family Size |
| Married-Couple | 335 (51.8%) | 3.48 |
| Single Male/Father | 50 (7.7%) | 3.52 |
| Single Female/Mother | 262 (40.5%) | 2.51 |
| Total Families | 647 (100.0%) | 3.09 |
Median Household Size in Des Allemands
The median household size in Des Allemands is 2.77 persons per household, with single male/father households (50 | 5.9%) accounting for the largest median household size of 4.04 persons per household. non-family households (199 | 23.5%) represent the smallest median household size with 1.21 persons per household.
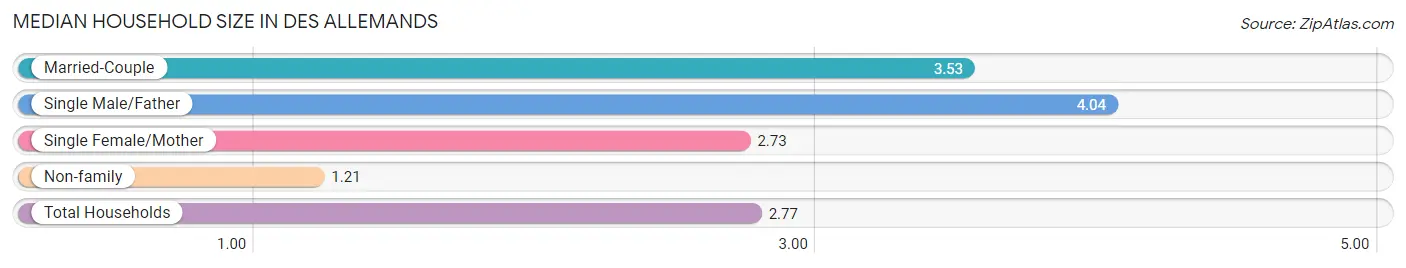
| Household Type | # Households | Household Size |
| Married-Couple | 335 (39.6%) | 3.53 |
| Single Male/Father | 50 (5.9%) | 4.04 |
| Single Female/Mother | 262 (31.0%) | 2.73 |
| Non-family | 199 (23.5%) | 1.21 |
| Total Households | 846 (100.0%) | 2.77 |
Household Size by Marriage Status in Des Allemands
Out of a total of 846 households in Des Allemands, 647 (76.5%) are family households, while 199 (23.5%) are nonfamily households. The most numerous type of family households are 2-person households, comprising 214, and the most common type of nonfamily households are 1-person households, comprising 159.
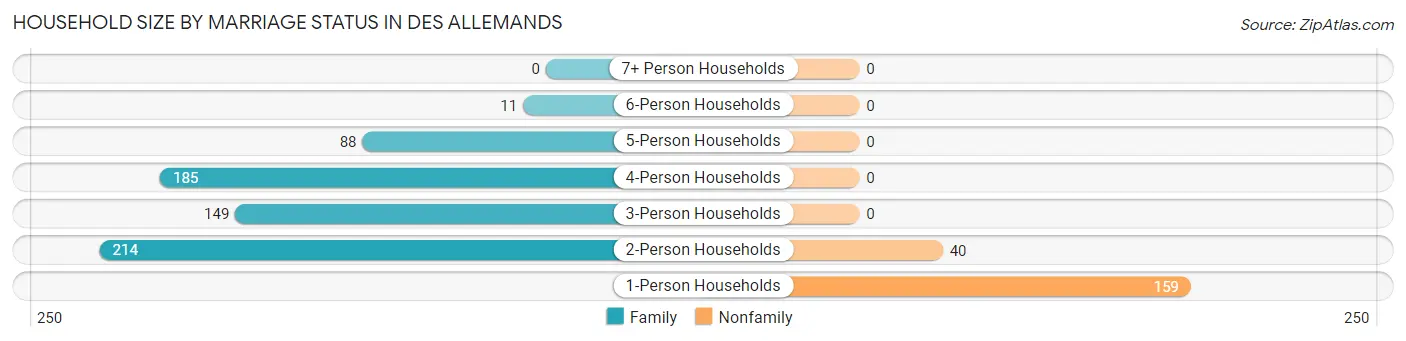
| Household Size | Family Households | Nonfamily Households |
| 1-Person Households | - | 159 (18.8%) |
| 2-Person Households | 214 (25.3%) | 40 (4.7%) |
| 3-Person Households | 149 (17.6%) | 0 (0.0%) |
| 4-Person Households | 185 (21.9%) | 0 (0.0%) |
| 5-Person Households | 88 (10.4%) | 0 (0.0%) |
| 6-Person Households | 11 (1.3%) | 0 (0.0%) |
| 7+ Person Households | 0 (0.0%) | 0 (0.0%) |
| Total | 647 (76.5%) | 199 (23.5%) |
Female Fertility in Des Allemands
Fertility by Age in Des Allemands
Average fertility rate in Des Allemands is 23.0 births per 1,000 women. Women in the age bracket of 20 to 34 years have the highest fertility rate with 38.0 births per 1,000 women. Women in the age bracket of 20 to 34 years acount for 100.0% of all women with births.
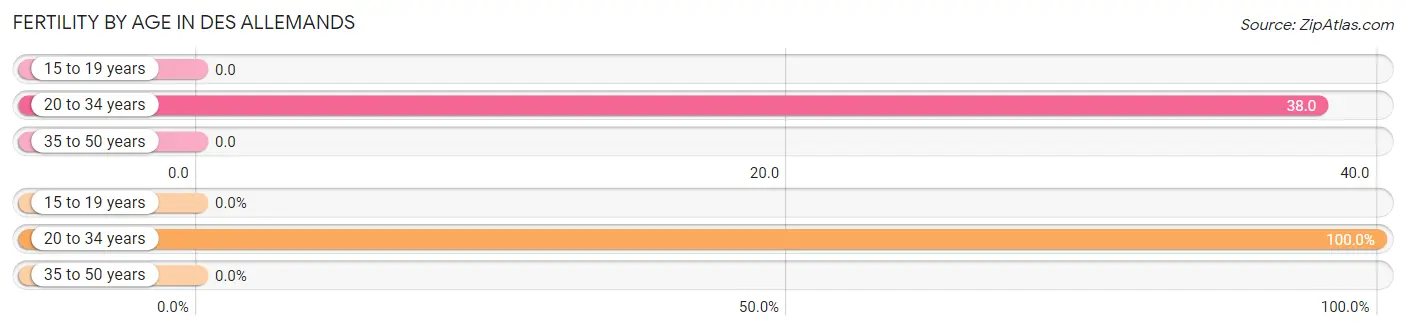
| Age Bracket | Women with Births | Births / 1,000 Women |
| 15 to 19 years | 0 (0.0%) | 0.0 |
| 20 to 34 years | 12 (100.0%) | 38.0 |
| 35 to 50 years | 0 (0.0%) | 0.0 |
| Total | 12 (100.0%) | 23.0 |
Fertility by Age by Marriage Status in Des Allemands
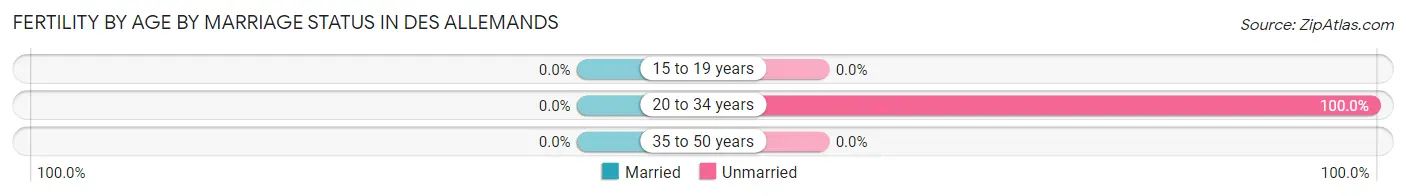
| Age Bracket | Married | Unmarried |
| 15 to 19 years | 0 (0.0%) | 0 (0.0%) |
| 20 to 34 years | 0 (0.0%) | 12 (100.0%) |
| 35 to 50 years | 0 (0.0%) | 0 (0.0%) |
| Total | 0 (0.0%) | 12 (100.0%) |
Fertility by Education in Des Allemands
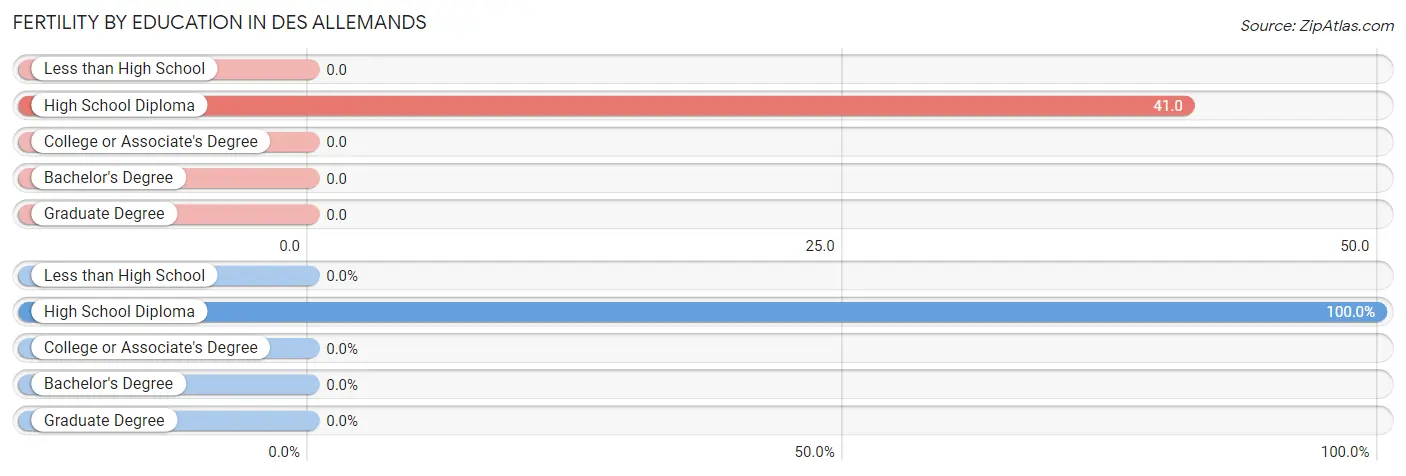
| Educational Attainment | Women with Births | Births / 1,000 Women |
| Less than High School | 0 (0.0%) | 0.0 |
| High School Diploma | 12 (100.0%) | 41.0 |
| College or Associate's Degree | 0 (0.0%) | 0.0 |
| Bachelor's Degree | 0 (0.0%) | 0.0 |
| Graduate Degree | 0 (0.0%) | 0.0 |
| Total | 12 (100.0%) | 23.0 |
Fertility by Education by Marriage Status in Des Allemands
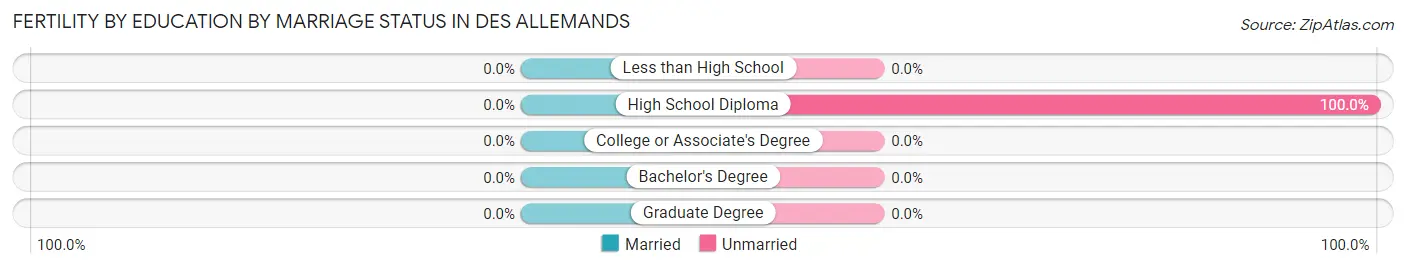
| Educational Attainment | Married | Unmarried |
| Less than High School | 0 (0.0%) | 0 (0.0%) |
| High School Diploma | 0 (0.0%) | 12 (100.0%) |
| College or Associate's Degree | 0 (0.0%) | 0 (0.0%) |
| Bachelor's Degree | 0 (0.0%) | 0 (0.0%) |
| Graduate Degree | 0 (0.0%) | 0 (0.0%) |
| Total | 0 (0.0%) | 12 (100.0%) |
Employment Characteristics in Des Allemands
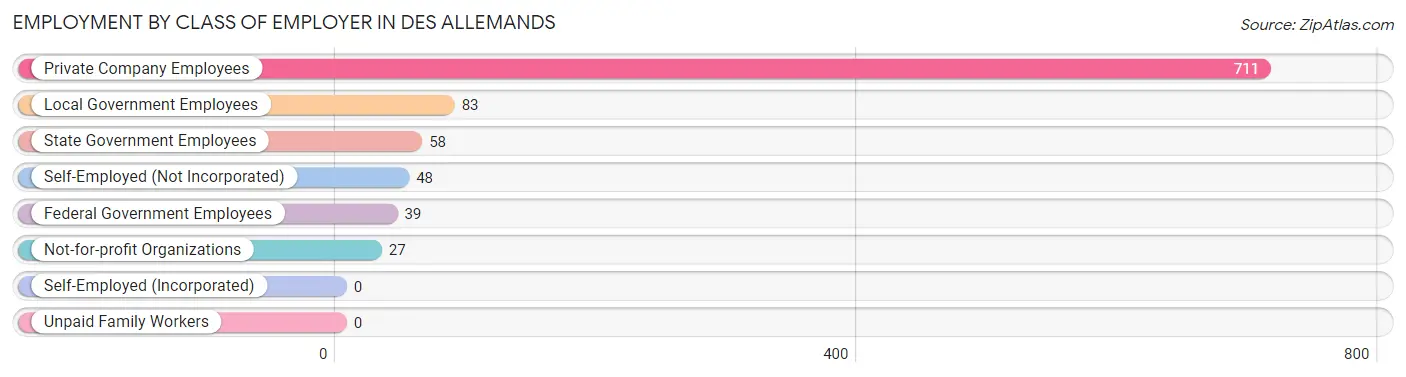
Employment by Class of Employer in Des Allemands
Among the 966 employed individuals in Des Allemands, private company employees (711 | 73.6%), local government employees (83 | 8.6%), and state government employees (58 | 6.0%) make up the most common classes of employment.
| Employer Class | # Employees | % Employees |
| Private Company Employees | 711 | 73.6% |
| Self-Employed (Incorporated) | 0 | 0.0% |
| Self-Employed (Not Incorporated) | 48 | 5.0% |
| Not-for-profit Organizations | 27 | 2.8% |
| Local Government Employees | 83 | 8.6% |
| State Government Employees | 58 | 6.0% |
| Federal Government Employees | 39 | 4.0% |
| Unpaid Family Workers | 0 | 0.0% |
| Total | 966 | 100.0% |
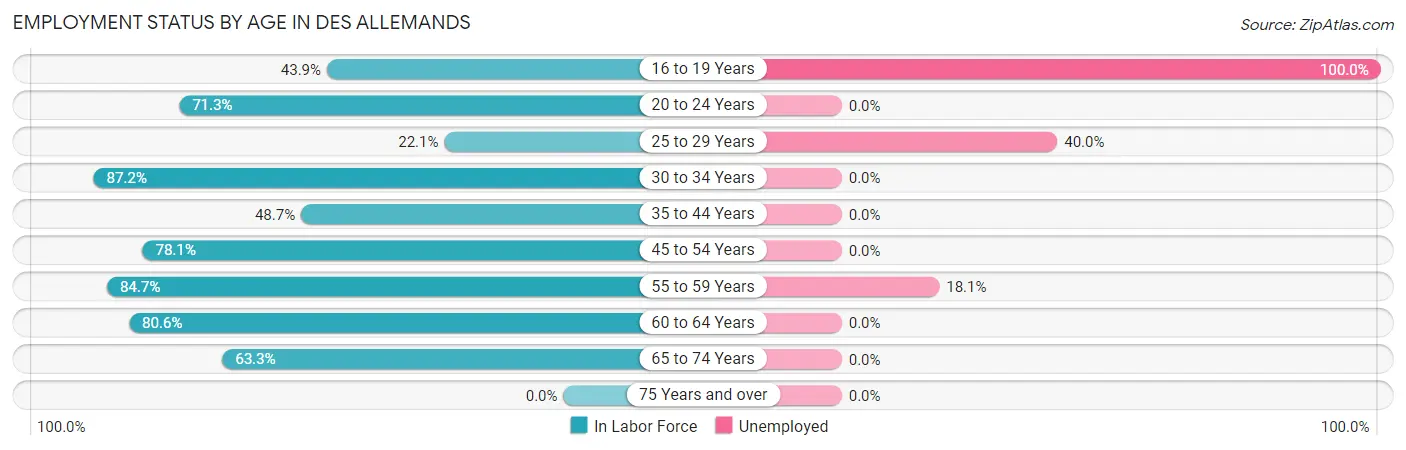
Employment Status by Age in Des Allemands
According to the labor force statistics for Des Allemands, out of the total population over 16 years of age (1,971), 56.9% or 1,121 individuals are in the labor force, with 5.7% or 64 of them unemployed. The age group with the highest labor force participation rate is 30 to 34 years, with 87.2% or 123 individuals in the labor force. Within the labor force, the 16 to 19 years age range has the highest percentage of unemployed individuals, with 100.0% or 29 of them being unemployed.
| Age Bracket | In Labor Force | Unemployed |
| 16 to 19 Years | 29 (43.9%) | 29 (100.0%) |
| 20 to 24 Years | 241 (71.3%) | 0 (0.0%) |
| 25 to 29 Years | 40 (22.1%) | 16 (40.0%) |
| 30 to 34 Years | 123 (87.2%) | 0 (0.0%) |
| 35 to 44 Years | 95 (48.7%) | 0 (0.0%) |
| 45 to 54 Years | 121 (78.1%) | 0 (0.0%) |
| 55 to 59 Years | 105 (84.7%) | 19 (18.1%) |
| 60 to 64 Years | 158 (80.6%) | 0 (0.0%) |
| 65 to 74 Years | 210 (63.3%) | 0 (0.0%) |
| 75 Years and over | 0 (0.0%) | 0 (0.0%) |
| Total | 1,121 (56.9%) | 64 (5.7%) |
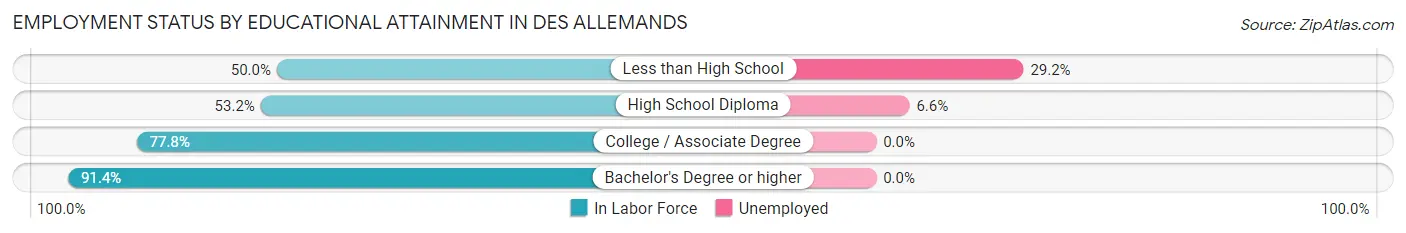
Employment Status by Educational Attainment in Des Allemands
According to labor force statistics for Des Allemands, 64.7% of individuals (642) out of the total population between 25 and 64 years of age (992) are in the labor force, with 5.5% or 35 of them being unemployed. The group with the highest labor force participation rate are those with the educational attainment of bachelor's degree or higher, with 91.4% or 127 individuals in the labor force. Within the labor force, individuals with less than high school education have the highest percentage of unemployment, with 29.2% or 19 of them being unemployed.
| Educational Attainment | In Labor Force | Unemployed |
| Less than High School | 65 (50.0%) | 38 (29.2%) |
| High School Diploma | 243 (53.2%) | 30 (6.6%) |
| College / Associate Degree | 207 (77.8%) | 0 (0.0%) |
| Bachelor's Degree or higher | 127 (91.4%) | 0 (0.0%) |
| Total | 642 (64.7%) | 55 (5.5%) |
Employment Occupations by Sex in Des Allemands
Management, Business, Science and Arts Occupations
The most common Management, Business, Science and Arts occupations in Des Allemands are Community & Social Service (120 | 11.3%), Computers, Engineering & Science (117 | 11.1%), Architecture & Engineering (117 | 11.1%), Management (98 | 9.3%), and Health Diagnosing & Treating (54 | 5.1%).
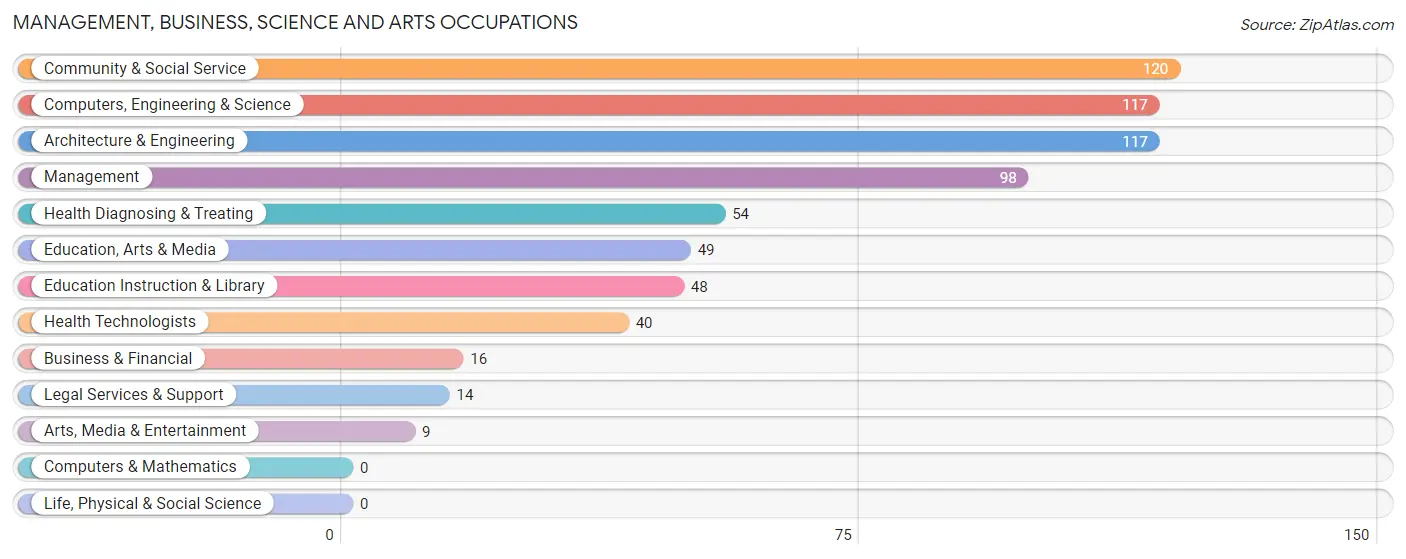
Management, Business, Science and Arts Occupations by Sex
Within the Management, Business, Science and Arts occupations in Des Allemands, the most male-oriented occupations are Arts, Media & Entertainment (100.0%), Management (70.4%), and Health Technologists (67.5%), while the most female-oriented occupations are Computers, Engineering & Science (100.0%), Architecture & Engineering (100.0%), and Education, Arts & Media (100.0%).
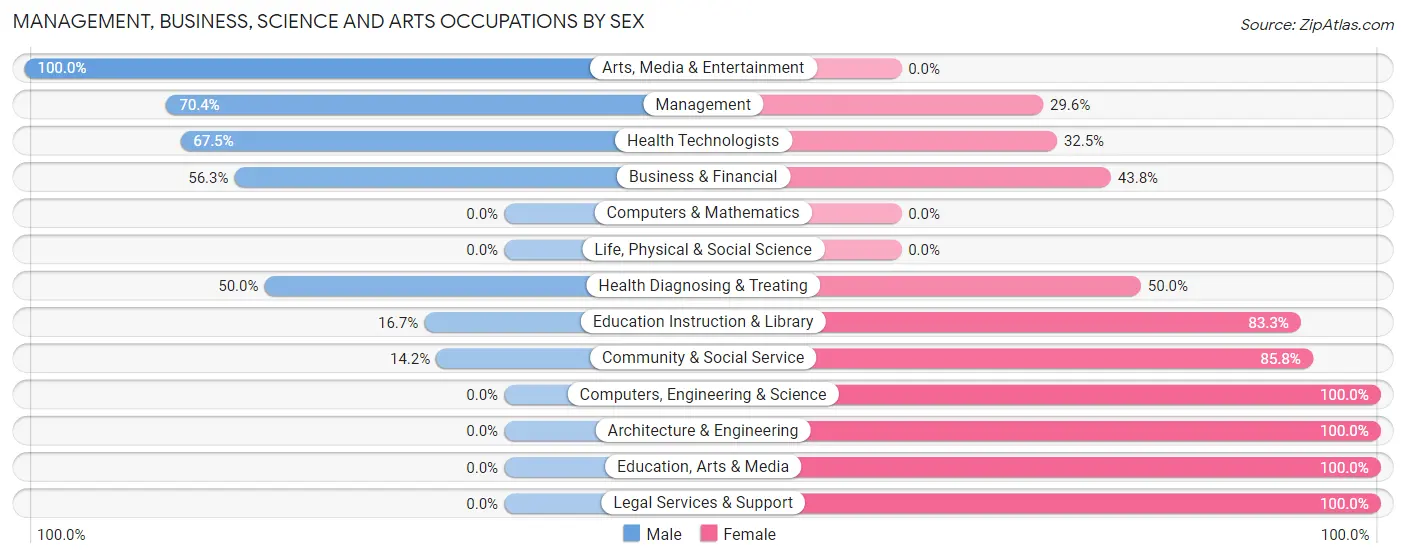
| Occupation | Male | Female |
| Management | 69 (70.4%) | 29 (29.6%) |
| Business & Financial | 9 (56.2%) | 7 (43.8%) |
| Computers, Engineering & Science | 0 (0.0%) | 117 (100.0%) |
| Computers & Mathematics | 0 (0.0%) | 0 (0.0%) |
| Architecture & Engineering | 0 (0.0%) | 117 (100.0%) |
| Life, Physical & Social Science | 0 (0.0%) | 0 (0.0%) |
| Community & Social Service | 17 (14.2%) | 103 (85.8%) |
| Education, Arts & Media | 0 (0.0%) | 49 (100.0%) |
| Legal Services & Support | 0 (0.0%) | 14 (100.0%) |
| Education Instruction & Library | 8 (16.7%) | 40 (83.3%) |
| Arts, Media & Entertainment | 9 (100.0%) | 0 (0.0%) |
| Health Diagnosing & Treating | 27 (50.0%) | 27 (50.0%) |
| Health Technologists | 27 (67.5%) | 13 (32.5%) |
| Total (Category) | 122 (30.1%) | 283 (69.9%) |
| Total (Overall) | 543 (51.3%) | 515 (48.7%) |
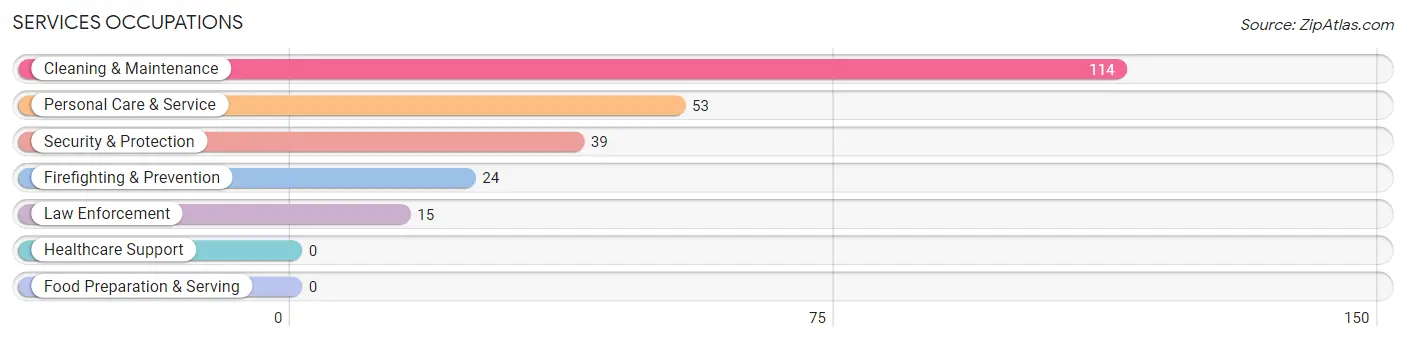
Services Occupations
The most common Services occupations in Des Allemands are Cleaning & Maintenance (114 | 10.8%), Personal Care & Service (53 | 5.0%), Security & Protection (39 | 3.7%), Firefighting & Prevention (24 | 2.3%), and Law Enforcement (15 | 1.4%).
Services Occupations by Sex
Within the Services occupations in Des Allemands, the most male-oriented occupations are Firefighting & Prevention (100.0%), Security & Protection (61.5%), and Cleaning & Maintenance (53.5%), while the most female-oriented occupations are Law Enforcement (100.0%), Personal Care & Service (100.0%), and Cleaning & Maintenance (46.5%).
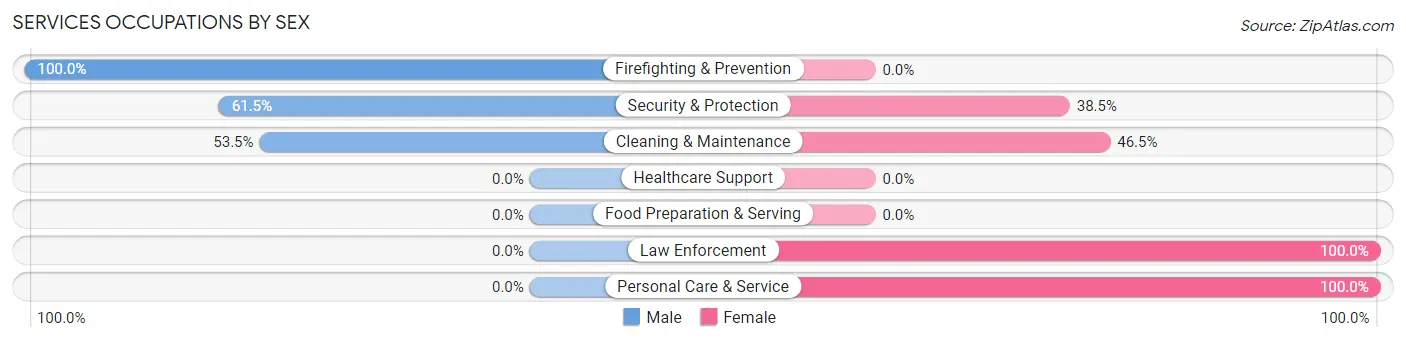
| Occupation | Male | Female |
| Healthcare Support | 0 (0.0%) | 0 (0.0%) |
| Security & Protection | 24 (61.5%) | 15 (38.5%) |
| Firefighting & Prevention | 24 (100.0%) | 0 (0.0%) |
| Law Enforcement | 0 (0.0%) | 15 (100.0%) |
| Food Preparation & Serving | 0 (0.0%) | 0 (0.0%) |
| Cleaning & Maintenance | 61 (53.5%) | 53 (46.5%) |
| Personal Care & Service | 0 (0.0%) | 53 (100.0%) |
| Total (Category) | 85 (41.3%) | 121 (58.7%) |
| Total (Overall) | 543 (51.3%) | 515 (48.7%) |
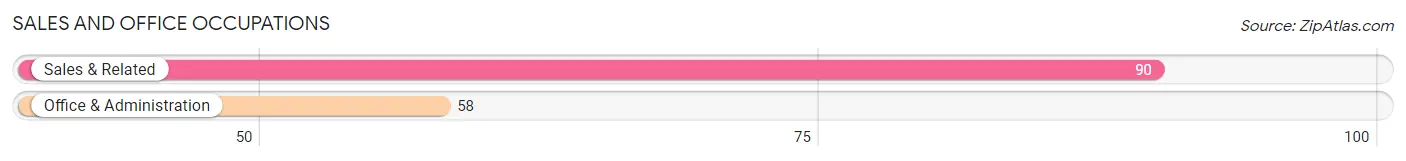
Sales and Office Occupations
The most common Sales and Office occupations in Des Allemands are Sales & Related (90 | 8.5%), and Office & Administration (58 | 5.5%).
Sales and Office Occupations by Sex
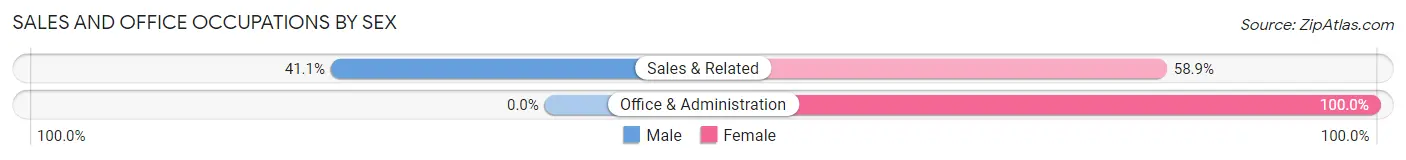
| Occupation | Male | Female |
| Sales & Related | 37 (41.1%) | 53 (58.9%) |
| Office & Administration | 0 (0.0%) | 58 (100.0%) |
| Total (Category) | 37 (25.0%) | 111 (75.0%) |
| Total (Overall) | 543 (51.3%) | 515 (48.7%) |
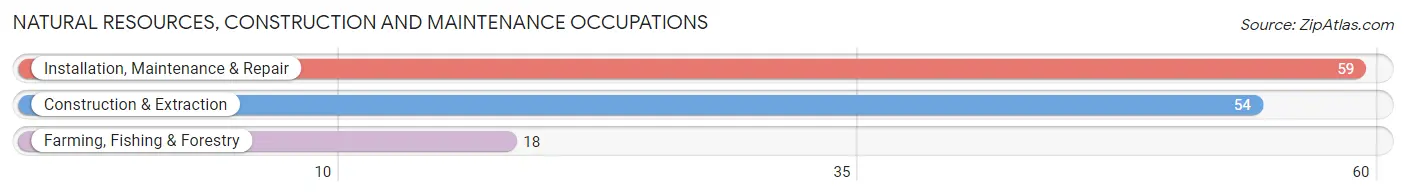
Natural Resources, Construction and Maintenance Occupations
The most common Natural Resources, Construction and Maintenance occupations in Des Allemands are Installation, Maintenance & Repair (59 | 5.6%), Construction & Extraction (54 | 5.1%), and Farming, Fishing & Forestry (18 | 1.7%).
Natural Resources, Construction and Maintenance Occupations by Sex
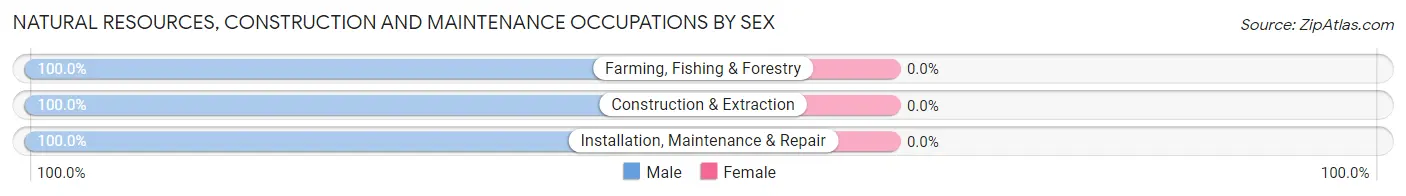
| Occupation | Male | Female |
| Farming, Fishing & Forestry | 18 (100.0%) | 0 (0.0%) |
| Construction & Extraction | 54 (100.0%) | 0 (0.0%) |
| Installation, Maintenance & Repair | 59 (100.0%) | 0 (0.0%) |
| Total (Category) | 131 (100.0%) | 0 (0.0%) |
| Total (Overall) | 543 (51.3%) | 515 (48.7%) |
Production, Transportation and Moving Occupations
The most common Production, Transportation and Moving occupations in Des Allemands are Transportation (92 | 8.7%), and Production (76 | 7.2%).
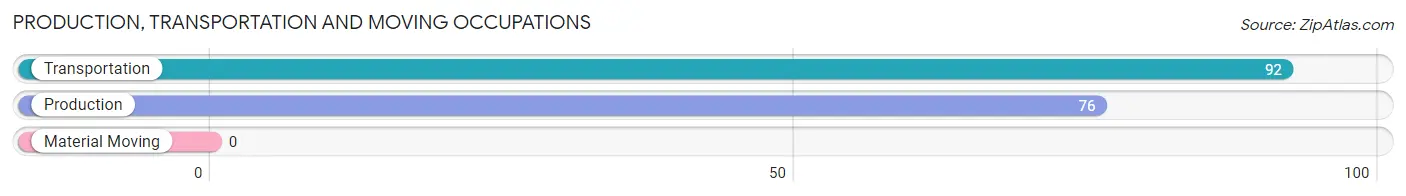
Production, Transportation and Moving Occupations by Sex
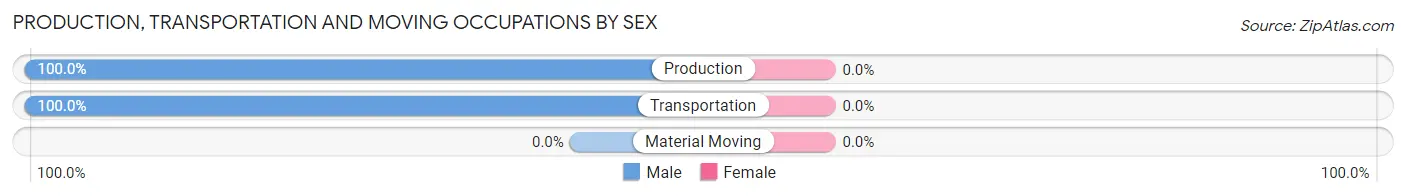
| Occupation | Male | Female |
| Production | 76 (100.0%) | 0 (0.0%) |
| Transportation | 92 (100.0%) | 0 (0.0%) |
| Material Moving | 0 (0.0%) | 0 (0.0%) |
| Total (Category) | 168 (100.0%) | 0 (0.0%) |
| Total (Overall) | 543 (51.3%) | 515 (48.7%) |
Employment Industries by Sex in Des Allemands
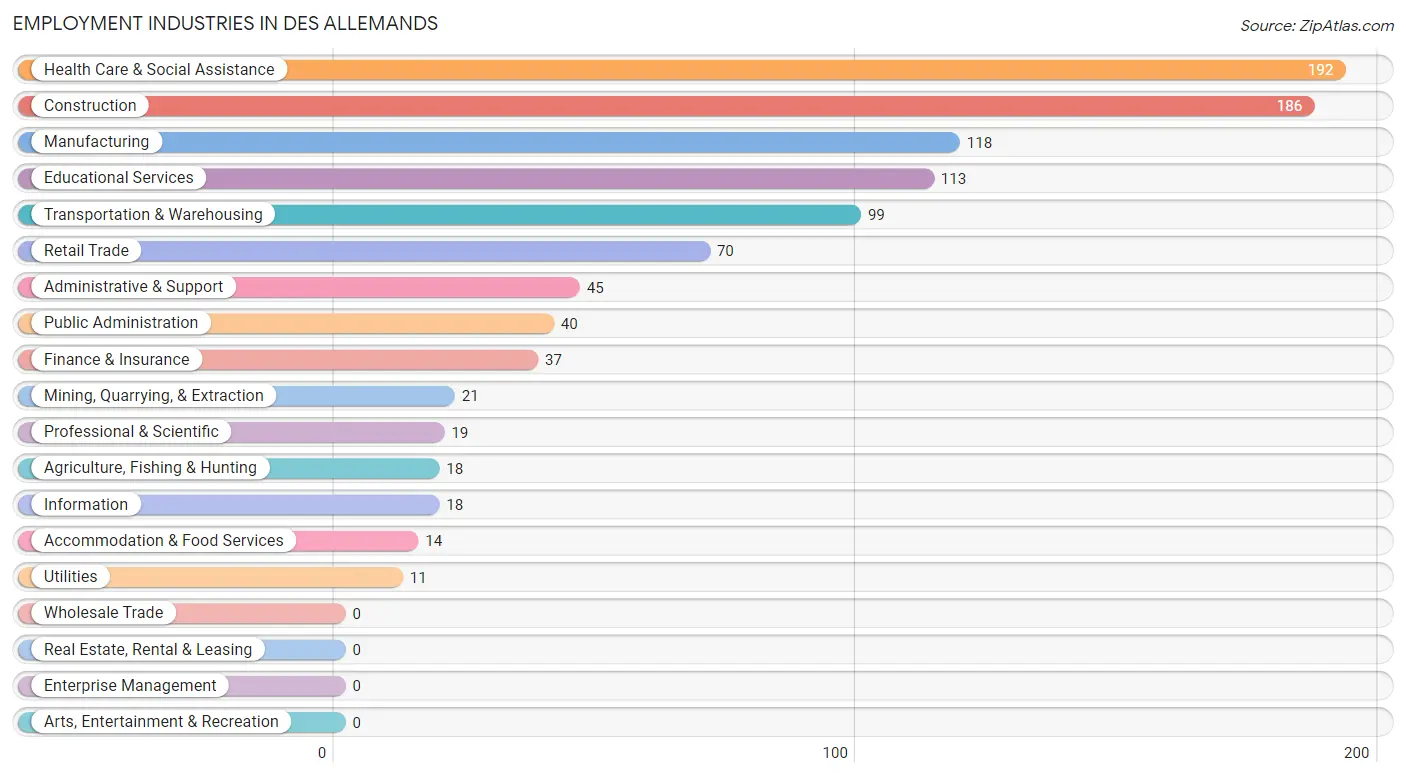
Employment Industries in Des Allemands
The major employment industries in Des Allemands include Health Care & Social Assistance (192 | 18.1%), Construction (186 | 17.6%), Manufacturing (118 | 11.2%), Educational Services (113 | 10.7%), and Transportation & Warehousing (99 | 9.4%).
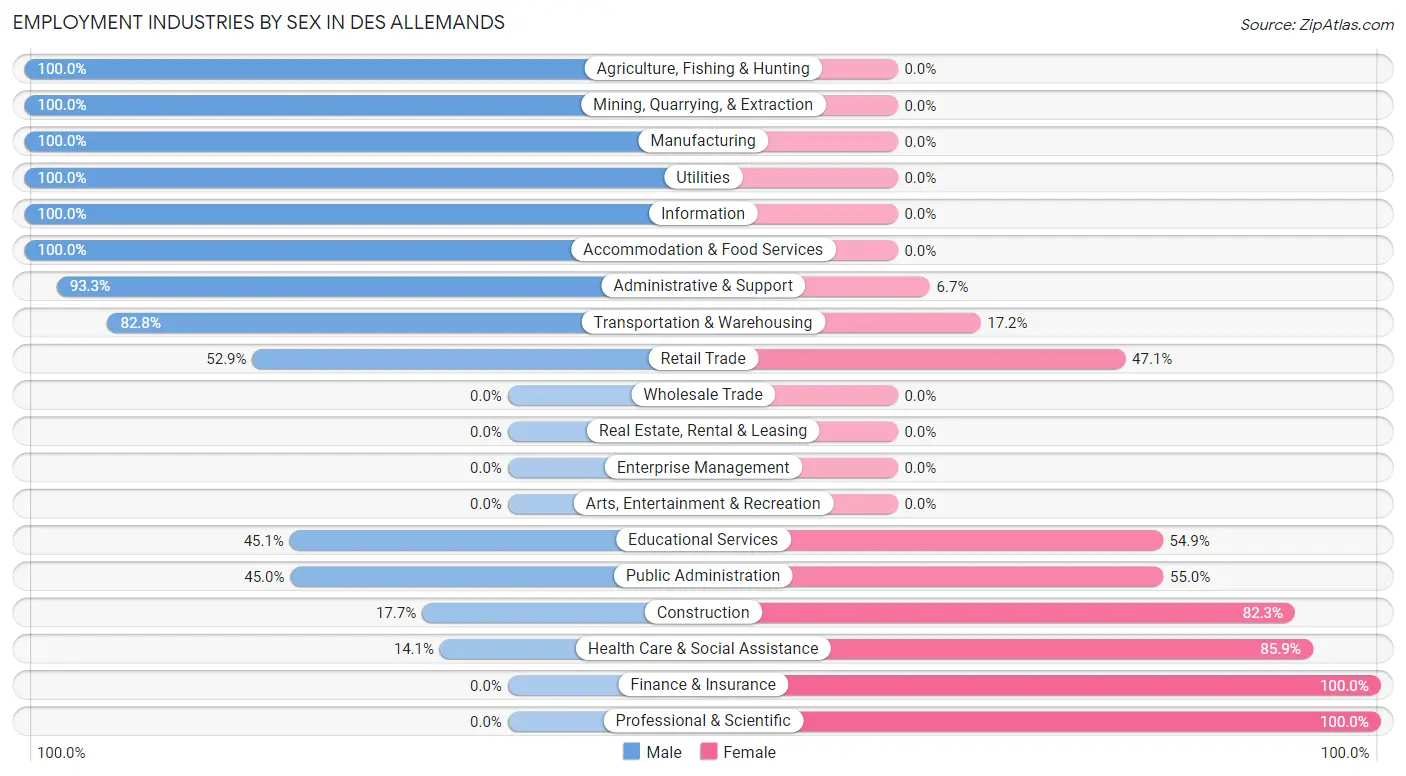
Employment Industries by Sex in Des Allemands
The Des Allemands industries that see more men than women are Agriculture, Fishing & Hunting (100.0%), Mining, Quarrying, & Extraction (100.0%), and Manufacturing (100.0%), whereas the industries that tend to have a higher number of women are Finance & Insurance (100.0%), Professional & Scientific (100.0%), and Health Care & Social Assistance (85.9%).
| Industry | Male | Female |
| Agriculture, Fishing & Hunting | 18 (100.0%) | 0 (0.0%) |
| Mining, Quarrying, & Extraction | 21 (100.0%) | 0 (0.0%) |
| Construction | 33 (17.7%) | 153 (82.3%) |
| Manufacturing | 118 (100.0%) | 0 (0.0%) |
| Wholesale Trade | 0 (0.0%) | 0 (0.0%) |
| Retail Trade | 37 (52.9%) | 33 (47.1%) |
| Transportation & Warehousing | 82 (82.8%) | 17 (17.2%) |
| Utilities | 11 (100.0%) | 0 (0.0%) |
| Information | 18 (100.0%) | 0 (0.0%) |
| Finance & Insurance | 0 (0.0%) | 37 (100.0%) |
| Real Estate, Rental & Leasing | 0 (0.0%) | 0 (0.0%) |
| Professional & Scientific | 0 (0.0%) | 19 (100.0%) |
| Enterprise Management | 0 (0.0%) | 0 (0.0%) |
| Administrative & Support | 42 (93.3%) | 3 (6.7%) |
| Educational Services | 51 (45.1%) | 62 (54.9%) |
| Health Care & Social Assistance | 27 (14.1%) | 165 (85.9%) |
| Arts, Entertainment & Recreation | 0 (0.0%) | 0 (0.0%) |
| Accommodation & Food Services | 14 (100.0%) | 0 (0.0%) |
| Public Administration | 18 (45.0%) | 22 (55.0%) |
| Total | 543 (51.3%) | 515 (48.7%) |
Education in Des Allemands
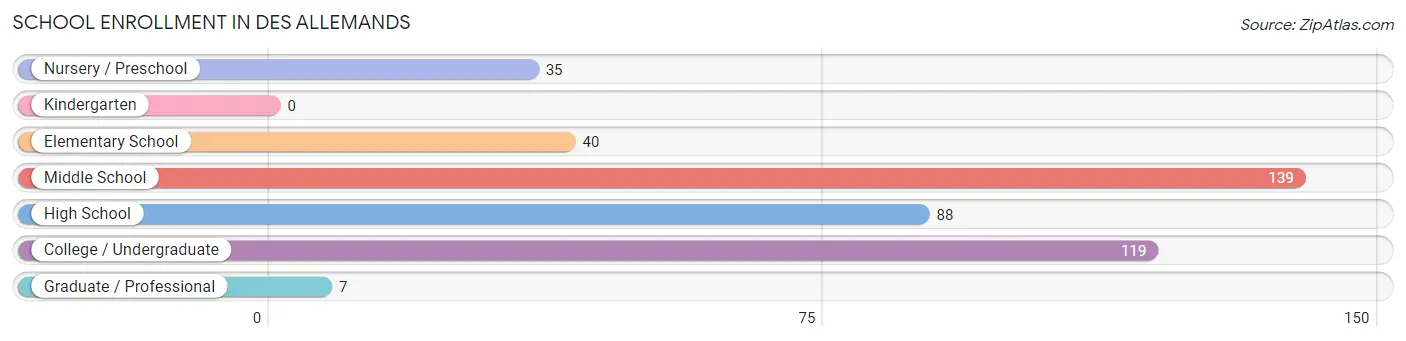
School Enrollment in Des Allemands
The most common levels of schooling among the 428 students in Des Allemands are middle school (139 | 32.5%), college / undergraduate (119 | 27.8%), and high school (88 | 20.6%).
| School Level | # Students | % Students |
| Nursery / Preschool | 35 | 8.2% |
| Kindergarten | 0 | 0.0% |
| Elementary School | 40 | 9.3% |
| Middle School | 139 | 32.5% |
| High School | 88 | 20.6% |
| College / Undergraduate | 119 | 27.8% |
| Graduate / Professional | 7 | 1.6% |
| Total | 428 | 100.0% |
School Enrollment by Age by Funding Source in Des Allemands
Out of a total of 428 students who are enrolled in schools in Des Allemands, 7 (1.6%) attend a private institution, while the remaining 421 (98.4%) are enrolled in public schools. The age group of 25 to 34 year olds has the highest likelihood of being enrolled in private schools, with 7 (100.0% in the age bracket) enrolled. Conversely, the age group of 3 to 4 year olds has the lowest likelihood of being enrolled in a private school, with 25 (100.0% in the age bracket) attending a public institution.
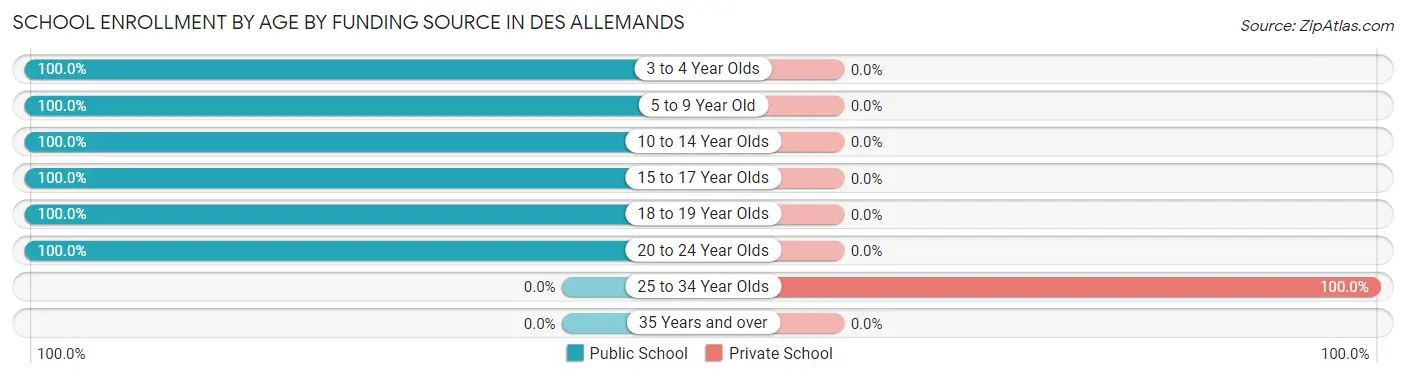
| Age Bracket | Public School | Private School |
| 3 to 4 Year Olds | 25 (100.0%) | 0 (0.0%) |
| 5 to 9 Year Old | 50 (100.0%) | 0 (0.0%) |
| 10 to 14 Year Olds | 139 (100.0%) | 0 (0.0%) |
| 15 to 17 Year Olds | 73 (100.0%) | 0 (0.0%) |
| 18 to 19 Year Olds | 17 (100.0%) | 0 (0.0%) |
| 20 to 24 Year Olds | 117 (100.0%) | 0 (0.0%) |
| 25 to 34 Year Olds | 0 (0.0%) | 7 (100.0%) |
| 35 Years and over | 0 (0.0%) | 0 (0.0%) |
| Total | 421 (98.4%) | 7 (1.6%) |
Educational Attainment by Field of Study in Des Allemands
Psychology (57 | 30.5%), science & technology (52 | 27.8%), literature & languages (20 | 10.7%), visual & performing arts (20 | 10.7%), and education (16 | 8.6%) are the most common fields of study among 187 individuals in Des Allemands who have obtained a bachelor's degree or higher.
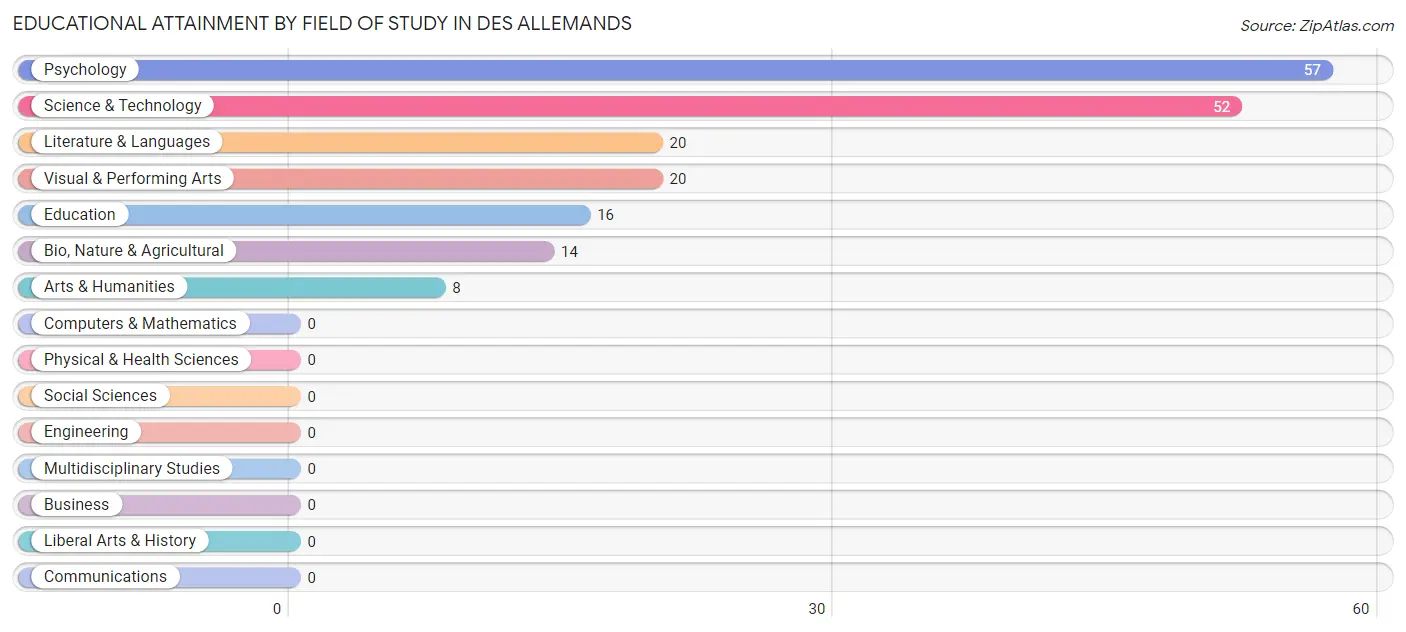
| Field of Study | # Graduates | % Graduates |
| Computers & Mathematics | 0 | 0.0% |
| Bio, Nature & Agricultural | 14 | 7.5% |
| Physical & Health Sciences | 0 | 0.0% |
| Psychology | 57 | 30.5% |
| Social Sciences | 0 | 0.0% |
| Engineering | 0 | 0.0% |
| Multidisciplinary Studies | 0 | 0.0% |
| Science & Technology | 52 | 27.8% |
| Business | 0 | 0.0% |
| Education | 16 | 8.6% |
| Literature & Languages | 20 | 10.7% |
| Liberal Arts & History | 0 | 0.0% |
| Visual & Performing Arts | 20 | 10.7% |
| Communications | 0 | 0.0% |
| Arts & Humanities | 8 | 4.3% |
| Total | 187 | 100.0% |
Transportation & Commute in Des Allemands
Vehicle Availability by Sex in Des Allemands
The most prevalent vehicle ownership categories in Des Allemands are males with 2 vehicles (189, accounting for 37.8%) and females with 2 vehicles (174, making up 40.6%).
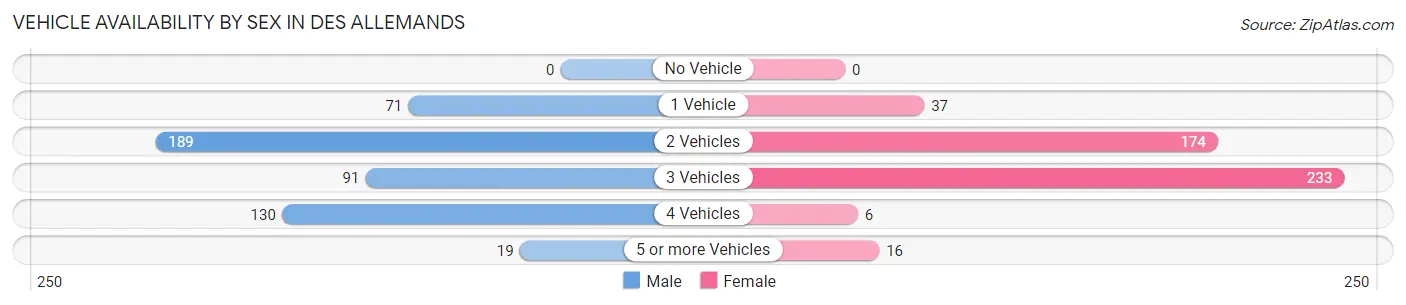
| Vehicles Available | Male | Female |
| No Vehicle | 0 (0.0%) | 0 (0.0%) |
| 1 Vehicle | 71 (14.2%) | 37 (7.9%) |
| 2 Vehicles | 189 (37.8%) | 174 (37.3%) |
| 3 Vehicles | 91 (18.2%) | 233 (50.0%) |
| 4 Vehicles | 130 (26.0%) | 6 (1.3%) |
| 5 or more Vehicles | 19 (3.8%) | 16 (3.4%) |
| Total | 500 (100.0%) | 466 (100.0%) |
Commute Time in Des Allemands
The most frequently occuring commute durations in Des Allemands are 30 to 34 minutes (360 commuters, 38.7%), 5 to 9 minutes (131 commuters, 14.1%), and 20 to 24 minutes (116 commuters, 12.5%).
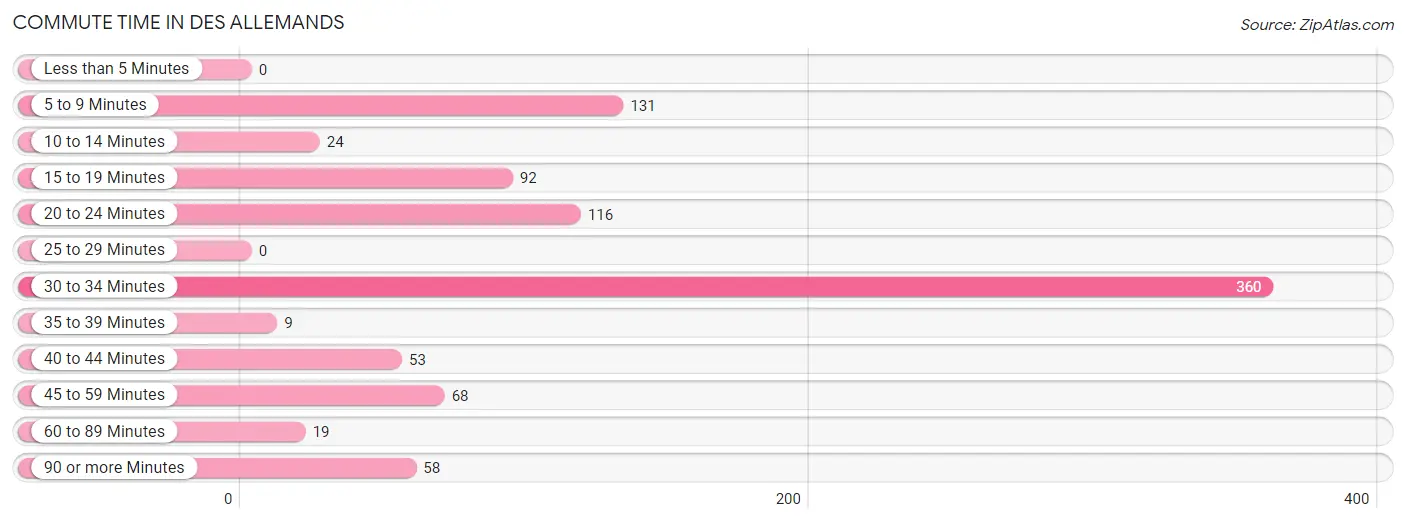
| Commute Time | # Commuters | % Commuters |
| Less than 5 Minutes | 0 | 0.0% |
| 5 to 9 Minutes | 131 | 14.1% |
| 10 to 14 Minutes | 24 | 2.6% |
| 15 to 19 Minutes | 92 | 9.9% |
| 20 to 24 Minutes | 116 | 12.5% |
| 25 to 29 Minutes | 0 | 0.0% |
| 30 to 34 Minutes | 360 | 38.7% |
| 35 to 39 Minutes | 9 | 1.0% |
| 40 to 44 Minutes | 53 | 5.7% |
| 45 to 59 Minutes | 68 | 7.3% |
| 60 to 89 Minutes | 19 | 2.0% |
| 90 or more Minutes | 58 | 6.2% |
Commute Time by Sex in Des Allemands
The most common commute times in Des Allemands are 30 to 34 minutes (194 commuters, 41.8%) for males and 30 to 34 minutes (166 commuters, 35.6%) for females.
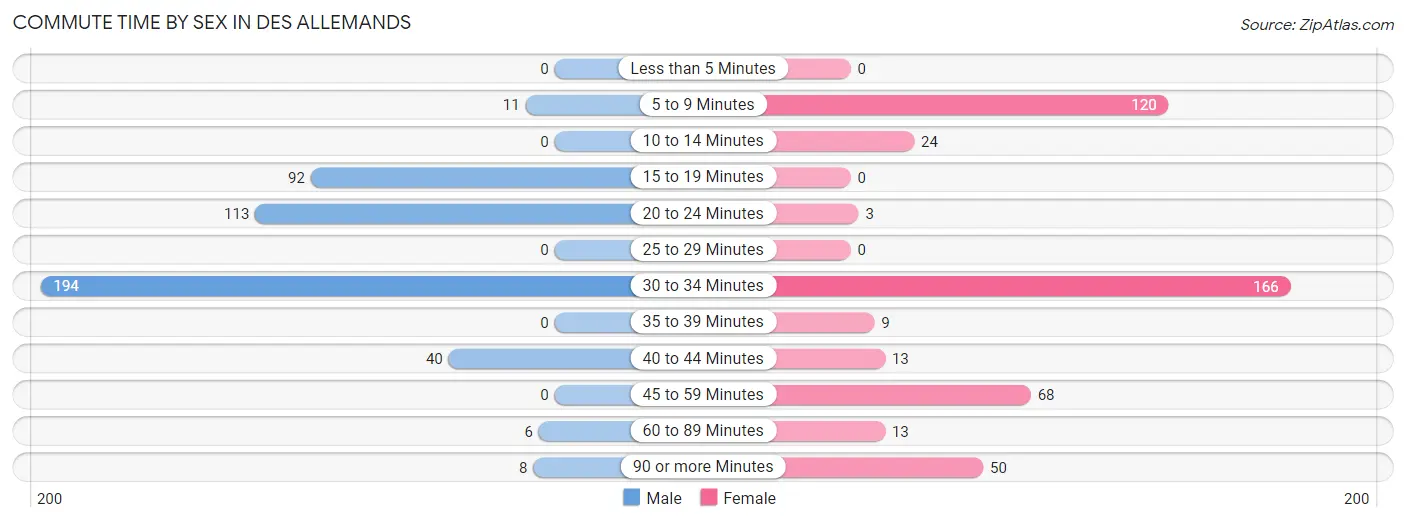
| Commute Time | Male | Female |
| Less than 5 Minutes | 0 (0.0%) | 0 (0.0%) |
| 5 to 9 Minutes | 11 (2.4%) | 120 (25.8%) |
| 10 to 14 Minutes | 0 (0.0%) | 24 (5.1%) |
| 15 to 19 Minutes | 92 (19.8%) | 0 (0.0%) |
| 20 to 24 Minutes | 113 (24.3%) | 3 (0.6%) |
| 25 to 29 Minutes | 0 (0.0%) | 0 (0.0%) |
| 30 to 34 Minutes | 194 (41.8%) | 166 (35.6%) |
| 35 to 39 Minutes | 0 (0.0%) | 9 (1.9%) |
| 40 to 44 Minutes | 40 (8.6%) | 13 (2.8%) |
| 45 to 59 Minutes | 0 (0.0%) | 68 (14.6%) |
| 60 to 89 Minutes | 6 (1.3%) | 13 (2.8%) |
| 90 or more Minutes | 8 (1.7%) | 50 (10.7%) |
Time of Departure to Work by Sex in Des Allemands
The most frequent times of departure to work in Des Allemands are 5:30 AM to 5:59 AM (82, 17.7%) for males and 6:30 AM to 6:59 AM (121, 26.0%) for females.
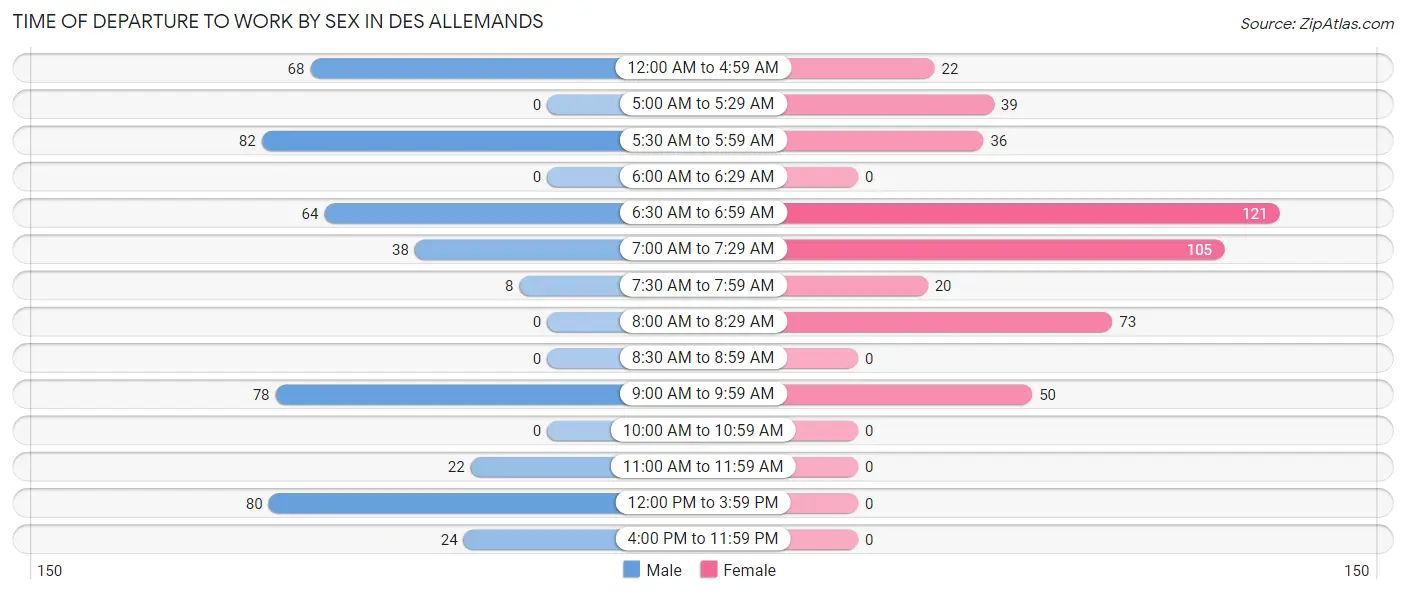
| Time of Departure | Male | Female |
| 12:00 AM to 4:59 AM | 68 (14.7%) | 22 (4.7%) |
| 5:00 AM to 5:29 AM | 0 (0.0%) | 39 (8.4%) |
| 5:30 AM to 5:59 AM | 82 (17.7%) | 36 (7.7%) |
| 6:00 AM to 6:29 AM | 0 (0.0%) | 0 (0.0%) |
| 6:30 AM to 6:59 AM | 64 (13.8%) | 121 (26.0%) |
| 7:00 AM to 7:29 AM | 38 (8.2%) | 105 (22.5%) |
| 7:30 AM to 7:59 AM | 8 (1.7%) | 20 (4.3%) |
| 8:00 AM to 8:29 AM | 0 (0.0%) | 73 (15.7%) |
| 8:30 AM to 8:59 AM | 0 (0.0%) | 0 (0.0%) |
| 9:00 AM to 9:59 AM | 78 (16.8%) | 50 (10.7%) |
| 10:00 AM to 10:59 AM | 0 (0.0%) | 0 (0.0%) |
| 11:00 AM to 11:59 AM | 22 (4.7%) | 0 (0.0%) |
| 12:00 PM to 3:59 PM | 80 (17.2%) | 0 (0.0%) |
| 4:00 PM to 11:59 PM | 24 (5.2%) | 0 (0.0%) |
| Total | 464 (100.0%) | 466 (100.0%) |
Housing Occupancy in Des Allemands
Occupancy by Ownership in Des Allemands
Of the total 846 dwellings in Des Allemands, owner-occupied units account for 773 (91.4%), while renter-occupied units make up 73 (8.6%).
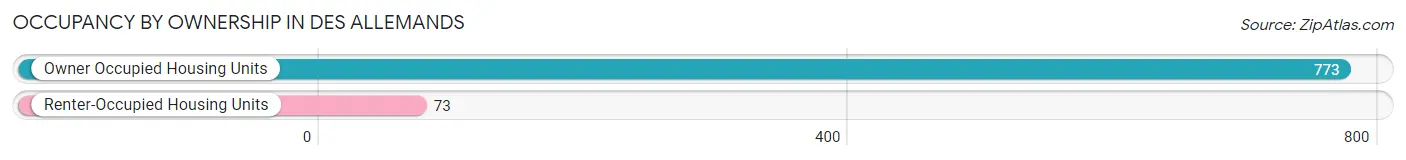
| Occupancy | # Housing Units | % Housing Units |
| Owner Occupied Housing Units | 773 | 91.4% |
| Renter-Occupied Housing Units | 73 | 8.6% |
| Total Occupied Housing Units | 846 | 100.0% |
Occupancy by Household Size in Des Allemands
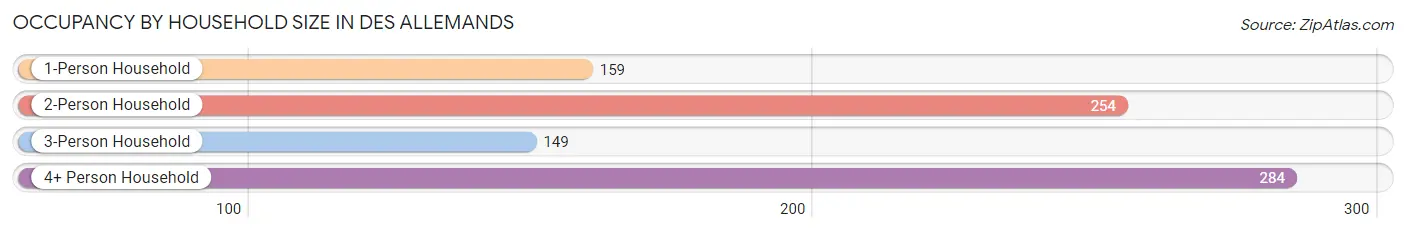
| Household Size | # Housing Units | % Housing Units |
| 1-Person Household | 159 | 18.8% |
| 2-Person Household | 254 | 30.0% |
| 3-Person Household | 149 | 17.6% |
| 4+ Person Household | 284 | 33.6% |
| Total Housing Units | 846 | 100.0% |
Occupancy by Ownership by Household Size in Des Allemands
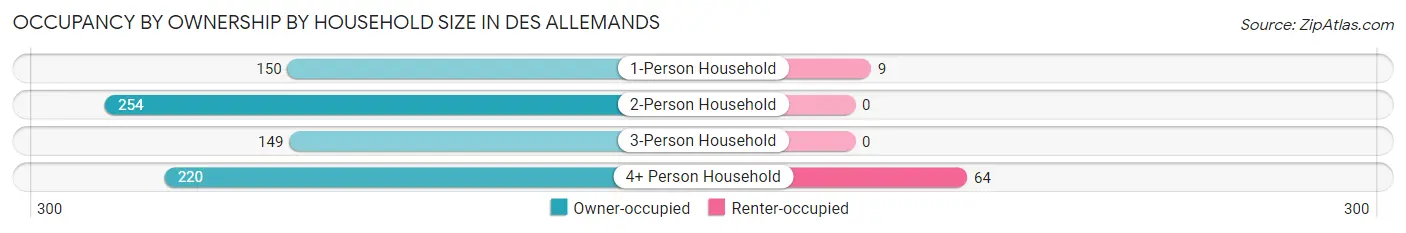
| Household Size | Owner-occupied | Renter-occupied |
| 1-Person Household | 150 (94.3%) | 9 (5.7%) |
| 2-Person Household | 254 (100.0%) | 0 (0.0%) |
| 3-Person Household | 149 (100.0%) | 0 (0.0%) |
| 4+ Person Household | 220 (77.5%) | 64 (22.5%) |
| Total Housing Units | 773 (91.4%) | 73 (8.6%) |
Occupancy by Educational Attainment in Des Allemands
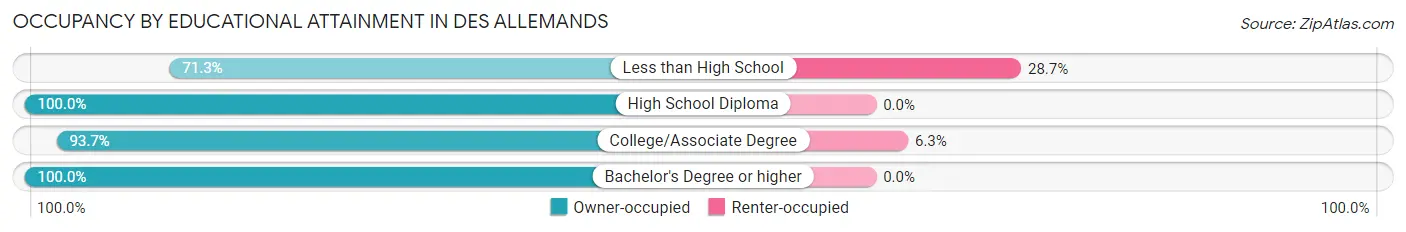
| Household Size | Owner-occupied | Renter-occupied |
| Less than High School | 139 (71.3%) | 56 (28.7%) |
| High School Diploma | 298 (100.0%) | 0 (0.0%) |
| College/Associate Degree | 252 (93.7%) | 17 (6.3%) |
| Bachelor's Degree or higher | 84 (100.0%) | 0 (0.0%) |
Occupancy by Age of Householder in Des Allemands
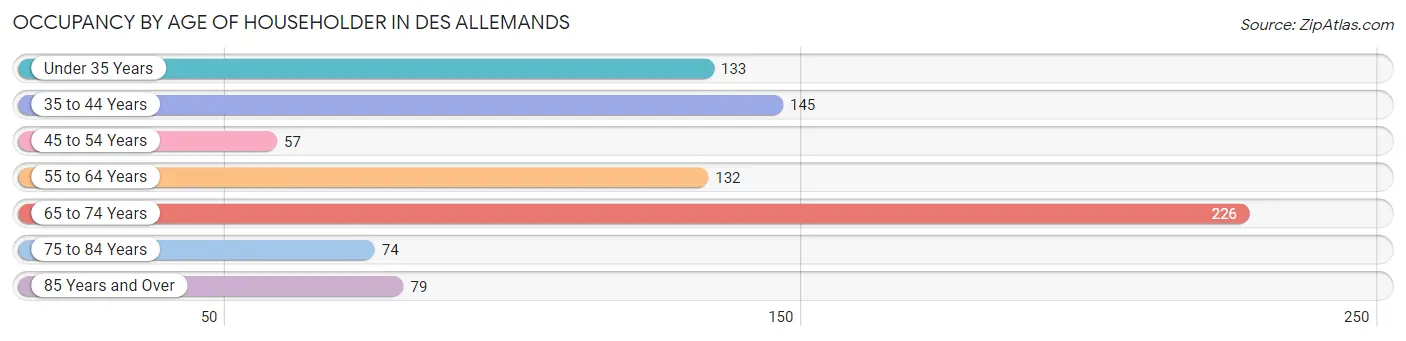
| Age Bracket | # Households | % Households |
| Under 35 Years | 133 | 15.7% |
| 35 to 44 Years | 145 | 17.1% |
| 45 to 54 Years | 57 | 6.7% |
| 55 to 64 Years | 132 | 15.6% |
| 65 to 74 Years | 226 | 26.7% |
| 75 to 84 Years | 74 | 8.7% |
| 85 Years and Over | 79 | 9.3% |
| Total | 846 | 100.0% |
Housing Finances in Des Allemands
Median Income by Occupancy in Des Allemands
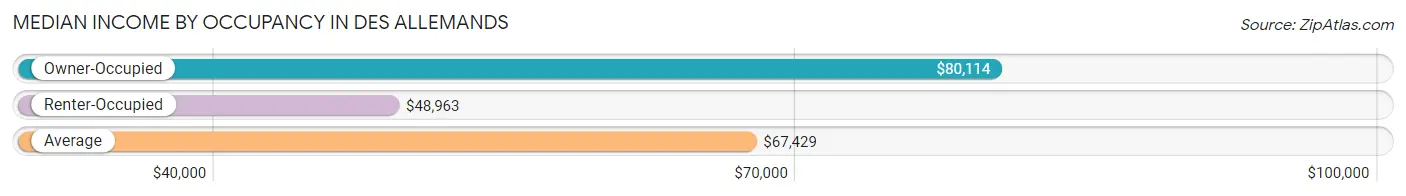
| Occupancy Type | # Households | Median Income |
| Owner-Occupied | 773 (91.4%) | $80,114 |
| Renter-Occupied | 73 (8.6%) | $48,963 |
| Average | 846 (100.0%) | $67,429 |
Occupancy by Householder Income Bracket in Des Allemands
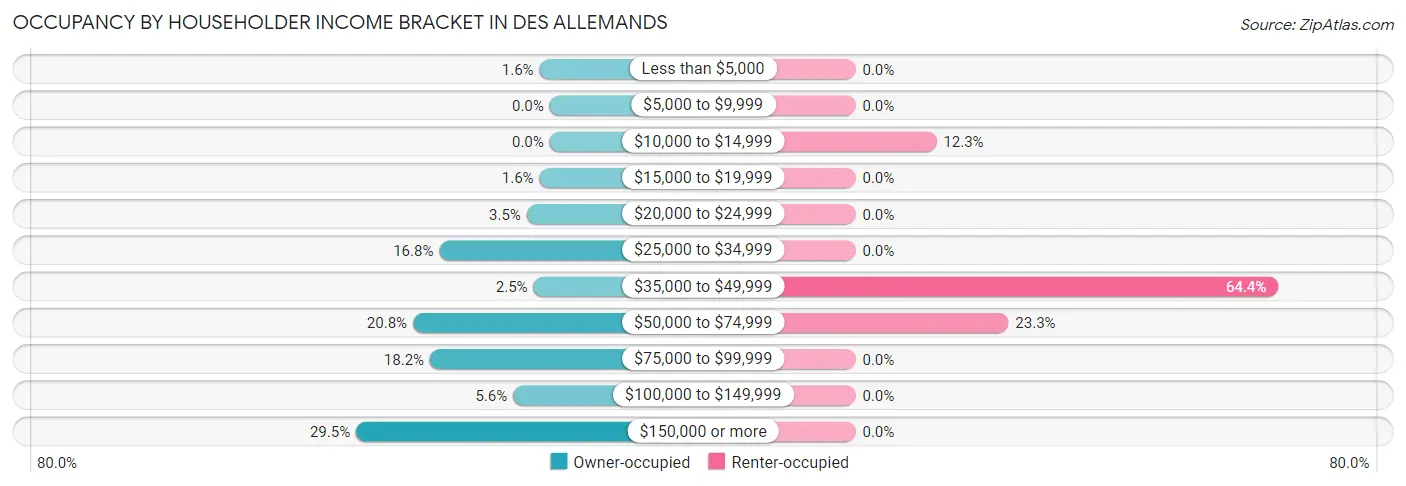
| Income Bracket | Owner-occupied | Renter-occupied |
| Less than $5,000 | 12 (1.5%) | 0 (0.0%) |
| $5,000 to $9,999 | 0 (0.0%) | 0 (0.0%) |
| $10,000 to $14,999 | 0 (0.0%) | 9 (12.3%) |
| $15,000 to $19,999 | 12 (1.5%) | 0 (0.0%) |
| $20,000 to $24,999 | 27 (3.5%) | 0 (0.0%) |
| $25,000 to $34,999 | 130 (16.8%) | 0 (0.0%) |
| $35,000 to $49,999 | 19 (2.5%) | 47 (64.4%) |
| $50,000 to $74,999 | 161 (20.8%) | 17 (23.3%) |
| $75,000 to $99,999 | 141 (18.2%) | 0 (0.0%) |
| $100,000 to $149,999 | 43 (5.6%) | 0 (0.0%) |
| $150,000 or more | 228 (29.5%) | 0 (0.0%) |
| Total | 773 (100.0%) | 73 (100.0%) |
Monthly Housing Cost Tiers in Des Allemands
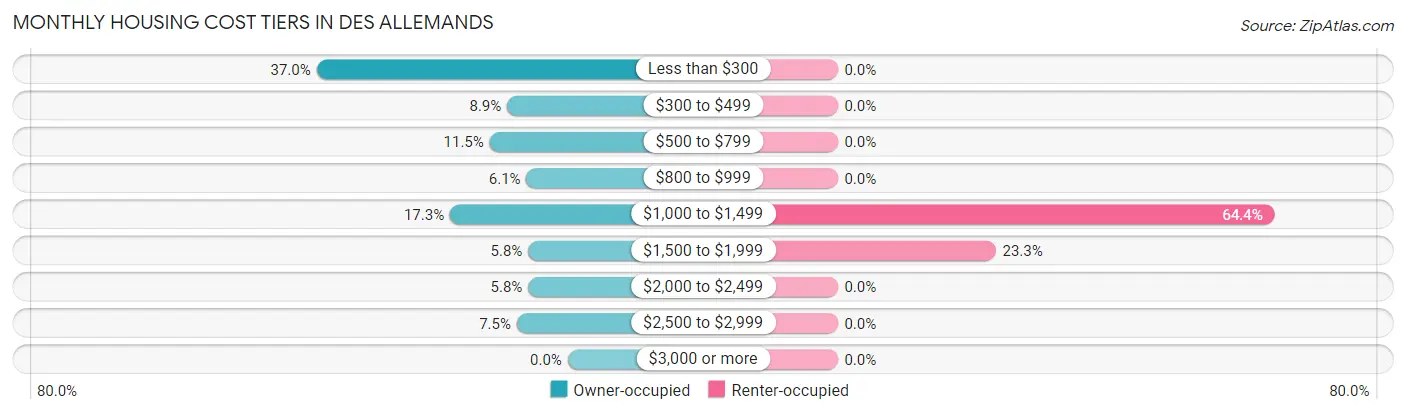
| Monthly Cost | Owner-occupied | Renter-occupied |
| Less than $300 | 286 (37.0%) | 0 (0.0%) |
| $300 to $499 | 69 (8.9%) | 0 (0.0%) |
| $500 to $799 | 89 (11.5%) | 0 (0.0%) |
| $800 to $999 | 47 (6.1%) | 0 (0.0%) |
| $1,000 to $1,499 | 134 (17.3%) | 47 (64.4%) |
| $1,500 to $1,999 | 45 (5.8%) | 17 (23.3%) |
| $2,000 to $2,499 | 45 (5.8%) | 0 (0.0%) |
| $2,500 to $2,999 | 58 (7.5%) | 0 (0.0%) |
| $3,000 or more | 0 (0.0%) | 0 (0.0%) |
| Total | 773 (100.0%) | 73 (100.0%) |
Physical Housing Characteristics in Des Allemands
Housing Structures in Des Allemands
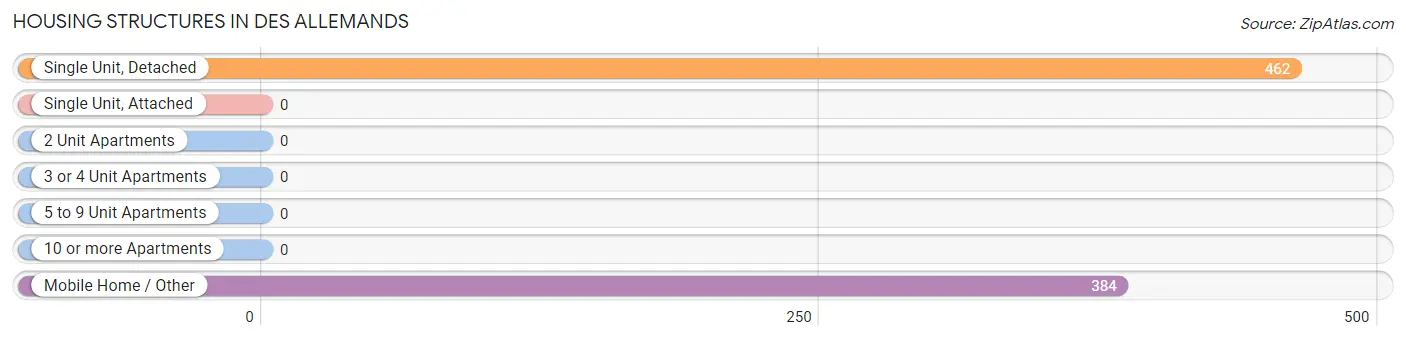
| Structure Type | # Housing Units | % Housing Units |
| Single Unit, Detached | 462 | 54.6% |
| Single Unit, Attached | 0 | 0.0% |
| 2 Unit Apartments | 0 | 0.0% |
| 3 or 4 Unit Apartments | 0 | 0.0% |
| 5 to 9 Unit Apartments | 0 | 0.0% |
| 10 or more Apartments | 0 | 0.0% |
| Mobile Home / Other | 384 | 45.4% |
| Total | 846 | 100.0% |
Housing Structures by Occupancy in Des Allemands
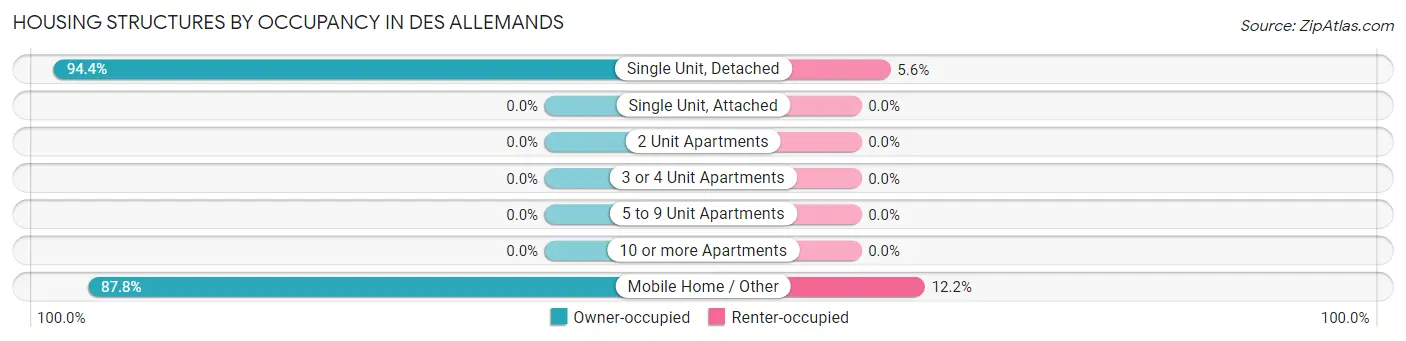
| Structure Type | Owner-occupied | Renter-occupied |
| Single Unit, Detached | 436 (94.4%) | 26 (5.6%) |
| Single Unit, Attached | 0 (0.0%) | 0 (0.0%) |
| 2 Unit Apartments | 0 (0.0%) | 0 (0.0%) |
| 3 or 4 Unit Apartments | 0 (0.0%) | 0 (0.0%) |
| 5 to 9 Unit Apartments | 0 (0.0%) | 0 (0.0%) |
| 10 or more Apartments | 0 (0.0%) | 0 (0.0%) |
| Mobile Home / Other | 337 (87.8%) | 47 (12.2%) |
| Total | 773 (91.4%) | 73 (8.6%) |
Housing Structures by Number of Rooms in Des Allemands
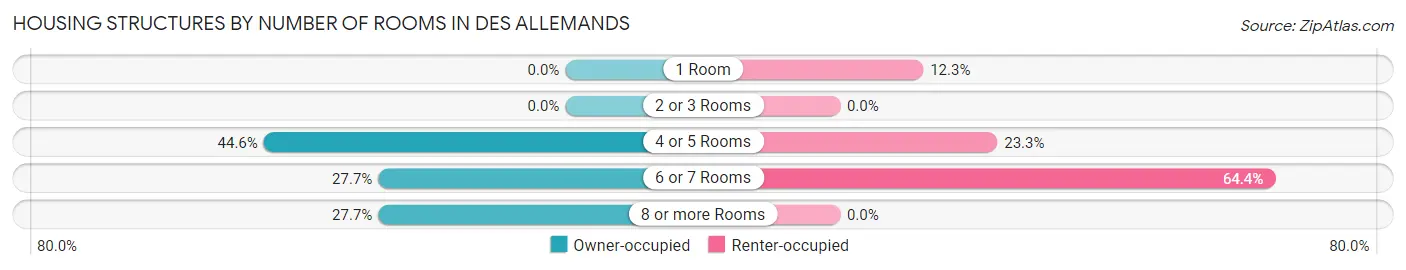
| Number of Rooms | Owner-occupied | Renter-occupied |
| 1 Room | 0 (0.0%) | 9 (12.3%) |
| 2 or 3 Rooms | 0 (0.0%) | 0 (0.0%) |
| 4 or 5 Rooms | 345 (44.6%) | 17 (23.3%) |
| 6 or 7 Rooms | 214 (27.7%) | 47 (64.4%) |
| 8 or more Rooms | 214 (27.7%) | 0 (0.0%) |
| Total | 773 (100.0%) | 73 (100.0%) |
Housing Structure by Heating Type in Des Allemands
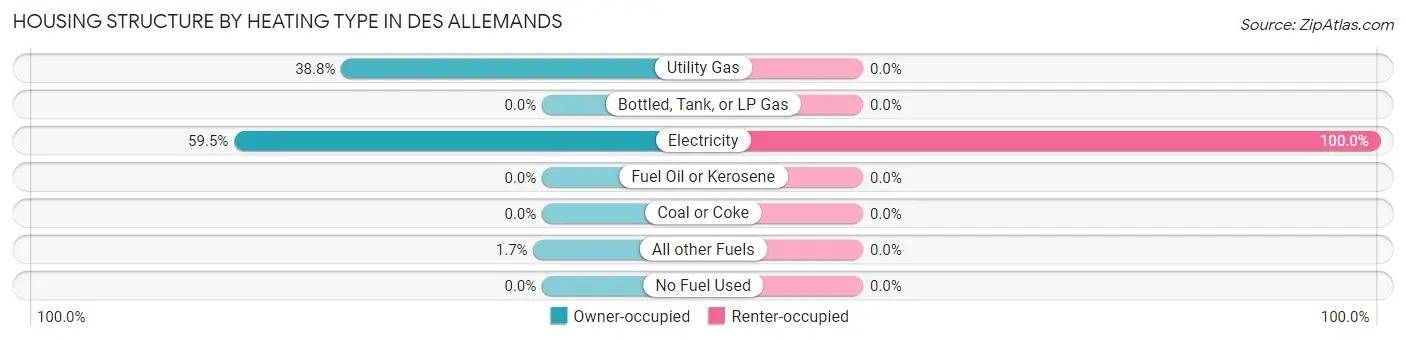
| Heating Type | Owner-occupied | Renter-occupied |
| Utility Gas | 300 (38.8%) | 0 (0.0%) |
| Bottled, Tank, or LP Gas | 0 (0.0%) | 0 (0.0%) |
| Electricity | 460 (59.5%) | 73 (100.0%) |
| Fuel Oil or Kerosene | 0 (0.0%) | 0 (0.0%) |
| Coal or Coke | 0 (0.0%) | 0 (0.0%) |
| All other Fuels | 13 (1.7%) | 0 (0.0%) |
| No Fuel Used | 0 (0.0%) | 0 (0.0%) |
| Total | 773 (100.0%) | 73 (100.0%) |
Household Vehicle Usage in Des Allemands
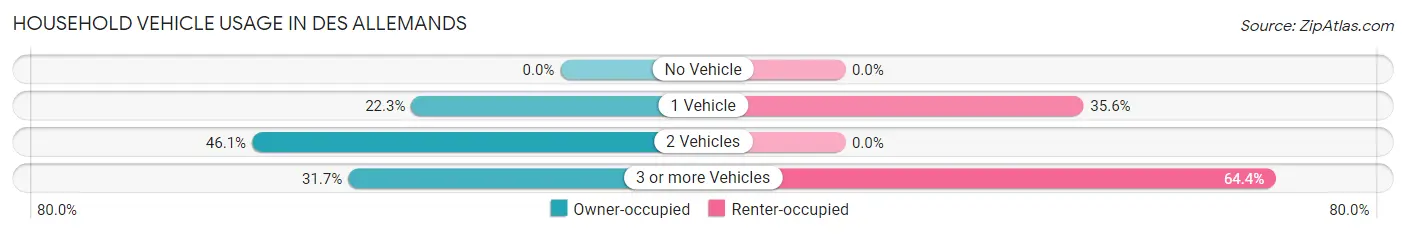
| Vehicles per Household | Owner-occupied | Renter-occupied |
| No Vehicle | 0 (0.0%) | 0 (0.0%) |
| 1 Vehicle | 172 (22.3%) | 26 (35.6%) |
| 2 Vehicles | 356 (46.1%) | 0 (0.0%) |
| 3 or more Vehicles | 245 (31.7%) | 47 (64.4%) |
| Total | 773 (100.0%) | 73 (100.0%) |
Real Estate & Mortgages in Des Allemands
Real Estate and Mortgage Overview in Des Allemands
| Characteristic | Without Mortgage | With Mortgage |
| Housing Units | 432 | 341 |
| Median Property Value | $87,300 | $166,600 |
| Median Household Income | $55,104 | $181 |
| Monthly Housing Costs | $268 | $0 |
| Real Estate Taxes | - | - |
Property Value by Mortgage Status in Des Allemands
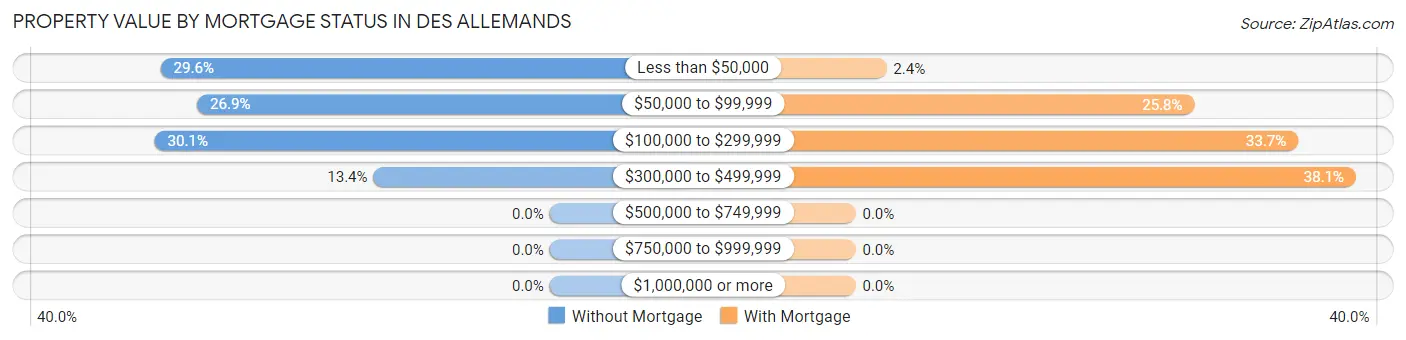
| Property Value | Without Mortgage | With Mortgage |
| Less than $50,000 | 128 (29.6%) | 8 (2.4%) |
| $50,000 to $99,999 | 116 (26.9%) | 88 (25.8%) |
| $100,000 to $299,999 | 130 (30.1%) | 115 (33.7%) |
| $300,000 to $499,999 | 58 (13.4%) | 130 (38.1%) |
| $500,000 to $749,999 | 0 (0.0%) | 0 (0.0%) |
| $750,000 to $999,999 | 0 (0.0%) | 0 (0.0%) |
| $1,000,000 or more | 0 (0.0%) | 0 (0.0%) |
| Total | 432 (100.0%) | 341 (100.0%) |
Household Income by Mortgage Status in Des Allemands
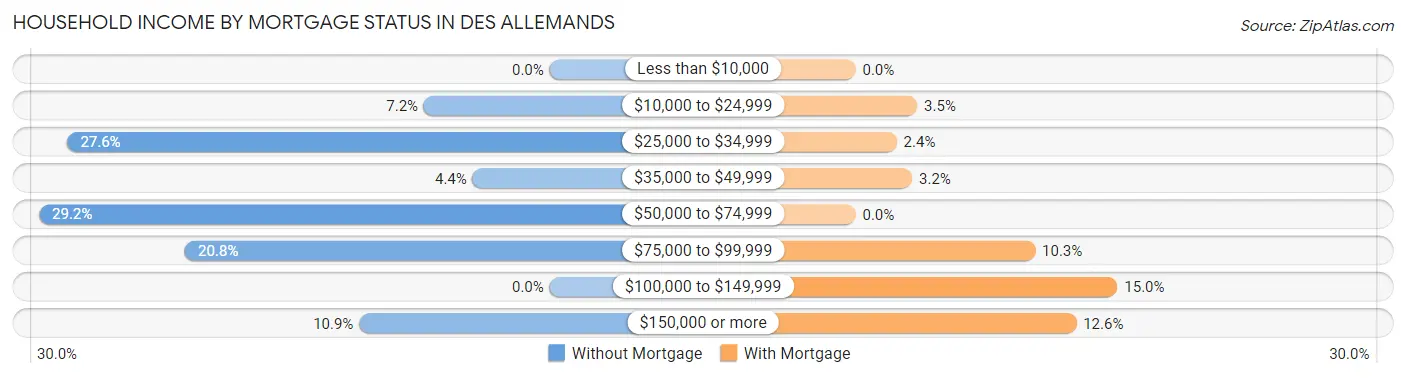
| Household Income | Without Mortgage | With Mortgage |
| Less than $10,000 | 0 (0.0%) | 0 (0.0%) |
| $10,000 to $24,999 | 31 (7.2%) | 12 (3.5%) |
| $25,000 to $34,999 | 119 (27.6%) | 8 (2.4%) |
| $35,000 to $49,999 | 19 (4.4%) | 11 (3.2%) |
| $50,000 to $74,999 | 126 (29.2%) | 0 (0.0%) |
| $75,000 to $99,999 | 90 (20.8%) | 35 (10.3%) |
| $100,000 to $149,999 | 0 (0.0%) | 51 (15.0%) |
| $150,000 or more | 47 (10.9%) | 43 (12.6%) |
| Total | 432 (100.0%) | 341 (100.0%) |
Property Value to Household Income Ratio in Des Allemands
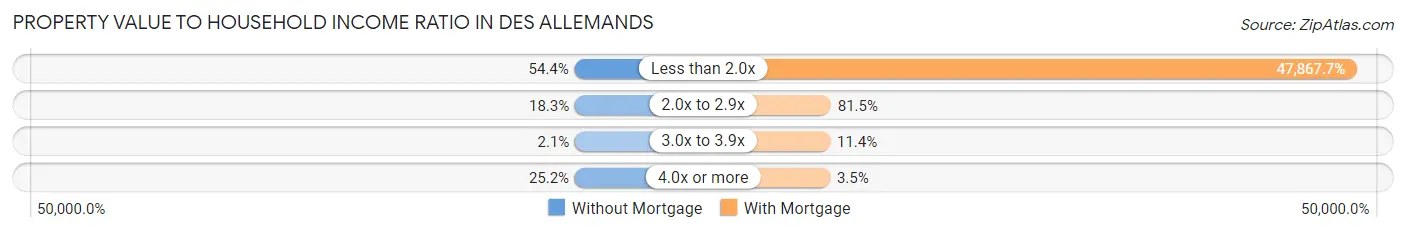
| Value-to-Income Ratio | Without Mortgage | With Mortgage |
| Less than 2.0x | 235 (54.4%) | 163,229 (47,867.7%) |
| 2.0x to 2.9x | 79 (18.3%) | 278 (81.5%) |
| 3.0x to 3.9x | 9 (2.1%) | 39 (11.4%) |
| 4.0x or more | 109 (25.2%) | 12 (3.5%) |
| Total | 432 (100.0%) | 341 (100.0%) |
Real Estate Taxes by Mortgage Status in Des Allemands
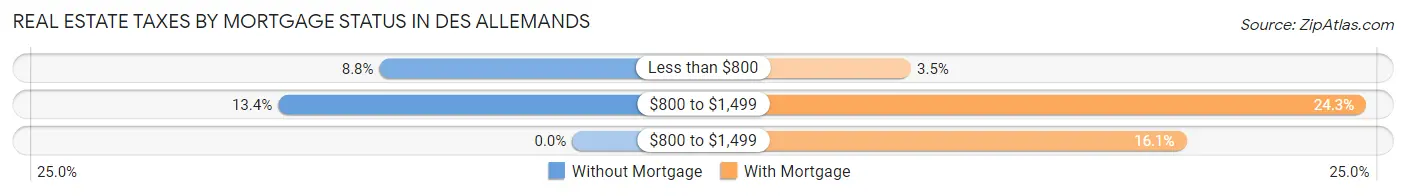
| Property Taxes | Without Mortgage | With Mortgage |
| Less than $800 | 38 (8.8%) | 12 (3.5%) |
| $800 to $1,499 | 58 (13.4%) | 83 (24.3%) |
| $800 to $1,499 | 0 (0.0%) | 55 (16.1%) |
| Total | 432 (100.0%) | 341 (100.0%) |
Health & Disability in Des Allemands
Health Insurance Coverage by Age in Des Allemands
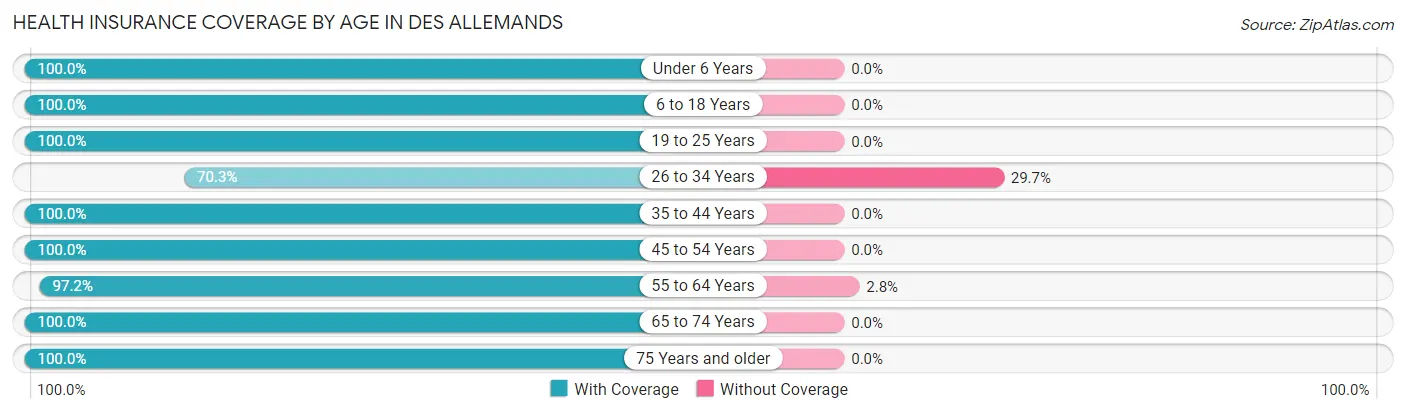
| Age Bracket | With Coverage | Without Coverage |
| Under 6 Years | 137 (100.0%) | 0 (0.0%) |
| 6 to 18 Years | 280 (100.0%) | 0 (0.0%) |
| 19 to 25 Years | 372 (100.0%) | 0 (0.0%) |
| 26 to 34 Years | 215 (70.3%) | 91 (29.7%) |
| 35 to 44 Years | 195 (100.0%) | 0 (0.0%) |
| 45 to 54 Years | 155 (100.0%) | 0 (0.0%) |
| 55 to 64 Years | 311 (97.2%) | 9 (2.8%) |
| 65 to 74 Years | 332 (100.0%) | 0 (0.0%) |
| 75 Years and older | 243 (100.0%) | 0 (0.0%) |
| Total | 2,240 (95.7%) | 100 (4.3%) |
Health Insurance Coverage by Citizenship Status in Des Allemands
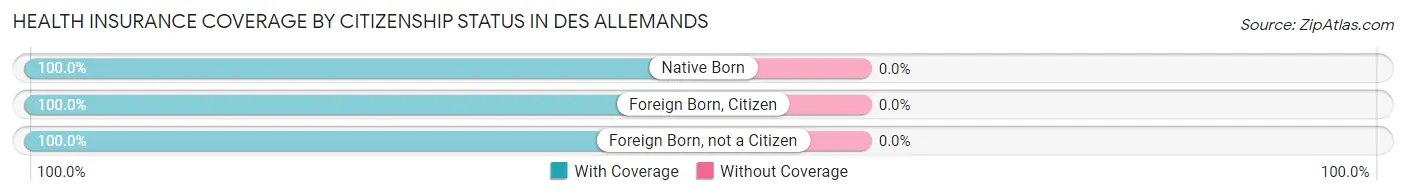
| Citizenship Status | With Coverage | Without Coverage |
| Native Born | 137 (100.0%) | 0 (0.0%) |
| Foreign Born, Citizen | 280 (100.0%) | 0 (0.0%) |
| Foreign Born, not a Citizen | 372 (100.0%) | 0 (0.0%) |
Health Insurance Coverage by Household Income in Des Allemands
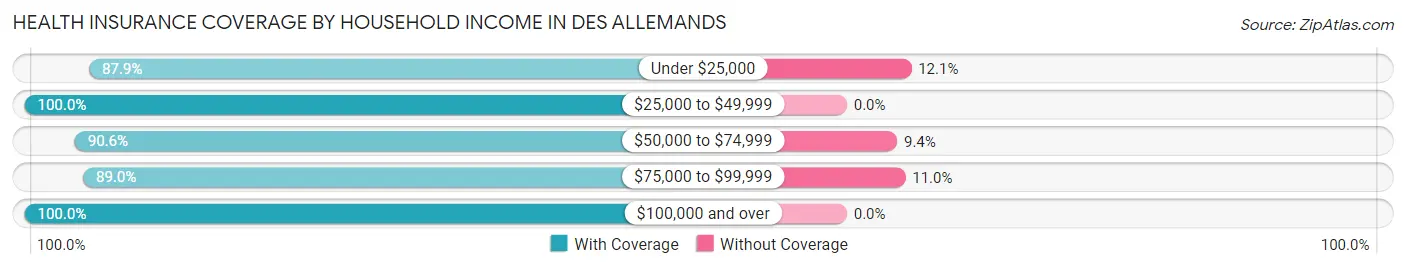
| Household Income | With Coverage | Without Coverage |
| Under $25,000 | 102 (87.9%) | 14 (12.1%) |
| $25,000 to $49,999 | 418 (100.0%) | 0 (0.0%) |
| $50,000 to $74,999 | 443 (90.6%) | 46 (9.4%) |
| $75,000 to $99,999 | 325 (89.0%) | 40 (11.0%) |
| $100,000 and over | 952 (100.0%) | 0 (0.0%) |
Public vs Private Health Insurance Coverage by Age in Des Allemands
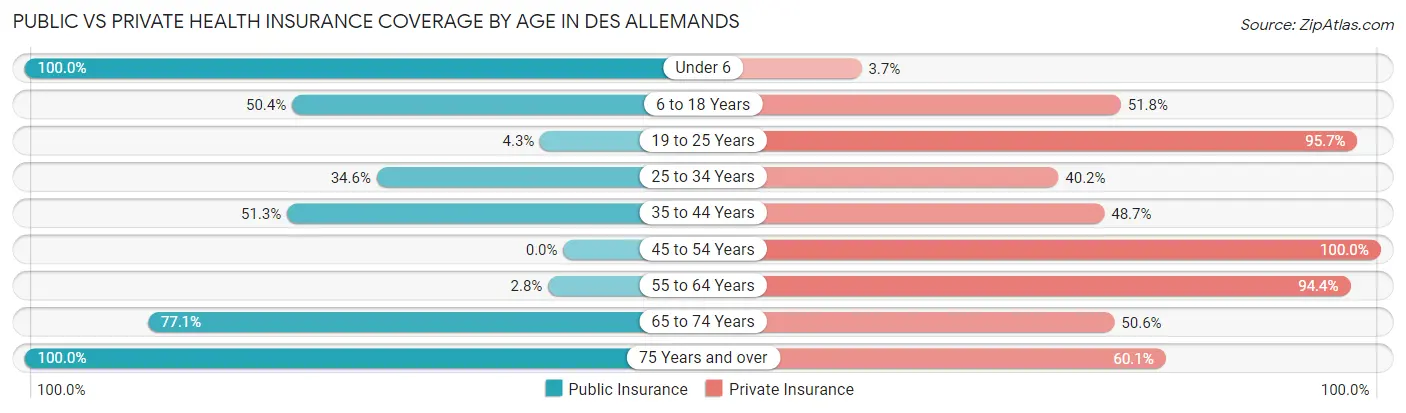
| Age Bracket | Public Insurance | Private Insurance |
| Under 6 | 137 (100.0%) | 5 (3.6%) |
| 6 to 18 Years | 141 (50.4%) | 145 (51.8%) |
| 19 to 25 Years | 16 (4.3%) | 356 (95.7%) |
| 25 to 34 Years | 106 (34.6%) | 123 (40.2%) |
| 35 to 44 Years | 100 (51.3%) | 95 (48.7%) |
| 45 to 54 Years | 0 (0.0%) | 155 (100.0%) |
| 55 to 64 Years | 9 (2.8%) | 302 (94.4%) |
| 65 to 74 Years | 256 (77.1%) | 168 (50.6%) |
| 75 Years and over | 243 (100.0%) | 146 (60.1%) |
| Total | 1,008 (43.1%) | 1,495 (63.9%) |
Disability Status by Sex by Age in Des Allemands
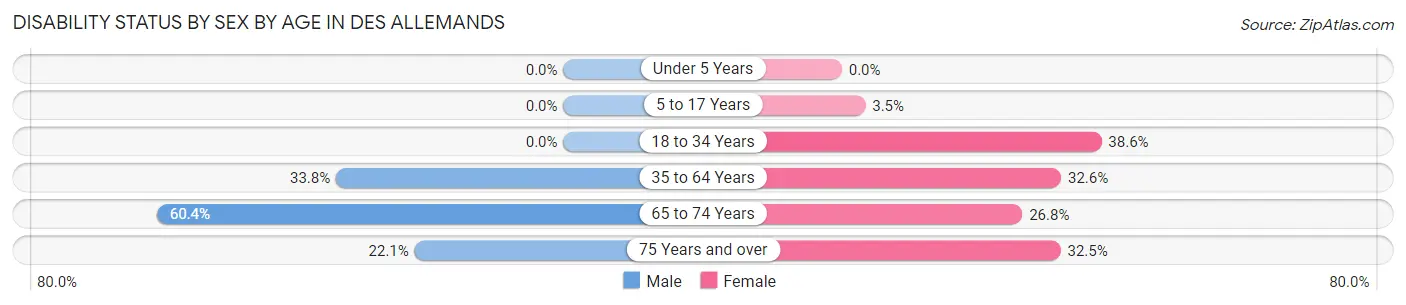
| Age Bracket | Male | Female |
| Under 5 Years | 0 (0.0%) | 0 (0.0%) |
| 5 to 17 Years | 0 (0.0%) | 6 (3.5%) |
| 18 to 34 Years | 0 (0.0%) | 133 (38.6%) |
| 35 to 64 Years | 109 (33.8%) | 113 (32.6%) |
| 65 to 74 Years | 99 (60.4%) | 45 (26.8%) |
| 75 Years and over | 19 (22.1%) | 51 (32.5%) |
Disability Class by Sex by Age in Des Allemands
Disability Class: Hearing Difficulty
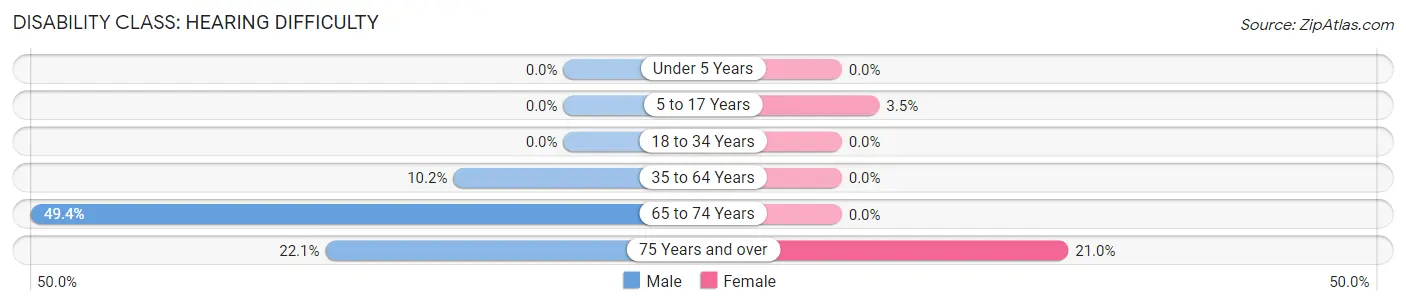
| Age Bracket | Male | Female |
| Under 5 Years | 0 (0.0%) | 0 (0.0%) |
| 5 to 17 Years | 0 (0.0%) | 6 (3.5%) |
| 18 to 34 Years | 0 (0.0%) | 0 (0.0%) |
| 35 to 64 Years | 33 (10.2%) | 0 (0.0%) |
| 65 to 74 Years | 81 (49.4%) | 0 (0.0%) |
| 75 Years and over | 19 (22.1%) | 33 (21.0%) |
Disability Class: Vision Difficulty
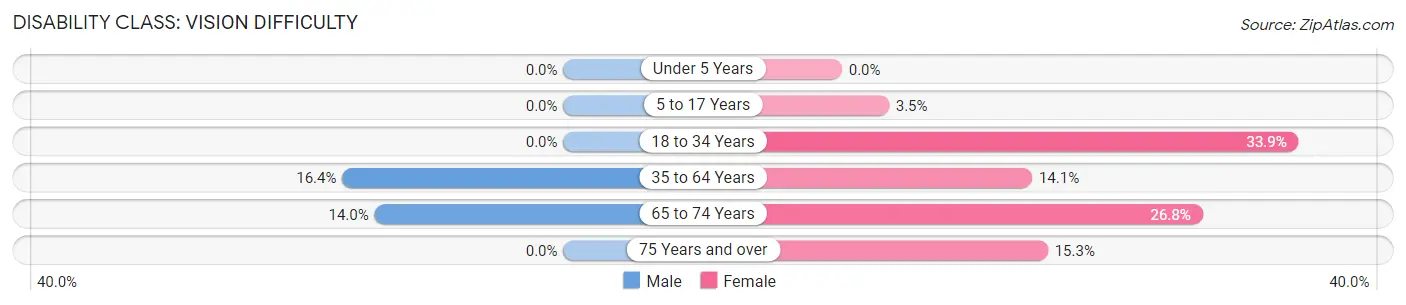
| Age Bracket | Male | Female |
| Under 5 Years | 0 (0.0%) | 0 (0.0%) |
| 5 to 17 Years | 0 (0.0%) | 6 (3.5%) |
| 18 to 34 Years | 0 (0.0%) | 117 (33.9%) |
| 35 to 64 Years | 53 (16.4%) | 49 (14.1%) |
| 65 to 74 Years | 23 (14.0%) | 45 (26.8%) |
| 75 Years and over | 0 (0.0%) | 24 (15.3%) |
Disability Class: Cognitive Difficulty

| Age Bracket | Male | Female |
| 5 to 17 Years | 0 (0.0%) | 0 (0.0%) |
| 18 to 34 Years | 0 (0.0%) | 16 (4.6%) |
| 35 to 64 Years | 0 (0.0%) | 47 (13.5%) |
| 65 to 74 Years | 0 (0.0%) | 0 (0.0%) |
| 75 Years and over | 0 (0.0%) | 0 (0.0%) |
Disability Class: Ambulatory Difficulty
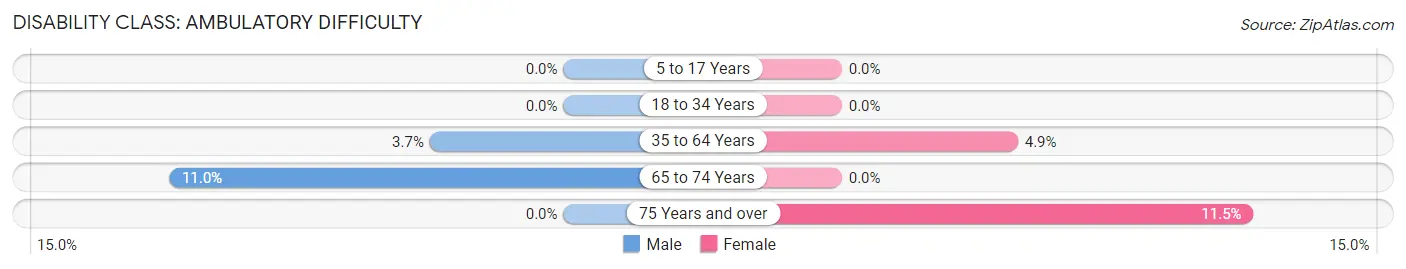
| Age Bracket | Male | Female |
| 5 to 17 Years | 0 (0.0%) | 0 (0.0%) |
| 18 to 34 Years | 0 (0.0%) | 0 (0.0%) |
| 35 to 64 Years | 12 (3.7%) | 17 (4.9%) |
| 65 to 74 Years | 18 (11.0%) | 0 (0.0%) |
| 75 Years and over | 0 (0.0%) | 18 (11.5%) |
Disability Class: Self-Care Difficulty
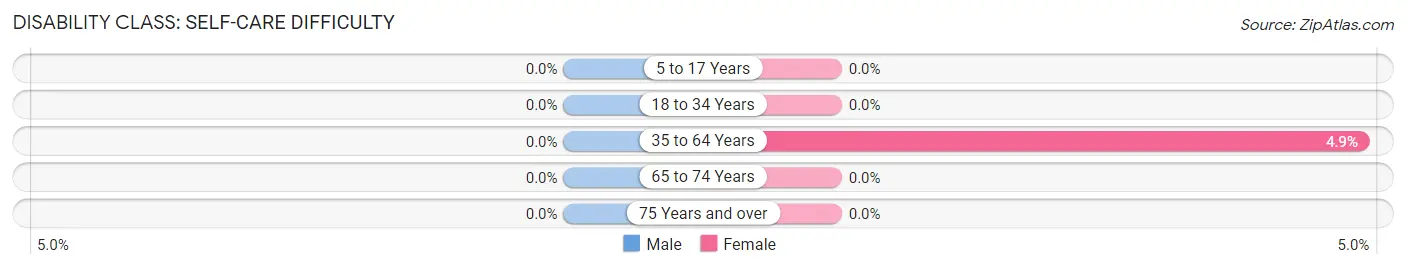
| Age Bracket | Male | Female |
| 5 to 17 Years | 0 (0.0%) | 0 (0.0%) |
| 18 to 34 Years | 0 (0.0%) | 0 (0.0%) |
| 35 to 64 Years | 0 (0.0%) | 17 (4.9%) |
| 65 to 74 Years | 0 (0.0%) | 0 (0.0%) |
| 75 Years and over | 0 (0.0%) | 0 (0.0%) |
Technology Access in Des Allemands
Computing Device Access in Des Allemands
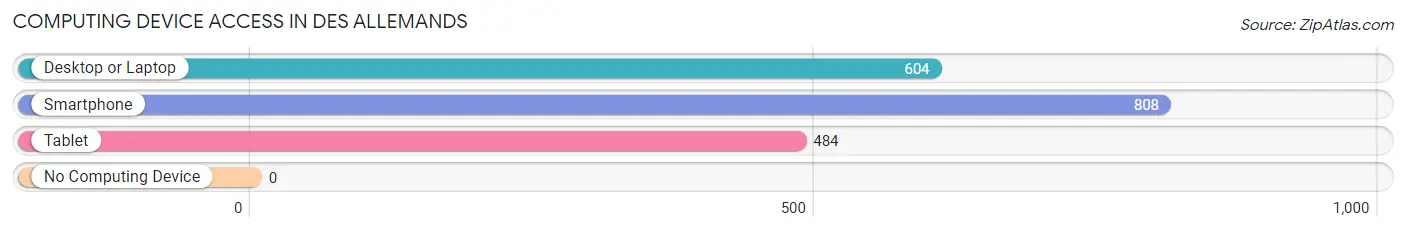
| Device Type | # Households | % Households |
| Desktop or Laptop | 604 | 71.4% |
| Smartphone | 808 | 95.5% |
| Tablet | 484 | 57.2% |
| No Computing Device | 0 | 0.0% |
| Total | 846 | 100.0% |
Internet Access in Des Allemands
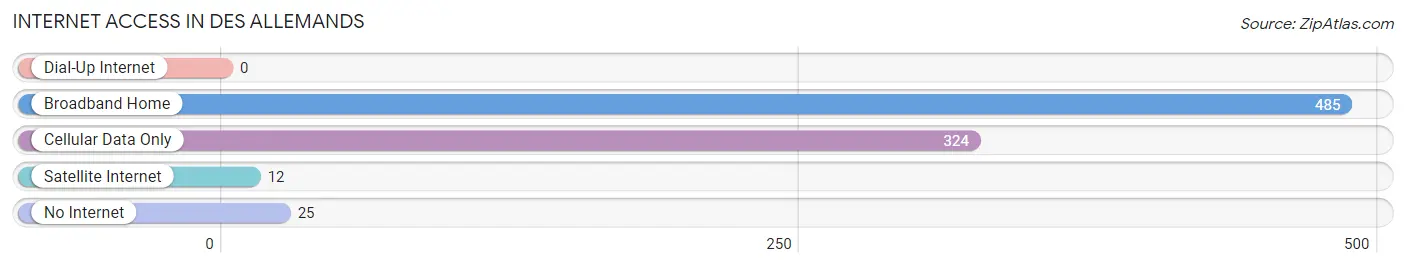
| Internet Type | # Households | % Households |
| Dial-Up Internet | 0 | 0.0% |
| Broadband Home | 485 | 57.3% |
| Cellular Data Only | 324 | 38.3% |
| Satellite Internet | 12 | 1.4% |
| No Internet | 25 | 3.0% |
| Total | 846 | 100.0% |
Des Allemands Summary
Allemands is a small unincorporated community located in St. Charles Parish, Louisiana. It is situated on the east bank of the Mississippi River, approximately 25 miles northwest of New Orleans. The population of Allemands was 1,845 as of the 2010 census.
History
Allemands was founded in the early 1800s by German immigrants who settled in the area. The name Allemands is derived from the French word for “Germans”. The town was originally known as “German Settlement”, but the name was changed to Allemands in the late 1800s.
The town was a major port for the shipping of cotton and other goods in the 19th century. The town was also home to a number of sawmills and other industries.
Geography
Allemands is located in St. Charles Parish, Louisiana. It is situated on the east bank of the Mississippi River, approximately 25 miles northwest of New Orleans. The town is bordered by the towns of Des Allemands, Paradis, and Boutte.
The town has a total area of 2.2 square miles, all of which is land. The terrain is mostly flat and the town is located at an elevation of 8 feet above sea level.
Economy
The economy of Allemands is largely based on agriculture and fishing. The town is home to a number of farms and ranches, as well as a number of seafood processing plants.
The town is also home to a number of small businesses, including restaurants, convenience stores, and gas stations.
Demographics
As of the 2010 census, the population of Allemands was 1,845. The racial makeup of the town was 79.3% White, 17.2% African American, 0.7% Native American, 0.3% Asian, 0.1% Pacific Islander, and 2.4% from other races.
The median household income in Allemands was $41,250, and the median family income was $48,750. The per capita income was $19,945. About 15.3% of the population was below the poverty line.
Conclusion
Allemands is a small unincorporated community located in St. Charles Parish, Louisiana. It was founded in the early 1800s by German immigrants and has a population of 1,845 as of the 2010 census. The economy of Allemands is largely based on agriculture and fishing, and the town is home to a number of small businesses. The racial makeup of the town is 79.3% White, 17.2% African American, 0.7% Native American, 0.3% Asian, 0.1% Pacific Islander, and 2.4% from other races. The median household income in Allemands was $41,250, and the median family income was $48,750. About 15.3% of the population was below the poverty line.
Common Questions
What is Per Capita Income in Des Allemands?
Per Capita income in Des Allemands is $62,413.
What is the Median Family Income in Des Allemands?
Median Family Income in Des Allemands is $65,821.
What is the Median Household income in Des Allemands?
Median Household Income in Des Allemands is $67,429.
What is Income or Wage Gap in Des Allemands?
Income or Wage Gap in Des Allemands is 28.6%.
Women in Des Allemands earn 71.4 cents for every dollar earned by a man.
What is Inequality or Gini Index in Des Allemands?
Inequality or Gini Index in Des Allemands is 0.61.
What is the Total Population of Des Allemands?
Total Population of Des Allemands is 2,340.
What is the Total Male Population of Des Allemands?
Total Male Population of Des Allemands is 1,109.
What is the Total Female Population of Des Allemands?
Total Female Population of Des Allemands is 1,231.
What is the Ratio of Males per 100 Females in Des Allemands?
There are 90.09 Males per 100 Females in Des Allemands.
What is the Ratio of Females per 100 Males in Des Allemands?
There are 111.00 Females per 100 Males in Des Allemands.
What is the Median Population Age in Des Allemands?
Median Population Age in Des Allemands is 39.9 Years.
What is the Average Family Size in Des Allemands
Average Family Size in Des Allemands is 3.1 People.
What is the Average Household Size in Des Allemands
Average Household Size in Des Allemands is 2.8 People.
How Large is the Labor Force in Des Allemands?
There are 1,121 People in the Labor Forcein in Des Allemands.
What is the Percentage of People in the Labor Force in Des Allemands?
56.9% of People are in the Labor Force in Des Allemands.
What is the Unemployment Rate in Des Allemands?
Unemployment Rate in Des Allemands is 5.7%.