Deridder, LA Map & Demographics
Deridder Map
Deridder Overview
$32,020
PER CAPITA INCOME
$64,182
AVG FAMILY INCOME
$56,607
AVG HOUSEHOLD INCOME
53.0%
WAGE / INCOME GAP [ % ]
47.0¢/ $1
WAGE / INCOME GAP [ $ ]
$11,159
FAMILY INCOME DEFICIT
0.44
INEQUALITY / GINI INDEX
9,850
TOTAL POPULATION
5,099
MALE POPULATION
4,751
FEMALE POPULATION
107.32
MALES / 100 FEMALES
93.18
FEMALES / 100 MALES
38.1
MEDIAN AGE
2.9
AVG FAMILY SIZE
2.4
AVG HOUSEHOLD SIZE
4,504
LABOR FORCE [ PEOPLE ]
57.6%
PERCENT IN LABOR FORCE
11.0%
UNEMPLOYMENT RATE
Deridder Zip Codes
Deridder Area Codes
Income in Deridder
Income Overview in Deridder
Per Capita Income in Deridder is $32,020, while median incomes of families and households are $64,182 and $56,607 respectively.
| Characteristic | Number | Measure |
| Per Capita Income | 9,850 | $32,020 |
| Median Family Income | 2,649 | $64,182 |
| Mean Family Income | 2,649 | $88,162 |
| Median Household Income | 4,051 | $56,607 |
| Mean Household Income | 4,051 | $76,475 |
| Income Deficit | 2,649 | $11,159 |
| Wage / Income Gap (%) | 9,850 | 52.99% |
| Wage / Income Gap ($) | 9,850 | 47.01¢ per $1 |
| Gini / Inequality Index | 9,850 | 0.44 |
Earnings by Sex in Deridder
Average Earnings in Deridder are $34,649, $53,885 for men and $25,330 for women, a difference of 53.0%.
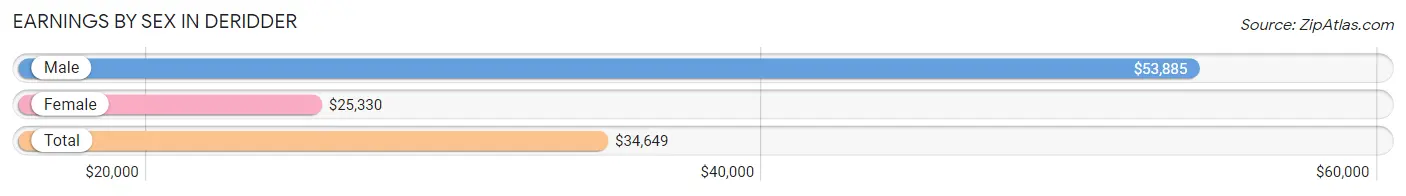
| Sex | Number | Average Earnings |
| Male | 2,482 (53.0%) | $53,885 |
| Female | 2,204 (47.0%) | $25,330 |
| Total | 4,686 (100.0%) | $34,649 |
Earnings by Sex by Income Bracket in Deridder
The most common earnings brackets in Deridder are $100,000+ for men (428 | 17.2%) and $25,000 to $29,999 for women (263 | 11.9%).
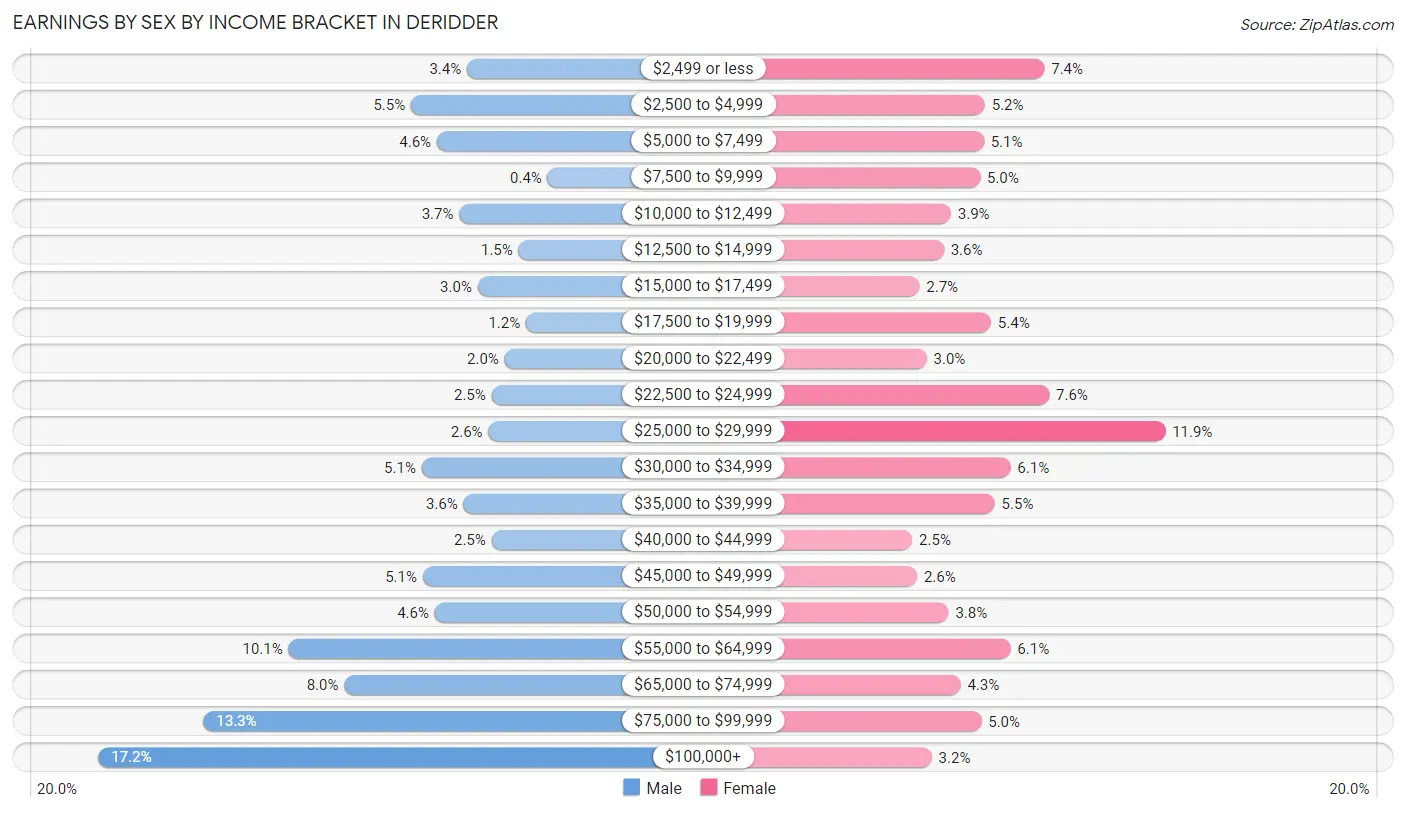
| Income | Male | Female |
| $2,499 or less | 85 (3.4%) | 163 (7.4%) |
| $2,500 to $4,999 | 137 (5.5%) | 114 (5.2%) |
| $5,000 to $7,499 | 113 (4.5%) | 113 (5.1%) |
| $7,500 to $9,999 | 10 (0.4%) | 110 (5.0%) |
| $10,000 to $12,499 | 92 (3.7%) | 86 (3.9%) |
| $12,500 to $14,999 | 37 (1.5%) | 80 (3.6%) |
| $15,000 to $17,499 | 75 (3.0%) | 60 (2.7%) |
| $17,500 to $19,999 | 30 (1.2%) | 119 (5.4%) |
| $20,000 to $22,499 | 50 (2.0%) | 66 (3.0%) |
| $22,500 to $24,999 | 62 (2.5%) | 167 (7.6%) |
| $25,000 to $29,999 | 65 (2.6%) | 263 (11.9%) |
| $30,000 to $34,999 | 127 (5.1%) | 135 (6.1%) |
| $35,000 to $39,999 | 88 (3.5%) | 122 (5.5%) |
| $40,000 to $44,999 | 62 (2.5%) | 54 (2.5%) |
| $45,000 to $49,999 | 126 (5.1%) | 58 (2.6%) |
| $50,000 to $54,999 | 115 (4.6%) | 84 (3.8%) |
| $55,000 to $64,999 | 251 (10.1%) | 135 (6.1%) |
| $65,000 to $74,999 | 199 (8.0%) | 94 (4.3%) |
| $75,000 to $99,999 | 330 (13.3%) | 111 (5.0%) |
| $100,000+ | 428 (17.2%) | 70 (3.2%) |
| Total | 2,482 (100.0%) | 2,204 (100.0%) |
Earnings by Sex by Educational Attainment in Deridder
Average earnings in Deridder are $58,770 for men and $26,695 for women, a difference of 54.6%. Men with an educational attainment of graduate degree enjoy the highest average annual earnings of $83,229, while those with less than high school education earn the least with $34,135. Women with an educational attainment of graduate degree earn the most with the average annual earnings of $62,031, while those with less than high school education have the smallest earnings of $24,750.
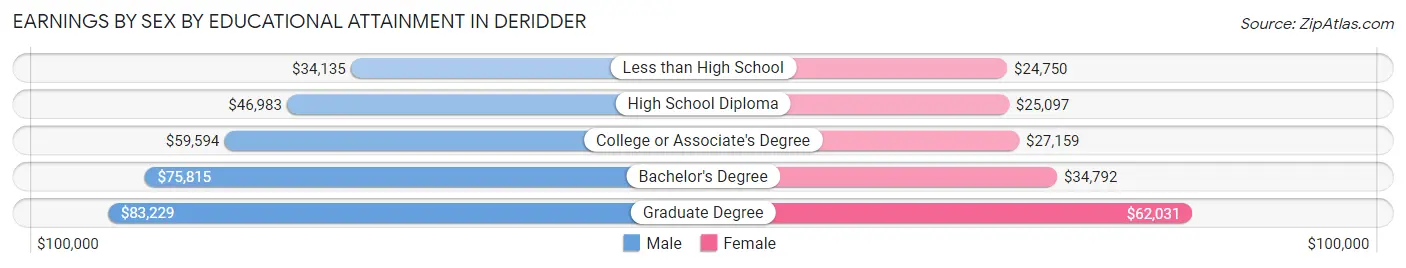
| Educational Attainment | Male Income | Female Income |
| Less than High School | $34,135 | $24,750 |
| High School Diploma | $46,983 | $25,097 |
| College or Associate's Degree | $59,594 | $27,159 |
| Bachelor's Degree | $75,815 | $34,792 |
| Graduate Degree | $83,229 | $62,031 |
| Total | $58,770 | $26,695 |
Family Income in Deridder
Family Income Brackets in Deridder
According to the Deridder family income data, there are 617 families falling into the $50,000 to $74,999 income range, which is the most common income bracket and makes up 23.3% of all families. Conversely, the $10,000 to $14,999 income bracket is the least frequent group with only 72 families (2.7%) belonging to this category.
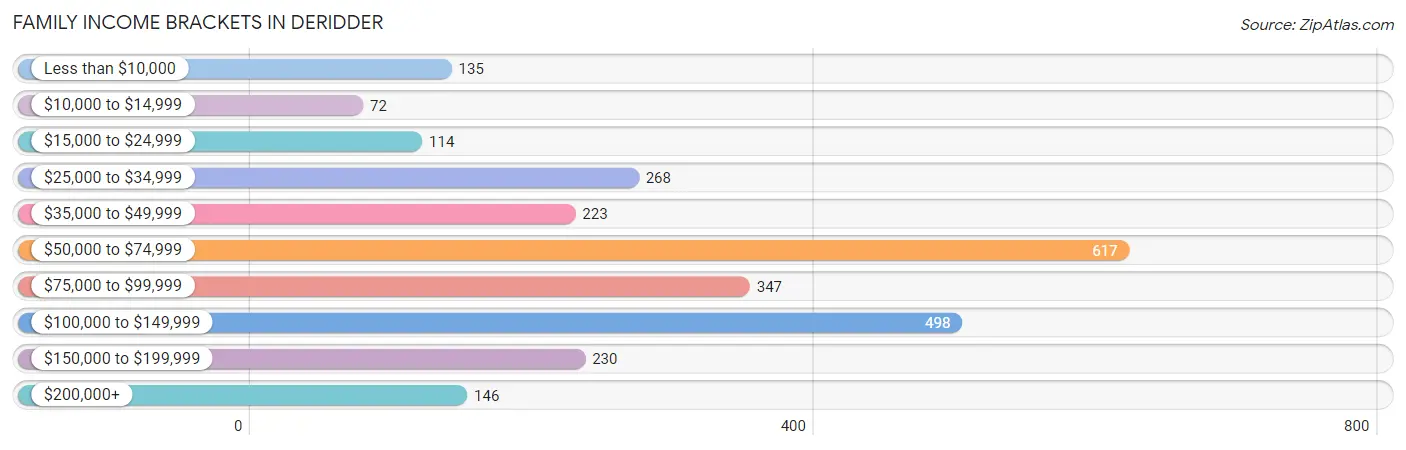
| Income Bracket | # Families | % Families |
| Less than $10,000 | 135 | 5.1% |
| $10,000 to $14,999 | 72 | 2.7% |
| $15,000 to $24,999 | 114 | 4.3% |
| $25,000 to $34,999 | 268 | 10.1% |
| $35,000 to $49,999 | 223 | 8.4% |
| $50,000 to $74,999 | 617 | 23.3% |
| $75,000 to $99,999 | 347 | 13.1% |
| $100,000 to $149,999 | 498 | 18.8% |
| $150,000 to $199,999 | 230 | 8.7% |
| $200,000+ | 146 | 5.5% |
Family Income by Famaliy Size in Deridder
6-person families (118 | 4.4%) account for the highest median family income in Deridder with $126,014 per family, while 2-person families (1,336 | 50.4%) have the highest median income of $32,183 per family member.
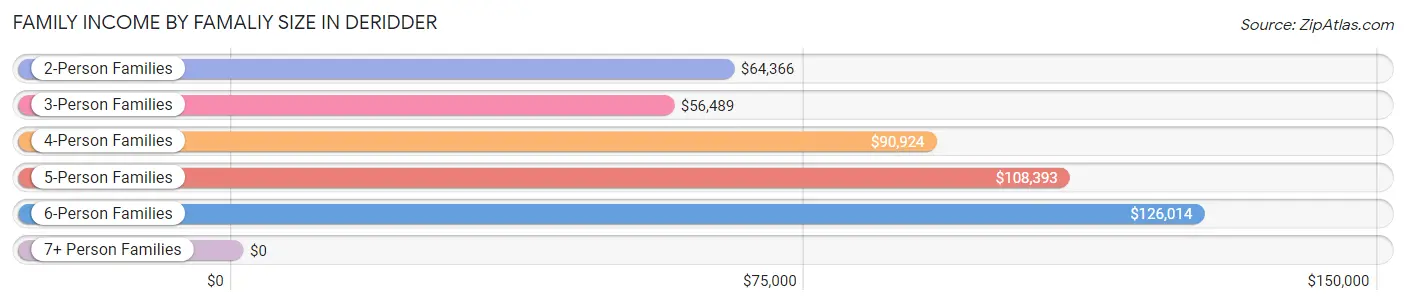
| Income Bracket | # Families | Median Income |
| 2-Person Families | 1,336 (50.4%) | $64,366 |
| 3-Person Families | 699 (26.4%) | $56,489 |
| 4-Person Families | 383 (14.5%) | $90,924 |
| 5-Person Families | 105 (4.0%) | $108,393 |
| 6-Person Families | 118 (4.4%) | $126,014 |
| 7+ Person Families | 8 (0.3%) | $0 |
| Total | 2,649 (100.0%) | $64,182 |
Family Income by Number of Earners in Deridder
The median family income in Deridder is $64,182, with families comprising 3+ earners (126) having the highest median family income of $133,333, while families with 1 earner (1,151) have the lowest median family income of $54,818, accounting for 4.8% and 43.4% of families, respectively.
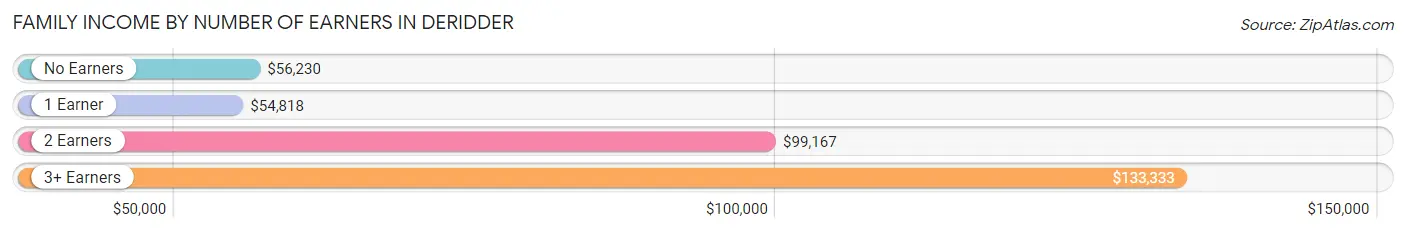
| Number of Earners | # Families | Median Income |
| No Earners | 496 (18.7%) | $56,230 |
| 1 Earner | 1,151 (43.4%) | $54,818 |
| 2 Earners | 876 (33.1%) | $99,167 |
| 3+ Earners | 126 (4.8%) | $133,333 |
| Total | 2,649 (100.0%) | $64,182 |
Household Income in Deridder
Household Income Brackets in Deridder
With 847 households falling in the category, the $50,000 to $74,999 income range is the most frequent in Deridder, accounting for 20.9% of all households. In contrast, only 158 households (3.9%) fall into the $200,000+ income bracket, making it the least populous group.
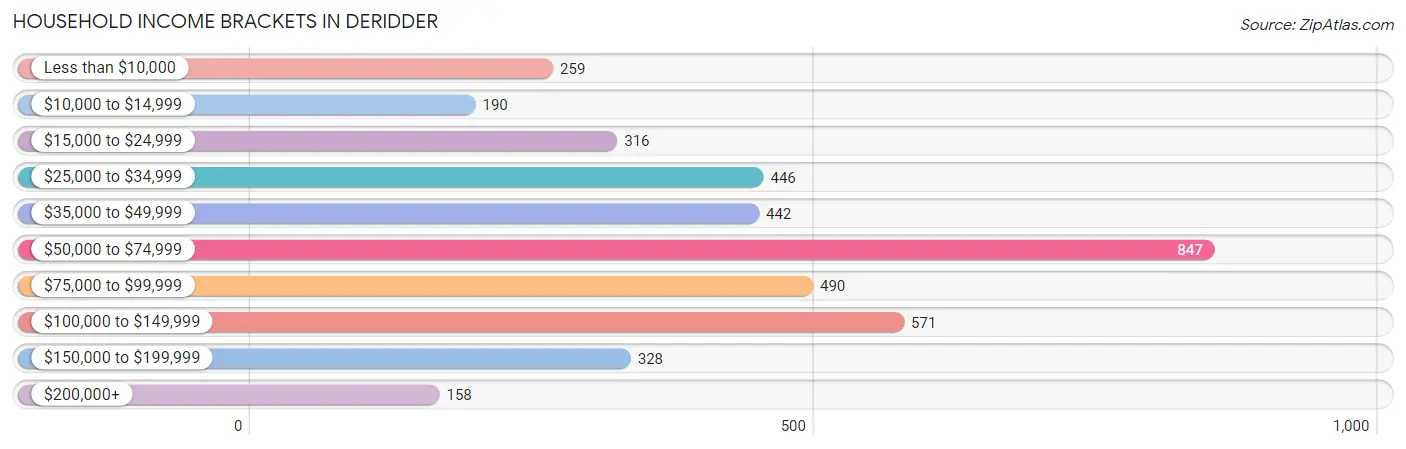
| Income Bracket | # Households | % Households |
| Less than $10,000 | 259 | 6.4% |
| $10,000 to $14,999 | 190 | 4.7% |
| $15,000 to $24,999 | 316 | 7.8% |
| $25,000 to $34,999 | 446 | 11.0% |
| $35,000 to $49,999 | 442 | 10.9% |
| $50,000 to $74,999 | 847 | 20.9% |
| $75,000 to $99,999 | 490 | 12.1% |
| $100,000 to $149,999 | 571 | 14.1% |
| $150,000 to $199,999 | 328 | 8.1% |
| $200,000+ | 158 | 3.9% |
Household Income by Householder Age in Deridder
The median household income in Deridder is $56,607, with the highest median household income of $63,816 found in the 25 to 44 years age bracket for the primary householder. A total of 1,356 households (33.5%) fall into this category. Meanwhile, the 15 to 24 years age bracket for the primary householder has the lowest median household income of $45,313, with 136 households (3.4%) in this group.
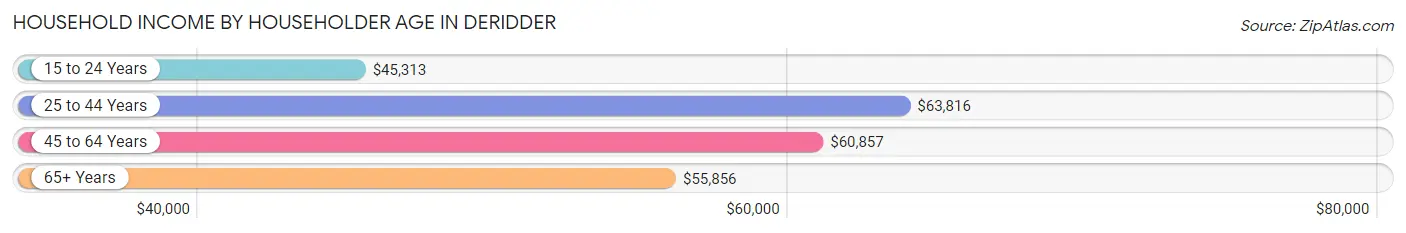
| Income Bracket | # Households | Median Income |
| 15 to 24 Years | 136 (3.4%) | $45,313 |
| 25 to 44 Years | 1,356 (33.5%) | $63,816 |
| 45 to 64 Years | 1,404 (34.7%) | $60,857 |
| 65+ Years | 1,155 (28.5%) | $55,856 |
| Total | 4,051 (100.0%) | $56,607 |
Poverty in Deridder
Income Below Poverty by Sex and Age in Deridder
With 14.8% poverty level for males and 20.8% for females among the residents of Deridder, 12 to 14 year old males and 5 year old females are the most vulnerable to poverty, with 46 males (38.0%) and 22 females (53.7%) in their respective age groups living below the poverty level.
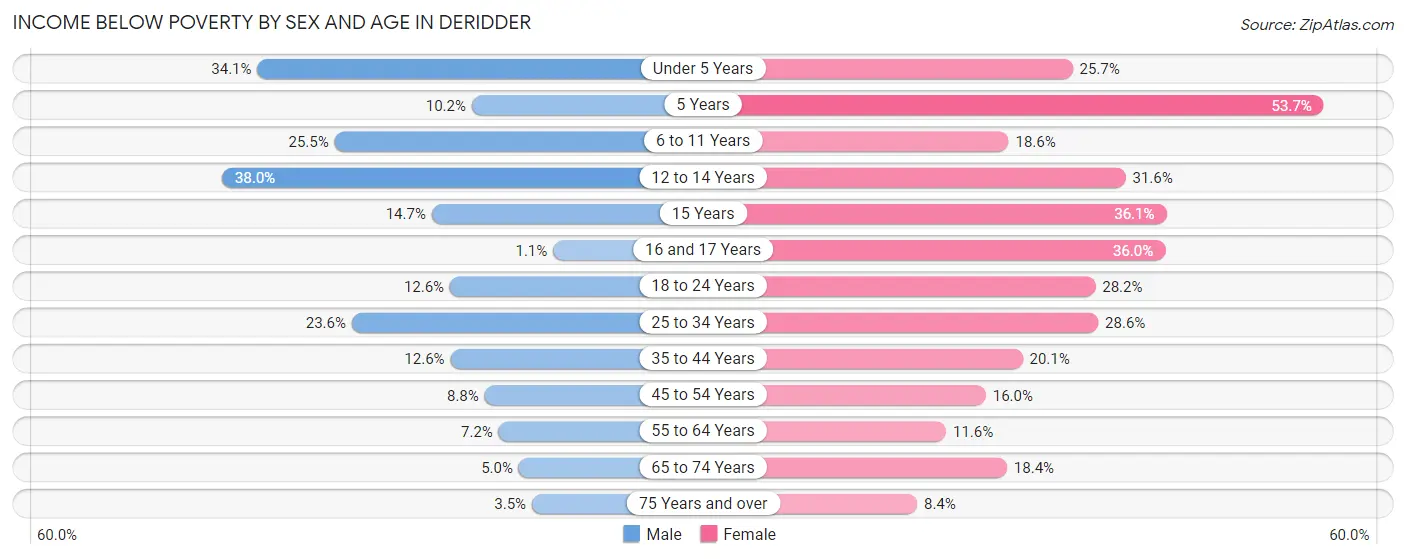
| Age Bracket | Male | Female |
| Under 5 Years | 91 (34.1%) | 73 (25.7%) |
| 5 Years | 5 (10.2%) | 22 (53.7%) |
| 6 to 11 Years | 132 (25.5%) | 57 (18.6%) |
| 12 to 14 Years | 46 (38.0%) | 67 (31.6%) |
| 15 Years | 17 (14.7%) | 30 (36.1%) |
| 16 and 17 Years | 2 (1.1%) | 27 (36.0%) |
| 18 to 24 Years | 50 (12.6%) | 83 (28.2%) |
| 25 to 34 Years | 192 (23.6%) | 215 (28.5%) |
| 35 to 44 Years | 56 (12.6%) | 94 (20.1%) |
| 45 to 54 Years | 50 (8.8%) | 103 (16.0%) |
| 55 to 64 Years | 46 (7.2%) | 70 (11.6%) |
| 65 to 74 Years | 26 (5.0%) | 89 (18.4%) |
| 75 Years and over | 9 (3.5%) | 32 (8.4%) |
| Total | 722 (14.8%) | 962 (20.8%) |
Income Above Poverty by Sex and Age in Deridder
According to the poverty statistics in Deridder, males aged 16 and 17 years and females aged 75 years and over are the age groups that are most secure financially, with 98.9% of males and 91.6% of females in these age groups living above the poverty line.
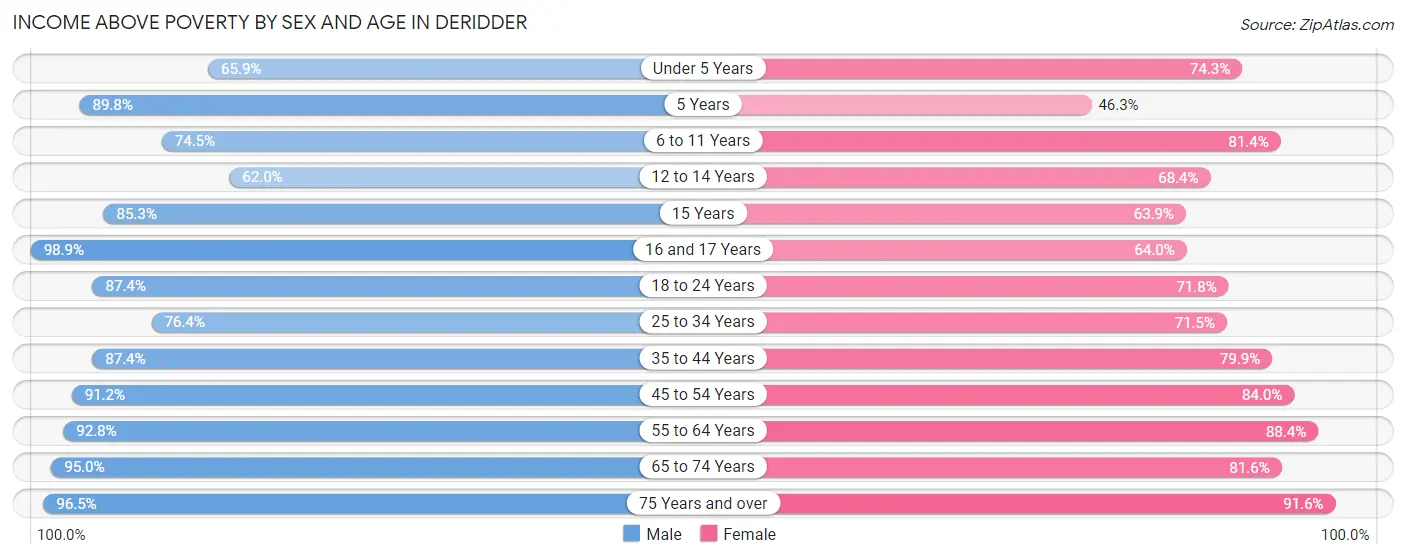
| Age Bracket | Male | Female |
| Under 5 Years | 176 (65.9%) | 211 (74.3%) |
| 5 Years | 44 (89.8%) | 19 (46.3%) |
| 6 to 11 Years | 386 (74.5%) | 250 (81.4%) |
| 12 to 14 Years | 75 (62.0%) | 145 (68.4%) |
| 15 Years | 99 (85.3%) | 53 (63.9%) |
| 16 and 17 Years | 173 (98.9%) | 48 (64.0%) |
| 18 to 24 Years | 346 (87.4%) | 211 (71.8%) |
| 25 to 34 Years | 623 (76.4%) | 538 (71.5%) |
| 35 to 44 Years | 389 (87.4%) | 373 (79.9%) |
| 45 to 54 Years | 520 (91.2%) | 539 (84.0%) |
| 55 to 64 Years | 593 (92.8%) | 533 (88.4%) |
| 65 to 74 Years | 498 (95.0%) | 395 (81.6%) |
| 75 Years and over | 248 (96.5%) | 350 (91.6%) |
| Total | 4,170 (85.2%) | 3,665 (79.2%) |
Income Below Poverty Among Married-Couple Families in Deridder
The poverty statistics for married-couple families in Deridder show that 3.3% or 56 of the total 1,688 families live below the poverty line. Families with 3 or 4 children have the highest poverty rate of 12.9%, comprising of 22 families. On the other hand, families with no children have the lowest poverty rate of 1.8%, which includes 20 families.
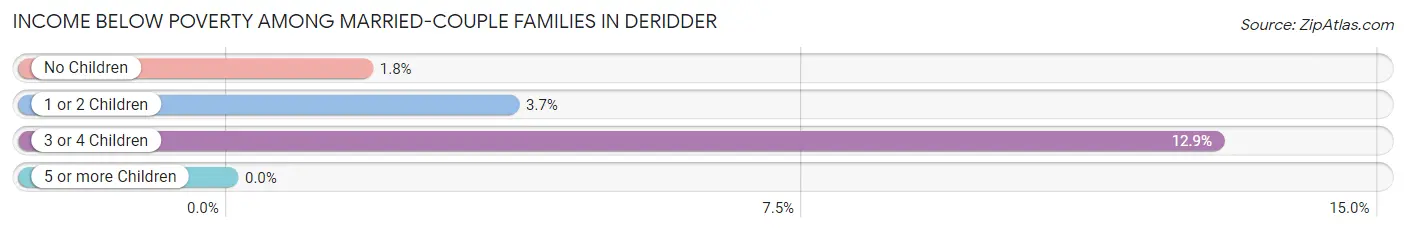
| Children | Above Poverty | Below Poverty |
| No Children | 1,116 (98.2%) | 20 (1.8%) |
| 1 or 2 Children | 367 (96.3%) | 14 (3.7%) |
| 3 or 4 Children | 149 (87.1%) | 22 (12.9%) |
| 5 or more Children | 0 (0.0%) | 0 (0.0%) |
| Total | 1,632 (96.7%) | 56 (3.3%) |
Income Below Poverty Among Single-Parent Households in Deridder
According to the poverty data in Deridder, 23.1% or 61 single-father households and 27.4% or 191 single-mother households are living below the poverty line. Among single-father households, those with 1 or 2 children have the highest poverty rate, with 61 households (36.3%) experiencing poverty. Likewise, among single-mother households, those with 5 or more children have the highest poverty rate, with 2 households (100.0%) falling below the poverty line.
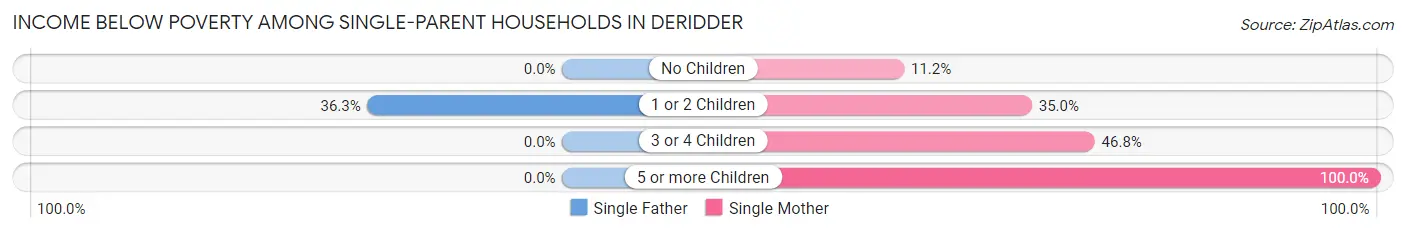
| Children | Single Father | Single Mother |
| No Children | 0 (0.0%) | 30 (11.2%) |
| 1 or 2 Children | 61 (36.3%) | 123 (35.0%) |
| 3 or 4 Children | 0 (0.0%) | 36 (46.8%) |
| 5 or more Children | 0 (0.0%) | 2 (100.0%) |
| Total | 61 (23.1%) | 191 (27.4%) |
Income Below Poverty Among Married-Couple vs Single-Parent Households in Deridder
The poverty data for Deridder shows that 56 of the married-couple family households (3.3%) and 252 of the single-parent households (26.2%) are living below the poverty level. Within the married-couple family households, those with 3 or 4 children have the highest poverty rate, with 22 households (12.9%) falling below the poverty line. Among the single-parent households, those with 5 or more children have the highest poverty rate, with 2 household (100.0%) living below poverty.
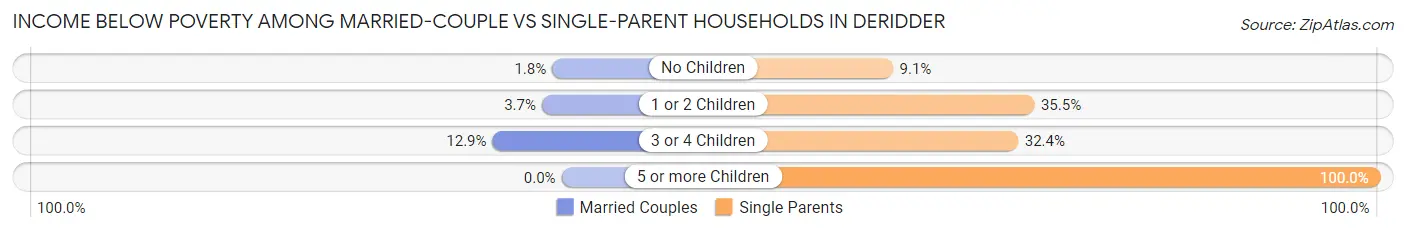
| Children | Married-Couple Families | Single-Parent Households |
| No Children | 20 (1.8%) | 30 (9.1%) |
| 1 or 2 Children | 14 (3.7%) | 184 (35.4%) |
| 3 or 4 Children | 22 (12.9%) | 36 (32.4%) |
| 5 or more Children | 0 (0.0%) | 2 (100.0%) |
| Total | 56 (3.3%) | 252 (26.2%) |
Race in Deridder
The most populous races in Deridder are White / Caucasian (5,236 | 53.2%), Black / African American (3,081 | 31.3%), and Two or more Races (1,077 | 10.9%).
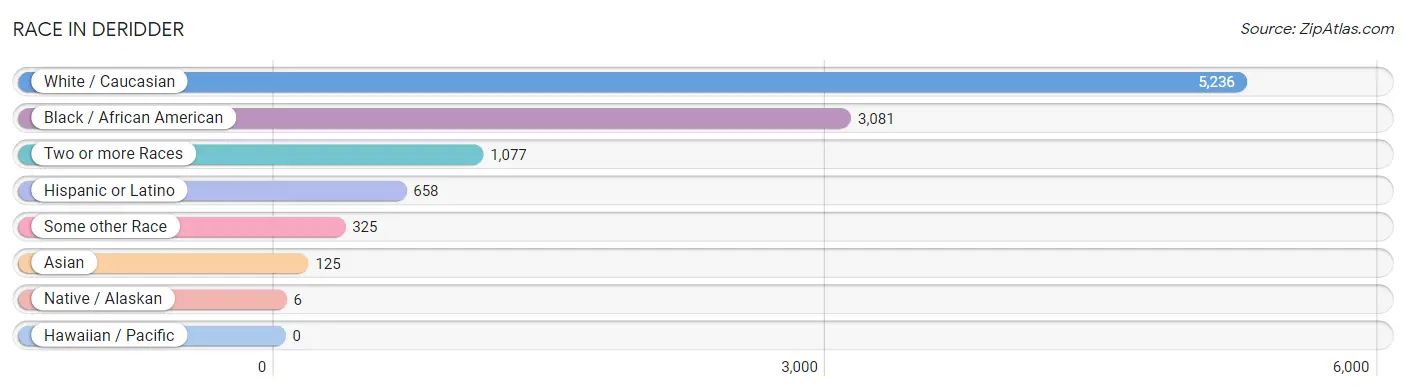
| Race | # Population | % Population |
| Asian | 125 | 1.3% |
| Black / African American | 3,081 | 31.3% |
| Hawaiian / Pacific | 0 | 0.0% |
| Hispanic or Latino | 658 | 6.7% |
| Native / Alaskan | 6 | 0.1% |
| White / Caucasian | 5,236 | 53.2% |
| Two or more Races | 1,077 | 10.9% |
| Some other Race | 325 | 3.3% |
| Total | 9,850 | 100.0% |
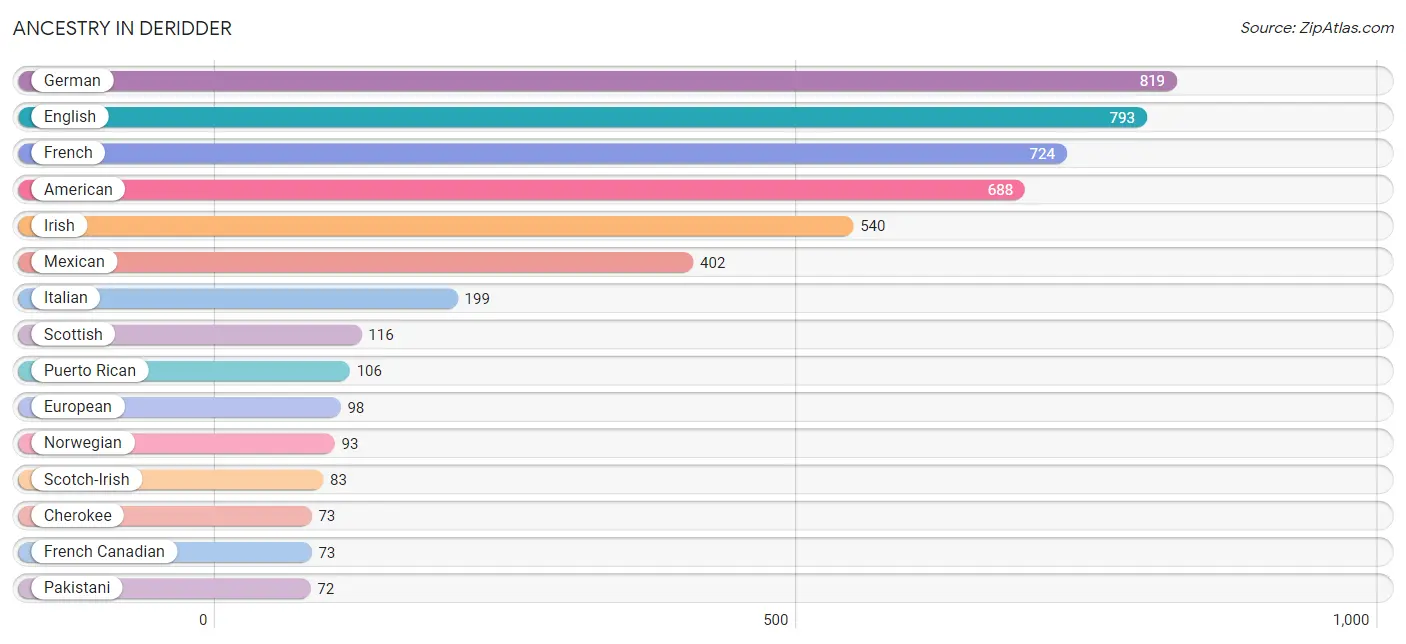
Ancestry in Deridder
The most populous ancestries reported in Deridder are German (819 | 8.3%), English (793 | 8.1%), French (724 | 7.3%), American (688 | 7.0%), and Irish (540 | 5.5%), together accounting for 36.2% of all Deridder residents.
| Ancestry | # Population | % Population |
| African | 20 | 0.2% |
| American | 688 | 7.0% |
| Arab | 15 | 0.2% |
| Belizean | 1 | 0.0% |
| Bhutanese | 5 | 0.1% |
| Blackfeet | 4 | 0.0% |
| British | 61 | 0.6% |
| Burmese | 34 | 0.4% |
| Cajun | 15 | 0.2% |
| Celtic | 5 | 0.1% |
| Central American | 57 | 0.6% |
| Cherokee | 73 | 0.7% |
| Chickasaw | 1 | 0.0% |
| Choctaw | 11 | 0.1% |
| Colombian | 32 | 0.3% |
| Creek | 1 | 0.0% |
| Cuban | 3 | 0.0% |
| Czechoslovakian | 21 | 0.2% |
| Danish | 27 | 0.3% |
| Dutch | 35 | 0.4% |
| Eastern European | 5 | 0.1% |
| English | 793 | 8.1% |
| European | 98 | 1.0% |
| Filipino | 3 | 0.0% |
| French | 724 | 7.3% |
| French Canadian | 73 | 0.7% |
| German | 819 | 8.3% |
| Greek | 15 | 0.2% |
| Guyanese | 10 | 0.1% |
| Haitian | 4 | 0.0% |
| Honduran | 3 | 0.0% |
| Houma | 2 | 0.0% |
| Hungarian | 14 | 0.1% |
| Indian (Asian) | 10 | 0.1% |
| Irish | 540 | 5.5% |
| Israeli | 37 | 0.4% |
| Italian | 199 | 2.0% |
| Jamaican | 19 | 0.2% |
| Japanese | 7 | 0.1% |
| Korean | 44 | 0.4% |
| Mexican | 402 | 4.1% |
| Native Hawaiian | 4 | 0.0% |
| Navajo | 9 | 0.1% |
| Nicaraguan | 13 | 0.1% |
| Nigerian | 9 | 0.1% |
| Northern European | 4 | 0.0% |
| Norwegian | 93 | 0.9% |
| Osage | 4 | 0.0% |
| Pakistani | 72 | 0.7% |
| Panamanian | 12 | 0.1% |
| Polish | 54 | 0.5% |
| Portuguese | 2 | 0.0% |
| Puerto Rican | 106 | 1.1% |
| Russian | 31 | 0.3% |
| Salvadoran | 29 | 0.3% |
| Scandinavian | 18 | 0.2% |
| Scotch-Irish | 83 | 0.8% |
| Scottish | 116 | 1.2% |
| Seminole | 1 | 0.0% |
| Slavic | 2 | 0.0% |
| South African | 3 | 0.0% |
| South American | 32 | 0.3% |
| Spaniard | 25 | 0.3% |
| Spanish | 33 | 0.3% |
| Sri Lankan | 18 | 0.2% |
| Subsaharan African | 32 | 0.3% |
| Swedish | 24 | 0.2% |
| Syrian | 15 | 0.2% |
| Thai | 38 | 0.4% |
| Trinidadian and Tobagonian | 9 | 0.1% |
| Ukrainian | 7 | 0.1% |
| Welsh | 14 | 0.1% | View All 72 Rows |
Immigrants in Deridder
The most numerous immigrant groups reported in Deridder came from Latin America (121 | 1.2%), Central America (83 | 0.8%), Asia (62 | 0.6%), Europe (62 | 0.6%), and Mexico (57 | 0.6%), together accounting for 3.9% of all Deridder residents.
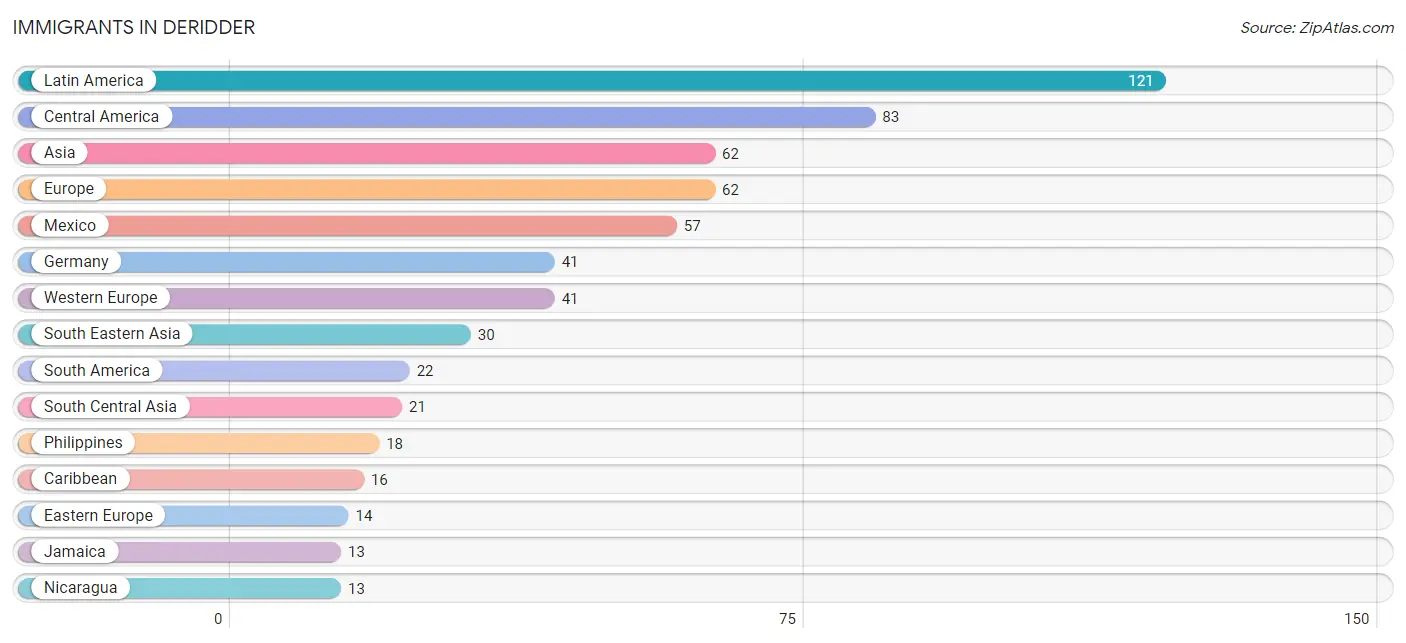
| Immigration Origin | # Population | % Population |
| Africa | 6 | 0.1% |
| Asia | 62 | 0.6% |
| Belize | 1 | 0.0% |
| Bosnia and Herzegovina | 9 | 0.1% |
| Cambodia | 7 | 0.1% |
| Canada | 4 | 0.0% |
| Caribbean | 16 | 0.2% |
| Central America | 83 | 0.8% |
| China | 5 | 0.1% |
| Colombia | 12 | 0.1% |
| Cuba | 3 | 0.0% |
| Eastern Asia | 11 | 0.1% |
| Eastern Europe | 14 | 0.1% |
| El Salvador | 9 | 0.1% |
| Europe | 62 | 0.6% |
| Germany | 41 | 0.4% |
| Guyana | 10 | 0.1% |
| Honduras | 3 | 0.0% |
| India | 11 | 0.1% |
| Italy | 2 | 0.0% |
| Jamaica | 13 | 0.1% |
| Korea | 6 | 0.1% |
| Latin America | 121 | 1.2% |
| Mexico | 57 | 0.6% |
| Nicaragua | 13 | 0.1% |
| Northern Europe | 4 | 0.0% |
| Pakistan | 10 | 0.1% |
| Philippines | 18 | 0.2% |
| Poland | 2 | 0.0% |
| Scotland | 4 | 0.0% |
| South Africa | 6 | 0.1% |
| South America | 22 | 0.2% |
| South Central Asia | 21 | 0.2% |
| South Eastern Asia | 30 | 0.3% |
| Southern Europe | 3 | 0.0% |
| Spain | 1 | 0.0% |
| Taiwan | 1 | 0.0% |
| Ukraine | 3 | 0.0% |
| Vietnam | 5 | 0.1% |
| Western Europe | 41 | 0.4% | View All 40 Rows |
Sex and Age in Deridder
Sex and Age in Deridder
The most populous age groups in Deridder are 30 to 34 Years (548 | 10.7%) for men and 25 to 29 Years (395 | 8.3%) for women.
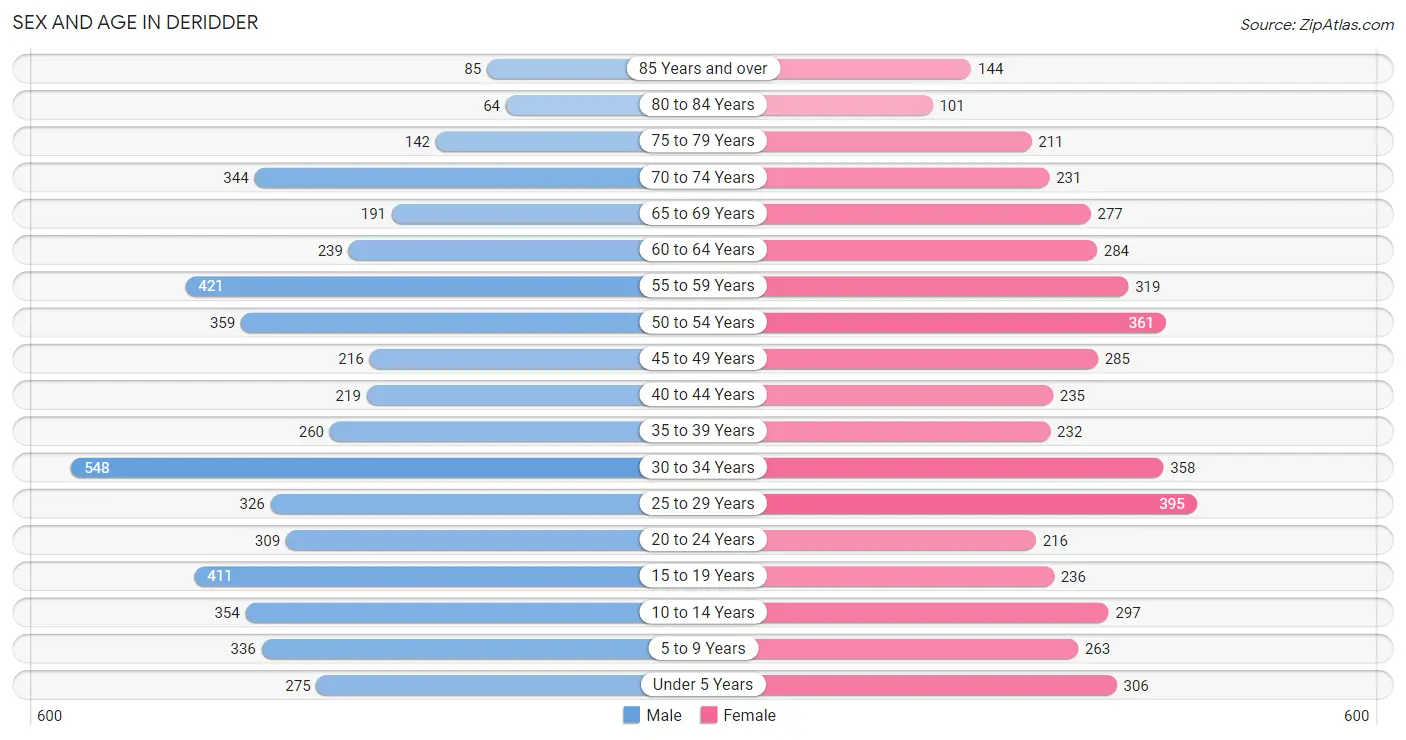
| Age Bracket | Male | Female |
| Under 5 Years | 275 (5.4%) | 306 (6.4%) |
| 5 to 9 Years | 336 (6.6%) | 263 (5.5%) |
| 10 to 14 Years | 354 (6.9%) | 297 (6.2%) |
| 15 to 19 Years | 411 (8.1%) | 236 (5.0%) |
| 20 to 24 Years | 309 (6.1%) | 216 (4.5%) |
| 25 to 29 Years | 326 (6.4%) | 395 (8.3%) |
| 30 to 34 Years | 548 (10.7%) | 358 (7.5%) |
| 35 to 39 Years | 260 (5.1%) | 232 (4.9%) |
| 40 to 44 Years | 219 (4.3%) | 235 (5.0%) |
| 45 to 49 Years | 216 (4.2%) | 285 (6.0%) |
| 50 to 54 Years | 359 (7.0%) | 361 (7.6%) |
| 55 to 59 Years | 421 (8.3%) | 319 (6.7%) |
| 60 to 64 Years | 239 (4.7%) | 284 (6.0%) |
| 65 to 69 Years | 191 (3.7%) | 277 (5.8%) |
| 70 to 74 Years | 344 (6.8%) | 231 (4.9%) |
| 75 to 79 Years | 142 (2.8%) | 211 (4.4%) |
| 80 to 84 Years | 64 (1.3%) | 101 (2.1%) |
| 85 Years and over | 85 (1.7%) | 144 (3.0%) |
| Total | 5,099 (100.0%) | 4,751 (100.0%) |
Families and Households in Deridder
Median Family Size in Deridder
The median family size in Deridder is 2.90 persons per family, with single female/mother families (697 | 26.3%) accounting for the largest median family size of 3.23 persons per family. On the other hand, single male/father families (264 | 10.0%) represent the smallest median family size with 2.47 persons per family.
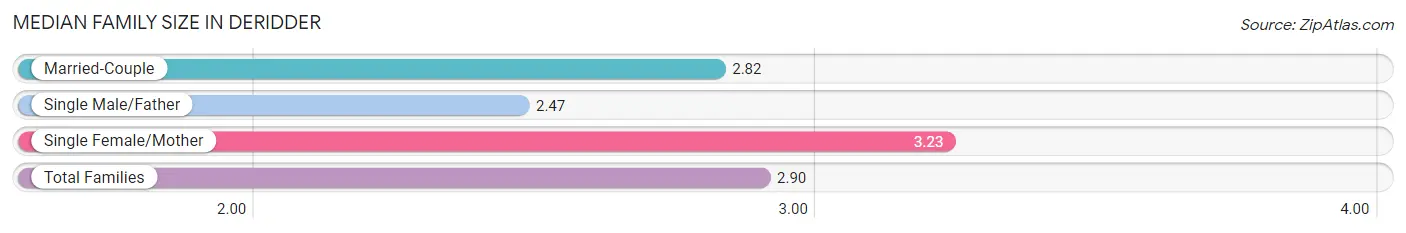
| Family Type | # Families | Family Size |
| Married-Couple | 1,688 (63.7%) | 2.82 |
| Single Male/Father | 264 (10.0%) | 2.47 |
| Single Female/Mother | 697 (26.3%) | 3.23 |
| Total Families | 2,649 (100.0%) | 2.90 |
Median Household Size in Deridder
The median household size in Deridder is 2.35 persons per household, with single female/mother households (697 | 17.2%) accounting for the largest median household size of 3.42 persons per household. non-family households (1,402 | 34.6%) represent the smallest median household size with 1.14 persons per household.
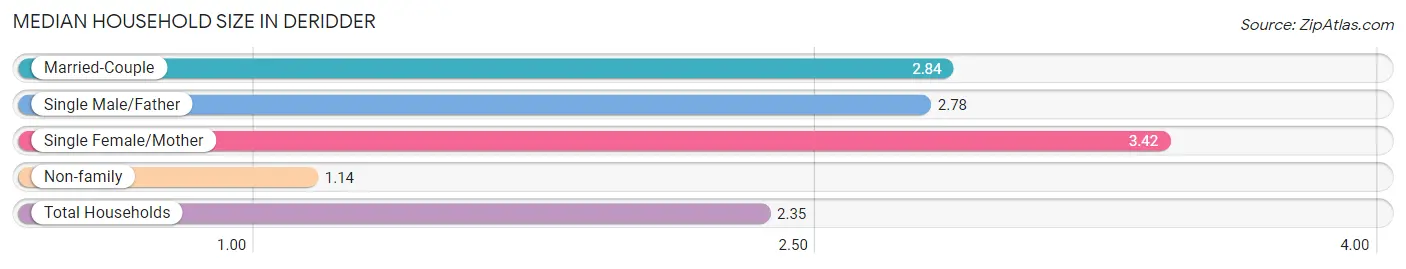
| Household Type | # Households | Household Size |
| Married-Couple | 1,688 (41.7%) | 2.84 |
| Single Male/Father | 264 (6.5%) | 2.78 |
| Single Female/Mother | 697 (17.2%) | 3.42 |
| Non-family | 1,402 (34.6%) | 1.14 |
| Total Households | 4,051 (100.0%) | 2.35 |
Household Size by Marriage Status in Deridder
Out of a total of 4,051 households in Deridder, 2,649 (65.4%) are family households, while 1,402 (34.6%) are nonfamily households. The most numerous type of family households are 2-person households, comprising 1,255, and the most common type of nonfamily households are 1-person households, comprising 1,257.
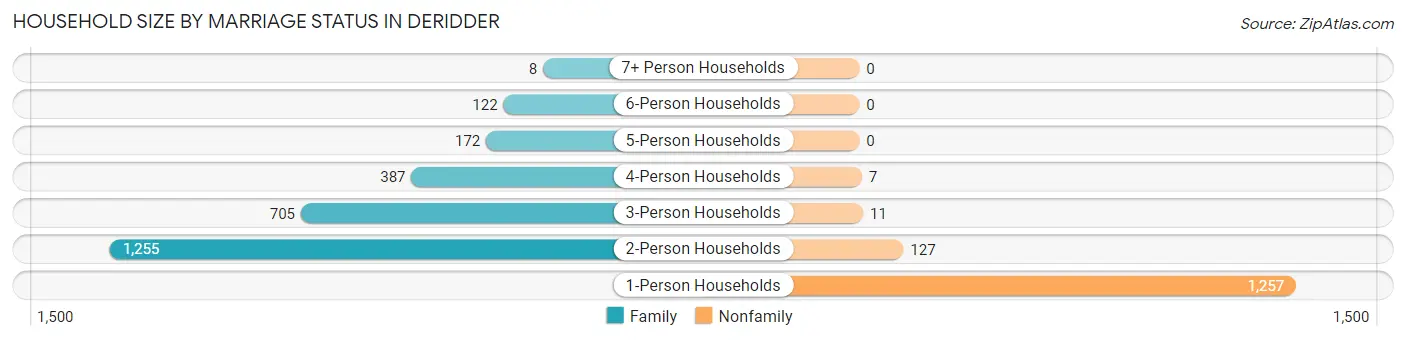
| Household Size | Family Households | Nonfamily Households |
| 1-Person Households | - | 1,257 (31.0%) |
| 2-Person Households | 1,255 (31.0%) | 127 (3.1%) |
| 3-Person Households | 705 (17.4%) | 11 (0.3%) |
| 4-Person Households | 387 (9.6%) | 7 (0.2%) |
| 5-Person Households | 172 (4.3%) | 0 (0.0%) |
| 6-Person Households | 122 (3.0%) | 0 (0.0%) |
| 7+ Person Households | 8 (0.2%) | 0 (0.0%) |
| Total | 2,649 (65.4%) | 1,402 (34.6%) |
Female Fertility in Deridder
Fertility by Age in Deridder
Average fertility rate in Deridder is 46.0 births per 1,000 women. Women in the age bracket of 20 to 34 years have the highest fertility rate with 59.0 births per 1,000 women. Women in the age bracket of 20 to 34 years acount for 60.6% of all women with births.
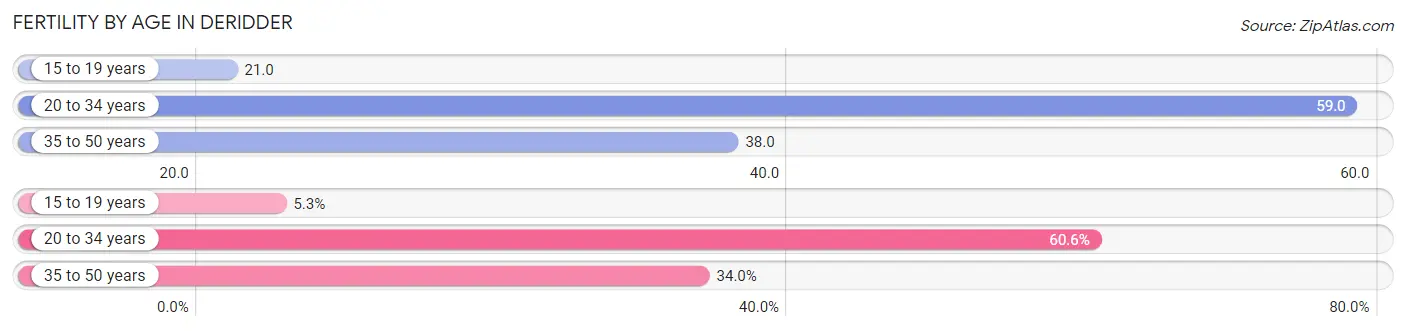
| Age Bracket | Women with Births | Births / 1,000 Women |
| 15 to 19 years | 5 (5.3%) | 21.0 |
| 20 to 34 years | 57 (60.6%) | 59.0 |
| 35 to 50 years | 32 (34.0%) | 38.0 |
| Total | 94 (100.0%) | 46.0 |
Fertility by Age by Marriage Status in Deridder
74.5% of women with births (94) in Deridder are married. The highest percentage of unmarried women with births falls into 15 to 19 years age bracket with 100.0% of them unmarried at the time of birth, while the lowest percentage of unmarried women with births belong to 35 to 50 years age bracket with 12.5% of them unmarried.
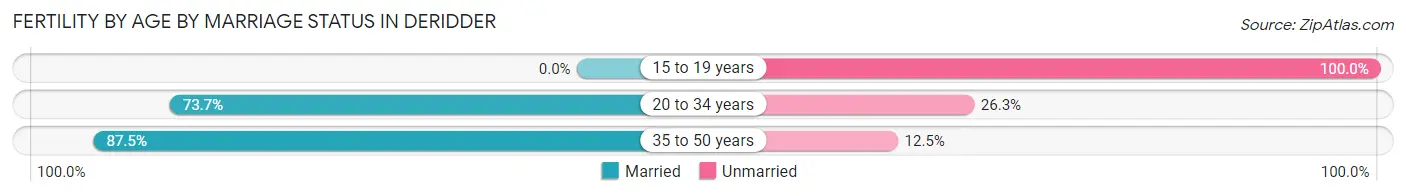
| Age Bracket | Married | Unmarried |
| 15 to 19 years | 0 (0.0%) | 5 (100.0%) |
| 20 to 34 years | 42 (73.7%) | 15 (26.3%) |
| 35 to 50 years | 28 (87.5%) | 4 (12.5%) |
| Total | 70 (74.5%) | 24 (25.5%) |
Fertility by Education in Deridder
Average fertility rate in Deridder is 46.0 births per 1,000 women. Women with the education attainment of graduate degree have the highest fertility rate of 63.0 births per 1,000 women, while women with the education attainment of college or associate's degree have the lowest fertility at 36.0 births per 1,000 women. Women with the education attainment of high school diploma represent 38.3% of all women with births.
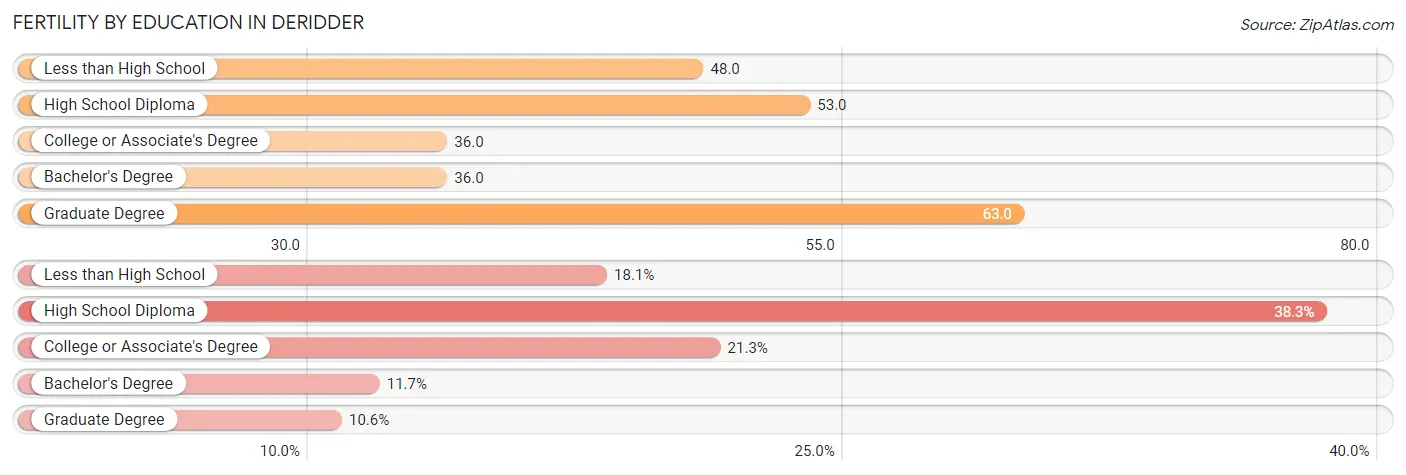
| Educational Attainment | Women with Births | Births / 1,000 Women |
| Less than High School | 17 (18.1%) | 48.0 |
| High School Diploma | 36 (38.3%) | 53.0 |
| College or Associate's Degree | 20 (21.3%) | 36.0 |
| Bachelor's Degree | 11 (11.7%) | 36.0 |
| Graduate Degree | 10 (10.6%) | 63.0 |
| Total | 94 (100.0%) | 46.0 |
Fertility by Education by Marriage Status in Deridder
25.5% of women with births in Deridder are unmarried. Women with the educational attainment of college or associate's degree are most likely to be married with 100.0% of them married at childbirth, while women with the educational attainment of high school diploma are least likely to be married with 47.2% of them unmarried at childbirth.
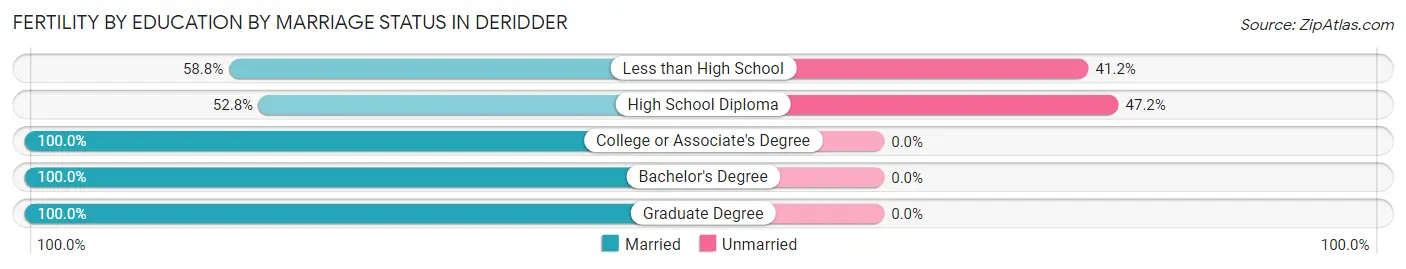
| Educational Attainment | Married | Unmarried |
| Less than High School | 10 (58.8%) | 7 (41.2%) |
| High School Diploma | 19 (52.8%) | 17 (47.2%) |
| College or Associate's Degree | 20 (100.0%) | 0 (0.0%) |
| Bachelor's Degree | 11 (100.0%) | 0 (0.0%) |
| Graduate Degree | 10 (100.0%) | 0 (0.0%) |
| Total | 70 (74.5%) | 24 (25.5%) |
Employment Characteristics in Deridder
Employment by Class of Employer in Deridder
Among the 3,975 employed individuals in Deridder, private company employees (2,376 | 59.8%), federal government employees (548 | 13.8%), and not-for-profit organizations (398 | 10.0%) make up the most common classes of employment.
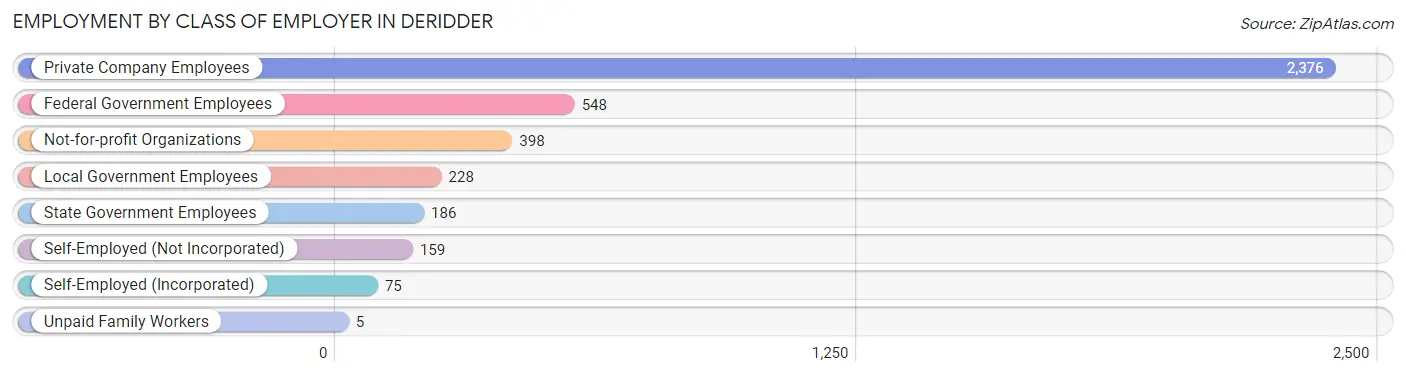
| Employer Class | # Employees | % Employees |
| Private Company Employees | 2,376 | 59.8% |
| Self-Employed (Incorporated) | 75 | 1.9% |
| Self-Employed (Not Incorporated) | 159 | 4.0% |
| Not-for-profit Organizations | 398 | 10.0% |
| Local Government Employees | 228 | 5.7% |
| State Government Employees | 186 | 4.7% |
| Federal Government Employees | 548 | 13.8% |
| Unpaid Family Workers | 5 | 0.1% |
| Total | 3,975 | 100.0% |
Employment Status by Age in Deridder
According to the labor force statistics for Deridder, out of the total population over 16 years of age (7,820), 57.6% or 4,504 individuals are in the labor force, with 11.0% or 495 of them unemployed. The age group with the highest labor force participation rate is 30 to 34 years, with 78.7% or 713 individuals in the labor force. Within the labor force, the 16 to 19 years age range has the highest percentage of unemployed individuals, with 34.7% or 50 of them being unemployed.
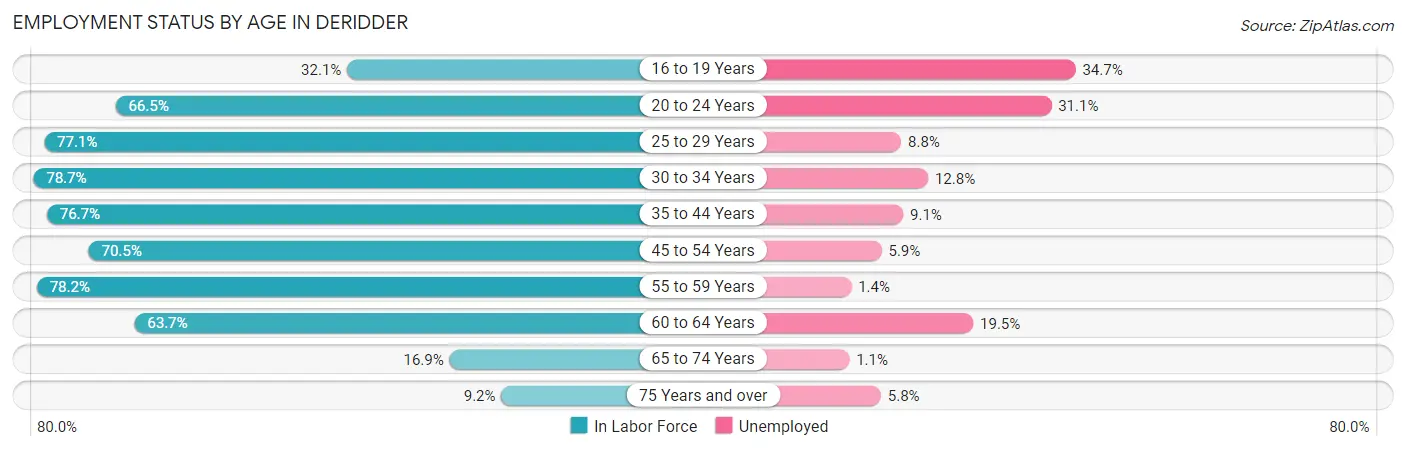
| Age Bracket | In Labor Force | Unemployed |
| 16 to 19 Years | 144 (32.1%) | 50 (34.7%) |
| 20 to 24 Years | 349 (66.5%) | 109 (31.1%) |
| 25 to 29 Years | 556 (77.1%) | 49 (8.8%) |
| 30 to 34 Years | 713 (78.7%) | 91 (12.8%) |
| 35 to 44 Years | 726 (76.7%) | 66 (9.1%) |
| 45 to 54 Years | 861 (70.5%) | 51 (5.9%) |
| 55 to 59 Years | 579 (78.2%) | 8 (1.4%) |
| 60 to 64 Years | 333 (63.7%) | 65 (19.5%) |
| 65 to 74 Years | 176 (16.9%) | 2 (1.1%) |
| 75 Years and over | 69 (9.2%) | 4 (5.8%) |
| Total | 4,504 (57.6%) | 495 (11.0%) |
Employment Status by Educational Attainment in Deridder
According to labor force statistics for Deridder, 74.5% of individuals (3,767) out of the total population between 25 and 64 years of age (5,057) are in the labor force, with 8.7% or 328 of them being unemployed. The group with the highest labor force participation rate are those with the educational attainment of bachelor's degree or higher, with 83.2% or 948 individuals in the labor force. Within the labor force, individuals with less than high school education have the highest percentage of unemployment, with 16.8% or 53 of them being unemployed.
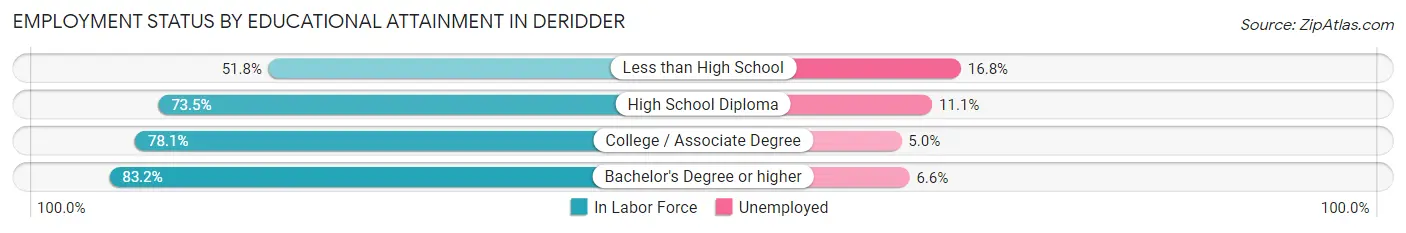
| Educational Attainment | In Labor Force | Unemployed |
| Less than High School | 314 (51.8%) | 102 (16.8%) |
| High School Diploma | 1,294 (73.5%) | 195 (11.1%) |
| College / Associate Degree | 1,211 (78.1%) | 78 (5.0%) |
| Bachelor's Degree or higher | 948 (83.2%) | 75 (6.6%) |
| Total | 3,767 (74.5%) | 440 (8.7%) |
Employment Occupations by Sex in Deridder
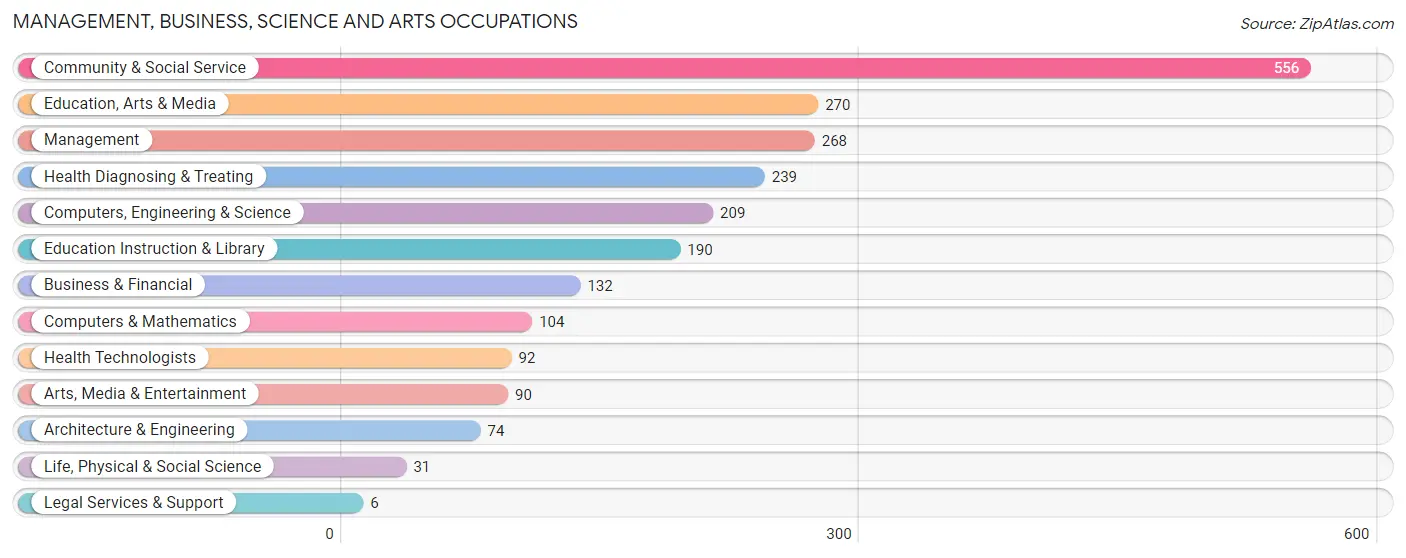
Management, Business, Science and Arts Occupations
The most common Management, Business, Science and Arts occupations in Deridder are Community & Social Service (556 | 15.0%), Education, Arts & Media (270 | 7.3%), Management (268 | 7.2%), Health Diagnosing & Treating (239 | 6.5%), and Computers, Engineering & Science (209 | 5.6%).
Management, Business, Science and Arts Occupations by Sex
Within the Management, Business, Science and Arts occupations in Deridder, the most male-oriented occupations are Computers & Mathematics (89.4%), Life, Physical & Social Science (83.9%), and Computers, Engineering & Science (77.0%), while the most female-oriented occupations are Legal Services & Support (100.0%), Health Diagnosing & Treating (96.2%), and Health Technologists (95.7%).
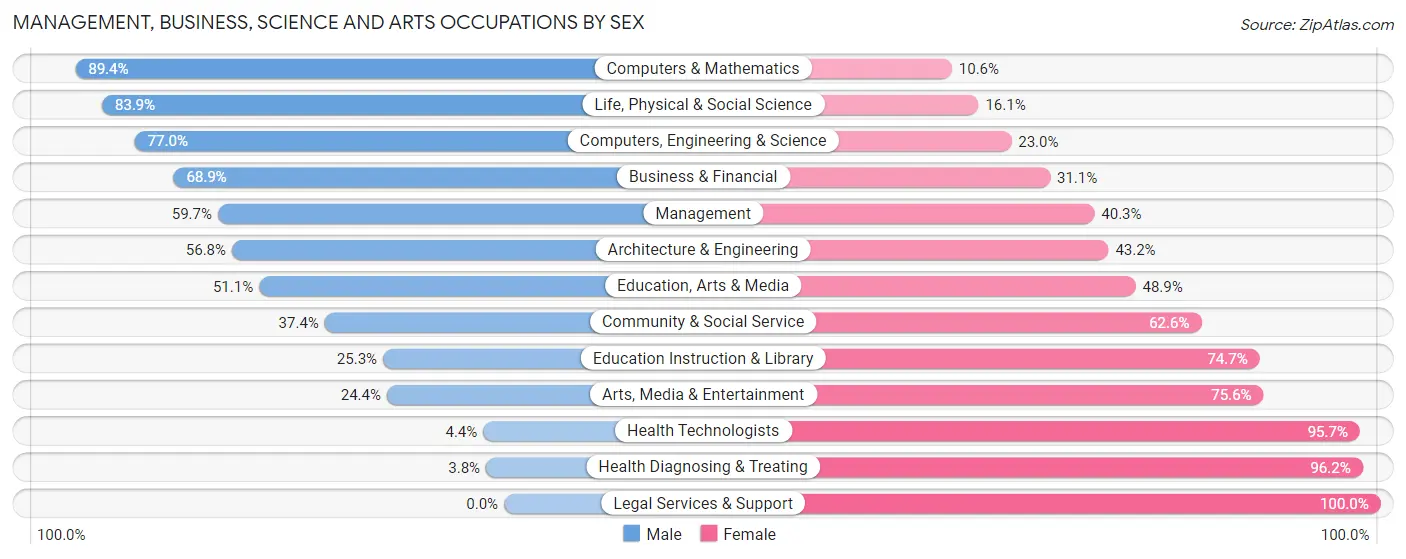
| Occupation | Male | Female |
| Management | 160 (59.7%) | 108 (40.3%) |
| Business & Financial | 91 (68.9%) | 41 (31.1%) |
| Computers, Engineering & Science | 161 (77.0%) | 48 (23.0%) |
| Computers & Mathematics | 93 (89.4%) | 11 (10.6%) |
| Architecture & Engineering | 42 (56.8%) | 32 (43.2%) |
| Life, Physical & Social Science | 26 (83.9%) | 5 (16.1%) |
| Community & Social Service | 208 (37.4%) | 348 (62.6%) |
| Education, Arts & Media | 138 (51.1%) | 132 (48.9%) |
| Legal Services & Support | 0 (0.0%) | 6 (100.0%) |
| Education Instruction & Library | 48 (25.3%) | 142 (74.7%) |
| Arts, Media & Entertainment | 22 (24.4%) | 68 (75.6%) |
| Health Diagnosing & Treating | 9 (3.8%) | 230 (96.2%) |
| Health Technologists | 4 (4.3%) | 88 (95.7%) |
| Total (Category) | 629 (44.8%) | 775 (55.2%) |
| Total (Overall) | 1,798 (48.5%) | 1,906 (51.5%) |
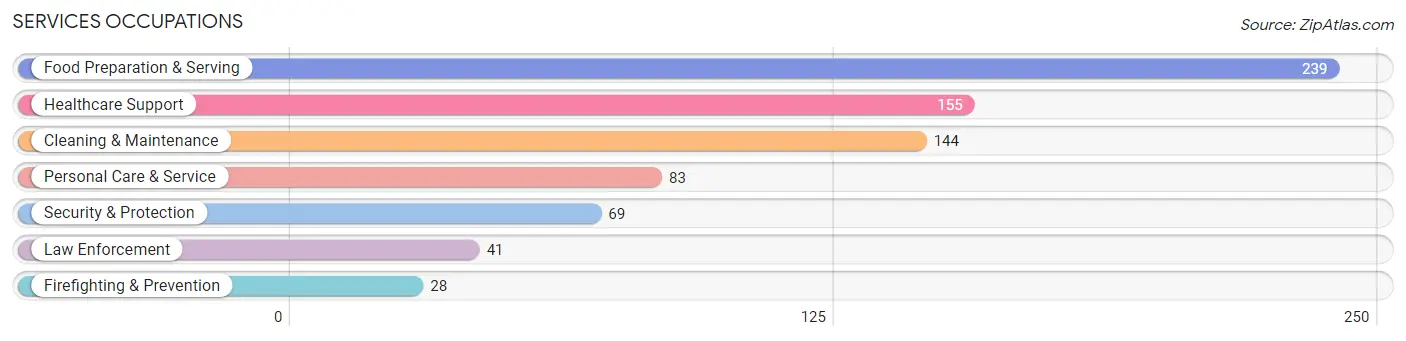
Services Occupations
The most common Services occupations in Deridder are Food Preparation & Serving (239 | 6.5%), Healthcare Support (155 | 4.2%), Cleaning & Maintenance (144 | 3.9%), Personal Care & Service (83 | 2.2%), and Security & Protection (69 | 1.9%).
Services Occupations by Sex
Within the Services occupations in Deridder, the most male-oriented occupations are Firefighting & Prevention (100.0%), Security & Protection (88.4%), and Law Enforcement (80.5%), while the most female-oriented occupations are Healthcare Support (80.0%), Personal Care & Service (78.3%), and Cleaning & Maintenance (70.1%).
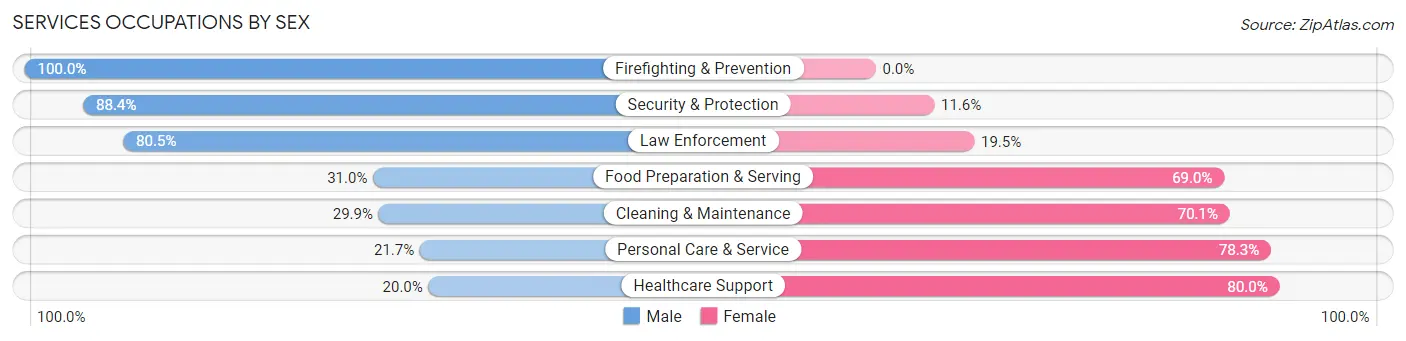
| Occupation | Male | Female |
| Healthcare Support | 31 (20.0%) | 124 (80.0%) |
| Security & Protection | 61 (88.4%) | 8 (11.6%) |
| Firefighting & Prevention | 28 (100.0%) | 0 (0.0%) |
| Law Enforcement | 33 (80.5%) | 8 (19.5%) |
| Food Preparation & Serving | 74 (31.0%) | 165 (69.0%) |
| Cleaning & Maintenance | 43 (29.9%) | 101 (70.1%) |
| Personal Care & Service | 18 (21.7%) | 65 (78.3%) |
| Total (Category) | 227 (32.9%) | 463 (67.1%) |
| Total (Overall) | 1,798 (48.5%) | 1,906 (51.5%) |
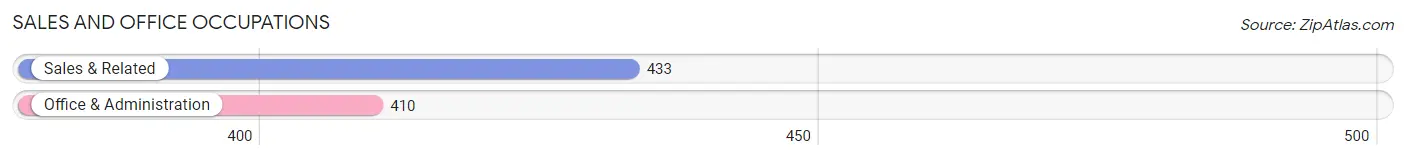
Sales and Office Occupations
The most common Sales and Office occupations in Deridder are Sales & Related (433 | 11.7%), and Office & Administration (410 | 11.1%).
Sales and Office Occupations by Sex
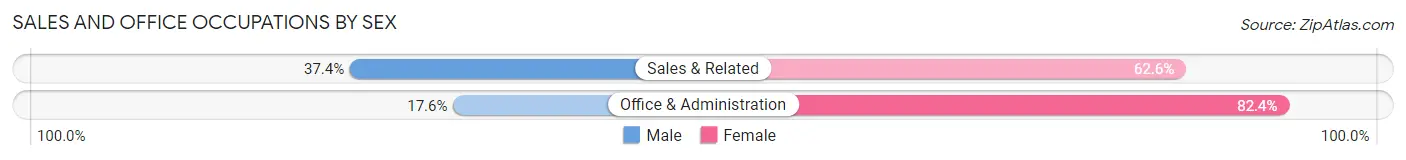
| Occupation | Male | Female |
| Sales & Related | 162 (37.4%) | 271 (62.6%) |
| Office & Administration | 72 (17.6%) | 338 (82.4%) |
| Total (Category) | 234 (27.8%) | 609 (72.2%) |
| Total (Overall) | 1,798 (48.5%) | 1,906 (51.5%) |
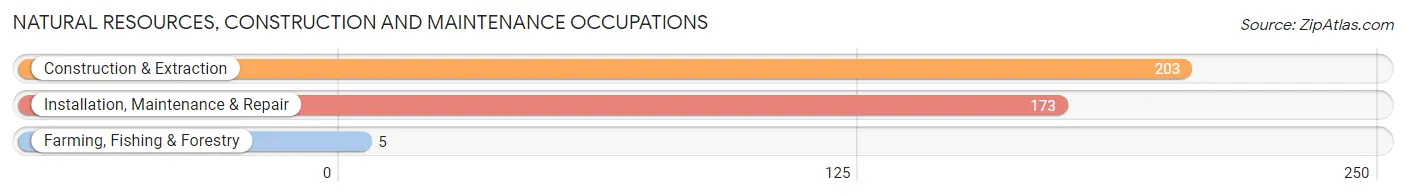
Natural Resources, Construction and Maintenance Occupations
The most common Natural Resources, Construction and Maintenance occupations in Deridder are Construction & Extraction (203 | 5.5%), Installation, Maintenance & Repair (173 | 4.7%), and Farming, Fishing & Forestry (5 | 0.1%).
Natural Resources, Construction and Maintenance Occupations by Sex
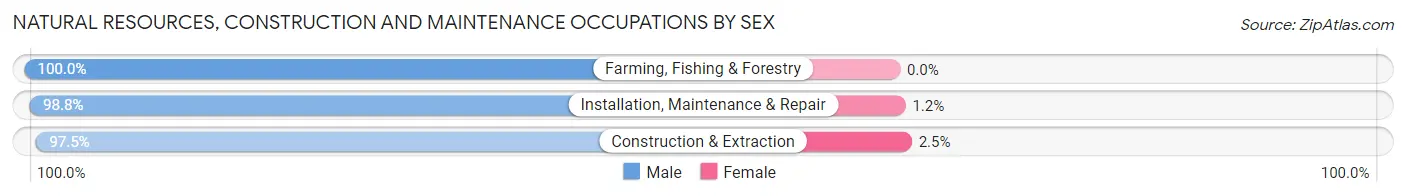
| Occupation | Male | Female |
| Farming, Fishing & Forestry | 5 (100.0%) | 0 (0.0%) |
| Construction & Extraction | 198 (97.5%) | 5 (2.5%) |
| Installation, Maintenance & Repair | 171 (98.8%) | 2 (1.2%) |
| Total (Category) | 374 (98.2%) | 7 (1.8%) |
| Total (Overall) | 1,798 (48.5%) | 1,906 (51.5%) |
Production, Transportation and Moving Occupations
The most common Production, Transportation and Moving occupations in Deridder are Production (189 | 5.1%), Transportation (114 | 3.1%), and Material Moving (83 | 2.2%).
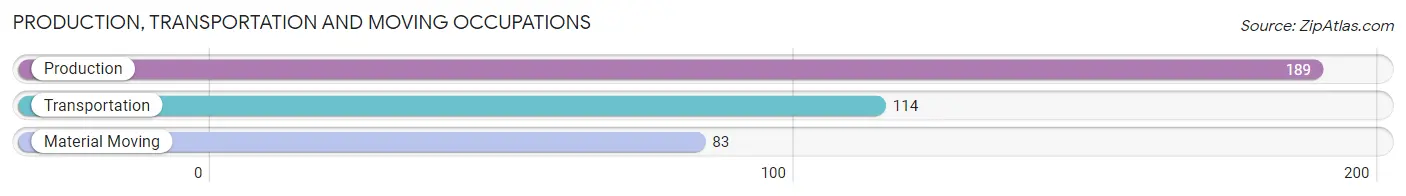
Production, Transportation and Moving Occupations by Sex
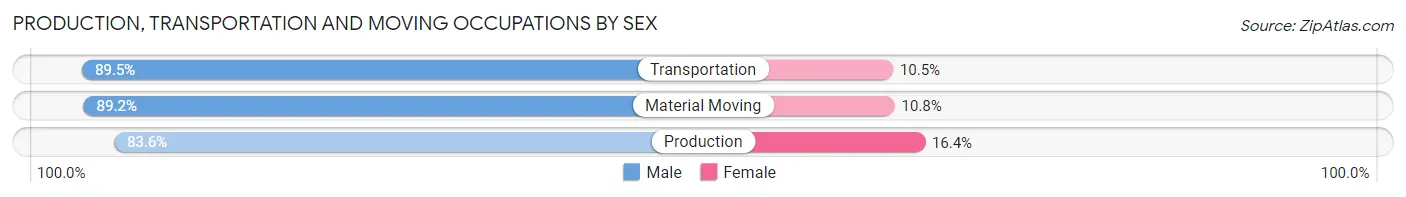
| Occupation | Male | Female |
| Production | 158 (83.6%) | 31 (16.4%) |
| Transportation | 102 (89.5%) | 12 (10.5%) |
| Material Moving | 74 (89.2%) | 9 (10.8%) |
| Total (Category) | 334 (86.5%) | 52 (13.5%) |
| Total (Overall) | 1,798 (48.5%) | 1,906 (51.5%) |
Employment Industries by Sex in Deridder
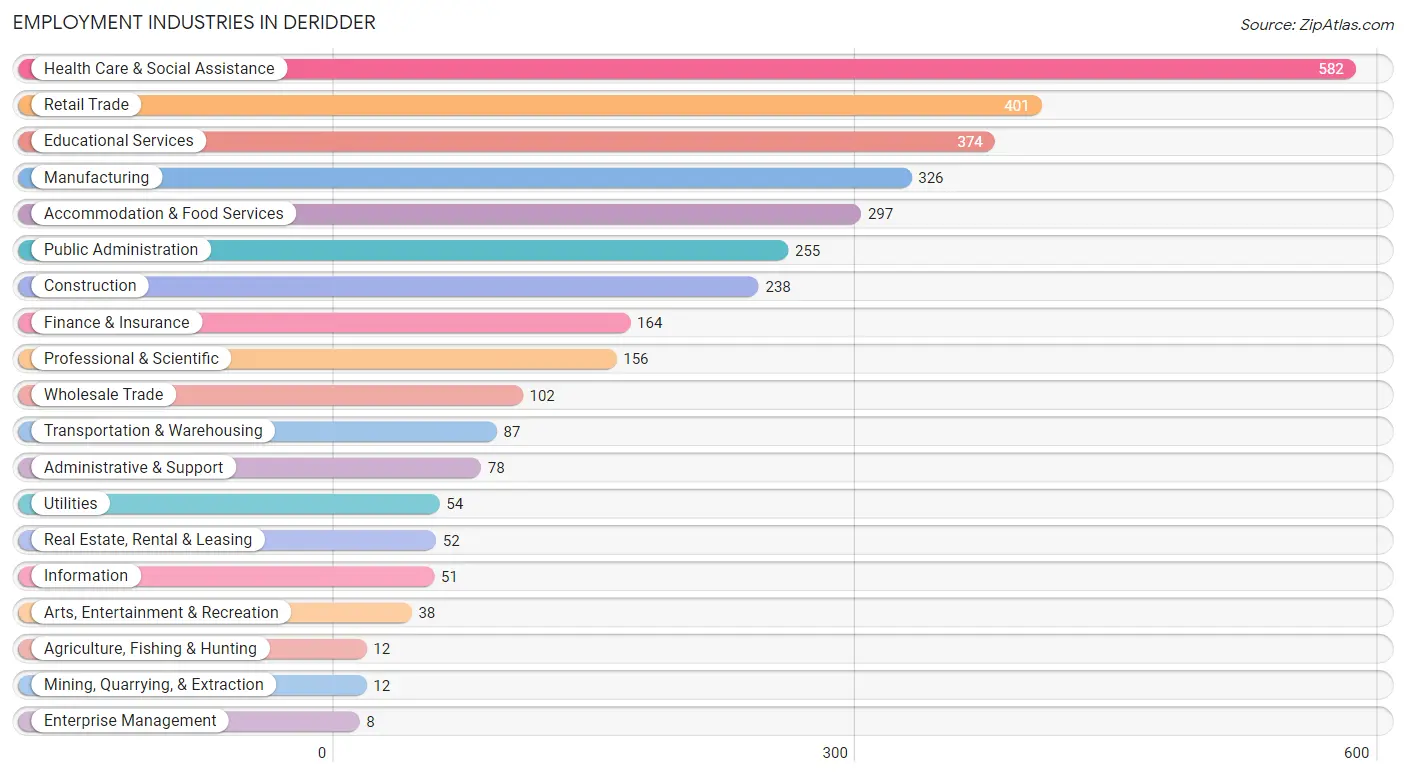
Employment Industries in Deridder
The major employment industries in Deridder include Health Care & Social Assistance (582 | 15.7%), Retail Trade (401 | 10.8%), Educational Services (374 | 10.1%), Manufacturing (326 | 8.8%), and Accommodation & Food Services (297 | 8.0%).
Employment Industries by Sex in Deridder
The Deridder industries that see more men than women are Agriculture, Fishing & Hunting (100.0%), Mining, Quarrying, & Extraction (100.0%), and Utilities (100.0%), whereas the industries that tend to have a higher number of women are Health Care & Social Assistance (88.7%), Real Estate, Rental & Leasing (88.5%), and Finance & Insurance (79.9%).
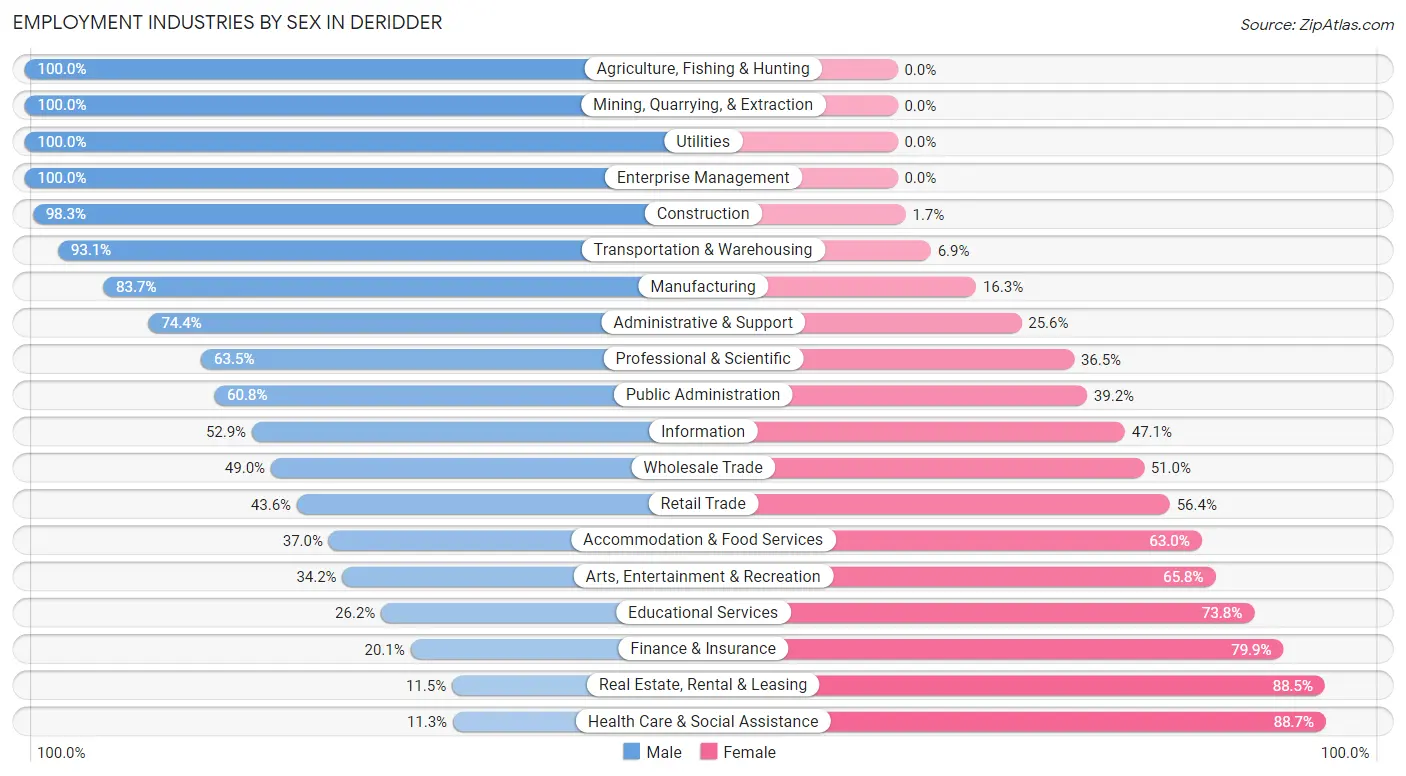
| Industry | Male | Female |
| Agriculture, Fishing & Hunting | 12 (100.0%) | 0 (0.0%) |
| Mining, Quarrying, & Extraction | 12 (100.0%) | 0 (0.0%) |
| Construction | 234 (98.3%) | 4 (1.7%) |
| Manufacturing | 273 (83.7%) | 53 (16.3%) |
| Wholesale Trade | 50 (49.0%) | 52 (51.0%) |
| Retail Trade | 175 (43.6%) | 226 (56.4%) |
| Transportation & Warehousing | 81 (93.1%) | 6 (6.9%) |
| Utilities | 54 (100.0%) | 0 (0.0%) |
| Information | 27 (52.9%) | 24 (47.1%) |
| Finance & Insurance | 33 (20.1%) | 131 (79.9%) |
| Real Estate, Rental & Leasing | 6 (11.5%) | 46 (88.5%) |
| Professional & Scientific | 99 (63.5%) | 57 (36.5%) |
| Enterprise Management | 8 (100.0%) | 0 (0.0%) |
| Administrative & Support | 58 (74.4%) | 20 (25.6%) |
| Educational Services | 98 (26.2%) | 276 (73.8%) |
| Health Care & Social Assistance | 66 (11.3%) | 516 (88.7%) |
| Arts, Entertainment & Recreation | 13 (34.2%) | 25 (65.8%) |
| Accommodation & Food Services | 110 (37.0%) | 187 (63.0%) |
| Public Administration | 155 (60.8%) | 100 (39.2%) |
| Total | 1,798 (48.5%) | 1,906 (51.5%) |
Education in Deridder
School Enrollment in Deridder
The most common levels of schooling among the 2,239 students in Deridder are elementary school (559 | 25.0%), middle school (539 | 24.1%), and high school (520 | 23.2%).
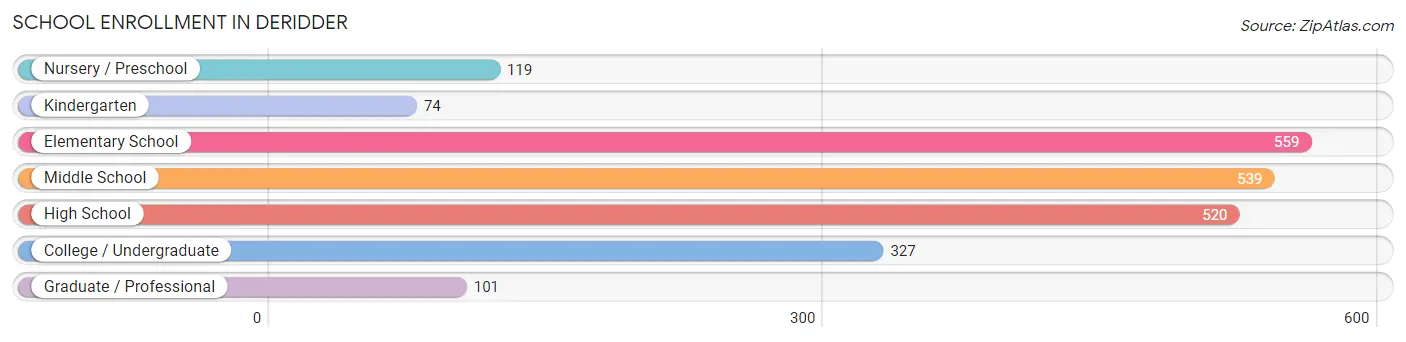
| School Level | # Students | % Students |
| Nursery / Preschool | 119 | 5.3% |
| Kindergarten | 74 | 3.3% |
| Elementary School | 559 | 25.0% |
| Middle School | 539 | 24.1% |
| High School | 520 | 23.2% |
| College / Undergraduate | 327 | 14.6% |
| Graduate / Professional | 101 | 4.5% |
| Total | 2,239 | 100.0% |
School Enrollment by Age by Funding Source in Deridder
Out of a total of 2,239 students who are enrolled in schools in Deridder, 260 (11.6%) attend a private institution, while the remaining 1,979 (88.4%) are enrolled in public schools. The age group of 35 years and over has the highest likelihood of being enrolled in private schools, with 33 (26.4% in the age bracket) enrolled. Conversely, the age group of 20 to 24 year olds has the lowest likelihood of being enrolled in a private school, with 74 (100.0% in the age bracket) attending a public institution.
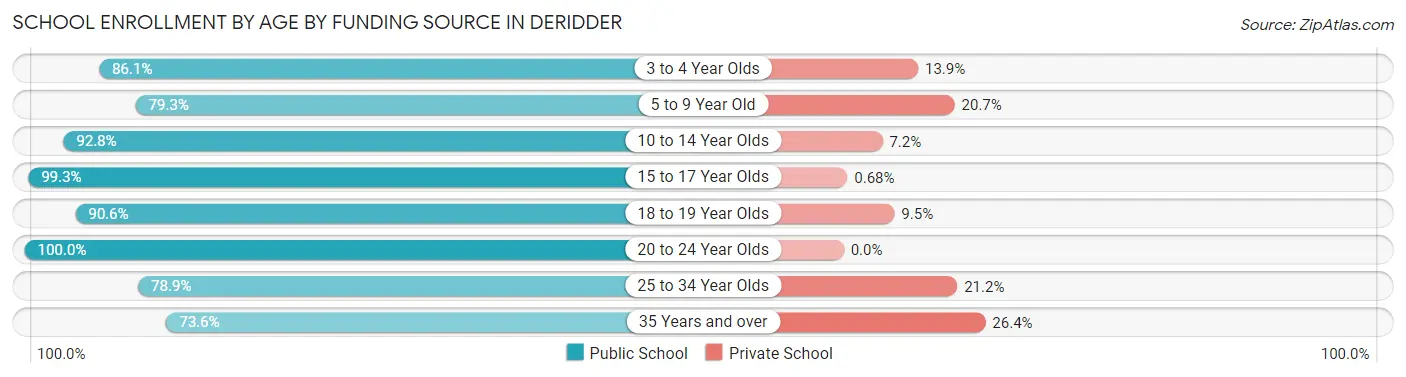
| Age Bracket | Public School | Private School |
| 3 to 4 Year Olds | 87 (86.1%) | 14 (13.9%) |
| 5 to 9 Year Old | 457 (79.3%) | 119 (20.7%) |
| 10 to 14 Year Olds | 590 (92.8%) | 46 (7.2%) |
| 15 to 17 Year Olds | 441 (99.3%) | 3 (0.7%) |
| 18 to 19 Year Olds | 115 (90.5%) | 12 (9.5%) |
| 20 to 24 Year Olds | 74 (100.0%) | 0 (0.0%) |
| 25 to 34 Year Olds | 123 (78.8%) | 33 (21.1%) |
| 35 Years and over | 92 (73.6%) | 33 (26.4%) |
| Total | 1,979 (88.4%) | 260 (11.6%) |
Educational Attainment by Field of Study in Deridder
Education (331 | 20.3%), business (249 | 15.3%), psychology (170 | 10.4%), science & technology (163 | 10.0%), and liberal arts & history (146 | 9.0%) are the most common fields of study among 1,629 individuals in Deridder who have obtained a bachelor's degree or higher.
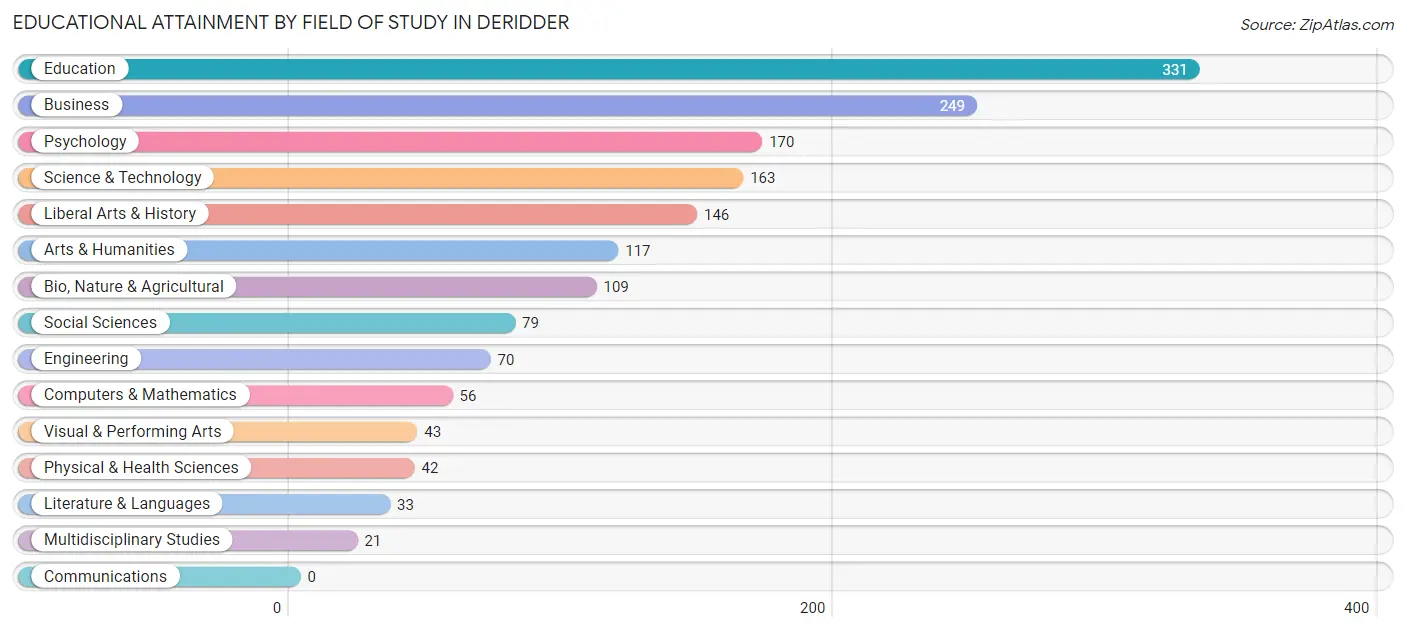
| Field of Study | # Graduates | % Graduates |
| Computers & Mathematics | 56 | 3.4% |
| Bio, Nature & Agricultural | 109 | 6.7% |
| Physical & Health Sciences | 42 | 2.6% |
| Psychology | 170 | 10.4% |
| Social Sciences | 79 | 4.9% |
| Engineering | 70 | 4.3% |
| Multidisciplinary Studies | 21 | 1.3% |
| Science & Technology | 163 | 10.0% |
| Business | 249 | 15.3% |
| Education | 331 | 20.3% |
| Literature & Languages | 33 | 2.0% |
| Liberal Arts & History | 146 | 9.0% |
| Visual & Performing Arts | 43 | 2.6% |
| Communications | 0 | 0.0% |
| Arts & Humanities | 117 | 7.2% |
| Total | 1,629 | 100.0% |
Transportation & Commute in Deridder
Vehicle Availability by Sex in Deridder
The most prevalent vehicle ownership categories in Deridder are males with 2 vehicles (903, accounting for 44.3%) and females with 2 vehicles (717, making up 46.9%).
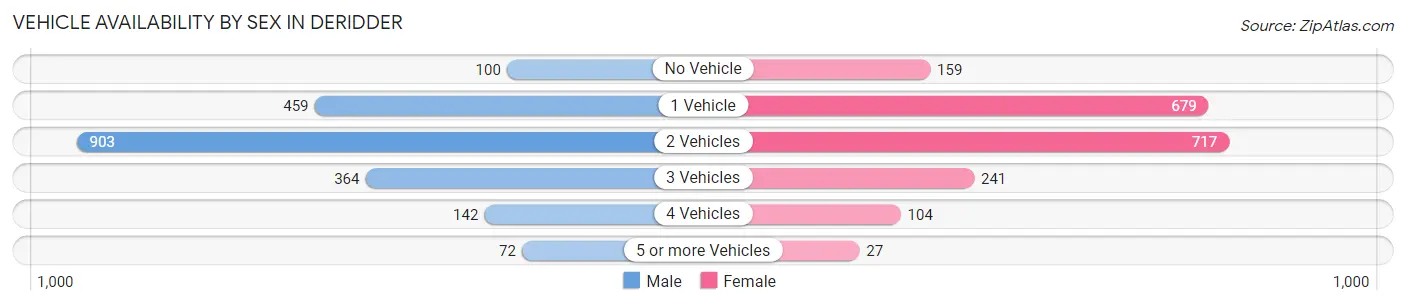
| Vehicles Available | Male | Female |
| No Vehicle | 100 (4.9%) | 159 (8.3%) |
| 1 Vehicle | 459 (22.5%) | 679 (35.2%) |
| 2 Vehicles | 903 (44.3%) | 717 (37.2%) |
| 3 Vehicles | 364 (17.8%) | 241 (12.5%) |
| 4 Vehicles | 142 (7.0%) | 104 (5.4%) |
| 5 or more Vehicles | 72 (3.5%) | 27 (1.4%) |
| Total | 2,040 (100.0%) | 1,927 (100.0%) |
Commute Time in Deridder
The most frequently occuring commute durations in Deridder are 5 to 9 minutes (819 commuters, 21.0%), 10 to 14 minutes (726 commuters, 18.6%), and 30 to 34 minutes (490 commuters, 12.6%).
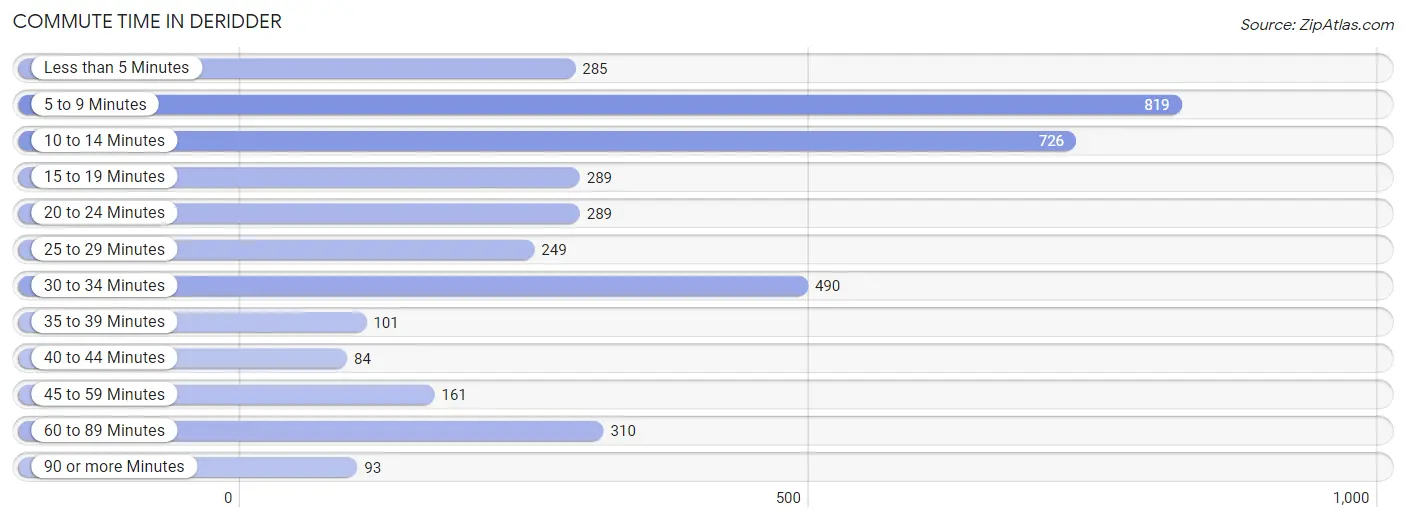
| Commute Time | # Commuters | % Commuters |
| Less than 5 Minutes | 285 | 7.3% |
| 5 to 9 Minutes | 819 | 21.0% |
| 10 to 14 Minutes | 726 | 18.6% |
| 15 to 19 Minutes | 289 | 7.4% |
| 20 to 24 Minutes | 289 | 7.4% |
| 25 to 29 Minutes | 249 | 6.4% |
| 30 to 34 Minutes | 490 | 12.6% |
| 35 to 39 Minutes | 101 | 2.6% |
| 40 to 44 Minutes | 84 | 2.2% |
| 45 to 59 Minutes | 161 | 4.1% |
| 60 to 89 Minutes | 310 | 8.0% |
| 90 or more Minutes | 93 | 2.4% |
Commute Time by Sex in Deridder
The most common commute times in Deridder are 10 to 14 minutes (337 commuters, 16.8%) for males and 5 to 9 minutes (570 commuters, 30.2%) for females.
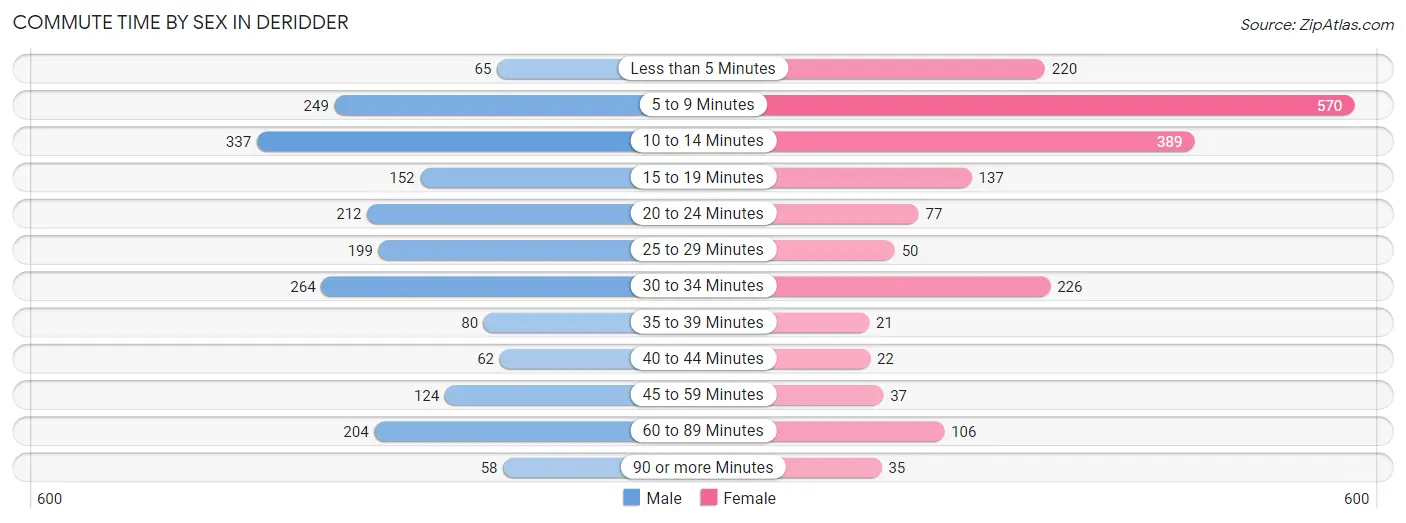
| Commute Time | Male | Female |
| Less than 5 Minutes | 65 (3.2%) | 220 (11.6%) |
| 5 to 9 Minutes | 249 (12.4%) | 570 (30.2%) |
| 10 to 14 Minutes | 337 (16.8%) | 389 (20.6%) |
| 15 to 19 Minutes | 152 (7.6%) | 137 (7.2%) |
| 20 to 24 Minutes | 212 (10.6%) | 77 (4.1%) |
| 25 to 29 Minutes | 199 (9.9%) | 50 (2.6%) |
| 30 to 34 Minutes | 264 (13.2%) | 226 (12.0%) |
| 35 to 39 Minutes | 80 (4.0%) | 21 (1.1%) |
| 40 to 44 Minutes | 62 (3.1%) | 22 (1.2%) |
| 45 to 59 Minutes | 124 (6.2%) | 37 (2.0%) |
| 60 to 89 Minutes | 204 (10.2%) | 106 (5.6%) |
| 90 or more Minutes | 58 (2.9%) | 35 (1.8%) |
Time of Departure to Work by Sex in Deridder
The most frequent times of departure to work in Deridder are 7:00 AM to 7:29 AM (378, 18.8%) for males and 7:30 AM to 7:59 AM (304, 16.1%) for females.
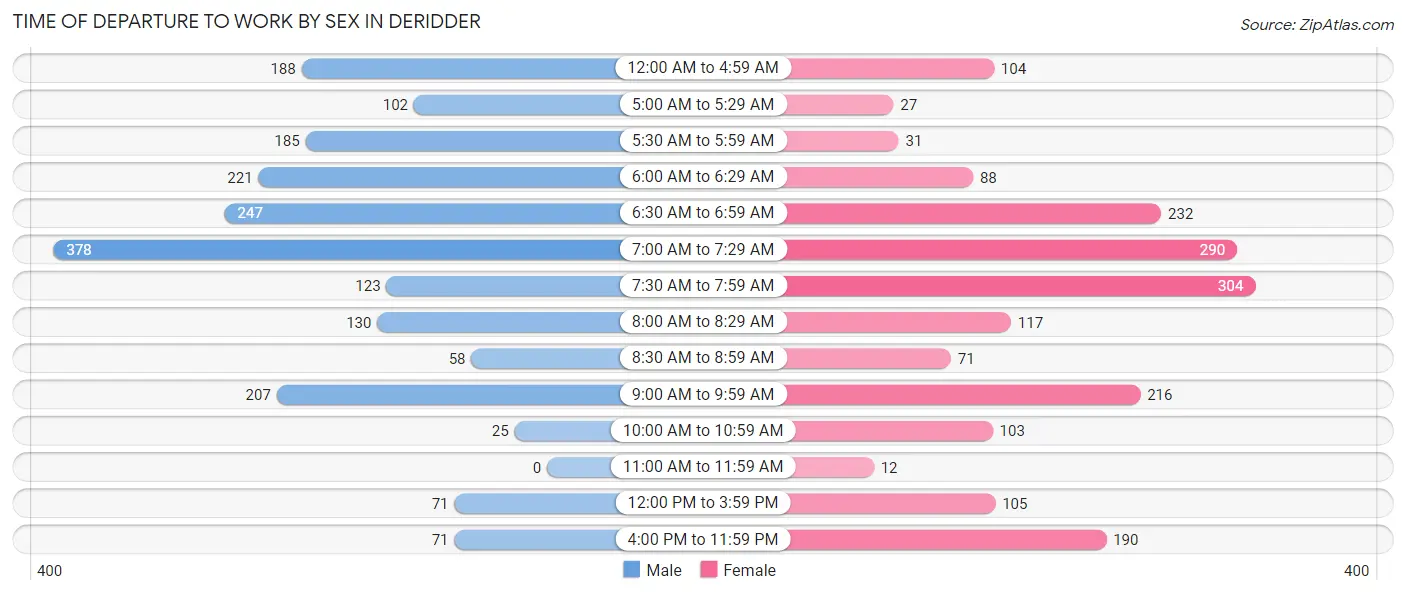
| Time of Departure | Male | Female |
| 12:00 AM to 4:59 AM | 188 (9.4%) | 104 (5.5%) |
| 5:00 AM to 5:29 AM | 102 (5.1%) | 27 (1.4%) |
| 5:30 AM to 5:59 AM | 185 (9.2%) | 31 (1.6%) |
| 6:00 AM to 6:29 AM | 221 (11.0%) | 88 (4.7%) |
| 6:30 AM to 6:59 AM | 247 (12.3%) | 232 (12.3%) |
| 7:00 AM to 7:29 AM | 378 (18.8%) | 290 (15.3%) |
| 7:30 AM to 7:59 AM | 123 (6.1%) | 304 (16.1%) |
| 8:00 AM to 8:29 AM | 130 (6.5%) | 117 (6.2%) |
| 8:30 AM to 8:59 AM | 58 (2.9%) | 71 (3.8%) |
| 9:00 AM to 9:59 AM | 207 (10.3%) | 216 (11.4%) |
| 10:00 AM to 10:59 AM | 25 (1.3%) | 103 (5.4%) |
| 11:00 AM to 11:59 AM | 0 (0.0%) | 12 (0.6%) |
| 12:00 PM to 3:59 PM | 71 (3.5%) | 105 (5.6%) |
| 4:00 PM to 11:59 PM | 71 (3.5%) | 190 (10.1%) |
| Total | 2,006 (100.0%) | 1,890 (100.0%) |
Housing Occupancy in Deridder
Occupancy by Ownership in Deridder
Of the total 4,051 dwellings in Deridder, owner-occupied units account for 2,575 (63.6%), while renter-occupied units make up 1,476 (36.4%).
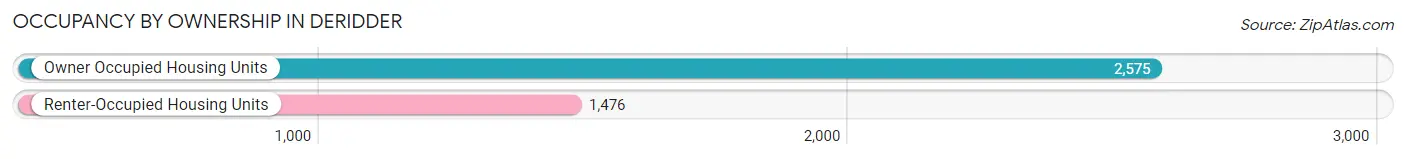
| Occupancy | # Housing Units | % Housing Units |
| Owner Occupied Housing Units | 2,575 | 63.6% |
| Renter-Occupied Housing Units | 1,476 | 36.4% |
| Total Occupied Housing Units | 4,051 | 100.0% |
Occupancy by Household Size in Deridder
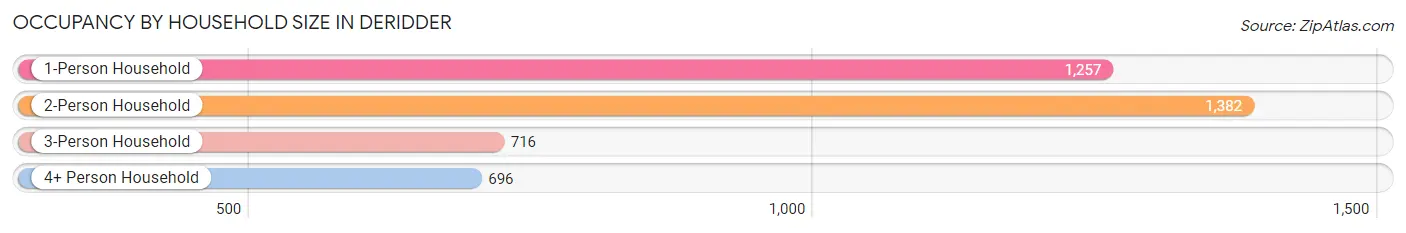
| Household Size | # Housing Units | % Housing Units |
| 1-Person Household | 1,257 | 31.0% |
| 2-Person Household | 1,382 | 34.1% |
| 3-Person Household | 716 | 17.7% |
| 4+ Person Household | 696 | 17.2% |
| Total Housing Units | 4,051 | 100.0% |
Occupancy by Ownership by Household Size in Deridder
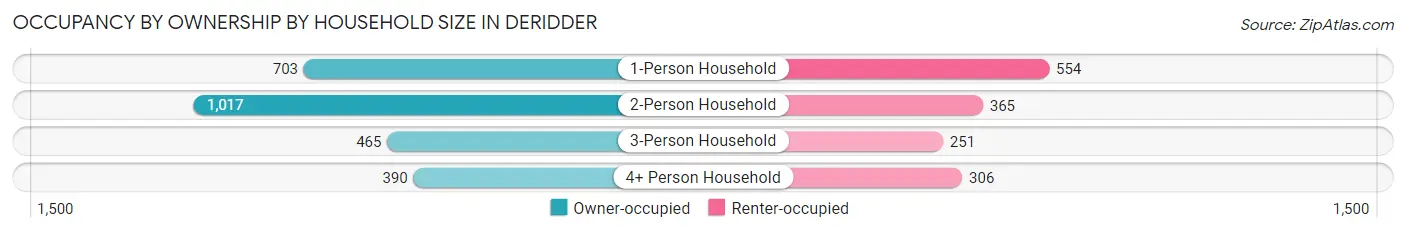
| Household Size | Owner-occupied | Renter-occupied |
| 1-Person Household | 703 (55.9%) | 554 (44.1%) |
| 2-Person Household | 1,017 (73.6%) | 365 (26.4%) |
| 3-Person Household | 465 (64.9%) | 251 (35.1%) |
| 4+ Person Household | 390 (56.0%) | 306 (44.0%) |
| Total Housing Units | 2,575 (63.6%) | 1,476 (36.4%) |
Occupancy by Educational Attainment in Deridder
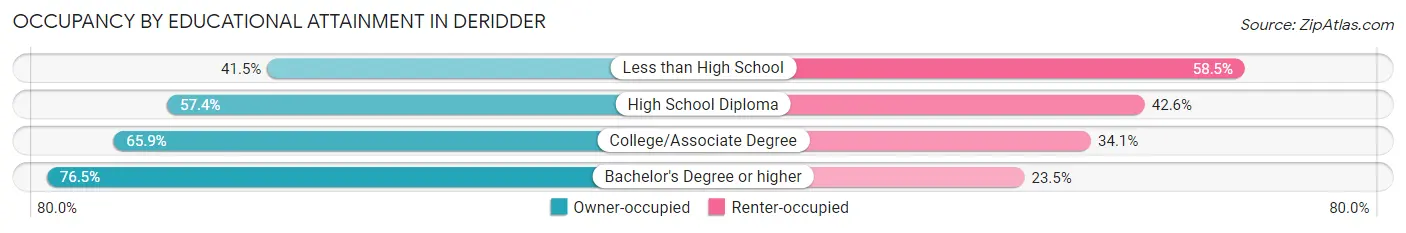
| Household Size | Owner-occupied | Renter-occupied |
| Less than High School | 130 (41.5%) | 183 (58.5%) |
| High School Diploma | 793 (57.4%) | 589 (42.6%) |
| College/Associate Degree | 934 (65.9%) | 483 (34.1%) |
| Bachelor's Degree or higher | 718 (76.5%) | 221 (23.5%) |
Occupancy by Age of Householder in Deridder
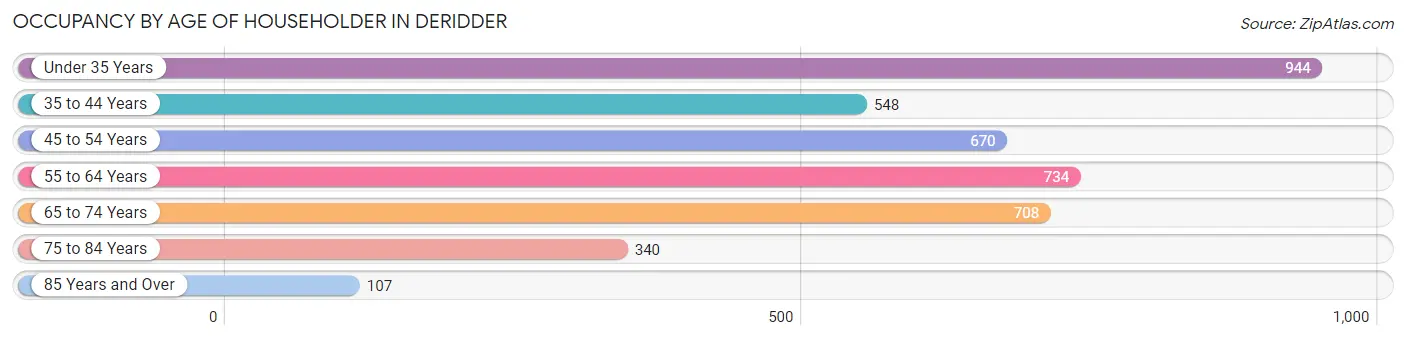
| Age Bracket | # Households | % Households |
| Under 35 Years | 944 | 23.3% |
| 35 to 44 Years | 548 | 13.5% |
| 45 to 54 Years | 670 | 16.5% |
| 55 to 64 Years | 734 | 18.1% |
| 65 to 74 Years | 708 | 17.5% |
| 75 to 84 Years | 340 | 8.4% |
| 85 Years and Over | 107 | 2.6% |
| Total | 4,051 | 100.0% |
Housing Finances in Deridder
Median Income by Occupancy in Deridder
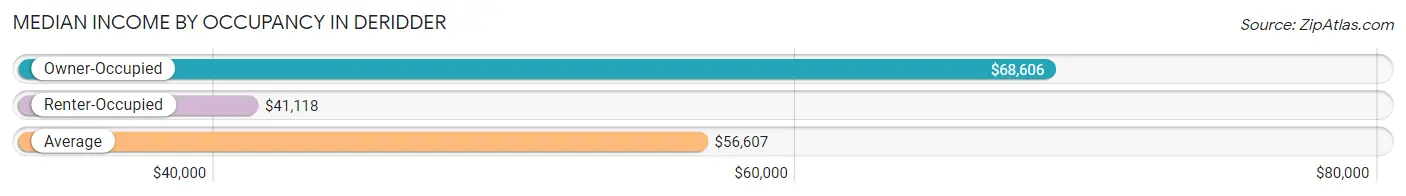
| Occupancy Type | # Households | Median Income |
| Owner-Occupied | 2,575 (63.6%) | $68,606 |
| Renter-Occupied | 1,476 (36.4%) | $41,118 |
| Average | 4,051 (100.0%) | $56,607 |
Occupancy by Householder Income Bracket in Deridder
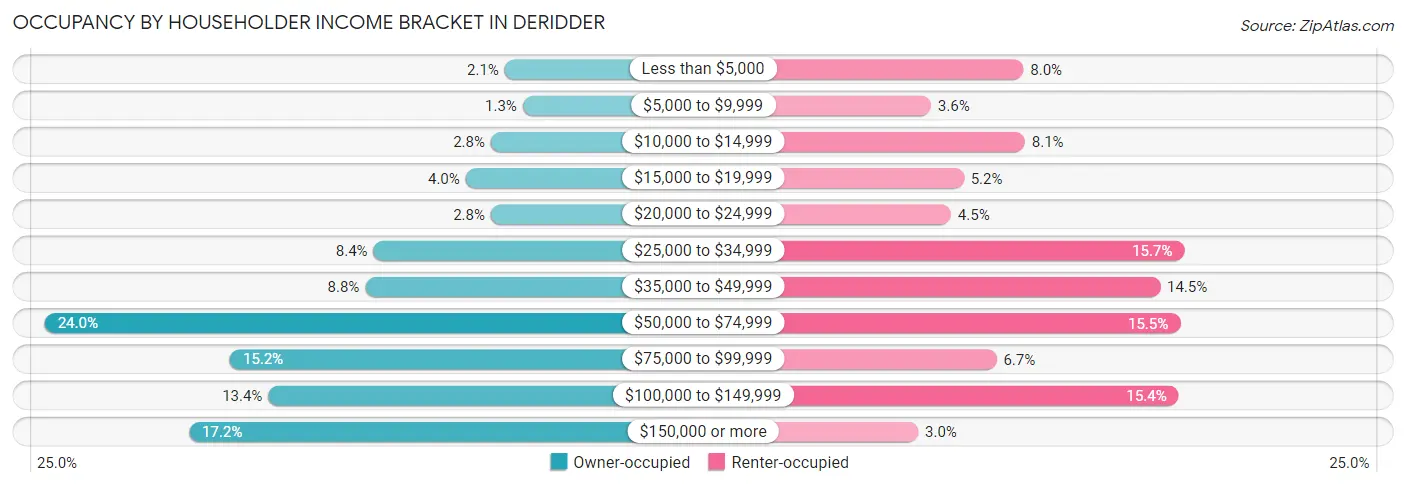
| Income Bracket | Owner-occupied | Renter-occupied |
| Less than $5,000 | 55 (2.1%) | 118 (8.0%) |
| $5,000 to $9,999 | 33 (1.3%) | 53 (3.6%) |
| $10,000 to $14,999 | 72 (2.8%) | 119 (8.1%) |
| $15,000 to $19,999 | 103 (4.0%) | 76 (5.1%) |
| $20,000 to $24,999 | 72 (2.8%) | 67 (4.5%) |
| $25,000 to $34,999 | 216 (8.4%) | 231 (15.7%) |
| $35,000 to $49,999 | 226 (8.8%) | 214 (14.5%) |
| $50,000 to $74,999 | 619 (24.0%) | 228 (15.4%) |
| $75,000 to $99,999 | 392 (15.2%) | 99 (6.7%) |
| $100,000 to $149,999 | 345 (13.4%) | 227 (15.4%) |
| $150,000 or more | 442 (17.2%) | 44 (3.0%) |
| Total | 2,575 (100.0%) | 1,476 (100.0%) |
Monthly Housing Cost Tiers in Deridder
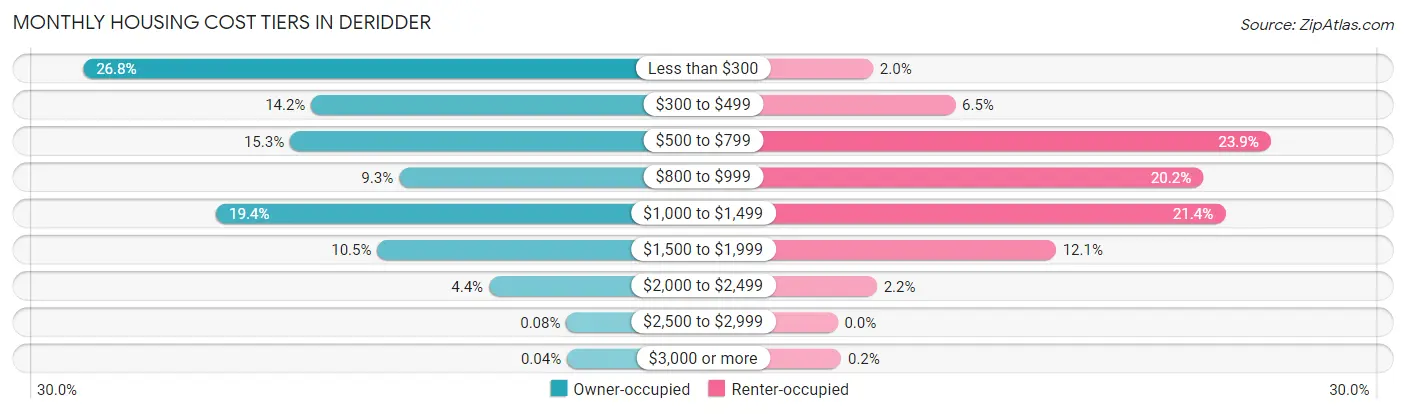
| Monthly Cost | Owner-occupied | Renter-occupied |
| Less than $300 | 689 (26.8%) | 29 (2.0%) |
| $300 to $499 | 365 (14.2%) | 96 (6.5%) |
| $500 to $799 | 395 (15.3%) | 353 (23.9%) |
| $800 to $999 | 240 (9.3%) | 298 (20.2%) |
| $1,000 to $1,499 | 500 (19.4%) | 316 (21.4%) |
| $1,500 to $1,999 | 271 (10.5%) | 178 (12.1%) |
| $2,000 to $2,499 | 112 (4.3%) | 32 (2.2%) |
| $2,500 to $2,999 | 2 (0.1%) | 0 (0.0%) |
| $3,000 or more | 1 (0.0%) | 3 (0.2%) |
| Total | 2,575 (100.0%) | 1,476 (100.0%) |
Physical Housing Characteristics in Deridder
Housing Structures in Deridder
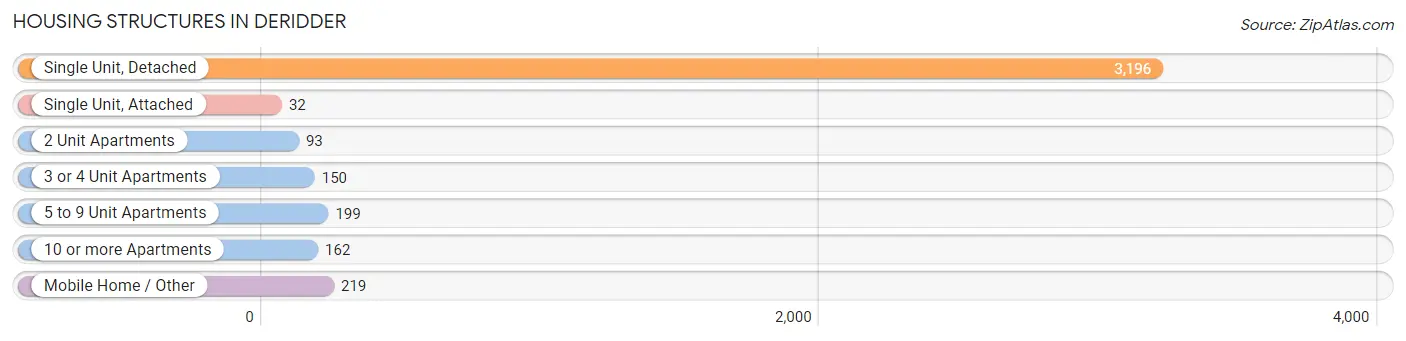
| Structure Type | # Housing Units | % Housing Units |
| Single Unit, Detached | 3,196 | 78.9% |
| Single Unit, Attached | 32 | 0.8% |
| 2 Unit Apartments | 93 | 2.3% |
| 3 or 4 Unit Apartments | 150 | 3.7% |
| 5 to 9 Unit Apartments | 199 | 4.9% |
| 10 or more Apartments | 162 | 4.0% |
| Mobile Home / Other | 219 | 5.4% |
| Total | 4,051 | 100.0% |
Housing Structures by Occupancy in Deridder
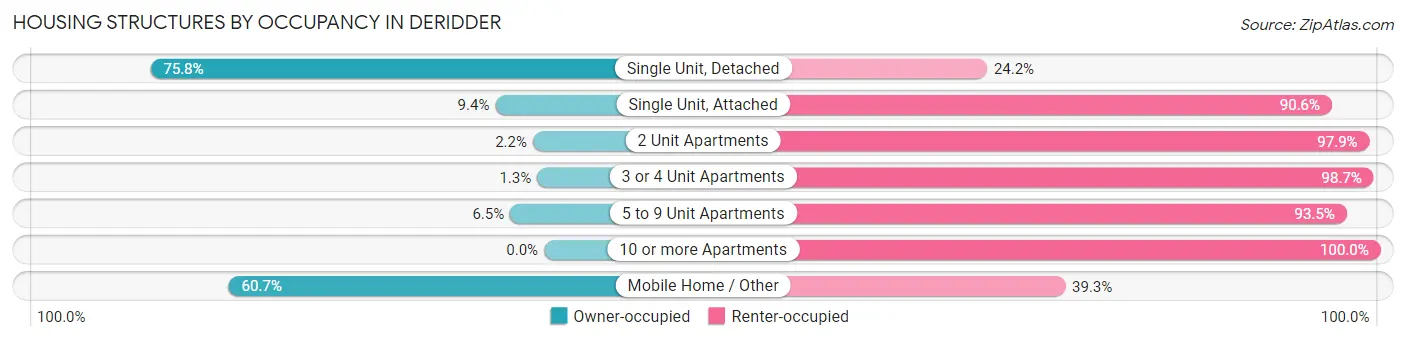
| Structure Type | Owner-occupied | Renter-occupied |
| Single Unit, Detached | 2,422 (75.8%) | 774 (24.2%) |
| Single Unit, Attached | 3 (9.4%) | 29 (90.6%) |
| 2 Unit Apartments | 2 (2.1%) | 91 (97.9%) |
| 3 or 4 Unit Apartments | 2 (1.3%) | 148 (98.7%) |
| 5 to 9 Unit Apartments | 13 (6.5%) | 186 (93.5%) |
| 10 or more Apartments | 0 (0.0%) | 162 (100.0%) |
| Mobile Home / Other | 133 (60.7%) | 86 (39.3%) |
| Total | 2,575 (63.6%) | 1,476 (36.4%) |
Housing Structures by Number of Rooms in Deridder
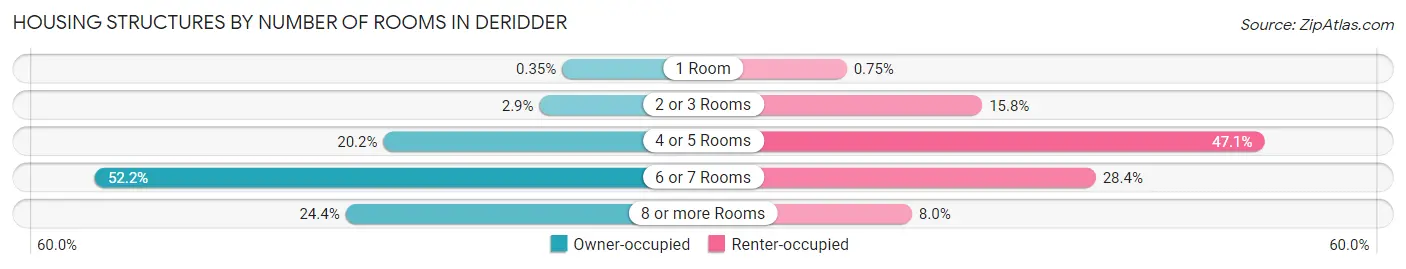
| Number of Rooms | Owner-occupied | Renter-occupied |
| 1 Room | 9 (0.4%) | 11 (0.7%) |
| 2 or 3 Rooms | 74 (2.9%) | 233 (15.8%) |
| 4 or 5 Rooms | 520 (20.2%) | 695 (47.1%) |
| 6 or 7 Rooms | 1,344 (52.2%) | 419 (28.4%) |
| 8 or more Rooms | 628 (24.4%) | 118 (8.0%) |
| Total | 2,575 (100.0%) | 1,476 (100.0%) |
Housing Structure by Heating Type in Deridder
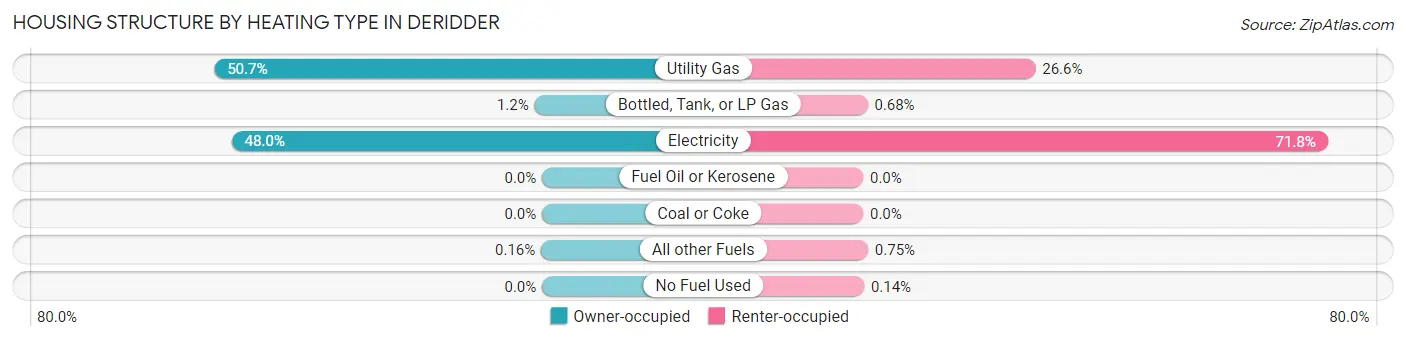
| Heating Type | Owner-occupied | Renter-occupied |
| Utility Gas | 1,305 (50.7%) | 393 (26.6%) |
| Bottled, Tank, or LP Gas | 30 (1.2%) | 10 (0.7%) |
| Electricity | 1,236 (48.0%) | 1,060 (71.8%) |
| Fuel Oil or Kerosene | 0 (0.0%) | 0 (0.0%) |
| Coal or Coke | 0 (0.0%) | 0 (0.0%) |
| All other Fuels | 4 (0.2%) | 11 (0.7%) |
| No Fuel Used | 0 (0.0%) | 2 (0.1%) |
| Total | 2,575 (100.0%) | 1,476 (100.0%) |
Household Vehicle Usage in Deridder
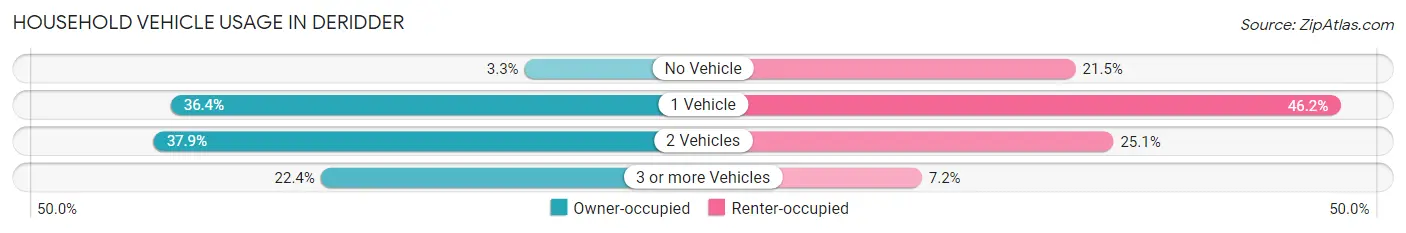
| Vehicles per Household | Owner-occupied | Renter-occupied |
| No Vehicle | 86 (3.3%) | 318 (21.5%) |
| 1 Vehicle | 936 (36.3%) | 682 (46.2%) |
| 2 Vehicles | 977 (37.9%) | 370 (25.1%) |
| 3 or more Vehicles | 576 (22.4%) | 106 (7.2%) |
| Total | 2,575 (100.0%) | 1,476 (100.0%) |
Real Estate & Mortgages in Deridder
Real Estate and Mortgage Overview in Deridder
| Characteristic | Without Mortgage | With Mortgage |
| Housing Units | 1,278 | 1,297 |
| Median Property Value | $93,800 | $185,600 |
| Median Household Income | $56,066 | $268 |
| Monthly Housing Costs | $279 | $1 |
| Real Estate Taxes | $199 | $95 |
Property Value by Mortgage Status in Deridder
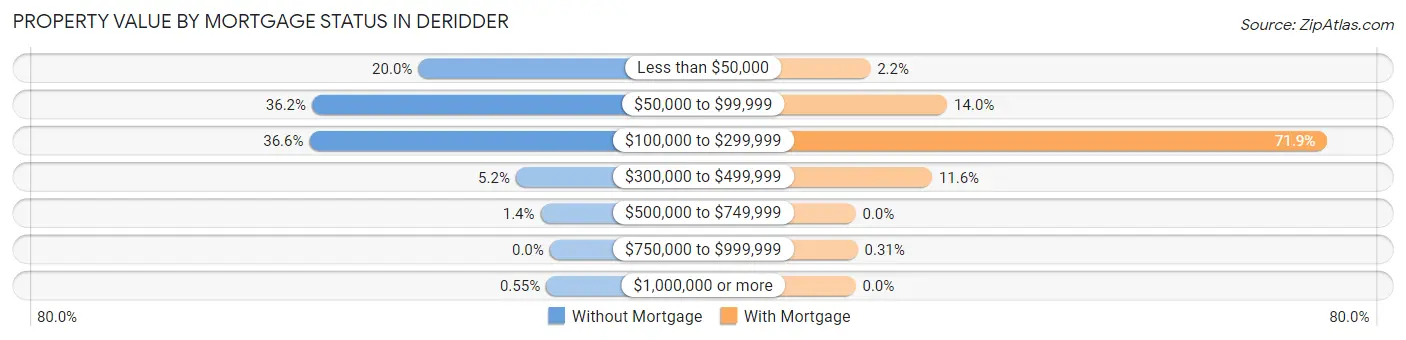
| Property Value | Without Mortgage | With Mortgage |
| Less than $50,000 | 256 (20.0%) | 29 (2.2%) |
| $50,000 to $99,999 | 463 (36.2%) | 181 (14.0%) |
| $100,000 to $299,999 | 468 (36.6%) | 932 (71.9%) |
| $300,000 to $499,999 | 66 (5.2%) | 151 (11.6%) |
| $500,000 to $749,999 | 18 (1.4%) | 0 (0.0%) |
| $750,000 to $999,999 | 0 (0.0%) | 4 (0.3%) |
| $1,000,000 or more | 7 (0.5%) | 0 (0.0%) |
| Total | 1,278 (100.0%) | 1,297 (100.0%) |
Household Income by Mortgage Status in Deridder
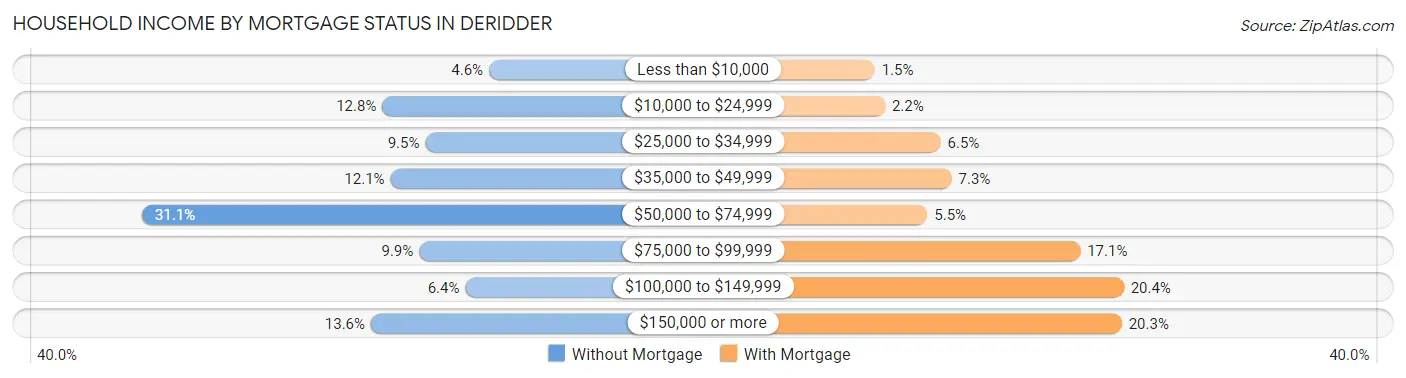
| Household Income | Without Mortgage | With Mortgage |
| Less than $10,000 | 59 (4.6%) | 19 (1.5%) |
| $10,000 to $24,999 | 163 (12.8%) | 29 (2.2%) |
| $25,000 to $34,999 | 121 (9.5%) | 84 (6.5%) |
| $35,000 to $49,999 | 155 (12.1%) | 95 (7.3%) |
| $50,000 to $74,999 | 397 (31.1%) | 71 (5.5%) |
| $75,000 to $99,999 | 127 (9.9%) | 222 (17.1%) |
| $100,000 to $149,999 | 82 (6.4%) | 265 (20.4%) |
| $150,000 or more | 174 (13.6%) | 263 (20.3%) |
| Total | 1,278 (100.0%) | 1,297 (100.0%) |
Property Value to Household Income Ratio in Deridder
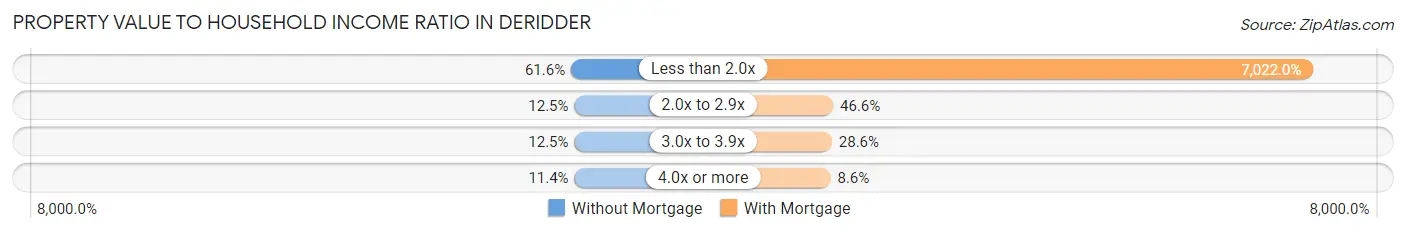
| Value-to-Income Ratio | Without Mortgage | With Mortgage |
| Less than 2.0x | 787 (61.6%) | 91,075 (7,022.0%) |
| 2.0x to 2.9x | 160 (12.5%) | 604 (46.6%) |
| 3.0x to 3.9x | 160 (12.5%) | 371 (28.6%) |
| 4.0x or more | 145 (11.4%) | 112 (8.6%) |
| Total | 1,278 (100.0%) | 1,297 (100.0%) |
Real Estate Taxes by Mortgage Status in Deridder
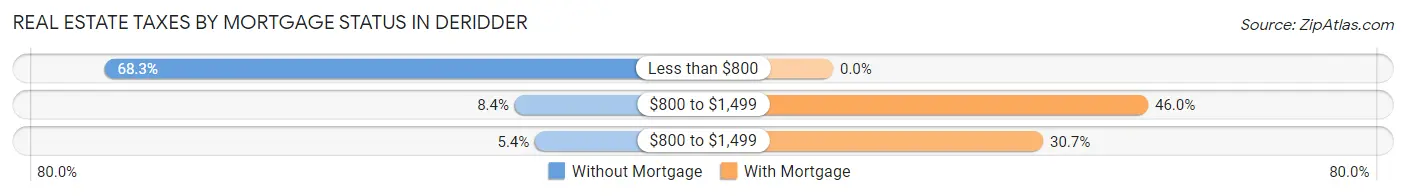
| Property Taxes | Without Mortgage | With Mortgage |
| Less than $800 | 873 (68.3%) | 0 (0.0%) |
| $800 to $1,499 | 107 (8.4%) | 597 (46.0%) |
| $800 to $1,499 | 69 (5.4%) | 398 (30.7%) |
| Total | 1,278 (100.0%) | 1,297 (100.0%) |
Health & Disability in Deridder
Health Insurance Coverage by Age in Deridder
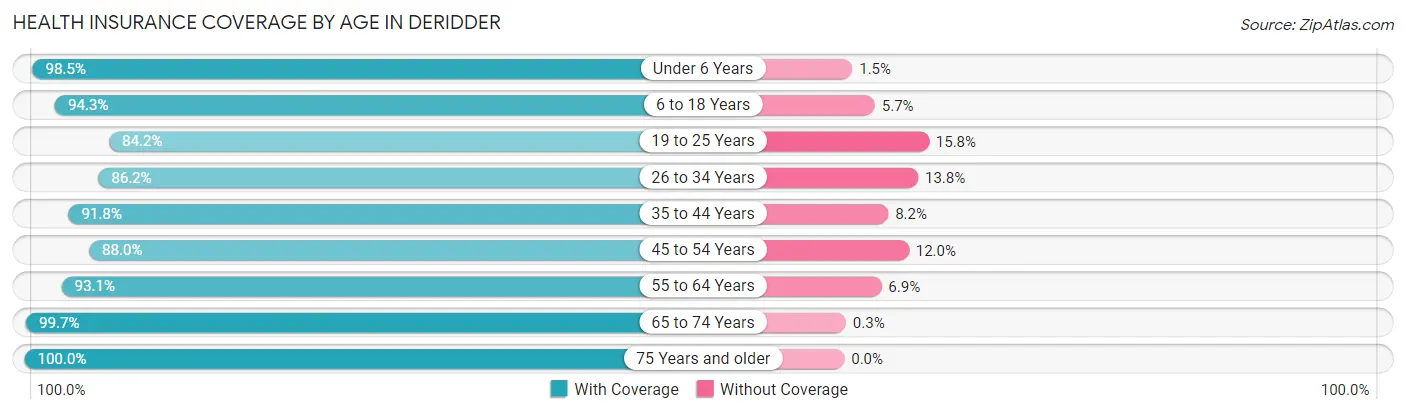
| Age Bracket | With Coverage | Without Coverage |
| Under 6 Years | 661 (98.5%) | 10 (1.5%) |
| 6 to 18 Years | 1,623 (94.3%) | 98 (5.7%) |
| 19 to 25 Years | 518 (84.2%) | 97 (15.8%) |
| 26 to 34 Years | 1,147 (86.2%) | 183 (13.8%) |
| 35 to 44 Years | 717 (91.8%) | 64 (8.2%) |
| 45 to 54 Years | 1,054 (88.0%) | 144 (12.0%) |
| 55 to 64 Years | 1,156 (93.1%) | 86 (6.9%) |
| 65 to 74 Years | 1,005 (99.7%) | 3 (0.3%) |
| 75 Years and older | 639 (100.0%) | 0 (0.0%) |
| Total | 8,520 (92.6%) | 685 (7.4%) |
Health Insurance Coverage by Citizenship Status in Deridder
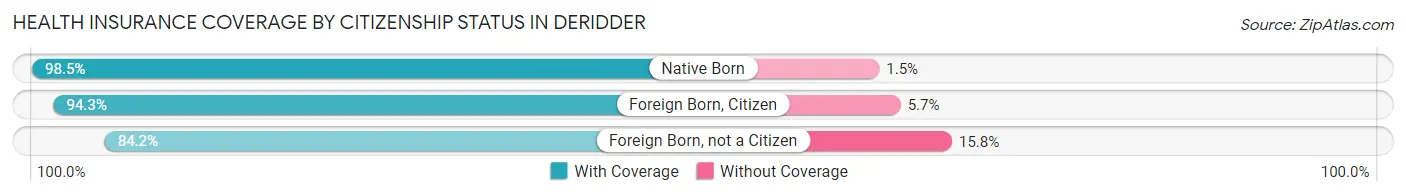
| Citizenship Status | With Coverage | Without Coverage |
| Native Born | 661 (98.5%) | 10 (1.5%) |
| Foreign Born, Citizen | 1,623 (94.3%) | 98 (5.7%) |
| Foreign Born, not a Citizen | 518 (84.2%) | 97 (15.8%) |
Health Insurance Coverage by Household Income in Deridder
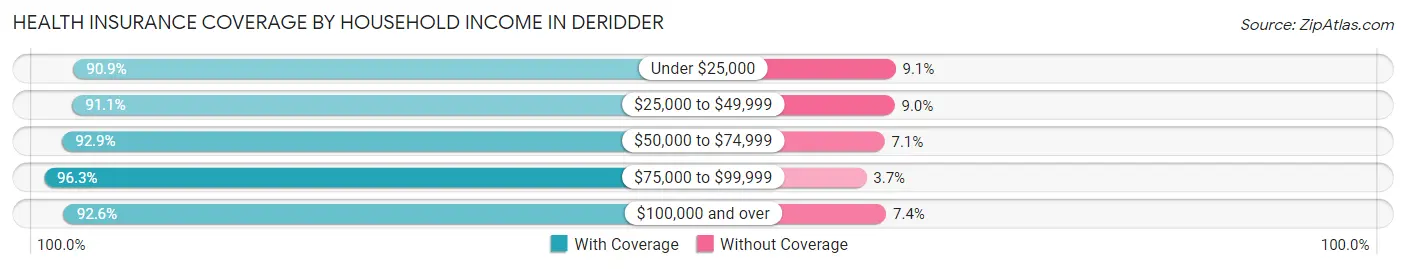
| Household Income | With Coverage | Without Coverage |
| Under $25,000 | 1,383 (90.9%) | 139 (9.1%) |
| $25,000 to $49,999 | 1,730 (91.0%) | 170 (8.9%) |
| $50,000 to $74,999 | 1,525 (92.9%) | 116 (7.1%) |
| $75,000 to $99,999 | 1,101 (96.3%) | 42 (3.7%) |
| $100,000 and over | 2,743 (92.6%) | 218 (7.4%) |
Public vs Private Health Insurance Coverage by Age in Deridder
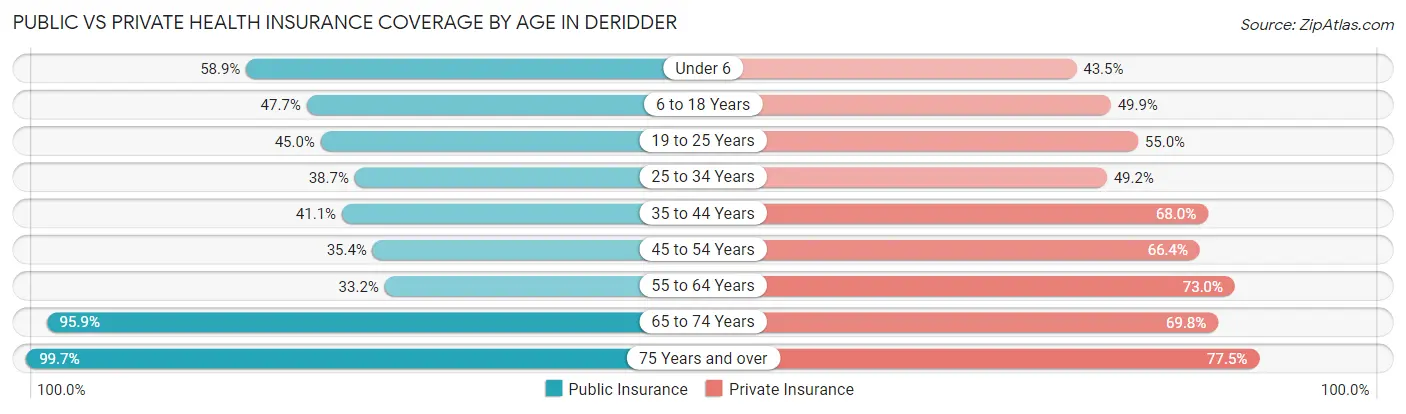
| Age Bracket | Public Insurance | Private Insurance |
| Under 6 | 395 (58.9%) | 292 (43.5%) |
| 6 to 18 Years | 820 (47.6%) | 859 (49.9%) |
| 19 to 25 Years | 277 (45.0%) | 338 (55.0%) |
| 25 to 34 Years | 515 (38.7%) | 654 (49.2%) |
| 35 to 44 Years | 321 (41.1%) | 531 (68.0%) |
| 45 to 54 Years | 424 (35.4%) | 796 (66.4%) |
| 55 to 64 Years | 412 (33.2%) | 906 (73.0%) |
| 65 to 74 Years | 967 (95.9%) | 704 (69.8%) |
| 75 Years and over | 637 (99.7%) | 495 (77.5%) |
| Total | 4,768 (51.8%) | 5,575 (60.6%) |
Disability Status by Sex by Age in Deridder
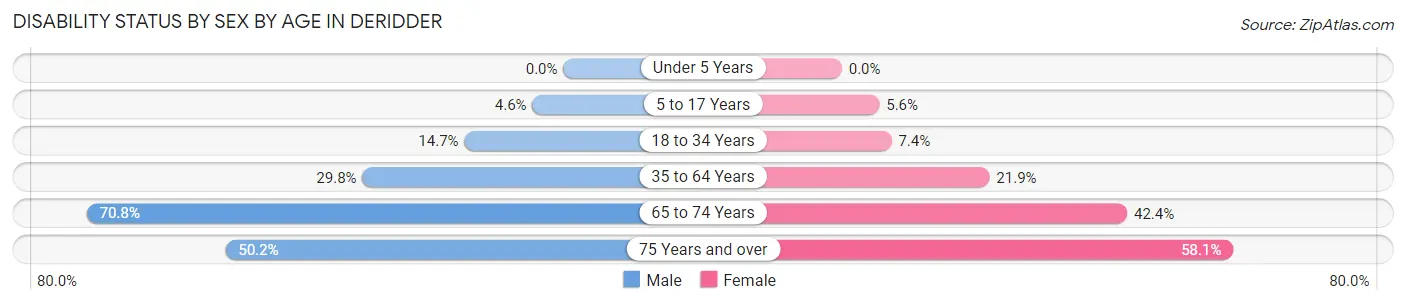
| Age Bracket | Male | Female |
| Under 5 Years | 0 (0.0%) | 0 (0.0%) |
| 5 to 17 Years | 45 (4.6%) | 40 (5.6%) |
| 18 to 34 Years | 149 (14.7%) | 77 (7.4%) |
| 35 to 64 Years | 467 (29.8%) | 363 (21.9%) |
| 65 to 74 Years | 371 (70.8%) | 205 (42.4%) |
| 75 Years and over | 129 (50.2%) | 222 (58.1%) |
Disability Class by Sex by Age in Deridder
Disability Class: Hearing Difficulty
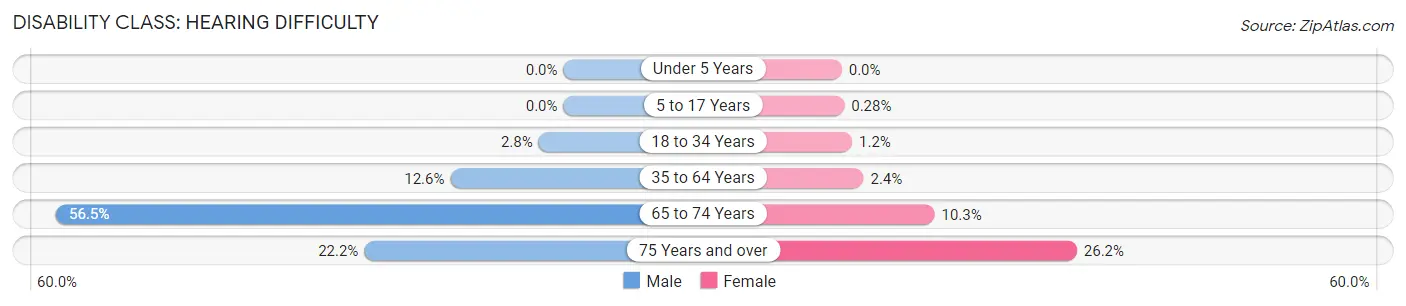
| Age Bracket | Male | Female |
| Under 5 Years | 0 (0.0%) | 0 (0.0%) |
| 5 to 17 Years | 0 (0.0%) | 2 (0.3%) |
| 18 to 34 Years | 28 (2.8%) | 12 (1.1%) |
| 35 to 64 Years | 197 (12.6%) | 40 (2.4%) |
| 65 to 74 Years | 296 (56.5%) | 50 (10.3%) |
| 75 Years and over | 57 (22.2%) | 100 (26.2%) |
Disability Class: Vision Difficulty
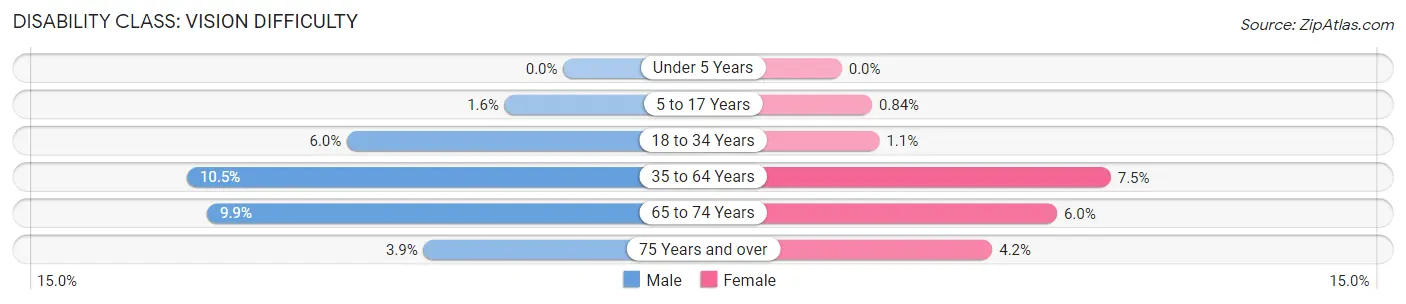
| Age Bracket | Male | Female |
| Under 5 Years | 0 (0.0%) | 0 (0.0%) |
| 5 to 17 Years | 16 (1.6%) | 6 (0.8%) |
| 18 to 34 Years | 61 (6.0%) | 11 (1.1%) |
| 35 to 64 Years | 164 (10.5%) | 124 (7.5%) |
| 65 to 74 Years | 52 (9.9%) | 29 (6.0%) |
| 75 Years and over | 10 (3.9%) | 16 (4.2%) |
Disability Class: Cognitive Difficulty
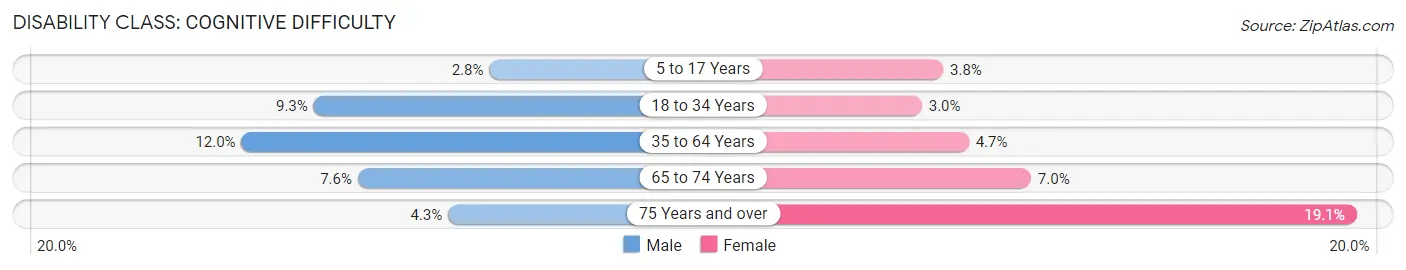
| Age Bracket | Male | Female |
| 5 to 17 Years | 27 (2.8%) | 27 (3.8%) |
| 18 to 34 Years | 94 (9.3%) | 31 (3.0%) |
| 35 to 64 Years | 187 (11.9%) | 78 (4.7%) |
| 65 to 74 Years | 40 (7.6%) | 34 (7.0%) |
| 75 Years and over | 11 (4.3%) | 73 (19.1%) |
Disability Class: Ambulatory Difficulty
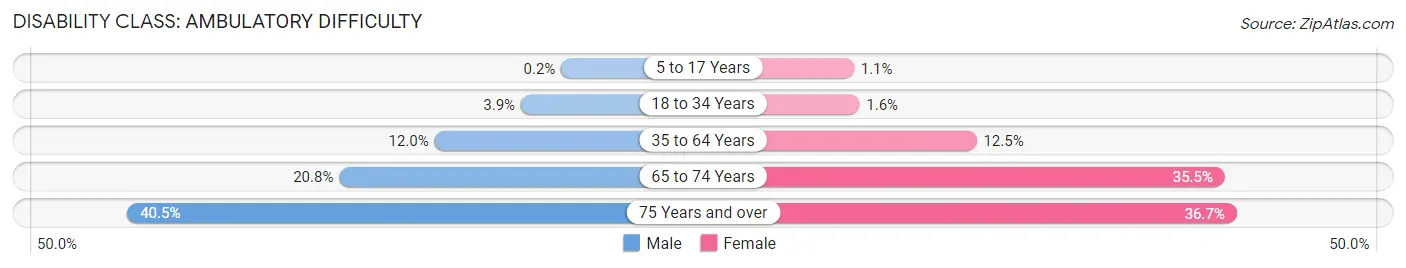
| Age Bracket | Male | Female |
| 5 to 17 Years | 2 (0.2%) | 8 (1.1%) |
| 18 to 34 Years | 40 (3.9%) | 17 (1.6%) |
| 35 to 64 Years | 187 (11.9%) | 207 (12.5%) |
| 65 to 74 Years | 109 (20.8%) | 172 (35.5%) |
| 75 Years and over | 104 (40.5%) | 140 (36.6%) |
Disability Class: Self-Care Difficulty
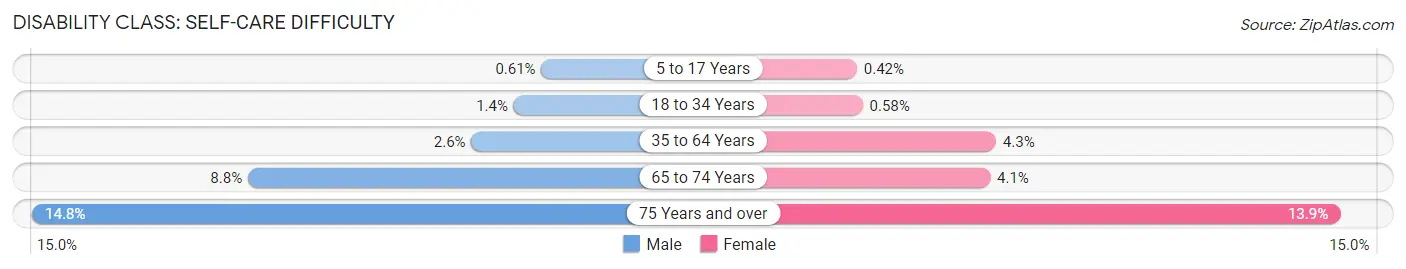
| Age Bracket | Male | Female |
| 5 to 17 Years | 6 (0.6%) | 3 (0.4%) |
| 18 to 34 Years | 14 (1.4%) | 6 (0.6%) |
| 35 to 64 Years | 40 (2.6%) | 71 (4.3%) |
| 65 to 74 Years | 46 (8.8%) | 20 (4.1%) |
| 75 Years and over | 38 (14.8%) | 53 (13.9%) |
Technology Access in Deridder
Computing Device Access in Deridder
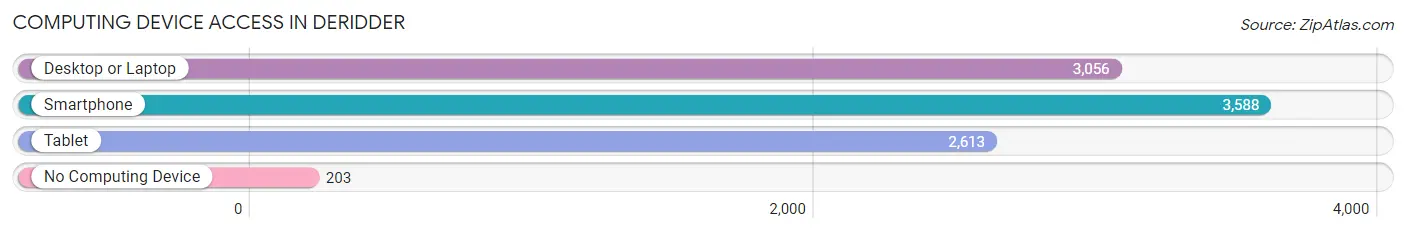
| Device Type | # Households | % Households |
| Desktop or Laptop | 3,056 | 75.4% |
| Smartphone | 3,588 | 88.6% |
| Tablet | 2,613 | 64.5% |
| No Computing Device | 203 | 5.0% |
| Total | 4,051 | 100.0% |
Internet Access in Deridder
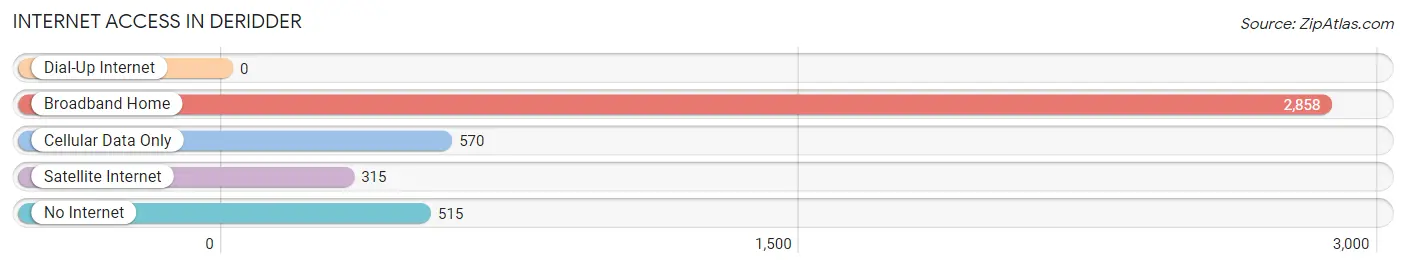
| Internet Type | # Households | % Households |
| Dial-Up Internet | 0 | 0.0% |
| Broadband Home | 2,858 | 70.6% |
| Cellular Data Only | 570 | 14.1% |
| Satellite Internet | 315 | 7.8% |
| No Internet | 515 | 12.7% |
| Total | 4,051 | 100.0% |
Deridder Summary
Deridder, Louisiana is a small city located in Beauregard Parish in the southwestern part of the state. It is the parish seat and the largest city in the parish. The city was founded in 1901 and has a population of 10,578 as of the 2010 census.
Geography
Deridder is located in the southwestern part of Louisiana, in Beauregard Parish. It is situated on the banks of the Calcasieu River, which is a tributary of the Sabine River. The city is located about 30 miles east of Lake Charles and about 90 miles west of Baton Rouge. The city has a total area of 8.2 square miles, all of which is land.
History
Deridder was founded in 1901 by the Deridder Land and Lumber Company. The company was founded by two brothers, John and William Deridder, who had moved to the area from Wisconsin. The brothers had purchased a large tract of land in the area and began to develop it for lumber production. The town was named after the brothers and quickly grew into a thriving lumber town.
In the early 1900s, the town was a major center for the lumber industry in the region. The town was also home to a number of other businesses, including a cotton gin, a sawmill, and a brick factory. The town was also home to a number of churches, schools, and other civic organizations.
In the 1920s, the lumber industry began to decline and the town began to suffer economically. The Great Depression further exacerbated the economic decline of the town. In the 1940s, the town began to experience a resurgence in economic activity due to the establishment of a number of military bases in the area. The town was also home to a number of oil and gas companies, which helped to further stimulate the local economy.
Economy
Deridder’s economy is largely based on the oil and gas industry. The city is home to a number of oil and gas companies, including Chevron, Shell, and ExxonMobil. The city is also home to a number of other businesses, including a number of retail stores, restaurants, and other service-oriented businesses.
The city is also home to a number of manufacturing companies, including a number of food processing plants. The city is also home to a number of government agencies, including the Beauregard Parish Sheriff’s Office and the Beauregard Parish Courthouse.
Demographics
As of the 2010 census, Deridder had a population of 10,578. The racial makeup of the city was 73.3% White, 22.2% African American, 0.4% Native American, 0.7% Asian, 0.1% Pacific Islander, 1.2% from other races, and 2.1% from two or more races. Hispanic or Latino of any race were 3.3% of the population.
The median income for a household in the city was $30,945, and the median income for a family was $37,917. The per capita income for the city was $17,845. About 17.2% of families and 20.7% of the population were below the poverty line, including 28.2% of those under age 18 and 16.2% of those age 65 or over.
Conclusion
Deridder, Louisiana is a small city located in Beauregard Parish in the southwestern part of the state. It was founded in 1901 and has a population of 10,578 as of the 2010 census. The city’s economy is largely based on the oil and gas industry, and it is also home to a number of other businesses, including retail stores, restaurants, and other service-oriented businesses. The racial makeup of the city is 73.3% White, 22.2% African American, 0.4% Native American, 0.7% Asian, 0.1% Pacific Islander, 1.2% from other races, and 2.1% from two or more races. The median income for a household in the city was $30,945, and the median income for a family was $37,917. About 17.2% of families and 20.7% of the population were below the poverty line.
Common Questions
What is Per Capita Income in Deridder?
Per Capita income in Deridder is $32,020.
What is the Median Family Income in Deridder?
Median Family Income in Deridder is $64,182.
What is the Median Household income in Deridder?
Median Household Income in Deridder is $56,607.
What is Income or Wage Gap in Deridder?
Income or Wage Gap in Deridder is 53.0%.
Women in Deridder earn 47.0 cents for every dollar earned by a man.
What is Family Income Deficit in Deridder?
Family Income Deficit in Deridder is $11,159.
Families that are below poverty line in Deridder earn $11,159 less on average than the poverty threshold level.
What is Inequality or Gini Index in Deridder?
Inequality or Gini Index in Deridder is 0.44.
What is the Total Population of Deridder?
Total Population of Deridder is 9,850.
What is the Total Male Population of Deridder?
Total Male Population of Deridder is 5,099.
What is the Total Female Population of Deridder?
Total Female Population of Deridder is 4,751.
What is the Ratio of Males per 100 Females in Deridder?
There are 107.32 Males per 100 Females in Deridder.
What is the Ratio of Females per 100 Males in Deridder?
There are 93.18 Females per 100 Males in Deridder.
What is the Median Population Age in Deridder?
Median Population Age in Deridder is 38.1 Years.
What is the Average Family Size in Deridder
Average Family Size in Deridder is 2.9 People.
What is the Average Household Size in Deridder
Average Household Size in Deridder is 2.4 People.
How Large is the Labor Force in Deridder?
There are 4,504 People in the Labor Forcein in Deridder.
What is the Percentage of People in the Labor Force in Deridder?
57.6% of People are in the Labor Force in Deridder.
What is the Unemployment Rate in Deridder?
Unemployment Rate in Deridder is 11.0%.