Dequincy, LA Map & Demographics
Dequincy Map
Dequincy Overview
$23,800
PER CAPITA INCOME
$72,171
AVG FAMILY INCOME
$51,500
AVG HOUSEHOLD INCOME
25.4%
WAGE / INCOME GAP [ % ]
74.6¢/ $1
WAGE / INCOME GAP [ $ ]
0.47
INEQUALITY / GINI INDEX
3,058
TOTAL POPULATION
1,704
MALE POPULATION
1,354
FEMALE POPULATION
125.85
MALES / 100 FEMALES
79.46
FEMALES / 100 MALES
37.5
MEDIAN AGE
4.4
AVG FAMILY SIZE
3.3
AVG HOUSEHOLD SIZE
1,105
LABOR FORCE [ PEOPLE ]
50.8%
PERCENT IN LABOR FORCE
1.2%
UNEMPLOYMENT RATE
Dequincy Zip Codes
Dequincy Area Codes
Income in Dequincy
Income Overview in Dequincy
Per Capita Income in Dequincy is $23,800, while median incomes of families and households are $72,171 and $51,500 respectively.
| Characteristic | Number | Measure |
| Per Capita Income | 3,058 | $23,800 |
| Median Family Income | 589 | $72,171 |
| Mean Family Income | 589 | $91,359 |
| Median Household Income | 918 | $51,500 |
| Mean Household Income | 918 | $71,262 |
| Income Deficit | 589 | $0 |
| Wage / Income Gap (%) | 3,058 | 25.40% |
| Wage / Income Gap ($) | 3,058 | 74.60¢ per $1 |
| Gini / Inequality Index | 3,058 | 0.47 |
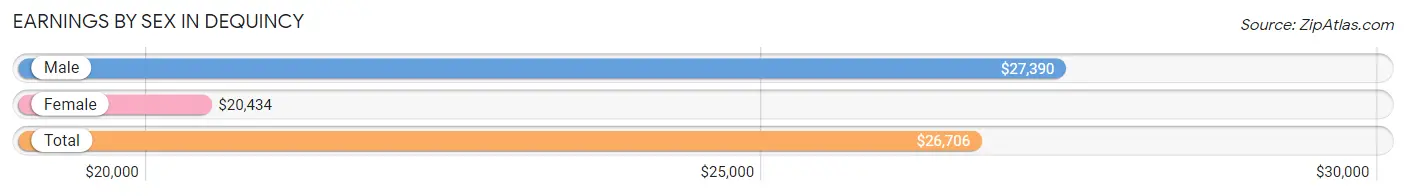
Earnings by Sex in Dequincy
Average Earnings in Dequincy are $26,706, $27,390 for men and $20,434 for women, a difference of 25.4%.
| Sex | Number | Average Earnings |
| Male | 689 (57.0%) | $27,390 |
| Female | 519 (43.0%) | $20,434 |
| Total | 1,208 (100.0%) | $26,706 |
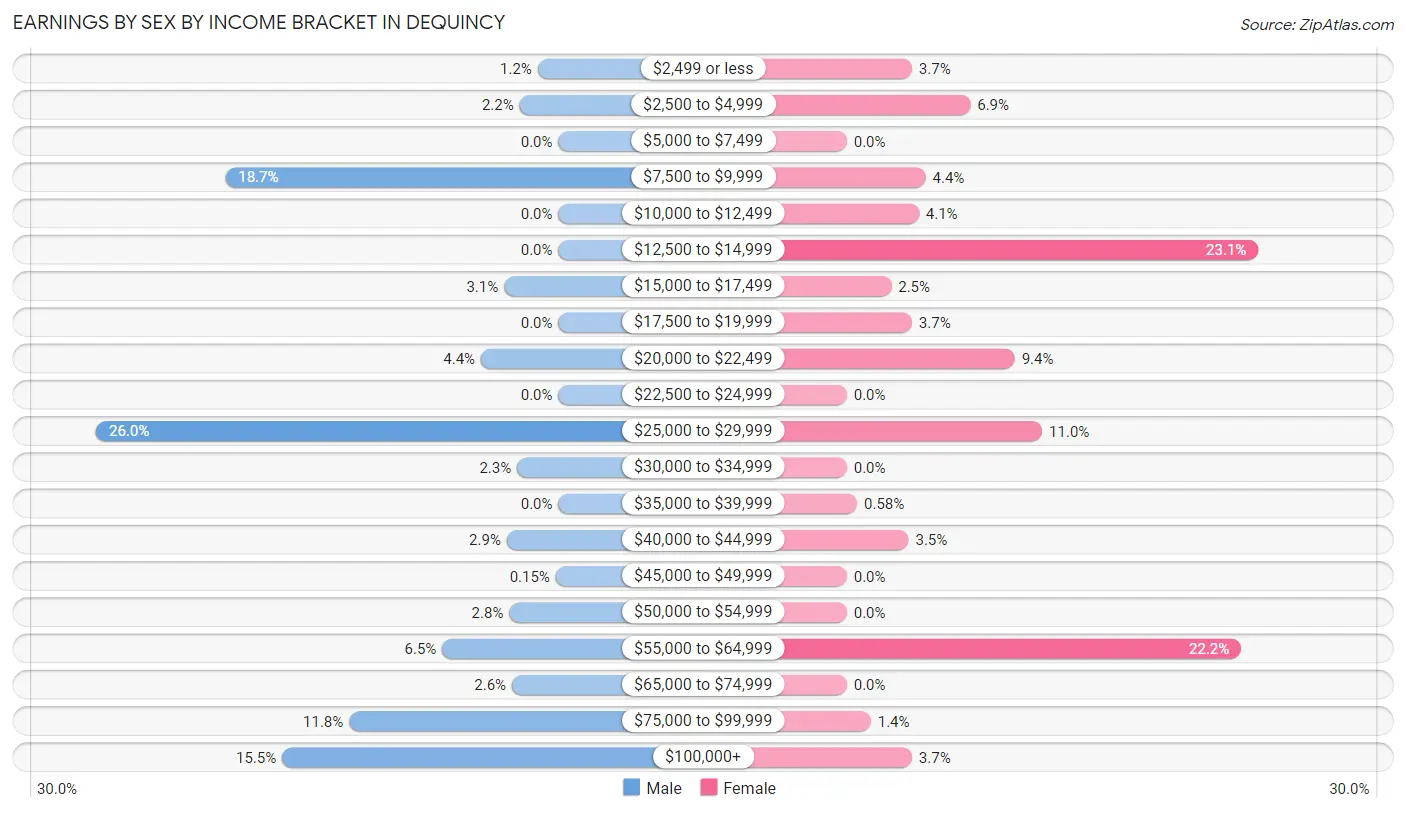
Earnings by Sex by Income Bracket in Dequincy
The most common earnings brackets in Dequincy are $25,000 to $29,999 for men (179 | 26.0%) and $12,500 to $14,999 for women (120 | 23.1%).
| Income | Male | Female |
| $2,499 or less | 8 (1.2%) | 19 (3.7%) |
| $2,500 to $4,999 | 15 (2.2%) | 36 (6.9%) |
| $5,000 to $7,499 | 0 (0.0%) | 0 (0.0%) |
| $7,500 to $9,999 | 129 (18.7%) | 23 (4.4%) |
| $10,000 to $12,499 | 0 (0.0%) | 21 (4.1%) |
| $12,500 to $14,999 | 0 (0.0%) | 120 (23.1%) |
| $15,000 to $17,499 | 21 (3.0%) | 13 (2.5%) |
| $17,500 to $19,999 | 0 (0.0%) | 19 (3.7%) |
| $20,000 to $22,499 | 30 (4.3%) | 49 (9.4%) |
| $22,500 to $24,999 | 0 (0.0%) | 0 (0.0%) |
| $25,000 to $29,999 | 179 (26.0%) | 57 (11.0%) |
| $30,000 to $34,999 | 16 (2.3%) | 0 (0.0%) |
| $35,000 to $39,999 | 0 (0.0%) | 3 (0.6%) |
| $40,000 to $44,999 | 20 (2.9%) | 18 (3.5%) |
| $45,000 to $49,999 | 1 (0.2%) | 0 (0.0%) |
| $50,000 to $54,999 | 19 (2.8%) | 0 (0.0%) |
| $55,000 to $64,999 | 45 (6.5%) | 115 (22.2%) |
| $65,000 to $74,999 | 18 (2.6%) | 0 (0.0%) |
| $75,000 to $99,999 | 81 (11.8%) | 7 (1.3%) |
| $100,000+ | 107 (15.5%) | 19 (3.7%) |
| Total | 689 (100.0%) | 519 (100.0%) |
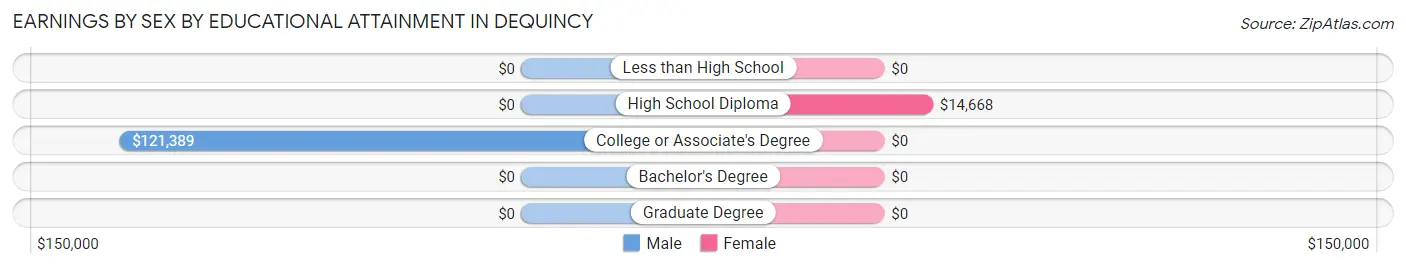
Earnings by Sex by Educational Attainment in Dequincy
Average earnings in Dequincy are $50,789 for men and $20,842 for women, a difference of 59.0%. Men with an educational attainment of college or associate's degree enjoy the highest average annual earnings of $121,389, while those with college or associate's degree education earn the least with $121,389. Women with an educational attainment of high school diploma earn the most with the average annual earnings of $14,668, while those with high school diploma education have the smallest earnings of $14,668.
| Educational Attainment | Male Income | Female Income |
| Less than High School | - | - |
| High School Diploma | - | - |
| College or Associate's Degree | $121,389 | $0 |
| Bachelor's Degree | - | - |
| Graduate Degree | - | - |
| Total | $50,789 | $20,842 |
Family Income in Dequincy
Family Income Brackets in Dequincy
According to the Dequincy family income data, there are 113 families falling into the $35,000 to $49,999 income range, which is the most common income bracket and makes up 19.2% of all families.
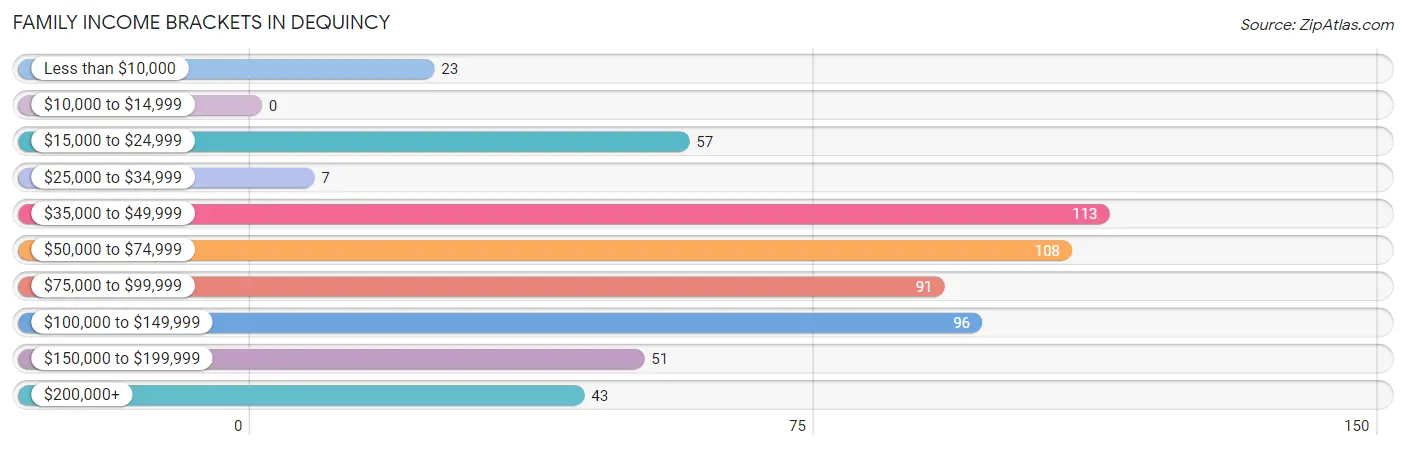
| Income Bracket | # Families | % Families |
| Less than $10,000 | 23 | 3.9% |
| $10,000 to $14,999 | 0 | 0.0% |
| $15,000 to $24,999 | 57 | 9.7% |
| $25,000 to $34,999 | 7 | 1.2% |
| $35,000 to $49,999 | 113 | 19.2% |
| $50,000 to $74,999 | 108 | 18.3% |
| $75,000 to $99,999 | 91 | 15.4% |
| $100,000 to $149,999 | 96 | 16.3% |
| $150,000 to $199,999 | 51 | 8.7% |
| $200,000+ | 43 | 7.3% |
Family Income by Famaliy Size in Dequincy
5-person families (110 | 18.7%) account for the highest median family income in Dequincy with $96,042 per family, while 2-person families (269 | 45.7%) have the highest median income of $33,038 per family member.
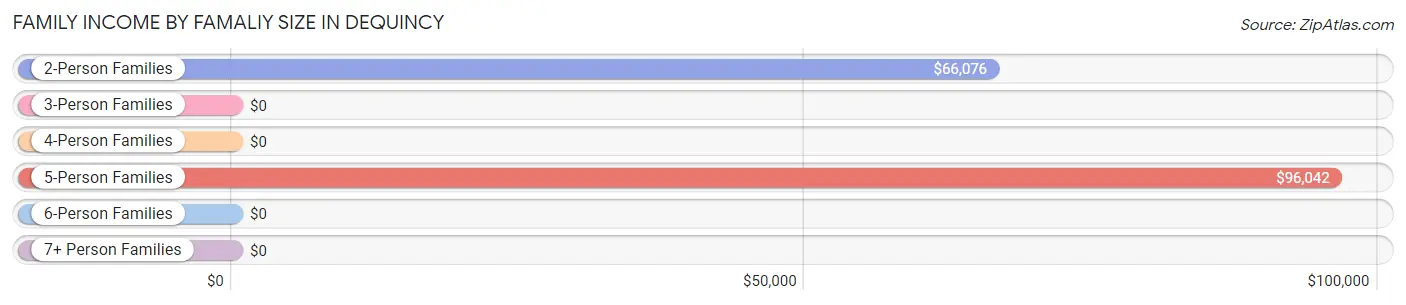
| Income Bracket | # Families | Median Income |
| 2-Person Families | 269 (45.7%) | $66,076 |
| 3-Person Families | 86 (14.6%) | $0 |
| 4-Person Families | 68 (11.5%) | $0 |
| 5-Person Families | 110 (18.7%) | $96,042 |
| 6-Person Families | 15 (2.5%) | $0 |
| 7+ Person Families | 41 (7.0%) | $0 |
| Total | 589 (100.0%) | $72,171 |
Family Income by Number of Earners in Dequincy
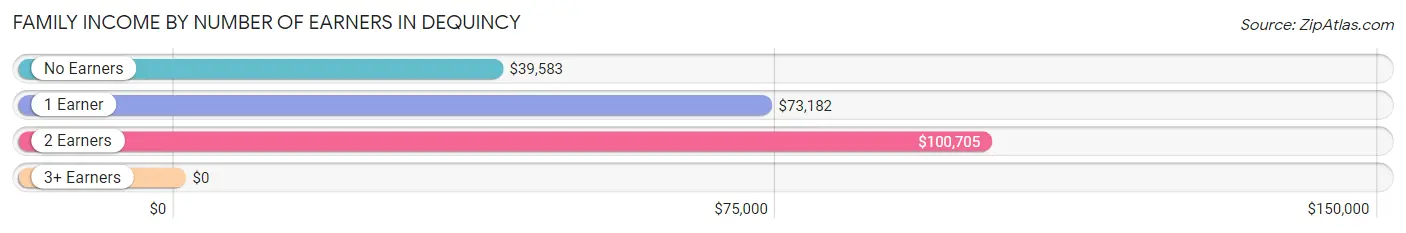
| Number of Earners | # Families | Median Income |
| No Earners | 93 (15.8%) | $39,583 |
| 1 Earner | 228 (38.7%) | $73,182 |
| 2 Earners | 244 (41.4%) | $100,705 |
| 3+ Earners | 24 (4.1%) | $0 |
| Total | 589 (100.0%) | $72,171 |
Household Income in Dequincy
Household Income Brackets in Dequincy
With 176 households falling in the category, the $75,000 to $99,999 income range is the most frequent in Dequincy, accounting for 19.2% of all households. In contrast, only 27 households (2.9%) fall into the $25,000 to $34,999 income bracket, making it the least populous group.
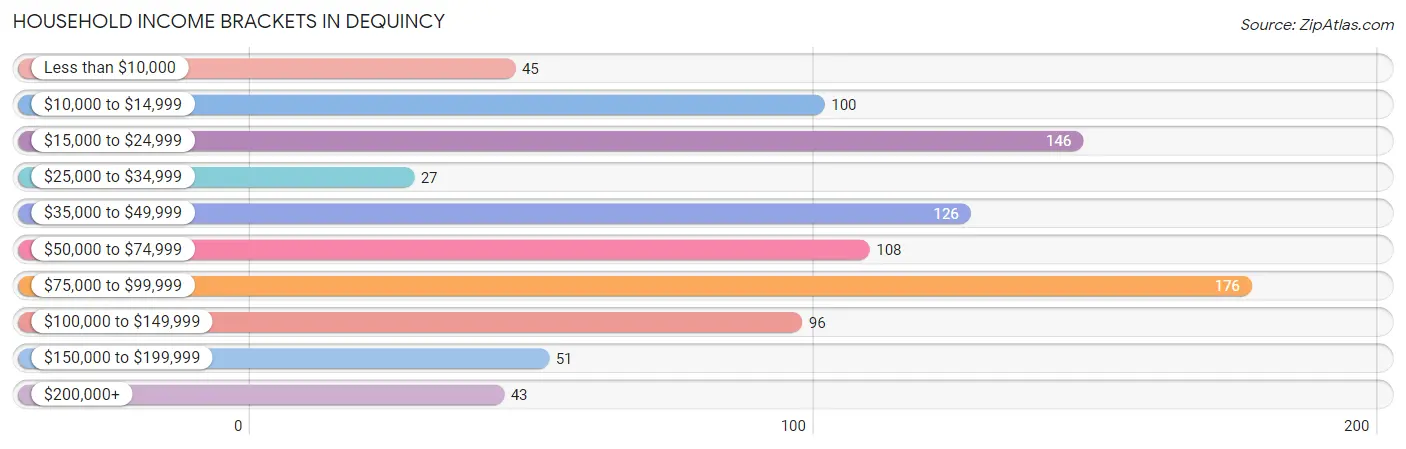
| Income Bracket | # Households | % Households |
| Less than $10,000 | 45 | 4.9% |
| $10,000 to $14,999 | 100 | 10.9% |
| $15,000 to $24,999 | 146 | 15.9% |
| $25,000 to $34,999 | 27 | 2.9% |
| $35,000 to $49,999 | 126 | 13.7% |
| $50,000 to $74,999 | 108 | 11.8% |
| $75,000 to $99,999 | 176 | 19.2% |
| $100,000 to $149,999 | 96 | 10.5% |
| $150,000 to $199,999 | 51 | 5.6% |
| $200,000+ | 43 | 4.7% |
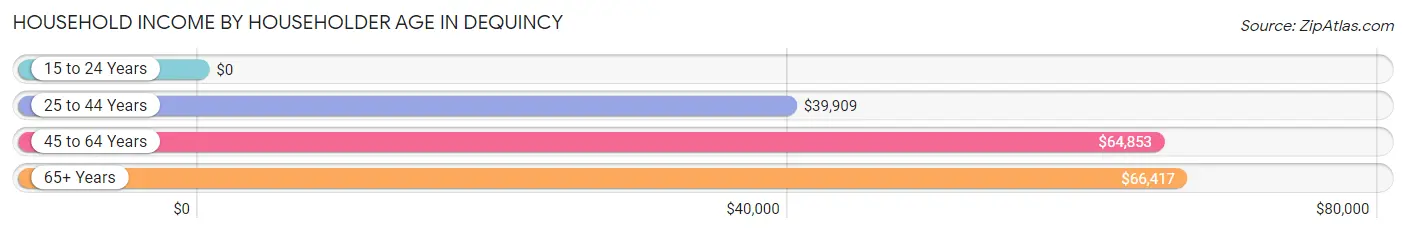
Household Income by Householder Age in Dequincy
The median household income in Dequincy is $51,500, with the highest median household income of $66,417 found in the 65+ years age bracket for the primary householder. A total of 411 households (44.8%) fall into this category.
| Income Bracket | # Households | Median Income |
| 15 to 24 Years | 0 (0.0%) | $0 |
| 25 to 44 Years | 165 (18.0%) | $39,909 |
| 45 to 64 Years | 342 (37.2%) | $64,853 |
| 65+ Years | 411 (44.8%) | $66,417 |
| Total | 918 (100.0%) | $51,500 |
Poverty in Dequincy
Income Below Poverty by Sex and Age in Dequincy
With 35.4% poverty level for males and 28.1% for females among the residents of Dequincy, 15 year old males and under 5 year old females are the most vulnerable to poverty, with 83 males (83.0%) and 99 females (100.0%) in their respective age groups living below the poverty level.
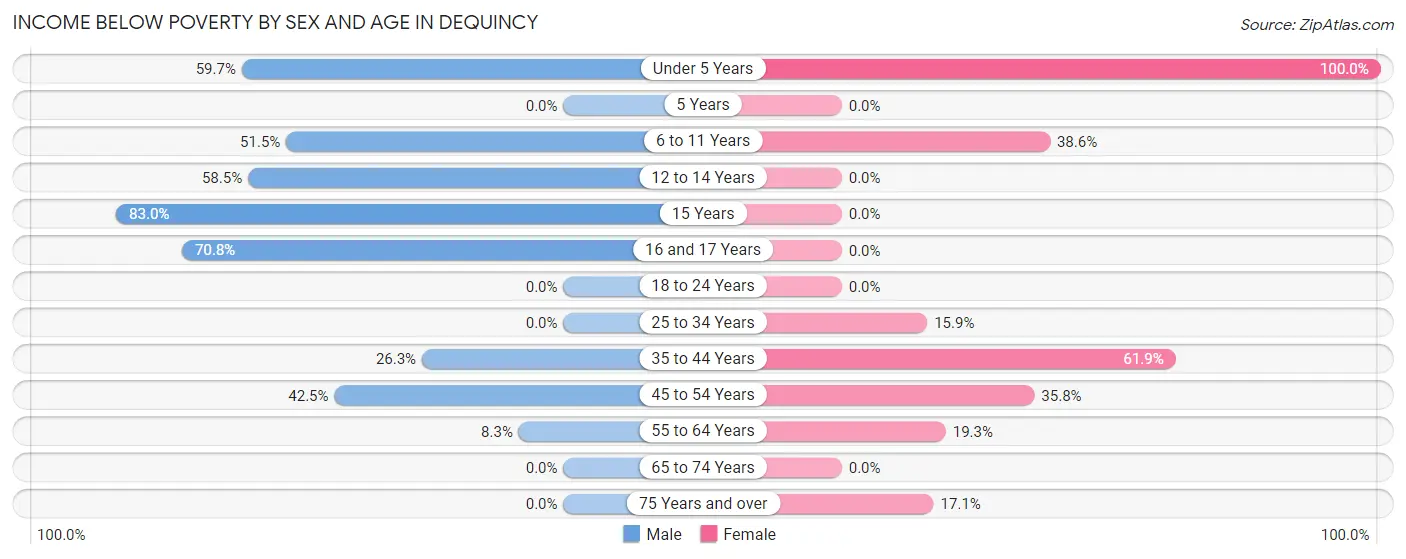
| Age Bracket | Male | Female |
| Under 5 Years | 157 (59.7%) | 99 (100.0%) |
| 5 Years | 0 (0.0%) | 0 (0.0%) |
| 6 to 11 Years | 71 (51.4%) | 51 (38.6%) |
| 12 to 14 Years | 72 (58.5%) | 0 (0.0%) |
| 15 Years | 83 (83.0%) | 0 (0.0%) |
| 16 and 17 Years | 63 (70.8%) | 0 (0.0%) |
| 18 to 24 Years | 0 (0.0%) | 0 (0.0%) |
| 25 to 34 Years | 0 (0.0%) | 23 (15.9%) |
| 35 to 44 Years | 84 (26.3%) | 83 (61.9%) |
| 45 to 54 Years | 51 (42.5%) | 64 (35.7%) |
| 55 to 64 Years | 14 (8.3%) | 22 (19.3%) |
| 65 to 74 Years | 0 (0.0%) | 0 (0.0%) |
| 75 Years and over | 0 (0.0%) | 22 (17.1%) |
| Total | 595 (35.4%) | 364 (28.1%) |
Income Above Poverty by Sex and Age in Dequincy
According to the poverty statistics in Dequincy, males aged 18 to 24 years and females aged 16 and 17 years are the age groups that are most secure financially, with 100.0% of males and 100.0% of females in these age groups living above the poverty line.
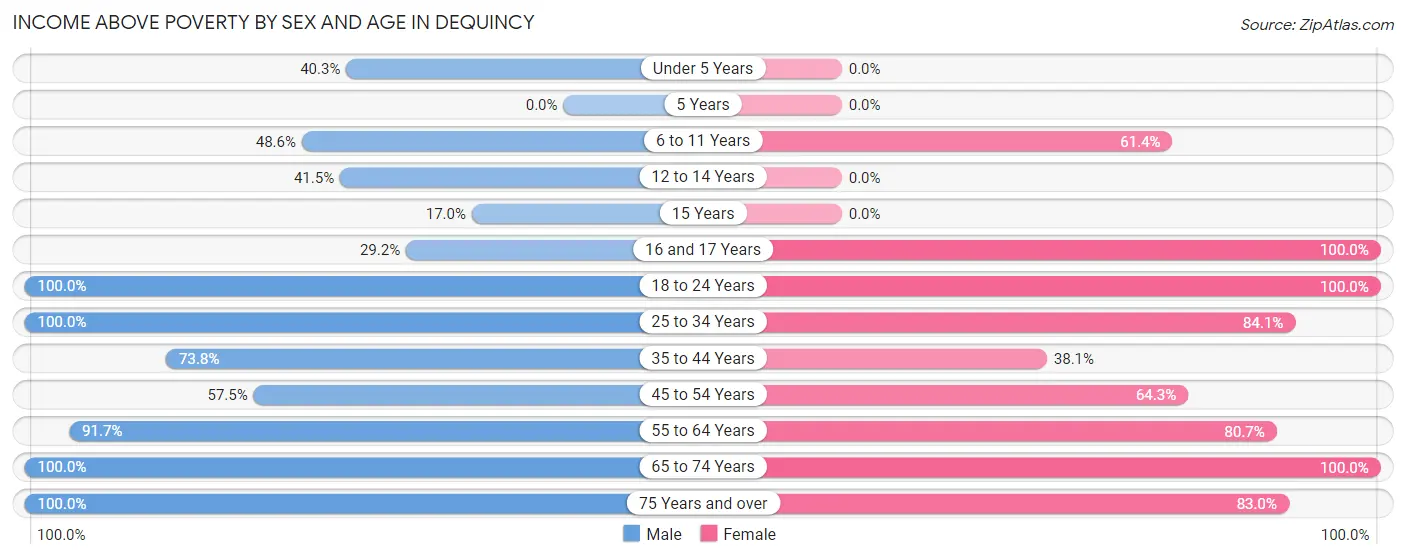
| Age Bracket | Male | Female |
| Under 5 Years | 106 (40.3%) | 0 (0.0%) |
| 5 Years | 0 (0.0%) | 0 (0.0%) |
| 6 to 11 Years | 67 (48.5%) | 81 (61.4%) |
| 12 to 14 Years | 51 (41.5%) | 0 (0.0%) |
| 15 Years | 17 (17.0%) | 0 (0.0%) |
| 16 and 17 Years | 26 (29.2%) | 58 (100.0%) |
| 18 to 24 Years | 179 (100.0%) | 22 (100.0%) |
| 25 to 34 Years | 63 (100.0%) | 122 (84.1%) |
| 35 to 44 Years | 236 (73.8%) | 51 (38.1%) |
| 45 to 54 Years | 69 (57.5%) | 115 (64.2%) |
| 55 to 64 Years | 155 (91.7%) | 92 (80.7%) |
| 65 to 74 Years | 100 (100.0%) | 281 (100.0%) |
| 75 Years and over | 15 (100.0%) | 107 (83.0%) |
| Total | 1,084 (64.6%) | 929 (71.9%) |
Income Below Poverty Among Married-Couple Families in Dequincy
The poverty statistics for married-couple families in Dequincy show that 6.1% or 20 of the total 330 families live below the poverty line. Families with 1 or 2 children have the highest poverty rate of 19.8%, comprising of 20 families. On the other hand, families with no children have the lowest poverty rate of 0.0%, which includes 0 families.
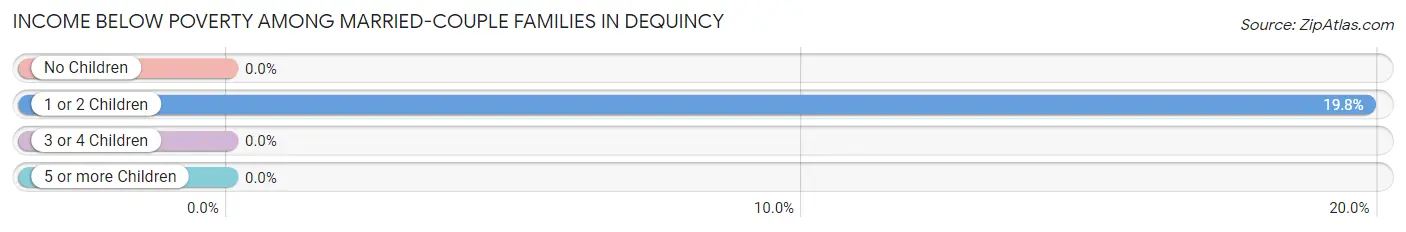
| Children | Above Poverty | Below Poverty |
| No Children | 190 (100.0%) | 0 (0.0%) |
| 1 or 2 Children | 81 (80.2%) | 20 (19.8%) |
| 3 or 4 Children | 39 (100.0%) | 0 (0.0%) |
| 5 or more Children | 0 (0.0%) | 0 (0.0%) |
| Total | 310 (93.9%) | 20 (6.1%) |
Income Below Poverty Among Single-Parent Households in Dequincy
According to the poverty data in Dequincy, 100.0% or 30 single-father households and 28.0% or 64 single-mother households are living below the poverty line. Among single-father households, those with 1 or 2 children have the highest poverty rate, with 30 households (100.0%) experiencing poverty. Likewise, among single-mother households, those with 5 or more children have the highest poverty rate, with 41 households (100.0%) falling below the poverty line.
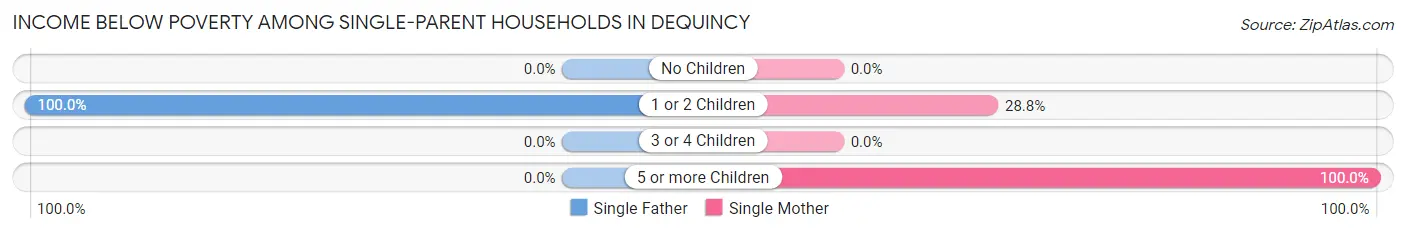
| Children | Single Father | Single Mother |
| No Children | 0 (0.0%) | 0 (0.0%) |
| 1 or 2 Children | 30 (100.0%) | 23 (28.7%) |
| 3 or 4 Children | 0 (0.0%) | 0 (0.0%) |
| 5 or more Children | 0 (0.0%) | 41 (100.0%) |
| Total | 30 (100.0%) | 64 (28.0%) |
Income Below Poverty Among Married-Couple vs Single-Parent Households in Dequincy
The poverty data for Dequincy shows that 20 of the married-couple family households (6.1%) and 94 of the single-parent households (36.3%) are living below the poverty level. Within the married-couple family households, those with 1 or 2 children have the highest poverty rate, with 20 households (19.8%) falling below the poverty line. Among the single-parent households, those with 5 or more children have the highest poverty rate, with 41 household (100.0%) living below poverty.
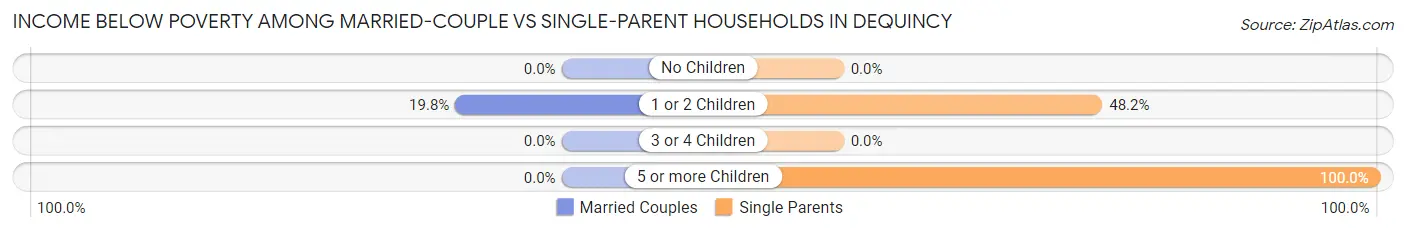
| Children | Married-Couple Families | Single-Parent Households |
| No Children | 0 (0.0%) | 0 (0.0%) |
| 1 or 2 Children | 20 (19.8%) | 53 (48.2%) |
| 3 or 4 Children | 0 (0.0%) | 0 (0.0%) |
| 5 or more Children | 0 (0.0%) | 41 (100.0%) |
| Total | 20 (6.1%) | 94 (36.3%) |
Race in Dequincy
The most populous races in Dequincy are White / Caucasian (2,493 | 81.5%), Black / African American (332 | 10.9%), and Two or more Races (233 | 7.6%).
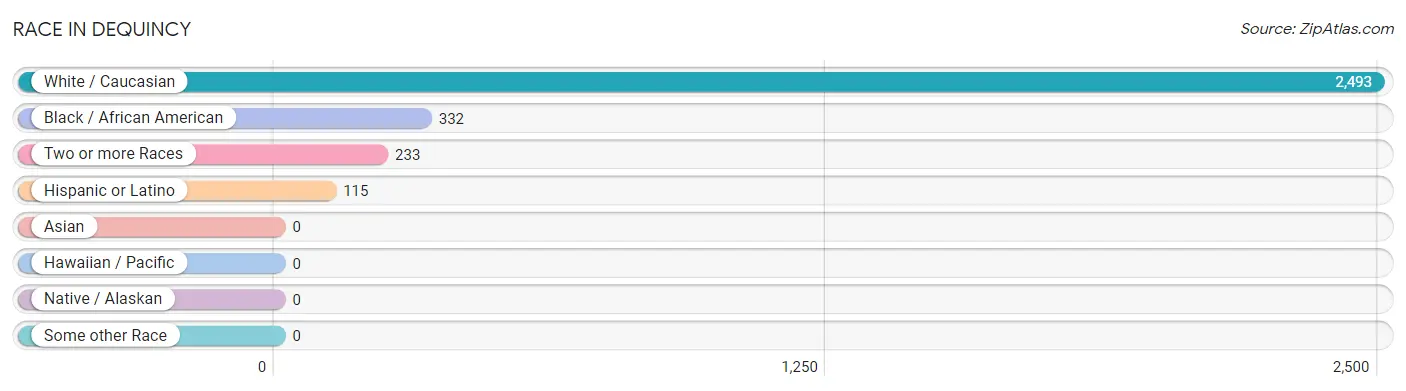
| Race | # Population | % Population |
| Asian | 0 | 0.0% |
| Black / African American | 332 | 10.9% |
| Hawaiian / Pacific | 0 | 0.0% |
| Hispanic or Latino | 115 | 3.8% |
| Native / Alaskan | 0 | 0.0% |
| White / Caucasian | 2,493 | 81.5% |
| Two or more Races | 233 | 7.6% |
| Some other Race | 0 | 0.0% |
| Total | 3,058 | 100.0% |
Ancestry in Dequincy
The most populous ancestries reported in Dequincy are French Canadian (327 | 10.7%), English (179 | 5.9%), American (167 | 5.5%), German (149 | 4.9%), and Irish (127 | 4.2%), together accounting for 31.0% of all Dequincy residents.
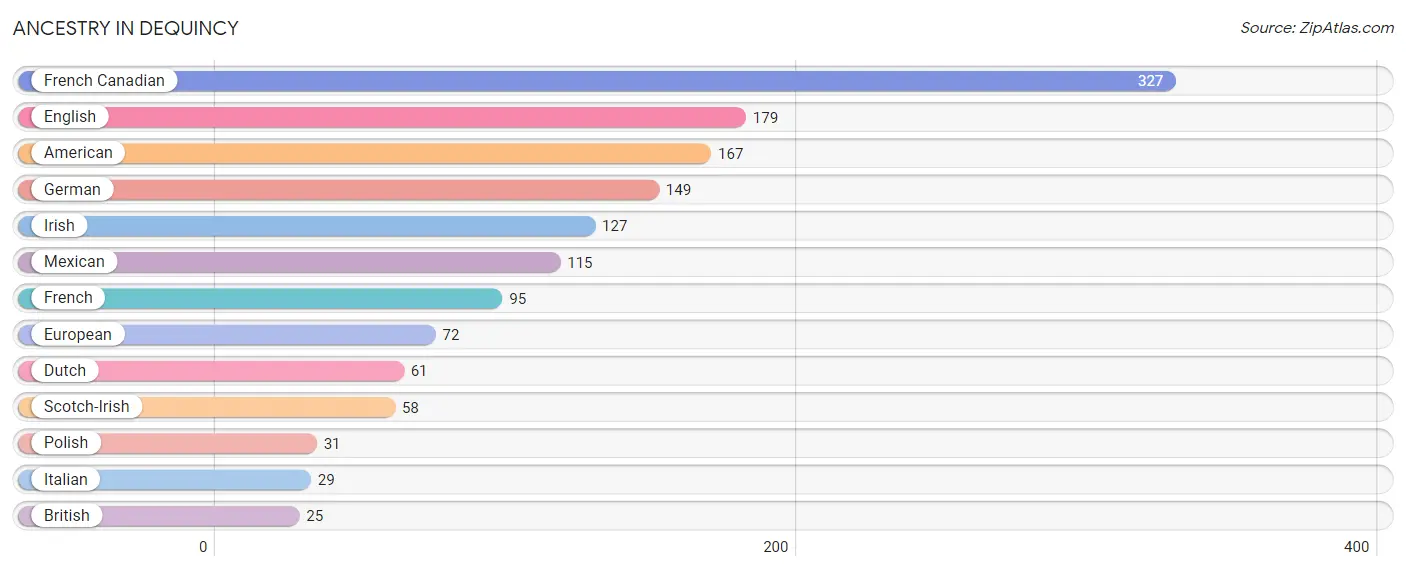
| Ancestry | # Population | % Population |
| American | 167 | 5.5% |
| British | 25 | 0.8% |
| Dutch | 61 | 2.0% |
| English | 179 | 5.9% |
| European | 72 | 2.4% |
| French | 95 | 3.1% |
| French Canadian | 327 | 10.7% |
| German | 149 | 4.9% |
| Irish | 127 | 4.2% |
| Italian | 29 | 0.9% |
| Mexican | 115 | 3.8% |
| Polish | 31 | 1.0% |
| Scotch-Irish | 58 | 1.9% | View All 13 Rows |
Immigrants in Dequincy
The most numerous immigrant groups reported in Dequincy came from , and Canada (7 | 0.2%), together accounting for 0.2% of all Dequincy residents.

| Immigration Origin | # Population | % Population |
| Canada | 7 | 0.2% | View All 1 Rows |
Sex and Age in Dequincy
Sex and Age in Dequincy
The most populous age groups in Dequincy are Under 5 Years (263 | 15.4%) for men and 65 to 69 Years (242 | 17.9%) for women.
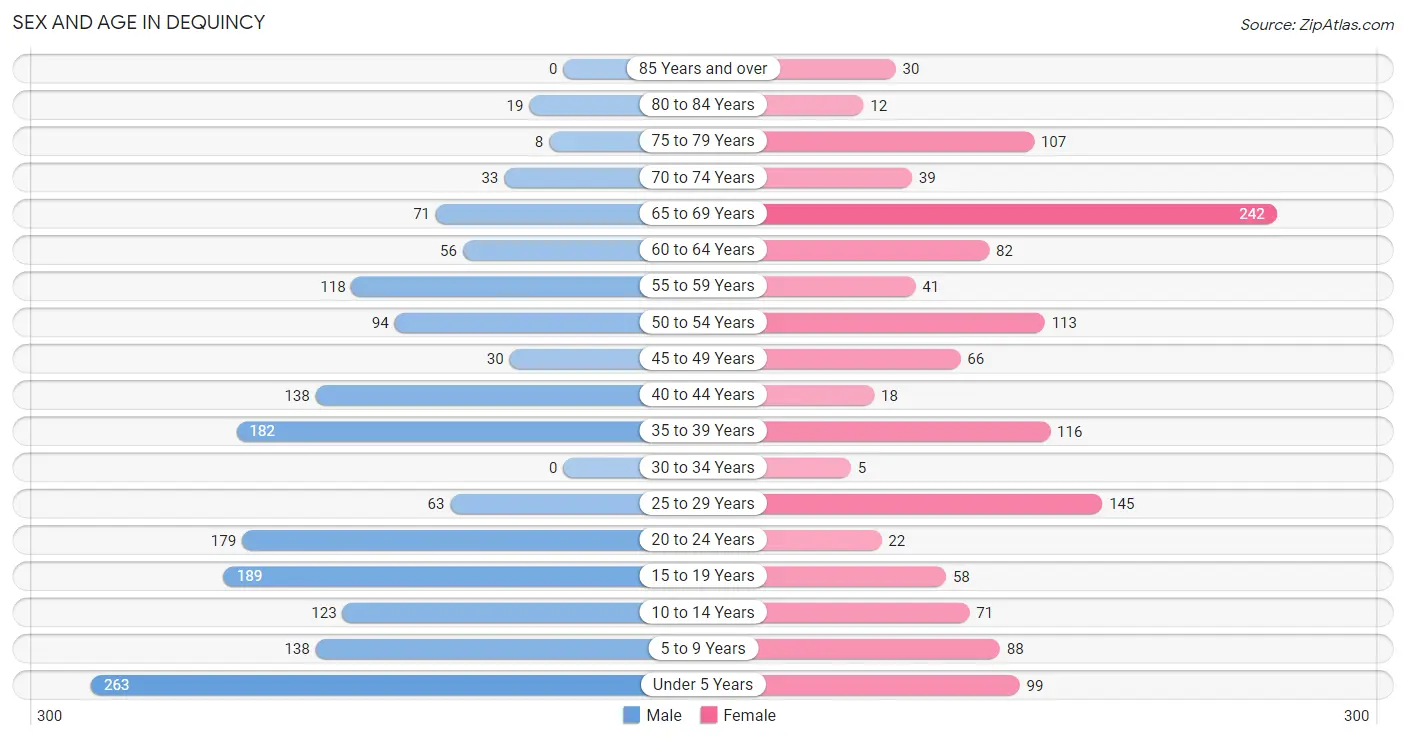
| Age Bracket | Male | Female |
| Under 5 Years | 263 (15.4%) | 99 (7.3%) |
| 5 to 9 Years | 138 (8.1%) | 88 (6.5%) |
| 10 to 14 Years | 123 (7.2%) | 71 (5.2%) |
| 15 to 19 Years | 189 (11.1%) | 58 (4.3%) |
| 20 to 24 Years | 179 (10.5%) | 22 (1.6%) |
| 25 to 29 Years | 63 (3.7%) | 145 (10.7%) |
| 30 to 34 Years | 0 (0.0%) | 5 (0.4%) |
| 35 to 39 Years | 182 (10.7%) | 116 (8.6%) |
| 40 to 44 Years | 138 (8.1%) | 18 (1.3%) |
| 45 to 49 Years | 30 (1.8%) | 66 (4.9%) |
| 50 to 54 Years | 94 (5.5%) | 113 (8.4%) |
| 55 to 59 Years | 118 (6.9%) | 41 (3.0%) |
| 60 to 64 Years | 56 (3.3%) | 82 (6.1%) |
| 65 to 69 Years | 71 (4.2%) | 242 (17.9%) |
| 70 to 74 Years | 33 (1.9%) | 39 (2.9%) |
| 75 to 79 Years | 8 (0.5%) | 107 (7.9%) |
| 80 to 84 Years | 19 (1.1%) | 12 (0.9%) |
| 85 Years and over | 0 (0.0%) | 30 (2.2%) |
| Total | 1,704 (100.0%) | 1,354 (100.0%) |
Families and Households in Dequincy
Median Family Size in Dequincy
The median family size in Dequincy is 4.44 persons per family, with single female/mother families (229 | 38.9%) accounting for the largest median family size of 6.14 persons per family. On the other hand, single male/father families (30 | 5.1%) represent the smallest median family size with 1.90 persons per family.
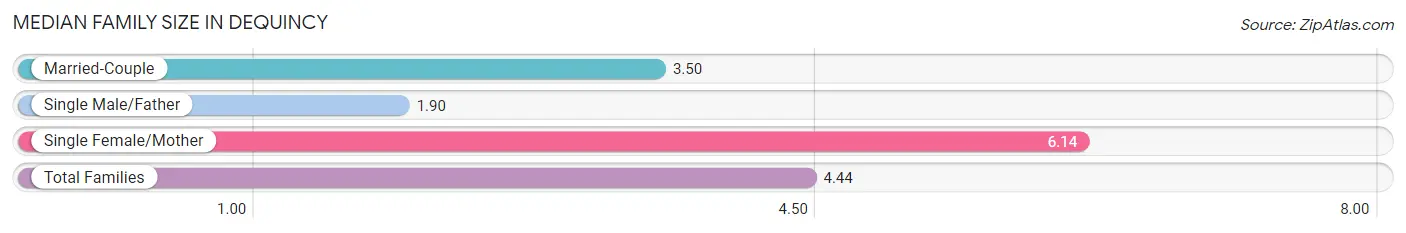
| Family Type | # Families | Family Size |
| Married-Couple | 330 (56.0%) | 3.50 |
| Single Male/Father | 30 (5.1%) | 1.90 |
| Single Female/Mother | 229 (38.9%) | 6.14 |
| Total Families | 589 (100.0%) | 4.44 |
Median Household Size in Dequincy
The median household size in Dequincy is 3.27 persons per household, with single female/mother households (229 | 24.9%) accounting for the largest median household size of 6.14 persons per household. non-family households (329 | 35.8%) represent the smallest median household size with 1.01 persons per household.
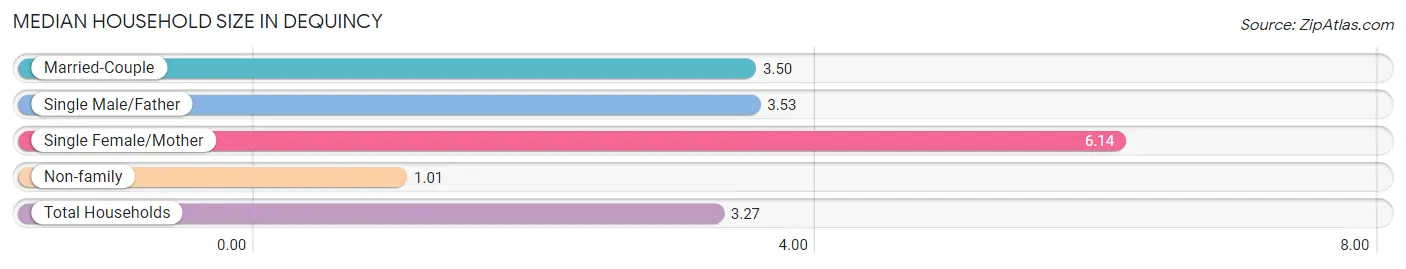
| Household Type | # Households | Household Size |
| Married-Couple | 330 (35.9%) | 3.50 |
| Single Male/Father | 30 (3.3%) | 3.53 |
| Single Female/Mother | 229 (24.9%) | 6.14 |
| Non-family | 329 (35.8%) | 1.01 |
| Total Households | 918 (100.0%) | 3.27 |
Household Size by Marriage Status in Dequincy
Out of a total of 918 households in Dequincy, 589 (64.2%) are family households, while 329 (35.8%) are nonfamily households. The most numerous type of family households are 2-person households, comprising 239, and the most common type of nonfamily households are 1-person households, comprising 320.
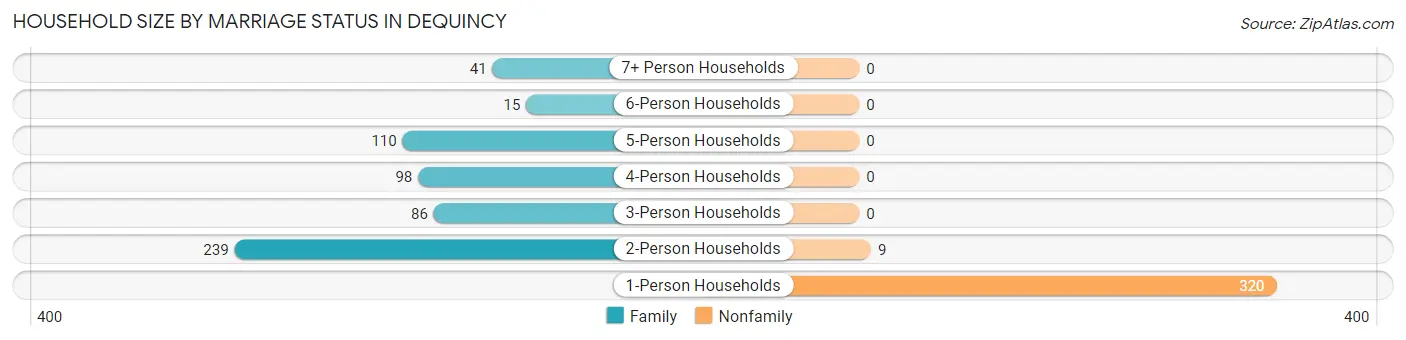
| Household Size | Family Households | Nonfamily Households |
| 1-Person Households | - | 320 (34.9%) |
| 2-Person Households | 239 (26.0%) | 9 (1.0%) |
| 3-Person Households | 86 (9.4%) | 0 (0.0%) |
| 4-Person Households | 98 (10.7%) | 0 (0.0%) |
| 5-Person Households | 110 (12.0%) | 0 (0.0%) |
| 6-Person Households | 15 (1.6%) | 0 (0.0%) |
| 7+ Person Households | 41 (4.5%) | 0 (0.0%) |
| Total | 589 (64.2%) | 329 (35.8%) |
Female Fertility in Dequincy
Fertility by Age in Dequincy
Average fertility rate in Dequincy is 156.0 births per 1,000 women. Women in the age bracket of 20 to 34 years have the highest fertility rate with 209.0 births per 1,000 women. Women in the age bracket of 35 to 50 years acount for 53.2% of all women with births.
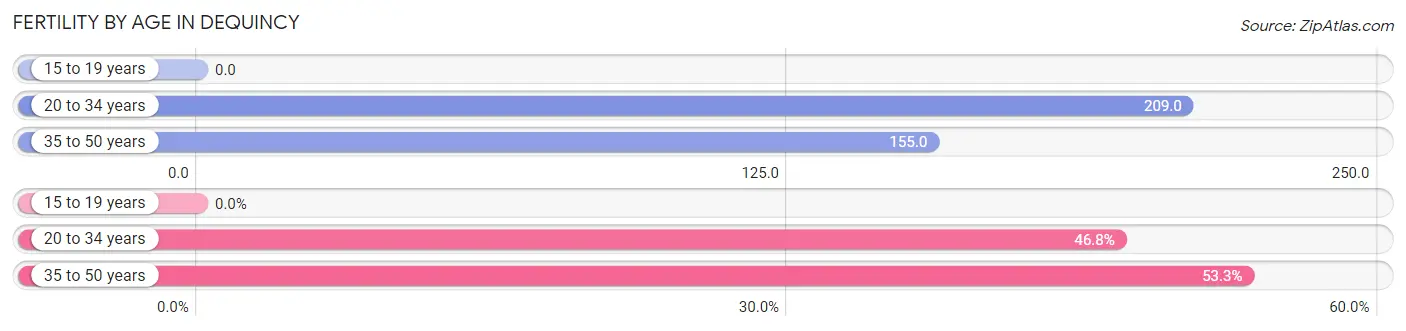
| Age Bracket | Women with Births | Births / 1,000 Women |
| 15 to 19 years | 0 (0.0%) | 0.0 |
| 20 to 34 years | 36 (46.8%) | 209.0 |
| 35 to 50 years | 41 (53.2%) | 155.0 |
| Total | 77 (100.0%) | 156.0 |
Fertility by Age by Marriage Status in Dequincy
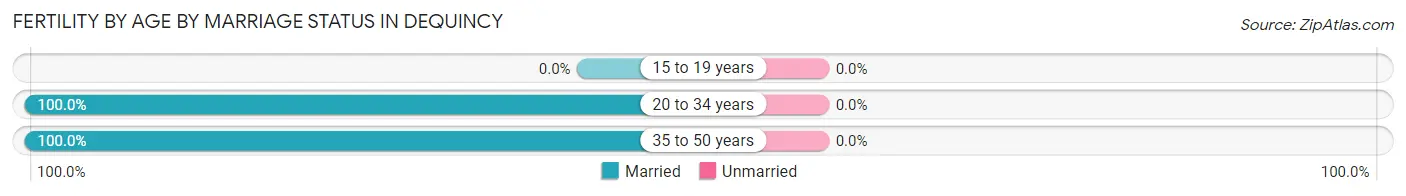
| Age Bracket | Married | Unmarried |
| 15 to 19 years | 0 (0.0%) | 0 (0.0%) |
| 20 to 34 years | 36 (100.0%) | 0 (0.0%) |
| 35 to 50 years | 41 (100.0%) | 0 (0.0%) |
| Total | 77 (100.0%) | 0 (0.0%) |
Fertility by Education in Dequincy
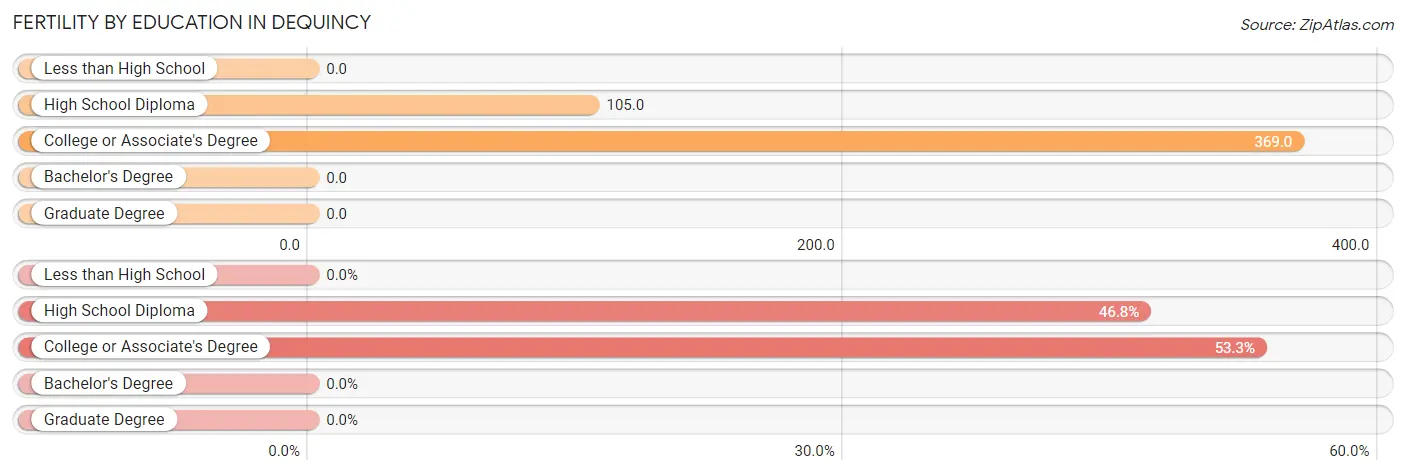
| Educational Attainment | Women with Births | Births / 1,000 Women |
| Less than High School | 0 (0.0%) | 0.0 |
| High School Diploma | 36 (46.8%) | 105.0 |
| College or Associate's Degree | 41 (53.2%) | 369.0 |
| Bachelor's Degree | 0 (0.0%) | 0.0 |
| Graduate Degree | 0 (0.0%) | 0.0 |
| Total | 77 (100.0%) | 156.0 |
Fertility by Education by Marriage Status in Dequincy
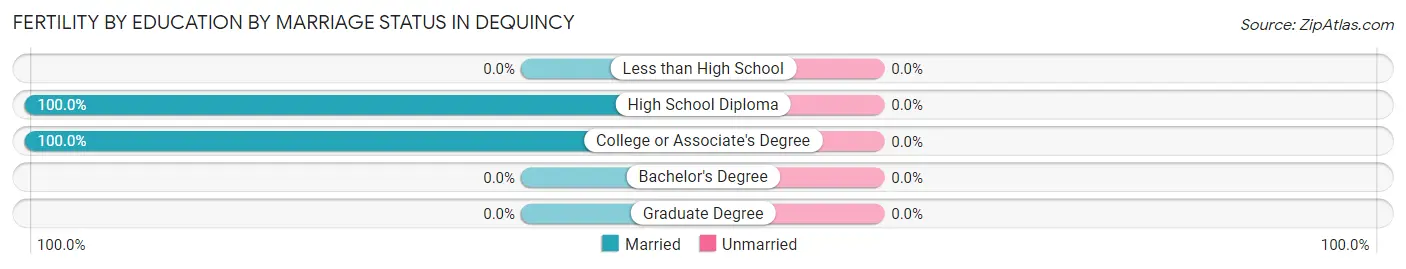
| Educational Attainment | Married | Unmarried |
| Less than High School | 0 (0.0%) | 0 (0.0%) |
| High School Diploma | 36 (100.0%) | 0 (0.0%) |
| College or Associate's Degree | 41 (100.0%) | 0 (0.0%) |
| Bachelor's Degree | 0 (0.0%) | 0 (0.0%) |
| Graduate Degree | 0 (0.0%) | 0 (0.0%) |
| Total | 77 (100.0%) | 0 (0.0%) |
Employment Characteristics in Dequincy
Employment by Class of Employer in Dequincy
Among the 1,093 employed individuals in Dequincy, private company employees (829 | 75.8%), not-for-profit organizations (160 | 14.6%), and local government employees (67 | 6.1%) make up the most common classes of employment.
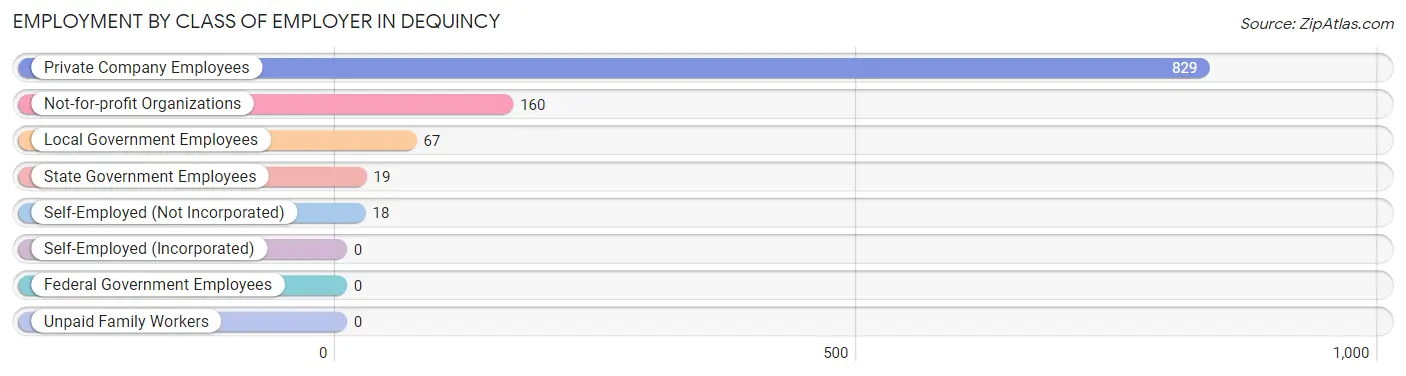
| Employer Class | # Employees | % Employees |
| Private Company Employees | 829 | 75.8% |
| Self-Employed (Incorporated) | 0 | 0.0% |
| Self-Employed (Not Incorporated) | 18 | 1.7% |
| Not-for-profit Organizations | 160 | 14.6% |
| Local Government Employees | 67 | 6.1% |
| State Government Employees | 19 | 1.7% |
| Federal Government Employees | 0 | 0.0% |
| Unpaid Family Workers | 0 | 0.0% |
| Total | 1,093 | 100.0% |
Employment Status by Age in Dequincy
According to the labor force statistics for Dequincy, out of the total population over 16 years of age (2,176), 50.8% or 1,105 individuals are in the labor force, with 1.2% or 13 of them unemployed. The age group with the highest labor force participation rate is 55 to 59 years, with 86.2% or 137 individuals in the labor force. Within the labor force, the 25 to 29 years age range has the highest percentage of unemployed individuals, with 7.6% or 13 of them being unemployed.
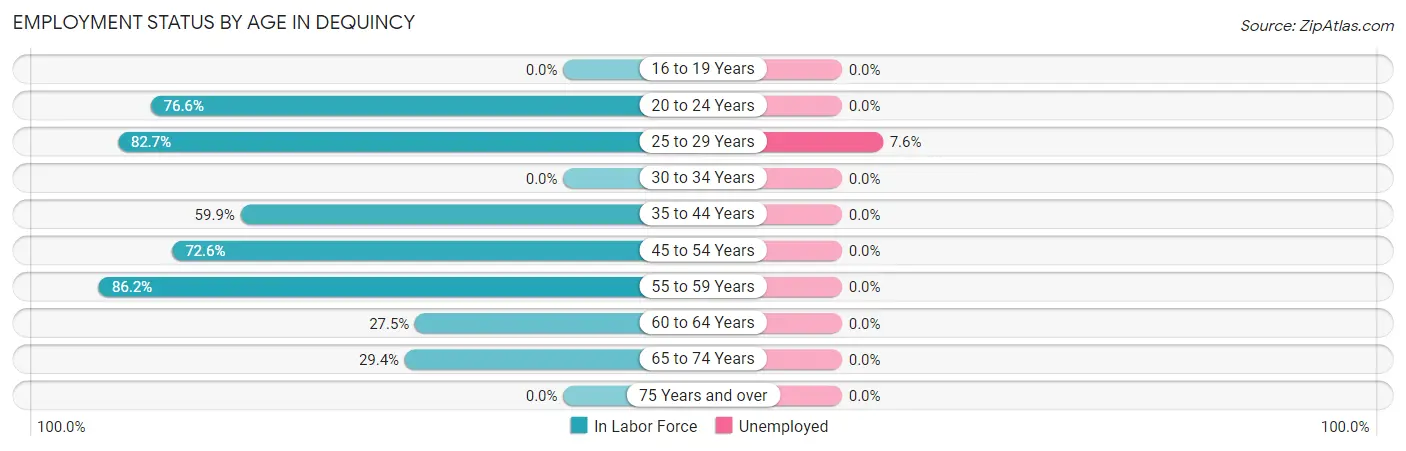
| Age Bracket | In Labor Force | Unemployed |
| 16 to 19 Years | 0 (0.0%) | 0 (0.0%) |
| 20 to 24 Years | 154 (76.6%) | 0 (0.0%) |
| 25 to 29 Years | 172 (82.7%) | 13 (7.6%) |
| 30 to 34 Years | 0 (0.0%) | 0 (0.0%) |
| 35 to 44 Years | 272 (59.9%) | 0 (0.0%) |
| 45 to 54 Years | 220 (72.6%) | 0 (0.0%) |
| 55 to 59 Years | 137 (86.2%) | 0 (0.0%) |
| 60 to 64 Years | 38 (27.5%) | 0 (0.0%) |
| 65 to 74 Years | 113 (29.4%) | 0 (0.0%) |
| 75 Years and over | 0 (0.0%) | 0 (0.0%) |
| Total | 1,105 (50.8%) | 13 (1.2%) |
Employment Status by Educational Attainment in Dequincy
According to labor force statistics for Dequincy, 66.2% of individuals (839) out of the total population between 25 and 64 years of age (1,267) are in the labor force, with 1.5% or 13 of them being unemployed. The group with the highest labor force participation rate are those with the educational attainment of bachelor's degree or higher, with 84.1% or 132 individuals in the labor force. Within the labor force, individuals with college / associate degree education have the highest percentage of unemployment, with 6.5% or 13 of them being unemployed.
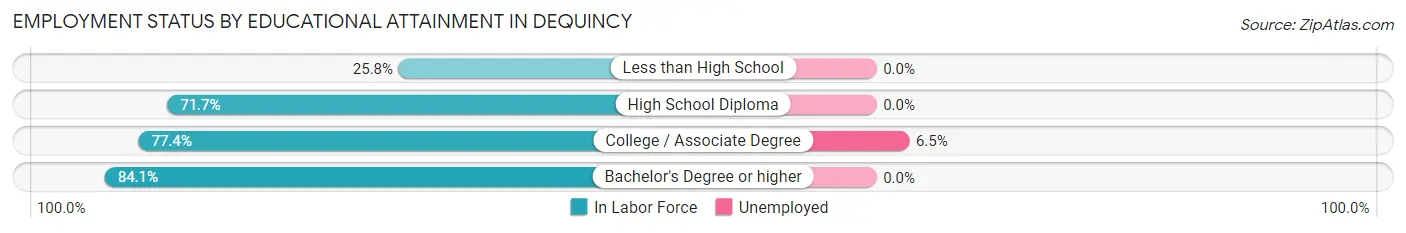
| Educational Attainment | In Labor Force | Unemployed |
| Less than High School | 58 (25.8%) | 0 (0.0%) |
| High School Diploma | 450 (71.7%) | 0 (0.0%) |
| College / Associate Degree | 199 (77.4%) | 17 (6.5%) |
| Bachelor's Degree or higher | 132 (84.1%) | 0 (0.0%) |
| Total | 839 (66.2%) | 19 (1.5%) |
Employment Occupations by Sex in Dequincy
Management, Business, Science and Arts Occupations
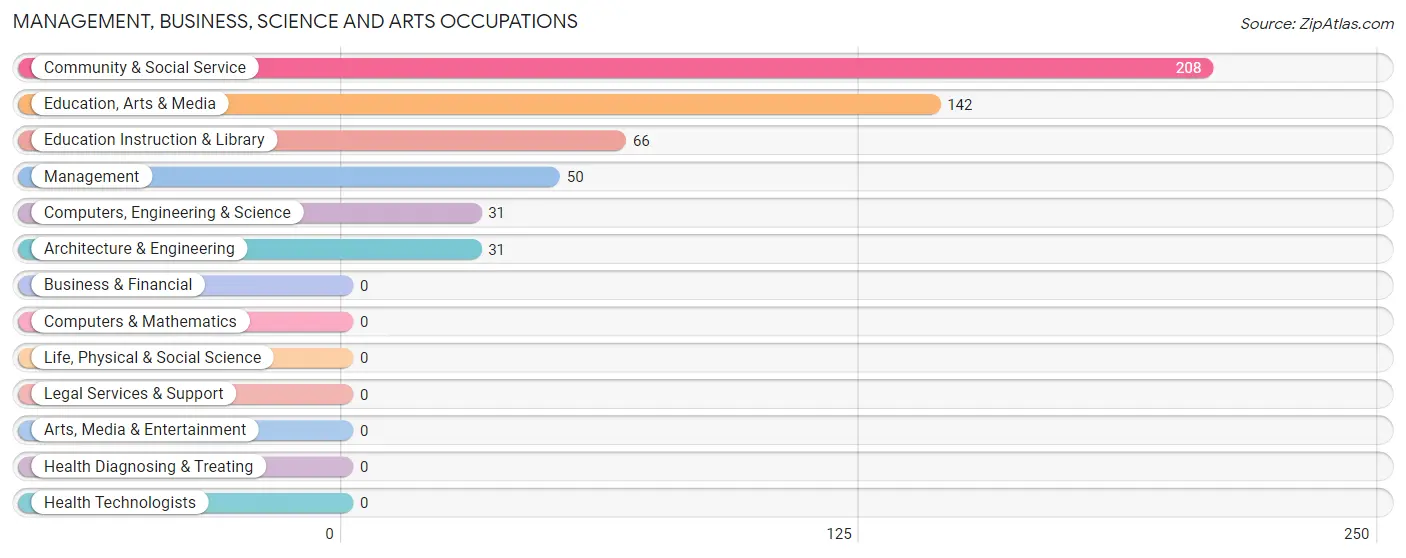
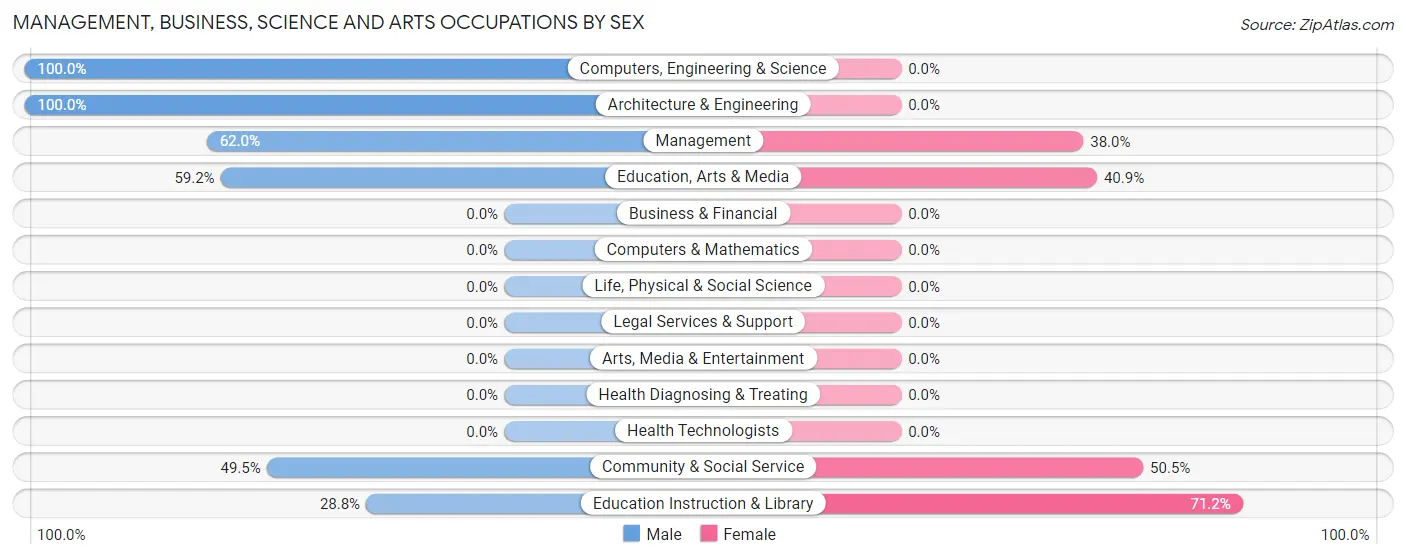
The most common Management, Business, Science and Arts occupations in Dequincy are Community & Social Service (208 | 19.0%), Education, Arts & Media (142 | 13.0%), Education Instruction & Library (66 | 6.0%), Management (50 | 4.6%), and Computers, Engineering & Science (31 | 2.8%).
Management, Business, Science and Arts Occupations by Sex
Within the Management, Business, Science and Arts occupations in Dequincy, the most male-oriented occupations are Computers, Engineering & Science (100.0%), Architecture & Engineering (100.0%), and Management (62.0%), while the most female-oriented occupations are Education Instruction & Library (71.2%), Community & Social Service (50.5%), and Education, Arts & Media (40.8%).
| Occupation | Male | Female |
| Management | 31 (62.0%) | 19 (38.0%) |
| Business & Financial | 0 (0.0%) | 0 (0.0%) |
| Computers, Engineering & Science | 31 (100.0%) | 0 (0.0%) |
| Computers & Mathematics | 0 (0.0%) | 0 (0.0%) |
| Architecture & Engineering | 31 (100.0%) | 0 (0.0%) |
| Life, Physical & Social Science | 0 (0.0%) | 0 (0.0%) |
| Community & Social Service | 103 (49.5%) | 105 (50.5%) |
| Education, Arts & Media | 84 (59.2%) | 58 (40.8%) |
| Legal Services & Support | 0 (0.0%) | 0 (0.0%) |
| Education Instruction & Library | 19 (28.8%) | 47 (71.2%) |
| Arts, Media & Entertainment | 0 (0.0%) | 0 (0.0%) |
| Health Diagnosing & Treating | 0 (0.0%) | 0 (0.0%) |
| Health Technologists | 0 (0.0%) | 0 (0.0%) |
| Total (Category) | 165 (57.1%) | 124 (42.9%) |
| Total (Overall) | 671 (61.4%) | 422 (38.6%) |
Services Occupations
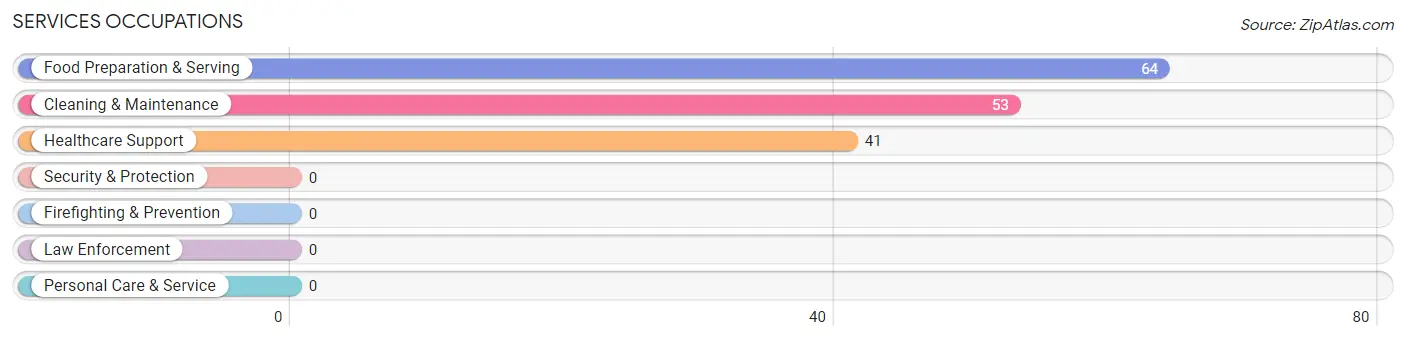
The most common Services occupations in Dequincy are Food Preparation & Serving (64 | 5.9%), Cleaning & Maintenance (53 | 4.9%), and Healthcare Support (41 | 3.7%).
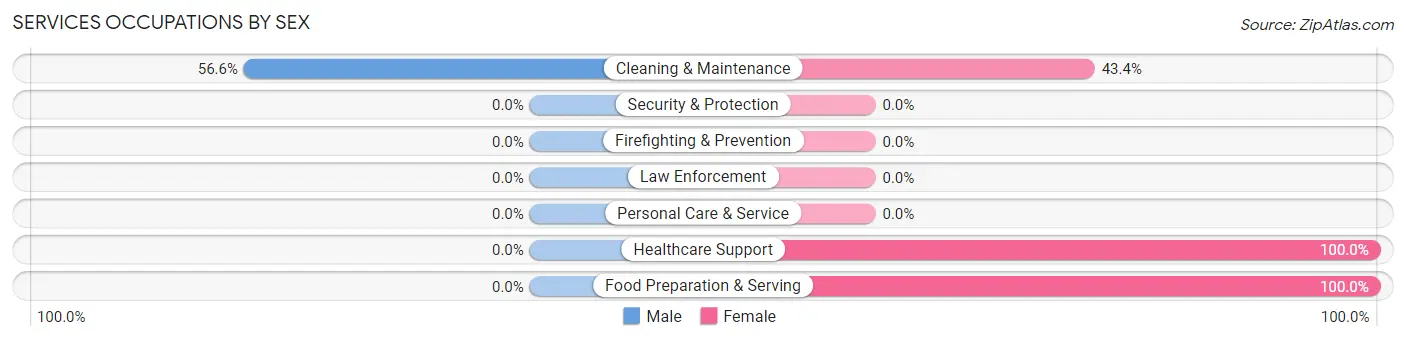
Services Occupations by Sex
| Occupation | Male | Female |
| Healthcare Support | 0 (0.0%) | 41 (100.0%) |
| Security & Protection | 0 (0.0%) | 0 (0.0%) |
| Firefighting & Prevention | 0 (0.0%) | 0 (0.0%) |
| Law Enforcement | 0 (0.0%) | 0 (0.0%) |
| Food Preparation & Serving | 0 (0.0%) | 64 (100.0%) |
| Cleaning & Maintenance | 30 (56.6%) | 23 (43.4%) |
| Personal Care & Service | 0 (0.0%) | 0 (0.0%) |
| Total (Category) | 30 (19.0%) | 128 (81.0%) |
| Total (Overall) | 671 (61.4%) | 422 (38.6%) |
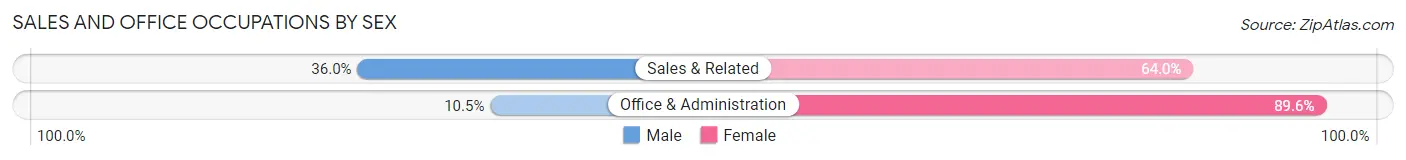
Sales and Office Occupations
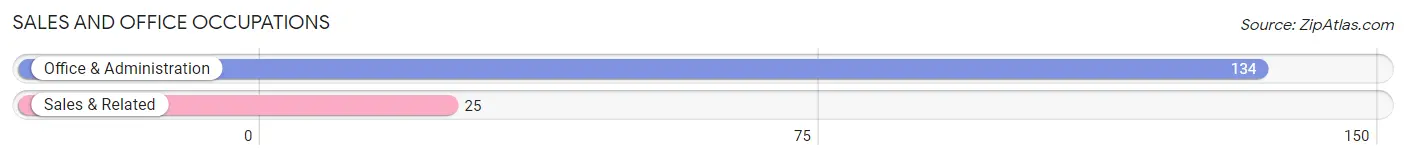
The most common Sales and Office occupations in Dequincy are Office & Administration (134 | 12.3%), and Sales & Related (25 | 2.3%).
Sales and Office Occupations by Sex
| Occupation | Male | Female |
| Sales & Related | 9 (36.0%) | 16 (64.0%) |
| Office & Administration | 14 (10.4%) | 120 (89.5%) |
| Total (Category) | 23 (14.5%) | 136 (85.5%) |
| Total (Overall) | 671 (61.4%) | 422 (38.6%) |
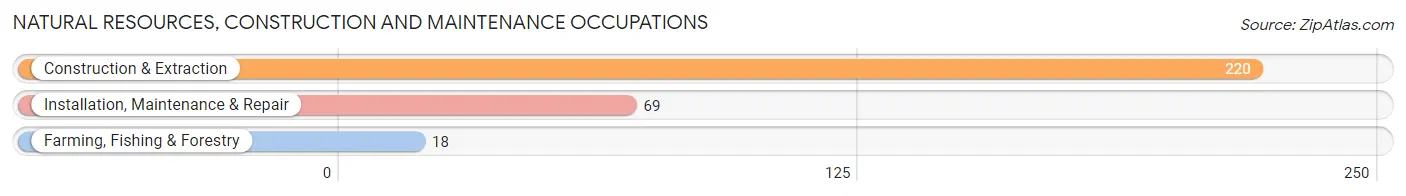
Natural Resources, Construction and Maintenance Occupations
The most common Natural Resources, Construction and Maintenance occupations in Dequincy are Construction & Extraction (220 | 20.1%), Installation, Maintenance & Repair (69 | 6.3%), and Farming, Fishing & Forestry (18 | 1.7%).
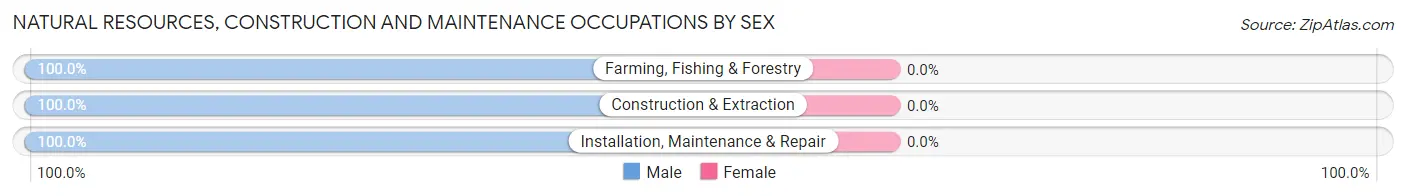
Natural Resources, Construction and Maintenance Occupations by Sex
| Occupation | Male | Female |
| Farming, Fishing & Forestry | 18 (100.0%) | 0 (0.0%) |
| Construction & Extraction | 220 (100.0%) | 0 (0.0%) |
| Installation, Maintenance & Repair | 69 (100.0%) | 0 (0.0%) |
| Total (Category) | 307 (100.0%) | 0 (0.0%) |
| Total (Overall) | 671 (61.4%) | 422 (38.6%) |
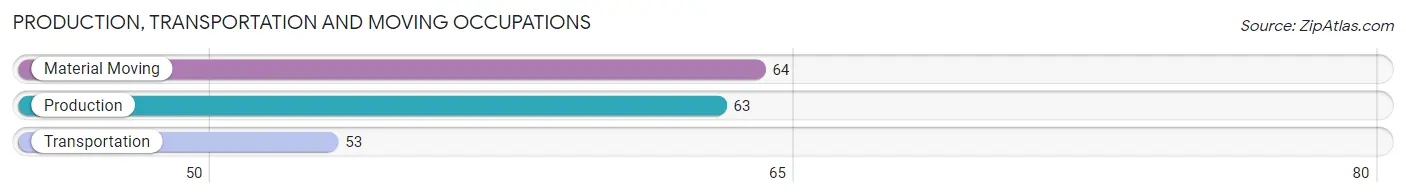
Production, Transportation and Moving Occupations
The most common Production, Transportation and Moving occupations in Dequincy are Material Moving (64 | 5.9%), Production (63 | 5.8%), and Transportation (53 | 4.9%).
Production, Transportation and Moving Occupations by Sex
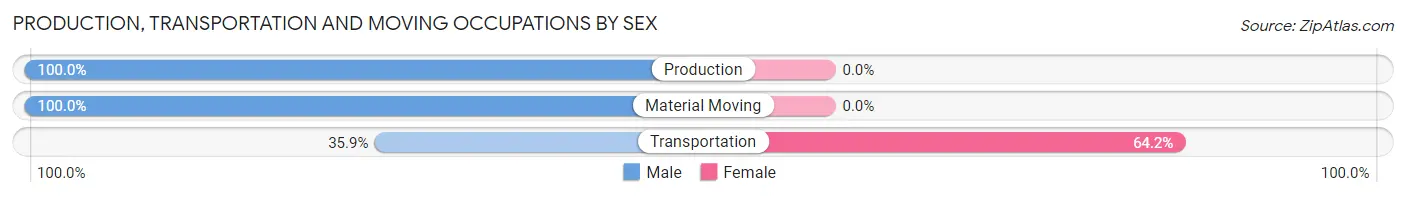
| Occupation | Male | Female |
| Production | 63 (100.0%) | 0 (0.0%) |
| Transportation | 19 (35.8%) | 34 (64.1%) |
| Material Moving | 64 (100.0%) | 0 (0.0%) |
| Total (Category) | 146 (81.1%) | 34 (18.9%) |
| Total (Overall) | 671 (61.4%) | 422 (38.6%) |
Employment Industries by Sex in Dequincy
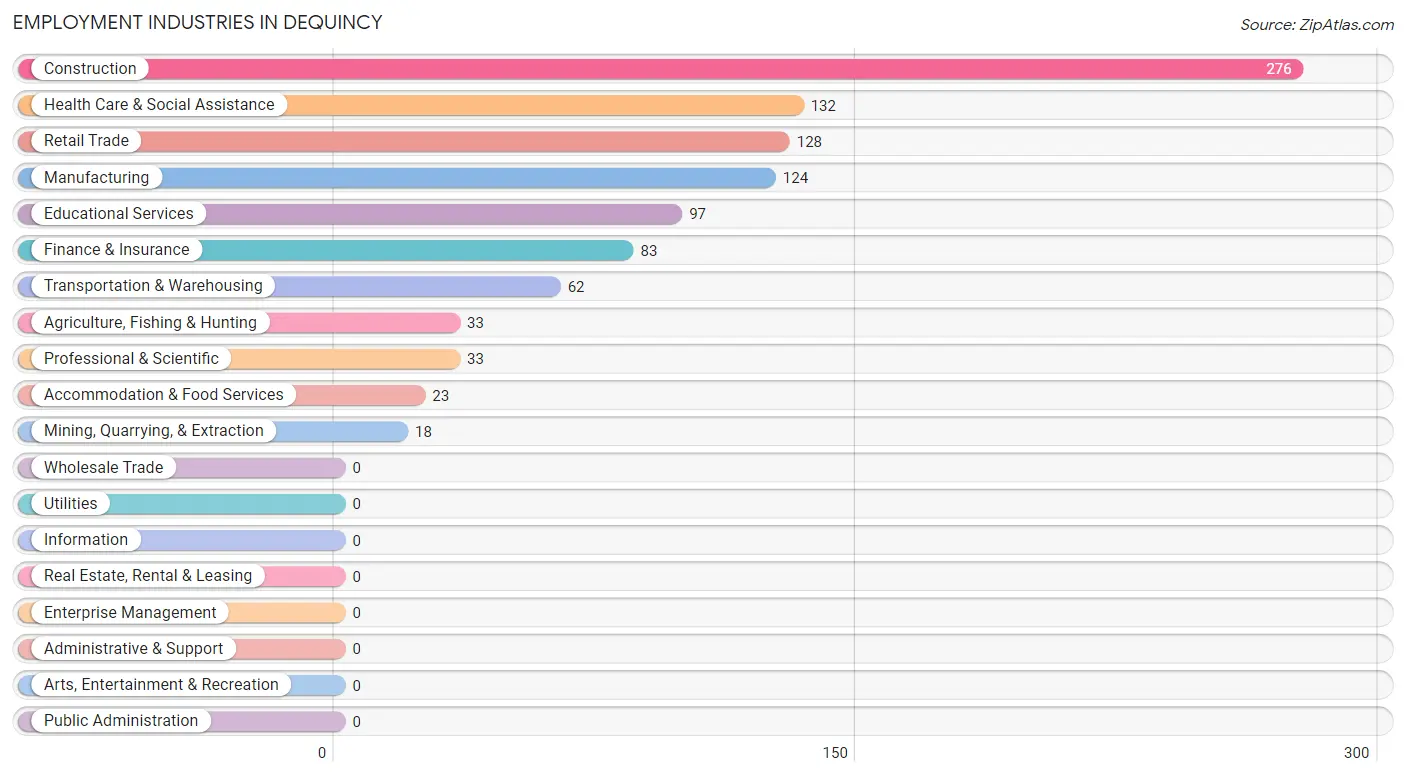
Employment Industries in Dequincy
The major employment industries in Dequincy include Construction (276 | 25.3%), Health Care & Social Assistance (132 | 12.1%), Retail Trade (128 | 11.7%), Manufacturing (124 | 11.3%), and Educational Services (97 | 8.9%).
Employment Industries by Sex in Dequincy
The Dequincy industries that see more men than women are Agriculture, Fishing & Hunting (100.0%), Construction (100.0%), and Transportation & Warehousing (100.0%), whereas the industries that tend to have a higher number of women are Mining, Quarrying, & Extraction (100.0%), Finance & Insurance (100.0%), and Health Care & Social Assistance (100.0%).
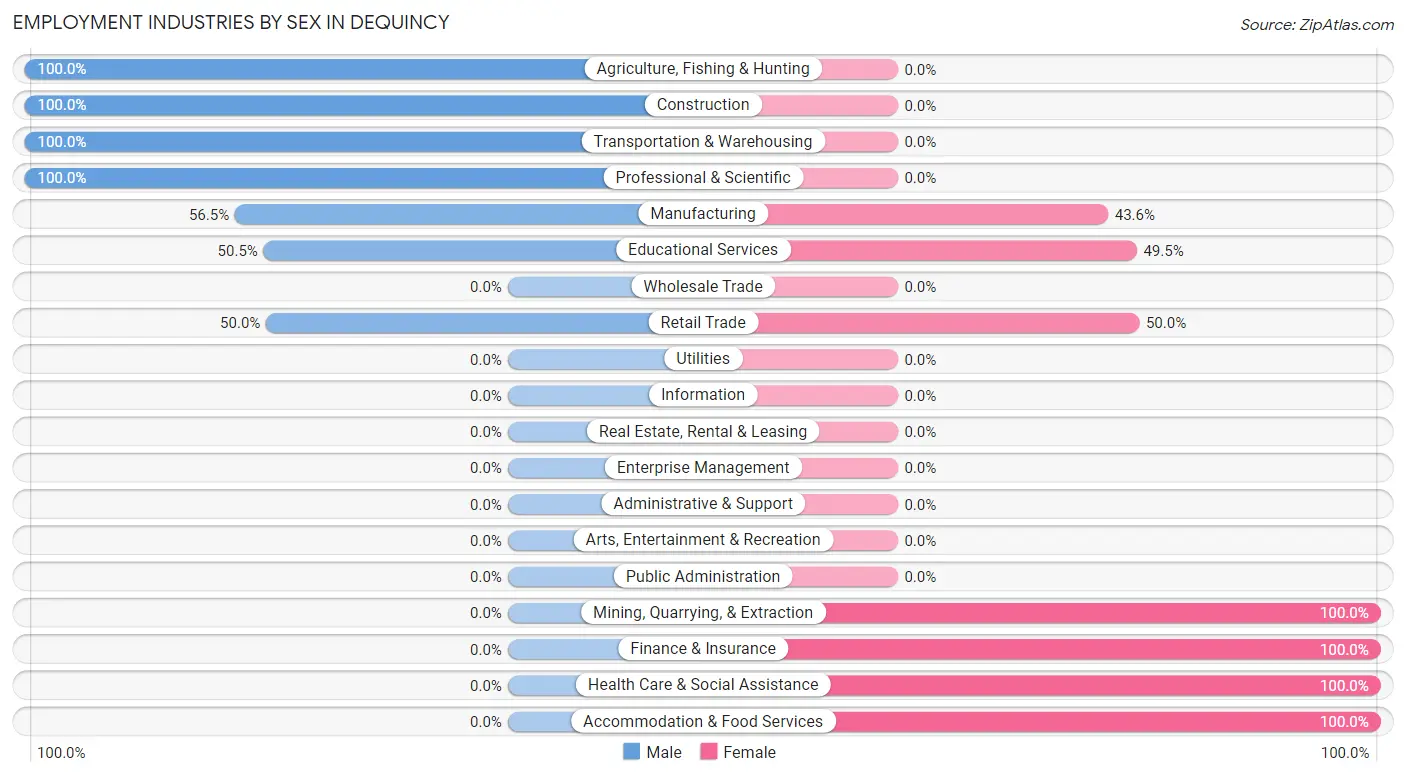
| Industry | Male | Female |
| Agriculture, Fishing & Hunting | 33 (100.0%) | 0 (0.0%) |
| Mining, Quarrying, & Extraction | 0 (0.0%) | 18 (100.0%) |
| Construction | 276 (100.0%) | 0 (0.0%) |
| Manufacturing | 70 (56.5%) | 54 (43.5%) |
| Wholesale Trade | 0 (0.0%) | 0 (0.0%) |
| Retail Trade | 64 (50.0%) | 64 (50.0%) |
| Transportation & Warehousing | 62 (100.0%) | 0 (0.0%) |
| Utilities | 0 (0.0%) | 0 (0.0%) |
| Information | 0 (0.0%) | 0 (0.0%) |
| Finance & Insurance | 0 (0.0%) | 83 (100.0%) |
| Real Estate, Rental & Leasing | 0 (0.0%) | 0 (0.0%) |
| Professional & Scientific | 33 (100.0%) | 0 (0.0%) |
| Enterprise Management | 0 (0.0%) | 0 (0.0%) |
| Administrative & Support | 0 (0.0%) | 0 (0.0%) |
| Educational Services | 49 (50.5%) | 48 (49.5%) |
| Health Care & Social Assistance | 0 (0.0%) | 132 (100.0%) |
| Arts, Entertainment & Recreation | 0 (0.0%) | 0 (0.0%) |
| Accommodation & Food Services | 0 (0.0%) | 23 (100.0%) |
| Public Administration | 0 (0.0%) | 0 (0.0%) |
| Total | 671 (61.4%) | 422 (38.6%) |
Education in Dequincy
School Enrollment in Dequincy
The most common levels of schooling among the 663 students in Dequincy are high school (247 | 37.2%), elementary school (199 | 30.0%), and middle school (167 | 25.2%).
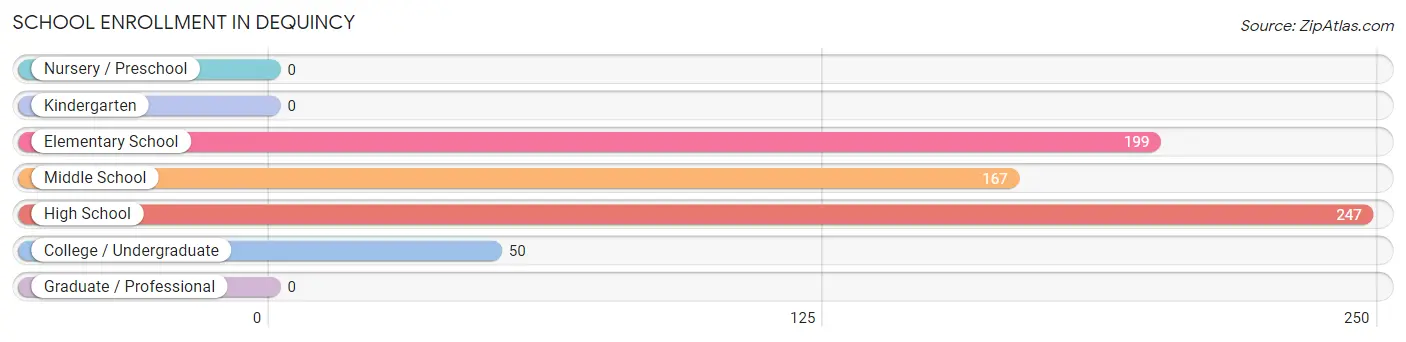
| School Level | # Students | % Students |
| Nursery / Preschool | 0 | 0.0% |
| Kindergarten | 0 | 0.0% |
| Elementary School | 199 | 30.0% |
| Middle School | 167 | 25.2% |
| High School | 247 | 37.2% |
| College / Undergraduate | 50 | 7.5% |
| Graduate / Professional | 0 | 0.0% |
| Total | 663 | 100.0% |
School Enrollment by Age by Funding Source in Dequincy
Out of a total of 663 students who are enrolled in schools in Dequincy, 234 (35.3%) attend a private institution, while the remaining 429 (64.7%) are enrolled in public schools. The age group of 5 to 9 year old has the highest likelihood of being enrolled in private schools, with 108 (54.3% in the age bracket) enrolled. Conversely, the age group of 10 to 14 year olds has the lowest likelihood of being enrolled in a private school, with 167 (100.0% in the age bracket) attending a public institution.
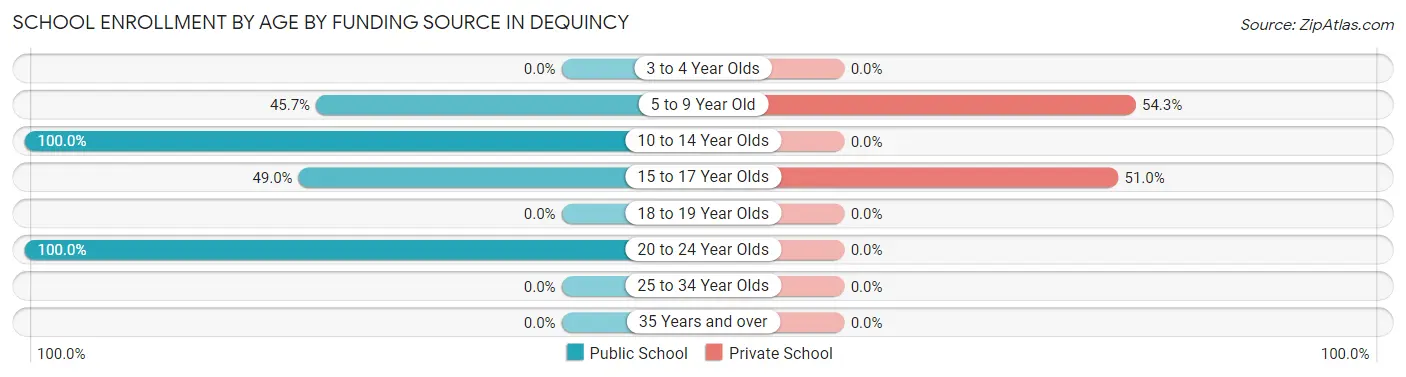
| Age Bracket | Public School | Private School |
| 3 to 4 Year Olds | 0 (0.0%) | 0 (0.0%) |
| 5 to 9 Year Old | 91 (45.7%) | 108 (54.3%) |
| 10 to 14 Year Olds | 167 (100.0%) | 0 (0.0%) |
| 15 to 17 Year Olds | 121 (49.0%) | 126 (51.0%) |
| 18 to 19 Year Olds | 0 (0.0%) | 0 (0.0%) |
| 20 to 24 Year Olds | 50 (100.0%) | 0 (0.0%) |
| 25 to 34 Year Olds | 0 (0.0%) | 0 (0.0%) |
| 35 Years and over | 0 (0.0%) | 0 (0.0%) |
| Total | 429 (64.7%) | 234 (35.3%) |
Educational Attainment by Field of Study in Dequincy
Business (107 | 40.4%), education (92 | 34.7%), visual & performing arts (25 | 9.4%), science & technology (19 | 7.2%), and bio, nature & agricultural (15 | 5.7%) are the most common fields of study among 265 individuals in Dequincy who have obtained a bachelor's degree or higher.
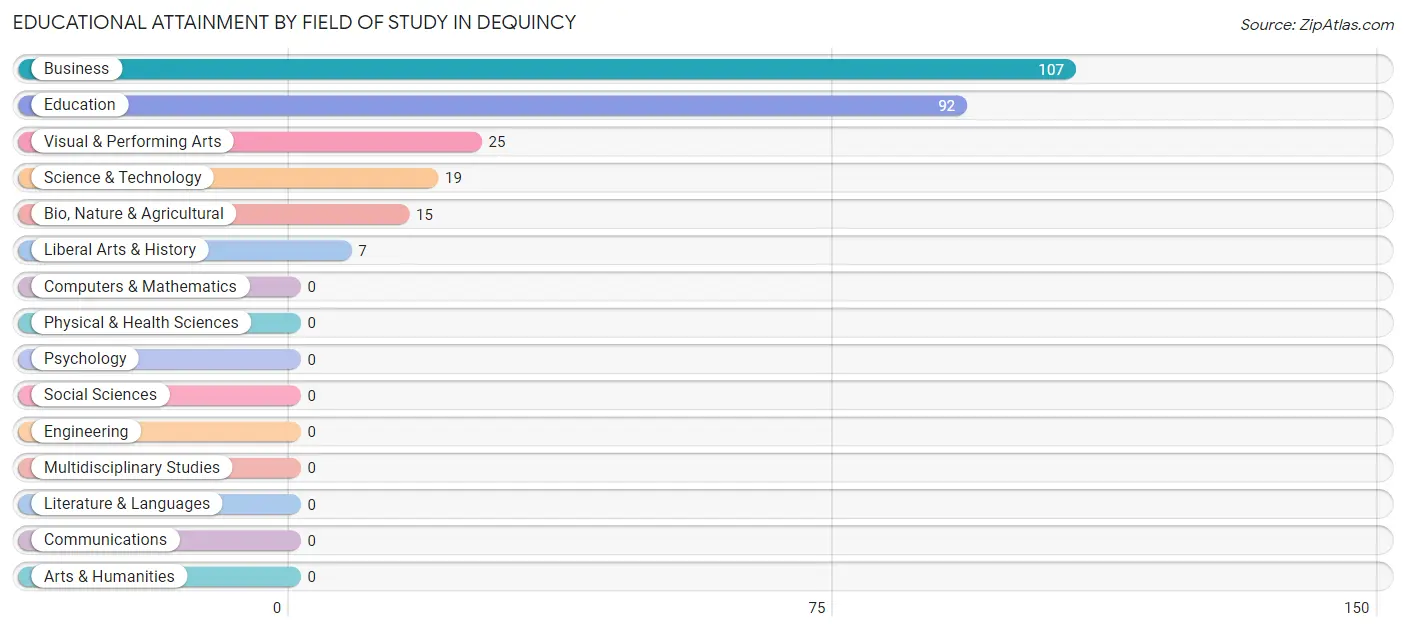
| Field of Study | # Graduates | % Graduates |
| Computers & Mathematics | 0 | 0.0% |
| Bio, Nature & Agricultural | 15 | 5.7% |
| Physical & Health Sciences | 0 | 0.0% |
| Psychology | 0 | 0.0% |
| Social Sciences | 0 | 0.0% |
| Engineering | 0 | 0.0% |
| Multidisciplinary Studies | 0 | 0.0% |
| Science & Technology | 19 | 7.2% |
| Business | 107 | 40.4% |
| Education | 92 | 34.7% |
| Literature & Languages | 0 | 0.0% |
| Liberal Arts & History | 7 | 2.6% |
| Visual & Performing Arts | 25 | 9.4% |
| Communications | 0 | 0.0% |
| Arts & Humanities | 0 | 0.0% |
| Total | 265 | 100.0% |
Transportation & Commute in Dequincy
Vehicle Availability by Sex in Dequincy
The most prevalent vehicle ownership categories in Dequincy are males with 1 vehicle (218, accounting for 32.5%) and females with 1 vehicle (163, making up 51.7%).
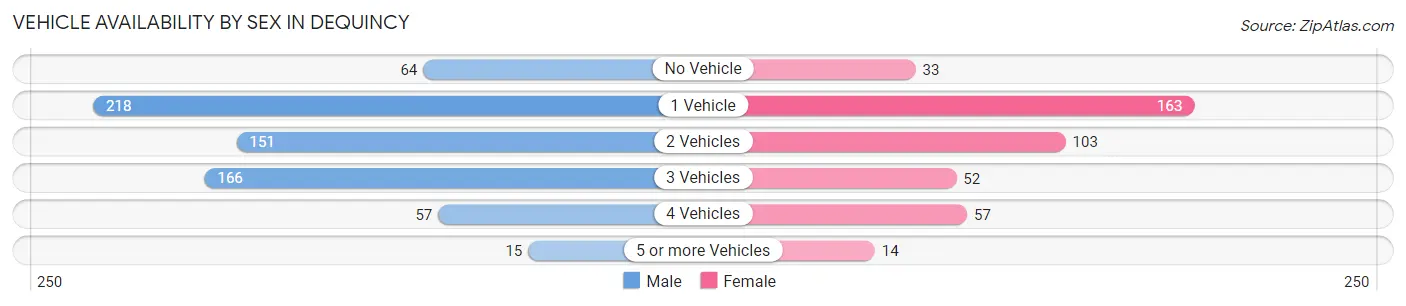
| Vehicles Available | Male | Female |
| No Vehicle | 64 (9.5%) | 33 (7.8%) |
| 1 Vehicle | 218 (32.5%) | 163 (38.6%) |
| 2 Vehicles | 151 (22.5%) | 103 (24.4%) |
| 3 Vehicles | 166 (24.7%) | 52 (12.3%) |
| 4 Vehicles | 57 (8.5%) | 57 (13.5%) |
| 5 or more Vehicles | 15 (2.2%) | 14 (3.3%) |
| Total | 671 (100.0%) | 422 (100.0%) |
Commute Time in Dequincy
The most frequently occuring commute durations in Dequincy are 30 to 34 minutes (267 commuters, 24.4%), 45 to 59 minutes (199 commuters, 18.2%), and 20 to 24 minutes (197 commuters, 18.0%).
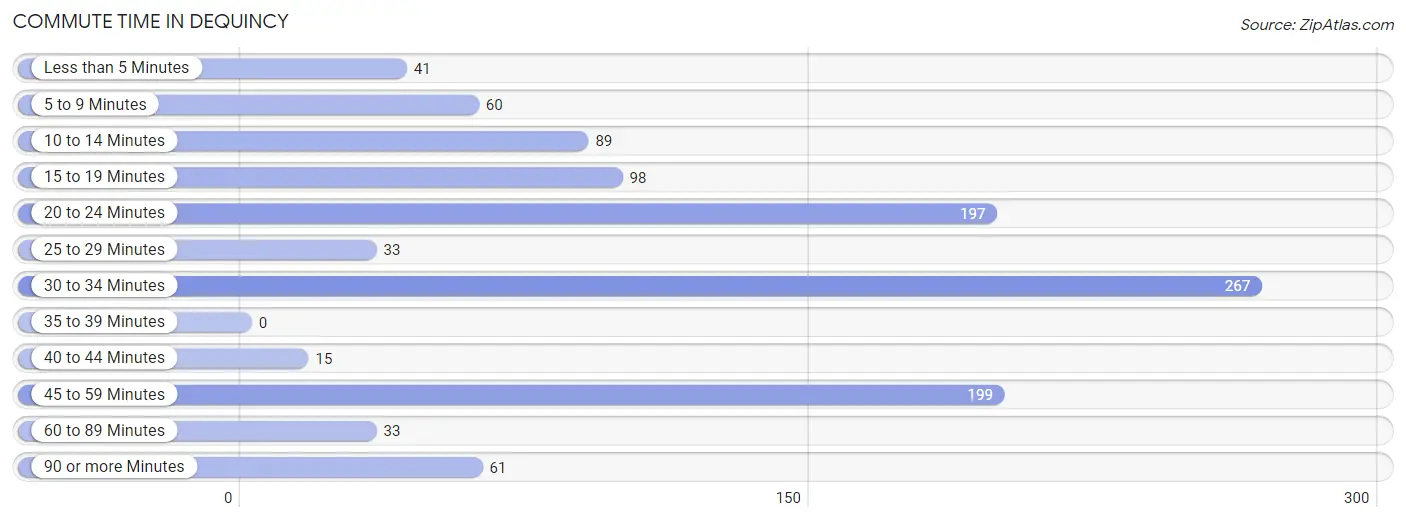
| Commute Time | # Commuters | % Commuters |
| Less than 5 Minutes | 41 | 3.7% |
| 5 to 9 Minutes | 60 | 5.5% |
| 10 to 14 Minutes | 89 | 8.1% |
| 15 to 19 Minutes | 98 | 9.0% |
| 20 to 24 Minutes | 197 | 18.0% |
| 25 to 29 Minutes | 33 | 3.0% |
| 30 to 34 Minutes | 267 | 24.4% |
| 35 to 39 Minutes | 0 | 0.0% |
| 40 to 44 Minutes | 15 | 1.4% |
| 45 to 59 Minutes | 199 | 18.2% |
| 60 to 89 Minutes | 33 | 3.0% |
| 90 or more Minutes | 61 | 5.6% |
Commute Time by Sex in Dequincy
The most common commute times in Dequincy are 30 to 34 minutes (210 commuters, 31.3%) for males and 45 to 59 minutes (122 commuters, 28.9%) for females.
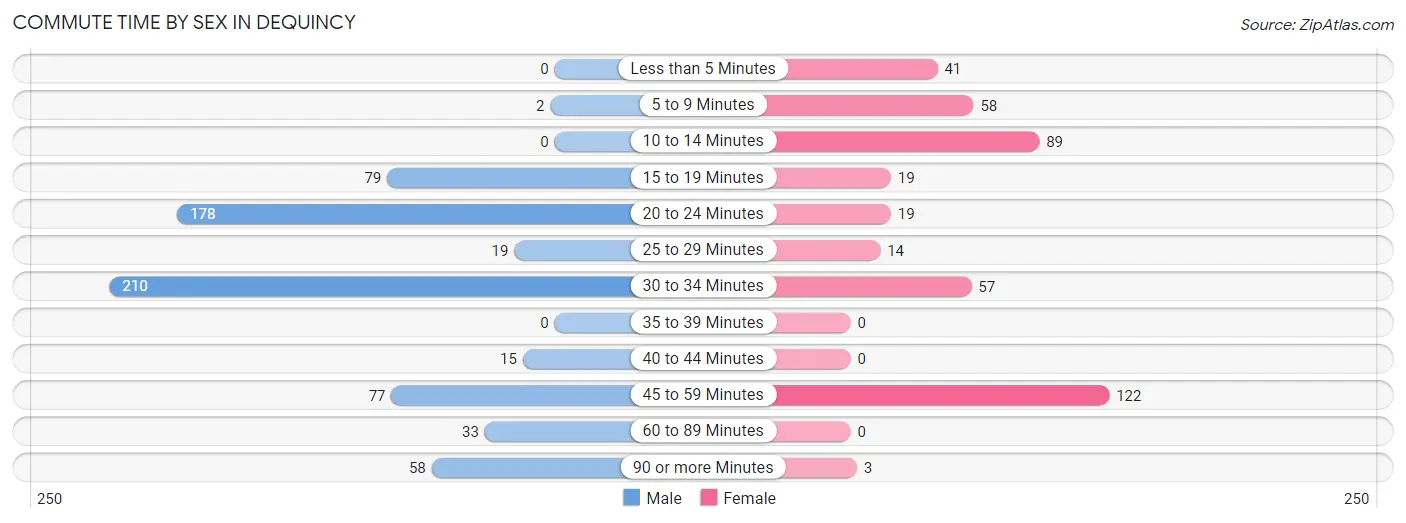
| Commute Time | Male | Female |
| Less than 5 Minutes | 0 (0.0%) | 41 (9.7%) |
| 5 to 9 Minutes | 2 (0.3%) | 58 (13.7%) |
| 10 to 14 Minutes | 0 (0.0%) | 89 (21.1%) |
| 15 to 19 Minutes | 79 (11.8%) | 19 (4.5%) |
| 20 to 24 Minutes | 178 (26.5%) | 19 (4.5%) |
| 25 to 29 Minutes | 19 (2.8%) | 14 (3.3%) |
| 30 to 34 Minutes | 210 (31.3%) | 57 (13.5%) |
| 35 to 39 Minutes | 0 (0.0%) | 0 (0.0%) |
| 40 to 44 Minutes | 15 (2.2%) | 0 (0.0%) |
| 45 to 59 Minutes | 77 (11.5%) | 122 (28.9%) |
| 60 to 89 Minutes | 33 (4.9%) | 0 (0.0%) |
| 90 or more Minutes | 58 (8.6%) | 3 (0.7%) |
Time of Departure to Work by Sex in Dequincy
The most frequent times of departure to work in Dequincy are 12:00 AM to 4:59 AM (176, 26.2%) for males and 7:00 AM to 7:29 AM (107, 25.4%) for females.
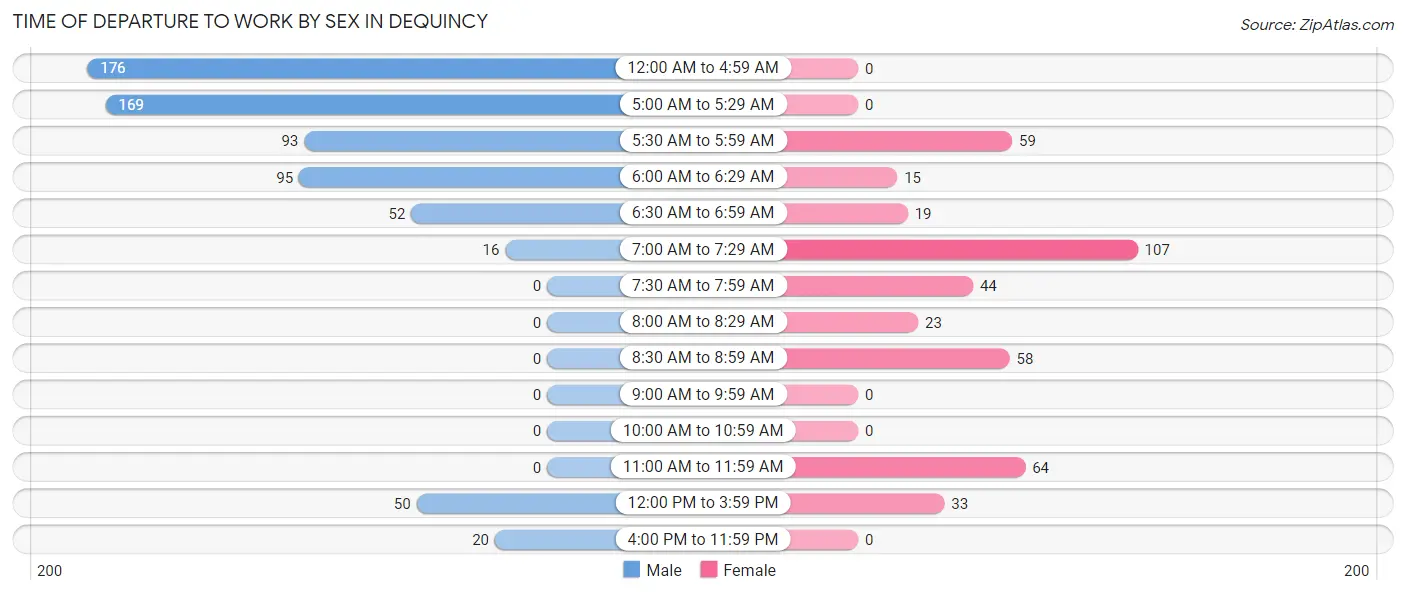
| Time of Departure | Male | Female |
| 12:00 AM to 4:59 AM | 176 (26.2%) | 0 (0.0%) |
| 5:00 AM to 5:29 AM | 169 (25.2%) | 0 (0.0%) |
| 5:30 AM to 5:59 AM | 93 (13.9%) | 59 (14.0%) |
| 6:00 AM to 6:29 AM | 95 (14.2%) | 15 (3.5%) |
| 6:30 AM to 6:59 AM | 52 (7.7%) | 19 (4.5%) |
| 7:00 AM to 7:29 AM | 16 (2.4%) | 107 (25.4%) |
| 7:30 AM to 7:59 AM | 0 (0.0%) | 44 (10.4%) |
| 8:00 AM to 8:29 AM | 0 (0.0%) | 23 (5.4%) |
| 8:30 AM to 8:59 AM | 0 (0.0%) | 58 (13.7%) |
| 9:00 AM to 9:59 AM | 0 (0.0%) | 0 (0.0%) |
| 10:00 AM to 10:59 AM | 0 (0.0%) | 0 (0.0%) |
| 11:00 AM to 11:59 AM | 0 (0.0%) | 64 (15.2%) |
| 12:00 PM to 3:59 PM | 50 (7.4%) | 33 (7.8%) |
| 4:00 PM to 11:59 PM | 20 (3.0%) | 0 (0.0%) |
| Total | 671 (100.0%) | 422 (100.0%) |
Housing Occupancy in Dequincy
Occupancy by Ownership in Dequincy
Of the total 918 dwellings in Dequincy, owner-occupied units account for 634 (69.1%), while renter-occupied units make up 284 (30.9%).
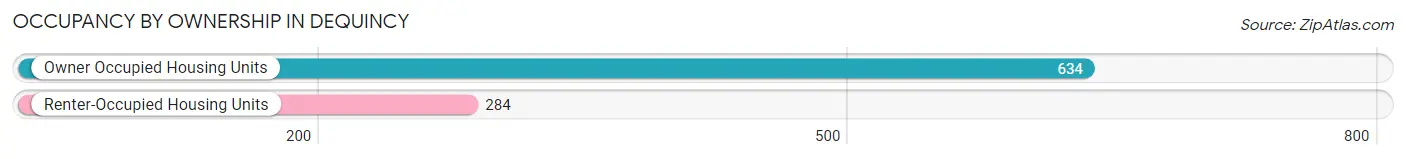
| Occupancy | # Housing Units | % Housing Units |
| Owner Occupied Housing Units | 634 | 69.1% |
| Renter-Occupied Housing Units | 284 | 30.9% |
| Total Occupied Housing Units | 918 | 100.0% |
Occupancy by Household Size in Dequincy
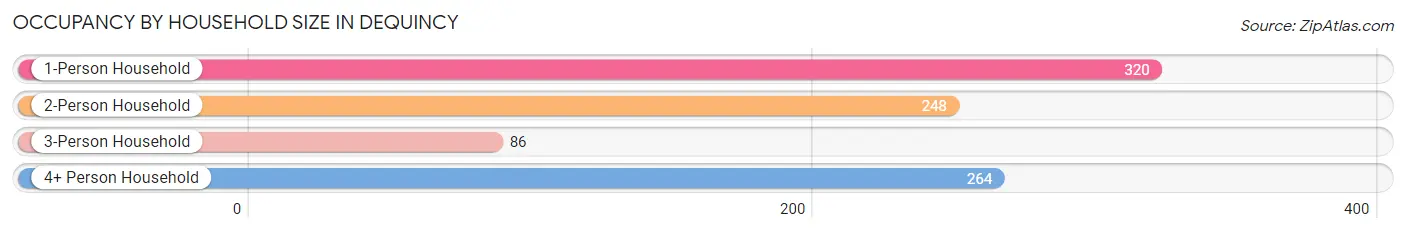
| Household Size | # Housing Units | % Housing Units |
| 1-Person Household | 320 | 34.9% |
| 2-Person Household | 248 | 27.0% |
| 3-Person Household | 86 | 9.4% |
| 4+ Person Household | 264 | 28.8% |
| Total Housing Units | 918 | 100.0% |
Occupancy by Ownership by Household Size in Dequincy
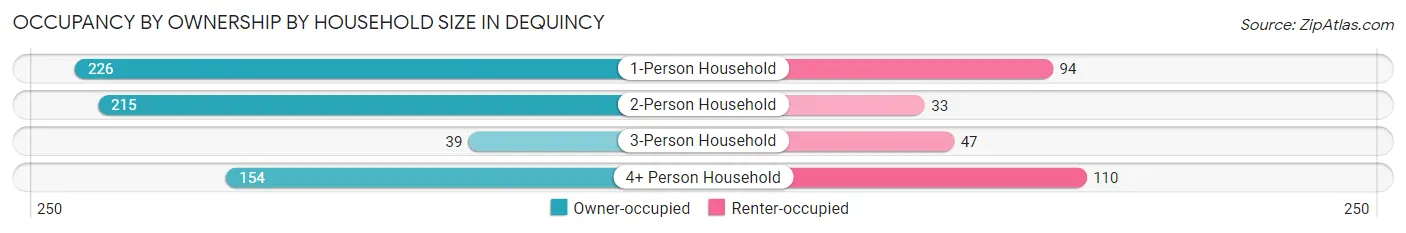
| Household Size | Owner-occupied | Renter-occupied |
| 1-Person Household | 226 (70.6%) | 94 (29.4%) |
| 2-Person Household | 215 (86.7%) | 33 (13.3%) |
| 3-Person Household | 39 (45.4%) | 47 (54.6%) |
| 4+ Person Household | 154 (58.3%) | 110 (41.7%) |
| Total Housing Units | 634 (69.1%) | 284 (30.9%) |
Occupancy by Educational Attainment in Dequincy
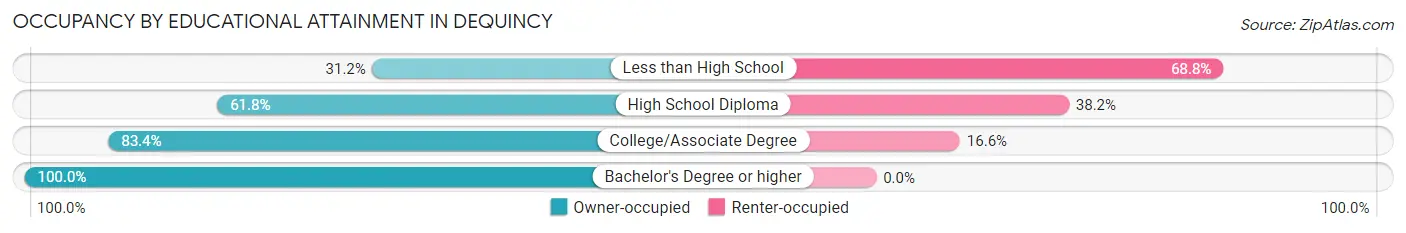
| Household Size | Owner-occupied | Renter-occupied |
| Less than High School | 39 (31.2%) | 86 (68.8%) |
| High School Diploma | 254 (61.8%) | 157 (38.2%) |
| College/Associate Degree | 206 (83.4%) | 41 (16.6%) |
| Bachelor's Degree or higher | 135 (100.0%) | 0 (0.0%) |
Occupancy by Age of Householder in Dequincy
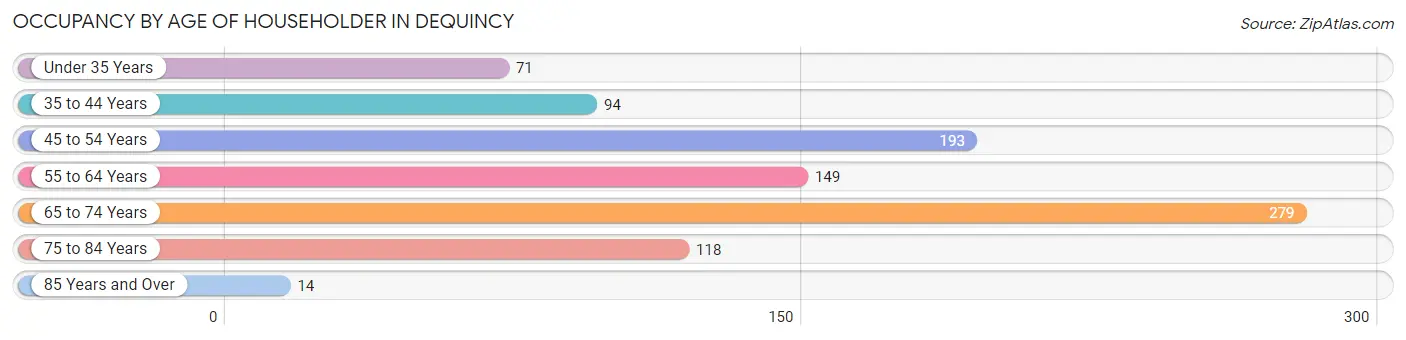
| Age Bracket | # Households | % Households |
| Under 35 Years | 71 | 7.7% |
| 35 to 44 Years | 94 | 10.2% |
| 45 to 54 Years | 193 | 21.0% |
| 55 to 64 Years | 149 | 16.2% |
| 65 to 74 Years | 279 | 30.4% |
| 75 to 84 Years | 118 | 12.9% |
| 85 Years and Over | 14 | 1.5% |
| Total | 918 | 100.0% |
Housing Finances in Dequincy
Median Income by Occupancy in Dequincy
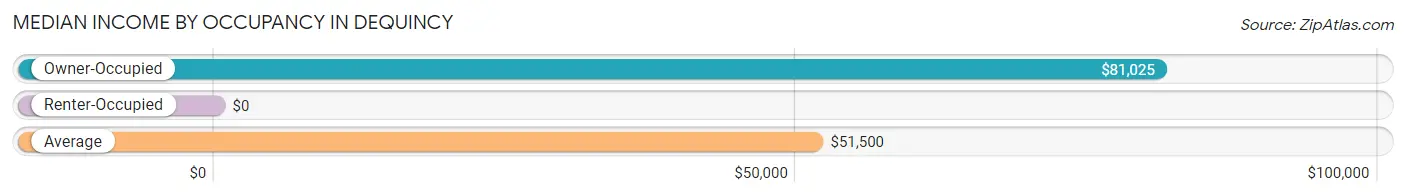
| Occupancy Type | # Households | Median Income |
| Owner-Occupied | 634 (69.1%) | $81,025 |
| Renter-Occupied | 284 (30.9%) | $0 |
| Average | 918 (100.0%) | $51,500 |
Occupancy by Householder Income Bracket in Dequincy
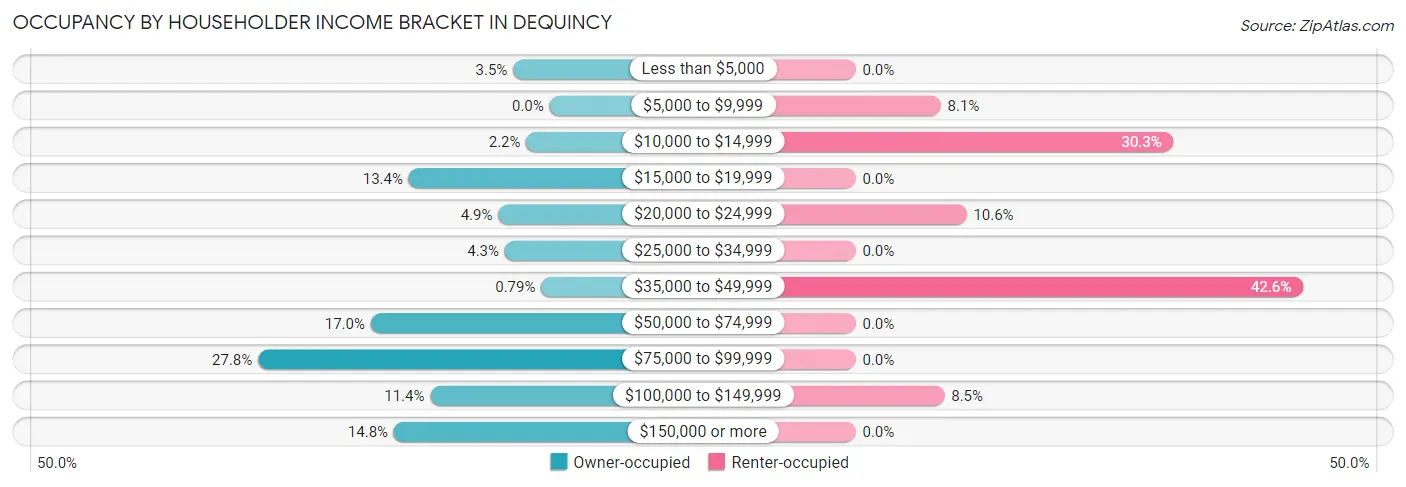
| Income Bracket | Owner-occupied | Renter-occupied |
| Less than $5,000 | 22 (3.5%) | 0 (0.0%) |
| $5,000 to $9,999 | 0 (0.0%) | 23 (8.1%) |
| $10,000 to $14,999 | 14 (2.2%) | 86 (30.3%) |
| $15,000 to $19,999 | 85 (13.4%) | 0 (0.0%) |
| $20,000 to $24,999 | 31 (4.9%) | 30 (10.6%) |
| $25,000 to $34,999 | 27 (4.3%) | 0 (0.0%) |
| $35,000 to $49,999 | 5 (0.8%) | 121 (42.6%) |
| $50,000 to $74,999 | 108 (17.0%) | 0 (0.0%) |
| $75,000 to $99,999 | 176 (27.8%) | 0 (0.0%) |
| $100,000 to $149,999 | 72 (11.4%) | 24 (8.5%) |
| $150,000 or more | 94 (14.8%) | 0 (0.0%) |
| Total | 634 (100.0%) | 284 (100.0%) |
Monthly Housing Cost Tiers in Dequincy
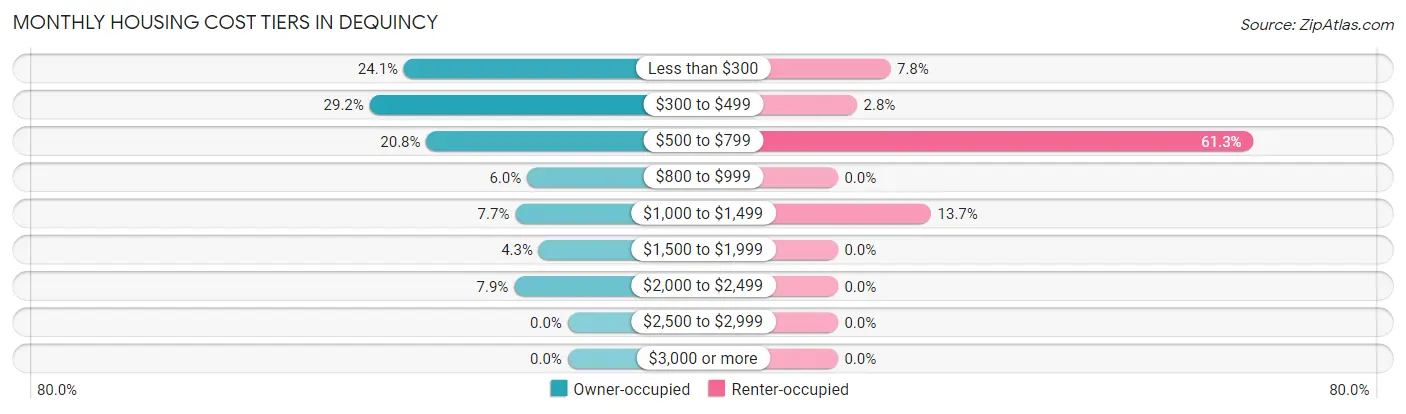
| Monthly Cost | Owner-occupied | Renter-occupied |
| Less than $300 | 153 (24.1%) | 22 (7.7%) |
| $300 to $499 | 185 (29.2%) | 8 (2.8%) |
| $500 to $799 | 132 (20.8%) | 174 (61.3%) |
| $800 to $999 | 38 (6.0%) | 0 (0.0%) |
| $1,000 to $1,499 | 49 (7.7%) | 39 (13.7%) |
| $1,500 to $1,999 | 27 (4.3%) | 0 (0.0%) |
| $2,000 to $2,499 | 50 (7.9%) | 0 (0.0%) |
| $2,500 to $2,999 | 0 (0.0%) | 0 (0.0%) |
| $3,000 or more | 0 (0.0%) | 0 (0.0%) |
| Total | 634 (100.0%) | 284 (100.0%) |
Physical Housing Characteristics in Dequincy
Housing Structures in Dequincy
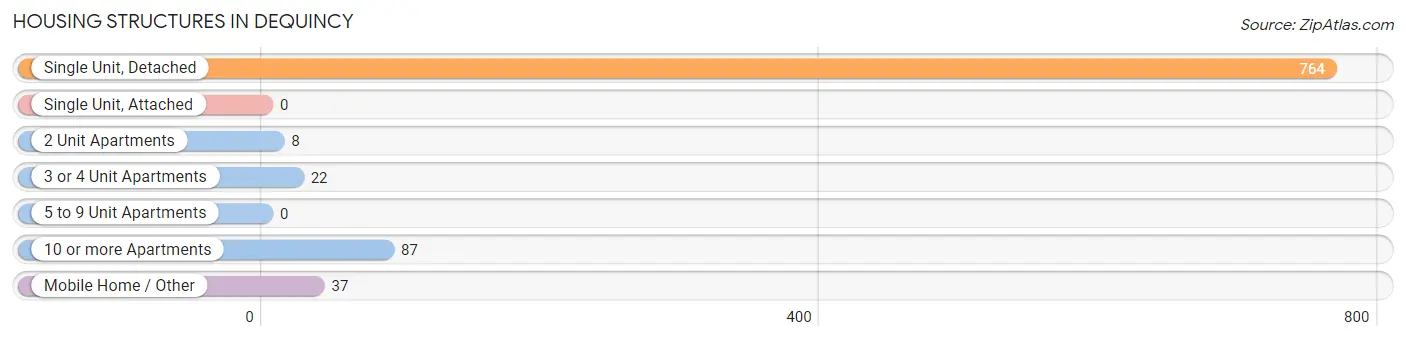
| Structure Type | # Housing Units | % Housing Units |
| Single Unit, Detached | 764 | 83.2% |
| Single Unit, Attached | 0 | 0.0% |
| 2 Unit Apartments | 8 | 0.9% |
| 3 or 4 Unit Apartments | 22 | 2.4% |
| 5 to 9 Unit Apartments | 0 | 0.0% |
| 10 or more Apartments | 87 | 9.5% |
| Mobile Home / Other | 37 | 4.0% |
| Total | 918 | 100.0% |
Housing Structures by Occupancy in Dequincy
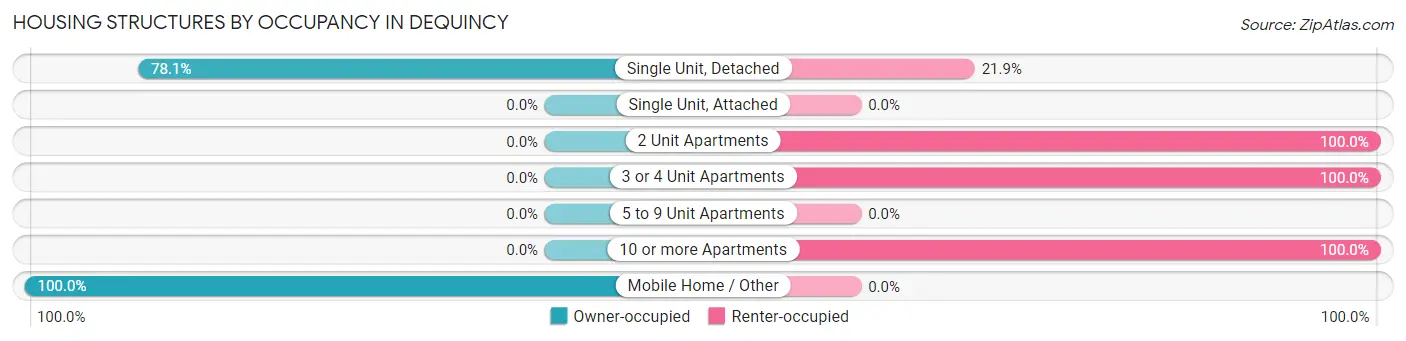
| Structure Type | Owner-occupied | Renter-occupied |
| Single Unit, Detached | 597 (78.1%) | 167 (21.9%) |
| Single Unit, Attached | 0 (0.0%) | 0 (0.0%) |
| 2 Unit Apartments | 0 (0.0%) | 8 (100.0%) |
| 3 or 4 Unit Apartments | 0 (0.0%) | 22 (100.0%) |
| 5 to 9 Unit Apartments | 0 (0.0%) | 0 (0.0%) |
| 10 or more Apartments | 0 (0.0%) | 87 (100.0%) |
| Mobile Home / Other | 37 (100.0%) | 0 (0.0%) |
| Total | 634 (69.1%) | 284 (30.9%) |
Housing Structures by Number of Rooms in Dequincy
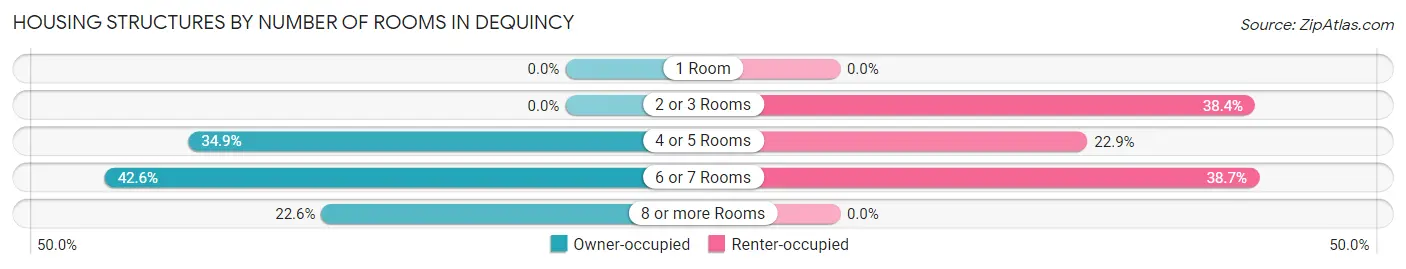
| Number of Rooms | Owner-occupied | Renter-occupied |
| 1 Room | 0 (0.0%) | 0 (0.0%) |
| 2 or 3 Rooms | 0 (0.0%) | 109 (38.4%) |
| 4 or 5 Rooms | 221 (34.9%) | 65 (22.9%) |
| 6 or 7 Rooms | 270 (42.6%) | 110 (38.7%) |
| 8 or more Rooms | 143 (22.6%) | 0 (0.0%) |
| Total | 634 (100.0%) | 284 (100.0%) |
Housing Structure by Heating Type in Dequincy
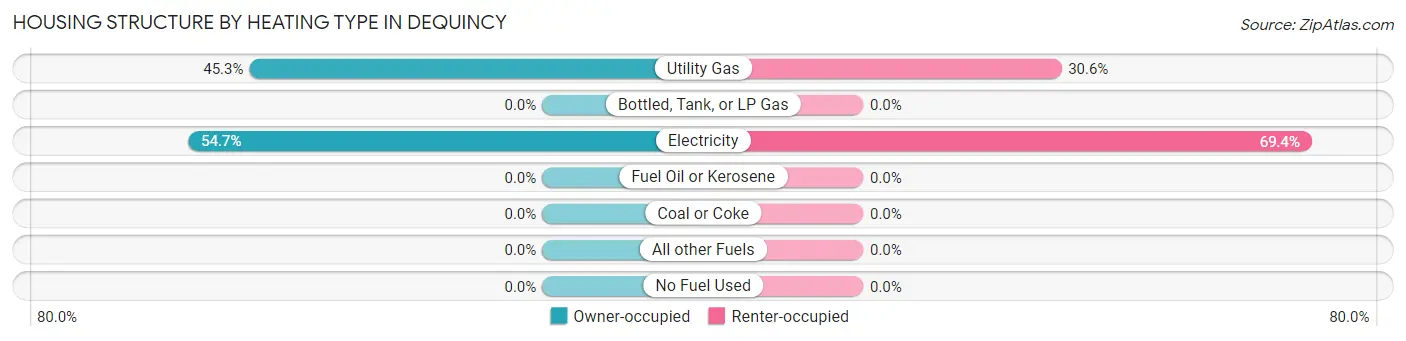
| Heating Type | Owner-occupied | Renter-occupied |
| Utility Gas | 287 (45.3%) | 87 (30.6%) |
| Bottled, Tank, or LP Gas | 0 (0.0%) | 0 (0.0%) |
| Electricity | 347 (54.7%) | 197 (69.4%) |
| Fuel Oil or Kerosene | 0 (0.0%) | 0 (0.0%) |
| Coal or Coke | 0 (0.0%) | 0 (0.0%) |
| All other Fuels | 0 (0.0%) | 0 (0.0%) |
| No Fuel Used | 0 (0.0%) | 0 (0.0%) |
| Total | 634 (100.0%) | 284 (100.0%) |
Household Vehicle Usage in Dequincy
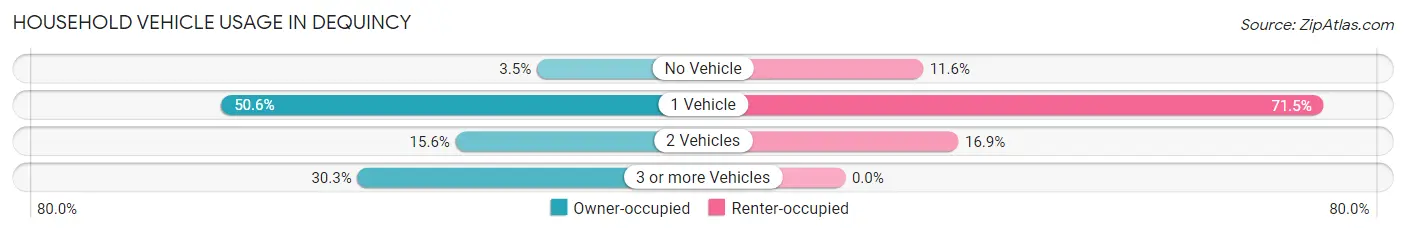
| Vehicles per Household | Owner-occupied | Renter-occupied |
| No Vehicle | 22 (3.5%) | 33 (11.6%) |
| 1 Vehicle | 321 (50.6%) | 203 (71.5%) |
| 2 Vehicles | 99 (15.6%) | 48 (16.9%) |
| 3 or more Vehicles | 192 (30.3%) | 0 (0.0%) |
| Total | 634 (100.0%) | 284 (100.0%) |
Real Estate & Mortgages in Dequincy
Real Estate and Mortgage Overview in Dequincy
| Characteristic | Without Mortgage | With Mortgage |
| Housing Units | 471 | 163 |
| Median Property Value | $142,000 | $208,300 |
| Median Household Income | $65,660 | $66 |
| Monthly Housing Costs | $442 | $0 |
| Real Estate Taxes | $199 | $39 |
Property Value by Mortgage Status in Dequincy
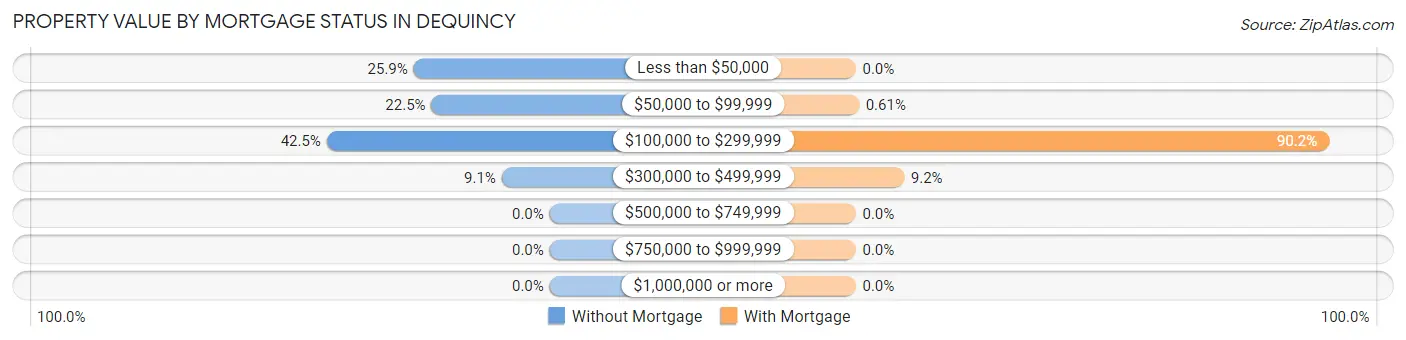
| Property Value | Without Mortgage | With Mortgage |
| Less than $50,000 | 122 (25.9%) | 0 (0.0%) |
| $50,000 to $99,999 | 106 (22.5%) | 1 (0.6%) |
| $100,000 to $299,999 | 200 (42.5%) | 147 (90.2%) |
| $300,000 to $499,999 | 43 (9.1%) | 15 (9.2%) |
| $500,000 to $749,999 | 0 (0.0%) | 0 (0.0%) |
| $750,000 to $999,999 | 0 (0.0%) | 0 (0.0%) |
| $1,000,000 or more | 0 (0.0%) | 0 (0.0%) |
| Total | 471 (100.0%) | 163 (100.0%) |
Household Income by Mortgage Status in Dequincy
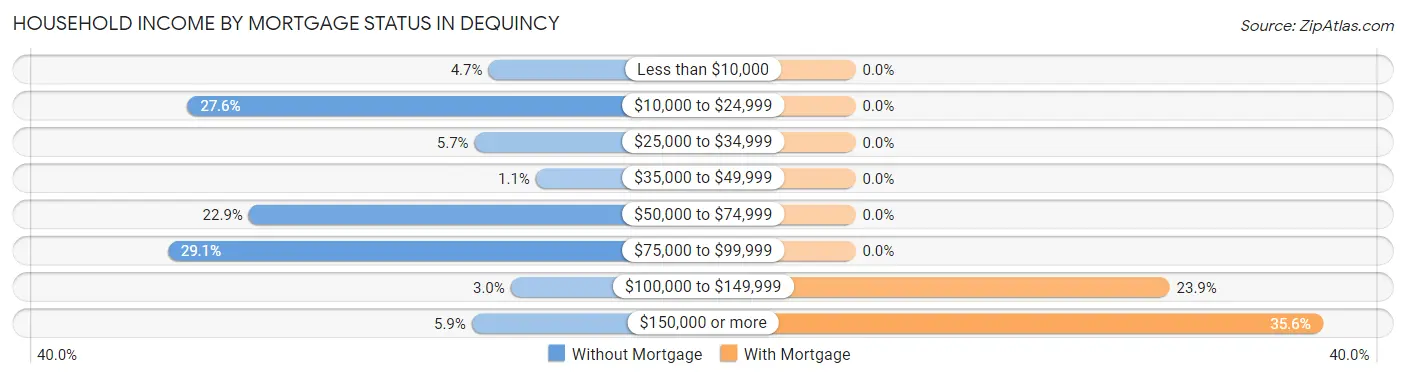
| Household Income | Without Mortgage | With Mortgage |
| Less than $10,000 | 22 (4.7%) | 0 (0.0%) |
| $10,000 to $24,999 | 130 (27.6%) | 0 (0.0%) |
| $25,000 to $34,999 | 27 (5.7%) | 0 (0.0%) |
| $35,000 to $49,999 | 5 (1.1%) | 0 (0.0%) |
| $50,000 to $74,999 | 108 (22.9%) | 0 (0.0%) |
| $75,000 to $99,999 | 137 (29.1%) | 0 (0.0%) |
| $100,000 to $149,999 | 14 (3.0%) | 39 (23.9%) |
| $150,000 or more | 28 (5.9%) | 58 (35.6%) |
| Total | 471 (100.0%) | 163 (100.0%) |
Property Value to Household Income Ratio in Dequincy
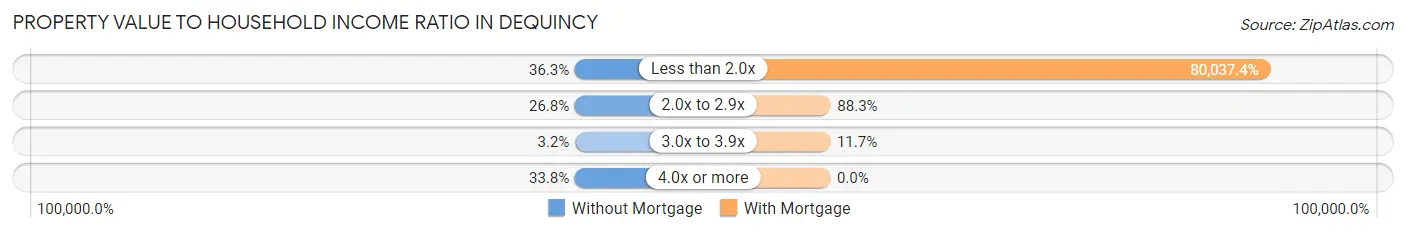
| Value-to-Income Ratio | Without Mortgage | With Mortgage |
| Less than 2.0x | 171 (36.3%) | 130,461 (80,037.4%) |
| 2.0x to 2.9x | 126 (26.8%) | 144 (88.3%) |
| 3.0x to 3.9x | 15 (3.2%) | 19 (11.7%) |
| 4.0x or more | 159 (33.8%) | 0 (0.0%) |
| Total | 471 (100.0%) | 163 (100.0%) |
Real Estate Taxes by Mortgage Status in Dequincy
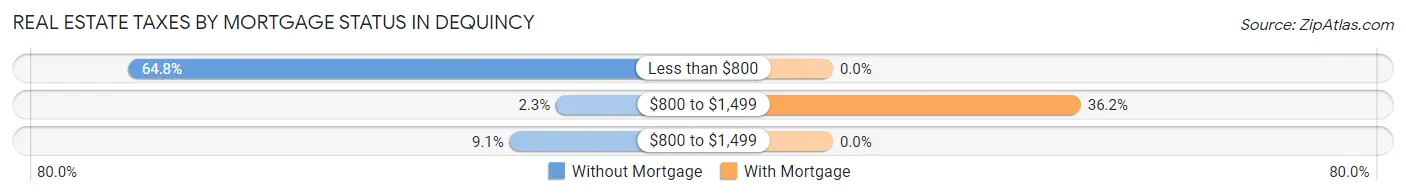
| Property Taxes | Without Mortgage | With Mortgage |
| Less than $800 | 305 (64.8%) | 0 (0.0%) |
| $800 to $1,499 | 11 (2.3%) | 59 (36.2%) |
| $800 to $1,499 | 43 (9.1%) | 0 (0.0%) |
| Total | 471 (100.0%) | 163 (100.0%) |
Health & Disability in Dequincy
Health Insurance Coverage by Age in Dequincy
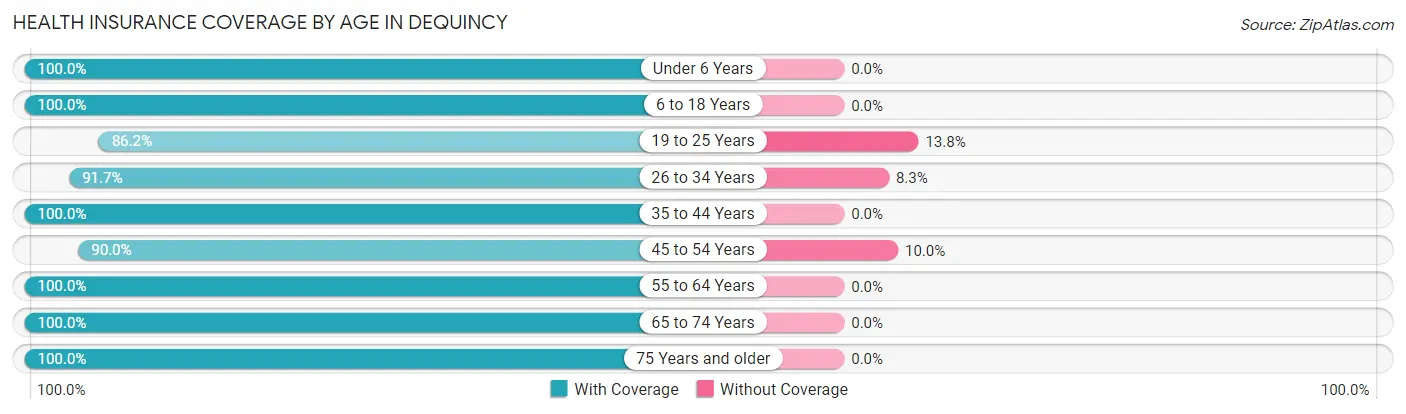
| Age Bracket | With Coverage | Without Coverage |
| Under 6 Years | 362 (100.0%) | 0 (0.0%) |
| 6 to 18 Years | 667 (100.0%) | 0 (0.0%) |
| 19 to 25 Years | 218 (86.2%) | 35 (13.8%) |
| 26 to 34 Years | 143 (91.7%) | 13 (8.3%) |
| 35 to 44 Years | 454 (100.0%) | 0 (0.0%) |
| 45 to 54 Years | 269 (90.0%) | 30 (10.0%) |
| 55 to 64 Years | 283 (100.0%) | 0 (0.0%) |
| 65 to 74 Years | 381 (100.0%) | 0 (0.0%) |
| 75 Years and older | 144 (100.0%) | 0 (0.0%) |
| Total | 2,921 (97.4%) | 78 (2.6%) |
Health Insurance Coverage by Citizenship Status in Dequincy
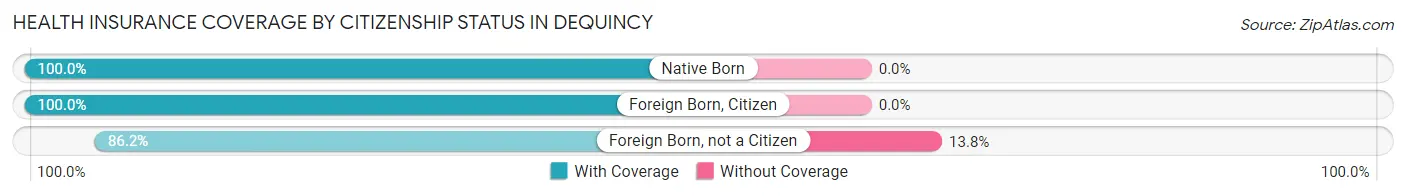
| Citizenship Status | With Coverage | Without Coverage |
| Native Born | 362 (100.0%) | 0 (0.0%) |
| Foreign Born, Citizen | 667 (100.0%) | 0 (0.0%) |
| Foreign Born, not a Citizen | 218 (86.2%) | 35 (13.8%) |
Health Insurance Coverage by Household Income in Dequincy
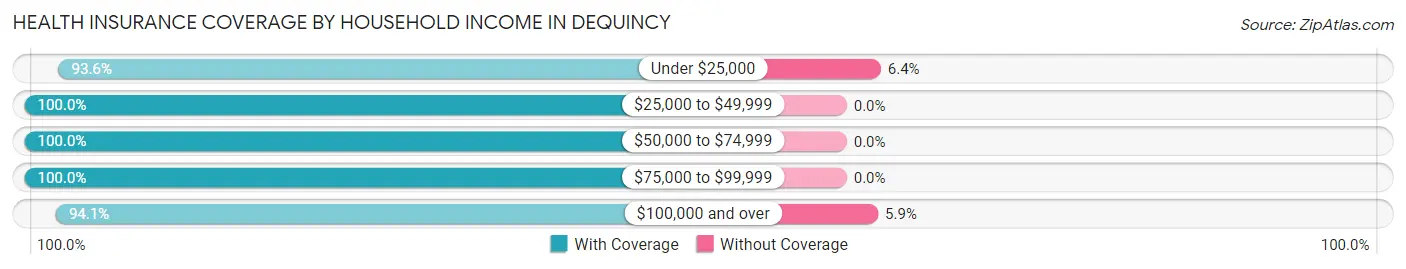
| Household Income | With Coverage | Without Coverage |
| Under $25,000 | 440 (93.6%) | 30 (6.4%) |
| $25,000 to $49,999 | 1,019 (100.0%) | 0 (0.0%) |
| $50,000 to $74,999 | 298 (100.0%) | 0 (0.0%) |
| $75,000 to $99,999 | 395 (100.0%) | 0 (0.0%) |
| $100,000 and over | 769 (94.1%) | 48 (5.9%) |
Public vs Private Health Insurance Coverage by Age in Dequincy
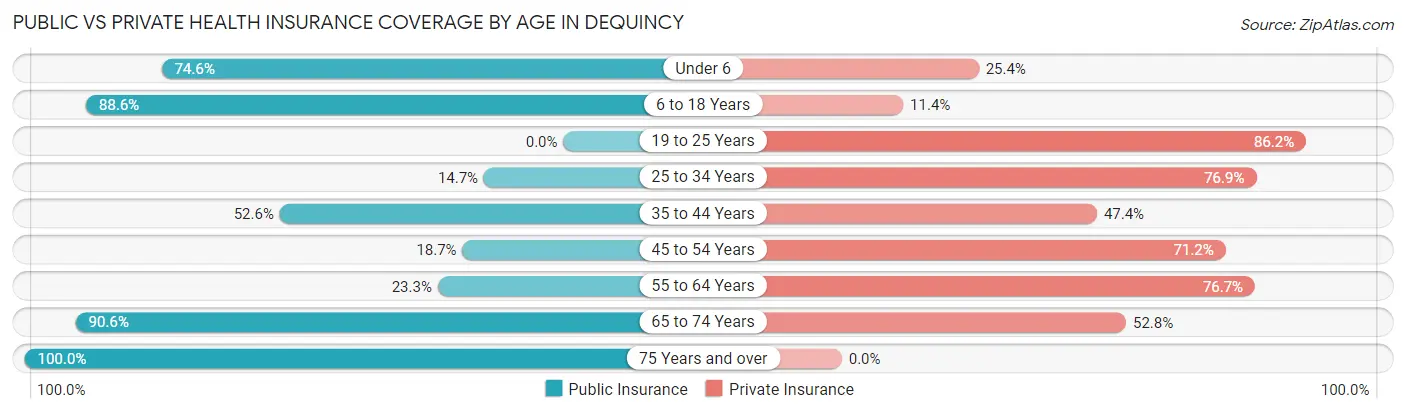
| Age Bracket | Public Insurance | Private Insurance |
| Under 6 | 270 (74.6%) | 92 (25.4%) |
| 6 to 18 Years | 591 (88.6%) | 76 (11.4%) |
| 19 to 25 Years | 0 (0.0%) | 218 (86.2%) |
| 25 to 34 Years | 23 (14.7%) | 120 (76.9%) |
| 35 to 44 Years | 239 (52.6%) | 215 (47.4%) |
| 45 to 54 Years | 56 (18.7%) | 213 (71.2%) |
| 55 to 64 Years | 66 (23.3%) | 217 (76.7%) |
| 65 to 74 Years | 345 (90.5%) | 201 (52.8%) |
| 75 Years and over | 144 (100.0%) | 0 (0.0%) |
| Total | 1,734 (57.8%) | 1,352 (45.1%) |
Disability Status by Sex by Age in Dequincy
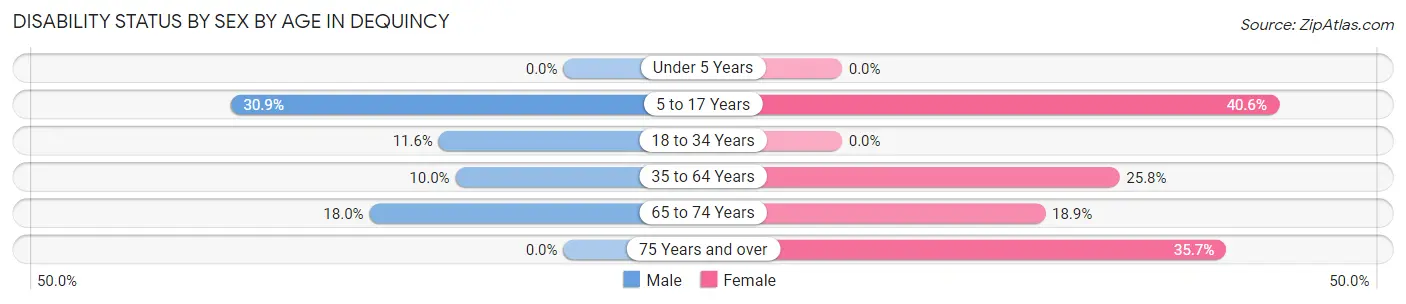
| Age Bracket | Male | Female |
| Under 5 Years | 0 (0.0%) | 0 (0.0%) |
| 5 to 17 Years | 139 (30.9%) | 88 (40.6%) |
| 18 to 34 Years | 28 (11.6%) | 0 (0.0%) |
| 35 to 64 Years | 61 (10.0%) | 110 (25.8%) |
| 65 to 74 Years | 18 (18.0%) | 53 (18.9%) |
| 75 Years and over | 0 (0.0%) | 46 (35.7%) |
Disability Class by Sex by Age in Dequincy
Disability Class: Hearing Difficulty
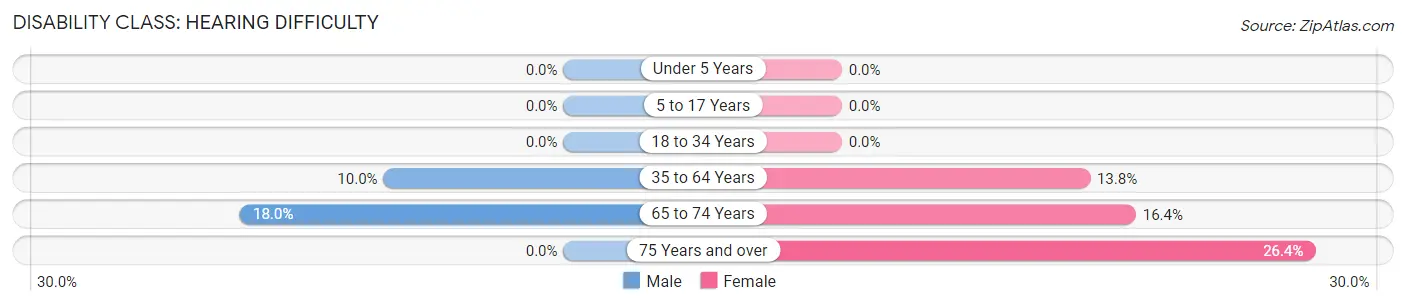
| Age Bracket | Male | Female |
| Under 5 Years | 0 (0.0%) | 0 (0.0%) |
| 5 to 17 Years | 0 (0.0%) | 0 (0.0%) |
| 18 to 34 Years | 0 (0.0%) | 0 (0.0%) |
| 35 to 64 Years | 61 (10.0%) | 59 (13.8%) |
| 65 to 74 Years | 18 (18.0%) | 46 (16.4%) |
| 75 Years and over | 0 (0.0%) | 34 (26.4%) |
Disability Class: Vision Difficulty
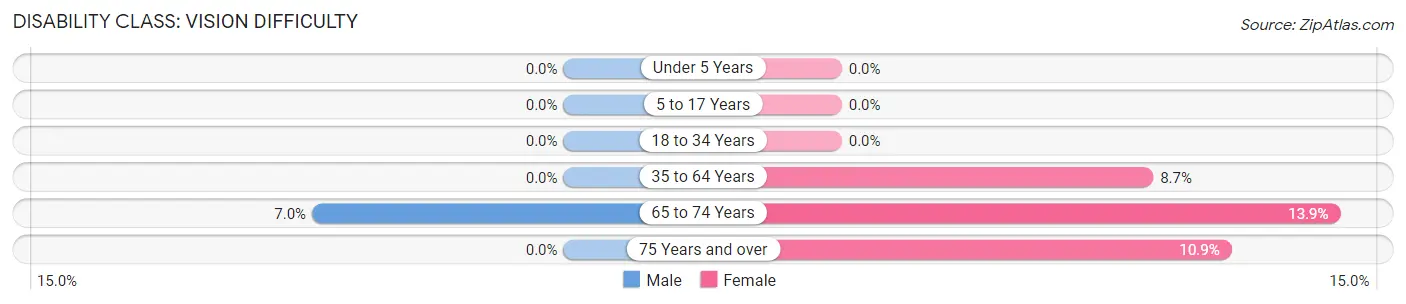
| Age Bracket | Male | Female |
| Under 5 Years | 0 (0.0%) | 0 (0.0%) |
| 5 to 17 Years | 0 (0.0%) | 0 (0.0%) |
| 18 to 34 Years | 0 (0.0%) | 0 (0.0%) |
| 35 to 64 Years | 0 (0.0%) | 37 (8.7%) |
| 65 to 74 Years | 7 (7.0%) | 39 (13.9%) |
| 75 Years and over | 0 (0.0%) | 14 (10.8%) |
Disability Class: Cognitive Difficulty
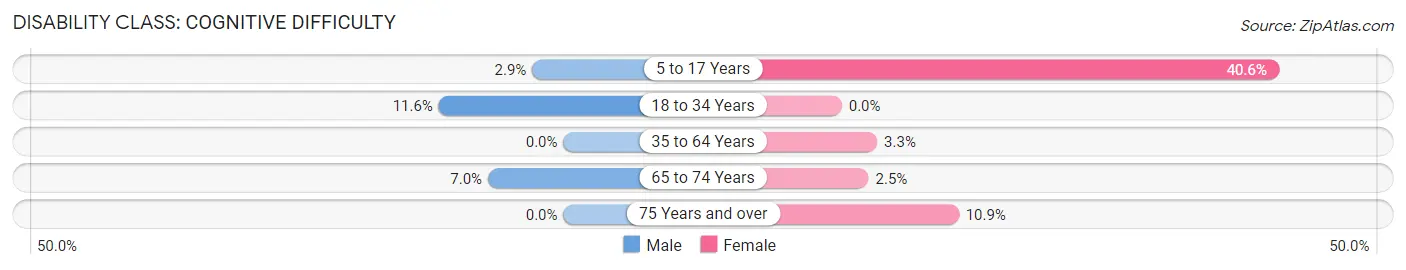
| Age Bracket | Male | Female |
| 5 to 17 Years | 13 (2.9%) | 88 (40.6%) |
| 18 to 34 Years | 28 (11.6%) | 0 (0.0%) |
| 35 to 64 Years | 0 (0.0%) | 14 (3.3%) |
| 65 to 74 Years | 7 (7.0%) | 7 (2.5%) |
| 75 Years and over | 0 (0.0%) | 14 (10.8%) |
Disability Class: Ambulatory Difficulty
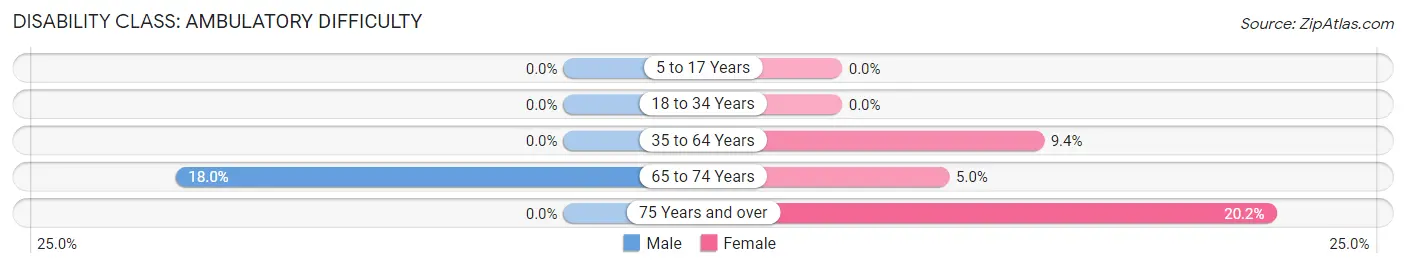
| Age Bracket | Male | Female |
| 5 to 17 Years | 0 (0.0%) | 0 (0.0%) |
| 18 to 34 Years | 0 (0.0%) | 0 (0.0%) |
| 35 to 64 Years | 0 (0.0%) | 40 (9.4%) |
| 65 to 74 Years | 18 (18.0%) | 14 (5.0%) |
| 75 Years and over | 0 (0.0%) | 26 (20.2%) |
Disability Class: Self-Care Difficulty
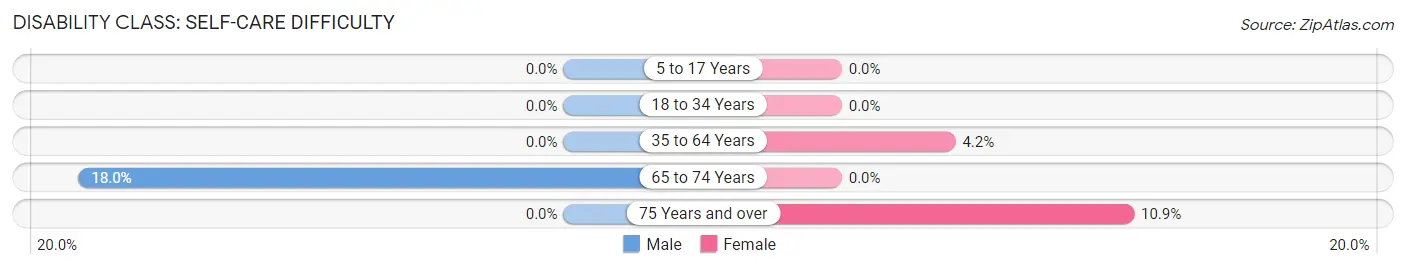
| Age Bracket | Male | Female |
| 5 to 17 Years | 0 (0.0%) | 0 (0.0%) |
| 18 to 34 Years | 0 (0.0%) | 0 (0.0%) |
| 35 to 64 Years | 0 (0.0%) | 18 (4.2%) |
| 65 to 74 Years | 18 (18.0%) | 0 (0.0%) |
| 75 Years and over | 0 (0.0%) | 14 (10.8%) |
Technology Access in Dequincy
Computing Device Access in Dequincy
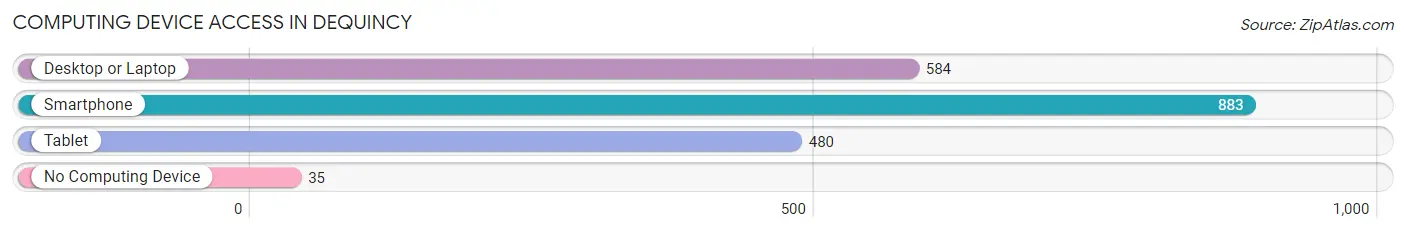
| Device Type | # Households | % Households |
| Desktop or Laptop | 584 | 63.6% |
| Smartphone | 883 | 96.2% |
| Tablet | 480 | 52.3% |
| No Computing Device | 35 | 3.8% |
| Total | 918 | 100.0% |
Internet Access in Dequincy
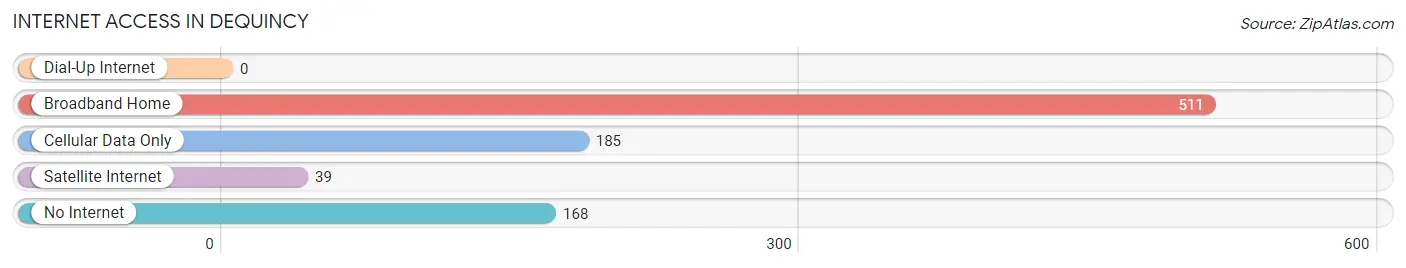
| Internet Type | # Households | % Households |
| Dial-Up Internet | 0 | 0.0% |
| Broadband Home | 511 | 55.7% |
| Cellular Data Only | 185 | 20.2% |
| Satellite Internet | 39 | 4.3% |
| No Internet | 168 | 18.3% |
| Total | 918 | 100.0% |
Dequincy Summary
Dequincy is a small city located in Calcasieu Parish, Louisiana. It is situated on the banks of the Sabine River, approximately 25 miles east of Lake Charles. The city has a population of approximately 3,000 people and is part of the Lake Charles Metropolitan Statistical Area.
History
Dequincy was founded in 1883 by the DeQuincy Land and Lumber Company. The company was established by a group of investors from New Orleans and was named after the town of DeQuincy, France. The company was responsible for the development of the town, which included the construction of a sawmill, a railroad, and a hotel. The sawmill was the first in the area and was used to produce lumber for the construction of homes and businesses.
The town grew rapidly and by the early 1900s, it had become a thriving community. The railroad was a major factor in the growth of the town, as it allowed for the transportation of goods and people to and from the area. The town also had a number of businesses, including a bank, a newspaper, and a variety of stores.
In the 1920s, the town experienced a period of decline due to the Great Depression. However, the town was able to recover and by the 1950s, it had become a popular tourist destination. The town was also home to a number of oil and gas companies, which helped to fuel the local economy.
Geography
Dequincy is located in Calcasieu Parish, Louisiana. It is situated on the banks of the Sabine River, approximately 25 miles east of Lake Charles. The city has a total area of 2.2 square miles, all of which is land. The city is located in a humid subtropical climate zone and experiences hot, humid summers and mild winters.
Economy
Dequincy’s economy is largely based on the oil and gas industry. The city is home to a number of oil and gas companies, which employ a large number of people in the area. The city is also home to a number of other businesses, including retail stores, restaurants, and hotels.
Demographics
As of the 2010 census, the population of Dequincy was 3,068. The racial makeup of the city was 79.3% White, 17.2% African American, 0.7% Native American, 0.3% Asian, 0.1% Pacific Islander, and 2.4% from other races. The median household income was $31,944 and the median family income was $41,250. The per capita income was $17,845.
Conclusion
Dequincy is a small city located in Calcasieu Parish, Louisiana. It is situated on the banks of the Sabine River, approximately 25 miles east of Lake Charles. The city has a population of approximately 3,000 people and is part of the Lake Charles Metropolitan Statistical Area. The economy of the city is largely based on the oil and gas industry, and the city is home to a number of businesses, including retail stores, restaurants, and hotels. The population of the city is largely white, with a small percentage of African Americans, Native Americans, Asians, and Pacific Islanders.
Common Questions
What is Per Capita Income in Dequincy?
Per Capita income in Dequincy is $23,800.
What is the Median Family Income in Dequincy?
Median Family Income in Dequincy is $72,171.
What is the Median Household income in Dequincy?
Median Household Income in Dequincy is $51,500.
What is Income or Wage Gap in Dequincy?
Income or Wage Gap in Dequincy is 25.4%.
Women in Dequincy earn 74.6 cents for every dollar earned by a man.
What is Inequality or Gini Index in Dequincy?
Inequality or Gini Index in Dequincy is 0.47.
What is the Total Population of Dequincy?
Total Population of Dequincy is 3,058.
What is the Total Male Population of Dequincy?
Total Male Population of Dequincy is 1,704.
What is the Total Female Population of Dequincy?
Total Female Population of Dequincy is 1,354.
What is the Ratio of Males per 100 Females in Dequincy?
There are 125.85 Males per 100 Females in Dequincy.
What is the Ratio of Females per 100 Males in Dequincy?
There are 79.46 Females per 100 Males in Dequincy.
What is the Median Population Age in Dequincy?
Median Population Age in Dequincy is 37.5 Years.
What is the Average Family Size in Dequincy
Average Family Size in Dequincy is 4.4 People.
What is the Average Household Size in Dequincy
Average Household Size in Dequincy is 3.3 People.
How Large is the Labor Force in Dequincy?
There are 1,105 People in the Labor Forcein in Dequincy.
What is the Percentage of People in the Labor Force in Dequincy?
50.8% of People are in the Labor Force in Dequincy.
What is the Unemployment Rate in Dequincy?
Unemployment Rate in Dequincy is 1.2%.