Zip Codes with the Highest Percentage of Population Employed in Agriculture, Fishing & Hunting in Covington, LA
RELATED REPORTS & OPTIONS
Agriculture, Fishing & Hunting
Covington
Compare Zip Codes
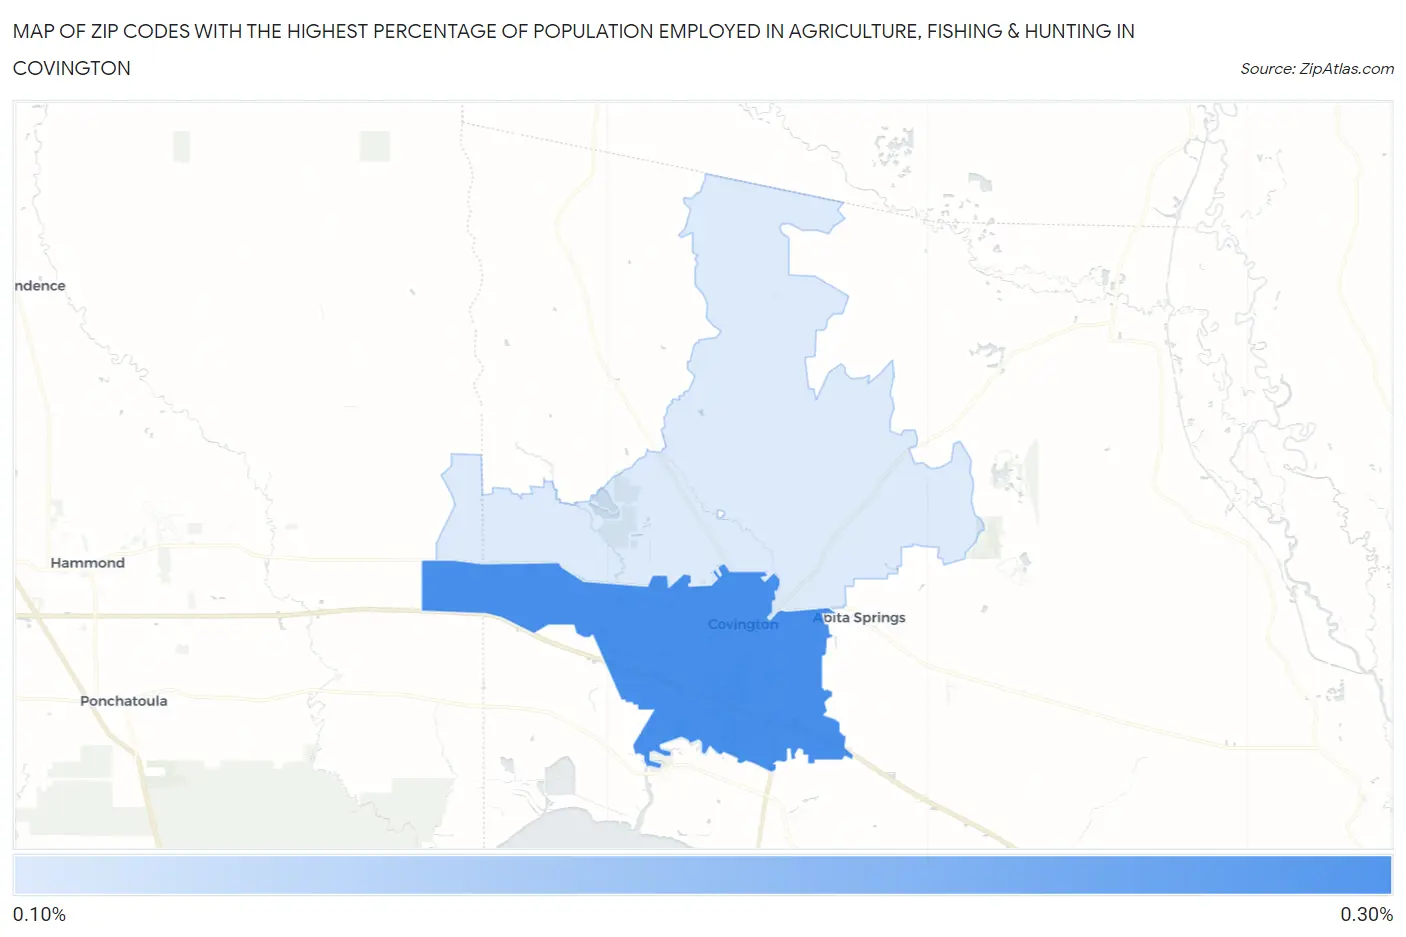
Map of Zip Codes with the Highest Percentage of Population Employed in Agriculture, Fishing & Hunting in Covington
0.0%
0.30%
Zip Codes with the Highest Percentage of Population Employed in Agriculture, Fishing & Hunting in Covington, LA
| Zip Code | % Employed | vs State | vs National | |
| 1. | 70433 | 0.27% | 1.0%(-0.736)#310 | 1.2%(-0.926)#21,494 |
| 2. | 70435 | 0.11% | 1.0%(-0.898)#342 | 1.2%(-1.09)#23,528 |
1
Common Questions
What are the Top Zip Codes with the Highest Percentage of Population Employed in Agriculture, Fishing & Hunting in Covington, LA?
Top Zip Codes with the Highest Percentage of Population Employed in Agriculture, Fishing & Hunting in Covington, LA are:
What zip code has the Highest Percentage of Population Employed in Agriculture, Fishing & Hunting in Covington, LA?
70433 has the Highest Percentage of Population Employed in Agriculture, Fishing & Hunting in Covington, LA with 0.27%.
What is the Percentage of Population Employed in Agriculture, Fishing & Hunting in Covington, LA?
Percentage of Population Employed in Agriculture, Fishing & Hunting in Covington is 0.16%.
What is the Percentage of Population Employed in Agriculture, Fishing & Hunting in Louisiana?
Percentage of Population Employed in Agriculture, Fishing & Hunting in Louisiana is 1.0%.
What is the Percentage of Population Employed in Agriculture, Fishing & Hunting in the United States?
Percentage of Population Employed in Agriculture, Fishing & Hunting in the United States is 1.2%.