Charenton, LA Map & Demographics
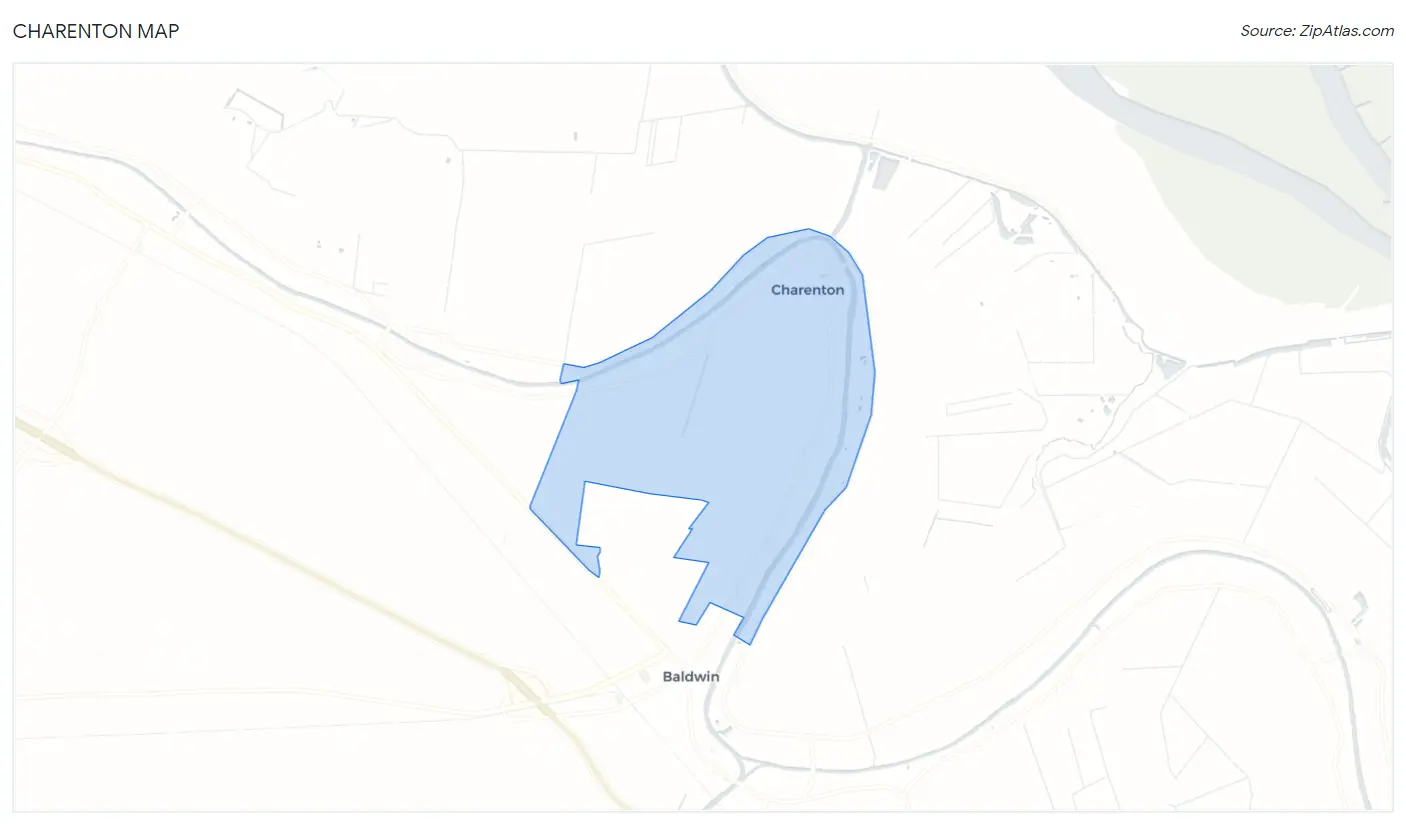
Charenton Map
Charenton Overview
$29,481
PER CAPITA INCOME
$65,938
AVG FAMILY INCOME
$50,282
AVG HOUSEHOLD INCOME
22.1%
WAGE / INCOME GAP [ % ]
77.9¢/ $1
WAGE / INCOME GAP [ $ ]
0.42
INEQUALITY / GINI INDEX
1,051
TOTAL POPULATION
556
MALE POPULATION
495
FEMALE POPULATION
112.32
MALES / 100 FEMALES
89.03
FEMALES / 100 MALES
46.0
MEDIAN AGE
2.7
AVG FAMILY SIZE
2.4
AVG HOUSEHOLD SIZE
471
LABOR FORCE [ PEOPLE ]
54.9%
PERCENT IN LABOR FORCE
4.1%
UNEMPLOYMENT RATE
Charenton Zip Codes
Income in Charenton
Income Overview in Charenton
Per Capita Income in Charenton is $29,481, while median incomes of families and households are $65,938 and $50,282 respectively.
| Characteristic | Number | Measure |
| Per Capita Income | 1,051 | $29,481 |
| Median Family Income | 319 | $65,938 |
| Mean Family Income | 319 | $76,848 |
| Median Household Income | 443 | $50,282 |
| Mean Household Income | 443 | $65,607 |
| Income Deficit | 319 | $0 |
| Wage / Income Gap (%) | 1,051 | 22.11% |
| Wage / Income Gap ($) | 1,051 | 77.89¢ per $1 |
| Gini / Inequality Index | 1,051 | 0.42 |
Earnings by Sex in Charenton
Average Earnings in Charenton are $46,667, $58,750 for men and $45,762 for women, a difference of 22.1%.
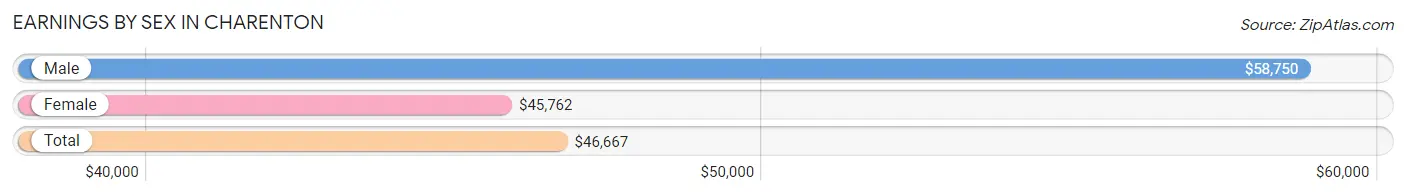
| Sex | Number | Average Earnings |
| Male | 237 (50.2%) | $58,750 |
| Female | 235 (49.8%) | $45,762 |
| Total | 472 (100.0%) | $46,667 |
Earnings by Sex by Income Bracket in Charenton
The most common earnings brackets in Charenton are $100,000+ for men (54 | 22.8%) and $45,000 to $49,999 for women (92 | 39.2%).
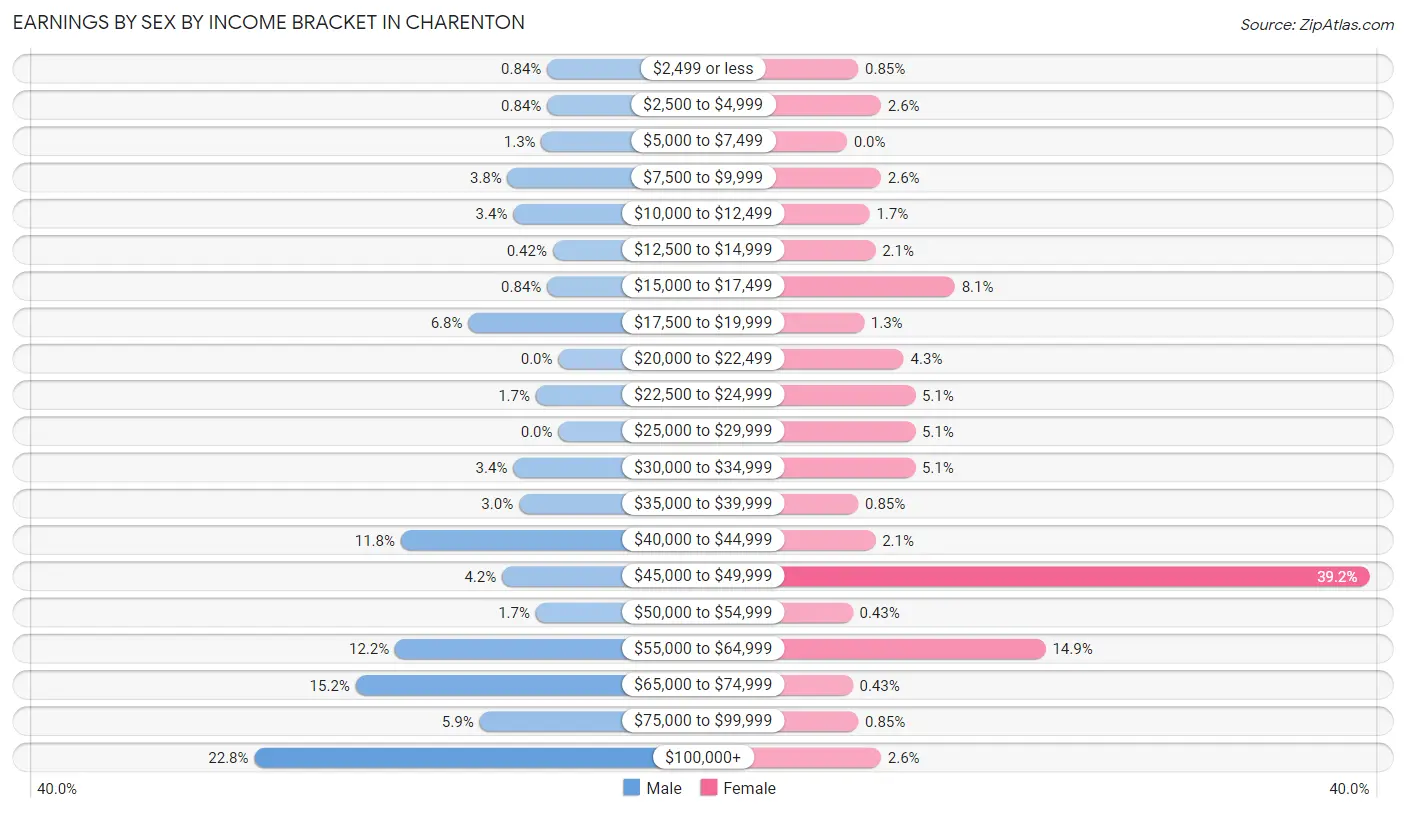
| Income | Male | Female |
| $2,499 or less | 2 (0.8%) | 2 (0.9%) |
| $2,500 to $4,999 | 2 (0.8%) | 6 (2.5%) |
| $5,000 to $7,499 | 3 (1.3%) | 0 (0.0%) |
| $7,500 to $9,999 | 9 (3.8%) | 6 (2.5%) |
| $10,000 to $12,499 | 8 (3.4%) | 4 (1.7%) |
| $12,500 to $14,999 | 1 (0.4%) | 5 (2.1%) |
| $15,000 to $17,499 | 2 (0.8%) | 19 (8.1%) |
| $17,500 to $19,999 | 16 (6.8%) | 3 (1.3%) |
| $20,000 to $22,499 | 0 (0.0%) | 10 (4.3%) |
| $22,500 to $24,999 | 4 (1.7%) | 12 (5.1%) |
| $25,000 to $29,999 | 0 (0.0%) | 12 (5.1%) |
| $30,000 to $34,999 | 8 (3.4%) | 12 (5.1%) |
| $35,000 to $39,999 | 7 (2.9%) | 2 (0.9%) |
| $40,000 to $44,999 | 28 (11.8%) | 5 (2.1%) |
| $45,000 to $49,999 | 10 (4.2%) | 92 (39.2%) |
| $50,000 to $54,999 | 4 (1.7%) | 1 (0.4%) |
| $55,000 to $64,999 | 29 (12.2%) | 35 (14.9%) |
| $65,000 to $74,999 | 36 (15.2%) | 1 (0.4%) |
| $75,000 to $99,999 | 14 (5.9%) | 2 (0.9%) |
| $100,000+ | 54 (22.8%) | 6 (2.5%) |
| Total | 237 (100.0%) | 235 (100.0%) |
Earnings by Sex by Educational Attainment in Charenton
Average earnings in Charenton are $63,000 for men and $45,938 for women, a difference of 27.1%. Men with an educational attainment of bachelor's degree enjoy the highest average annual earnings of $83,333, while those with college or associate's degree education earn the least with $46,250. Women with an educational attainment of high school diploma earn the most with the average annual earnings of $46,146, while those with less than high school education have the smallest earnings of $26,667.
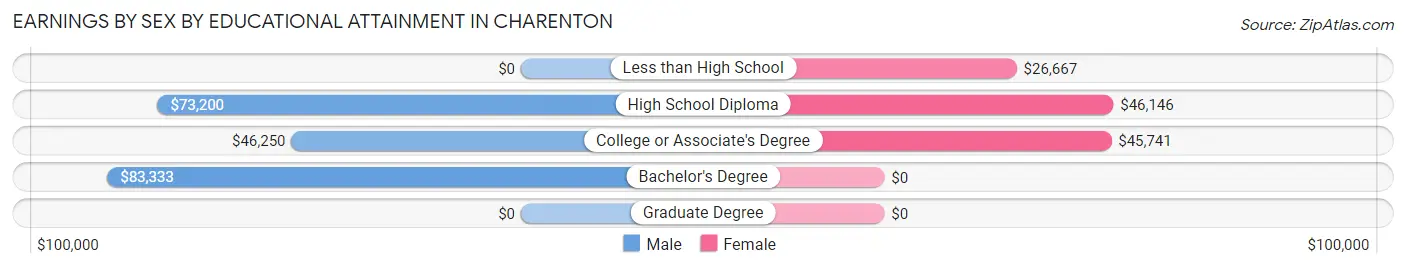
| Educational Attainment | Male Income | Female Income |
| Less than High School | - | - |
| High School Diploma | $73,200 | $46,146 |
| College or Associate's Degree | $46,250 | $45,741 |
| Bachelor's Degree | $83,333 | $0 |
| Graduate Degree | - | - |
| Total | $63,000 | $45,938 |
Family Income in Charenton
Family Income Brackets in Charenton
According to the Charenton family income data, there are 67 families falling into the $75,000 to $99,999 income range, which is the most common income bracket and makes up 21.0% of all families. Conversely, the $200,000+ income bracket is the least frequent group with only 9 families (2.8%) belonging to this category.
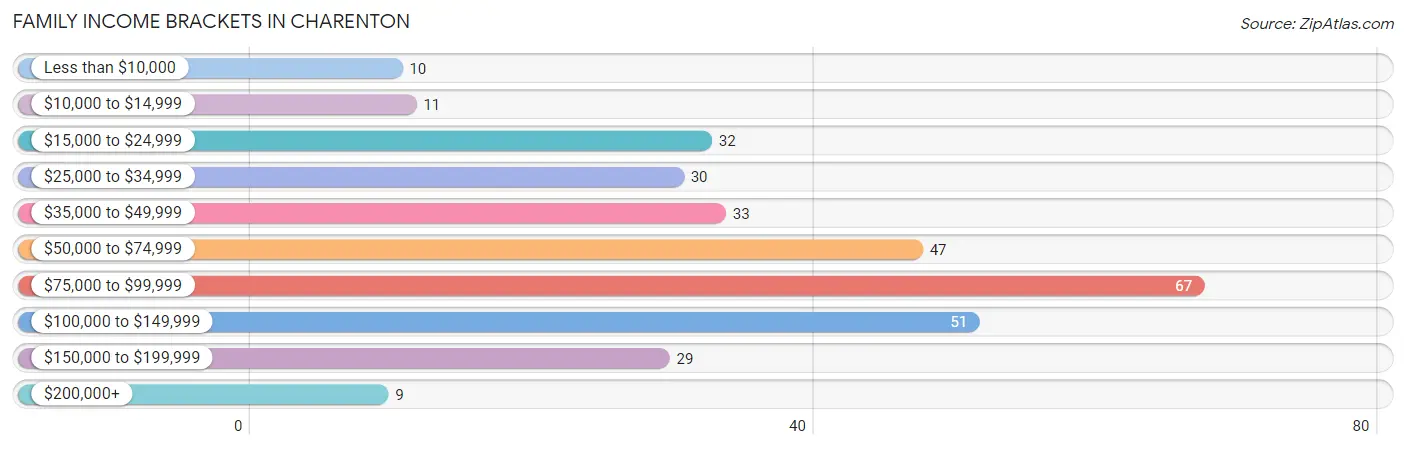
| Income Bracket | # Families | % Families |
| Less than $10,000 | 10 | 3.1% |
| $10,000 to $14,999 | 11 | 3.4% |
| $15,000 to $24,999 | 32 | 10.0% |
| $25,000 to $34,999 | 30 | 9.4% |
| $35,000 to $49,999 | 33 | 10.3% |
| $50,000 to $74,999 | 47 | 14.7% |
| $75,000 to $99,999 | 67 | 21.0% |
| $100,000 to $149,999 | 51 | 16.0% |
| $150,000 to $199,999 | 29 | 9.1% |
| $200,000+ | 9 | 2.8% |
Family Income by Famaliy Size in Charenton
5-person families (19 | 6.0%) account for the highest median family income in Charenton with $101,406 per family, while 3-person families (96 | 30.1%) have the highest median income of $29,028 per family member.
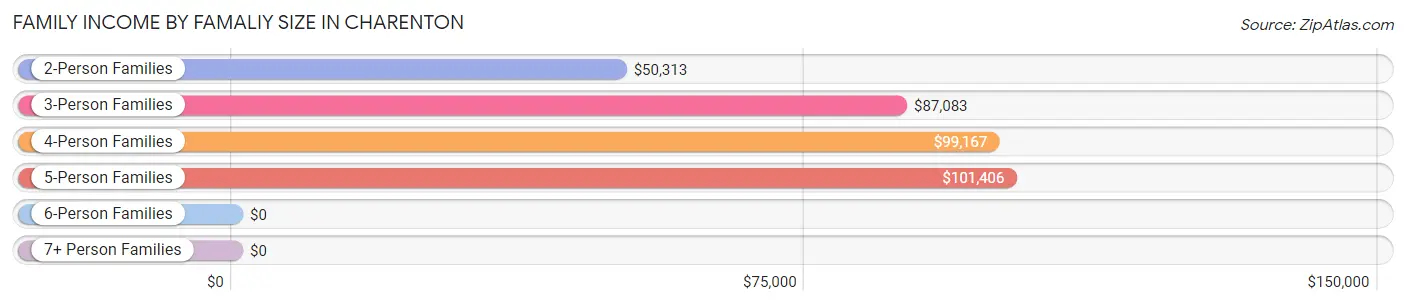
| Income Bracket | # Families | Median Income |
| 2-Person Families | 171 (53.6%) | $50,313 |
| 3-Person Families | 96 (30.1%) | $87,083 |
| 4-Person Families | 28 (8.8%) | $99,167 |
| 5-Person Families | 19 (6.0%) | $101,406 |
| 6-Person Families | 5 (1.6%) | $0 |
| 7+ Person Families | 0 (0.0%) | $0 |
| Total | 319 (100.0%) | $65,938 |
Family Income by Number of Earners in Charenton
The median family income in Charenton is $65,938, with families comprising 2 earners (108) having the highest median family income of $100,000, while families with no earners (47) have the lowest median family income of $26,302, accounting for 33.9% and 14.7% of families, respectively.
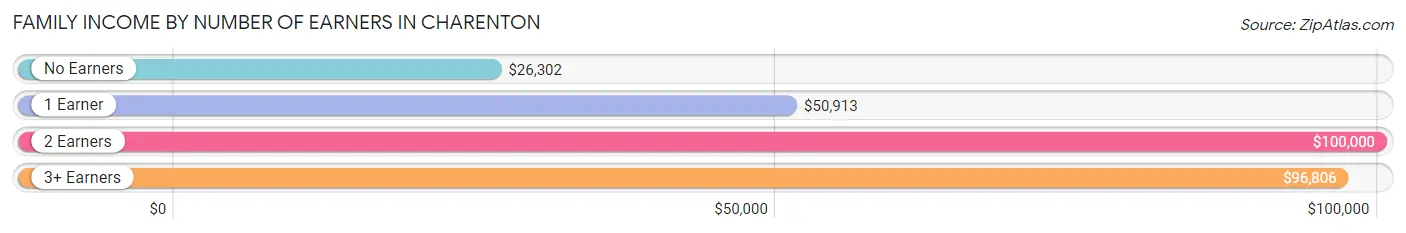
| Number of Earners | # Families | Median Income |
| No Earners | 47 (14.7%) | $26,302 |
| 1 Earner | 147 (46.1%) | $50,913 |
| 2 Earners | 108 (33.9%) | $100,000 |
| 3+ Earners | 17 (5.3%) | $96,806 |
| Total | 319 (100.0%) | $65,938 |
Household Income in Charenton
Household Income Brackets in Charenton
With 73 households falling in the category, the $35,000 to $49,999 income range is the most frequent in Charenton, accounting for 16.5% of all households. In contrast, only 9 households (2.0%) fall into the $200,000+ income bracket, making it the least populous group.
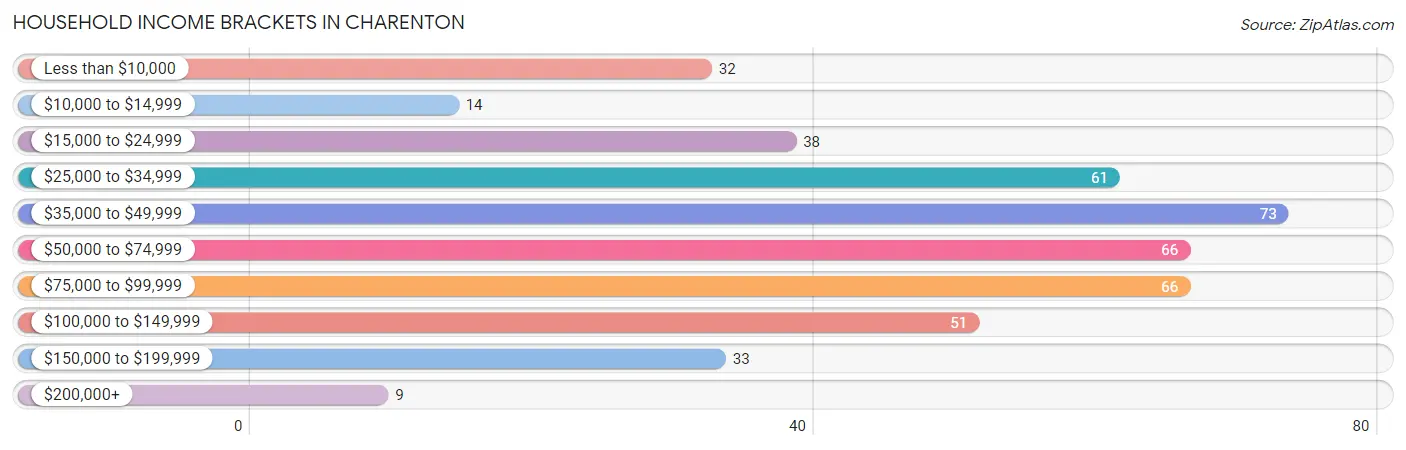
| Income Bracket | # Households | % Households |
| Less than $10,000 | 32 | 7.2% |
| $10,000 to $14,999 | 14 | 3.2% |
| $15,000 to $24,999 | 38 | 8.6% |
| $25,000 to $34,999 | 61 | 13.8% |
| $35,000 to $49,999 | 73 | 16.5% |
| $50,000 to $74,999 | 66 | 14.9% |
| $75,000 to $99,999 | 66 | 14.9% |
| $100,000 to $149,999 | 51 | 11.5% |
| $150,000 to $199,999 | 33 | 7.4% |
| $200,000+ | 9 | 2.0% |
Household Income by Householder Age in Charenton
The median household income in Charenton is $50,282, with the highest median household income of $84,375 found in the 25 to 44 years age bracket for the primary householder. A total of 123 households (27.8%) fall into this category. Meanwhile, the 15 to 24 years age bracket for the primary householder has the lowest median household income of $28,750, with 10 households (2.3%) in this group.
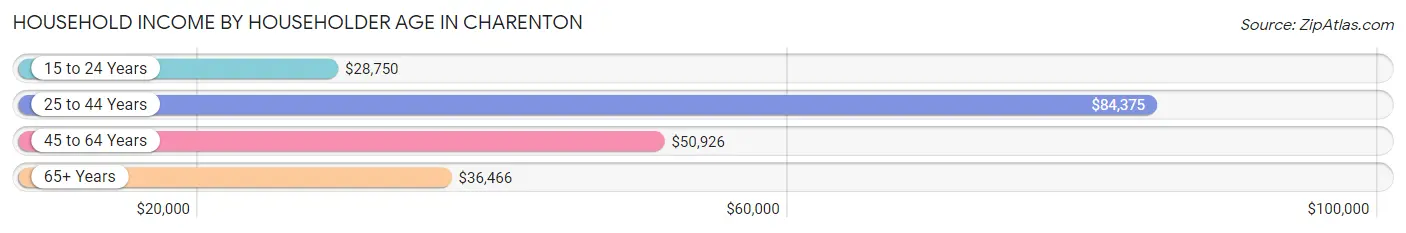
| Income Bracket | # Households | Median Income |
| 15 to 24 Years | 10 (2.3%) | $28,750 |
| 25 to 44 Years | 123 (27.8%) | $84,375 |
| 45 to 64 Years | 196 (44.2%) | $50,926 |
| 65+ Years | 114 (25.7%) | $36,466 |
| Total | 443 (100.0%) | $50,282 |
Poverty in Charenton
Income Below Poverty by Sex and Age in Charenton
With 14.6% poverty level for males and 15.7% for females among the residents of Charenton, 6 to 11 year old males and 16 and 17 year old females are the most vulnerable to poverty, with 8 males (28.6%) and 9 females (75.0%) in their respective age groups living below the poverty level.
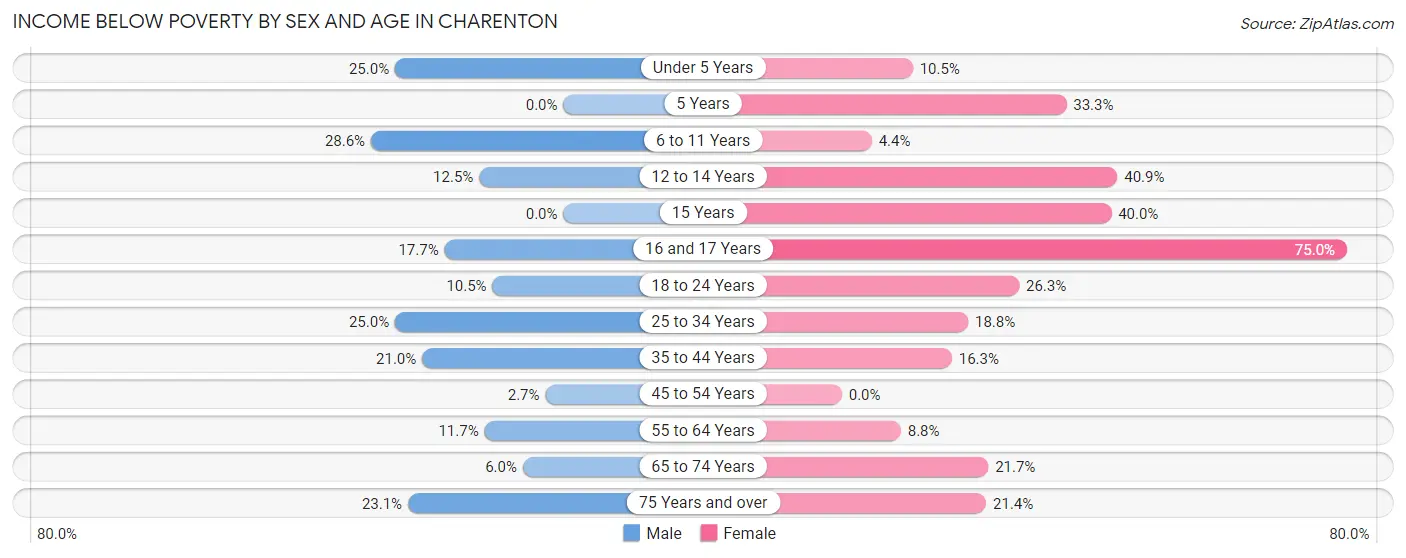
| Age Bracket | Male | Female |
| Under 5 Years | 11 (25.0%) | 2 (10.5%) |
| 5 Years | 0 (0.0%) | 1 (33.3%) |
| 6 to 11 Years | 8 (28.6%) | 2 (4.4%) |
| 12 to 14 Years | 2 (12.5%) | 9 (40.9%) |
| 15 Years | 0 (0.0%) | 2 (40.0%) |
| 16 and 17 Years | 6 (17.6%) | 9 (75.0%) |
| 18 to 24 Years | 2 (10.5%) | 10 (26.3%) |
| 25 to 34 Years | 16 (25.0%) | 9 (18.8%) |
| 35 to 44 Years | 13 (21.0%) | 8 (16.3%) |
| 45 to 54 Years | 2 (2.7%) | 0 (0.0%) |
| 55 to 64 Years | 13 (11.7%) | 12 (8.8%) |
| 65 to 74 Years | 5 (6.0%) | 10 (21.7%) |
| 75 Years and over | 3 (23.1%) | 3 (21.4%) |
| Total | 81 (14.6%) | 77 (15.7%) |
Income Above Poverty by Sex and Age in Charenton
According to the poverty statistics in Charenton, males aged 5 years and females aged 45 to 54 years are the age groups that are most secure financially, with 100.0% of males and 100.0% of females in these age groups living above the poverty line.
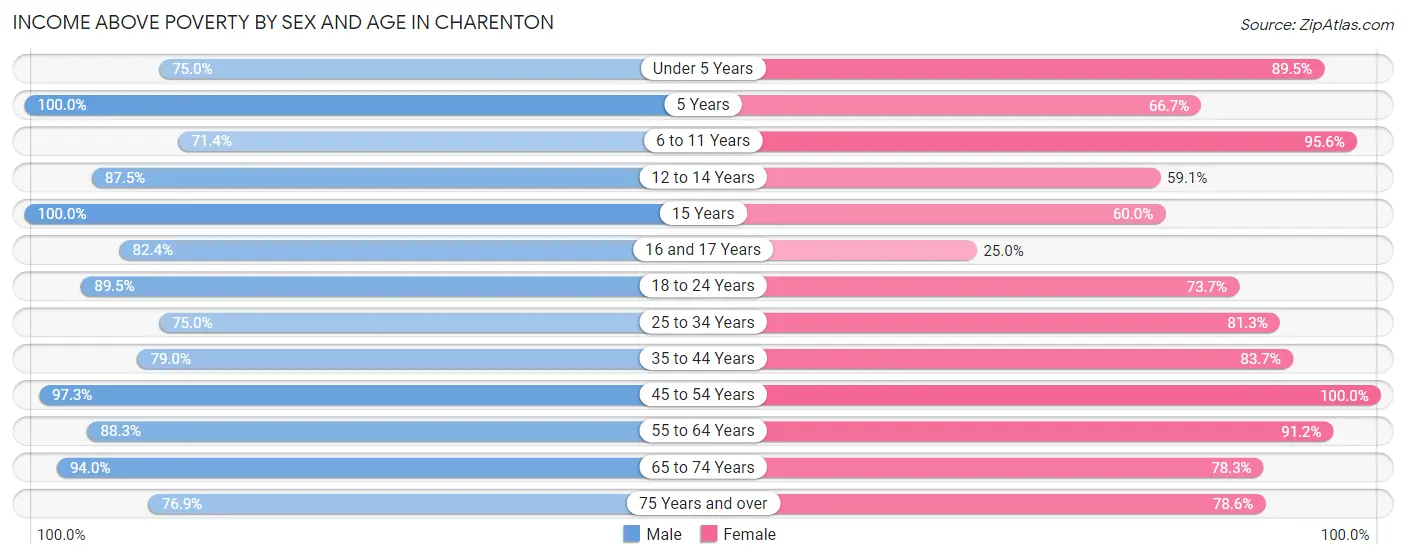
| Age Bracket | Male | Female |
| Under 5 Years | 33 (75.0%) | 17 (89.5%) |
| 5 Years | 2 (100.0%) | 2 (66.7%) |
| 6 to 11 Years | 20 (71.4%) | 43 (95.6%) |
| 12 to 14 Years | 14 (87.5%) | 13 (59.1%) |
| 15 Years | 2 (100.0%) | 3 (60.0%) |
| 16 and 17 Years | 28 (82.4%) | 3 (25.0%) |
| 18 to 24 Years | 17 (89.5%) | 28 (73.7%) |
| 25 to 34 Years | 48 (75.0%) | 39 (81.2%) |
| 35 to 44 Years | 49 (79.0%) | 41 (83.7%) |
| 45 to 54 Years | 73 (97.3%) | 53 (100.0%) |
| 55 to 64 Years | 98 (88.3%) | 125 (91.2%) |
| 65 to 74 Years | 78 (94.0%) | 36 (78.3%) |
| 75 Years and over | 10 (76.9%) | 11 (78.6%) |
| Total | 472 (85.4%) | 414 (84.3%) |
Income Below Poverty Among Married-Couple Families in Charenton
The poverty statistics for married-couple families in Charenton show that 7.1% or 18 of the total 252 families live below the poverty line. Families with 3 or 4 children have the highest poverty rate of 17.4%, comprising of 4 families. On the other hand, families with no children have the lowest poverty rate of 3.7%, which includes 6 families.
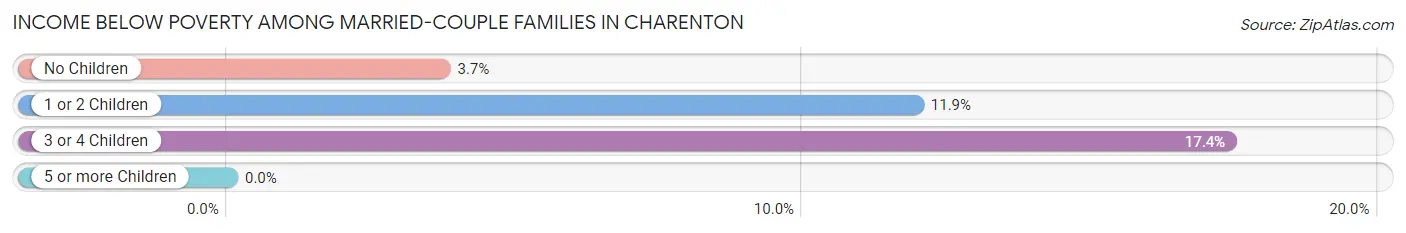
| Children | Above Poverty | Below Poverty |
| No Children | 156 (96.3%) | 6 (3.7%) |
| 1 or 2 Children | 59 (88.1%) | 8 (11.9%) |
| 3 or 4 Children | 19 (82.6%) | 4 (17.4%) |
| 5 or more Children | 0 (0.0%) | 0 (0.0%) |
| Total | 234 (92.9%) | 18 (7.1%) |
Income Below Poverty Among Single-Parent Households in Charenton
According to the poverty data in Charenton, 25.0% or 7 single-father households and 33.3% or 13 single-mother households are living below the poverty line. Among single-father households, those with 1 or 2 children have the highest poverty rate, with 7 households (26.9%) experiencing poverty. Likewise, among single-mother households, those with 1 or 2 children have the highest poverty rate, with 13 households (61.9%) falling below the poverty line.
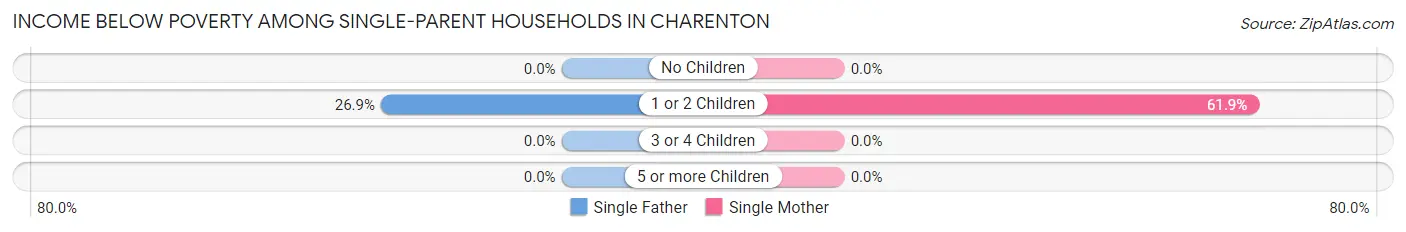
| Children | Single Father | Single Mother |
| No Children | 0 (0.0%) | 0 (0.0%) |
| 1 or 2 Children | 7 (26.9%) | 13 (61.9%) |
| 3 or 4 Children | 0 (0.0%) | 0 (0.0%) |
| 5 or more Children | 0 (0.0%) | 0 (0.0%) |
| Total | 7 (25.0%) | 13 (33.3%) |
Income Below Poverty Among Married-Couple vs Single-Parent Households in Charenton
The poverty data for Charenton shows that 18 of the married-couple family households (7.1%) and 20 of the single-parent households (29.8%) are living below the poverty level. Within the married-couple family households, those with 3 or 4 children have the highest poverty rate, with 4 households (17.4%) falling below the poverty line. Among the single-parent households, those with 1 or 2 children have the highest poverty rate, with 20 household (42.5%) living below poverty.
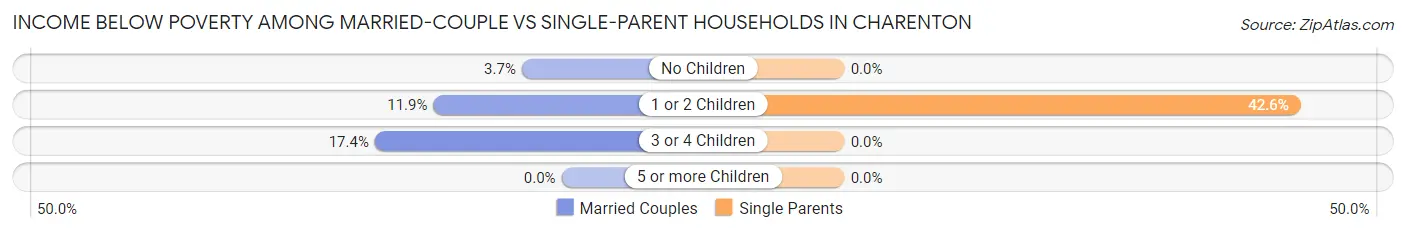
| Children | Married-Couple Families | Single-Parent Households |
| No Children | 6 (3.7%) | 0 (0.0%) |
| 1 or 2 Children | 8 (11.9%) | 20 (42.5%) |
| 3 or 4 Children | 4 (17.4%) | 0 (0.0%) |
| 5 or more Children | 0 (0.0%) | 0 (0.0%) |
| Total | 18 (7.1%) | 20 (29.8%) |
Race in Charenton
The most populous races in Charenton are White / Caucasian (483 | 46.0%), Native / Alaskan (400 | 38.1%), and Two or more Races (122 | 11.6%).
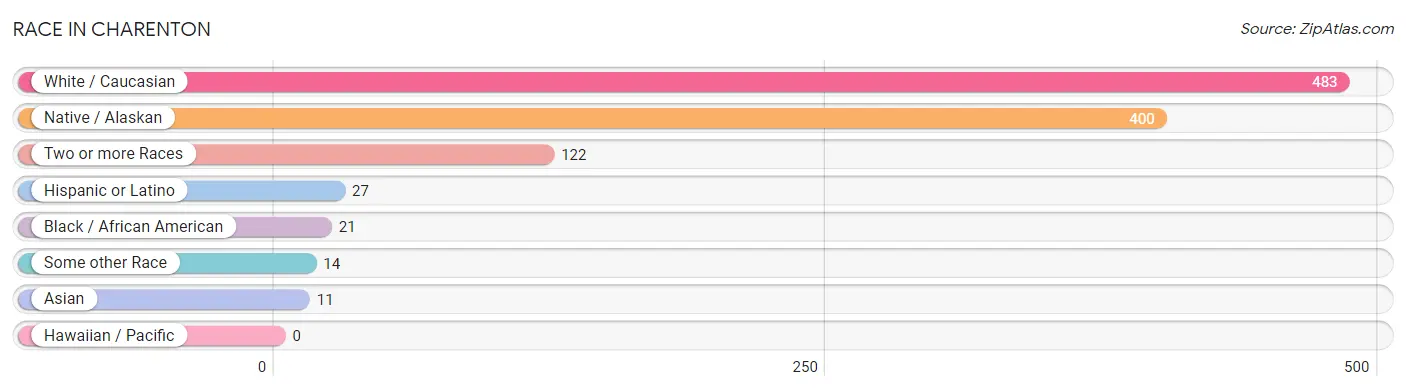
| Race | # Population | % Population |
| Asian | 11 | 1.1% |
| Black / African American | 21 | 2.0% |
| Hawaiian / Pacific | 0 | 0.0% |
| Hispanic or Latino | 27 | 2.6% |
| Native / Alaskan | 400 | 38.1% |
| White / Caucasian | 483 | 46.0% |
| Two or more Races | 122 | 11.6% |
| Some other Race | 14 | 1.3% |
| Total | 1,051 | 100.0% |
Ancestry in Charenton
The most populous ancestries reported in Charenton are French (100 | 9.5%), Irish (53 | 5.0%), Italian (42 | 4.0%), Korean (25 | 2.4%), and Cajun (19 | 1.8%), together accounting for 22.7% of all Charenton residents.
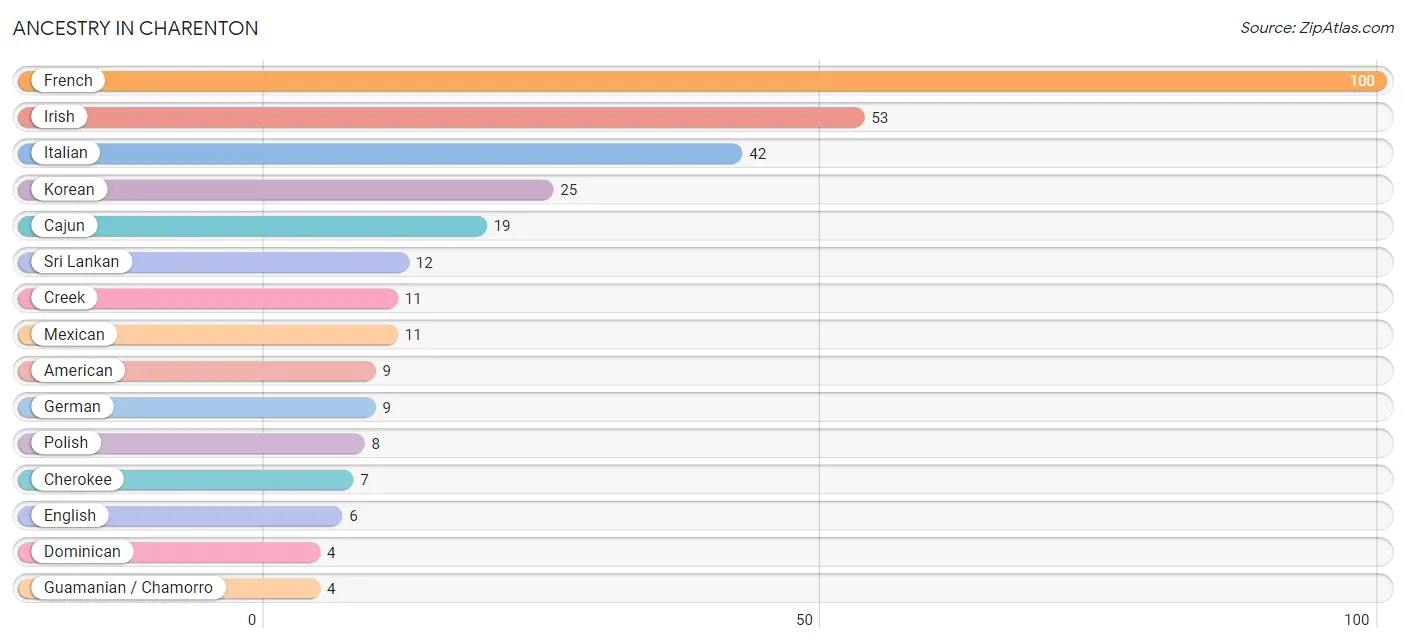
| Ancestry | # Population | % Population |
| American | 9 | 0.9% |
| British | 1 | 0.1% |
| Cajun | 19 | 1.8% |
| Cherokee | 7 | 0.7% |
| Creek | 11 | 1.1% |
| Cuban | 2 | 0.2% |
| Dominican | 4 | 0.4% |
| English | 6 | 0.6% |
| French | 100 | 9.5% |
| French Canadian | 1 | 0.1% |
| German | 9 | 0.9% |
| Guamanian / Chamorro | 4 | 0.4% |
| Inupiat | 1 | 0.1% |
| Irish | 53 | 5.0% |
| Italian | 42 | 4.0% |
| Korean | 25 | 2.4% |
| Mexican | 11 | 1.1% |
| Mexican American Indian | 3 | 0.3% |
| Polish | 8 | 0.8% |
| Puerto Rican | 3 | 0.3% |
| Spanish | 2 | 0.2% |
| Sri Lankan | 12 | 1.1% | View All 22 Rows |
Immigrants in Charenton
The most numerous immigrant groups reported in Charenton came from Asia (9 | 0.9%), South Eastern Asia (9 | 0.9%), Vietnam (6 | 0.6%), and Philippines (3 | 0.3%), together accounting for 2.6% of all Charenton residents.
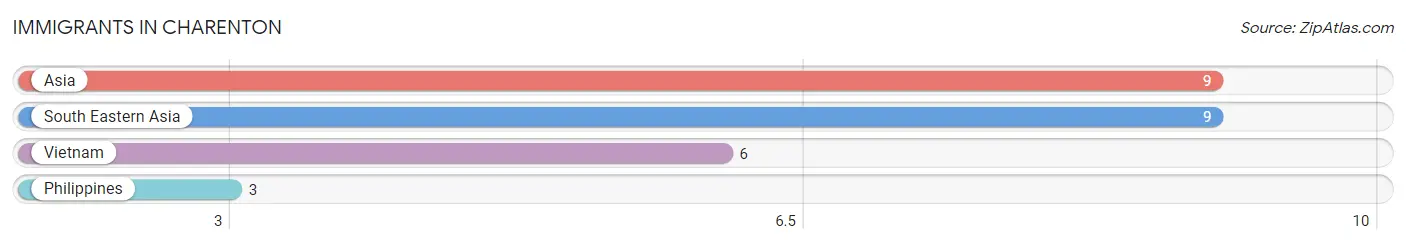
| Immigration Origin | # Population | % Population |
| Asia | 9 | 0.9% |
| Philippines | 3 | 0.3% |
| South Eastern Asia | 9 | 0.9% |
| Vietnam | 6 | 0.6% | View All 4 Rows |
Sex and Age in Charenton
Sex and Age in Charenton
The most populous age groups in Charenton are 65 to 69 Years (69 | 12.4%) for men and 55 to 59 Years (79 | 16.0%) for women.
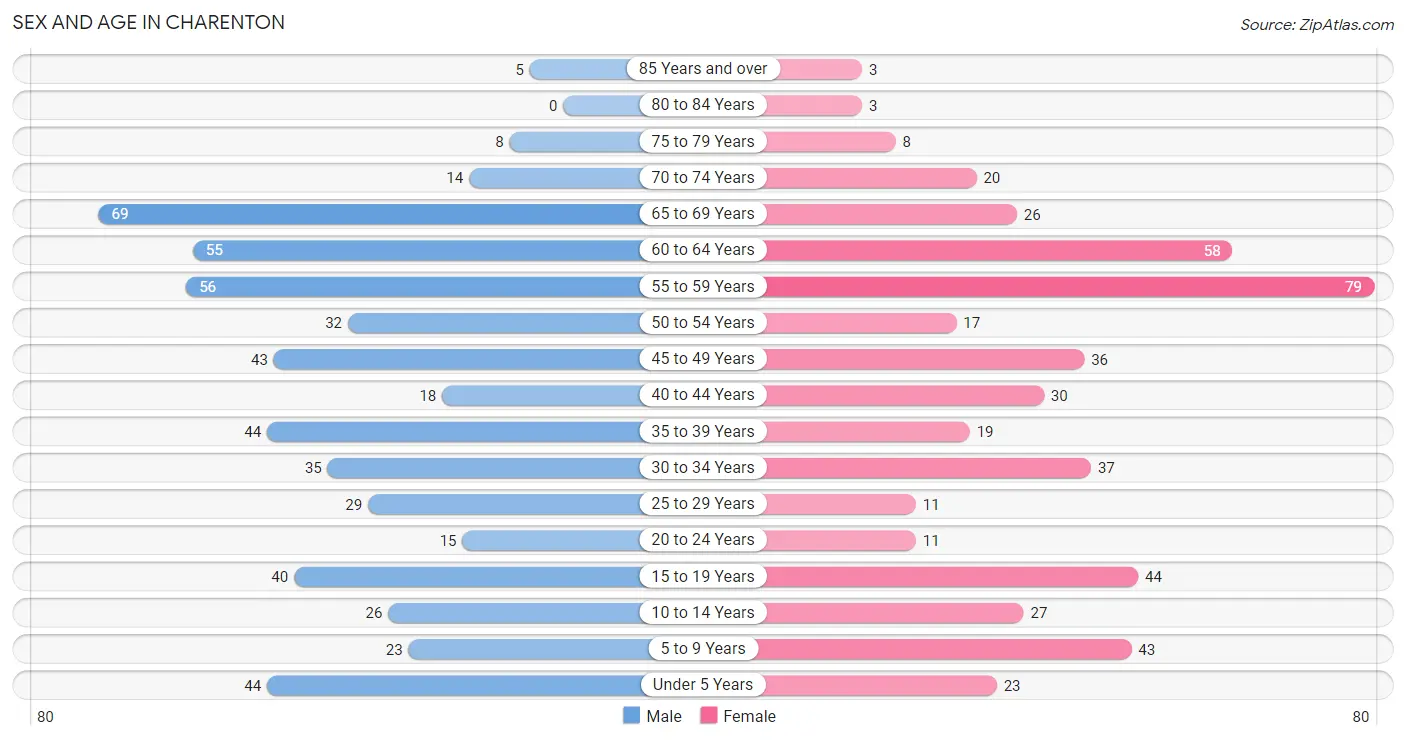
| Age Bracket | Male | Female |
| Under 5 Years | 44 (7.9%) | 23 (4.6%) |
| 5 to 9 Years | 23 (4.1%) | 43 (8.7%) |
| 10 to 14 Years | 26 (4.7%) | 27 (5.4%) |
| 15 to 19 Years | 40 (7.2%) | 44 (8.9%) |
| 20 to 24 Years | 15 (2.7%) | 11 (2.2%) |
| 25 to 29 Years | 29 (5.2%) | 11 (2.2%) |
| 30 to 34 Years | 35 (6.3%) | 37 (7.5%) |
| 35 to 39 Years | 44 (7.9%) | 19 (3.8%) |
| 40 to 44 Years | 18 (3.2%) | 30 (6.1%) |
| 45 to 49 Years | 43 (7.7%) | 36 (7.3%) |
| 50 to 54 Years | 32 (5.8%) | 17 (3.4%) |
| 55 to 59 Years | 56 (10.1%) | 79 (16.0%) |
| 60 to 64 Years | 55 (9.9%) | 58 (11.7%) |
| 65 to 69 Years | 69 (12.4%) | 26 (5.2%) |
| 70 to 74 Years | 14 (2.5%) | 20 (4.0%) |
| 75 to 79 Years | 8 (1.4%) | 8 (1.6%) |
| 80 to 84 Years | 0 (0.0%) | 3 (0.6%) |
| 85 Years and over | 5 (0.9%) | 3 (0.6%) |
| Total | 556 (100.0%) | 495 (100.0%) |
Families and Households in Charenton
Median Family Size in Charenton
The median family size in Charenton is 2.73 persons per family, with single female/mother families (39 | 12.2%) accounting for the largest median family size of 2.97 persons per family. On the other hand, single male/father families (28 | 8.8%) represent the smallest median family size with 1.79 persons per family.
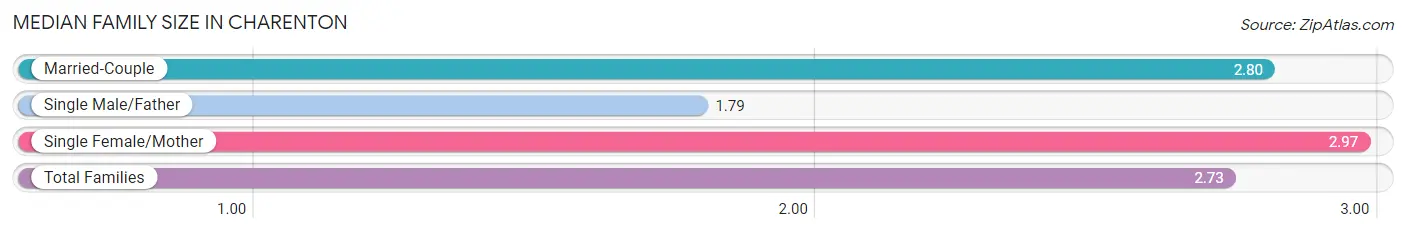
| Family Type | # Families | Family Size |
| Married-Couple | 252 (79.0%) | 2.80 |
| Single Male/Father | 28 (8.8%) | 1.79 |
| Single Female/Mother | 39 (12.2%) | 2.97 |
| Total Families | 319 (100.0%) | 2.73 |
Median Household Size in Charenton
The median household size in Charenton is 2.37 persons per household, with single female/mother households (39 | 8.8%) accounting for the largest median household size of 3.26 persons per household. non-family households (124 | 28.0%) represent the smallest median household size with 1.13 persons per household.
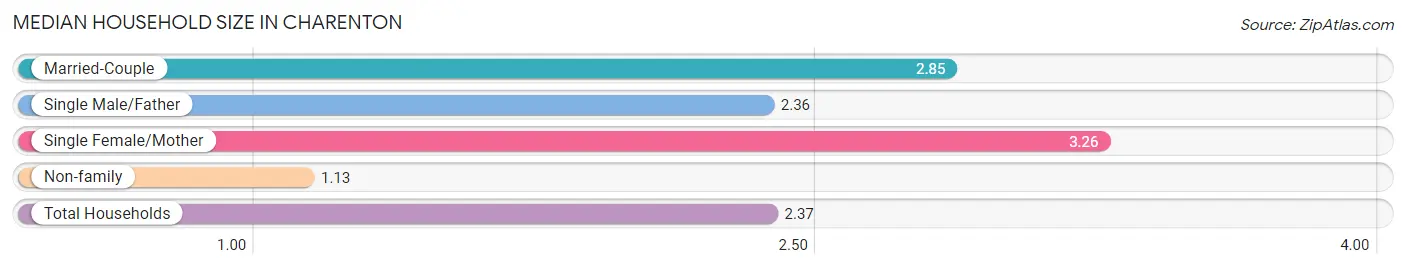
| Household Type | # Households | Household Size |
| Married-Couple | 252 (56.9%) | 2.85 |
| Single Male/Father | 28 (6.3%) | 2.36 |
| Single Female/Mother | 39 (8.8%) | 3.26 |
| Non-family | 124 (28.0%) | 1.13 |
| Total Households | 443 (100.0%) | 2.37 |
Household Size by Marriage Status in Charenton
Out of a total of 443 households in Charenton, 319 (72.0%) are family households, while 124 (28.0%) are nonfamily households. The most numerous type of family households are 2-person households, comprising 160, and the most common type of nonfamily households are 1-person households, comprising 114.
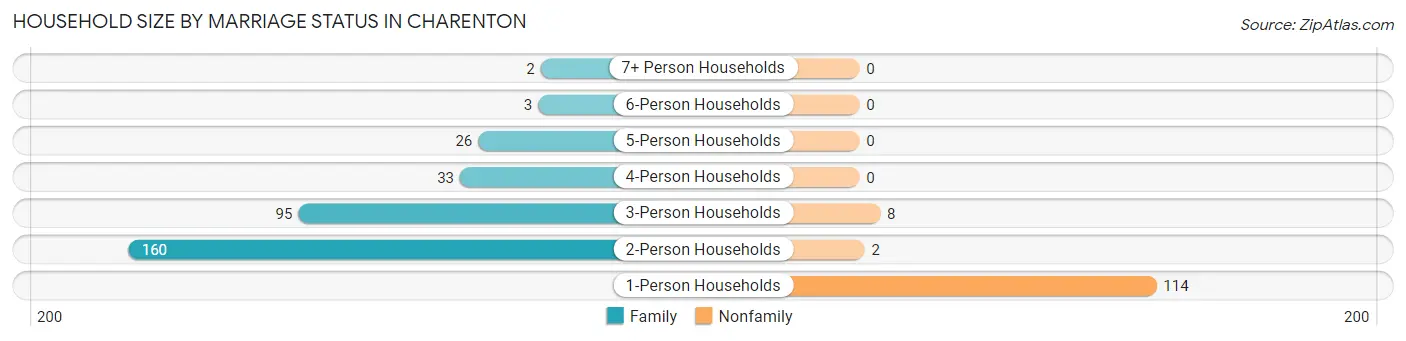
| Household Size | Family Households | Nonfamily Households |
| 1-Person Households | - | 114 (25.7%) |
| 2-Person Households | 160 (36.1%) | 2 (0.4%) |
| 3-Person Households | 95 (21.4%) | 8 (1.8%) |
| 4-Person Households | 33 (7.4%) | 0 (0.0%) |
| 5-Person Households | 26 (5.9%) | 0 (0.0%) |
| 6-Person Households | 3 (0.7%) | 0 (0.0%) |
| 7+ Person Households | 2 (0.4%) | 0 (0.0%) |
| Total | 319 (72.0%) | 124 (28.0%) |
Female Fertility in Charenton
Fertility by Age in Charenton
Average fertility rate in Charenton is 69.0 births per 1,000 women. Women in the age bracket of 20 to 34 years have the highest fertility rate with 136.0 births per 1,000 women. Women in the age bracket of 20 to 34 years acount for 61.5% of all women with births.
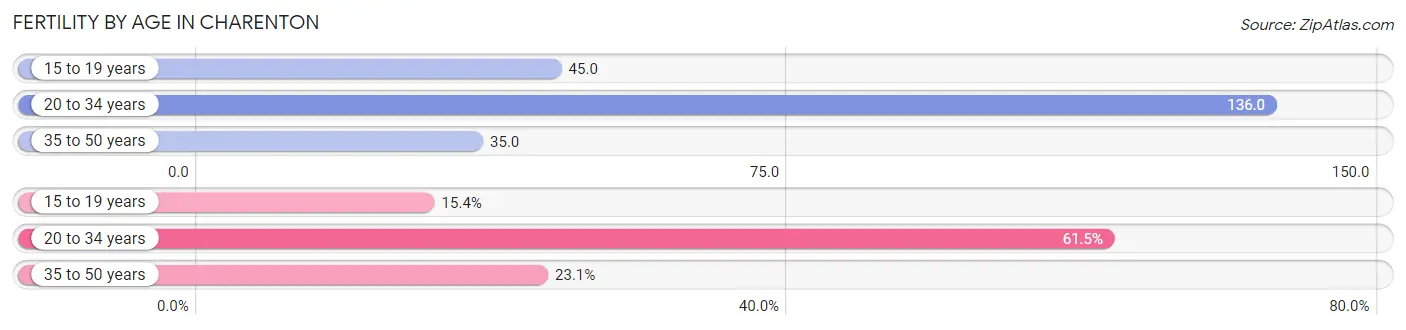
| Age Bracket | Women with Births | Births / 1,000 Women |
| 15 to 19 years | 2 (15.4%) | 45.0 |
| 20 to 34 years | 8 (61.5%) | 136.0 |
| 35 to 50 years | 3 (23.1%) | 35.0 |
| Total | 13 (100.0%) | 69.0 |
Fertility by Age by Marriage Status in Charenton
84.6% of women with births (13) in Charenton are married. The highest percentage of unmarried women with births falls into 15 to 19 years age bracket with 100.0% of them unmarried at the time of birth, while the lowest percentage of unmarried women with births belong to 20 to 34 years age bracket with 0.0% of them unmarried.
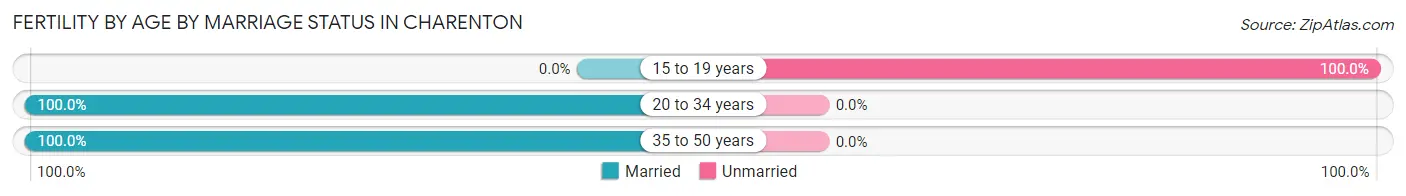
| Age Bracket | Married | Unmarried |
| 15 to 19 years | 0 (0.0%) | 2 (100.0%) |
| 20 to 34 years | 8 (100.0%) | 0 (0.0%) |
| 35 to 50 years | 3 (100.0%) | 0 (0.0%) |
| Total | 11 (84.6%) | 2 (15.4%) |
Fertility by Education in Charenton
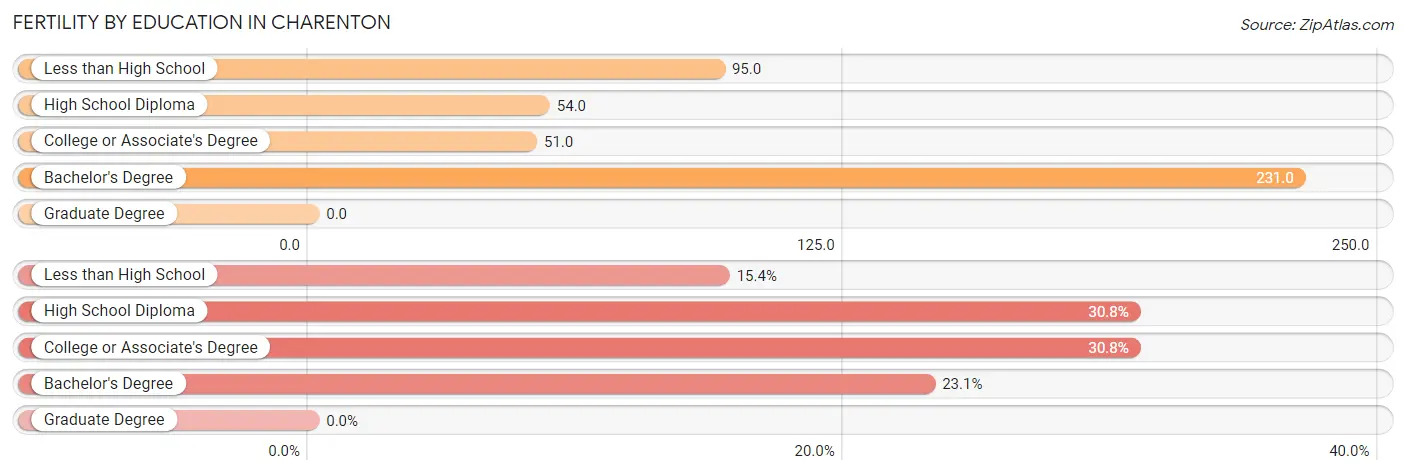
| Educational Attainment | Women with Births | Births / 1,000 Women |
| Less than High School | 2 (15.4%) | 95.0 |
| High School Diploma | 4 (30.8%) | 54.0 |
| College or Associate's Degree | 4 (30.8%) | 51.0 |
| Bachelor's Degree | 3 (23.1%) | 231.0 |
| Graduate Degree | 0 (0.0%) | 0.0 |
| Total | 13 (100.0%) | 69.0 |
Fertility by Education by Marriage Status in Charenton
15.4% of women with births in Charenton are unmarried. Women with the educational attainment of high school diploma are most likely to be married with 100.0% of them married at childbirth, while women with the educational attainment of less than high school are least likely to be married with 100.0% of them unmarried at childbirth.
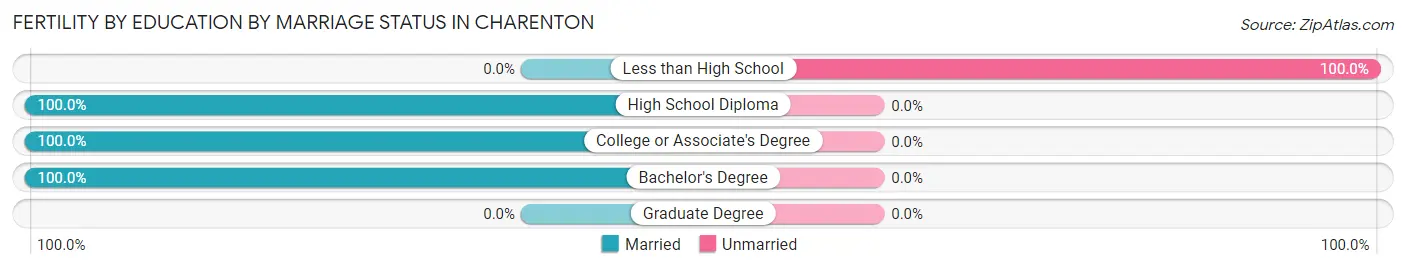
| Educational Attainment | Married | Unmarried |
| Less than High School | 0 (0.0%) | 2 (100.0%) |
| High School Diploma | 4 (100.0%) | 0 (0.0%) |
| College or Associate's Degree | 4 (100.0%) | 0 (0.0%) |
| Bachelor's Degree | 3 (100.0%) | 0 (0.0%) |
| Graduate Degree | 0 (0.0%) | 0 (0.0%) |
| Total | 11 (84.6%) | 2 (15.4%) |
Employment Characteristics in Charenton
Employment by Class of Employer in Charenton
Among the 422 employed individuals in Charenton, private company employees (281 | 66.6%), local government employees (75 | 17.8%), and not-for-profit organizations (33 | 7.8%) make up the most common classes of employment.
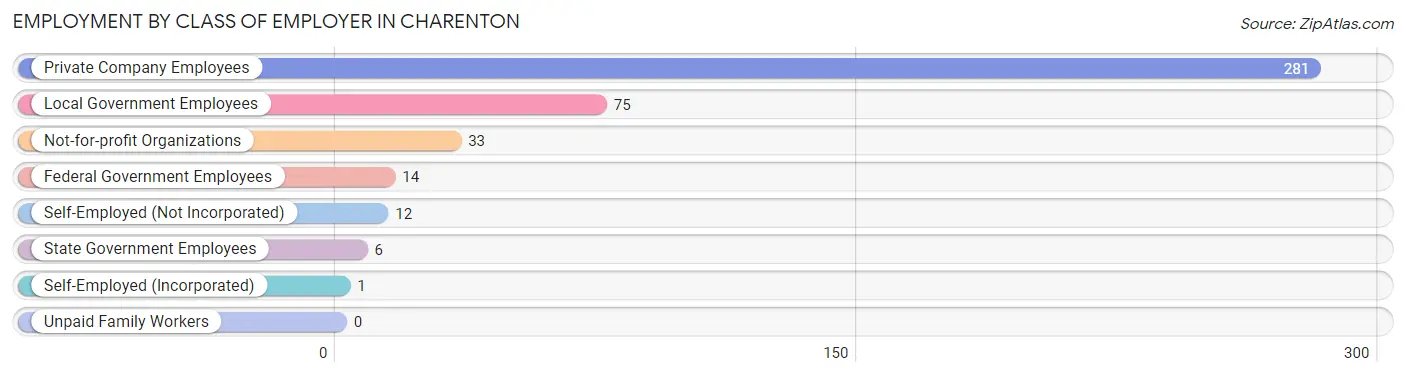
| Employer Class | # Employees | % Employees |
| Private Company Employees | 281 | 66.6% |
| Self-Employed (Incorporated) | 1 | 0.2% |
| Self-Employed (Not Incorporated) | 12 | 2.8% |
| Not-for-profit Organizations | 33 | 7.8% |
| Local Government Employees | 75 | 17.8% |
| State Government Employees | 6 | 1.4% |
| Federal Government Employees | 14 | 3.3% |
| Unpaid Family Workers | 0 | 0.0% |
| Total | 422 | 100.0% |
Employment Status by Age in Charenton
According to the labor force statistics for Charenton, out of the total population over 16 years of age (858), 54.9% or 471 individuals are in the labor force, with 4.1% or 19 of them unemployed. The age group with the highest labor force participation rate is 25 to 29 years, with 92.5% or 37 individuals in the labor force. Within the labor force, the 16 to 19 years age range has the highest percentage of unemployed individuals, with 35.7% or 5 of them being unemployed.
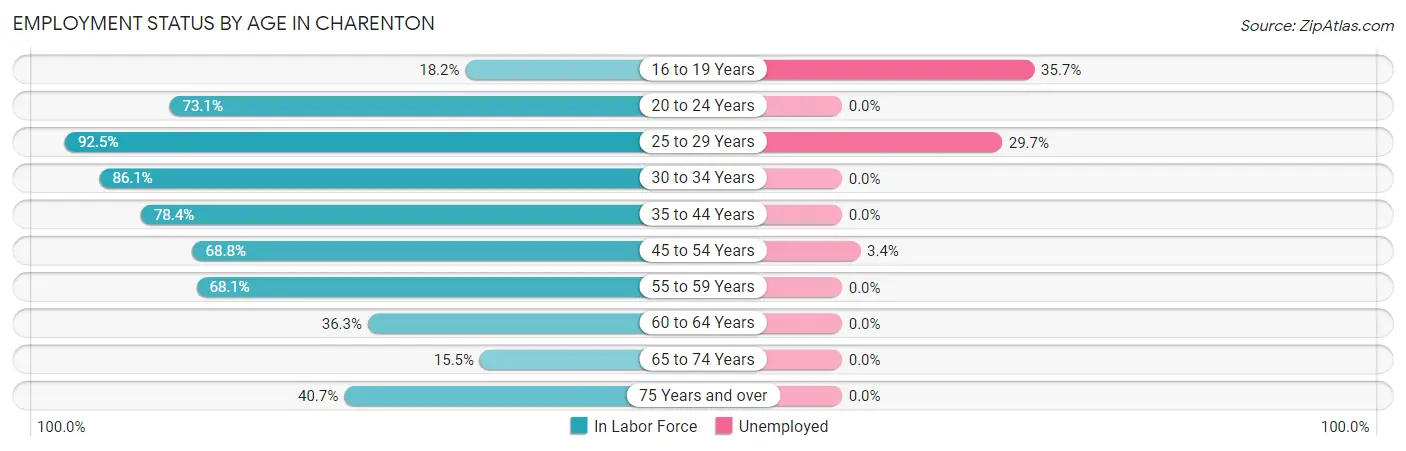
| Age Bracket | In Labor Force | Unemployed |
| 16 to 19 Years | 14 (18.2%) | 5 (35.7%) |
| 20 to 24 Years | 19 (73.1%) | 0 (0.0%) |
| 25 to 29 Years | 37 (92.5%) | 11 (29.7%) |
| 30 to 34 Years | 62 (86.1%) | 0 (0.0%) |
| 35 to 44 Years | 87 (78.4%) | 0 (0.0%) |
| 45 to 54 Years | 88 (68.8%) | 3 (3.4%) |
| 55 to 59 Years | 92 (68.1%) | 0 (0.0%) |
| 60 to 64 Years | 41 (36.3%) | 0 (0.0%) |
| 65 to 74 Years | 20 (15.5%) | 0 (0.0%) |
| 75 Years and over | 11 (40.7%) | 0 (0.0%) |
| Total | 471 (54.9%) | 19 (4.1%) |
Employment Status by Educational Attainment in Charenton
According to labor force statistics for Charenton, 67.9% of individuals (407) out of the total population between 25 and 64 years of age (599) are in the labor force, with 3.5% or 14 of them being unemployed. The group with the highest labor force participation rate are those with the educational attainment of college / associate degree, with 94.7% or 142 individuals in the labor force. Within the labor force, individuals with high school diploma education have the highest percentage of unemployment, with 5.3% or 11 of them being unemployed.
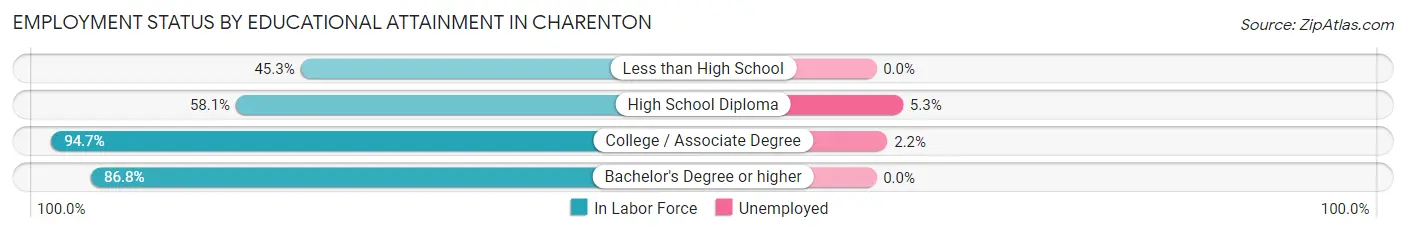
| Educational Attainment | In Labor Force | Unemployed |
| Less than High School | 24 (45.3%) | 0 (0.0%) |
| High School Diploma | 208 (58.1%) | 19 (5.3%) |
| College / Associate Degree | 142 (94.7%) | 3 (2.2%) |
| Bachelor's Degree or higher | 33 (86.8%) | 0 (0.0%) |
| Total | 407 (67.9%) | 21 (3.5%) |
Employment Occupations by Sex in Charenton
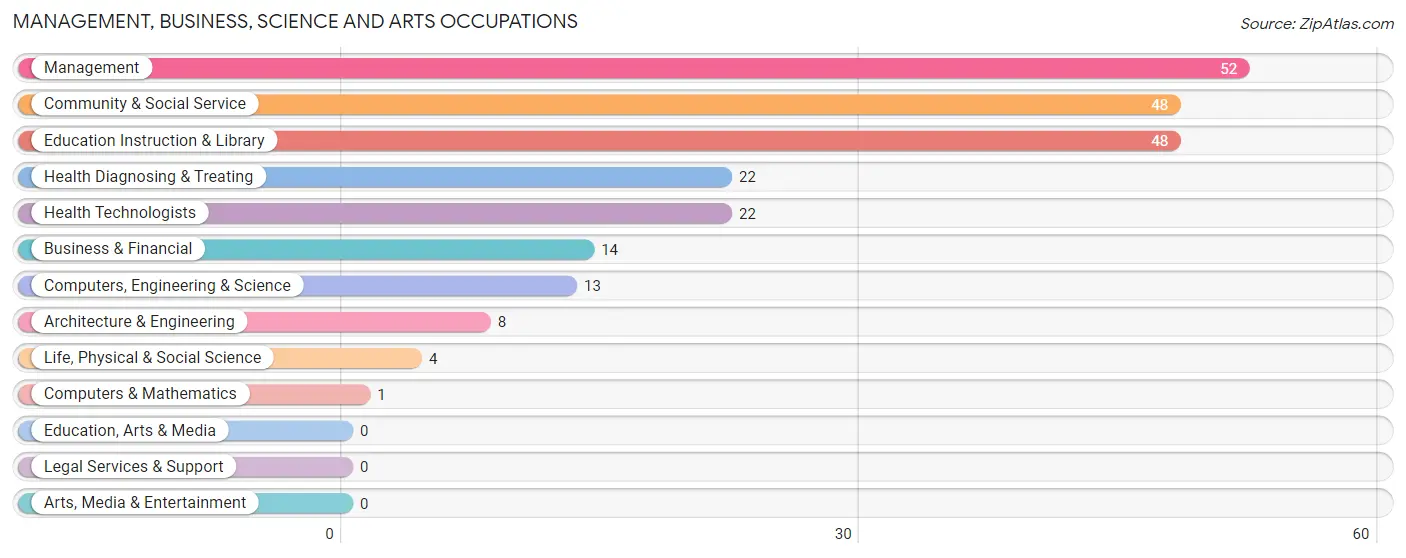
Management, Business, Science and Arts Occupations
The most common Management, Business, Science and Arts occupations in Charenton are Management (52 | 11.7%), Community & Social Service (48 | 10.8%), Education Instruction & Library (48 | 10.8%), Health Diagnosing & Treating (22 | 5.0%), and Health Technologists (22 | 5.0%).
Management, Business, Science and Arts Occupations by Sex
Within the Management, Business, Science and Arts occupations in Charenton, the most male-oriented occupations are Computers, Engineering & Science (100.0%), Computers & Mathematics (100.0%), and Architecture & Engineering (100.0%), while the most female-oriented occupations are Business & Financial (100.0%), Community & Social Service (100.0%), and Education Instruction & Library (100.0%).
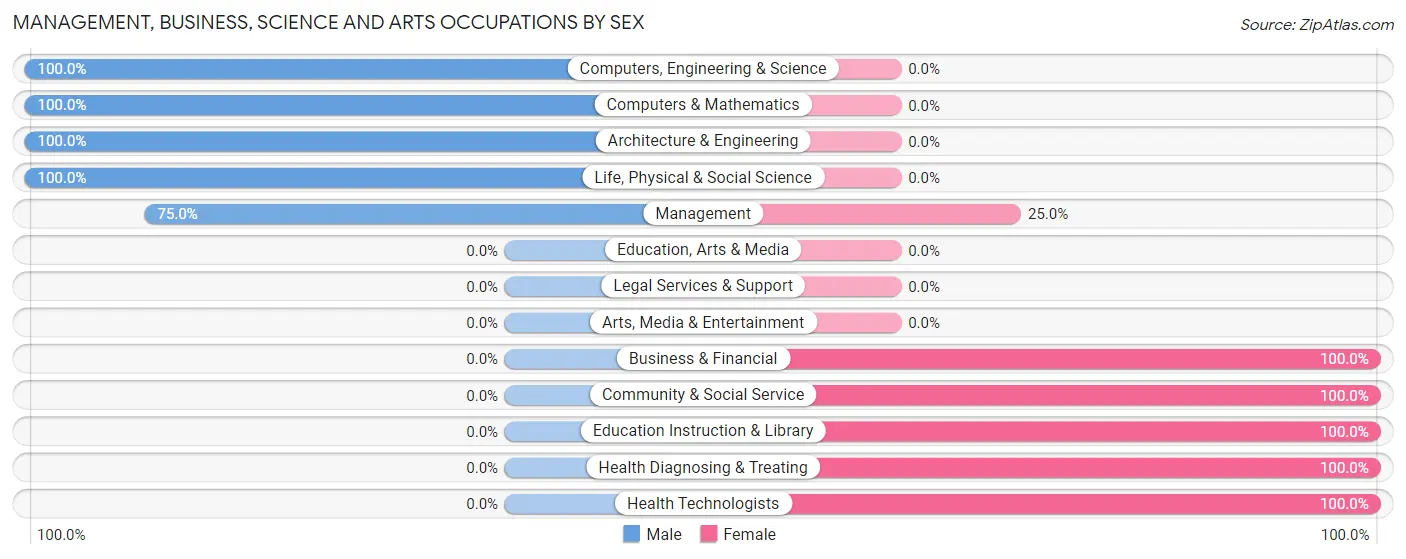
| Occupation | Male | Female |
| Management | 39 (75.0%) | 13 (25.0%) |
| Business & Financial | 0 (0.0%) | 14 (100.0%) |
| Computers, Engineering & Science | 13 (100.0%) | 0 (0.0%) |
| Computers & Mathematics | 1 (100.0%) | 0 (0.0%) |
| Architecture & Engineering | 8 (100.0%) | 0 (0.0%) |
| Life, Physical & Social Science | 4 (100.0%) | 0 (0.0%) |
| Community & Social Service | 0 (0.0%) | 48 (100.0%) |
| Education, Arts & Media | 0 (0.0%) | 0 (0.0%) |
| Legal Services & Support | 0 (0.0%) | 0 (0.0%) |
| Education Instruction & Library | 0 (0.0%) | 48 (100.0%) |
| Arts, Media & Entertainment | 0 (0.0%) | 0 (0.0%) |
| Health Diagnosing & Treating | 0 (0.0%) | 22 (100.0%) |
| Health Technologists | 0 (0.0%) | 22 (100.0%) |
| Total (Category) | 52 (34.9%) | 97 (65.1%) |
| Total (Overall) | 213 (48.0%) | 231 (52.0%) |
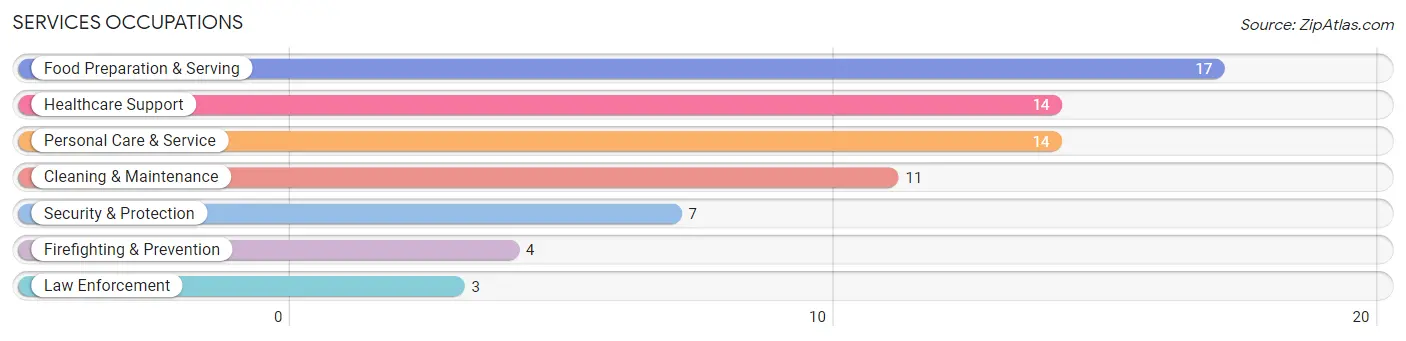
Services Occupations
The most common Services occupations in Charenton are Food Preparation & Serving (17 | 3.8%), Healthcare Support (14 | 3.2%), Personal Care & Service (14 | 3.2%), Cleaning & Maintenance (11 | 2.5%), and Security & Protection (7 | 1.6%).
Services Occupations by Sex
Within the Services occupations in Charenton, the most male-oriented occupations are Security & Protection (100.0%), Firefighting & Prevention (100.0%), and Law Enforcement (100.0%), while the most female-oriented occupations are Healthcare Support (100.0%), Personal Care & Service (100.0%), and Food Preparation & Serving (76.5%).
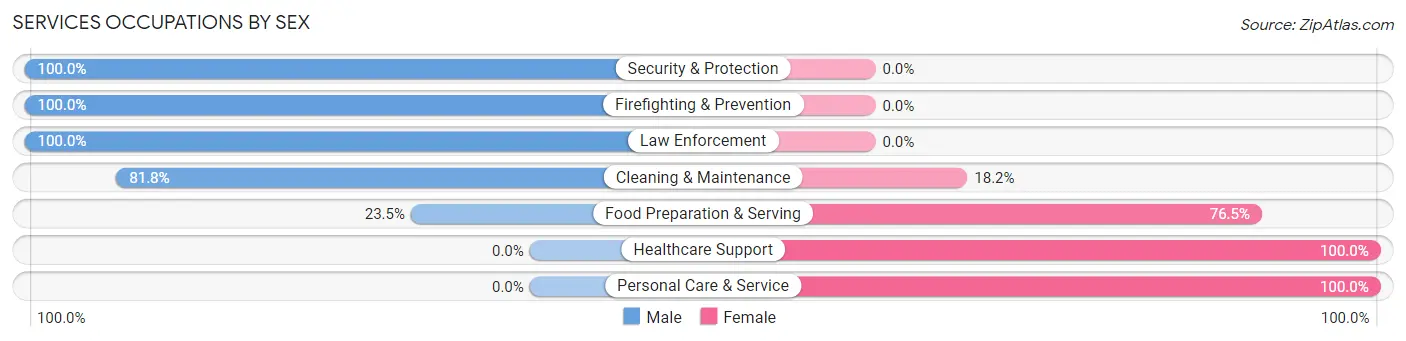
| Occupation | Male | Female |
| Healthcare Support | 0 (0.0%) | 14 (100.0%) |
| Security & Protection | 7 (100.0%) | 0 (0.0%) |
| Firefighting & Prevention | 4 (100.0%) | 0 (0.0%) |
| Law Enforcement | 3 (100.0%) | 0 (0.0%) |
| Food Preparation & Serving | 4 (23.5%) | 13 (76.5%) |
| Cleaning & Maintenance | 9 (81.8%) | 2 (18.2%) |
| Personal Care & Service | 0 (0.0%) | 14 (100.0%) |
| Total (Category) | 20 (31.8%) | 43 (68.2%) |
| Total (Overall) | 213 (48.0%) | 231 (52.0%) |
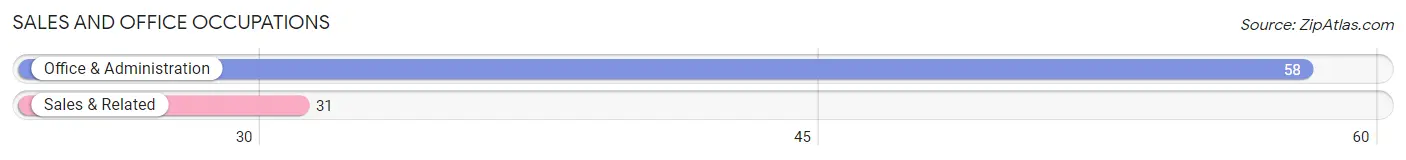
Sales and Office Occupations
The most common Sales and Office occupations in Charenton are Office & Administration (58 | 13.1%), and Sales & Related (31 | 7.0%).
Sales and Office Occupations by Sex
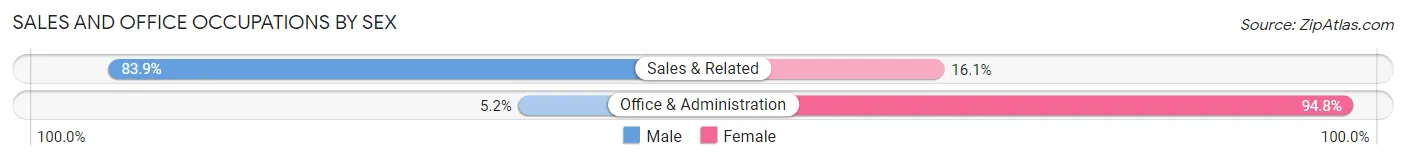
| Occupation | Male | Female |
| Sales & Related | 26 (83.9%) | 5 (16.1%) |
| Office & Administration | 3 (5.2%) | 55 (94.8%) |
| Total (Category) | 29 (32.6%) | 60 (67.4%) |
| Total (Overall) | 213 (48.0%) | 231 (52.0%) |
Natural Resources, Construction and Maintenance Occupations
The most common Natural Resources, Construction and Maintenance occupations in Charenton are Construction & Extraction (60 | 13.5%), and Installation, Maintenance & Repair (13 | 2.9%).
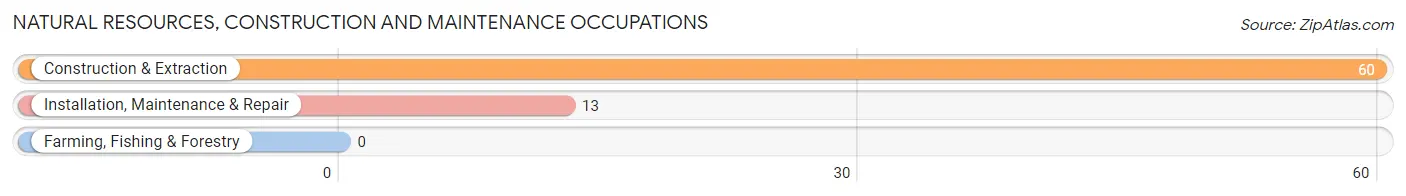
Natural Resources, Construction and Maintenance Occupations by Sex
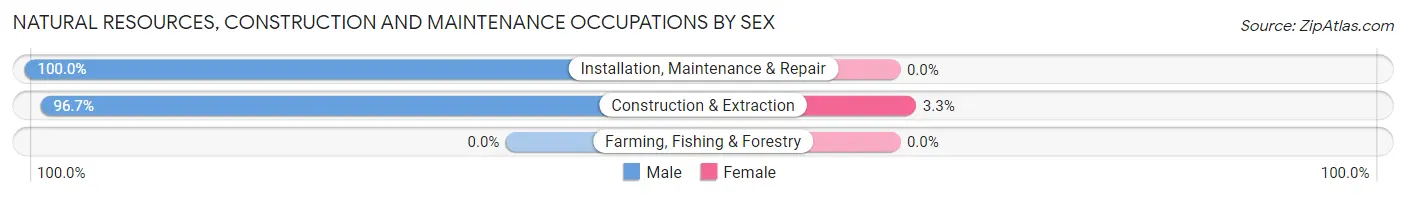
| Occupation | Male | Female |
| Farming, Fishing & Forestry | 0 (0.0%) | 0 (0.0%) |
| Construction & Extraction | 58 (96.7%) | 2 (3.3%) |
| Installation, Maintenance & Repair | 13 (100.0%) | 0 (0.0%) |
| Total (Category) | 71 (97.3%) | 2 (2.7%) |
| Total (Overall) | 213 (48.0%) | 231 (52.0%) |
Production, Transportation and Moving Occupations
The most common Production, Transportation and Moving occupations in Charenton are Material Moving (40 | 9.0%), Production (24 | 5.4%), and Transportation (6 | 1.3%).
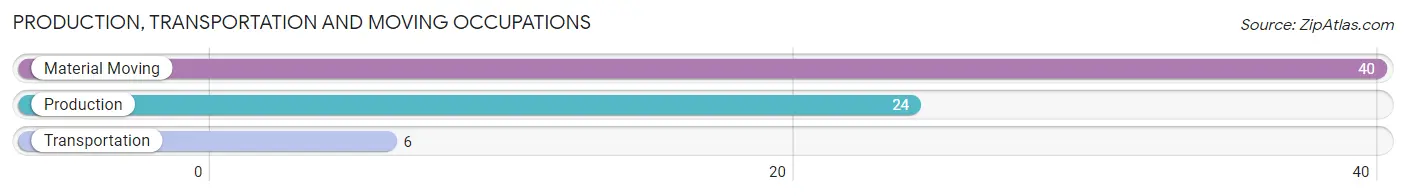
Production, Transportation and Moving Occupations by Sex
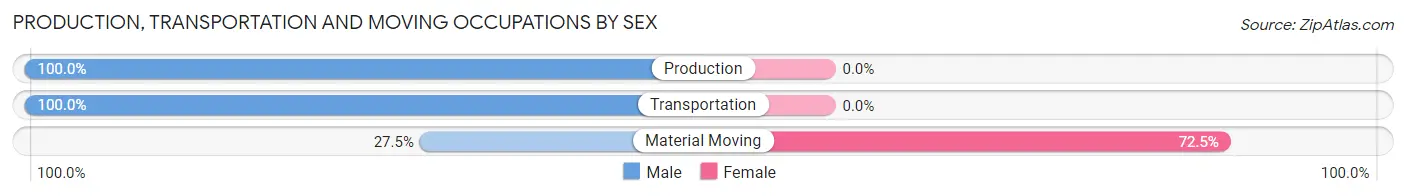
| Occupation | Male | Female |
| Production | 24 (100.0%) | 0 (0.0%) |
| Transportation | 6 (100.0%) | 0 (0.0%) |
| Material Moving | 11 (27.5%) | 29 (72.5%) |
| Total (Category) | 41 (58.6%) | 29 (41.4%) |
| Total (Overall) | 213 (48.0%) | 231 (52.0%) |
Employment Industries by Sex in Charenton
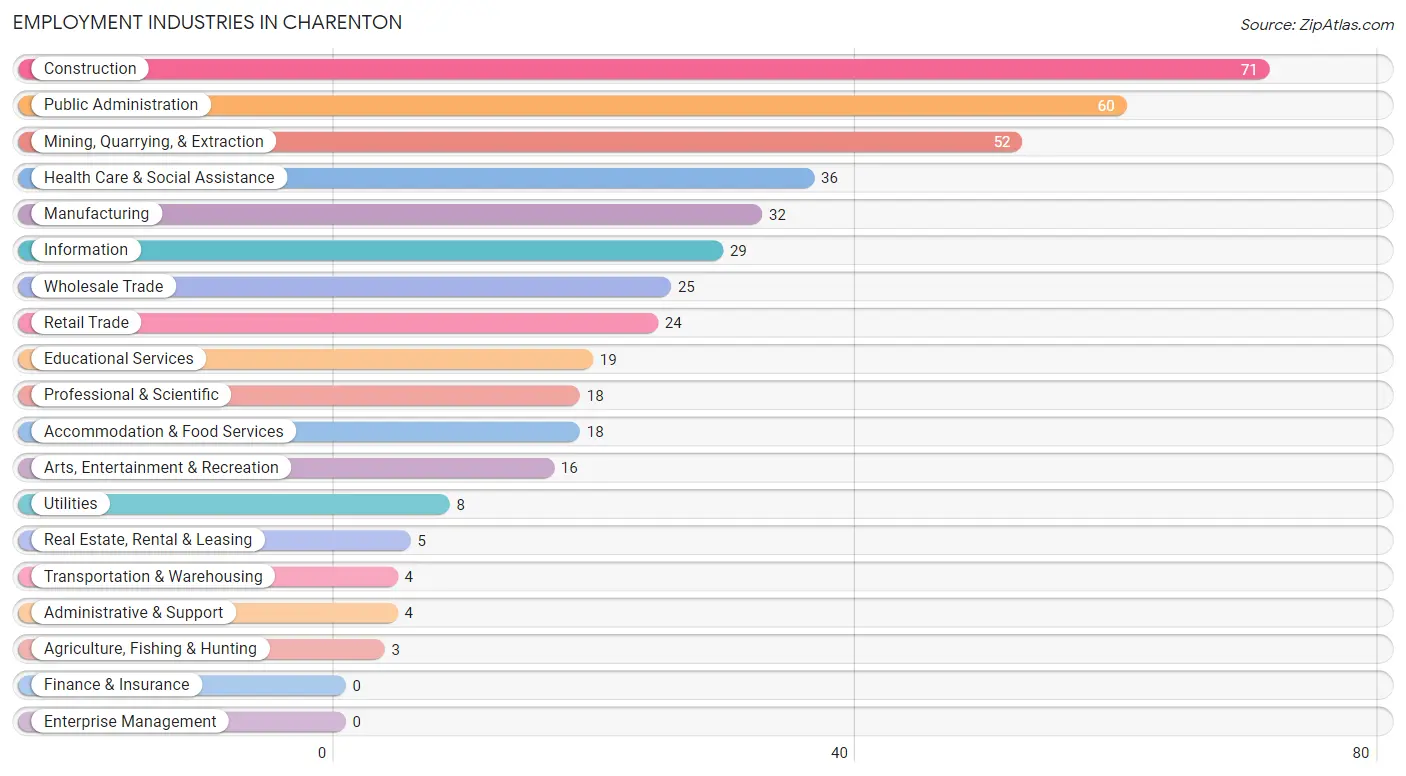
Employment Industries in Charenton
The major employment industries in Charenton include Construction (71 | 16.0%), Public Administration (60 | 13.5%), Mining, Quarrying, & Extraction (52 | 11.7%), Health Care & Social Assistance (36 | 8.1%), and Manufacturing (32 | 7.2%).
Employment Industries by Sex in Charenton
The Charenton industries that see more men than women are Agriculture, Fishing & Hunting (100.0%), Wholesale Trade (100.0%), and Transportation & Warehousing (100.0%), whereas the industries that tend to have a higher number of women are Information (100.0%), Educational Services (100.0%), and Health Care & Social Assistance (100.0%).
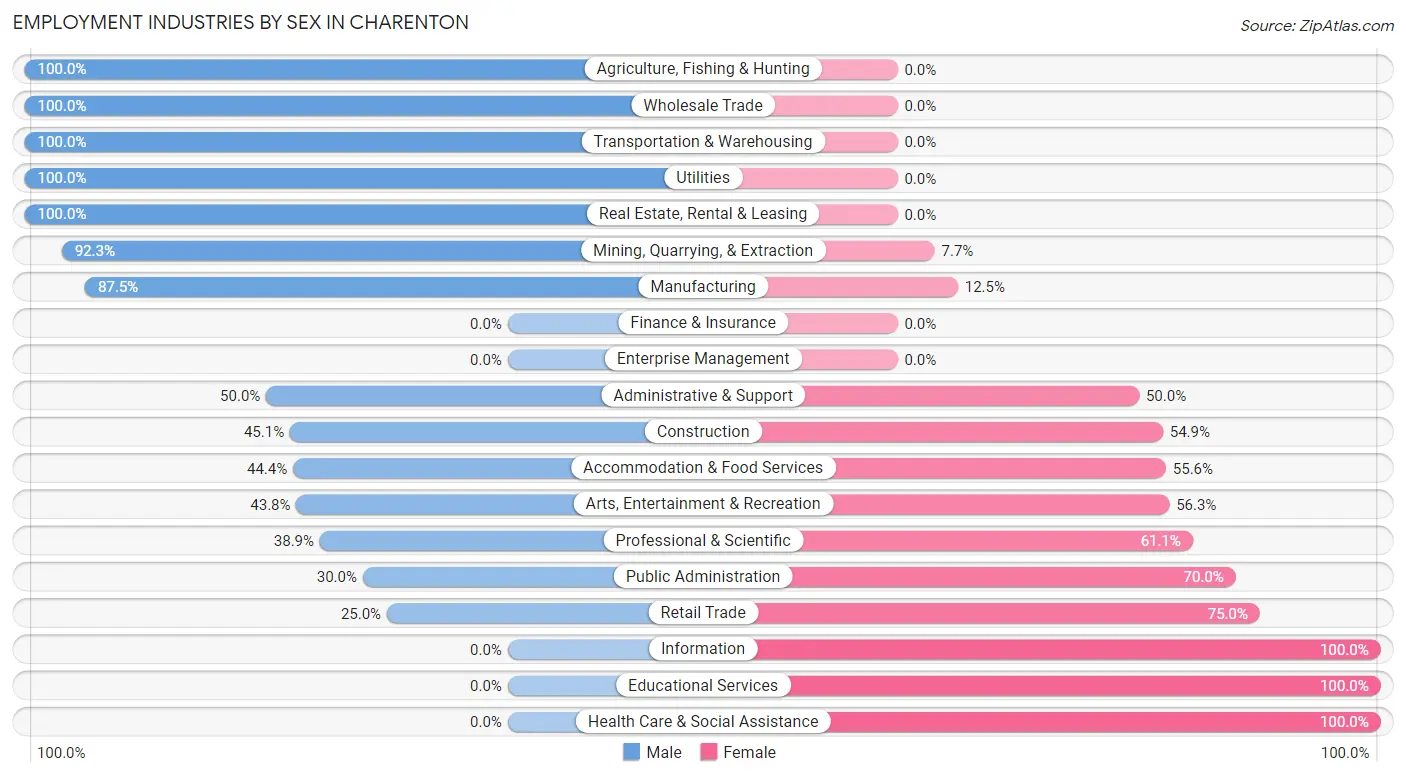
| Industry | Male | Female |
| Agriculture, Fishing & Hunting | 3 (100.0%) | 0 (0.0%) |
| Mining, Quarrying, & Extraction | 48 (92.3%) | 4 (7.7%) |
| Construction | 32 (45.1%) | 39 (54.9%) |
| Manufacturing | 28 (87.5%) | 4 (12.5%) |
| Wholesale Trade | 25 (100.0%) | 0 (0.0%) |
| Retail Trade | 6 (25.0%) | 18 (75.0%) |
| Transportation & Warehousing | 4 (100.0%) | 0 (0.0%) |
| Utilities | 8 (100.0%) | 0 (0.0%) |
| Information | 0 (0.0%) | 29 (100.0%) |
| Finance & Insurance | 0 (0.0%) | 0 (0.0%) |
| Real Estate, Rental & Leasing | 5 (100.0%) | 0 (0.0%) |
| Professional & Scientific | 7 (38.9%) | 11 (61.1%) |
| Enterprise Management | 0 (0.0%) | 0 (0.0%) |
| Administrative & Support | 2 (50.0%) | 2 (50.0%) |
| Educational Services | 0 (0.0%) | 19 (100.0%) |
| Health Care & Social Assistance | 0 (0.0%) | 36 (100.0%) |
| Arts, Entertainment & Recreation | 7 (43.8%) | 9 (56.2%) |
| Accommodation & Food Services | 8 (44.4%) | 10 (55.6%) |
| Public Administration | 18 (30.0%) | 42 (70.0%) |
| Total | 213 (48.0%) | 231 (52.0%) |
Education in Charenton
School Enrollment in Charenton
The most common levels of schooling among the 217 students in Charenton are elementary school (61 | 28.1%), high school (52 | 24.0%), and middle school (50 | 23.0%).
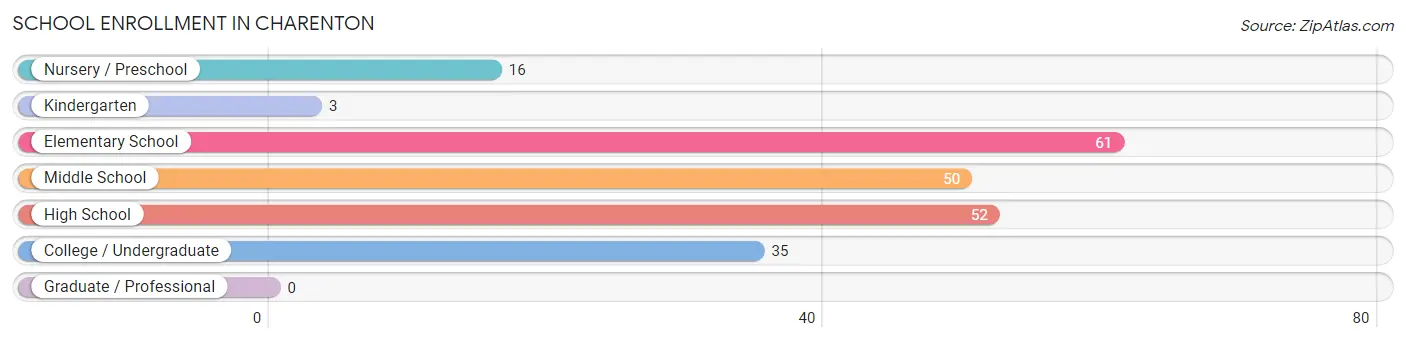
| School Level | # Students | % Students |
| Nursery / Preschool | 16 | 7.4% |
| Kindergarten | 3 | 1.4% |
| Elementary School | 61 | 28.1% |
| Middle School | 50 | 23.0% |
| High School | 52 | 24.0% |
| College / Undergraduate | 35 | 16.1% |
| Graduate / Professional | 0 | 0.0% |
| Total | 217 | 100.0% |
School Enrollment by Age by Funding Source in Charenton
Out of a total of 217 students who are enrolled in schools in Charenton, 70 (32.3%) attend a private institution, while the remaining 147 (67.7%) are enrolled in public schools. The age group of 3 to 4 year olds has the highest likelihood of being enrolled in private schools, with 14 (100.0% in the age bracket) enrolled. Conversely, the age group of 25 to 34 year olds has the lowest likelihood of being enrolled in a private school, with 2 (100.0% in the age bracket) attending a public institution.
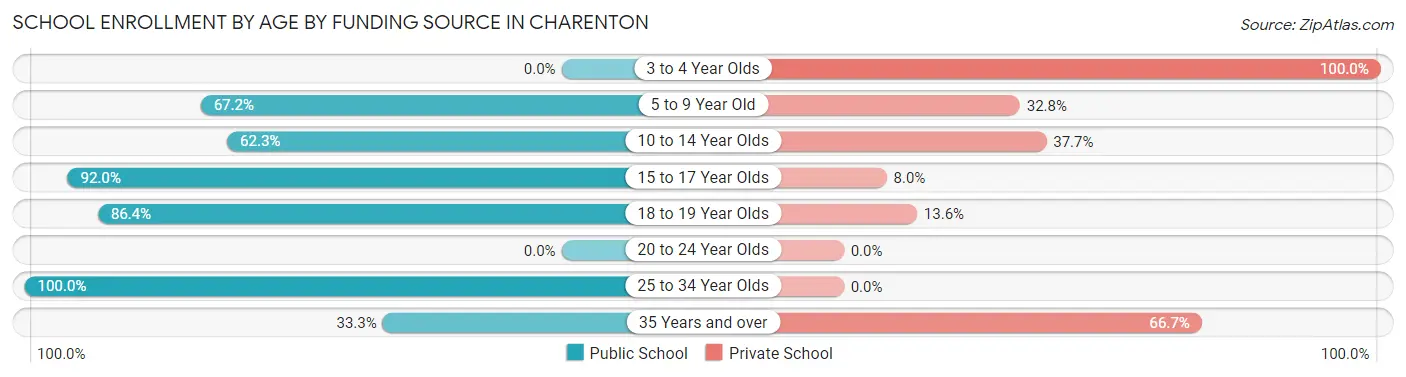
| Age Bracket | Public School | Private School |
| 3 to 4 Year Olds | 0 (0.0%) | 14 (100.0%) |
| 5 to 9 Year Old | 43 (67.2%) | 21 (32.8%) |
| 10 to 14 Year Olds | 33 (62.3%) | 20 (37.7%) |
| 15 to 17 Year Olds | 46 (92.0%) | 4 (8.0%) |
| 18 to 19 Year Olds | 19 (86.4%) | 3 (13.6%) |
| 20 to 24 Year Olds | 0 (0.0%) | 0 (0.0%) |
| 25 to 34 Year Olds | 2 (100.0%) | 0 (0.0%) |
| 35 Years and over | 4 (33.3%) | 8 (66.7%) |
| Total | 147 (67.7%) | 70 (32.3%) |
Educational Attainment by Field of Study in Charenton
Business (11 | 26.8%), bio, nature & agricultural (9 | 22.0%), engineering (6 | 14.6%), arts & humanities (6 | 14.6%), and physical & health sciences (3 | 7.3%) are the most common fields of study among 41 individuals in Charenton who have obtained a bachelor's degree or higher.
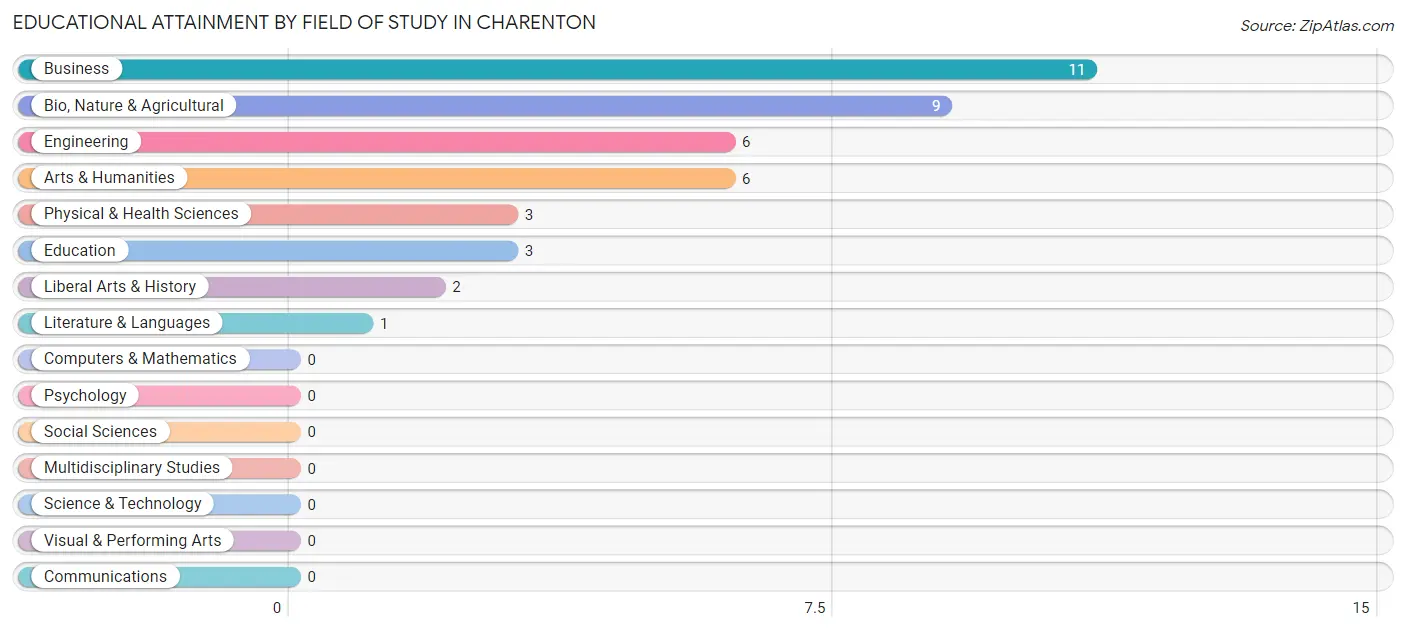
| Field of Study | # Graduates | % Graduates |
| Computers & Mathematics | 0 | 0.0% |
| Bio, Nature & Agricultural | 9 | 22.0% |
| Physical & Health Sciences | 3 | 7.3% |
| Psychology | 0 | 0.0% |
| Social Sciences | 0 | 0.0% |
| Engineering | 6 | 14.6% |
| Multidisciplinary Studies | 0 | 0.0% |
| Science & Technology | 0 | 0.0% |
| Business | 11 | 26.8% |
| Education | 3 | 7.3% |
| Literature & Languages | 1 | 2.4% |
| Liberal Arts & History | 2 | 4.9% |
| Visual & Performing Arts | 0 | 0.0% |
| Communications | 0 | 0.0% |
| Arts & Humanities | 6 | 14.6% |
| Total | 41 | 100.0% |
Transportation & Commute in Charenton
Vehicle Availability by Sex in Charenton
The most prevalent vehicle ownership categories in Charenton are males with 2 vehicles (90, accounting for 41.5%) and females with 2 vehicles (67, making up 43.9%).
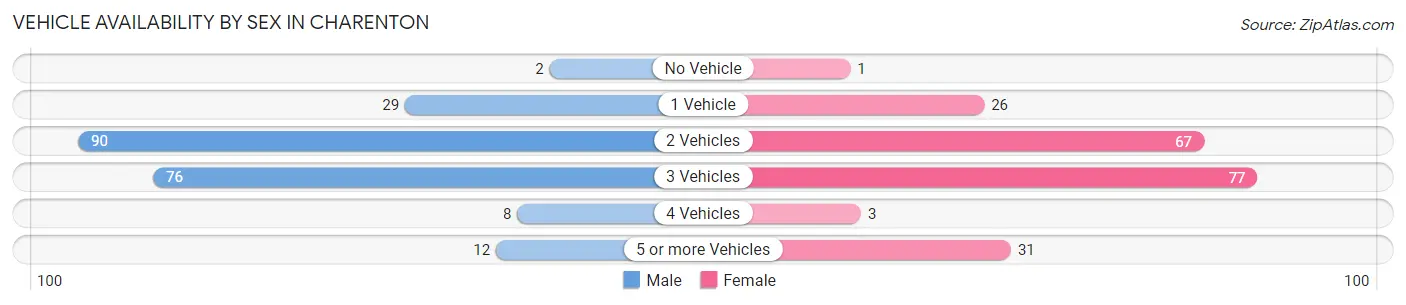
| Vehicles Available | Male | Female |
| No Vehicle | 2 (0.9%) | 1 (0.5%) |
| 1 Vehicle | 29 (13.4%) | 26 (12.7%) |
| 2 Vehicles | 90 (41.5%) | 67 (32.7%) |
| 3 Vehicles | 76 (35.0%) | 77 (37.6%) |
| 4 Vehicles | 8 (3.7%) | 3 (1.5%) |
| 5 or more Vehicles | 12 (5.5%) | 31 (15.1%) |
| Total | 217 (100.0%) | 205 (100.0%) |
Commute Time in Charenton
The most frequently occuring commute durations in Charenton are 5 to 9 minutes (104 commuters, 25.2%), less than 5 minutes (74 commuters, 17.9%), and 15 to 19 minutes (50 commuters, 12.1%).
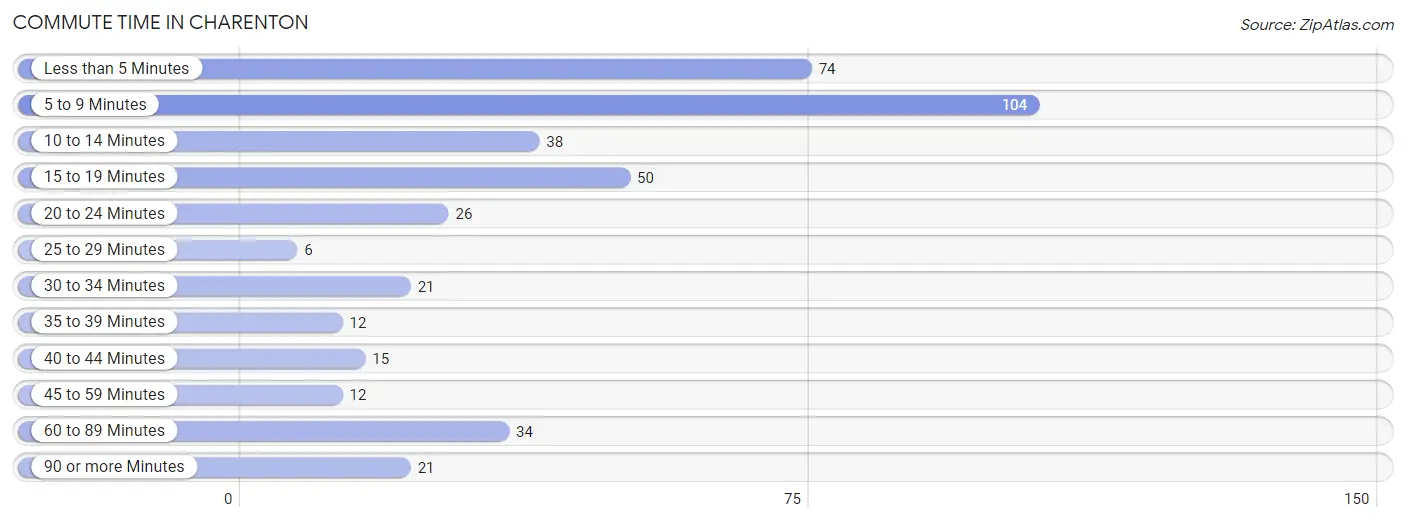
| Commute Time | # Commuters | % Commuters |
| Less than 5 Minutes | 74 | 17.9% |
| 5 to 9 Minutes | 104 | 25.2% |
| 10 to 14 Minutes | 38 | 9.2% |
| 15 to 19 Minutes | 50 | 12.1% |
| 20 to 24 Minutes | 26 | 6.3% |
| 25 to 29 Minutes | 6 | 1.5% |
| 30 to 34 Minutes | 21 | 5.1% |
| 35 to 39 Minutes | 12 | 2.9% |
| 40 to 44 Minutes | 15 | 3.6% |
| 45 to 59 Minutes | 12 | 2.9% |
| 60 to 89 Minutes | 34 | 8.2% |
| 90 or more Minutes | 21 | 5.1% |
Commute Time by Sex in Charenton
The most common commute times in Charenton are 5 to 9 minutes (43 commuters, 20.4%) for males and 5 to 9 minutes (61 commuters, 30.2%) for females.
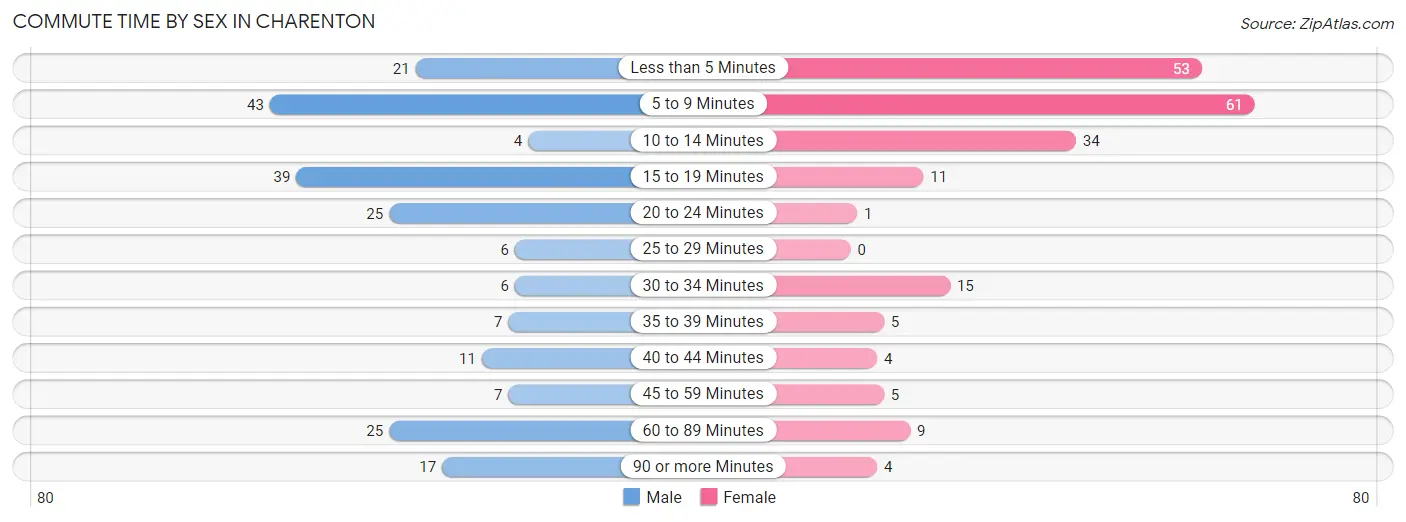
| Commute Time | Male | Female |
| Less than 5 Minutes | 21 (10.0%) | 53 (26.2%) |
| 5 to 9 Minutes | 43 (20.4%) | 61 (30.2%) |
| 10 to 14 Minutes | 4 (1.9%) | 34 (16.8%) |
| 15 to 19 Minutes | 39 (18.5%) | 11 (5.4%) |
| 20 to 24 Minutes | 25 (11.8%) | 1 (0.5%) |
| 25 to 29 Minutes | 6 (2.8%) | 0 (0.0%) |
| 30 to 34 Minutes | 6 (2.8%) | 15 (7.4%) |
| 35 to 39 Minutes | 7 (3.3%) | 5 (2.5%) |
| 40 to 44 Minutes | 11 (5.2%) | 4 (2.0%) |
| 45 to 59 Minutes | 7 (3.3%) | 5 (2.5%) |
| 60 to 89 Minutes | 25 (11.8%) | 9 (4.5%) |
| 90 or more Minutes | 17 (8.1%) | 4 (2.0%) |
Time of Departure to Work by Sex in Charenton
The most frequent times of departure to work in Charenton are 7:00 AM to 7:29 AM (54, 25.6%) for males and 8:00 AM to 8:29 AM (75, 37.1%) for females.
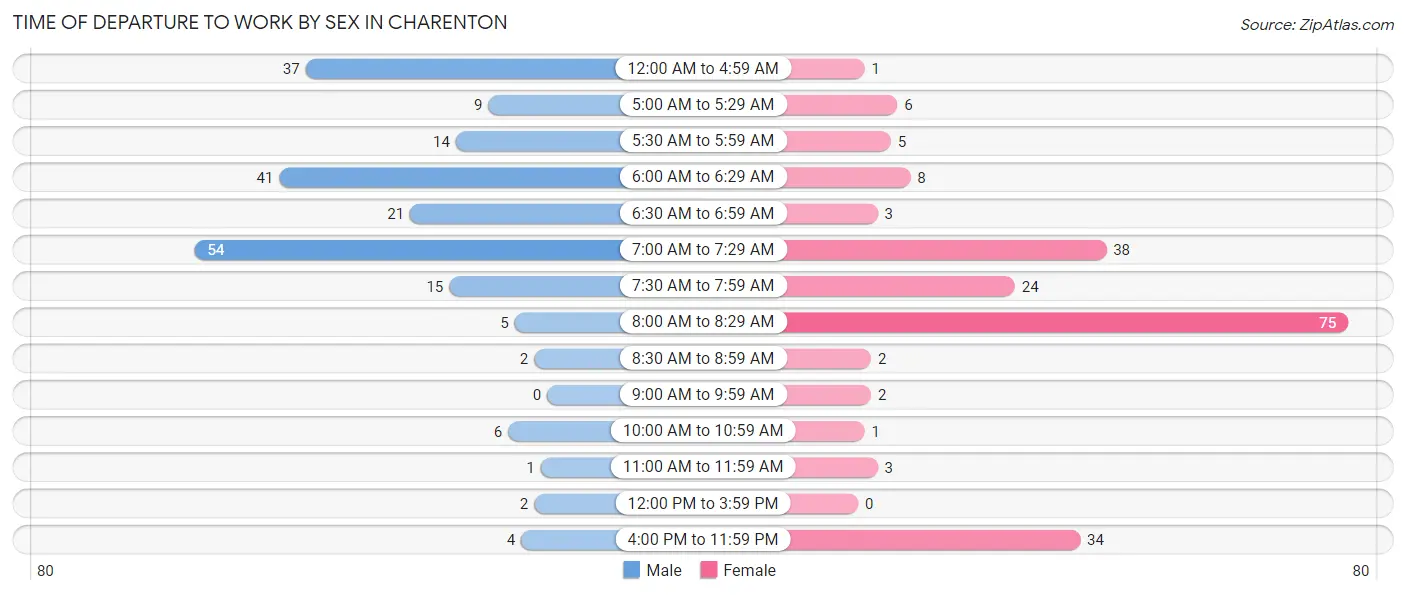
| Time of Departure | Male | Female |
| 12:00 AM to 4:59 AM | 37 (17.5%) | 1 (0.5%) |
| 5:00 AM to 5:29 AM | 9 (4.3%) | 6 (3.0%) |
| 5:30 AM to 5:59 AM | 14 (6.6%) | 5 (2.5%) |
| 6:00 AM to 6:29 AM | 41 (19.4%) | 8 (4.0%) |
| 6:30 AM to 6:59 AM | 21 (10.0%) | 3 (1.5%) |
| 7:00 AM to 7:29 AM | 54 (25.6%) | 38 (18.8%) |
| 7:30 AM to 7:59 AM | 15 (7.1%) | 24 (11.9%) |
| 8:00 AM to 8:29 AM | 5 (2.4%) | 75 (37.1%) |
| 8:30 AM to 8:59 AM | 2 (0.9%) | 2 (1.0%) |
| 9:00 AM to 9:59 AM | 0 (0.0%) | 2 (1.0%) |
| 10:00 AM to 10:59 AM | 6 (2.8%) | 1 (0.5%) |
| 11:00 AM to 11:59 AM | 1 (0.5%) | 3 (1.5%) |
| 12:00 PM to 3:59 PM | 2 (0.9%) | 0 (0.0%) |
| 4:00 PM to 11:59 PM | 4 (1.9%) | 34 (16.8%) |
| Total | 211 (100.0%) | 202 (100.0%) |
Housing Occupancy in Charenton
Occupancy by Ownership in Charenton
Of the total 443 dwellings in Charenton, owner-occupied units account for 352 (79.5%), while renter-occupied units make up 91 (20.5%).
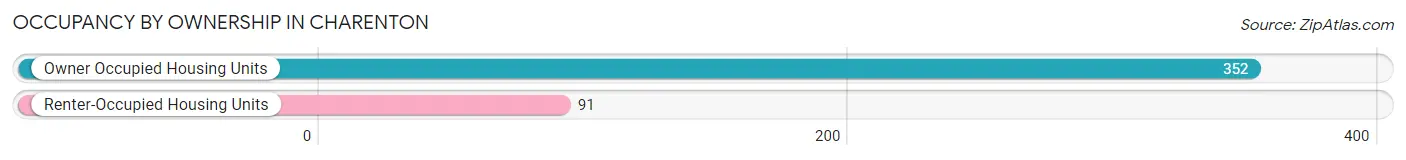
| Occupancy | # Housing Units | % Housing Units |
| Owner Occupied Housing Units | 352 | 79.5% |
| Renter-Occupied Housing Units | 91 | 20.5% |
| Total Occupied Housing Units | 443 | 100.0% |
Occupancy by Household Size in Charenton
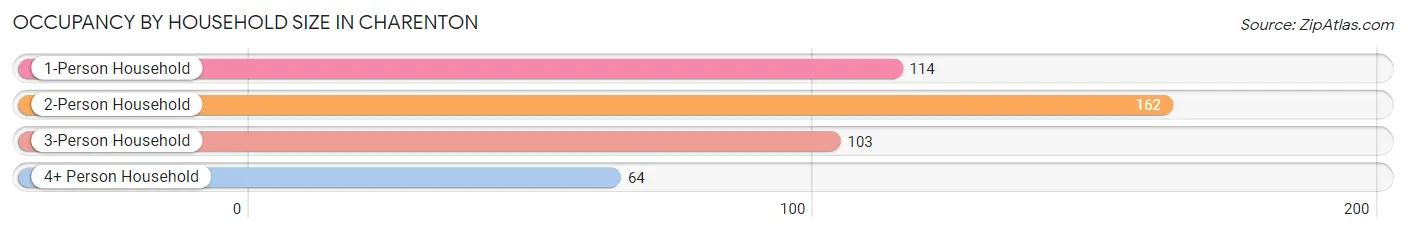
| Household Size | # Housing Units | % Housing Units |
| 1-Person Household | 114 | 25.7% |
| 2-Person Household | 162 | 36.6% |
| 3-Person Household | 103 | 23.3% |
| 4+ Person Household | 64 | 14.4% |
| Total Housing Units | 443 | 100.0% |
Occupancy by Ownership by Household Size in Charenton
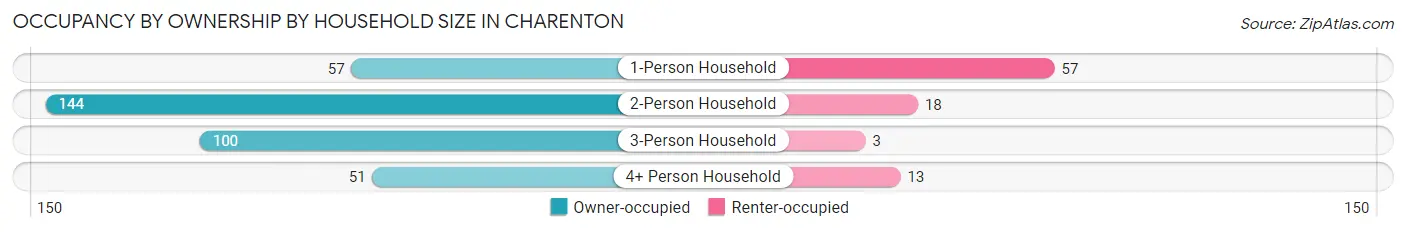
| Household Size | Owner-occupied | Renter-occupied |
| 1-Person Household | 57 (50.0%) | 57 (50.0%) |
| 2-Person Household | 144 (88.9%) | 18 (11.1%) |
| 3-Person Household | 100 (97.1%) | 3 (2.9%) |
| 4+ Person Household | 51 (79.7%) | 13 (20.3%) |
| Total Housing Units | 352 (79.5%) | 91 (20.5%) |
Occupancy by Educational Attainment in Charenton
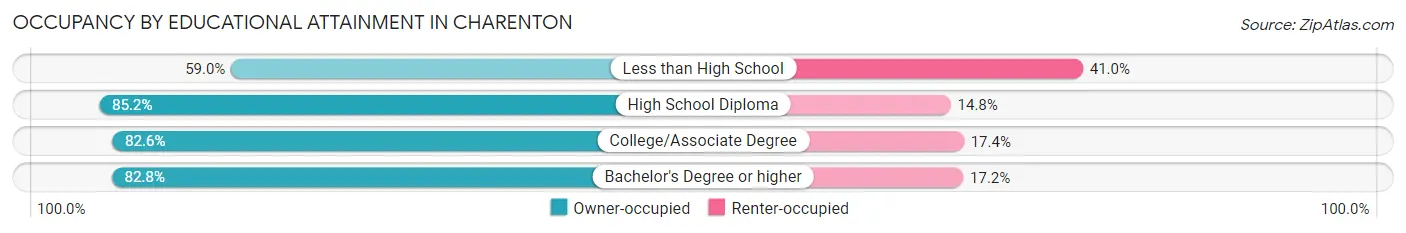
| Household Size | Owner-occupied | Renter-occupied |
| Less than High School | 49 (59.0%) | 34 (41.0%) |
| High School Diploma | 179 (85.2%) | 31 (14.8%) |
| College/Associate Degree | 100 (82.6%) | 21 (17.4%) |
| Bachelor's Degree or higher | 24 (82.8%) | 5 (17.2%) |
Occupancy by Age of Householder in Charenton
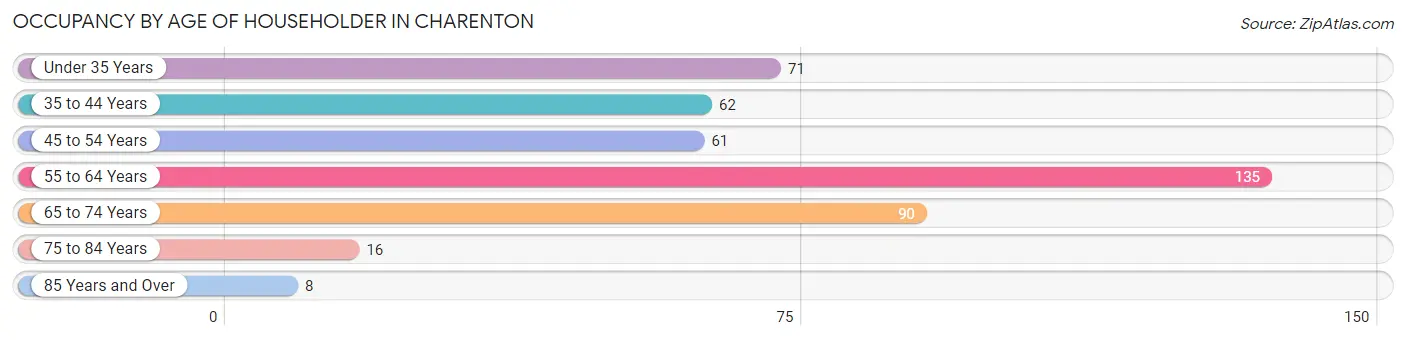
| Age Bracket | # Households | % Households |
| Under 35 Years | 71 | 16.0% |
| 35 to 44 Years | 62 | 14.0% |
| 45 to 54 Years | 61 | 13.8% |
| 55 to 64 Years | 135 | 30.5% |
| 65 to 74 Years | 90 | 20.3% |
| 75 to 84 Years | 16 | 3.6% |
| 85 Years and Over | 8 | 1.8% |
| Total | 443 | 100.0% |
Housing Finances in Charenton
Median Income by Occupancy in Charenton
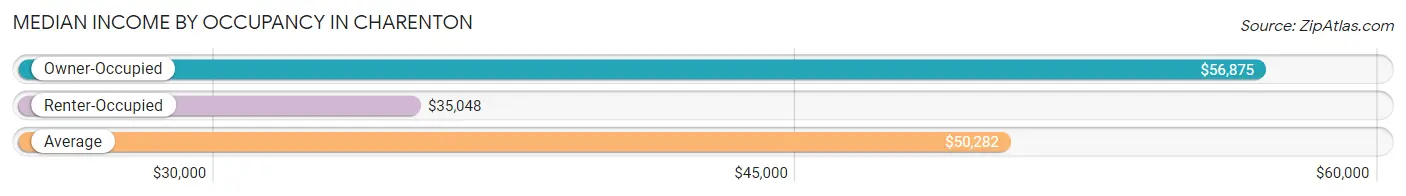
| Occupancy Type | # Households | Median Income |
| Owner-Occupied | 352 (79.5%) | $56,875 |
| Renter-Occupied | 91 (20.5%) | $35,048 |
| Average | 443 (100.0%) | $50,282 |
Occupancy by Householder Income Bracket in Charenton
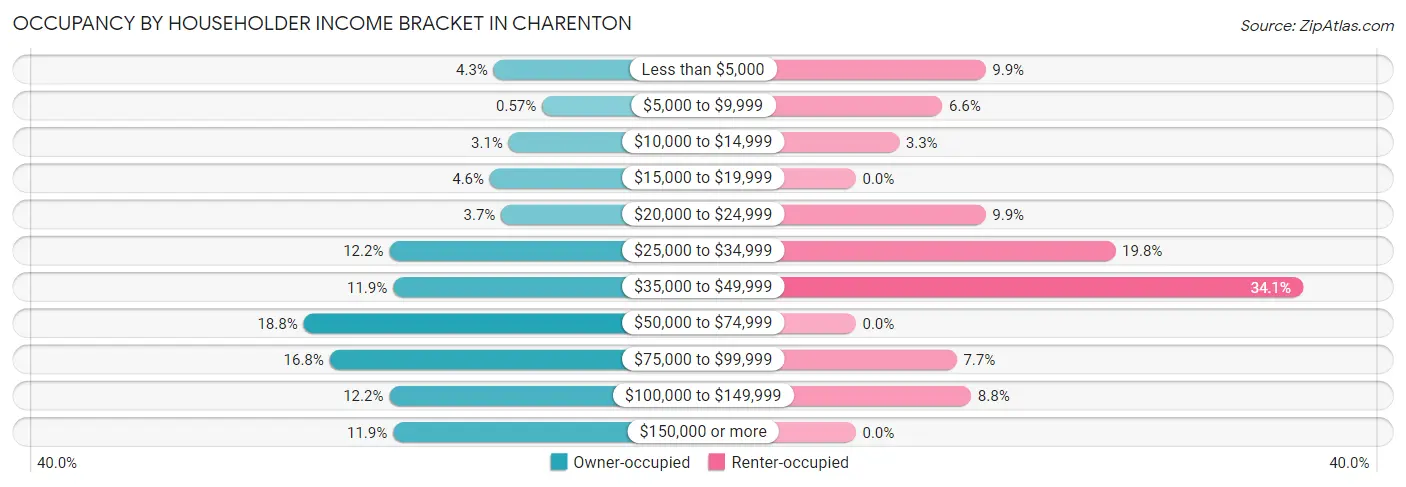
| Income Bracket | Owner-occupied | Renter-occupied |
| Less than $5,000 | 15 (4.3%) | 9 (9.9%) |
| $5,000 to $9,999 | 2 (0.6%) | 6 (6.6%) |
| $10,000 to $14,999 | 11 (3.1%) | 3 (3.3%) |
| $15,000 to $19,999 | 16 (4.5%) | 0 (0.0%) |
| $20,000 to $24,999 | 13 (3.7%) | 9 (9.9%) |
| $25,000 to $34,999 | 43 (12.2%) | 18 (19.8%) |
| $35,000 to $49,999 | 42 (11.9%) | 31 (34.1%) |
| $50,000 to $74,999 | 66 (18.8%) | 0 (0.0%) |
| $75,000 to $99,999 | 59 (16.8%) | 7 (7.7%) |
| $100,000 to $149,999 | 43 (12.2%) | 8 (8.8%) |
| $150,000 or more | 42 (11.9%) | 0 (0.0%) |
| Total | 352 (100.0%) | 91 (100.0%) |
Monthly Housing Cost Tiers in Charenton
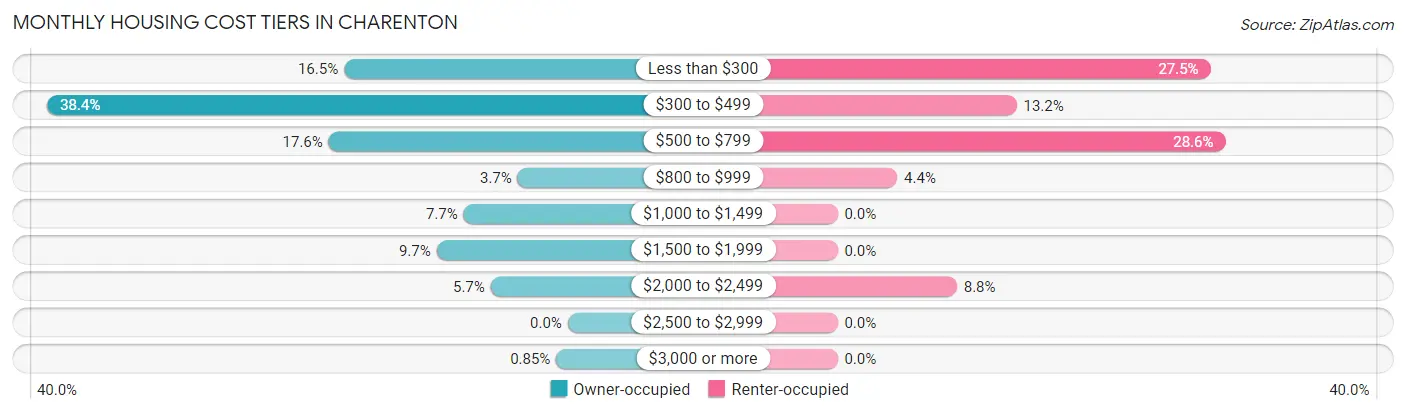
| Monthly Cost | Owner-occupied | Renter-occupied |
| Less than $300 | 58 (16.5%) | 25 (27.5%) |
| $300 to $499 | 135 (38.4%) | 12 (13.2%) |
| $500 to $799 | 62 (17.6%) | 26 (28.6%) |
| $800 to $999 | 13 (3.7%) | 4 (4.4%) |
| $1,000 to $1,499 | 27 (7.7%) | 0 (0.0%) |
| $1,500 to $1,999 | 34 (9.7%) | 0 (0.0%) |
| $2,000 to $2,499 | 20 (5.7%) | 8 (8.8%) |
| $2,500 to $2,999 | 0 (0.0%) | 0 (0.0%) |
| $3,000 or more | 3 (0.9%) | 0 (0.0%) |
| Total | 352 (100.0%) | 91 (100.0%) |
Physical Housing Characteristics in Charenton
Housing Structures in Charenton
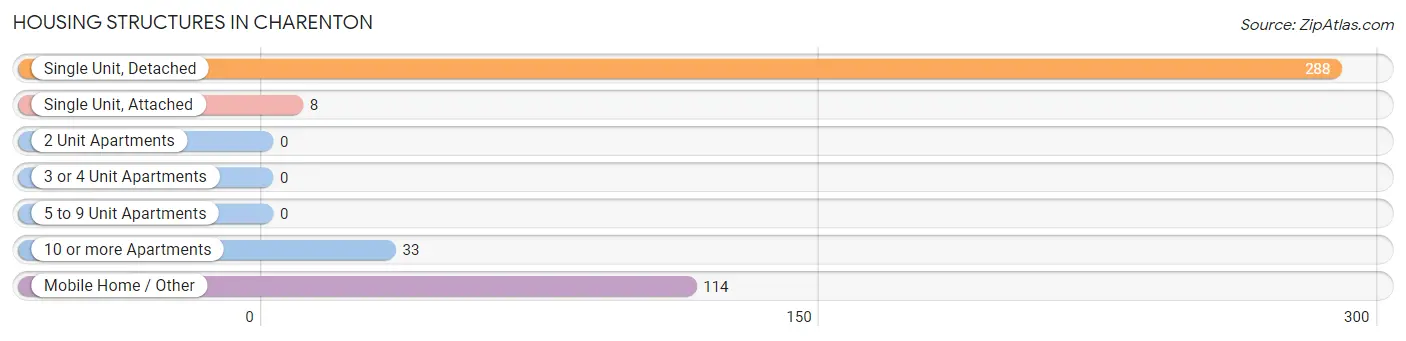
| Structure Type | # Housing Units | % Housing Units |
| Single Unit, Detached | 288 | 65.0% |
| Single Unit, Attached | 8 | 1.8% |
| 2 Unit Apartments | 0 | 0.0% |
| 3 or 4 Unit Apartments | 0 | 0.0% |
| 5 to 9 Unit Apartments | 0 | 0.0% |
| 10 or more Apartments | 33 | 7.4% |
| Mobile Home / Other | 114 | 25.7% |
| Total | 443 | 100.0% |
Housing Structures by Occupancy in Charenton
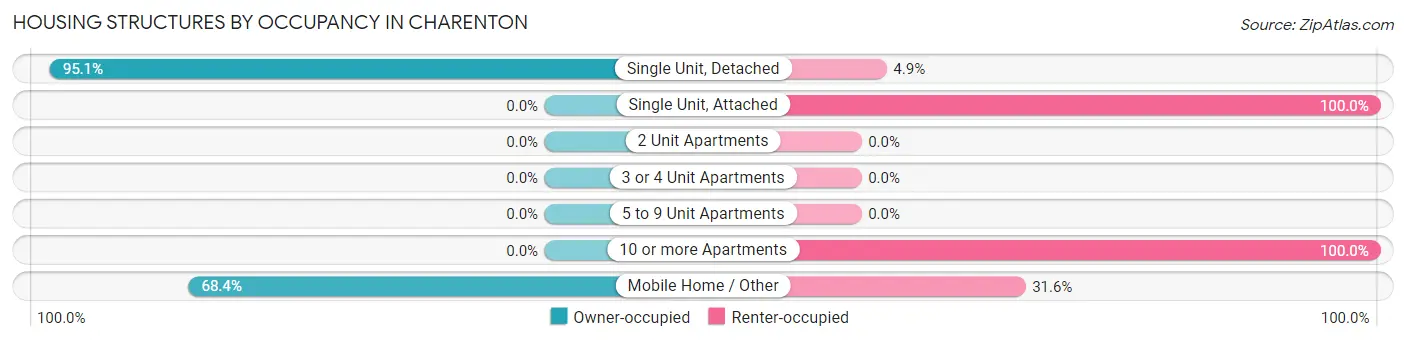
| Structure Type | Owner-occupied | Renter-occupied |
| Single Unit, Detached | 274 (95.1%) | 14 (4.9%) |
| Single Unit, Attached | 0 (0.0%) | 8 (100.0%) |
| 2 Unit Apartments | 0 (0.0%) | 0 (0.0%) |
| 3 or 4 Unit Apartments | 0 (0.0%) | 0 (0.0%) |
| 5 to 9 Unit Apartments | 0 (0.0%) | 0 (0.0%) |
| 10 or more Apartments | 0 (0.0%) | 33 (100.0%) |
| Mobile Home / Other | 78 (68.4%) | 36 (31.6%) |
| Total | 352 (79.5%) | 91 (20.5%) |
Housing Structures by Number of Rooms in Charenton
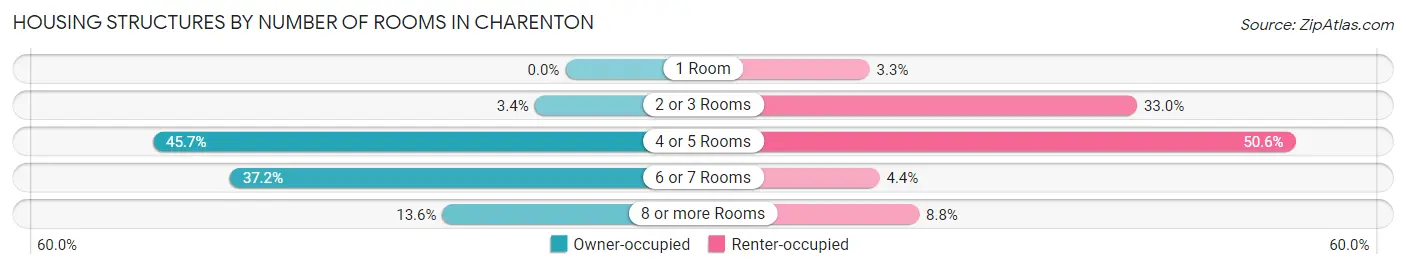
| Number of Rooms | Owner-occupied | Renter-occupied |
| 1 Room | 0 (0.0%) | 3 (3.3%) |
| 2 or 3 Rooms | 12 (3.4%) | 30 (33.0%) |
| 4 or 5 Rooms | 161 (45.7%) | 46 (50.5%) |
| 6 or 7 Rooms | 131 (37.2%) | 4 (4.4%) |
| 8 or more Rooms | 48 (13.6%) | 8 (8.8%) |
| Total | 352 (100.0%) | 91 (100.0%) |
Housing Structure by Heating Type in Charenton
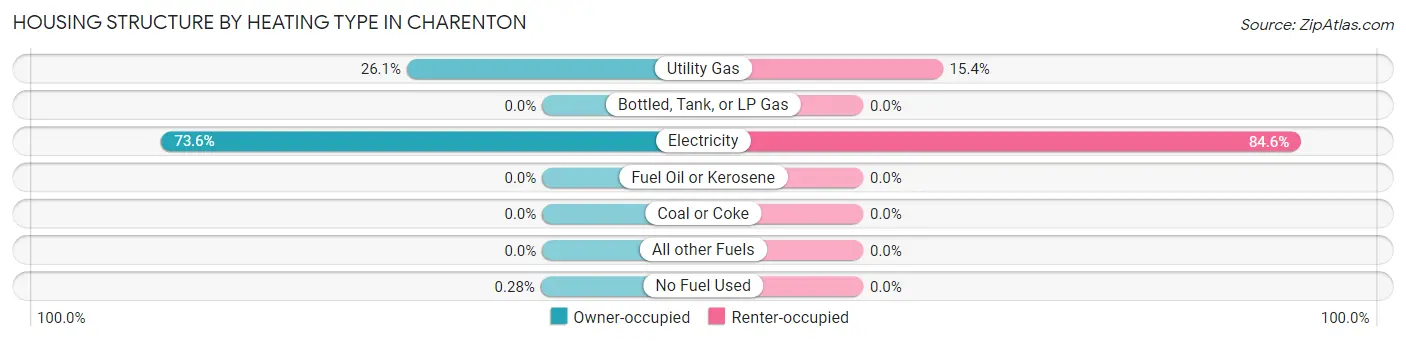
| Heating Type | Owner-occupied | Renter-occupied |
| Utility Gas | 92 (26.1%) | 14 (15.4%) |
| Bottled, Tank, or LP Gas | 0 (0.0%) | 0 (0.0%) |
| Electricity | 259 (73.6%) | 77 (84.6%) |
| Fuel Oil or Kerosene | 0 (0.0%) | 0 (0.0%) |
| Coal or Coke | 0 (0.0%) | 0 (0.0%) |
| All other Fuels | 0 (0.0%) | 0 (0.0%) |
| No Fuel Used | 1 (0.3%) | 0 (0.0%) |
| Total | 352 (100.0%) | 91 (100.0%) |
Household Vehicle Usage in Charenton
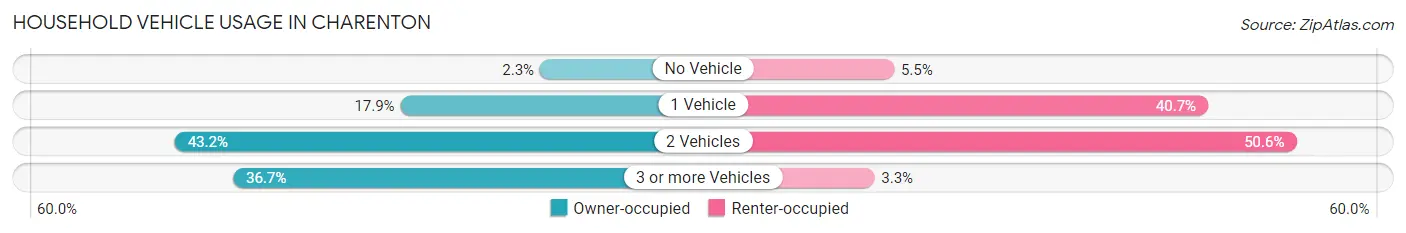
| Vehicles per Household | Owner-occupied | Renter-occupied |
| No Vehicle | 8 (2.3%) | 5 (5.5%) |
| 1 Vehicle | 63 (17.9%) | 37 (40.7%) |
| 2 Vehicles | 152 (43.2%) | 46 (50.5%) |
| 3 or more Vehicles | 129 (36.6%) | 3 (3.3%) |
| Total | 352 (100.0%) | 91 (100.0%) |
Real Estate & Mortgages in Charenton
Real Estate and Mortgage Overview in Charenton
| Characteristic | Without Mortgage | With Mortgage |
| Housing Units | 216 | 136 |
| Median Property Value | $122,500 | $162,500 |
| Median Household Income | $61,250 | $12 |
| Monthly Housing Costs | $425 | $3 |
| Real Estate Taxes | $556 | $81 |
Property Value by Mortgage Status in Charenton
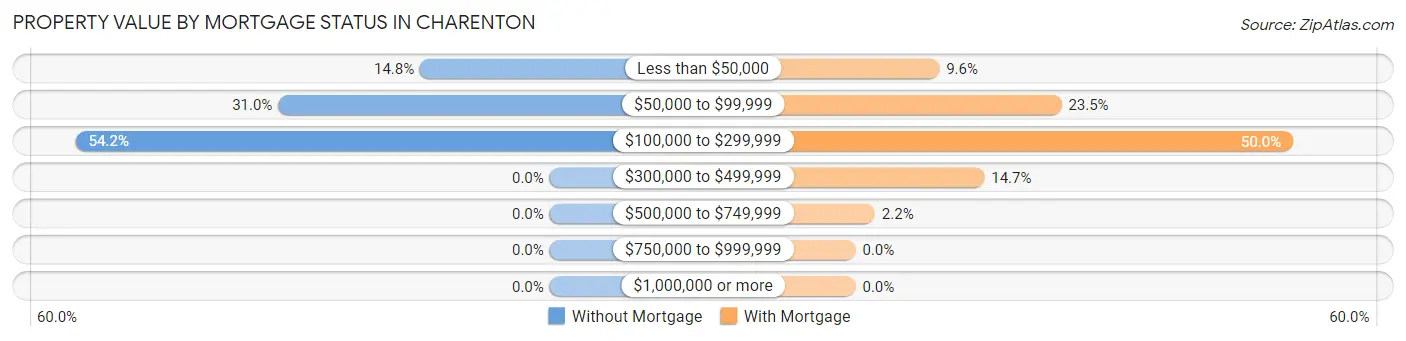
| Property Value | Without Mortgage | With Mortgage |
| Less than $50,000 | 32 (14.8%) | 13 (9.6%) |
| $50,000 to $99,999 | 67 (31.0%) | 32 (23.5%) |
| $100,000 to $299,999 | 117 (54.2%) | 68 (50.0%) |
| $300,000 to $499,999 | 0 (0.0%) | 20 (14.7%) |
| $500,000 to $749,999 | 0 (0.0%) | 3 (2.2%) |
| $750,000 to $999,999 | 0 (0.0%) | 0 (0.0%) |
| $1,000,000 or more | 0 (0.0%) | 0 (0.0%) |
| Total | 216 (100.0%) | 136 (100.0%) |
Household Income by Mortgage Status in Charenton
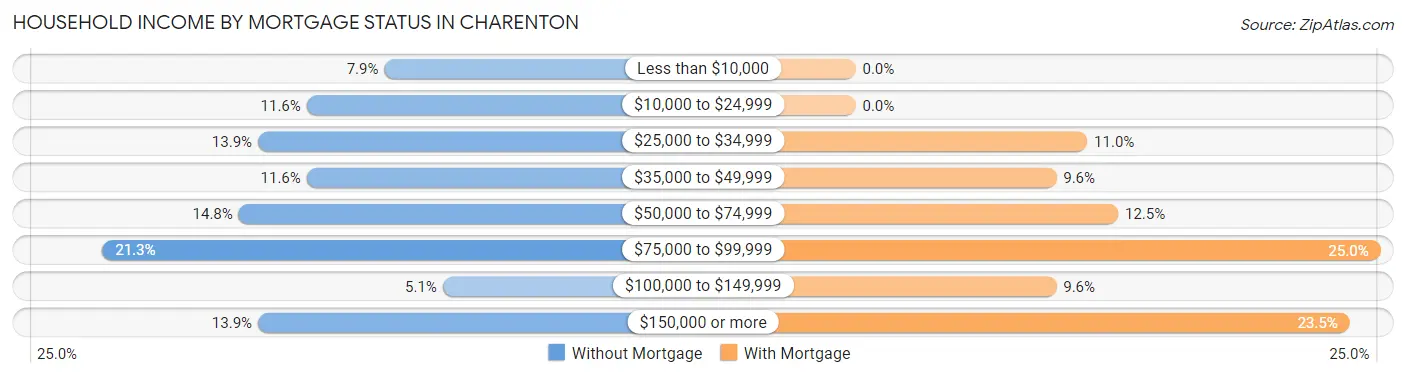
| Household Income | Without Mortgage | With Mortgage |
| Less than $10,000 | 17 (7.9%) | 0 (0.0%) |
| $10,000 to $24,999 | 25 (11.6%) | 0 (0.0%) |
| $25,000 to $34,999 | 30 (13.9%) | 15 (11.0%) |
| $35,000 to $49,999 | 25 (11.6%) | 13 (9.6%) |
| $50,000 to $74,999 | 32 (14.8%) | 17 (12.5%) |
| $75,000 to $99,999 | 46 (21.3%) | 34 (25.0%) |
| $100,000 to $149,999 | 11 (5.1%) | 13 (9.6%) |
| $150,000 or more | 30 (13.9%) | 32 (23.5%) |
| Total | 216 (100.0%) | 136 (100.0%) |
Property Value to Household Income Ratio in Charenton
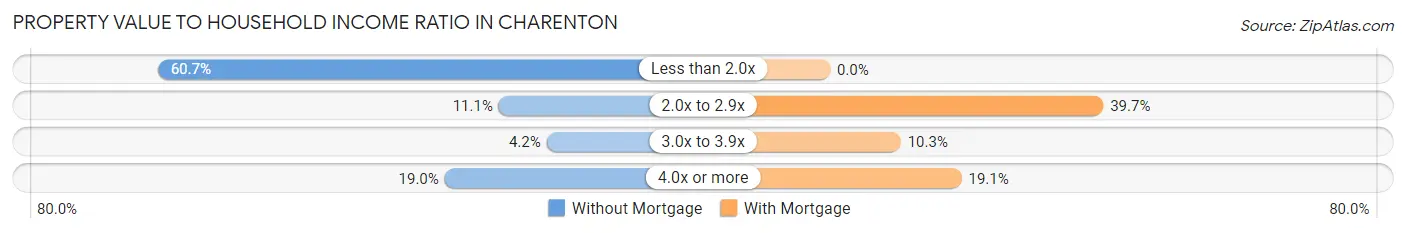
| Value-to-Income Ratio | Without Mortgage | With Mortgage |
| Less than 2.0x | 131 (60.7%) | 0 (0.0%) |
| 2.0x to 2.9x | 24 (11.1%) | 54 (39.7%) |
| 3.0x to 3.9x | 9 (4.2%) | 14 (10.3%) |
| 4.0x or more | 41 (19.0%) | 26 (19.1%) |
| Total | 216 (100.0%) | 136 (100.0%) |
Real Estate Taxes by Mortgage Status in Charenton
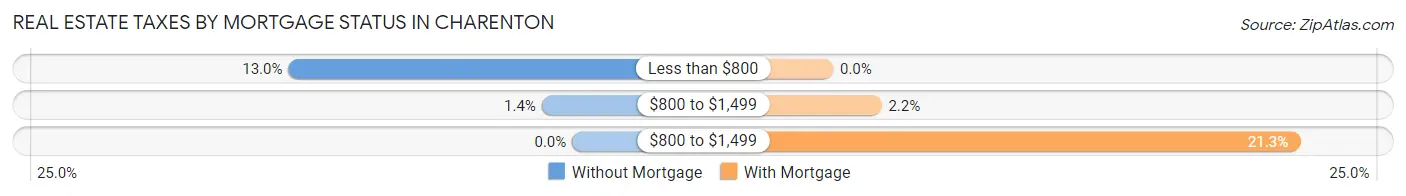
| Property Taxes | Without Mortgage | With Mortgage |
| Less than $800 | 28 (13.0%) | 0 (0.0%) |
| $800 to $1,499 | 3 (1.4%) | 3 (2.2%) |
| $800 to $1,499 | 0 (0.0%) | 29 (21.3%) |
| Total | 216 (100.0%) | 136 (100.0%) |
Health & Disability in Charenton
Health Insurance Coverage by Age in Charenton
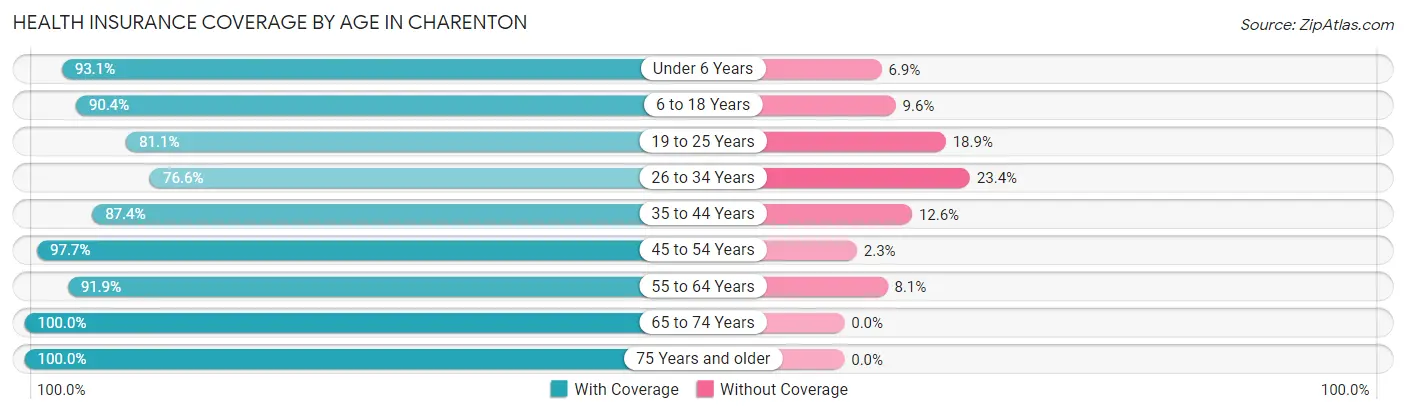
| Age Bracket | With Coverage | Without Coverage |
| Under 6 Years | 67 (93.1%) | 5 (6.9%) |
| 6 to 18 Years | 170 (90.4%) | 18 (9.6%) |
| 19 to 25 Years | 30 (81.1%) | 7 (18.9%) |
| 26 to 34 Years | 85 (76.6%) | 26 (23.4%) |
| 35 to 44 Years | 90 (87.4%) | 13 (12.6%) |
| 45 to 54 Years | 125 (97.7%) | 3 (2.3%) |
| 55 to 64 Years | 228 (91.9%) | 20 (8.1%) |
| 65 to 74 Years | 129 (100.0%) | 0 (0.0%) |
| 75 Years and older | 27 (100.0%) | 0 (0.0%) |
| Total | 951 (91.2%) | 92 (8.8%) |
Health Insurance Coverage by Citizenship Status in Charenton
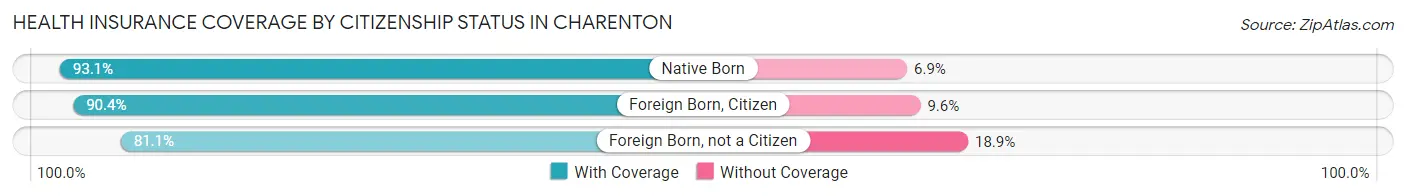
| Citizenship Status | With Coverage | Without Coverage |
| Native Born | 67 (93.1%) | 5 (6.9%) |
| Foreign Born, Citizen | 170 (90.4%) | 18 (9.6%) |
| Foreign Born, not a Citizen | 30 (81.1%) | 7 (18.9%) |
Health Insurance Coverage by Household Income in Charenton
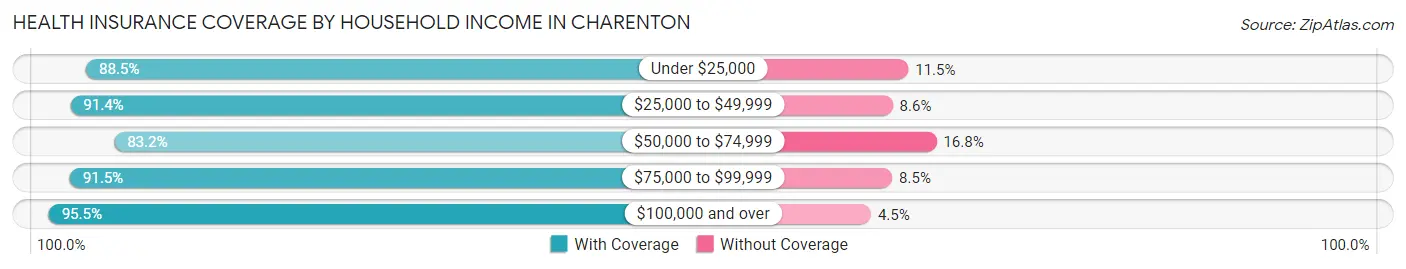
| Household Income | With Coverage | Without Coverage |
| Under $25,000 | 146 (88.5%) | 19 (11.5%) |
| $25,000 to $49,999 | 266 (91.4%) | 25 (8.6%) |
| $50,000 to $74,999 | 104 (83.2%) | 21 (16.8%) |
| $75,000 to $99,999 | 140 (91.5%) | 13 (8.5%) |
| $100,000 and over | 295 (95.5%) | 14 (4.5%) |
Public vs Private Health Insurance Coverage by Age in Charenton
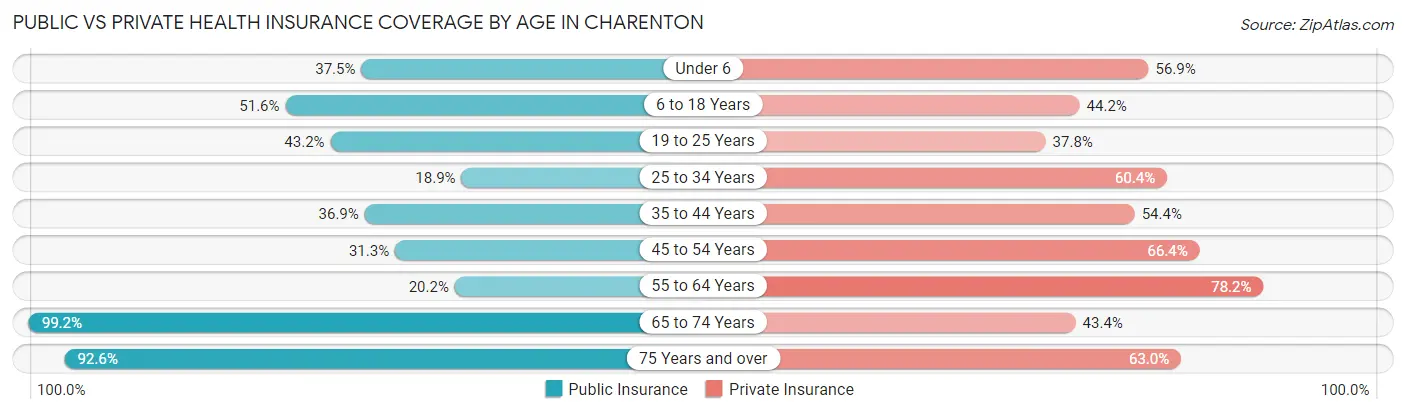
| Age Bracket | Public Insurance | Private Insurance |
| Under 6 | 27 (37.5%) | 41 (56.9%) |
| 6 to 18 Years | 97 (51.6%) | 83 (44.2%) |
| 19 to 25 Years | 16 (43.2%) | 14 (37.8%) |
| 25 to 34 Years | 21 (18.9%) | 67 (60.4%) |
| 35 to 44 Years | 38 (36.9%) | 56 (54.4%) |
| 45 to 54 Years | 40 (31.2%) | 85 (66.4%) |
| 55 to 64 Years | 50 (20.2%) | 194 (78.2%) |
| 65 to 74 Years | 128 (99.2%) | 56 (43.4%) |
| 75 Years and over | 25 (92.6%) | 17 (63.0%) |
| Total | 442 (42.4%) | 613 (58.8%) |
Disability Status by Sex by Age in Charenton
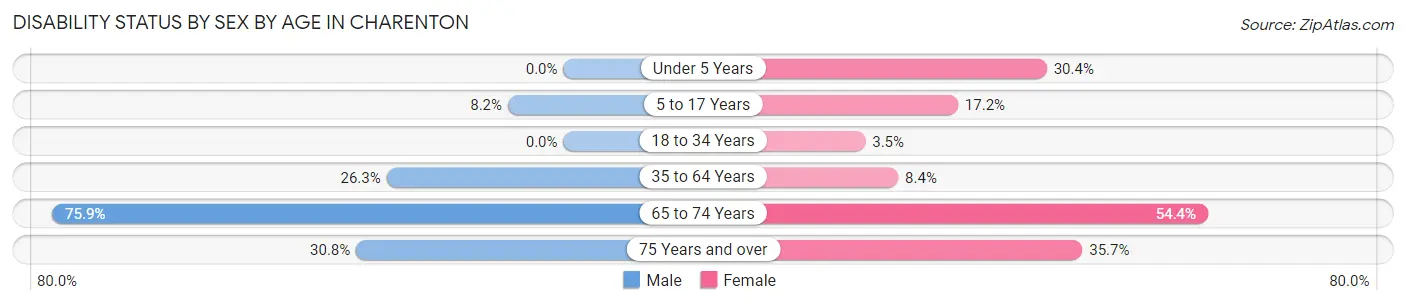
| Age Bracket | Male | Female |
| Under 5 Years | 0 (0.0%) | 7 (30.4%) |
| 5 to 17 Years | 7 (8.2%) | 15 (17.2%) |
| 18 to 34 Years | 0 (0.0%) | 3 (3.5%) |
| 35 to 64 Years | 63 (26.3%) | 20 (8.4%) |
| 65 to 74 Years | 63 (75.9%) | 25 (54.3%) |
| 75 Years and over | 4 (30.8%) | 5 (35.7%) |
Disability Class by Sex by Age in Charenton
Disability Class: Hearing Difficulty
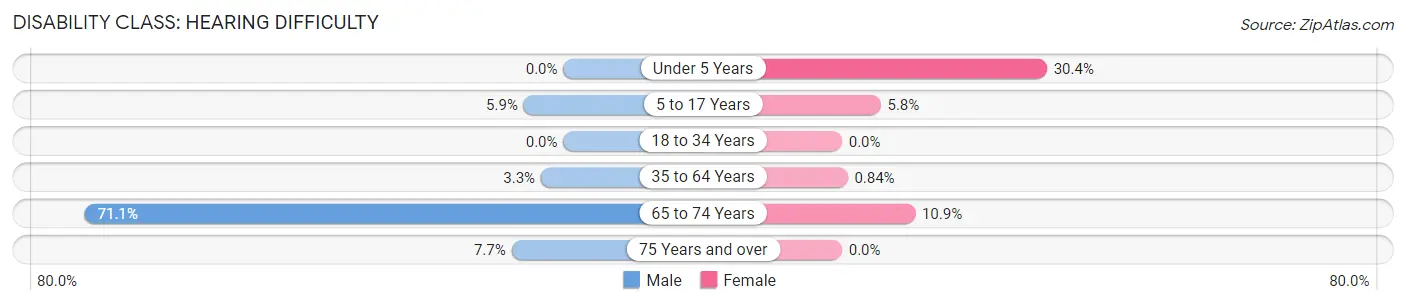
| Age Bracket | Male | Female |
| Under 5 Years | 0 (0.0%) | 7 (30.4%) |
| 5 to 17 Years | 5 (5.9%) | 5 (5.8%) |
| 18 to 34 Years | 0 (0.0%) | 0 (0.0%) |
| 35 to 64 Years | 8 (3.3%) | 2 (0.8%) |
| 65 to 74 Years | 59 (71.1%) | 5 (10.9%) |
| 75 Years and over | 1 (7.7%) | 0 (0.0%) |
Disability Class: Vision Difficulty
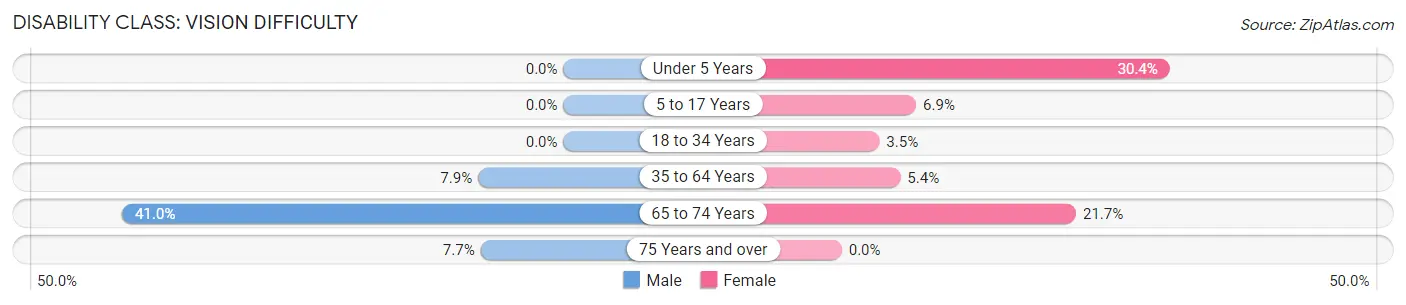
| Age Bracket | Male | Female |
| Under 5 Years | 0 (0.0%) | 7 (30.4%) |
| 5 to 17 Years | 0 (0.0%) | 6 (6.9%) |
| 18 to 34 Years | 0 (0.0%) | 3 (3.5%) |
| 35 to 64 Years | 19 (7.9%) | 13 (5.4%) |
| 65 to 74 Years | 34 (41.0%) | 10 (21.7%) |
| 75 Years and over | 1 (7.7%) | 0 (0.0%) |
Disability Class: Cognitive Difficulty
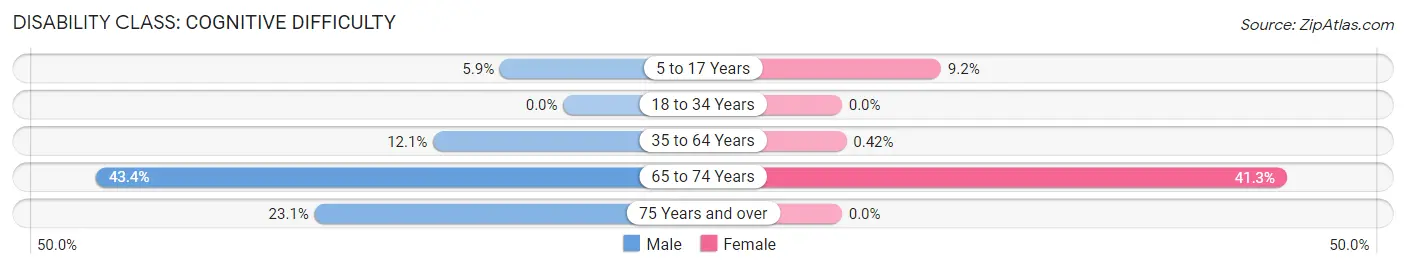
| Age Bracket | Male | Female |
| 5 to 17 Years | 5 (5.9%) | 8 (9.2%) |
| 18 to 34 Years | 0 (0.0%) | 0 (0.0%) |
| 35 to 64 Years | 29 (12.1%) | 1 (0.4%) |
| 65 to 74 Years | 36 (43.4%) | 19 (41.3%) |
| 75 Years and over | 3 (23.1%) | 0 (0.0%) |
Disability Class: Ambulatory Difficulty
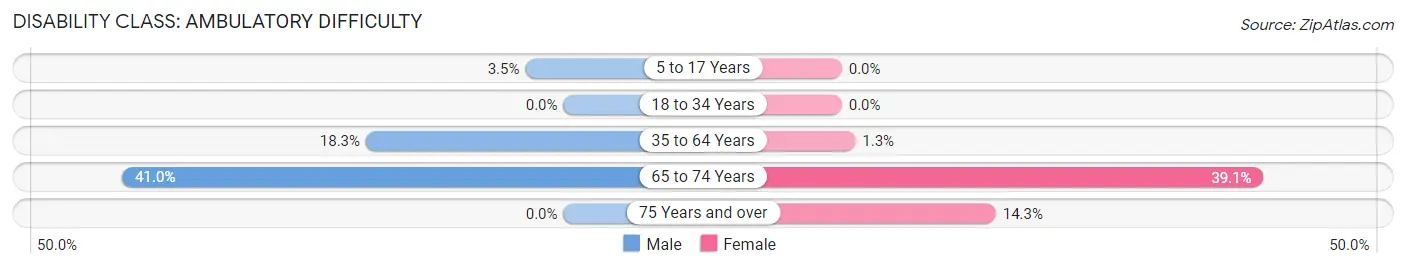
| Age Bracket | Male | Female |
| 5 to 17 Years | 3 (3.5%) | 0 (0.0%) |
| 18 to 34 Years | 0 (0.0%) | 0 (0.0%) |
| 35 to 64 Years | 44 (18.3%) | 3 (1.3%) |
| 65 to 74 Years | 34 (41.0%) | 18 (39.1%) |
| 75 Years and over | 0 (0.0%) | 2 (14.3%) |
Disability Class: Self-Care Difficulty
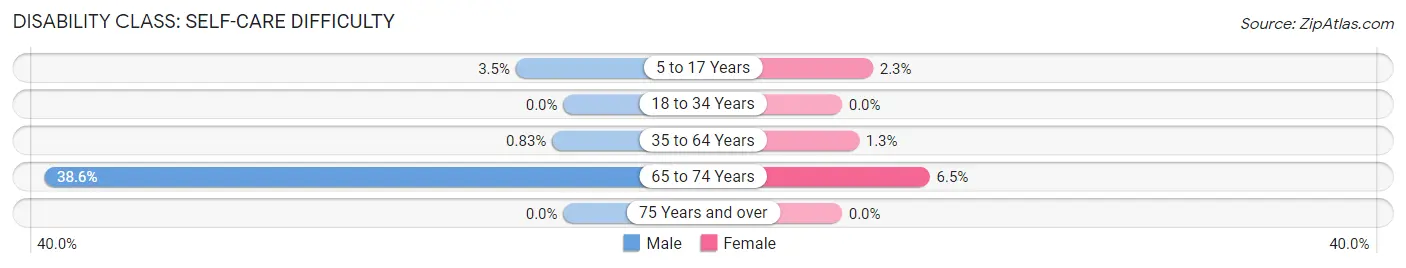
| Age Bracket | Male | Female |
| 5 to 17 Years | 3 (3.5%) | 2 (2.3%) |
| 18 to 34 Years | 0 (0.0%) | 0 (0.0%) |
| 35 to 64 Years | 2 (0.8%) | 3 (1.3%) |
| 65 to 74 Years | 32 (38.6%) | 3 (6.5%) |
| 75 Years and over | 0 (0.0%) | 0 (0.0%) |
Technology Access in Charenton
Computing Device Access in Charenton
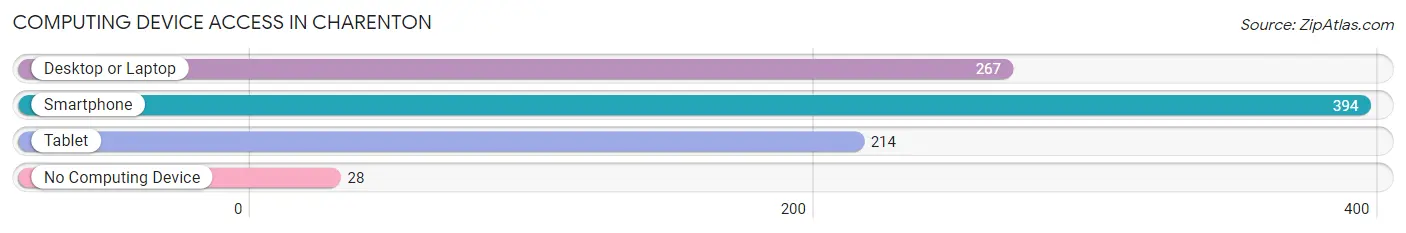
| Device Type | # Households | % Households |
| Desktop or Laptop | 267 | 60.3% |
| Smartphone | 394 | 88.9% |
| Tablet | 214 | 48.3% |
| No Computing Device | 28 | 6.3% |
| Total | 443 | 100.0% |
Internet Access in Charenton
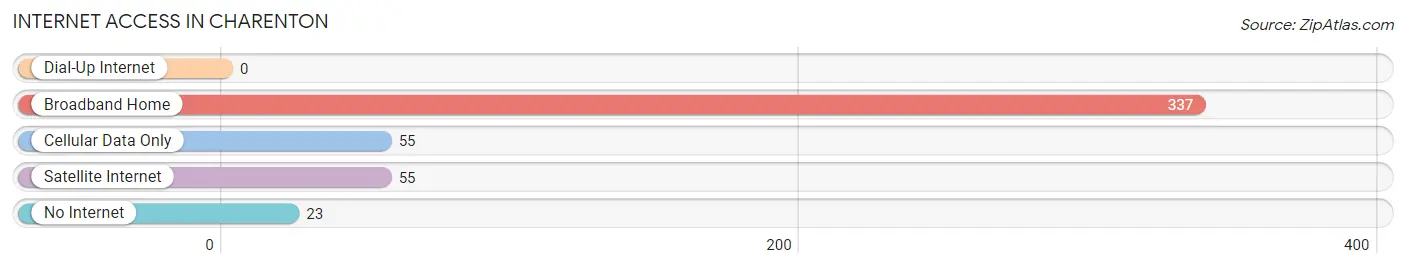
| Internet Type | # Households | % Households |
| Dial-Up Internet | 0 | 0.0% |
| Broadband Home | 337 | 76.1% |
| Cellular Data Only | 55 | 12.4% |
| Satellite Internet | 55 | 12.4% |
| No Internet | 23 | 5.2% |
| Total | 443 | 100.0% |
Charenton Summary
Charenton is a small unincorporated community located in St. Mary Parish, Louisiana. It is situated on the banks of Bayou Teche, approximately 15 miles south of the city of Morgan City. The population of Charenton was 1,717 at the 2010 census.
History
Charenton was founded in 1819 by French-speaking Acadians who had been exiled from Nova Scotia. The town was named after the Charenton River in France. The Acadians were attracted to the area by the abundance of fish and wildlife in the Bayou Teche. The town quickly grew and became a center of commerce for the surrounding area.
In the late 19th century, Charenton was a major port for the lumber industry. The town was also home to a number of sugar plantations. During the Civil War, Charenton was a major supplier of cotton to the Confederate Army.
Geography
Charenton is located at 29°45'N, 91°25'W (29.75, -91.42). The town is situated on the banks of Bayou Teche, approximately 15 miles south of the city of Morgan City. The terrain is mostly flat with some low hills. The climate is humid subtropical with hot, humid summers and mild winters.
Economy
The economy of Charenton is largely based on agriculture and fishing. The town is home to a number of sugar plantations and is a major producer of sugar cane. The town is also home to a number of seafood processing plants.
Demographics
As of the 2010 census, the population of Charenton was 1,717. The racial makeup of the town was 73.3% White, 22.2% African American, 0.7% Native American, 0.3% Asian, 0.1% Pacific Islander, and 3.4% from two or more races. The median household income was $30,938. The per capita income was $14,945.
Conclusion
Charenton is a small unincorporated community located in St. Mary Parish, Louisiana. It was founded in 1819 by French-speaking Acadians and has since become a center of commerce for the surrounding area. The economy of Charenton is largely based on agriculture and fishing. The population of Charenton was 1,717 at the 2010 census. The racial makeup of the town was 73.3% White, 22.2% African American, 0.7% Native American, 0.3% Asian, 0.1% Pacific Islander, and 3.4% from two or more races. The median household income was $30,938. The per capita income was $14,945.
Common Questions
What is Per Capita Income in Charenton?
Per Capita income in Charenton is $29,481.
What is the Median Family Income in Charenton?
Median Family Income in Charenton is $65,938.
What is the Median Household income in Charenton?
Median Household Income in Charenton is $50,282.
What is Income or Wage Gap in Charenton?
Income or Wage Gap in Charenton is 22.1%.
Women in Charenton earn 77.9 cents for every dollar earned by a man.
What is Inequality or Gini Index in Charenton?
Inequality or Gini Index in Charenton is 0.42.
What is the Total Population of Charenton?
Total Population of Charenton is 1,051.
What is the Total Male Population of Charenton?
Total Male Population of Charenton is 556.
What is the Total Female Population of Charenton?
Total Female Population of Charenton is 495.
What is the Ratio of Males per 100 Females in Charenton?
There are 112.32 Males per 100 Females in Charenton.
What is the Ratio of Females per 100 Males in Charenton?
There are 89.03 Females per 100 Males in Charenton.
What is the Median Population Age in Charenton?
Median Population Age in Charenton is 46.0 Years.
What is the Average Family Size in Charenton
Average Family Size in Charenton is 2.7 People.
What is the Average Household Size in Charenton
Average Household Size in Charenton is 2.4 People.
How Large is the Labor Force in Charenton?
There are 471 People in the Labor Forcein in Charenton.
What is the Percentage of People in the Labor Force in Charenton?
54.9% of People are in the Labor Force in Charenton.
What is the Unemployment Rate in Charenton?
Unemployment Rate in Charenton is 4.1%.