St Mary Parish, LA Map & Demographics
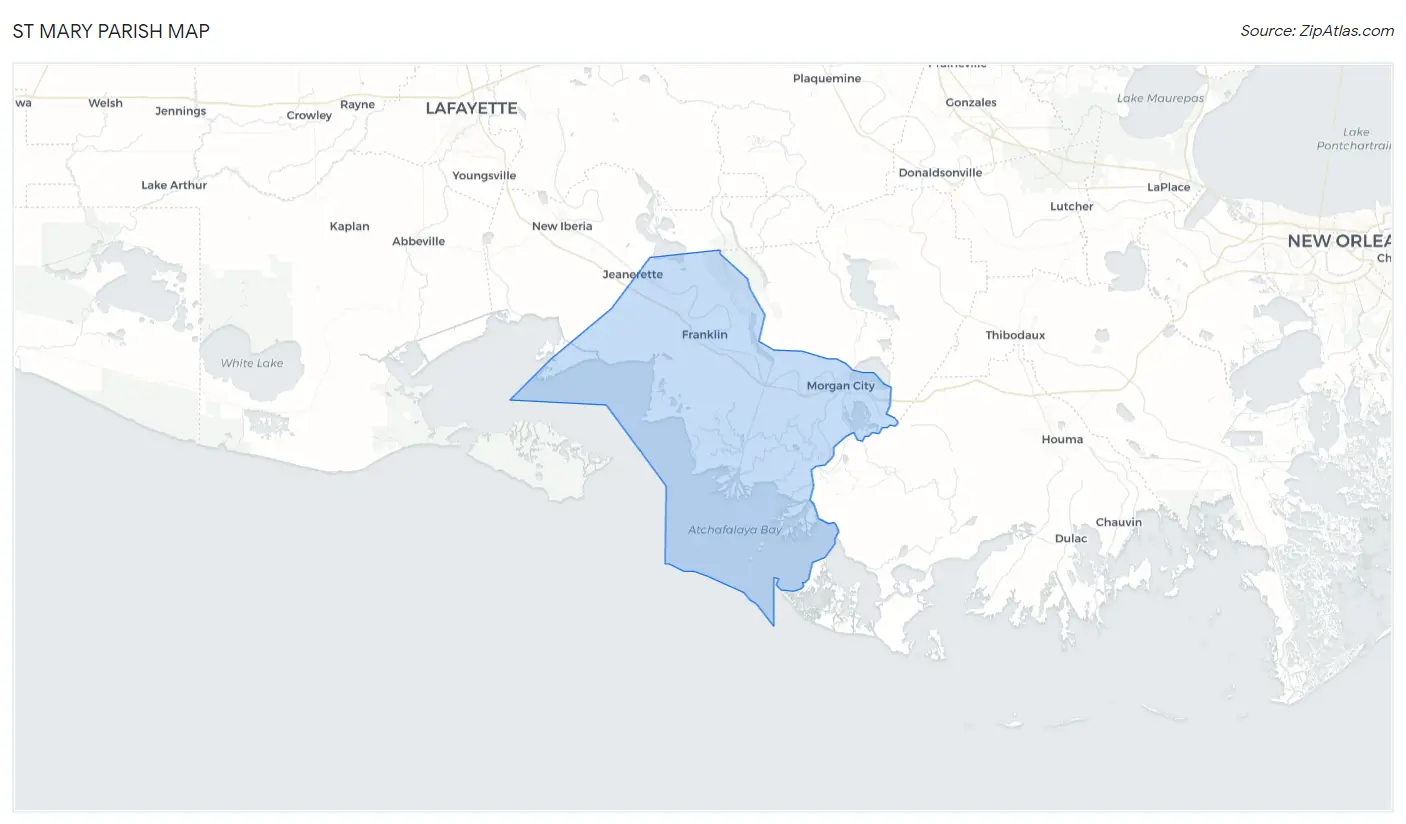
St Mary Parish Map
St Mary Parish Overview
$26,949
PER CAPITA INCOME
$63,102
AVG FAMILY INCOME
$47,322
AVG HOUSEHOLD INCOME
44.3%
WAGE / INCOME GAP [ % ]
55.7¢/ $1
WAGE / INCOME GAP [ $ ]
$11,541
FAMILY INCOME DEFICIT
0.48
INEQUALITY / GINI INDEX
49,114
TOTAL POPULATION
24,037
MALE POPULATION
25,077
FEMALE POPULATION
95.85
MALES / 100 FEMALES
104.33
FEMALES / 100 MALES
39.5
MEDIAN AGE
3.3
AVG FAMILY SIZE
2.6
AVG HOUSEHOLD SIZE
20,623
LABOR FORCE [ PEOPLE ]
53.4%
PERCENT IN LABOR FORCE
5.9%
UNEMPLOYMENT RATE
Income in St Mary Parish
Income Overview in St Mary Parish
Per Capita Income in St Mary Parish is $26,949, while median incomes of families and households are $63,102 and $47,322 respectively.
| Characteristic | Number | Measure |
| Per Capita Income | 49,114 | $26,949 |
| Median Family Income | 12,336 | $63,102 |
| Mean Family Income | 12,336 | $80,719 |
| Median Household Income | 18,628 | $47,322 |
| Mean Household Income | 18,628 | $66,683 |
| Income Deficit | 12,336 | $11,541 |
| Wage / Income Gap (%) | 49,114 | 44.32% |
| Wage / Income Gap ($) | 49,114 | 55.68¢ per $1 |
| Gini / Inequality Index | 49,114 | 0.48 |
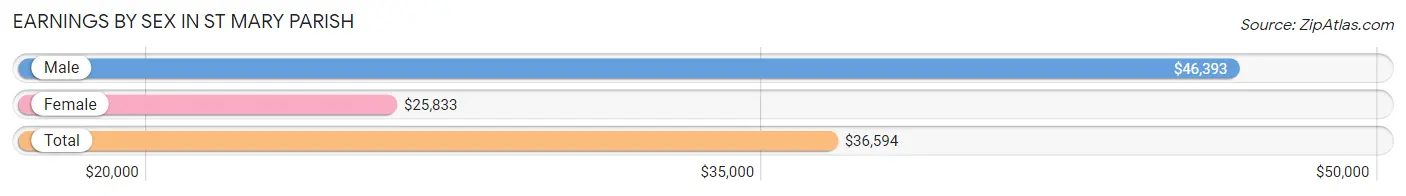
Earnings by Sex in St Mary Parish
Average Earnings in St Mary Parish are $36,594, $46,393 for men and $25,833 for women, a difference of 44.3%.
| Sex | Number | Average Earnings |
| Male | 11,012 (51.9%) | $46,393 |
| Female | 10,218 (48.1%) | $25,833 |
| Total | 21,230 (100.0%) | $36,594 |
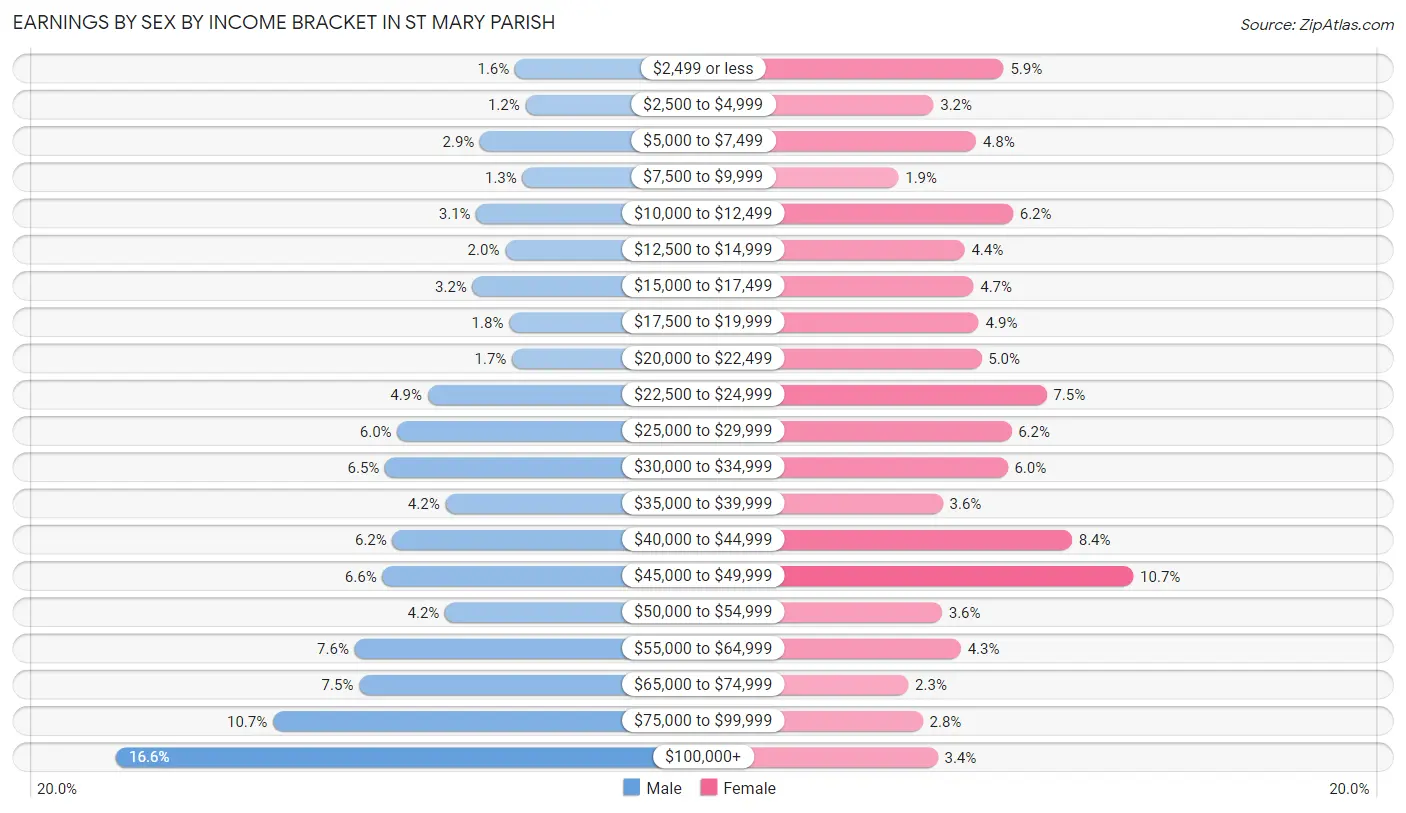
Earnings by Sex by Income Bracket in St Mary Parish
The most common earnings brackets in St Mary Parish are $100,000+ for men (1,825 | 16.6%) and $45,000 to $49,999 for women (1,096 | 10.7%).
| Income | Male | Female |
| $2,499 or less | 178 (1.6%) | 600 (5.9%) |
| $2,500 to $4,999 | 135 (1.2%) | 331 (3.2%) |
| $5,000 to $7,499 | 323 (2.9%) | 495 (4.8%) |
| $7,500 to $9,999 | 148 (1.3%) | 197 (1.9%) |
| $10,000 to $12,499 | 338 (3.1%) | 636 (6.2%) |
| $12,500 to $14,999 | 219 (2.0%) | 451 (4.4%) |
| $15,000 to $17,499 | 354 (3.2%) | 484 (4.7%) |
| $17,500 to $19,999 | 203 (1.8%) | 505 (4.9%) |
| $20,000 to $22,499 | 191 (1.7%) | 515 (5.0%) |
| $22,500 to $24,999 | 538 (4.9%) | 764 (7.5%) |
| $25,000 to $29,999 | 664 (6.0%) | 629 (6.2%) |
| $30,000 to $34,999 | 715 (6.5%) | 615 (6.0%) |
| $35,000 to $39,999 | 466 (4.2%) | 367 (3.6%) |
| $40,000 to $44,999 | 684 (6.2%) | 861 (8.4%) |
| $45,000 to $49,999 | 726 (6.6%) | 1,096 (10.7%) |
| $50,000 to $54,999 | 467 (4.2%) | 364 (3.6%) |
| $55,000 to $64,999 | 840 (7.6%) | 436 (4.3%) |
| $65,000 to $74,999 | 821 (7.5%) | 235 (2.3%) |
| $75,000 to $99,999 | 1,177 (10.7%) | 290 (2.8%) |
| $100,000+ | 1,825 (16.6%) | 347 (3.4%) |
| Total | 11,012 (100.0%) | 10,218 (100.0%) |
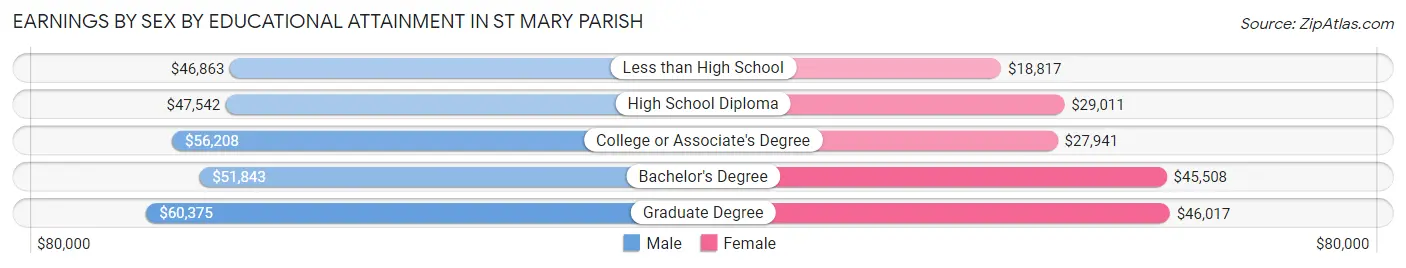
Earnings by Sex by Educational Attainment in St Mary Parish
Average earnings in St Mary Parish are $50,820 for men and $29,698 for women, a difference of 41.6%. Men with an educational attainment of graduate degree enjoy the highest average annual earnings of $60,375, while those with less than high school education earn the least with $46,863. Women with an educational attainment of graduate degree earn the most with the average annual earnings of $46,017, while those with less than high school education have the smallest earnings of $18,817.
| Educational Attainment | Male Income | Female Income |
| Less than High School | $46,863 | $18,817 |
| High School Diploma | $47,542 | $29,011 |
| College or Associate's Degree | $56,208 | $27,941 |
| Bachelor's Degree | $51,843 | $45,508 |
| Graduate Degree | $60,375 | $46,017 |
| Total | $50,820 | $29,698 |
Family Income in St Mary Parish
Family Income Brackets in St Mary Parish
According to the St Mary Parish family income data, there are 2,356 families falling into the $100,000 to $149,999 income range, which is the most common income bracket and makes up 19.1% of all families. Conversely, the $10,000 to $14,999 income bracket is the least frequent group with only 432 families (3.5%) belonging to this category.
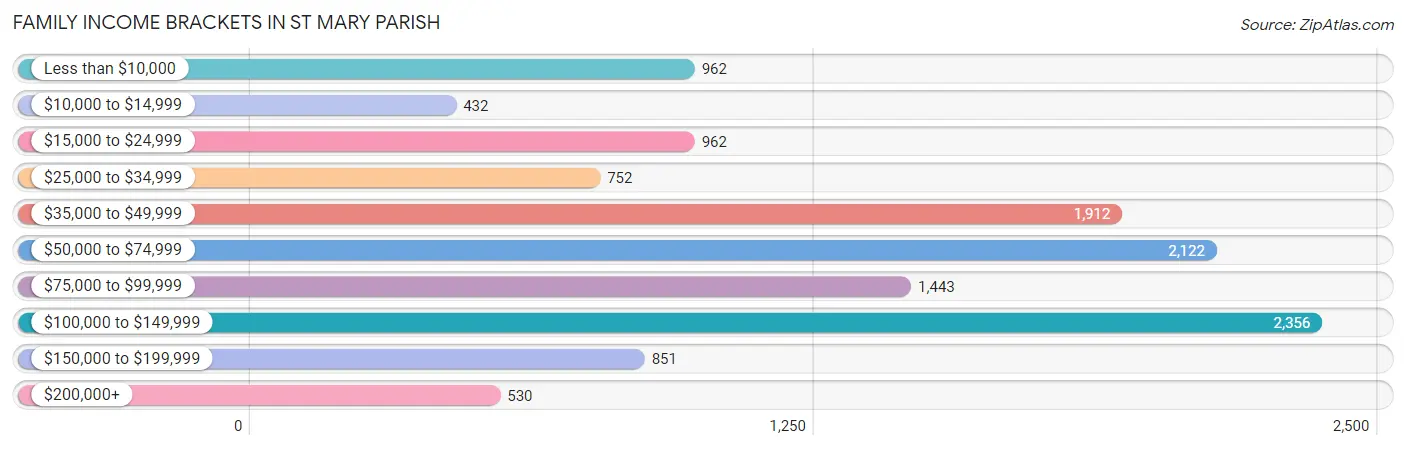
| Income Bracket | # Families | % Families |
| Less than $10,000 | 962 | 7.8% |
| $10,000 to $14,999 | 432 | 3.5% |
| $15,000 to $24,999 | 962 | 7.8% |
| $25,000 to $34,999 | 752 | 6.1% |
| $35,000 to $49,999 | 1,912 | 15.5% |
| $50,000 to $74,999 | 2,122 | 17.2% |
| $75,000 to $99,999 | 1,443 | 11.7% |
| $100,000 to $149,999 | 2,356 | 19.1% |
| $150,000 to $199,999 | 851 | 6.9% |
| $200,000+ | 530 | 4.3% |
Family Income by Famaliy Size in St Mary Parish
5-person families (834 | 6.8%) account for the highest median family income in St Mary Parish with $99,115 per family, while 2-person families (6,111 | 49.5%) have the highest median income of $29,661 per family member.
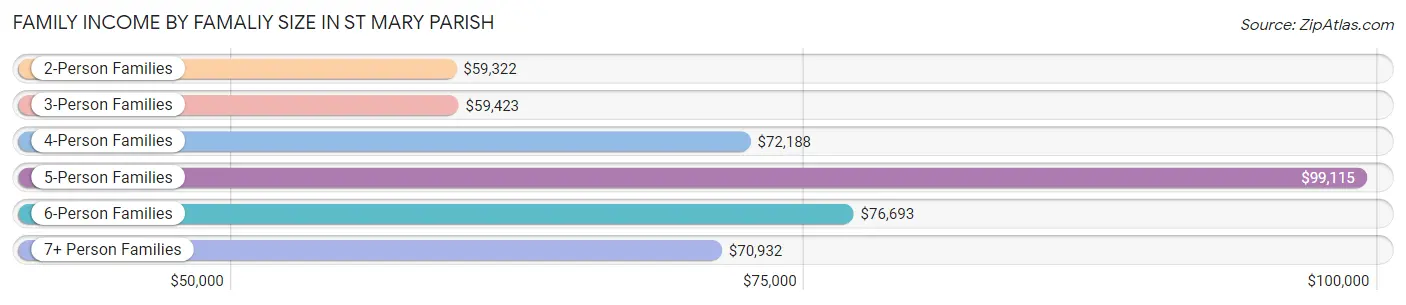
| Income Bracket | # Families | Median Income |
| 2-Person Families | 6,111 (49.5%) | $59,322 |
| 3-Person Families | 3,038 (24.6%) | $59,423 |
| 4-Person Families | 1,881 (15.2%) | $72,188 |
| 5-Person Families | 834 (6.8%) | $99,115 |
| 6-Person Families | 377 (3.1%) | $76,693 |
| 7+ Person Families | 95 (0.8%) | $70,932 |
| Total | 12,336 (100.0%) | $63,102 |
Family Income by Number of Earners in St Mary Parish
The median family income in St Mary Parish is $63,102, with families comprising 3+ earners (769) having the highest median family income of $136,219, while families with no earners (2,368) have the lowest median family income of $20,493, accounting for 6.2% and 19.2% of families, respectively.
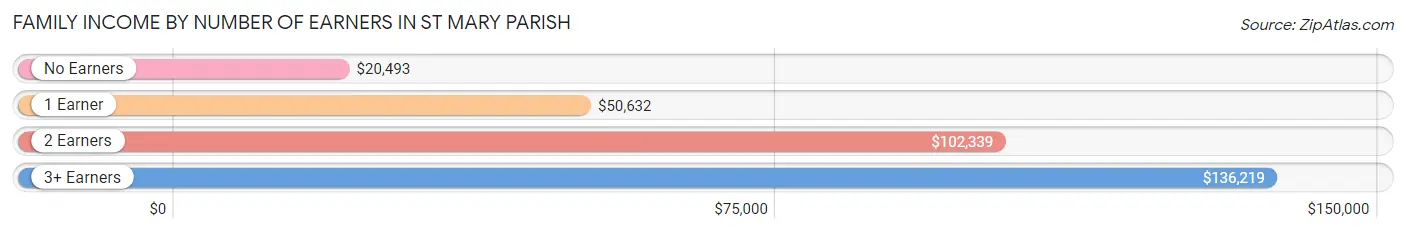
| Number of Earners | # Families | Median Income |
| No Earners | 2,368 (19.2%) | $20,493 |
| 1 Earner | 5,151 (41.8%) | $50,632 |
| 2 Earners | 4,048 (32.8%) | $102,339 |
| 3+ Earners | 769 (6.2%) | $136,219 |
| Total | 12,336 (100.0%) | $63,102 |
Household Income in St Mary Parish
Household Income Brackets in St Mary Parish
With 2,831 households falling in the category, the $50,000 to $74,999 income range is the most frequent in St Mary Parish, accounting for 15.2% of all households. In contrast, only 596 households (3.2%) fall into the $200,000+ income bracket, making it the least populous group.
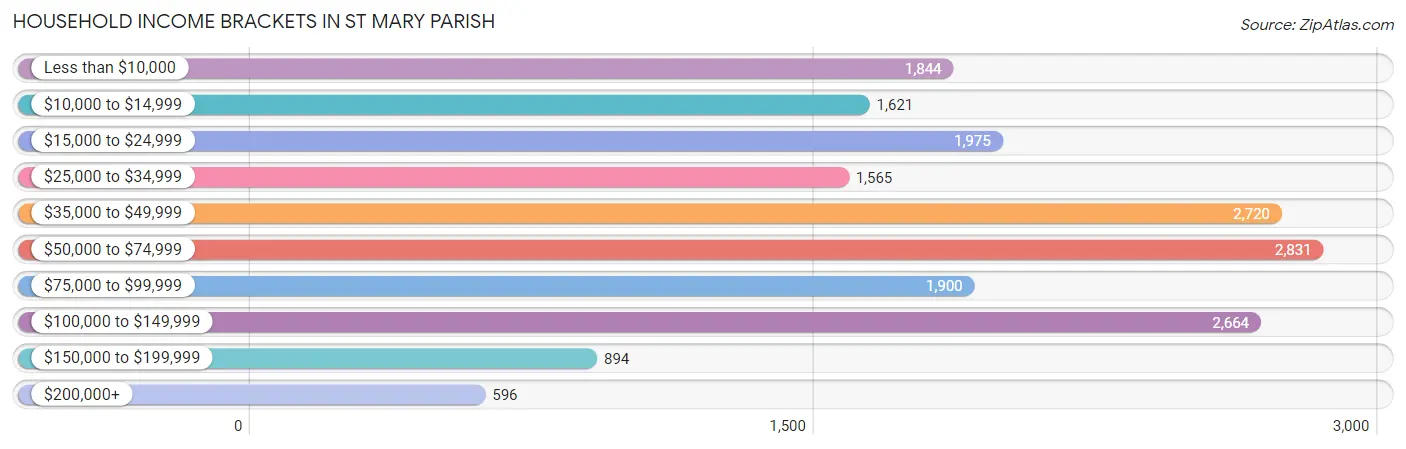
| Income Bracket | # Households | % Households |
| Less than $10,000 | 1,844 | 9.9% |
| $10,000 to $14,999 | 1,621 | 8.7% |
| $15,000 to $24,999 | 1,975 | 10.6% |
| $25,000 to $34,999 | 1,565 | 8.4% |
| $35,000 to $49,999 | 2,720 | 14.6% |
| $50,000 to $74,999 | 2,831 | 15.2% |
| $75,000 to $99,999 | 1,900 | 10.2% |
| $100,000 to $149,999 | 2,664 | 14.3% |
| $150,000 to $199,999 | 894 | 4.8% |
| $200,000+ | 596 | 3.2% |
Household Income by Householder Age in St Mary Parish
The median household income in St Mary Parish is $47,322, with the highest median household income of $55,239 found in the 45 to 64 years age bracket for the primary householder. A total of 7,211 households (38.7%) fall into this category. Meanwhile, the 65+ years age bracket for the primary householder has the lowest median household income of $40,414, with 5,570 households (29.9%) in this group.
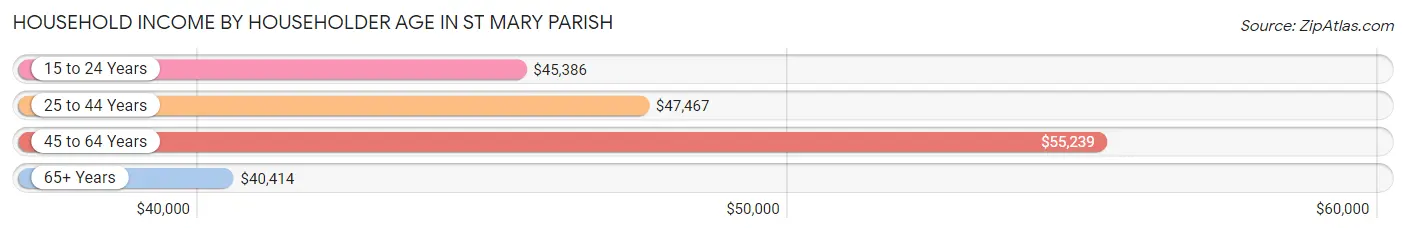
| Income Bracket | # Households | Median Income |
| 15 to 24 Years | 678 (3.6%) | $45,386 |
| 25 to 44 Years | 5,169 (27.8%) | $47,467 |
| 45 to 64 Years | 7,211 (38.7%) | $55,239 |
| 65+ Years | 5,570 (29.9%) | $40,414 |
| Total | 18,628 (100.0%) | $47,322 |
Poverty in St Mary Parish
Income Below Poverty by Sex and Age in St Mary Parish
With 20.5% poverty level for males and 23.3% for females among the residents of St Mary Parish, 5 year old males and 15 year old females are the most vulnerable to poverty, with 79 males (35.0%) and 194 females (40.4%) in their respective age groups living below the poverty level.
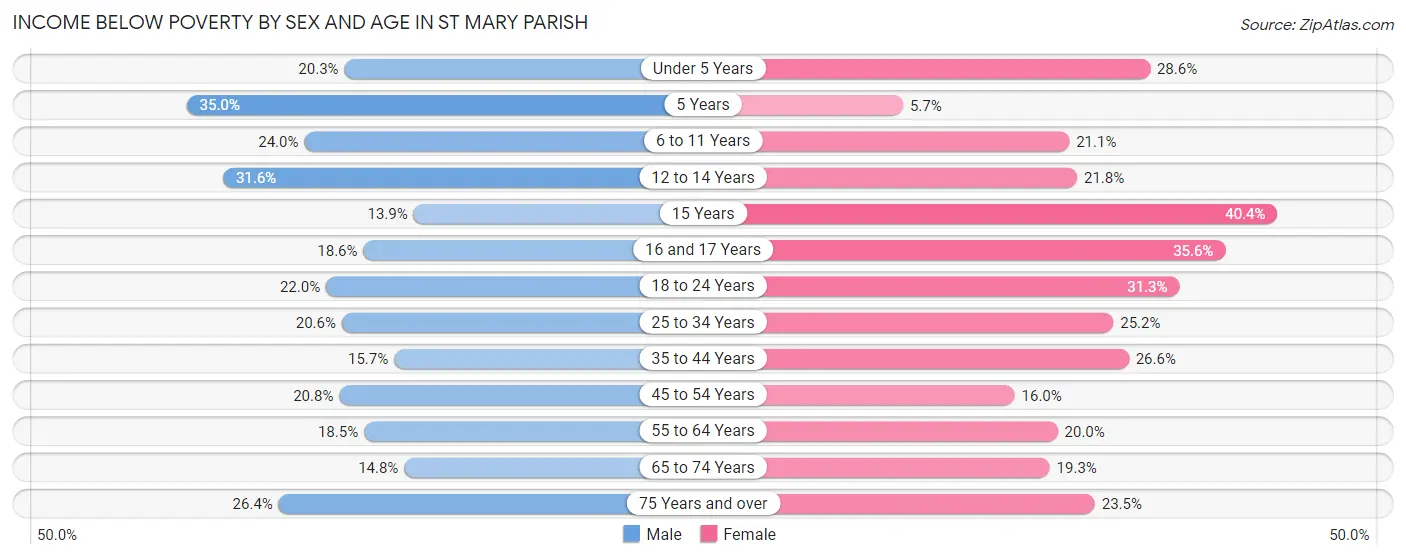
| Age Bracket | Male | Female |
| Under 5 Years | 307 (20.3%) | 485 (28.6%) |
| 5 Years | 79 (35.0%) | 13 (5.7%) |
| 6 to 11 Years | 456 (24.0%) | 394 (21.1%) |
| 12 to 14 Years | 392 (31.6%) | 243 (21.8%) |
| 15 Years | 31 (13.9%) | 194 (40.4%) |
| 16 and 17 Years | 131 (18.6%) | 185 (35.6%) |
| 18 to 24 Years | 412 (22.0%) | 538 (31.3%) |
| 25 to 34 Years | 583 (20.6%) | 795 (25.2%) |
| 35 to 44 Years | 417 (15.7%) | 764 (26.6%) |
| 45 to 54 Years | 632 (20.8%) | 483 (16.0%) |
| 55 to 64 Years | 650 (18.5%) | 735 (20.0%) |
| 65 to 74 Years | 352 (14.8%) | 497 (19.3%) |
| 75 Years and over | 387 (26.4%) | 468 (23.5%) |
| Total | 4,829 (20.5%) | 5,794 (23.3%) |
Income Above Poverty by Sex and Age in St Mary Parish
According to the poverty statistics in St Mary Parish, males aged 15 years and females aged 5 years are the age groups that are most secure financially, with 86.1% of males and 94.3% of females in these age groups living above the poverty line.
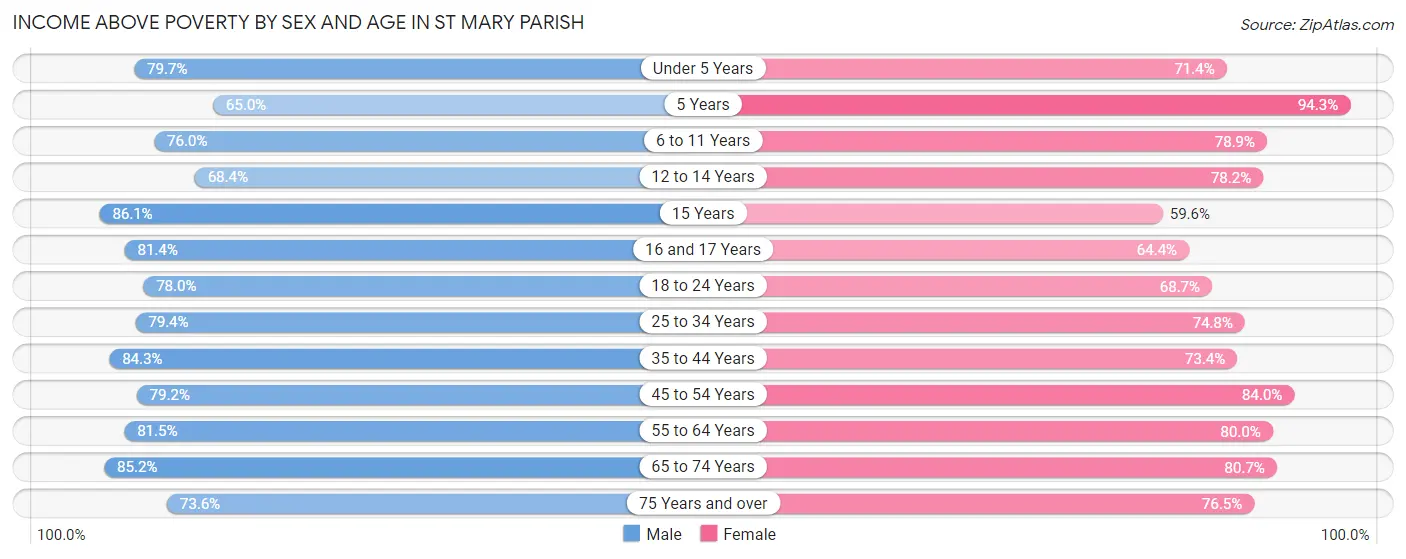
| Age Bracket | Male | Female |
| Under 5 Years | 1,204 (79.7%) | 1,211 (71.4%) |
| 5 Years | 147 (65.0%) | 216 (94.3%) |
| 6 to 11 Years | 1,441 (76.0%) | 1,472 (78.9%) |
| 12 to 14 Years | 849 (68.4%) | 870 (78.2%) |
| 15 Years | 192 (86.1%) | 286 (59.6%) |
| 16 and 17 Years | 575 (81.4%) | 335 (64.4%) |
| 18 to 24 Years | 1,458 (78.0%) | 1,180 (68.7%) |
| 25 to 34 Years | 2,253 (79.4%) | 2,360 (74.8%) |
| 35 to 44 Years | 2,238 (84.3%) | 2,105 (73.4%) |
| 45 to 54 Years | 2,406 (79.2%) | 2,528 (84.0%) |
| 55 to 64 Years | 2,864 (81.5%) | 2,935 (80.0%) |
| 65 to 74 Years | 2,031 (85.2%) | 2,079 (80.7%) |
| 75 Years and over | 1,078 (73.6%) | 1,525 (76.5%) |
| Total | 18,736 (79.5%) | 19,102 (76.7%) |
Income Below Poverty Among Married-Couple Families in St Mary Parish
The poverty statistics for married-couple families in St Mary Parish show that 9.5% or 768 of the total 8,125 families live below the poverty line. Families with no children have the highest poverty rate of 9.9%, comprising of 487 families. On the other hand, families with 5 or more children have the lowest poverty rate of 0.0%, which includes 0 families.
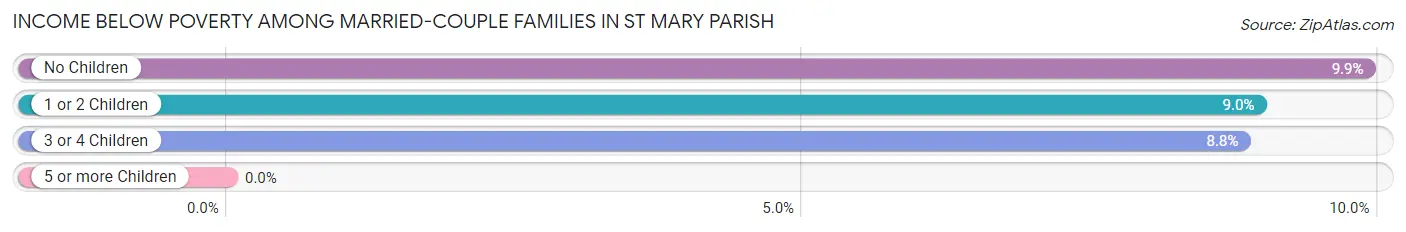
| Children | Above Poverty | Below Poverty |
| No Children | 4,432 (90.1%) | 487 (9.9%) |
| 1 or 2 Children | 2,156 (91.0%) | 212 (8.9%) |
| 3 or 4 Children | 714 (91.2%) | 69 (8.8%) |
| 5 or more Children | 55 (100.0%) | 0 (0.0%) |
| Total | 7,357 (90.5%) | 768 (9.5%) |
Income Below Poverty Among Single-Parent Households in St Mary Parish
According to the poverty data in St Mary Parish, 17.1% or 193 single-father households and 35.8% or 1,104 single-mother households are living below the poverty line. Among single-father households, those with no children have the highest poverty rate, with 156 households (21.9%) experiencing poverty. Likewise, among single-mother households, those with 3 or 4 children have the highest poverty rate, with 215 households (89.2%) falling below the poverty line.
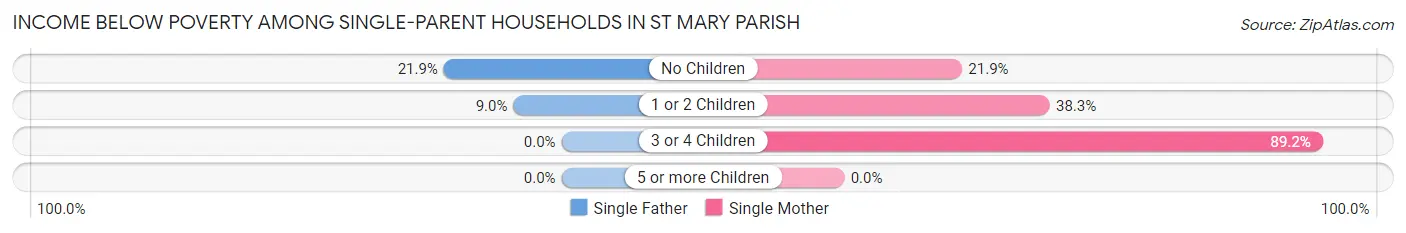
| Children | Single Father | Single Mother |
| No Children | 156 (21.9%) | 263 (21.9%) |
| 1 or 2 Children | 37 (9.0%) | 626 (38.3%) |
| 3 or 4 Children | 0 (0.0%) | 215 (89.2%) |
| 5 or more Children | 0 (0.0%) | 0 (0.0%) |
| Total | 193 (17.1%) | 1,104 (35.8%) |
Income Below Poverty Among Married-Couple vs Single-Parent Households in St Mary Parish
The poverty data for St Mary Parish shows that 768 of the married-couple family households (9.5%) and 1,297 of the single-parent households (30.8%) are living below the poverty level. Within the married-couple family households, those with no children have the highest poverty rate, with 487 households (9.9%) falling below the poverty line. Among the single-parent households, those with 3 or 4 children have the highest poverty rate, with 215 household (86.4%) living below poverty.
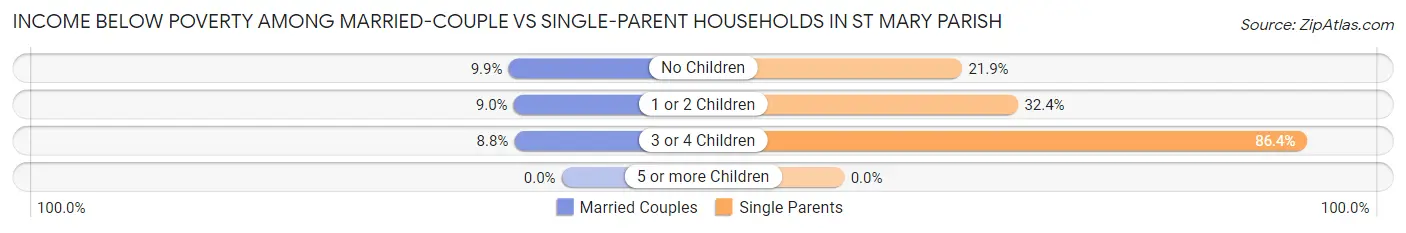
| Children | Married-Couple Families | Single-Parent Households |
| No Children | 487 (9.9%) | 419 (21.9%) |
| 1 or 2 Children | 212 (8.9%) | 663 (32.4%) |
| 3 or 4 Children | 69 (8.8%) | 215 (86.4%) |
| 5 or more Children | 0 (0.0%) | 0 (0.0%) |
| Total | 768 (9.5%) | 1,297 (30.8%) |
Race in St Mary Parish
The most populous races in St Mary Parish are White / Caucasian (28,427 | 57.9%), Black / African American (14,554 | 29.6%), and Hispanic or Latino (3,566 | 7.3%).
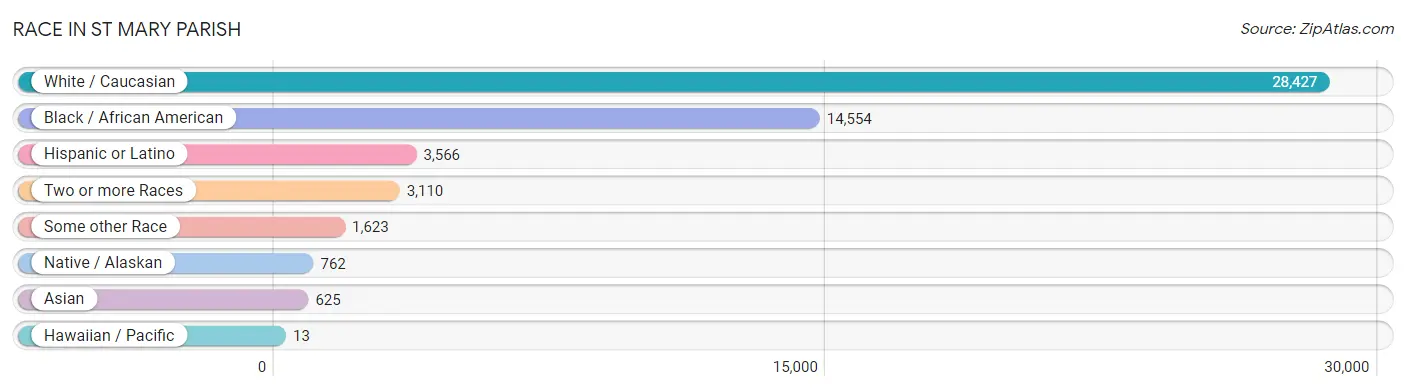
| Race | # Population | % Population |
| Asian | 625 | 1.3% |
| Black / African American | 14,554 | 29.6% |
| Hawaiian / Pacific | 13 | 0.0% |
| Hispanic or Latino | 3,566 | 7.3% |
| Native / Alaskan | 762 | 1.5% |
| White / Caucasian | 28,427 | 57.9% |
| Two or more Races | 3,110 | 6.3% |
| Some other Race | 1,623 | 3.3% |
| Total | 49,114 | 100.0% |
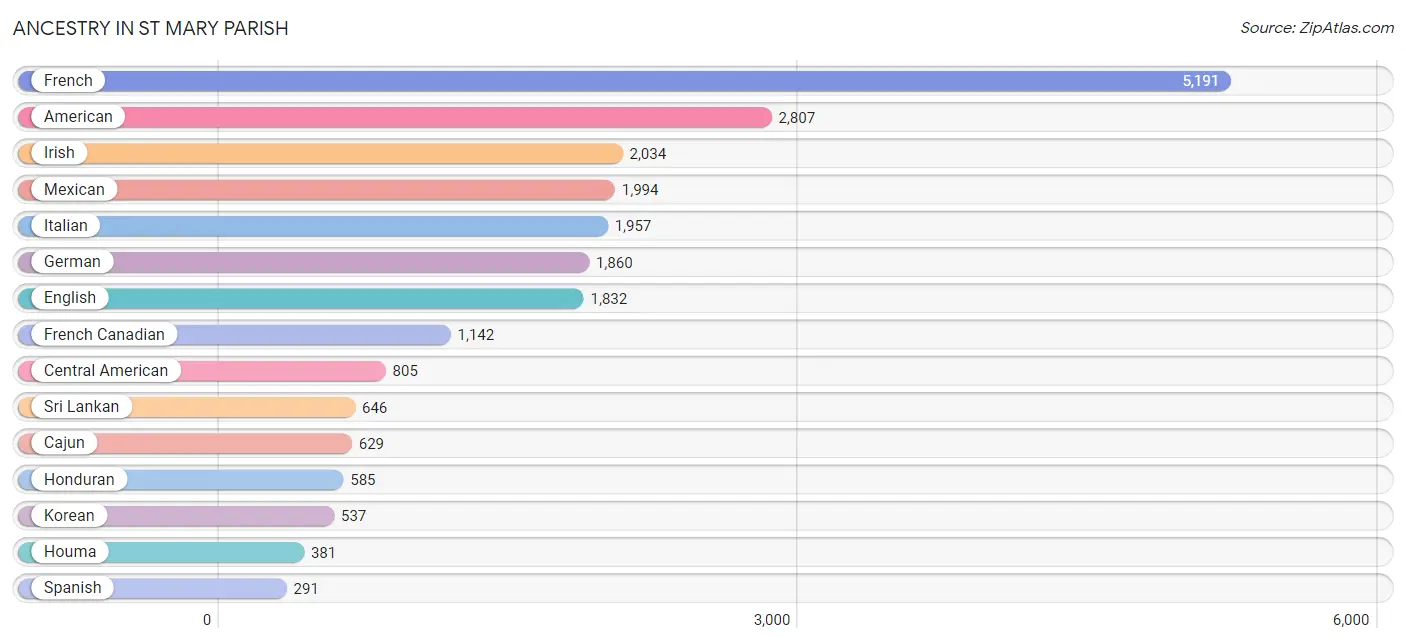
Ancestry in St Mary Parish
The most populous ancestries reported in St Mary Parish are French (5,191 | 10.6%), American (2,807 | 5.7%), Irish (2,034 | 4.1%), Mexican (1,994 | 4.1%), and Italian (1,957 | 4.0%), together accounting for 28.5% of all St Mary Parish residents.
| Ancestry | # Population | % Population |
| African | 275 | 0.6% |
| American | 2,807 | 5.7% |
| Arab | 31 | 0.1% |
| Austrian | 8 | 0.0% |
| Belgian | 30 | 0.1% |
| Bhutanese | 7 | 0.0% |
| British | 115 | 0.2% |
| Cajun | 629 | 1.3% |
| Canadian | 69 | 0.1% |
| Celtic | 5 | 0.0% |
| Central American | 805 | 1.6% |
| Cherokee | 62 | 0.1% |
| Chilean | 70 | 0.1% |
| Choctaw | 4 | 0.0% |
| Colombian | 6 | 0.0% |
| Creek | 14 | 0.0% |
| Croatian | 8 | 0.0% |
| Cuban | 76 | 0.2% |
| Czech | 98 | 0.2% |
| Czechoslovakian | 12 | 0.0% |
| Danish | 29 | 0.1% |
| Dominican | 128 | 0.3% |
| Dutch | 150 | 0.3% |
| English | 1,832 | 3.7% |
| European | 228 | 0.5% |
| French | 5,191 | 10.6% |
| French Canadian | 1,142 | 2.3% |
| German | 1,860 | 3.8% |
| Greek | 102 | 0.2% |
| Guamanian / Chamorro | 4 | 0.0% |
| Guatemalan | 173 | 0.4% |
| Haitian | 2 | 0.0% |
| Honduran | 585 | 1.2% |
| Houma | 381 | 0.8% |
| Hungarian | 16 | 0.0% |
| Indian (Asian) | 21 | 0.0% |
| Inupiat | 12 | 0.0% |
| Irish | 2,034 | 4.1% |
| Italian | 1,957 | 4.0% |
| Korean | 537 | 1.1% |
| Lebanese | 21 | 0.0% |
| Macedonian | 8 | 0.0% |
| Mexican | 1,994 | 4.1% |
| Mexican American Indian | 123 | 0.3% |
| Native Hawaiian | 63 | 0.1% |
| Nicaraguan | 35 | 0.1% |
| Nigerian | 3 | 0.0% |
| Northern European | 9 | 0.0% |
| Norwegian | 10 | 0.0% |
| Palestinian | 10 | 0.0% |
| Panamanian | 12 | 0.0% |
| Polish | 63 | 0.1% |
| Portuguese | 7 | 0.0% |
| Puerto Rican | 78 | 0.2% |
| Russian | 50 | 0.1% |
| Scotch-Irish | 94 | 0.2% |
| Scottish | 127 | 0.3% |
| Serbian | 8 | 0.0% |
| South American | 76 | 0.2% |
| Spaniard | 30 | 0.1% |
| Spanish | 291 | 0.6% |
| Sri Lankan | 646 | 1.3% |
| Subsaharan African | 278 | 0.6% |
| Swedish | 46 | 0.1% |
| Thai | 21 | 0.0% |
| Welsh | 45 | 0.1% |
| West Indian | 1 | 0.0% | View All 67 Rows |
Immigrants in St Mary Parish
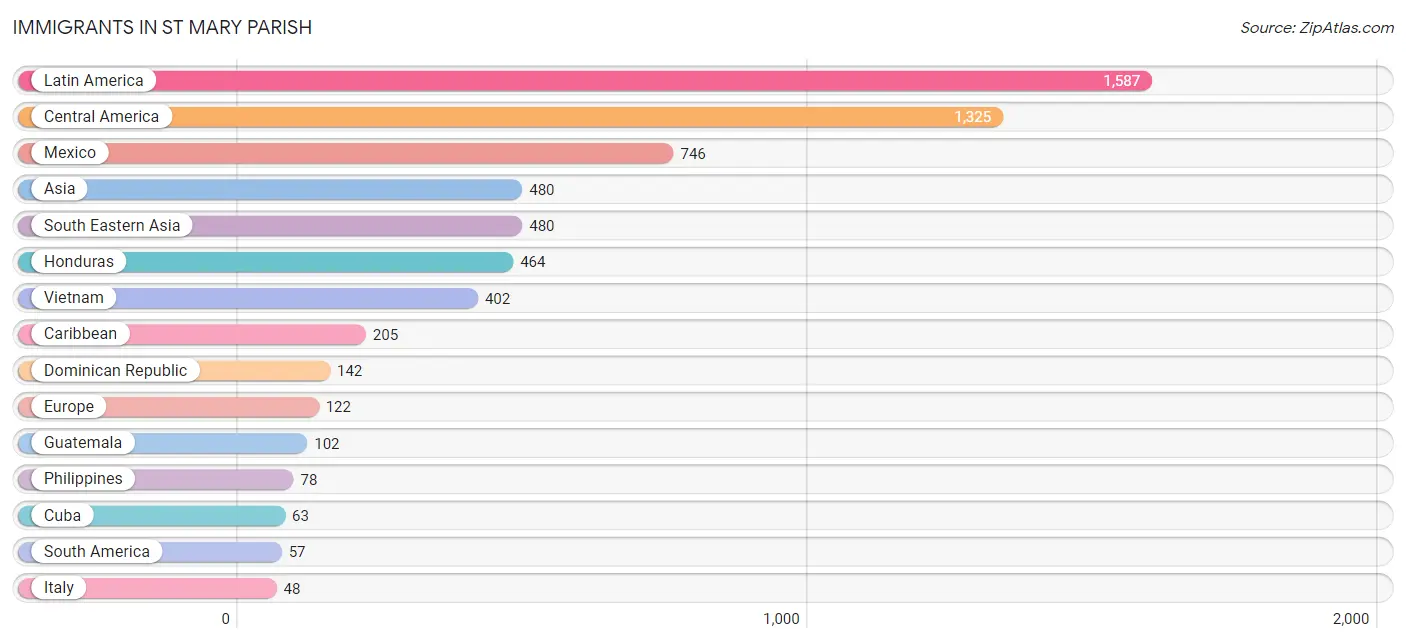
The most numerous immigrant groups reported in St Mary Parish came from Latin America (1,587 | 3.2%), Central America (1,325 | 2.7%), Mexico (746 | 1.5%), Asia (480 | 1.0%), and South Eastern Asia (480 | 1.0%), together accounting for 9.4% of all St Mary Parish residents.
| Immigration Origin | # Population | % Population |
| Africa | 3 | 0.0% |
| Asia | 480 | 1.0% |
| Belize | 1 | 0.0% |
| Canada | 12 | 0.0% |
| Caribbean | 205 | 0.4% |
| Central America | 1,325 | 2.7% |
| Chile | 43 | 0.1% |
| Colombia | 6 | 0.0% |
| Cuba | 63 | 0.1% |
| Czechoslovakia | 28 | 0.1% |
| Dominican Republic | 142 | 0.3% |
| Eastern Europe | 28 | 0.1% |
| England | 3 | 0.0% |
| Europe | 122 | 0.3% |
| Germany | 29 | 0.1% |
| Guatemala | 102 | 0.2% |
| Honduras | 464 | 0.9% |
| Ireland | 6 | 0.0% |
| Italy | 48 | 0.1% |
| Latin America | 1,587 | 3.2% |
| Mexico | 746 | 1.5% |
| Nigeria | 3 | 0.0% |
| Northern Europe | 17 | 0.0% |
| Panama | 12 | 0.0% |
| Peru | 8 | 0.0% |
| Philippines | 78 | 0.2% |
| Scotland | 8 | 0.0% |
| South America | 57 | 0.1% |
| South Eastern Asia | 480 | 1.0% |
| Southern Europe | 48 | 0.1% |
| Vietnam | 402 | 0.8% |
| Western Africa | 3 | 0.0% |
| Western Europe | 29 | 0.1% | View All 33 Rows |
Sex and Age in St Mary Parish
Sex and Age in St Mary Parish
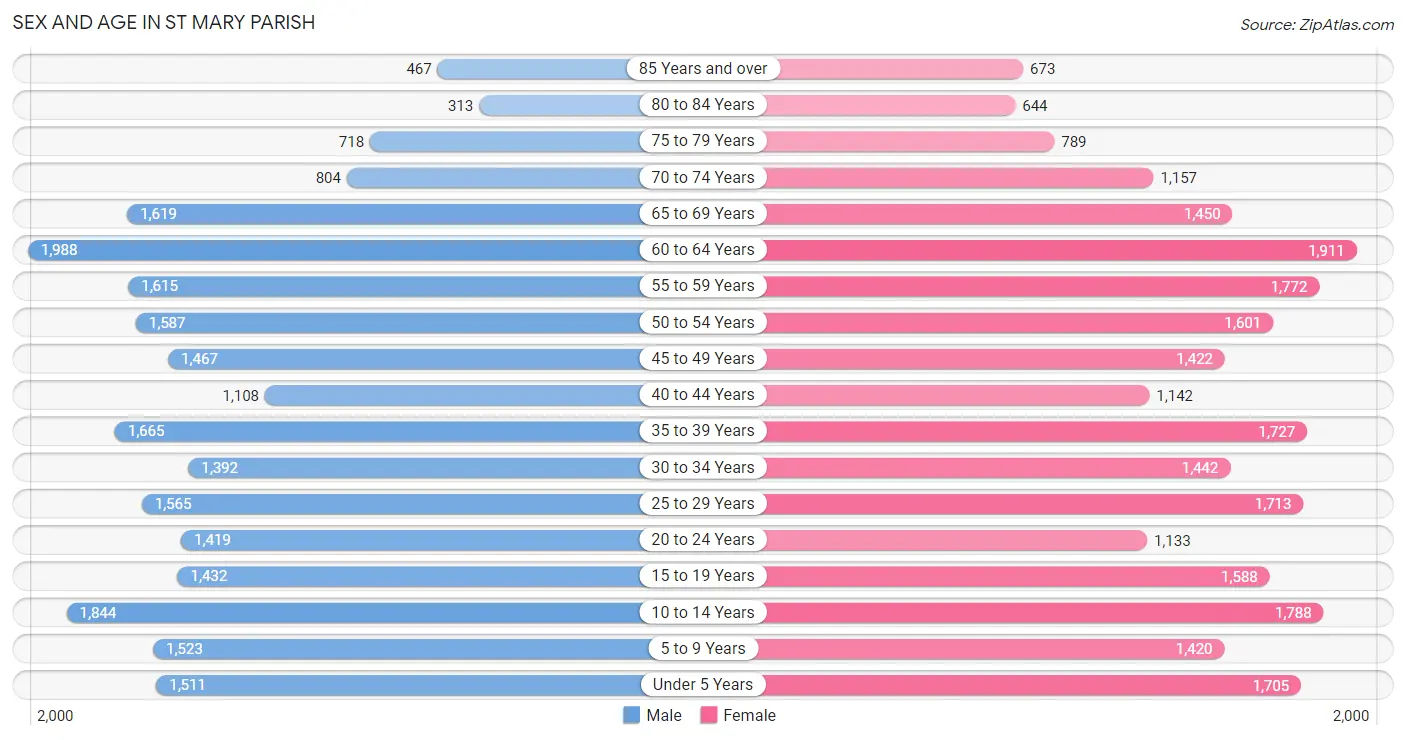
The most populous age groups in St Mary Parish are 60 to 64 Years (1,988 | 8.3%) for men and 60 to 64 Years (1,911 | 7.6%) for women.
| Age Bracket | Male | Female |
| Under 5 Years | 1,511 (6.3%) | 1,705 (6.8%) |
| 5 to 9 Years | 1,523 (6.3%) | 1,420 (5.7%) |
| 10 to 14 Years | 1,844 (7.7%) | 1,788 (7.1%) |
| 15 to 19 Years | 1,432 (6.0%) | 1,588 (6.3%) |
| 20 to 24 Years | 1,419 (5.9%) | 1,133 (4.5%) |
| 25 to 29 Years | 1,565 (6.5%) | 1,713 (6.8%) |
| 30 to 34 Years | 1,392 (5.8%) | 1,442 (5.8%) |
| 35 to 39 Years | 1,665 (6.9%) | 1,727 (6.9%) |
| 40 to 44 Years | 1,108 (4.6%) | 1,142 (4.5%) |
| 45 to 49 Years | 1,467 (6.1%) | 1,422 (5.7%) |
| 50 to 54 Years | 1,587 (6.6%) | 1,601 (6.4%) |
| 55 to 59 Years | 1,615 (6.7%) | 1,772 (7.1%) |
| 60 to 64 Years | 1,988 (8.3%) | 1,911 (7.6%) |
| 65 to 69 Years | 1,619 (6.7%) | 1,450 (5.8%) |
| 70 to 74 Years | 804 (3.3%) | 1,157 (4.6%) |
| 75 to 79 Years | 718 (3.0%) | 789 (3.2%) |
| 80 to 84 Years | 313 (1.3%) | 644 (2.6%) |
| 85 Years and over | 467 (1.9%) | 673 (2.7%) |
| Total | 24,037 (100.0%) | 25,077 (100.0%) |
Families and Households in St Mary Parish
Median Family Size in St Mary Parish
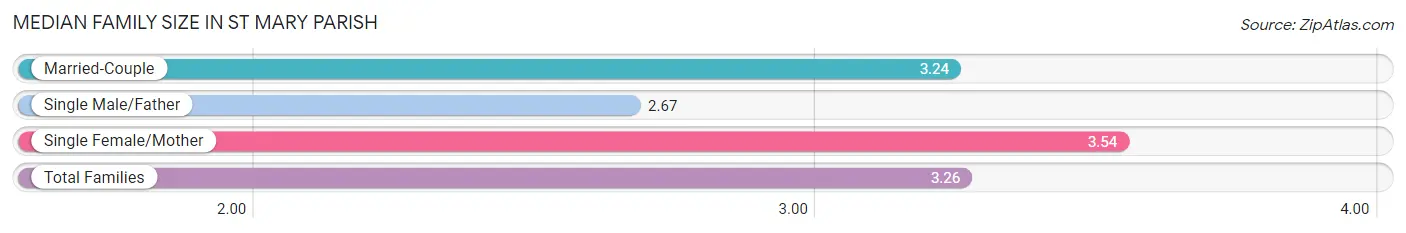
The median family size in St Mary Parish is 3.26 persons per family, with single female/mother families (3,080 | 25.0%) accounting for the largest median family size of 3.54 persons per family. On the other hand, single male/father families (1,131 | 9.2%) represent the smallest median family size with 2.67 persons per family.
| Family Type | # Families | Family Size |
| Married-Couple | 8,125 (65.9%) | 3.24 |
| Single Male/Father | 1,131 (9.2%) | 2.67 |
| Single Female/Mother | 3,080 (25.0%) | 3.54 |
| Total Families | 12,336 (100.0%) | 3.26 |
Median Household Size in St Mary Parish
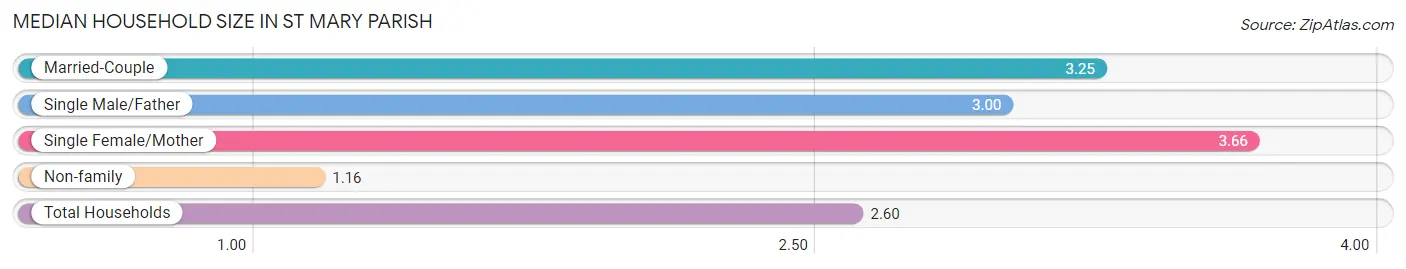
The median household size in St Mary Parish is 2.60 persons per household, with single female/mother households (3,080 | 16.5%) accounting for the largest median household size of 3.66 persons per household. non-family households (6,292 | 33.8%) represent the smallest median household size with 1.16 persons per household.
| Household Type | # Households | Household Size |
| Married-Couple | 8,125 (43.6%) | 3.25 |
| Single Male/Father | 1,131 (6.1%) | 3.00 |
| Single Female/Mother | 3,080 (16.5%) | 3.66 |
| Non-family | 6,292 (33.8%) | 1.16 |
| Total Households | 18,628 (100.0%) | 2.60 |
Household Size by Marriage Status in St Mary Parish
Out of a total of 18,628 households in St Mary Parish, 12,336 (66.2%) are family households, while 6,292 (33.8%) are nonfamily households. The most numerous type of family households are 2-person households, comprising 5,830, and the most common type of nonfamily households are 1-person households, comprising 5,321.
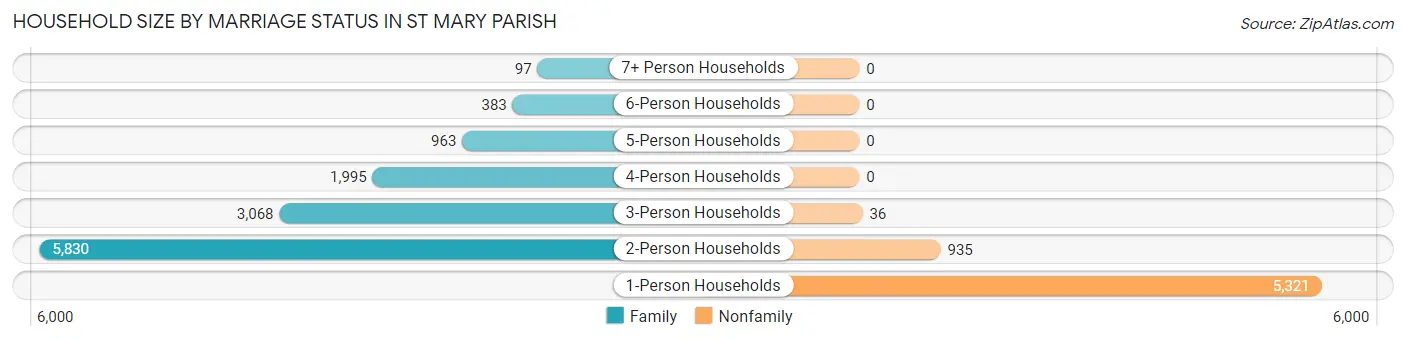
| Household Size | Family Households | Nonfamily Households |
| 1-Person Households | - | 5,321 (28.6%) |
| 2-Person Households | 5,830 (31.3%) | 935 (5.0%) |
| 3-Person Households | 3,068 (16.5%) | 36 (0.2%) |
| 4-Person Households | 1,995 (10.7%) | 0 (0.0%) |
| 5-Person Households | 963 (5.2%) | 0 (0.0%) |
| 6-Person Households | 383 (2.1%) | 0 (0.0%) |
| 7+ Person Households | 97 (0.5%) | 0 (0.0%) |
| Total | 12,336 (66.2%) | 6,292 (33.8%) |
Female Fertility in St Mary Parish
Fertility by Age in St Mary Parish
Average fertility rate in St Mary Parish is 36.0 births per 1,000 women. Women in the age bracket of 20 to 34 years have the highest fertility rate with 71.0 births per 1,000 women. Women in the age bracket of 20 to 34 years acount for 81.5% of all women with births.
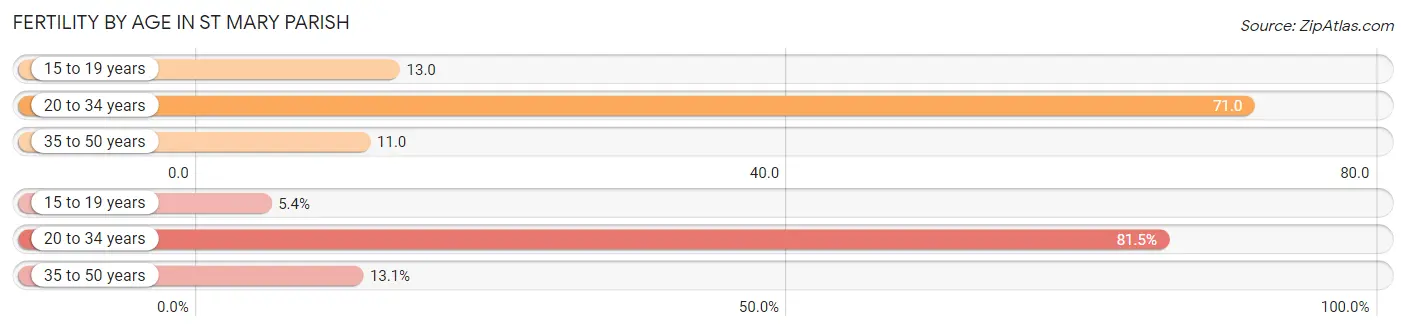
| Age Bracket | Women with Births | Births / 1,000 Women |
| 15 to 19 years | 20 (5.4%) | 13.0 |
| 20 to 34 years | 304 (81.5%) | 71.0 |
| 35 to 50 years | 49 (13.1%) | 11.0 |
| Total | 373 (100.0%) | 36.0 |
Fertility by Age by Marriage Status in St Mary Parish
37.5% of women with births (373) in St Mary Parish are married. The highest percentage of unmarried women with births falls into 15 to 19 years age bracket with 100.0% of them unmarried at the time of birth, while the lowest percentage of unmarried women with births belong to 35 to 50 years age bracket with 20.4% of them unmarried.
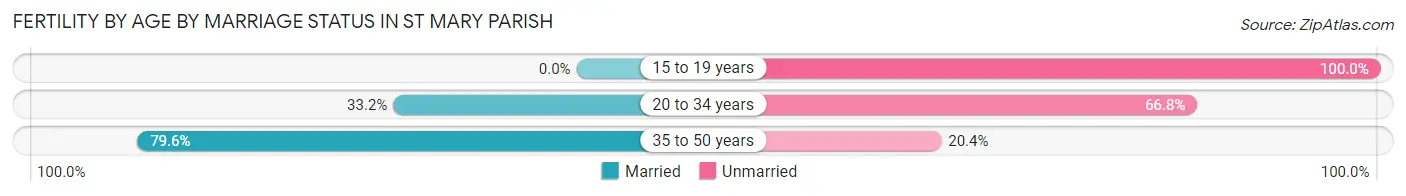
| Age Bracket | Married | Unmarried |
| 15 to 19 years | 0 (0.0%) | 20 (100.0%) |
| 20 to 34 years | 101 (33.2%) | 203 (66.8%) |
| 35 to 50 years | 39 (79.6%) | 10 (20.4%) |
| Total | 140 (37.5%) | 233 (62.5%) |
Fertility by Education in St Mary Parish
Average fertility rate in St Mary Parish is 36.0 births per 1,000 women. Women with the education attainment of graduate degree have the highest fertility rate of 69.0 births per 1,000 women, while women with the education attainment of less than high school have the lowest fertility at 11.0 births per 1,000 women. Women with the education attainment of high school diploma represent 42.1% of all women with births.
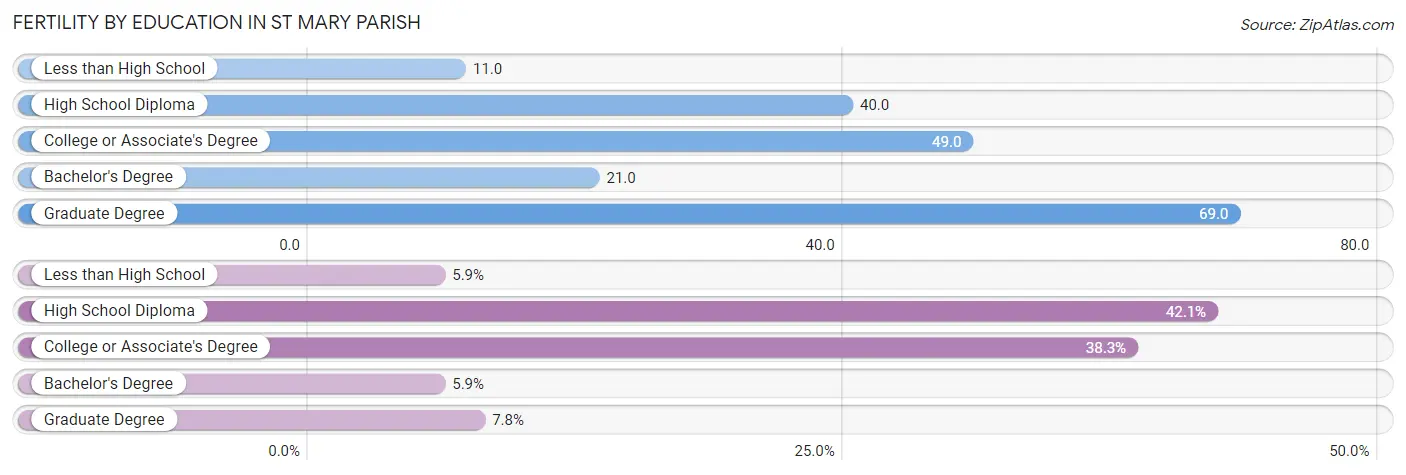
| Educational Attainment | Women with Births | Births / 1,000 Women |
| Less than High School | 22 (5.9%) | 11.0 |
| High School Diploma | 157 (42.1%) | 40.0 |
| College or Associate's Degree | 143 (38.3%) | 49.0 |
| Bachelor's Degree | 22 (5.9%) | 21.0 |
| Graduate Degree | 29 (7.8%) | 69.0 |
| Total | 373 (100.0%) | 36.0 |
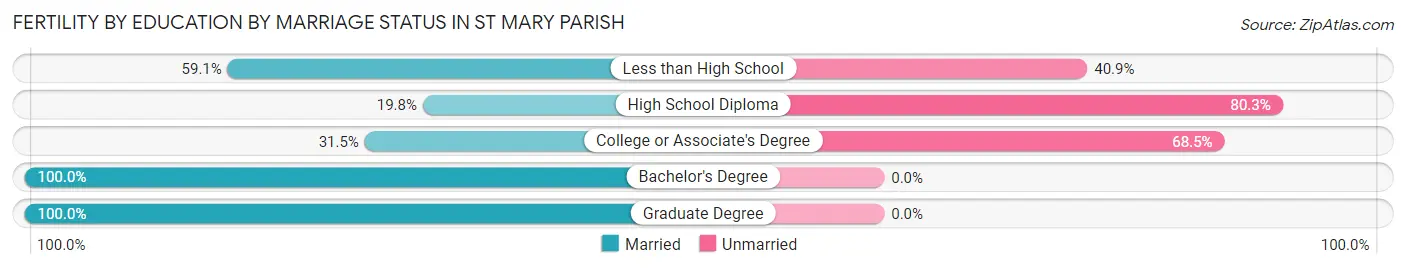
Fertility by Education by Marriage Status in St Mary Parish
62.5% of women with births in St Mary Parish are unmarried. Women with the educational attainment of bachelor's degree are most likely to be married with 100.0% of them married at childbirth, while women with the educational attainment of high school diploma are least likely to be married with 80.2% of them unmarried at childbirth.
| Educational Attainment | Married | Unmarried |
| Less than High School | 13 (59.1%) | 9 (40.9%) |
| High School Diploma | 31 (19.8%) | 126 (80.2%) |
| College or Associate's Degree | 45 (31.5%) | 98 (68.5%) |
| Bachelor's Degree | 22 (100.0%) | 0 (0.0%) |
| Graduate Degree | 29 (100.0%) | 0 (0.0%) |
| Total | 140 (37.5%) | 233 (62.5%) |
Employment Characteristics in St Mary Parish
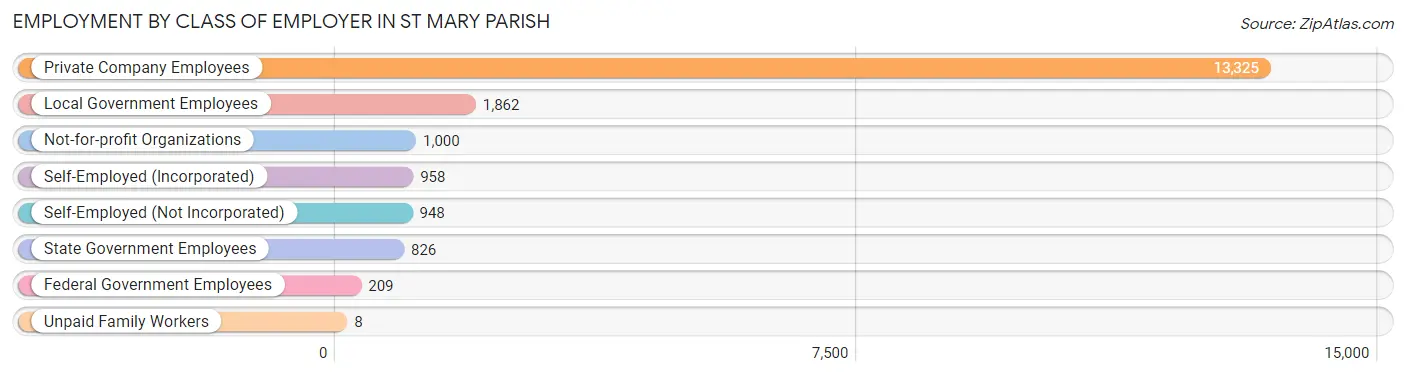
Employment by Class of Employer in St Mary Parish
Among the 19,136 employed individuals in St Mary Parish, private company employees (13,325 | 69.6%), local government employees (1,862 | 9.7%), and not-for-profit organizations (1,000 | 5.2%) make up the most common classes of employment.
| Employer Class | # Employees | % Employees |
| Private Company Employees | 13,325 | 69.6% |
| Self-Employed (Incorporated) | 958 | 5.0% |
| Self-Employed (Not Incorporated) | 948 | 5.0% |
| Not-for-profit Organizations | 1,000 | 5.2% |
| Local Government Employees | 1,862 | 9.7% |
| State Government Employees | 826 | 4.3% |
| Federal Government Employees | 209 | 1.1% |
| Unpaid Family Workers | 8 | 0.0% |
| Total | 19,136 | 100.0% |
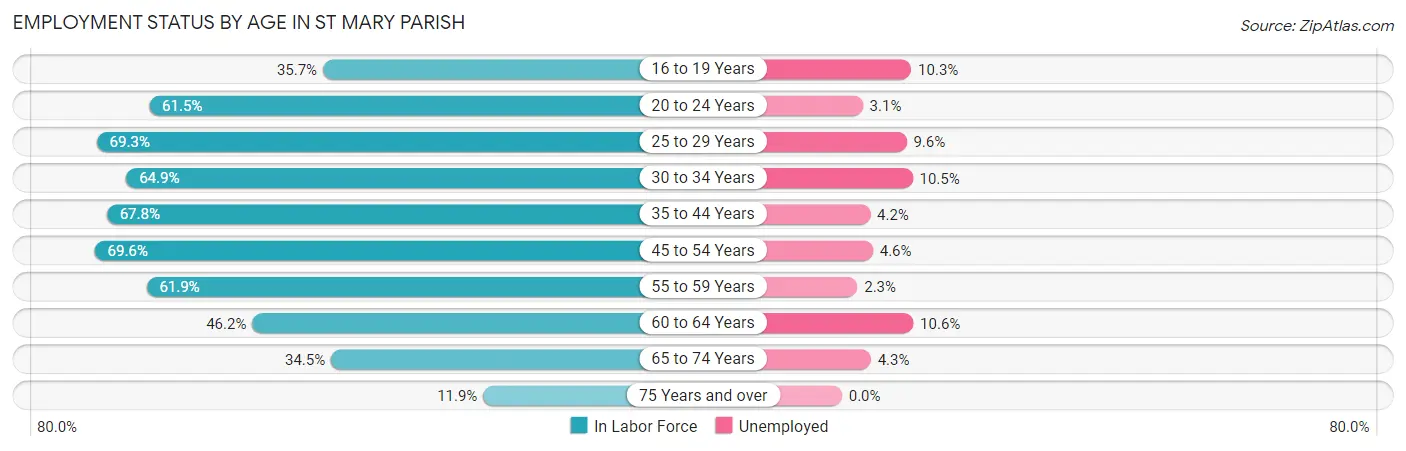
Employment Status by Age in St Mary Parish
According to the labor force statistics for St Mary Parish, out of the total population over 16 years of age (38,619), 53.4% or 20,623 individuals are in the labor force, with 5.9% or 1,217 of them unemployed. The age group with the highest labor force participation rate is 45 to 54 years, with 69.6% or 4,230 individuals in the labor force. Within the labor force, the 60 to 64 years age range has the highest percentage of unemployed individuals, with 10.6% or 191 of them being unemployed.
| Age Bracket | In Labor Force | Unemployed |
| 16 to 19 Years | 827 (35.7%) | 85 (10.3%) |
| 20 to 24 Years | 1,569 (61.5%) | 49 (3.1%) |
| 25 to 29 Years | 2,272 (69.3%) | 218 (9.6%) |
| 30 to 34 Years | 1,839 (64.9%) | 193 (10.5%) |
| 35 to 44 Years | 3,825 (67.8%) | 161 (4.2%) |
| 45 to 54 Years | 4,230 (69.6%) | 195 (4.6%) |
| 55 to 59 Years | 2,097 (61.9%) | 48 (2.3%) |
| 60 to 64 Years | 1,801 (46.2%) | 191 (10.6%) |
| 65 to 74 Years | 1,735 (34.5%) | 75 (4.3%) |
| 75 Years and over | 429 (11.9%) | 0 (0.0%) |
| Total | 20,623 (53.4%) | 1,217 (5.9%) |
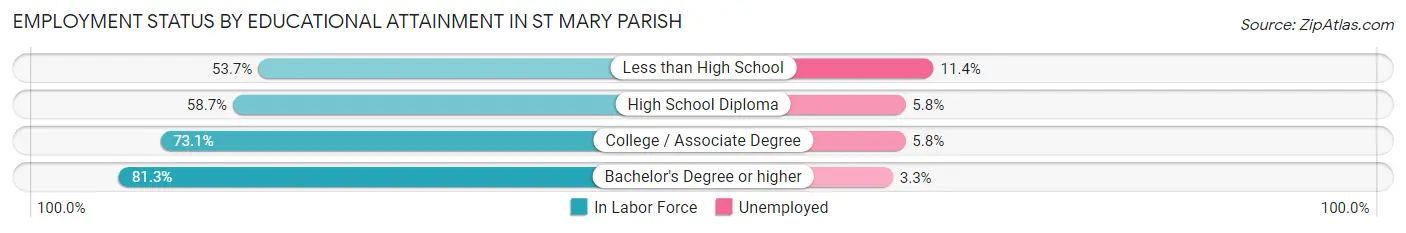
Employment Status by Educational Attainment in St Mary Parish
According to labor force statistics for St Mary Parish, 64.0% of individuals (16,075) out of the total population between 25 and 64 years of age (25,117) are in the labor force, with 6.3% or 1,013 of them being unemployed. The group with the highest labor force participation rate are those with the educational attainment of bachelor's degree or higher, with 81.3% or 2,537 individuals in the labor force. Within the labor force, individuals with less than high school education have the highest percentage of unemployment, with 11.4% or 272 of them being unemployed.
| Educational Attainment | In Labor Force | Unemployed |
| Less than High School | 2,387 (53.7%) | 507 (11.4%) |
| High School Diploma | 6,860 (58.7%) | 678 (5.8%) |
| College / Associate Degree | 4,287 (73.1%) | 340 (5.8%) |
| Bachelor's Degree or higher | 2,537 (81.3%) | 103 (3.3%) |
| Total | 16,075 (64.0%) | 1,582 (6.3%) |
Employment Occupations by Sex in St Mary Parish
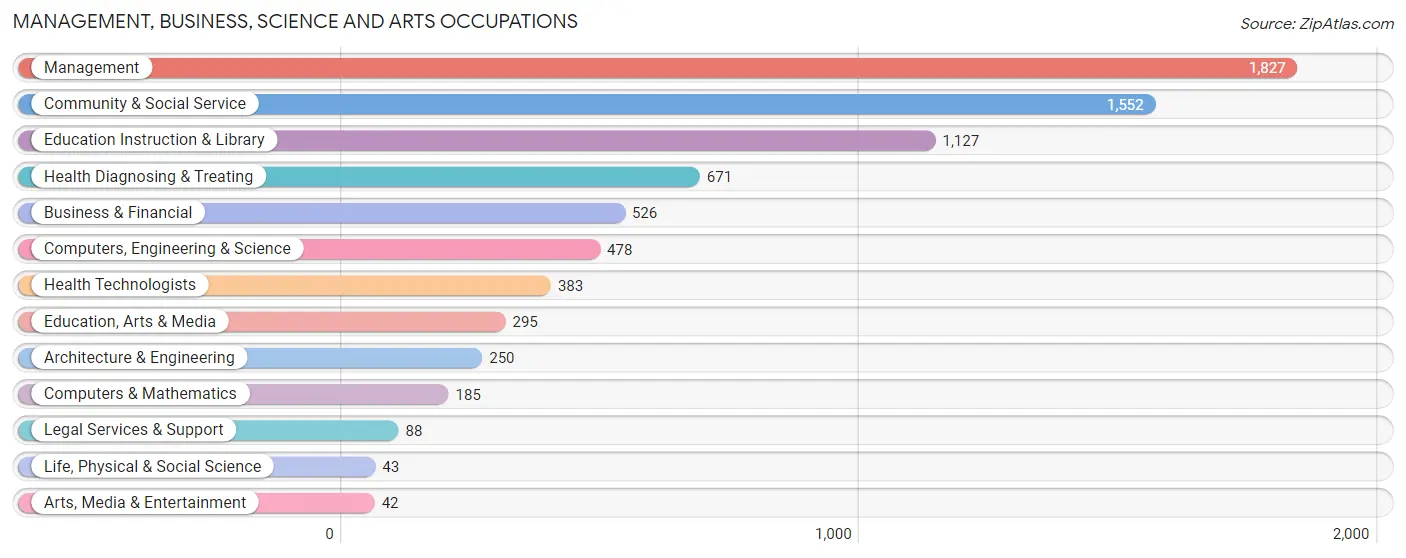
Management, Business, Science and Arts Occupations
The most common Management, Business, Science and Arts occupations in St Mary Parish are Management (1,827 | 9.4%), Community & Social Service (1,552 | 8.0%), Education Instruction & Library (1,127 | 5.8%), Health Diagnosing & Treating (671 | 3.5%), and Business & Financial (526 | 2.7%).
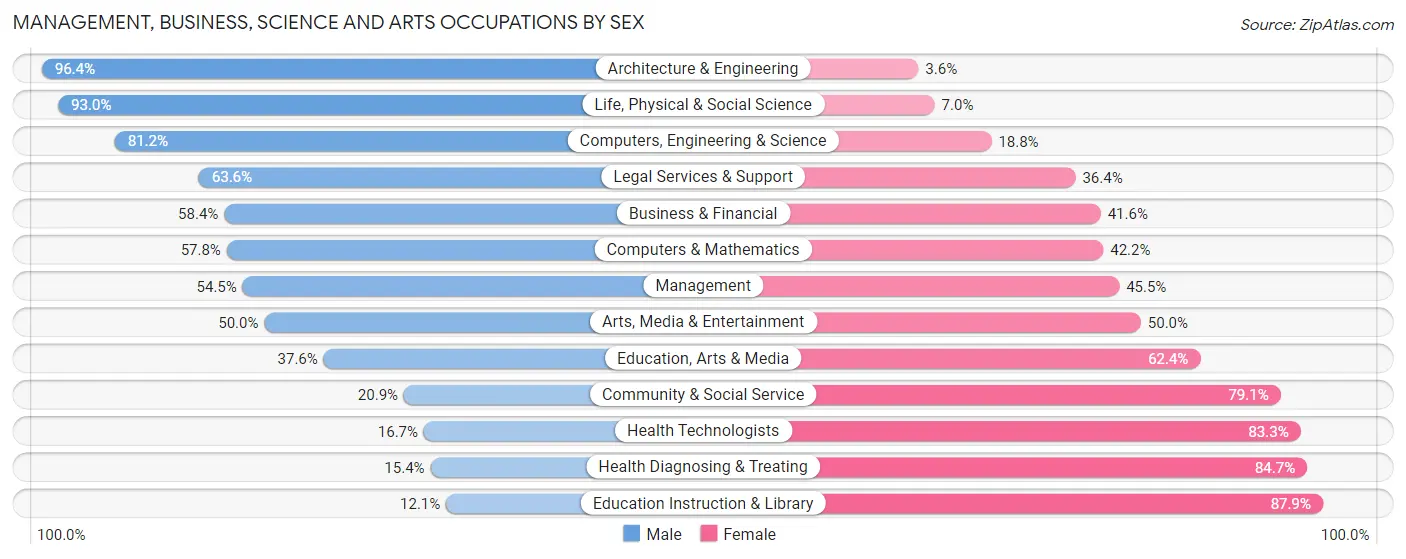
Management, Business, Science and Arts Occupations by Sex
Within the Management, Business, Science and Arts occupations in St Mary Parish, the most male-oriented occupations are Architecture & Engineering (96.4%), Life, Physical & Social Science (93.0%), and Computers, Engineering & Science (81.2%), while the most female-oriented occupations are Education Instruction & Library (87.9%), Health Diagnosing & Treating (84.7%), and Health Technologists (83.3%).
| Occupation | Male | Female |
| Management | 996 (54.5%) | 831 (45.5%) |
| Business & Financial | 307 (58.4%) | 219 (41.6%) |
| Computers, Engineering & Science | 388 (81.2%) | 90 (18.8%) |
| Computers & Mathematics | 107 (57.8%) | 78 (42.2%) |
| Architecture & Engineering | 241 (96.4%) | 9 (3.6%) |
| Life, Physical & Social Science | 40 (93.0%) | 3 (7.0%) |
| Community & Social Service | 324 (20.9%) | 1,228 (79.1%) |
| Education, Arts & Media | 111 (37.6%) | 184 (62.4%) |
| Legal Services & Support | 56 (63.6%) | 32 (36.4%) |
| Education Instruction & Library | 136 (12.1%) | 991 (87.9%) |
| Arts, Media & Entertainment | 21 (50.0%) | 21 (50.0%) |
| Health Diagnosing & Treating | 103 (15.3%) | 568 (84.7%) |
| Health Technologists | 64 (16.7%) | 319 (83.3%) |
| Total (Category) | 2,118 (41.9%) | 2,936 (58.1%) |
| Total (Overall) | 10,056 (51.9%) | 9,303 (48.1%) |
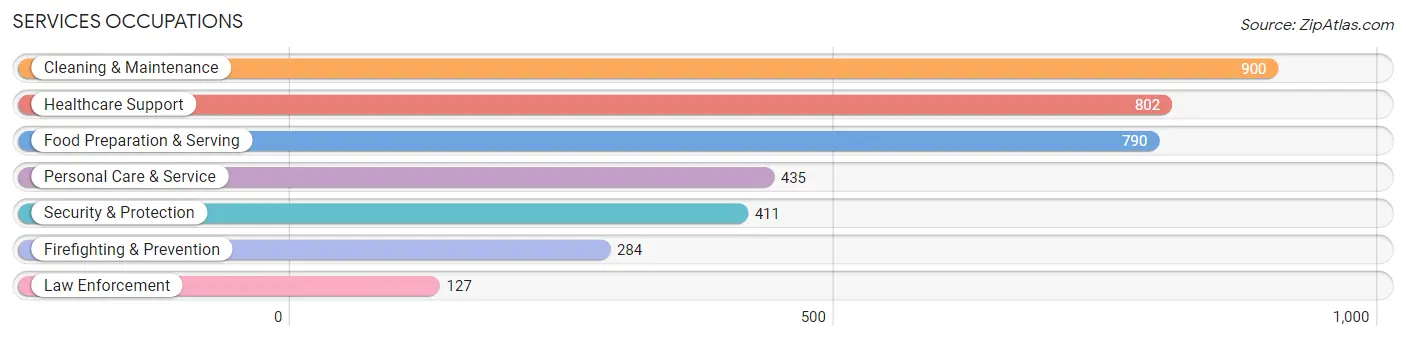
Services Occupations
The most common Services occupations in St Mary Parish are Cleaning & Maintenance (900 | 4.6%), Healthcare Support (802 | 4.1%), Food Preparation & Serving (790 | 4.1%), Personal Care & Service (435 | 2.2%), and Security & Protection (411 | 2.1%).
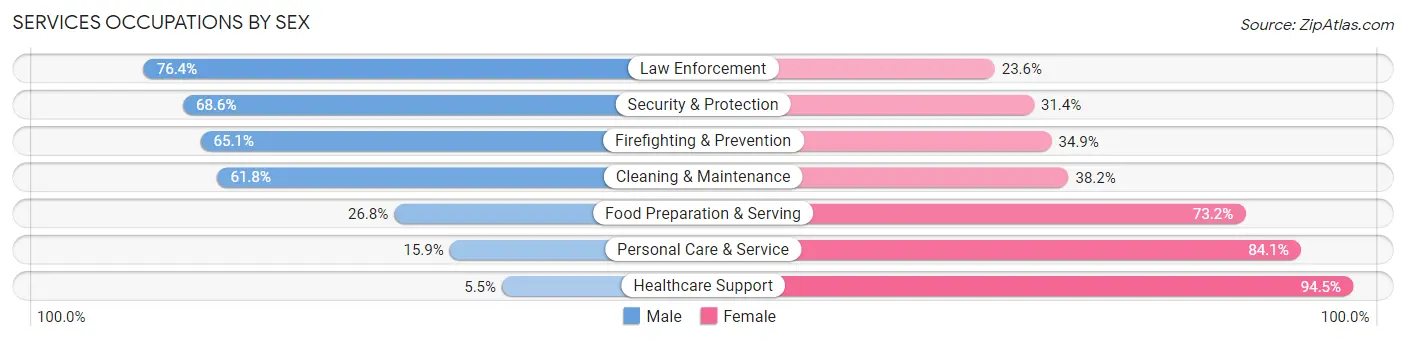
Services Occupations by Sex
Within the Services occupations in St Mary Parish, the most male-oriented occupations are Law Enforcement (76.4%), Security & Protection (68.6%), and Firefighting & Prevention (65.1%), while the most female-oriented occupations are Healthcare Support (94.5%), Personal Care & Service (84.1%), and Food Preparation & Serving (73.2%).
| Occupation | Male | Female |
| Healthcare Support | 44 (5.5%) | 758 (94.5%) |
| Security & Protection | 282 (68.6%) | 129 (31.4%) |
| Firefighting & Prevention | 185 (65.1%) | 99 (34.9%) |
| Law Enforcement | 97 (76.4%) | 30 (23.6%) |
| Food Preparation & Serving | 212 (26.8%) | 578 (73.2%) |
| Cleaning & Maintenance | 556 (61.8%) | 344 (38.2%) |
| Personal Care & Service | 69 (15.9%) | 366 (84.1%) |
| Total (Category) | 1,163 (34.8%) | 2,175 (65.2%) |
| Total (Overall) | 10,056 (51.9%) | 9,303 (48.1%) |
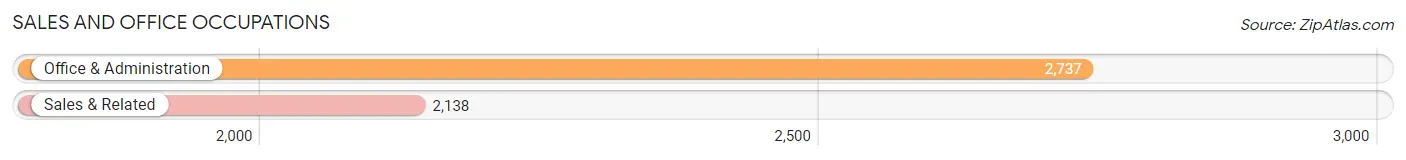
Sales and Office Occupations
The most common Sales and Office occupations in St Mary Parish are Office & Administration (2,737 | 14.1%), and Sales & Related (2,138 | 11.0%).
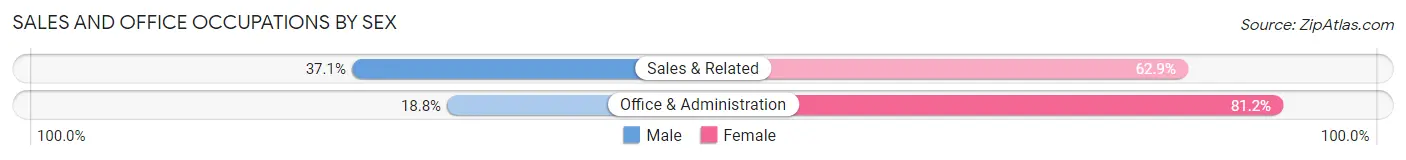
Sales and Office Occupations by Sex
| Occupation | Male | Female |
| Sales & Related | 793 (37.1%) | 1,345 (62.9%) |
| Office & Administration | 514 (18.8%) | 2,223 (81.2%) |
| Total (Category) | 1,307 (26.8%) | 3,568 (73.2%) |
| Total (Overall) | 10,056 (51.9%) | 9,303 (48.1%) |
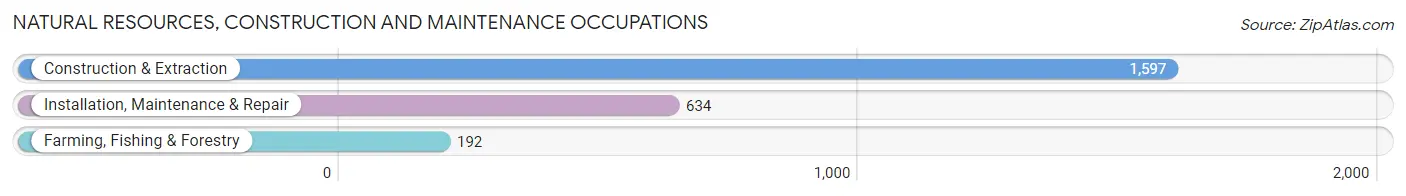
Natural Resources, Construction and Maintenance Occupations
The most common Natural Resources, Construction and Maintenance occupations in St Mary Parish are Construction & Extraction (1,597 | 8.3%), Installation, Maintenance & Repair (634 | 3.3%), and Farming, Fishing & Forestry (192 | 1.0%).
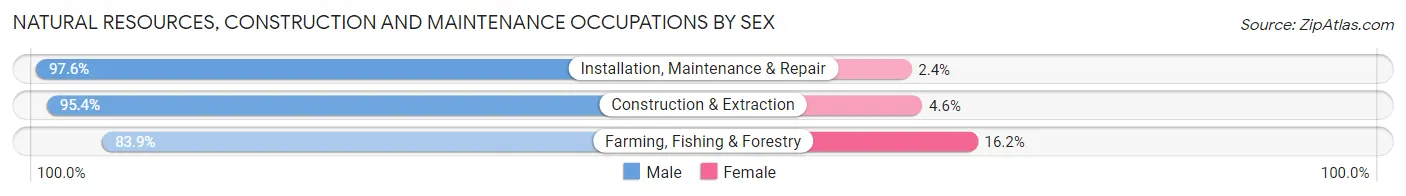
Natural Resources, Construction and Maintenance Occupations by Sex
| Occupation | Male | Female |
| Farming, Fishing & Forestry | 161 (83.9%) | 31 (16.2%) |
| Construction & Extraction | 1,523 (95.4%) | 74 (4.6%) |
| Installation, Maintenance & Repair | 619 (97.6%) | 15 (2.4%) |
| Total (Category) | 2,303 (95.1%) | 120 (5.0%) |
| Total (Overall) | 10,056 (51.9%) | 9,303 (48.1%) |
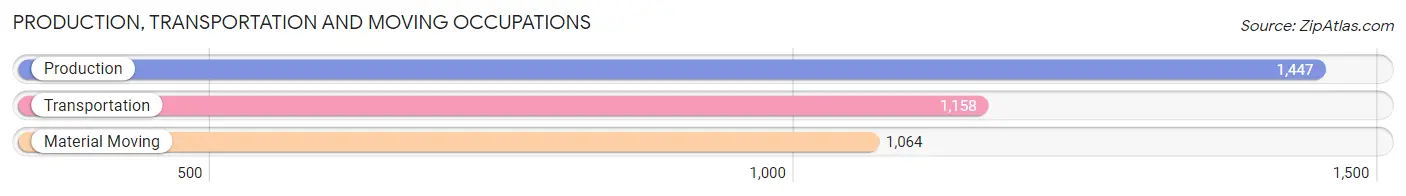
Production, Transportation and Moving Occupations
The most common Production, Transportation and Moving occupations in St Mary Parish are Production (1,447 | 7.5%), Transportation (1,158 | 6.0%), and Material Moving (1,064 | 5.5%).
Production, Transportation and Moving Occupations by Sex
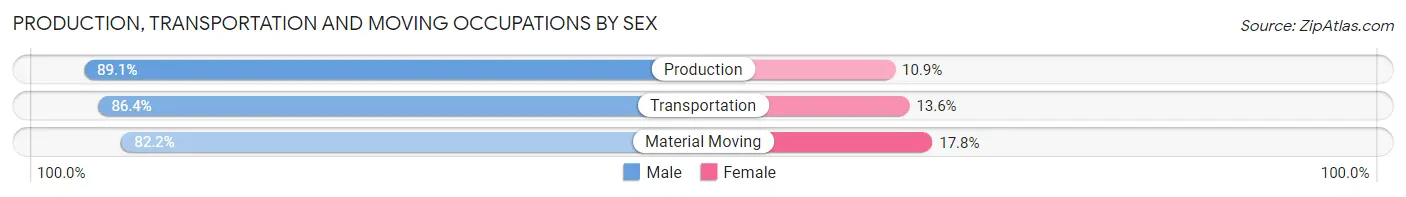
| Occupation | Male | Female |
| Production | 1,289 (89.1%) | 158 (10.9%) |
| Transportation | 1,001 (86.4%) | 157 (13.6%) |
| Material Moving | 875 (82.2%) | 189 (17.8%) |
| Total (Category) | 3,165 (86.3%) | 504 (13.7%) |
| Total (Overall) | 10,056 (51.9%) | 9,303 (48.1%) |
Employment Industries by Sex in St Mary Parish
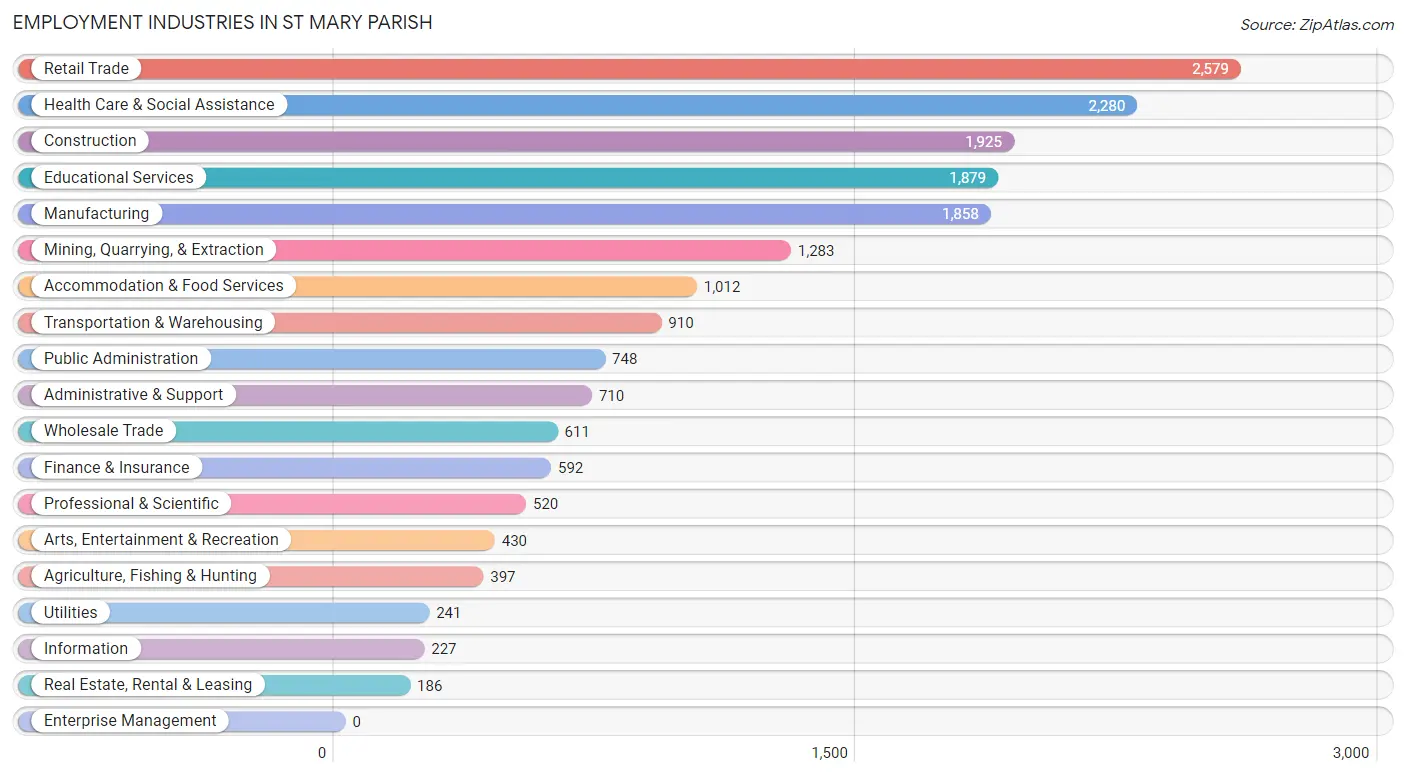
Employment Industries in St Mary Parish
The major employment industries in St Mary Parish include Retail Trade (2,579 | 13.3%), Health Care & Social Assistance (2,280 | 11.8%), Construction (1,925 | 9.9%), Educational Services (1,879 | 9.7%), and Manufacturing (1,858 | 9.6%).
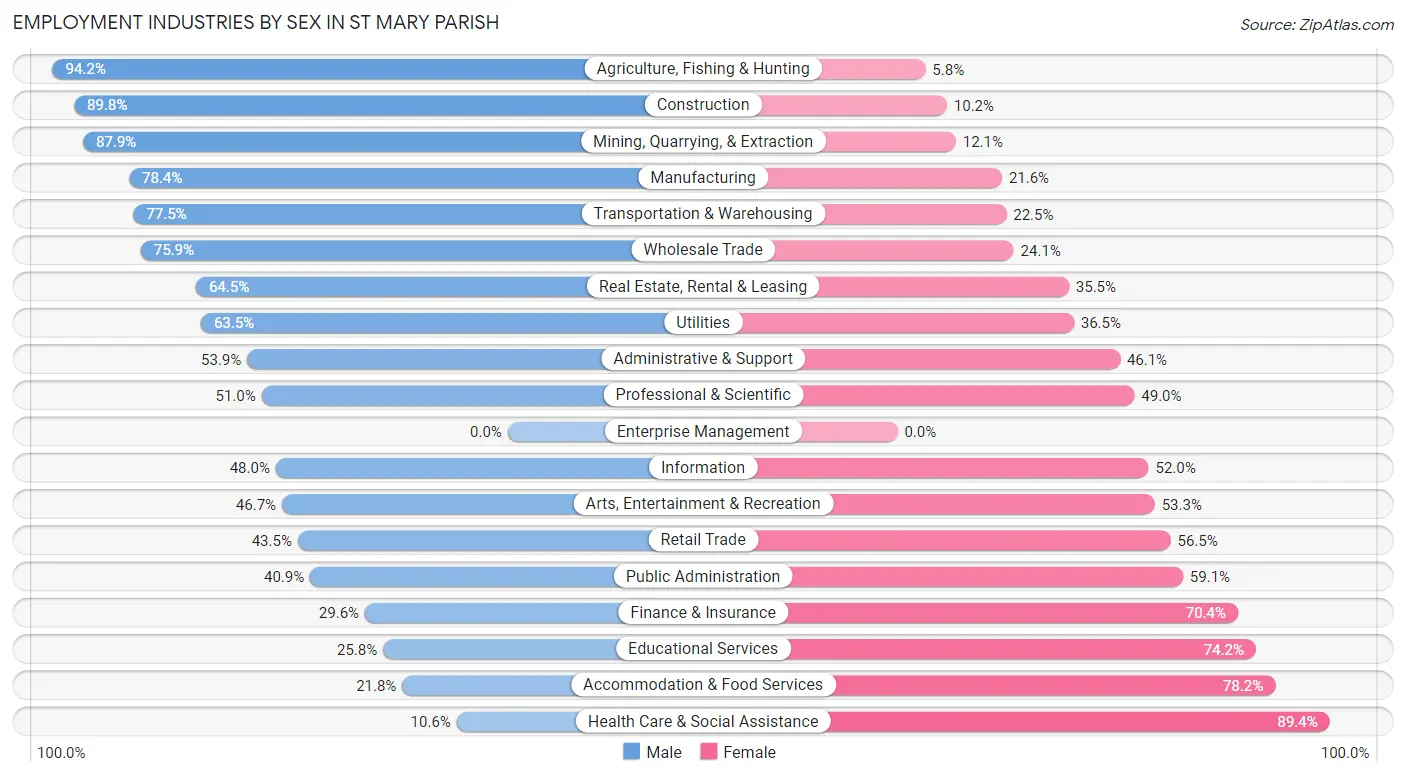
Employment Industries by Sex in St Mary Parish
The St Mary Parish industries that see more men than women are Agriculture, Fishing & Hunting (94.2%), Construction (89.8%), and Mining, Quarrying, & Extraction (87.9%), whereas the industries that tend to have a higher number of women are Health Care & Social Assistance (89.4%), Accommodation & Food Services (78.2%), and Educational Services (74.2%).
| Industry | Male | Female |
| Agriculture, Fishing & Hunting | 374 (94.2%) | 23 (5.8%) |
| Mining, Quarrying, & Extraction | 1,128 (87.9%) | 155 (12.1%) |
| Construction | 1,728 (89.8%) | 197 (10.2%) |
| Manufacturing | 1,456 (78.4%) | 402 (21.6%) |
| Wholesale Trade | 464 (75.9%) | 147 (24.1%) |
| Retail Trade | 1,121 (43.5%) | 1,458 (56.5%) |
| Transportation & Warehousing | 705 (77.5%) | 205 (22.5%) |
| Utilities | 153 (63.5%) | 88 (36.5%) |
| Information | 109 (48.0%) | 118 (52.0%) |
| Finance & Insurance | 175 (29.6%) | 417 (70.4%) |
| Real Estate, Rental & Leasing | 120 (64.5%) | 66 (35.5%) |
| Professional & Scientific | 265 (51.0%) | 255 (49.0%) |
| Enterprise Management | 0 (0.0%) | 0 (0.0%) |
| Administrative & Support | 383 (53.9%) | 327 (46.1%) |
| Educational Services | 485 (25.8%) | 1,394 (74.2%) |
| Health Care & Social Assistance | 241 (10.6%) | 2,039 (89.4%) |
| Arts, Entertainment & Recreation | 201 (46.7%) | 229 (53.3%) |
| Accommodation & Food Services | 221 (21.8%) | 791 (78.2%) |
| Public Administration | 306 (40.9%) | 442 (59.1%) |
| Total | 10,056 (51.9%) | 9,303 (48.1%) |
Education in St Mary Parish
School Enrollment in St Mary Parish
The most common levels of schooling among the 10,749 students in St Mary Parish are middle school (2,828 | 26.3%), high school (2,606 | 24.2%), and elementary school (2,566 | 23.9%).
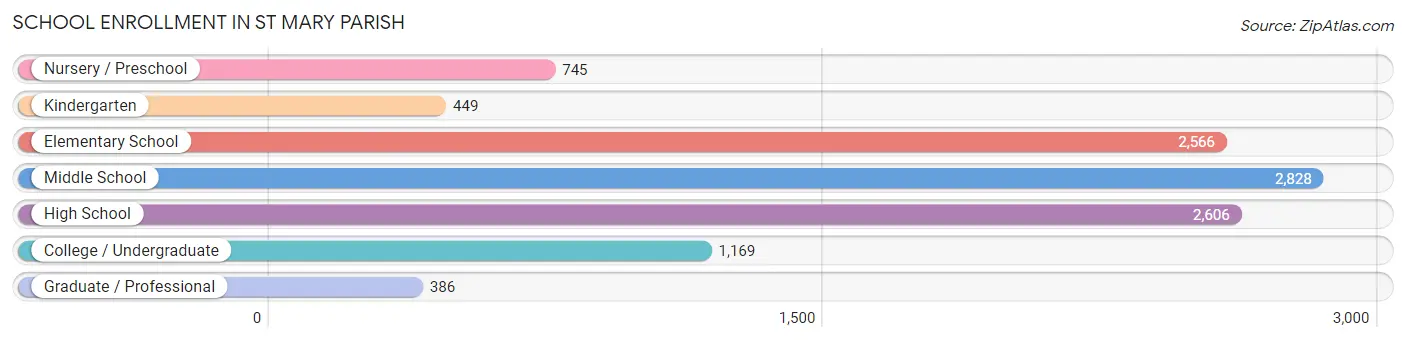
| School Level | # Students | % Students |
| Nursery / Preschool | 745 | 6.9% |
| Kindergarten | 449 | 4.2% |
| Elementary School | 2,566 | 23.9% |
| Middle School | 2,828 | 26.3% |
| High School | 2,606 | 24.2% |
| College / Undergraduate | 1,169 | 10.9% |
| Graduate / Professional | 386 | 3.6% |
| Total | 10,749 | 100.0% |
School Enrollment by Age by Funding Source in St Mary Parish
Out of a total of 10,749 students who are enrolled in schools in St Mary Parish, 1,688 (15.7%) attend a private institution, while the remaining 9,061 (84.3%) are enrolled in public schools. The age group of 3 to 4 year olds has the highest likelihood of being enrolled in private schools, with 315 (47.2% in the age bracket) enrolled. Conversely, the age group of 20 to 24 year olds has the lowest likelihood of being enrolled in a private school, with 350 (89.7% in the age bracket) attending a public institution.
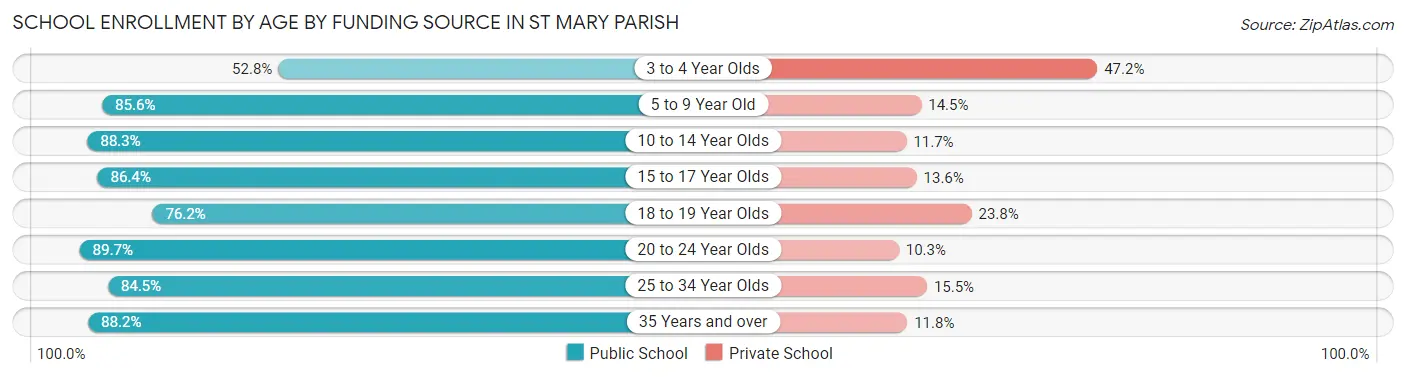
| Age Bracket | Public School | Private School |
| 3 to 4 Year Olds | 352 (52.8%) | 315 (47.2%) |
| 5 to 9 Year Old | 2,327 (85.6%) | 393 (14.4%) |
| 10 to 14 Year Olds | 3,149 (88.3%) | 417 (11.7%) |
| 15 to 17 Year Olds | 1,634 (86.4%) | 257 (13.6%) |
| 18 to 19 Year Olds | 387 (76.2%) | 121 (23.8%) |
| 20 to 24 Year Olds | 350 (89.7%) | 40 (10.3%) |
| 25 to 34 Year Olds | 501 (84.5%) | 92 (15.5%) |
| 35 Years and over | 365 (88.2%) | 49 (11.8%) |
| Total | 9,061 (84.3%) | 1,688 (15.7%) |
Educational Attainment by Field of Study in St Mary Parish
Education (1,180 | 27.5%), business (868 | 20.2%), science & technology (446 | 10.4%), liberal arts & history (367 | 8.6%), and social sciences (282 | 6.6%) are the most common fields of study among 4,291 individuals in St Mary Parish who have obtained a bachelor's degree or higher.
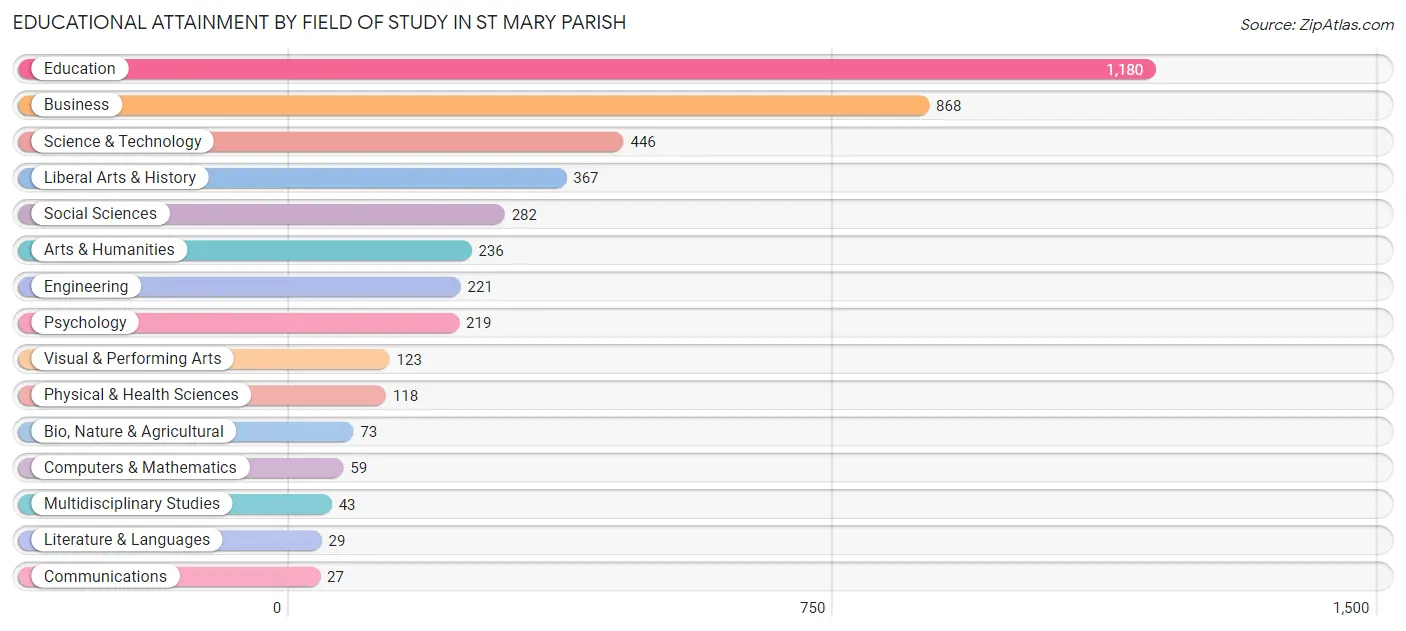
| Field of Study | # Graduates | % Graduates |
| Computers & Mathematics | 59 | 1.4% |
| Bio, Nature & Agricultural | 73 | 1.7% |
| Physical & Health Sciences | 118 | 2.8% |
| Psychology | 219 | 5.1% |
| Social Sciences | 282 | 6.6% |
| Engineering | 221 | 5.1% |
| Multidisciplinary Studies | 43 | 1.0% |
| Science & Technology | 446 | 10.4% |
| Business | 868 | 20.2% |
| Education | 1,180 | 27.5% |
| Literature & Languages | 29 | 0.7% |
| Liberal Arts & History | 367 | 8.6% |
| Visual & Performing Arts | 123 | 2.9% |
| Communications | 27 | 0.6% |
| Arts & Humanities | 236 | 5.5% |
| Total | 4,291 | 100.0% |
Transportation & Commute in St Mary Parish
Vehicle Availability by Sex in St Mary Parish
The most prevalent vehicle ownership categories in St Mary Parish are males with 2 vehicles (4,203, accounting for 42.1%) and females with 2 vehicles (3,667, making up 46.0%).
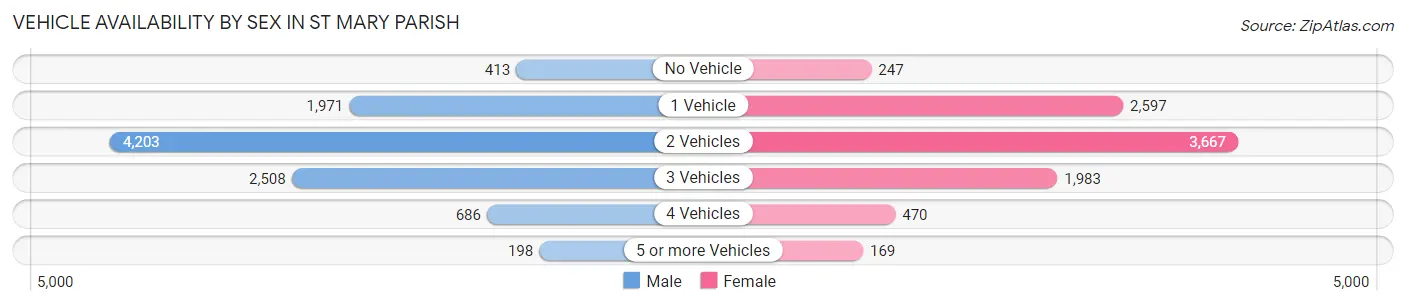
| Vehicles Available | Male | Female |
| No Vehicle | 413 (4.1%) | 247 (2.7%) |
| 1 Vehicle | 1,971 (19.8%) | 2,597 (28.4%) |
| 2 Vehicles | 4,203 (42.1%) | 3,667 (40.2%) |
| 3 Vehicles | 2,508 (25.1%) | 1,983 (21.7%) |
| 4 Vehicles | 686 (6.9%) | 470 (5.1%) |
| 5 or more Vehicles | 198 (2.0%) | 169 (1.8%) |
| Total | 9,979 (100.0%) | 9,133 (100.0%) |
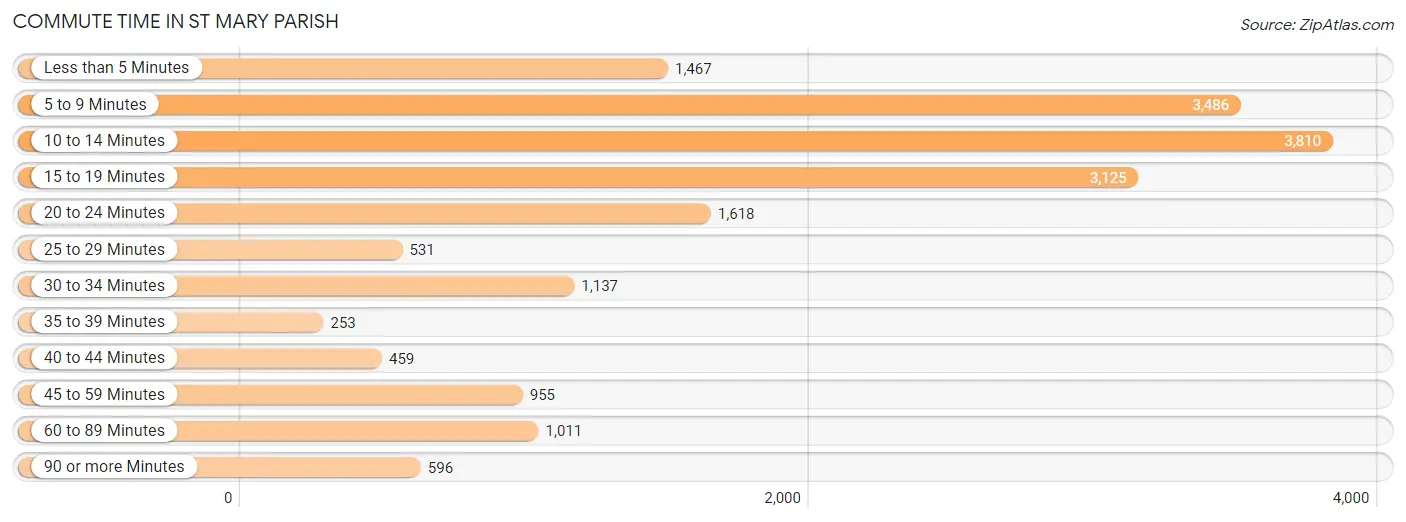
Commute Time in St Mary Parish
The most frequently occuring commute durations in St Mary Parish are 10 to 14 minutes (3,810 commuters, 20.6%), 5 to 9 minutes (3,486 commuters, 18.9%), and 15 to 19 minutes (3,125 commuters, 16.9%).
| Commute Time | # Commuters | % Commuters |
| Less than 5 Minutes | 1,467 | 8.0% |
| 5 to 9 Minutes | 3,486 | 18.9% |
| 10 to 14 Minutes | 3,810 | 20.6% |
| 15 to 19 Minutes | 3,125 | 16.9% |
| 20 to 24 Minutes | 1,618 | 8.8% |
| 25 to 29 Minutes | 531 | 2.9% |
| 30 to 34 Minutes | 1,137 | 6.2% |
| 35 to 39 Minutes | 253 | 1.4% |
| 40 to 44 Minutes | 459 | 2.5% |
| 45 to 59 Minutes | 955 | 5.2% |
| 60 to 89 Minutes | 1,011 | 5.5% |
| 90 or more Minutes | 596 | 3.2% |
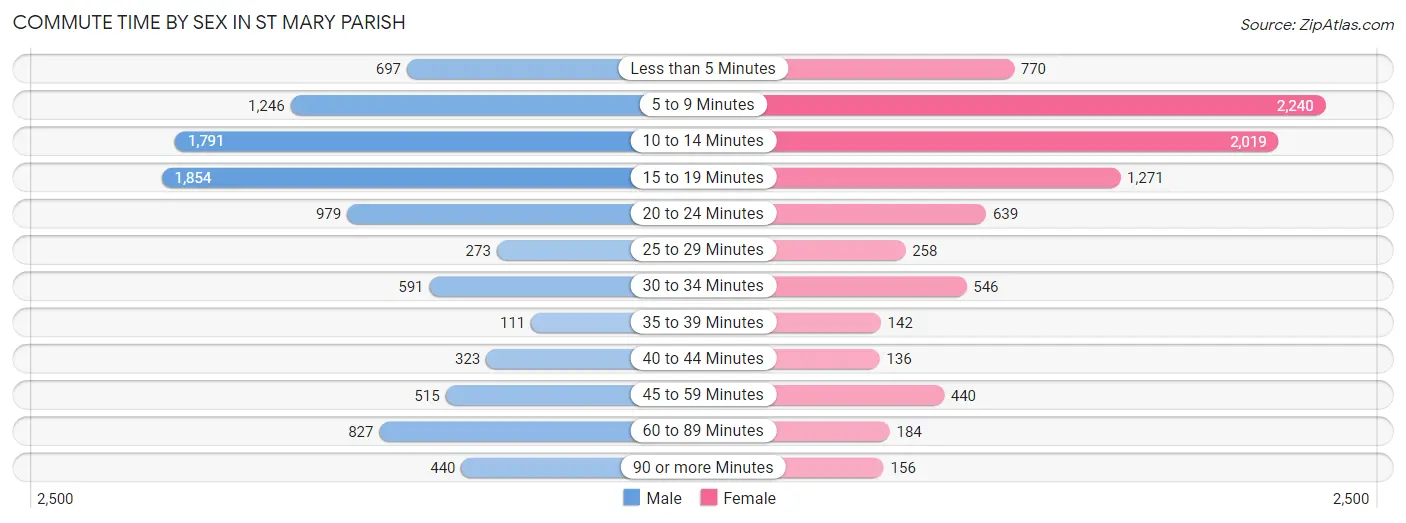
Commute Time by Sex in St Mary Parish
The most common commute times in St Mary Parish are 15 to 19 minutes (1,854 commuters, 19.2%) for males and 5 to 9 minutes (2,240 commuters, 25.5%) for females.
| Commute Time | Male | Female |
| Less than 5 Minutes | 697 (7.2%) | 770 (8.7%) |
| 5 to 9 Minutes | 1,246 (12.9%) | 2,240 (25.5%) |
| 10 to 14 Minutes | 1,791 (18.6%) | 2,019 (22.9%) |
| 15 to 19 Minutes | 1,854 (19.2%) | 1,271 (14.4%) |
| 20 to 24 Minutes | 979 (10.2%) | 639 (7.3%) |
| 25 to 29 Minutes | 273 (2.8%) | 258 (2.9%) |
| 30 to 34 Minutes | 591 (6.1%) | 546 (6.2%) |
| 35 to 39 Minutes | 111 (1.1%) | 142 (1.6%) |
| 40 to 44 Minutes | 323 (3.4%) | 136 (1.5%) |
| 45 to 59 Minutes | 515 (5.3%) | 440 (5.0%) |
| 60 to 89 Minutes | 827 (8.6%) | 184 (2.1%) |
| 90 or more Minutes | 440 (4.6%) | 156 (1.8%) |
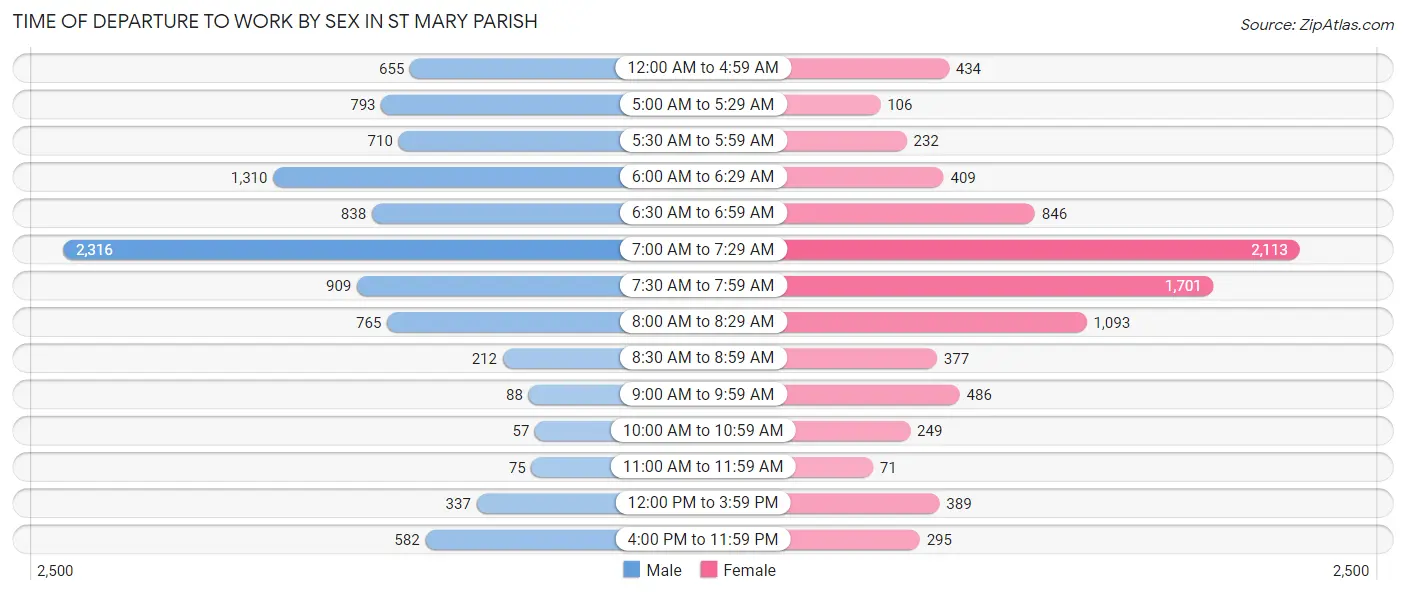
Time of Departure to Work by Sex in St Mary Parish
The most frequent times of departure to work in St Mary Parish are 7:00 AM to 7:29 AM (2,316, 24.0%) for males and 7:00 AM to 7:29 AM (2,113, 24.0%) for females.
| Time of Departure | Male | Female |
| 12:00 AM to 4:59 AM | 655 (6.8%) | 434 (4.9%) |
| 5:00 AM to 5:29 AM | 793 (8.2%) | 106 (1.2%) |
| 5:30 AM to 5:59 AM | 710 (7.4%) | 232 (2.6%) |
| 6:00 AM to 6:29 AM | 1,310 (13.6%) | 409 (4.6%) |
| 6:30 AM to 6:59 AM | 838 (8.7%) | 846 (9.6%) |
| 7:00 AM to 7:29 AM | 2,316 (24.0%) | 2,113 (24.0%) |
| 7:30 AM to 7:59 AM | 909 (9.4%) | 1,701 (19.3%) |
| 8:00 AM to 8:29 AM | 765 (7.9%) | 1,093 (12.4%) |
| 8:30 AM to 8:59 AM | 212 (2.2%) | 377 (4.3%) |
| 9:00 AM to 9:59 AM | 88 (0.9%) | 486 (5.5%) |
| 10:00 AM to 10:59 AM | 57 (0.6%) | 249 (2.8%) |
| 11:00 AM to 11:59 AM | 75 (0.8%) | 71 (0.8%) |
| 12:00 PM to 3:59 PM | 337 (3.5%) | 389 (4.4%) |
| 4:00 PM to 11:59 PM | 582 (6.0%) | 295 (3.4%) |
| Total | 9,647 (100.0%) | 8,801 (100.0%) |
Housing Occupancy in St Mary Parish
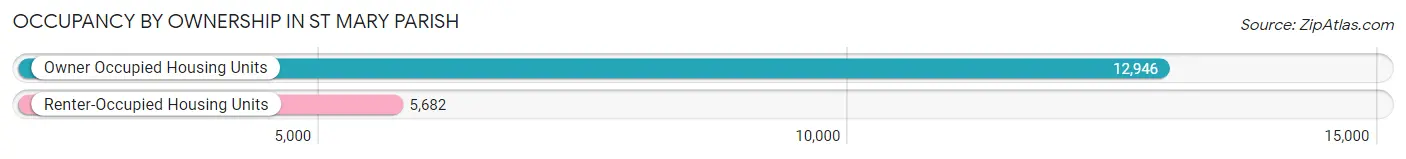
Occupancy by Ownership in St Mary Parish
Of the total 18,628 dwellings in St Mary Parish, owner-occupied units account for 12,946 (69.5%), while renter-occupied units make up 5,682 (30.5%).
| Occupancy | # Housing Units | % Housing Units |
| Owner Occupied Housing Units | 12,946 | 69.5% |
| Renter-Occupied Housing Units | 5,682 | 30.5% |
| Total Occupied Housing Units | 18,628 | 100.0% |
Occupancy by Household Size in St Mary Parish
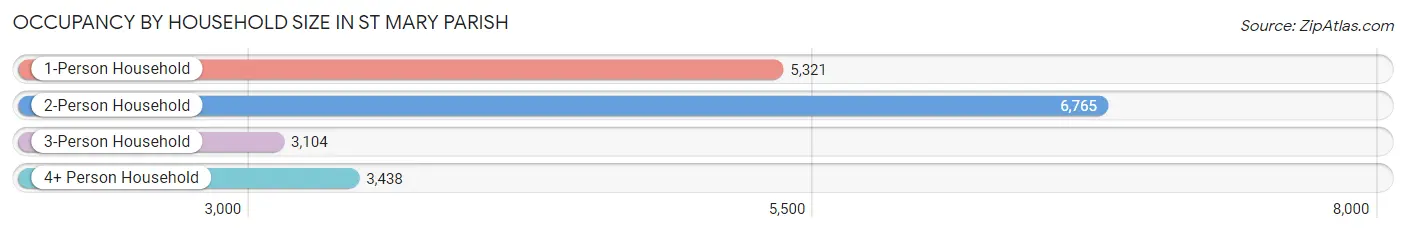
| Household Size | # Housing Units | % Housing Units |
| 1-Person Household | 5,321 | 28.6% |
| 2-Person Household | 6,765 | 36.3% |
| 3-Person Household | 3,104 | 16.7% |
| 4+ Person Household | 3,438 | 18.5% |
| Total Housing Units | 18,628 | 100.0% |
Occupancy by Ownership by Household Size in St Mary Parish
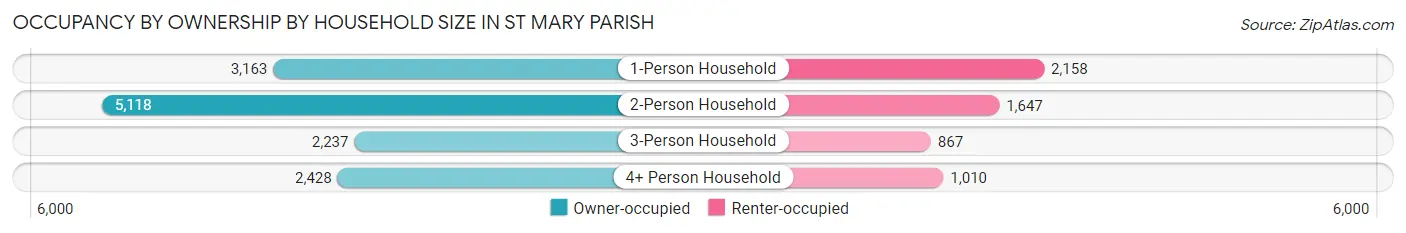
| Household Size | Owner-occupied | Renter-occupied |
| 1-Person Household | 3,163 (59.4%) | 2,158 (40.6%) |
| 2-Person Household | 5,118 (75.6%) | 1,647 (24.3%) |
| 3-Person Household | 2,237 (72.1%) | 867 (27.9%) |
| 4+ Person Household | 2,428 (70.6%) | 1,010 (29.4%) |
| Total Housing Units | 12,946 (69.5%) | 5,682 (30.5%) |
Occupancy by Educational Attainment in St Mary Parish
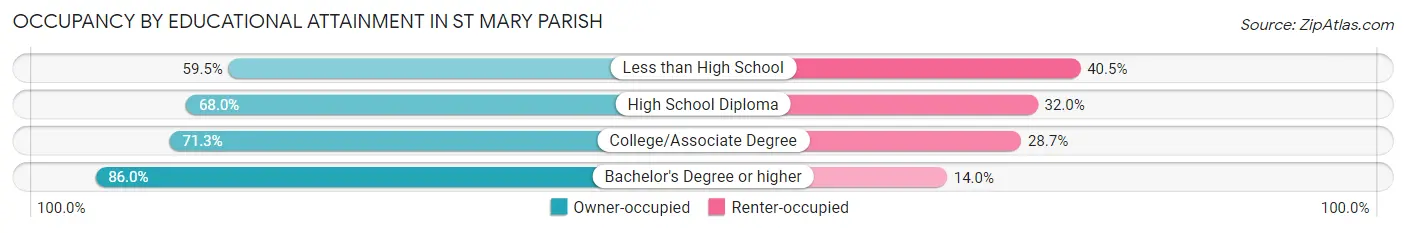
| Household Size | Owner-occupied | Renter-occupied |
| Less than High School | 2,169 (59.5%) | 1,474 (40.5%) |
| High School Diploma | 5,596 (68.0%) | 2,633 (32.0%) |
| College/Associate Degree | 3,050 (71.3%) | 1,228 (28.7%) |
| Bachelor's Degree or higher | 2,131 (86.0%) | 347 (14.0%) |
Occupancy by Age of Householder in St Mary Parish
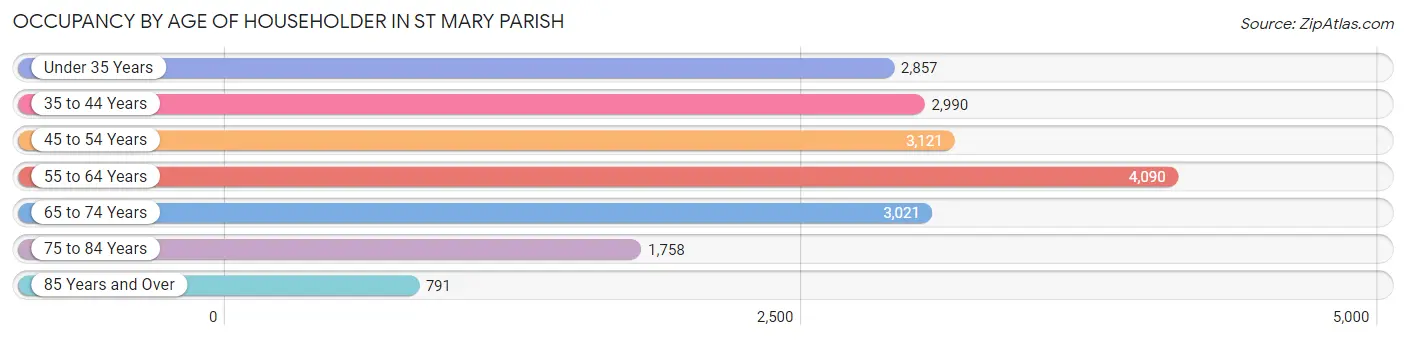
| Age Bracket | # Households | % Households |
| Under 35 Years | 2,857 | 15.3% |
| 35 to 44 Years | 2,990 | 16.1% |
| 45 to 54 Years | 3,121 | 16.8% |
| 55 to 64 Years | 4,090 | 22.0% |
| 65 to 74 Years | 3,021 | 16.2% |
| 75 to 84 Years | 1,758 | 9.4% |
| 85 Years and Over | 791 | 4.3% |
| Total | 18,628 | 100.0% |
Housing Finances in St Mary Parish
Median Income by Occupancy in St Mary Parish
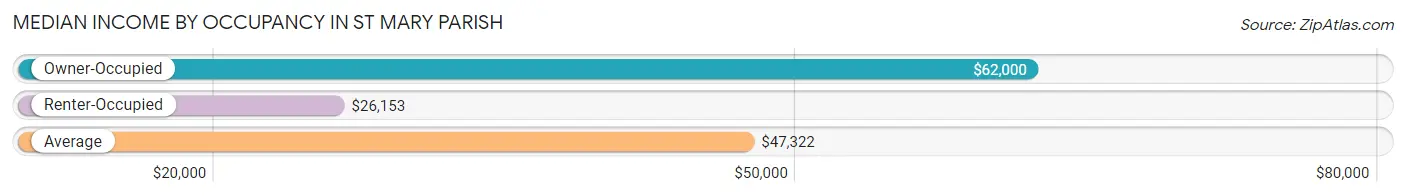
| Occupancy Type | # Households | Median Income |
| Owner-Occupied | 12,946 (69.5%) | $62,000 |
| Renter-Occupied | 5,682 (30.5%) | $26,153 |
| Average | 18,628 (100.0%) | $47,322 |
Occupancy by Householder Income Bracket in St Mary Parish
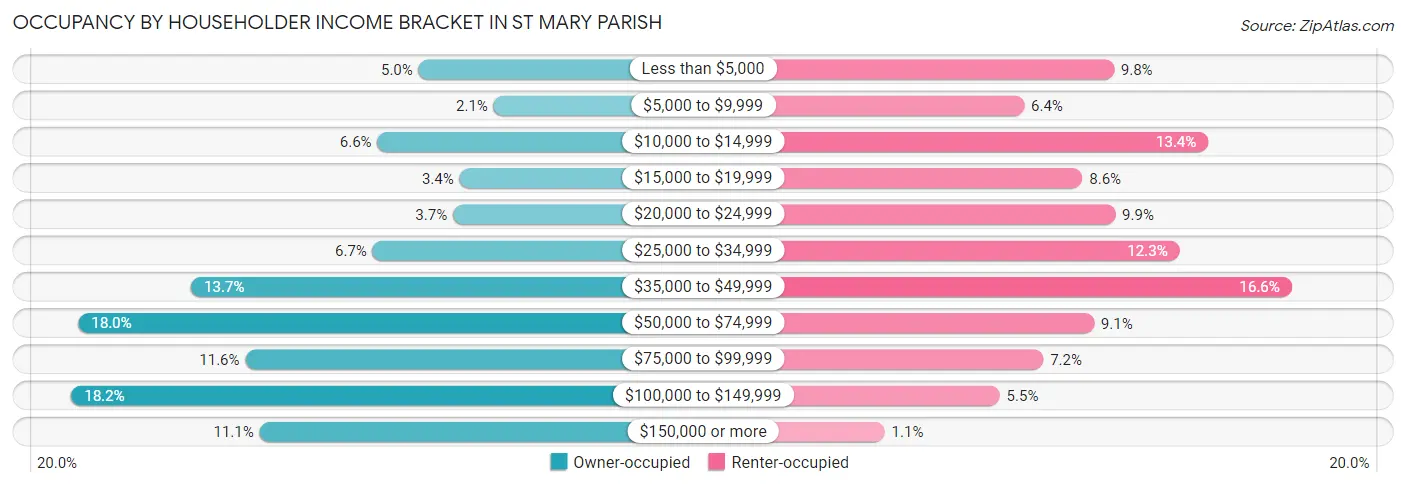
| Income Bracket | Owner-occupied | Renter-occupied |
| Less than $5,000 | 646 (5.0%) | 559 (9.8%) |
| $5,000 to $9,999 | 276 (2.1%) | 365 (6.4%) |
| $10,000 to $14,999 | 849 (6.6%) | 763 (13.4%) |
| $15,000 to $19,999 | 444 (3.4%) | 491 (8.6%) |
| $20,000 to $24,999 | 476 (3.7%) | 562 (9.9%) |
| $25,000 to $34,999 | 872 (6.7%) | 701 (12.3%) |
| $35,000 to $49,999 | 1,769 (13.7%) | 944 (16.6%) |
| $50,000 to $74,999 | 2,324 (17.9%) | 516 (9.1%) |
| $75,000 to $99,999 | 1,501 (11.6%) | 406 (7.1%) |
| $100,000 to $149,999 | 2,359 (18.2%) | 312 (5.5%) |
| $150,000 or more | 1,430 (11.1%) | 63 (1.1%) |
| Total | 12,946 (100.0%) | 5,682 (100.0%) |
Monthly Housing Cost Tiers in St Mary Parish
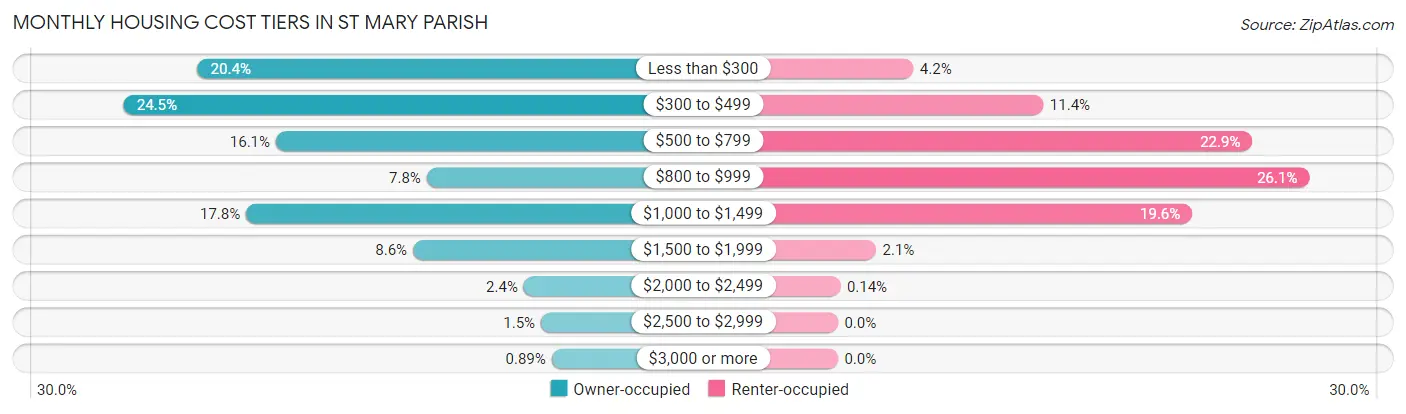
| Monthly Cost | Owner-occupied | Renter-occupied |
| Less than $300 | 2,646 (20.4%) | 237 (4.2%) |
| $300 to $499 | 3,175 (24.5%) | 645 (11.4%) |
| $500 to $799 | 2,087 (16.1%) | 1,302 (22.9%) |
| $800 to $999 | 1,009 (7.8%) | 1,481 (26.1%) |
| $1,000 to $1,499 | 2,301 (17.8%) | 1,113 (19.6%) |
| $1,500 to $1,999 | 1,107 (8.6%) | 120 (2.1%) |
| $2,000 to $2,499 | 314 (2.4%) | 8 (0.1%) |
| $2,500 to $2,999 | 192 (1.5%) | 0 (0.0%) |
| $3,000 or more | 115 (0.9%) | 0 (0.0%) |
| Total | 12,946 (100.0%) | 5,682 (100.0%) |
Physical Housing Characteristics in St Mary Parish
Housing Structures in St Mary Parish
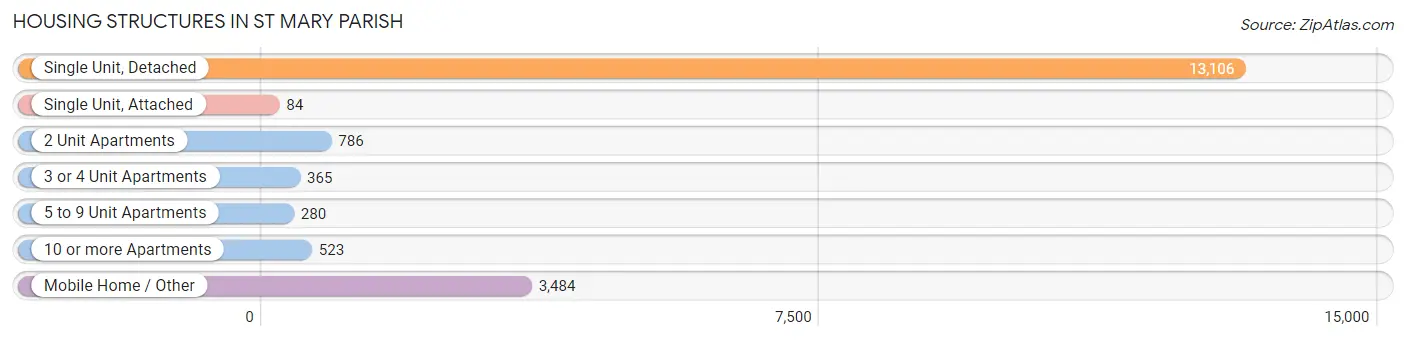
| Structure Type | # Housing Units | % Housing Units |
| Single Unit, Detached | 13,106 | 70.4% |
| Single Unit, Attached | 84 | 0.4% |
| 2 Unit Apartments | 786 | 4.2% |
| 3 or 4 Unit Apartments | 365 | 2.0% |
| 5 to 9 Unit Apartments | 280 | 1.5% |
| 10 or more Apartments | 523 | 2.8% |
| Mobile Home / Other | 3,484 | 18.7% |
| Total | 18,628 | 100.0% |
Housing Structures by Occupancy in St Mary Parish
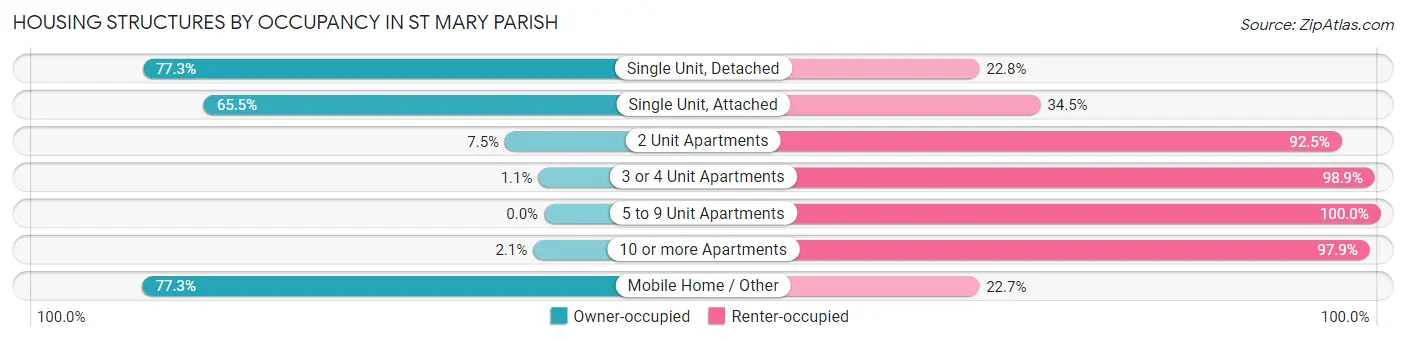
| Structure Type | Owner-occupied | Renter-occupied |
| Single Unit, Detached | 10,125 (77.2%) | 2,981 (22.8%) |
| Single Unit, Attached | 55 (65.5%) | 29 (34.5%) |
| 2 Unit Apartments | 59 (7.5%) | 727 (92.5%) |
| 3 or 4 Unit Apartments | 4 (1.1%) | 361 (98.9%) |
| 5 to 9 Unit Apartments | 0 (0.0%) | 280 (100.0%) |
| 10 or more Apartments | 11 (2.1%) | 512 (97.9%) |
| Mobile Home / Other | 2,692 (77.3%) | 792 (22.7%) |
| Total | 12,946 (69.5%) | 5,682 (30.5%) |
Housing Structures by Number of Rooms in St Mary Parish
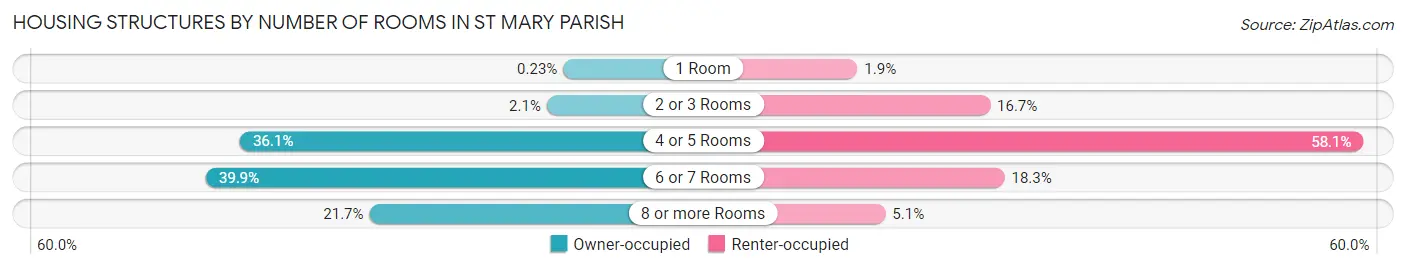
| Number of Rooms | Owner-occupied | Renter-occupied |
| 1 Room | 30 (0.2%) | 110 (1.9%) |
| 2 or 3 Rooms | 266 (2.1%) | 947 (16.7%) |
| 4 or 5 Rooms | 4,672 (36.1%) | 3,300 (58.1%) |
| 6 or 7 Rooms | 5,163 (39.9%) | 1,038 (18.3%) |
| 8 or more Rooms | 2,815 (21.7%) | 287 (5.1%) |
| Total | 12,946 (100.0%) | 5,682 (100.0%) |
Housing Structure by Heating Type in St Mary Parish
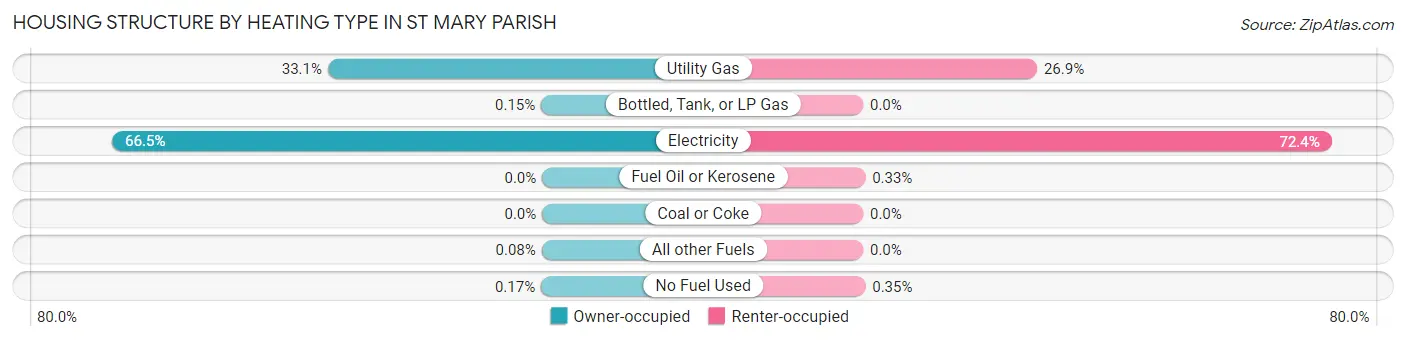
| Heating Type | Owner-occupied | Renter-occupied |
| Utility Gas | 4,289 (33.1%) | 1,528 (26.9%) |
| Bottled, Tank, or LP Gas | 19 (0.2%) | 0 (0.0%) |
| Electricity | 8,605 (66.5%) | 4,115 (72.4%) |
| Fuel Oil or Kerosene | 0 (0.0%) | 19 (0.3%) |
| Coal or Coke | 0 (0.0%) | 0 (0.0%) |
| All other Fuels | 11 (0.1%) | 0 (0.0%) |
| No Fuel Used | 22 (0.2%) | 20 (0.4%) |
| Total | 12,946 (100.0%) | 5,682 (100.0%) |
Household Vehicle Usage in St Mary Parish
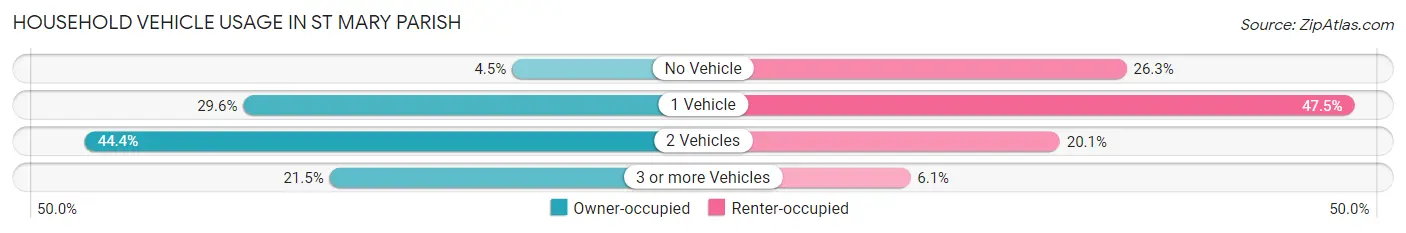
| Vehicles per Household | Owner-occupied | Renter-occupied |
| No Vehicle | 582 (4.5%) | 1,494 (26.3%) |
| 1 Vehicle | 3,831 (29.6%) | 2,701 (47.5%) |
| 2 Vehicles | 5,745 (44.4%) | 1,140 (20.1%) |
| 3 or more Vehicles | 2,788 (21.5%) | 347 (6.1%) |
| Total | 12,946 (100.0%) | 5,682 (100.0%) |
Real Estate & Mortgages in St Mary Parish
Real Estate and Mortgage Overview in St Mary Parish
| Characteristic | Without Mortgage | With Mortgage |
| Housing Units | 7,983 | 4,963 |
| Median Property Value | $98,700 | $170,300 |
| Median Household Income | $51,953 | $861 |
| Monthly Housing Costs | $380 | $115 |
| Real Estate Taxes | $395 | $950 |
Property Value by Mortgage Status in St Mary Parish
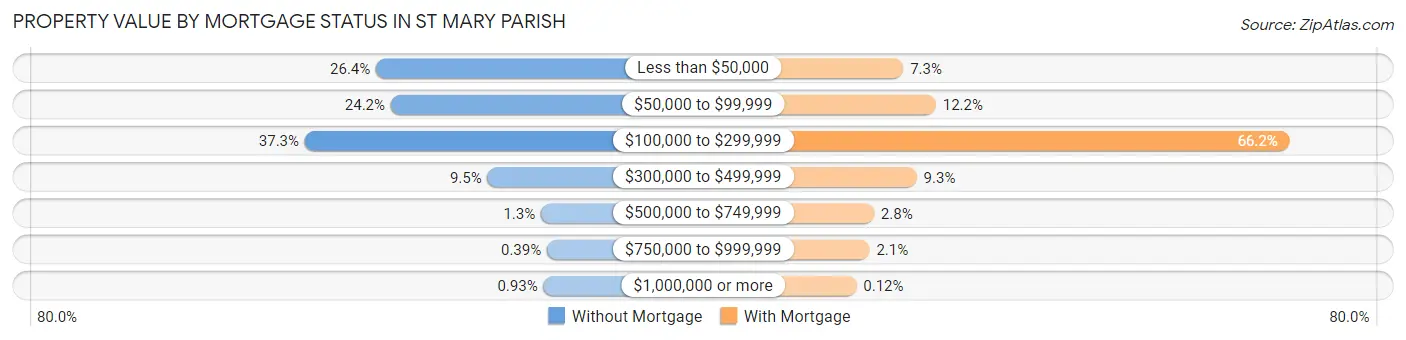
| Property Value | Without Mortgage | With Mortgage |
| Less than $50,000 | 2,111 (26.4%) | 361 (7.3%) |
| $50,000 to $99,999 | 1,931 (24.2%) | 607 (12.2%) |
| $100,000 to $299,999 | 2,977 (37.3%) | 3,283 (66.1%) |
| $300,000 to $499,999 | 755 (9.5%) | 462 (9.3%) |
| $500,000 to $749,999 | 104 (1.3%) | 139 (2.8%) |
| $750,000 to $999,999 | 31 (0.4%) | 105 (2.1%) |
| $1,000,000 or more | 74 (0.9%) | 6 (0.1%) |
| Total | 7,983 (100.0%) | 4,963 (100.0%) |
Household Income by Mortgage Status in St Mary Parish
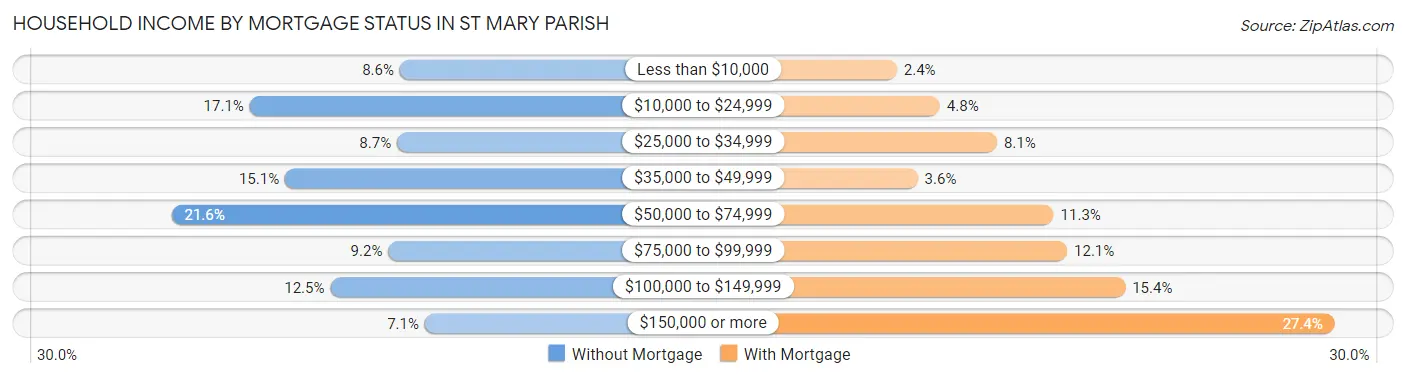
| Household Income | Without Mortgage | With Mortgage |
| Less than $10,000 | 683 (8.6%) | 117 (2.4%) |
| $10,000 to $24,999 | 1,368 (17.1%) | 239 (4.8%) |
| $25,000 to $34,999 | 696 (8.7%) | 401 (8.1%) |
| $35,000 to $49,999 | 1,207 (15.1%) | 176 (3.5%) |
| $50,000 to $74,999 | 1,724 (21.6%) | 562 (11.3%) |
| $75,000 to $99,999 | 736 (9.2%) | 600 (12.1%) |
| $100,000 to $149,999 | 1,000 (12.5%) | 765 (15.4%) |
| $150,000 or more | 569 (7.1%) | 1,359 (27.4%) |
| Total | 7,983 (100.0%) | 4,963 (100.0%) |
Property Value to Household Income Ratio in St Mary Parish
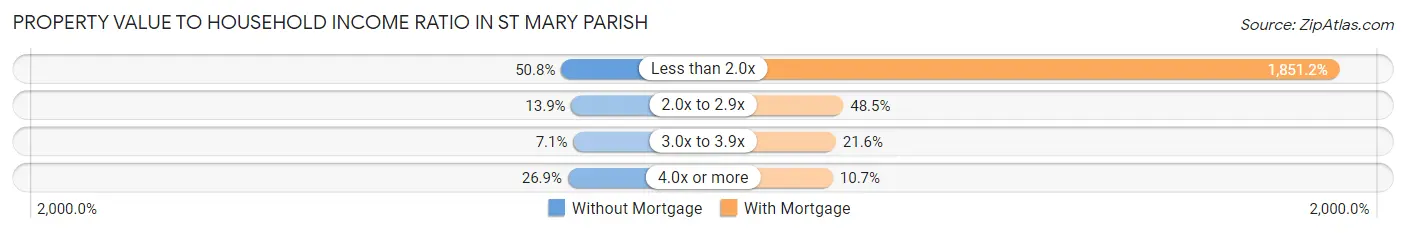
| Value-to-Income Ratio | Without Mortgage | With Mortgage |
| Less than 2.0x | 4,053 (50.8%) | 91,875 (1,851.2%) |
| 2.0x to 2.9x | 1,111 (13.9%) | 2,409 (48.5%) |
| 3.0x to 3.9x | 564 (7.1%) | 1,070 (21.6%) |
| 4.0x or more | 2,150 (26.9%) | 529 (10.7%) |
| Total | 7,983 (100.0%) | 4,963 (100.0%) |
Real Estate Taxes by Mortgage Status in St Mary Parish
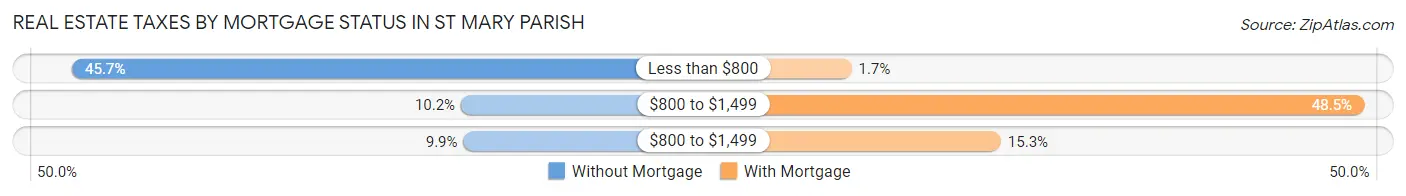
| Property Taxes | Without Mortgage | With Mortgage |
| Less than $800 | 3,645 (45.7%) | 84 (1.7%) |
| $800 to $1,499 | 810 (10.2%) | 2,406 (48.5%) |
| $800 to $1,499 | 793 (9.9%) | 761 (15.3%) |
| Total | 7,983 (100.0%) | 4,963 (100.0%) |
Health & Disability in St Mary Parish
Health Insurance Coverage by Age in St Mary Parish
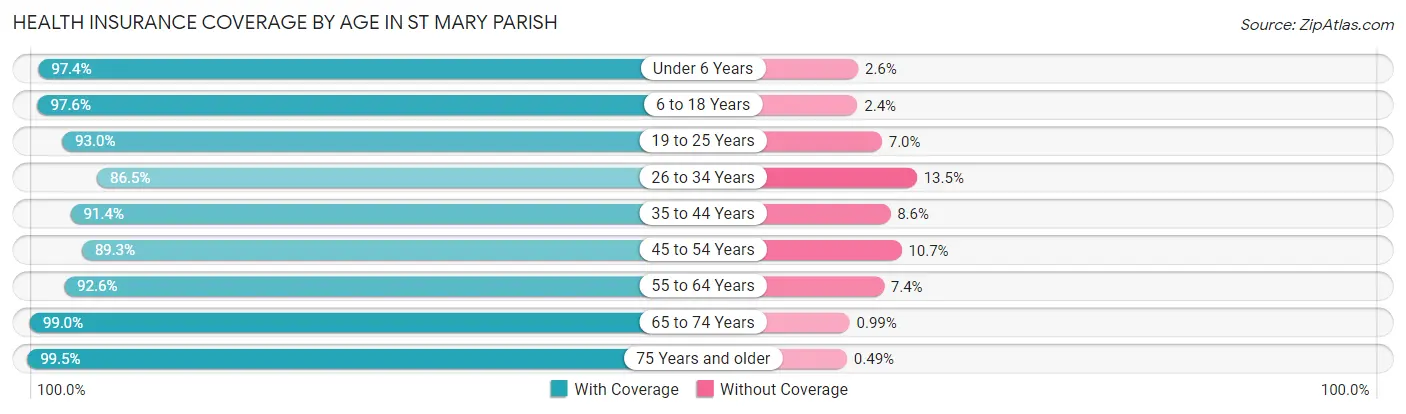
| Age Bracket | With Coverage | Without Coverage |
| Under 6 Years | 3,577 (97.4%) | 94 (2.6%) |
| 6 to 18 Years | 8,423 (97.6%) | 210 (2.4%) |
| 19 to 25 Years | 3,247 (93.0%) | 244 (7.0%) |
| 26 to 34 Years | 4,717 (86.5%) | 737 (13.5%) |
| 35 to 44 Years | 5,044 (91.4%) | 472 (8.6%) |
| 45 to 54 Years | 5,404 (89.3%) | 645 (10.7%) |
| 55 to 64 Years | 6,654 (92.6%) | 530 (7.4%) |
| 65 to 74 Years | 4,910 (99.0%) | 49 (1.0%) |
| 75 Years and older | 3,441 (99.5%) | 17 (0.5%) |
| Total | 45,417 (93.8%) | 2,998 (6.2%) |
Health Insurance Coverage by Citizenship Status in St Mary Parish
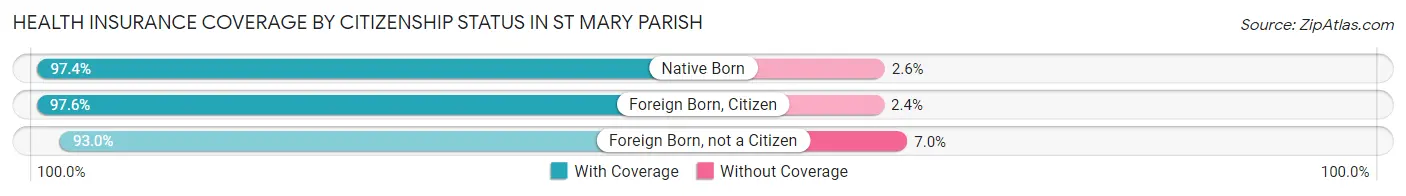
| Citizenship Status | With Coverage | Without Coverage |
| Native Born | 3,577 (97.4%) | 94 (2.6%) |
| Foreign Born, Citizen | 8,423 (97.6%) | 210 (2.4%) |
| Foreign Born, not a Citizen | 3,247 (93.0%) | 244 (7.0%) |
Health Insurance Coverage by Household Income in St Mary Parish
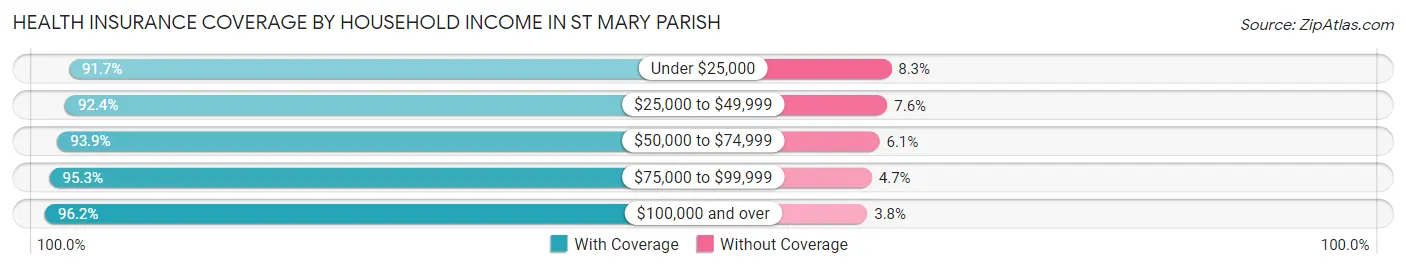
| Household Income | With Coverage | Without Coverage |
| Under $25,000 | 10,021 (91.7%) | 911 (8.3%) |
| $25,000 to $49,999 | 9,939 (92.4%) | 817 (7.6%) |
| $50,000 to $74,999 | 7,546 (93.9%) | 494 (6.1%) |
| $75,000 to $99,999 | 5,377 (95.3%) | 265 (4.7%) |
| $100,000 and over | 12,438 (96.2%) | 497 (3.8%) |
Public vs Private Health Insurance Coverage by Age in St Mary Parish
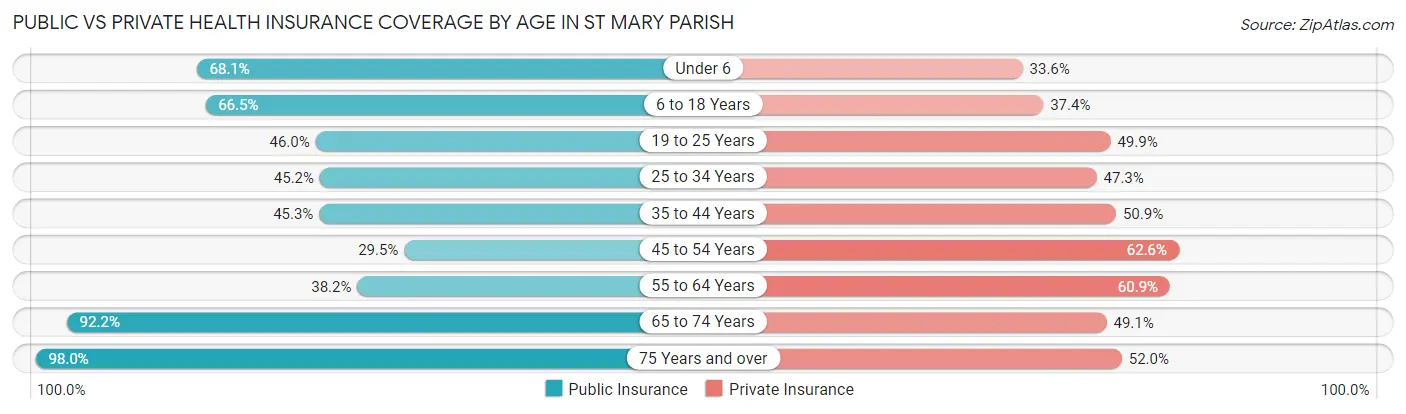
| Age Bracket | Public Insurance | Private Insurance |
| Under 6 | 2,500 (68.1%) | 1,232 (33.6%) |
| 6 to 18 Years | 5,738 (66.5%) | 3,228 (37.4%) |
| 19 to 25 Years | 1,606 (46.0%) | 1,741 (49.9%) |
| 25 to 34 Years | 2,465 (45.2%) | 2,580 (47.3%) |
| 35 to 44 Years | 2,500 (45.3%) | 2,807 (50.9%) |
| 45 to 54 Years | 1,787 (29.5%) | 3,784 (62.6%) |
| 55 to 64 Years | 2,747 (38.2%) | 4,375 (60.9%) |
| 65 to 74 Years | 4,572 (92.2%) | 2,437 (49.1%) |
| 75 Years and over | 3,388 (98.0%) | 1,797 (52.0%) |
| Total | 27,303 (56.4%) | 23,981 (49.5%) |
Disability Status by Sex by Age in St Mary Parish
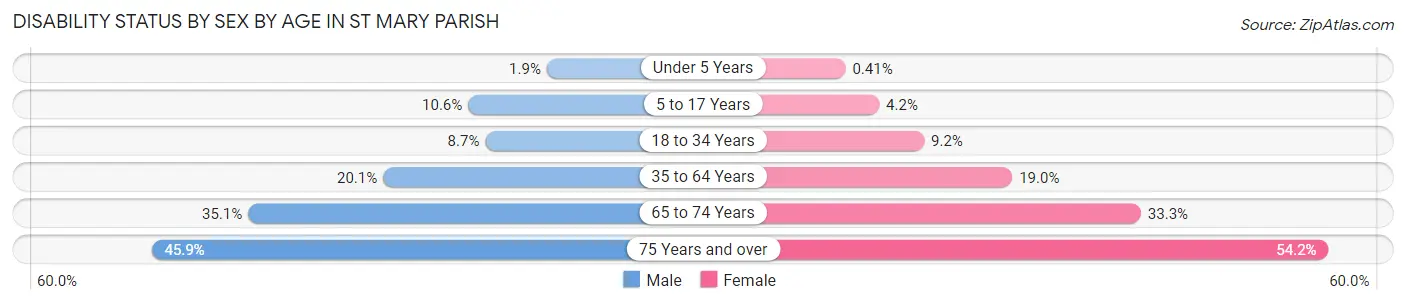
| Age Bracket | Male | Female |
| Under 5 Years | 28 (1.8%) | 7 (0.4%) |
| 5 to 17 Years | 456 (10.6%) | 175 (4.2%) |
| 18 to 34 Years | 405 (8.7%) | 447 (9.2%) |
| 35 to 64 Years | 1,847 (20.1%) | 1,813 (19.0%) |
| 65 to 74 Years | 837 (35.1%) | 858 (33.3%) |
| 75 Years and over | 672 (45.9%) | 1,080 (54.2%) |
Disability Class by Sex by Age in St Mary Parish
Disability Class: Hearing Difficulty
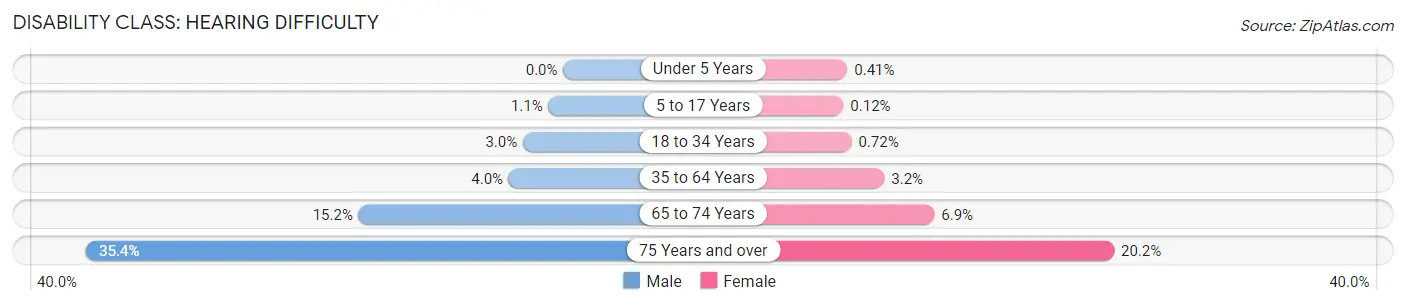
| Age Bracket | Male | Female |
| Under 5 Years | 0 (0.0%) | 7 (0.4%) |
| 5 to 17 Years | 47 (1.1%) | 5 (0.1%) |
| 18 to 34 Years | 139 (3.0%) | 35 (0.7%) |
| 35 to 64 Years | 372 (4.0%) | 302 (3.2%) |
| 65 to 74 Years | 362 (15.2%) | 177 (6.9%) |
| 75 Years and over | 519 (35.4%) | 403 (20.2%) |
Disability Class: Vision Difficulty
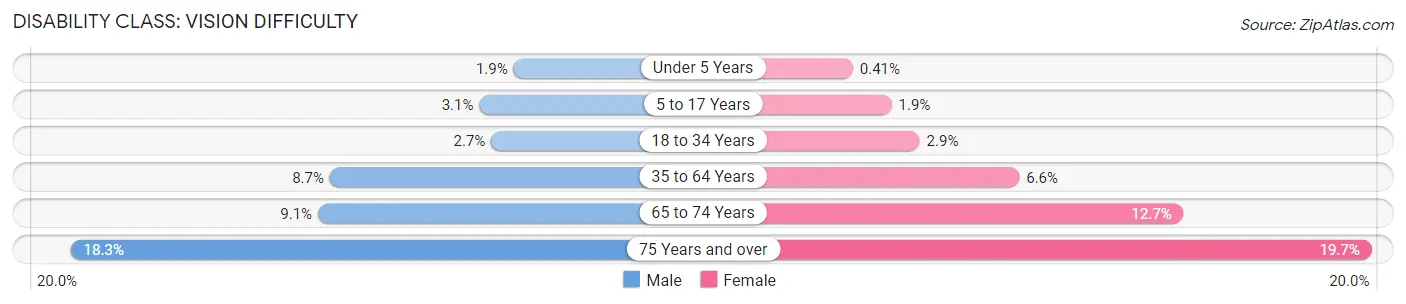
| Age Bracket | Male | Female |
| Under 5 Years | 28 (1.8%) | 7 (0.4%) |
| 5 to 17 Years | 134 (3.1%) | 78 (1.8%) |
| 18 to 34 Years | 125 (2.7%) | 141 (2.9%) |
| 35 to 64 Years | 798 (8.7%) | 629 (6.6%) |
| 65 to 74 Years | 217 (9.1%) | 327 (12.7%) |
| 75 Years and over | 268 (18.3%) | 392 (19.7%) |
Disability Class: Cognitive Difficulty
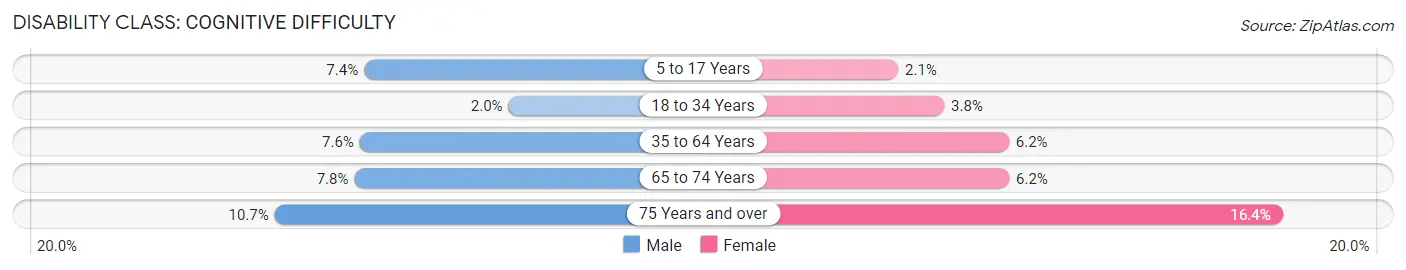
| Age Bracket | Male | Female |
| 5 to 17 Years | 318 (7.4%) | 88 (2.1%) |
| 18 to 34 Years | 95 (2.0%) | 185 (3.8%) |
| 35 to 64 Years | 695 (7.6%) | 592 (6.2%) |
| 65 to 74 Years | 185 (7.8%) | 160 (6.2%) |
| 75 Years and over | 157 (10.7%) | 326 (16.4%) |
Disability Class: Ambulatory Difficulty
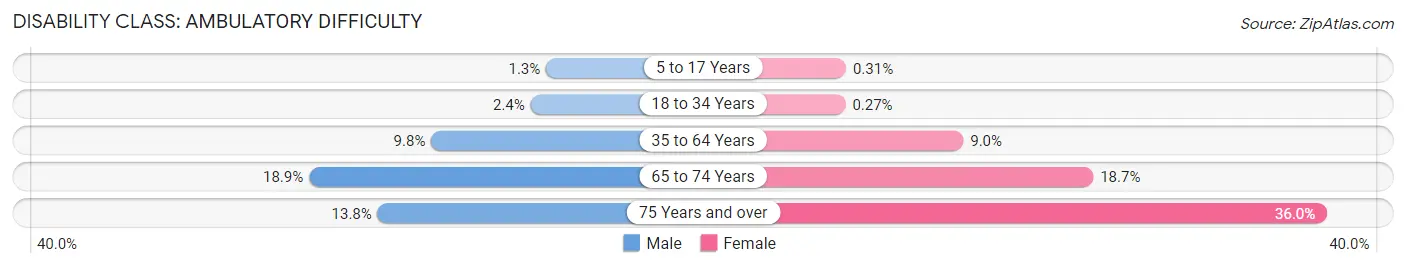
| Age Bracket | Male | Female |
| 5 to 17 Years | 55 (1.3%) | 13 (0.3%) |
| 18 to 34 Years | 113 (2.4%) | 13 (0.3%) |
| 35 to 64 Years | 902 (9.8%) | 861 (9.0%) |
| 65 to 74 Years | 450 (18.9%) | 481 (18.7%) |
| 75 Years and over | 202 (13.8%) | 718 (36.0%) |
Disability Class: Self-Care Difficulty
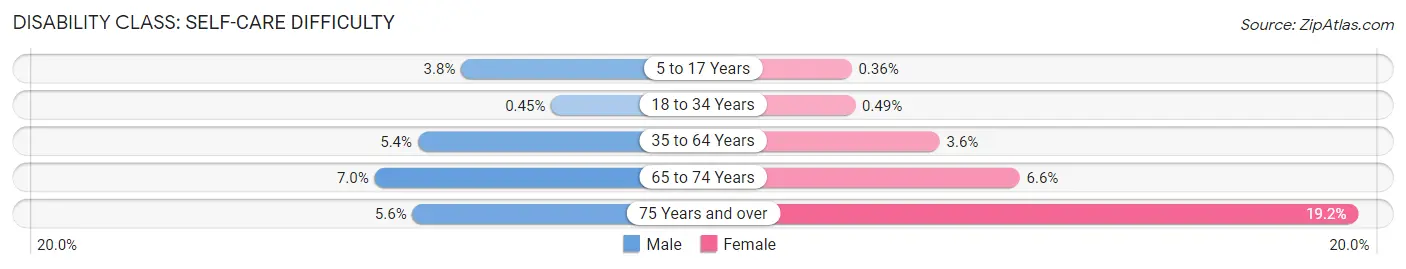
| Age Bracket | Male | Female |
| 5 to 17 Years | 163 (3.8%) | 15 (0.4%) |
| 18 to 34 Years | 21 (0.4%) | 24 (0.5%) |
| 35 to 64 Years | 497 (5.4%) | 347 (3.6%) |
| 65 to 74 Years | 167 (7.0%) | 170 (6.6%) |
| 75 Years and over | 82 (5.6%) | 382 (19.2%) |
Technology Access in St Mary Parish
Computing Device Access in St Mary Parish
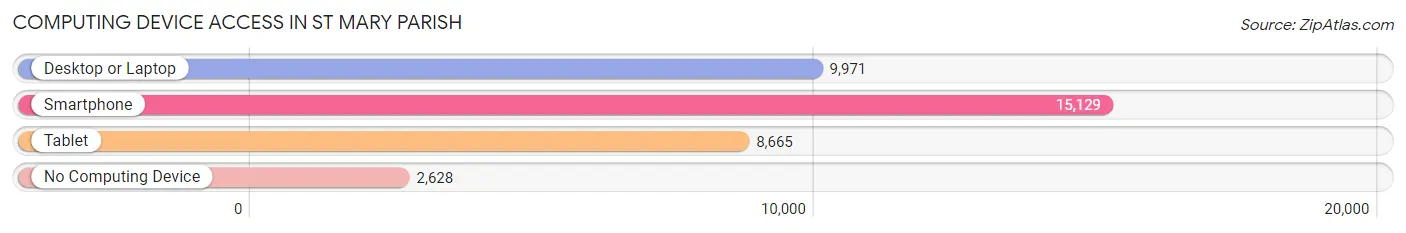
| Device Type | # Households | % Households |
| Desktop or Laptop | 9,971 | 53.5% |
| Smartphone | 15,129 | 81.2% |
| Tablet | 8,665 | 46.5% |
| No Computing Device | 2,628 | 14.1% |
| Total | 18,628 | 100.0% |
Internet Access in St Mary Parish
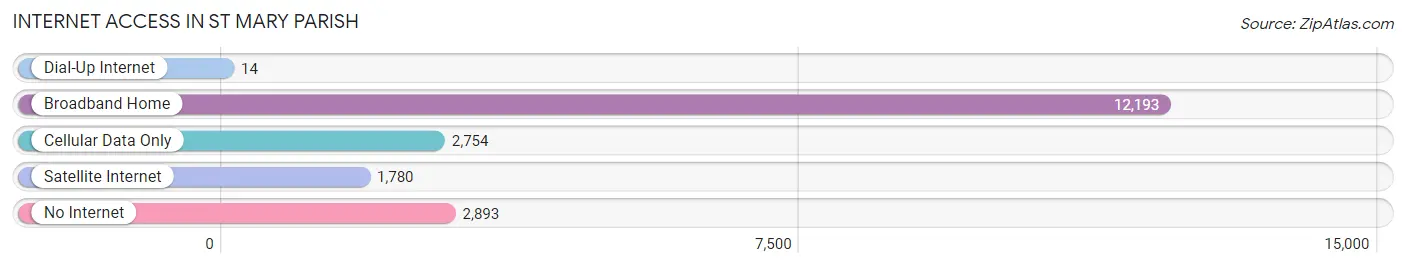
| Internet Type | # Households | % Households |
| Dial-Up Internet | 14 | 0.1% |
| Broadband Home | 12,193 | 65.5% |
| Cellular Data Only | 2,754 | 14.8% |
| Satellite Internet | 1,780 | 9.6% |
| No Internet | 2,893 | 15.5% |
| Total | 18,628 | 100.0% |
St Mary Parish Summary
St. Mary Parish is located in the southeastern part of Louisiana, and is part of the Acadiana region. It is bordered by Iberia Parish to the west, Assumption Parish to the east, and the Atchafalaya River to the south. The parish seat is Franklin, and the largest city is Morgan City. The parish has a total area of 1,119 square miles, and a population of 54,650 as of the 2010 census.
History
St. Mary Parish was established in 1811, and is named for the Catholic Church of St. Mary. The parish was originally part of the Attakapas District, which was created in 1763. The parish was divided in 1868, with the western portion becoming Iberia Parish.
The parish has a rich history, and was home to many Native American tribes, including the Chitimacha, Houma, and Tunica. The first European settlers were French, who arrived in the area in the late 1600s. The area was part of the French colony of Louisiana until it was ceded to Spain in 1763. After the Louisiana Purchase in 1803, the area became part of the United States.
Geography
St. Mary Parish is located in the southeastern part of Louisiana, and is part of the Acadiana region. It is bordered by Iberia Parish to the west, Assumption Parish to the east, and the Atchafalaya River to the south. The parish has a total area of 1,119 square miles, and a population of 54,650 as of the 2010 census.
The parish is mostly flat, with some rolling hills in the northern part. The terrain is mostly marshland, with some areas of higher ground. The parish is home to several bayous, including Bayou Teche, Bayou Black, and Bayou Boeuf. The Atchafalaya River forms the southern boundary of the parish.
Economy
St. Mary Parish has a diverse economy, with a mix of agriculture, manufacturing, and service industries. The parish is home to several large industries, including oil and gas, shipbuilding, and seafood processing.
Agriculture is an important part of the local economy, with sugarcane, rice, and soybeans being the main crops. The parish is also home to several large dairy farms.
Manufacturing is also an important part of the local economy, with several large companies located in the parish. These include shipbuilding, oil and gas, and seafood processing.
The service industry is also an important part of the local economy, with several large companies located in the parish. These include banking, insurance, and healthcare.
Demographics
As of the 2010 census, St. Mary Parish had a population of 54,650. The racial makeup of the parish was 68.3% White, 28.2% African American, 0.5% Native American, 0.7% Asian, 0.1% Pacific Islander, and 1.2% from other races. Hispanic or Latino of any race were 2.7% of the population.
The median income for a household in the parish was $37,945, and the median income for a family was $45,945. The per capita income for the parish was $19,945. About 17.3% of families and 21.2% of the population were below the poverty line, including 28.2% of those under age 18 and 16.2% of those age 65 or over.
Common Questions
What is Per Capita Income in St Mary Parish?
Per Capita income in St Mary Parish is $26,949.
What is the Median Family Income in St Mary Parish?
Median Family Income in St Mary Parish is $63,102.
What is the Median Household income in St Mary Parish?
Median Household Income in St Mary Parish is $47,322.
What is Income or Wage Gap in St Mary Parish?
Income or Wage Gap in St Mary Parish is 44.3%.
Women in St Mary Parish earn 55.7 cents for every dollar earned by a man.
What is Family Income Deficit in St Mary Parish?
Family Income Deficit in St Mary Parish is $11,541.
Families that are below poverty line in St Mary Parish earn $11,541 less on average than the poverty threshold level.
What is Inequality or Gini Index in St Mary Parish?
Inequality or Gini Index in St Mary Parish is 0.48.
What is the Total Population of St Mary Parish?
Total Population of St Mary Parish is 49,114.
What is the Total Male Population of St Mary Parish?
Total Male Population of St Mary Parish is 24,037.
What is the Total Female Population of St Mary Parish?
Total Female Population of St Mary Parish is 25,077.
What is the Ratio of Males per 100 Females in St Mary Parish?
There are 95.85 Males per 100 Females in St Mary Parish.
What is the Ratio of Females per 100 Males in St Mary Parish?
There are 104.33 Females per 100 Males in St Mary Parish.
What is the Median Population Age in St Mary Parish?
Median Population Age in St Mary Parish is 39.5 Years.
What is the Average Family Size in St Mary Parish
Average Family Size in St Mary Parish is 3.3 People.
What is the Average Household Size in St Mary Parish
Average Household Size in St Mary Parish is 2.6 People.
How Large is the Labor Force in St Mary Parish?
There are 20,623 People in the Labor Forcein in St Mary Parish.
What is the Percentage of People in the Labor Force in St Mary Parish?
53.4% of People are in the Labor Force in St Mary Parish.
What is the Unemployment Rate in St Mary Parish?
Unemployment Rate in St Mary Parish is 5.9%.