Breaux Bridge, LA Map & Demographics
Breaux Bridge Map
Breaux Bridge Overview
$25,222
PER CAPITA INCOME
$56,783
AVG FAMILY INCOME
$45,619
AVG HOUSEHOLD INCOME
30.0%
WAGE / INCOME GAP [ % ]
70.0¢/ $1
WAGE / INCOME GAP [ $ ]
$11,927
FAMILY INCOME DEFICIT
0.48
INEQUALITY / GINI INDEX
7,544
TOTAL POPULATION
3,797
MALE POPULATION
3,747
FEMALE POPULATION
101.33
MALES / 100 FEMALES
98.68
FEMALES / 100 MALES
39.0
MEDIAN AGE
3.1
AVG FAMILY SIZE
2.6
AVG HOUSEHOLD SIZE
3,223
LABOR FORCE [ PEOPLE ]
55.7%
PERCENT IN LABOR FORCE
9.6%
UNEMPLOYMENT RATE
Breaux Bridge Zip Codes
Breaux Bridge Area Codes
Income in Breaux Bridge
Income Overview in Breaux Bridge
Per Capita Income in Breaux Bridge is $25,222, while median incomes of families and households are $56,783 and $45,619 respectively.
| Characteristic | Number | Measure |
| Per Capita Income | 7,544 | $25,222 |
| Median Family Income | 1,830 | $56,783 |
| Mean Family Income | 1,830 | $76,144 |
| Median Household Income | 2,847 | $45,619 |
| Mean Household Income | 2,847 | $64,676 |
| Income Deficit | 1,830 | $11,927 |
| Wage / Income Gap (%) | 7,544 | 30.05% |
| Wage / Income Gap ($) | 7,544 | 69.95¢ per $1 |
| Gini / Inequality Index | 7,544 | 0.48 |
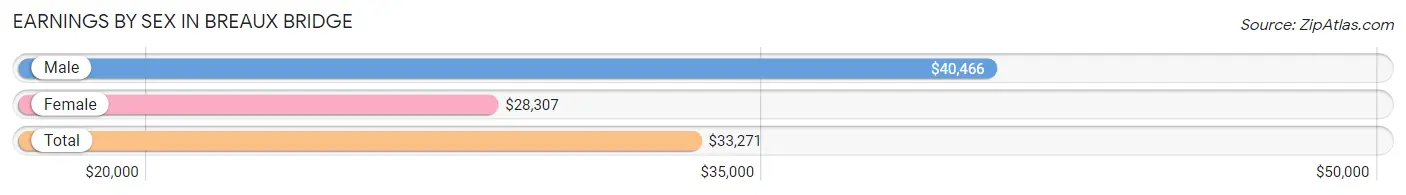
Earnings by Sex in Breaux Bridge
Average Earnings in Breaux Bridge are $33,271, $40,466 for men and $28,307 for women, a difference of 30.0%.
| Sex | Number | Average Earnings |
| Male | 1,823 (53.0%) | $40,466 |
| Female | 1,619 (47.0%) | $28,307 |
| Total | 3,442 (100.0%) | $33,271 |
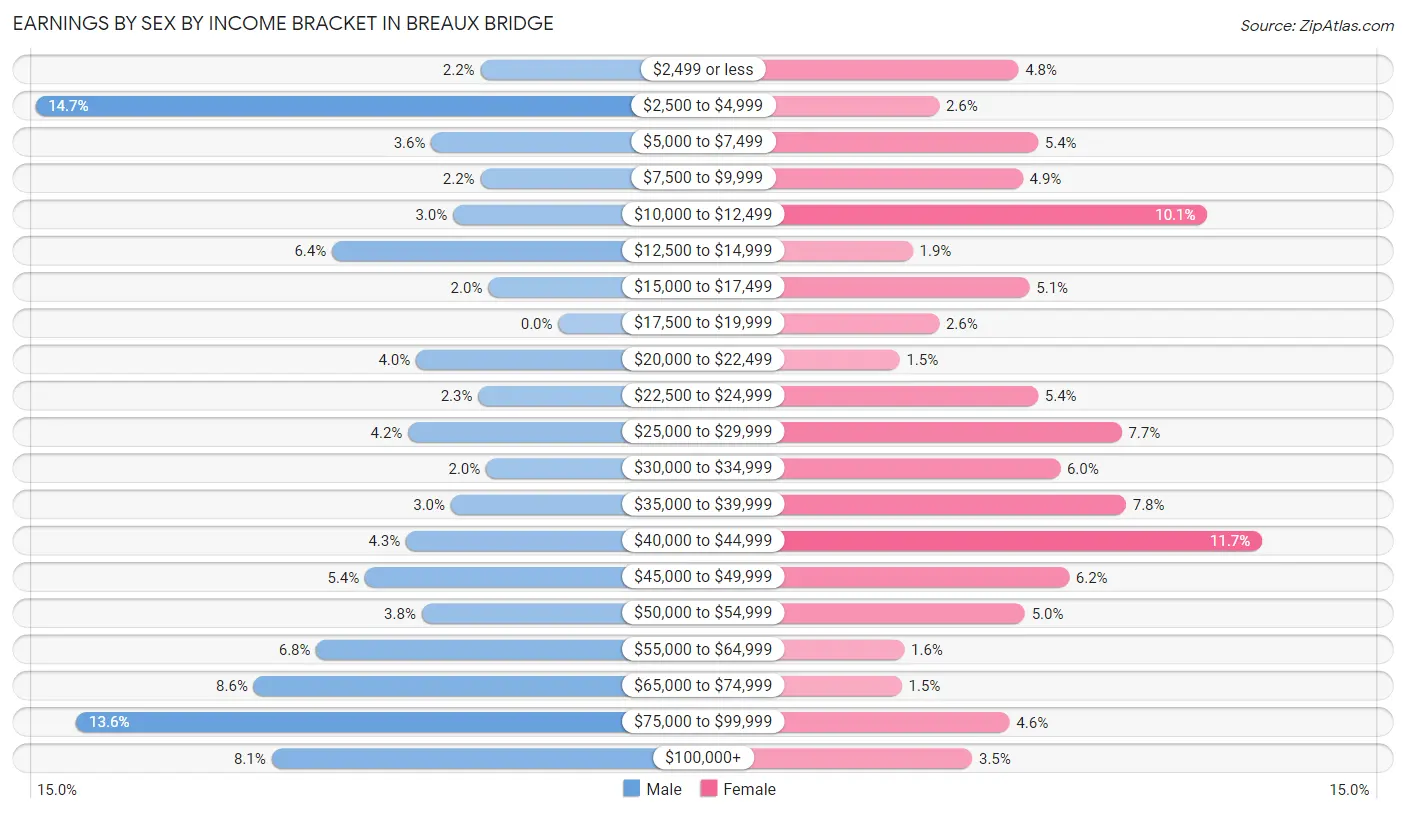
Earnings by Sex by Income Bracket in Breaux Bridge
The most common earnings brackets in Breaux Bridge are $2,500 to $4,999 for men (268 | 14.7%) and $40,000 to $44,999 for women (189 | 11.7%).
| Income | Male | Female |
| $2,499 or less | 40 (2.2%) | 78 (4.8%) |
| $2,500 to $4,999 | 268 (14.7%) | 42 (2.6%) |
| $5,000 to $7,499 | 65 (3.6%) | 87 (5.4%) |
| $7,500 to $9,999 | 40 (2.2%) | 80 (4.9%) |
| $10,000 to $12,499 | 54 (3.0%) | 164 (10.1%) |
| $12,500 to $14,999 | 116 (6.4%) | 30 (1.8%) |
| $15,000 to $17,499 | 36 (2.0%) | 83 (5.1%) |
| $17,500 to $19,999 | 0 (0.0%) | 42 (2.6%) |
| $20,000 to $22,499 | 73 (4.0%) | 24 (1.5%) |
| $22,500 to $24,999 | 41 (2.2%) | 87 (5.4%) |
| $25,000 to $29,999 | 77 (4.2%) | 125 (7.7%) |
| $30,000 to $34,999 | 37 (2.0%) | 97 (6.0%) |
| $35,000 to $39,999 | 55 (3.0%) | 127 (7.8%) |
| $40,000 to $44,999 | 78 (4.3%) | 189 (11.7%) |
| $45,000 to $49,999 | 99 (5.4%) | 101 (6.2%) |
| $50,000 to $54,999 | 70 (3.8%) | 81 (5.0%) |
| $55,000 to $64,999 | 124 (6.8%) | 26 (1.6%) |
| $65,000 to $74,999 | 156 (8.6%) | 25 (1.5%) |
| $75,000 to $99,999 | 247 (13.6%) | 74 (4.6%) |
| $100,000+ | 147 (8.1%) | 57 (3.5%) |
| Total | 1,823 (100.0%) | 1,619 (100.0%) |
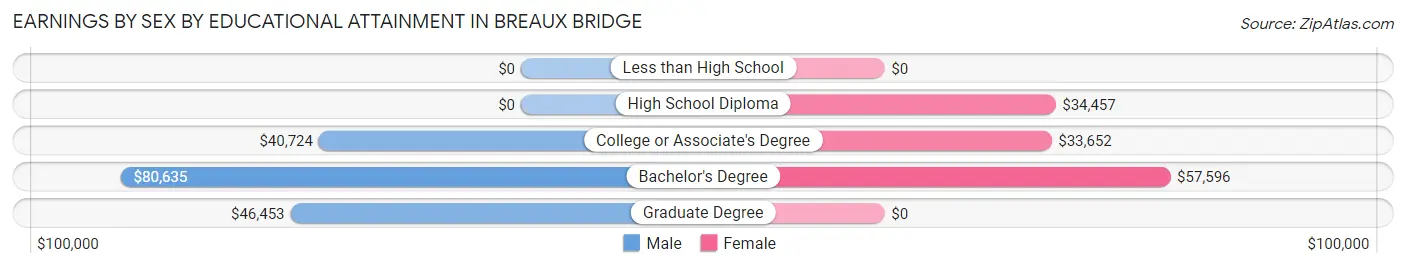
Earnings by Sex by Educational Attainment in Breaux Bridge
Average earnings in Breaux Bridge are $45,357 for men and $36,206 for women, a difference of 20.2%. Men with an educational attainment of bachelor's degree enjoy the highest average annual earnings of $80,635, while those with college or associate's degree education earn the least with $40,724. Women with an educational attainment of bachelor's degree earn the most with the average annual earnings of $57,596, while those with college or associate's degree education have the smallest earnings of $33,652.
| Educational Attainment | Male Income | Female Income |
| Less than High School | - | - |
| High School Diploma | - | - |
| College or Associate's Degree | $40,724 | $33,652 |
| Bachelor's Degree | $80,635 | $57,596 |
| Graduate Degree | $46,453 | $0 |
| Total | $45,357 | $36,206 |
Family Income in Breaux Bridge
Family Income Brackets in Breaux Bridge
According to the Breaux Bridge family income data, there are 320 families falling into the $100,000 to $149,999 income range, which is the most common income bracket and makes up 17.5% of all families. Conversely, the $200,000+ income bracket is the least frequent group with only 81 families (4.4%) belonging to this category.
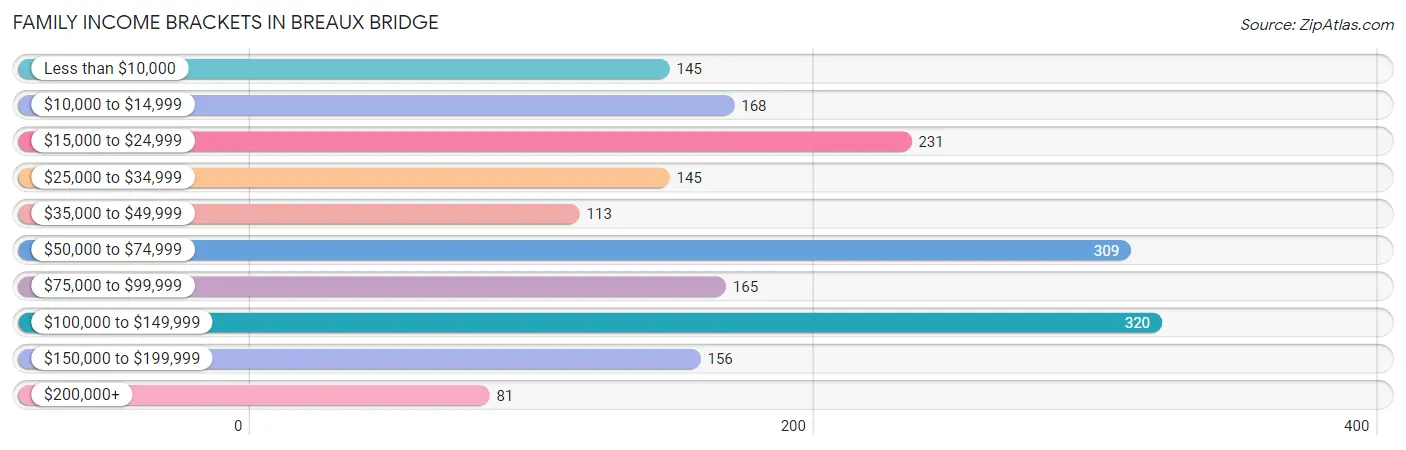
| Income Bracket | # Families | % Families |
| Less than $10,000 | 145 | 7.9% |
| $10,000 to $14,999 | 168 | 9.2% |
| $15,000 to $24,999 | 231 | 12.6% |
| $25,000 to $34,999 | 145 | 7.9% |
| $35,000 to $49,999 | 113 | 6.2% |
| $50,000 to $74,999 | 309 | 16.9% |
| $75,000 to $99,999 | 165 | 9.0% |
| $100,000 to $149,999 | 320 | 17.5% |
| $150,000 to $199,999 | 156 | 8.5% |
| $200,000+ | 81 | 4.4% |
Family Income by Famaliy Size in Breaux Bridge
4-person families (230 | 12.6%) account for the highest median family income in Breaux Bridge with $76,300 per family, while 2-person families (871 | 47.6%) have the highest median income of $24,688 per family member.
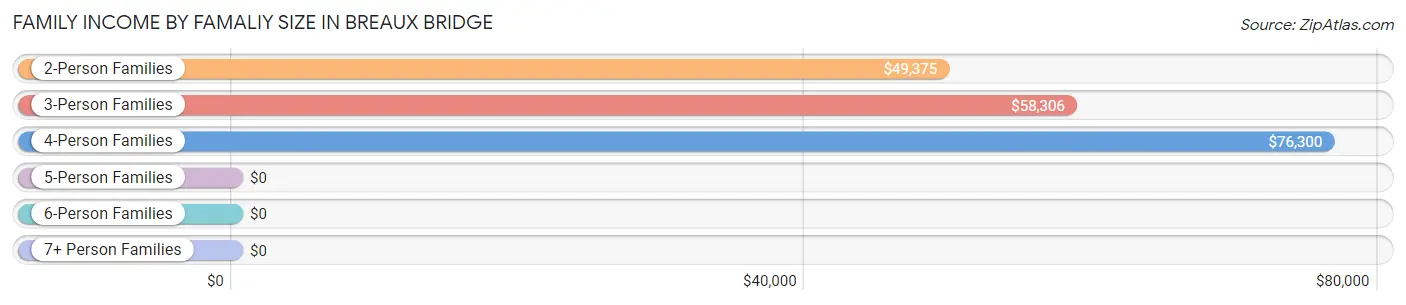
| Income Bracket | # Families | Median Income |
| 2-Person Families | 871 (47.6%) | $49,375 |
| 3-Person Families | 532 (29.1%) | $58,306 |
| 4-Person Families | 230 (12.6%) | $76,300 |
| 5-Person Families | 171 (9.3%) | $0 |
| 6-Person Families | 17 (0.9%) | $0 |
| 7+ Person Families | 9 (0.5%) | $0 |
| Total | 1,830 (100.0%) | $56,783 |
Family Income by Number of Earners in Breaux Bridge
The median family income in Breaux Bridge is $56,783, with families comprising 3+ earners (128) having the highest median family income of $160,625, while families with no earners (410) have the lowest median family income of $22,500, accounting for 7.0% and 22.4% of families, respectively.
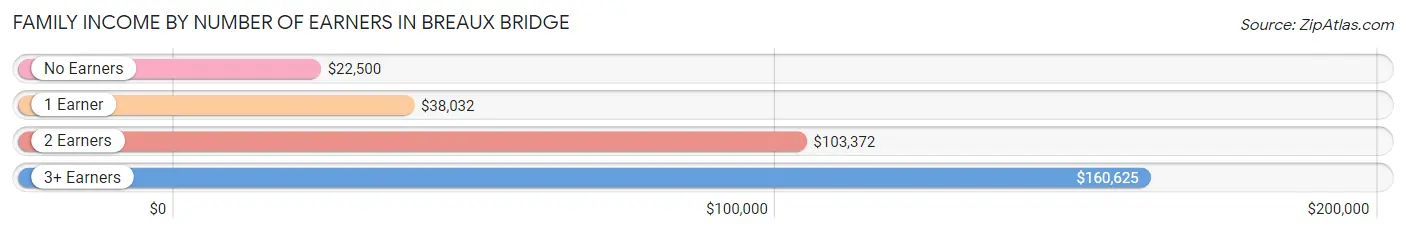
| Number of Earners | # Families | Median Income |
| No Earners | 410 (22.4%) | $22,500 |
| 1 Earner | 779 (42.6%) | $38,032 |
| 2 Earners | 513 (28.0%) | $103,372 |
| 3+ Earners | 128 (7.0%) | $160,625 |
| Total | 1,830 (100.0%) | $56,783 |
Household Income in Breaux Bridge
Household Income Brackets in Breaux Bridge
With 433 households falling in the category, the $50,000 to $74,999 income range is the most frequent in Breaux Bridge, accounting for 15.2% of all households. In contrast, only 80 households (2.8%) fall into the $200,000+ income bracket, making it the least populous group.
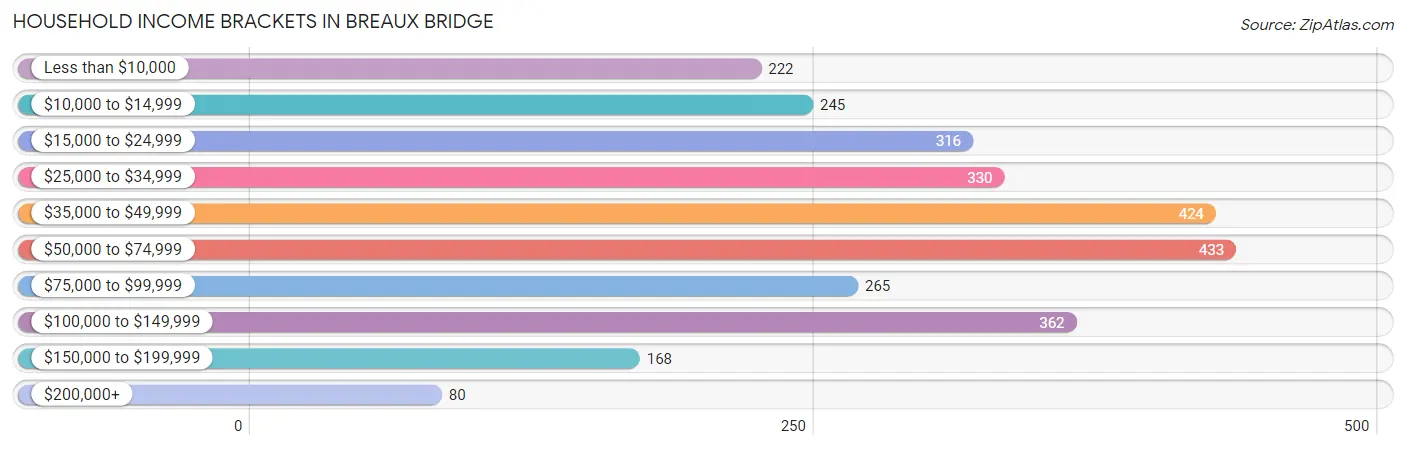
| Income Bracket | # Households | % Households |
| Less than $10,000 | 222 | 7.8% |
| $10,000 to $14,999 | 245 | 8.6% |
| $15,000 to $24,999 | 316 | 11.1% |
| $25,000 to $34,999 | 330 | 11.6% |
| $35,000 to $49,999 | 424 | 14.9% |
| $50,000 to $74,999 | 433 | 15.2% |
| $75,000 to $99,999 | 265 | 9.3% |
| $100,000 to $149,999 | 362 | 12.7% |
| $150,000 to $199,999 | 168 | 5.9% |
| $200,000+ | 80 | 2.8% |
Household Income by Householder Age in Breaux Bridge
The median household income in Breaux Bridge is $45,619, with the highest median household income of $56,429 found in the 45 to 64 years age bracket for the primary householder. A total of 1,006 households (35.3%) fall into this category. Meanwhile, the 15 to 24 years age bracket for the primary householder has the lowest median household income of $0, with 51 households (1.8%) in this group.
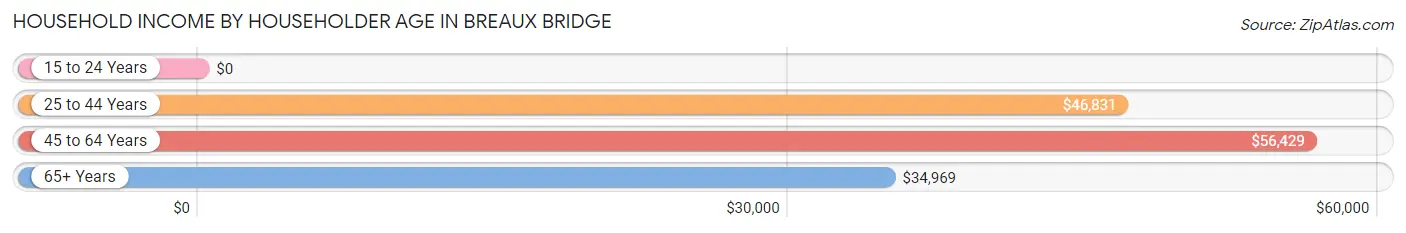
| Income Bracket | # Households | Median Income |
| 15 to 24 Years | 51 (1.8%) | $0 |
| 25 to 44 Years | 879 (30.9%) | $46,831 |
| 45 to 64 Years | 1,006 (35.3%) | $56,429 |
| 65+ Years | 911 (32.0%) | $34,969 |
| Total | 2,847 (100.0%) | $45,619 |
Poverty in Breaux Bridge
Income Below Poverty by Sex and Age in Breaux Bridge
With 32.6% poverty level for males and 28.7% for females among the residents of Breaux Bridge, 6 to 11 year old males and 5 year old females are the most vulnerable to poverty, with 147 males (74.2%) and 27 females (100.0%) in their respective age groups living below the poverty level.
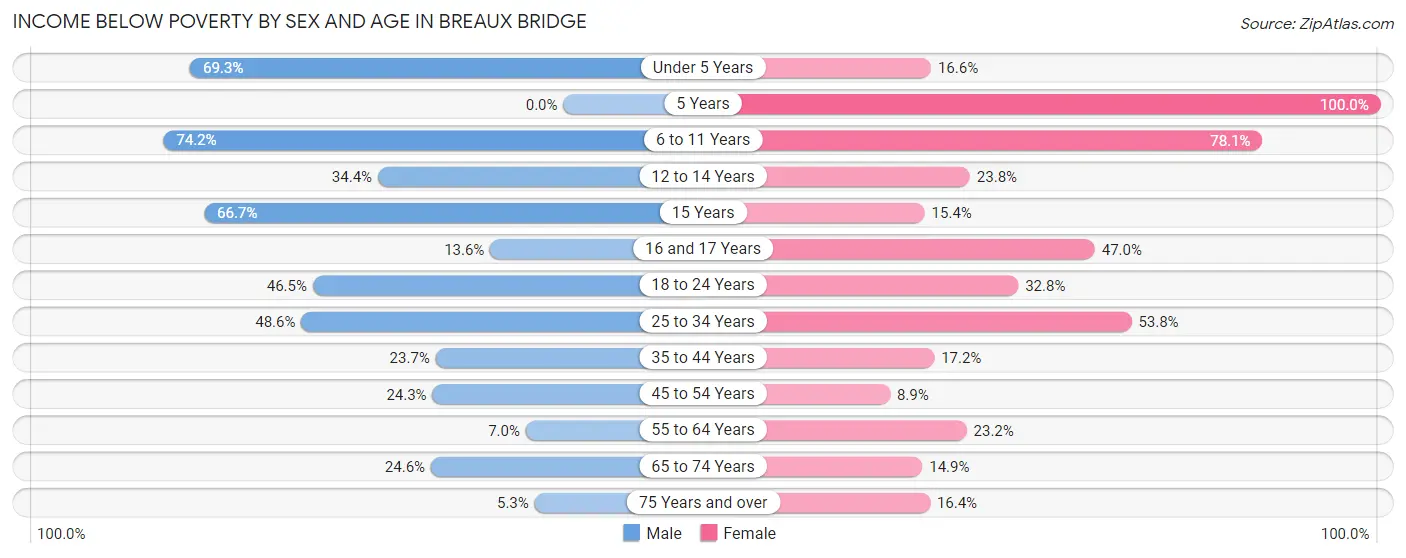
| Age Bracket | Male | Female |
| Under 5 Years | 176 (69.3%) | 25 (16.6%) |
| 5 Years | 0 (0.0%) | 27 (100.0%) |
| 6 to 11 Years | 147 (74.2%) | 235 (78.1%) |
| 12 to 14 Years | 95 (34.4%) | 44 (23.8%) |
| 15 Years | 22 (66.7%) | 18 (15.4%) |
| 16 and 17 Years | 11 (13.6%) | 54 (47.0%) |
| 18 to 24 Years | 166 (46.5%) | 113 (32.8%) |
| 25 to 34 Years | 232 (48.6%) | 200 (53.8%) |
| 35 to 44 Years | 105 (23.7%) | 83 (17.2%) |
| 45 to 54 Years | 95 (24.3%) | 38 (8.9%) |
| 55 to 64 Years | 34 (7.0%) | 98 (23.2%) |
| 65 to 74 Years | 87 (24.6%) | 62 (14.9%) |
| 75 Years and over | 12 (5.3%) | 45 (16.4%) |
| Total | 1,182 (32.6%) | 1,042 (28.7%) |
Income Above Poverty by Sex and Age in Breaux Bridge
According to the poverty statistics in Breaux Bridge, males aged 5 years and females aged 45 to 54 years are the age groups that are most secure financially, with 100.0% of males and 91.1% of females in these age groups living above the poverty line.
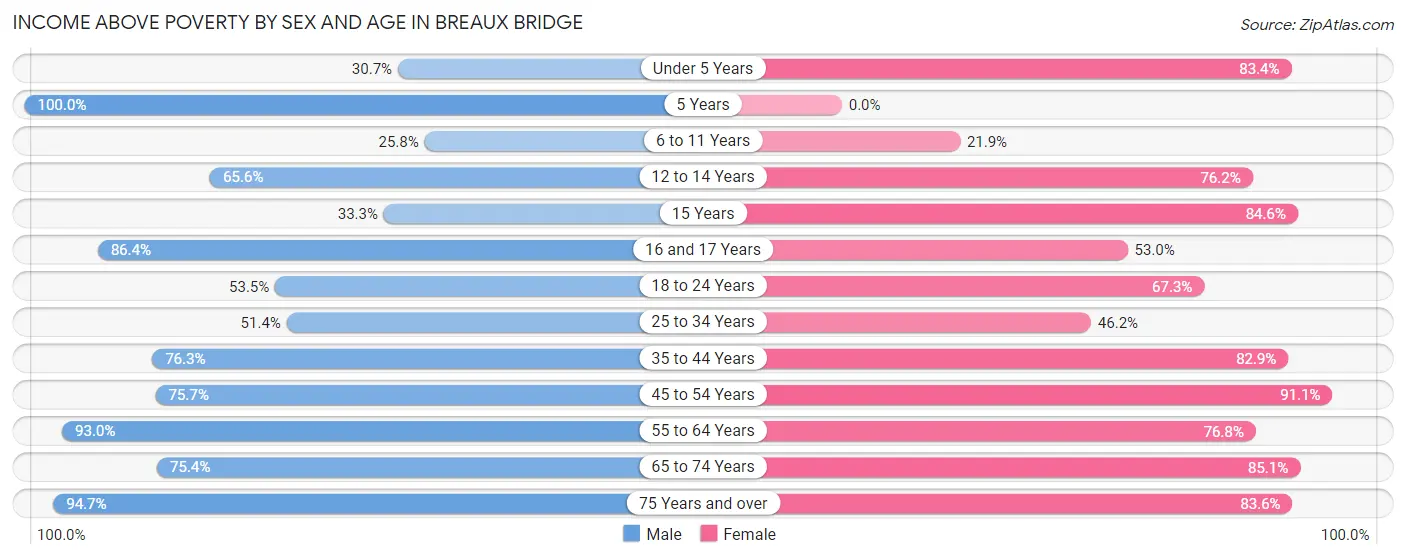
| Age Bracket | Male | Female |
| Under 5 Years | 78 (30.7%) | 126 (83.4%) |
| 5 Years | 44 (100.0%) | 0 (0.0%) |
| 6 to 11 Years | 51 (25.8%) | 66 (21.9%) |
| 12 to 14 Years | 181 (65.6%) | 141 (76.2%) |
| 15 Years | 11 (33.3%) | 99 (84.6%) |
| 16 and 17 Years | 70 (86.4%) | 61 (53.0%) |
| 18 to 24 Years | 191 (53.5%) | 232 (67.2%) |
| 25 to 34 Years | 245 (51.4%) | 172 (46.2%) |
| 35 to 44 Years | 338 (76.3%) | 401 (82.9%) |
| 45 to 54 Years | 296 (75.7%) | 387 (91.1%) |
| 55 to 64 Years | 454 (93.0%) | 325 (76.8%) |
| 65 to 74 Years | 267 (75.4%) | 353 (85.1%) |
| 75 Years and over | 213 (94.7%) | 230 (83.6%) |
| Total | 2,439 (67.4%) | 2,593 (71.3%) |
Income Below Poverty Among Married-Couple Families in Breaux Bridge
The poverty statistics for married-couple families in Breaux Bridge show that 10.1% or 116 of the total 1,147 families live below the poverty line. Families with 3 or 4 children have the highest poverty rate of 39.2%, comprising of 20 families. On the other hand, families with no children have the lowest poverty rate of 5.6%, which includes 37 families.
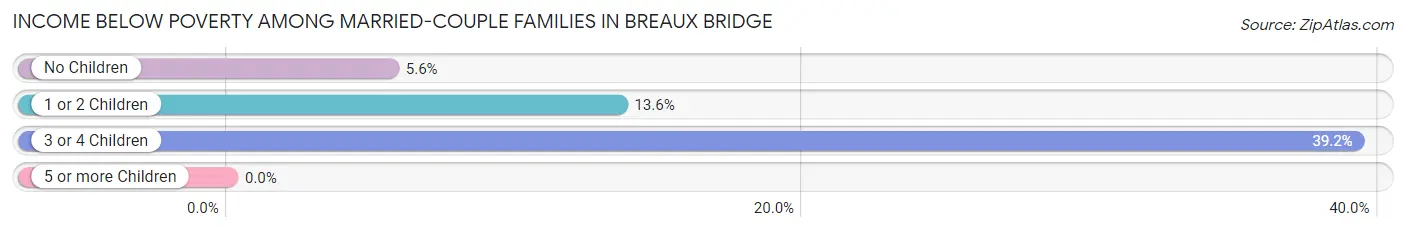
| Children | Above Poverty | Below Poverty |
| No Children | 624 (94.4%) | 37 (5.6%) |
| 1 or 2 Children | 376 (86.4%) | 59 (13.6%) |
| 3 or 4 Children | 31 (60.8%) | 20 (39.2%) |
| 5 or more Children | 0 (0.0%) | 0 (0.0%) |
| Total | 1,031 (89.9%) | 116 (10.1%) |
Income Below Poverty Among Single-Parent Households in Breaux Bridge
According to the poverty data in Breaux Bridge, 60.0% or 156 single-father households and 47.0% or 199 single-mother households are living below the poverty line. Among single-father households, those with 1 or 2 children have the highest poverty rate, with 89 households (87.3%) experiencing poverty. Likewise, among single-mother households, those with 3 or 4 children have the highest poverty rate, with 22 households (100.0%) falling below the poverty line.
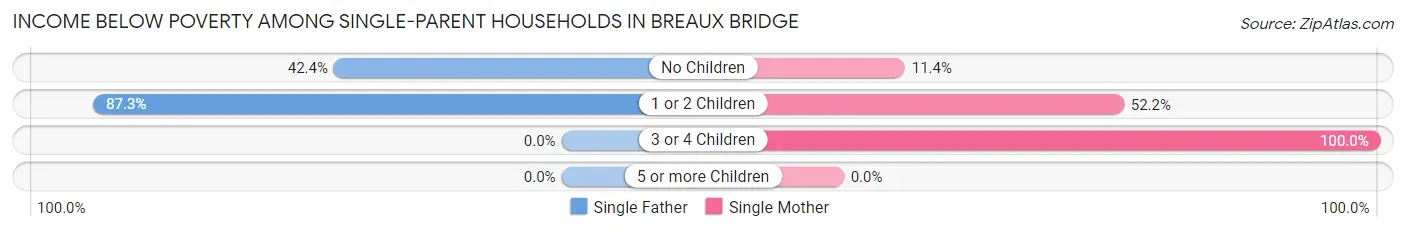
| Children | Single Father | Single Mother |
| No Children | 67 (42.4%) | 9 (11.4%) |
| 1 or 2 Children | 89 (87.3%) | 168 (52.2%) |
| 3 or 4 Children | 0 (0.0%) | 22 (100.0%) |
| 5 or more Children | 0 (0.0%) | 0 (0.0%) |
| Total | 156 (60.0%) | 199 (47.0%) |
Income Below Poverty Among Married-Couple vs Single-Parent Households in Breaux Bridge
The poverty data for Breaux Bridge shows that 116 of the married-couple family households (10.1%) and 355 of the single-parent households (52.0%) are living below the poverty level. Within the married-couple family households, those with 3 or 4 children have the highest poverty rate, with 20 households (39.2%) falling below the poverty line. Among the single-parent households, those with 3 or 4 children have the highest poverty rate, with 22 household (100.0%) living below poverty.
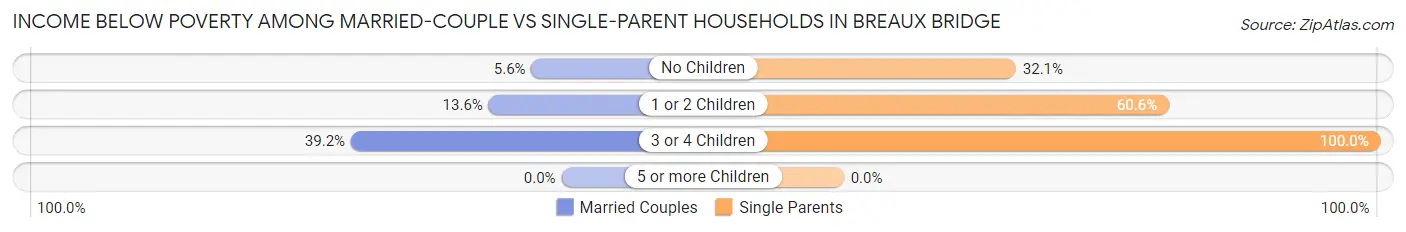
| Children | Married-Couple Families | Single-Parent Households |
| No Children | 37 (5.6%) | 76 (32.1%) |
| 1 or 2 Children | 59 (13.6%) | 257 (60.6%) |
| 3 or 4 Children | 20 (39.2%) | 22 (100.0%) |
| 5 or more Children | 0 (0.0%) | 0 (0.0%) |
| Total | 116 (10.1%) | 355 (52.0%) |
Race in Breaux Bridge
The most populous races in Breaux Bridge are White / Caucasian (3,920 | 52.0%), Black / African American (3,115 | 41.3%), and Two or more Races (302 | 4.0%).
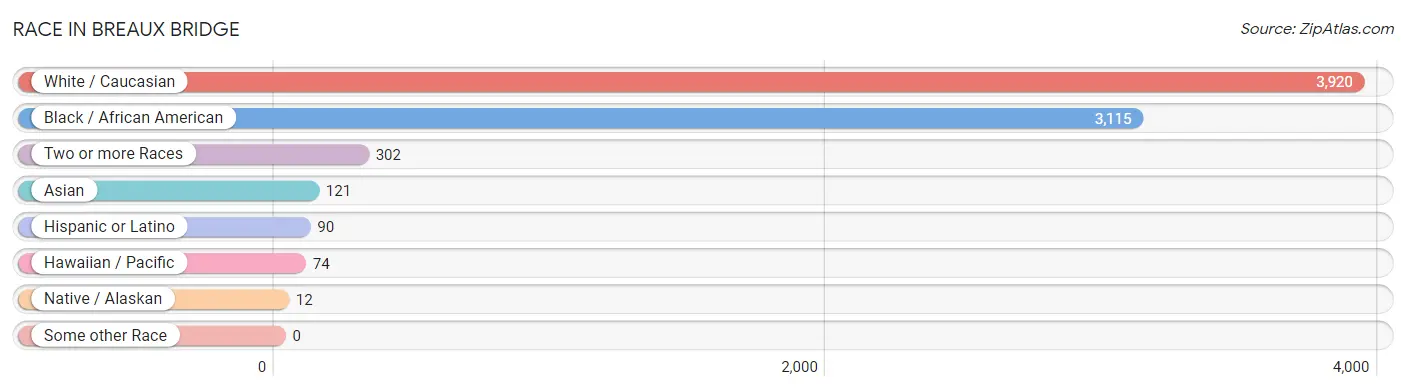
| Race | # Population | % Population |
| Asian | 121 | 1.6% |
| Black / African American | 3,115 | 41.3% |
| Hawaiian / Pacific | 74 | 1.0% |
| Hispanic or Latino | 90 | 1.2% |
| Native / Alaskan | 12 | 0.2% |
| White / Caucasian | 3,920 | 52.0% |
| Two or more Races | 302 | 4.0% |
| Some other Race | 0 | 0.0% |
| Total | 7,544 | 100.0% |
Ancestry in Breaux Bridge
The most populous ancestries reported in Breaux Bridge are French (1,232 | 16.3%), French Canadian (747 | 9.9%), American (365 | 4.8%), German (275 | 3.6%), and English (222 | 2.9%), together accounting for 37.7% of all Breaux Bridge residents.
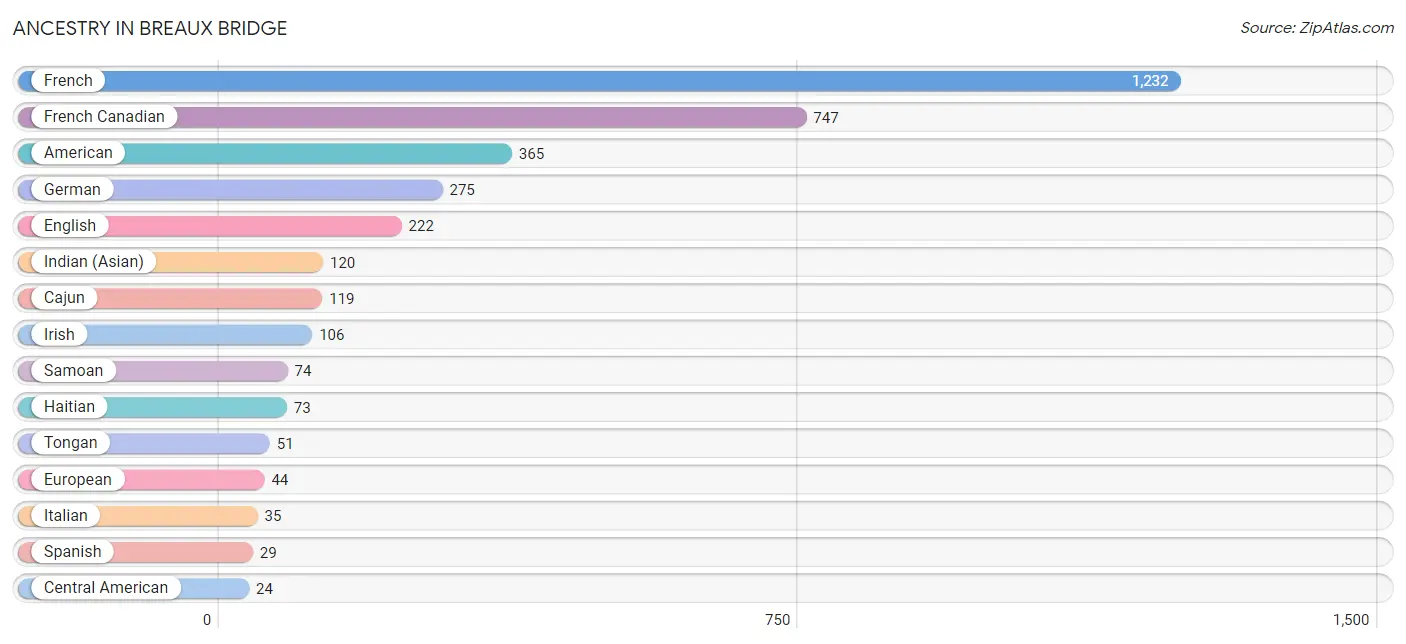
| Ancestry | # Population | % Population |
| American | 365 | 4.8% |
| Bulgarian | 5 | 0.1% |
| Burmese | 1 | 0.0% |
| Cajun | 119 | 1.6% |
| Canadian | 14 | 0.2% |
| Central American | 24 | 0.3% |
| Cherokee | 14 | 0.2% |
| Dutch | 9 | 0.1% |
| English | 222 | 2.9% |
| European | 44 | 0.6% |
| French | 1,232 | 16.3% |
| French Canadian | 747 | 9.9% |
| German | 275 | 3.6% |
| Haitian | 73 | 1.0% |
| Honduran | 24 | 0.3% |
| Indian (Asian) | 120 | 1.6% |
| Iranian | 5 | 0.1% |
| Irish | 106 | 1.4% |
| Italian | 35 | 0.5% |
| Mexican | 21 | 0.3% |
| Puerto Rican | 7 | 0.1% |
| Samoan | 74 | 1.0% |
| Scottish | 24 | 0.3% |
| Serbian | 8 | 0.1% |
| Spanish | 29 | 0.4% |
| Tongan | 51 | 0.7% | View All 26 Rows |
Immigrants in Breaux Bridge
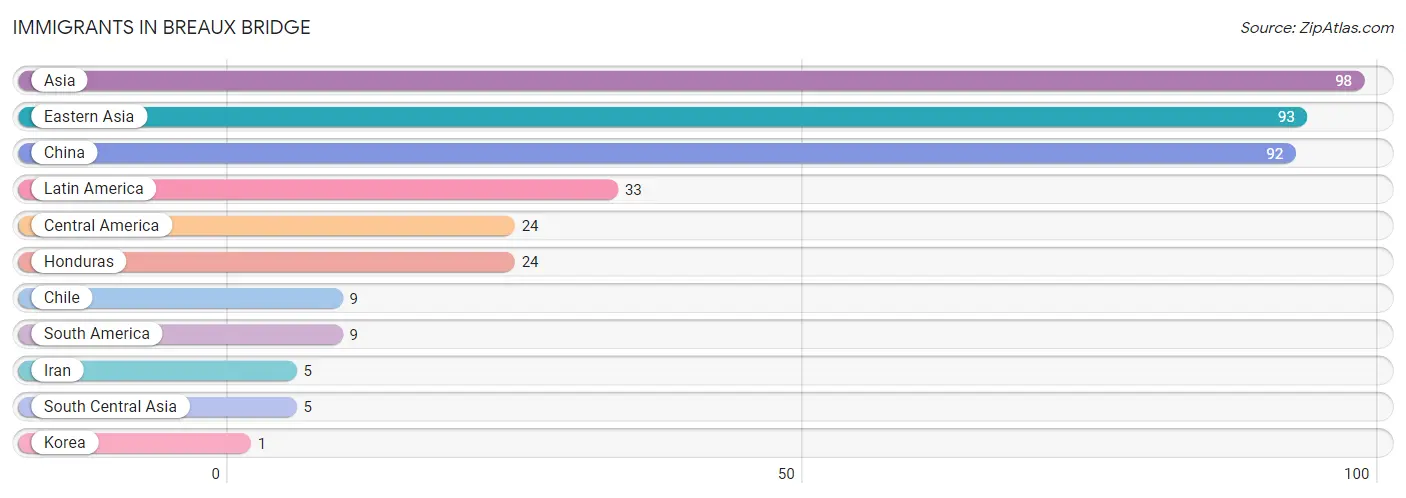
The most numerous immigrant groups reported in Breaux Bridge came from Asia (98 | 1.3%), Eastern Asia (93 | 1.2%), China (92 | 1.2%), Latin America (33 | 0.4%), and Central America (24 | 0.3%), together accounting for 4.5% of all Breaux Bridge residents.
| Immigration Origin | # Population | % Population |
| Asia | 98 | 1.3% |
| Central America | 24 | 0.3% |
| Chile | 9 | 0.1% |
| China | 92 | 1.2% |
| Eastern Asia | 93 | 1.2% |
| Honduras | 24 | 0.3% |
| Iran | 5 | 0.1% |
| Korea | 1 | 0.0% |
| Latin America | 33 | 0.4% |
| South America | 9 | 0.1% |
| South Central Asia | 5 | 0.1% | View All 11 Rows |
Sex and Age in Breaux Bridge
Sex and Age in Breaux Bridge
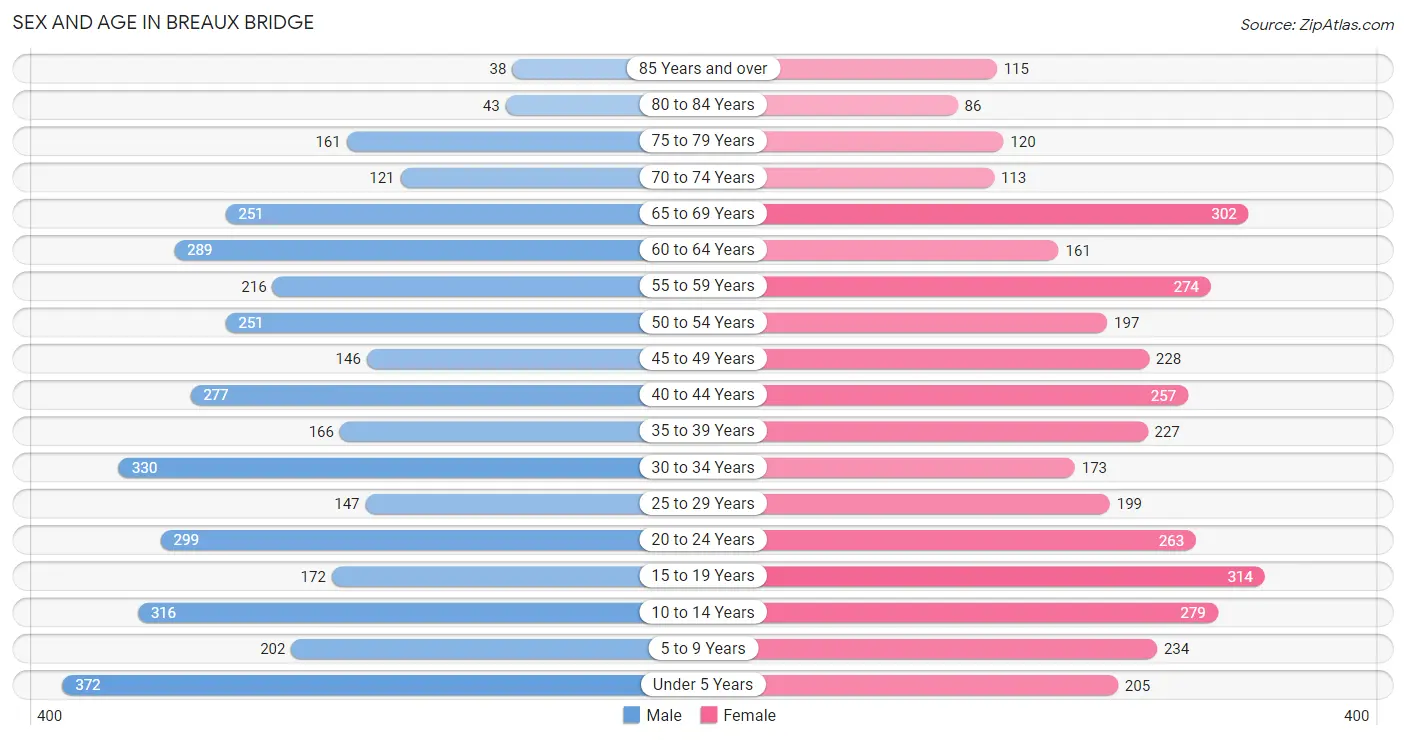
The most populous age groups in Breaux Bridge are Under 5 Years (372 | 9.8%) for men and 15 to 19 Years (314 | 8.4%) for women.
| Age Bracket | Male | Female |
| Under 5 Years | 372 (9.8%) | 205 (5.5%) |
| 5 to 9 Years | 202 (5.3%) | 234 (6.2%) |
| 10 to 14 Years | 316 (8.3%) | 279 (7.4%) |
| 15 to 19 Years | 172 (4.5%) | 314 (8.4%) |
| 20 to 24 Years | 299 (7.9%) | 263 (7.0%) |
| 25 to 29 Years | 147 (3.9%) | 199 (5.3%) |
| 30 to 34 Years | 330 (8.7%) | 173 (4.6%) |
| 35 to 39 Years | 166 (4.4%) | 227 (6.1%) |
| 40 to 44 Years | 277 (7.3%) | 257 (6.9%) |
| 45 to 49 Years | 146 (3.8%) | 228 (6.1%) |
| 50 to 54 Years | 251 (6.6%) | 197 (5.3%) |
| 55 to 59 Years | 216 (5.7%) | 274 (7.3%) |
| 60 to 64 Years | 289 (7.6%) | 161 (4.3%) |
| 65 to 69 Years | 251 (6.6%) | 302 (8.1%) |
| 70 to 74 Years | 121 (3.2%) | 113 (3.0%) |
| 75 to 79 Years | 161 (4.2%) | 120 (3.2%) |
| 80 to 84 Years | 43 (1.1%) | 86 (2.3%) |
| 85 Years and over | 38 (1.0%) | 115 (3.1%) |
| Total | 3,797 (100.0%) | 3,747 (100.0%) |
Families and Households in Breaux Bridge
Median Family Size in Breaux Bridge
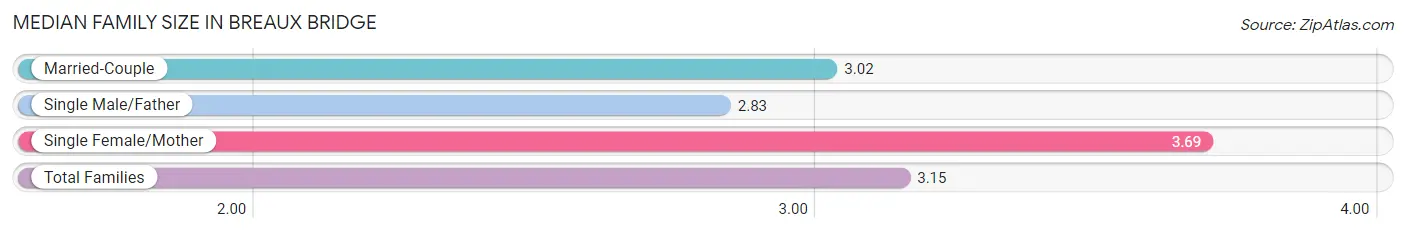
The median family size in Breaux Bridge is 3.15 persons per family, with single female/mother families (423 | 23.1%) accounting for the largest median family size of 3.69 persons per family. On the other hand, single male/father families (260 | 14.2%) represent the smallest median family size with 2.83 persons per family.
| Family Type | # Families | Family Size |
| Married-Couple | 1,147 (62.7%) | 3.02 |
| Single Male/Father | 260 (14.2%) | 2.83 |
| Single Female/Mother | 423 (23.1%) | 3.69 |
| Total Families | 1,830 (100.0%) | 3.15 |
Median Household Size in Breaux Bridge
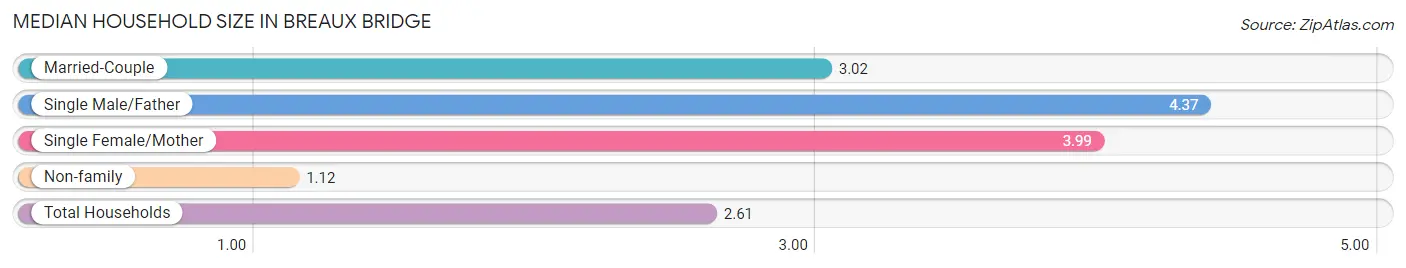
The median household size in Breaux Bridge is 2.61 persons per household, with single male/father households (260 | 9.1%) accounting for the largest median household size of 4.37 persons per household. non-family households (1,017 | 35.7%) represent the smallest median household size with 1.12 persons per household.
| Household Type | # Households | Household Size |
| Married-Couple | 1,147 (40.3%) | 3.02 |
| Single Male/Father | 260 (9.1%) | 4.37 |
| Single Female/Mother | 423 (14.9%) | 3.99 |
| Non-family | 1,017 (35.7%) | 1.12 |
| Total Households | 2,847 (100.0%) | 2.61 |
Household Size by Marriage Status in Breaux Bridge
Out of a total of 2,847 households in Breaux Bridge, 1,830 (64.3%) are family households, while 1,017 (35.7%) are nonfamily households. The most numerous type of family households are 2-person households, comprising 700, and the most common type of nonfamily households are 1-person households, comprising 913.
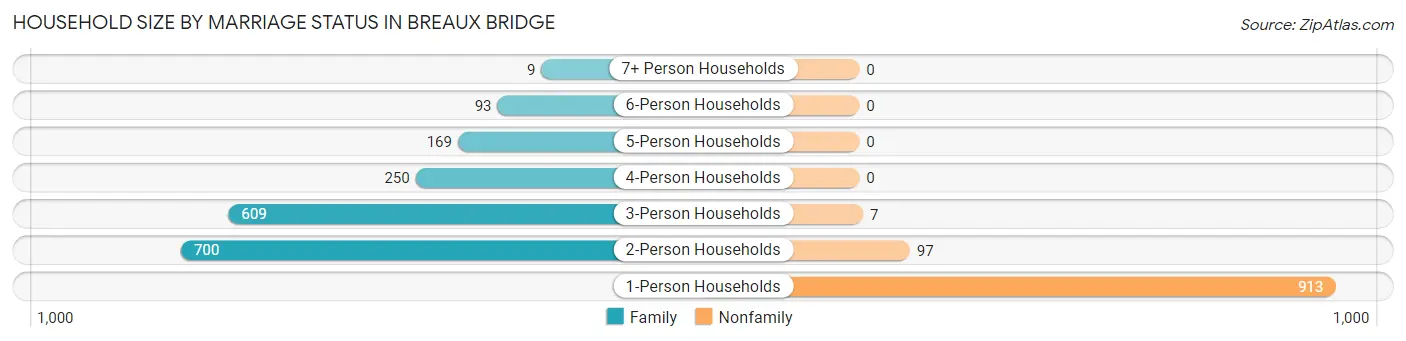
| Household Size | Family Households | Nonfamily Households |
| 1-Person Households | - | 913 (32.1%) |
| 2-Person Households | 700 (24.6%) | 97 (3.4%) |
| 3-Person Households | 609 (21.4%) | 7 (0.3%) |
| 4-Person Households | 250 (8.8%) | 0 (0.0%) |
| 5-Person Households | 169 (5.9%) | 0 (0.0%) |
| 6-Person Households | 93 (3.3%) | 0 (0.0%) |
| 7+ Person Households | 9 (0.3%) | 0 (0.0%) |
| Total | 1,830 (64.3%) | 1,017 (35.7%) |
Female Fertility in Breaux Bridge
Fertility by Age in Breaux Bridge
Average fertility rate in Breaux Bridge is 90.0 births per 1,000 women. Women in the age bracket of 20 to 34 years have the highest fertility rate with 181.0 births per 1,000 women. Women in the age bracket of 20 to 34 years acount for 76.2% of all women with births.
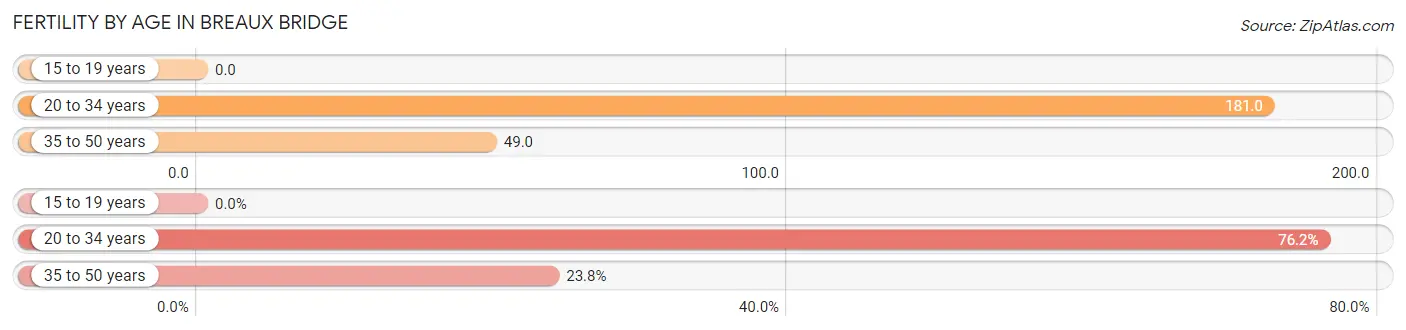
| Age Bracket | Women with Births | Births / 1,000 Women |
| 15 to 19 years | 0 (0.0%) | 0.0 |
| 20 to 34 years | 115 (76.2%) | 181.0 |
| 35 to 50 years | 36 (23.8%) | 49.0 |
| Total | 151 (100.0%) | 90.0 |
Fertility by Age by Marriage Status in Breaux Bridge
60.9% of women with births (151) in Breaux Bridge are married. The highest percentage of unmarried women with births falls into 20 to 34 years age bracket with 51.3% of them unmarried at the time of birth, while the lowest percentage of unmarried women with births belong to 35 to 50 years age bracket with 0.0% of them unmarried.
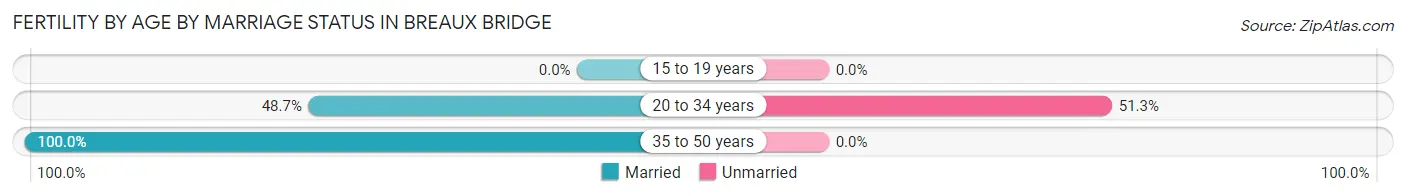
| Age Bracket | Married | Unmarried |
| 15 to 19 years | 0 (0.0%) | 0 (0.0%) |
| 20 to 34 years | 56 (48.7%) | 59 (51.3%) |
| 35 to 50 years | 36 (100.0%) | 0 (0.0%) |
| Total | 92 (60.9%) | 59 (39.1%) |
Fertility by Education in Breaux Bridge
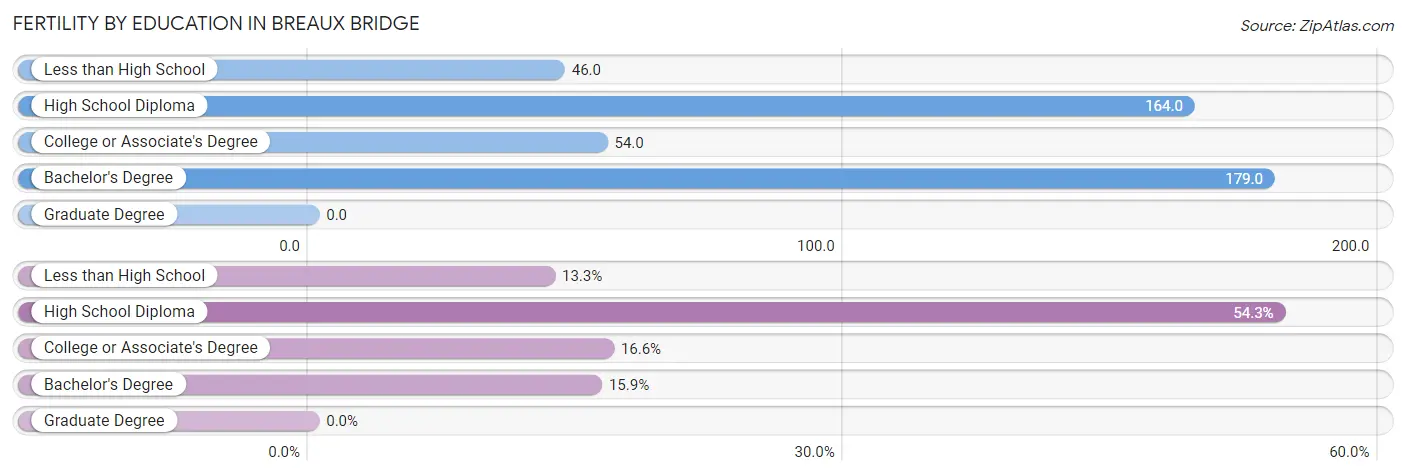
| Educational Attainment | Women with Births | Births / 1,000 Women |
| Less than High School | 20 (13.3%) | 46.0 |
| High School Diploma | 82 (54.3%) | 164.0 |
| College or Associate's Degree | 25 (16.6%) | 54.0 |
| Bachelor's Degree | 24 (15.9%) | 179.0 |
| Graduate Degree | 0 (0.0%) | 0.0 |
| Total | 151 (100.0%) | 90.0 |
Fertility by Education by Marriage Status in Breaux Bridge
39.1% of women with births in Breaux Bridge are unmarried. Women with the educational attainment of bachelor's degree are most likely to be married with 100.0% of them married at childbirth, while women with the educational attainment of less than high school are least likely to be married with 100.0% of them unmarried at childbirth.
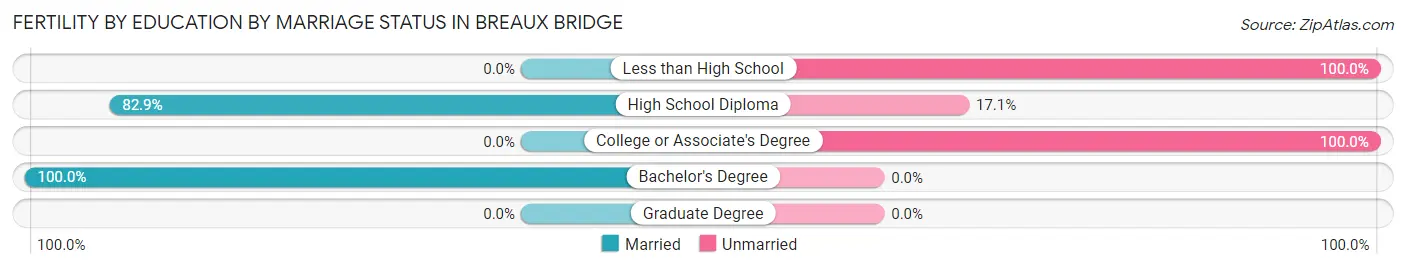
| Educational Attainment | Married | Unmarried |
| Less than High School | 0 (0.0%) | 20 (100.0%) |
| High School Diploma | 68 (82.9%) | 14 (17.1%) |
| College or Associate's Degree | 0 (0.0%) | 25 (100.0%) |
| Bachelor's Degree | 24 (100.0%) | 0 (0.0%) |
| Graduate Degree | 0 (0.0%) | 0 (0.0%) |
| Total | 92 (60.9%) | 59 (39.1%) |
Employment Characteristics in Breaux Bridge
Employment by Class of Employer in Breaux Bridge
Among the 2,867 employed individuals in Breaux Bridge, private company employees (2,063 | 72.0%), self-employed (not incorporated) (250 | 8.7%), and not-for-profit organizations (183 | 6.4%) make up the most common classes of employment.
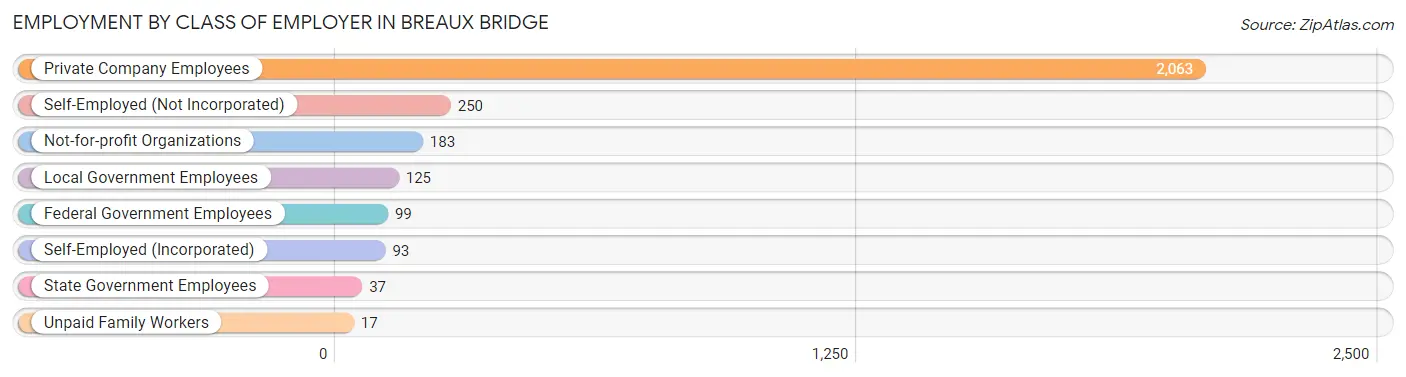
| Employer Class | # Employees | % Employees |
| Private Company Employees | 2,063 | 72.0% |
| Self-Employed (Incorporated) | 93 | 3.2% |
| Self-Employed (Not Incorporated) | 250 | 8.7% |
| Not-for-profit Organizations | 183 | 6.4% |
| Local Government Employees | 125 | 4.4% |
| State Government Employees | 37 | 1.3% |
| Federal Government Employees | 99 | 3.5% |
| Unpaid Family Workers | 17 | 0.6% |
| Total | 2,867 | 100.0% |
Employment Status by Age in Breaux Bridge
According to the labor force statistics for Breaux Bridge, out of the total population over 16 years of age (5,786), 55.7% or 3,223 individuals are in the labor force, with 9.6% or 309 of them unemployed. The age group with the highest labor force participation rate is 30 to 34 years, with 97.0% or 488 individuals in the labor force. Within the labor force, the 30 to 34 years age range has the highest percentage of unemployed individuals, with 32.0% or 156 of them being unemployed.
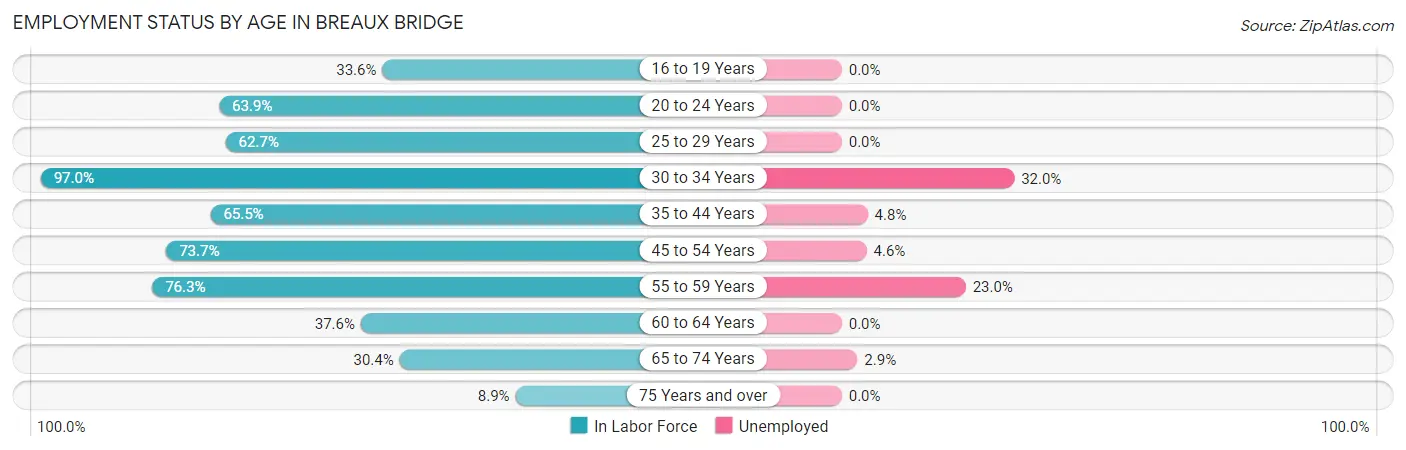
| Age Bracket | In Labor Force | Unemployed |
| 16 to 19 Years | 113 (33.6%) | 0 (0.0%) |
| 20 to 24 Years | 359 (63.9%) | 0 (0.0%) |
| 25 to 29 Years | 217 (62.7%) | 0 (0.0%) |
| 30 to 34 Years | 488 (97.0%) | 156 (32.0%) |
| 35 to 44 Years | 607 (65.5%) | 29 (4.8%) |
| 45 to 54 Years | 606 (73.7%) | 28 (4.6%) |
| 55 to 59 Years | 374 (76.3%) | 86 (23.0%) |
| 60 to 64 Years | 169 (37.6%) | 0 (0.0%) |
| 65 to 74 Years | 239 (30.4%) | 7 (2.9%) |
| 75 Years and over | 50 (8.9%) | 0 (0.0%) |
| Total | 3,223 (55.7%) | 309 (9.6%) |
Employment Status by Educational Attainment in Breaux Bridge
According to labor force statistics for Breaux Bridge, 69.6% of individuals (2,462) out of the total population between 25 and 64 years of age (3,538) are in the labor force, with 12.3% or 303 of them being unemployed. The group with the highest labor force participation rate are those with the educational attainment of bachelor's degree or higher, with 76.7% or 565 individuals in the labor force. Within the labor force, individuals with high school diploma education have the highest percentage of unemployment, with 26.1% or 270 of them being unemployed.
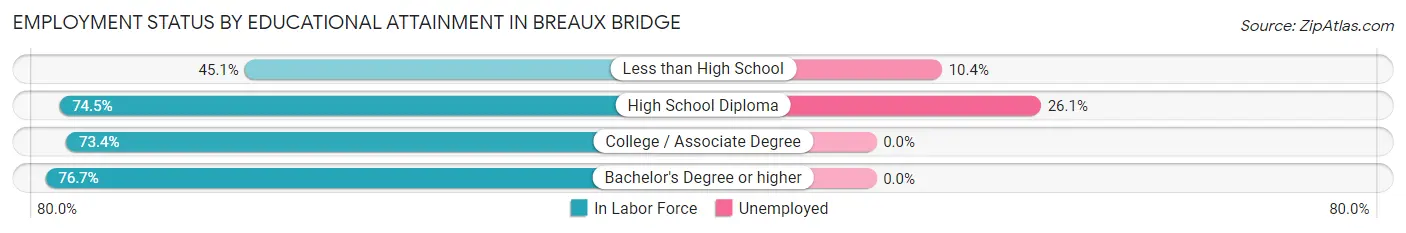
| Educational Attainment | In Labor Force | Unemployed |
| Less than High School | 279 (45.1%) | 64 (10.4%) |
| High School Diploma | 1,036 (74.5%) | 363 (26.1%) |
| College / Associate Degree | 581 (73.4%) | 0 (0.0%) |
| Bachelor's Degree or higher | 565 (76.7%) | 0 (0.0%) |
| Total | 2,462 (69.6%) | 435 (12.3%) |
Employment Occupations by Sex in Breaux Bridge
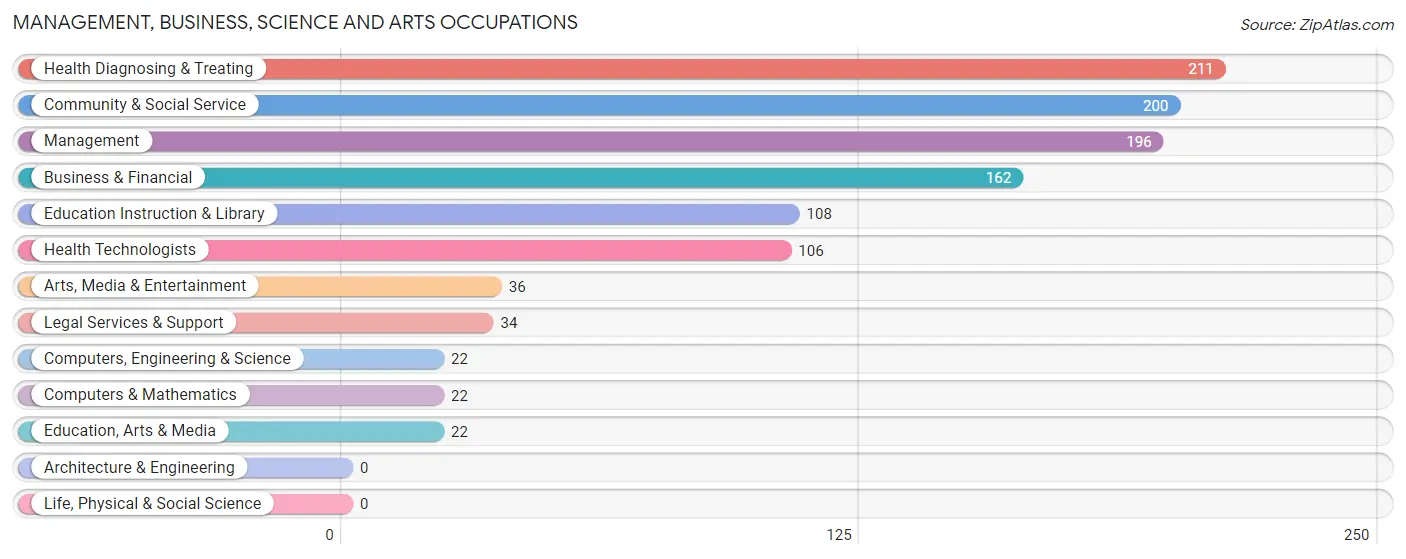
Management, Business, Science and Arts Occupations
The most common Management, Business, Science and Arts occupations in Breaux Bridge are Health Diagnosing & Treating (211 | 7.3%), Community & Social Service (200 | 6.9%), Management (196 | 6.8%), Business & Financial (162 | 5.6%), and Education Instruction & Library (108 | 3.7%).
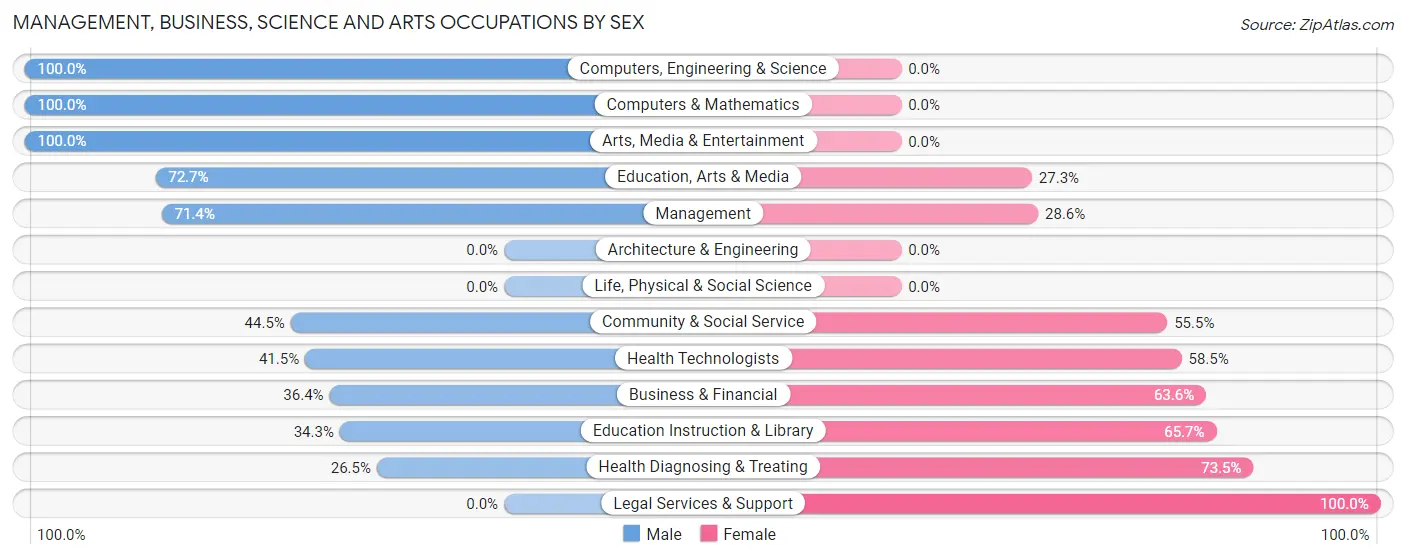
Management, Business, Science and Arts Occupations by Sex
Within the Management, Business, Science and Arts occupations in Breaux Bridge, the most male-oriented occupations are Computers, Engineering & Science (100.0%), Computers & Mathematics (100.0%), and Arts, Media & Entertainment (100.0%), while the most female-oriented occupations are Legal Services & Support (100.0%), Health Diagnosing & Treating (73.5%), and Education Instruction & Library (65.7%).
| Occupation | Male | Female |
| Management | 140 (71.4%) | 56 (28.6%) |
| Business & Financial | 59 (36.4%) | 103 (63.6%) |
| Computers, Engineering & Science | 22 (100.0%) | 0 (0.0%) |
| Computers & Mathematics | 22 (100.0%) | 0 (0.0%) |
| Architecture & Engineering | 0 (0.0%) | 0 (0.0%) |
| Life, Physical & Social Science | 0 (0.0%) | 0 (0.0%) |
| Community & Social Service | 89 (44.5%) | 111 (55.5%) |
| Education, Arts & Media | 16 (72.7%) | 6 (27.3%) |
| Legal Services & Support | 0 (0.0%) | 34 (100.0%) |
| Education Instruction & Library | 37 (34.3%) | 71 (65.7%) |
| Arts, Media & Entertainment | 36 (100.0%) | 0 (0.0%) |
| Health Diagnosing & Treating | 56 (26.5%) | 155 (73.5%) |
| Health Technologists | 44 (41.5%) | 62 (58.5%) |
| Total (Category) | 366 (46.3%) | 425 (53.7%) |
| Total (Overall) | 1,374 (47.5%) | 1,519 (52.5%) |
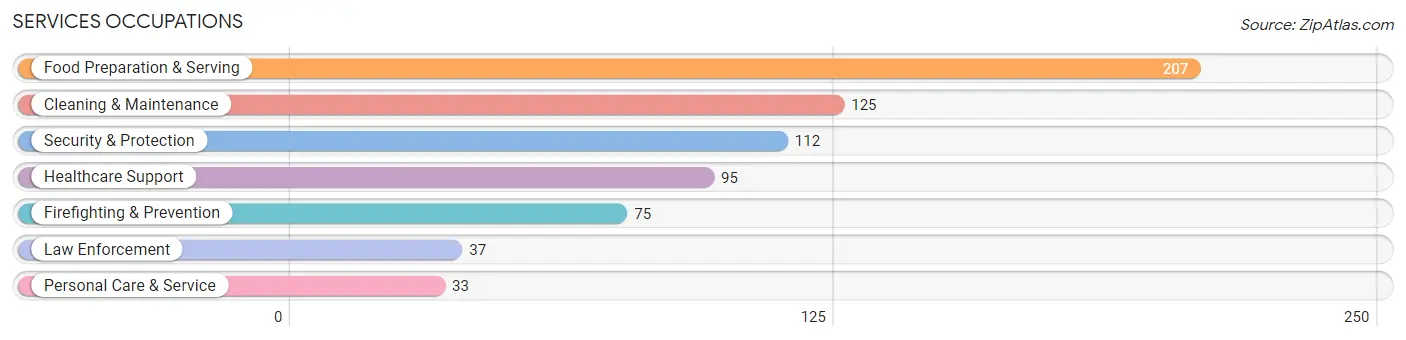
Services Occupations
The most common Services occupations in Breaux Bridge are Food Preparation & Serving (207 | 7.2%), Cleaning & Maintenance (125 | 4.3%), Security & Protection (112 | 3.9%), Healthcare Support (95 | 3.3%), and Firefighting & Prevention (75 | 2.6%).
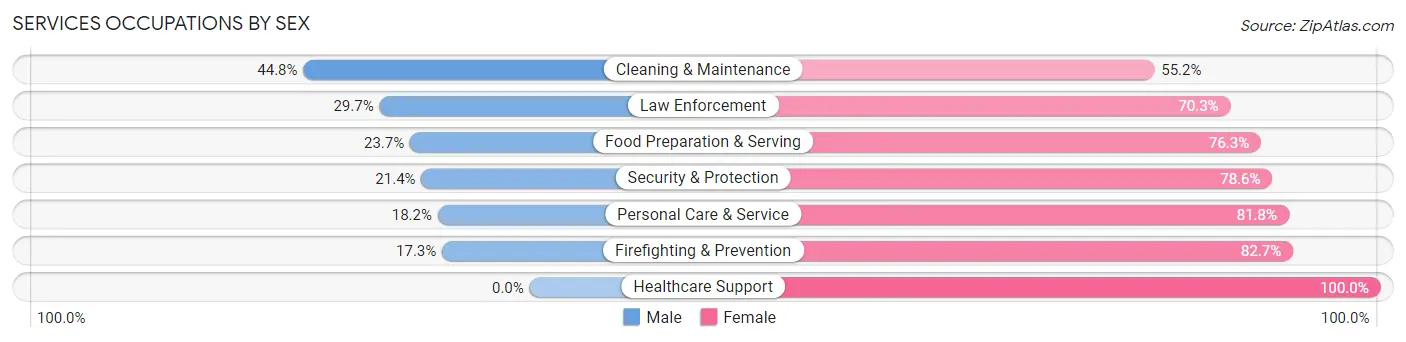
Services Occupations by Sex
Within the Services occupations in Breaux Bridge, the most male-oriented occupations are Cleaning & Maintenance (44.8%), Law Enforcement (29.7%), and Food Preparation & Serving (23.7%), while the most female-oriented occupations are Healthcare Support (100.0%), Firefighting & Prevention (82.7%), and Personal Care & Service (81.8%).
| Occupation | Male | Female |
| Healthcare Support | 0 (0.0%) | 95 (100.0%) |
| Security & Protection | 24 (21.4%) | 88 (78.6%) |
| Firefighting & Prevention | 13 (17.3%) | 62 (82.7%) |
| Law Enforcement | 11 (29.7%) | 26 (70.3%) |
| Food Preparation & Serving | 49 (23.7%) | 158 (76.3%) |
| Cleaning & Maintenance | 56 (44.8%) | 69 (55.2%) |
| Personal Care & Service | 6 (18.2%) | 27 (81.8%) |
| Total (Category) | 135 (23.6%) | 437 (76.4%) |
| Total (Overall) | 1,374 (47.5%) | 1,519 (52.5%) |
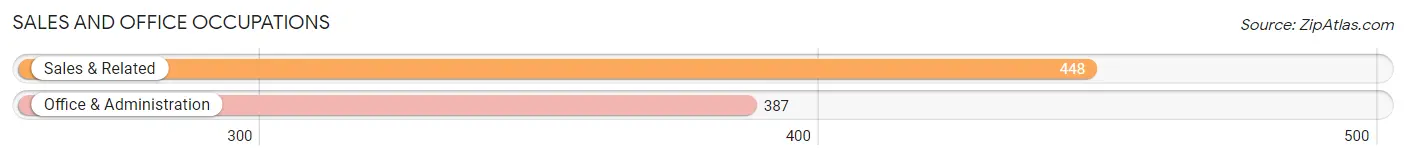
Sales and Office Occupations
The most common Sales and Office occupations in Breaux Bridge are Sales & Related (448 | 15.5%), and Office & Administration (387 | 13.4%).
Sales and Office Occupations by Sex
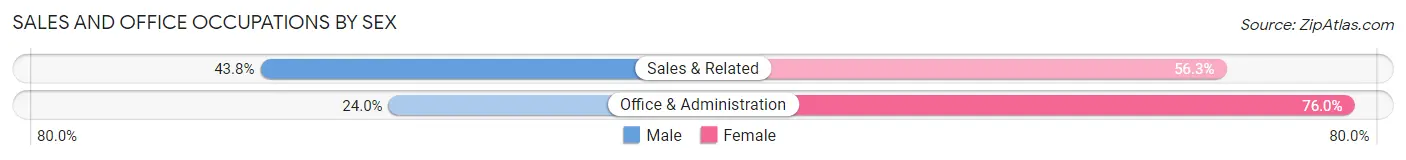
| Occupation | Male | Female |
| Sales & Related | 196 (43.8%) | 252 (56.2%) |
| Office & Administration | 93 (24.0%) | 294 (76.0%) |
| Total (Category) | 289 (34.6%) | 546 (65.4%) |
| Total (Overall) | 1,374 (47.5%) | 1,519 (52.5%) |
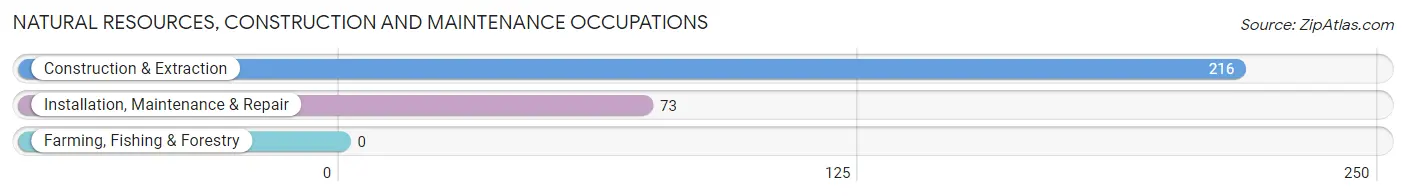
Natural Resources, Construction and Maintenance Occupations
The most common Natural Resources, Construction and Maintenance occupations in Breaux Bridge are Construction & Extraction (216 | 7.5%), and Installation, Maintenance & Repair (73 | 2.5%).
Natural Resources, Construction and Maintenance Occupations by Sex
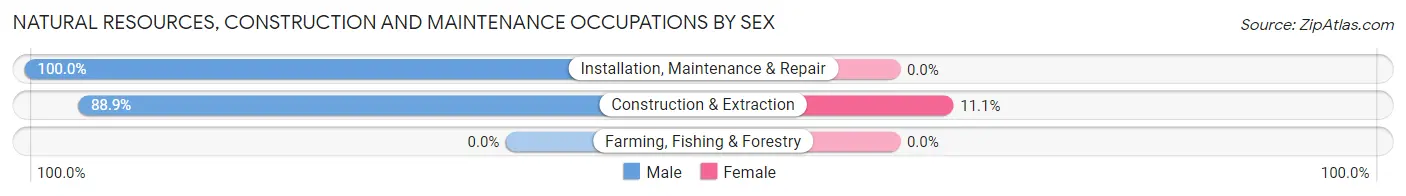
| Occupation | Male | Female |
| Farming, Fishing & Forestry | 0 (0.0%) | 0 (0.0%) |
| Construction & Extraction | 192 (88.9%) | 24 (11.1%) |
| Installation, Maintenance & Repair | 73 (100.0%) | 0 (0.0%) |
| Total (Category) | 265 (91.7%) | 24 (8.3%) |
| Total (Overall) | 1,374 (47.5%) | 1,519 (52.5%) |
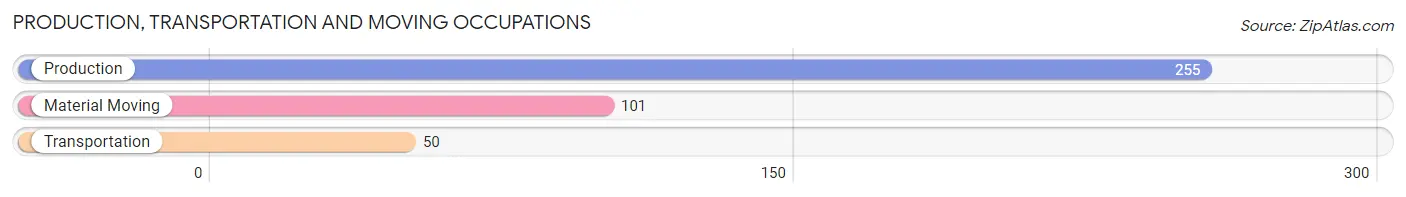
Production, Transportation and Moving Occupations
The most common Production, Transportation and Moving occupations in Breaux Bridge are Production (255 | 8.8%), Material Moving (101 | 3.5%), and Transportation (50 | 1.7%).
Production, Transportation and Moving Occupations by Sex
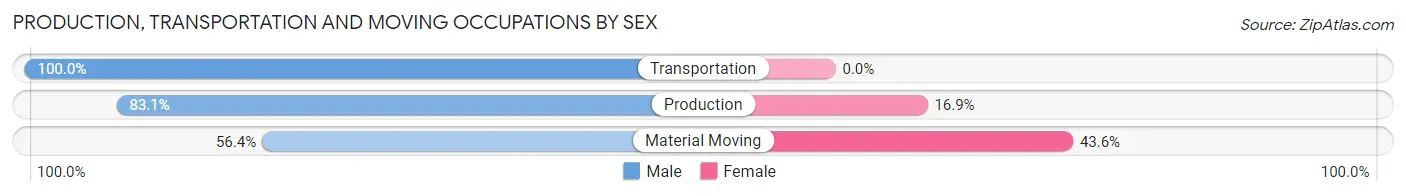
| Occupation | Male | Female |
| Production | 212 (83.1%) | 43 (16.9%) |
| Transportation | 50 (100.0%) | 0 (0.0%) |
| Material Moving | 57 (56.4%) | 44 (43.6%) |
| Total (Category) | 319 (78.6%) | 87 (21.4%) |
| Total (Overall) | 1,374 (47.5%) | 1,519 (52.5%) |
Employment Industries by Sex in Breaux Bridge
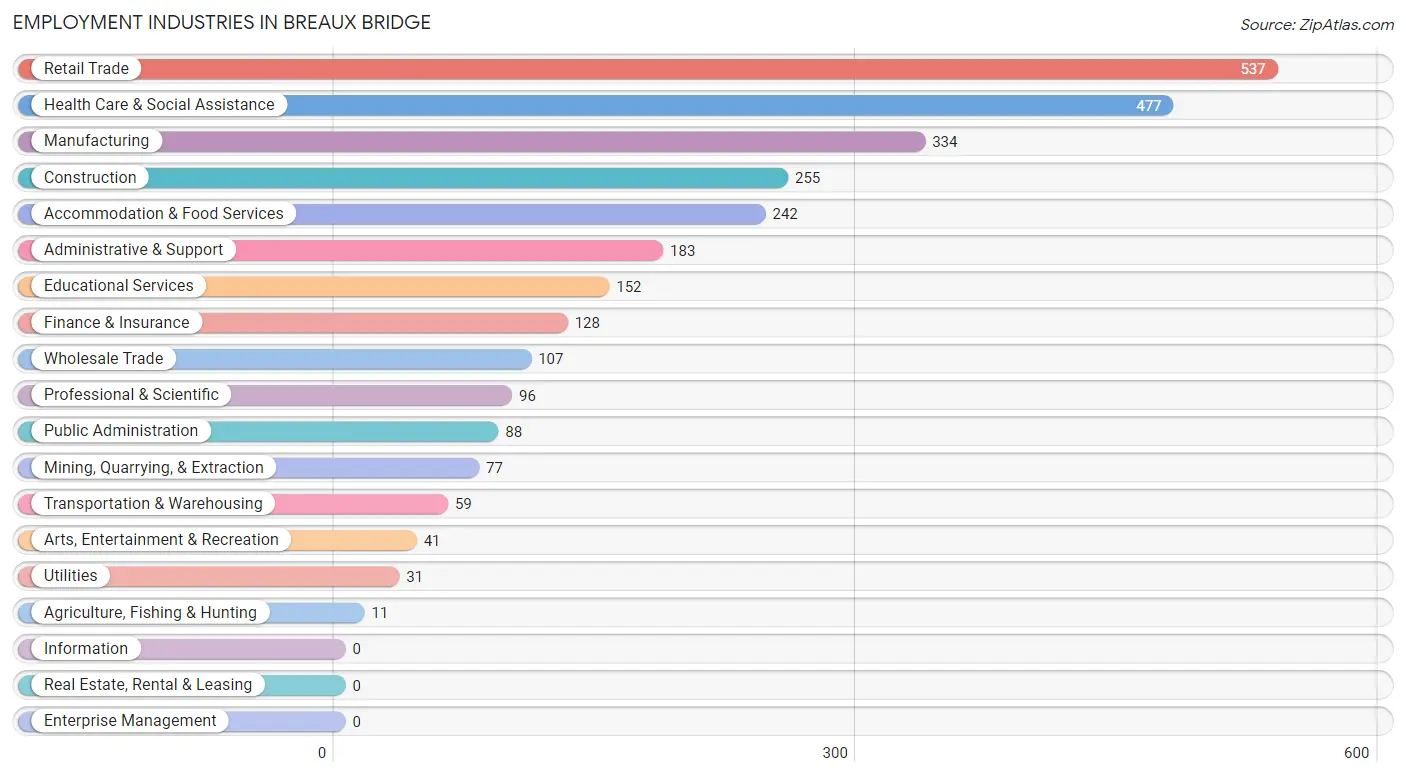
Employment Industries in Breaux Bridge
The major employment industries in Breaux Bridge include Retail Trade (537 | 18.6%), Health Care & Social Assistance (477 | 16.5%), Manufacturing (334 | 11.6%), Construction (255 | 8.8%), and Accommodation & Food Services (242 | 8.4%).
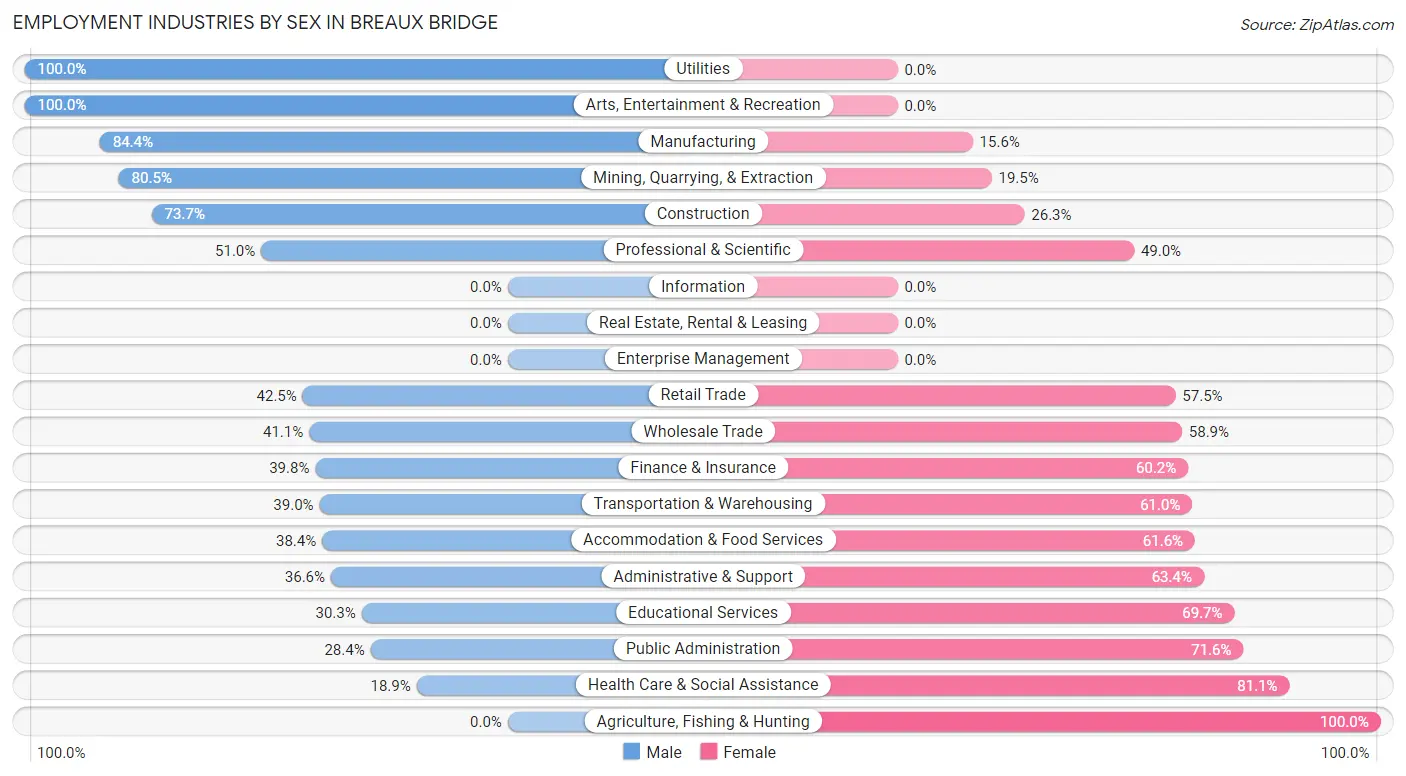
Employment Industries by Sex in Breaux Bridge
The Breaux Bridge industries that see more men than women are Utilities (100.0%), Arts, Entertainment & Recreation (100.0%), and Manufacturing (84.4%), whereas the industries that tend to have a higher number of women are Agriculture, Fishing & Hunting (100.0%), Health Care & Social Assistance (81.1%), and Public Administration (71.6%).
| Industry | Male | Female |
| Agriculture, Fishing & Hunting | 0 (0.0%) | 11 (100.0%) |
| Mining, Quarrying, & Extraction | 62 (80.5%) | 15 (19.5%) |
| Construction | 188 (73.7%) | 67 (26.3%) |
| Manufacturing | 282 (84.4%) | 52 (15.6%) |
| Wholesale Trade | 44 (41.1%) | 63 (58.9%) |
| Retail Trade | 228 (42.5%) | 309 (57.5%) |
| Transportation & Warehousing | 23 (39.0%) | 36 (61.0%) |
| Utilities | 31 (100.0%) | 0 (0.0%) |
| Information | 0 (0.0%) | 0 (0.0%) |
| Finance & Insurance | 51 (39.8%) | 77 (60.2%) |
| Real Estate, Rental & Leasing | 0 (0.0%) | 0 (0.0%) |
| Professional & Scientific | 49 (51.0%) | 47 (49.0%) |
| Enterprise Management | 0 (0.0%) | 0 (0.0%) |
| Administrative & Support | 67 (36.6%) | 116 (63.4%) |
| Educational Services | 46 (30.3%) | 106 (69.7%) |
| Health Care & Social Assistance | 90 (18.9%) | 387 (81.1%) |
| Arts, Entertainment & Recreation | 41 (100.0%) | 0 (0.0%) |
| Accommodation & Food Services | 93 (38.4%) | 149 (61.6%) |
| Public Administration | 25 (28.4%) | 63 (71.6%) |
| Total | 1,374 (47.5%) | 1,519 (52.5%) |
Education in Breaux Bridge
School Enrollment in Breaux Bridge
The most common levels of schooling among the 1,777 students in Breaux Bridge are high school (612 | 34.4%), middle school (390 | 22.0%), and elementary school (380 | 21.4%).
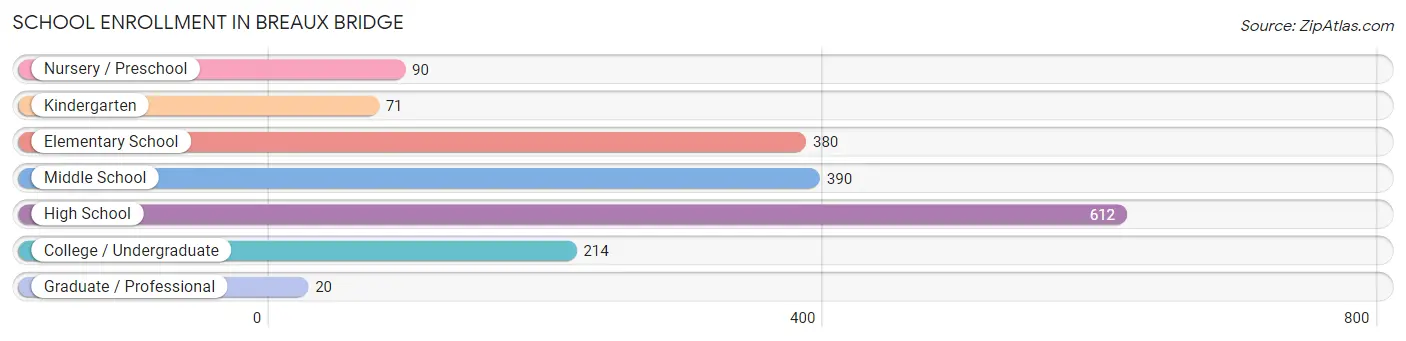
| School Level | # Students | % Students |
| Nursery / Preschool | 90 | 5.1% |
| Kindergarten | 71 | 4.0% |
| Elementary School | 380 | 21.4% |
| Middle School | 390 | 22.0% |
| High School | 612 | 34.4% |
| College / Undergraduate | 214 | 12.0% |
| Graduate / Professional | 20 | 1.1% |
| Total | 1,777 | 100.0% |
School Enrollment by Age by Funding Source in Breaux Bridge
Out of a total of 1,777 students who are enrolled in schools in Breaux Bridge, 512 (28.8%) attend a private institution, while the remaining 1,265 (71.2%) are enrolled in public schools. The age group of 35 years and over has the highest likelihood of being enrolled in private schools, with 40 (85.1% in the age bracket) enrolled. Conversely, the age group of 20 to 24 year olds has the lowest likelihood of being enrolled in a private school, with 125 (100.0% in the age bracket) attending a public institution.
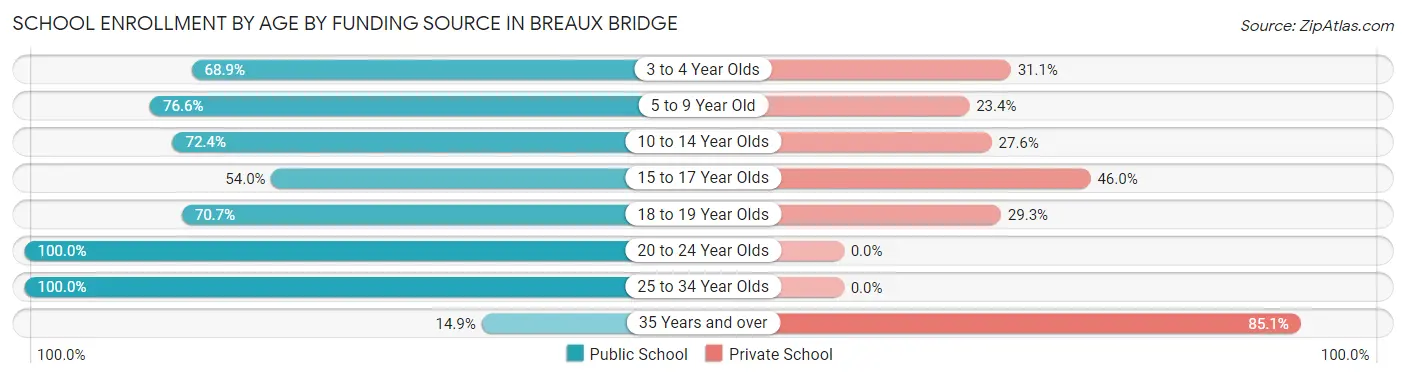
| Age Bracket | Public School | Private School |
| 3 to 4 Year Olds | 62 (68.9%) | 28 (31.1%) |
| 5 to 9 Year Old | 334 (76.6%) | 102 (23.4%) |
| 10 to 14 Year Olds | 431 (72.4%) | 164 (27.6%) |
| 15 to 17 Year Olds | 161 (54.0%) | 137 (46.0%) |
| 18 to 19 Year Olds | 99 (70.7%) | 41 (29.3%) |
| 20 to 24 Year Olds | 125 (100.0%) | 0 (0.0%) |
| 25 to 34 Year Olds | 46 (100.0%) | 0 (0.0%) |
| 35 Years and over | 7 (14.9%) | 40 (85.1%) |
| Total | 1,265 (71.2%) | 512 (28.8%) |
Educational Attainment by Field of Study in Breaux Bridge
Business (233 | 23.9%), education (182 | 18.6%), science & technology (93 | 9.5%), arts & humanities (91 | 9.3%), and liberal arts & history (89 | 9.1%) are the most common fields of study among 976 individuals in Breaux Bridge who have obtained a bachelor's degree or higher.
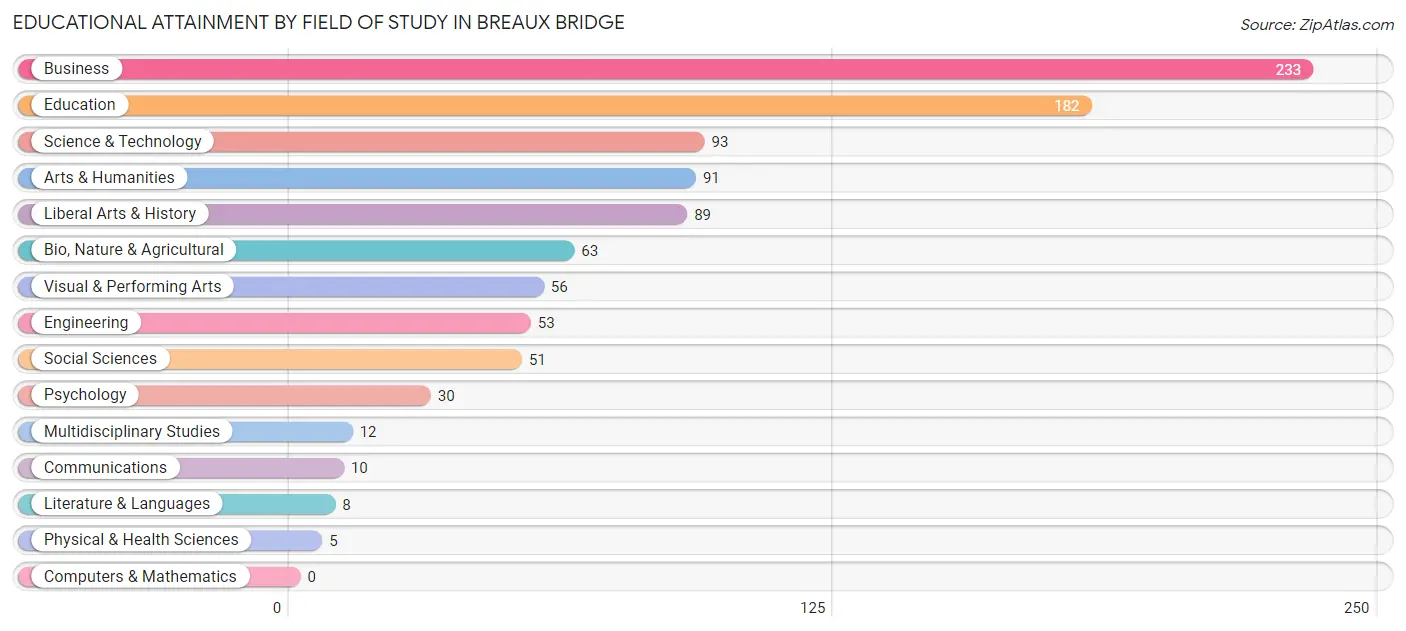
| Field of Study | # Graduates | % Graduates |
| Computers & Mathematics | 0 | 0.0% |
| Bio, Nature & Agricultural | 63 | 6.5% |
| Physical & Health Sciences | 5 | 0.5% |
| Psychology | 30 | 3.1% |
| Social Sciences | 51 | 5.2% |
| Engineering | 53 | 5.4% |
| Multidisciplinary Studies | 12 | 1.2% |
| Science & Technology | 93 | 9.5% |
| Business | 233 | 23.9% |
| Education | 182 | 18.6% |
| Literature & Languages | 8 | 0.8% |
| Liberal Arts & History | 89 | 9.1% |
| Visual & Performing Arts | 56 | 5.7% |
| Communications | 10 | 1.0% |
| Arts & Humanities | 91 | 9.3% |
| Total | 976 | 100.0% |
Transportation & Commute in Breaux Bridge
Vehicle Availability by Sex in Breaux Bridge
The most prevalent vehicle ownership categories in Breaux Bridge are males with 2 vehicles (612, accounting for 44.7%) and females with 2 vehicles (581, making up 40.8%).
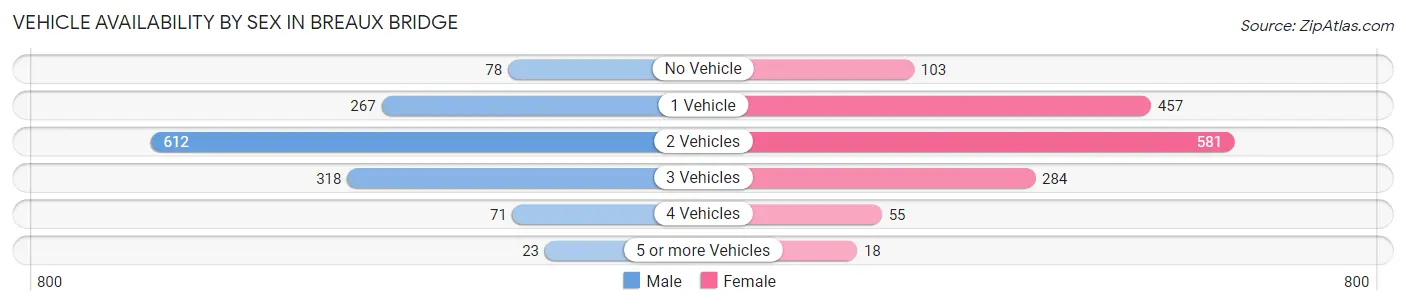
| Vehicles Available | Male | Female |
| No Vehicle | 78 (5.7%) | 103 (6.9%) |
| 1 Vehicle | 267 (19.5%) | 457 (30.5%) |
| 2 Vehicles | 612 (44.7%) | 581 (38.8%) |
| 3 Vehicles | 318 (23.2%) | 284 (19.0%) |
| 4 Vehicles | 71 (5.2%) | 55 (3.7%) |
| 5 or more Vehicles | 23 (1.7%) | 18 (1.2%) |
| Total | 1,369 (100.0%) | 1,498 (100.0%) |
Commute Time in Breaux Bridge
The most frequently occuring commute durations in Breaux Bridge are 30 to 34 minutes (483 commuters, 17.8%), 10 to 14 minutes (404 commuters, 14.9%), and 15 to 19 minutes (342 commuters, 12.6%).
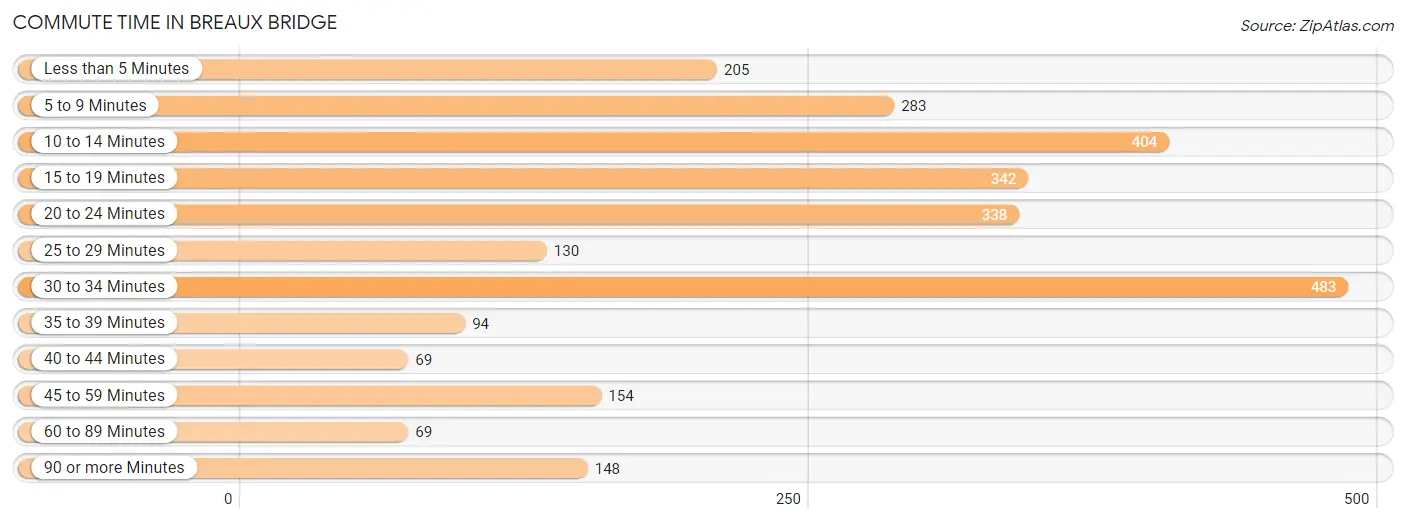
| Commute Time | # Commuters | % Commuters |
| Less than 5 Minutes | 205 | 7.5% |
| 5 to 9 Minutes | 283 | 10.4% |
| 10 to 14 Minutes | 404 | 14.9% |
| 15 to 19 Minutes | 342 | 12.6% |
| 20 to 24 Minutes | 338 | 12.4% |
| 25 to 29 Minutes | 130 | 4.8% |
| 30 to 34 Minutes | 483 | 17.8% |
| 35 to 39 Minutes | 94 | 3.5% |
| 40 to 44 Minutes | 69 | 2.5% |
| 45 to 59 Minutes | 154 | 5.7% |
| 60 to 89 Minutes | 69 | 2.5% |
| 90 or more Minutes | 148 | 5.4% |
Commute Time by Sex in Breaux Bridge
The most common commute times in Breaux Bridge are 10 to 14 minutes (228 commuters, 17.1%) for males and 30 to 34 minutes (331 commuters, 23.9%) for females.
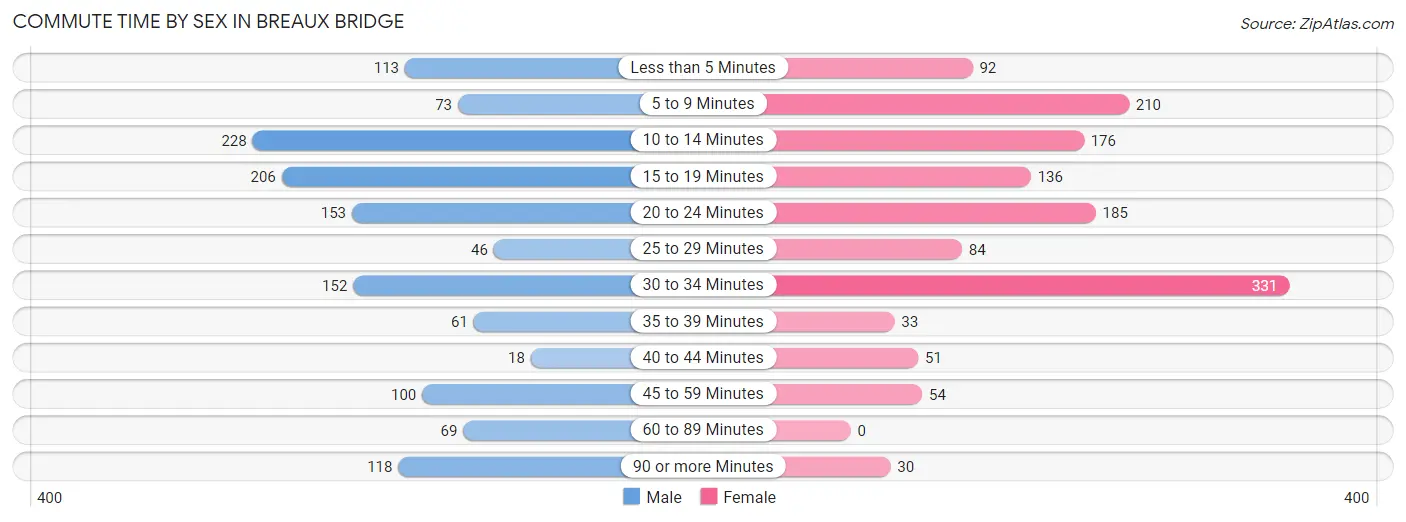
| Commute Time | Male | Female |
| Less than 5 Minutes | 113 (8.5%) | 92 (6.7%) |
| 5 to 9 Minutes | 73 (5.5%) | 210 (15.2%) |
| 10 to 14 Minutes | 228 (17.1%) | 176 (12.7%) |
| 15 to 19 Minutes | 206 (15.4%) | 136 (9.8%) |
| 20 to 24 Minutes | 153 (11.4%) | 185 (13.4%) |
| 25 to 29 Minutes | 46 (3.4%) | 84 (6.1%) |
| 30 to 34 Minutes | 152 (11.4%) | 331 (23.9%) |
| 35 to 39 Minutes | 61 (4.6%) | 33 (2.4%) |
| 40 to 44 Minutes | 18 (1.3%) | 51 (3.7%) |
| 45 to 59 Minutes | 100 (7.5%) | 54 (3.9%) |
| 60 to 89 Minutes | 69 (5.2%) | 0 (0.0%) |
| 90 or more Minutes | 118 (8.8%) | 30 (2.2%) |
Time of Departure to Work by Sex in Breaux Bridge
The most frequent times of departure to work in Breaux Bridge are 7:00 AM to 7:29 AM (469, 35.1%) for males and 6:00 AM to 6:29 AM (258, 18.7%) for females.
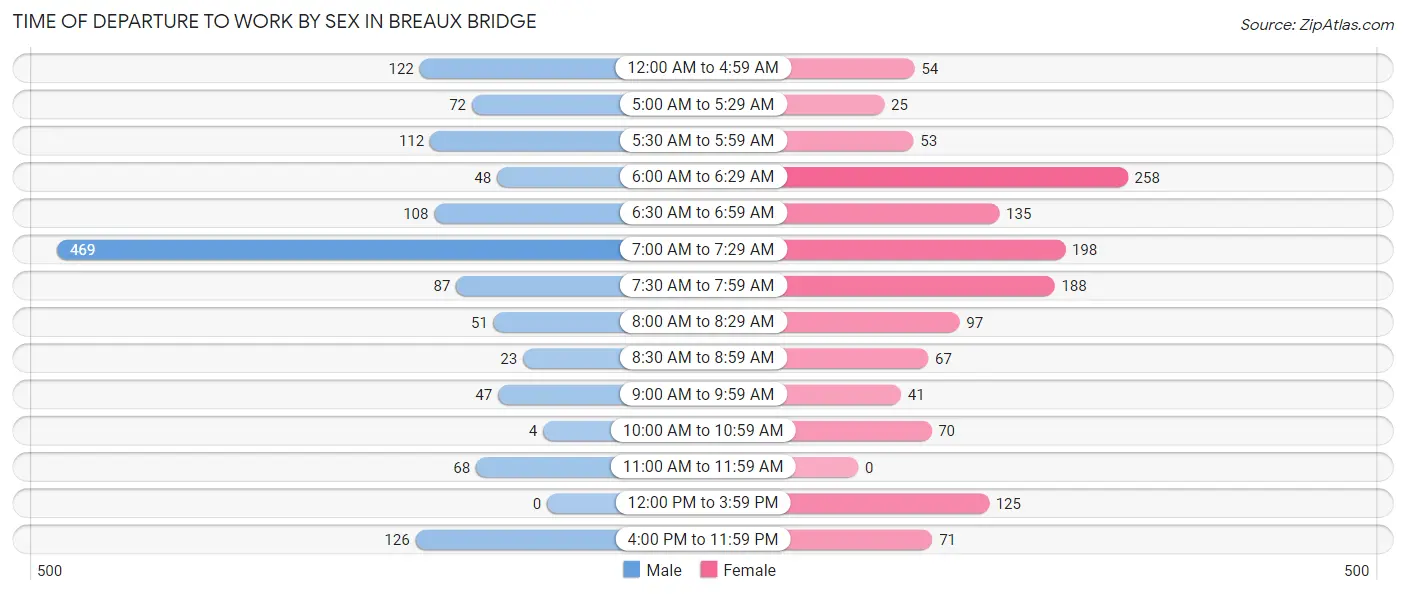
| Time of Departure | Male | Female |
| 12:00 AM to 4:59 AM | 122 (9.1%) | 54 (3.9%) |
| 5:00 AM to 5:29 AM | 72 (5.4%) | 25 (1.8%) |
| 5:30 AM to 5:59 AM | 112 (8.4%) | 53 (3.8%) |
| 6:00 AM to 6:29 AM | 48 (3.6%) | 258 (18.7%) |
| 6:30 AM to 6:59 AM | 108 (8.1%) | 135 (9.8%) |
| 7:00 AM to 7:29 AM | 469 (35.1%) | 198 (14.3%) |
| 7:30 AM to 7:59 AM | 87 (6.5%) | 188 (13.6%) |
| 8:00 AM to 8:29 AM | 51 (3.8%) | 97 (7.0%) |
| 8:30 AM to 8:59 AM | 23 (1.7%) | 67 (4.9%) |
| 9:00 AM to 9:59 AM | 47 (3.5%) | 41 (3.0%) |
| 10:00 AM to 10:59 AM | 4 (0.3%) | 70 (5.1%) |
| 11:00 AM to 11:59 AM | 68 (5.1%) | 0 (0.0%) |
| 12:00 PM to 3:59 PM | 0 (0.0%) | 125 (9.0%) |
| 4:00 PM to 11:59 PM | 126 (9.4%) | 71 (5.1%) |
| Total | 1,337 (100.0%) | 1,382 (100.0%) |
Housing Occupancy in Breaux Bridge
Occupancy by Ownership in Breaux Bridge
Of the total 2,847 dwellings in Breaux Bridge, owner-occupied units account for 2,039 (71.6%), while renter-occupied units make up 808 (28.4%).
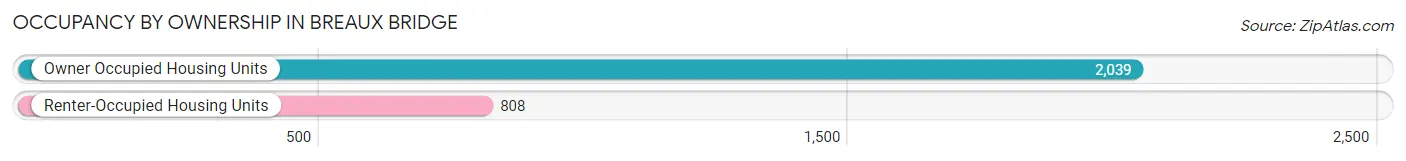
| Occupancy | # Housing Units | % Housing Units |
| Owner Occupied Housing Units | 2,039 | 71.6% |
| Renter-Occupied Housing Units | 808 | 28.4% |
| Total Occupied Housing Units | 2,847 | 100.0% |
Occupancy by Household Size in Breaux Bridge
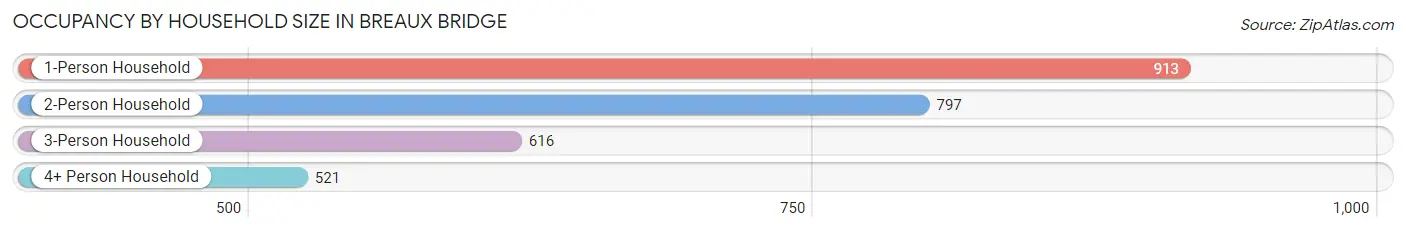
| Household Size | # Housing Units | % Housing Units |
| 1-Person Household | 913 | 32.1% |
| 2-Person Household | 797 | 28.0% |
| 3-Person Household | 616 | 21.6% |
| 4+ Person Household | 521 | 18.3% |
| Total Housing Units | 2,847 | 100.0% |
Occupancy by Ownership by Household Size in Breaux Bridge
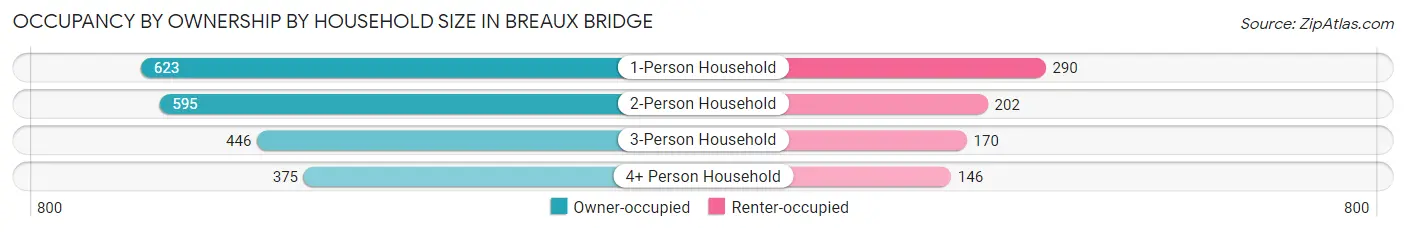
| Household Size | Owner-occupied | Renter-occupied |
| 1-Person Household | 623 (68.2%) | 290 (31.8%) |
| 2-Person Household | 595 (74.7%) | 202 (25.4%) |
| 3-Person Household | 446 (72.4%) | 170 (27.6%) |
| 4+ Person Household | 375 (72.0%) | 146 (28.0%) |
| Total Housing Units | 2,039 (71.6%) | 808 (28.4%) |
Occupancy by Educational Attainment in Breaux Bridge
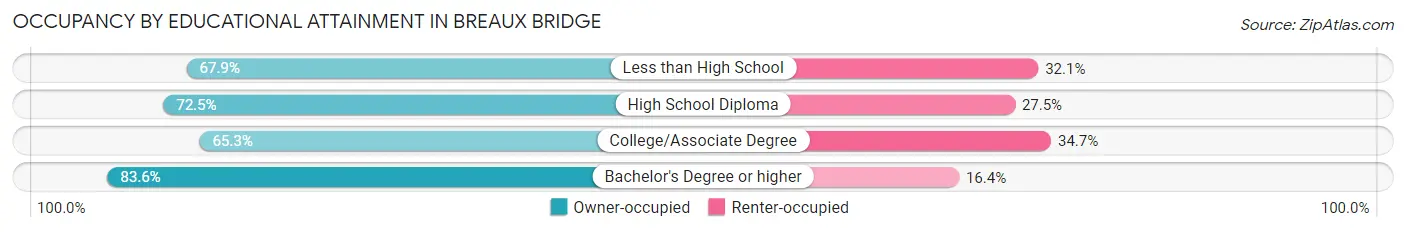
| Household Size | Owner-occupied | Renter-occupied |
| Less than High School | 412 (67.9%) | 195 (32.1%) |
| High School Diploma | 656 (72.5%) | 249 (27.5%) |
| College/Associate Degree | 518 (65.3%) | 275 (34.7%) |
| Bachelor's Degree or higher | 453 (83.6%) | 89 (16.4%) |
Occupancy by Age of Householder in Breaux Bridge
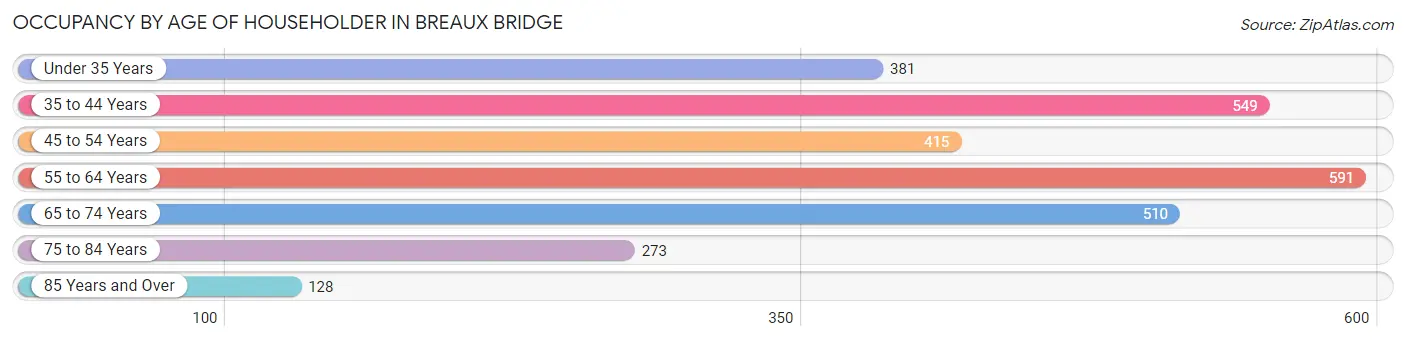
| Age Bracket | # Households | % Households |
| Under 35 Years | 381 | 13.4% |
| 35 to 44 Years | 549 | 19.3% |
| 45 to 54 Years | 415 | 14.6% |
| 55 to 64 Years | 591 | 20.8% |
| 65 to 74 Years | 510 | 17.9% |
| 75 to 84 Years | 273 | 9.6% |
| 85 Years and Over | 128 | 4.5% |
| Total | 2,847 | 100.0% |
Housing Finances in Breaux Bridge
Median Income by Occupancy in Breaux Bridge
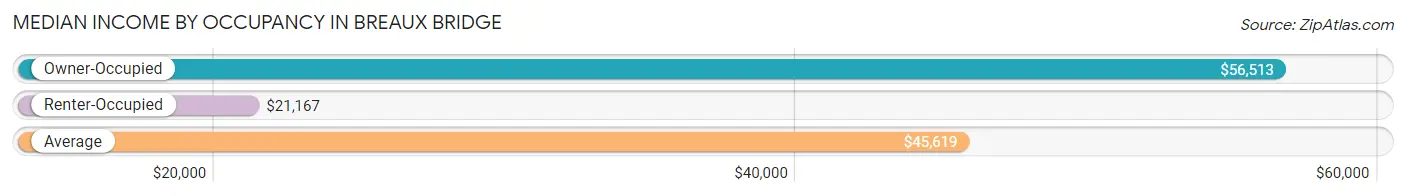
| Occupancy Type | # Households | Median Income |
| Owner-Occupied | 2,039 (71.6%) | $56,513 |
| Renter-Occupied | 808 (28.4%) | $21,167 |
| Average | 2,847 (100.0%) | $45,619 |
Occupancy by Householder Income Bracket in Breaux Bridge
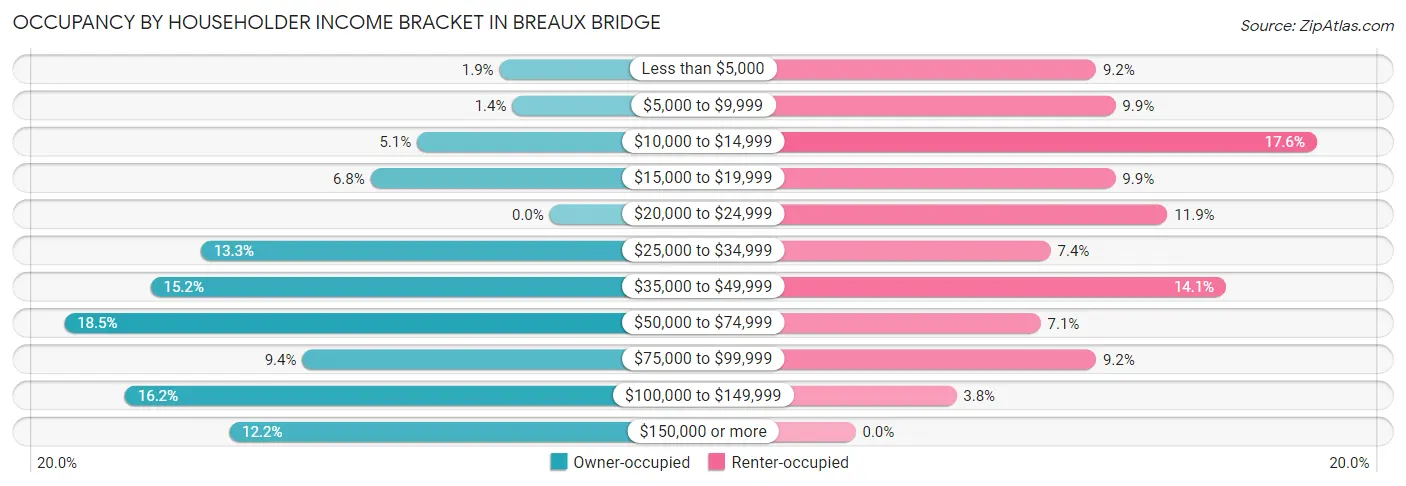
| Income Bracket | Owner-occupied | Renter-occupied |
| Less than $5,000 | 39 (1.9%) | 74 (9.2%) |
| $5,000 to $9,999 | 29 (1.4%) | 80 (9.9%) |
| $10,000 to $14,999 | 103 (5.1%) | 142 (17.6%) |
| $15,000 to $19,999 | 139 (6.8%) | 80 (9.9%) |
| $20,000 to $24,999 | 0 (0.0%) | 96 (11.9%) |
| $25,000 to $34,999 | 271 (13.3%) | 60 (7.4%) |
| $35,000 to $49,999 | 310 (15.2%) | 114 (14.1%) |
| $50,000 to $74,999 | 377 (18.5%) | 57 (7.0%) |
| $75,000 to $99,999 | 192 (9.4%) | 74 (9.2%) |
| $100,000 to $149,999 | 330 (16.2%) | 31 (3.8%) |
| $150,000 or more | 249 (12.2%) | 0 (0.0%) |
| Total | 2,039 (100.0%) | 808 (100.0%) |
Monthly Housing Cost Tiers in Breaux Bridge
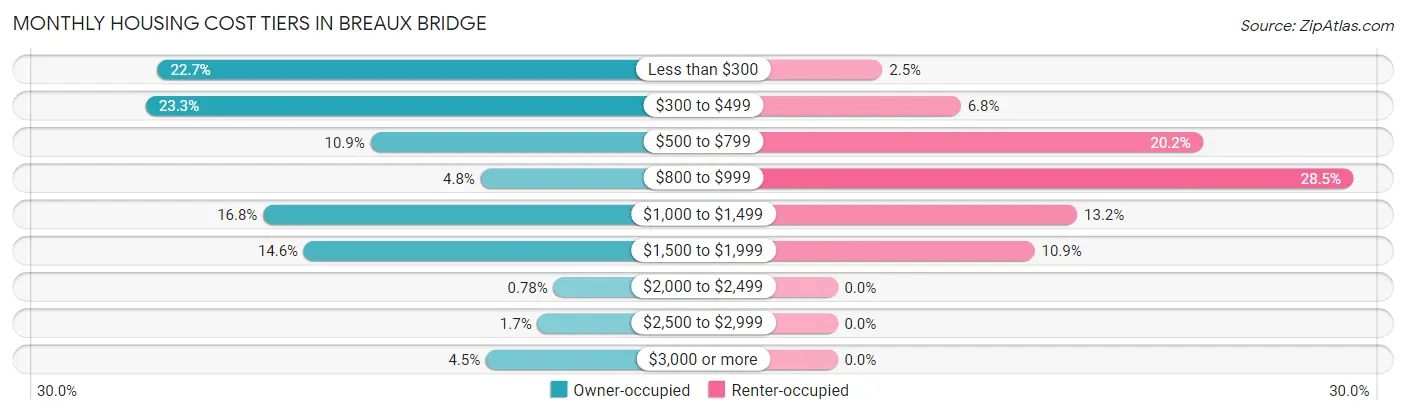
| Monthly Cost | Owner-occupied | Renter-occupied |
| Less than $300 | 462 (22.7%) | 20 (2.5%) |
| $300 to $499 | 475 (23.3%) | 55 (6.8%) |
| $500 to $799 | 222 (10.9%) | 163 (20.2%) |
| $800 to $999 | 98 (4.8%) | 230 (28.5%) |
| $1,000 to $1,499 | 343 (16.8%) | 107 (13.2%) |
| $1,500 to $1,999 | 297 (14.6%) | 88 (10.9%) |
| $2,000 to $2,499 | 16 (0.8%) | 0 (0.0%) |
| $2,500 to $2,999 | 34 (1.7%) | 0 (0.0%) |
| $3,000 or more | 92 (4.5%) | 0 (0.0%) |
| Total | 2,039 (100.0%) | 808 (100.0%) |
Physical Housing Characteristics in Breaux Bridge
Housing Structures in Breaux Bridge
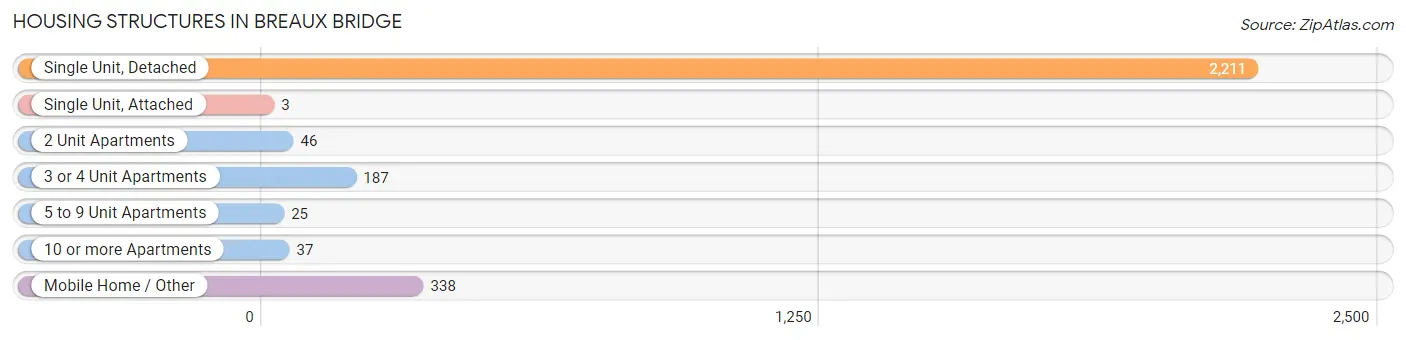
| Structure Type | # Housing Units | % Housing Units |
| Single Unit, Detached | 2,211 | 77.7% |
| Single Unit, Attached | 3 | 0.1% |
| 2 Unit Apartments | 46 | 1.6% |
| 3 or 4 Unit Apartments | 187 | 6.6% |
| 5 to 9 Unit Apartments | 25 | 0.9% |
| 10 or more Apartments | 37 | 1.3% |
| Mobile Home / Other | 338 | 11.9% |
| Total | 2,847 | 100.0% |
Housing Structures by Occupancy in Breaux Bridge
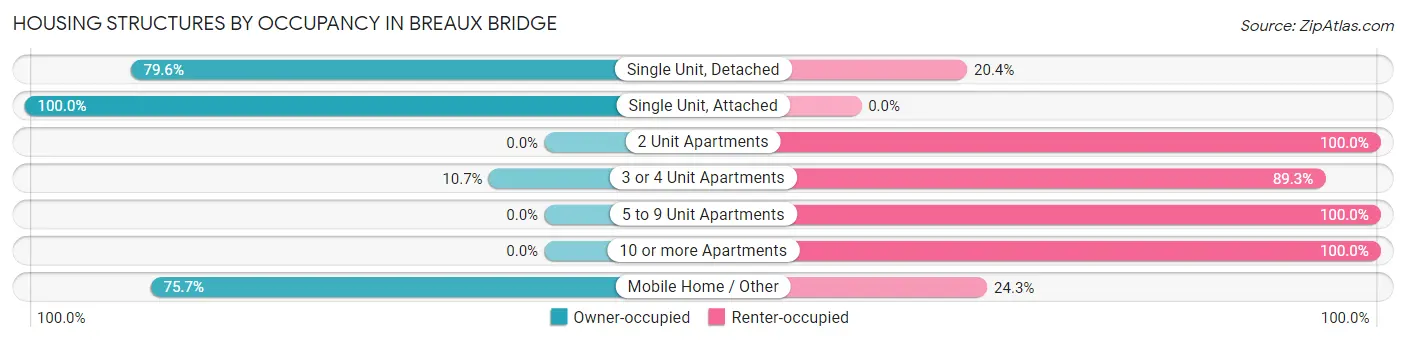
| Structure Type | Owner-occupied | Renter-occupied |
| Single Unit, Detached | 1,760 (79.6%) | 451 (20.4%) |
| Single Unit, Attached | 3 (100.0%) | 0 (0.0%) |
| 2 Unit Apartments | 0 (0.0%) | 46 (100.0%) |
| 3 or 4 Unit Apartments | 20 (10.7%) | 167 (89.3%) |
| 5 to 9 Unit Apartments | 0 (0.0%) | 25 (100.0%) |
| 10 or more Apartments | 0 (0.0%) | 37 (100.0%) |
| Mobile Home / Other | 256 (75.7%) | 82 (24.3%) |
| Total | 2,039 (71.6%) | 808 (28.4%) |
Housing Structures by Number of Rooms in Breaux Bridge
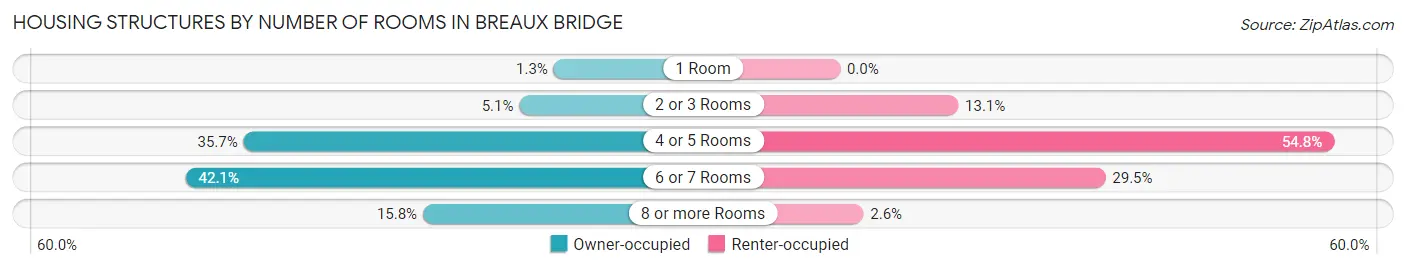
| Number of Rooms | Owner-occupied | Renter-occupied |
| 1 Room | 26 (1.3%) | 0 (0.0%) |
| 2 or 3 Rooms | 104 (5.1%) | 106 (13.1%) |
| 4 or 5 Rooms | 728 (35.7%) | 443 (54.8%) |
| 6 or 7 Rooms | 859 (42.1%) | 238 (29.5%) |
| 8 or more Rooms | 322 (15.8%) | 21 (2.6%) |
| Total | 2,039 (100.0%) | 808 (100.0%) |
Housing Structure by Heating Type in Breaux Bridge
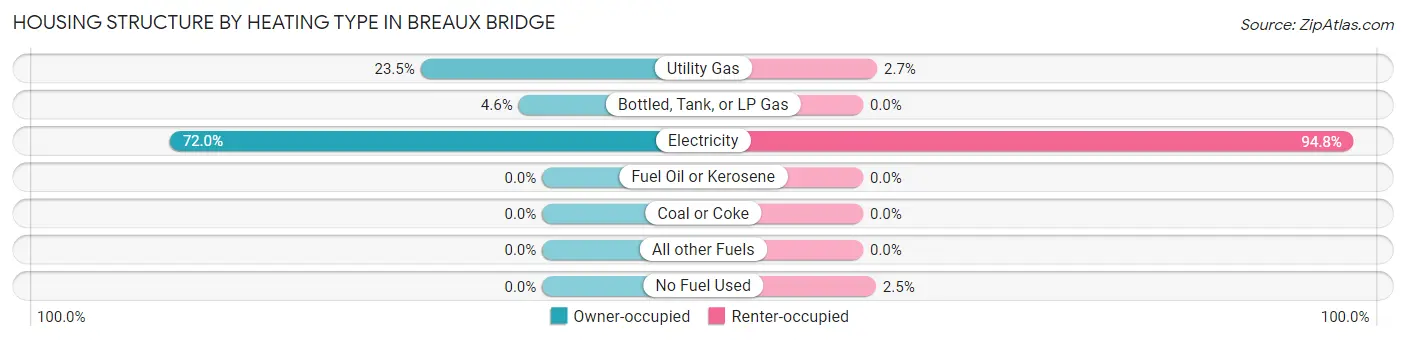
| Heating Type | Owner-occupied | Renter-occupied |
| Utility Gas | 479 (23.5%) | 22 (2.7%) |
| Bottled, Tank, or LP Gas | 93 (4.6%) | 0 (0.0%) |
| Electricity | 1,467 (72.0%) | 766 (94.8%) |
| Fuel Oil or Kerosene | 0 (0.0%) | 0 (0.0%) |
| Coal or Coke | 0 (0.0%) | 0 (0.0%) |
| All other Fuels | 0 (0.0%) | 0 (0.0%) |
| No Fuel Used | 0 (0.0%) | 20 (2.5%) |
| Total | 2,039 (100.0%) | 808 (100.0%) |
Household Vehicle Usage in Breaux Bridge
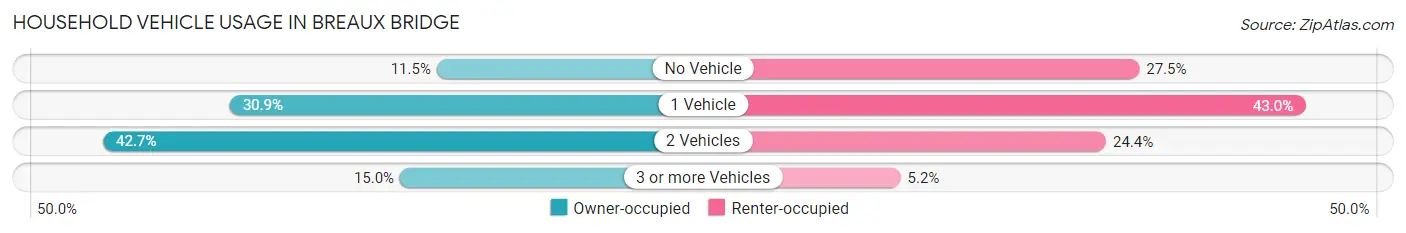
| Vehicles per Household | Owner-occupied | Renter-occupied |
| No Vehicle | 235 (11.5%) | 222 (27.5%) |
| 1 Vehicle | 629 (30.8%) | 347 (42.9%) |
| 2 Vehicles | 870 (42.7%) | 197 (24.4%) |
| 3 or more Vehicles | 305 (15.0%) | 42 (5.2%) |
| Total | 2,039 (100.0%) | 808 (100.0%) |
Real Estate & Mortgages in Breaux Bridge
Real Estate and Mortgage Overview in Breaux Bridge
| Characteristic | Without Mortgage | With Mortgage |
| Housing Units | 1,108 | 931 |
| Median Property Value | $95,300 | $232,400 |
| Median Household Income | $37,880 | $222 |
| Monthly Housing Costs | $336 | $92 |
| Real Estate Taxes | $214 | $86 |
Property Value by Mortgage Status in Breaux Bridge
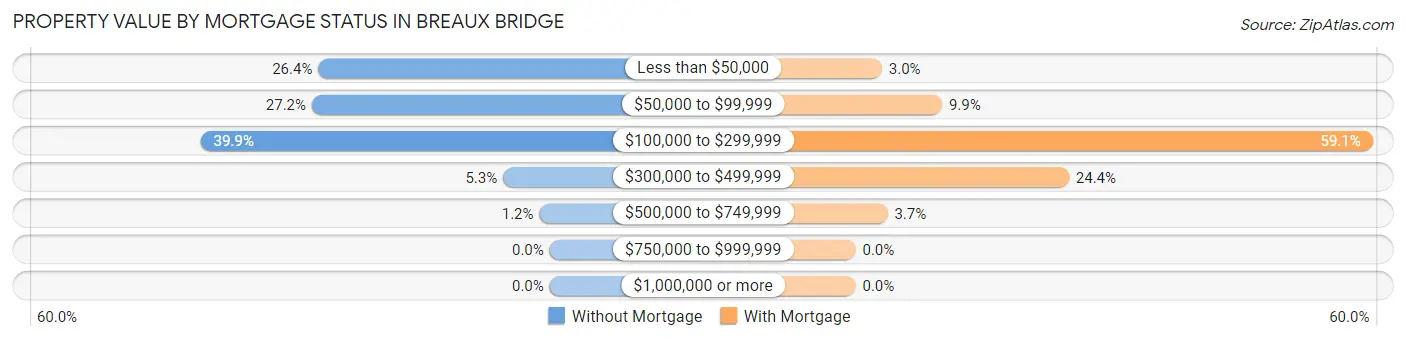
| Property Value | Without Mortgage | With Mortgage |
| Less than $50,000 | 293 (26.4%) | 28 (3.0%) |
| $50,000 to $99,999 | 301 (27.2%) | 92 (9.9%) |
| $100,000 to $299,999 | 442 (39.9%) | 550 (59.1%) |
| $300,000 to $499,999 | 59 (5.3%) | 227 (24.4%) |
| $500,000 to $749,999 | 13 (1.2%) | 34 (3.6%) |
| $750,000 to $999,999 | 0 (0.0%) | 0 (0.0%) |
| $1,000,000 or more | 0 (0.0%) | 0 (0.0%) |
| Total | 1,108 (100.0%) | 931 (100.0%) |
Household Income by Mortgage Status in Breaux Bridge
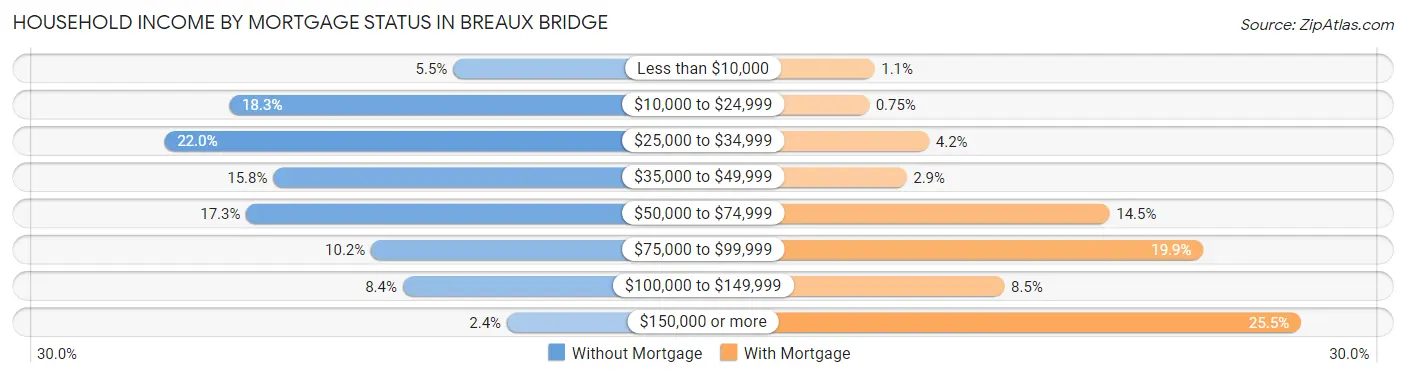
| Household Income | Without Mortgage | With Mortgage |
| Less than $10,000 | 61 (5.5%) | 10 (1.1%) |
| $10,000 to $24,999 | 203 (18.3%) | 7 (0.7%) |
| $25,000 to $34,999 | 244 (22.0%) | 39 (4.2%) |
| $35,000 to $49,999 | 175 (15.8%) | 27 (2.9%) |
| $50,000 to $74,999 | 192 (17.3%) | 135 (14.5%) |
| $75,000 to $99,999 | 113 (10.2%) | 185 (19.9%) |
| $100,000 to $149,999 | 93 (8.4%) | 79 (8.5%) |
| $150,000 or more | 27 (2.4%) | 237 (25.5%) |
| Total | 1,108 (100.0%) | 931 (100.0%) |
Property Value to Household Income Ratio in Breaux Bridge
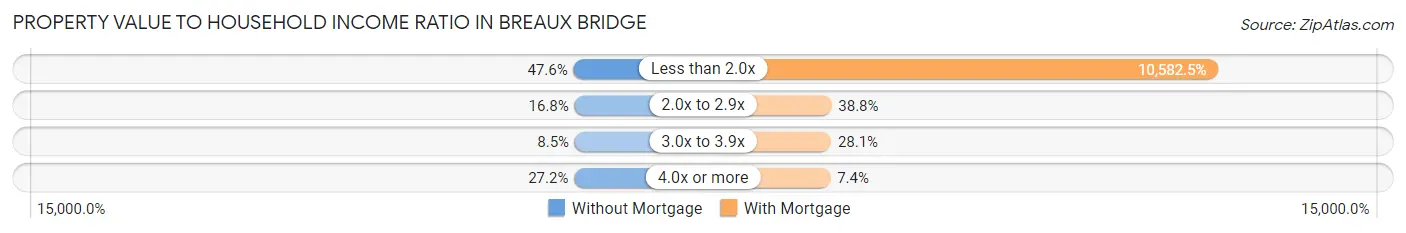
| Value-to-Income Ratio | Without Mortgage | With Mortgage |
| Less than 2.0x | 527 (47.6%) | 98,523 (10,582.5%) |
| 2.0x to 2.9x | 186 (16.8%) | 361 (38.8%) |
| 3.0x to 3.9x | 94 (8.5%) | 262 (28.1%) |
| 4.0x or more | 301 (27.2%) | 69 (7.4%) |
| Total | 1,108 (100.0%) | 931 (100.0%) |
Real Estate Taxes by Mortgage Status in Breaux Bridge
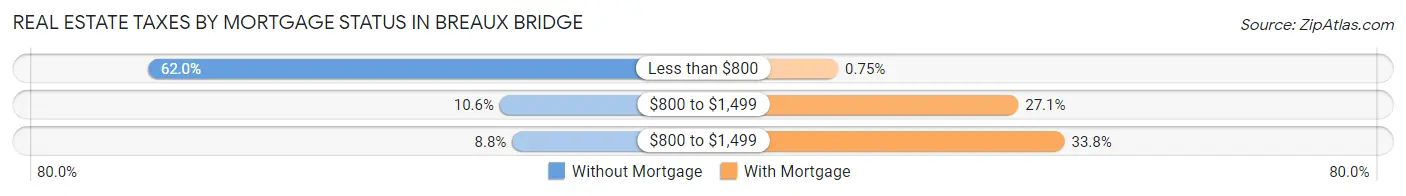
| Property Taxes | Without Mortgage | With Mortgage |
| Less than $800 | 687 (62.0%) | 7 (0.7%) |
| $800 to $1,499 | 117 (10.6%) | 252 (27.1%) |
| $800 to $1,499 | 97 (8.7%) | 315 (33.8%) |
| Total | 1,108 (100.0%) | 931 (100.0%) |
Health & Disability in Breaux Bridge
Health Insurance Coverage by Age in Breaux Bridge
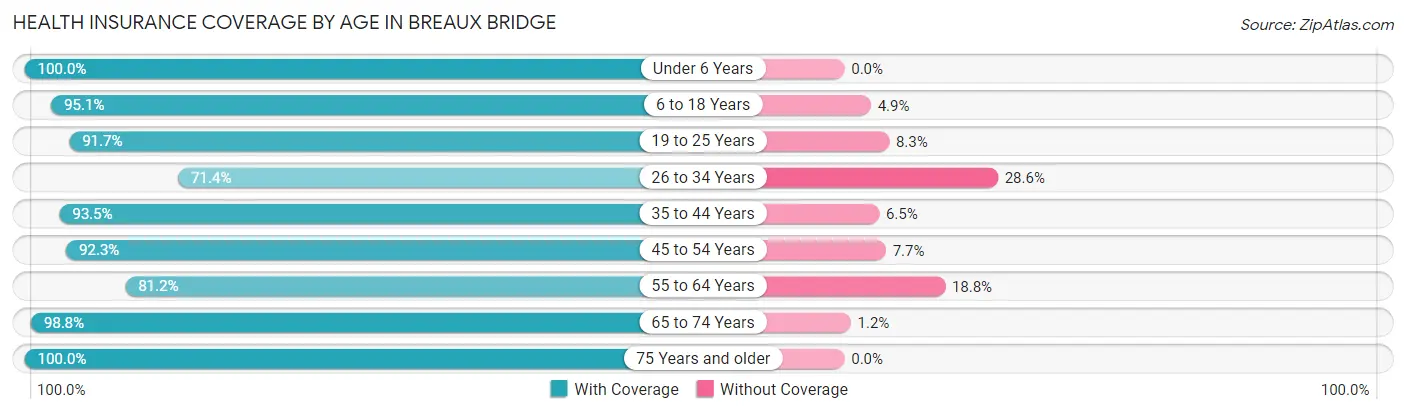
| Age Bracket | With Coverage | Without Coverage |
| Under 6 Years | 648 (100.0%) | 0 (0.0%) |
| 6 to 18 Years | 1,332 (95.1%) | 69 (4.9%) |
| 19 to 25 Years | 660 (91.7%) | 60 (8.3%) |
| 26 to 34 Years | 509 (71.4%) | 204 (28.6%) |
| 35 to 44 Years | 867 (93.5%) | 60 (6.5%) |
| 45 to 54 Years | 753 (92.3%) | 63 (7.7%) |
| 55 to 64 Years | 740 (81.2%) | 171 (18.8%) |
| 65 to 74 Years | 760 (98.8%) | 9 (1.2%) |
| 75 Years and older | 500 (100.0%) | 0 (0.0%) |
| Total | 6,769 (91.4%) | 636 (8.6%) |
Health Insurance Coverage by Citizenship Status in Breaux Bridge
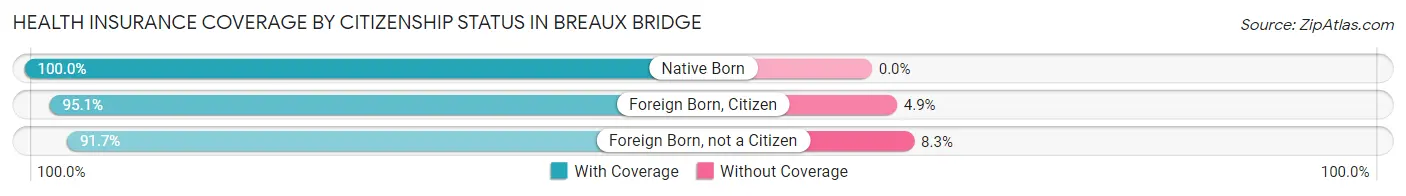
| Citizenship Status | With Coverage | Without Coverage |
| Native Born | 648 (100.0%) | 0 (0.0%) |
| Foreign Born, Citizen | 1,332 (95.1%) | 69 (4.9%) |
| Foreign Born, not a Citizen | 660 (91.7%) | 60 (8.3%) |
Health Insurance Coverage by Household Income in Breaux Bridge
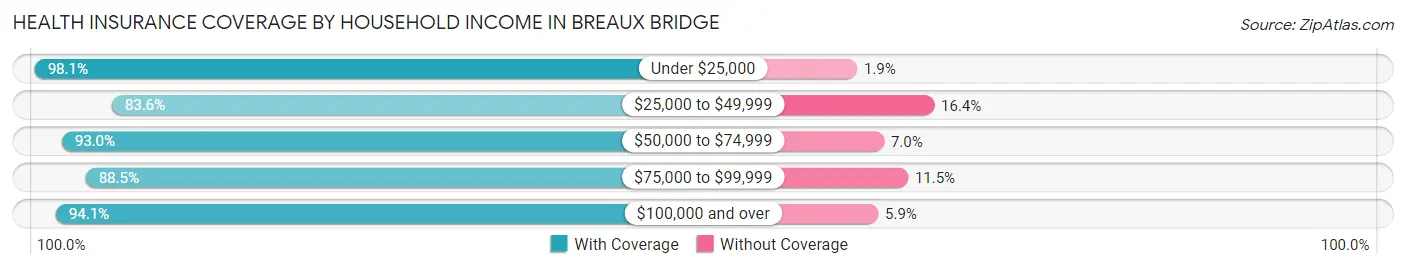
| Household Income | With Coverage | Without Coverage |
| Under $25,000 | 1,696 (98.1%) | 33 (1.9%) |
| $25,000 to $49,999 | 1,738 (83.6%) | 340 (16.4%) |
| $50,000 to $74,999 | 1,014 (93.0%) | 76 (7.0%) |
| $75,000 to $99,999 | 618 (88.5%) | 80 (11.5%) |
| $100,000 and over | 1,699 (94.1%) | 106 (5.9%) |
Public vs Private Health Insurance Coverage by Age in Breaux Bridge
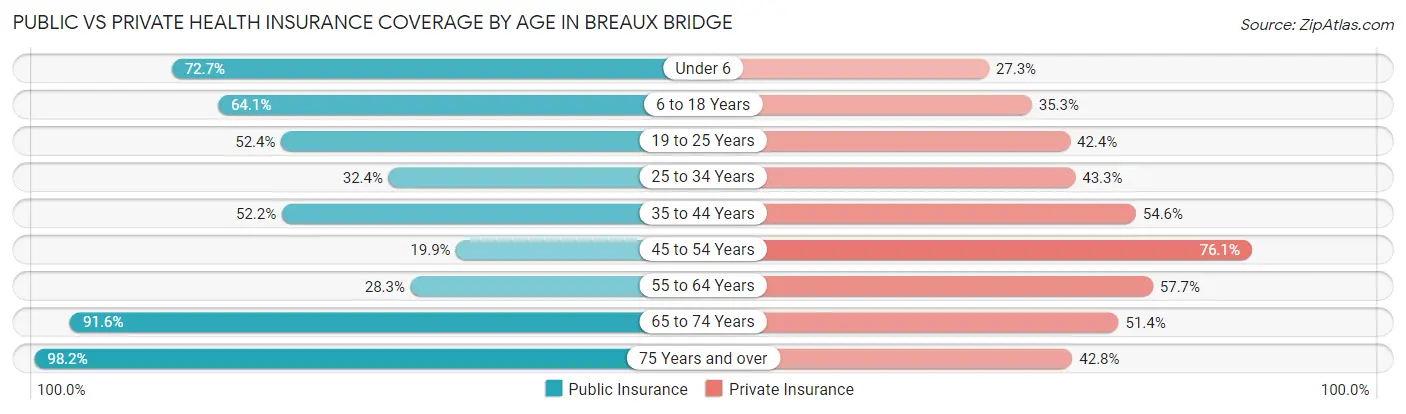
| Age Bracket | Public Insurance | Private Insurance |
| Under 6 | 471 (72.7%) | 177 (27.3%) |
| 6 to 18 Years | 898 (64.1%) | 494 (35.3%) |
| 19 to 25 Years | 377 (52.4%) | 305 (42.4%) |
| 25 to 34 Years | 231 (32.4%) | 309 (43.3%) |
| 35 to 44 Years | 484 (52.2%) | 506 (54.6%) |
| 45 to 54 Years | 162 (19.9%) | 621 (76.1%) |
| 55 to 64 Years | 258 (28.3%) | 526 (57.7%) |
| 65 to 74 Years | 704 (91.5%) | 395 (51.4%) |
| 75 Years and over | 491 (98.2%) | 214 (42.8%) |
| Total | 4,076 (55.0%) | 3,547 (47.9%) |
Disability Status by Sex by Age in Breaux Bridge
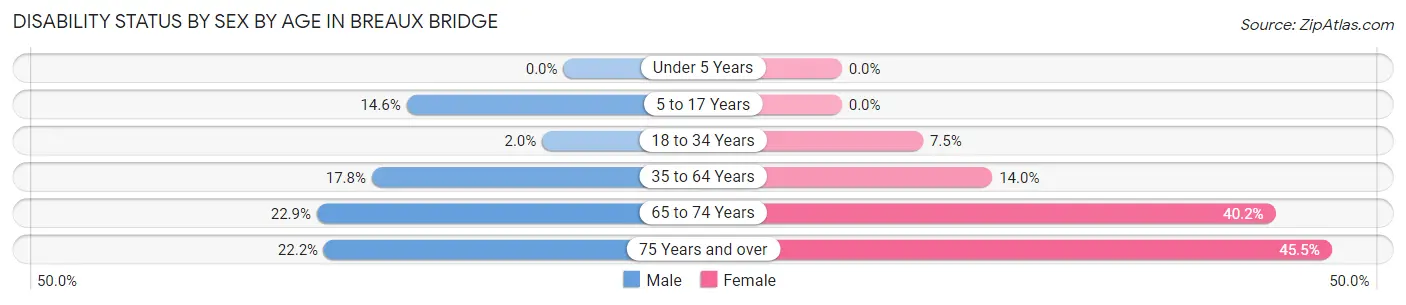
| Age Bracket | Male | Female |
| Under 5 Years | 0 (0.0%) | 0 (0.0%) |
| 5 to 17 Years | 92 (14.6%) | 0 (0.0%) |
| 18 to 34 Years | 16 (2.0%) | 54 (7.5%) |
| 35 to 64 Years | 235 (17.8%) | 186 (14.0%) |
| 65 to 74 Years | 81 (22.9%) | 167 (40.2%) |
| 75 Years and over | 50 (22.2%) | 125 (45.5%) |
Disability Class by Sex by Age in Breaux Bridge
Disability Class: Hearing Difficulty
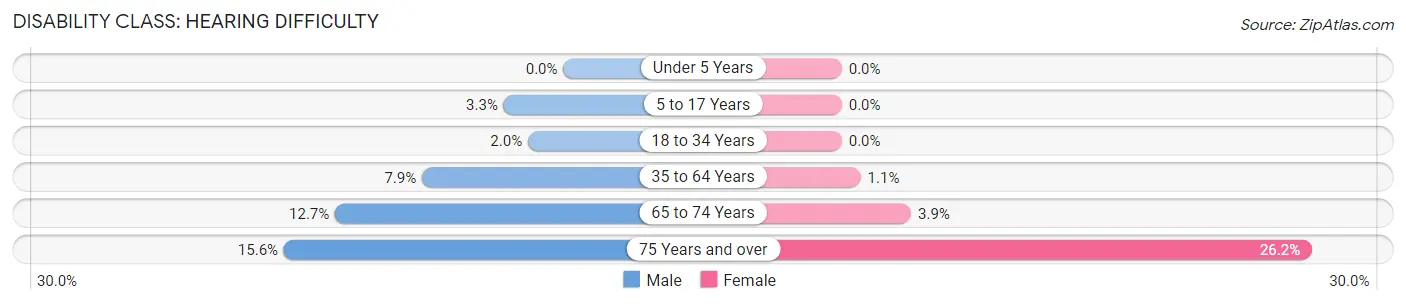
| Age Bracket | Male | Female |
| Under 5 Years | 0 (0.0%) | 0 (0.0%) |
| 5 to 17 Years | 21 (3.3%) | 0 (0.0%) |
| 18 to 34 Years | 16 (2.0%) | 0 (0.0%) |
| 35 to 64 Years | 104 (7.9%) | 14 (1.1%) |
| 65 to 74 Years | 45 (12.7%) | 16 (3.9%) |
| 75 Years and over | 35 (15.6%) | 72 (26.2%) |
Disability Class: Vision Difficulty
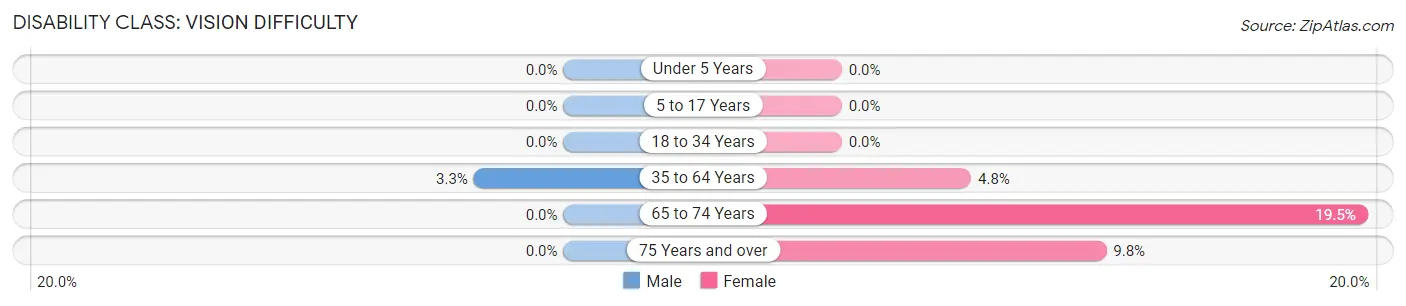
| Age Bracket | Male | Female |
| Under 5 Years | 0 (0.0%) | 0 (0.0%) |
| 5 to 17 Years | 0 (0.0%) | 0 (0.0%) |
| 18 to 34 Years | 0 (0.0%) | 0 (0.0%) |
| 35 to 64 Years | 44 (3.3%) | 64 (4.8%) |
| 65 to 74 Years | 0 (0.0%) | 81 (19.5%) |
| 75 Years and over | 0 (0.0%) | 27 (9.8%) |
Disability Class: Cognitive Difficulty
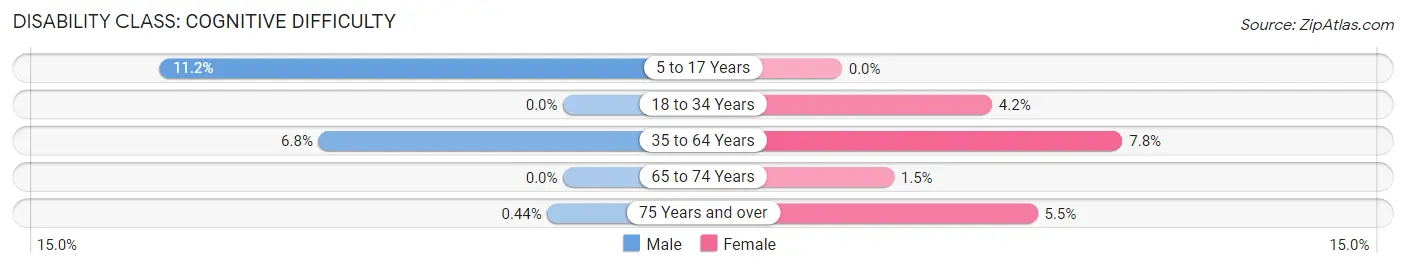
| Age Bracket | Male | Female |
| 5 to 17 Years | 71 (11.2%) | 0 (0.0%) |
| 18 to 34 Years | 0 (0.0%) | 30 (4.2%) |
| 35 to 64 Years | 90 (6.8%) | 104 (7.8%) |
| 65 to 74 Years | 0 (0.0%) | 6 (1.5%) |
| 75 Years and over | 1 (0.4%) | 15 (5.4%) |
Disability Class: Ambulatory Difficulty
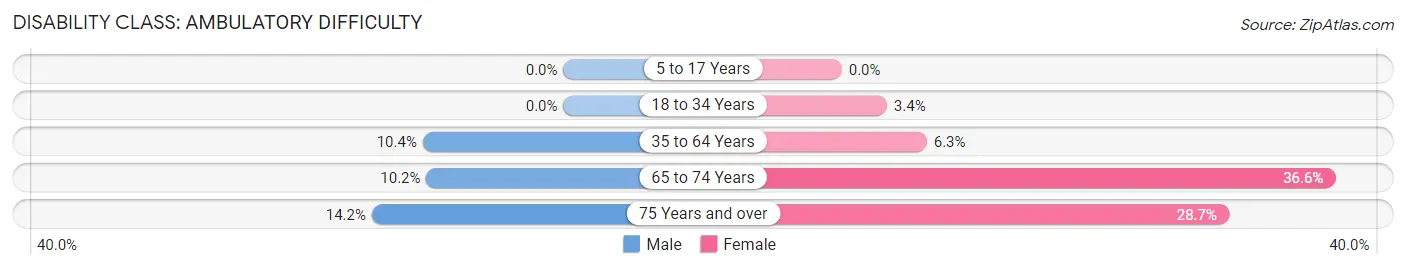
| Age Bracket | Male | Female |
| 5 to 17 Years | 0 (0.0%) | 0 (0.0%) |
| 18 to 34 Years | 0 (0.0%) | 24 (3.4%) |
| 35 to 64 Years | 138 (10.4%) | 84 (6.3%) |
| 65 to 74 Years | 36 (10.2%) | 152 (36.6%) |
| 75 Years and over | 32 (14.2%) | 79 (28.7%) |
Disability Class: Self-Care Difficulty
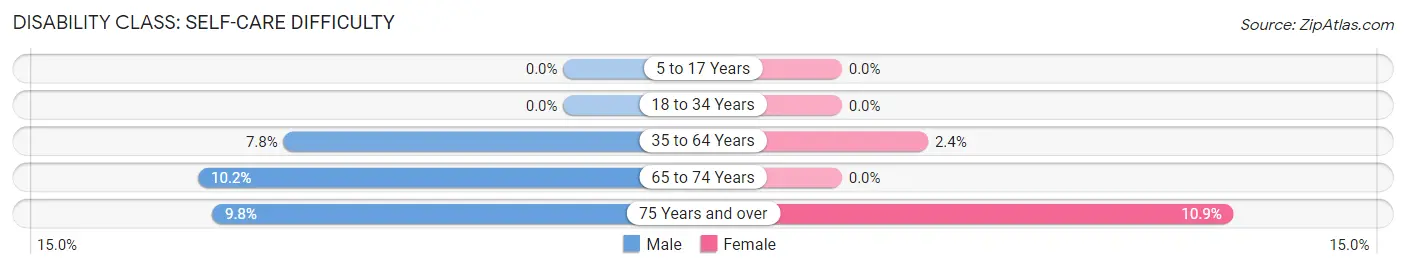
| Age Bracket | Male | Female |
| 5 to 17 Years | 0 (0.0%) | 0 (0.0%) |
| 18 to 34 Years | 0 (0.0%) | 0 (0.0%) |
| 35 to 64 Years | 103 (7.8%) | 32 (2.4%) |
| 65 to 74 Years | 36 (10.2%) | 0 (0.0%) |
| 75 Years and over | 22 (9.8%) | 30 (10.9%) |
Technology Access in Breaux Bridge
Computing Device Access in Breaux Bridge
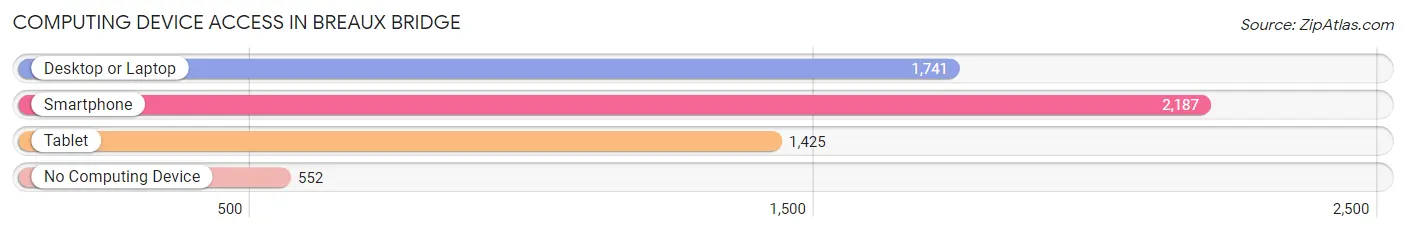
| Device Type | # Households | % Households |
| Desktop or Laptop | 1,741 | 61.2% |
| Smartphone | 2,187 | 76.8% |
| Tablet | 1,425 | 50.0% |
| No Computing Device | 552 | 19.4% |
| Total | 2,847 | 100.0% |
Internet Access in Breaux Bridge
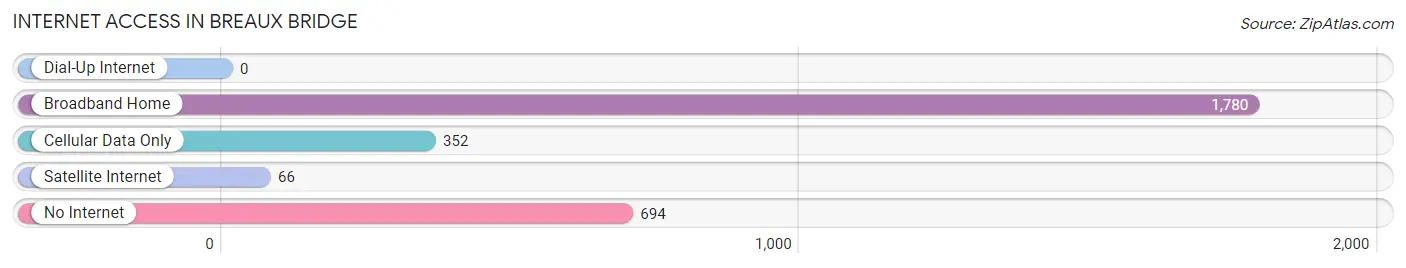
| Internet Type | # Households | % Households |
| Dial-Up Internet | 0 | 0.0% |
| Broadband Home | 1,780 | 62.5% |
| Cellular Data Only | 352 | 12.4% |
| Satellite Internet | 66 | 2.3% |
| No Internet | 694 | 24.4% |
| Total | 2,847 | 100.0% |
Breaux Bridge Summary
Introduction
Breaux Bridge is a small city located in St. Martin Parish, Louisiana. It is situated on the banks of the Bayou Teche and is known as the “Crawfish Capital of the World”. The city has a population of 8,139 as of the 2010 census and is part of the Lafayette Metropolitan Statistical Area. Breaux Bridge is a popular tourist destination due to its unique culture, history, and cuisine.
History
The area that is now Breaux Bridge was first settled by Acadian exiles in the late 1700s. The settlement was named after Firmin Breaux, a local landowner who donated land for the construction of a bridge across the Bayou Teche. The bridge was completed in 1821 and was the first bridge to span the bayou.
The city was officially incorporated in 1864 and was named the parish seat of St. Martin Parish in 1868. Breaux Bridge quickly became a hub of commerce and industry, with the construction of a railroad line in 1881. The city also became a popular tourist destination, with the opening of the Breaux Bridge Hotel in 1883.
Geography
Breaux Bridge is located in south-central Louisiana, approximately 30 miles west of Baton Rouge and 40 miles south of Lafayette. The city is situated on the banks of the Bayou Teche, which is a tributary of the Atchafalaya River. The city has a total area of 4.2 square miles, all of which is land.
The climate in Breaux Bridge is classified as humid subtropical, with hot, humid summers and mild winters. The average annual temperature is 68°F, with an average high of 91°F in July and an average low of 44°F in January. The average annual precipitation is 56 inches.
Economy
The economy of Breaux Bridge is largely based on tourism and agriculture. The city is home to several popular tourist attractions, including the Breaux Bridge Crawfish Festival, the Breaux Bridge Museum, and the Bayou Teche National Wildlife Refuge.
Agriculture is also an important part of the local economy. The area is known for its crawfish production, and the city is home to several crawfish farms. Other agricultural products include rice, soybeans, and sugarcane.
Demographics
As of the 2010 census, Breaux Bridge had a population of 8,139. The racial makeup of the city was 73.3% White, 22.2% African American, 0.7% Native American, 0.7% Asian, 0.1% Pacific Islander, and 2.9% from other races. Hispanic or Latino of any race were 4.3% of the population.
The median household income in Breaux Bridge was $35,945, and the median family income was $41,944. The per capita income was $17,845. About 17.2% of the population was below the poverty line.
Conclusion
Breaux Bridge is a small city located in St. Martin Parish, Louisiana. It is situated on the banks of the Bayou Teche and is known as the “Crawfish Capital of the World”. The city has a population of 8,139 as of the 2010 census and is part of the Lafayette Metropolitan Statistical Area. Breaux Bridge is a popular tourist destination due to its unique culture, history, and cuisine. The economy of Breaux Bridge is largely based on tourism and agriculture, and the city is home to several popular tourist attractions. The racial makeup of the city is 73.3% White, 22.2% African American, 0.7% Native American, 0.7% Asian, 0.1% Pacific Islander, and 2.9% from other races. The median household income in Breaux Bridge was $35,945, and the median family income was $41,944.
Common Questions
What is Per Capita Income in Breaux Bridge?
Per Capita income in Breaux Bridge is $25,222.
What is the Median Family Income in Breaux Bridge?
Median Family Income in Breaux Bridge is $56,783.
What is the Median Household income in Breaux Bridge?
Median Household Income in Breaux Bridge is $45,619.
What is Income or Wage Gap in Breaux Bridge?
Income or Wage Gap in Breaux Bridge is 30.0%.
Women in Breaux Bridge earn 70.0 cents for every dollar earned by a man.
What is Family Income Deficit in Breaux Bridge?
Family Income Deficit in Breaux Bridge is $11,927.
Families that are below poverty line in Breaux Bridge earn $11,927 less on average than the poverty threshold level.
What is Inequality or Gini Index in Breaux Bridge?
Inequality or Gini Index in Breaux Bridge is 0.48.
What is the Total Population of Breaux Bridge?
Total Population of Breaux Bridge is 7,544.
What is the Total Male Population of Breaux Bridge?
Total Male Population of Breaux Bridge is 3,797.
What is the Total Female Population of Breaux Bridge?
Total Female Population of Breaux Bridge is 3,747.
What is the Ratio of Males per 100 Females in Breaux Bridge?
There are 101.33 Males per 100 Females in Breaux Bridge.
What is the Ratio of Females per 100 Males in Breaux Bridge?
There are 98.68 Females per 100 Males in Breaux Bridge.
What is the Median Population Age in Breaux Bridge?
Median Population Age in Breaux Bridge is 39.0 Years.
What is the Average Family Size in Breaux Bridge
Average Family Size in Breaux Bridge is 3.1 People.
What is the Average Household Size in Breaux Bridge
Average Household Size in Breaux Bridge is 2.6 People.
How Large is the Labor Force in Breaux Bridge?
There are 3,223 People in the Labor Forcein in Breaux Bridge.
What is the Percentage of People in the Labor Force in Breaux Bridge?
55.7% of People are in the Labor Force in Breaux Bridge.
What is the Unemployment Rate in Breaux Bridge?
Unemployment Rate in Breaux Bridge is 9.6%.