Boutte, LA Map & Demographics
Boutte Map
Boutte Overview
$31,223
PER CAPITA INCOME
$79,732
AVG FAMILY INCOME
$74,886
AVG HOUSEHOLD INCOME
0.44
INEQUALITY / GINI INDEX
2,274
TOTAL POPULATION
1,241
MALE POPULATION
1,033
FEMALE POPULATION
120.14
MALES / 100 FEMALES
83.24
FEMALES / 100 MALES
39.4
MEDIAN AGE
3.4
AVG FAMILY SIZE
2.8
AVG HOUSEHOLD SIZE
1,109
LABOR FORCE [ PEOPLE ]
63.9%
PERCENT IN LABOR FORCE
12.4%
UNEMPLOYMENT RATE
Boutte Zip Codes
Boutte Area Codes
Income in Boutte
Income Overview in Boutte
Per Capita Income in Boutte is $31,223, while median incomes of families and households are $79,732 and $74,886 respectively.
| Characteristic | Number | Measure |
| Per Capita Income | 2,274 | $31,223 |
| Median Family Income | 581 | $79,732 |
| Mean Family Income | 581 | $96,968 |
| Median Household Income | 826 | $74,886 |
| Mean Household Income | 826 | $81,301 |
| Income Deficit | 581 | $0 |
| Wage / Income Gap (%) | 2,274 | 0.00% |
| Wage / Income Gap ($) | 2,274 | 100.00¢ per $1 |
| Gini / Inequality Index | 2,274 | 0.44 |
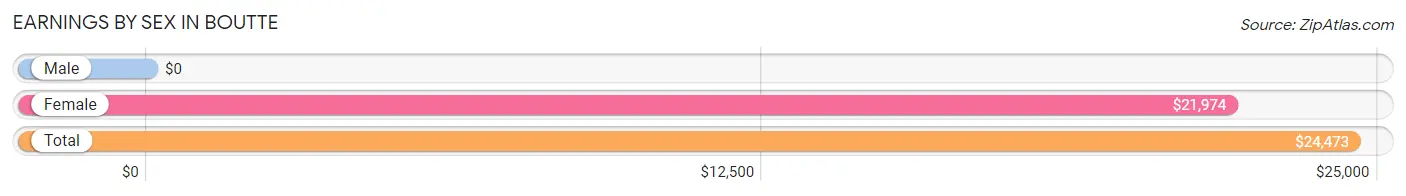
Earnings by Sex in Boutte
| Sex | Number | Average Earnings |
| Male | 565 (52.7%) | $0 |
| Female | 508 (47.3%) | $21,974 |
| Total | 1,073 (100.0%) | $24,473 |
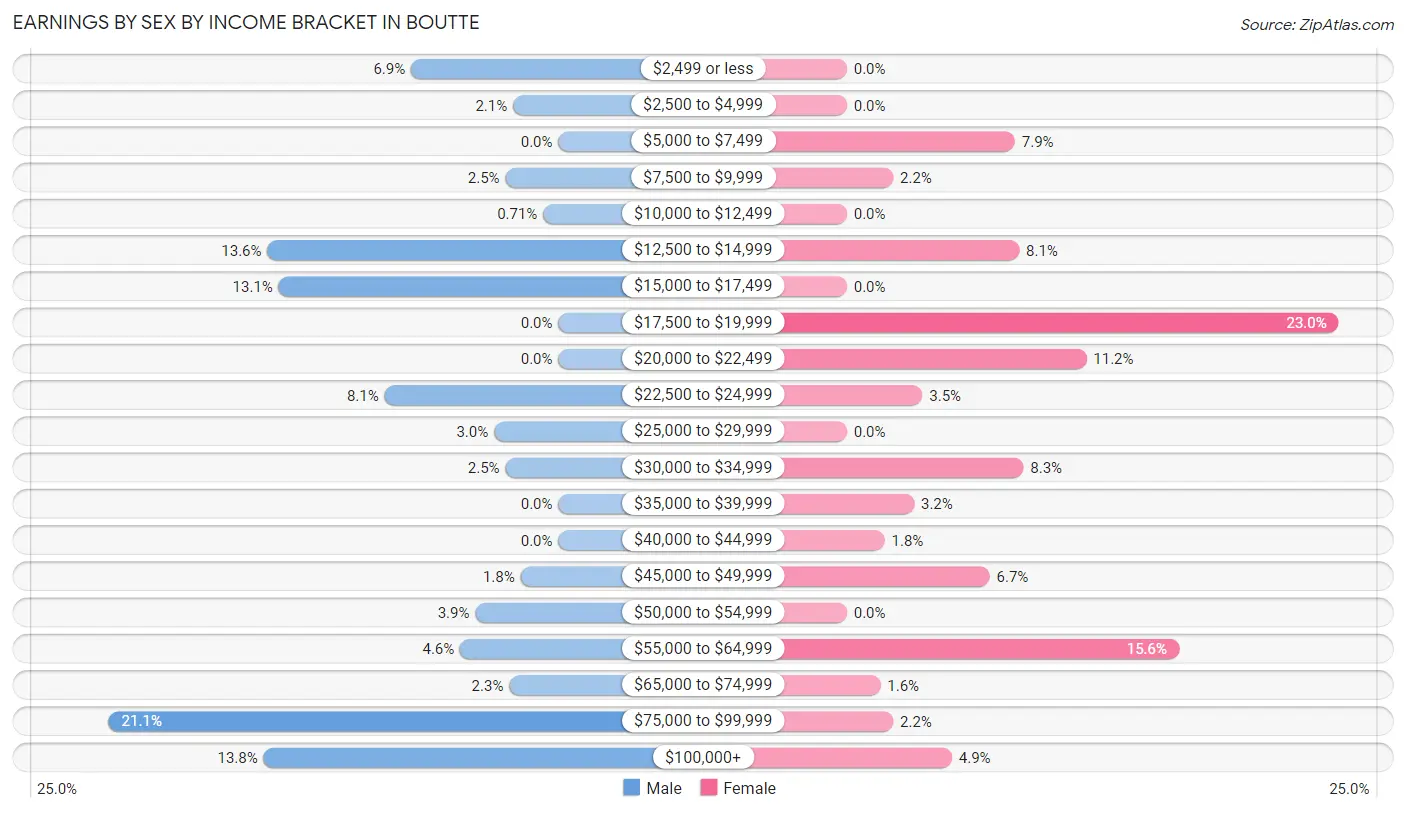
Earnings by Sex by Income Bracket in Boutte
The most common earnings brackets in Boutte are $75,000 to $99,999 for men (119 | 21.1%) and $17,500 to $19,999 for women (117 | 23.0%).
| Income | Male | Female |
| $2,499 or less | 39 (6.9%) | 0 (0.0%) |
| $2,500 to $4,999 | 12 (2.1%) | 0 (0.0%) |
| $5,000 to $7,499 | 0 (0.0%) | 40 (7.9%) |
| $7,500 to $9,999 | 14 (2.5%) | 11 (2.2%) |
| $10,000 to $12,499 | 4 (0.7%) | 0 (0.0%) |
| $12,500 to $14,999 | 77 (13.6%) | 41 (8.1%) |
| $15,000 to $17,499 | 74 (13.1%) | 0 (0.0%) |
| $17,500 to $19,999 | 0 (0.0%) | 117 (23.0%) |
| $20,000 to $22,499 | 0 (0.0%) | 57 (11.2%) |
| $22,500 to $24,999 | 46 (8.1%) | 18 (3.5%) |
| $25,000 to $29,999 | 17 (3.0%) | 0 (0.0%) |
| $30,000 to $34,999 | 14 (2.5%) | 42 (8.3%) |
| $35,000 to $39,999 | 0 (0.0%) | 16 (3.2%) |
| $40,000 to $44,999 | 0 (0.0%) | 9 (1.8%) |
| $45,000 to $49,999 | 10 (1.8%) | 34 (6.7%) |
| $50,000 to $54,999 | 22 (3.9%) | 0 (0.0%) |
| $55,000 to $64,999 | 26 (4.6%) | 79 (15.5%) |
| $65,000 to $74,999 | 13 (2.3%) | 8 (1.6%) |
| $75,000 to $99,999 | 119 (21.1%) | 11 (2.2%) |
| $100,000+ | 78 (13.8%) | 25 (4.9%) |
| Total | 565 (100.0%) | 508 (100.0%) |
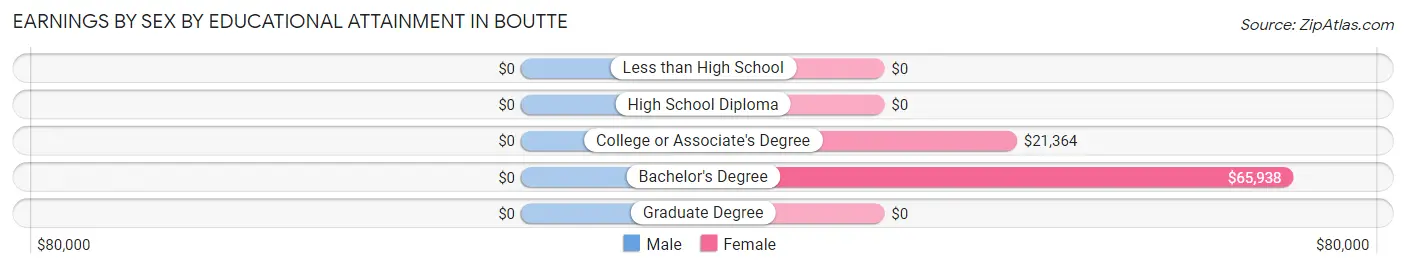
Earnings by Sex by Educational Attainment in Boutte
| Educational Attainment | Male Income | Female Income |
| Less than High School | - | - |
| High School Diploma | - | - |
| College or Associate's Degree | - | - |
| Bachelor's Degree | - | - |
| Graduate Degree | - | - |
| Total | $50,398 | $22,456 |
Family Income in Boutte
Family Income Brackets in Boutte
According to the Boutte family income data, there are 185 families falling into the $75,000 to $99,999 income range, which is the most common income bracket and makes up 31.8% of all families.
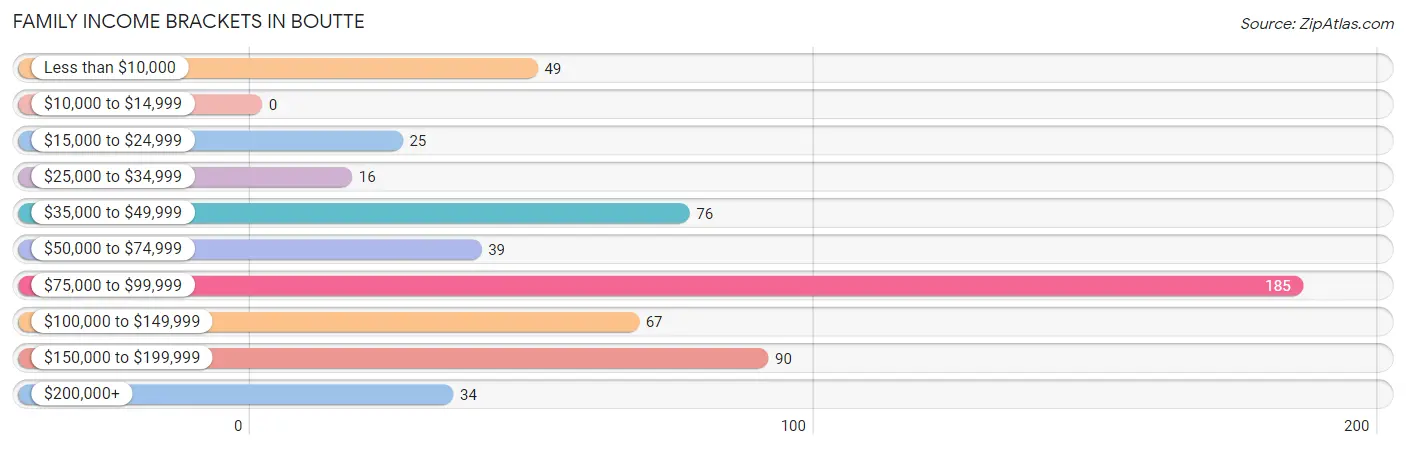
| Income Bracket | # Families | % Families |
| Less than $10,000 | 49 | 8.4% |
| $10,000 to $14,999 | 0 | 0.0% |
| $15,000 to $24,999 | 25 | 4.3% |
| $25,000 to $34,999 | 16 | 2.8% |
| $35,000 to $49,999 | 76 | 13.1% |
| $50,000 to $74,999 | 39 | 6.7% |
| $75,000 to $99,999 | 185 | 31.8% |
| $100,000 to $149,999 | 67 | 11.5% |
| $150,000 to $199,999 | 90 | 15.5% |
| $200,000+ | 34 | 5.9% |
Family Income by Famaliy Size in Boutte
3-person families (131 | 22.6%) account for the highest median family income in Boutte with $79,570 per family, while 2-person families (331 | 57.0%) have the highest median income of $39,424 per family member.
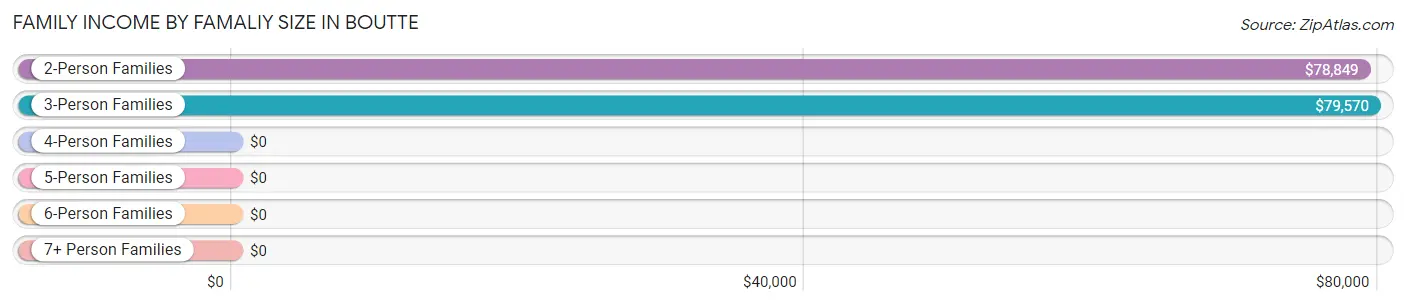
| Income Bracket | # Families | Median Income |
| 2-Person Families | 331 (57.0%) | $78,849 |
| 3-Person Families | 131 (22.6%) | $79,570 |
| 4-Person Families | 93 (16.0%) | $0 |
| 5-Person Families | 11 (1.9%) | $0 |
| 6-Person Families | 15 (2.6%) | $0 |
| 7+ Person Families | 0 (0.0%) | $0 |
| Total | 581 (100.0%) | $79,732 |
Family Income by Number of Earners in Boutte
The median family income in Boutte is $79,732, with families comprising 3+ earners (52) having the highest median family income of $152,344, while families with 1 earner (259) have the lowest median family income of $76,902, accounting for 8.9% and 44.6% of families, respectively.
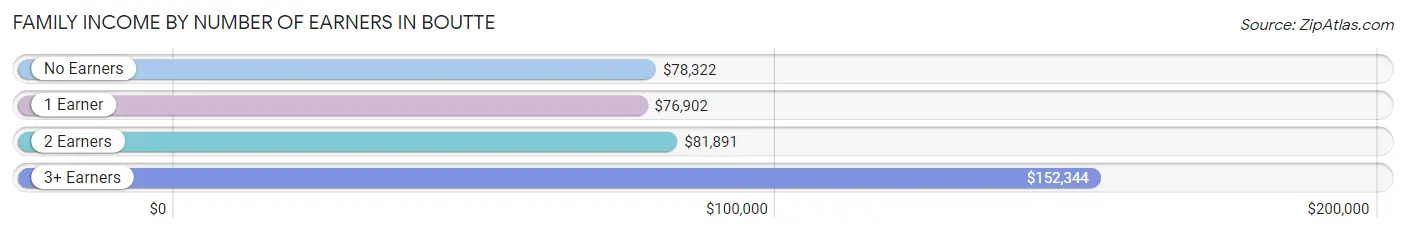
| Number of Earners | # Families | Median Income |
| No Earners | 79 (13.6%) | $78,322 |
| 1 Earner | 259 (44.6%) | $76,902 |
| 2 Earners | 191 (32.9%) | $81,891 |
| 3+ Earners | 52 (8.9%) | $152,344 |
| Total | 581 (100.0%) | $79,732 |
Household Income in Boutte
Household Income Brackets in Boutte
With 197 households falling in the category, the $75,000 to $99,999 income range is the most frequent in Boutte, accounting for 23.8% of all households.
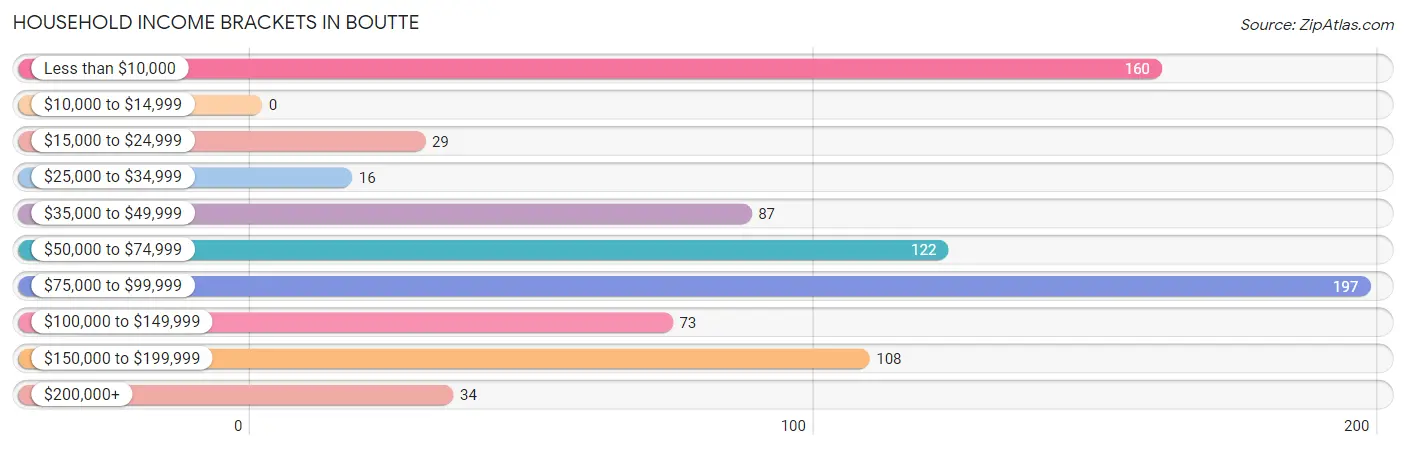
| Income Bracket | # Households | % Households |
| Less than $10,000 | 160 | 19.4% |
| $10,000 to $14,999 | 0 | 0.0% |
| $15,000 to $24,999 | 29 | 3.5% |
| $25,000 to $34,999 | 16 | 1.9% |
| $35,000 to $49,999 | 87 | 10.5% |
| $50,000 to $74,999 | 122 | 14.8% |
| $75,000 to $99,999 | 197 | 23.8% |
| $100,000 to $149,999 | 73 | 8.8% |
| $150,000 to $199,999 | 108 | 13.1% |
| $200,000+ | 34 | 4.1% |
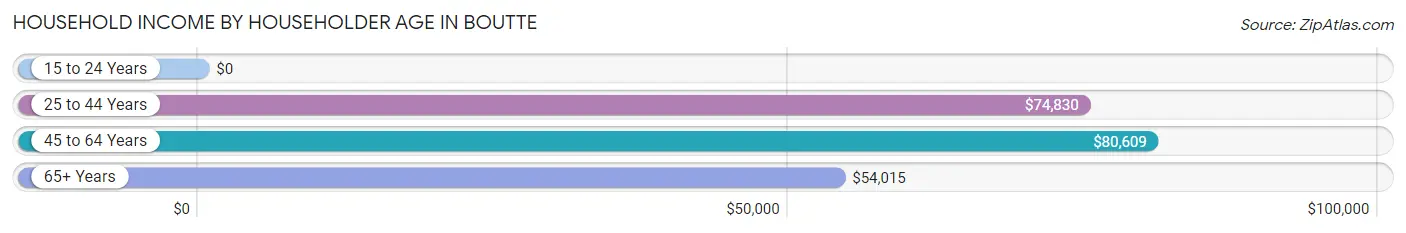
Household Income by Householder Age in Boutte
The median household income in Boutte is $74,886, with the highest median household income of $80,609 found in the 45 to 64 years age bracket for the primary householder. A total of 361 households (43.7%) fall into this category. Meanwhile, the 15 to 24 years age bracket for the primary householder has the lowest median household income of $0, with 4 households (0.5%) in this group.
| Income Bracket | # Households | Median Income |
| 15 to 24 Years | 4 (0.5%) | $0 |
| 25 to 44 Years | 207 (25.1%) | $74,830 |
| 45 to 64 Years | 361 (43.7%) | $80,609 |
| 65+ Years | 254 (30.7%) | $54,015 |
| Total | 826 (100.0%) | $74,886 |
Poverty in Boutte
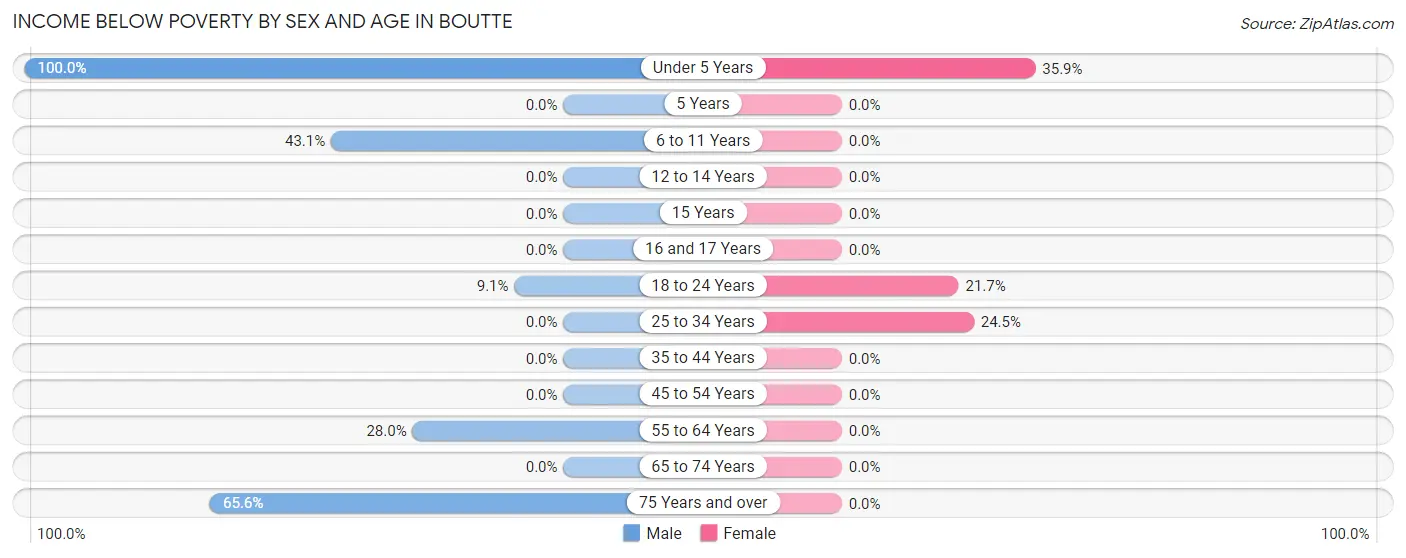
Income Below Poverty by Sex and Age in Boutte
With 19.3% poverty level for males and 11.8% for females among the residents of Boutte, under 5 year old males and under 5 year old females are the most vulnerable to poverty, with 60 males (100.0%) and 60 females (35.9%) in their respective age groups living below the poverty level.
| Age Bracket | Male | Female |
| Under 5 Years | 60 (100.0%) | 60 (35.9%) |
| 5 Years | 0 (0.0%) | 0 (0.0%) |
| 6 to 11 Years | 47 (43.1%) | 0 (0.0%) |
| 12 to 14 Years | 0 (0.0%) | 0 (0.0%) |
| 15 Years | 0 (0.0%) | 0 (0.0%) |
| 16 and 17 Years | 0 (0.0%) | 0 (0.0%) |
| 18 to 24 Years | 4 (9.1%) | 13 (21.7%) |
| 25 to 34 Years | 0 (0.0%) | 49 (24.5%) |
| 35 to 44 Years | 0 (0.0%) | 0 (0.0%) |
| 45 to 54 Years | 0 (0.0%) | 0 (0.0%) |
| 55 to 64 Years | 49 (28.0%) | 0 (0.0%) |
| 65 to 74 Years | 0 (0.0%) | 0 (0.0%) |
| 75 Years and over | 80 (65.6%) | 0 (0.0%) |
| Total | 240 (19.3%) | 122 (11.8%) |
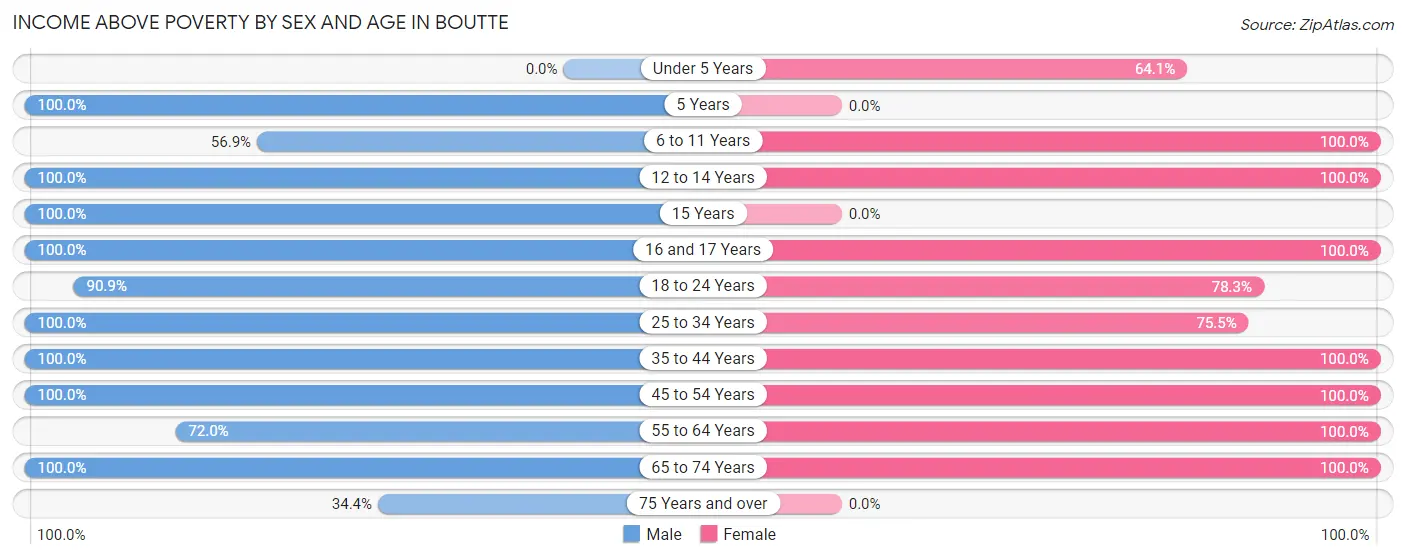
Income Above Poverty by Sex and Age in Boutte
According to the poverty statistics in Boutte, males aged 5 years and females aged 6 to 11 years are the age groups that are most secure financially, with 100.0% of males and 100.0% of females in these age groups living above the poverty line.
| Age Bracket | Male | Female |
| Under 5 Years | 0 (0.0%) | 107 (64.1%) |
| 5 Years | 63 (100.0%) | 0 (0.0%) |
| 6 to 11 Years | 62 (56.9%) | 70 (100.0%) |
| 12 to 14 Years | 26 (100.0%) | 14 (100.0%) |
| 15 Years | 30 (100.0%) | 0 (0.0%) |
| 16 and 17 Years | 47 (100.0%) | 13 (100.0%) |
| 18 to 24 Years | 40 (90.9%) | 47 (78.3%) |
| 25 to 34 Years | 84 (100.0%) | 151 (75.5%) |
| 35 to 44 Years | 178 (100.0%) | 122 (100.0%) |
| 45 to 54 Years | 172 (100.0%) | 182 (100.0%) |
| 55 to 64 Years | 126 (72.0%) | 116 (100.0%) |
| 65 to 74 Years | 131 (100.0%) | 89 (100.0%) |
| 75 Years and over | 42 (34.4%) | 0 (0.0%) |
| Total | 1,001 (80.7%) | 911 (88.2%) |
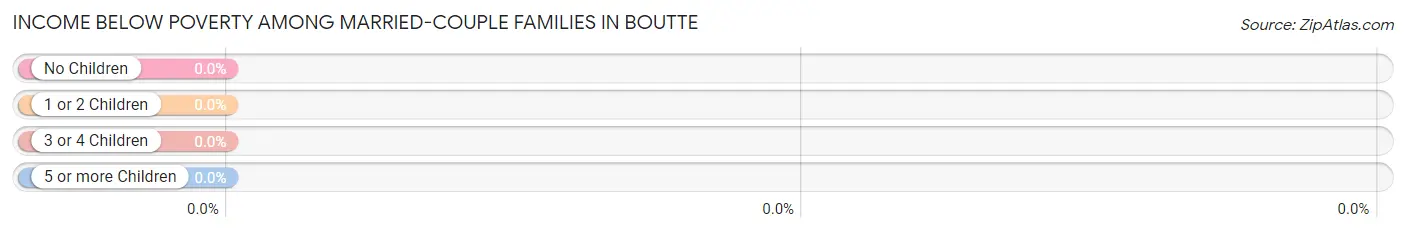
Income Below Poverty Among Married-Couple Families in Boutte
| Children | Above Poverty | Below Poverty |
| No Children | 260 (100.0%) | 0 (0.0%) |
| 1 or 2 Children | 140 (100.0%) | 0 (0.0%) |
| 3 or 4 Children | 0 (0.0%) | 0 (0.0%) |
| 5 or more Children | 0 (0.0%) | 0 (0.0%) |
| Total | 400 (100.0%) | 0 (0.0%) |
Income Below Poverty Among Single-Parent Households in Boutte
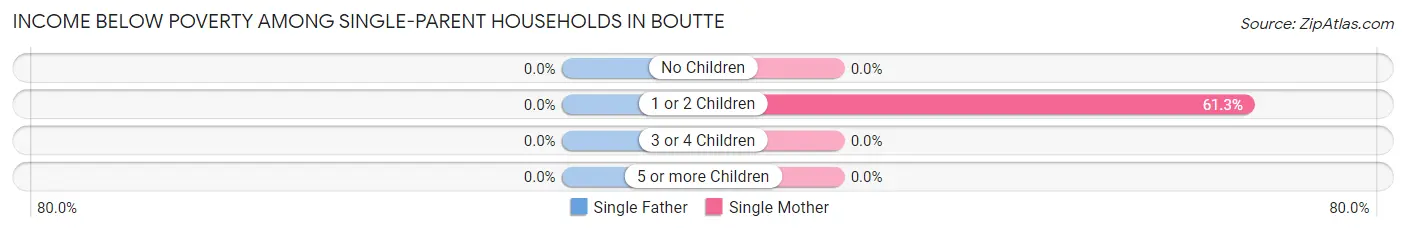
| Children | Single Father | Single Mother |
| No Children | 0 (0.0%) | 0 (0.0%) |
| 1 or 2 Children | 0 (0.0%) | 49 (61.3%) |
| 3 or 4 Children | 0 (0.0%) | 0 (0.0%) |
| 5 or more Children | 0 (0.0%) | 0 (0.0%) |
| Total | 0 (0.0%) | 49 (51.0%) |
Income Below Poverty Among Married-Couple vs Single-Parent Households in Boutte
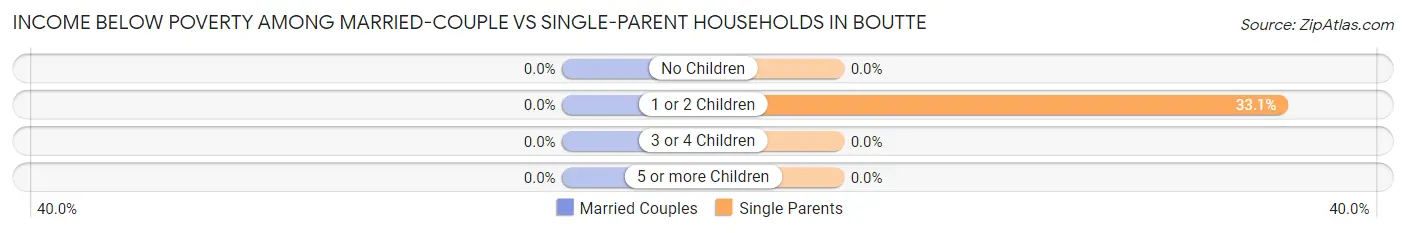
| Children | Married-Couple Families | Single-Parent Households |
| No Children | 0 (0.0%) | 0 (0.0%) |
| 1 or 2 Children | 0 (0.0%) | 49 (33.1%) |
| 3 or 4 Children | 0 (0.0%) | 0 (0.0%) |
| 5 or more Children | 0 (0.0%) | 0 (0.0%) |
| Total | 0 (0.0%) | 49 (27.1%) |
Race in Boutte
The most populous races in Boutte are Black / African American (1,397 | 61.4%), White / Caucasian (777 | 34.2%), and Hispanic or Latino (106 | 4.7%).
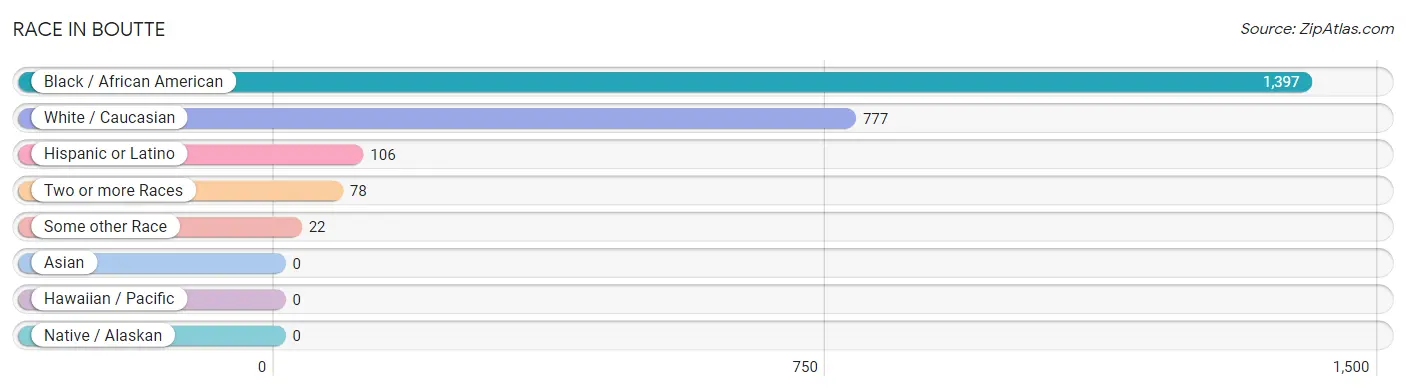
| Race | # Population | % Population |
| Asian | 0 | 0.0% |
| Black / African American | 1,397 | 61.4% |
| Hawaiian / Pacific | 0 | 0.0% |
| Hispanic or Latino | 106 | 4.7% |
| Native / Alaskan | 0 | 0.0% |
| White / Caucasian | 777 | 34.2% |
| Two or more Races | 78 | 3.4% |
| Some other Race | 22 | 1.0% |
| Total | 2,274 | 100.0% |
Ancestry in Boutte
The most populous ancestries reported in Boutte are French (285 | 12.5%), German (195 | 8.6%), Italian (167 | 7.3%), American (126 | 5.5%), and Irish (79 | 3.5%), together accounting for 37.5% of all Boutte residents.
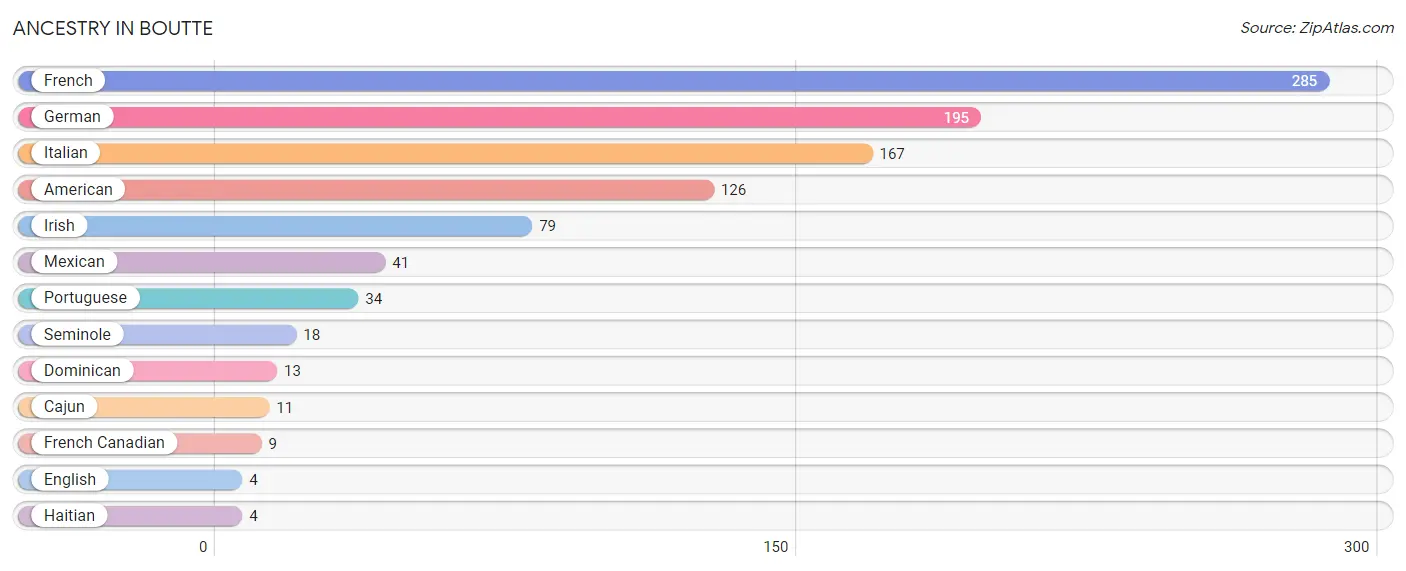
| Ancestry | # Population | % Population |
| American | 126 | 5.5% |
| Cajun | 11 | 0.5% |
| Dominican | 13 | 0.6% |
| English | 4 | 0.2% |
| French | 285 | 12.5% |
| French Canadian | 9 | 0.4% |
| German | 195 | 8.6% |
| Haitian | 4 | 0.2% |
| Irish | 79 | 3.5% |
| Italian | 167 | 7.3% |
| Mexican | 41 | 1.8% |
| Portuguese | 34 | 1.5% |
| Seminole | 18 | 0.8% | View All 13 Rows |
Immigrants in Boutte
The most numerous immigrant groups reported in Boutte came from Latin America (41 | 1.8%), Central America (28 | 1.2%), Mexico (22 | 1.0%), Caribbean (13 | 0.6%), and Dominican Republic (13 | 0.6%), together accounting for 5.1% of all Boutte residents.
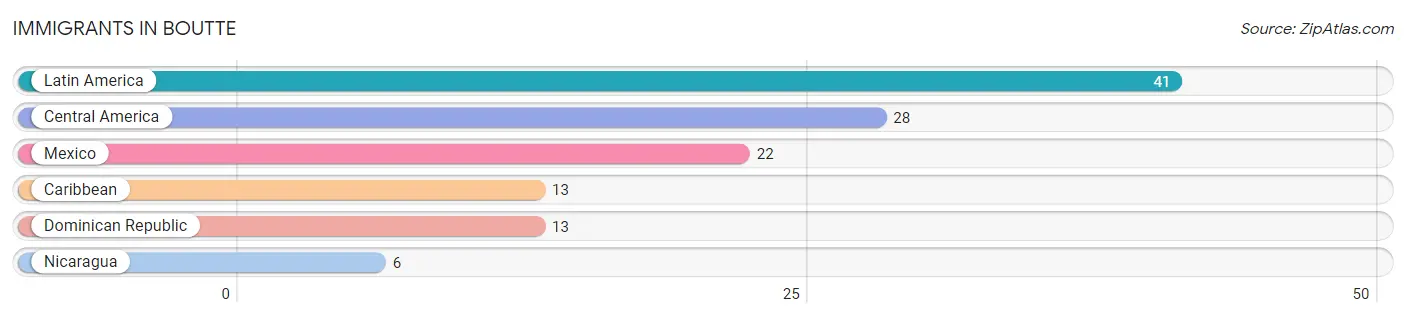
| Immigration Origin | # Population | % Population |
| Caribbean | 13 | 0.6% |
| Central America | 28 | 1.2% |
| Dominican Republic | 13 | 0.6% |
| Latin America | 41 | 1.8% |
| Mexico | 22 | 1.0% |
| Nicaragua | 6 | 0.3% | View All 6 Rows |
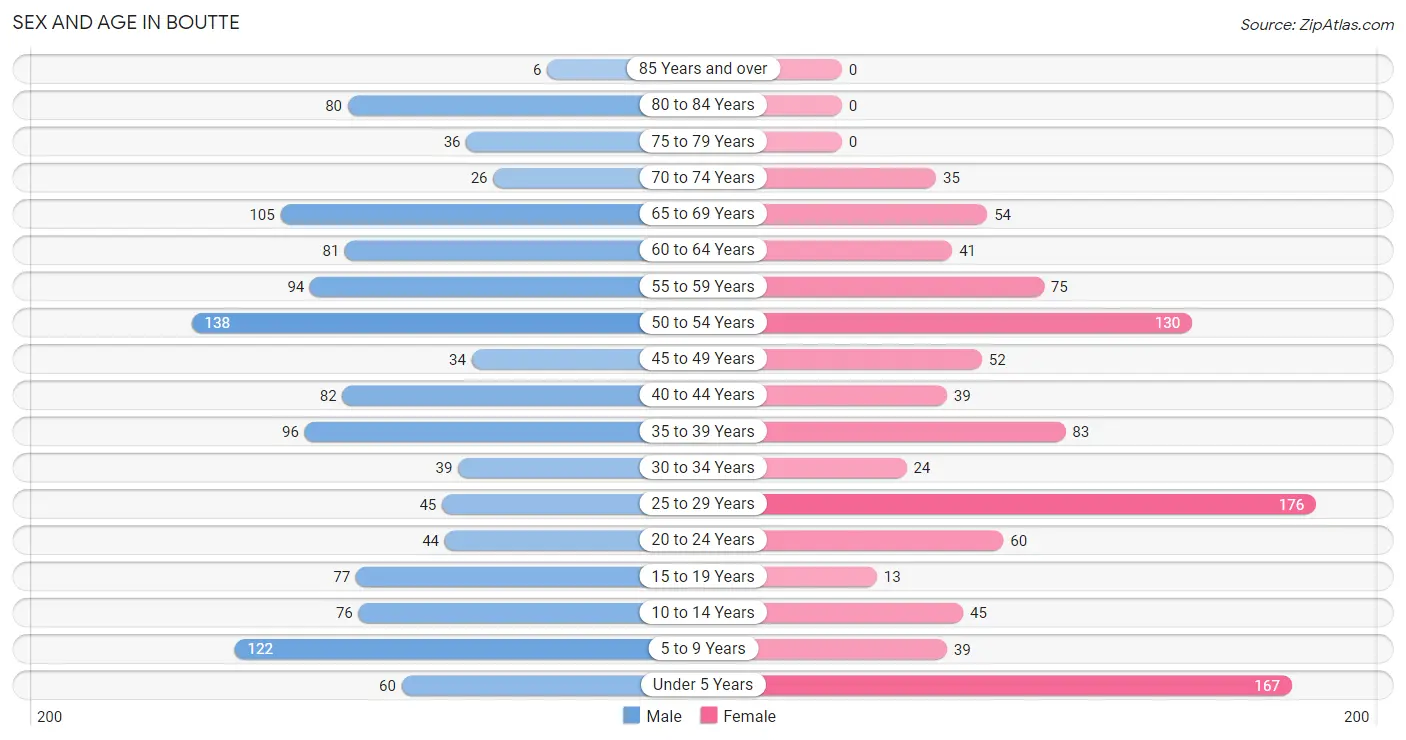
Sex and Age in Boutte
Sex and Age in Boutte
The most populous age groups in Boutte are 50 to 54 Years (138 | 11.1%) for men and 25 to 29 Years (176 | 17.0%) for women.
| Age Bracket | Male | Female |
| Under 5 Years | 60 (4.8%) | 167 (16.2%) |
| 5 to 9 Years | 122 (9.8%) | 39 (3.8%) |
| 10 to 14 Years | 76 (6.1%) | 45 (4.4%) |
| 15 to 19 Years | 77 (6.2%) | 13 (1.3%) |
| 20 to 24 Years | 44 (3.5%) | 60 (5.8%) |
| 25 to 29 Years | 45 (3.6%) | 176 (17.0%) |
| 30 to 34 Years | 39 (3.1%) | 24 (2.3%) |
| 35 to 39 Years | 96 (7.7%) | 83 (8.0%) |
| 40 to 44 Years | 82 (6.6%) | 39 (3.8%) |
| 45 to 49 Years | 34 (2.7%) | 52 (5.0%) |
| 50 to 54 Years | 138 (11.1%) | 130 (12.6%) |
| 55 to 59 Years | 94 (7.6%) | 75 (7.3%) |
| 60 to 64 Years | 81 (6.5%) | 41 (4.0%) |
| 65 to 69 Years | 105 (8.5%) | 54 (5.2%) |
| 70 to 74 Years | 26 (2.1%) | 35 (3.4%) |
| 75 to 79 Years | 36 (2.9%) | 0 (0.0%) |
| 80 to 84 Years | 80 (6.5%) | 0 (0.0%) |
| 85 Years and over | 6 (0.5%) | 0 (0.0%) |
| Total | 1,241 (100.0%) | 1,033 (100.0%) |
Families and Households in Boutte
Median Family Size in Boutte
The median family size in Boutte is 3.39 persons per family, with single female/mother families (96 | 16.5%) accounting for the largest median family size of 3.73 persons per family. On the other hand, married-couple families (400 | 68.9%) represent the smallest median family size with 3.27 persons per family.
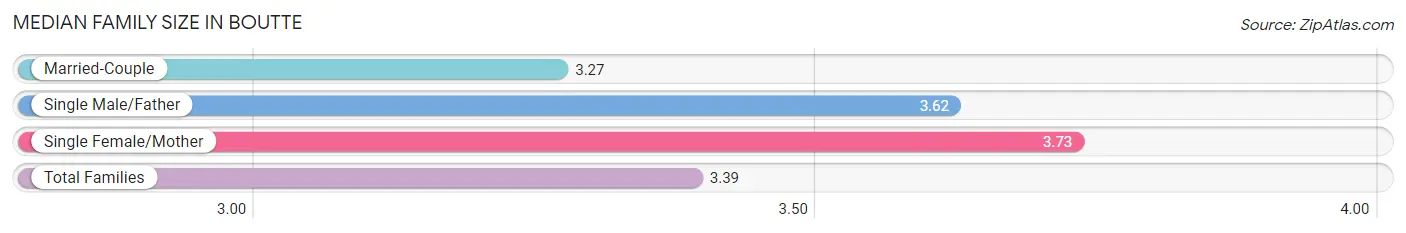
| Family Type | # Families | Family Size |
| Married-Couple | 400 (68.9%) | 3.27 |
| Single Male/Father | 85 (14.6%) | 3.62 |
| Single Female/Mother | 96 (16.5%) | 3.73 |
| Total Families | 581 (100.0%) | 3.39 |
Median Household Size in Boutte
The median household size in Boutte is 2.75 persons per household, with single female/mother households (96 | 11.6%) accounting for the largest median household size of 3.95 persons per household. non-family households (245 | 29.7%) represent the smallest median household size with 1.05 persons per household.
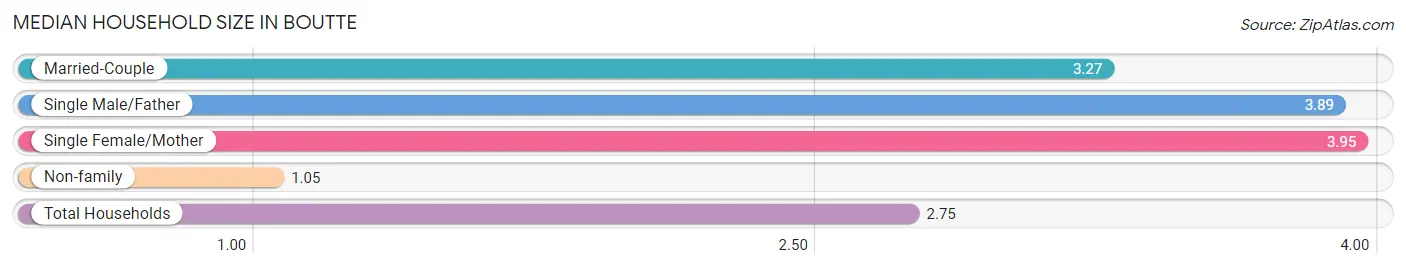
| Household Type | # Households | Household Size |
| Married-Couple | 400 (48.4%) | 3.27 |
| Single Male/Father | 85 (10.3%) | 3.89 |
| Single Female/Mother | 96 (11.6%) | 3.95 |
| Non-family | 245 (29.7%) | 1.05 |
| Total Households | 826 (100.0%) | 2.75 |
Household Size by Marriage Status in Boutte
Out of a total of 826 households in Boutte, 581 (70.3%) are family households, while 245 (29.7%) are nonfamily households. The most numerous type of family households are 2-person households, comprising 331, and the most common type of nonfamily households are 1-person households, comprising 241.
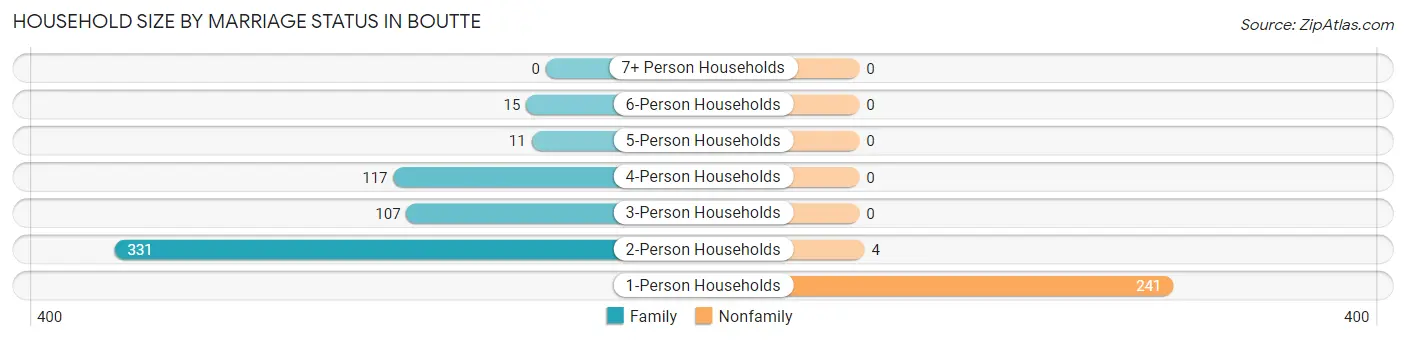
| Household Size | Family Households | Nonfamily Households |
| 1-Person Households | - | 241 (29.2%) |
| 2-Person Households | 331 (40.1%) | 4 (0.5%) |
| 3-Person Households | 107 (13.0%) | 0 (0.0%) |
| 4-Person Households | 117 (14.2%) | 0 (0.0%) |
| 5-Person Households | 11 (1.3%) | 0 (0.0%) |
| 6-Person Households | 15 (1.8%) | 0 (0.0%) |
| 7+ Person Households | 0 (0.0%) | 0 (0.0%) |
| Total | 581 (70.3%) | 245 (29.7%) |
Female Fertility in Boutte
Fertility by Age in Boutte
Average fertility rate in Boutte is 61.0 births per 1,000 women. Women in the age bracket of 20 to 34 years have the highest fertility rate with 108.0 births per 1,000 women. Women in the age bracket of 20 to 34 years acount for 100.0% of all women with births.
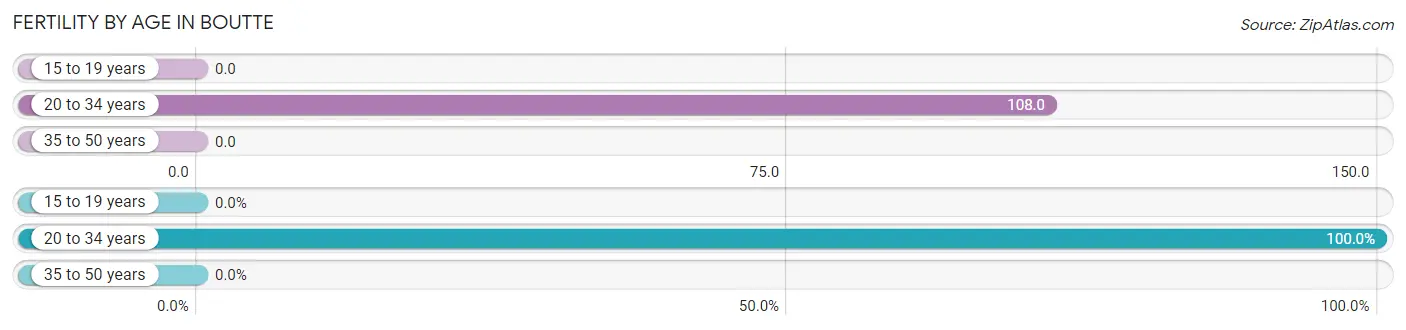
| Age Bracket | Women with Births | Births / 1,000 Women |
| 15 to 19 years | 0 (0.0%) | 0.0 |
| 20 to 34 years | 28 (100.0%) | 108.0 |
| 35 to 50 years | 0 (0.0%) | 0.0 |
| Total | 28 (100.0%) | 61.0 |
Fertility by Age by Marriage Status in Boutte
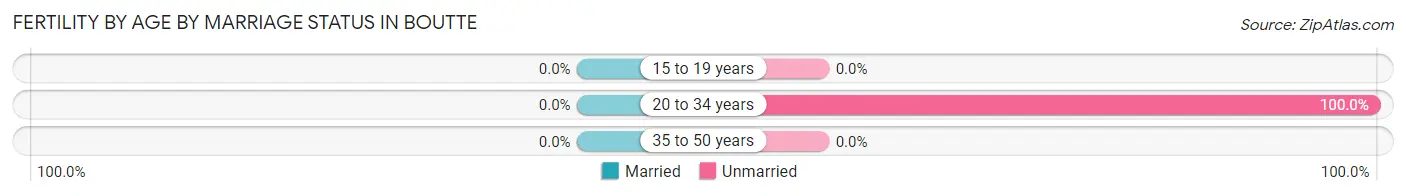
| Age Bracket | Married | Unmarried |
| 15 to 19 years | 0 (0.0%) | 0 (0.0%) |
| 20 to 34 years | 0 (0.0%) | 28 (100.0%) |
| 35 to 50 years | 0 (0.0%) | 0 (0.0%) |
| Total | 0 (0.0%) | 28 (100.0%) |
Fertility by Education in Boutte
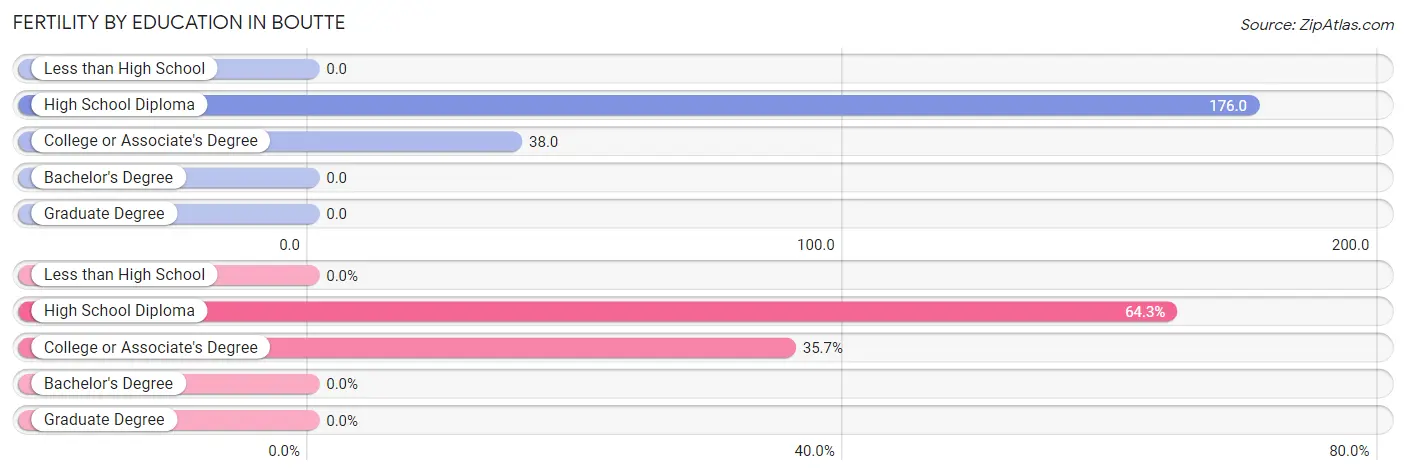
| Educational Attainment | Women with Births | Births / 1,000 Women |
| Less than High School | 0 (0.0%) | 0.0 |
| High School Diploma | 18 (64.3%) | 176.0 |
| College or Associate's Degree | 10 (35.7%) | 38.0 |
| Bachelor's Degree | 0 (0.0%) | 0.0 |
| Graduate Degree | 0 (0.0%) | 0.0 |
| Total | 28 (100.0%) | 61.0 |
Fertility by Education by Marriage Status in Boutte
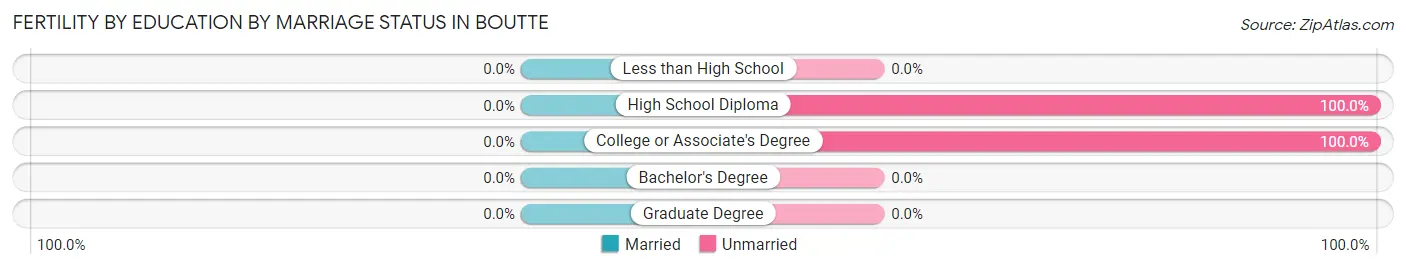
| Educational Attainment | Married | Unmarried |
| Less than High School | 0 (0.0%) | 0 (0.0%) |
| High School Diploma | 0 (0.0%) | 18 (100.0%) |
| College or Associate's Degree | 0 (0.0%) | 10 (100.0%) |
| Bachelor's Degree | 0 (0.0%) | 0 (0.0%) |
| Graduate Degree | 0 (0.0%) | 0 (0.0%) |
| Total | 0 (0.0%) | 28 (100.0%) |
Employment Characteristics in Boutte
Employment by Class of Employer in Boutte
Among the 973 employed individuals in Boutte, private company employees (726 | 74.6%), local government employees (99 | 10.2%), and not-for-profit organizations (89 | 9.1%) make up the most common classes of employment.
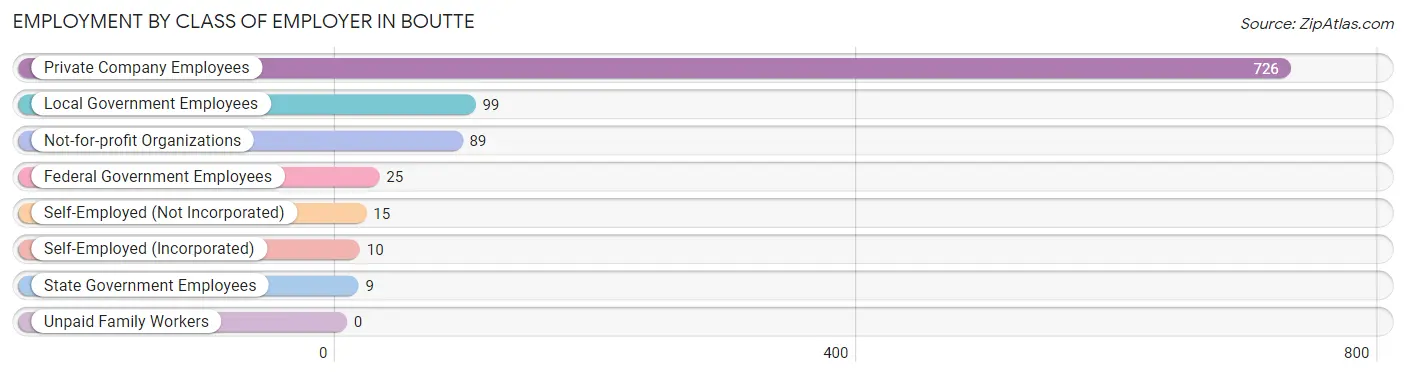
| Employer Class | # Employees | % Employees |
| Private Company Employees | 726 | 74.6% |
| Self-Employed (Incorporated) | 10 | 1.0% |
| Self-Employed (Not Incorporated) | 15 | 1.5% |
| Not-for-profit Organizations | 89 | 9.1% |
| Local Government Employees | 99 | 10.2% |
| State Government Employees | 9 | 0.9% |
| Federal Government Employees | 25 | 2.6% |
| Unpaid Family Workers | 0 | 0.0% |
| Total | 973 | 100.0% |
Employment Status by Age in Boutte
According to the labor force statistics for Boutte, out of the total population over 16 years of age (1,735), 63.9% or 1,109 individuals are in the labor force, with 12.4% or 138 of them unemployed. The age group with the highest labor force participation rate is 30 to 34 years, with 100.0% or 63 individuals in the labor force. Within the labor force, the 20 to 24 years age range has the highest percentage of unemployed individuals, with 34.8% or 23 of them being unemployed.
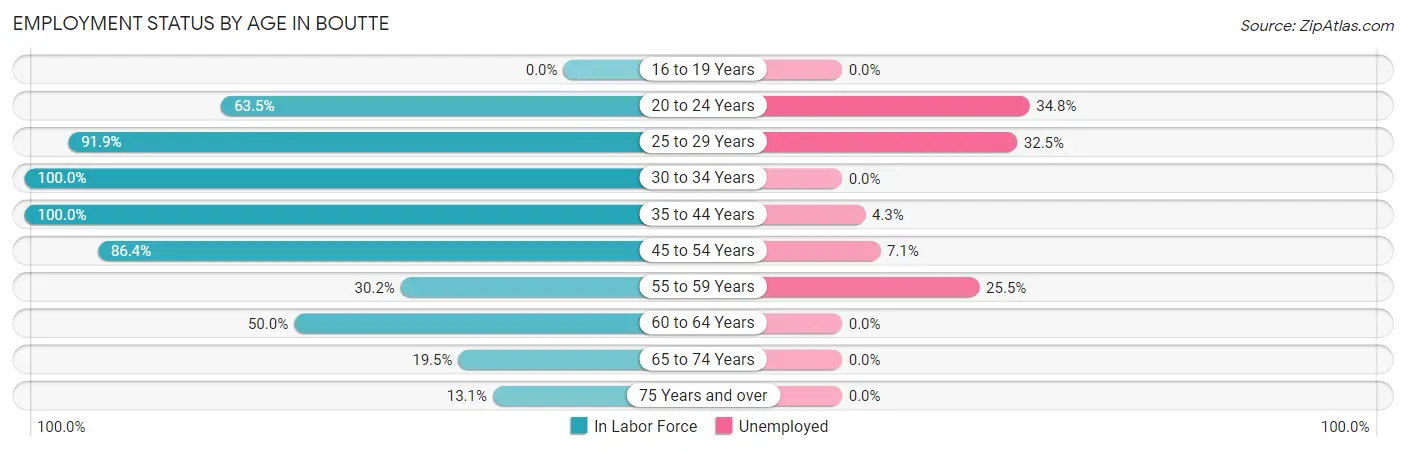
| Age Bracket | In Labor Force | Unemployed |
| 16 to 19 Years | 0 (0.0%) | 0 (0.0%) |
| 20 to 24 Years | 66 (63.5%) | 23 (34.8%) |
| 25 to 29 Years | 203 (91.9%) | 66 (32.5%) |
| 30 to 34 Years | 63 (100.0%) | 0 (0.0%) |
| 35 to 44 Years | 300 (100.0%) | 13 (4.3%) |
| 45 to 54 Years | 306 (86.4%) | 22 (7.1%) |
| 55 to 59 Years | 51 (30.2%) | 13 (25.5%) |
| 60 to 64 Years | 61 (50.0%) | 0 (0.0%) |
| 65 to 74 Years | 43 (19.5%) | 0 (0.0%) |
| 75 Years and over | 16 (13.1%) | 0 (0.0%) |
| Total | 1,109 (63.9%) | 138 (12.4%) |
Employment Status by Educational Attainment in Boutte
According to labor force statistics for Boutte, 80.1% of individuals (984) out of the total population between 25 and 64 years of age (1,229) are in the labor force, with 11.6% or 114 of them being unemployed. The group with the highest labor force participation rate are those with the educational attainment of college / associate degree, with 90.9% or 530 individuals in the labor force. Within the labor force, individuals with less than high school education have the highest percentage of unemployment, with 53.0% or 35 of them being unemployed.
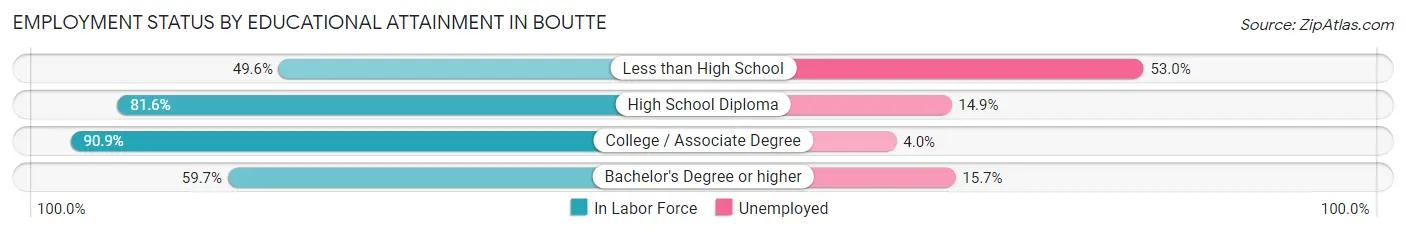
| Educational Attainment | In Labor Force | Unemployed |
| Less than High School | 66 (49.6%) | 70 (53.0%) |
| High School Diploma | 305 (81.6%) | 56 (14.9%) |
| College / Associate Degree | 530 (90.9%) | 23 (4.0%) |
| Bachelor's Degree or higher | 83 (59.7%) | 22 (15.7%) |
| Total | 984 (80.1%) | 143 (11.6%) |
Employment Occupations by Sex in Boutte
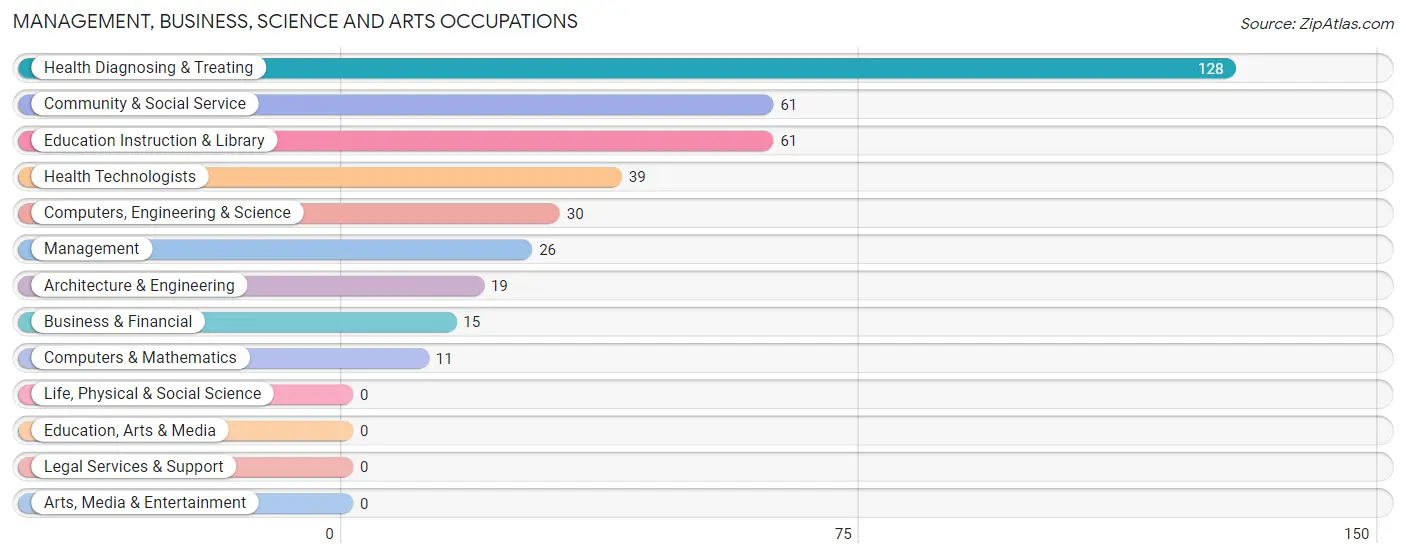
Management, Business, Science and Arts Occupations
The most common Management, Business, Science and Arts occupations in Boutte are Health Diagnosing & Treating (128 | 13.3%), Community & Social Service (61 | 6.3%), Education Instruction & Library (61 | 6.3%), Health Technologists (39 | 4.1%), and Computers, Engineering & Science (30 | 3.1%).
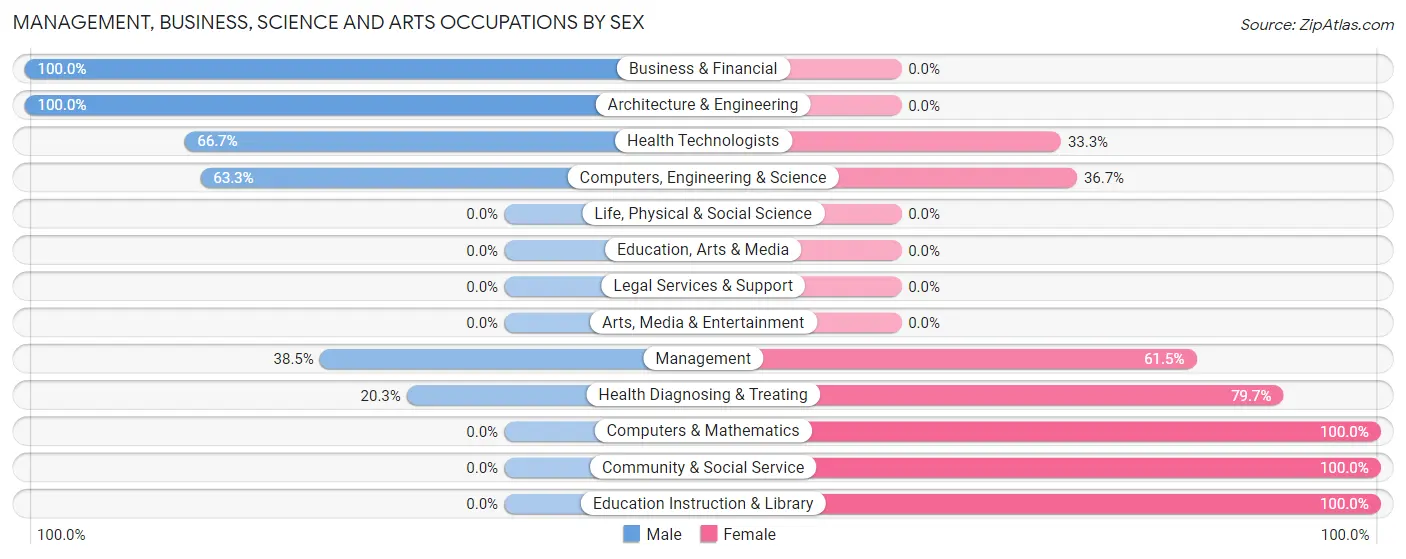
Management, Business, Science and Arts Occupations by Sex
Within the Management, Business, Science and Arts occupations in Boutte, the most male-oriented occupations are Business & Financial (100.0%), Architecture & Engineering (100.0%), and Health Technologists (66.7%), while the most female-oriented occupations are Computers & Mathematics (100.0%), Community & Social Service (100.0%), and Education Instruction & Library (100.0%).
| Occupation | Male | Female |
| Management | 10 (38.5%) | 16 (61.5%) |
| Business & Financial | 15 (100.0%) | 0 (0.0%) |
| Computers, Engineering & Science | 19 (63.3%) | 11 (36.7%) |
| Computers & Mathematics | 0 (0.0%) | 11 (100.0%) |
| Architecture & Engineering | 19 (100.0%) | 0 (0.0%) |
| Life, Physical & Social Science | 0 (0.0%) | 0 (0.0%) |
| Community & Social Service | 0 (0.0%) | 61 (100.0%) |
| Education, Arts & Media | 0 (0.0%) | 0 (0.0%) |
| Legal Services & Support | 0 (0.0%) | 0 (0.0%) |
| Education Instruction & Library | 0 (0.0%) | 61 (100.0%) |
| Arts, Media & Entertainment | 0 (0.0%) | 0 (0.0%) |
| Health Diagnosing & Treating | 26 (20.3%) | 102 (79.7%) |
| Health Technologists | 26 (66.7%) | 13 (33.3%) |
| Total (Category) | 70 (26.9%) | 190 (73.1%) |
| Total (Overall) | 521 (54.0%) | 443 (46.0%) |
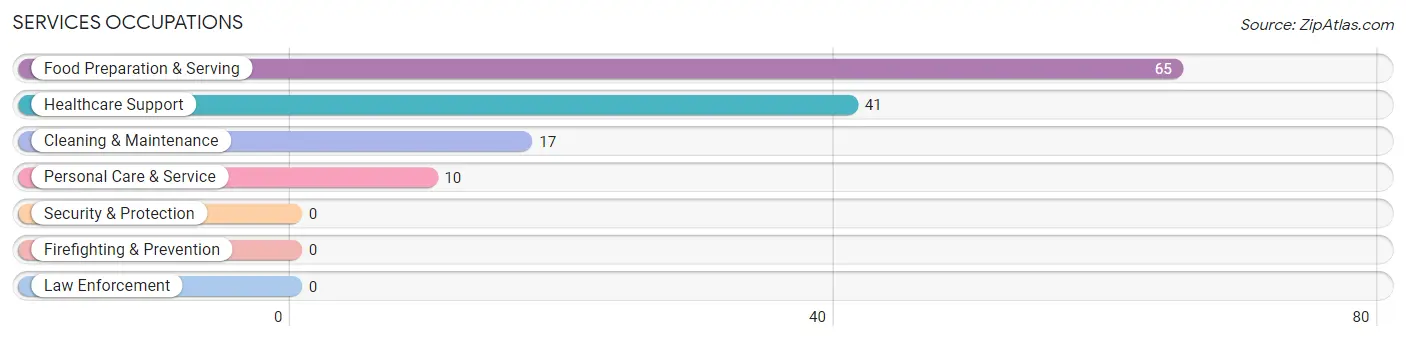
Services Occupations
The most common Services occupations in Boutte are Food Preparation & Serving (65 | 6.7%), Healthcare Support (41 | 4.3%), Cleaning & Maintenance (17 | 1.8%), and Personal Care & Service (10 | 1.0%).
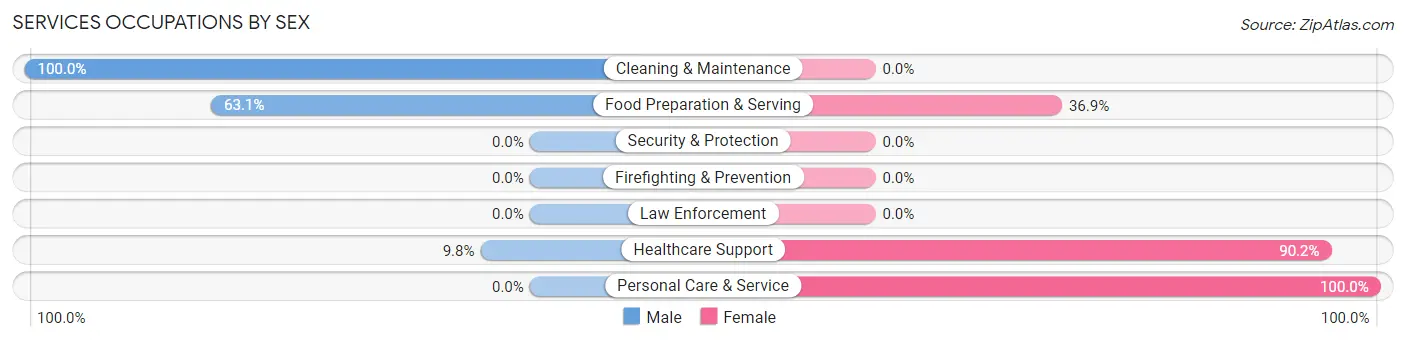
Services Occupations by Sex
Within the Services occupations in Boutte, the most male-oriented occupations are Cleaning & Maintenance (100.0%), Food Preparation & Serving (63.1%), and Healthcare Support (9.8%), while the most female-oriented occupations are Personal Care & Service (100.0%), Healthcare Support (90.2%), and Food Preparation & Serving (36.9%).
| Occupation | Male | Female |
| Healthcare Support | 4 (9.8%) | 37 (90.2%) |
| Security & Protection | 0 (0.0%) | 0 (0.0%) |
| Firefighting & Prevention | 0 (0.0%) | 0 (0.0%) |
| Law Enforcement | 0 (0.0%) | 0 (0.0%) |
| Food Preparation & Serving | 41 (63.1%) | 24 (36.9%) |
| Cleaning & Maintenance | 17 (100.0%) | 0 (0.0%) |
| Personal Care & Service | 0 (0.0%) | 10 (100.0%) |
| Total (Category) | 62 (46.6%) | 71 (53.4%) |
| Total (Overall) | 521 (54.0%) | 443 (46.0%) |
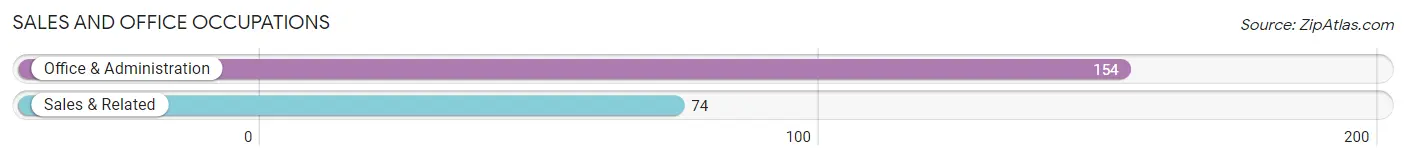
Sales and Office Occupations
The most common Sales and Office occupations in Boutte are Office & Administration (154 | 16.0%), and Sales & Related (74 | 7.7%).
Sales and Office Occupations by Sex
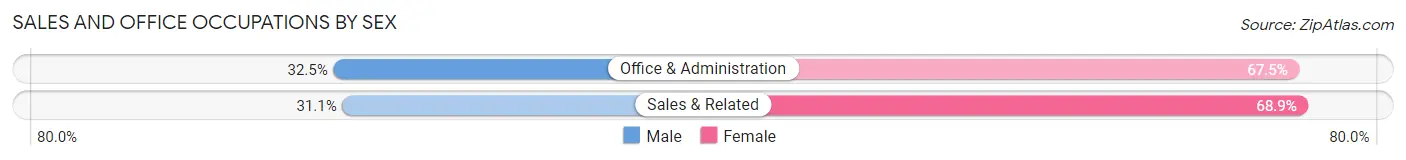
| Occupation | Male | Female |
| Sales & Related | 23 (31.1%) | 51 (68.9%) |
| Office & Administration | 50 (32.5%) | 104 (67.5%) |
| Total (Category) | 73 (32.0%) | 155 (68.0%) |
| Total (Overall) | 521 (54.0%) | 443 (46.0%) |
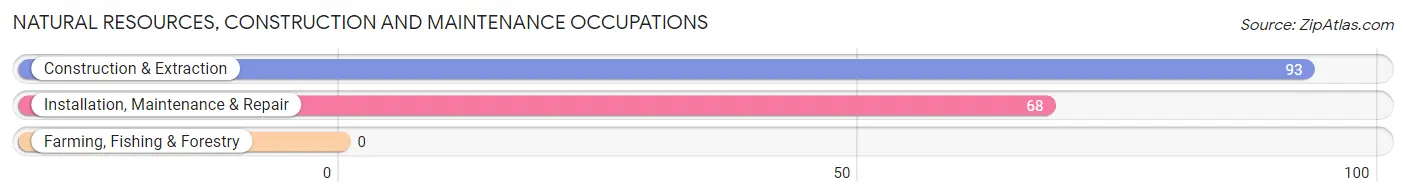
Natural Resources, Construction and Maintenance Occupations
The most common Natural Resources, Construction and Maintenance occupations in Boutte are Construction & Extraction (93 | 9.7%), and Installation, Maintenance & Repair (68 | 7.0%).
Natural Resources, Construction and Maintenance Occupations by Sex
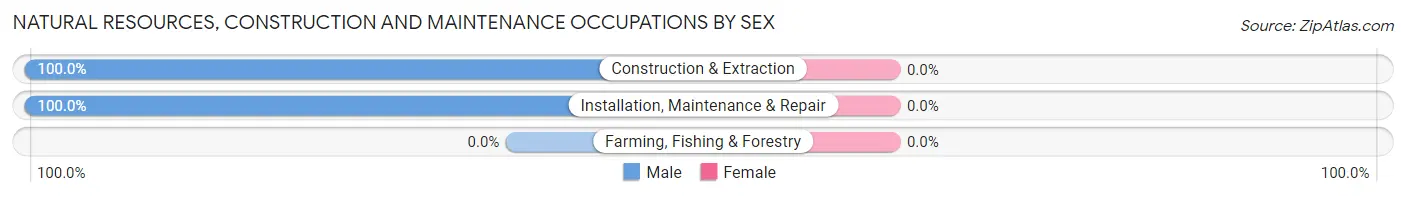
| Occupation | Male | Female |
| Farming, Fishing & Forestry | 0 (0.0%) | 0 (0.0%) |
| Construction & Extraction | 93 (100.0%) | 0 (0.0%) |
| Installation, Maintenance & Repair | 68 (100.0%) | 0 (0.0%) |
| Total (Category) | 161 (100.0%) | 0 (0.0%) |
| Total (Overall) | 521 (54.0%) | 443 (46.0%) |
Production, Transportation and Moving Occupations
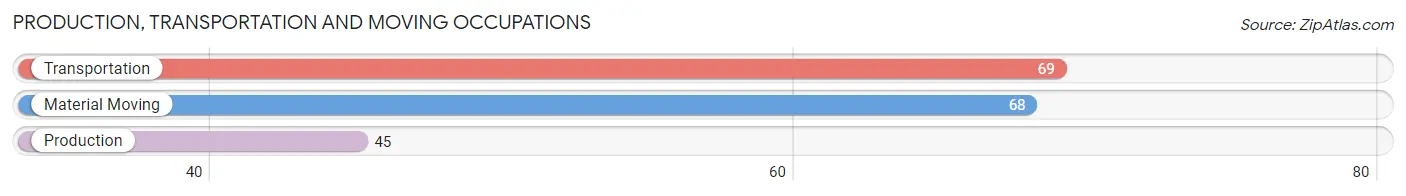
The most common Production, Transportation and Moving occupations in Boutte are Transportation (69 | 7.2%), Material Moving (68 | 7.0%), and Production (45 | 4.7%).
Production, Transportation and Moving Occupations by Sex
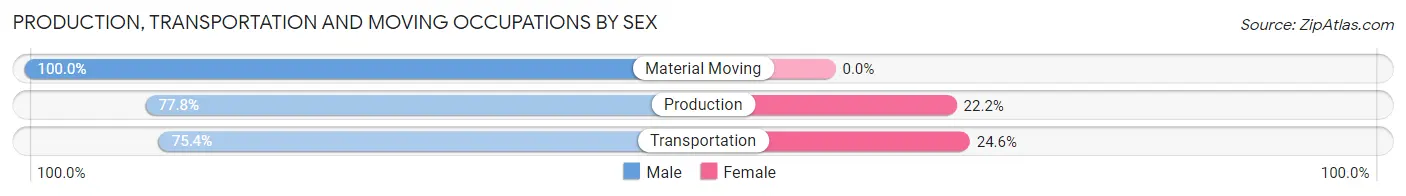
| Occupation | Male | Female |
| Production | 35 (77.8%) | 10 (22.2%) |
| Transportation | 52 (75.4%) | 17 (24.6%) |
| Material Moving | 68 (100.0%) | 0 (0.0%) |
| Total (Category) | 155 (85.2%) | 27 (14.8%) |
| Total (Overall) | 521 (54.0%) | 443 (46.0%) |
Employment Industries by Sex in Boutte
Employment Industries in Boutte
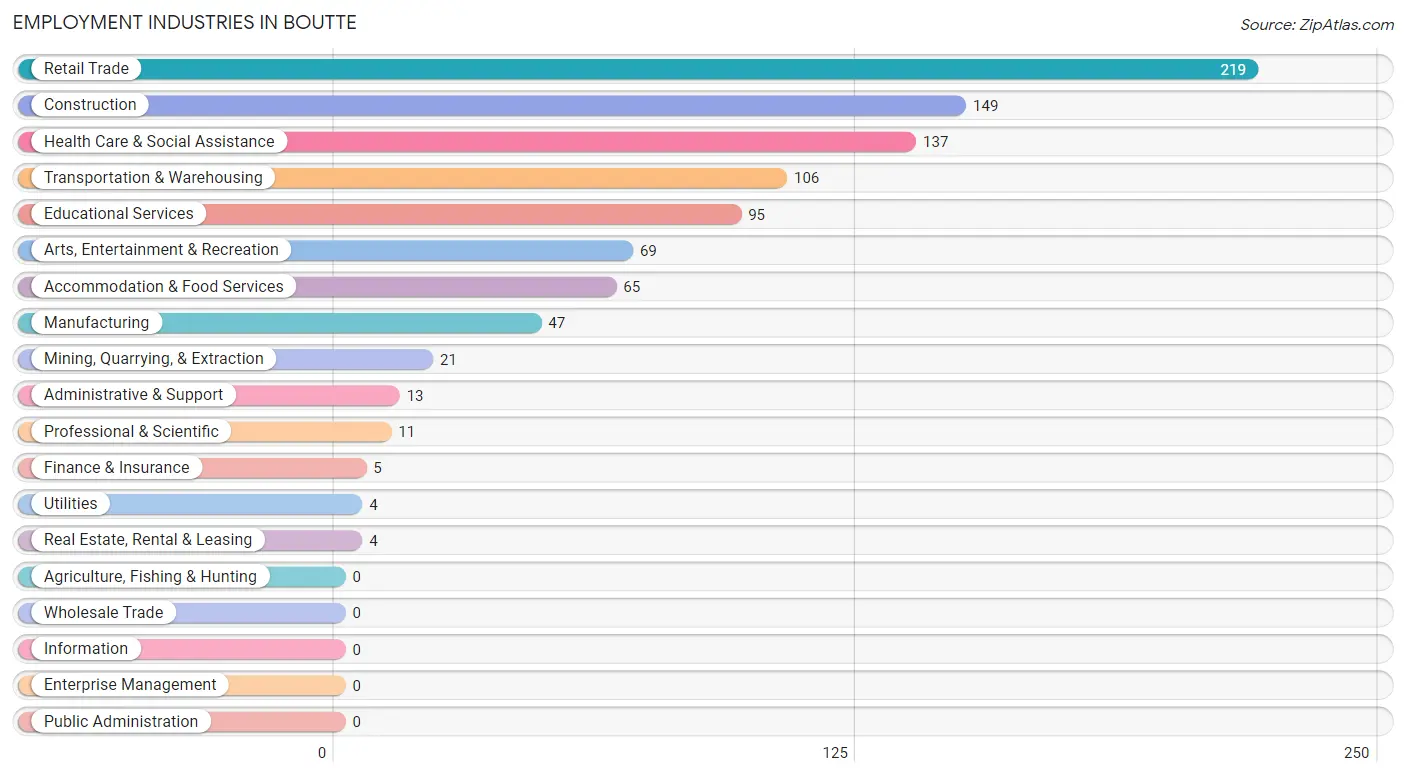
The major employment industries in Boutte include Retail Trade (219 | 22.7%), Construction (149 | 15.5%), Health Care & Social Assistance (137 | 14.2%), Transportation & Warehousing (106 | 11.0%), and Educational Services (95 | 9.9%).
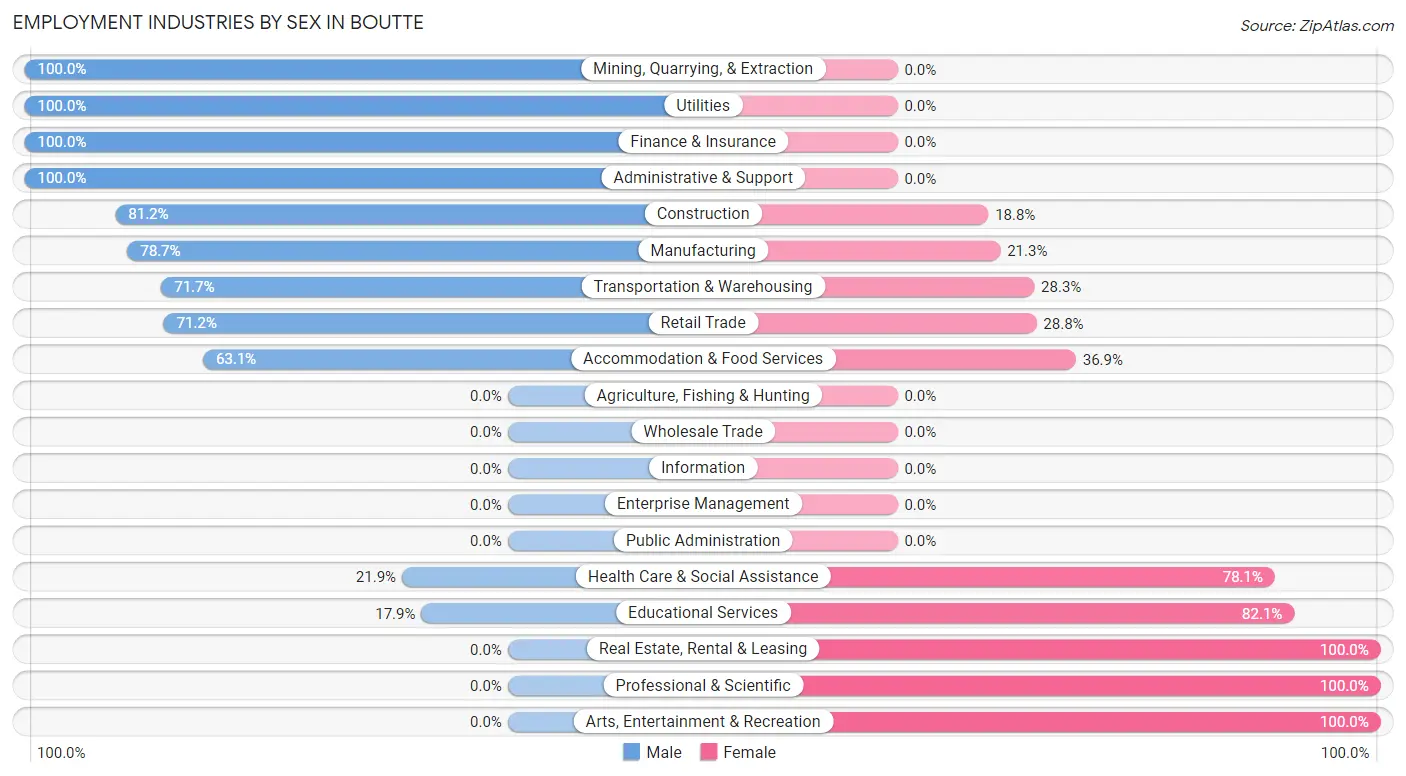
Employment Industries by Sex in Boutte
The Boutte industries that see more men than women are Mining, Quarrying, & Extraction (100.0%), Utilities (100.0%), and Finance & Insurance (100.0%), whereas the industries that tend to have a higher number of women are Real Estate, Rental & Leasing (100.0%), Professional & Scientific (100.0%), and Arts, Entertainment & Recreation (100.0%).
| Industry | Male | Female |
| Agriculture, Fishing & Hunting | 0 (0.0%) | 0 (0.0%) |
| Mining, Quarrying, & Extraction | 21 (100.0%) | 0 (0.0%) |
| Construction | 121 (81.2%) | 28 (18.8%) |
| Manufacturing | 37 (78.7%) | 10 (21.3%) |
| Wholesale Trade | 0 (0.0%) | 0 (0.0%) |
| Retail Trade | 156 (71.2%) | 63 (28.8%) |
| Transportation & Warehousing | 76 (71.7%) | 30 (28.3%) |
| Utilities | 4 (100.0%) | 0 (0.0%) |
| Information | 0 (0.0%) | 0 (0.0%) |
| Finance & Insurance | 5 (100.0%) | 0 (0.0%) |
| Real Estate, Rental & Leasing | 0 (0.0%) | 4 (100.0%) |
| Professional & Scientific | 0 (0.0%) | 11 (100.0%) |
| Enterprise Management | 0 (0.0%) | 0 (0.0%) |
| Administrative & Support | 13 (100.0%) | 0 (0.0%) |
| Educational Services | 17 (17.9%) | 78 (82.1%) |
| Health Care & Social Assistance | 30 (21.9%) | 107 (78.1%) |
| Arts, Entertainment & Recreation | 0 (0.0%) | 69 (100.0%) |
| Accommodation & Food Services | 41 (63.1%) | 24 (36.9%) |
| Public Administration | 0 (0.0%) | 0 (0.0%) |
| Total | 521 (54.0%) | 443 (46.0%) |
Education in Boutte
School Enrollment in Boutte
The most common levels of schooling among the 539 students in Boutte are elementary school (119 | 22.1%), high school (108 | 20.0%), and nursery / preschool (107 | 19.9%).
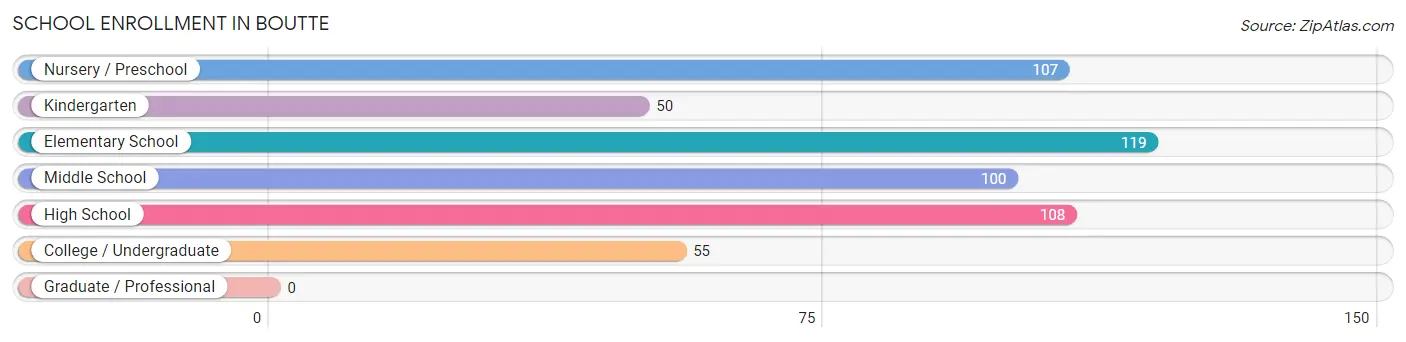
| School Level | # Students | % Students |
| Nursery / Preschool | 107 | 19.9% |
| Kindergarten | 50 | 9.3% |
| Elementary School | 119 | 22.1% |
| Middle School | 100 | 18.5% |
| High School | 108 | 20.0% |
| College / Undergraduate | 55 | 10.2% |
| Graduate / Professional | 0 | 0.0% |
| Total | 539 | 100.0% |
School Enrollment by Age by Funding Source in Boutte
Out of a total of 539 students who are enrolled in schools in Boutte, 137 (25.4%) attend a private institution, while the remaining 402 (74.6%) are enrolled in public schools. The age group of 3 to 4 year olds has the highest likelihood of being enrolled in private schools, with 107 (100.0% in the age bracket) enrolled. Conversely, the age group of 5 to 9 year old has the lowest likelihood of being enrolled in a private school, with 148 (100.0% in the age bracket) attending a public institution.
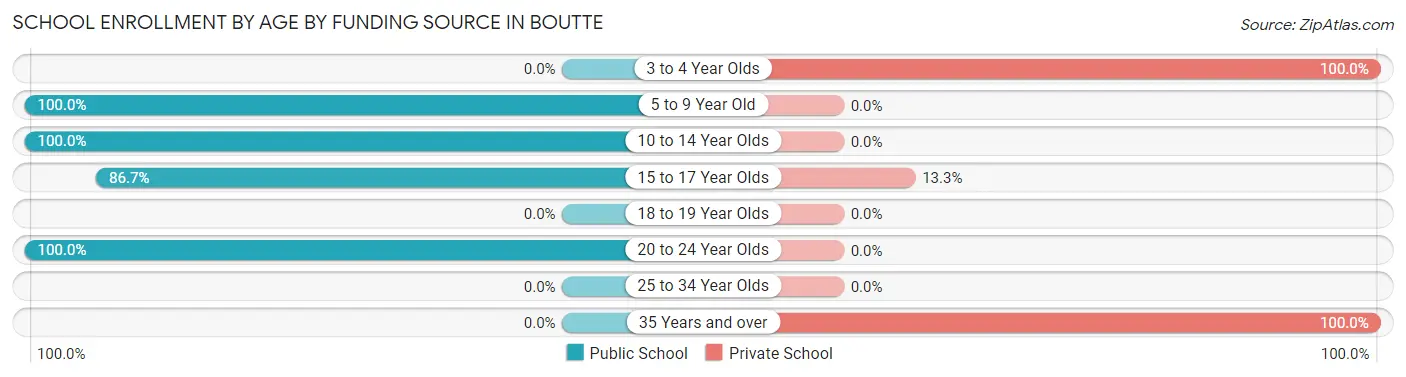
| Age Bracket | Public School | Private School |
| 3 to 4 Year Olds | 0 (0.0%) | 107 (100.0%) |
| 5 to 9 Year Old | 148 (100.0%) | 0 (0.0%) |
| 10 to 14 Year Olds | 121 (100.0%) | 0 (0.0%) |
| 15 to 17 Year Olds | 78 (86.7%) | 12 (13.3%) |
| 18 to 19 Year Olds | 0 (0.0%) | 0 (0.0%) |
| 20 to 24 Year Olds | 55 (100.0%) | 0 (0.0%) |
| 25 to 34 Year Olds | 0 (0.0%) | 0 (0.0%) |
| 35 Years and over | 0 (0.0%) | 18 (100.0%) |
| Total | 402 (74.6%) | 137 (25.4%) |
Educational Attainment by Field of Study in Boutte
Liberal arts & history (56 | 23.3%), computers & mathematics (49 | 20.4%), science & technology (38 | 15.8%), social sciences (28 | 11.7%), and physical & health sciences (20 | 8.3%) are the most common fields of study among 240 individuals in Boutte who have obtained a bachelor's degree or higher.
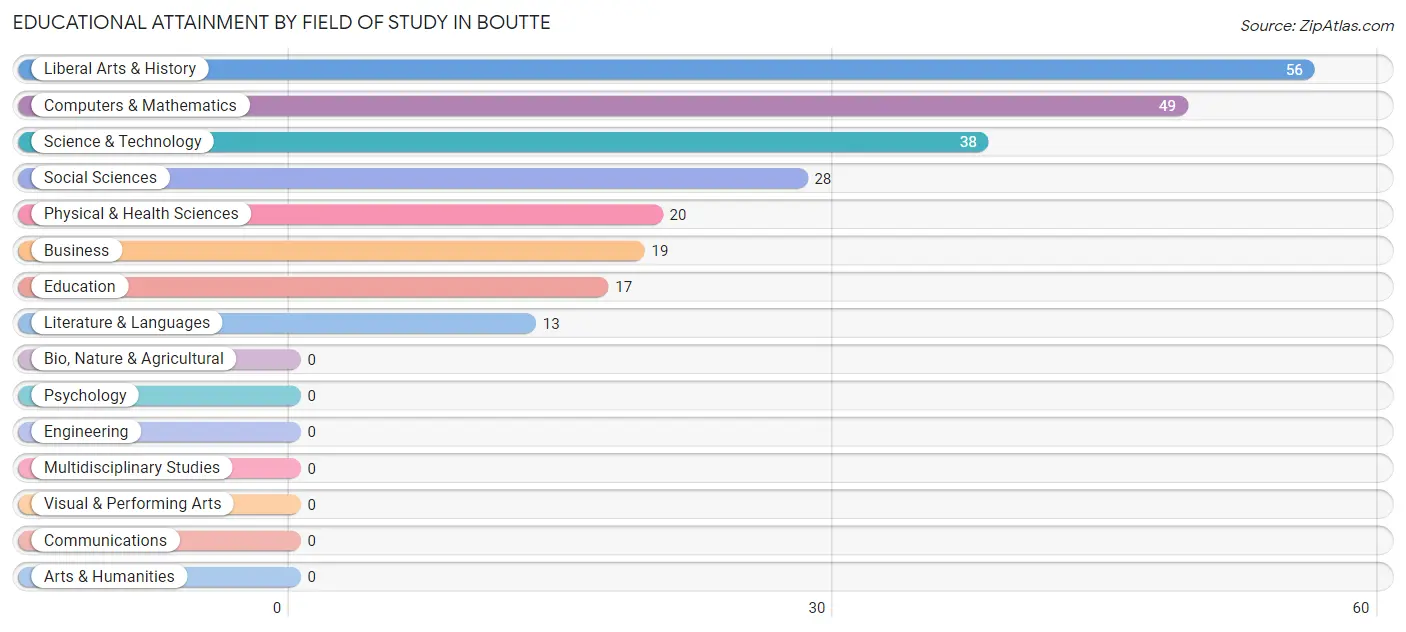
| Field of Study | # Graduates | % Graduates |
| Computers & Mathematics | 49 | 20.4% |
| Bio, Nature & Agricultural | 0 | 0.0% |
| Physical & Health Sciences | 20 | 8.3% |
| Psychology | 0 | 0.0% |
| Social Sciences | 28 | 11.7% |
| Engineering | 0 | 0.0% |
| Multidisciplinary Studies | 0 | 0.0% |
| Science & Technology | 38 | 15.8% |
| Business | 19 | 7.9% |
| Education | 17 | 7.1% |
| Literature & Languages | 13 | 5.4% |
| Liberal Arts & History | 56 | 23.3% |
| Visual & Performing Arts | 0 | 0.0% |
| Communications | 0 | 0.0% |
| Arts & Humanities | 0 | 0.0% |
| Total | 240 | 100.0% |
Transportation & Commute in Boutte
Vehicle Availability by Sex in Boutte
The most prevalent vehicle ownership categories in Boutte are males with 2 vehicles (252, accounting for 47.5%) and females with 2 vehicles (95, making up 56.9%).
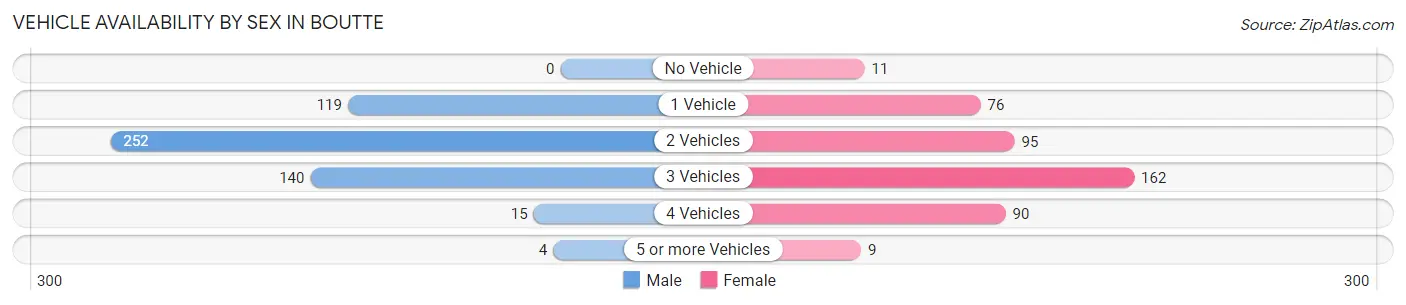
| Vehicles Available | Male | Female |
| No Vehicle | 0 (0.0%) | 11 (2.5%) |
| 1 Vehicle | 119 (22.5%) | 76 (17.2%) |
| 2 Vehicles | 252 (47.5%) | 95 (21.4%) |
| 3 Vehicles | 140 (26.4%) | 162 (36.6%) |
| 4 Vehicles | 15 (2.8%) | 90 (20.3%) |
| 5 or more Vehicles | 4 (0.7%) | 9 (2.0%) |
| Total | 530 (100.0%) | 443 (100.0%) |
Commute Time in Boutte
The most frequently occuring commute durations in Boutte are 30 to 34 minutes (194 commuters, 20.2%), 45 to 59 minutes (135 commuters, 14.0%), and 25 to 29 minutes (127 commuters, 13.2%).
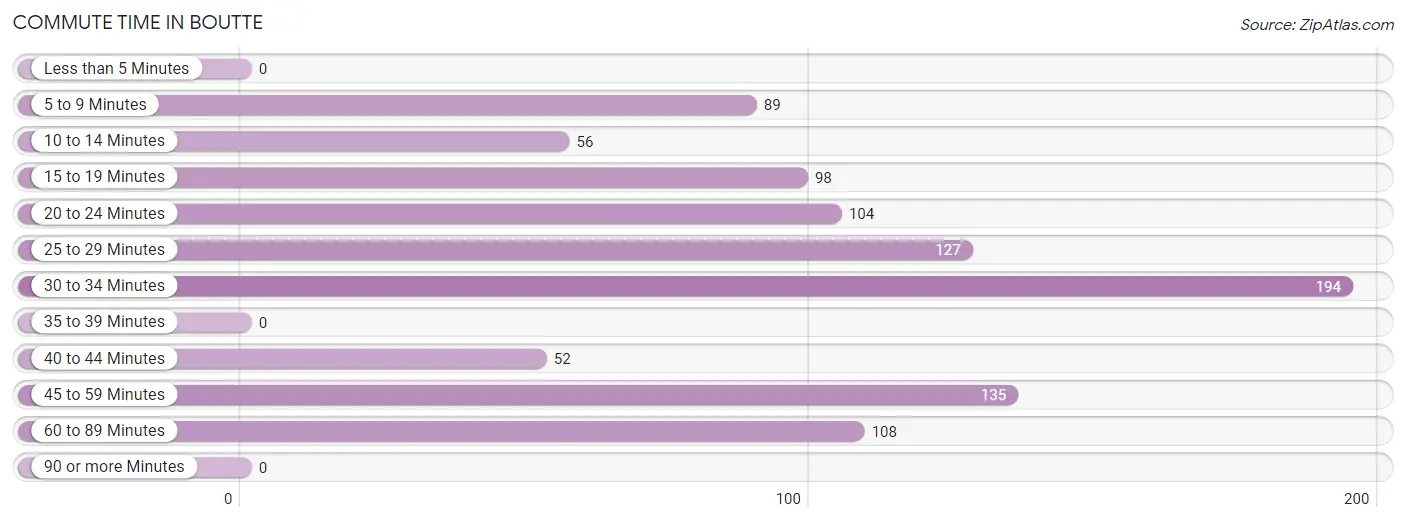
| Commute Time | # Commuters | % Commuters |
| Less than 5 Minutes | 0 | 0.0% |
| 5 to 9 Minutes | 89 | 9.2% |
| 10 to 14 Minutes | 56 | 5.8% |
| 15 to 19 Minutes | 98 | 10.2% |
| 20 to 24 Minutes | 104 | 10.8% |
| 25 to 29 Minutes | 127 | 13.2% |
| 30 to 34 Minutes | 194 | 20.2% |
| 35 to 39 Minutes | 0 | 0.0% |
| 40 to 44 Minutes | 52 | 5.4% |
| 45 to 59 Minutes | 135 | 14.0% |
| 60 to 89 Minutes | 108 | 11.2% |
| 90 or more Minutes | 0 | 0.0% |
Commute Time by Sex in Boutte
The most common commute times in Boutte are 30 to 34 minutes (97 commuters, 18.3%) for males and 30 to 34 minutes (97 commuters, 22.4%) for females.
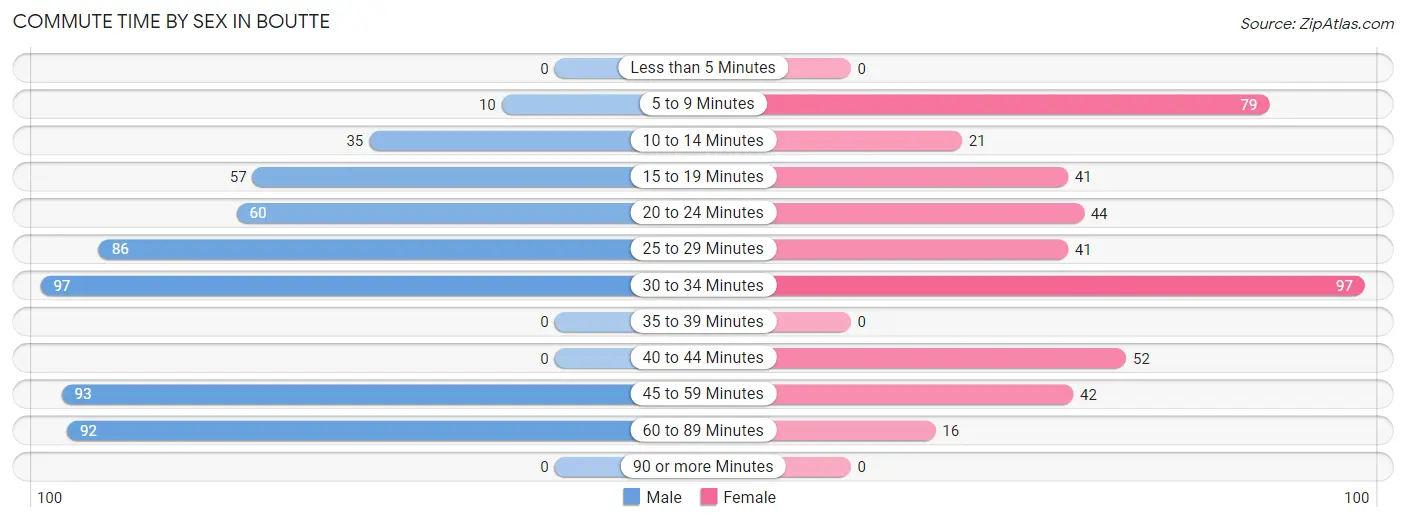
| Commute Time | Male | Female |
| Less than 5 Minutes | 0 (0.0%) | 0 (0.0%) |
| 5 to 9 Minutes | 10 (1.9%) | 79 (18.2%) |
| 10 to 14 Minutes | 35 (6.6%) | 21 (4.9%) |
| 15 to 19 Minutes | 57 (10.7%) | 41 (9.5%) |
| 20 to 24 Minutes | 60 (11.3%) | 44 (10.2%) |
| 25 to 29 Minutes | 86 (16.2%) | 41 (9.5%) |
| 30 to 34 Minutes | 97 (18.3%) | 97 (22.4%) |
| 35 to 39 Minutes | 0 (0.0%) | 0 (0.0%) |
| 40 to 44 Minutes | 0 (0.0%) | 52 (12.0%) |
| 45 to 59 Minutes | 93 (17.5%) | 42 (9.7%) |
| 60 to 89 Minutes | 92 (17.4%) | 16 (3.7%) |
| 90 or more Minutes | 0 (0.0%) | 0 (0.0%) |
Time of Departure to Work by Sex in Boutte
The most frequent times of departure to work in Boutte are 5:30 AM to 5:59 AM (106, 20.0%) for males and 7:00 AM to 7:29 AM (154, 35.6%) for females.
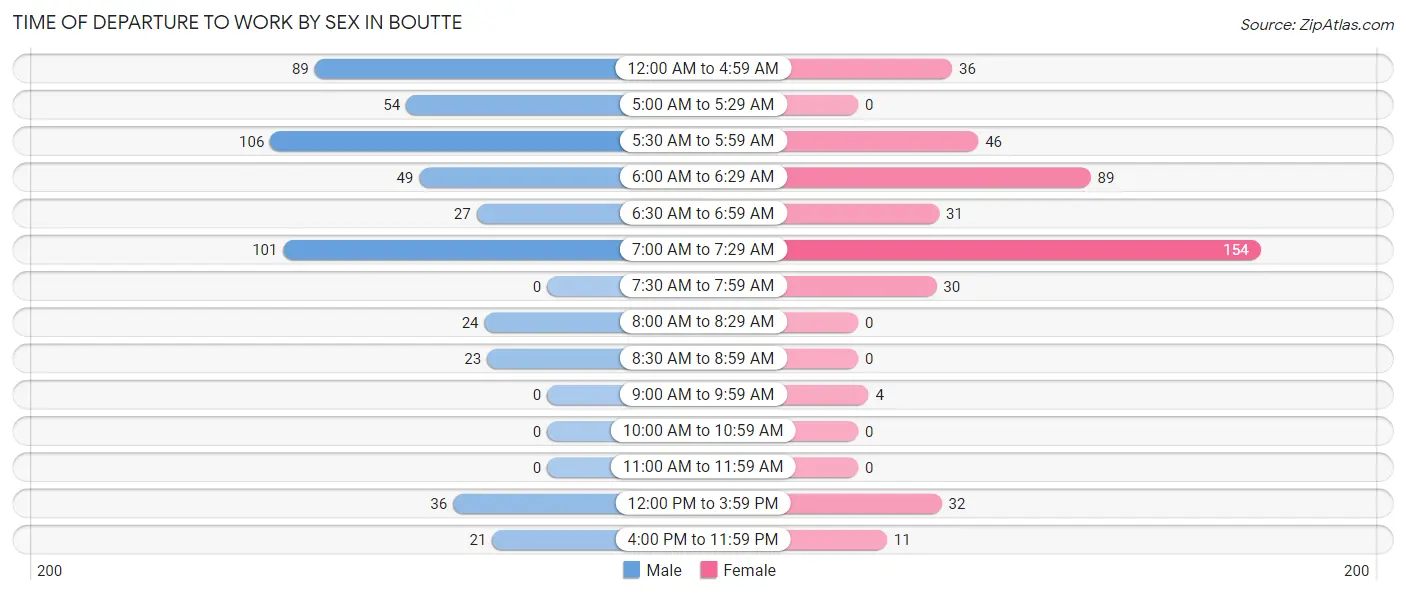
| Time of Departure | Male | Female |
| 12:00 AM to 4:59 AM | 89 (16.8%) | 36 (8.3%) |
| 5:00 AM to 5:29 AM | 54 (10.2%) | 0 (0.0%) |
| 5:30 AM to 5:59 AM | 106 (20.0%) | 46 (10.6%) |
| 6:00 AM to 6:29 AM | 49 (9.2%) | 89 (20.5%) |
| 6:30 AM to 6:59 AM | 27 (5.1%) | 31 (7.2%) |
| 7:00 AM to 7:29 AM | 101 (19.1%) | 154 (35.6%) |
| 7:30 AM to 7:59 AM | 0 (0.0%) | 30 (6.9%) |
| 8:00 AM to 8:29 AM | 24 (4.5%) | 0 (0.0%) |
| 8:30 AM to 8:59 AM | 23 (4.3%) | 0 (0.0%) |
| 9:00 AM to 9:59 AM | 0 (0.0%) | 4 (0.9%) |
| 10:00 AM to 10:59 AM | 0 (0.0%) | 0 (0.0%) |
| 11:00 AM to 11:59 AM | 0 (0.0%) | 0 (0.0%) |
| 12:00 PM to 3:59 PM | 36 (6.8%) | 32 (7.4%) |
| 4:00 PM to 11:59 PM | 21 (4.0%) | 11 (2.5%) |
| Total | 530 (100.0%) | 433 (100.0%) |
Housing Occupancy in Boutte
Occupancy by Ownership in Boutte
Of the total 826 dwellings in Boutte, owner-occupied units account for 587 (71.1%), while renter-occupied units make up 239 (28.9%).
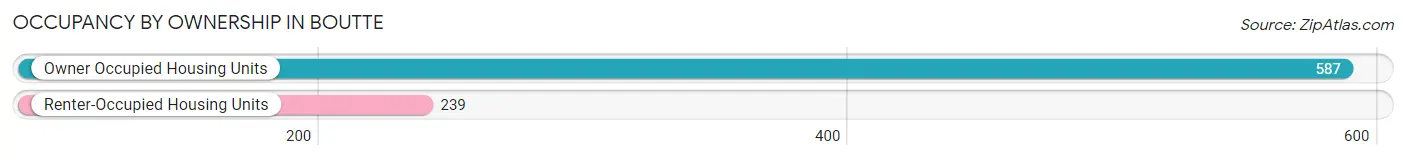
| Occupancy | # Housing Units | % Housing Units |
| Owner Occupied Housing Units | 587 | 71.1% |
| Renter-Occupied Housing Units | 239 | 28.9% |
| Total Occupied Housing Units | 826 | 100.0% |
Occupancy by Household Size in Boutte
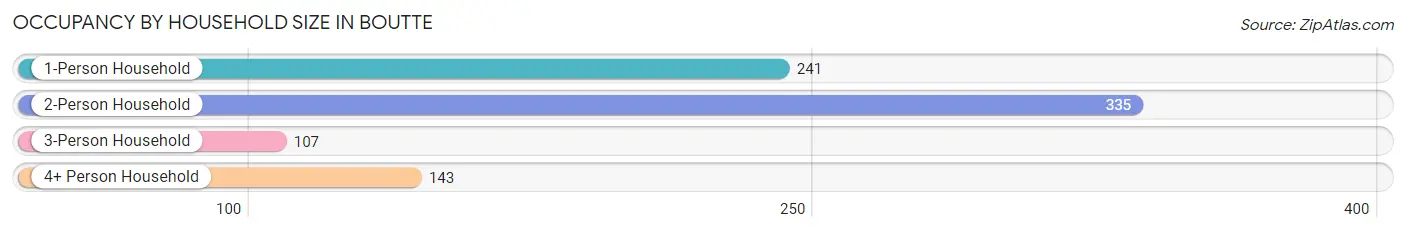
| Household Size | # Housing Units | % Housing Units |
| 1-Person Household | 241 | 29.2% |
| 2-Person Household | 335 | 40.6% |
| 3-Person Household | 107 | 13.0% |
| 4+ Person Household | 143 | 17.3% |
| Total Housing Units | 826 | 100.0% |
Occupancy by Ownership by Household Size in Boutte
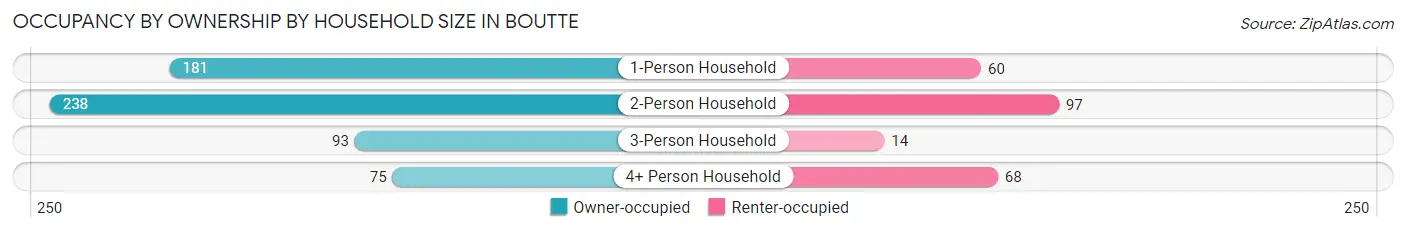
| Household Size | Owner-occupied | Renter-occupied |
| 1-Person Household | 181 (75.1%) | 60 (24.9%) |
| 2-Person Household | 238 (71.0%) | 97 (29.0%) |
| 3-Person Household | 93 (86.9%) | 14 (13.1%) |
| 4+ Person Household | 75 (52.4%) | 68 (47.5%) |
| Total Housing Units | 587 (71.1%) | 239 (28.9%) |
Occupancy by Educational Attainment in Boutte
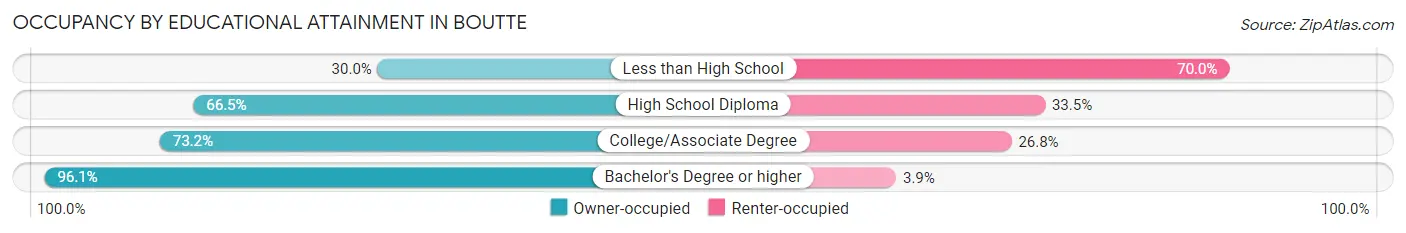
| Household Size | Owner-occupied | Renter-occupied |
| Less than High School | 21 (30.0%) | 49 (70.0%) |
| High School Diploma | 163 (66.5%) | 82 (33.5%) |
| College/Associate Degree | 281 (73.2%) | 103 (26.8%) |
| Bachelor's Degree or higher | 122 (96.1%) | 5 (3.9%) |
Occupancy by Age of Householder in Boutte
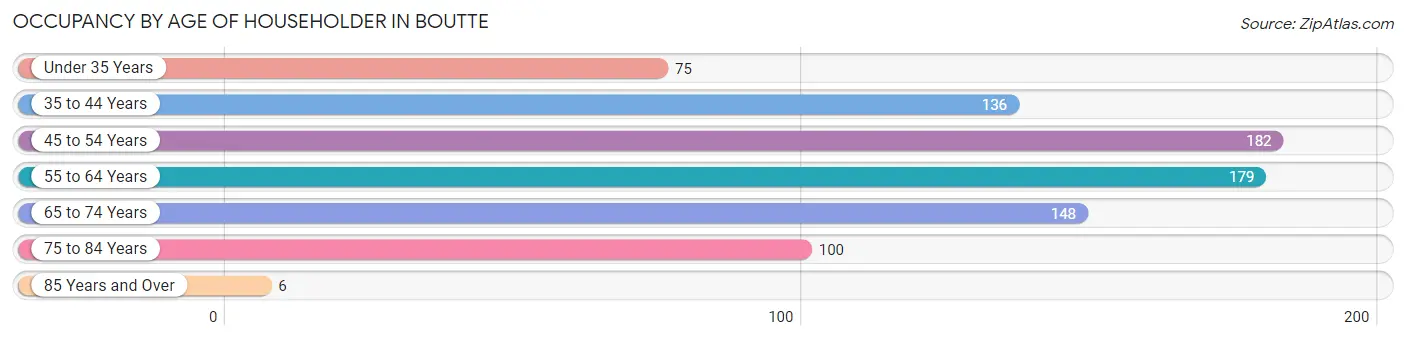
| Age Bracket | # Households | % Households |
| Under 35 Years | 75 | 9.1% |
| 35 to 44 Years | 136 | 16.5% |
| 45 to 54 Years | 182 | 22.0% |
| 55 to 64 Years | 179 | 21.7% |
| 65 to 74 Years | 148 | 17.9% |
| 75 to 84 Years | 100 | 12.1% |
| 85 Years and Over | 6 | 0.7% |
| Total | 826 | 100.0% |
Housing Finances in Boutte
Median Income by Occupancy in Boutte
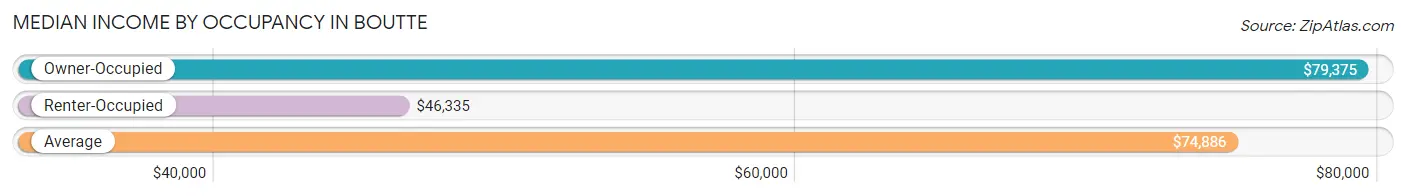
| Occupancy Type | # Households | Median Income |
| Owner-Occupied | 587 (71.1%) | $79,375 |
| Renter-Occupied | 239 (28.9%) | $46,335 |
| Average | 826 (100.0%) | $74,886 |
Occupancy by Householder Income Bracket in Boutte
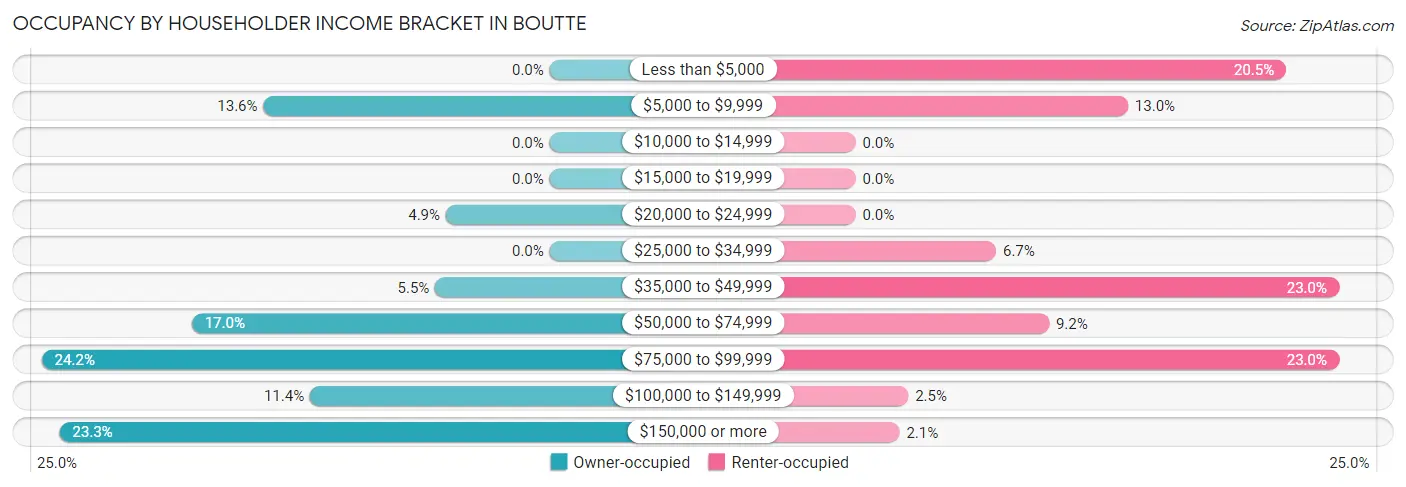
| Income Bracket | Owner-occupied | Renter-occupied |
| Less than $5,000 | 0 (0.0%) | 49 (20.5%) |
| $5,000 to $9,999 | 80 (13.6%) | 31 (13.0%) |
| $10,000 to $14,999 | 0 (0.0%) | 0 (0.0%) |
| $15,000 to $19,999 | 0 (0.0%) | 0 (0.0%) |
| $20,000 to $24,999 | 29 (4.9%) | 0 (0.0%) |
| $25,000 to $34,999 | 0 (0.0%) | 16 (6.7%) |
| $35,000 to $49,999 | 32 (5.4%) | 55 (23.0%) |
| $50,000 to $74,999 | 100 (17.0%) | 22 (9.2%) |
| $75,000 to $99,999 | 142 (24.2%) | 55 (23.0%) |
| $100,000 to $149,999 | 67 (11.4%) | 6 (2.5%) |
| $150,000 or more | 137 (23.3%) | 5 (2.1%) |
| Total | 587 (100.0%) | 239 (100.0%) |
Monthly Housing Cost Tiers in Boutte
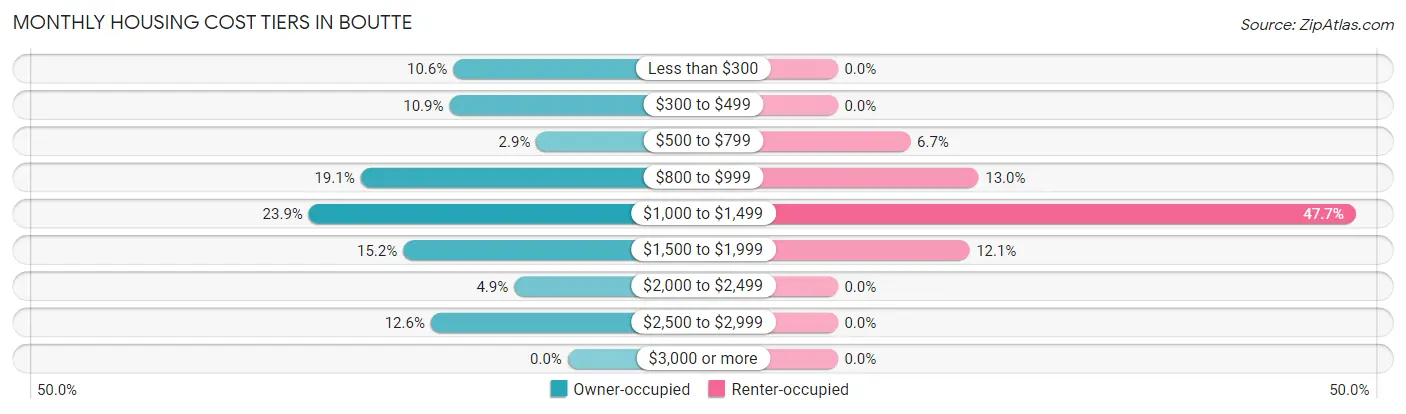
| Monthly Cost | Owner-occupied | Renter-occupied |
| Less than $300 | 62 (10.6%) | 0 (0.0%) |
| $300 to $499 | 64 (10.9%) | 0 (0.0%) |
| $500 to $799 | 17 (2.9%) | 16 (6.7%) |
| $800 to $999 | 112 (19.1%) | 31 (13.0%) |
| $1,000 to $1,499 | 140 (23.8%) | 114 (47.7%) |
| $1,500 to $1,999 | 89 (15.2%) | 29 (12.1%) |
| $2,000 to $2,499 | 29 (4.9%) | 0 (0.0%) |
| $2,500 to $2,999 | 74 (12.6%) | 0 (0.0%) |
| $3,000 or more | 0 (0.0%) | 0 (0.0%) |
| Total | 587 (100.0%) | 239 (100.0%) |
Physical Housing Characteristics in Boutte
Housing Structures in Boutte
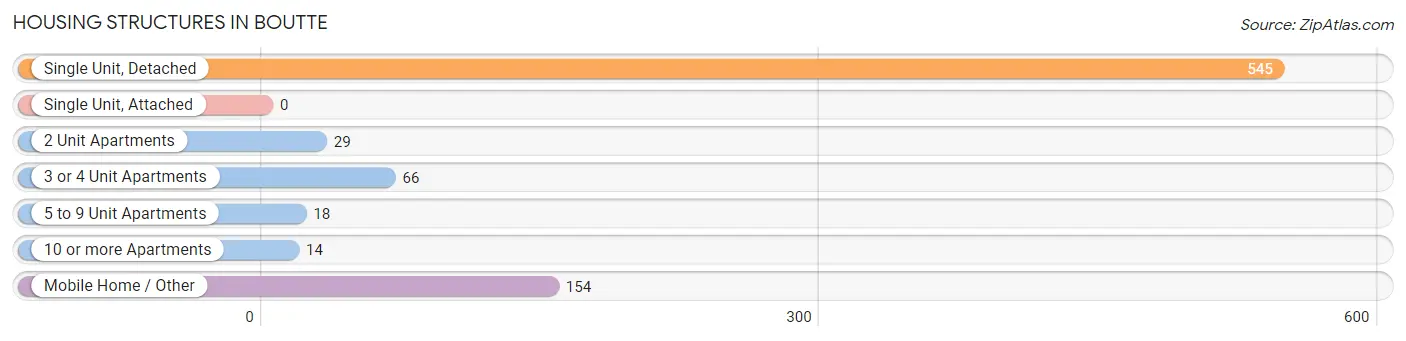
| Structure Type | # Housing Units | % Housing Units |
| Single Unit, Detached | 545 | 66.0% |
| Single Unit, Attached | 0 | 0.0% |
| 2 Unit Apartments | 29 | 3.5% |
| 3 or 4 Unit Apartments | 66 | 8.0% |
| 5 to 9 Unit Apartments | 18 | 2.2% |
| 10 or more Apartments | 14 | 1.7% |
| Mobile Home / Other | 154 | 18.6% |
| Total | 826 | 100.0% |
Housing Structures by Occupancy in Boutte
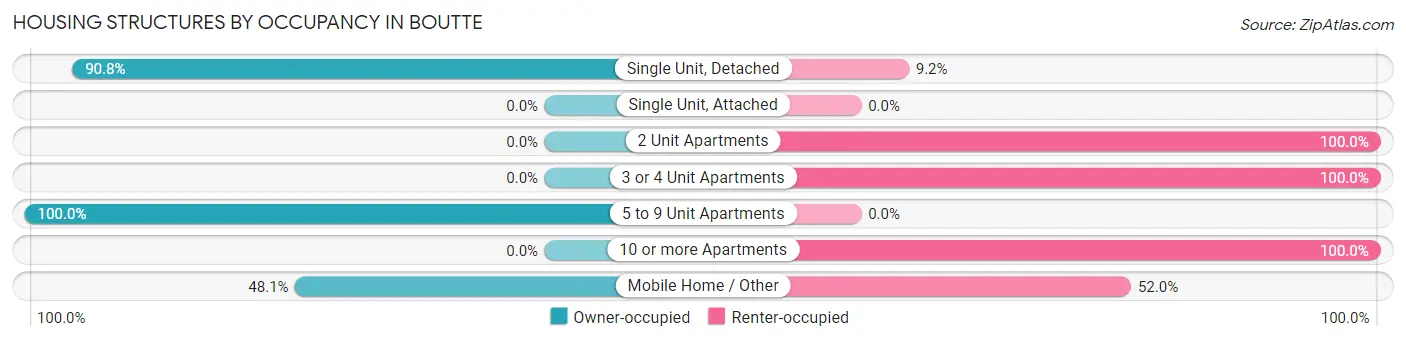
| Structure Type | Owner-occupied | Renter-occupied |
| Single Unit, Detached | 495 (90.8%) | 50 (9.2%) |
| Single Unit, Attached | 0 (0.0%) | 0 (0.0%) |
| 2 Unit Apartments | 0 (0.0%) | 29 (100.0%) |
| 3 or 4 Unit Apartments | 0 (0.0%) | 66 (100.0%) |
| 5 to 9 Unit Apartments | 18 (100.0%) | 0 (0.0%) |
| 10 or more Apartments | 0 (0.0%) | 14 (100.0%) |
| Mobile Home / Other | 74 (48.0%) | 80 (51.9%) |
| Total | 587 (71.1%) | 239 (28.9%) |
Housing Structures by Number of Rooms in Boutte
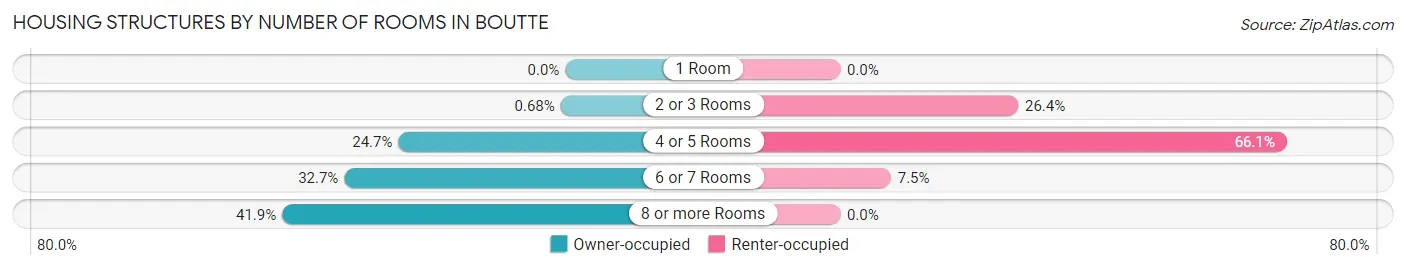
| Number of Rooms | Owner-occupied | Renter-occupied |
| 1 Room | 0 (0.0%) | 0 (0.0%) |
| 2 or 3 Rooms | 4 (0.7%) | 63 (26.4%) |
| 4 or 5 Rooms | 145 (24.7%) | 158 (66.1%) |
| 6 or 7 Rooms | 192 (32.7%) | 18 (7.5%) |
| 8 or more Rooms | 246 (41.9%) | 0 (0.0%) |
| Total | 587 (100.0%) | 239 (100.0%) |
Housing Structure by Heating Type in Boutte
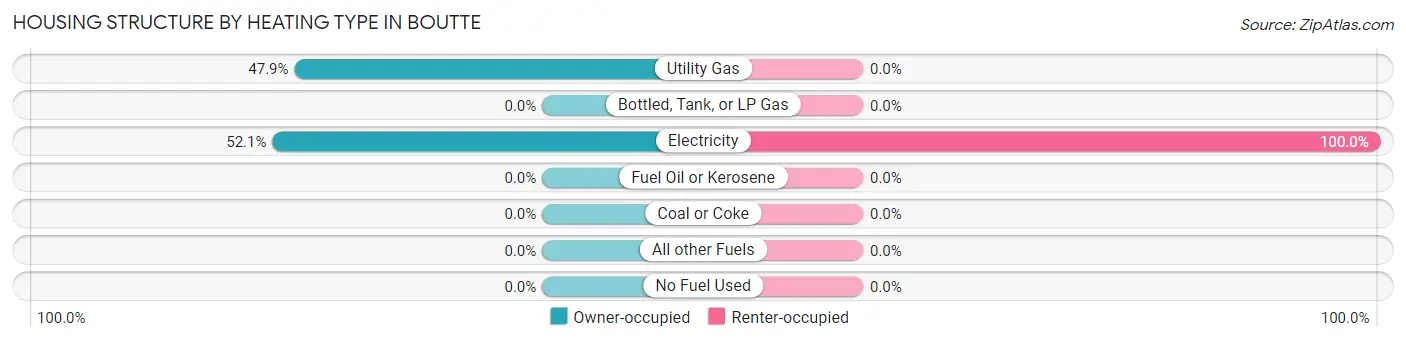
| Heating Type | Owner-occupied | Renter-occupied |
| Utility Gas | 281 (47.9%) | 0 (0.0%) |
| Bottled, Tank, or LP Gas | 0 (0.0%) | 0 (0.0%) |
| Electricity | 306 (52.1%) | 239 (100.0%) |
| Fuel Oil or Kerosene | 0 (0.0%) | 0 (0.0%) |
| Coal or Coke | 0 (0.0%) | 0 (0.0%) |
| All other Fuels | 0 (0.0%) | 0 (0.0%) |
| No Fuel Used | 0 (0.0%) | 0 (0.0%) |
| Total | 587 (100.0%) | 239 (100.0%) |
Household Vehicle Usage in Boutte
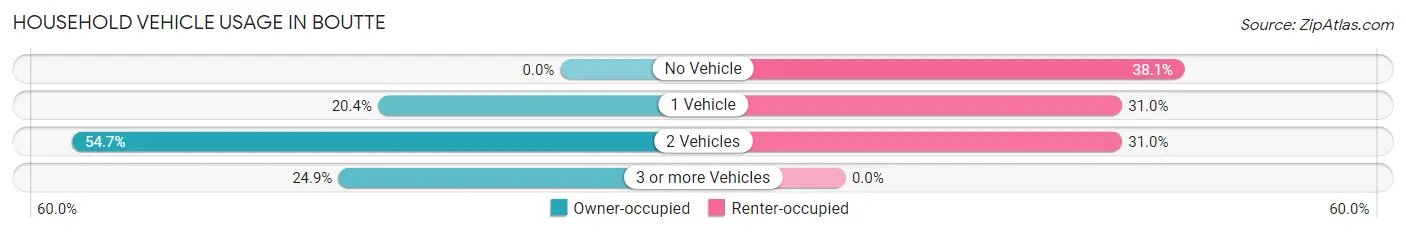
| Vehicles per Household | Owner-occupied | Renter-occupied |
| No Vehicle | 0 (0.0%) | 91 (38.1%) |
| 1 Vehicle | 120 (20.4%) | 74 (31.0%) |
| 2 Vehicles | 321 (54.7%) | 74 (31.0%) |
| 3 or more Vehicles | 146 (24.9%) | 0 (0.0%) |
| Total | 587 (100.0%) | 239 (100.0%) |
Real Estate & Mortgages in Boutte
Real Estate and Mortgage Overview in Boutte
| Characteristic | Without Mortgage | With Mortgage |
| Housing Units | 159 | 428 |
| Median Property Value | - | - |
| Median Household Income | $78,242 | $105 |
| Monthly Housing Costs | $390 | $0 |
| Real Estate Taxes | $2,212 | $166 |
Property Value by Mortgage Status in Boutte
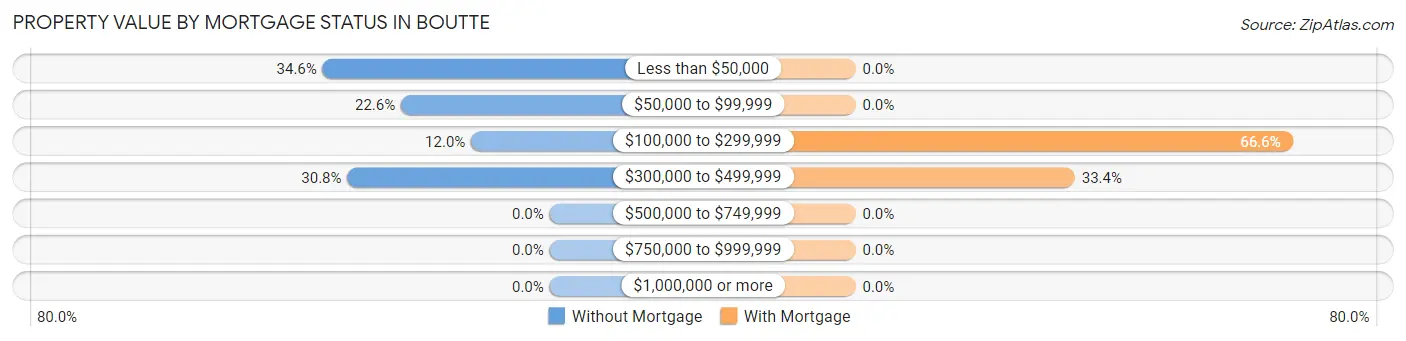
| Property Value | Without Mortgage | With Mortgage |
| Less than $50,000 | 55 (34.6%) | 0 (0.0%) |
| $50,000 to $99,999 | 36 (22.6%) | 0 (0.0%) |
| $100,000 to $299,999 | 19 (11.9%) | 285 (66.6%) |
| $300,000 to $499,999 | 49 (30.8%) | 143 (33.4%) |
| $500,000 to $749,999 | 0 (0.0%) | 0 (0.0%) |
| $750,000 to $999,999 | 0 (0.0%) | 0 (0.0%) |
| $1,000,000 or more | 0 (0.0%) | 0 (0.0%) |
| Total | 159 (100.0%) | 428 (100.0%) |
Household Income by Mortgage Status in Boutte
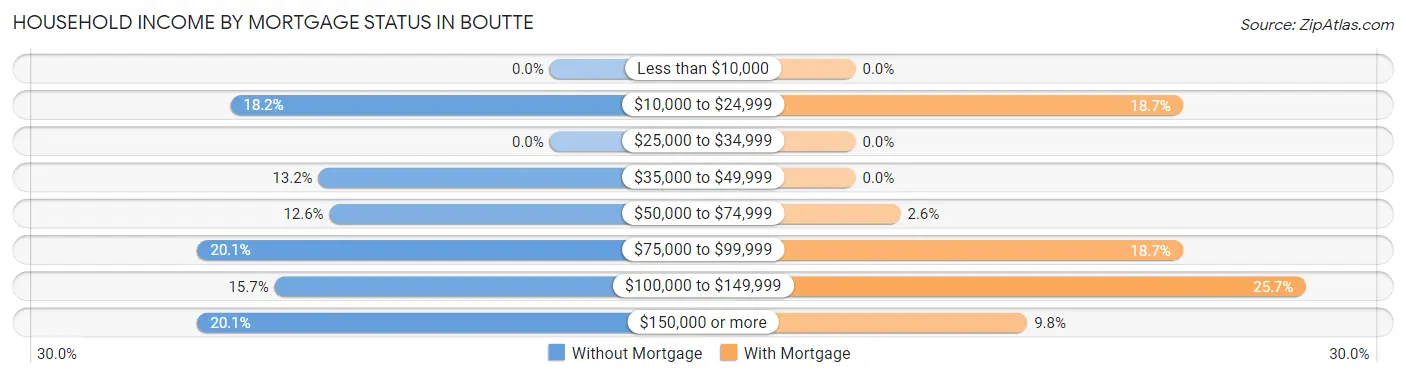
| Household Income | Without Mortgage | With Mortgage |
| Less than $10,000 | 0 (0.0%) | 0 (0.0%) |
| $10,000 to $24,999 | 29 (18.2%) | 80 (18.7%) |
| $25,000 to $34,999 | 0 (0.0%) | 0 (0.0%) |
| $35,000 to $49,999 | 21 (13.2%) | 0 (0.0%) |
| $50,000 to $74,999 | 20 (12.6%) | 11 (2.6%) |
| $75,000 to $99,999 | 32 (20.1%) | 80 (18.7%) |
| $100,000 to $149,999 | 25 (15.7%) | 110 (25.7%) |
| $150,000 or more | 32 (20.1%) | 42 (9.8%) |
| Total | 159 (100.0%) | 428 (100.0%) |
Property Value to Household Income Ratio in Boutte
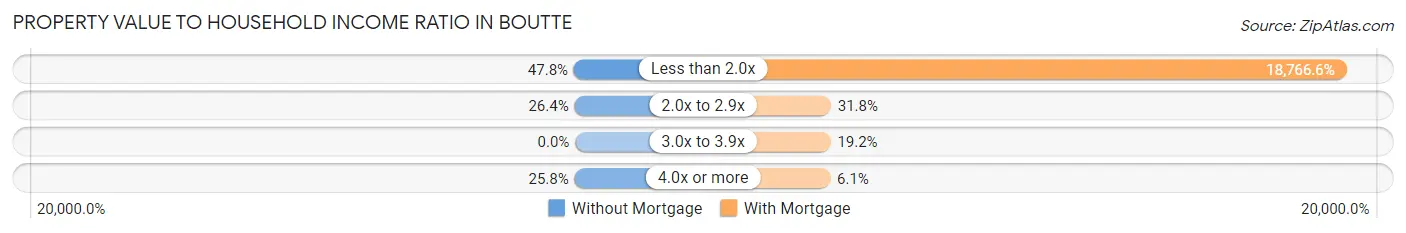
| Value-to-Income Ratio | Without Mortgage | With Mortgage |
| Less than 2.0x | 76 (47.8%) | 80,321 (18,766.6%) |
| 2.0x to 2.9x | 42 (26.4%) | 136 (31.8%) |
| 3.0x to 3.9x | 0 (0.0%) | 82 (19.2%) |
| 4.0x or more | 41 (25.8%) | 26 (6.1%) |
| Total | 159 (100.0%) | 428 (100.0%) |
Real Estate Taxes by Mortgage Status in Boutte
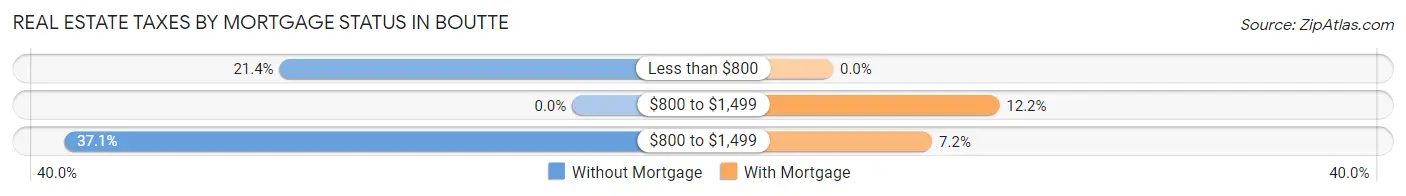
| Property Taxes | Without Mortgage | With Mortgage |
| Less than $800 | 34 (21.4%) | 0 (0.0%) |
| $800 to $1,499 | 0 (0.0%) | 52 (12.1%) |
| $800 to $1,499 | 59 (37.1%) | 31 (7.2%) |
| Total | 159 (100.0%) | 428 (100.0%) |
Health & Disability in Boutte
Health Insurance Coverage by Age in Boutte
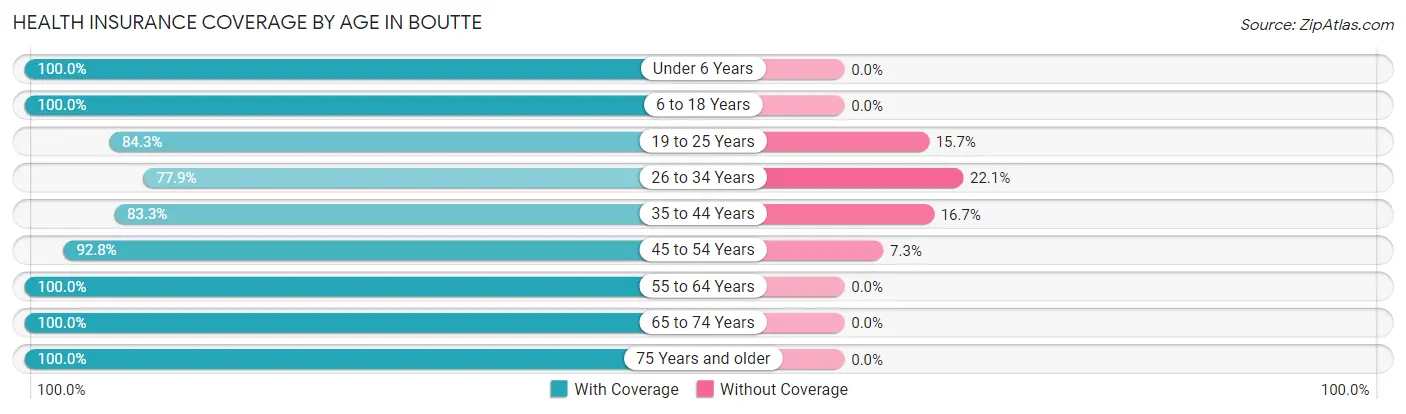
| Age Bracket | With Coverage | Without Coverage |
| Under 6 Years | 290 (100.0%) | 0 (0.0%) |
| 6 to 18 Years | 309 (100.0%) | 0 (0.0%) |
| 19 to 25 Years | 91 (84.3%) | 17 (15.7%) |
| 26 to 34 Years | 218 (77.9%) | 62 (22.1%) |
| 35 to 44 Years | 250 (83.3%) | 50 (16.7%) |
| 45 to 54 Years | 320 (92.7%) | 25 (7.2%) |
| 55 to 64 Years | 291 (100.0%) | 0 (0.0%) |
| 65 to 74 Years | 220 (100.0%) | 0 (0.0%) |
| 75 Years and older | 122 (100.0%) | 0 (0.0%) |
| Total | 2,111 (93.2%) | 154 (6.8%) |
Health Insurance Coverage by Citizenship Status in Boutte
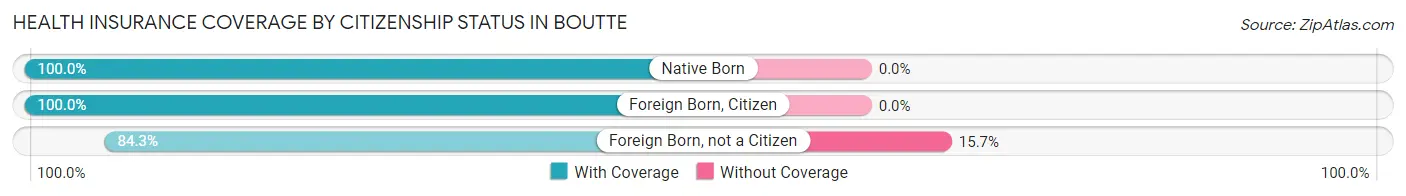
| Citizenship Status | With Coverage | Without Coverage |
| Native Born | 290 (100.0%) | 0 (0.0%) |
| Foreign Born, Citizen | 309 (100.0%) | 0 (0.0%) |
| Foreign Born, not a Citizen | 91 (84.3%) | 17 (15.7%) |
Health Insurance Coverage by Household Income in Boutte
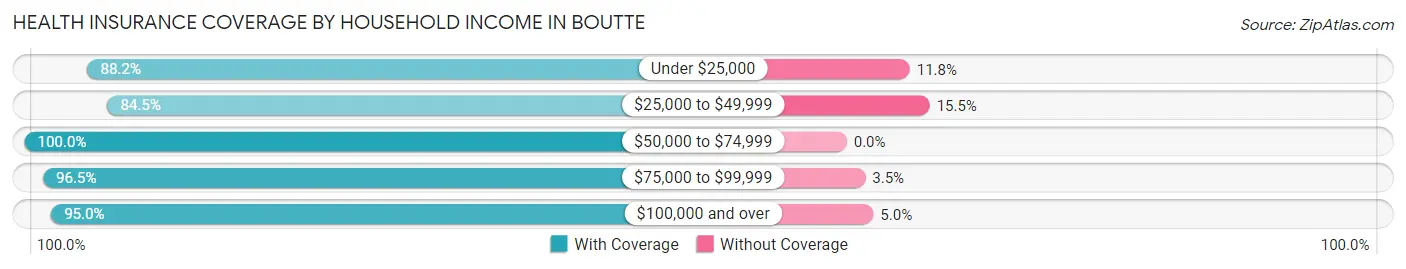
| Household Income | With Coverage | Without Coverage |
| Under $25,000 | 314 (88.2%) | 42 (11.8%) |
| $25,000 to $49,999 | 272 (84.5%) | 50 (15.5%) |
| $50,000 to $74,999 | 159 (100.0%) | 0 (0.0%) |
| $75,000 to $99,999 | 585 (96.5%) | 21 (3.5%) |
| $100,000 and over | 781 (95.0%) | 41 (5.0%) |
Public vs Private Health Insurance Coverage by Age in Boutte
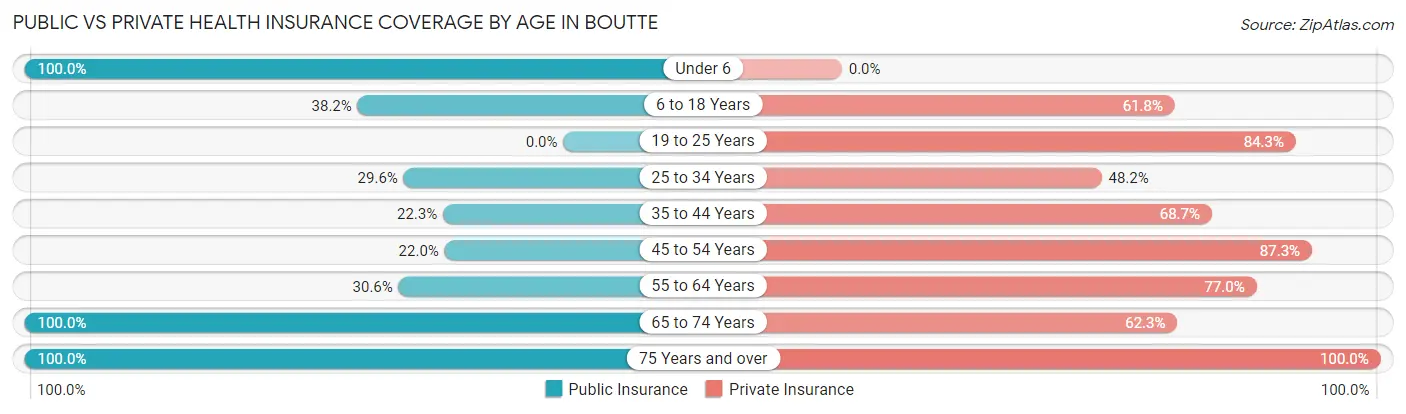
| Age Bracket | Public Insurance | Private Insurance |
| Under 6 | 290 (100.0%) | 0 (0.0%) |
| 6 to 18 Years | 118 (38.2%) | 191 (61.8%) |
| 19 to 25 Years | 0 (0.0%) | 91 (84.3%) |
| 25 to 34 Years | 83 (29.6%) | 135 (48.2%) |
| 35 to 44 Years | 67 (22.3%) | 206 (68.7%) |
| 45 to 54 Years | 76 (22.0%) | 301 (87.3%) |
| 55 to 64 Years | 89 (30.6%) | 224 (77.0%) |
| 65 to 74 Years | 220 (100.0%) | 137 (62.3%) |
| 75 Years and over | 122 (100.0%) | 122 (100.0%) |
| Total | 1,065 (47.0%) | 1,407 (62.1%) |
Disability Status by Sex by Age in Boutte
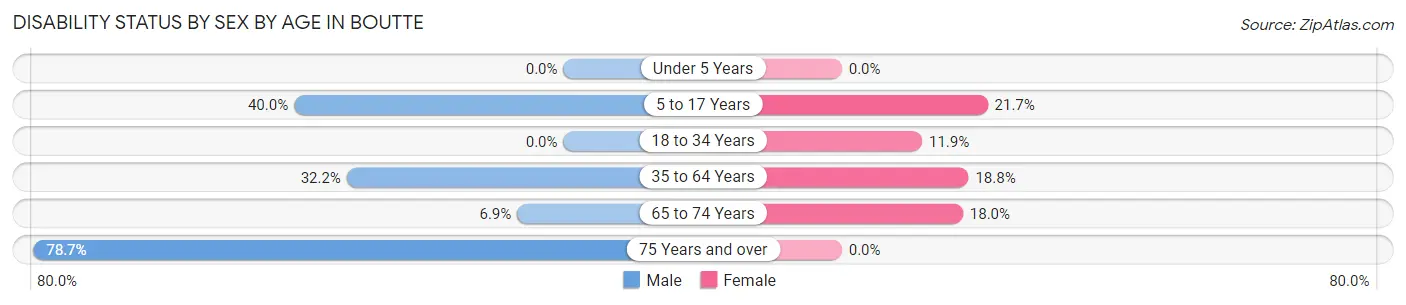
| Age Bracket | Male | Female |
| Under 5 Years | 0 (0.0%) | 0 (0.0%) |
| 5 to 17 Years | 110 (40.0%) | 21 (21.6%) |
| 18 to 34 Years | 0 (0.0%) | 31 (11.9%) |
| 35 to 64 Years | 166 (32.2%) | 79 (18.8%) |
| 65 to 74 Years | 9 (6.9%) | 16 (18.0%) |
| 75 Years and over | 96 (78.7%) | 0 (0.0%) |
Disability Class by Sex by Age in Boutte
Disability Class: Hearing Difficulty
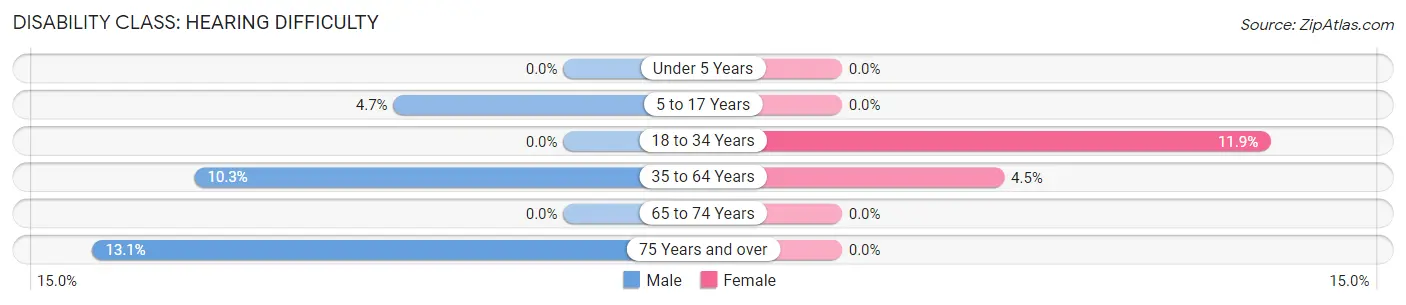
| Age Bracket | Male | Female |
| Under 5 Years | 0 (0.0%) | 0 (0.0%) |
| 5 to 17 Years | 13 (4.7%) | 0 (0.0%) |
| 18 to 34 Years | 0 (0.0%) | 31 (11.9%) |
| 35 to 64 Years | 53 (10.3%) | 19 (4.5%) |
| 65 to 74 Years | 0 (0.0%) | 0 (0.0%) |
| 75 Years and over | 16 (13.1%) | 0 (0.0%) |
Disability Class: Vision Difficulty
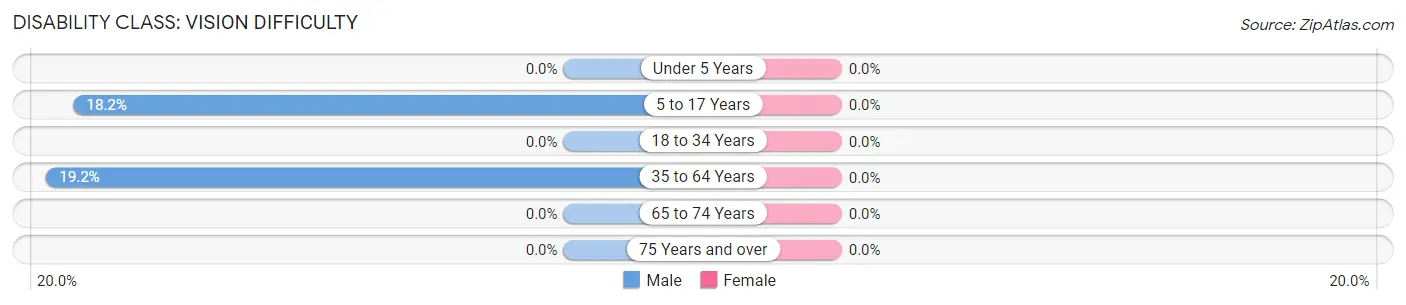
| Age Bracket | Male | Female |
| Under 5 Years | 0 (0.0%) | 0 (0.0%) |
| 5 to 17 Years | 50 (18.2%) | 0 (0.0%) |
| 18 to 34 Years | 0 (0.0%) | 0 (0.0%) |
| 35 to 64 Years | 99 (19.2%) | 0 (0.0%) |
| 65 to 74 Years | 0 (0.0%) | 0 (0.0%) |
| 75 Years and over | 0 (0.0%) | 0 (0.0%) |
Disability Class: Cognitive Difficulty
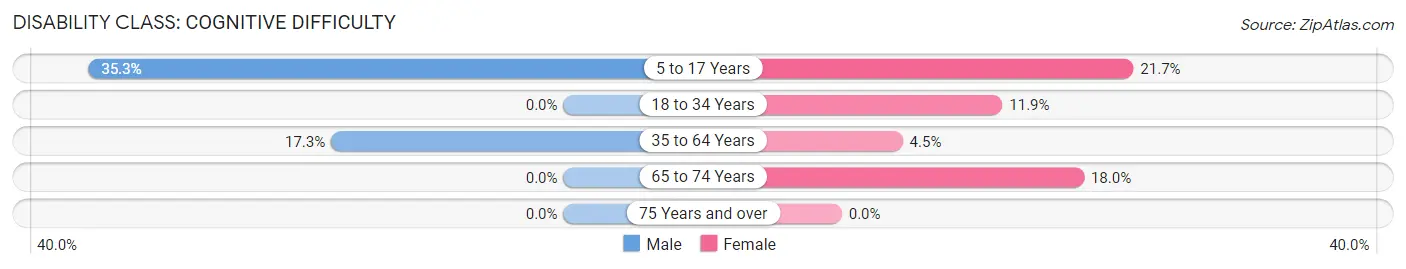
| Age Bracket | Male | Female |
| 5 to 17 Years | 97 (35.3%) | 21 (21.6%) |
| 18 to 34 Years | 0 (0.0%) | 31 (11.9%) |
| 35 to 64 Years | 89 (17.2%) | 19 (4.5%) |
| 65 to 74 Years | 0 (0.0%) | 16 (18.0%) |
| 75 Years and over | 0 (0.0%) | 0 (0.0%) |
Disability Class: Ambulatory Difficulty
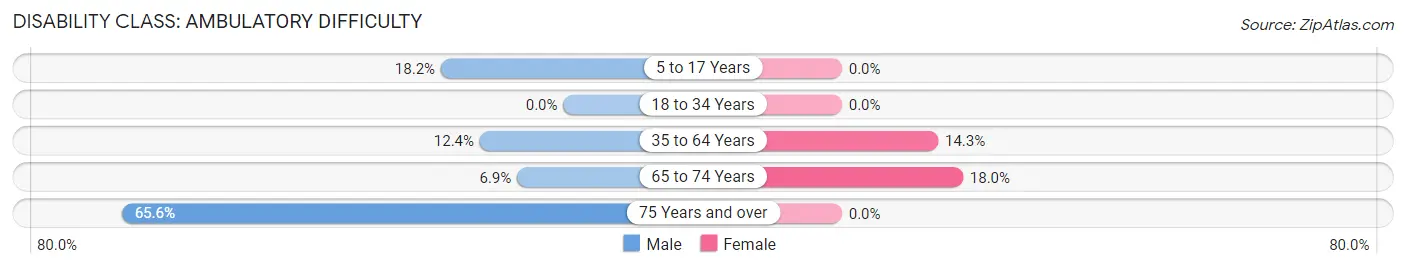
| Age Bracket | Male | Female |
| 5 to 17 Years | 50 (18.2%) | 0 (0.0%) |
| 18 to 34 Years | 0 (0.0%) | 0 (0.0%) |
| 35 to 64 Years | 64 (12.4%) | 60 (14.3%) |
| 65 to 74 Years | 9 (6.9%) | 16 (18.0%) |
| 75 Years and over | 80 (65.6%) | 0 (0.0%) |
Disability Class: Self-Care Difficulty
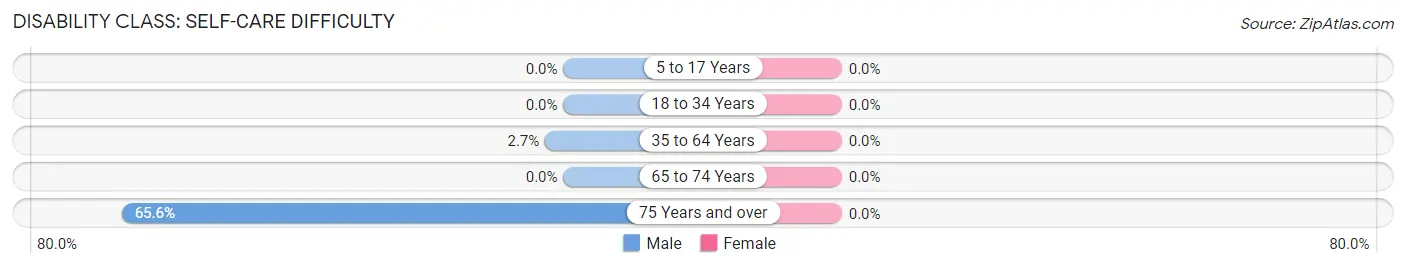
| Age Bracket | Male | Female |
| 5 to 17 Years | 0 (0.0%) | 0 (0.0%) |
| 18 to 34 Years | 0 (0.0%) | 0 (0.0%) |
| 35 to 64 Years | 14 (2.7%) | 0 (0.0%) |
| 65 to 74 Years | 0 (0.0%) | 0 (0.0%) |
| 75 Years and over | 80 (65.6%) | 0 (0.0%) |
Technology Access in Boutte
Computing Device Access in Boutte
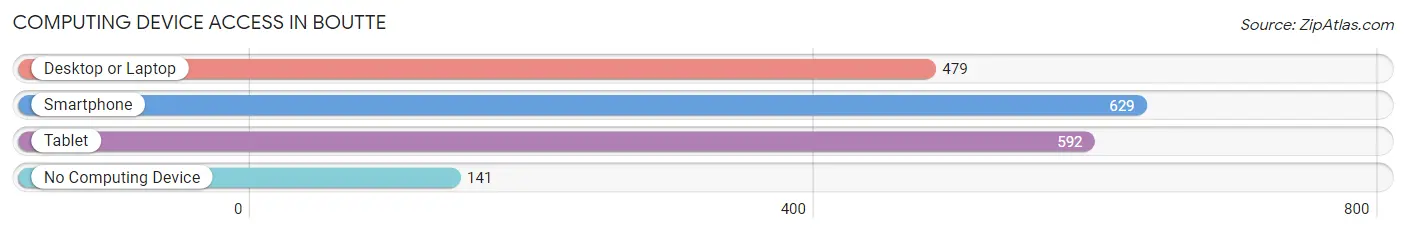
| Device Type | # Households | % Households |
| Desktop or Laptop | 479 | 58.0% |
| Smartphone | 629 | 76.1% |
| Tablet | 592 | 71.7% |
| No Computing Device | 141 | 17.1% |
| Total | 826 | 100.0% |
Internet Access in Boutte
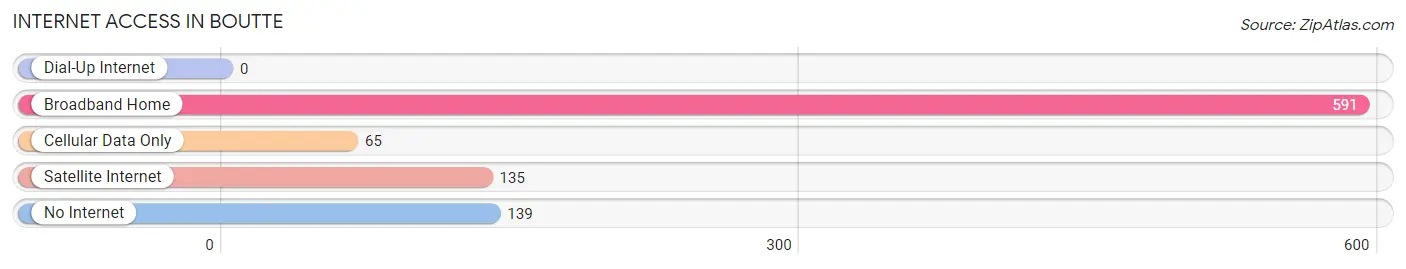
| Internet Type | # Households | % Households |
| Dial-Up Internet | 0 | 0.0% |
| Broadband Home | 591 | 71.6% |
| Cellular Data Only | 65 | 7.9% |
| Satellite Internet | 135 | 16.3% |
| No Internet | 139 | 16.8% |
| Total | 826 | 100.0% |
Boutte Summary
Boutte is a small town located in St. Charles Parish, Louisiana. It is situated along the banks of the Mississippi River, approximately 25 miles west of New Orleans. The town has a population of approximately 2,000 people and is part of the Greater New Orleans Metropolitan Area.
History
Boutte was founded in 1819 by French settlers who were attracted to the area by its fertile soil and abundant wildlife. The town was originally named “Boutteville” after the family of Pierre Boutte, who was one of the first settlers. The town was later renamed “Boutte” in 1845.
In the late 19th century, Boutte became a popular destination for wealthy New Orleanians who wanted to escape the hustle and bustle of the city. The town was known for its picturesque scenery and its many hunting and fishing opportunities.
In the early 20th century, Boutte experienced a period of growth and development. The town was connected to the rest of the state by the New Orleans and Northeastern Railroad in 1906. This allowed for the transportation of goods and people to and from the town.
In the 1950s, the town experienced a period of decline as many of its residents moved away in search of better economic opportunities. However, in recent years, the town has seen a resurgence in population and economic activity.
Geography
Boutte is located in St. Charles Parish, Louisiana. It is situated along the banks of the Mississippi River, approximately 25 miles west of New Orleans. The town has a total area of 1.3 square miles, all of which is land.
The town is located in a humid subtropical climate zone, with hot, humid summers and mild winters. The average annual temperature is 68 degrees Fahrenheit, with an average high of 87 degrees in the summer and an average low of 48 degrees in the winter.
Economy
Boutte’s economy is largely based on agriculture and tourism. The town is home to several farms that produce a variety of crops, including corn, soybeans, and sugarcane. The town is also home to several restaurants, bars, and other businesses that cater to tourists.
The town is also home to several manufacturing companies, including a paper mill and a chemical plant. These companies provide employment opportunities for many of the town’s residents.
Demographics
As of the 2010 census, Boutte had a population of 2,000 people. The racial makeup of the town was 79.2% White, 17.2% African American, 0.7% Native American, 0.3% Asian, and 2.6% from other races.
The median household income in Boutte was $41,250, and the median family income was $50,000. The per capita income was $20,000. Approximately 15.2% of the population was below the poverty line.
Conclusion
Boutte is a small town located in St. Charles Parish, Louisiana. It is situated along the banks of the Mississippi River, approximately 25 miles west of New Orleans. The town has a population of approximately 2,000 people and is part of the Greater New Orleans Metropolitan Area. The town’s economy is largely based on agriculture and tourism, and it is home to several manufacturing companies. The town has a diverse population, with a median household income of $41,250 and a per capita income of $20,000.
Common Questions
What is Per Capita Income in Boutte?
Per Capita income in Boutte is $31,223.
What is the Median Family Income in Boutte?
Median Family Income in Boutte is $79,732.
What is the Median Household income in Boutte?
Median Household Income in Boutte is $74,886.
What is Inequality or Gini Index in Boutte?
Inequality or Gini Index in Boutte is 0.44.
What is the Total Population of Boutte?
Total Population of Boutte is 2,274.
What is the Total Male Population of Boutte?
Total Male Population of Boutte is 1,241.
What is the Total Female Population of Boutte?
Total Female Population of Boutte is 1,033.
What is the Ratio of Males per 100 Females in Boutte?
There are 120.14 Males per 100 Females in Boutte.
What is the Ratio of Females per 100 Males in Boutte?
There are 83.24 Females per 100 Males in Boutte.
What is the Median Population Age in Boutte?
Median Population Age in Boutte is 39.4 Years.
What is the Average Family Size in Boutte
Average Family Size in Boutte is 3.4 People.
What is the Average Household Size in Boutte
Average Household Size in Boutte is 2.8 People.
How Large is the Labor Force in Boutte?
There are 1,109 People in the Labor Forcein in Boutte.
What is the Percentage of People in the Labor Force in Boutte?
63.9% of People are in the Labor Force in Boutte.
What is the Unemployment Rate in Boutte?
Unemployment Rate in Boutte is 12.4%.