Bogalusa, LA Map & Demographics
Bogalusa Map
Bogalusa Overview
$21,349
PER CAPITA INCOME
$42,471
AVG FAMILY INCOME
$39,213
AVG HOUSEHOLD INCOME
33.7%
WAGE / INCOME GAP [ % ]
66.3¢/ $1
WAGE / INCOME GAP [ $ ]
0.45
INEQUALITY / GINI INDEX
10,689
TOTAL POPULATION
4,900
MALE POPULATION
5,789
FEMALE POPULATION
84.64
MALES / 100 FEMALES
118.14
FEMALES / 100 MALES
39.1
MEDIAN AGE
2.9
AVG FAMILY SIZE
2.5
AVG HOUSEHOLD SIZE
4,696
LABOR FORCE [ PEOPLE ]
54.4%
PERCENT IN LABOR FORCE
11.6%
UNEMPLOYMENT RATE
Bogalusa Zip Codes
Bogalusa Area Codes
Income in Bogalusa
Income Overview in Bogalusa
Per Capita Income in Bogalusa is $21,349, while median incomes of families and households are $42,471 and $39,213 respectively.
| Characteristic | Number | Measure |
| Per Capita Income | 10,689 | $21,349 |
| Median Family Income | 2,872 | $42,471 |
| Mean Family Income | 2,872 | $55,052 |
| Median Household Income | 4,285 | $39,213 |
| Mean Household Income | 4,285 | $51,902 |
| Income Deficit | 2,872 | $0 |
| Wage / Income Gap (%) | 10,689 | 33.68% |
| Wage / Income Gap ($) | 10,689 | 66.32¢ per $1 |
| Gini / Inequality Index | 10,689 | 0.45 |
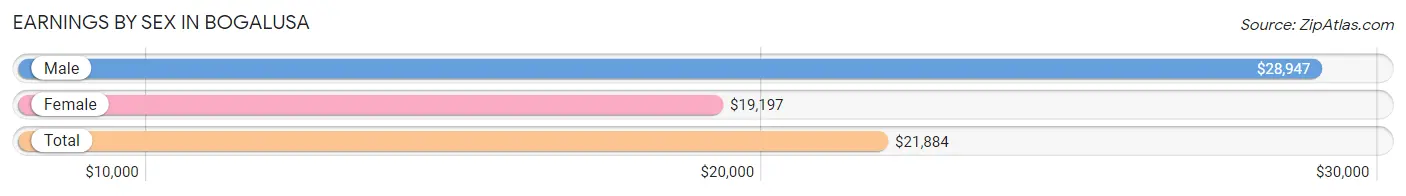
Earnings by Sex in Bogalusa
Average Earnings in Bogalusa are $21,884, $28,947 for men and $19,197 for women, a difference of 33.7%.
| Sex | Number | Average Earnings |
| Male | 2,242 (47.5%) | $28,947 |
| Female | 2,480 (52.5%) | $19,197 |
| Total | 4,722 (100.0%) | $21,884 |
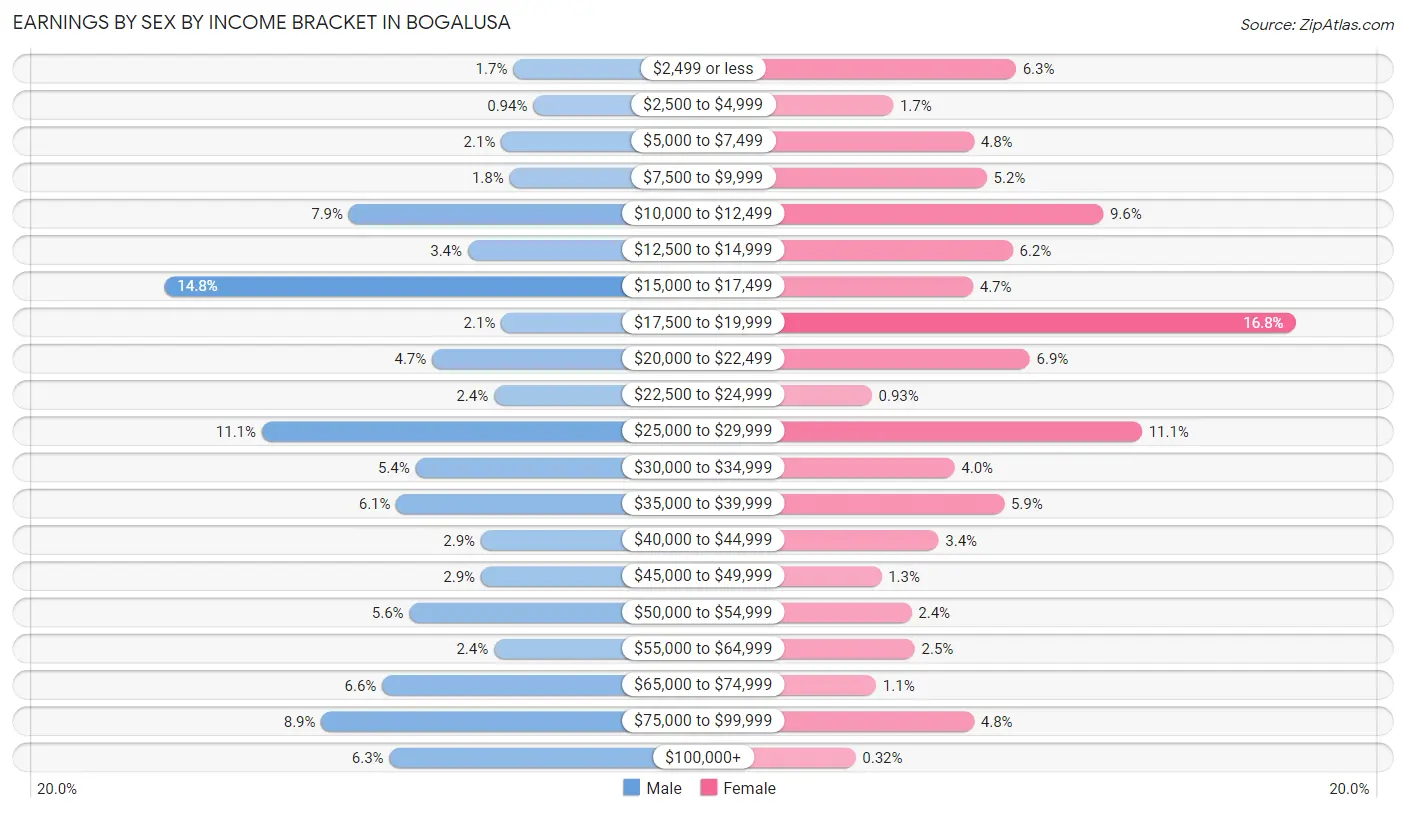
Earnings by Sex by Income Bracket in Bogalusa
The most common earnings brackets in Bogalusa are $15,000 to $17,499 for men (331 | 14.8%) and $17,500 to $19,999 for women (417 | 16.8%).
| Income | Male | Female |
| $2,499 or less | 38 (1.7%) | 157 (6.3%) |
| $2,500 to $4,999 | 21 (0.9%) | 43 (1.7%) |
| $5,000 to $7,499 | 48 (2.1%) | 118 (4.8%) |
| $7,500 to $9,999 | 41 (1.8%) | 130 (5.2%) |
| $10,000 to $12,499 | 176 (7.9%) | 238 (9.6%) |
| $12,500 to $14,999 | 76 (3.4%) | 154 (6.2%) |
| $15,000 to $17,499 | 331 (14.8%) | 117 (4.7%) |
| $17,500 to $19,999 | 48 (2.1%) | 417 (16.8%) |
| $20,000 to $22,499 | 106 (4.7%) | 170 (6.9%) |
| $22,500 to $24,999 | 54 (2.4%) | 23 (0.9%) |
| $25,000 to $29,999 | 249 (11.1%) | 274 (11.1%) |
| $30,000 to $34,999 | 120 (5.3%) | 100 (4.0%) |
| $35,000 to $39,999 | 136 (6.1%) | 146 (5.9%) |
| $40,000 to $44,999 | 65 (2.9%) | 85 (3.4%) |
| $45,000 to $49,999 | 65 (2.9%) | 32 (1.3%) |
| $50,000 to $54,999 | 125 (5.6%) | 60 (2.4%) |
| $55,000 to $64,999 | 54 (2.4%) | 63 (2.5%) |
| $65,000 to $74,999 | 148 (6.6%) | 27 (1.1%) |
| $75,000 to $99,999 | 199 (8.9%) | 118 (4.8%) |
| $100,000+ | 142 (6.3%) | 8 (0.3%) |
| Total | 2,242 (100.0%) | 2,480 (100.0%) |
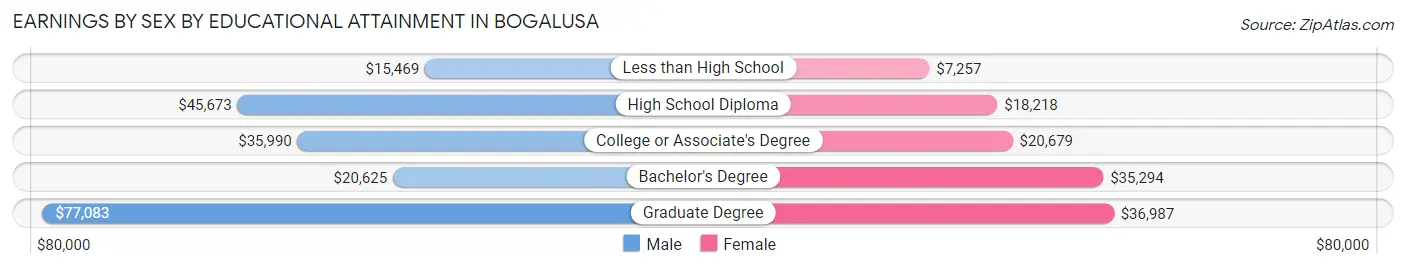
Earnings by Sex by Educational Attainment in Bogalusa
Average earnings in Bogalusa are $33,750 for men and $19,104 for women, a difference of 43.4%. Men with an educational attainment of graduate degree enjoy the highest average annual earnings of $77,083, while those with less than high school education earn the least with $15,469. Women with an educational attainment of graduate degree earn the most with the average annual earnings of $36,987, while those with less than high school education have the smallest earnings of $7,257.
| Educational Attainment | Male Income | Female Income |
| Less than High School | $15,469 | $7,257 |
| High School Diploma | $45,673 | $18,218 |
| College or Associate's Degree | $35,990 | $20,679 |
| Bachelor's Degree | $20,625 | $35,294 |
| Graduate Degree | $77,083 | $36,987 |
| Total | $33,750 | $19,104 |
Family Income in Bogalusa
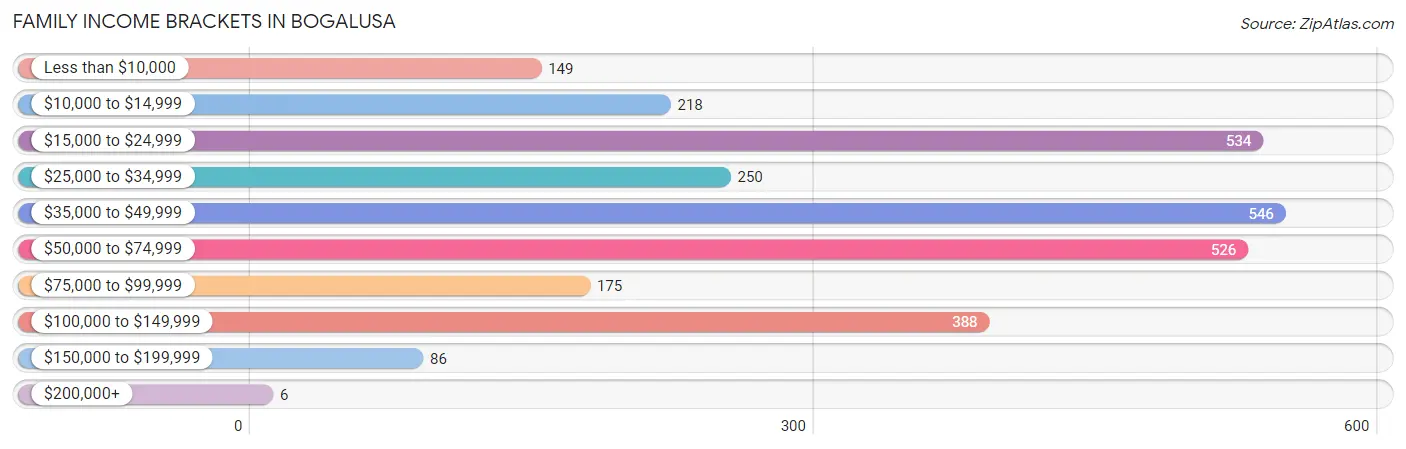
Family Income Brackets in Bogalusa
According to the Bogalusa family income data, there are 546 families falling into the $35,000 to $49,999 income range, which is the most common income bracket and makes up 19.0% of all families. Conversely, the $200,000+ income bracket is the least frequent group with only 6 families (0.2%) belonging to this category.
| Income Bracket | # Families | % Families |
| Less than $10,000 | 149 | 5.2% |
| $10,000 to $14,999 | 218 | 7.6% |
| $15,000 to $24,999 | 534 | 18.6% |
| $25,000 to $34,999 | 250 | 8.7% |
| $35,000 to $49,999 | 546 | 19.0% |
| $50,000 to $74,999 | 526 | 18.3% |
| $75,000 to $99,999 | 175 | 6.1% |
| $100,000 to $149,999 | 388 | 13.5% |
| $150,000 to $199,999 | 86 | 3.0% |
| $200,000+ | 6 | 0.2% |
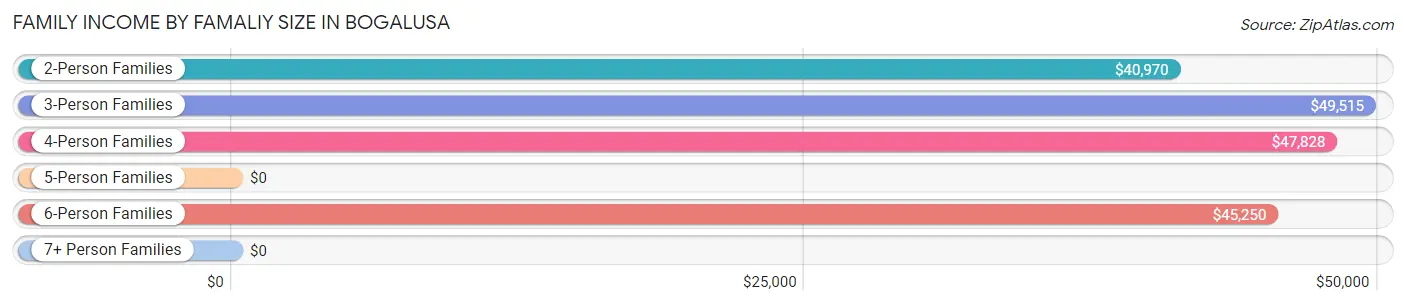
Family Income by Famaliy Size in Bogalusa
3-person families (899 | 31.3%) account for the highest median family income in Bogalusa with $49,515 per family, while 2-person families (1,350 | 47.0%) have the highest median income of $20,485 per family member.
| Income Bracket | # Families | Median Income |
| 2-Person Families | 1,350 (47.0%) | $40,970 |
| 3-Person Families | 899 (31.3%) | $49,515 |
| 4-Person Families | 480 (16.7%) | $47,828 |
| 5-Person Families | 130 (4.5%) | $0 |
| 6-Person Families | 9 (0.3%) | $45,250 |
| 7+ Person Families | 4 (0.1%) | $0 |
| Total | 2,872 (100.0%) | $42,471 |
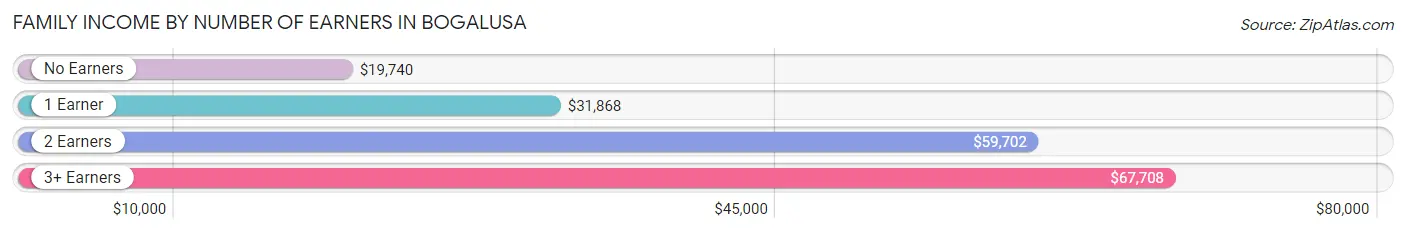
Family Income by Number of Earners in Bogalusa
The median family income in Bogalusa is $42,471, with families comprising 3+ earners (139) having the highest median family income of $67,708, while families with no earners (633) have the lowest median family income of $19,740, accounting for 4.8% and 22.0% of families, respectively.
| Number of Earners | # Families | Median Income |
| No Earners | 633 (22.0%) | $19,740 |
| 1 Earner | 1,275 (44.4%) | $31,868 |
| 2 Earners | 825 (28.7%) | $59,702 |
| 3+ Earners | 139 (4.8%) | $67,708 |
| Total | 2,872 (100.0%) | $42,471 |
Household Income in Bogalusa
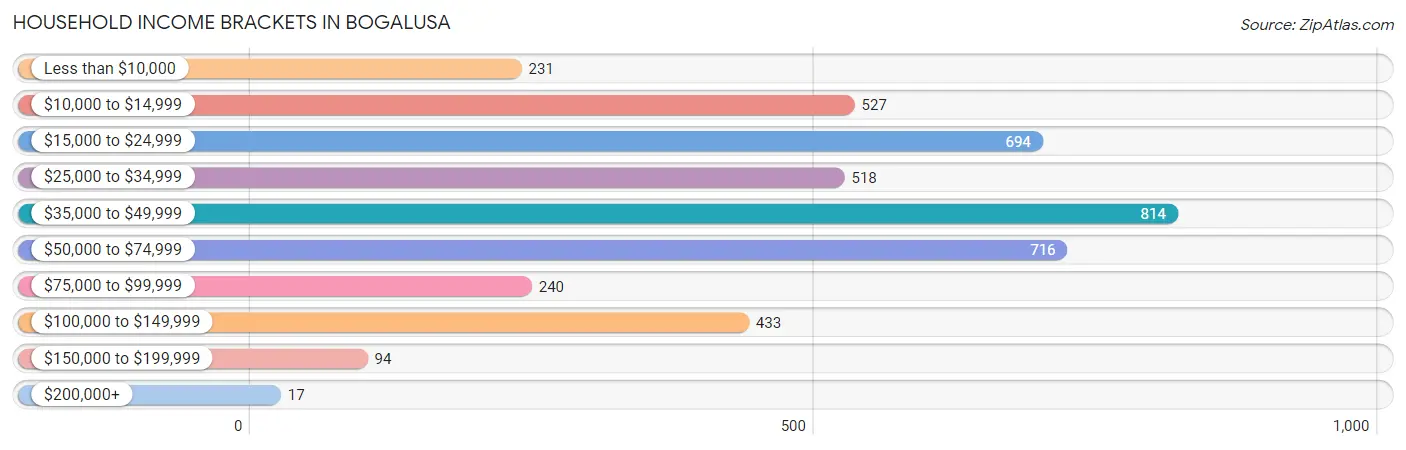
Household Income Brackets in Bogalusa
With 814 households falling in the category, the $35,000 to $49,999 income range is the most frequent in Bogalusa, accounting for 19.0% of all households. In contrast, only 17 households (0.4%) fall into the $200,000+ income bracket, making it the least populous group.
| Income Bracket | # Households | % Households |
| Less than $10,000 | 231 | 5.4% |
| $10,000 to $14,999 | 527 | 12.3% |
| $15,000 to $24,999 | 694 | 16.2% |
| $25,000 to $34,999 | 518 | 12.1% |
| $35,000 to $49,999 | 814 | 19.0% |
| $50,000 to $74,999 | 716 | 16.7% |
| $75,000 to $99,999 | 240 | 5.6% |
| $100,000 to $149,999 | 433 | 10.1% |
| $150,000 to $199,999 | 94 | 2.2% |
| $200,000+ | 17 | 0.4% |
Household Income by Householder Age in Bogalusa
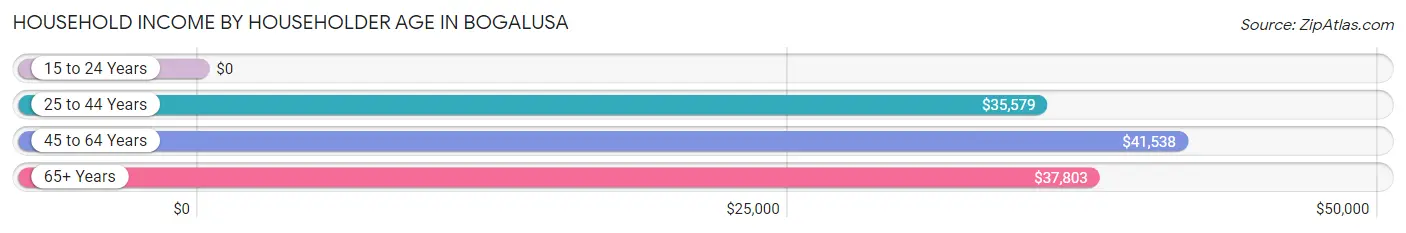
The median household income in Bogalusa is $39,213, with the highest median household income of $41,538 found in the 45 to 64 years age bracket for the primary householder. A total of 1,411 households (32.9%) fall into this category. Meanwhile, the 15 to 24 years age bracket for the primary householder has the lowest median household income of $0, with 221 households (5.2%) in this group.
| Income Bracket | # Households | Median Income |
| 15 to 24 Years | 221 (5.2%) | $0 |
| 25 to 44 Years | 1,603 (37.4%) | $35,579 |
| 45 to 64 Years | 1,411 (32.9%) | $41,538 |
| 65+ Years | 1,050 (24.5%) | $37,803 |
| Total | 4,285 (100.0%) | $39,213 |
Poverty in Bogalusa
Income Below Poverty by Sex and Age in Bogalusa
With 25.0% poverty level for males and 33.5% for females among the residents of Bogalusa, 6 to 11 year old males and under 5 year old females are the most vulnerable to poverty, with 219 males (59.7%) and 280 females (82.6%) in their respective age groups living below the poverty level.
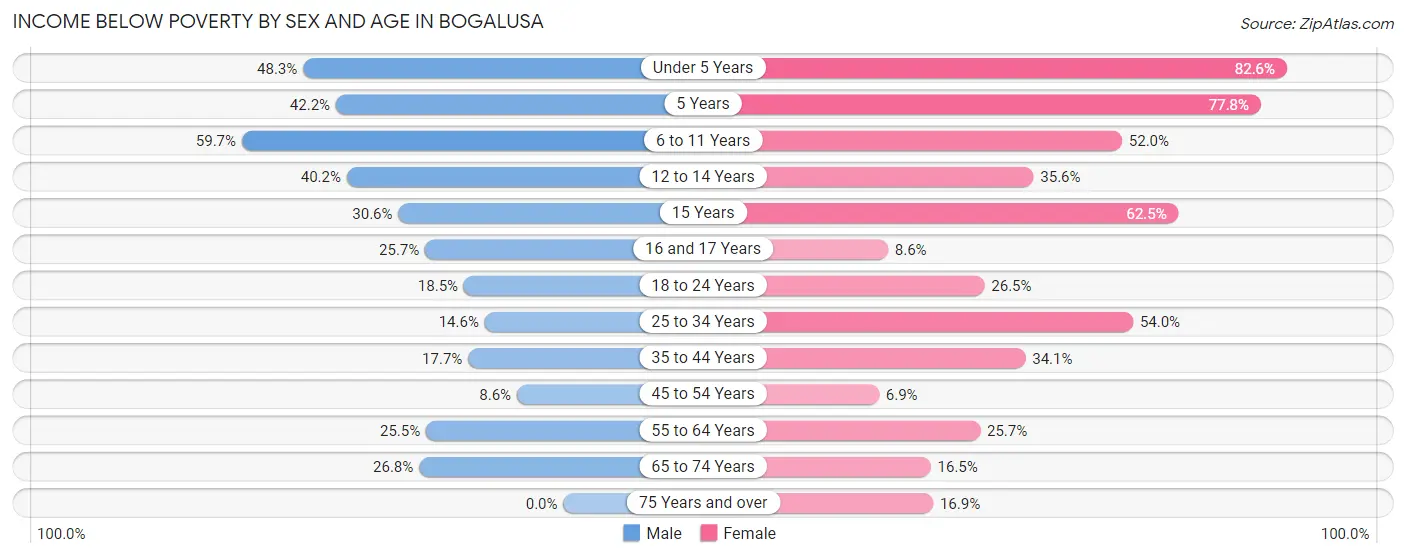
| Age Bracket | Male | Female |
| Under 5 Years | 157 (48.3%) | 280 (82.6%) |
| 5 Years | 19 (42.2%) | 42 (77.8%) |
| 6 to 11 Years | 219 (59.7%) | 171 (52.0%) |
| 12 to 14 Years | 86 (40.2%) | 48 (35.6%) |
| 15 Years | 49 (30.6%) | 55 (62.5%) |
| 16 and 17 Years | 29 (25.7%) | 10 (8.6%) |
| 18 to 24 Years | 120 (18.5%) | 95 (26.5%) |
| 25 to 34 Years | 55 (14.6%) | 595 (54.0%) |
| 35 to 44 Years | 147 (17.7%) | 157 (34.1%) |
| 45 to 54 Years | 42 (8.6%) | 49 (6.9%) |
| 55 to 64 Years | 155 (25.5%) | 222 (25.7%) |
| 65 to 74 Years | 121 (26.8%) | 139 (16.5%) |
| 75 Years and over | 0 (0.0%) | 53 (16.9%) |
| Total | 1,199 (25.0%) | 1,916 (33.5%) |
Income Above Poverty by Sex and Age in Bogalusa
According to the poverty statistics in Bogalusa, males aged 75 years and over and females aged 45 to 54 years are the age groups that are most secure financially, with 100.0% of males and 93.1% of females in these age groups living above the poverty line.
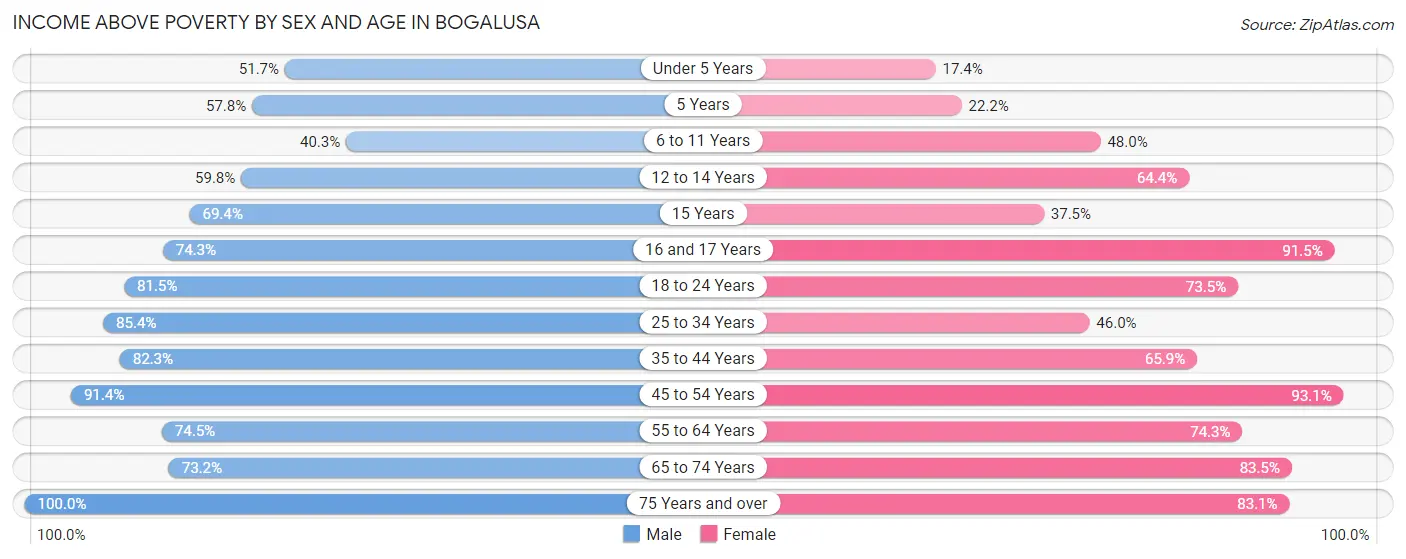
| Age Bracket | Male | Female |
| Under 5 Years | 168 (51.7%) | 59 (17.4%) |
| 5 Years | 26 (57.8%) | 12 (22.2%) |
| 6 to 11 Years | 148 (40.3%) | 158 (48.0%) |
| 12 to 14 Years | 128 (59.8%) | 87 (64.4%) |
| 15 Years | 111 (69.4%) | 33 (37.5%) |
| 16 and 17 Years | 84 (74.3%) | 107 (91.4%) |
| 18 to 24 Years | 530 (81.5%) | 264 (73.5%) |
| 25 to 34 Years | 322 (85.4%) | 506 (46.0%) |
| 35 to 44 Years | 685 (82.3%) | 304 (65.9%) |
| 45 to 54 Years | 445 (91.4%) | 663 (93.1%) |
| 55 to 64 Years | 453 (74.5%) | 643 (74.3%) |
| 65 to 74 Years | 331 (73.2%) | 704 (83.5%) |
| 75 Years and over | 165 (100.0%) | 260 (83.1%) |
| Total | 3,596 (75.0%) | 3,800 (66.5%) |
Income Below Poverty Among Married-Couple Families in Bogalusa
The poverty statistics for married-couple families in Bogalusa show that 7.5% or 96 of the total 1,283 families live below the poverty line. Families with 1 or 2 children have the highest poverty rate of 17.8%, comprising of 79 families. On the other hand, families with 3 or 4 children have the lowest poverty rate of 0.0%, which includes 0 families.
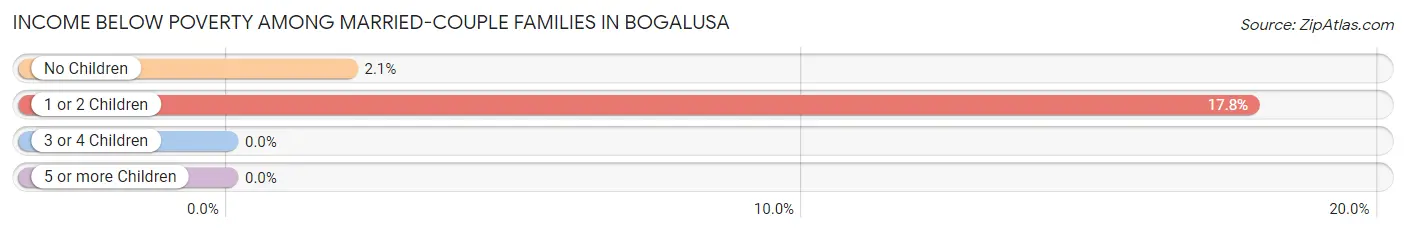
| Children | Above Poverty | Below Poverty |
| No Children | 802 (97.9%) | 17 (2.1%) |
| 1 or 2 Children | 365 (82.2%) | 79 (17.8%) |
| 3 or 4 Children | 16 (100.0%) | 0 (0.0%) |
| 5 or more Children | 4 (100.0%) | 0 (0.0%) |
| Total | 1,187 (92.5%) | 96 (7.5%) |
Income Below Poverty Among Single-Parent Households in Bogalusa
According to the poverty data in Bogalusa, 4.5% or 15 single-father households and 55.8% or 703 single-mother households are living below the poverty line. Among single-father households, those with 1 or 2 children have the highest poverty rate, with 15 households (7.8%) experiencing poverty. Likewise, among single-mother households, those with 3 or 4 children have the highest poverty rate, with 147 households (92.4%) falling below the poverty line.
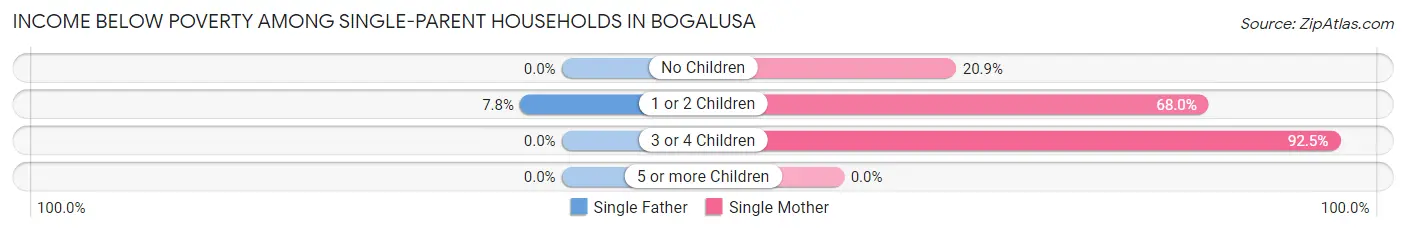
| Children | Single Father | Single Mother |
| No Children | 0 (0.0%) | 85 (20.9%) |
| 1 or 2 Children | 15 (7.8%) | 471 (68.0%) |
| 3 or 4 Children | 0 (0.0%) | 147 (92.4%) |
| 5 or more Children | 0 (0.0%) | 0 (0.0%) |
| Total | 15 (4.5%) | 703 (55.8%) |
Income Below Poverty Among Married-Couple vs Single-Parent Households in Bogalusa
The poverty data for Bogalusa shows that 96 of the married-couple family households (7.5%) and 718 of the single-parent households (45.2%) are living below the poverty level. Within the married-couple family households, those with 1 or 2 children have the highest poverty rate, with 79 households (17.8%) falling below the poverty line. Among the single-parent households, those with 3 or 4 children have the highest poverty rate, with 147 household (92.4%) living below poverty.
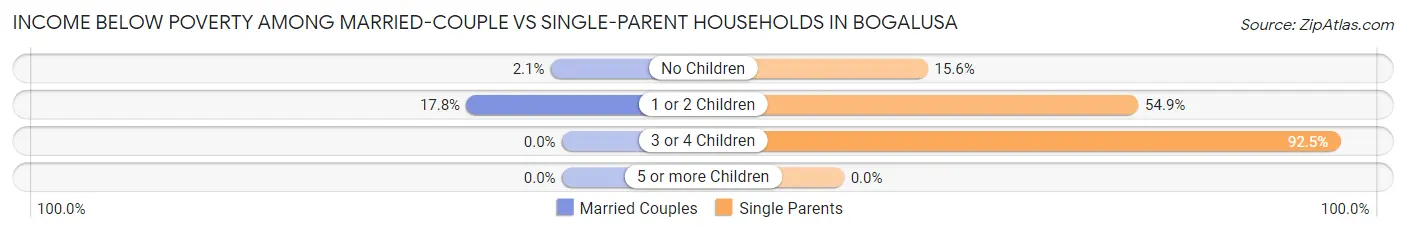
| Children | Married-Couple Families | Single-Parent Households |
| No Children | 17 (2.1%) | 85 (15.6%) |
| 1 or 2 Children | 79 (17.8%) | 486 (54.8%) |
| 3 or 4 Children | 0 (0.0%) | 147 (92.4%) |
| 5 or more Children | 0 (0.0%) | 0 (0.0%) |
| Total | 96 (7.5%) | 718 (45.2%) |
Race in Bogalusa
The most populous races in Bogalusa are White / Caucasian (5,362 | 50.2%), Black / African American (4,789 | 44.8%), and Hispanic or Latino (585 | 5.5%).
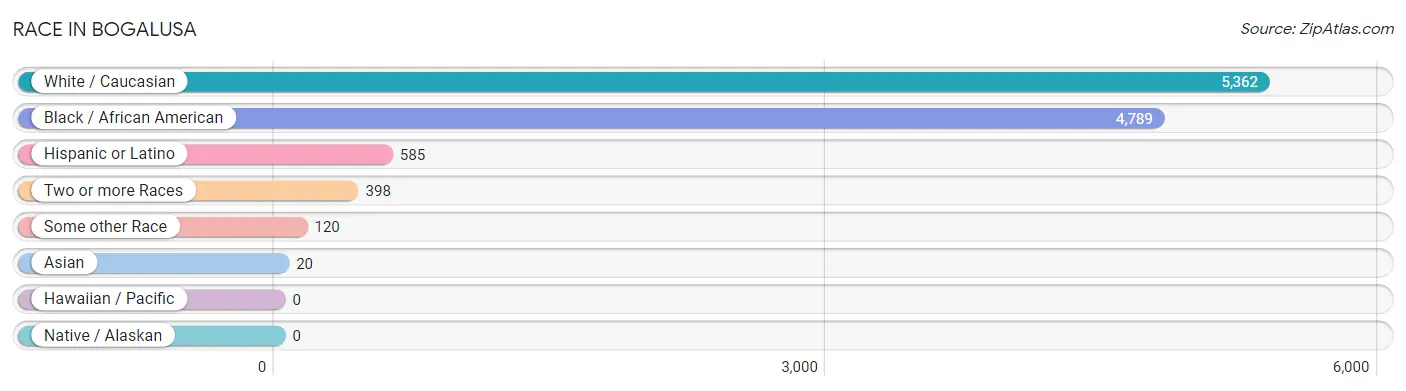
| Race | # Population | % Population |
| Asian | 20 | 0.2% |
| Black / African American | 4,789 | 44.8% |
| Hawaiian / Pacific | 0 | 0.0% |
| Hispanic or Latino | 585 | 5.5% |
| Native / Alaskan | 0 | 0.0% |
| White / Caucasian | 5,362 | 50.2% |
| Two or more Races | 398 | 3.7% |
| Some other Race | 120 | 1.1% |
| Total | 10,689 | 100.0% |
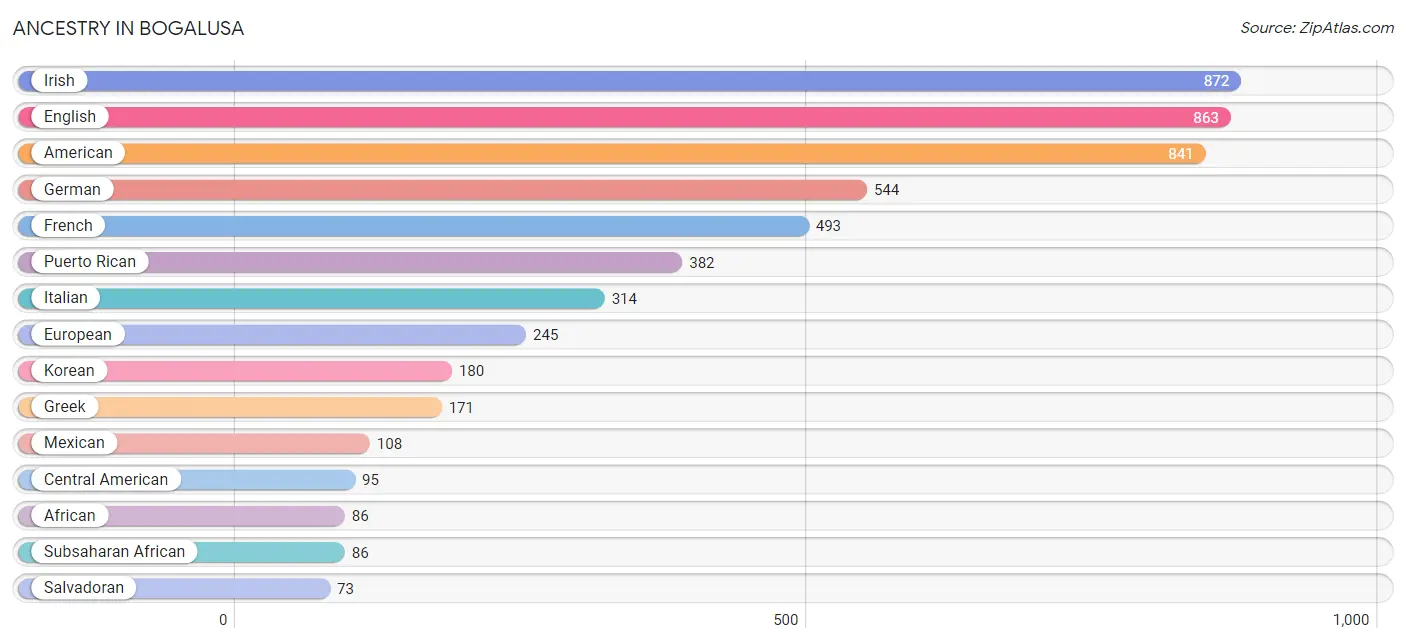
Ancestry in Bogalusa
The most populous ancestries reported in Bogalusa are Irish (872 | 8.2%), English (863 | 8.1%), American (841 | 7.9%), German (544 | 5.1%), and French (493 | 4.6%), together accounting for 33.8% of all Bogalusa residents.
| Ancestry | # Population | % Population |
| African | 86 | 0.8% |
| American | 841 | 7.9% |
| Apache | 16 | 0.2% |
| British | 47 | 0.4% |
| Cajun | 12 | 0.1% |
| Central American | 95 | 0.9% |
| Cherokee | 32 | 0.3% |
| Cheyenne | 19 | 0.2% |
| English | 863 | 8.1% |
| European | 245 | 2.3% |
| French | 493 | 4.6% |
| German | 544 | 5.1% |
| Greek | 171 | 1.6% |
| Iranian | 5 | 0.1% |
| Irish | 872 | 8.2% |
| Italian | 314 | 2.9% |
| Korean | 180 | 1.7% |
| Mexican | 108 | 1.0% |
| Nicaraguan | 22 | 0.2% |
| Polish | 48 | 0.4% |
| Portuguese | 11 | 0.1% |
| Puerto Rican | 382 | 3.6% |
| Salvadoran | 73 | 0.7% |
| Scotch-Irish | 4 | 0.0% |
| Scottish | 20 | 0.2% |
| Sri Lankan | 9 | 0.1% |
| Subsaharan African | 86 | 0.8% |
| Welsh | 8 | 0.1% | View All 28 Rows |
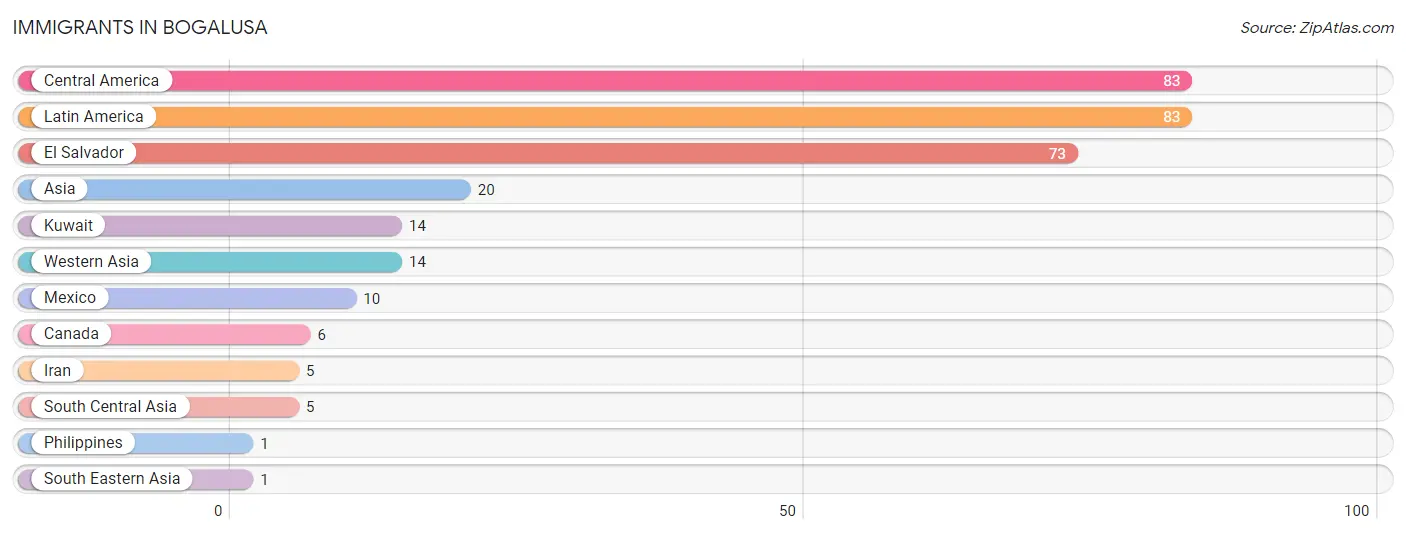
Immigrants in Bogalusa
The most numerous immigrant groups reported in Bogalusa came from Central America (83 | 0.8%), Latin America (83 | 0.8%), El Salvador (73 | 0.7%), Asia (20 | 0.2%), and Kuwait (14 | 0.1%), together accounting for 2.6% of all Bogalusa residents.
| Immigration Origin | # Population | % Population |
| Asia | 20 | 0.2% |
| Canada | 6 | 0.1% |
| Central America | 83 | 0.8% |
| El Salvador | 73 | 0.7% |
| Iran | 5 | 0.1% |
| Kuwait | 14 | 0.1% |
| Latin America | 83 | 0.8% |
| Mexico | 10 | 0.1% |
| Philippines | 1 | 0.0% |
| South Central Asia | 5 | 0.1% |
| South Eastern Asia | 1 | 0.0% |
| Western Asia | 14 | 0.1% | View All 12 Rows |
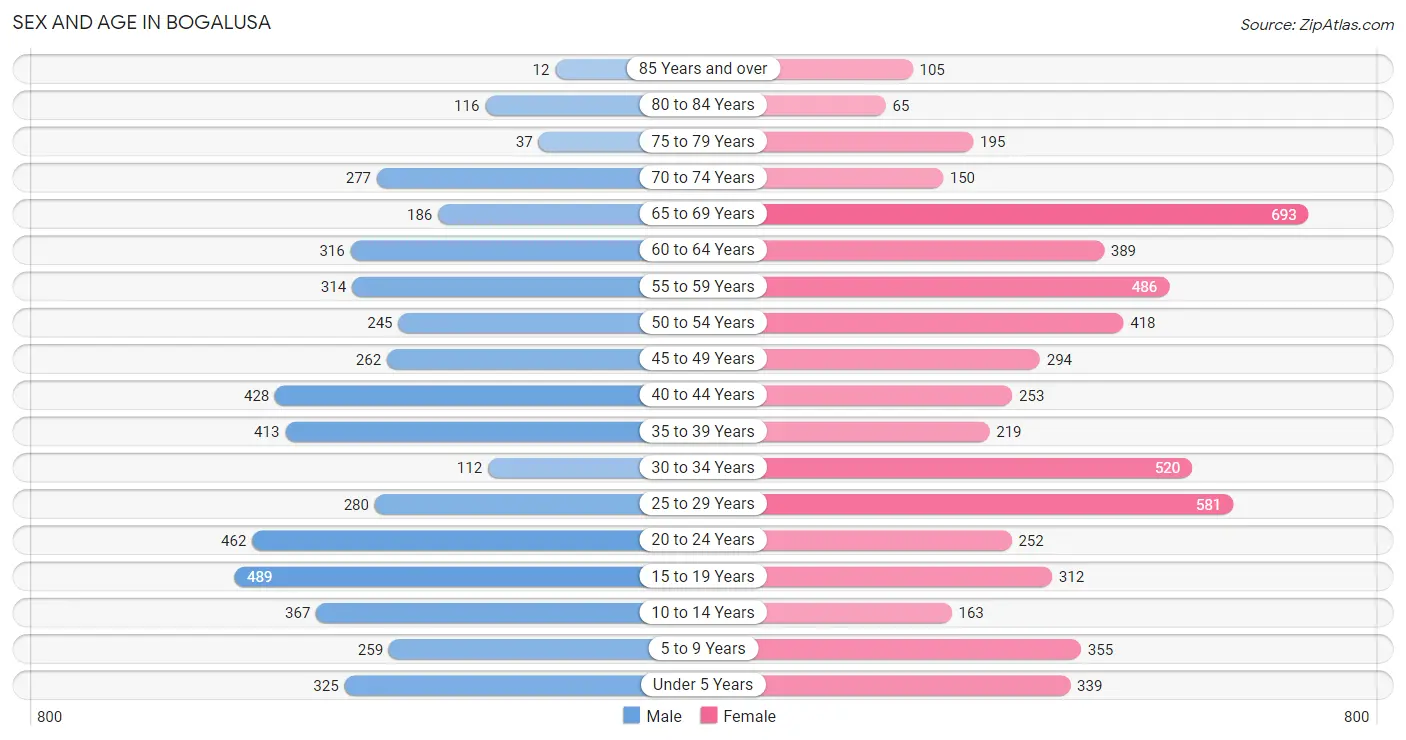
Sex and Age in Bogalusa
Sex and Age in Bogalusa
The most populous age groups in Bogalusa are 15 to 19 Years (489 | 10.0%) for men and 65 to 69 Years (693 | 12.0%) for women.
| Age Bracket | Male | Female |
| Under 5 Years | 325 (6.6%) | 339 (5.9%) |
| 5 to 9 Years | 259 (5.3%) | 355 (6.1%) |
| 10 to 14 Years | 367 (7.5%) | 163 (2.8%) |
| 15 to 19 Years | 489 (10.0%) | 312 (5.4%) |
| 20 to 24 Years | 462 (9.4%) | 252 (4.3%) |
| 25 to 29 Years | 280 (5.7%) | 581 (10.0%) |
| 30 to 34 Years | 112 (2.3%) | 520 (9.0%) |
| 35 to 39 Years | 413 (8.4%) | 219 (3.8%) |
| 40 to 44 Years | 428 (8.7%) | 253 (4.4%) |
| 45 to 49 Years | 262 (5.3%) | 294 (5.1%) |
| 50 to 54 Years | 245 (5.0%) | 418 (7.2%) |
| 55 to 59 Years | 314 (6.4%) | 486 (8.4%) |
| 60 to 64 Years | 316 (6.5%) | 389 (6.7%) |
| 65 to 69 Years | 186 (3.8%) | 693 (12.0%) |
| 70 to 74 Years | 277 (5.7%) | 150 (2.6%) |
| 75 to 79 Years | 37 (0.8%) | 195 (3.4%) |
| 80 to 84 Years | 116 (2.4%) | 65 (1.1%) |
| 85 Years and over | 12 (0.2%) | 105 (1.8%) |
| Total | 4,900 (100.0%) | 5,789 (100.0%) |
Families and Households in Bogalusa
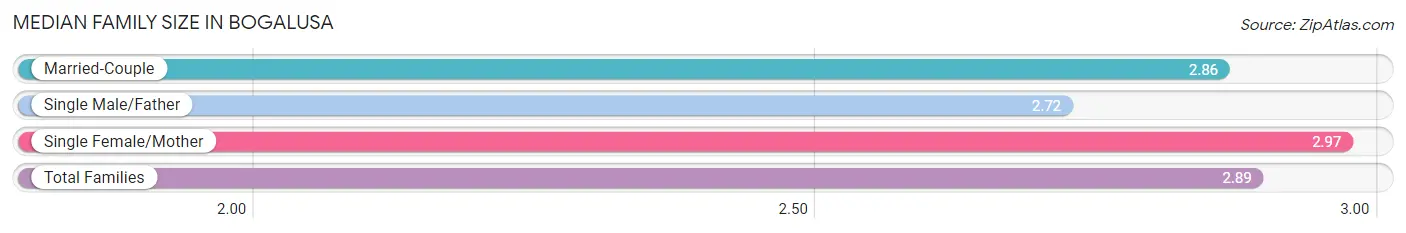
Median Family Size in Bogalusa
The median family size in Bogalusa is 2.89 persons per family, with single female/mother families (1,259 | 43.8%) accounting for the largest median family size of 2.97 persons per family. On the other hand, single male/father families (330 | 11.5%) represent the smallest median family size with 2.72 persons per family.
| Family Type | # Families | Family Size |
| Married-Couple | 1,283 (44.7%) | 2.86 |
| Single Male/Father | 330 (11.5%) | 2.72 |
| Single Female/Mother | 1,259 (43.8%) | 2.97 |
| Total Families | 2,872 (100.0%) | 2.89 |
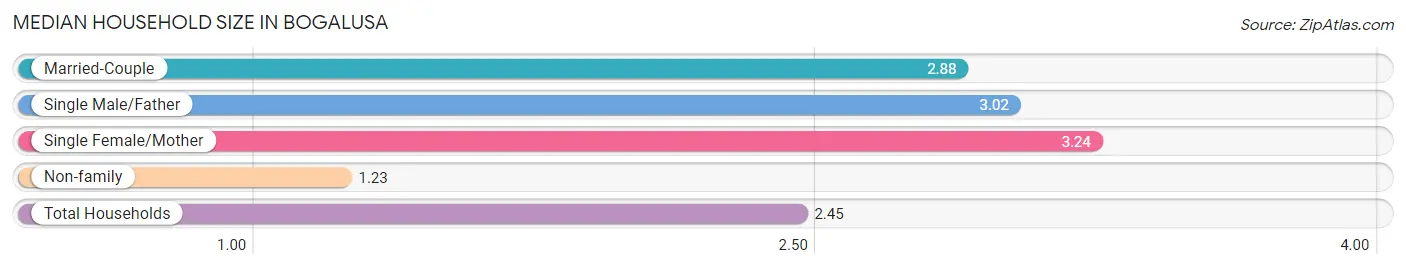
Median Household Size in Bogalusa
The median household size in Bogalusa is 2.45 persons per household, with single female/mother households (1,259 | 29.4%) accounting for the largest median household size of 3.24 persons per household. non-family households (1,413 | 33.0%) represent the smallest median household size with 1.23 persons per household.
| Household Type | # Households | Household Size |
| Married-Couple | 1,283 (29.9%) | 2.88 |
| Single Male/Father | 330 (7.7%) | 3.02 |
| Single Female/Mother | 1,259 (29.4%) | 3.24 |
| Non-family | 1,413 (33.0%) | 1.23 |
| Total Households | 4,285 (100.0%) | 2.45 |
Household Size by Marriage Status in Bogalusa
Out of a total of 4,285 households in Bogalusa, 2,872 (67.0%) are family households, while 1,413 (33.0%) are nonfamily households. The most numerous type of family households are 2-person households, comprising 1,115, and the most common type of nonfamily households are 1-person households, comprising 1,190.
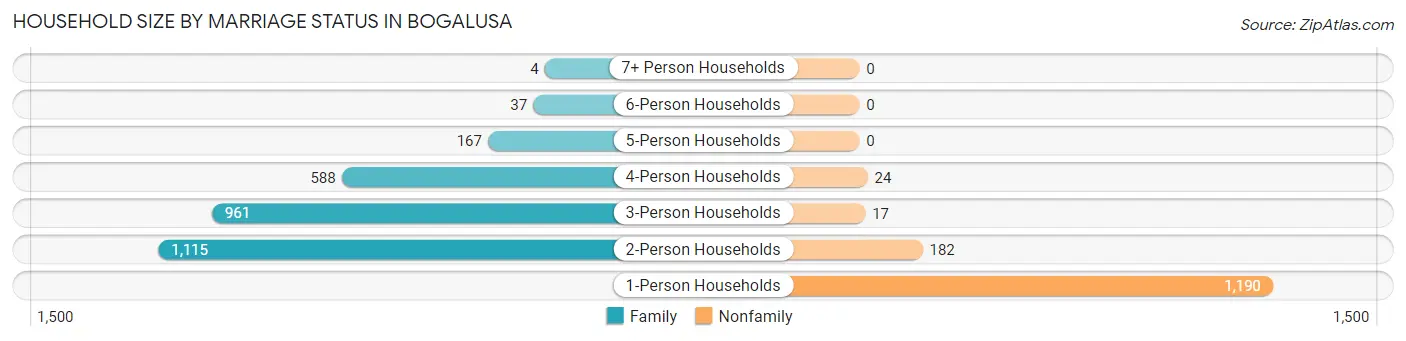
| Household Size | Family Households | Nonfamily Households |
| 1-Person Households | - | 1,190 (27.8%) |
| 2-Person Households | 1,115 (26.0%) | 182 (4.3%) |
| 3-Person Households | 961 (22.4%) | 17 (0.4%) |
| 4-Person Households | 588 (13.7%) | 24 (0.6%) |
| 5-Person Households | 167 (3.9%) | 0 (0.0%) |
| 6-Person Households | 37 (0.9%) | 0 (0.0%) |
| 7+ Person Households | 4 (0.1%) | 0 (0.0%) |
| Total | 2,872 (67.0%) | 1,413 (33.0%) |
Female Fertility in Bogalusa
Fertility by Age in Bogalusa
Average fertility rate in Bogalusa is 35.0 births per 1,000 women. Women in the age bracket of 20 to 34 years have the highest fertility rate with 53.0 births per 1,000 women. Women in the age bracket of 20 to 34 years acount for 81.8% of all women with births.
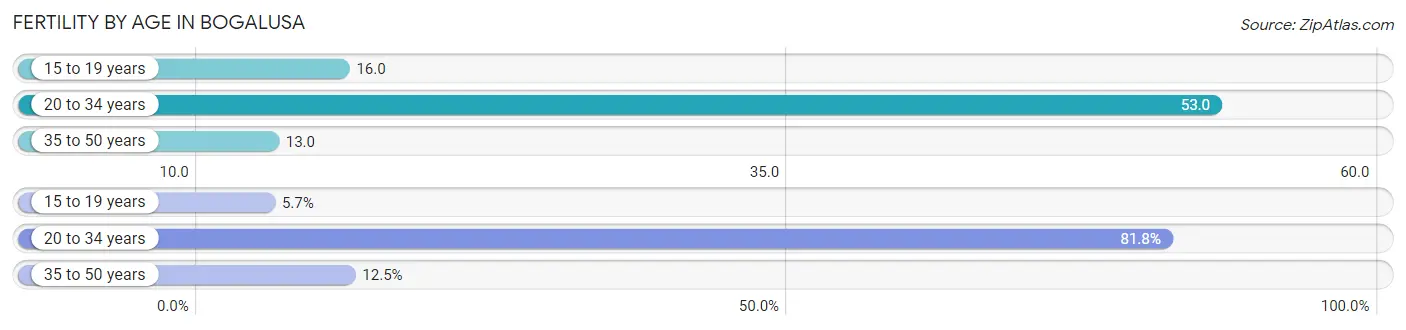
| Age Bracket | Women with Births | Births / 1,000 Women |
| 15 to 19 years | 5 (5.7%) | 16.0 |
| 20 to 34 years | 72 (81.8%) | 53.0 |
| 35 to 50 years | 11 (12.5%) | 13.0 |
| Total | 88 (100.0%) | 35.0 |
Fertility by Age by Marriage Status in Bogalusa
13.6% of women with births (88) in Bogalusa are married. The highest percentage of unmarried women with births falls into 15 to 19 years age bracket with 100.0% of them unmarried at the time of birth, while the lowest percentage of unmarried women with births belong to 20 to 34 years age bracket with 83.3% of them unmarried.
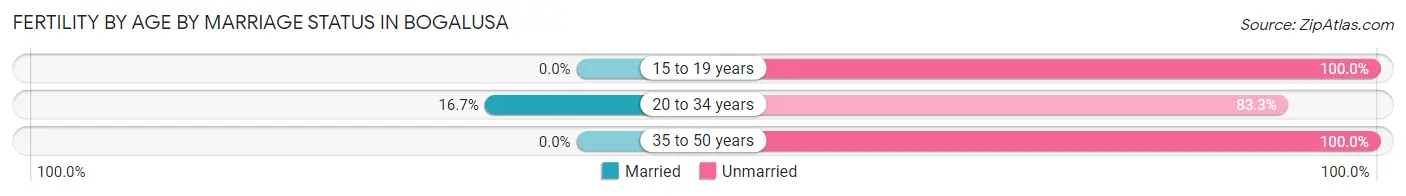
| Age Bracket | Married | Unmarried |
| 15 to 19 years | 0 (0.0%) | 5 (100.0%) |
| 20 to 34 years | 12 (16.7%) | 60 (83.3%) |
| 35 to 50 years | 0 (0.0%) | 11 (100.0%) |
| Total | 12 (13.6%) | 76 (86.4%) |
Fertility by Education in Bogalusa
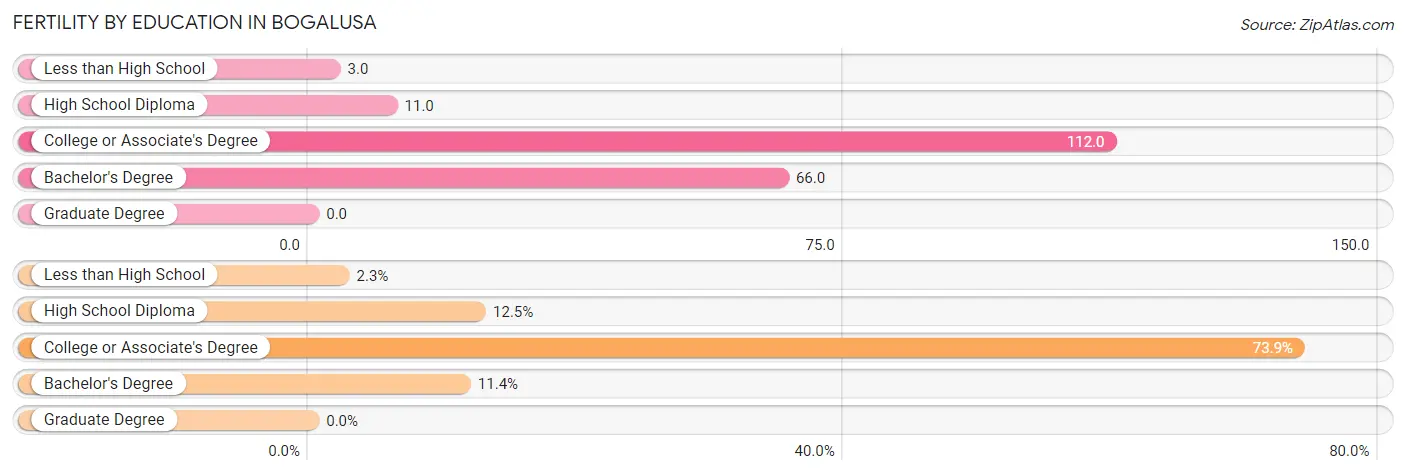
| Educational Attainment | Women with Births | Births / 1,000 Women |
| Less than High School | 2 (2.3%) | 3.0 |
| High School Diploma | 11 (12.5%) | 11.0 |
| College or Associate's Degree | 65 (73.9%) | 112.0 |
| Bachelor's Degree | 10 (11.4%) | 66.0 |
| Graduate Degree | 0 (0.0%) | 0.0 |
| Total | 88 (100.0%) | 35.0 |
Fertility by Education by Marriage Status in Bogalusa
86.4% of women with births in Bogalusa are unmarried. Women with the educational attainment of less than high school are most likely to be married with 100.0% of them married at childbirth, while women with the educational attainment of high school diploma are least likely to be married with 100.0% of them unmarried at childbirth.
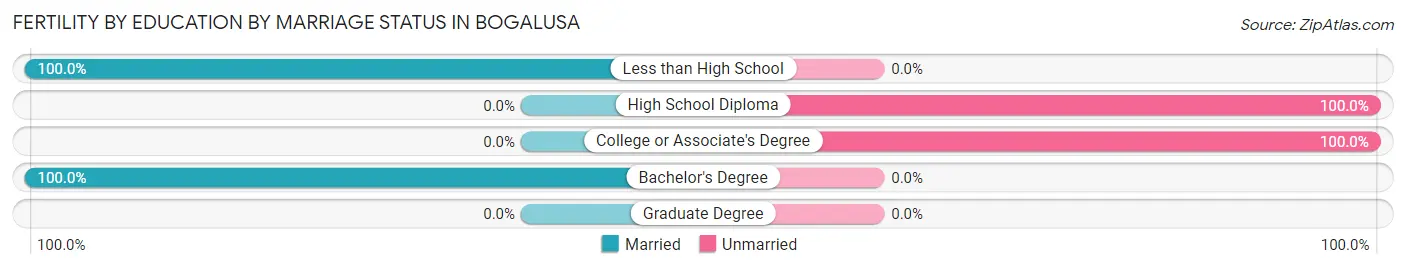
| Educational Attainment | Married | Unmarried |
| Less than High School | 2 (100.0%) | 0 (0.0%) |
| High School Diploma | 0 (0.0%) | 11 (100.0%) |
| College or Associate's Degree | 0 (0.0%) | 65 (100.0%) |
| Bachelor's Degree | 10 (100.0%) | 0 (0.0%) |
| Graduate Degree | 0 (0.0%) | 0 (0.0%) |
| Total | 12 (13.6%) | 76 (86.4%) |
Employment Characteristics in Bogalusa
Employment by Class of Employer in Bogalusa
Among the 4,066 employed individuals in Bogalusa, private company employees (2,885 | 71.0%), state government employees (322 | 7.9%), and local government employees (280 | 6.9%) make up the most common classes of employment.
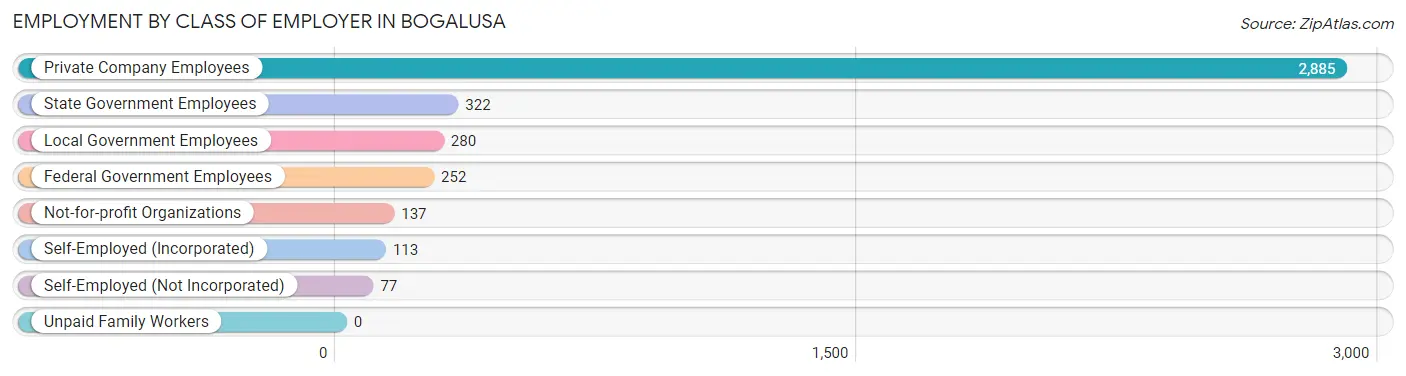
| Employer Class | # Employees | % Employees |
| Private Company Employees | 2,885 | 71.0% |
| Self-Employed (Incorporated) | 113 | 2.8% |
| Self-Employed (Not Incorporated) | 77 | 1.9% |
| Not-for-profit Organizations | 137 | 3.4% |
| Local Government Employees | 280 | 6.9% |
| State Government Employees | 322 | 7.9% |
| Federal Government Employees | 252 | 6.2% |
| Unpaid Family Workers | 0 | 0.0% |
| Total | 4,066 | 100.0% |
Employment Status by Age in Bogalusa
According to the labor force statistics for Bogalusa, out of the total population over 16 years of age (8,633), 54.4% or 4,696 individuals are in the labor force, with 11.6% or 545 of them unemployed. The age group with the highest labor force participation rate is 20 to 24 years, with 89.5% or 639 individuals in the labor force. Within the labor force, the 16 to 19 years age range has the highest percentage of unemployed individuals, with 30.6% or 52 of them being unemployed.
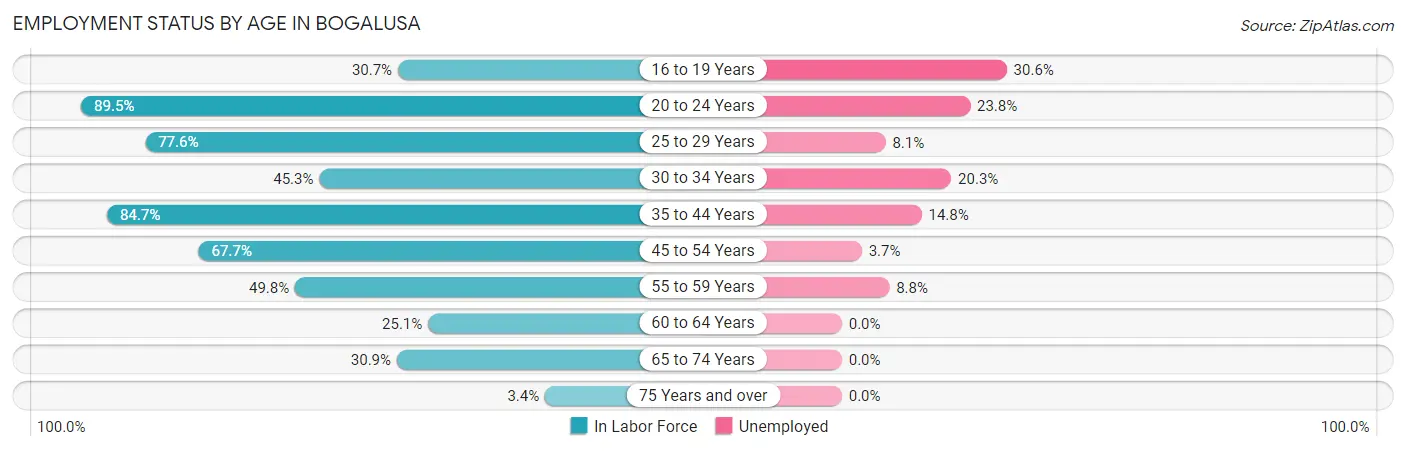
| Age Bracket | In Labor Force | Unemployed |
| 16 to 19 Years | 170 (30.7%) | 52 (30.6%) |
| 20 to 24 Years | 639 (89.5%) | 152 (23.8%) |
| 25 to 29 Years | 668 (77.6%) | 54 (8.1%) |
| 30 to 34 Years | 286 (45.3%) | 58 (20.3%) |
| 35 to 44 Years | 1,112 (84.7%) | 165 (14.8%) |
| 45 to 54 Years | 825 (67.7%) | 31 (3.7%) |
| 55 to 59 Years | 398 (49.8%) | 35 (8.8%) |
| 60 to 64 Years | 177 (25.1%) | 0 (0.0%) |
| 65 to 74 Years | 404 (30.9%) | 0 (0.0%) |
| 75 Years and over | 18 (3.4%) | 0 (0.0%) |
| Total | 4,696 (54.4%) | 545 (11.6%) |
Employment Status by Educational Attainment in Bogalusa
According to labor force statistics for Bogalusa, 62.7% of individuals (3,467) out of the total population between 25 and 64 years of age (5,530) are in the labor force, with 9.9% or 343 of them being unemployed. The group with the highest labor force participation rate are those with the educational attainment of high school diploma, with 72.1% or 1,677 individuals in the labor force. Within the labor force, individuals with high school diploma education have the highest percentage of unemployment, with 13.9% or 233 of them being unemployed.
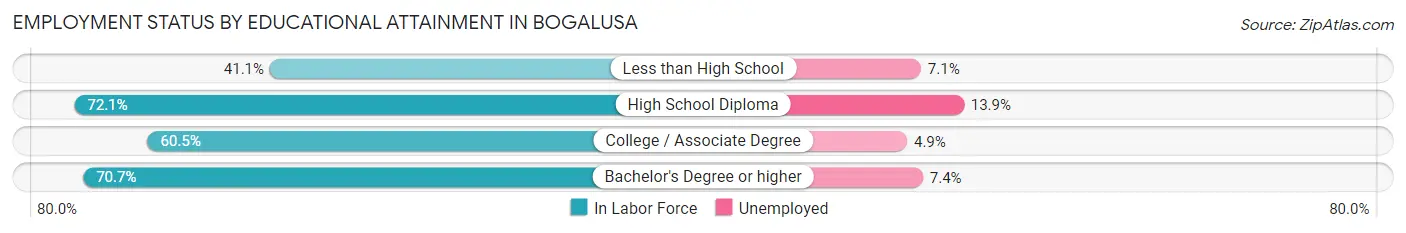
| Educational Attainment | In Labor Force | Unemployed |
| Less than High School | 462 (41.1%) | 80 (7.1%) |
| High School Diploma | 1,677 (72.1%) | 323 (13.9%) |
| College / Associate Degree | 860 (60.5%) | 70 (4.9%) |
| Bachelor's Degree or higher | 465 (70.7%) | 49 (7.4%) |
| Total | 3,467 (62.7%) | 547 (9.9%) |
Employment Occupations by Sex in Bogalusa
Management, Business, Science and Arts Occupations
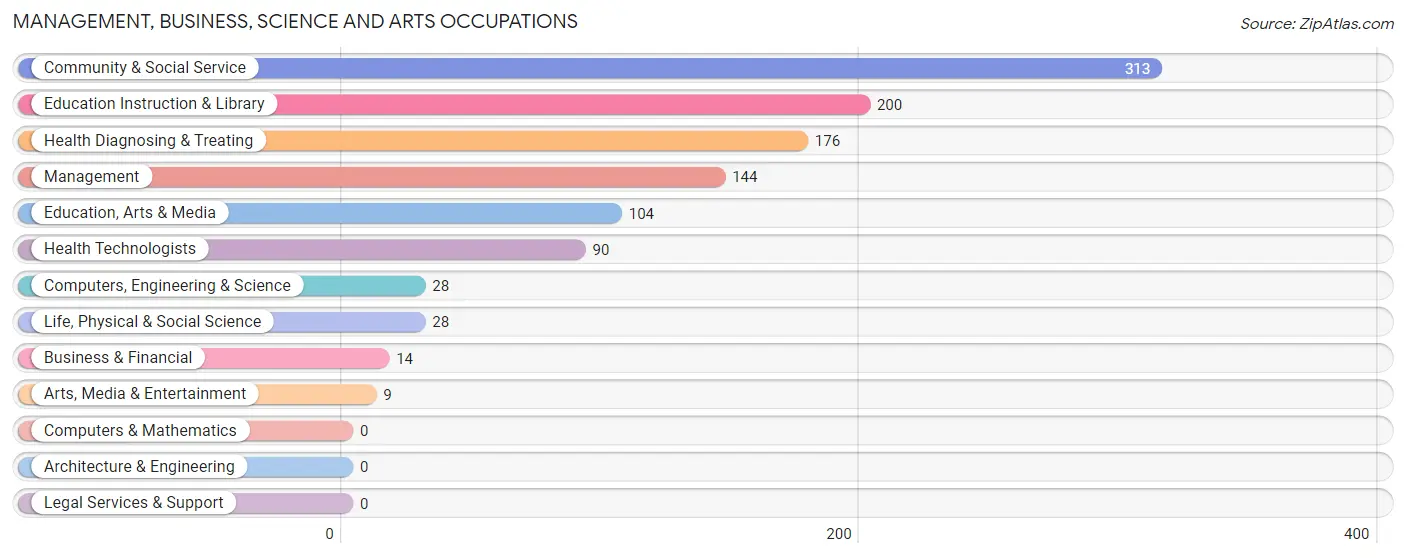
The most common Management, Business, Science and Arts occupations in Bogalusa are Community & Social Service (313 | 7.5%), Education Instruction & Library (200 | 4.8%), Health Diagnosing & Treating (176 | 4.2%), Management (144 | 3.5%), and Education, Arts & Media (104 | 2.5%).
Management, Business, Science and Arts Occupations by Sex
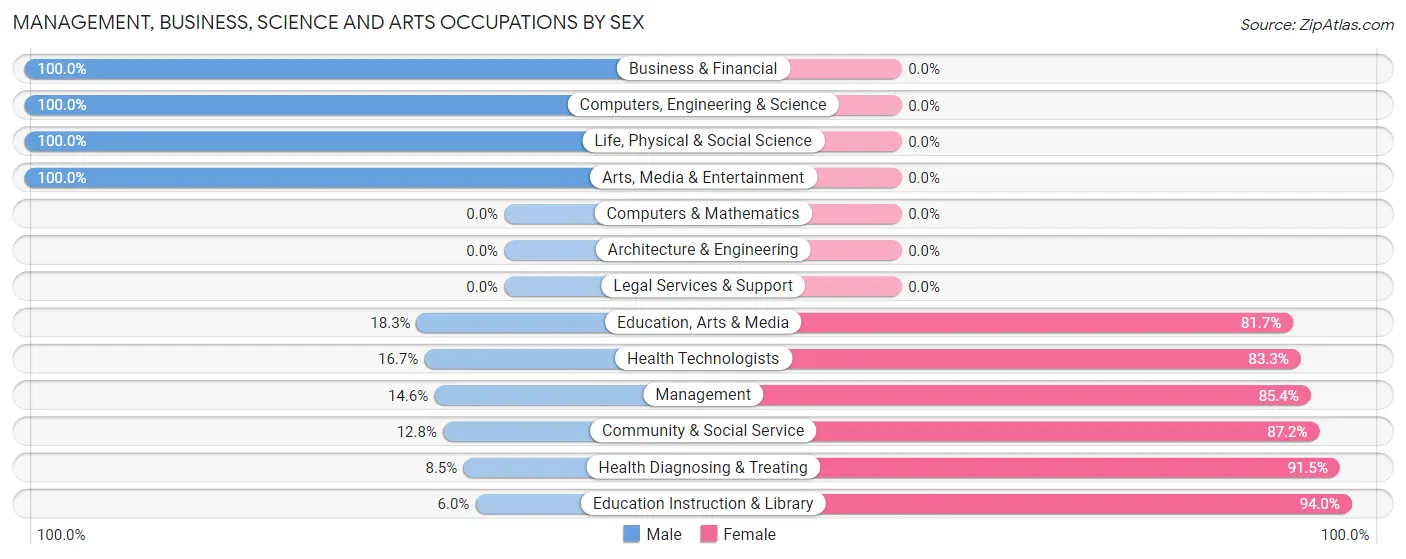
Within the Management, Business, Science and Arts occupations in Bogalusa, the most male-oriented occupations are Business & Financial (100.0%), Computers, Engineering & Science (100.0%), and Life, Physical & Social Science (100.0%), while the most female-oriented occupations are Education Instruction & Library (94.0%), Health Diagnosing & Treating (91.5%), and Community & Social Service (87.2%).
| Occupation | Male | Female |
| Management | 21 (14.6%) | 123 (85.4%) |
| Business & Financial | 14 (100.0%) | 0 (0.0%) |
| Computers, Engineering & Science | 28 (100.0%) | 0 (0.0%) |
| Computers & Mathematics | 0 (0.0%) | 0 (0.0%) |
| Architecture & Engineering | 0 (0.0%) | 0 (0.0%) |
| Life, Physical & Social Science | 28 (100.0%) | 0 (0.0%) |
| Community & Social Service | 40 (12.8%) | 273 (87.2%) |
| Education, Arts & Media | 19 (18.3%) | 85 (81.7%) |
| Legal Services & Support | 0 (0.0%) | 0 (0.0%) |
| Education Instruction & Library | 12 (6.0%) | 188 (94.0%) |
| Arts, Media & Entertainment | 9 (100.0%) | 0 (0.0%) |
| Health Diagnosing & Treating | 15 (8.5%) | 161 (91.5%) |
| Health Technologists | 15 (16.7%) | 75 (83.3%) |
| Total (Category) | 118 (17.5%) | 557 (82.5%) |
| Total (Overall) | 1,980 (47.7%) | 2,167 (52.2%) |
Services Occupations
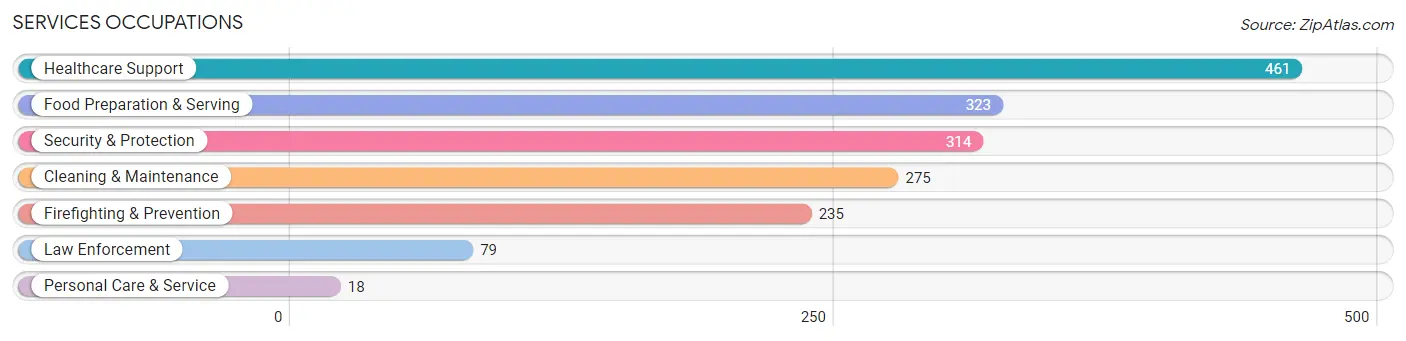
The most common Services occupations in Bogalusa are Healthcare Support (461 | 11.1%), Food Preparation & Serving (323 | 7.8%), Security & Protection (314 | 7.6%), Cleaning & Maintenance (275 | 6.6%), and Firefighting & Prevention (235 | 5.7%).
Services Occupations by Sex
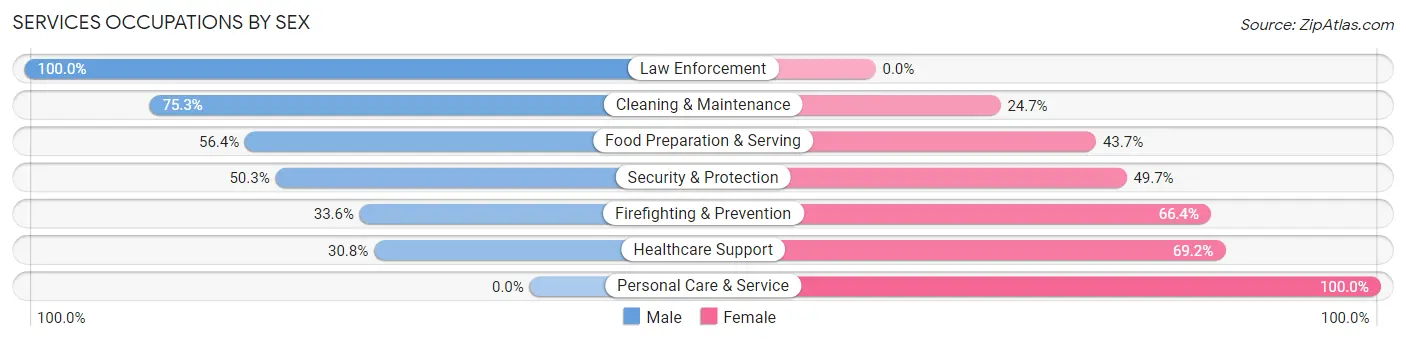
Within the Services occupations in Bogalusa, the most male-oriented occupations are Law Enforcement (100.0%), Cleaning & Maintenance (75.3%), and Food Preparation & Serving (56.4%), while the most female-oriented occupations are Personal Care & Service (100.0%), Healthcare Support (69.2%), and Firefighting & Prevention (66.4%).
| Occupation | Male | Female |
| Healthcare Support | 142 (30.8%) | 319 (69.2%) |
| Security & Protection | 158 (50.3%) | 156 (49.7%) |
| Firefighting & Prevention | 79 (33.6%) | 156 (66.4%) |
| Law Enforcement | 79 (100.0%) | 0 (0.0%) |
| Food Preparation & Serving | 182 (56.4%) | 141 (43.6%) |
| Cleaning & Maintenance | 207 (75.3%) | 68 (24.7%) |
| Personal Care & Service | 0 (0.0%) | 18 (100.0%) |
| Total (Category) | 689 (49.5%) | 702 (50.5%) |
| Total (Overall) | 1,980 (47.7%) | 2,167 (52.2%) |
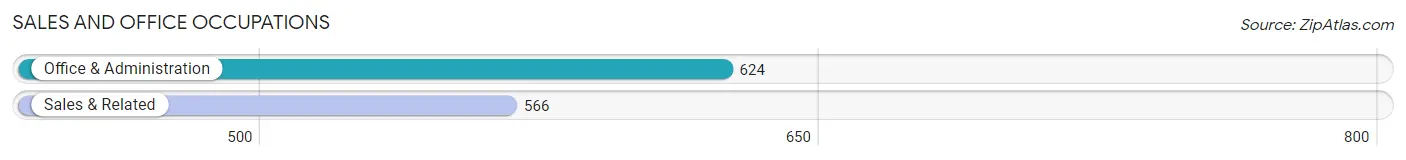
Sales and Office Occupations
The most common Sales and Office occupations in Bogalusa are Office & Administration (624 | 15.0%), and Sales & Related (566 | 13.7%).
Sales and Office Occupations by Sex
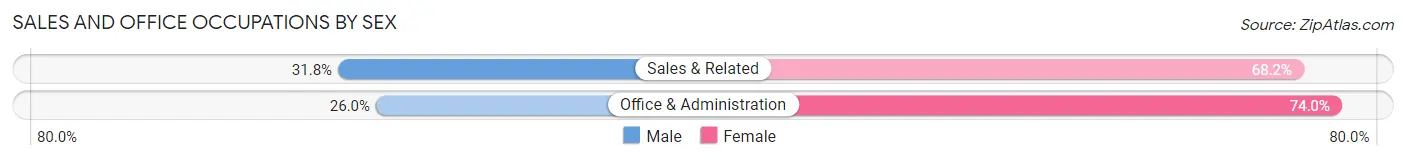
| Occupation | Male | Female |
| Sales & Related | 180 (31.8%) | 386 (68.2%) |
| Office & Administration | 162 (26.0%) | 462 (74.0%) |
| Total (Category) | 342 (28.7%) | 848 (71.3%) |
| Total (Overall) | 1,980 (47.7%) | 2,167 (52.2%) |
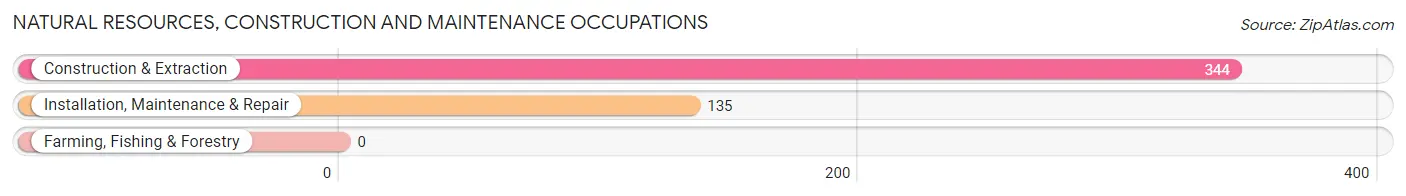
Natural Resources, Construction and Maintenance Occupations
The most common Natural Resources, Construction and Maintenance occupations in Bogalusa are Construction & Extraction (344 | 8.3%), and Installation, Maintenance & Repair (135 | 3.3%).
Natural Resources, Construction and Maintenance Occupations by Sex
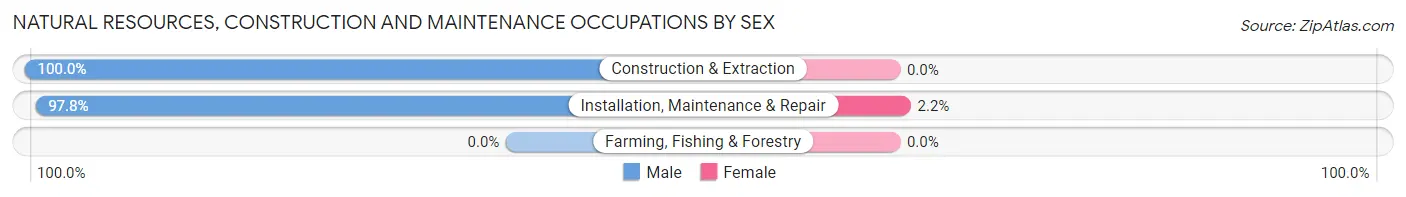
| Occupation | Male | Female |
| Farming, Fishing & Forestry | 0 (0.0%) | 0 (0.0%) |
| Construction & Extraction | 344 (100.0%) | 0 (0.0%) |
| Installation, Maintenance & Repair | 132 (97.8%) | 3 (2.2%) |
| Total (Category) | 476 (99.4%) | 3 (0.6%) |
| Total (Overall) | 1,980 (47.7%) | 2,167 (52.2%) |
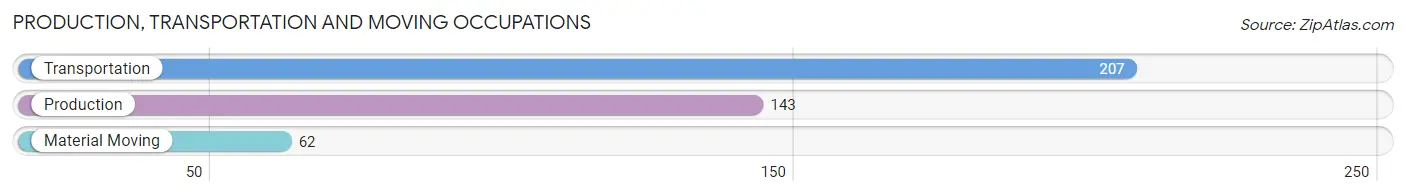
Production, Transportation and Moving Occupations
The most common Production, Transportation and Moving occupations in Bogalusa are Transportation (207 | 5.0%), Production (143 | 3.5%), and Material Moving (62 | 1.5%).
Production, Transportation and Moving Occupations by Sex
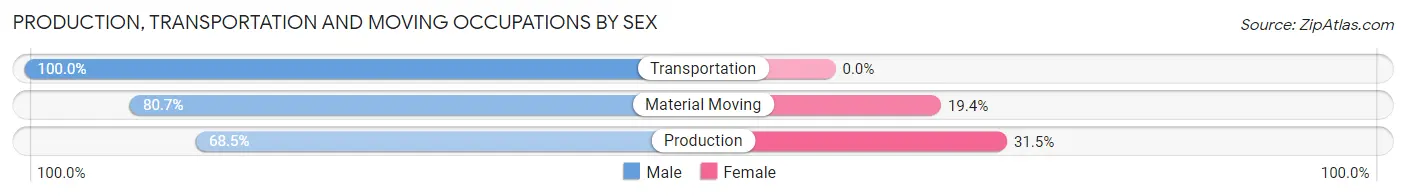
| Occupation | Male | Female |
| Production | 98 (68.5%) | 45 (31.5%) |
| Transportation | 207 (100.0%) | 0 (0.0%) |
| Material Moving | 50 (80.6%) | 12 (19.4%) |
| Total (Category) | 355 (86.2%) | 57 (13.8%) |
| Total (Overall) | 1,980 (47.7%) | 2,167 (52.2%) |
Employment Industries by Sex in Bogalusa
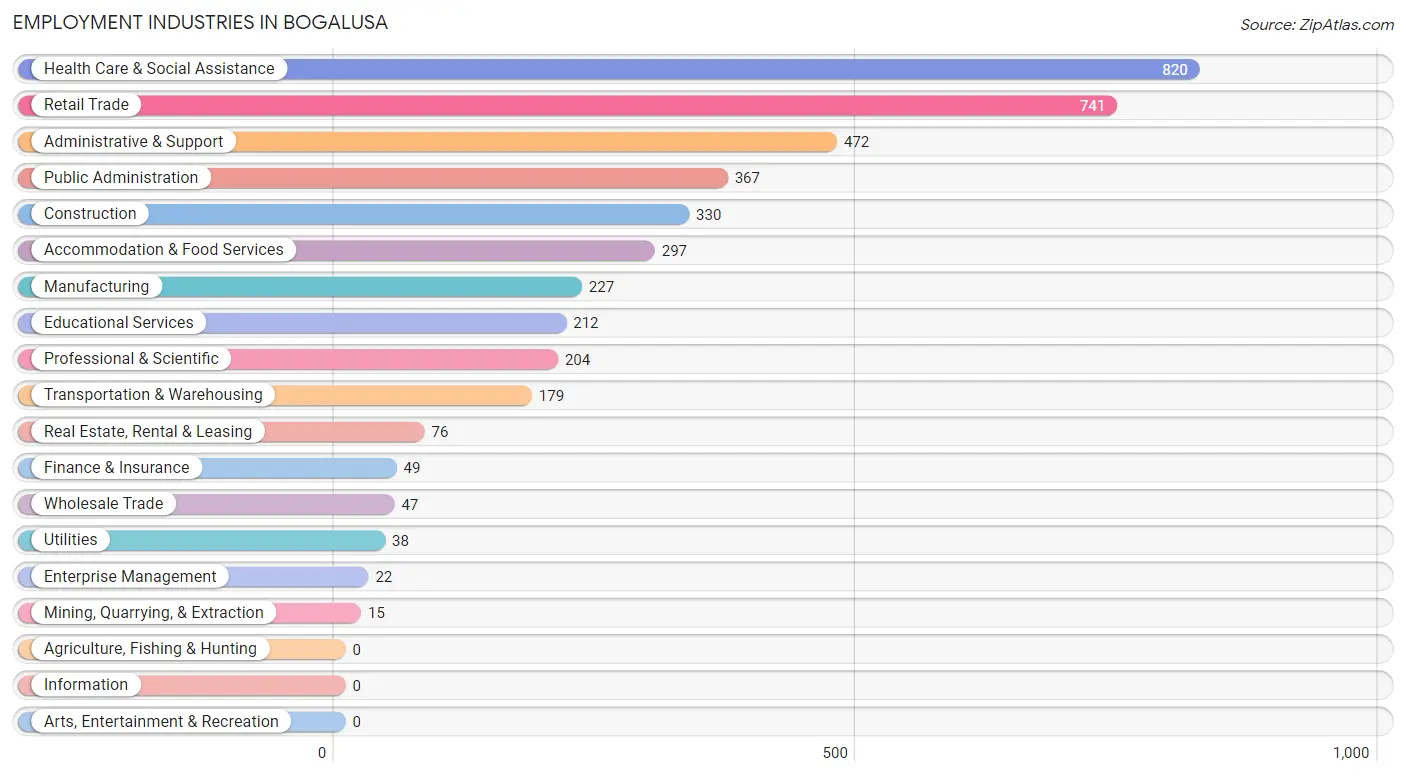
Employment Industries in Bogalusa
The major employment industries in Bogalusa include Health Care & Social Assistance (820 | 19.8%), Retail Trade (741 | 17.9%), Administrative & Support (472 | 11.4%), Public Administration (367 | 8.8%), and Construction (330 | 8.0%).
Employment Industries by Sex in Bogalusa
The Bogalusa industries that see more men than women are Mining, Quarrying, & Extraction (100.0%), Wholesale Trade (100.0%), and Enterprise Management (100.0%), whereas the industries that tend to have a higher number of women are Finance & Insurance (100.0%), Educational Services (94.3%), and Health Care & Social Assistance (77.4%).
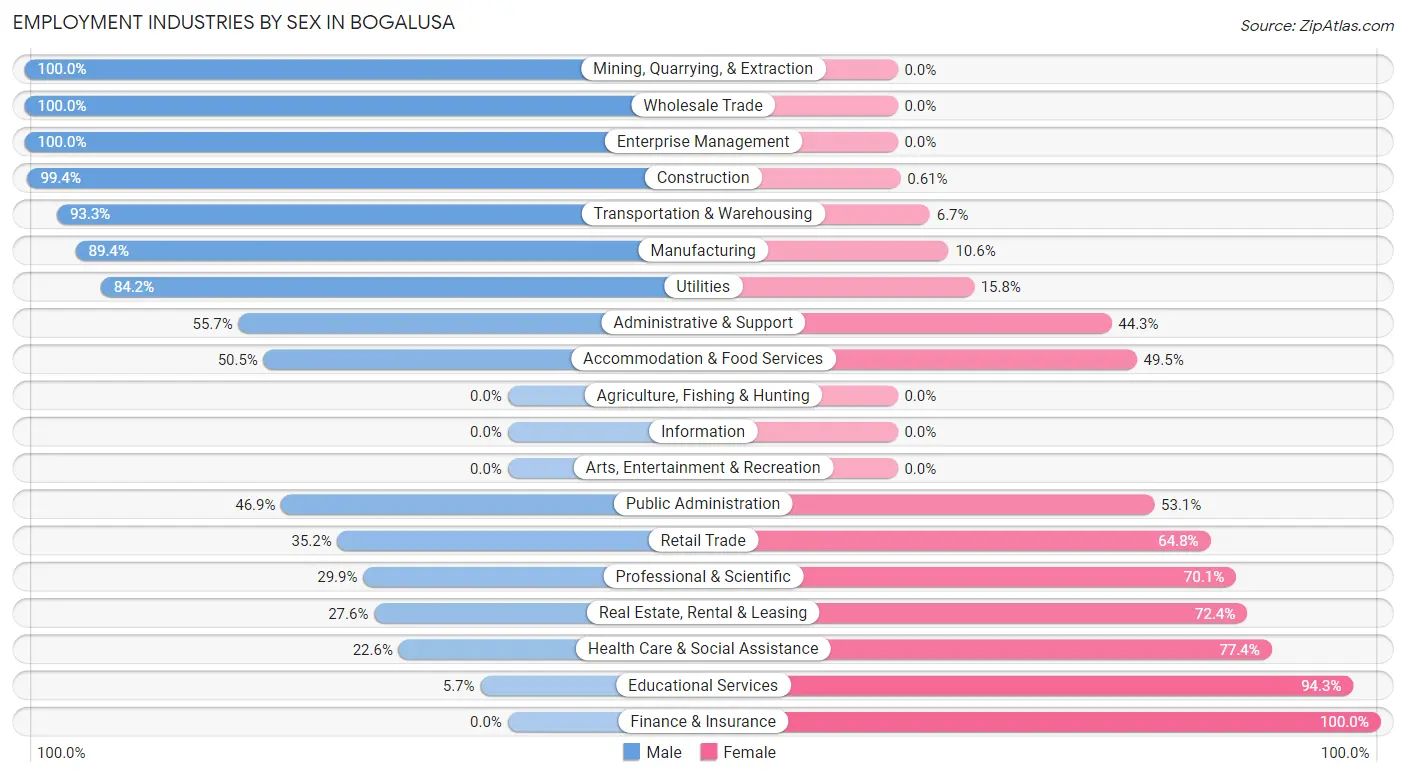
| Industry | Male | Female |
| Agriculture, Fishing & Hunting | 0 (0.0%) | 0 (0.0%) |
| Mining, Quarrying, & Extraction | 15 (100.0%) | 0 (0.0%) |
| Construction | 328 (99.4%) | 2 (0.6%) |
| Manufacturing | 203 (89.4%) | 24 (10.6%) |
| Wholesale Trade | 47 (100.0%) | 0 (0.0%) |
| Retail Trade | 261 (35.2%) | 480 (64.8%) |
| Transportation & Warehousing | 167 (93.3%) | 12 (6.7%) |
| Utilities | 32 (84.2%) | 6 (15.8%) |
| Information | 0 (0.0%) | 0 (0.0%) |
| Finance & Insurance | 0 (0.0%) | 49 (100.0%) |
| Real Estate, Rental & Leasing | 21 (27.6%) | 55 (72.4%) |
| Professional & Scientific | 61 (29.9%) | 143 (70.1%) |
| Enterprise Management | 22 (100.0%) | 0 (0.0%) |
| Administrative & Support | 263 (55.7%) | 209 (44.3%) |
| Educational Services | 12 (5.7%) | 200 (94.3%) |
| Health Care & Social Assistance | 185 (22.6%) | 635 (77.4%) |
| Arts, Entertainment & Recreation | 0 (0.0%) | 0 (0.0%) |
| Accommodation & Food Services | 150 (50.5%) | 147 (49.5%) |
| Public Administration | 172 (46.9%) | 195 (53.1%) |
| Total | 1,980 (47.7%) | 2,167 (52.2%) |
Education in Bogalusa
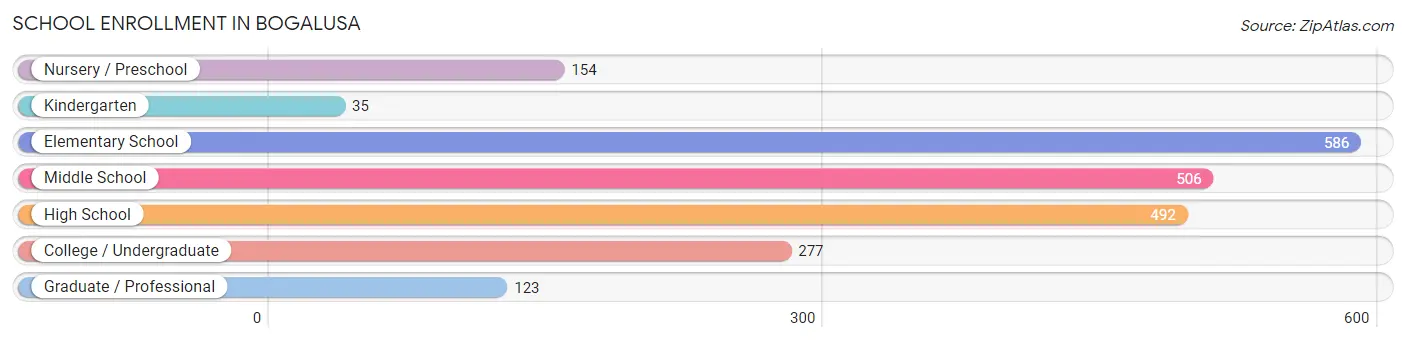
School Enrollment in Bogalusa
The most common levels of schooling among the 2,173 students in Bogalusa are elementary school (586 | 27.0%), middle school (506 | 23.3%), and high school (492 | 22.6%).
| School Level | # Students | % Students |
| Nursery / Preschool | 154 | 7.1% |
| Kindergarten | 35 | 1.6% |
| Elementary School | 586 | 27.0% |
| Middle School | 506 | 23.3% |
| High School | 492 | 22.6% |
| College / Undergraduate | 277 | 12.8% |
| Graduate / Professional | 123 | 5.7% |
| Total | 2,173 | 100.0% |
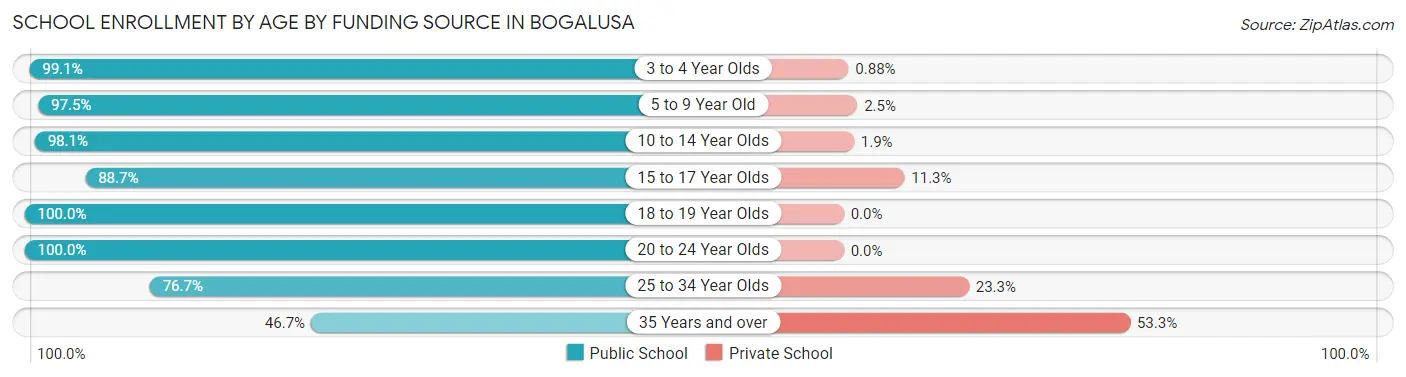
School Enrollment by Age by Funding Source in Bogalusa
Out of a total of 2,173 students who are enrolled in schools in Bogalusa, 126 (5.8%) attend a private institution, while the remaining 2,047 (94.2%) are enrolled in public schools. The age group of 35 years and over has the highest likelihood of being enrolled in private schools, with 8 (53.3% in the age bracket) enrolled. Conversely, the age group of 18 to 19 year olds has the lowest likelihood of being enrolled in a private school, with 137 (100.0% in the age bracket) attending a public institution.
| Age Bracket | Public School | Private School |
| 3 to 4 Year Olds | 112 (99.1%) | 1 (0.9%) |
| 5 to 9 Year Old | 539 (97.5%) | 14 (2.5%) |
| 10 to 14 Year Olds | 520 (98.1%) | 10 (1.9%) |
| 15 to 17 Year Olds | 424 (88.7%) | 54 (11.3%) |
| 18 to 19 Year Olds | 137 (100.0%) | 0 (0.0%) |
| 20 to 24 Year Olds | 184 (100.0%) | 0 (0.0%) |
| 25 to 34 Year Olds | 125 (76.7%) | 38 (23.3%) |
| 35 Years and over | 7 (46.7%) | 8 (53.3%) |
| Total | 2,047 (94.2%) | 126 (5.8%) |
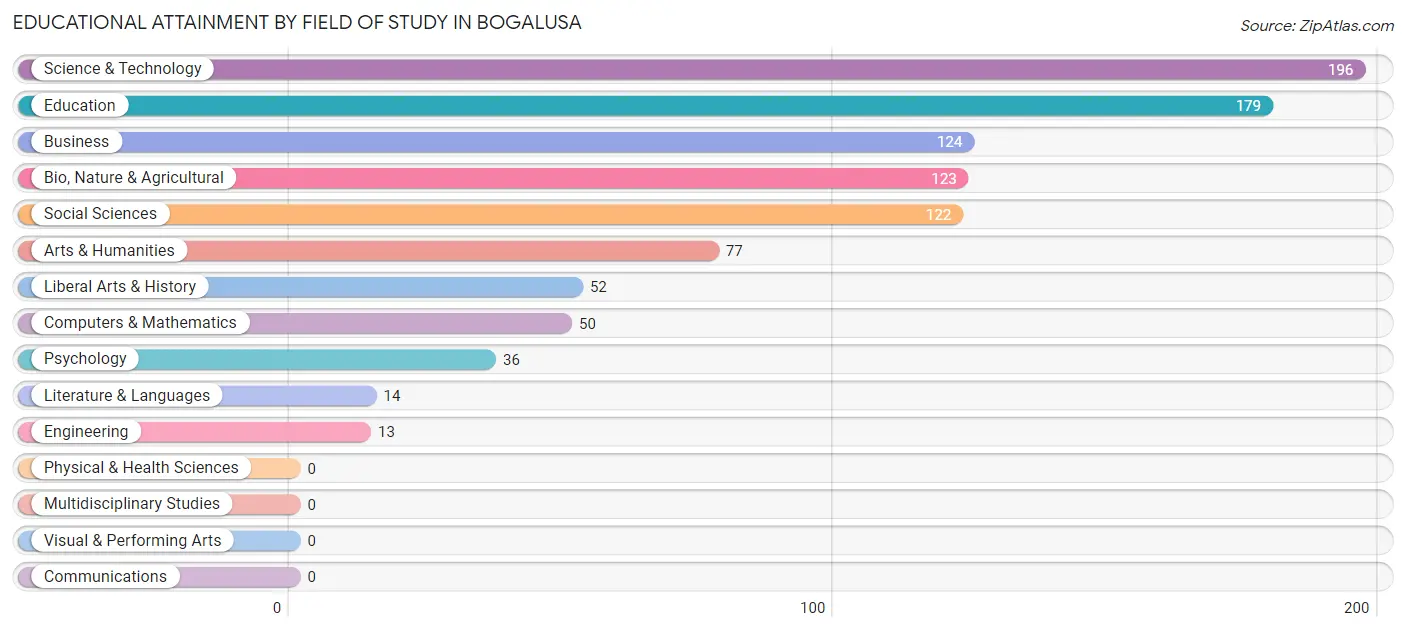
Educational Attainment by Field of Study in Bogalusa
Science & technology (196 | 19.9%), education (179 | 18.1%), business (124 | 12.6%), bio, nature & agricultural (123 | 12.5%), and social sciences (122 | 12.4%) are the most common fields of study among 986 individuals in Bogalusa who have obtained a bachelor's degree or higher.
| Field of Study | # Graduates | % Graduates |
| Computers & Mathematics | 50 | 5.1% |
| Bio, Nature & Agricultural | 123 | 12.5% |
| Physical & Health Sciences | 0 | 0.0% |
| Psychology | 36 | 3.6% |
| Social Sciences | 122 | 12.4% |
| Engineering | 13 | 1.3% |
| Multidisciplinary Studies | 0 | 0.0% |
| Science & Technology | 196 | 19.9% |
| Business | 124 | 12.6% |
| Education | 179 | 18.1% |
| Literature & Languages | 14 | 1.4% |
| Liberal Arts & History | 52 | 5.3% |
| Visual & Performing Arts | 0 | 0.0% |
| Communications | 0 | 0.0% |
| Arts & Humanities | 77 | 7.8% |
| Total | 986 | 100.0% |
Transportation & Commute in Bogalusa
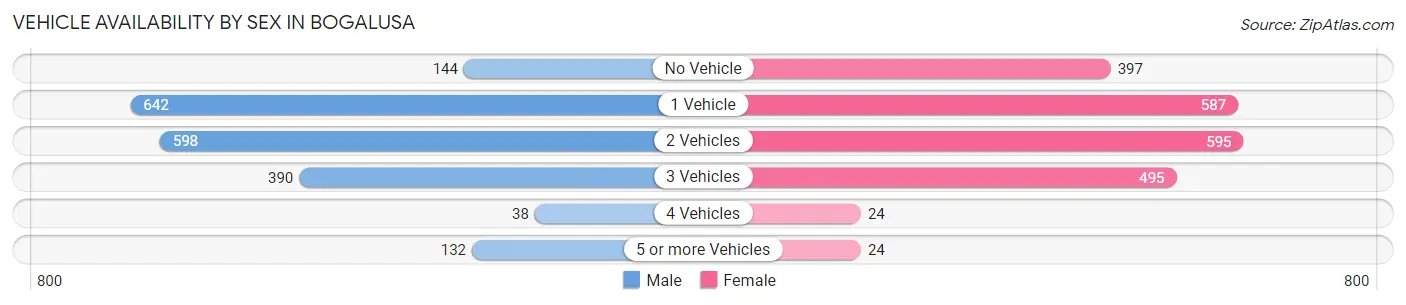
Vehicle Availability by Sex in Bogalusa
The most prevalent vehicle ownership categories in Bogalusa are males with 1 vehicle (642, accounting for 33.0%) and females with 1 vehicle (587, making up 30.2%).
| Vehicles Available | Male | Female |
| No Vehicle | 144 (7.4%) | 397 (18.7%) |
| 1 Vehicle | 642 (33.0%) | 587 (27.7%) |
| 2 Vehicles | 598 (30.8%) | 595 (28.0%) |
| 3 Vehicles | 390 (20.1%) | 495 (23.3%) |
| 4 Vehicles | 38 (1.9%) | 24 (1.1%) |
| 5 or more Vehicles | 132 (6.8%) | 24 (1.1%) |
| Total | 1,944 (100.0%) | 2,122 (100.0%) |
Commute Time in Bogalusa
The most frequently occuring commute durations in Bogalusa are 5 to 9 minutes (1,100 commuters, 27.2%), 10 to 14 minutes (1,086 commuters, 26.9%), and 90 or more minutes (606 commuters, 15.0%).
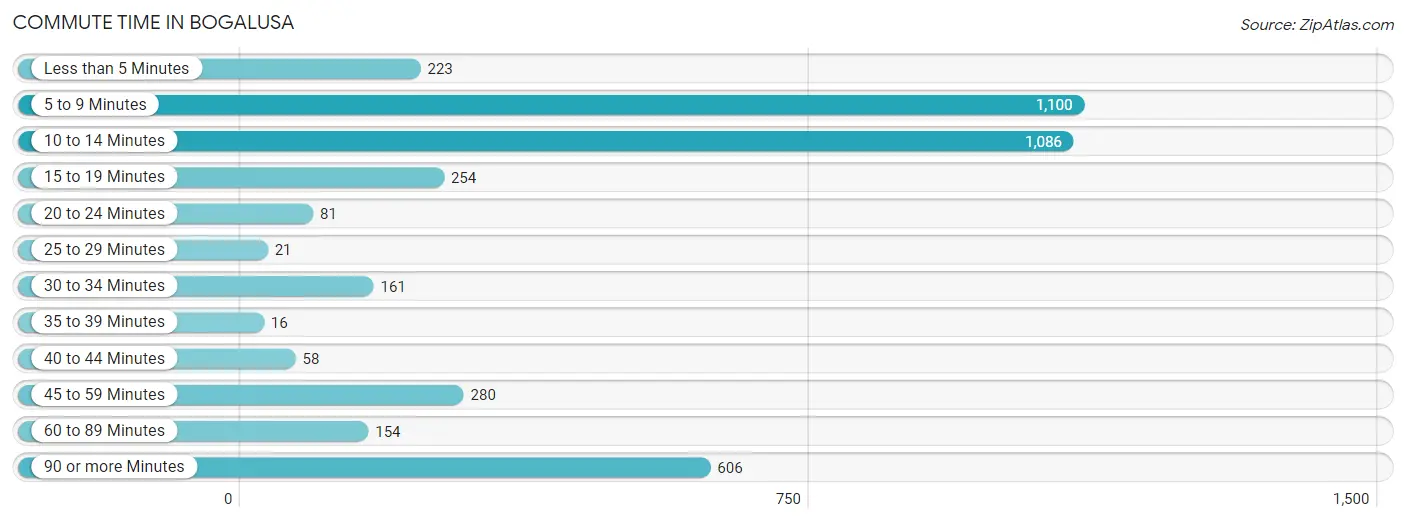
| Commute Time | # Commuters | % Commuters |
| Less than 5 Minutes | 223 | 5.5% |
| 5 to 9 Minutes | 1,100 | 27.2% |
| 10 to 14 Minutes | 1,086 | 26.9% |
| 15 to 19 Minutes | 254 | 6.3% |
| 20 to 24 Minutes | 81 | 2.0% |
| 25 to 29 Minutes | 21 | 0.5% |
| 30 to 34 Minutes | 161 | 4.0% |
| 35 to 39 Minutes | 16 | 0.4% |
| 40 to 44 Minutes | 58 | 1.4% |
| 45 to 59 Minutes | 280 | 6.9% |
| 60 to 89 Minutes | 154 | 3.8% |
| 90 or more Minutes | 606 | 15.0% |
Commute Time by Sex in Bogalusa
The most common commute times in Bogalusa are 5 to 9 minutes (541 commuters, 28.2%) for males and 10 to 14 minutes (587 commuters, 27.7%) for females.
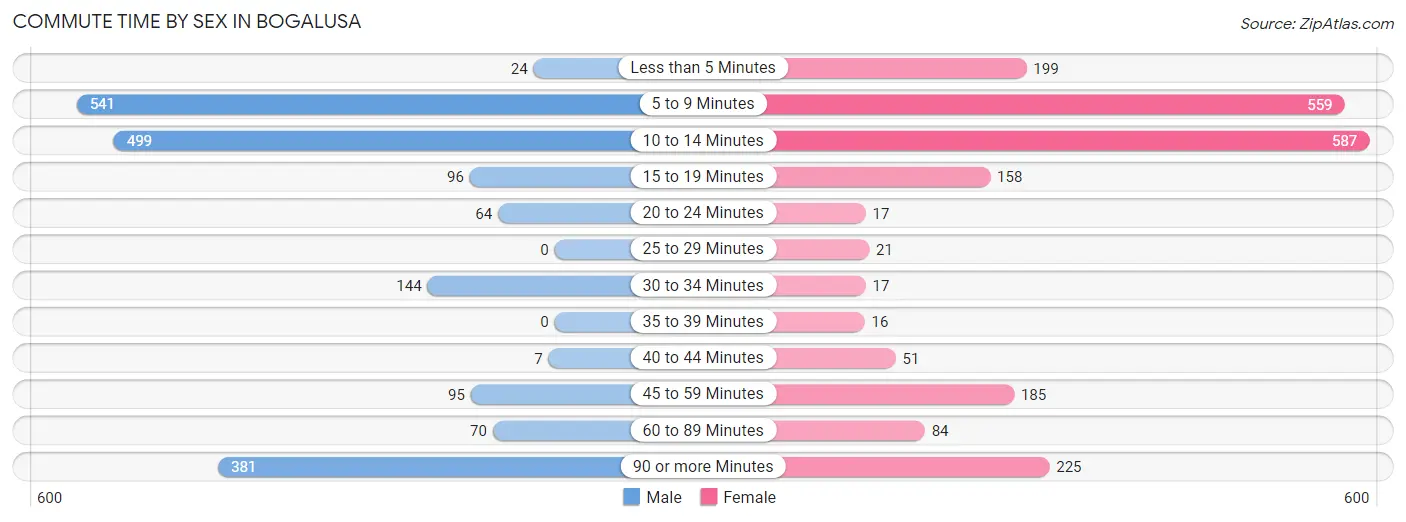
| Commute Time | Male | Female |
| Less than 5 Minutes | 24 (1.3%) | 199 (9.4%) |
| 5 to 9 Minutes | 541 (28.2%) | 559 (26.4%) |
| 10 to 14 Minutes | 499 (26.0%) | 587 (27.7%) |
| 15 to 19 Minutes | 96 (5.0%) | 158 (7.5%) |
| 20 to 24 Minutes | 64 (3.3%) | 17 (0.8%) |
| 25 to 29 Minutes | 0 (0.0%) | 21 (1.0%) |
| 30 to 34 Minutes | 144 (7.5%) | 17 (0.8%) |
| 35 to 39 Minutes | 0 (0.0%) | 16 (0.8%) |
| 40 to 44 Minutes | 7 (0.4%) | 51 (2.4%) |
| 45 to 59 Minutes | 95 (5.0%) | 185 (8.7%) |
| 60 to 89 Minutes | 70 (3.6%) | 84 (4.0%) |
| 90 or more Minutes | 381 (19.8%) | 225 (10.6%) |
Time of Departure to Work by Sex in Bogalusa
The most frequent times of departure to work in Bogalusa are 12:00 AM to 4:59 AM (396, 20.6%) for males and 7:00 AM to 7:29 AM (422, 19.9%) for females.
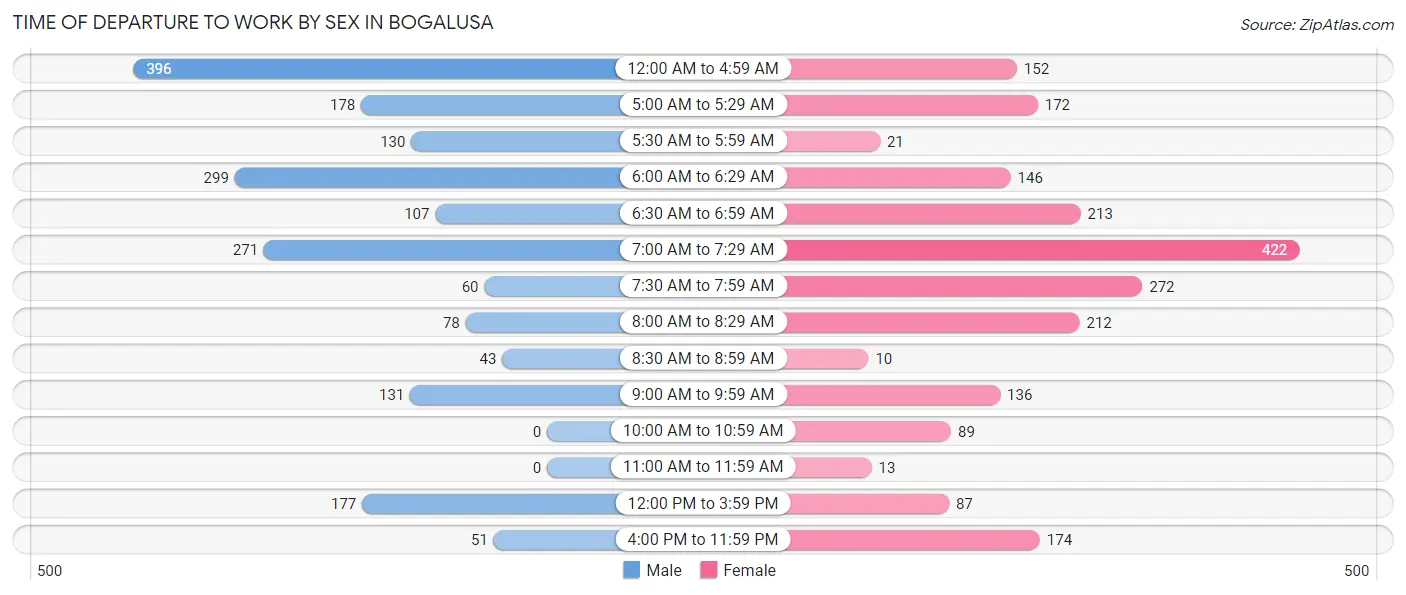
| Time of Departure | Male | Female |
| 12:00 AM to 4:59 AM | 396 (20.6%) | 152 (7.2%) |
| 5:00 AM to 5:29 AM | 178 (9.3%) | 172 (8.1%) |
| 5:30 AM to 5:59 AM | 130 (6.8%) | 21 (1.0%) |
| 6:00 AM to 6:29 AM | 299 (15.6%) | 146 (6.9%) |
| 6:30 AM to 6:59 AM | 107 (5.6%) | 213 (10.1%) |
| 7:00 AM to 7:29 AM | 271 (14.1%) | 422 (19.9%) |
| 7:30 AM to 7:59 AM | 60 (3.1%) | 272 (12.8%) |
| 8:00 AM to 8:29 AM | 78 (4.1%) | 212 (10.0%) |
| 8:30 AM to 8:59 AM | 43 (2.2%) | 10 (0.5%) |
| 9:00 AM to 9:59 AM | 131 (6.8%) | 136 (6.4%) |
| 10:00 AM to 10:59 AM | 0 (0.0%) | 89 (4.2%) |
| 11:00 AM to 11:59 AM | 0 (0.0%) | 13 (0.6%) |
| 12:00 PM to 3:59 PM | 177 (9.2%) | 87 (4.1%) |
| 4:00 PM to 11:59 PM | 51 (2.6%) | 174 (8.2%) |
| Total | 1,921 (100.0%) | 2,119 (100.0%) |
Housing Occupancy in Bogalusa
Occupancy by Ownership in Bogalusa
Of the total 4,285 dwellings in Bogalusa, owner-occupied units account for 2,144 (50.0%), while renter-occupied units make up 2,141 (50.0%).
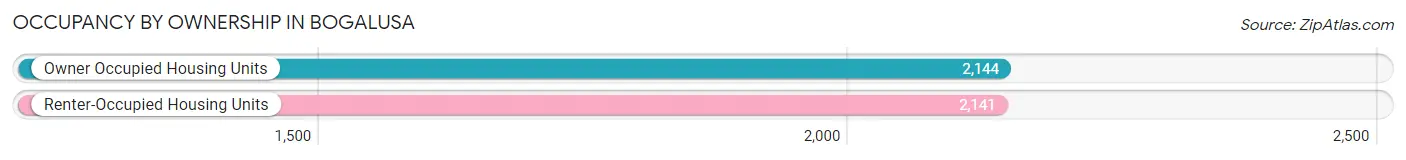
| Occupancy | # Housing Units | % Housing Units |
| Owner Occupied Housing Units | 2,144 | 50.0% |
| Renter-Occupied Housing Units | 2,141 | 50.0% |
| Total Occupied Housing Units | 4,285 | 100.0% |
Occupancy by Household Size in Bogalusa
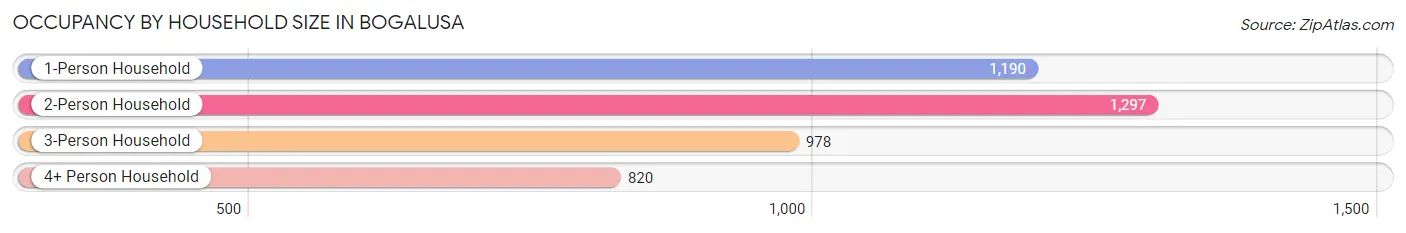
| Household Size | # Housing Units | % Housing Units |
| 1-Person Household | 1,190 | 27.8% |
| 2-Person Household | 1,297 | 30.3% |
| 3-Person Household | 978 | 22.8% |
| 4+ Person Household | 820 | 19.1% |
| Total Housing Units | 4,285 | 100.0% |
Occupancy by Ownership by Household Size in Bogalusa
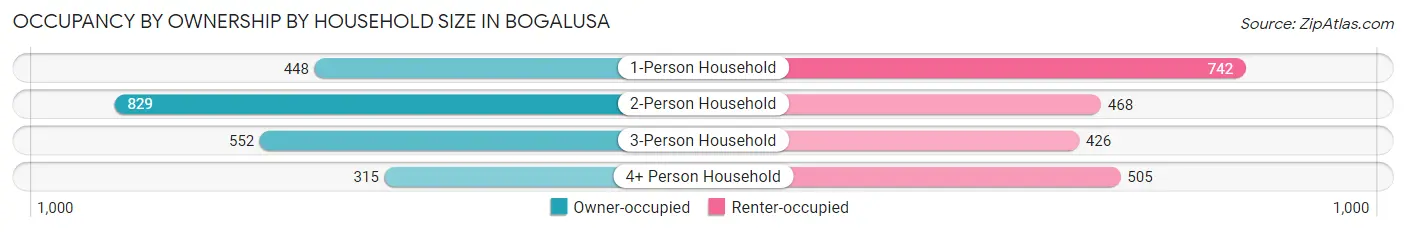
| Household Size | Owner-occupied | Renter-occupied |
| 1-Person Household | 448 (37.7%) | 742 (62.4%) |
| 2-Person Household | 829 (63.9%) | 468 (36.1%) |
| 3-Person Household | 552 (56.4%) | 426 (43.6%) |
| 4+ Person Household | 315 (38.4%) | 505 (61.6%) |
| Total Housing Units | 2,144 (50.0%) | 2,141 (50.0%) |
Occupancy by Educational Attainment in Bogalusa
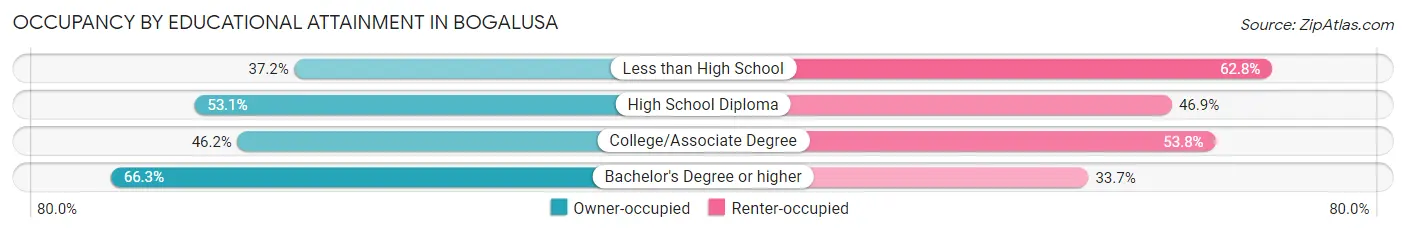
| Household Size | Owner-occupied | Renter-occupied |
| Less than High School | 302 (37.2%) | 510 (62.8%) |
| High School Diploma | 948 (53.1%) | 838 (46.9%) |
| College/Associate Degree | 516 (46.2%) | 601 (53.8%) |
| Bachelor's Degree or higher | 378 (66.3%) | 192 (33.7%) |
Occupancy by Age of Householder in Bogalusa
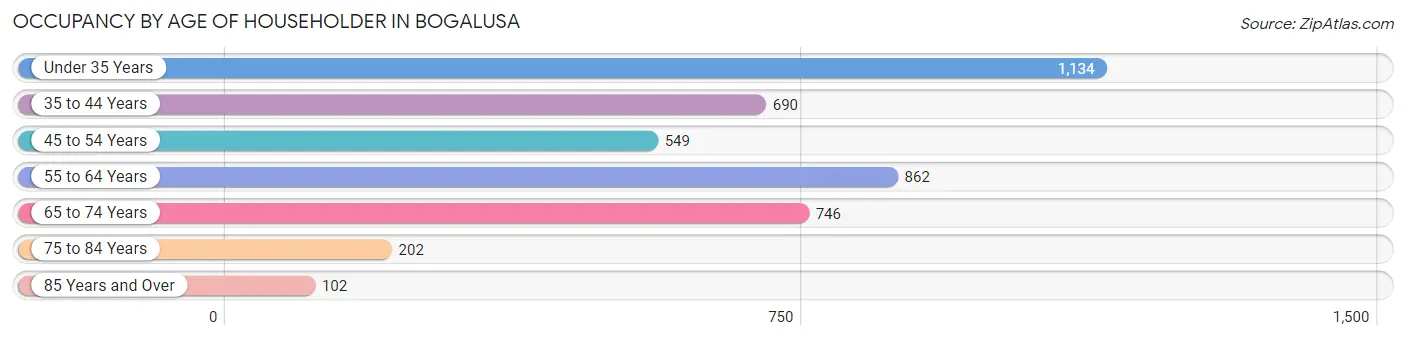
| Age Bracket | # Households | % Households |
| Under 35 Years | 1,134 | 26.5% |
| 35 to 44 Years | 690 | 16.1% |
| 45 to 54 Years | 549 | 12.8% |
| 55 to 64 Years | 862 | 20.1% |
| 65 to 74 Years | 746 | 17.4% |
| 75 to 84 Years | 202 | 4.7% |
| 85 Years and Over | 102 | 2.4% |
| Total | 4,285 | 100.0% |
Housing Finances in Bogalusa
Median Income by Occupancy in Bogalusa
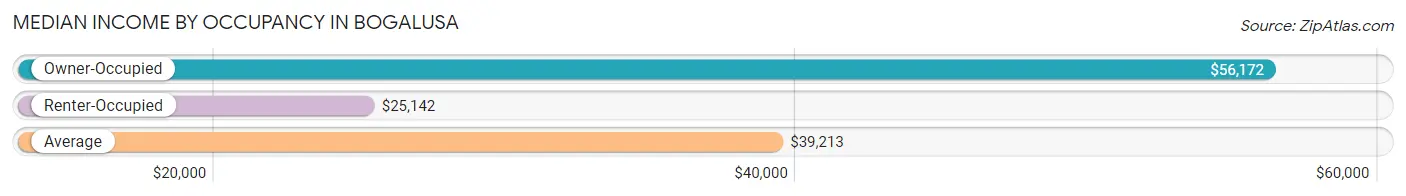
| Occupancy Type | # Households | Median Income |
| Owner-Occupied | 2,144 (50.0%) | $56,172 |
| Renter-Occupied | 2,141 (50.0%) | $25,142 |
| Average | 4,285 (100.0%) | $39,213 |
Occupancy by Householder Income Bracket in Bogalusa
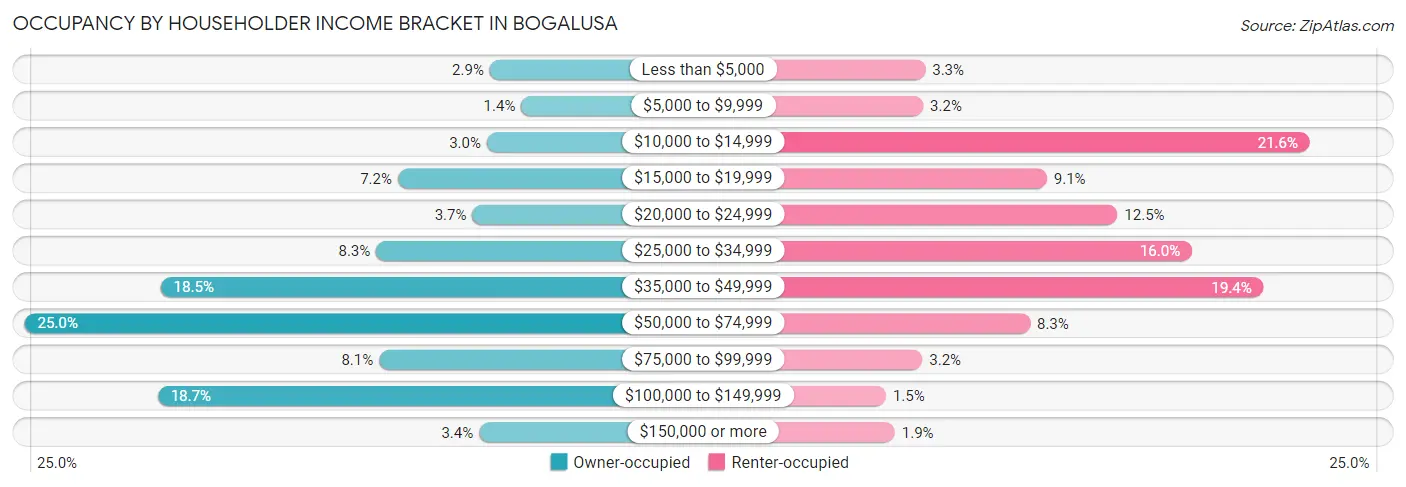
| Income Bracket | Owner-occupied | Renter-occupied |
| Less than $5,000 | 61 (2.9%) | 71 (3.3%) |
| $5,000 to $9,999 | 29 (1.3%) | 69 (3.2%) |
| $10,000 to $14,999 | 64 (3.0%) | 463 (21.6%) |
| $15,000 to $19,999 | 155 (7.2%) | 195 (9.1%) |
| $20,000 to $24,999 | 79 (3.7%) | 267 (12.5%) |
| $25,000 to $34,999 | 177 (8.3%) | 343 (16.0%) |
| $35,000 to $49,999 | 397 (18.5%) | 416 (19.4%) |
| $50,000 to $74,999 | 536 (25.0%) | 178 (8.3%) |
| $75,000 to $99,999 | 174 (8.1%) | 68 (3.2%) |
| $100,000 to $149,999 | 400 (18.7%) | 31 (1.5%) |
| $150,000 or more | 72 (3.4%) | 40 (1.9%) |
| Total | 2,144 (100.0%) | 2,141 (100.0%) |
Monthly Housing Cost Tiers in Bogalusa
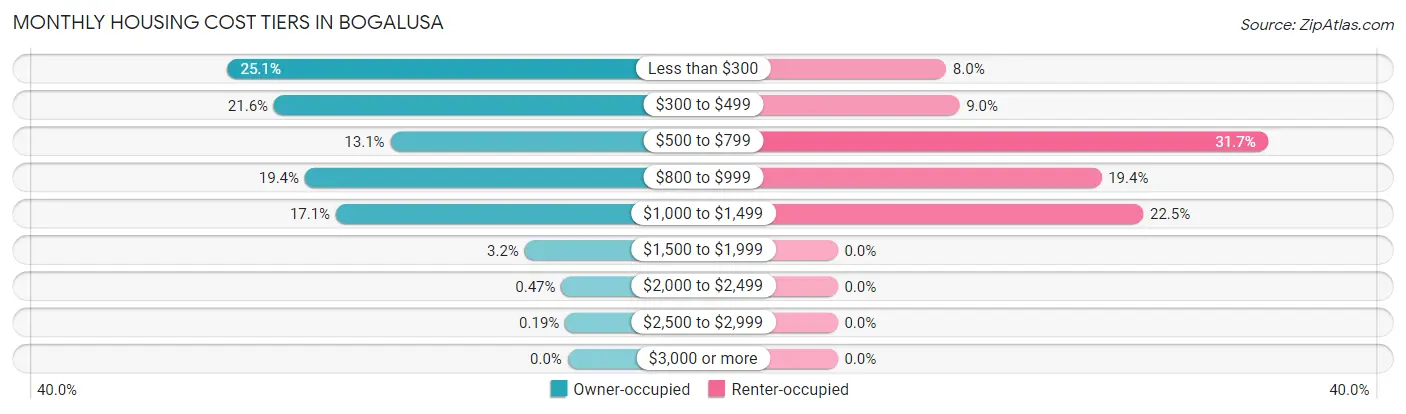
| Monthly Cost | Owner-occupied | Renter-occupied |
| Less than $300 | 537 (25.1%) | 171 (8.0%) |
| $300 to $499 | 464 (21.6%) | 192 (9.0%) |
| $500 to $799 | 280 (13.1%) | 678 (31.7%) |
| $800 to $999 | 415 (19.4%) | 416 (19.4%) |
| $1,000 to $1,499 | 366 (17.1%) | 482 (22.5%) |
| $1,500 to $1,999 | 68 (3.2%) | 0 (0.0%) |
| $2,000 to $2,499 | 10 (0.5%) | 0 (0.0%) |
| $2,500 to $2,999 | 4 (0.2%) | 0 (0.0%) |
| $3,000 or more | 0 (0.0%) | 0 (0.0%) |
| Total | 2,144 (100.0%) | 2,141 (100.0%) |
Physical Housing Characteristics in Bogalusa
Housing Structures in Bogalusa
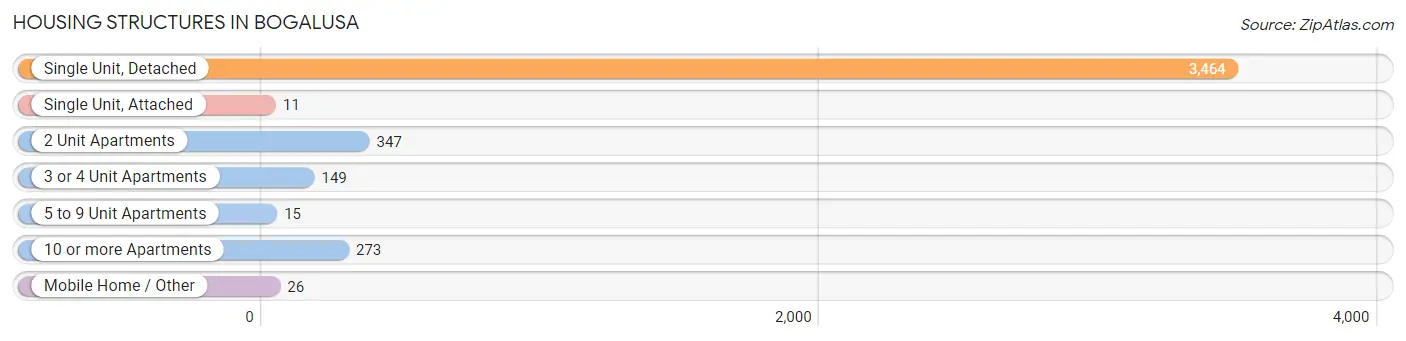
| Structure Type | # Housing Units | % Housing Units |
| Single Unit, Detached | 3,464 | 80.8% |
| Single Unit, Attached | 11 | 0.3% |
| 2 Unit Apartments | 347 | 8.1% |
| 3 or 4 Unit Apartments | 149 | 3.5% |
| 5 to 9 Unit Apartments | 15 | 0.4% |
| 10 or more Apartments | 273 | 6.4% |
| Mobile Home / Other | 26 | 0.6% |
| Total | 4,285 | 100.0% |
Housing Structures by Occupancy in Bogalusa
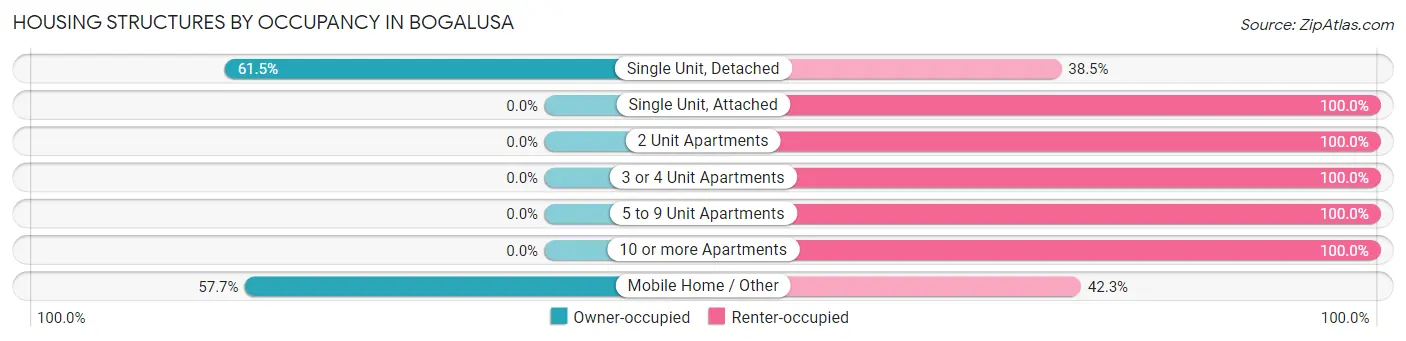
| Structure Type | Owner-occupied | Renter-occupied |
| Single Unit, Detached | 2,129 (61.5%) | 1,335 (38.5%) |
| Single Unit, Attached | 0 (0.0%) | 11 (100.0%) |
| 2 Unit Apartments | 0 (0.0%) | 347 (100.0%) |
| 3 or 4 Unit Apartments | 0 (0.0%) | 149 (100.0%) |
| 5 to 9 Unit Apartments | 0 (0.0%) | 15 (100.0%) |
| 10 or more Apartments | 0 (0.0%) | 273 (100.0%) |
| Mobile Home / Other | 15 (57.7%) | 11 (42.3%) |
| Total | 2,144 (50.0%) | 2,141 (50.0%) |
Housing Structures by Number of Rooms in Bogalusa
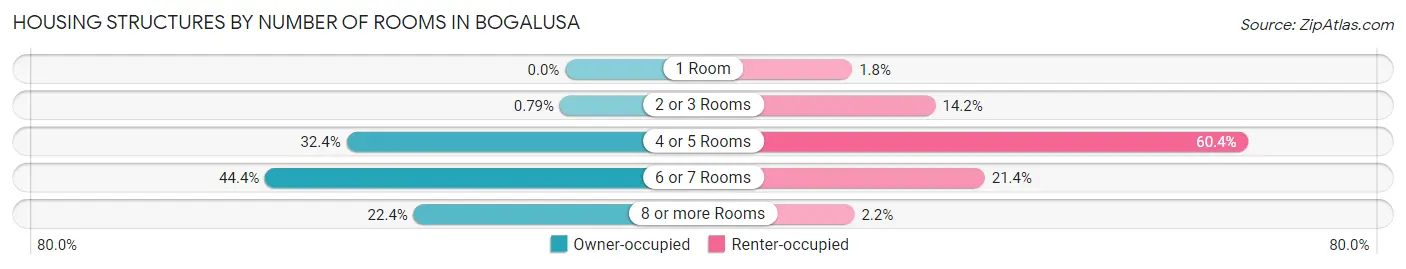
| Number of Rooms | Owner-occupied | Renter-occupied |
| 1 Room | 0 (0.0%) | 39 (1.8%) |
| 2 or 3 Rooms | 17 (0.8%) | 303 (14.1%) |
| 4 or 5 Rooms | 694 (32.4%) | 1,294 (60.4%) |
| 6 or 7 Rooms | 952 (44.4%) | 459 (21.4%) |
| 8 or more Rooms | 481 (22.4%) | 46 (2.1%) |
| Total | 2,144 (100.0%) | 2,141 (100.0%) |
Housing Structure by Heating Type in Bogalusa
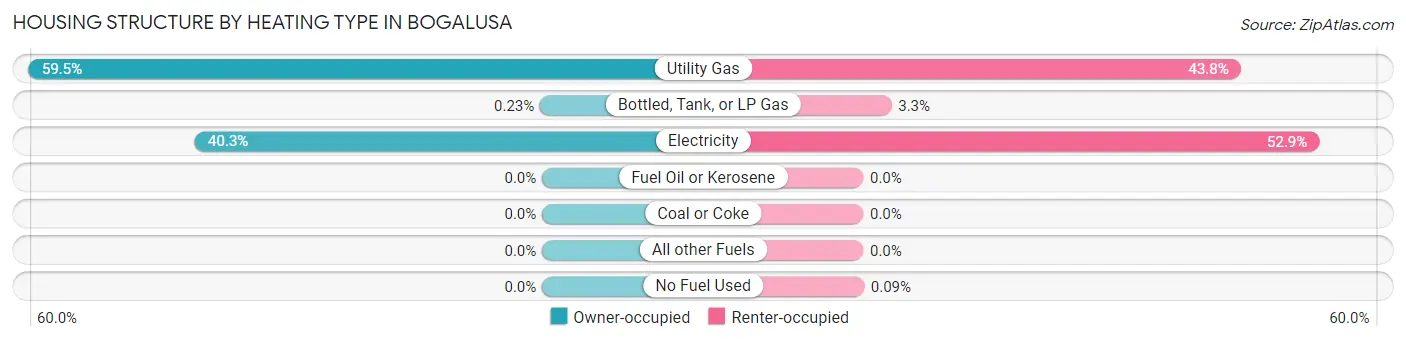
| Heating Type | Owner-occupied | Renter-occupied |
| Utility Gas | 1,276 (59.5%) | 937 (43.8%) |
| Bottled, Tank, or LP Gas | 5 (0.2%) | 70 (3.3%) |
| Electricity | 863 (40.3%) | 1,132 (52.9%) |
| Fuel Oil or Kerosene | 0 (0.0%) | 0 (0.0%) |
| Coal or Coke | 0 (0.0%) | 0 (0.0%) |
| All other Fuels | 0 (0.0%) | 0 (0.0%) |
| No Fuel Used | 0 (0.0%) | 2 (0.1%) |
| Total | 2,144 (100.0%) | 2,141 (100.0%) |
Household Vehicle Usage in Bogalusa
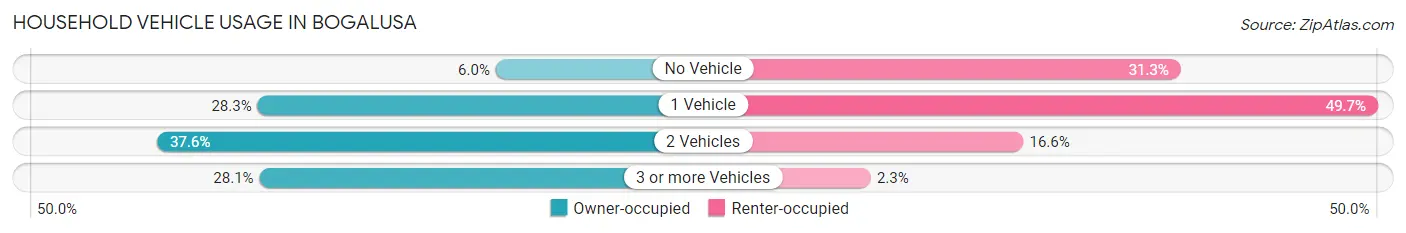
| Vehicles per Household | Owner-occupied | Renter-occupied |
| No Vehicle | 129 (6.0%) | 671 (31.3%) |
| 1 Vehicle | 606 (28.3%) | 1,065 (49.7%) |
| 2 Vehicles | 807 (37.6%) | 355 (16.6%) |
| 3 or more Vehicles | 602 (28.1%) | 50 (2.3%) |
| Total | 2,144 (100.0%) | 2,141 (100.0%) |
Real Estate & Mortgages in Bogalusa
Real Estate and Mortgage Overview in Bogalusa
| Characteristic | Without Mortgage | With Mortgage |
| Housing Units | 1,277 | 867 |
| Median Property Value | $97,700 | $113,800 |
| Median Household Income | $46,289 | $40 |
| Monthly Housing Costs | $359 | $0 |
| Real Estate Taxes | $344 | $54 |
Property Value by Mortgage Status in Bogalusa
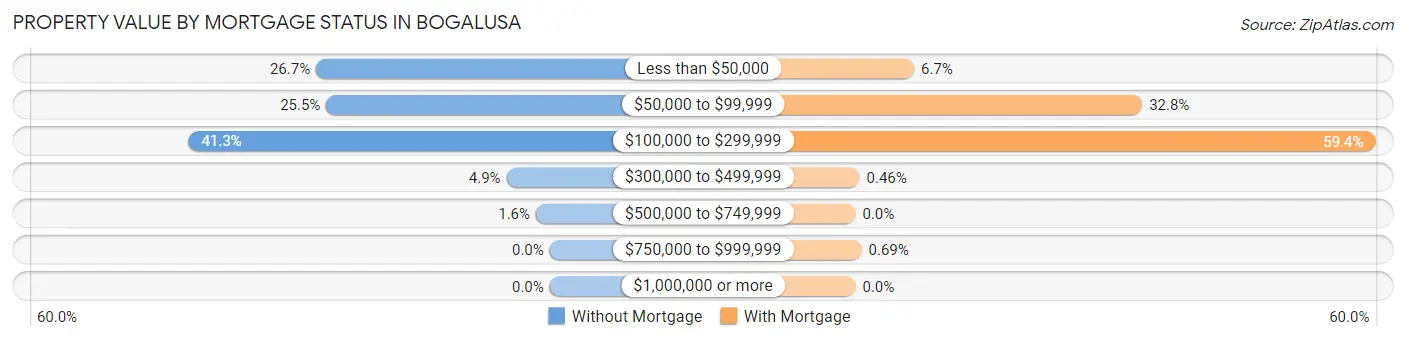
| Property Value | Without Mortgage | With Mortgage |
| Less than $50,000 | 341 (26.7%) | 58 (6.7%) |
| $50,000 to $99,999 | 326 (25.5%) | 284 (32.8%) |
| $100,000 to $299,999 | 527 (41.3%) | 515 (59.4%) |
| $300,000 to $499,999 | 63 (4.9%) | 4 (0.5%) |
| $500,000 to $749,999 | 20 (1.6%) | 0 (0.0%) |
| $750,000 to $999,999 | 0 (0.0%) | 6 (0.7%) |
| $1,000,000 or more | 0 (0.0%) | 0 (0.0%) |
| Total | 1,277 (100.0%) | 867 (100.0%) |
Household Income by Mortgage Status in Bogalusa
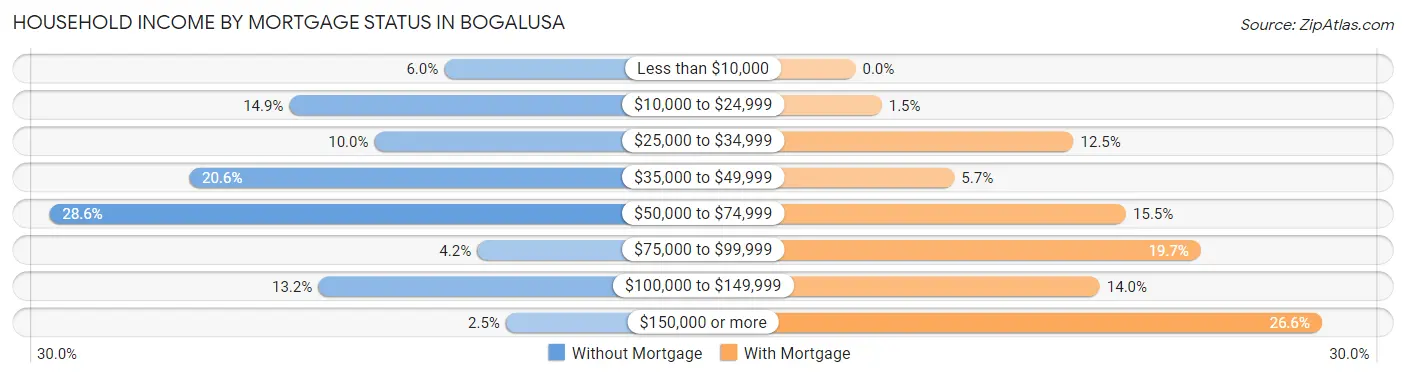
| Household Income | Without Mortgage | With Mortgage |
| Less than $10,000 | 77 (6.0%) | 0 (0.0%) |
| $10,000 to $24,999 | 190 (14.9%) | 13 (1.5%) |
| $25,000 to $34,999 | 128 (10.0%) | 108 (12.5%) |
| $35,000 to $49,999 | 263 (20.6%) | 49 (5.7%) |
| $50,000 to $74,999 | 365 (28.6%) | 134 (15.5%) |
| $75,000 to $99,999 | 53 (4.2%) | 171 (19.7%) |
| $100,000 to $149,999 | 169 (13.2%) | 121 (14.0%) |
| $150,000 or more | 32 (2.5%) | 231 (26.6%) |
| Total | 1,277 (100.0%) | 867 (100.0%) |
Property Value to Household Income Ratio in Bogalusa
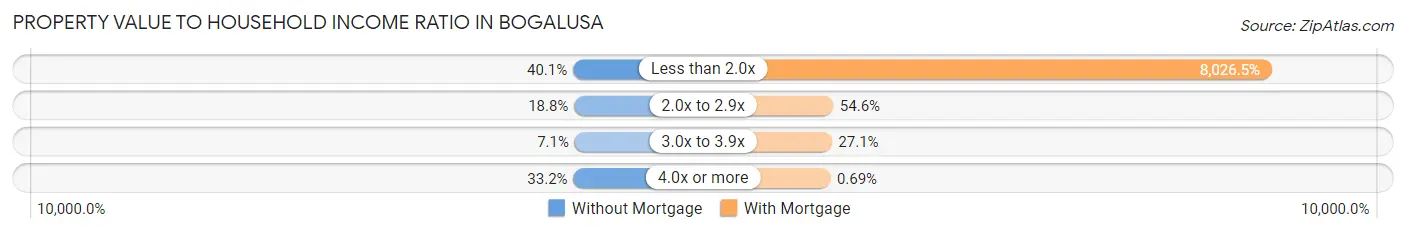
| Value-to-Income Ratio | Without Mortgage | With Mortgage |
| Less than 2.0x | 512 (40.1%) | 69,590 (8,026.5%) |
| 2.0x to 2.9x | 240 (18.8%) | 473 (54.6%) |
| 3.0x to 3.9x | 91 (7.1%) | 235 (27.1%) |
| 4.0x or more | 424 (33.2%) | 6 (0.7%) |
| Total | 1,277 (100.0%) | 867 (100.0%) |
Real Estate Taxes by Mortgage Status in Bogalusa
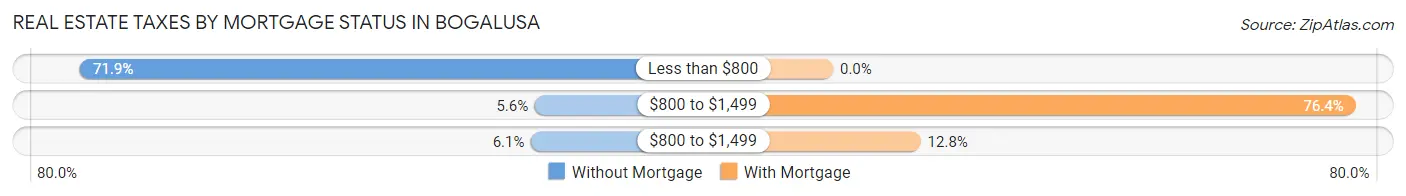
| Property Taxes | Without Mortgage | With Mortgage |
| Less than $800 | 918 (71.9%) | 0 (0.0%) |
| $800 to $1,499 | 71 (5.6%) | 662 (76.4%) |
| $800 to $1,499 | 78 (6.1%) | 111 (12.8%) |
| Total | 1,277 (100.0%) | 867 (100.0%) |
Health & Disability in Bogalusa
Health Insurance Coverage by Age in Bogalusa
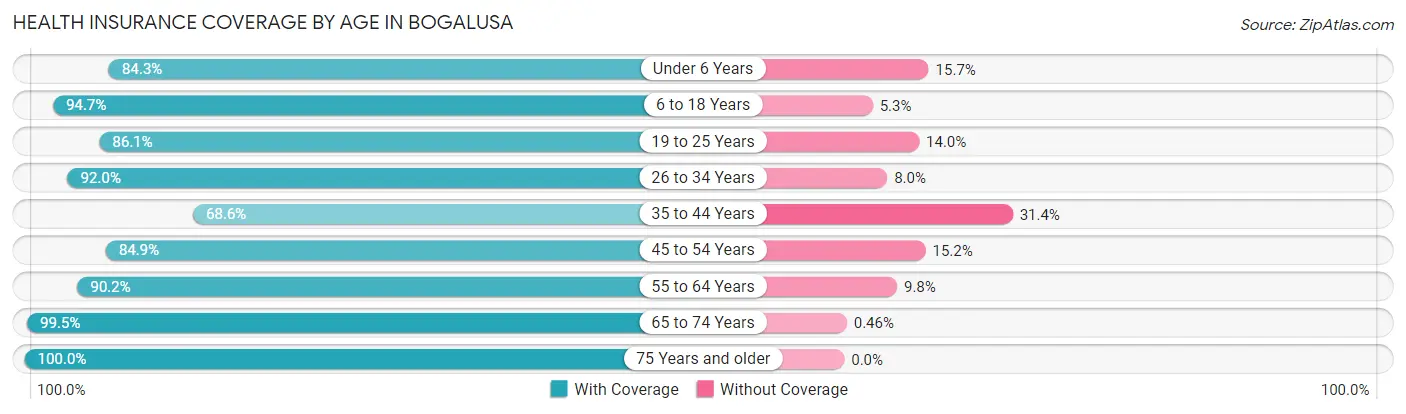
| Age Bracket | With Coverage | Without Coverage |
| Under 6 Years | 643 (84.3%) | 120 (15.7%) |
| 6 to 18 Years | 1,625 (94.7%) | 91 (5.3%) |
| 19 to 25 Years | 802 (86.1%) | 130 (14.0%) |
| 26 to 34 Years | 1,253 (92.0%) | 109 (8.0%) |
| 35 to 44 Years | 887 (68.6%) | 406 (31.4%) |
| 45 to 54 Years | 1,014 (84.9%) | 181 (15.1%) |
| 55 to 64 Years | 1,328 (90.2%) | 145 (9.8%) |
| 65 to 74 Years | 1,289 (99.5%) | 6 (0.5%) |
| 75 Years and older | 478 (100.0%) | 0 (0.0%) |
| Total | 9,319 (88.7%) | 1,188 (11.3%) |
Health Insurance Coverage by Citizenship Status in Bogalusa
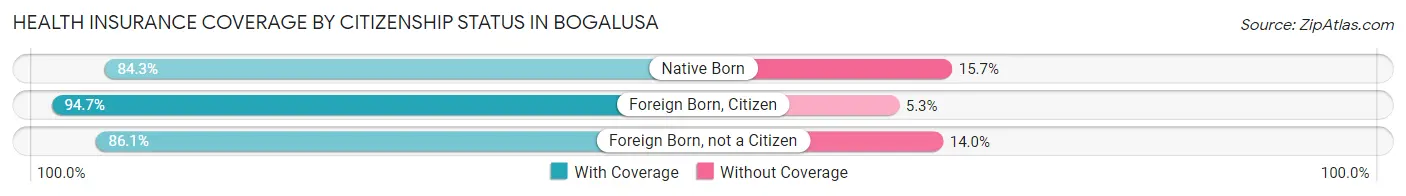
| Citizenship Status | With Coverage | Without Coverage |
| Native Born | 643 (84.3%) | 120 (15.7%) |
| Foreign Born, Citizen | 1,625 (94.7%) | 91 (5.3%) |
| Foreign Born, not a Citizen | 802 (86.1%) | 130 (14.0%) |
Health Insurance Coverage by Household Income in Bogalusa
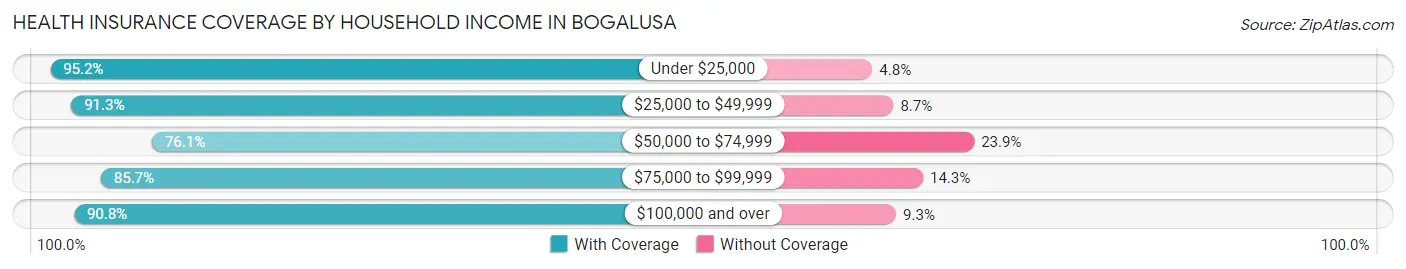
| Household Income | With Coverage | Without Coverage |
| Under $25,000 | 2,398 (95.2%) | 121 (4.8%) |
| $25,000 to $49,999 | 3,121 (91.3%) | 299 (8.7%) |
| $50,000 to $74,999 | 1,607 (76.1%) | 504 (23.9%) |
| $75,000 to $99,999 | 624 (85.7%) | 104 (14.3%) |
| $100,000 and over | 1,569 (90.7%) | 160 (9.2%) |
Public vs Private Health Insurance Coverage by Age in Bogalusa
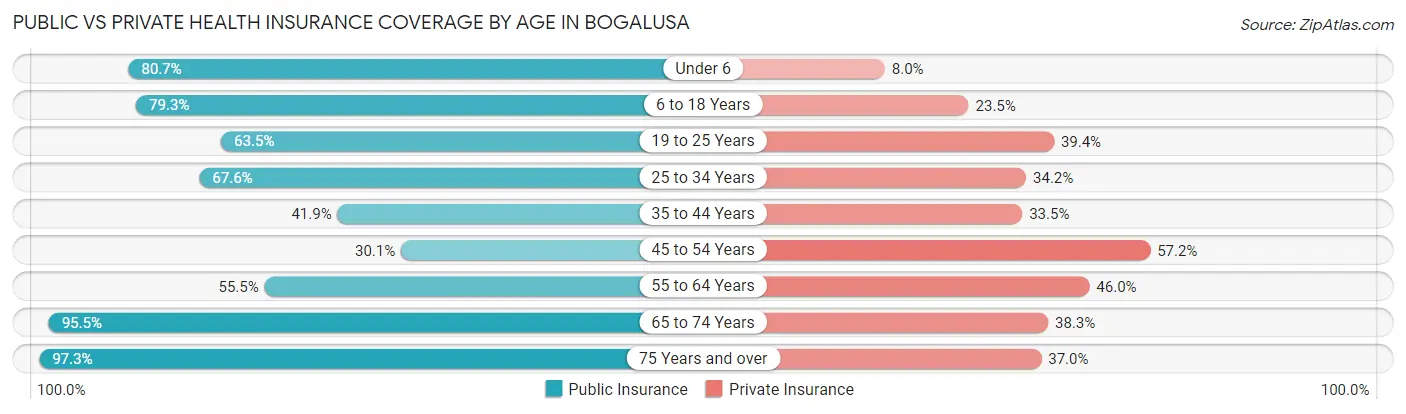
| Age Bracket | Public Insurance | Private Insurance |
| Under 6 | 616 (80.7%) | 61 (8.0%) |
| 6 to 18 Years | 1,361 (79.3%) | 404 (23.5%) |
| 19 to 25 Years | 592 (63.5%) | 367 (39.4%) |
| 25 to 34 Years | 920 (67.5%) | 466 (34.2%) |
| 35 to 44 Years | 542 (41.9%) | 433 (33.5%) |
| 45 to 54 Years | 360 (30.1%) | 684 (57.2%) |
| 55 to 64 Years | 817 (55.5%) | 677 (46.0%) |
| 65 to 74 Years | 1,237 (95.5%) | 496 (38.3%) |
| 75 Years and over | 465 (97.3%) | 177 (37.0%) |
| Total | 6,910 (65.8%) | 3,765 (35.8%) |
Disability Status by Sex by Age in Bogalusa
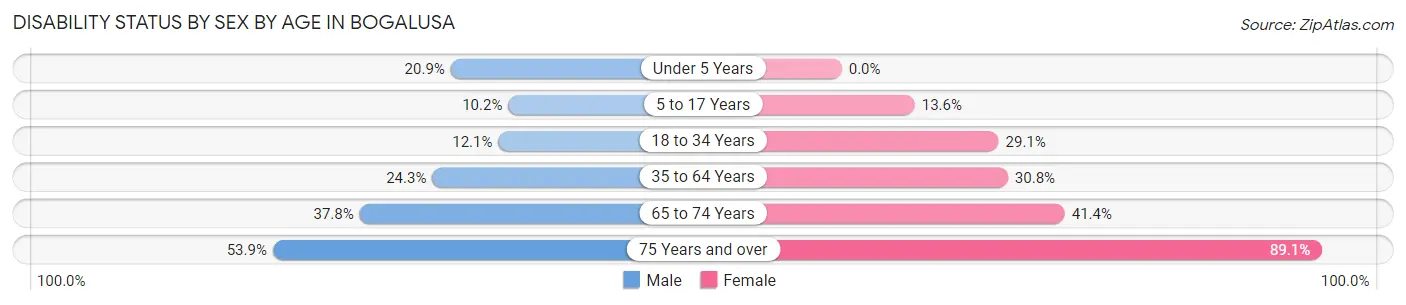
| Age Bracket | Male | Female |
| Under 5 Years | 68 (20.9%) | 0 (0.0%) |
| 5 to 17 Years | 92 (10.2%) | 98 (13.6%) |
| 18 to 34 Years | 124 (12.1%) | 425 (29.1%) |
| 35 to 64 Years | 469 (24.3%) | 627 (30.8%) |
| 65 to 74 Years | 171 (37.8%) | 349 (41.4%) |
| 75 Years and over | 89 (53.9%) | 279 (89.1%) |
Disability Class by Sex by Age in Bogalusa
Disability Class: Hearing Difficulty
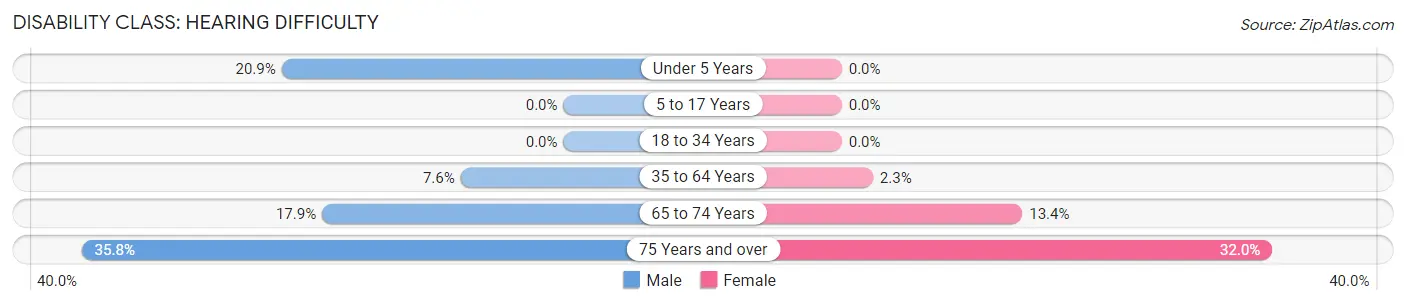
| Age Bracket | Male | Female |
| Under 5 Years | 68 (20.9%) | 0 (0.0%) |
| 5 to 17 Years | 0 (0.0%) | 0 (0.0%) |
| 18 to 34 Years | 0 (0.0%) | 0 (0.0%) |
| 35 to 64 Years | 147 (7.6%) | 47 (2.3%) |
| 65 to 74 Years | 81 (17.9%) | 113 (13.4%) |
| 75 Years and over | 59 (35.8%) | 100 (32.0%) |
Disability Class: Vision Difficulty
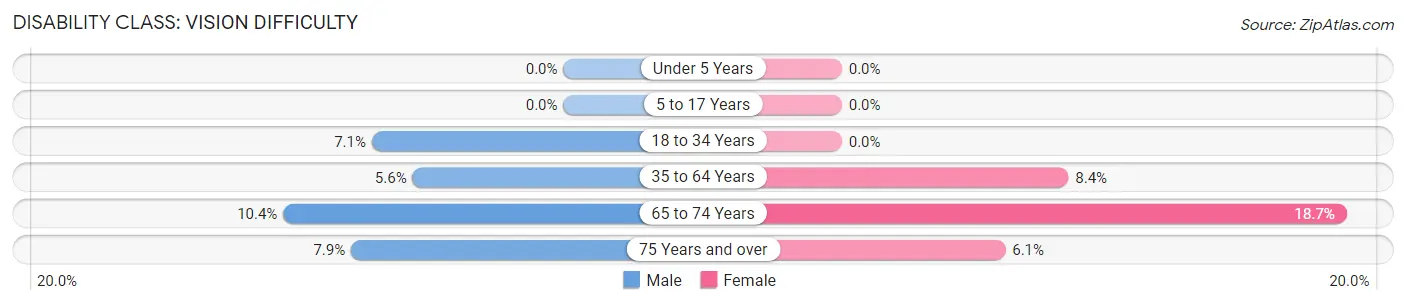
| Age Bracket | Male | Female |
| Under 5 Years | 0 (0.0%) | 0 (0.0%) |
| 5 to 17 Years | 0 (0.0%) | 0 (0.0%) |
| 18 to 34 Years | 73 (7.1%) | 0 (0.0%) |
| 35 to 64 Years | 108 (5.6%) | 171 (8.4%) |
| 65 to 74 Years | 47 (10.4%) | 158 (18.7%) |
| 75 Years and over | 13 (7.9%) | 19 (6.1%) |
Disability Class: Cognitive Difficulty
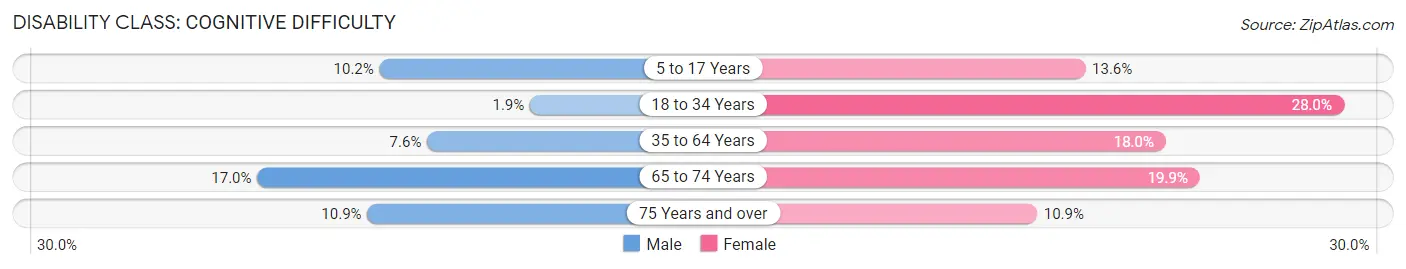
| Age Bracket | Male | Female |
| 5 to 17 Years | 92 (10.2%) | 98 (13.6%) |
| 18 to 34 Years | 19 (1.8%) | 408 (28.0%) |
| 35 to 64 Years | 146 (7.6%) | 367 (18.0%) |
| 65 to 74 Years | 77 (17.0%) | 168 (19.9%) |
| 75 Years and over | 18 (10.9%) | 34 (10.9%) |
Disability Class: Ambulatory Difficulty
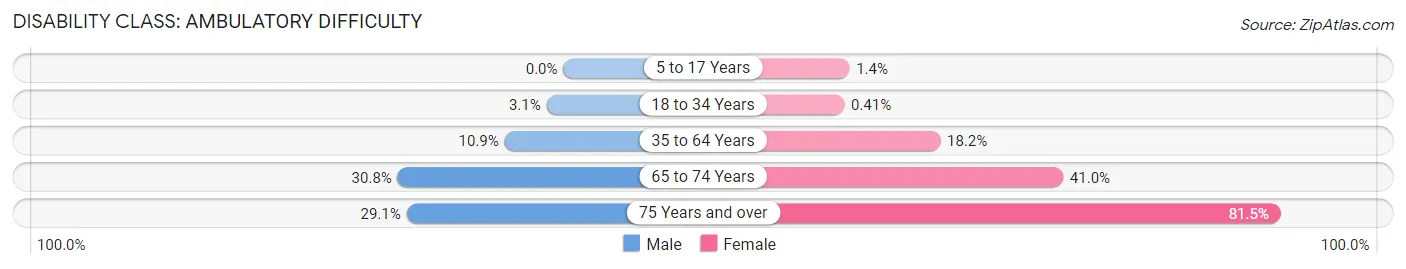
| Age Bracket | Male | Female |
| 5 to 17 Years | 0 (0.0%) | 10 (1.4%) |
| 18 to 34 Years | 32 (3.1%) | 6 (0.4%) |
| 35 to 64 Years | 210 (10.9%) | 371 (18.2%) |
| 65 to 74 Years | 139 (30.7%) | 346 (41.0%) |
| 75 Years and over | 48 (29.1%) | 255 (81.5%) |
Disability Class: Self-Care Difficulty
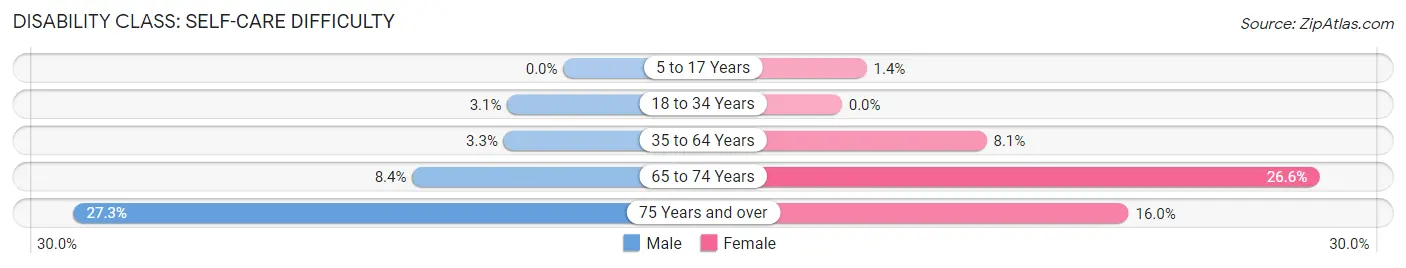
| Age Bracket | Male | Female |
| 5 to 17 Years | 0 (0.0%) | 10 (1.4%) |
| 18 to 34 Years | 32 (3.1%) | 0 (0.0%) |
| 35 to 64 Years | 64 (3.3%) | 164 (8.1%) |
| 65 to 74 Years | 38 (8.4%) | 224 (26.6%) |
| 75 Years and over | 45 (27.3%) | 50 (16.0%) |
Technology Access in Bogalusa
Computing Device Access in Bogalusa
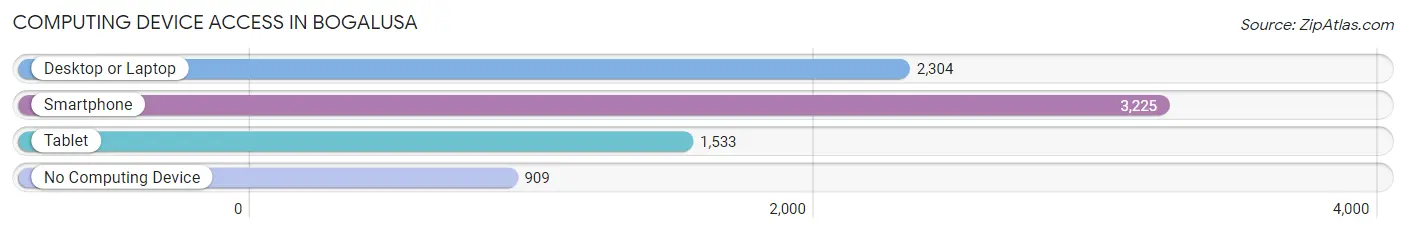
| Device Type | # Households | % Households |
| Desktop or Laptop | 2,304 | 53.8% |
| Smartphone | 3,225 | 75.3% |
| Tablet | 1,533 | 35.8% |
| No Computing Device | 909 | 21.2% |
| Total | 4,285 | 100.0% |
Internet Access in Bogalusa
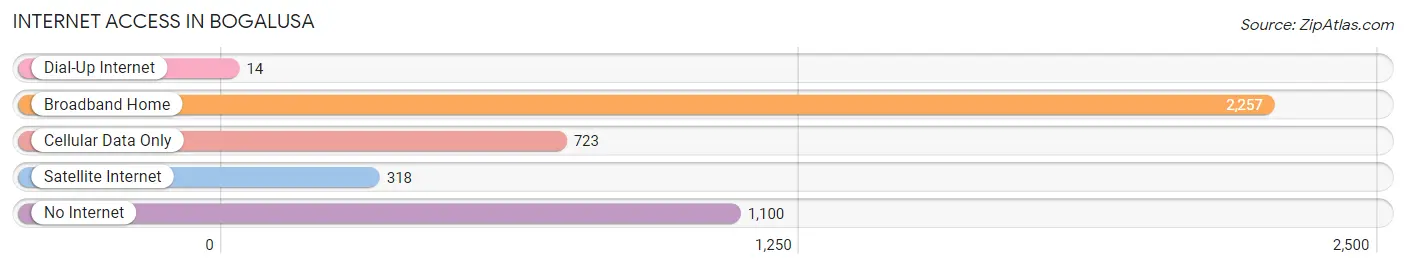
| Internet Type | # Households | % Households |
| Dial-Up Internet | 14 | 0.3% |
| Broadband Home | 2,257 | 52.7% |
| Cellular Data Only | 723 | 16.9% |
| Satellite Internet | 318 | 7.4% |
| No Internet | 1,100 | 25.7% |
| Total | 4,285 | 100.0% |
Bogalusa Summary
Bogalusa, Louisiana is a small city located in Washington Parish in the southeastern part of the state. It is situated on the banks of the Bogue Chitto River, about 70 miles north of New Orleans. The city has a population of 12,232 as of the 2010 census, making it the largest city in Washington Parish.
Bogalusa was founded in 1907 by the Great Southern Lumber Company, which was owned by the Goodyear-Granberry Lumber Company. The city was named after the Choctaw Indian word for “black water”, referring to the dark color of the Bogue Chitto River. The city was originally a company town, with the lumber company providing housing, schools, and other services to its employees.
The city’s economy was largely based on the lumber industry until the mid-20th century. In the 1950s, the city began to diversify its economy, with the opening of a paper mill and other manufacturing plants. The city also became a center for the oil and gas industry, with several oil refineries located in the area.
Geographically, Bogalusa is located in the Piney Woods region of Louisiana. The city is situated on the banks of the Bogue Chitto River, and is surrounded by pine forests and swamps. The city is located about 70 miles north of New Orleans, and is about an hour’s drive from the Gulf of Mexico.
The population of Bogalusa is predominantly white, with African Americans making up about one-third of the population. The median household income in the city is $30,845, and the median home value is $90,000. The city has a poverty rate of 22.3%, which is higher than the national average.
Bogalusa is served by the Washington Parish School District, which includes five elementary schools, two middle schools, and one high school. The city is also home to a branch of the Louisiana Technical College, which offers a variety of vocational and technical programs.
Bogalusa is home to several parks and recreational areas, including the Bogue Chitto State Park, which offers camping, fishing, and other outdoor activities. The city also has a number of historic sites, including the Great Southern Lumber Company Museum, which chronicles the history of the lumber industry in the area.
Bogalusa is a small city with a rich history and a diverse economy. The city has a long history of lumber production, and has diversified its economy in recent years with the addition of manufacturing and oil and gas industries. The city is home to a number of parks and recreational areas, as well as a branch of the Louisiana Technical College. The population of Bogalusa is predominantly white, with African Americans making up about one-third of the population. The median household income in the city is $30,845, and the median home value is $90,000. The city has a poverty rate of 22.3%, which is higher than the national average.
Common Questions
What is Per Capita Income in Bogalusa?
Per Capita income in Bogalusa is $21,349.
What is the Median Family Income in Bogalusa?
Median Family Income in Bogalusa is $42,471.
What is the Median Household income in Bogalusa?
Median Household Income in Bogalusa is $39,213.
What is Income or Wage Gap in Bogalusa?
Income or Wage Gap in Bogalusa is 33.7%.
Women in Bogalusa earn 66.3 cents for every dollar earned by a man.
What is Inequality or Gini Index in Bogalusa?
Inequality or Gini Index in Bogalusa is 0.45.
What is the Total Population of Bogalusa?
Total Population of Bogalusa is 10,689.
What is the Total Male Population of Bogalusa?
Total Male Population of Bogalusa is 4,900.
What is the Total Female Population of Bogalusa?
Total Female Population of Bogalusa is 5,789.
What is the Ratio of Males per 100 Females in Bogalusa?
There are 84.64 Males per 100 Females in Bogalusa.
What is the Ratio of Females per 100 Males in Bogalusa?
There are 118.14 Females per 100 Males in Bogalusa.
What is the Median Population Age in Bogalusa?
Median Population Age in Bogalusa is 39.1 Years.
What is the Average Family Size in Bogalusa
Average Family Size in Bogalusa is 2.9 People.
What is the Average Household Size in Bogalusa
Average Household Size in Bogalusa is 2.5 People.
How Large is the Labor Force in Bogalusa?
There are 4,696 People in the Labor Forcein in Bogalusa.
What is the Percentage of People in the Labor Force in Bogalusa?
54.4% of People are in the Labor Force in Bogalusa.
What is the Unemployment Rate in Bogalusa?
Unemployment Rate in Bogalusa is 11.6%.