Banks Springs, LA Map & Demographics
Banks Springs Map
Banks Springs Overview
$16,882
PER CAPITA INCOME
$24,656
AVG HOUSEHOLD INCOME
$20,485
FAMILY INCOME DEFICIT
0.45
INEQUALITY / GINI INDEX
1,485
TOTAL POPULATION
865
MALE POPULATION
620
FEMALE POPULATION
139.52
MALES / 100 FEMALES
71.68
FEMALES / 100 MALES
30.1
MEDIAN AGE
4.8
AVG FAMILY SIZE
3.4
AVG HOUSEHOLD SIZE
677
LABOR FORCE [ PEOPLE ]
57.7%
PERCENT IN LABOR FORCE
19.1%
UNEMPLOYMENT RATE
Income in Banks Springs
Income Overview in Banks Springs
| Characteristic | Number | Measure |
| Per Capita Income | 1,485 | $16,882 |
| Median Family Income | 216 | $0 |
| Mean Family Income | 216 | $32,377 |
| Median Household Income | 413 | $24,656 |
| Mean Household Income | 413 | $37,125 |
| Income Deficit | 216 | $20,485 |
| Wage / Income Gap (%) | 1,485 | 0.00% |
| Wage / Income Gap ($) | 1,485 | 100.00¢ per $1 |
| Gini / Inequality Index | 1,485 | 0.45 |
Earnings by Sex in Banks Springs
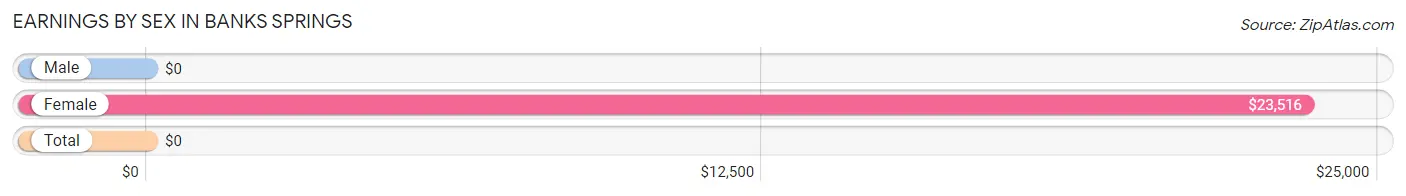
| Sex | Number | Average Earnings |
| Male | 436 (78.4%) | $0 |
| Female | 120 (21.6%) | $23,516 |
| Total | 556 (100.0%) | $0 |
Earnings by Sex by Income Bracket in Banks Springs
The most common earnings brackets in Banks Springs are $45,000 to $49,999 for men (163 | 37.4%) and $22,500 to $24,999 for women (32 | 26.7%).
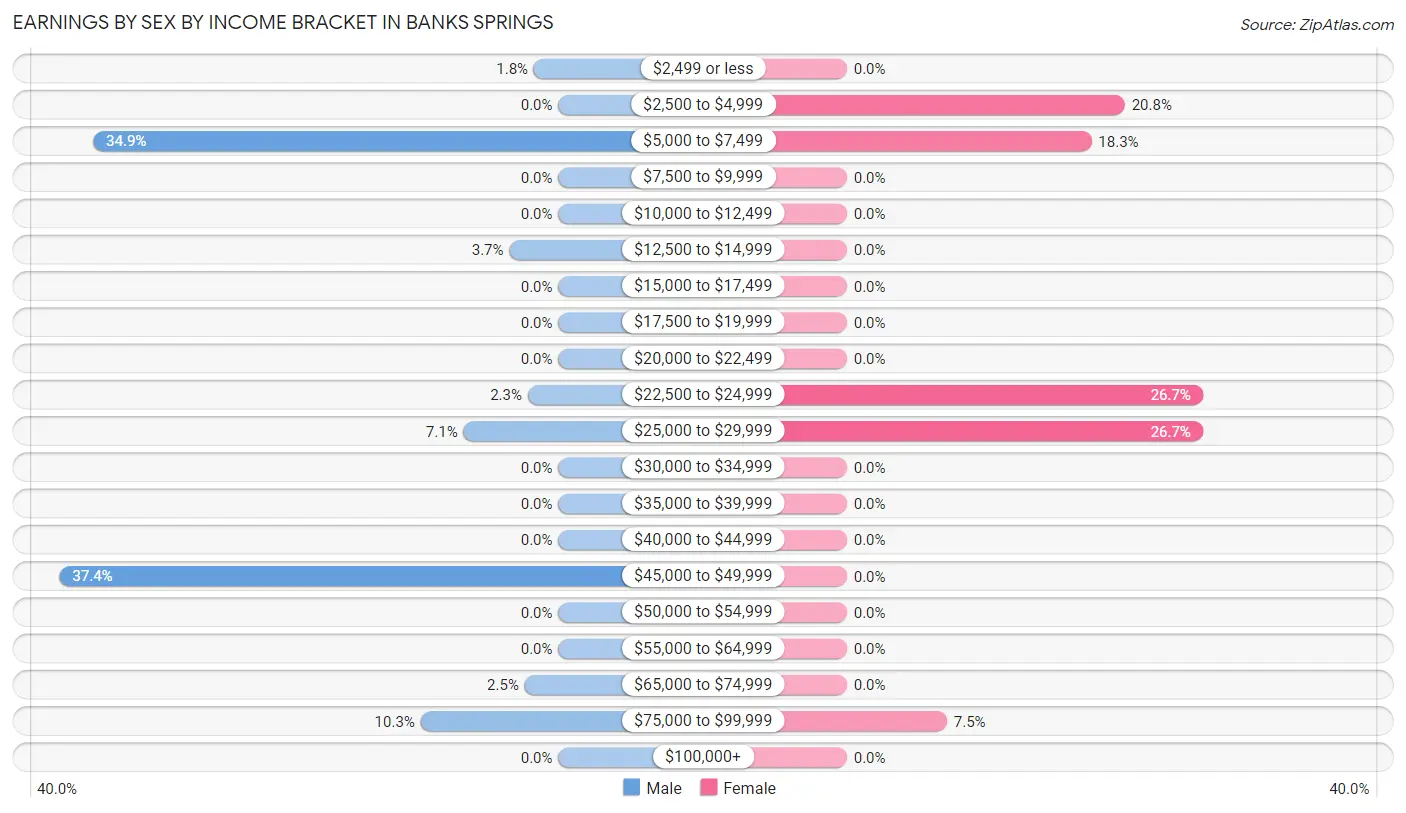
| Income | Male | Female |
| $2,499 or less | 8 (1.8%) | 0 (0.0%) |
| $2,500 to $4,999 | 0 (0.0%) | 25 (20.8%) |
| $5,000 to $7,499 | 152 (34.9%) | 22 (18.3%) |
| $7,500 to $9,999 | 0 (0.0%) | 0 (0.0%) |
| $10,000 to $12,499 | 0 (0.0%) | 0 (0.0%) |
| $12,500 to $14,999 | 16 (3.7%) | 0 (0.0%) |
| $15,000 to $17,499 | 0 (0.0%) | 0 (0.0%) |
| $17,500 to $19,999 | 0 (0.0%) | 0 (0.0%) |
| $20,000 to $22,499 | 0 (0.0%) | 0 (0.0%) |
| $22,500 to $24,999 | 10 (2.3%) | 32 (26.7%) |
| $25,000 to $29,999 | 31 (7.1%) | 32 (26.7%) |
| $30,000 to $34,999 | 0 (0.0%) | 0 (0.0%) |
| $35,000 to $39,999 | 0 (0.0%) | 0 (0.0%) |
| $40,000 to $44,999 | 0 (0.0%) | 0 (0.0%) |
| $45,000 to $49,999 | 163 (37.4%) | 0 (0.0%) |
| $50,000 to $54,999 | 0 (0.0%) | 0 (0.0%) |
| $55,000 to $64,999 | 0 (0.0%) | 0 (0.0%) |
| $65,000 to $74,999 | 11 (2.5%) | 0 (0.0%) |
| $75,000 to $99,999 | 45 (10.3%) | 9 (7.5%) |
| $100,000+ | 0 (0.0%) | 0 (0.0%) |
| Total | 436 (100.0%) | 120 (100.0%) |
Earnings by Sex by Educational Attainment in Banks Springs
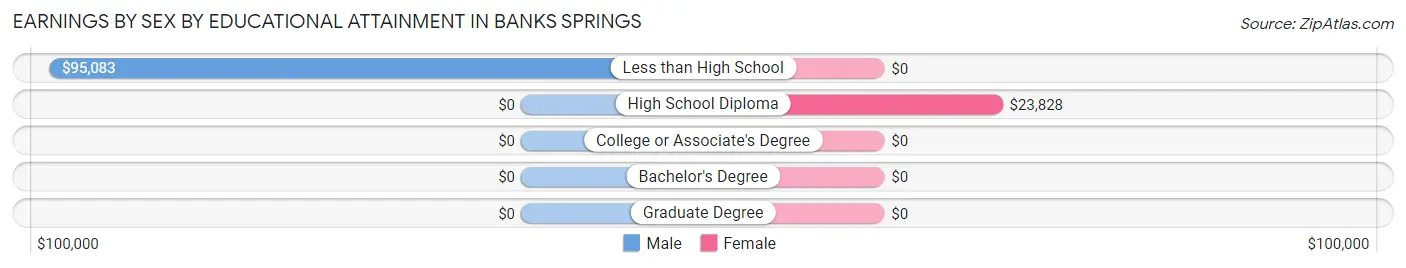
| Educational Attainment | Male Income | Female Income |
| Less than High School | $95,083 | $0 |
| High School Diploma | - | - |
| College or Associate's Degree | - | - |
| Bachelor's Degree | - | - |
| Graduate Degree | - | - |
| Total | - | - |
Family Income in Banks Springs
Family Income Brackets in Banks Springs
According to the Banks Springs family income data, there are 104 families falling into the less than $10,000 income range, which is the most common income bracket and makes up 48.1% of all families.
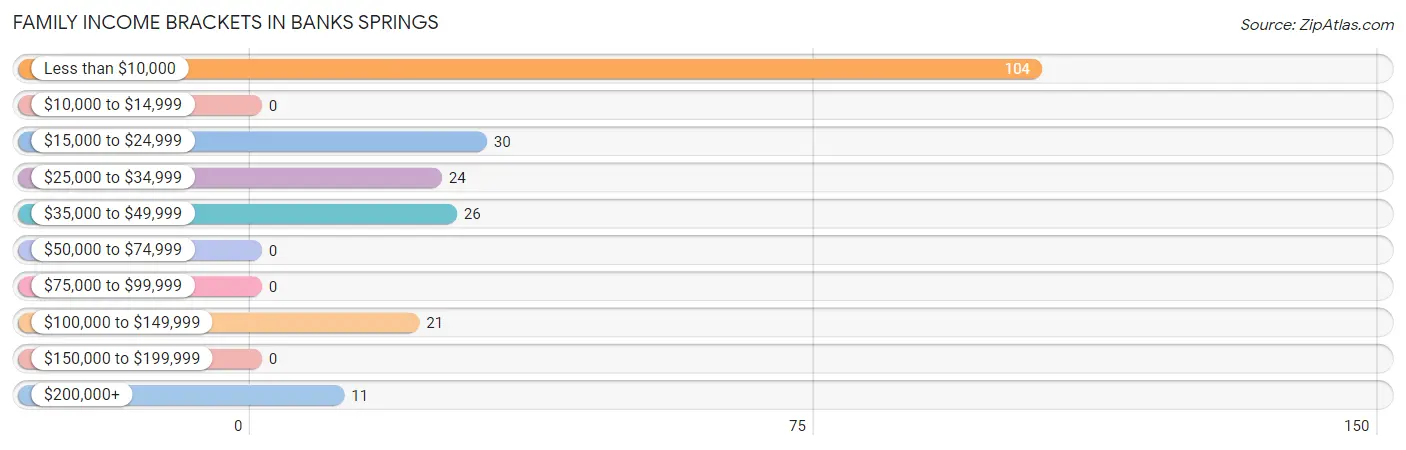
| Income Bracket | # Families | % Families |
| Less than $10,000 | 104 | 48.1% |
| $10,000 to $14,999 | 0 | 0.0% |
| $15,000 to $24,999 | 30 | 13.9% |
| $25,000 to $34,999 | 24 | 11.1% |
| $35,000 to $49,999 | 26 | 12.0% |
| $50,000 to $74,999 | 0 | 0.0% |
| $75,000 to $99,999 | 0 | 0.0% |
| $100,000 to $149,999 | 21 | 9.7% |
| $150,000 to $199,999 | 0 | 0.0% |
| $200,000+ | 11 | 5.1% |
Family Income by Famaliy Size in Banks Springs
3-person families (75 | 34.7%) account for the highest median family income in Banks Springs with $26,302 per family, while 3-person families (75 | 34.7%) have the highest median income of $8,767 per family member.
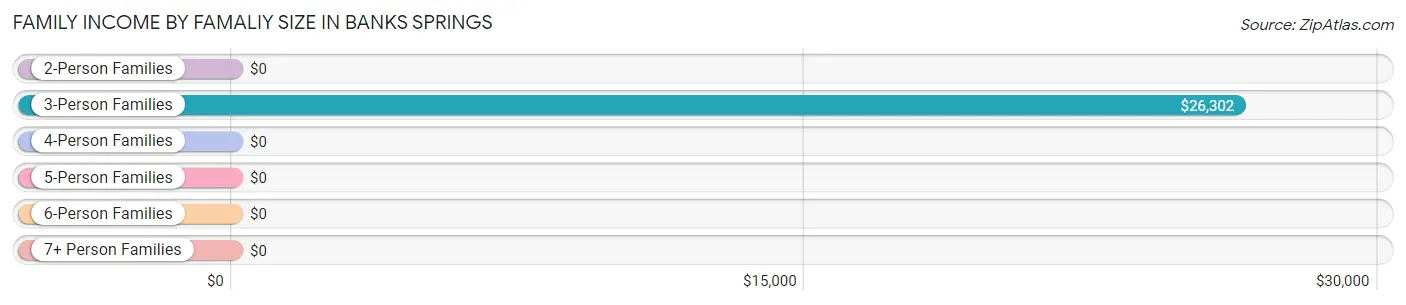
| Income Bracket | # Families | Median Income |
| 2-Person Families | 27 (12.5%) | $0 |
| 3-Person Families | 75 (34.7%) | $26,302 |
| 4-Person Families | 84 (38.9%) | $0 |
| 5-Person Families | 30 (13.9%) | $0 |
| 6-Person Families | 0 (0.0%) | $0 |
| 7+ Person Families | 0 (0.0%) | $0 |
| Total | 216 (100.0%) | $0 |
Family Income by Number of Earners in Banks Springs
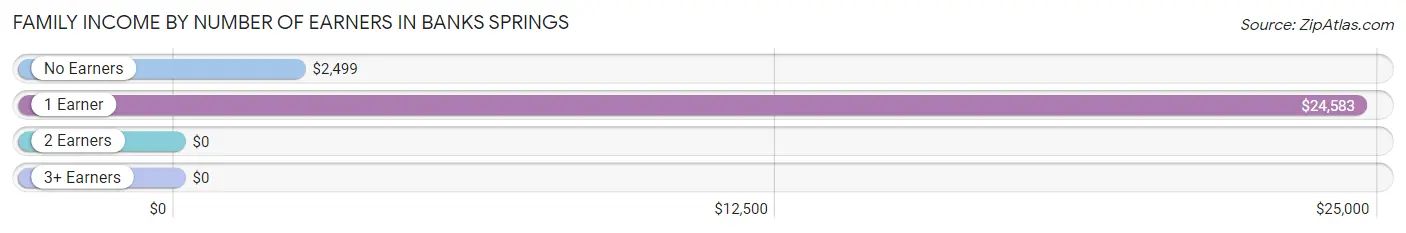
| Number of Earners | # Families | Median Income |
| No Earners | 105 (48.6%) | $2,499 |
| 1 Earner | 100 (46.3%) | $24,583 |
| 2 Earners | 0 (0.0%) | $0 |
| 3+ Earners | 11 (5.1%) | $0 |
| Total | 216 (100.0%) | $0 |
Household Income in Banks Springs
Household Income Brackets in Banks Springs
With 124 households falling in the category, the $15,000 to $24,999 income range is the most frequent in Banks Springs, accounting for 30.0% of all households.
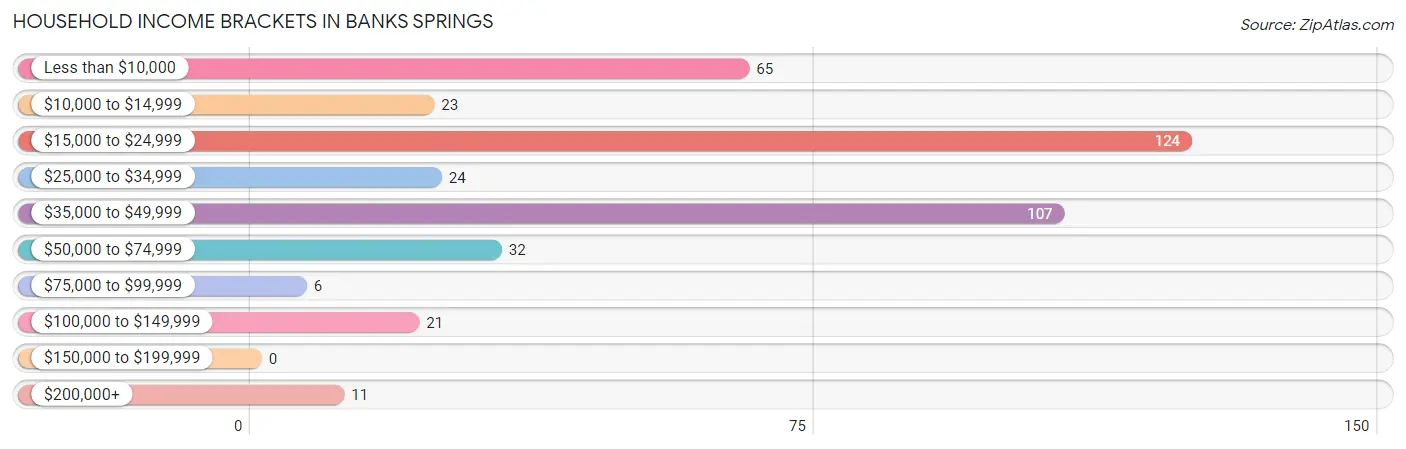
| Income Bracket | # Households | % Households |
| Less than $10,000 | 65 | 15.7% |
| $10,000 to $14,999 | 23 | 5.6% |
| $15,000 to $24,999 | 124 | 30.0% |
| $25,000 to $34,999 | 24 | 5.8% |
| $35,000 to $49,999 | 107 | 25.9% |
| $50,000 to $74,999 | 32 | 7.7% |
| $75,000 to $99,999 | 6 | 1.5% |
| $100,000 to $149,999 | 21 | 5.1% |
| $150,000 to $199,999 | 0 | 0.0% |
| $200,000+ | 11 | 2.7% |
Household Income by Householder Age in Banks Springs
The median household income in Banks Springs is $24,656, with the highest median household income of $45,736 found in the 25 to 44 years age bracket for the primary householder. A total of 103 households (24.9%) fall into this category. Meanwhile, the 15 to 24 years age bracket for the primary householder has the lowest median household income of $0, with 41 households (9.9%) in this group.
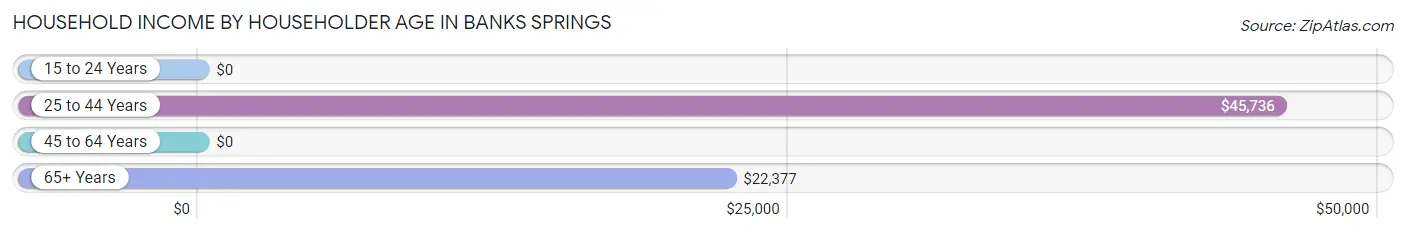
| Income Bracket | # Households | Median Income |
| 15 to 24 Years | 41 (9.9%) | $0 |
| 25 to 44 Years | 103 (24.9%) | $45,736 |
| 45 to 64 Years | 97 (23.5%) | $0 |
| 65+ Years | 172 (41.6%) | $22,377 |
| Total | 413 (100.0%) | $24,656 |
Poverty in Banks Springs
Income Below Poverty by Sex and Age in Banks Springs
With 43.1% poverty level for males and 61.6% for females among the residents of Banks Springs, under 5 year old males and under 5 year old females are the most vulnerable to poverty, with 40 males (100.0%) and 13 females (100.0%) in their respective age groups living below the poverty level.
| Age Bracket | Male | Female |
| Under 5 Years | 40 (100.0%) | 13 (100.0%) |
| 5 Years | 0 (0.0%) | 0 (0.0%) |
| 6 to 11 Years | 80 (100.0%) | 47 (100.0%) |
| 12 to 14 Years | 59 (100.0%) | 0 (0.0%) |
| 15 Years | 0 (0.0%) | 0 (0.0%) |
| 16 and 17 Years | 0 (0.0%) | 0 (0.0%) |
| 18 to 24 Years | 16 (100.0%) | 25 (62.5%) |
| 25 to 34 Years | 152 (48.2%) | 203 (100.0%) |
| 35 to 44 Years | 0 (0.0%) | 6 (20.0%) |
| 45 to 54 Years | 8 (8.4%) | 0 (0.0%) |
| 55 to 64 Years | 7 (41.2%) | 21 (72.4%) |
| 65 to 74 Years | 5 (7.1%) | 30 (31.6%) |
| 75 Years and over | 0 (0.0%) | 0 (0.0%) |
| Total | 367 (43.1%) | 345 (61.6%) |
Income Above Poverty by Sex and Age in Banks Springs
According to the poverty statistics in Banks Springs, males aged 15 years and females aged 12 to 14 years are the age groups that are most secure financially, with 100.0% of males and 100.0% of females in these age groups living above the poverty line.
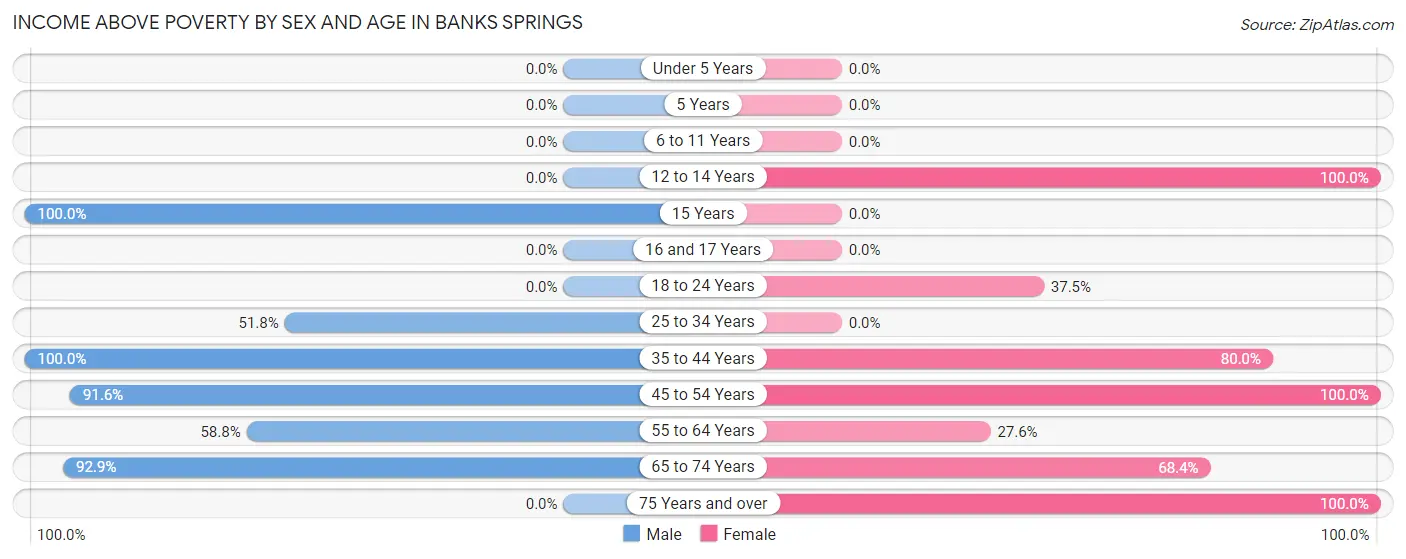
| Age Bracket | Male | Female |
| Under 5 Years | 0 (0.0%) | 0 (0.0%) |
| 5 Years | 0 (0.0%) | 0 (0.0%) |
| 6 to 11 Years | 0 (0.0%) | 0 (0.0%) |
| 12 to 14 Years | 0 (0.0%) | 34 (100.0%) |
| 15 Years | 39 (100.0%) | 0 (0.0%) |
| 16 and 17 Years | 0 (0.0%) | 0 (0.0%) |
| 18 to 24 Years | 0 (0.0%) | 15 (37.5%) |
| 25 to 34 Years | 163 (51.7%) | 0 (0.0%) |
| 35 to 44 Years | 121 (100.0%) | 24 (80.0%) |
| 45 to 54 Years | 87 (91.6%) | 41 (100.0%) |
| 55 to 64 Years | 10 (58.8%) | 8 (27.6%) |
| 65 to 74 Years | 65 (92.9%) | 65 (68.4%) |
| 75 Years and over | 0 (0.0%) | 28 (100.0%) |
| Total | 485 (56.9%) | 215 (38.4%) |
Income Below Poverty Among Married-Couple Families in Banks Springs
| Children | Above Poverty | Below Poverty |
| No Children | 37 (100.0%) | 0 (0.0%) |
| 1 or 2 Children | 0 (0.0%) | 0 (0.0%) |
| 3 or 4 Children | 0 (0.0%) | 0 (0.0%) |
| 5 or more Children | 0 (0.0%) | 0 (0.0%) |
| Total | 37 (100.0%) | 0 (0.0%) |
Income Below Poverty Among Single-Parent Households in Banks Springs
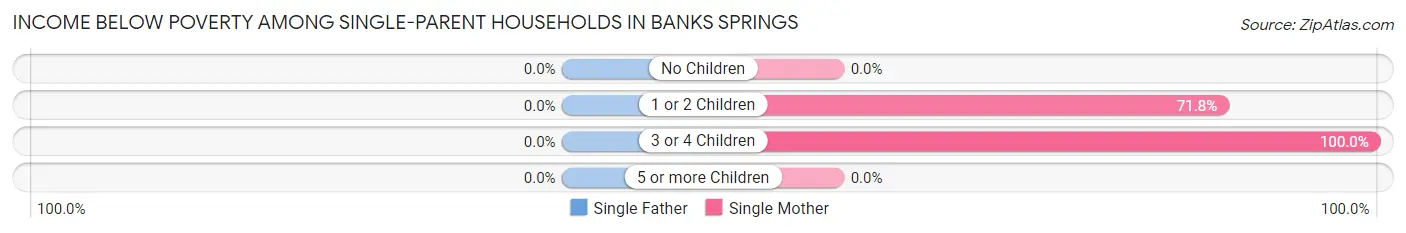
| Children | Single Father | Single Mother |
| No Children | 0 (0.0%) | 0 (0.0%) |
| 1 or 2 Children | 0 (0.0%) | 61 (71.8%) |
| 3 or 4 Children | 0 (0.0%) | 73 (100.0%) |
| 5 or more Children | 0 (0.0%) | 0 (0.0%) |
| Total | 0 (0.0%) | 134 (74.9%) |
Income Below Poverty Among Married-Couple vs Single-Parent Households in Banks Springs
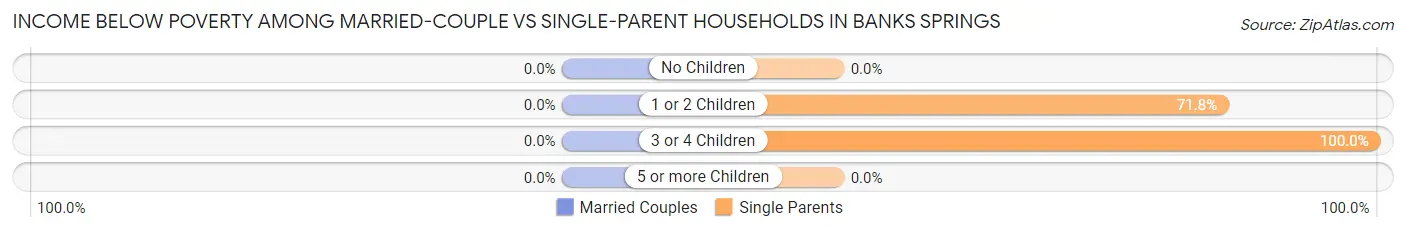
| Children | Married-Couple Families | Single-Parent Households |
| No Children | 0 (0.0%) | 0 (0.0%) |
| 1 or 2 Children | 0 (0.0%) | 61 (71.8%) |
| 3 or 4 Children | 0 (0.0%) | 73 (100.0%) |
| 5 or more Children | 0 (0.0%) | 0 (0.0%) |
| Total | 0 (0.0%) | 134 (74.9%) |
Race in Banks Springs
The most populous races in Banks Springs are Black / African American (1,193 | 80.3%), White / Caucasian (249 | 16.8%), and Hispanic or Latino (43 | 2.9%).
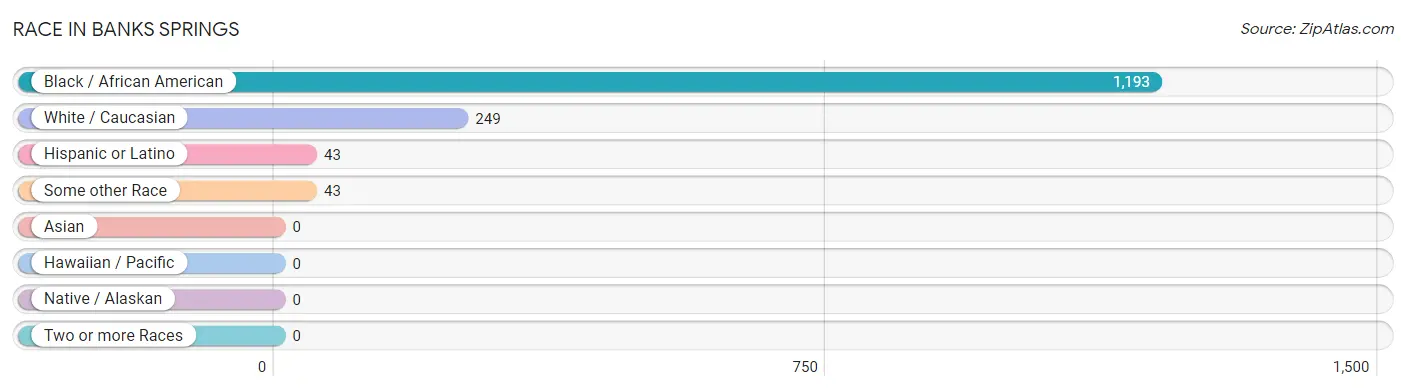
| Race | # Population | % Population |
| Asian | 0 | 0.0% |
| Black / African American | 1,193 | 80.3% |
| Hawaiian / Pacific | 0 | 0.0% |
| Hispanic or Latino | 43 | 2.9% |
| Native / Alaskan | 0 | 0.0% |
| White / Caucasian | 249 | 16.8% |
| Two or more Races | 0 | 0.0% |
| Some other Race | 43 | 2.9% |
| Total | 1,485 | 100.0% |
Ancestry in Banks Springs
The most populous ancestries reported in Banks Springs are Irish (63 | 4.2%), Mexican (43 | 2.9%), American (27 | 1.8%), European (16 | 1.1%), and English (8 | 0.5%), together accounting for 10.6% of all Banks Springs residents.
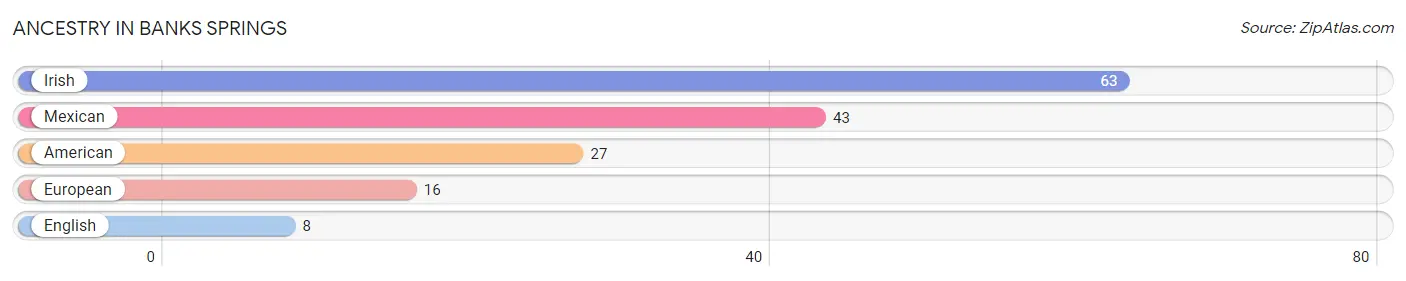
| Ancestry | # Population | % Population |
| American | 27 | 1.8% |
| English | 8 | 0.5% |
| European | 16 | 1.1% |
| Irish | 63 | 4.2% |
| Mexican | 43 | 2.9% | View All 5 Rows |
Immigrants in Banks Springs

| Immigration Origin | # Population | % Population | View All 0 Rows |
Sex and Age in Banks Springs
Sex and Age in Banks Springs
The most populous age groups in Banks Springs are 25 to 29 Years (163 | 18.8%) for men and 25 to 29 Years (203 | 32.7%) for women.
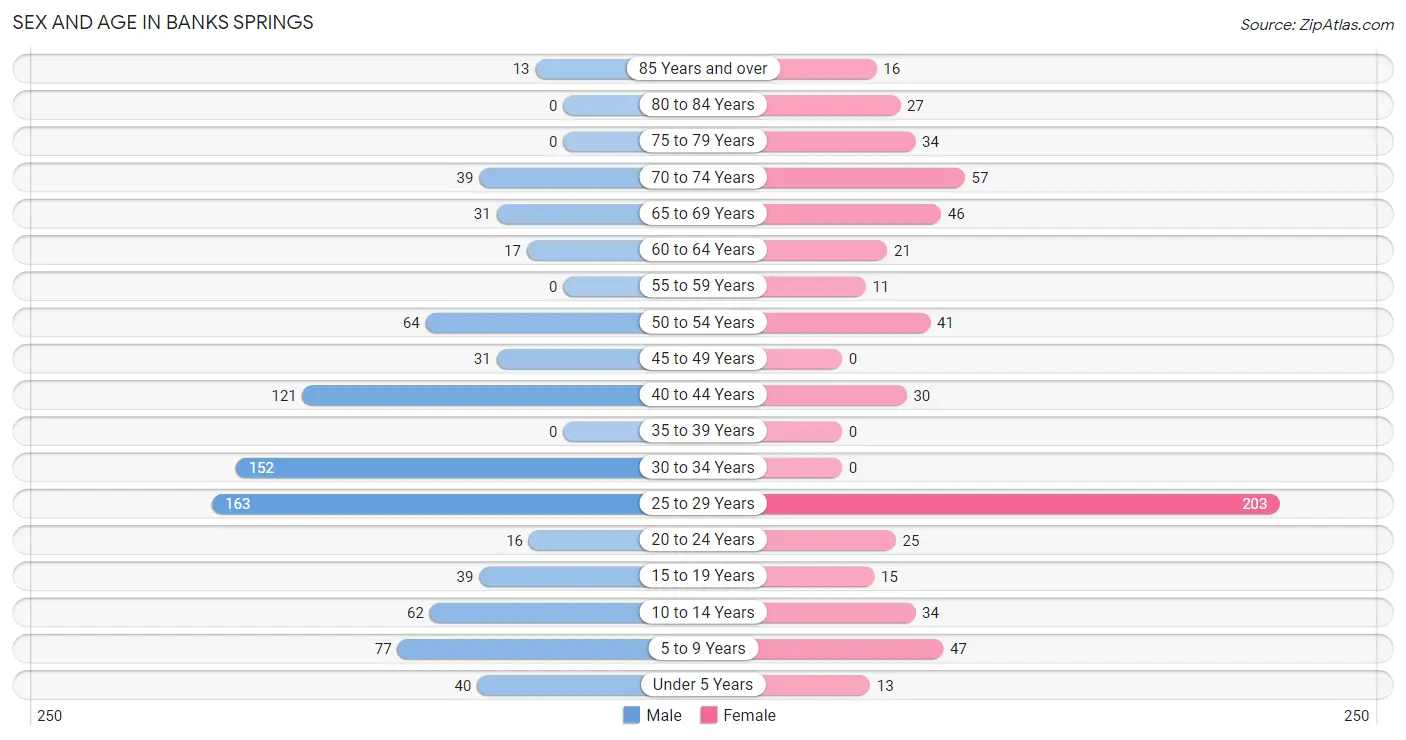
| Age Bracket | Male | Female |
| Under 5 Years | 40 (4.6%) | 13 (2.1%) |
| 5 to 9 Years | 77 (8.9%) | 47 (7.6%) |
| 10 to 14 Years | 62 (7.2%) | 34 (5.5%) |
| 15 to 19 Years | 39 (4.5%) | 15 (2.4%) |
| 20 to 24 Years | 16 (1.8%) | 25 (4.0%) |
| 25 to 29 Years | 163 (18.8%) | 203 (32.7%) |
| 30 to 34 Years | 152 (17.6%) | 0 (0.0%) |
| 35 to 39 Years | 0 (0.0%) | 0 (0.0%) |
| 40 to 44 Years | 121 (14.0%) | 30 (4.8%) |
| 45 to 49 Years | 31 (3.6%) | 0 (0.0%) |
| 50 to 54 Years | 64 (7.4%) | 41 (6.6%) |
| 55 to 59 Years | 0 (0.0%) | 11 (1.8%) |
| 60 to 64 Years | 17 (2.0%) | 21 (3.4%) |
| 65 to 69 Years | 31 (3.6%) | 46 (7.4%) |
| 70 to 74 Years | 39 (4.5%) | 57 (9.2%) |
| 75 to 79 Years | 0 (0.0%) | 34 (5.5%) |
| 80 to 84 Years | 0 (0.0%) | 27 (4.3%) |
| 85 Years and over | 13 (1.5%) | 16 (2.6%) |
| Total | 865 (100.0%) | 620 (100.0%) |
Families and Households in Banks Springs
Median Family Size in Banks Springs
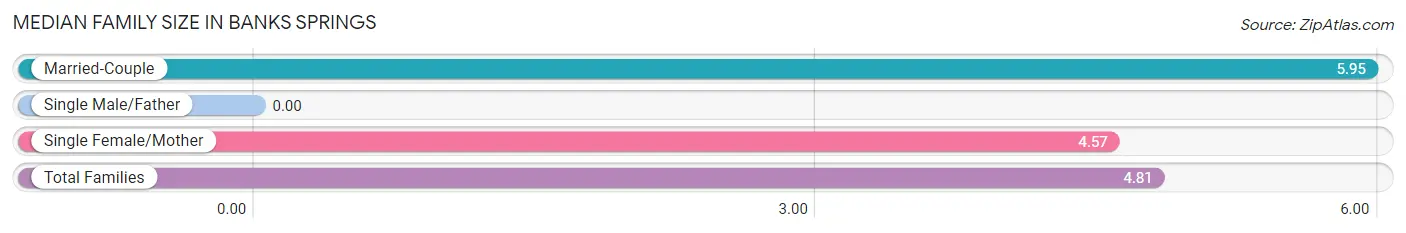
| Family Type | # Families | Family Size |
| Married-Couple | 37 (17.1%) | 5.95 |
| Single Male/Father | 0 (0.0%) | - |
| Single Female/Mother | 179 (82.9%) | 4.57 |
| Total Families | 216 (100.0%) | 4.81 |
Median Household Size in Banks Springs
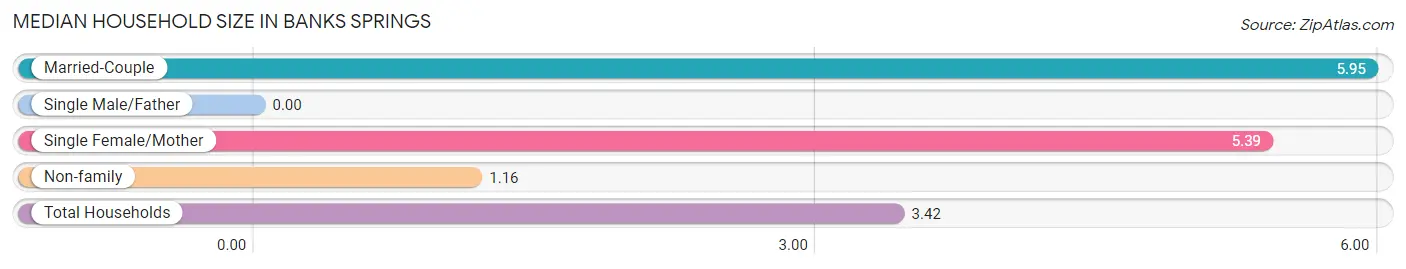
| Household Type | # Households | Household Size |
| Married-Couple | 37 (9.0%) | 5.95 |
| Single Male/Father | 0 (0.0%) | - |
| Single Female/Mother | 179 (43.3%) | 5.39 |
| Non-family | 197 (47.7%) | 1.16 |
| Total Households | 413 (100.0%) | 3.42 |
Household Size by Marriage Status in Banks Springs
Out of a total of 413 households in Banks Springs, 216 (52.3%) are family households, while 197 (47.7%) are nonfamily households. The most numerous type of family households are 5-person households, comprising 103, and the most common type of nonfamily households are 1-person households, comprising 165.
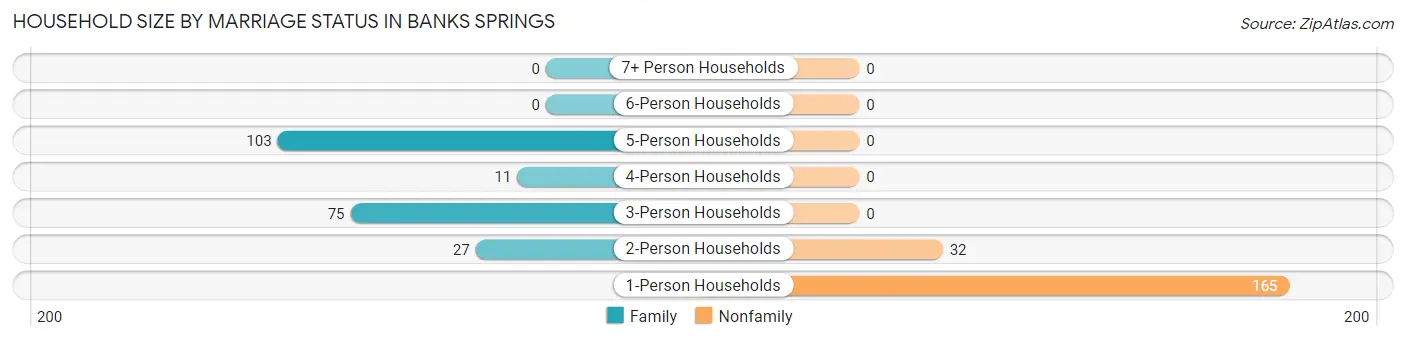
| Household Size | Family Households | Nonfamily Households |
| 1-Person Households | - | 165 (40.0%) |
| 2-Person Households | 27 (6.5%) | 32 (7.7%) |
| 3-Person Households | 75 (18.2%) | 0 (0.0%) |
| 4-Person Households | 11 (2.7%) | 0 (0.0%) |
| 5-Person Households | 103 (24.9%) | 0 (0.0%) |
| 6-Person Households | 0 (0.0%) | 0 (0.0%) |
| 7+ Person Households | 0 (0.0%) | 0 (0.0%) |
| Total | 216 (52.3%) | 197 (47.7%) |
Female Fertility in Banks Springs
Fertility by Age in Banks Springs
Average fertility rate in Banks Springs is 359.0 births per 1,000 women. Women in the age bracket of 20 to 34 years have the highest fertility rate with 430.0 births per 1,000 women. Women in the age bracket of 20 to 34 years acount for 100.0% of all women with births.
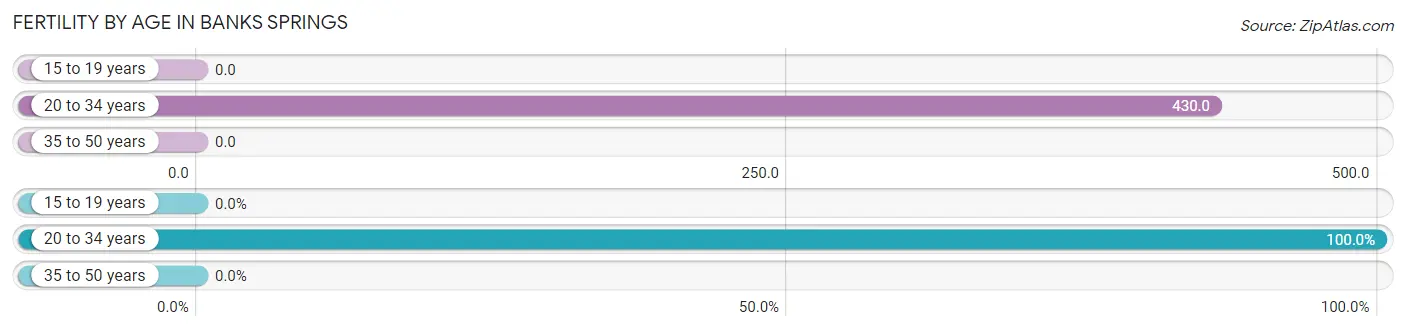
| Age Bracket | Women with Births | Births / 1,000 Women |
| 15 to 19 years | 0 (0.0%) | 0.0 |
| 20 to 34 years | 98 (100.0%) | 430.0 |
| 35 to 50 years | 0 (0.0%) | 0.0 |
| Total | 98 (100.0%) | 359.0 |
Fertility by Age by Marriage Status in Banks Springs
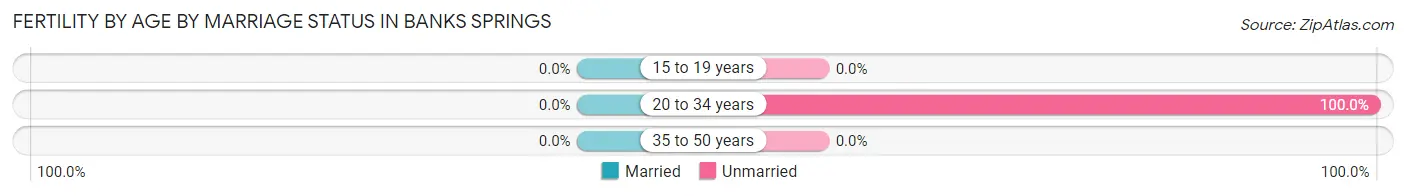
| Age Bracket | Married | Unmarried |
| 15 to 19 years | 0 (0.0%) | 0 (0.0%) |
| 20 to 34 years | 0 (0.0%) | 98 (100.0%) |
| 35 to 50 years | 0 (0.0%) | 0 (0.0%) |
| Total | 0 (0.0%) | 98 (100.0%) |
Fertility by Education in Banks Springs
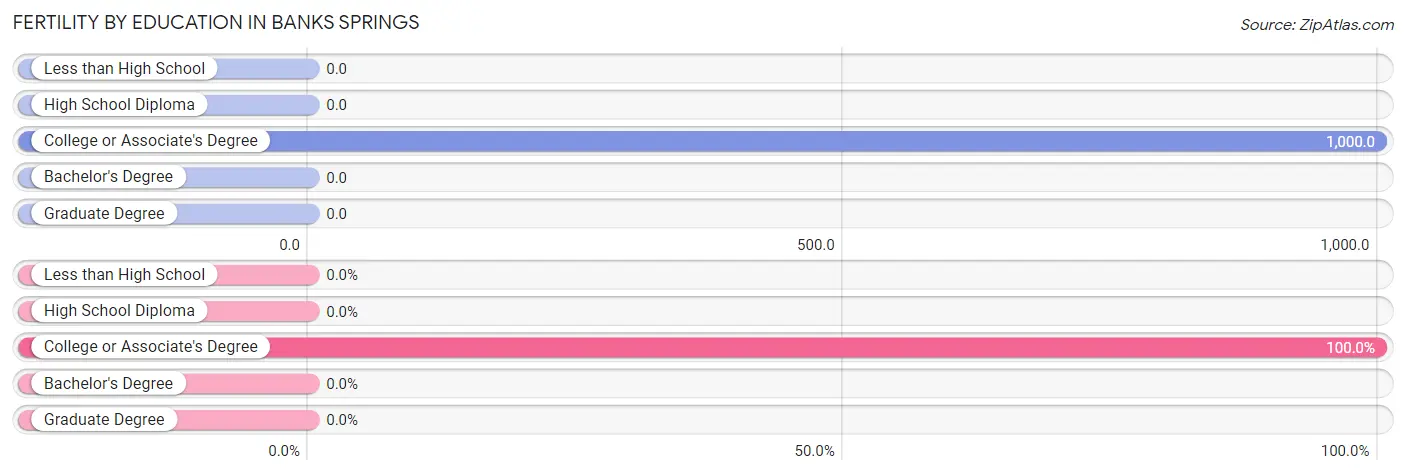
| Educational Attainment | Women with Births | Births / 1,000 Women |
| Less than High School | 0 (0.0%) | 0.0 |
| High School Diploma | 0 (0.0%) | 0.0 |
| College or Associate's Degree | 98 (100.0%) | 1,000.0 |
| Bachelor's Degree | 0 (0.0%) | 0.0 |
| Graduate Degree | 0 (0.0%) | 0.0 |
| Total | 98 (100.0%) | 359.0 |
Fertility by Education by Marriage Status in Banks Springs
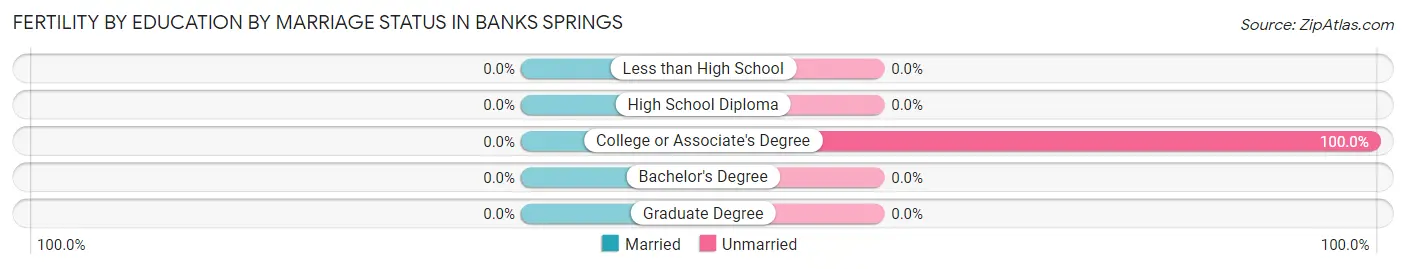
| Educational Attainment | Married | Unmarried |
| Less than High School | 0 (0.0%) | 0 (0.0%) |
| High School Diploma | 0 (0.0%) | 0 (0.0%) |
| College or Associate's Degree | 0 (0.0%) | 98 (100.0%) |
| Bachelor's Degree | 0 (0.0%) | 0 (0.0%) |
| Graduate Degree | 0 (0.0%) | 0 (0.0%) |
| Total | 0 (0.0%) | 98 (100.0%) |
Employment Characteristics in Banks Springs
Employment by Class of Employer in Banks Springs
Among the 516 employed individuals in Banks Springs, private company employees (456 | 88.4%), local government employees (25 | 4.8%), and state government employees (17 | 3.3%) make up the most common classes of employment.
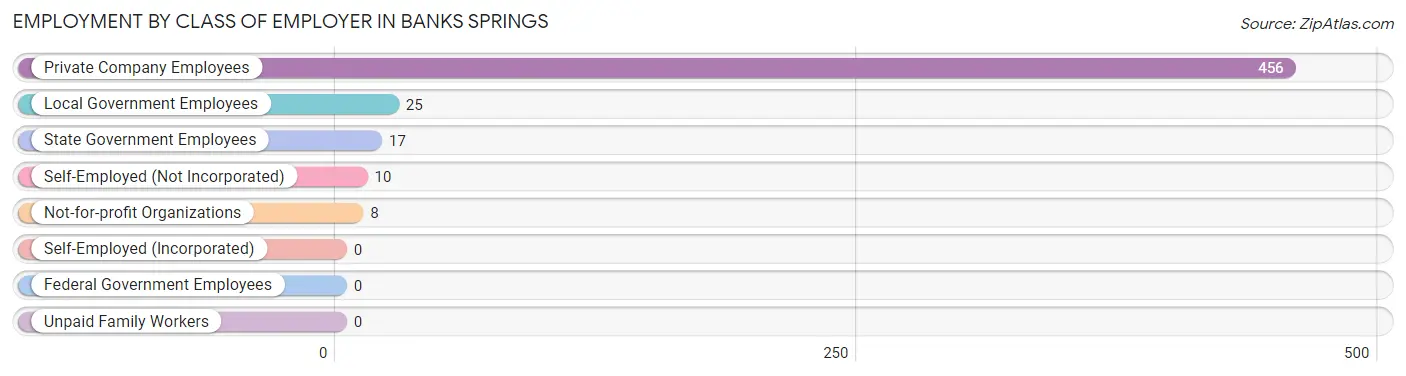
| Employer Class | # Employees | % Employees |
| Private Company Employees | 456 | 88.4% |
| Self-Employed (Incorporated) | 0 | 0.0% |
| Self-Employed (Not Incorporated) | 10 | 1.9% |
| Not-for-profit Organizations | 8 | 1.5% |
| Local Government Employees | 25 | 4.8% |
| State Government Employees | 17 | 3.3% |
| Federal Government Employees | 0 | 0.0% |
| Unpaid Family Workers | 0 | 0.0% |
| Total | 516 | 100.0% |
Employment Status by Age in Banks Springs
According to the labor force statistics for Banks Springs, out of the total population over 16 years of age (1,173), 57.7% or 677 individuals are in the labor force, with 19.1% or 129 of them unemployed. The age group with the highest labor force participation rate is 20 to 24 years, with 100.0% or 41 individuals in the labor force. Within the labor force, the 35 to 44 years age range has the highest percentage of unemployed individuals, with 83.4% or 121 of them being unemployed.
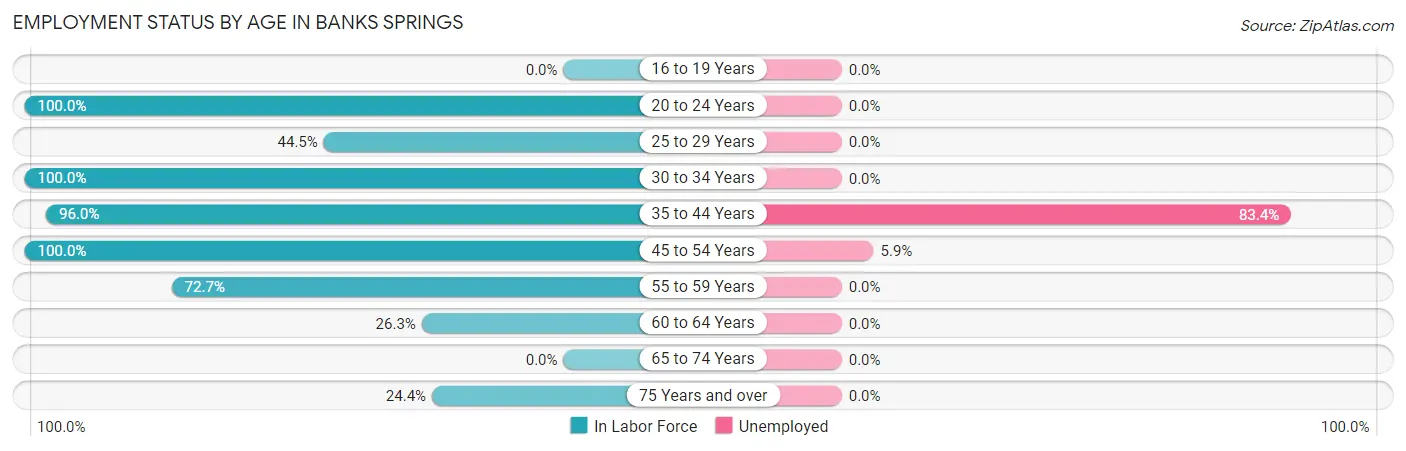
| Age Bracket | In Labor Force | Unemployed |
| 16 to 19 Years | 0 (0.0%) | 0 (0.0%) |
| 20 to 24 Years | 41 (100.0%) | 0 (0.0%) |
| 25 to 29 Years | 163 (44.5%) | 0 (0.0%) |
| 30 to 34 Years | 152 (100.0%) | 0 (0.0%) |
| 35 to 44 Years | 145 (96.0%) | 121 (83.4%) |
| 45 to 54 Years | 136 (100.0%) | 8 (5.9%) |
| 55 to 59 Years | 8 (72.7%) | 0 (0.0%) |
| 60 to 64 Years | 10 (26.3%) | 0 (0.0%) |
| 65 to 74 Years | 0 (0.0%) | 0 (0.0%) |
| 75 Years and over | 22 (24.4%) | 0 (0.0%) |
| Total | 677 (57.7%) | 129 (19.1%) |
Employment Status by Educational Attainment in Banks Springs
According to labor force statistics for Banks Springs, 71.9% of individuals (614) out of the total population between 25 and 64 years of age (854) are in the labor force, with 21.0% or 129 of them being unemployed. The group with the highest labor force participation rate are those with the educational attainment of bachelor's degree or higher, with 100.0% or 25 individuals in the labor force. Within the labor force, individuals with college / associate degree education have the highest percentage of unemployment, with 47.1% or 8 of them being unemployed.
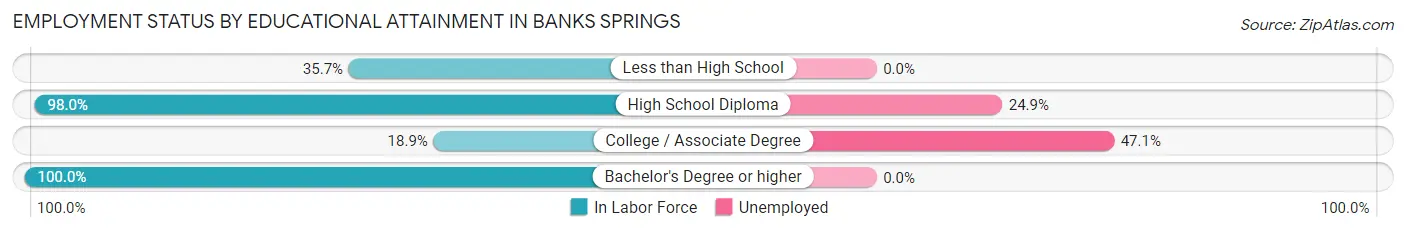
| Educational Attainment | In Labor Force | Unemployed |
| Less than High School | 87 (35.7%) | 0 (0.0%) |
| High School Diploma | 485 (98.0%) | 123 (24.9%) |
| College / Associate Degree | 17 (18.9%) | 42 (47.1%) |
| Bachelor's Degree or higher | 25 (100.0%) | 0 (0.0%) |
| Total | 614 (71.9%) | 179 (21.0%) |
Employment Occupations by Sex in Banks Springs
Management, Business, Science and Arts Occupations
The most common Management, Business, Science and Arts occupations in Banks Springs are Health Diagnosing & Treating (9 | 1.6%), Health Technologists (9 | 1.6%), Community & Social Service (8 | 1.5%), and Education Instruction & Library (8 | 1.5%).
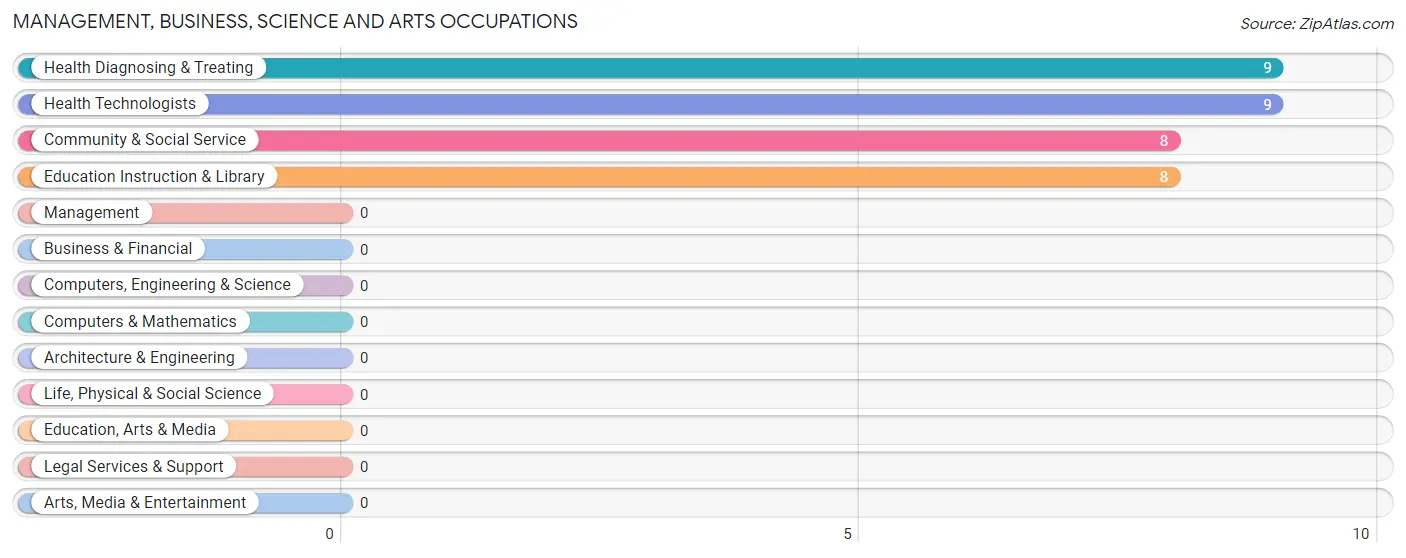
Management, Business, Science and Arts Occupations by Sex
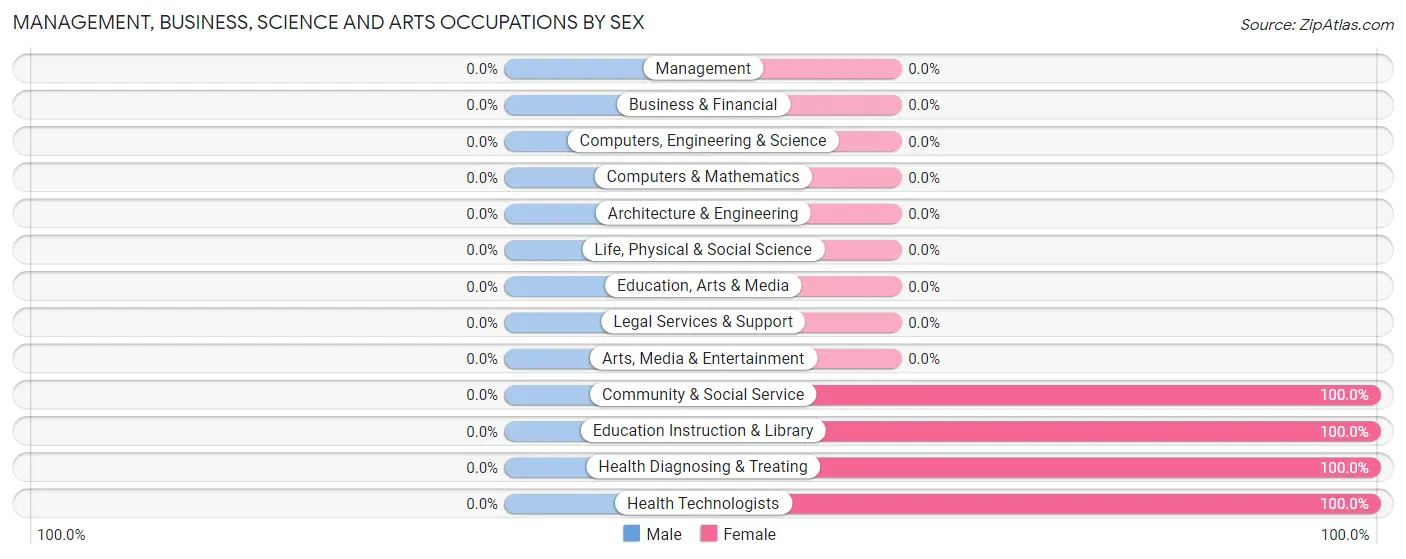
| Occupation | Male | Female |
| Management | 0 (0.0%) | 0 (0.0%) |
| Business & Financial | 0 (0.0%) | 0 (0.0%) |
| Computers, Engineering & Science | 0 (0.0%) | 0 (0.0%) |
| Computers & Mathematics | 0 (0.0%) | 0 (0.0%) |
| Architecture & Engineering | 0 (0.0%) | 0 (0.0%) |
| Life, Physical & Social Science | 0 (0.0%) | 0 (0.0%) |
| Community & Social Service | 0 (0.0%) | 8 (100.0%) |
| Education, Arts & Media | 0 (0.0%) | 0 (0.0%) |
| Legal Services & Support | 0 (0.0%) | 0 (0.0%) |
| Education Instruction & Library | 0 (0.0%) | 8 (100.0%) |
| Arts, Media & Entertainment | 0 (0.0%) | 0 (0.0%) |
| Health Diagnosing & Treating | 0 (0.0%) | 9 (100.0%) |
| Health Technologists | 0 (0.0%) | 9 (100.0%) |
| Total (Category) | 0 (0.0%) | 17 (100.0%) |
| Total (Overall) | 428 (78.1%) | 120 (21.9%) |
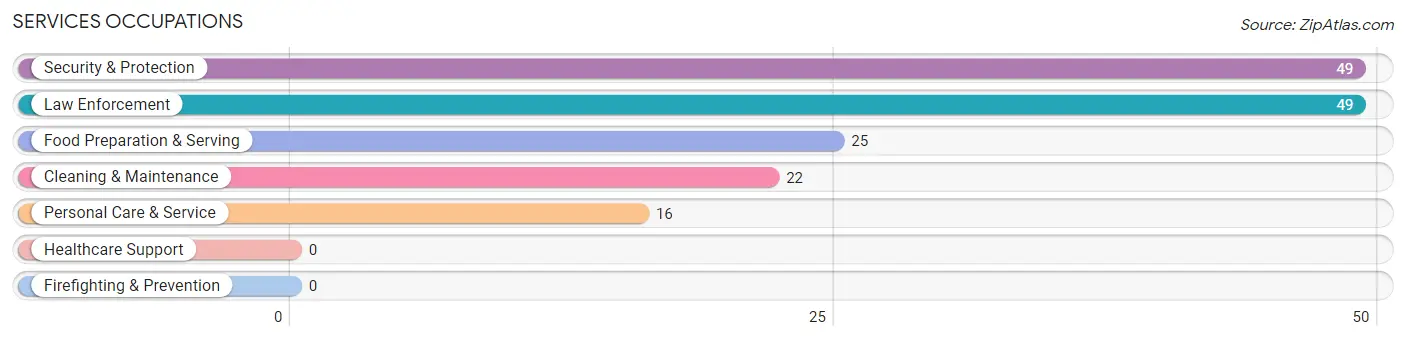
Services Occupations
The most common Services occupations in Banks Springs are Security & Protection (49 | 8.9%), Law Enforcement (49 | 8.9%), Food Preparation & Serving (25 | 4.6%), Cleaning & Maintenance (22 | 4.0%), and Personal Care & Service (16 | 2.9%).
Services Occupations by Sex
Within the Services occupations in Banks Springs, the most male-oriented occupations are Personal Care & Service (100.0%), Security & Protection (34.7%), and Law Enforcement (34.7%), while the most female-oriented occupations are Food Preparation & Serving (100.0%), Cleaning & Maintenance (100.0%), and Security & Protection (65.3%).
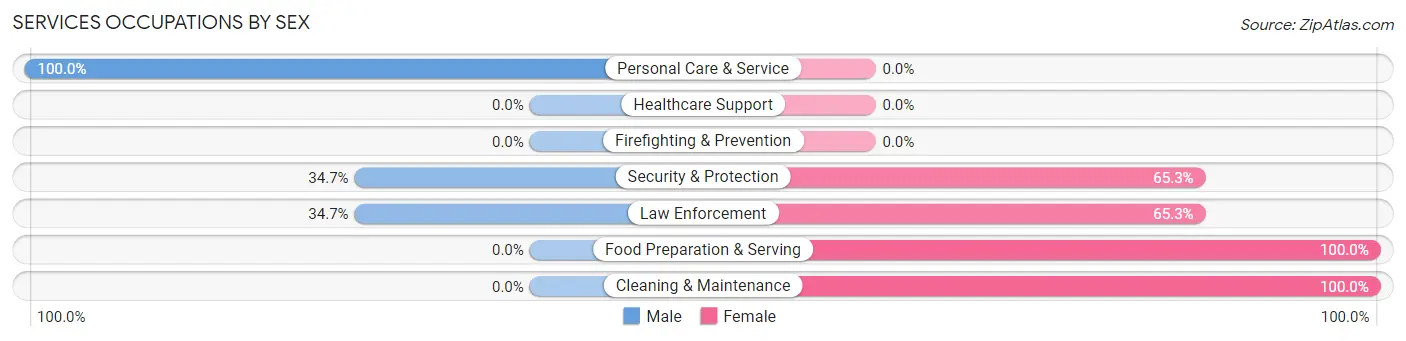
| Occupation | Male | Female |
| Healthcare Support | 0 (0.0%) | 0 (0.0%) |
| Security & Protection | 17 (34.7%) | 32 (65.3%) |
| Firefighting & Prevention | 0 (0.0%) | 0 (0.0%) |
| Law Enforcement | 17 (34.7%) | 32 (65.3%) |
| Food Preparation & Serving | 0 (0.0%) | 25 (100.0%) |
| Cleaning & Maintenance | 0 (0.0%) | 22 (100.0%) |
| Personal Care & Service | 16 (100.0%) | 0 (0.0%) |
| Total (Category) | 33 (29.5%) | 79 (70.5%) |
| Total (Overall) | 428 (78.1%) | 120 (21.9%) |
Sales and Office Occupations
The most common Sales and Office occupations in Banks Springs are , and Sales & Related (24 | 4.4%).
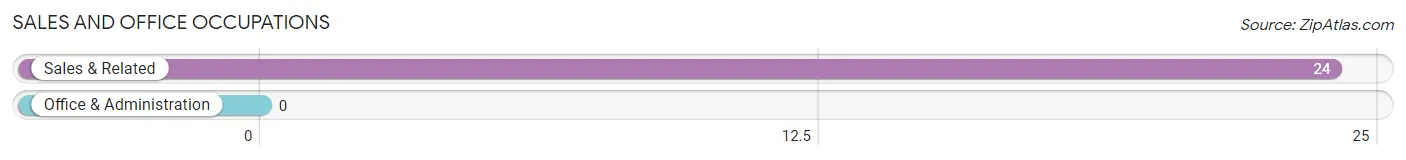
Sales and Office Occupations by Sex
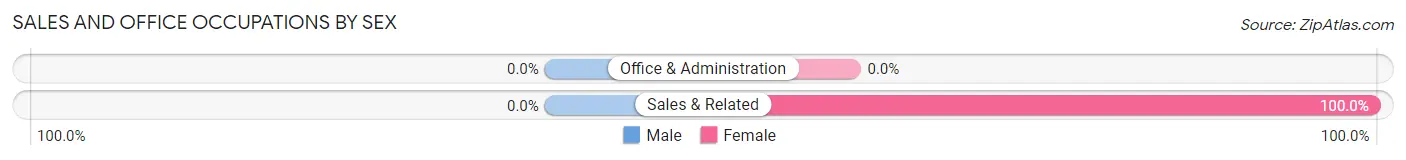
| Occupation | Male | Female |
| Sales & Related | 0 (0.0%) | 24 (100.0%) |
| Office & Administration | 0 (0.0%) | 0 (0.0%) |
| Total (Category) | 0 (0.0%) | 24 (100.0%) |
| Total (Overall) | 428 (78.1%) | 120 (21.9%) |
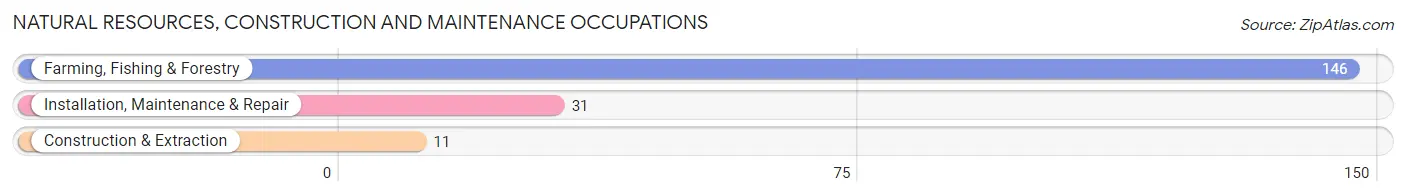
Natural Resources, Construction and Maintenance Occupations
The most common Natural Resources, Construction and Maintenance occupations in Banks Springs are Farming, Fishing & Forestry (146 | 26.6%), Installation, Maintenance & Repair (31 | 5.7%), and Construction & Extraction (11 | 2.0%).
Natural Resources, Construction and Maintenance Occupations by Sex
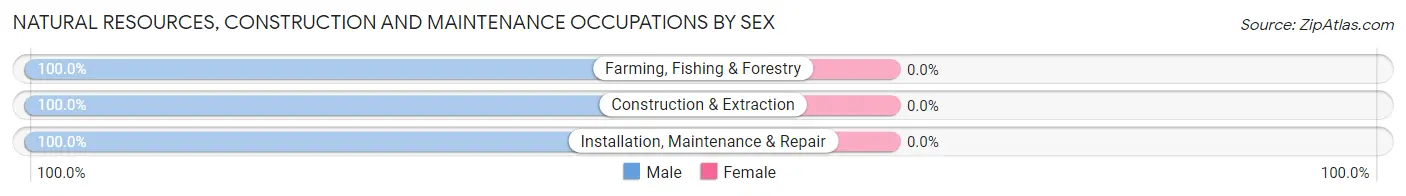
| Occupation | Male | Female |
| Farming, Fishing & Forestry | 146 (100.0%) | 0 (0.0%) |
| Construction & Extraction | 11 (100.0%) | 0 (0.0%) |
| Installation, Maintenance & Repair | 31 (100.0%) | 0 (0.0%) |
| Total (Category) | 188 (100.0%) | 0 (0.0%) |
| Total (Overall) | 428 (78.1%) | 120 (21.9%) |
Production, Transportation and Moving Occupations
The most common Production, Transportation and Moving occupations in Banks Springs are Material Moving (152 | 27.7%), Production (45 | 8.2%), and Transportation (10 | 1.8%).
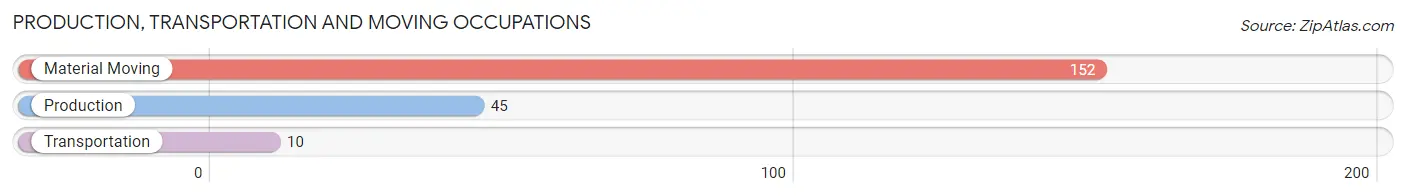
Production, Transportation and Moving Occupations by Sex
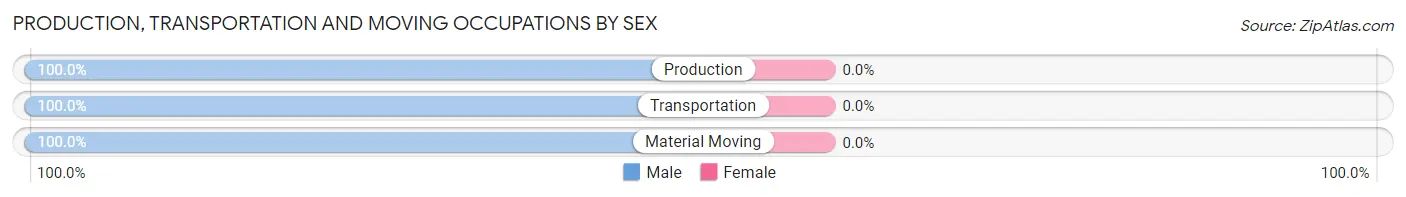
| Occupation | Male | Female |
| Production | 45 (100.0%) | 0 (0.0%) |
| Transportation | 10 (100.0%) | 0 (0.0%) |
| Material Moving | 152 (100.0%) | 0 (0.0%) |
| Total (Category) | 207 (100.0%) | 0 (0.0%) |
| Total (Overall) | 428 (78.1%) | 120 (21.9%) |
Employment Industries by Sex in Banks Springs
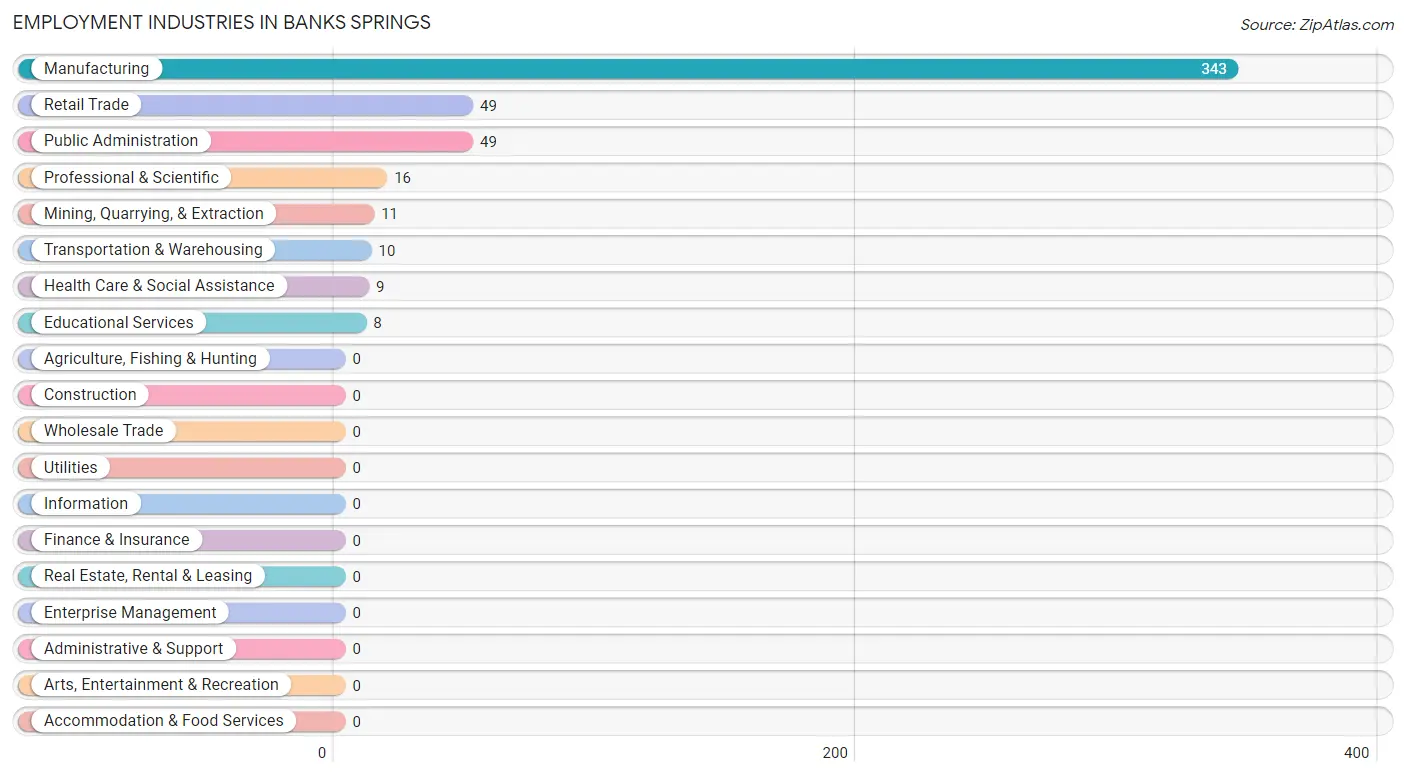
Employment Industries in Banks Springs
The major employment industries in Banks Springs include Manufacturing (343 | 62.6%), Retail Trade (49 | 8.9%), Public Administration (49 | 8.9%), Professional & Scientific (16 | 2.9%), and Mining, Quarrying, & Extraction (11 | 2.0%).
Employment Industries by Sex in Banks Springs
The Banks Springs industries that see more men than women are Mining, Quarrying, & Extraction (100.0%), Manufacturing (100.0%), and Transportation & Warehousing (100.0%), whereas the industries that tend to have a higher number of women are Retail Trade (100.0%), Educational Services (100.0%), and Health Care & Social Assistance (100.0%).
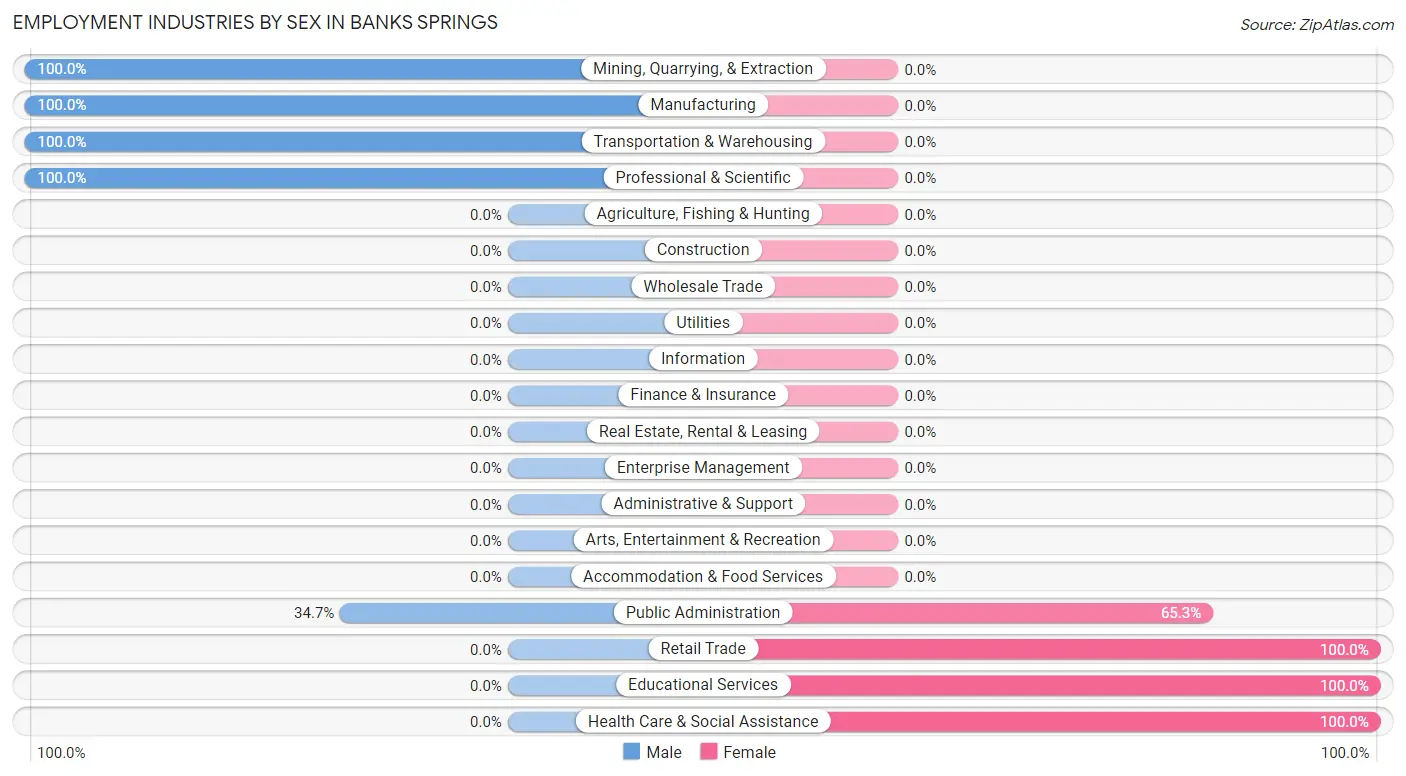
| Industry | Male | Female |
| Agriculture, Fishing & Hunting | 0 (0.0%) | 0 (0.0%) |
| Mining, Quarrying, & Extraction | 11 (100.0%) | 0 (0.0%) |
| Construction | 0 (0.0%) | 0 (0.0%) |
| Manufacturing | 343 (100.0%) | 0 (0.0%) |
| Wholesale Trade | 0 (0.0%) | 0 (0.0%) |
| Retail Trade | 0 (0.0%) | 49 (100.0%) |
| Transportation & Warehousing | 10 (100.0%) | 0 (0.0%) |
| Utilities | 0 (0.0%) | 0 (0.0%) |
| Information | 0 (0.0%) | 0 (0.0%) |
| Finance & Insurance | 0 (0.0%) | 0 (0.0%) |
| Real Estate, Rental & Leasing | 0 (0.0%) | 0 (0.0%) |
| Professional & Scientific | 16 (100.0%) | 0 (0.0%) |
| Enterprise Management | 0 (0.0%) | 0 (0.0%) |
| Administrative & Support | 0 (0.0%) | 0 (0.0%) |
| Educational Services | 0 (0.0%) | 8 (100.0%) |
| Health Care & Social Assistance | 0 (0.0%) | 9 (100.0%) |
| Arts, Entertainment & Recreation | 0 (0.0%) | 0 (0.0%) |
| Accommodation & Food Services | 0 (0.0%) | 0 (0.0%) |
| Public Administration | 17 (34.7%) | 32 (65.3%) |
| Total | 428 (78.1%) | 120 (21.9%) |
Education in Banks Springs
School Enrollment in Banks Springs
The most common levels of schooling among the 310 students in Banks Springs are elementary school (124 | 40.0%), middle school (102 | 32.9%), and high school (39 | 12.6%).
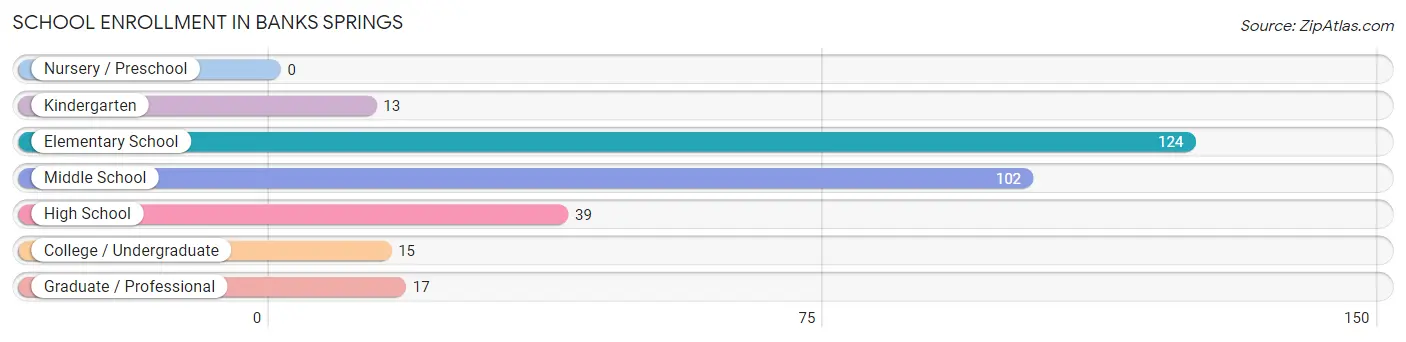
| School Level | # Students | % Students |
| Nursery / Preschool | 0 | 0.0% |
| Kindergarten | 13 | 4.2% |
| Elementary School | 124 | 40.0% |
| Middle School | 102 | 32.9% |
| High School | 39 | 12.6% |
| College / Undergraduate | 15 | 4.8% |
| Graduate / Professional | 17 | 5.5% |
| Total | 310 | 100.0% |
School Enrollment by Age by Funding Source in Banks Springs
Out of a total of 310 students who are enrolled in schools in Banks Springs, 34 (11.0%) attend a private institution, while the remaining 276 (89.0%) are enrolled in public schools. The age group of 10 to 14 year olds has the highest likelihood of being enrolled in private schools, with 34 (35.4% in the age bracket) enrolled. Conversely, the age group of 3 to 4 year olds has the lowest likelihood of being enrolled in a private school, with 13 (100.0% in the age bracket) attending a public institution.
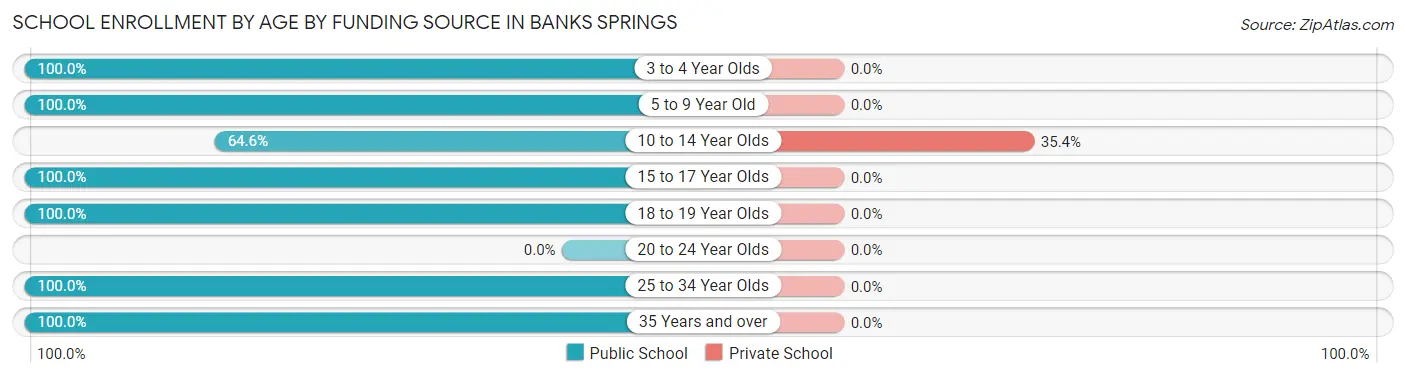
| Age Bracket | Public School | Private School |
| 3 to 4 Year Olds | 13 (100.0%) | 0 (0.0%) |
| 5 to 9 Year Old | 124 (100.0%) | 0 (0.0%) |
| 10 to 14 Year Olds | 62 (64.6%) | 34 (35.4%) |
| 15 to 17 Year Olds | 39 (100.0%) | 0 (0.0%) |
| 18 to 19 Year Olds | 15 (100.0%) | 0 (0.0%) |
| 20 to 24 Year Olds | 0 (0.0%) | 0 (0.0%) |
| 25 to 34 Year Olds | 17 (100.0%) | 0 (0.0%) |
| 35 Years and over | 6 (100.0%) | 0 (0.0%) |
| Total | 276 (89.0%) | 34 (11.0%) |
Educational Attainment by Field of Study in Banks Springs
Arts & humanities (23 | 40.4%), education (16 | 28.1%), science & technology (8 | 14.0%), computers & mathematics (5 | 8.8%), and visual & performing arts (5 | 8.8%) are the most common fields of study among 57 individuals in Banks Springs who have obtained a bachelor's degree or higher.
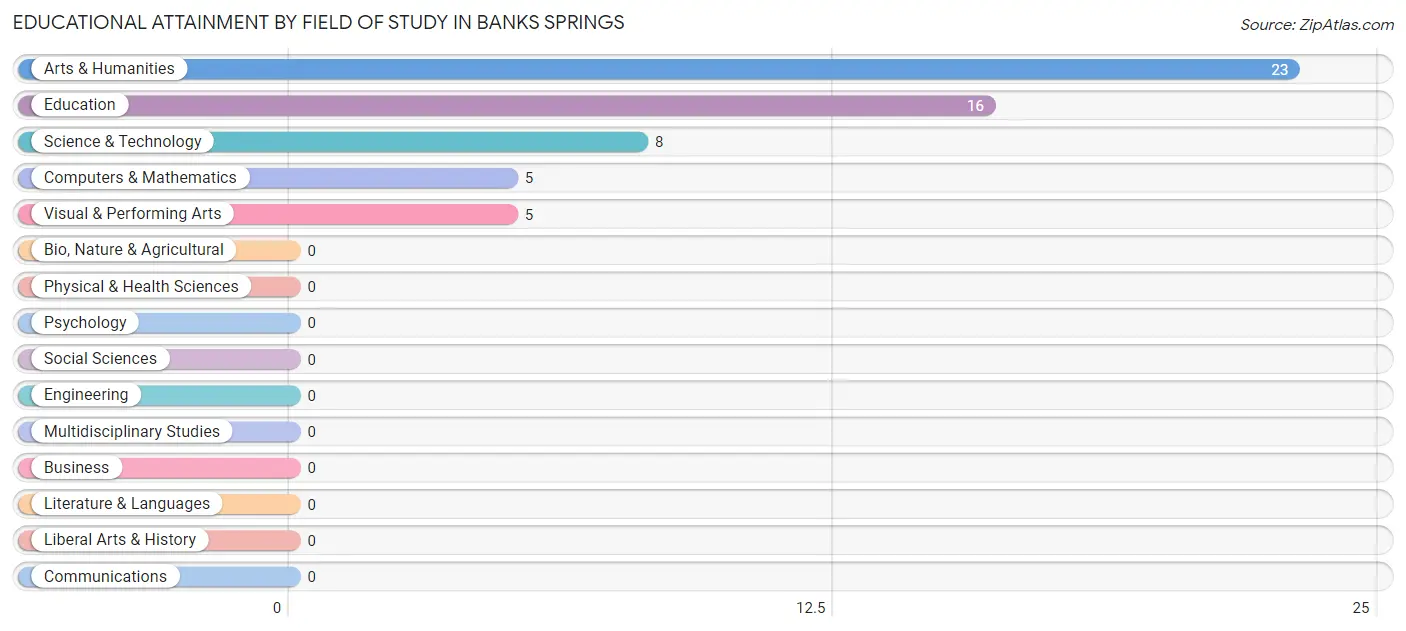
| Field of Study | # Graduates | % Graduates |
| Computers & Mathematics | 5 | 8.8% |
| Bio, Nature & Agricultural | 0 | 0.0% |
| Physical & Health Sciences | 0 | 0.0% |
| Psychology | 0 | 0.0% |
| Social Sciences | 0 | 0.0% |
| Engineering | 0 | 0.0% |
| Multidisciplinary Studies | 0 | 0.0% |
| Science & Technology | 8 | 14.0% |
| Business | 0 | 0.0% |
| Education | 16 | 28.1% |
| Literature & Languages | 0 | 0.0% |
| Liberal Arts & History | 0 | 0.0% |
| Visual & Performing Arts | 5 | 8.8% |
| Communications | 0 | 0.0% |
| Arts & Humanities | 23 | 40.4% |
| Total | 57 | 100.0% |
Transportation & Commute in Banks Springs
Vehicle Availability by Sex in Banks Springs
The most prevalent vehicle ownership categories in Banks Springs are males with 1 vehicle (172, accounting for 40.2%) and females with 1 vehicle (79, making up 195.4%).
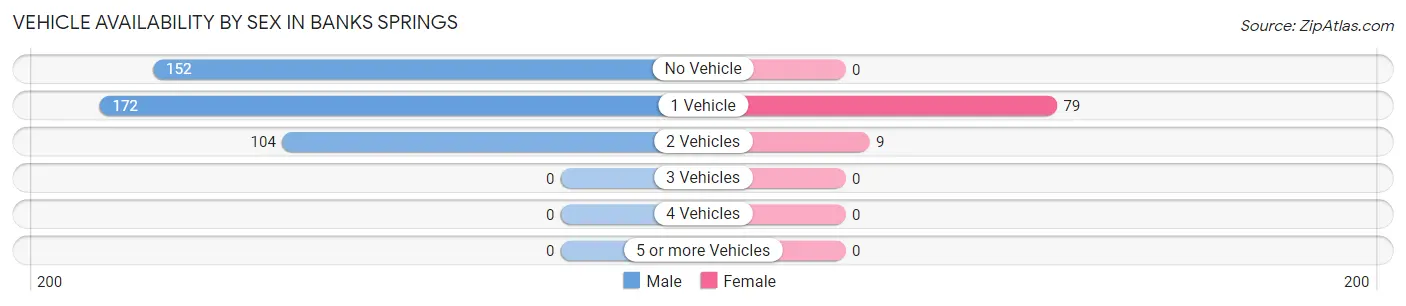
| Vehicles Available | Male | Female |
| No Vehicle | 152 (35.5%) | 0 (0.0%) |
| 1 Vehicle | 172 (40.2%) | 79 (89.8%) |
| 2 Vehicles | 104 (24.3%) | 9 (10.2%) |
| 3 Vehicles | 0 (0.0%) | 0 (0.0%) |
| 4 Vehicles | 0 (0.0%) | 0 (0.0%) |
| 5 or more Vehicles | 0 (0.0%) | 0 (0.0%) |
| Total | 428 (100.0%) | 88 (100.0%) |
Commute Time in Banks Springs
The most frequently occuring commute durations in Banks Springs are 30 to 34 minutes (180 commuters, 34.9%), 40 to 44 minutes (146 commuters, 28.3%), and less than 5 minutes (101 commuters, 19.6%).
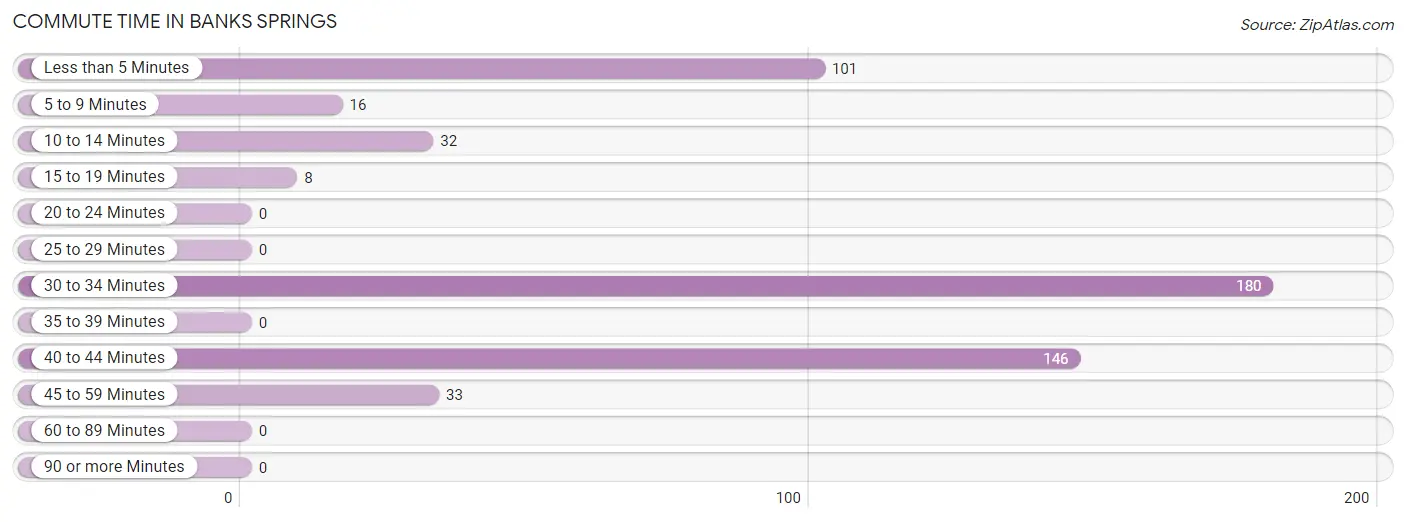
| Commute Time | # Commuters | % Commuters |
| Less than 5 Minutes | 101 | 19.6% |
| 5 to 9 Minutes | 16 | 3.1% |
| 10 to 14 Minutes | 32 | 6.2% |
| 15 to 19 Minutes | 8 | 1.5% |
| 20 to 24 Minutes | 0 | 0.0% |
| 25 to 29 Minutes | 0 | 0.0% |
| 30 to 34 Minutes | 180 | 34.9% |
| 35 to 39 Minutes | 0 | 0.0% |
| 40 to 44 Minutes | 146 | 28.3% |
| 45 to 59 Minutes | 33 | 6.4% |
| 60 to 89 Minutes | 0 | 0.0% |
| 90 or more Minutes | 0 | 0.0% |
Commute Time by Sex in Banks Springs
The most common commute times in Banks Springs are 30 to 34 minutes (180 commuters, 42.1%) for males and 45 to 59 minutes (33 commuters, 37.5%) for females.
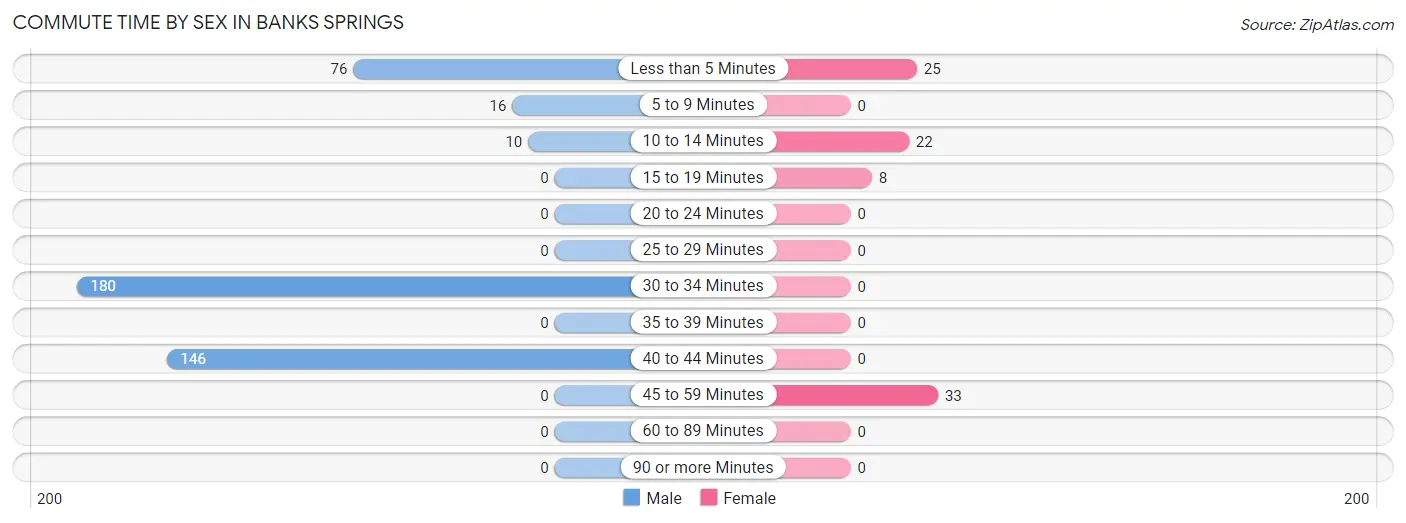
| Commute Time | Male | Female |
| Less than 5 Minutes | 76 (17.8%) | 25 (28.4%) |
| 5 to 9 Minutes | 16 (3.7%) | 0 (0.0%) |
| 10 to 14 Minutes | 10 (2.3%) | 22 (25.0%) |
| 15 to 19 Minutes | 0 (0.0%) | 8 (9.1%) |
| 20 to 24 Minutes | 0 (0.0%) | 0 (0.0%) |
| 25 to 29 Minutes | 0 (0.0%) | 0 (0.0%) |
| 30 to 34 Minutes | 180 (42.1%) | 0 (0.0%) |
| 35 to 39 Minutes | 0 (0.0%) | 0 (0.0%) |
| 40 to 44 Minutes | 146 (34.1%) | 0 (0.0%) |
| 45 to 59 Minutes | 0 (0.0%) | 33 (37.5%) |
| 60 to 89 Minutes | 0 (0.0%) | 0 (0.0%) |
| 90 or more Minutes | 0 (0.0%) | 0 (0.0%) |
Time of Departure to Work by Sex in Banks Springs
The most frequent times of departure to work in Banks Springs are 6:00 AM to 6:29 AM (371, 86.7%) for males and 7:00 AM to 7:29 AM (32, 36.4%) for females.
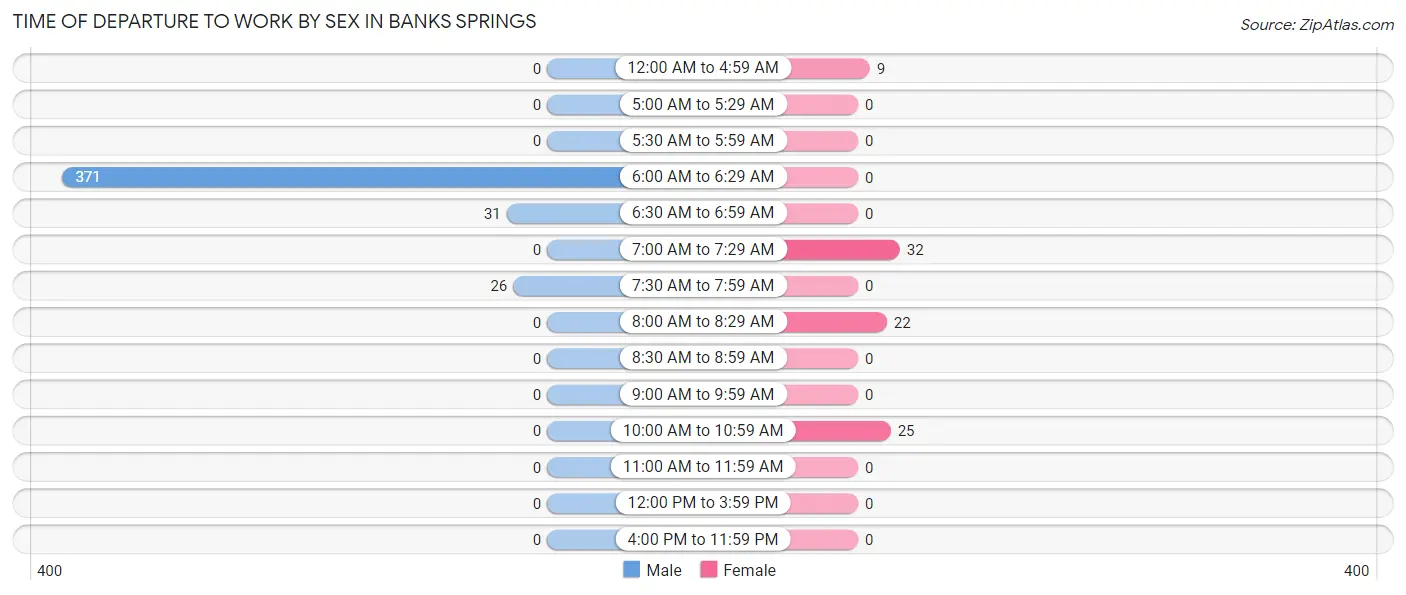
| Time of Departure | Male | Female |
| 12:00 AM to 4:59 AM | 0 (0.0%) | 9 (10.2%) |
| 5:00 AM to 5:29 AM | 0 (0.0%) | 0 (0.0%) |
| 5:30 AM to 5:59 AM | 0 (0.0%) | 0 (0.0%) |
| 6:00 AM to 6:29 AM | 371 (86.7%) | 0 (0.0%) |
| 6:30 AM to 6:59 AM | 31 (7.2%) | 0 (0.0%) |
| 7:00 AM to 7:29 AM | 0 (0.0%) | 32 (36.4%) |
| 7:30 AM to 7:59 AM | 26 (6.1%) | 0 (0.0%) |
| 8:00 AM to 8:29 AM | 0 (0.0%) | 22 (25.0%) |
| 8:30 AM to 8:59 AM | 0 (0.0%) | 0 (0.0%) |
| 9:00 AM to 9:59 AM | 0 (0.0%) | 0 (0.0%) |
| 10:00 AM to 10:59 AM | 0 (0.0%) | 25 (28.4%) |
| 11:00 AM to 11:59 AM | 0 (0.0%) | 0 (0.0%) |
| 12:00 PM to 3:59 PM | 0 (0.0%) | 0 (0.0%) |
| 4:00 PM to 11:59 PM | 0 (0.0%) | 0 (0.0%) |
| Total | 428 (100.0%) | 88 (100.0%) |
Housing Occupancy in Banks Springs
Occupancy by Ownership in Banks Springs
Of the total 413 dwellings in Banks Springs, owner-occupied units account for 178 (43.1%), while renter-occupied units make up 235 (56.9%).
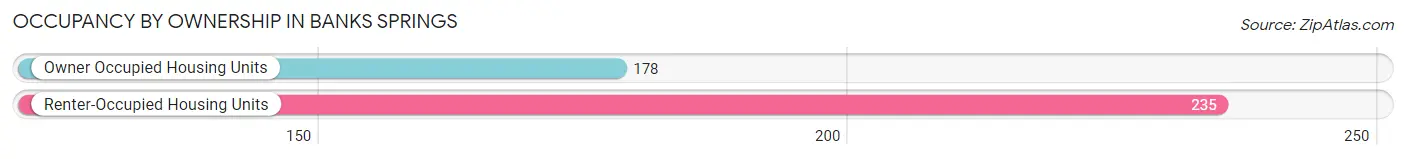
| Occupancy | # Housing Units | % Housing Units |
| Owner Occupied Housing Units | 178 | 43.1% |
| Renter-Occupied Housing Units | 235 | 56.9% |
| Total Occupied Housing Units | 413 | 100.0% |
Occupancy by Household Size in Banks Springs
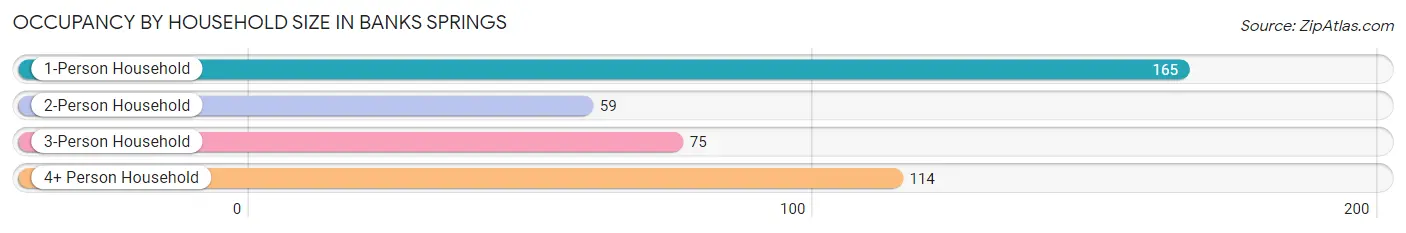
| Household Size | # Housing Units | % Housing Units |
| 1-Person Household | 165 | 40.0% |
| 2-Person Household | 59 | 14.3% |
| 3-Person Household | 75 | 18.2% |
| 4+ Person Household | 114 | 27.6% |
| Total Housing Units | 413 | 100.0% |
Occupancy by Ownership by Household Size in Banks Springs
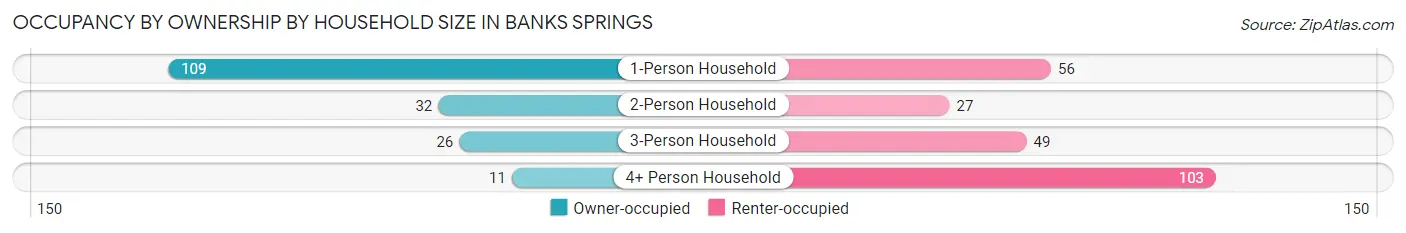
| Household Size | Owner-occupied | Renter-occupied |
| 1-Person Household | 109 (66.1%) | 56 (33.9%) |
| 2-Person Household | 32 (54.2%) | 27 (45.8%) |
| 3-Person Household | 26 (34.7%) | 49 (65.3%) |
| 4+ Person Household | 11 (9.7%) | 103 (90.3%) |
| Total Housing Units | 178 (43.1%) | 235 (56.9%) |
Occupancy by Educational Attainment in Banks Springs
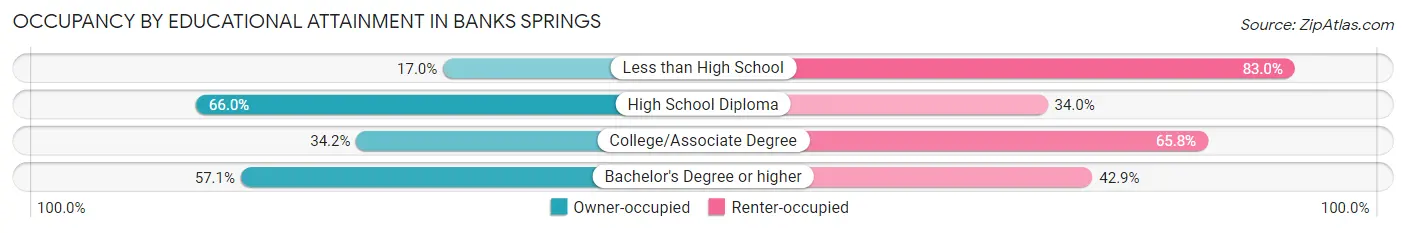
| Household Size | Owner-occupied | Renter-occupied |
| Less than High School | 16 (17.0%) | 78 (83.0%) |
| High School Diploma | 103 (66.0%) | 53 (34.0%) |
| College/Associate Degree | 51 (34.2%) | 98 (65.8%) |
| Bachelor's Degree or higher | 8 (57.1%) | 6 (42.9%) |
Occupancy by Age of Householder in Banks Springs
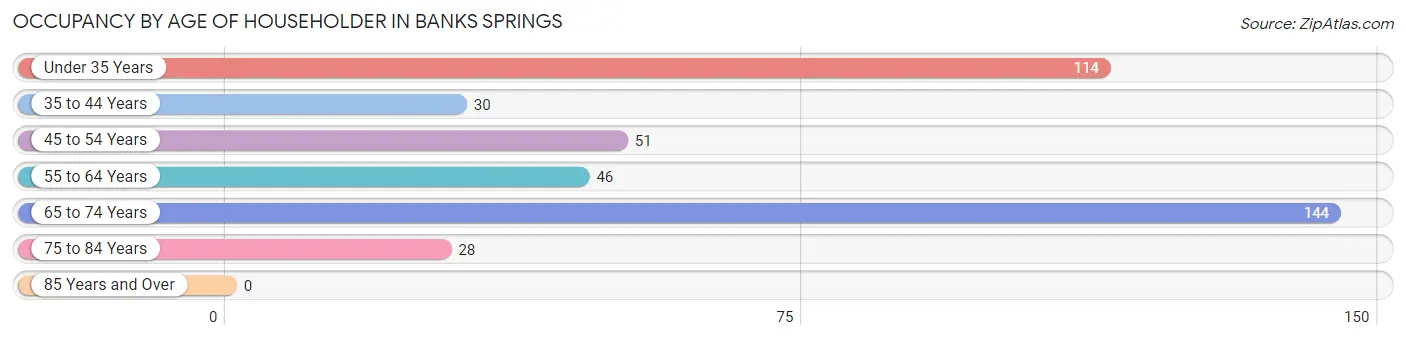
| Age Bracket | # Households | % Households |
| Under 35 Years | 114 | 27.6% |
| 35 to 44 Years | 30 | 7.3% |
| 45 to 54 Years | 51 | 12.3% |
| 55 to 64 Years | 46 | 11.1% |
| 65 to 74 Years | 144 | 34.9% |
| 75 to 84 Years | 28 | 6.8% |
| 85 Years and Over | 0 | 0.0% |
| Total | 413 | 100.0% |
Housing Finances in Banks Springs
Median Income by Occupancy in Banks Springs
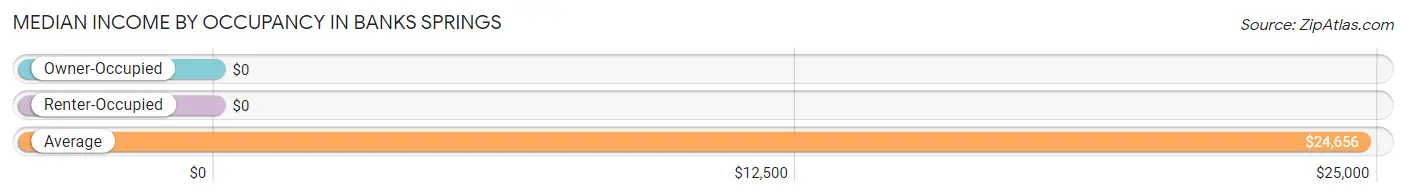
| Occupancy Type | # Households | Median Income |
| Owner-Occupied | 178 (43.1%) | $0 |
| Renter-Occupied | 235 (56.9%) | $0 |
| Average | 413 (100.0%) | $24,656 |
Occupancy by Householder Income Bracket in Banks Springs
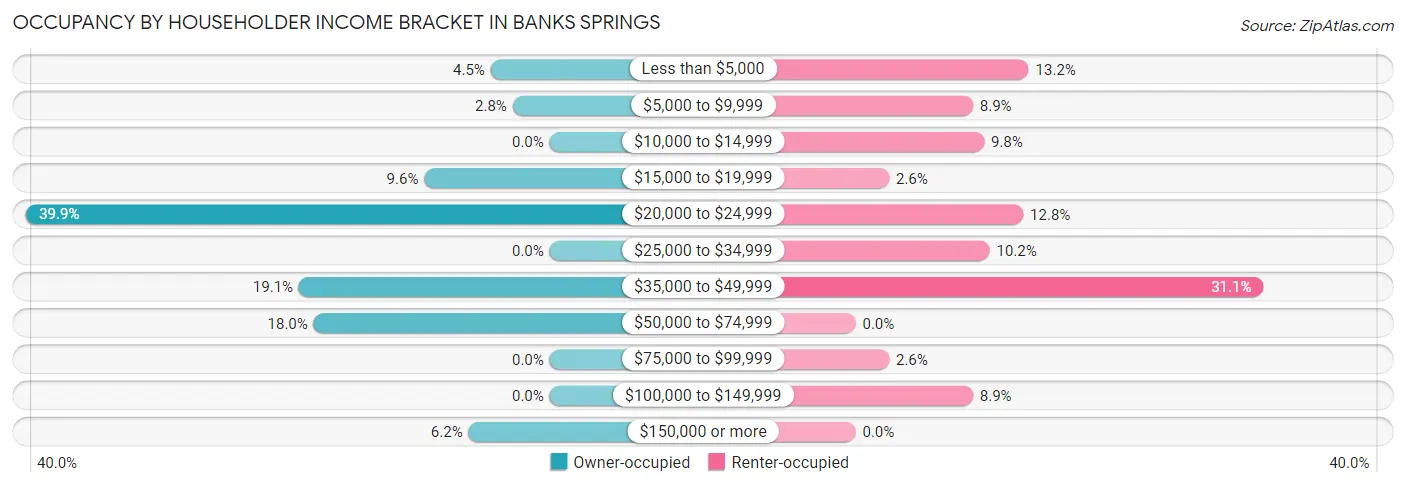
| Income Bracket | Owner-occupied | Renter-occupied |
| Less than $5,000 | 8 (4.5%) | 31 (13.2%) |
| $5,000 to $9,999 | 5 (2.8%) | 21 (8.9%) |
| $10,000 to $14,999 | 0 (0.0%) | 23 (9.8%) |
| $15,000 to $19,999 | 17 (9.6%) | 6 (2.5%) |
| $20,000 to $24,999 | 71 (39.9%) | 30 (12.8%) |
| $25,000 to $34,999 | 0 (0.0%) | 24 (10.2%) |
| $35,000 to $49,999 | 34 (19.1%) | 73 (31.1%) |
| $50,000 to $74,999 | 32 (18.0%) | 0 (0.0%) |
| $75,000 to $99,999 | 0 (0.0%) | 6 (2.5%) |
| $100,000 to $149,999 | 0 (0.0%) | 21 (8.9%) |
| $150,000 or more | 11 (6.2%) | 0 (0.0%) |
| Total | 178 (100.0%) | 235 (100.0%) |
Monthly Housing Cost Tiers in Banks Springs
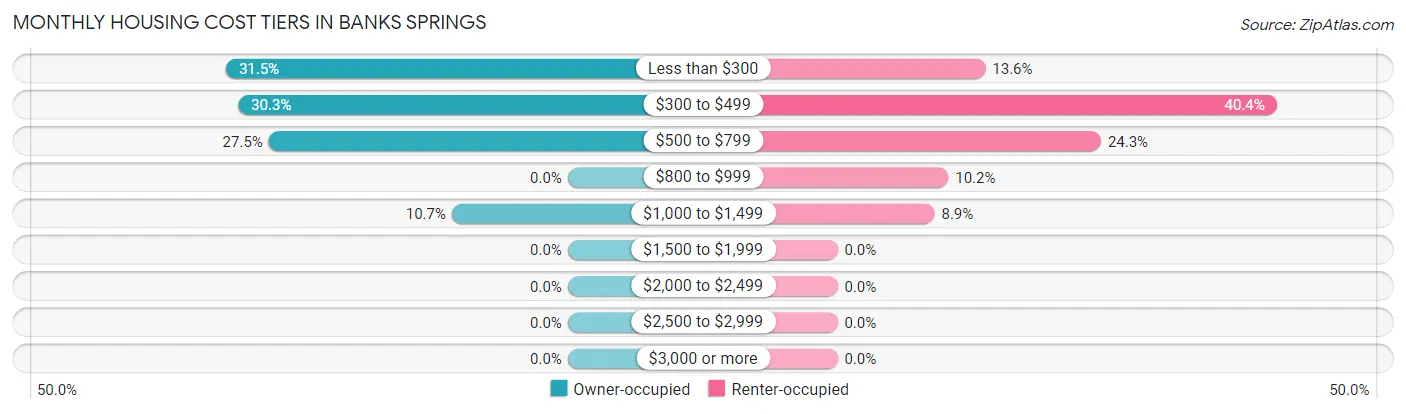
| Monthly Cost | Owner-occupied | Renter-occupied |
| Less than $300 | 56 (31.5%) | 32 (13.6%) |
| $300 to $499 | 54 (30.3%) | 95 (40.4%) |
| $500 to $799 | 49 (27.5%) | 57 (24.3%) |
| $800 to $999 | 0 (0.0%) | 24 (10.2%) |
| $1,000 to $1,499 | 19 (10.7%) | 21 (8.9%) |
| $1,500 to $1,999 | 0 (0.0%) | 0 (0.0%) |
| $2,000 to $2,499 | 0 (0.0%) | 0 (0.0%) |
| $2,500 to $2,999 | 0 (0.0%) | 0 (0.0%) |
| $3,000 or more | 0 (0.0%) | 0 (0.0%) |
| Total | 178 (100.0%) | 235 (100.0%) |
Physical Housing Characteristics in Banks Springs
Housing Structures in Banks Springs
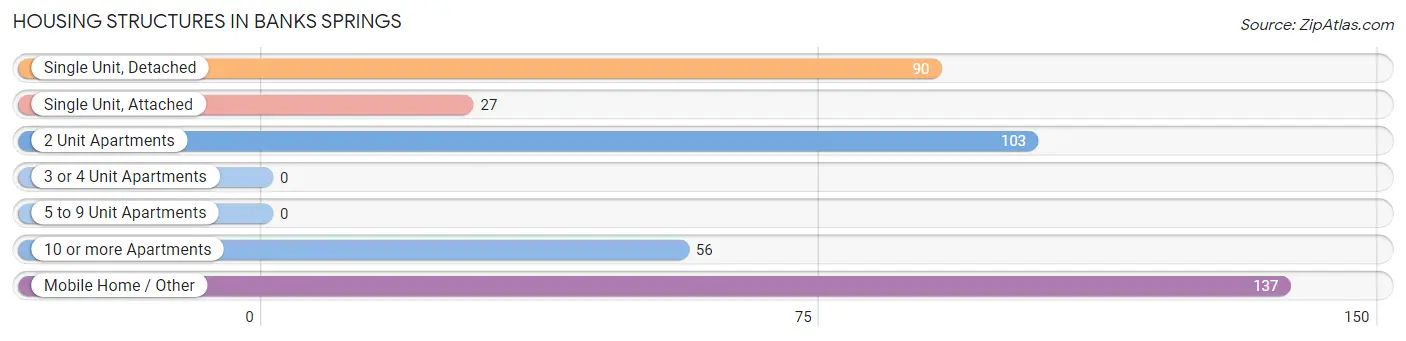
| Structure Type | # Housing Units | % Housing Units |
| Single Unit, Detached | 90 | 21.8% |
| Single Unit, Attached | 27 | 6.5% |
| 2 Unit Apartments | 103 | 24.9% |
| 3 or 4 Unit Apartments | 0 | 0.0% |
| 5 to 9 Unit Apartments | 0 | 0.0% |
| 10 or more Apartments | 56 | 13.6% |
| Mobile Home / Other | 137 | 33.2% |
| Total | 413 | 100.0% |
Housing Structures by Occupancy in Banks Springs
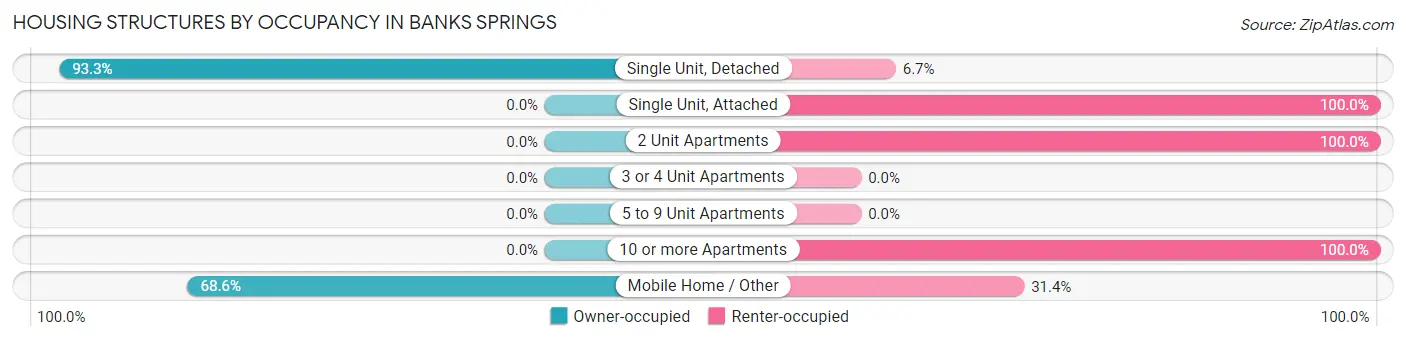
| Structure Type | Owner-occupied | Renter-occupied |
| Single Unit, Detached | 84 (93.3%) | 6 (6.7%) |
| Single Unit, Attached | 0 (0.0%) | 27 (100.0%) |
| 2 Unit Apartments | 0 (0.0%) | 103 (100.0%) |
| 3 or 4 Unit Apartments | 0 (0.0%) | 0 (0.0%) |
| 5 to 9 Unit Apartments | 0 (0.0%) | 0 (0.0%) |
| 10 or more Apartments | 0 (0.0%) | 56 (100.0%) |
| Mobile Home / Other | 94 (68.6%) | 43 (31.4%) |
| Total | 178 (43.1%) | 235 (56.9%) |
Housing Structures by Number of Rooms in Banks Springs
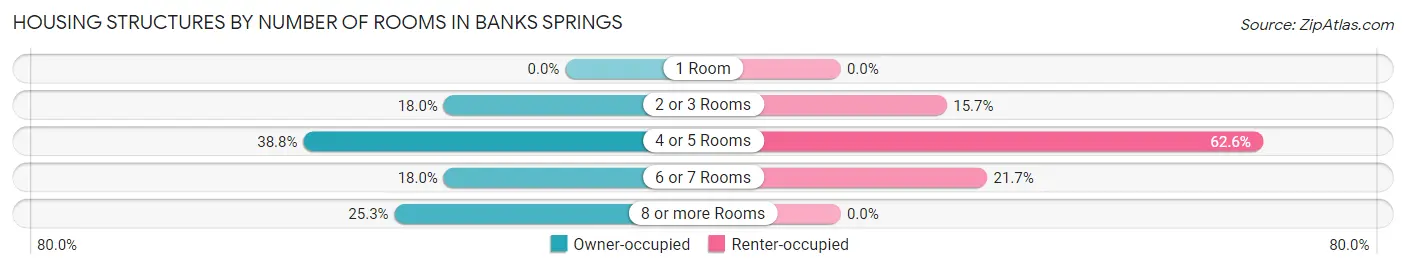
| Number of Rooms | Owner-occupied | Renter-occupied |
| 1 Room | 0 (0.0%) | 0 (0.0%) |
| 2 or 3 Rooms | 32 (18.0%) | 37 (15.7%) |
| 4 or 5 Rooms | 69 (38.8%) | 147 (62.5%) |
| 6 or 7 Rooms | 32 (18.0%) | 51 (21.7%) |
| 8 or more Rooms | 45 (25.3%) | 0 (0.0%) |
| Total | 178 (100.0%) | 235 (100.0%) |
Housing Structure by Heating Type in Banks Springs
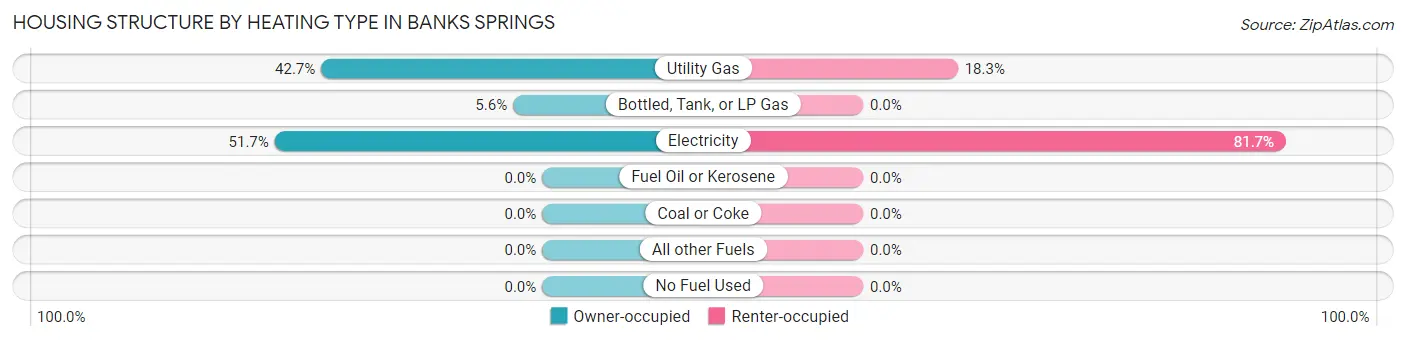
| Heating Type | Owner-occupied | Renter-occupied |
| Utility Gas | 76 (42.7%) | 43 (18.3%) |
| Bottled, Tank, or LP Gas | 10 (5.6%) | 0 (0.0%) |
| Electricity | 92 (51.7%) | 192 (81.7%) |
| Fuel Oil or Kerosene | 0 (0.0%) | 0 (0.0%) |
| Coal or Coke | 0 (0.0%) | 0 (0.0%) |
| All other Fuels | 0 (0.0%) | 0 (0.0%) |
| No Fuel Used | 0 (0.0%) | 0 (0.0%) |
| Total | 178 (100.0%) | 235 (100.0%) |
Household Vehicle Usage in Banks Springs
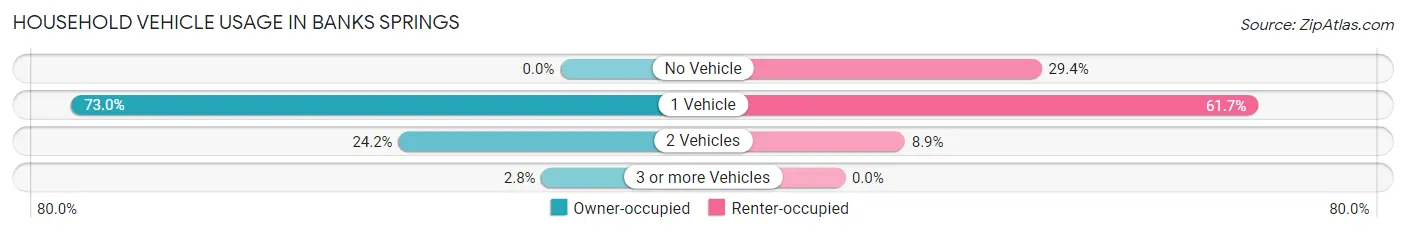
| Vehicles per Household | Owner-occupied | Renter-occupied |
| No Vehicle | 0 (0.0%) | 69 (29.4%) |
| 1 Vehicle | 130 (73.0%) | 145 (61.7%) |
| 2 Vehicles | 43 (24.2%) | 21 (8.9%) |
| 3 or more Vehicles | 5 (2.8%) | 0 (0.0%) |
| Total | 178 (100.0%) | 235 (100.0%) |
Real Estate & Mortgages in Banks Springs
Real Estate and Mortgage Overview in Banks Springs
| Characteristic | Without Mortgage | With Mortgage |
| Housing Units | 110 | 68 |
| Median Property Value | $32,900 | $84,200 |
| Median Household Income | $21,557 | $11 |
| Monthly Housing Costs | $247 | $0 |
| Real Estate Taxes | - | - |
Property Value by Mortgage Status in Banks Springs
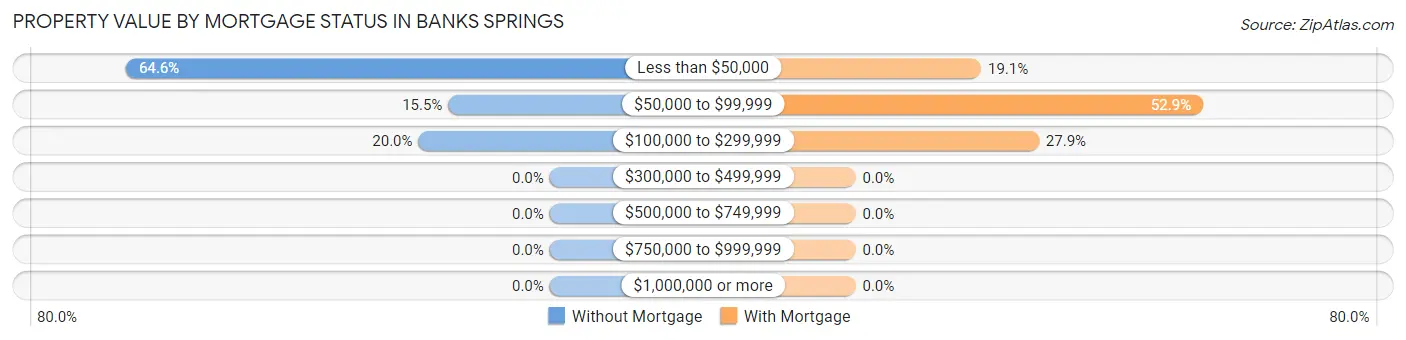
| Property Value | Without Mortgage | With Mortgage |
| Less than $50,000 | 71 (64.5%) | 13 (19.1%) |
| $50,000 to $99,999 | 17 (15.4%) | 36 (52.9%) |
| $100,000 to $299,999 | 22 (20.0%) | 19 (27.9%) |
| $300,000 to $499,999 | 0 (0.0%) | 0 (0.0%) |
| $500,000 to $749,999 | 0 (0.0%) | 0 (0.0%) |
| $750,000 to $999,999 | 0 (0.0%) | 0 (0.0%) |
| $1,000,000 or more | 0 (0.0%) | 0 (0.0%) |
| Total | 110 (100.0%) | 68 (100.0%) |
Household Income by Mortgage Status in Banks Springs
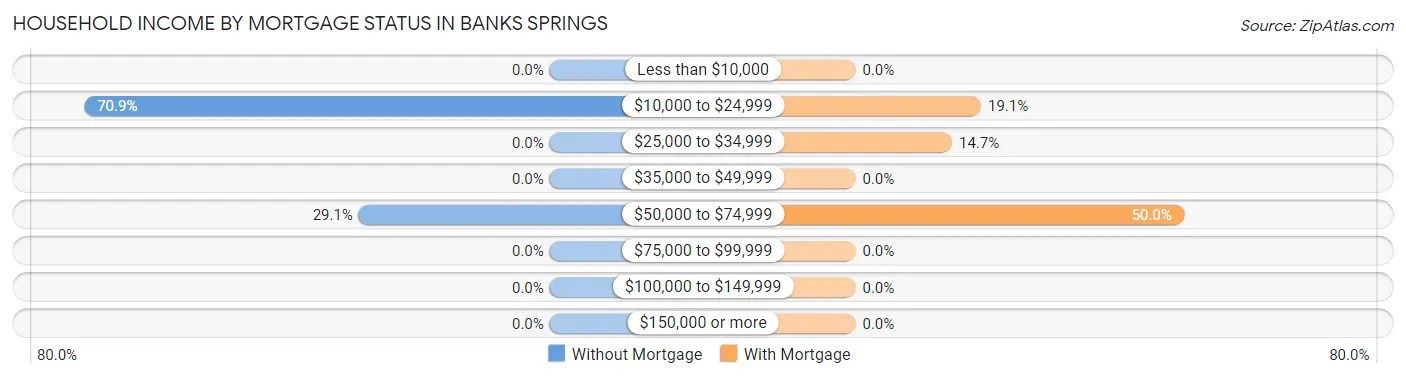
| Household Income | Without Mortgage | With Mortgage |
| Less than $10,000 | 0 (0.0%) | 0 (0.0%) |
| $10,000 to $24,999 | 78 (70.9%) | 13 (19.1%) |
| $25,000 to $34,999 | 0 (0.0%) | 10 (14.7%) |
| $35,000 to $49,999 | 0 (0.0%) | 0 (0.0%) |
| $50,000 to $74,999 | 32 (29.1%) | 34 (50.0%) |
| $75,000 to $99,999 | 0 (0.0%) | 0 (0.0%) |
| $100,000 to $149,999 | 0 (0.0%) | 0 (0.0%) |
| $150,000 or more | 0 (0.0%) | 0 (0.0%) |
| Total | 110 (100.0%) | 68 (100.0%) |
Property Value to Household Income Ratio in Banks Springs
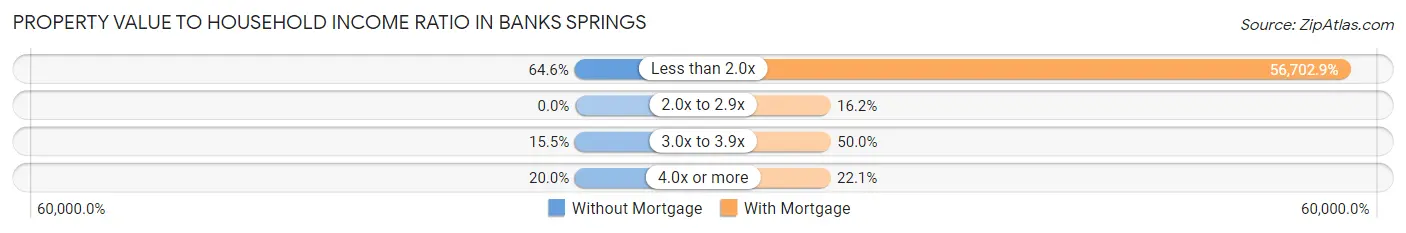
| Value-to-Income Ratio | Without Mortgage | With Mortgage |
| Less than 2.0x | 71 (64.5%) | 38,558 (56,702.9%) |
| 2.0x to 2.9x | 0 (0.0%) | 11 (16.2%) |
| 3.0x to 3.9x | 17 (15.4%) | 34 (50.0%) |
| 4.0x or more | 22 (20.0%) | 15 (22.1%) |
| Total | 110 (100.0%) | 68 (100.0%) |
Real Estate Taxes by Mortgage Status in Banks Springs
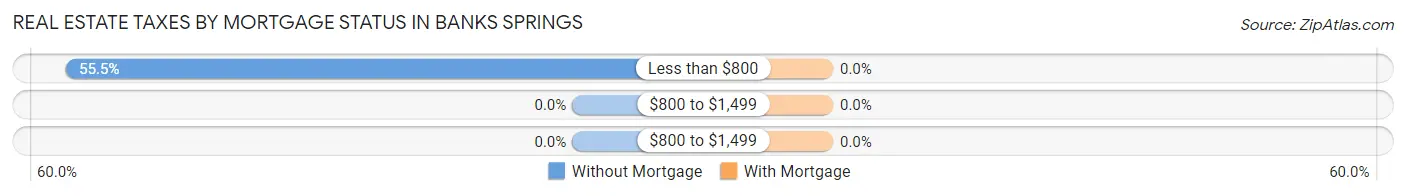
| Property Taxes | Without Mortgage | With Mortgage |
| Less than $800 | 61 (55.4%) | 0 (0.0%) |
| $800 to $1,499 | 0 (0.0%) | 0 (0.0%) |
| $800 to $1,499 | 0 (0.0%) | 0 (0.0%) |
| Total | 110 (100.0%) | 68 (100.0%) |
Health & Disability in Banks Springs
Health Insurance Coverage by Age in Banks Springs
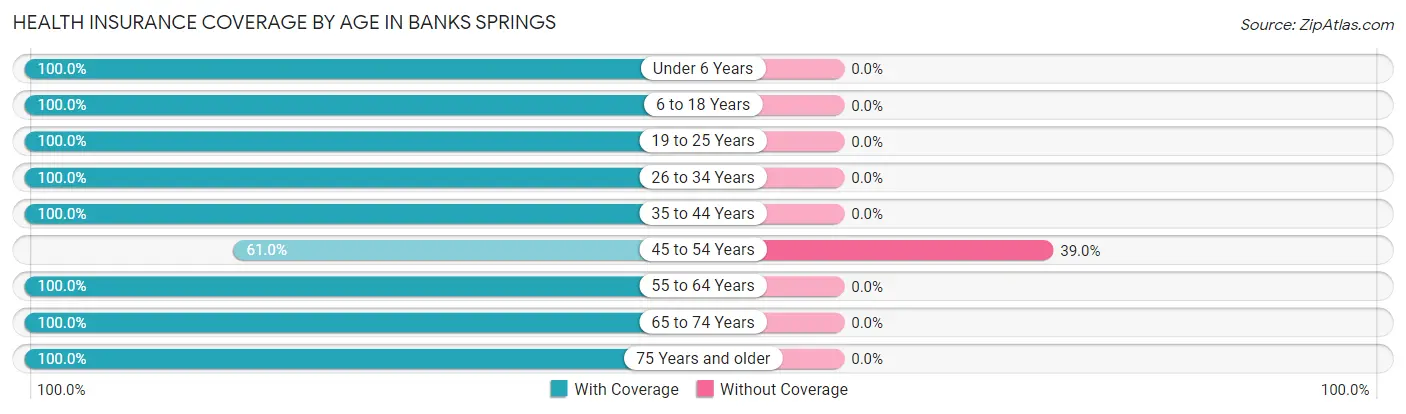
| Age Bracket | With Coverage | Without Coverage |
| Under 6 Years | 53 (100.0%) | 0 (0.0%) |
| 6 to 18 Years | 259 (100.0%) | 0 (0.0%) |
| 19 to 25 Years | 73 (100.0%) | 0 (0.0%) |
| 26 to 34 Years | 501 (100.0%) | 0 (0.0%) |
| 35 to 44 Years | 151 (100.0%) | 0 (0.0%) |
| 45 to 54 Years | 83 (61.0%) | 53 (39.0%) |
| 55 to 64 Years | 46 (100.0%) | 0 (0.0%) |
| 65 to 74 Years | 165 (100.0%) | 0 (0.0%) |
| 75 Years and older | 28 (100.0%) | 0 (0.0%) |
| Total | 1,359 (96.3%) | 53 (3.7%) |
Health Insurance Coverage by Citizenship Status in Banks Springs
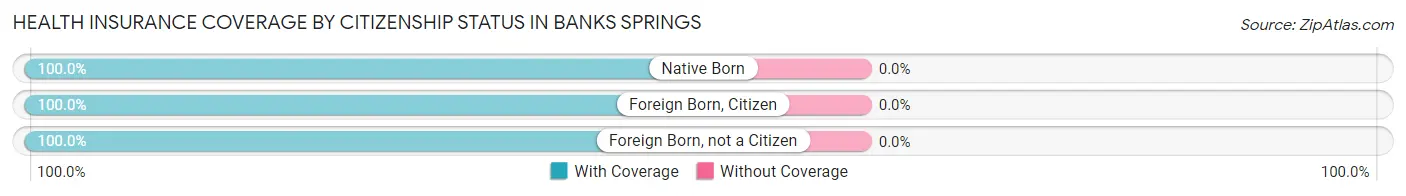
| Citizenship Status | With Coverage | Without Coverage |
| Native Born | 53 (100.0%) | 0 (0.0%) |
| Foreign Born, Citizen | 259 (100.0%) | 0 (0.0%) |
| Foreign Born, not a Citizen | 73 (100.0%) | 0 (0.0%) |
Health Insurance Coverage by Household Income in Banks Springs
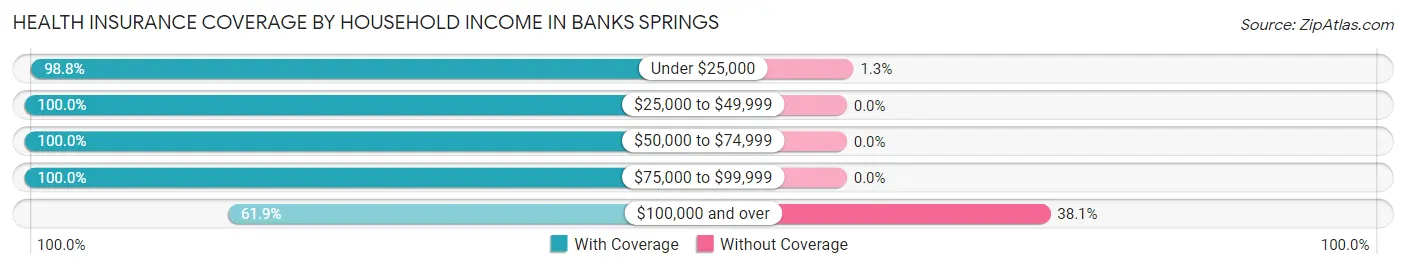
| Household Income | With Coverage | Without Coverage |
| Under $25,000 | 634 (98.8%) | 8 (1.3%) |
| $25,000 to $49,999 | 583 (100.0%) | 0 (0.0%) |
| $50,000 to $74,999 | 63 (100.0%) | 0 (0.0%) |
| $75,000 to $99,999 | 6 (100.0%) | 0 (0.0%) |
| $100,000 and over | 73 (61.9%) | 45 (38.1%) |
Public vs Private Health Insurance Coverage by Age in Banks Springs
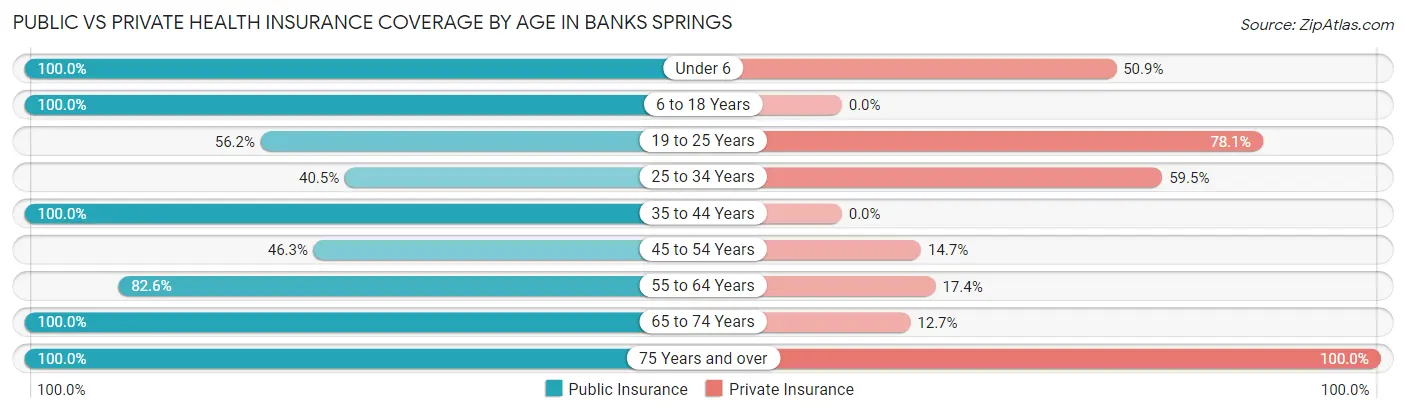
| Age Bracket | Public Insurance | Private Insurance |
| Under 6 | 53 (100.0%) | 27 (50.9%) |
| 6 to 18 Years | 259 (100.0%) | 0 (0.0%) |
| 19 to 25 Years | 41 (56.2%) | 57 (78.1%) |
| 25 to 34 Years | 203 (40.5%) | 298 (59.5%) |
| 35 to 44 Years | 151 (100.0%) | 0 (0.0%) |
| 45 to 54 Years | 63 (46.3%) | 20 (14.7%) |
| 55 to 64 Years | 38 (82.6%) | 8 (17.4%) |
| 65 to 74 Years | 165 (100.0%) | 21 (12.7%) |
| 75 Years and over | 28 (100.0%) | 28 (100.0%) |
| Total | 1,001 (70.9%) | 459 (32.5%) |
Disability Status by Sex by Age in Banks Springs
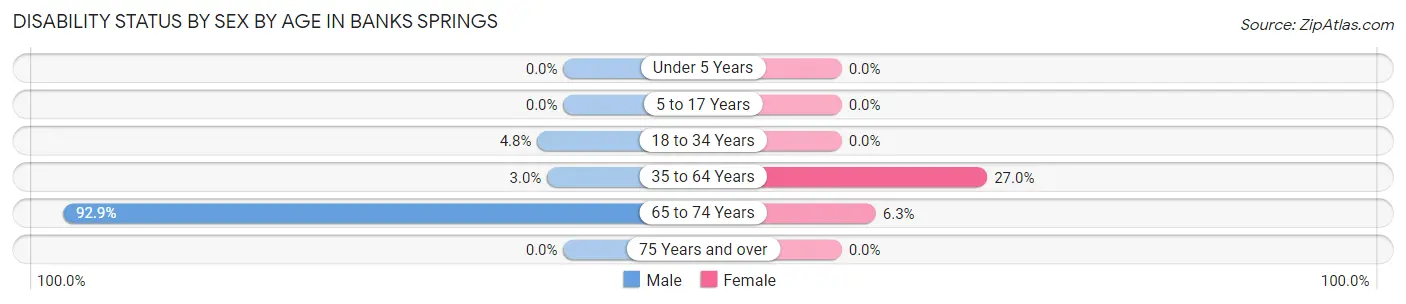
| Age Bracket | Male | Female |
| Under 5 Years | 0 (0.0%) | 0 (0.0%) |
| 5 to 17 Years | 0 (0.0%) | 0 (0.0%) |
| 18 to 34 Years | 16 (4.8%) | 0 (0.0%) |
| 35 to 64 Years | 7 (3.0%) | 27 (27.0%) |
| 65 to 74 Years | 65 (92.9%) | 6 (6.3%) |
| 75 Years and over | 0 (0.0%) | 0 (0.0%) |
Disability Class by Sex by Age in Banks Springs
Disability Class: Hearing Difficulty
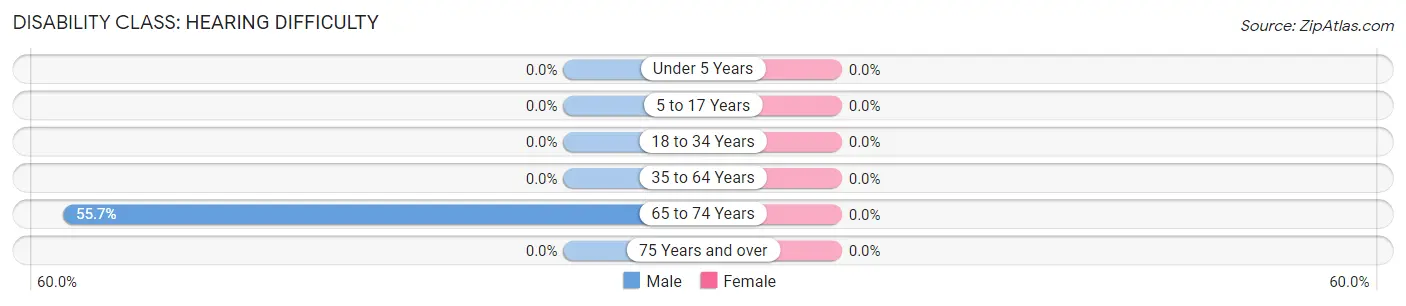
| Age Bracket | Male | Female |
| Under 5 Years | 0 (0.0%) | 0 (0.0%) |
| 5 to 17 Years | 0 (0.0%) | 0 (0.0%) |
| 18 to 34 Years | 0 (0.0%) | 0 (0.0%) |
| 35 to 64 Years | 0 (0.0%) | 0 (0.0%) |
| 65 to 74 Years | 39 (55.7%) | 0 (0.0%) |
| 75 Years and over | 0 (0.0%) | 0 (0.0%) |
Disability Class: Vision Difficulty
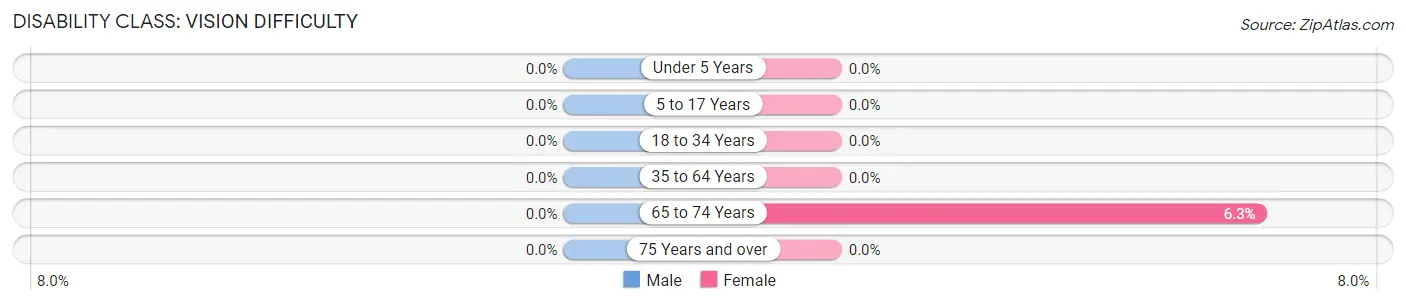
| Age Bracket | Male | Female |
| Under 5 Years | 0 (0.0%) | 0 (0.0%) |
| 5 to 17 Years | 0 (0.0%) | 0 (0.0%) |
| 18 to 34 Years | 0 (0.0%) | 0 (0.0%) |
| 35 to 64 Years | 0 (0.0%) | 0 (0.0%) |
| 65 to 74 Years | 0 (0.0%) | 6 (6.3%) |
| 75 Years and over | 0 (0.0%) | 0 (0.0%) |
Disability Class: Cognitive Difficulty
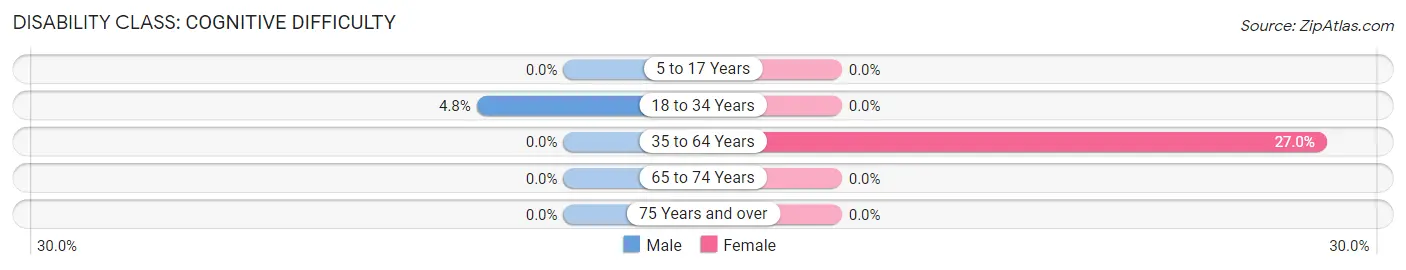
| Age Bracket | Male | Female |
| 5 to 17 Years | 0 (0.0%) | 0 (0.0%) |
| 18 to 34 Years | 16 (4.8%) | 0 (0.0%) |
| 35 to 64 Years | 0 (0.0%) | 27 (27.0%) |
| 65 to 74 Years | 0 (0.0%) | 0 (0.0%) |
| 75 Years and over | 0 (0.0%) | 0 (0.0%) |
Disability Class: Ambulatory Difficulty
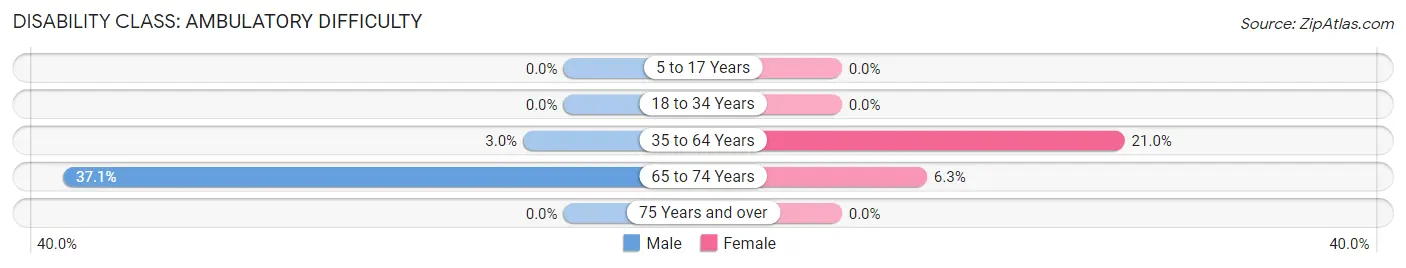
| Age Bracket | Male | Female |
| 5 to 17 Years | 0 (0.0%) | 0 (0.0%) |
| 18 to 34 Years | 0 (0.0%) | 0 (0.0%) |
| 35 to 64 Years | 7 (3.0%) | 21 (21.0%) |
| 65 to 74 Years | 26 (37.1%) | 6 (6.3%) |
| 75 Years and over | 0 (0.0%) | 0 (0.0%) |
Disability Class: Self-Care Difficulty
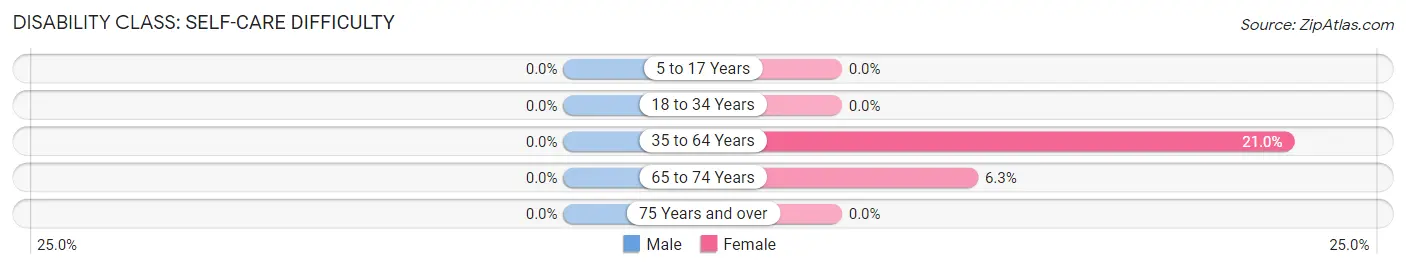
| Age Bracket | Male | Female |
| 5 to 17 Years | 0 (0.0%) | 0 (0.0%) |
| 18 to 34 Years | 0 (0.0%) | 0 (0.0%) |
| 35 to 64 Years | 0 (0.0%) | 21 (21.0%) |
| 65 to 74 Years | 0 (0.0%) | 6 (6.3%) |
| 75 Years and over | 0 (0.0%) | 0 (0.0%) |
Technology Access in Banks Springs
Computing Device Access in Banks Springs
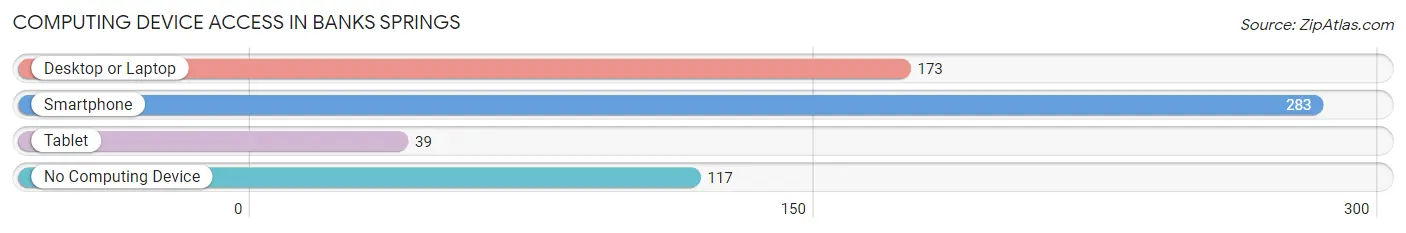
| Device Type | # Households | % Households |
| Desktop or Laptop | 173 | 41.9% |
| Smartphone | 283 | 68.5% |
| Tablet | 39 | 9.4% |
| No Computing Device | 117 | 28.3% |
| Total | 413 | 100.0% |
Internet Access in Banks Springs
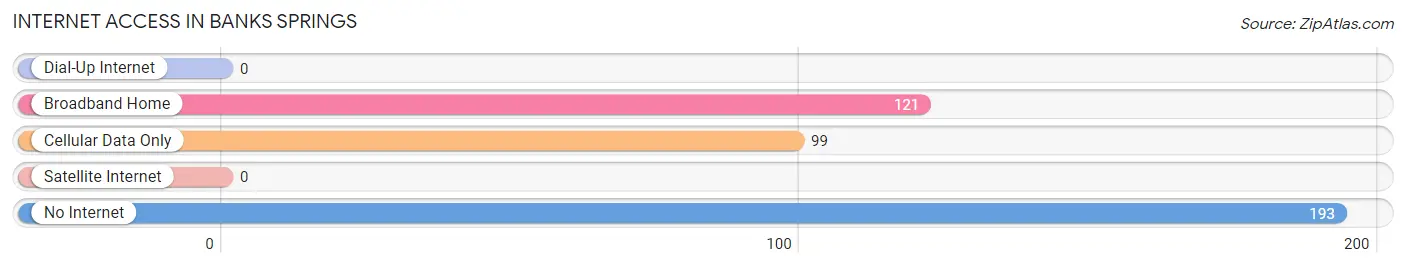
| Internet Type | # Households | % Households |
| Dial-Up Internet | 0 | 0.0% |
| Broadband Home | 121 | 29.3% |
| Cellular Data Only | 99 | 24.0% |
| Satellite Internet | 0 | 0.0% |
| No Internet | 193 | 46.7% |
| Total | 413 | 100.0% |
Banks Springs Summary
Banks Springs is a small unincorporated community located in Beauregard Parish, Louisiana. It is situated in the western part of the parish, approximately 10 miles south of DeRidder. The community is named after the nearby Banks Springs, which is a natural spring that was used by early settlers for drinking water.
History
The area around Banks Springs has been inhabited for thousands of years. Archaeological evidence suggests that Native Americans lived in the area as early as the Archaic period (8000-1000 BC). The first European settlers arrived in the area in the early 1800s. The area was originally part of the Neutral Strip, a region of disputed land between the United States and Spain. The Neutral Strip was eventually ceded to the United States in 1819.
In 1820, the area was organized into the St. Landry Parish. In 1843, the area was divided into Beauregard Parish, which included Banks Springs. The community was named after the nearby Banks Springs, which was a natural spring that was used by early settlers for drinking water.
The first post office in Banks Springs was established in 1845. The community grew slowly over the next few decades, and by the early 1900s, it had a population of around 200 people. The population remained relatively stable until the 1950s, when the population began to decline. By the 2000 census, the population had dropped to just over 100 people.
Geography
Banks Springs is located in western Beauregard Parish, approximately 10 miles south of DeRidder. The community is situated on the banks of the Sabine River, which forms the border between Louisiana and Texas. The area is mostly flat, with some rolling hills in the surrounding area. The climate is humid subtropical, with hot summers and mild winters.
Economy
The economy of Banks Springs is largely based on agriculture. The area is known for its production of cotton, soybeans, and other crops. The area is also home to several timber companies, which harvest the area’s abundant pine forests.
In addition to agriculture, the area is home to several small businesses, including a gas station, a convenience store, and a few restaurants. The area is also home to a few small manufacturing companies, which produce a variety of products, including furniture and clothing.
Demographics
As of the 2000 census, the population of Banks Springs was 106 people. The racial makeup of the community was 97.2% White, 0.9% African American, 0.9% Native American, and 0.9% from other races. The median household income was $25,625, and the median family income was $30,000. The per capita income was $13,929.
The population of Banks Springs is largely rural, with most of the population living in small, rural communities. The area is home to a few small churches, and the community is served by the Beauregard Parish School District.
Conclusion
Banks Springs is a small unincorporated community located in Beauregard Parish, Louisiana. The area has a long history, dating back to the early 1800s. The economy of the area is largely based on agriculture, with some small businesses and manufacturing companies. The population of Banks Springs is largely rural, with a median household income of $25,625. The area is served by the Beauregard Parish School District.
Common Questions
What is Per Capita Income in Banks Springs?
Per Capita income in Banks Springs is $16,882.
What is the Median Household income in Banks Springs?
Median Household Income in Banks Springs is $24,656.
What is Family Income Deficit in Banks Springs?
Family Income Deficit in Banks Springs is $20,485.
Families that are below poverty line in Banks Springs earn $20,485 less on average than the poverty threshold level.
What is Inequality or Gini Index in Banks Springs?
Inequality or Gini Index in Banks Springs is 0.45.
What is the Total Population of Banks Springs?
Total Population of Banks Springs is 1,485.
What is the Total Male Population of Banks Springs?
Total Male Population of Banks Springs is 865.
What is the Total Female Population of Banks Springs?
Total Female Population of Banks Springs is 620.
What is the Ratio of Males per 100 Females in Banks Springs?
There are 139.52 Males per 100 Females in Banks Springs.
What is the Ratio of Females per 100 Males in Banks Springs?
There are 71.68 Females per 100 Males in Banks Springs.
What is the Median Population Age in Banks Springs?
Median Population Age in Banks Springs is 30.1 Years.
What is the Average Family Size in Banks Springs
Average Family Size in Banks Springs is 4.8 People.
What is the Average Household Size in Banks Springs
Average Household Size in Banks Springs is 3.4 People.
How Large is the Labor Force in Banks Springs?
There are 677 People in the Labor Forcein in Banks Springs.
What is the Percentage of People in the Labor Force in Banks Springs?
57.7% of People are in the Labor Force in Banks Springs.
What is the Unemployment Rate in Banks Springs?
Unemployment Rate in Banks Springs is 19.1%.