Baldwin, LA Map & Demographics
Baldwin Map
Baldwin Overview
$19,550
PER CAPITA INCOME
$42,887
AVG FAMILY INCOME
$29,473
AVG HOUSEHOLD INCOME
19.4%
WAGE / INCOME GAP [ % ]
80.6¢/ $1
WAGE / INCOME GAP [ $ ]
0.48
INEQUALITY / GINI INDEX
2,065
TOTAL POPULATION
1,115
MALE POPULATION
950
FEMALE POPULATION
117.37
MALES / 100 FEMALES
85.20
FEMALES / 100 MALES
37.6
MEDIAN AGE
3.6
AVG FAMILY SIZE
2.8
AVG HOUSEHOLD SIZE
530
LABOR FORCE [ PEOPLE ]
28.7%
PERCENT IN LABOR FORCE
0.8%
UNEMPLOYMENT RATE
Baldwin Zip Codes
Baldwin Area Codes
Income in Baldwin
Income Overview in Baldwin
Per Capita Income in Baldwin is $19,550, while median incomes of families and households are $42,887 and $29,473 respectively.
| Characteristic | Number | Measure |
| Per Capita Income | 2,065 | $19,550 |
| Median Family Income | 453 | $42,887 |
| Mean Family Income | 453 | $56,273 |
| Median Household Income | 747 | $29,473 |
| Mean Household Income | 747 | $47,046 |
| Income Deficit | 453 | $0 |
| Wage / Income Gap (%) | 2,065 | 19.42% |
| Wage / Income Gap ($) | 2,065 | 80.58¢ per $1 |
| Gini / Inequality Index | 2,065 | 0.48 |
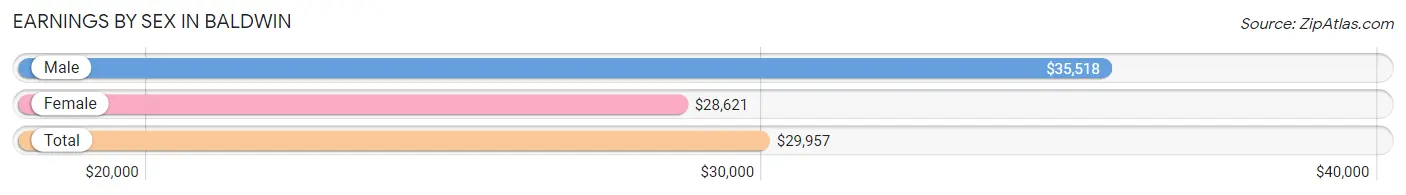
Earnings by Sex in Baldwin
Average Earnings in Baldwin are $29,957, $35,518 for men and $28,621 for women, a difference of 19.4%.
| Sex | Number | Average Earnings |
| Male | 395 (62.0%) | $35,518 |
| Female | 242 (38.0%) | $28,621 |
| Total | 637 (100.0%) | $29,957 |
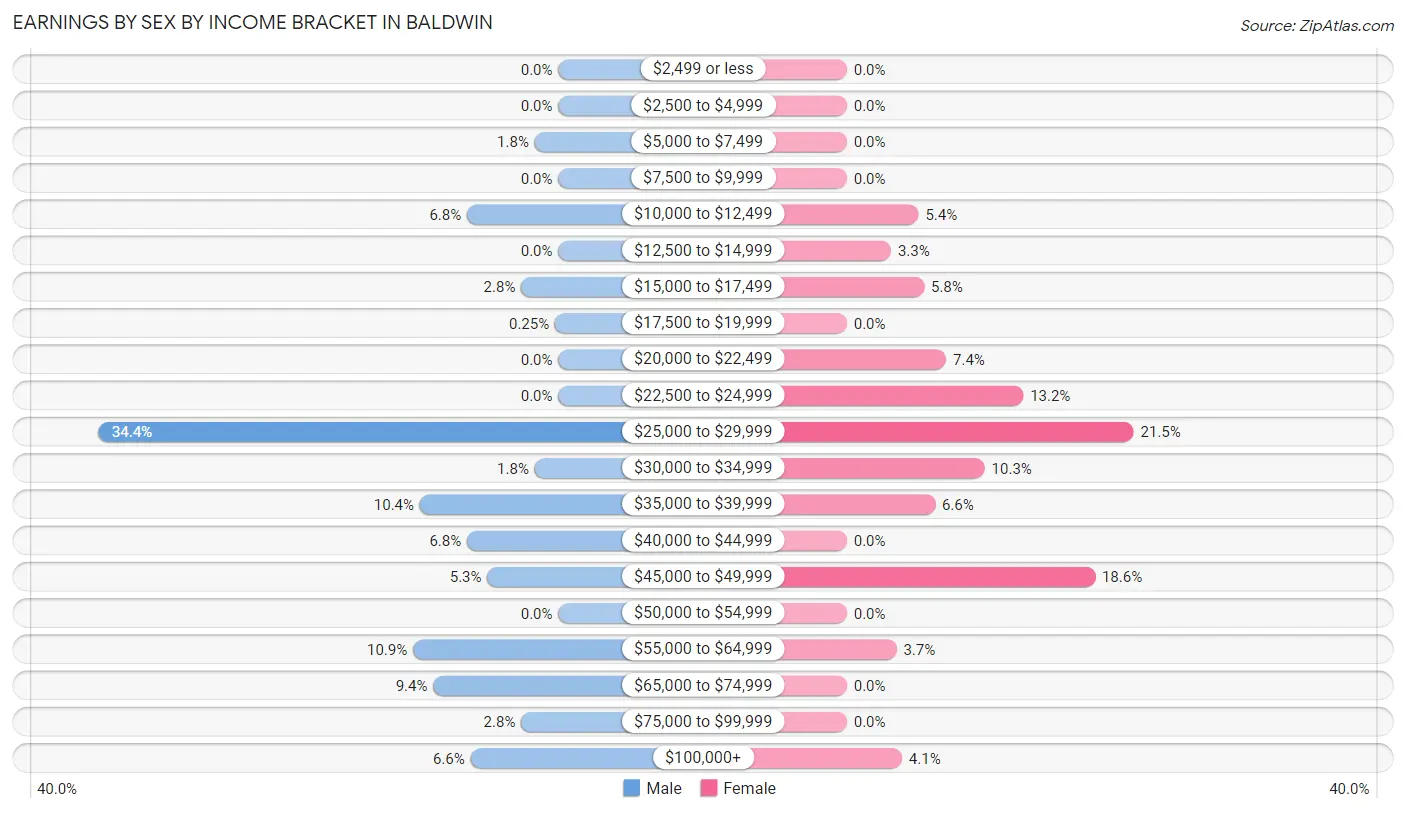
Earnings by Sex by Income Bracket in Baldwin
The most common earnings brackets in Baldwin are $25,000 to $29,999 for men (136 | 34.4%) and $25,000 to $29,999 for women (52 | 21.5%).
| Income | Male | Female |
| $2,499 or less | 0 (0.0%) | 0 (0.0%) |
| $2,500 to $4,999 | 0 (0.0%) | 0 (0.0%) |
| $5,000 to $7,499 | 7 (1.8%) | 0 (0.0%) |
| $7,500 to $9,999 | 0 (0.0%) | 0 (0.0%) |
| $10,000 to $12,499 | 27 (6.8%) | 13 (5.4%) |
| $12,500 to $14,999 | 0 (0.0%) | 8 (3.3%) |
| $15,000 to $17,499 | 11 (2.8%) | 14 (5.8%) |
| $17,500 to $19,999 | 1 (0.3%) | 0 (0.0%) |
| $20,000 to $22,499 | 0 (0.0%) | 18 (7.4%) |
| $22,500 to $24,999 | 0 (0.0%) | 32 (13.2%) |
| $25,000 to $29,999 | 136 (34.4%) | 52 (21.5%) |
| $30,000 to $34,999 | 7 (1.8%) | 25 (10.3%) |
| $35,000 to $39,999 | 41 (10.4%) | 16 (6.6%) |
| $40,000 to $44,999 | 27 (6.8%) | 0 (0.0%) |
| $45,000 to $49,999 | 21 (5.3%) | 45 (18.6%) |
| $50,000 to $54,999 | 0 (0.0%) | 0 (0.0%) |
| $55,000 to $64,999 | 43 (10.9%) | 9 (3.7%) |
| $65,000 to $74,999 | 37 (9.4%) | 0 (0.0%) |
| $75,000 to $99,999 | 11 (2.8%) | 0 (0.0%) |
| $100,000+ | 26 (6.6%) | 10 (4.1%) |
| Total | 395 (100.0%) | 242 (100.0%) |
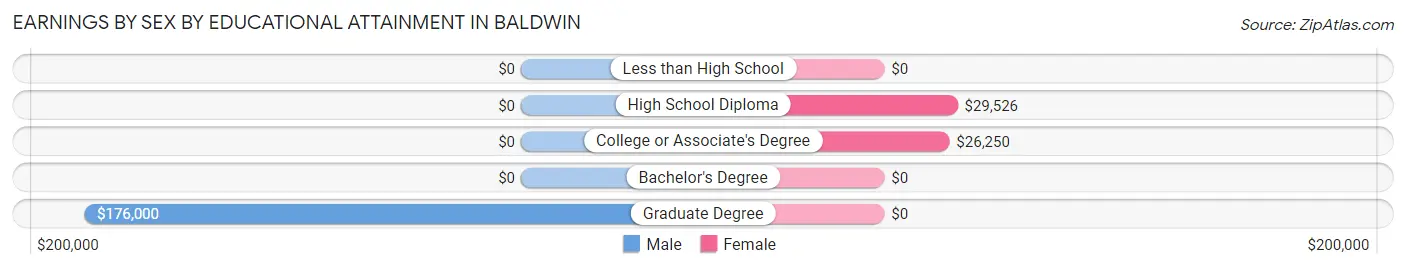
Earnings by Sex by Educational Attainment in Baldwin
Average earnings in Baldwin are $36,829 for men and $29,612 for women, a difference of 19.6%. Men with an educational attainment of graduate degree enjoy the highest average annual earnings of $176,000, while those with graduate degree education earn the least with $176,000. Women with an educational attainment of high school diploma earn the most with the average annual earnings of $29,526, while those with college or associate's degree education have the smallest earnings of $26,250.
| Educational Attainment | Male Income | Female Income |
| Less than High School | - | - |
| High School Diploma | - | - |
| College or Associate's Degree | - | - |
| Bachelor's Degree | - | - |
| Graduate Degree | $176,000 | $0 |
| Total | $36,829 | $29,612 |
Family Income in Baldwin
Family Income Brackets in Baldwin
According to the Baldwin family income data, there are 100 families falling into the $10,000 to $14,999 income range, which is the most common income bracket and makes up 22.1% of all families. Conversely, the $150,000 to $199,999 income bracket is the least frequent group with only 5 families (1.1%) belonging to this category.
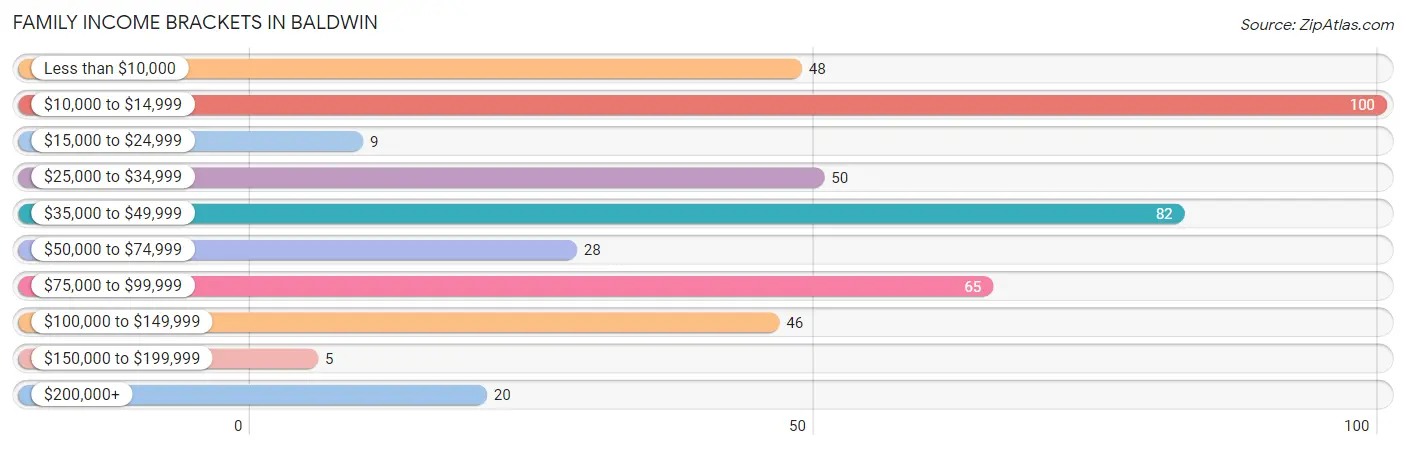
| Income Bracket | # Families | % Families |
| Less than $10,000 | 48 | 10.6% |
| $10,000 to $14,999 | 100 | 22.1% |
| $15,000 to $24,999 | 9 | 2.0% |
| $25,000 to $34,999 | 50 | 11.0% |
| $35,000 to $49,999 | 82 | 18.1% |
| $50,000 to $74,999 | 28 | 6.2% |
| $75,000 to $99,999 | 65 | 14.3% |
| $100,000 to $149,999 | 46 | 10.2% |
| $150,000 to $199,999 | 5 | 1.1% |
| $200,000+ | 20 | 4.4% |
Family Income by Famaliy Size in Baldwin
3-person families (98 | 21.6%) account for the highest median family income in Baldwin with $90,303 per family, while 3-person families (98 | 21.6%) have the highest median income of $30,101 per family member.
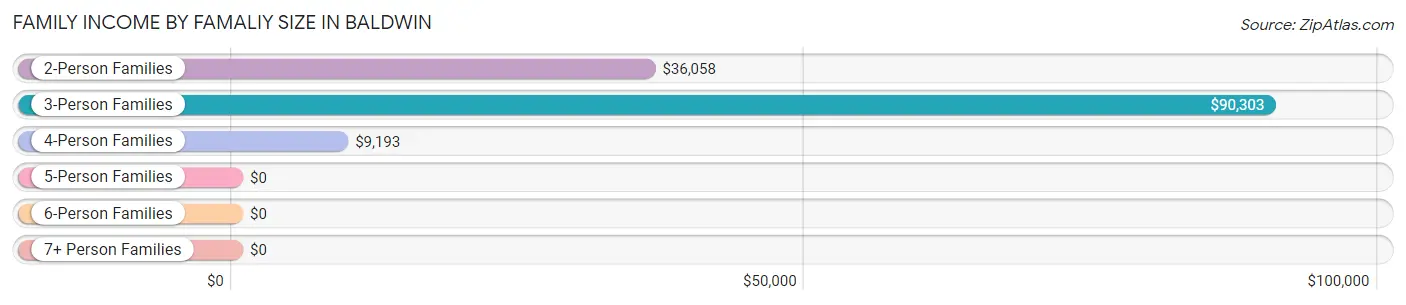
| Income Bracket | # Families | Median Income |
| 2-Person Families | 273 (60.3%) | $36,058 |
| 3-Person Families | 98 (21.6%) | $90,303 |
| 4-Person Families | 65 (14.3%) | $9,193 |
| 5-Person Families | 17 (3.7%) | $0 |
| 6-Person Families | 0 (0.0%) | $0 |
| 7+ Person Families | 0 (0.0%) | $0 |
| Total | 453 (100.0%) | $42,887 |
Family Income by Number of Earners in Baldwin
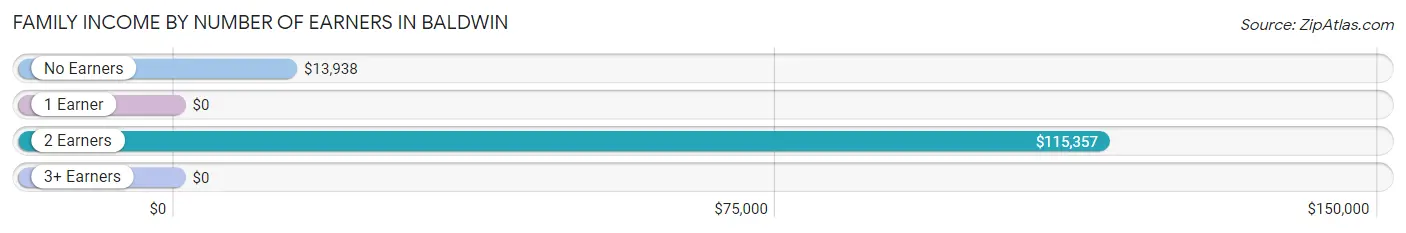
| Number of Earners | # Families | Median Income |
| No Earners | 211 (46.6%) | $13,938 |
| 1 Earner | 130 (28.7%) | $0 |
| 2 Earners | 112 (24.7%) | $115,357 |
| 3+ Earners | 0 (0.0%) | $0 |
| Total | 453 (100.0%) | $42,887 |
Household Income in Baldwin
Household Income Brackets in Baldwin
With 188 households falling in the category, the $25,000 to $34,999 income range is the most frequent in Baldwin, accounting for 25.2% of all households. In contrast, only 5 households (0.7%) fall into the $150,000 to $199,999 income bracket, making it the least populous group.
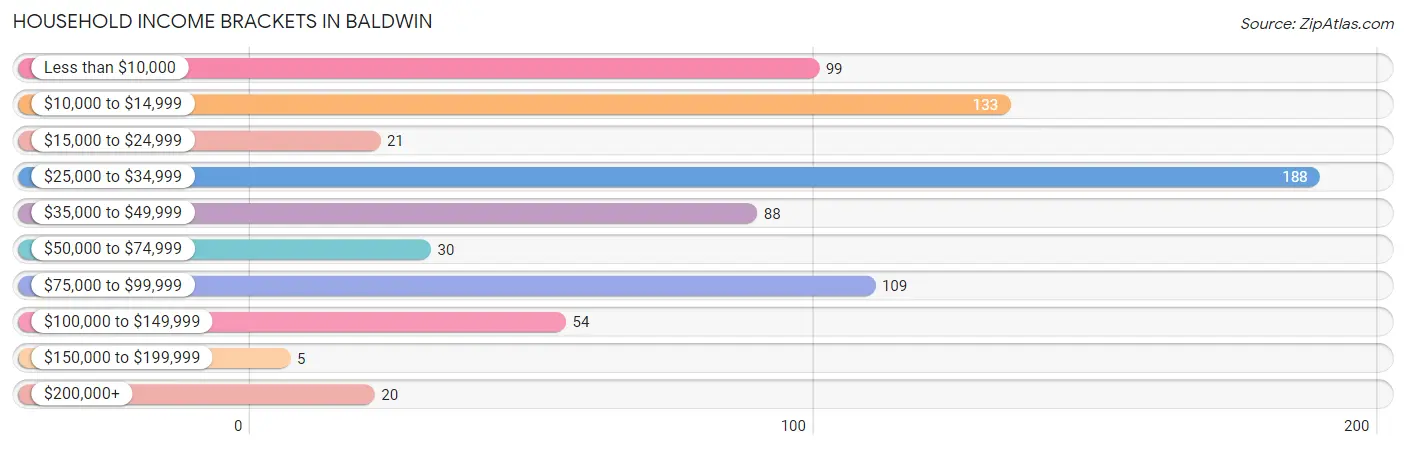
| Income Bracket | # Households | % Households |
| Less than $10,000 | 99 | 13.3% |
| $10,000 to $14,999 | 133 | 17.8% |
| $15,000 to $24,999 | 21 | 2.8% |
| $25,000 to $34,999 | 188 | 25.2% |
| $35,000 to $49,999 | 88 | 11.8% |
| $50,000 to $74,999 | 30 | 4.0% |
| $75,000 to $99,999 | 109 | 14.6% |
| $100,000 to $149,999 | 54 | 7.2% |
| $150,000 to $199,999 | 5 | 0.7% |
| $200,000+ | 20 | 2.7% |
Household Income by Householder Age in Baldwin
The median household income in Baldwin is $29,473, with the highest median household income of $42,721 found in the 65+ years age bracket for the primary householder. A total of 153 households (20.5%) fall into this category. Meanwhile, the 15 to 24 years age bracket for the primary householder has the lowest median household income of $0, with 19 households (2.5%) in this group.
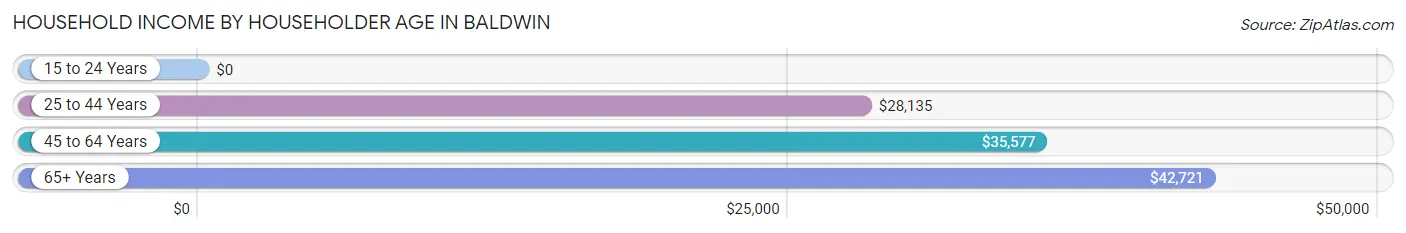
| Income Bracket | # Households | Median Income |
| 15 to 24 Years | 19 (2.5%) | $0 |
| 25 to 44 Years | 265 (35.5%) | $28,135 |
| 45 to 64 Years | 310 (41.5%) | $35,577 |
| 65+ Years | 153 (20.5%) | $42,721 |
| Total | 747 (100.0%) | $29,473 |
Poverty in Baldwin
Income Below Poverty by Sex and Age in Baldwin
With 39.6% poverty level for males and 41.4% for females among the residents of Baldwin, 75 year old and over males and 25 to 34 year old females are the most vulnerable to poverty, with 42 males (79.2%) and 223 females (96.1%) in their respective age groups living below the poverty level.
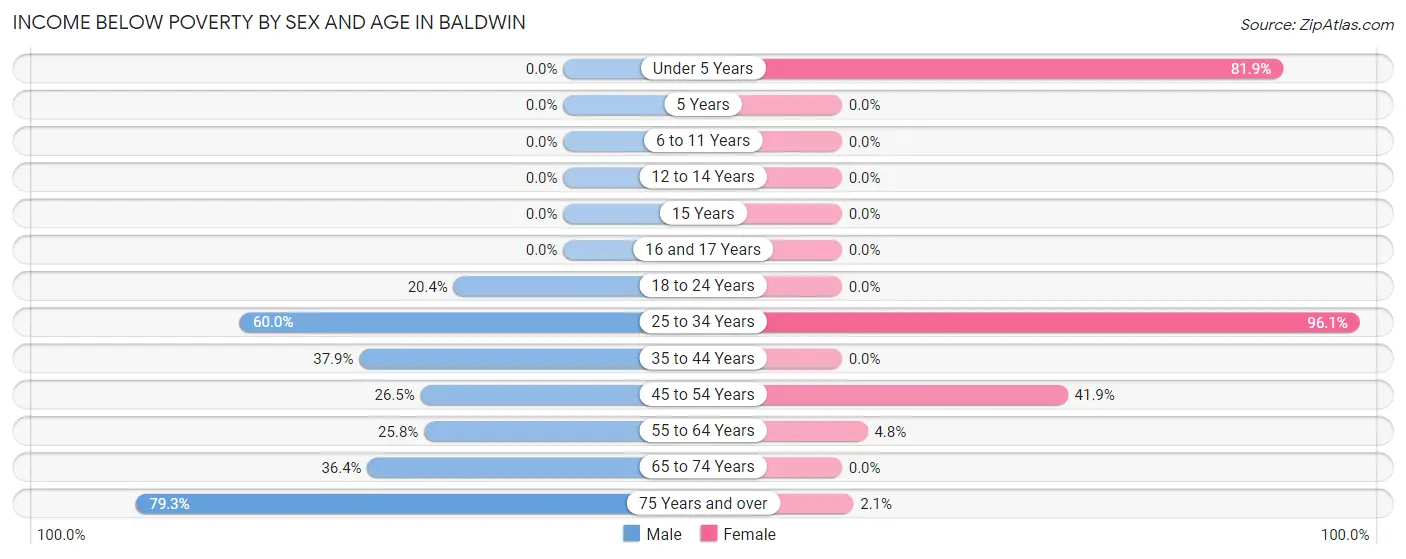
| Age Bracket | Male | Female |
| Under 5 Years | 0 (0.0%) | 104 (81.9%) |
| 5 Years | 0 (0.0%) | 0 (0.0%) |
| 6 to 11 Years | 0 (0.0%) | 0 (0.0%) |
| 12 to 14 Years | 0 (0.0%) | 0 (0.0%) |
| 15 Years | 0 (0.0%) | 0 (0.0%) |
| 16 and 17 Years | 0 (0.0%) | 0 (0.0%) |
| 18 to 24 Years | 23 (20.3%) | 0 (0.0%) |
| 25 to 34 Years | 168 (60.0%) | 223 (96.1%) |
| 35 to 44 Years | 100 (37.9%) | 0 (0.0%) |
| 45 to 54 Years | 22 (26.5%) | 57 (41.9%) |
| 55 to 64 Years | 46 (25.8%) | 8 (4.8%) |
| 65 to 74 Years | 40 (36.4%) | 0 (0.0%) |
| 75 Years and over | 42 (79.2%) | 1 (2.1%) |
| Total | 441 (39.6%) | 393 (41.4%) |
Income Above Poverty by Sex and Age in Baldwin
According to the poverty statistics in Baldwin, males aged under 5 years and females aged 6 to 11 years are the age groups that are most secure financially, with 100.0% of males and 100.0% of females in these age groups living above the poverty line.
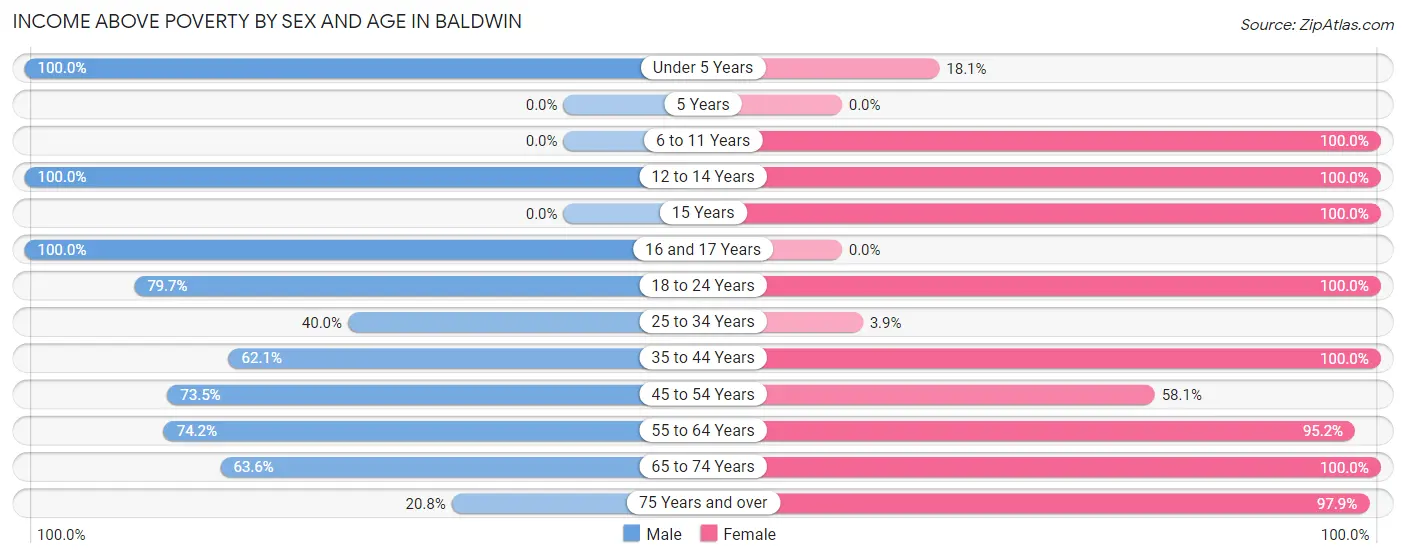
| Age Bracket | Male | Female |
| Under 5 Years | 8 (100.0%) | 23 (18.1%) |
| 5 Years | 0 (0.0%) | 0 (0.0%) |
| 6 to 11 Years | 0 (0.0%) | 29 (100.0%) |
| 12 to 14 Years | 14 (100.0%) | 29 (100.0%) |
| 15 Years | 0 (0.0%) | 12 (100.0%) |
| 16 and 17 Years | 12 (100.0%) | 0 (0.0%) |
| 18 to 24 Years | 90 (79.6%) | 66 (100.0%) |
| 25 to 34 Years | 112 (40.0%) | 9 (3.9%) |
| 35 to 44 Years | 164 (62.1%) | 75 (100.0%) |
| 45 to 54 Years | 61 (73.5%) | 79 (58.1%) |
| 55 to 64 Years | 132 (74.2%) | 160 (95.2%) |
| 65 to 74 Years | 70 (63.6%) | 29 (100.0%) |
| 75 Years and over | 11 (20.7%) | 46 (97.9%) |
| Total | 674 (60.5%) | 557 (58.6%) |
Income Below Poverty Among Married-Couple Families in Baldwin
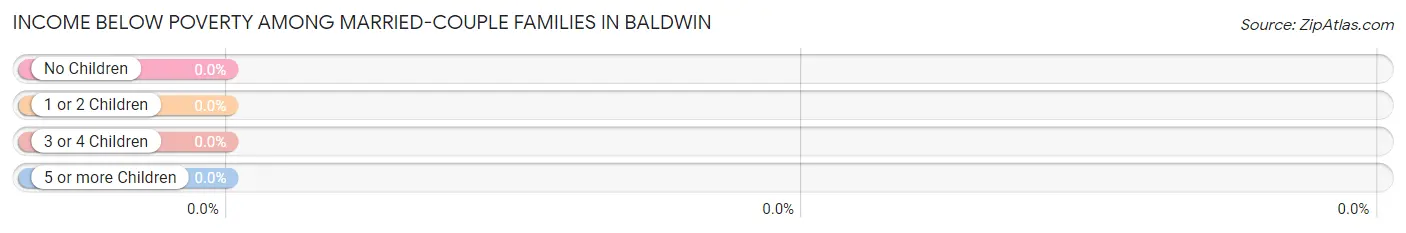
| Children | Above Poverty | Below Poverty |
| No Children | 151 (100.0%) | 0 (0.0%) |
| 1 or 2 Children | 20 (100.0%) | 0 (0.0%) |
| 3 or 4 Children | 0 (0.0%) | 0 (0.0%) |
| 5 or more Children | 0 (0.0%) | 0 (0.0%) |
| Total | 171 (100.0%) | 0 (0.0%) |
Income Below Poverty Among Single-Parent Households in Baldwin
According to the poverty data in Baldwin, 77.5% or 100 single-father households and 31.4% or 48 single-mother households are living below the poverty line. Among single-father households, those with no children have the highest poverty rate, with 100 households (77.5%) experiencing poverty. Likewise, among single-mother households, those with 1 or 2 children have the highest poverty rate, with 48 households (55.2%) falling below the poverty line.
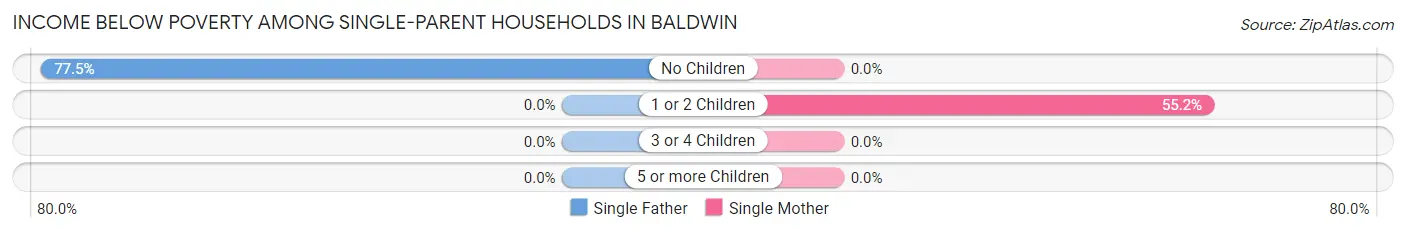
| Children | Single Father | Single Mother |
| No Children | 100 (77.5%) | 0 (0.0%) |
| 1 or 2 Children | 0 (0.0%) | 48 (55.2%) |
| 3 or 4 Children | 0 (0.0%) | 0 (0.0%) |
| 5 or more Children | 0 (0.0%) | 0 (0.0%) |
| Total | 100 (77.5%) | 48 (31.4%) |
Income Below Poverty Among Married-Couple vs Single-Parent Households in Baldwin
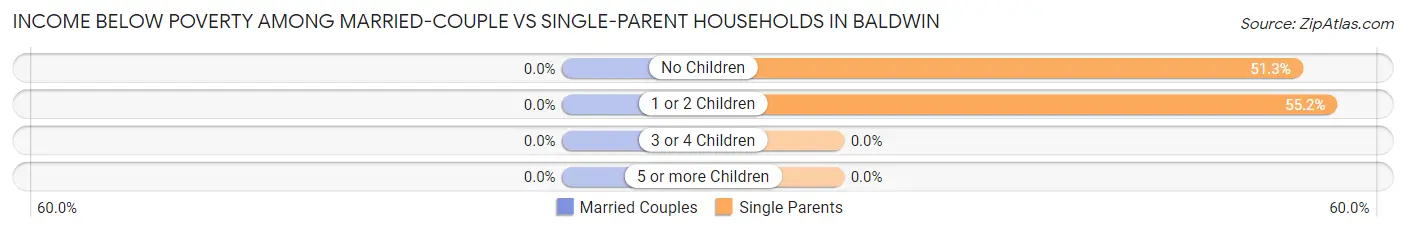
| Children | Married-Couple Families | Single-Parent Households |
| No Children | 0 (0.0%) | 100 (51.3%) |
| 1 or 2 Children | 0 (0.0%) | 48 (55.2%) |
| 3 or 4 Children | 0 (0.0%) | 0 (0.0%) |
| 5 or more Children | 0 (0.0%) | 0 (0.0%) |
| Total | 0 (0.0%) | 148 (52.5%) |
Race in Baldwin
The most populous races in Baldwin are Black / African American (1,690 | 81.8%), White / Caucasian (367 | 17.8%), and Two or more Races (8 | 0.4%).
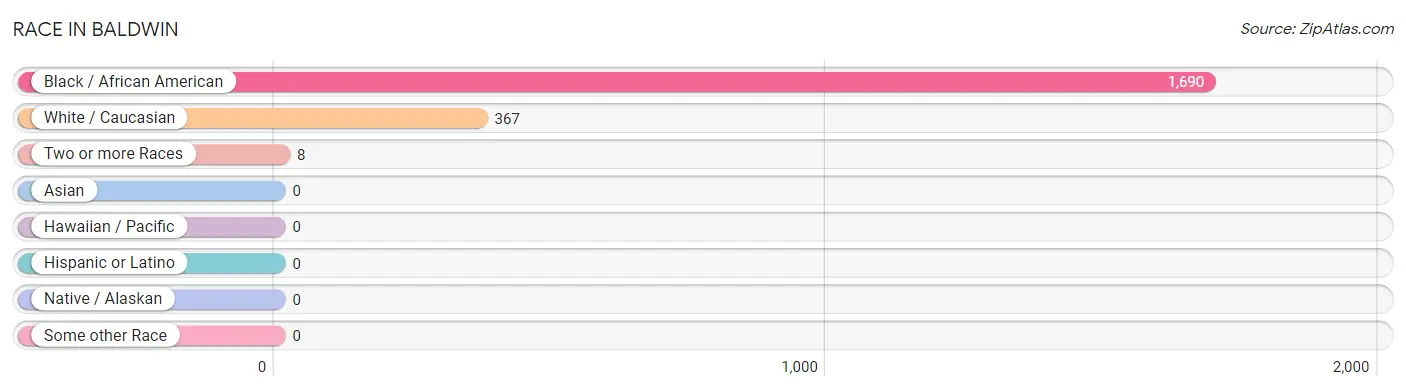
| Race | # Population | % Population |
| Asian | 0 | 0.0% |
| Black / African American | 1,690 | 81.8% |
| Hawaiian / Pacific | 0 | 0.0% |
| Hispanic or Latino | 0 | 0.0% |
| Native / Alaskan | 0 | 0.0% |
| White / Caucasian | 367 | 17.8% |
| Two or more Races | 8 | 0.4% |
| Some other Race | 0 | 0.0% |
| Total | 2,065 | 100.0% |
Ancestry in Baldwin
The most populous ancestries reported in Baldwin are Subsaharan African (217 | 10.5%), African (216 | 10.5%), French (19 | 0.9%), English (10 | 0.5%), and Irish (9 | 0.4%), together accounting for 22.8% of all Baldwin residents.
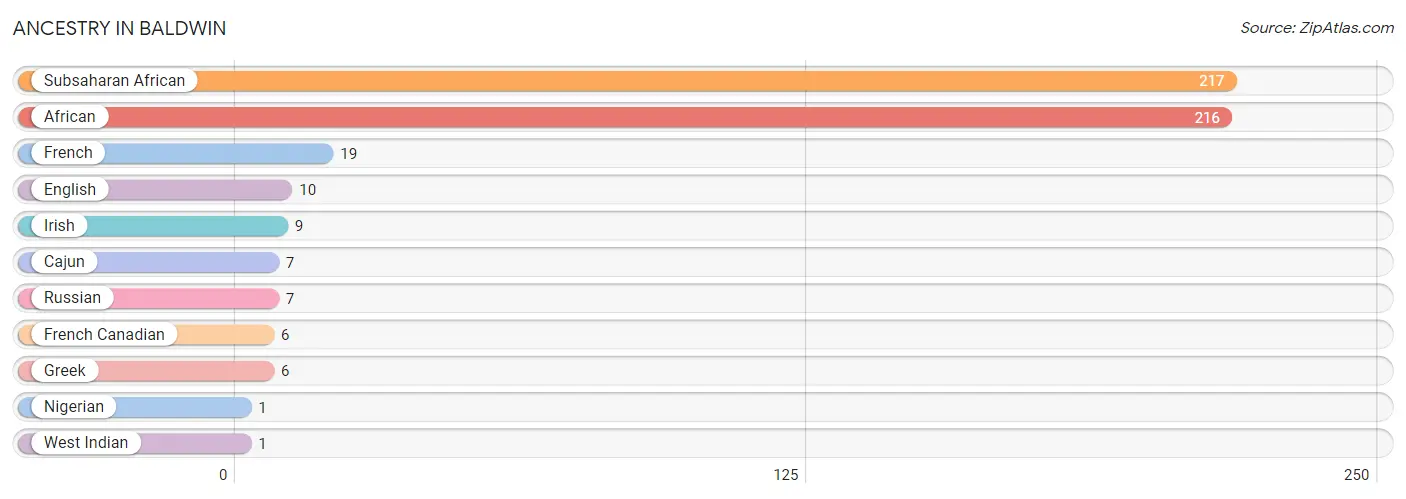
| Ancestry | # Population | % Population |
| African | 216 | 10.5% |
| Cajun | 7 | 0.3% |
| English | 10 | 0.5% |
| French | 19 | 0.9% |
| French Canadian | 6 | 0.3% |
| Greek | 6 | 0.3% |
| Irish | 9 | 0.4% |
| Nigerian | 1 | 0.1% |
| Russian | 7 | 0.3% |
| Subsaharan African | 217 | 10.5% |
| West Indian | 1 | 0.1% | View All 11 Rows |
Immigrants in Baldwin
The most numerous immigrant groups reported in Baldwin came from Africa (1 | 0.1%), Belize (1 | 0.1%), Central America (1 | 0.1%), Latin America (1 | 0.1%), and Nigeria (1 | 0.1%), together accounting for 0.3% of all Baldwin residents.
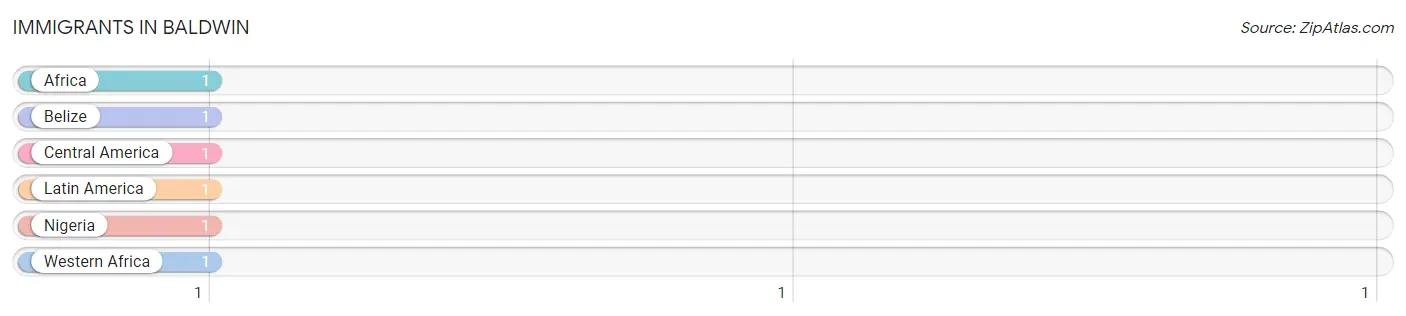
| Immigration Origin | # Population | % Population |
| Africa | 1 | 0.1% |
| Belize | 1 | 0.1% |
| Central America | 1 | 0.1% |
| Latin America | 1 | 0.1% |
| Nigeria | 1 | 0.1% |
| Western Africa | 1 | 0.1% | View All 6 Rows |
Sex and Age in Baldwin
Sex and Age in Baldwin
The most populous age groups in Baldwin are 30 to 34 Years (245 | 22.0%) for men and 25 to 29 Years (228 | 24.0%) for women.
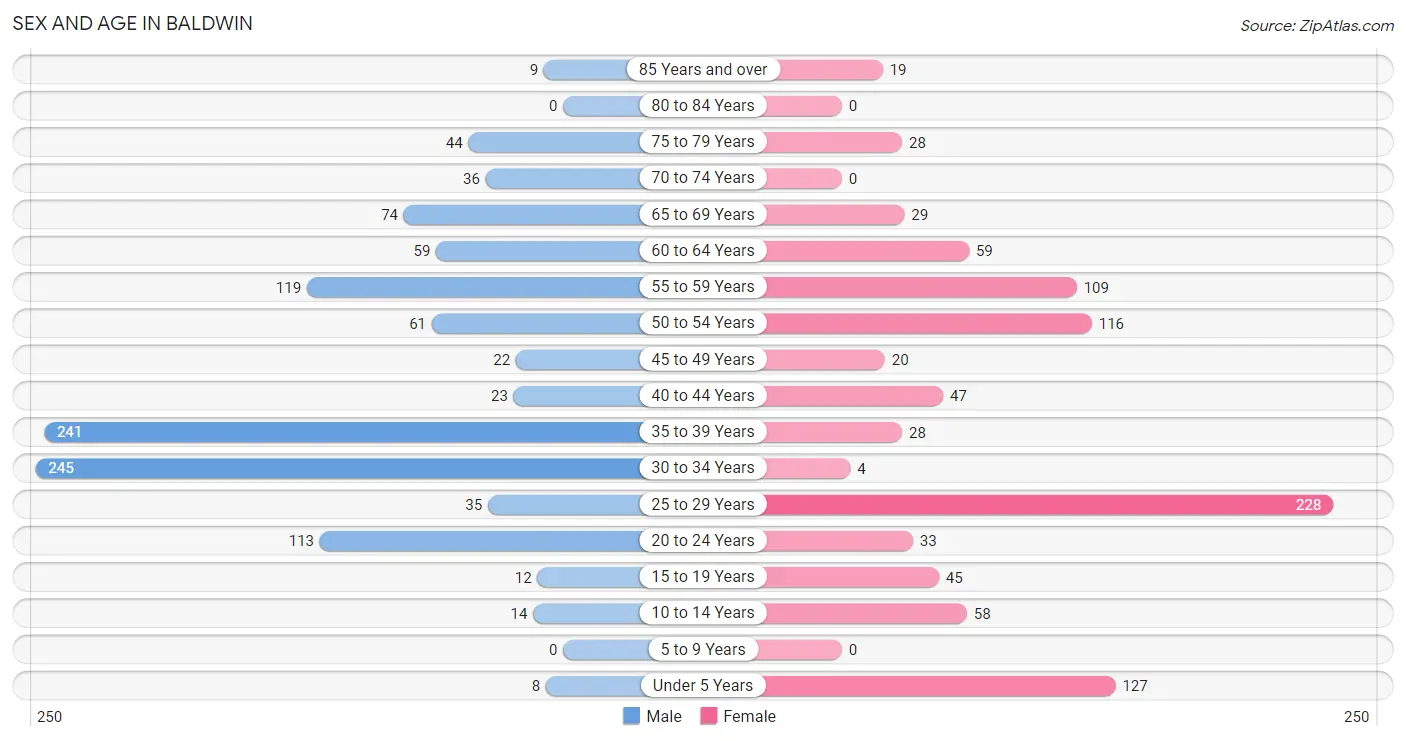
| Age Bracket | Male | Female |
| Under 5 Years | 8 (0.7%) | 127 (13.4%) |
| 5 to 9 Years | 0 (0.0%) | 0 (0.0%) |
| 10 to 14 Years | 14 (1.3%) | 58 (6.1%) |
| 15 to 19 Years | 12 (1.1%) | 45 (4.7%) |
| 20 to 24 Years | 113 (10.1%) | 33 (3.5%) |
| 25 to 29 Years | 35 (3.1%) | 228 (24.0%) |
| 30 to 34 Years | 245 (22.0%) | 4 (0.4%) |
| 35 to 39 Years | 241 (21.6%) | 28 (2.9%) |
| 40 to 44 Years | 23 (2.1%) | 47 (5.0%) |
| 45 to 49 Years | 22 (2.0%) | 20 (2.1%) |
| 50 to 54 Years | 61 (5.5%) | 116 (12.2%) |
| 55 to 59 Years | 119 (10.7%) | 109 (11.5%) |
| 60 to 64 Years | 59 (5.3%) | 59 (6.2%) |
| 65 to 69 Years | 74 (6.6%) | 29 (3.0%) |
| 70 to 74 Years | 36 (3.2%) | 0 (0.0%) |
| 75 to 79 Years | 44 (4.0%) | 28 (2.9%) |
| 80 to 84 Years | 0 (0.0%) | 0 (0.0%) |
| 85 Years and over | 9 (0.8%) | 19 (2.0%) |
| Total | 1,115 (100.0%) | 950 (100.0%) |
Families and Households in Baldwin
Median Family Size in Baldwin
The median family size in Baldwin is 3.63 persons per family, with single female/mother families (153 | 33.8%) accounting for the largest median family size of 6.05 persons per family. On the other hand, single male/father families (129 | 28.5%) represent the smallest median family size with 1.83 persons per family.
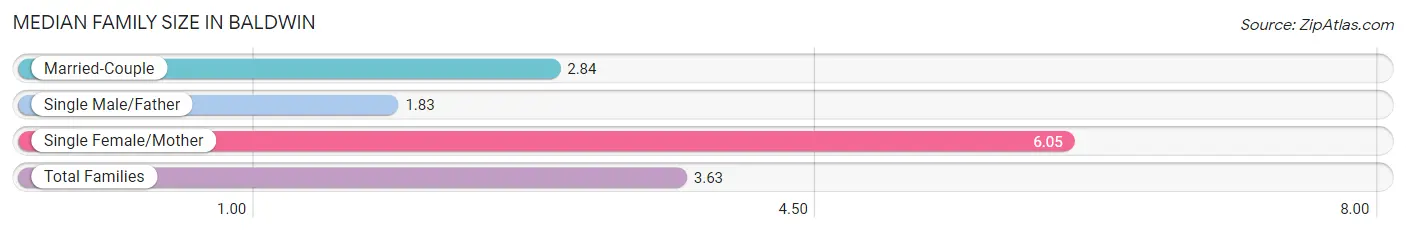
| Family Type | # Families | Family Size |
| Married-Couple | 171 (37.8%) | 2.84 |
| Single Male/Father | 129 (28.5%) | 1.83 |
| Single Female/Mother | 153 (33.8%) | 6.05 |
| Total Families | 453 (100.0%) | 3.63 |
Median Household Size in Baldwin
The median household size in Baldwin is 2.76 persons per household, with single female/mother households (153 | 20.5%) accounting for the largest median household size of 6.22 persons per household. non-family households (294 | 39.4%) represent the smallest median household size with 1.23 persons per household.
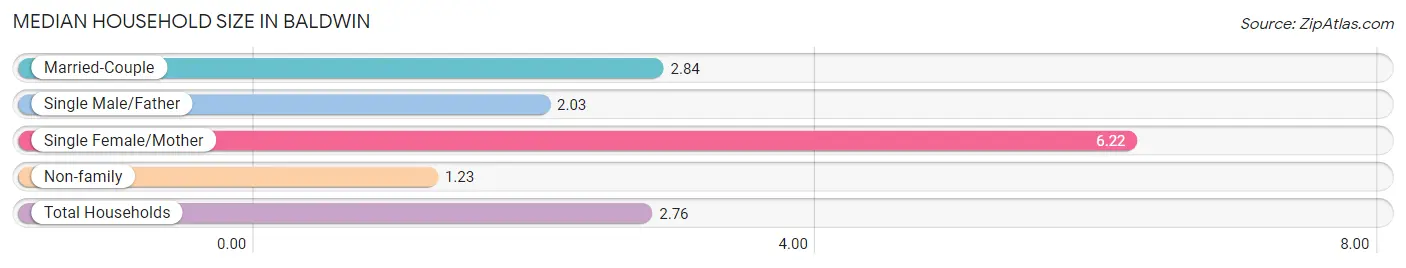
| Household Type | # Households | Household Size |
| Married-Couple | 171 (22.9%) | 2.84 |
| Single Male/Father | 129 (17.3%) | 2.03 |
| Single Female/Mother | 153 (20.5%) | 6.22 |
| Non-family | 294 (39.4%) | 1.23 |
| Total Households | 747 (100.0%) | 2.76 |
Household Size by Marriage Status in Baldwin
Out of a total of 747 households in Baldwin, 453 (60.6%) are family households, while 294 (39.4%) are nonfamily households. The most numerous type of family households are 2-person households, comprising 255, and the most common type of nonfamily households are 1-person households, comprising 267.
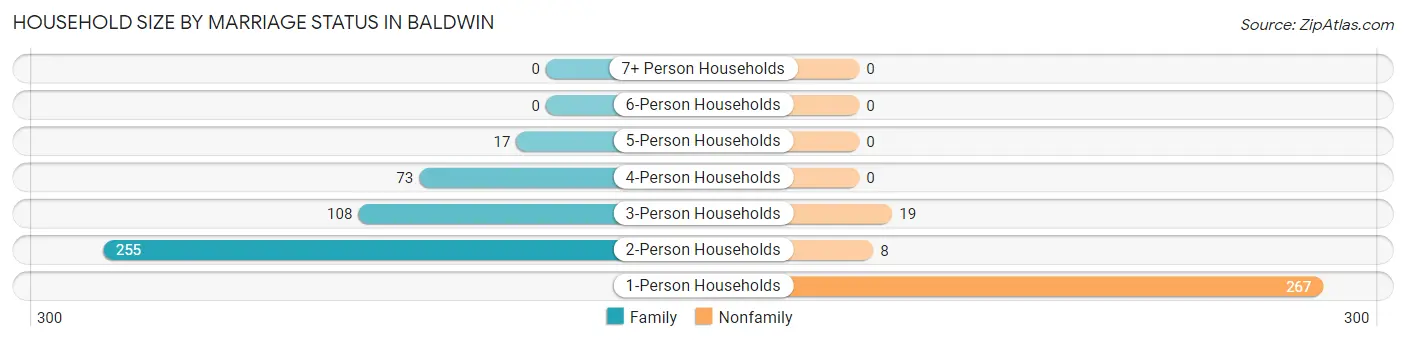
| Household Size | Family Households | Nonfamily Households |
| 1-Person Households | - | 267 (35.7%) |
| 2-Person Households | 255 (34.1%) | 8 (1.1%) |
| 3-Person Households | 108 (14.5%) | 19 (2.5%) |
| 4-Person Households | 73 (9.8%) | 0 (0.0%) |
| 5-Person Households | 17 (2.3%) | 0 (0.0%) |
| 6-Person Households | 0 (0.0%) | 0 (0.0%) |
| 7+ Person Households | 0 (0.0%) | 0 (0.0%) |
| Total | 453 (60.6%) | 294 (39.4%) |
Female Fertility in Baldwin
Fertility by Age in Baldwin
Average fertility rate in Baldwin is 43.0 births per 1,000 women. Women in the age bracket of 15 to 19 years have the highest fertility rate with 400.0 births per 1,000 women. Women in the age bracket of 15 to 19 years acount for 100.0% of all women with births.
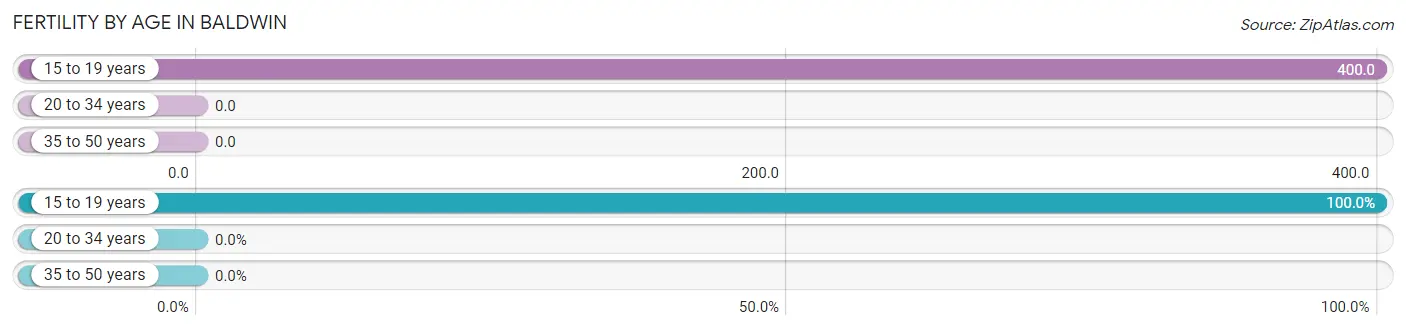
| Age Bracket | Women with Births | Births / 1,000 Women |
| 15 to 19 years | 18 (100.0%) | 400.0 |
| 20 to 34 years | 0 (0.0%) | 0.0 |
| 35 to 50 years | 0 (0.0%) | 0.0 |
| Total | 18 (100.0%) | 43.0 |
Fertility by Age by Marriage Status in Baldwin
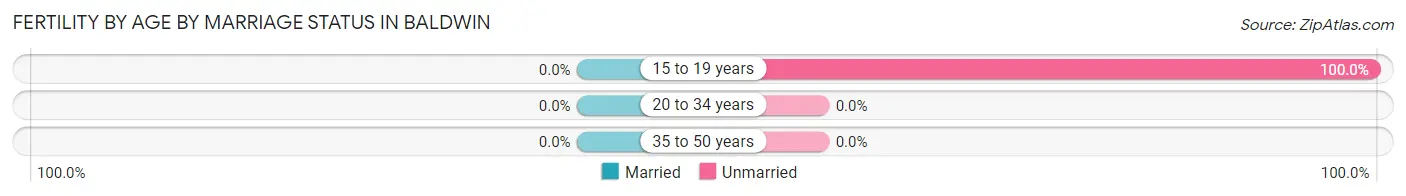
| Age Bracket | Married | Unmarried |
| 15 to 19 years | 0 (0.0%) | 18 (100.0%) |
| 20 to 34 years | 0 (0.0%) | 0 (0.0%) |
| 35 to 50 years | 0 (0.0%) | 0 (0.0%) |
| Total | 0 (0.0%) | 18 (100.0%) |
Fertility by Education in Baldwin
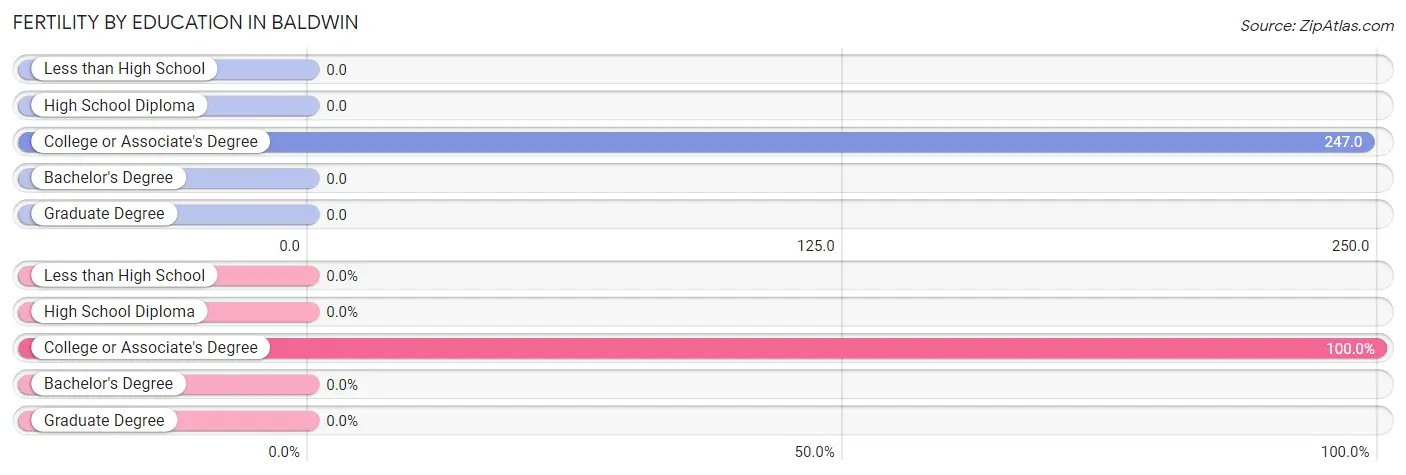
| Educational Attainment | Women with Births | Births / 1,000 Women |
| Less than High School | 0 (0.0%) | 0.0 |
| High School Diploma | 0 (0.0%) | 0.0 |
| College or Associate's Degree | 18 (100.0%) | 247.0 |
| Bachelor's Degree | 0 (0.0%) | 0.0 |
| Graduate Degree | 0 (0.0%) | 0.0 |
| Total | 18 (100.0%) | 43.0 |
Fertility by Education by Marriage Status in Baldwin
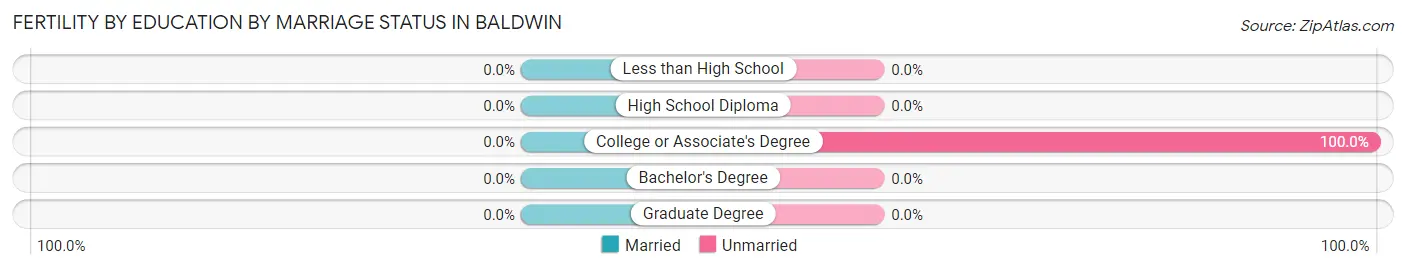
| Educational Attainment | Married | Unmarried |
| Less than High School | 0 (0.0%) | 0 (0.0%) |
| High School Diploma | 0 (0.0%) | 0 (0.0%) |
| College or Associate's Degree | 0 (0.0%) | 18 (100.0%) |
| Bachelor's Degree | 0 (0.0%) | 0 (0.0%) |
| Graduate Degree | 0 (0.0%) | 0 (0.0%) |
| Total | 0 (0.0%) | 18 (100.0%) |
Employment Characteristics in Baldwin
Employment by Class of Employer in Baldwin
Among the 525 employed individuals in Baldwin, private company employees (430 | 81.9%), local government employees (33 | 6.3%), and state government employees (31 | 5.9%) make up the most common classes of employment.
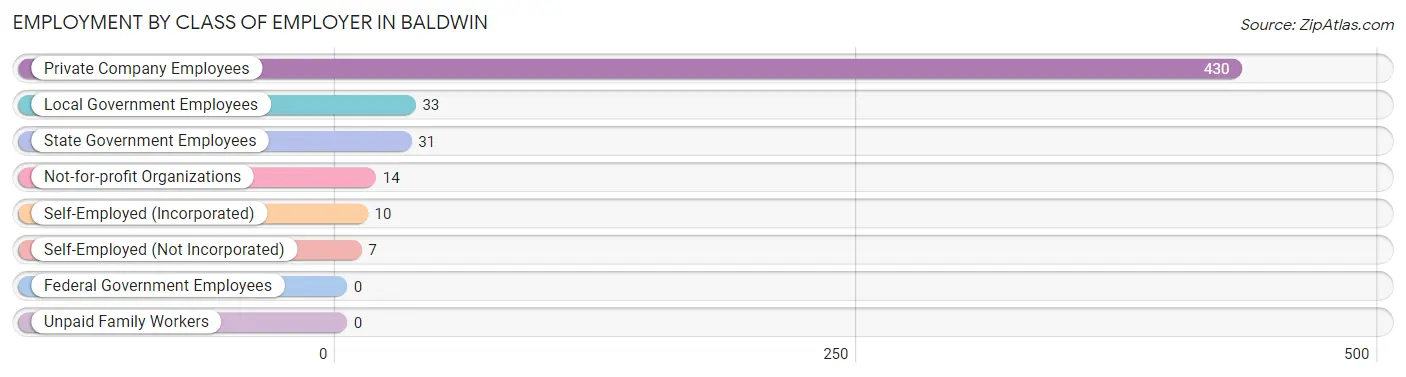
| Employer Class | # Employees | % Employees |
| Private Company Employees | 430 | 81.9% |
| Self-Employed (Incorporated) | 10 | 1.9% |
| Self-Employed (Not Incorporated) | 7 | 1.3% |
| Not-for-profit Organizations | 14 | 2.7% |
| Local Government Employees | 33 | 6.3% |
| State Government Employees | 31 | 5.9% |
| Federal Government Employees | 0 | 0.0% |
| Unpaid Family Workers | 0 | 0.0% |
| Total | 525 | 100.0% |
Employment Status by Age in Baldwin
According to the labor force statistics for Baldwin, out of the total population over 16 years of age (1,846), 28.7% or 530 individuals are in the labor force, with 0.8% or 4 of them unemployed. The age group with the highest labor force participation rate is 45 to 54 years, with 58.9% or 129 individuals in the labor force. Within the labor force, the 25 to 29 years age range has the highest percentage of unemployed individuals, with 26.7% or 4 of them being unemployed.
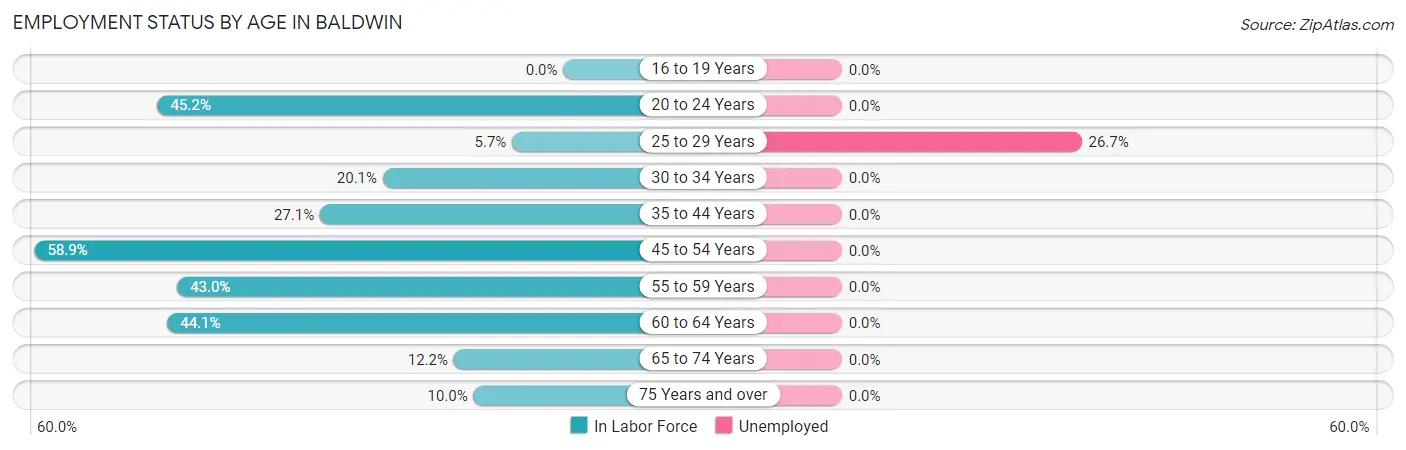
| Age Bracket | In Labor Force | Unemployed |
| 16 to 19 Years | 0 (0.0%) | 0 (0.0%) |
| 20 to 24 Years | 66 (45.2%) | 0 (0.0%) |
| 25 to 29 Years | 15 (5.7%) | 4 (26.7%) |
| 30 to 34 Years | 50 (20.1%) | 0 (0.0%) |
| 35 to 44 Years | 92 (27.1%) | 0 (0.0%) |
| 45 to 54 Years | 129 (58.9%) | 0 (0.0%) |
| 55 to 59 Years | 98 (43.0%) | 0 (0.0%) |
| 60 to 64 Years | 52 (44.1%) | 0 (0.0%) |
| 65 to 74 Years | 17 (12.2%) | 0 (0.0%) |
| 75 Years and over | 10 (10.0%) | 0 (0.0%) |
| Total | 530 (28.7%) | 4 (0.8%) |
Employment Status by Educational Attainment in Baldwin
According to labor force statistics for Baldwin, 30.8% of individuals (436) out of the total population between 25 and 64 years of age (1,416) are in the labor force, with 0.9% or 4 of them being unemployed. The group with the highest labor force participation rate are those with the educational attainment of bachelor's degree or higher, with 91.1% or 72 individuals in the labor force. Within the labor force, individuals with college / associate degree education have the highest percentage of unemployment, with 3.8% or 4 of them being unemployed.
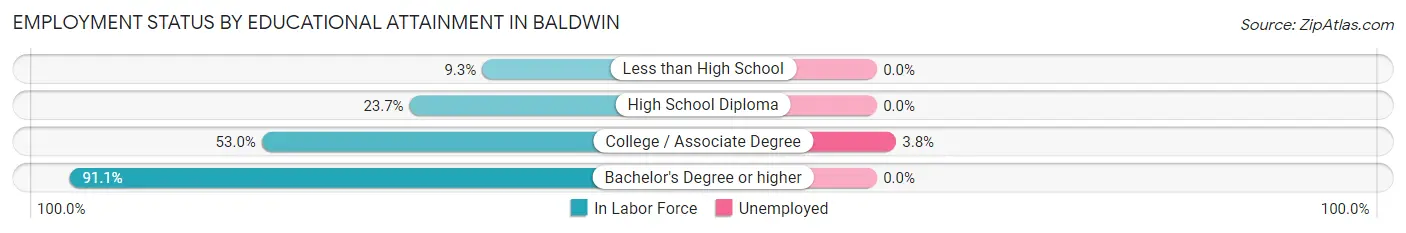
| Educational Attainment | In Labor Force | Unemployed |
| Less than High School | 7 (9.3%) | 0 (0.0%) |
| High School Diploma | 252 (23.7%) | 0 (0.0%) |
| College / Associate Degree | 105 (53.0%) | 8 (3.8%) |
| Bachelor's Degree or higher | 72 (91.1%) | 0 (0.0%) |
| Total | 436 (30.8%) | 13 (0.9%) |
Employment Occupations by Sex in Baldwin
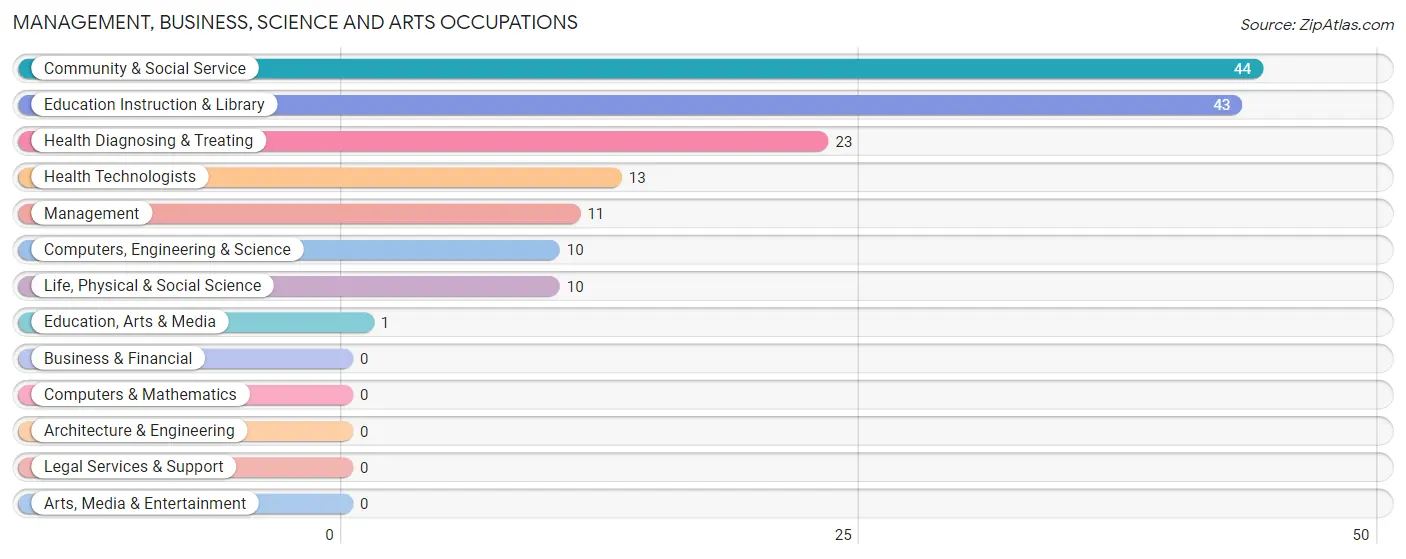
Management, Business, Science and Arts Occupations
The most common Management, Business, Science and Arts occupations in Baldwin are Community & Social Service (44 | 8.4%), Education Instruction & Library (43 | 8.2%), Health Diagnosing & Treating (23 | 4.4%), Health Technologists (13 | 2.5%), and Management (11 | 2.1%).
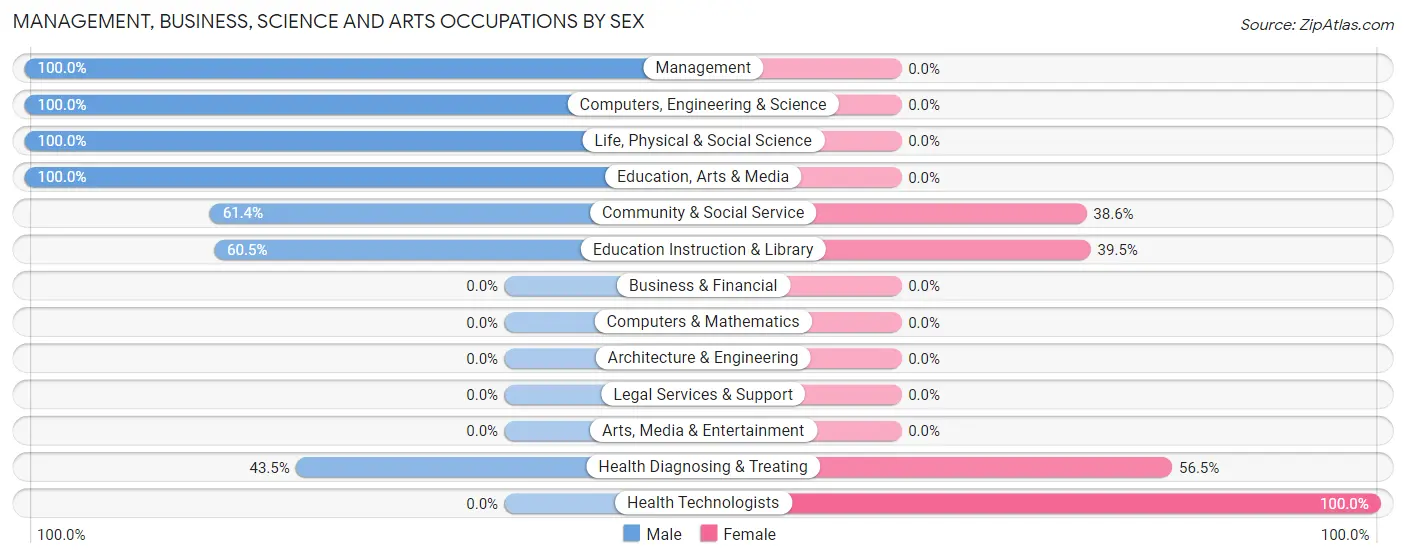
Management, Business, Science and Arts Occupations by Sex
Within the Management, Business, Science and Arts occupations in Baldwin, the most male-oriented occupations are Management (100.0%), Computers, Engineering & Science (100.0%), and Life, Physical & Social Science (100.0%), while the most female-oriented occupations are Health Technologists (100.0%), Health Diagnosing & Treating (56.5%), and Education Instruction & Library (39.5%).
| Occupation | Male | Female |
| Management | 11 (100.0%) | 0 (0.0%) |
| Business & Financial | 0 (0.0%) | 0 (0.0%) |
| Computers, Engineering & Science | 10 (100.0%) | 0 (0.0%) |
| Computers & Mathematics | 0 (0.0%) | 0 (0.0%) |
| Architecture & Engineering | 0 (0.0%) | 0 (0.0%) |
| Life, Physical & Social Science | 10 (100.0%) | 0 (0.0%) |
| Community & Social Service | 27 (61.4%) | 17 (38.6%) |
| Education, Arts & Media | 1 (100.0%) | 0 (0.0%) |
| Legal Services & Support | 0 (0.0%) | 0 (0.0%) |
| Education Instruction & Library | 26 (60.5%) | 17 (39.5%) |
| Arts, Media & Entertainment | 0 (0.0%) | 0 (0.0%) |
| Health Diagnosing & Treating | 10 (43.5%) | 13 (56.5%) |
| Health Technologists | 0 (0.0%) | 13 (100.0%) |
| Total (Category) | 58 (65.9%) | 30 (34.1%) |
| Total (Overall) | 283 (53.9%) | 242 (46.1%) |
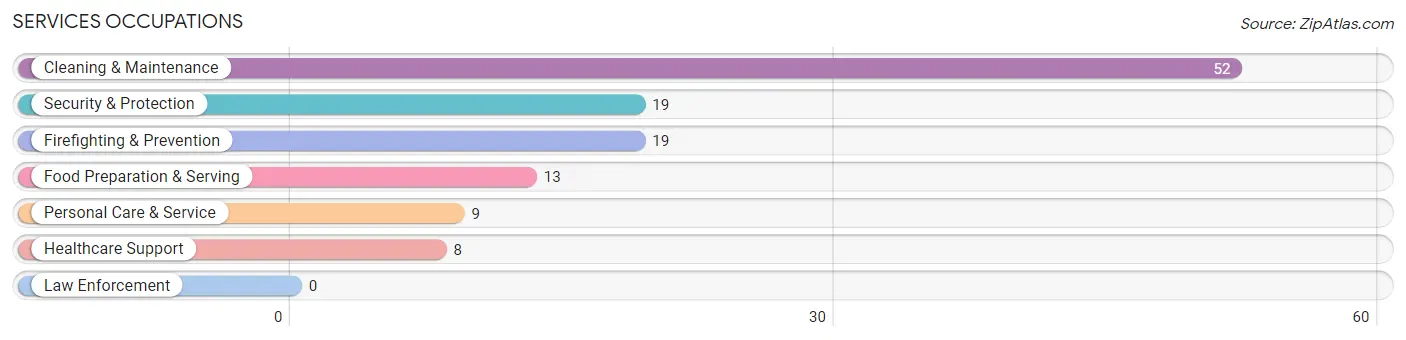
Services Occupations
The most common Services occupations in Baldwin are Cleaning & Maintenance (52 | 9.9%), Security & Protection (19 | 3.6%), Firefighting & Prevention (19 | 3.6%), Food Preparation & Serving (13 | 2.5%), and Personal Care & Service (9 | 1.7%).
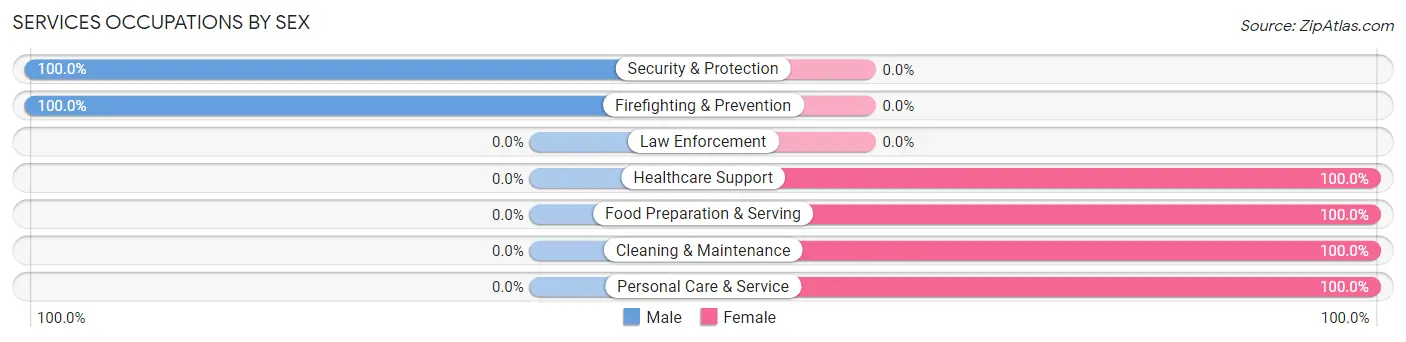
Services Occupations by Sex
Within the Services occupations in Baldwin, the most male-oriented occupations are Security & Protection (100.0%), and Firefighting & Prevention (100.0%), while the most female-oriented occupations are Healthcare Support (100.0%), Food Preparation & Serving (100.0%), and Cleaning & Maintenance (100.0%).
| Occupation | Male | Female |
| Healthcare Support | 0 (0.0%) | 8 (100.0%) |
| Security & Protection | 19 (100.0%) | 0 (0.0%) |
| Firefighting & Prevention | 19 (100.0%) | 0 (0.0%) |
| Law Enforcement | 0 (0.0%) | 0 (0.0%) |
| Food Preparation & Serving | 0 (0.0%) | 13 (100.0%) |
| Cleaning & Maintenance | 0 (0.0%) | 52 (100.0%) |
| Personal Care & Service | 0 (0.0%) | 9 (100.0%) |
| Total (Category) | 19 (18.8%) | 82 (81.2%) |
| Total (Overall) | 283 (53.9%) | 242 (46.1%) |
Sales and Office Occupations
The most common Sales and Office occupations in Baldwin are Office & Administration (83 | 15.8%), and Sales & Related (49 | 9.3%).
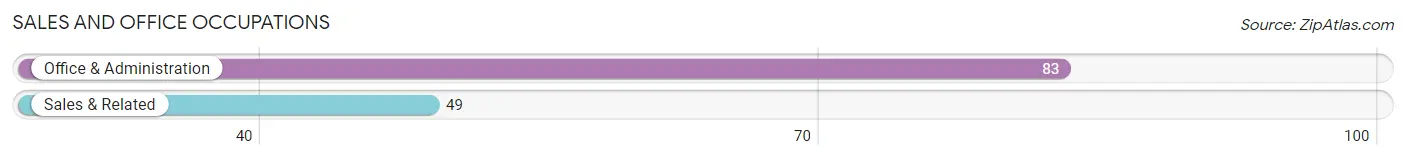
Sales and Office Occupations by Sex

| Occupation | Male | Female |
| Sales & Related | 10 (20.4%) | 39 (79.6%) |
| Office & Administration | 0 (0.0%) | 83 (100.0%) |
| Total (Category) | 10 (7.6%) | 122 (92.4%) |
| Total (Overall) | 283 (53.9%) | 242 (46.1%) |
Natural Resources, Construction and Maintenance Occupations
The most common Natural Resources, Construction and Maintenance occupations in Baldwin are Construction & Extraction (91 | 17.3%), Installation, Maintenance & Repair (26 | 5.0%), and Farming, Fishing & Forestry (7 | 1.3%).
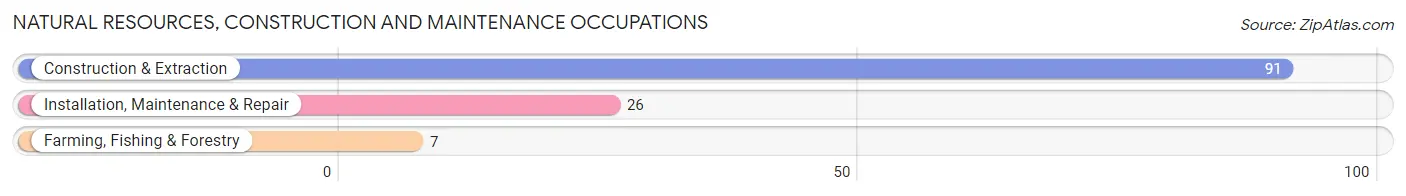
Natural Resources, Construction and Maintenance Occupations by Sex
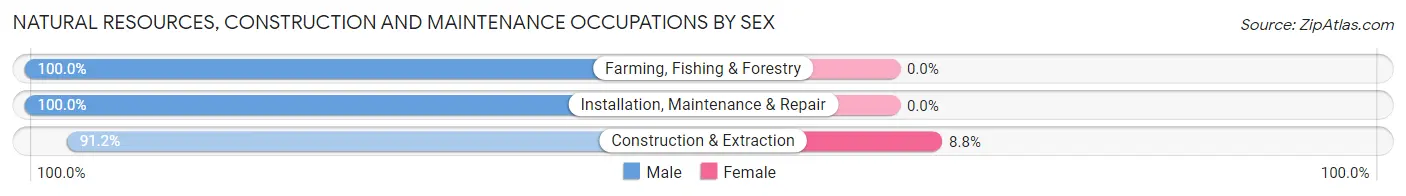
| Occupation | Male | Female |
| Farming, Fishing & Forestry | 7 (100.0%) | 0 (0.0%) |
| Construction & Extraction | 83 (91.2%) | 8 (8.8%) |
| Installation, Maintenance & Repair | 26 (100.0%) | 0 (0.0%) |
| Total (Category) | 116 (93.5%) | 8 (6.5%) |
| Total (Overall) | 283 (53.9%) | 242 (46.1%) |
Production, Transportation and Moving Occupations
The most common Production, Transportation and Moving occupations in Baldwin are Material Moving (52 | 9.9%), and Production (28 | 5.3%).
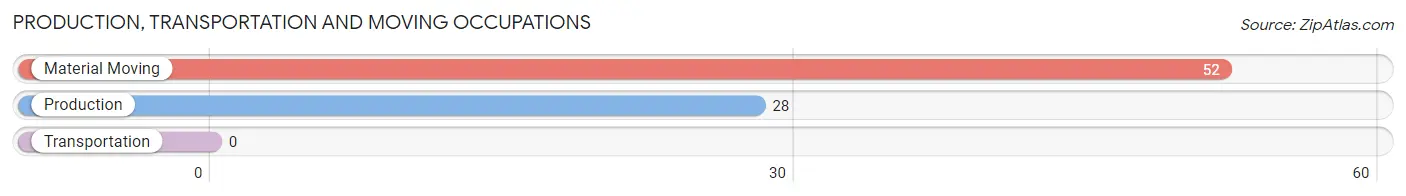
Production, Transportation and Moving Occupations by Sex
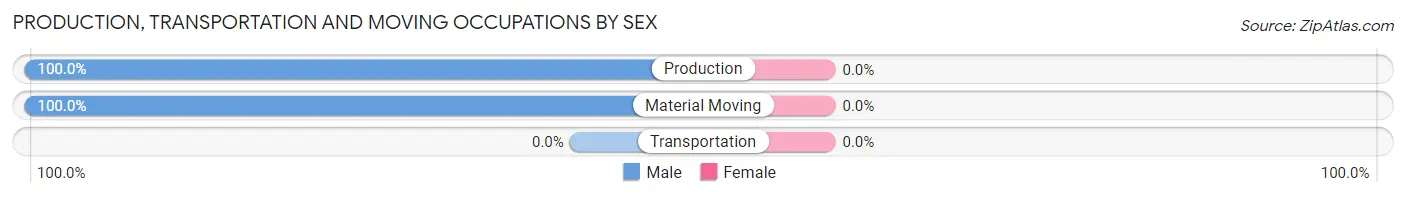
| Occupation | Male | Female |
| Production | 28 (100.0%) | 0 (0.0%) |
| Transportation | 0 (0.0%) | 0 (0.0%) |
| Material Moving | 52 (100.0%) | 0 (0.0%) |
| Total (Category) | 80 (100.0%) | 0 (0.0%) |
| Total (Overall) | 283 (53.9%) | 242 (46.1%) |
Employment Industries by Sex in Baldwin
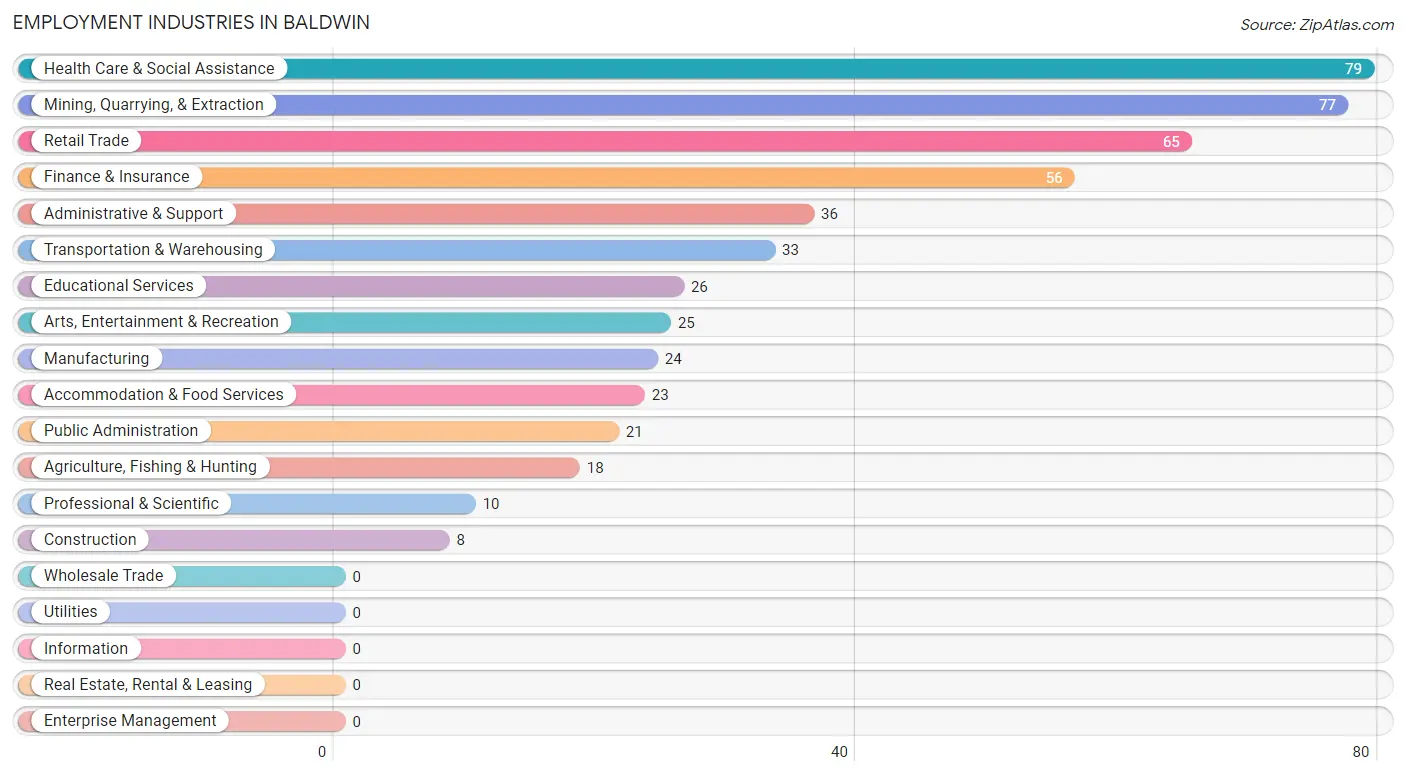
Employment Industries in Baldwin
The major employment industries in Baldwin include Health Care & Social Assistance (79 | 15.0%), Mining, Quarrying, & Extraction (77 | 14.7%), Retail Trade (65 | 12.4%), Finance & Insurance (56 | 10.7%), and Administrative & Support (36 | 6.9%).
Employment Industries by Sex in Baldwin
The Baldwin industries that see more men than women are Agriculture, Fishing & Hunting (100.0%), Mining, Quarrying, & Extraction (100.0%), and Manufacturing (100.0%), whereas the industries that tend to have a higher number of women are Construction (100.0%), Finance & Insurance (100.0%), and Accommodation & Food Services (100.0%).
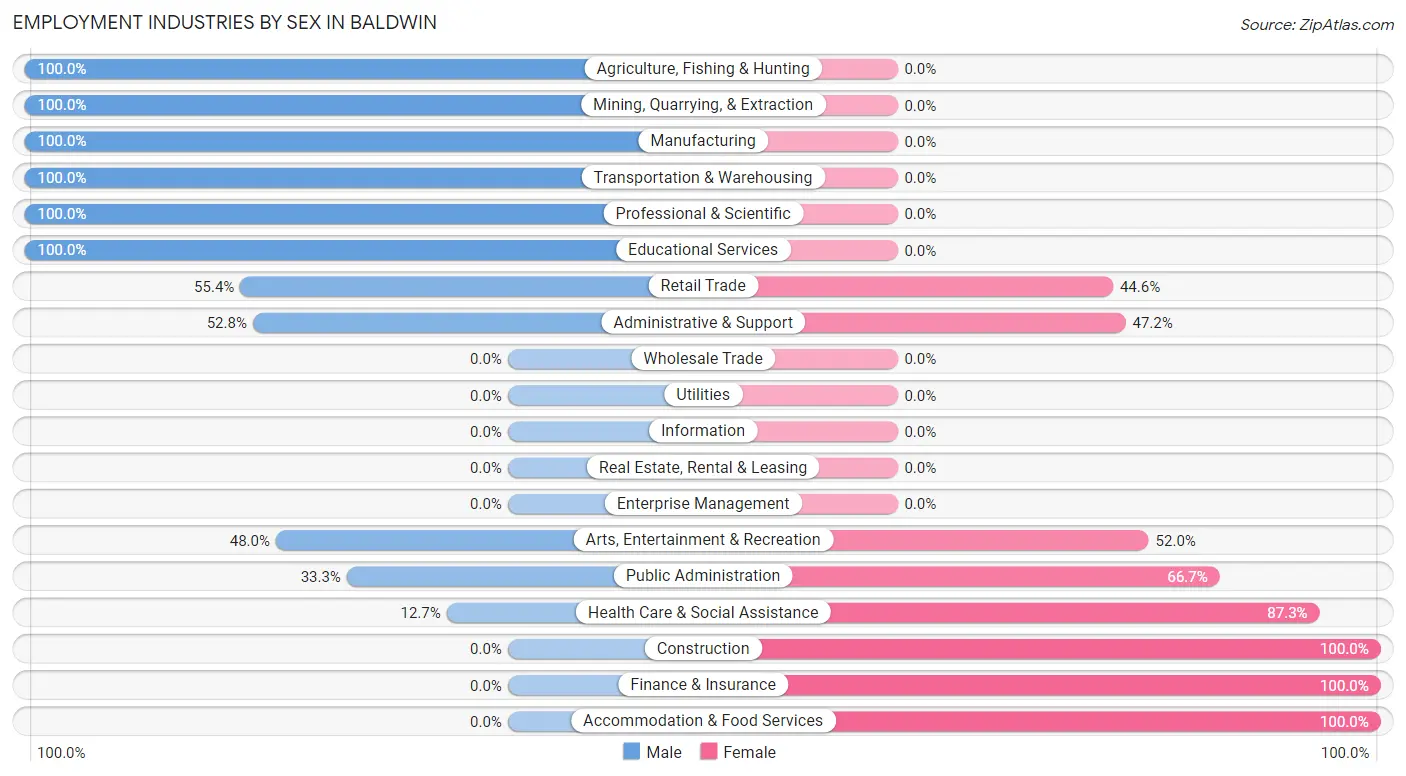
| Industry | Male | Female |
| Agriculture, Fishing & Hunting | 18 (100.0%) | 0 (0.0%) |
| Mining, Quarrying, & Extraction | 77 (100.0%) | 0 (0.0%) |
| Construction | 0 (0.0%) | 8 (100.0%) |
| Manufacturing | 24 (100.0%) | 0 (0.0%) |
| Wholesale Trade | 0 (0.0%) | 0 (0.0%) |
| Retail Trade | 36 (55.4%) | 29 (44.6%) |
| Transportation & Warehousing | 33 (100.0%) | 0 (0.0%) |
| Utilities | 0 (0.0%) | 0 (0.0%) |
| Information | 0 (0.0%) | 0 (0.0%) |
| Finance & Insurance | 0 (0.0%) | 56 (100.0%) |
| Real Estate, Rental & Leasing | 0 (0.0%) | 0 (0.0%) |
| Professional & Scientific | 10 (100.0%) | 0 (0.0%) |
| Enterprise Management | 0 (0.0%) | 0 (0.0%) |
| Administrative & Support | 19 (52.8%) | 17 (47.2%) |
| Educational Services | 26 (100.0%) | 0 (0.0%) |
| Health Care & Social Assistance | 10 (12.7%) | 69 (87.3%) |
| Arts, Entertainment & Recreation | 12 (48.0%) | 13 (52.0%) |
| Accommodation & Food Services | 0 (0.0%) | 23 (100.0%) |
| Public Administration | 7 (33.3%) | 14 (66.7%) |
| Total | 283 (53.9%) | 242 (46.1%) |
Education in Baldwin
School Enrollment in Baldwin
The most common levels of schooling among the 179 students in Baldwin are middle school (72 | 40.2%), college / undergraduate (69 | 38.6%), and high school (24 | 13.4%).
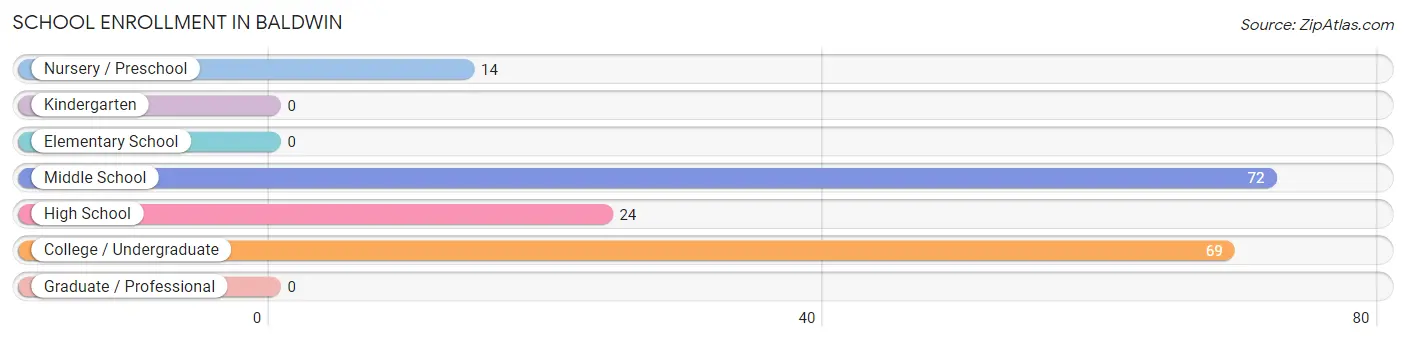
| School Level | # Students | % Students |
| Nursery / Preschool | 14 | 7.8% |
| Kindergarten | 0 | 0.0% |
| Elementary School | 0 | 0.0% |
| Middle School | 72 | 40.2% |
| High School | 24 | 13.4% |
| College / Undergraduate | 69 | 38.6% |
| Graduate / Professional | 0 | 0.0% |
| Total | 179 | 100.0% |
School Enrollment by Age by Funding Source in Baldwin
Out of a total of 179 students who are enrolled in schools in Baldwin, 19 (10.6%) attend a private institution, while the remaining 160 (89.4%) are enrolled in public schools. The age group of 18 to 19 year olds has the highest likelihood of being enrolled in private schools, with 15 (45.5% in the age bracket) enrolled. Conversely, the age group of 10 to 14 year olds has the lowest likelihood of being enrolled in a private school, with 72 (100.0% in the age bracket) attending a public institution.
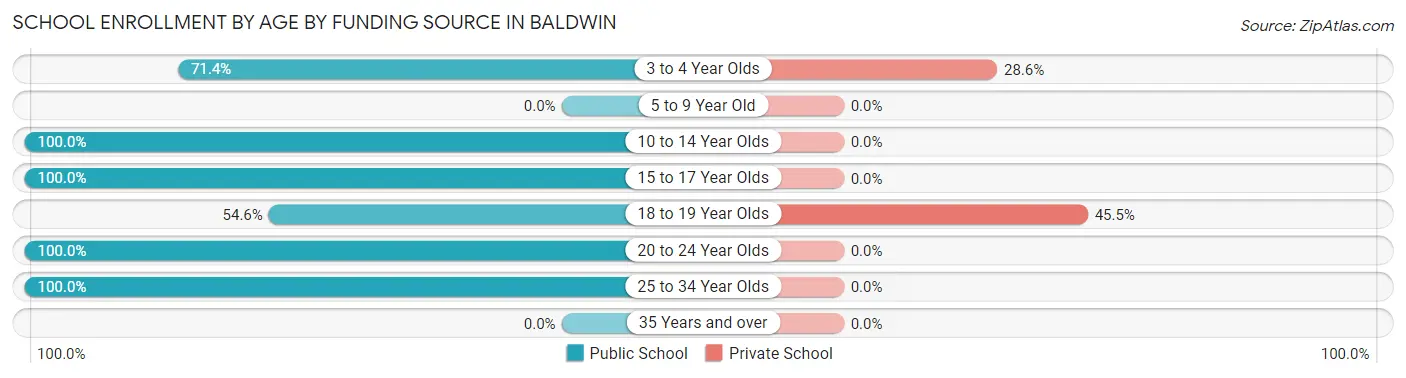
| Age Bracket | Public School | Private School |
| 3 to 4 Year Olds | 10 (71.4%) | 4 (28.6%) |
| 5 to 9 Year Old | 0 (0.0%) | 0 (0.0%) |
| 10 to 14 Year Olds | 72 (100.0%) | 0 (0.0%) |
| 15 to 17 Year Olds | 24 (100.0%) | 0 (0.0%) |
| 18 to 19 Year Olds | 18 (54.5%) | 15 (45.5%) |
| 20 to 24 Year Olds | 25 (100.0%) | 0 (0.0%) |
| 25 to 34 Year Olds | 11 (100.0%) | 0 (0.0%) |
| 35 Years and over | 0 (0.0%) | 0 (0.0%) |
| Total | 160 (89.4%) | 19 (10.6%) |
Educational Attainment by Field of Study in Baldwin
Education (43 | 36.4%), business (19 | 16.1%), science & technology (16 | 13.6%), physical & health sciences (14 | 11.9%), and psychology (10 | 8.5%) are the most common fields of study among 118 individuals in Baldwin who have obtained a bachelor's degree or higher.
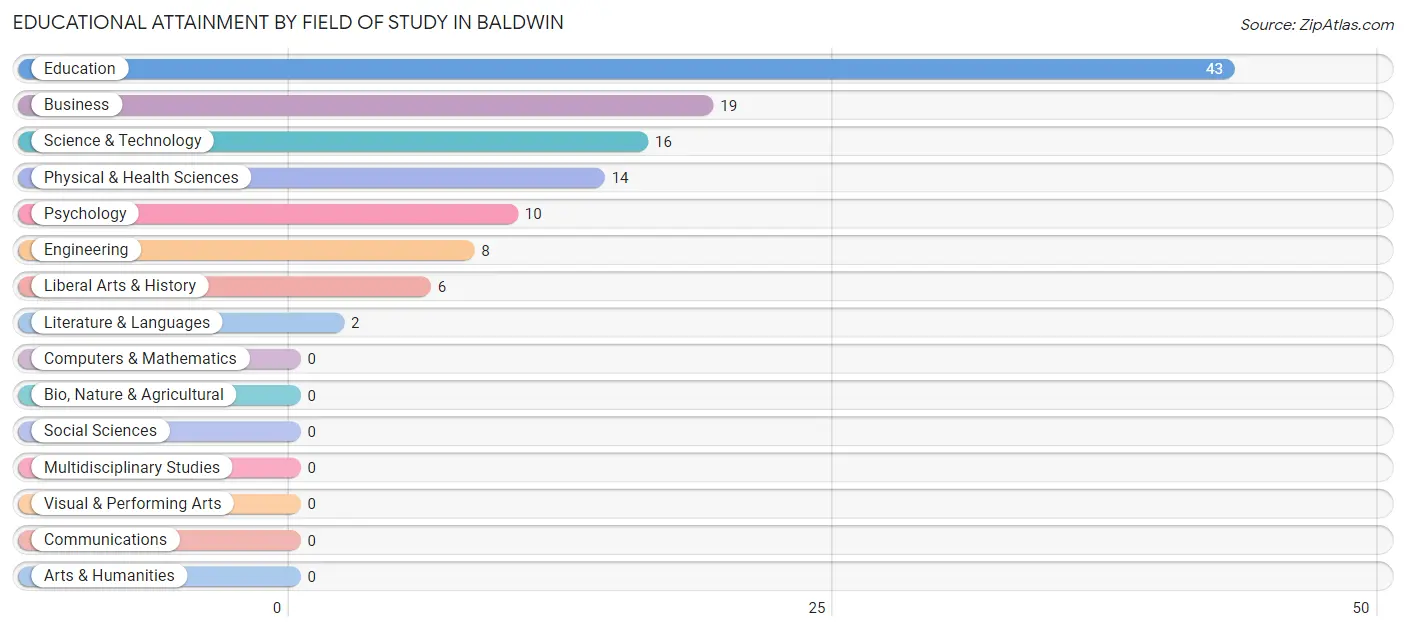
| Field of Study | # Graduates | % Graduates |
| Computers & Mathematics | 0 | 0.0% |
| Bio, Nature & Agricultural | 0 | 0.0% |
| Physical & Health Sciences | 14 | 11.9% |
| Psychology | 10 | 8.5% |
| Social Sciences | 0 | 0.0% |
| Engineering | 8 | 6.8% |
| Multidisciplinary Studies | 0 | 0.0% |
| Science & Technology | 16 | 13.6% |
| Business | 19 | 16.1% |
| Education | 43 | 36.4% |
| Literature & Languages | 2 | 1.7% |
| Liberal Arts & History | 6 | 5.1% |
| Visual & Performing Arts | 0 | 0.0% |
| Communications | 0 | 0.0% |
| Arts & Humanities | 0 | 0.0% |
| Total | 118 | 100.0% |
Transportation & Commute in Baldwin
Vehicle Availability by Sex in Baldwin
The most prevalent vehicle ownership categories in Baldwin are males with 3 vehicles (100, accounting for 35.5%) and females with 3 vehicles (6, making up 41.3%).
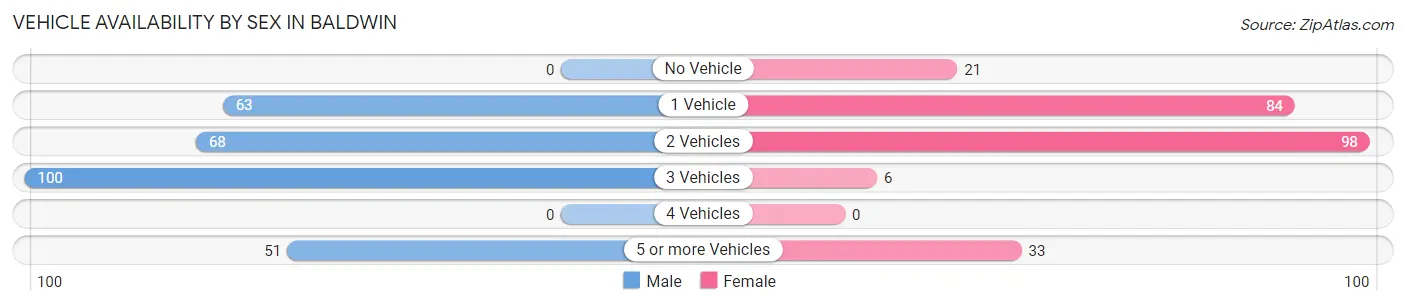
| Vehicles Available | Male | Female |
| No Vehicle | 0 (0.0%) | 21 (8.7%) |
| 1 Vehicle | 63 (22.3%) | 84 (34.7%) |
| 2 Vehicles | 68 (24.1%) | 98 (40.5%) |
| 3 Vehicles | 100 (35.5%) | 6 (2.5%) |
| 4 Vehicles | 0 (0.0%) | 0 (0.0%) |
| 5 or more Vehicles | 51 (18.1%) | 33 (13.6%) |
| Total | 282 (100.0%) | 242 (100.0%) |
Commute Time in Baldwin
The most frequently occuring commute durations in Baldwin are 20 to 24 minutes (109 commuters, 21.5%), 10 to 14 minutes (90 commuters, 17.7%), and 30 to 34 minutes (62 commuters, 12.2%).
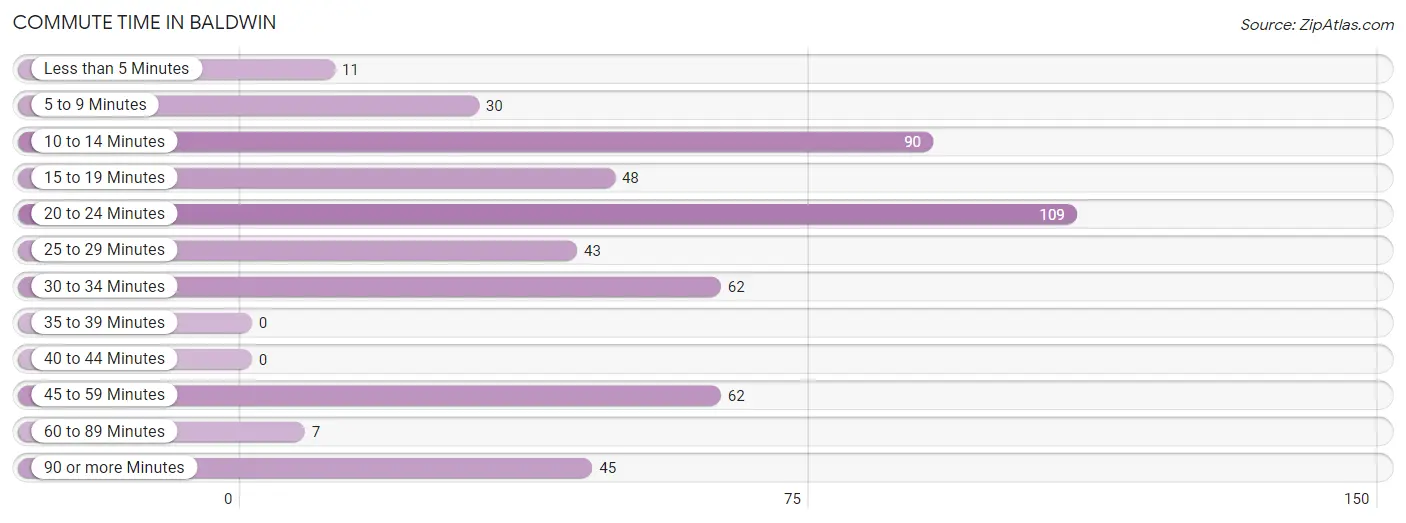
| Commute Time | # Commuters | % Commuters |
| Less than 5 Minutes | 11 | 2.2% |
| 5 to 9 Minutes | 30 | 5.9% |
| 10 to 14 Minutes | 90 | 17.7% |
| 15 to 19 Minutes | 48 | 9.5% |
| 20 to 24 Minutes | 109 | 21.5% |
| 25 to 29 Minutes | 43 | 8.5% |
| 30 to 34 Minutes | 62 | 12.2% |
| 35 to 39 Minutes | 0 | 0.0% |
| 40 to 44 Minutes | 0 | 0.0% |
| 45 to 59 Minutes | 62 | 12.2% |
| 60 to 89 Minutes | 7 | 1.4% |
| 90 or more Minutes | 45 | 8.9% |
Commute Time by Sex in Baldwin
The most common commute times in Baldwin are 20 to 24 minutes (79 commuters, 28.9%) for males and 10 to 14 minutes (83 commuters, 35.5%) for females.
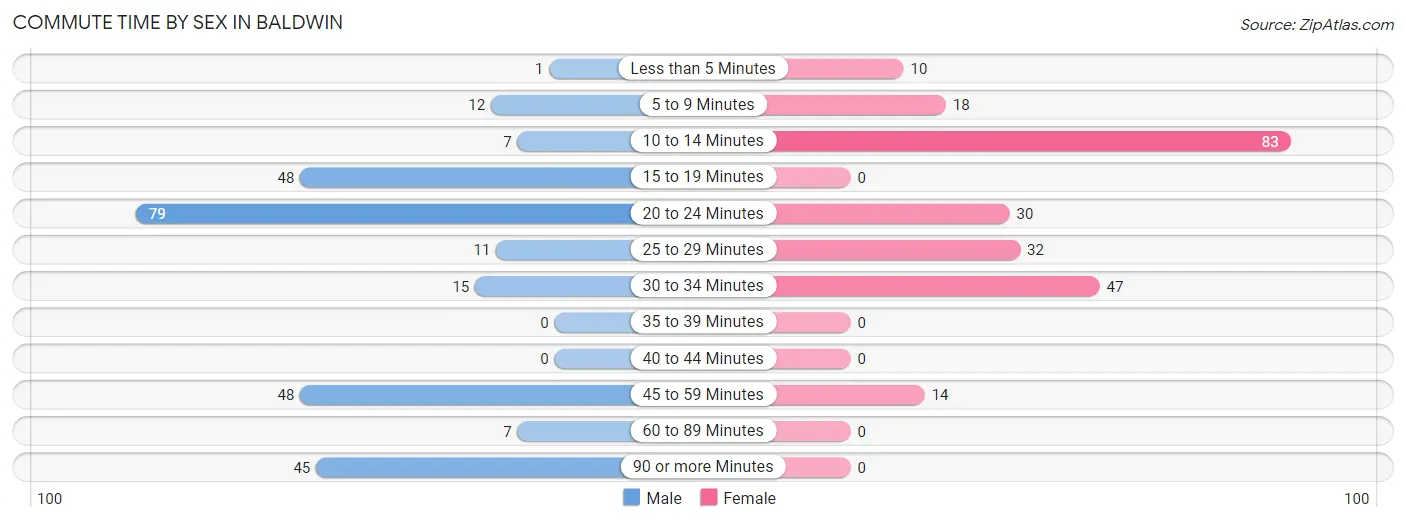
| Commute Time | Male | Female |
| Less than 5 Minutes | 1 (0.4%) | 10 (4.3%) |
| 5 to 9 Minutes | 12 (4.4%) | 18 (7.7%) |
| 10 to 14 Minutes | 7 (2.6%) | 83 (35.5%) |
| 15 to 19 Minutes | 48 (17.6%) | 0 (0.0%) |
| 20 to 24 Minutes | 79 (28.9%) | 30 (12.8%) |
| 25 to 29 Minutes | 11 (4.0%) | 32 (13.7%) |
| 30 to 34 Minutes | 15 (5.5%) | 47 (20.1%) |
| 35 to 39 Minutes | 0 (0.0%) | 0 (0.0%) |
| 40 to 44 Minutes | 0 (0.0%) | 0 (0.0%) |
| 45 to 59 Minutes | 48 (17.6%) | 14 (6.0%) |
| 60 to 89 Minutes | 7 (2.6%) | 0 (0.0%) |
| 90 or more Minutes | 45 (16.5%) | 0 (0.0%) |
Time of Departure to Work by Sex in Baldwin
The most frequent times of departure to work in Baldwin are 7:00 AM to 7:29 AM (126, 46.2%) for males and 8:00 AM to 8:29 AM (62, 26.5%) for females.
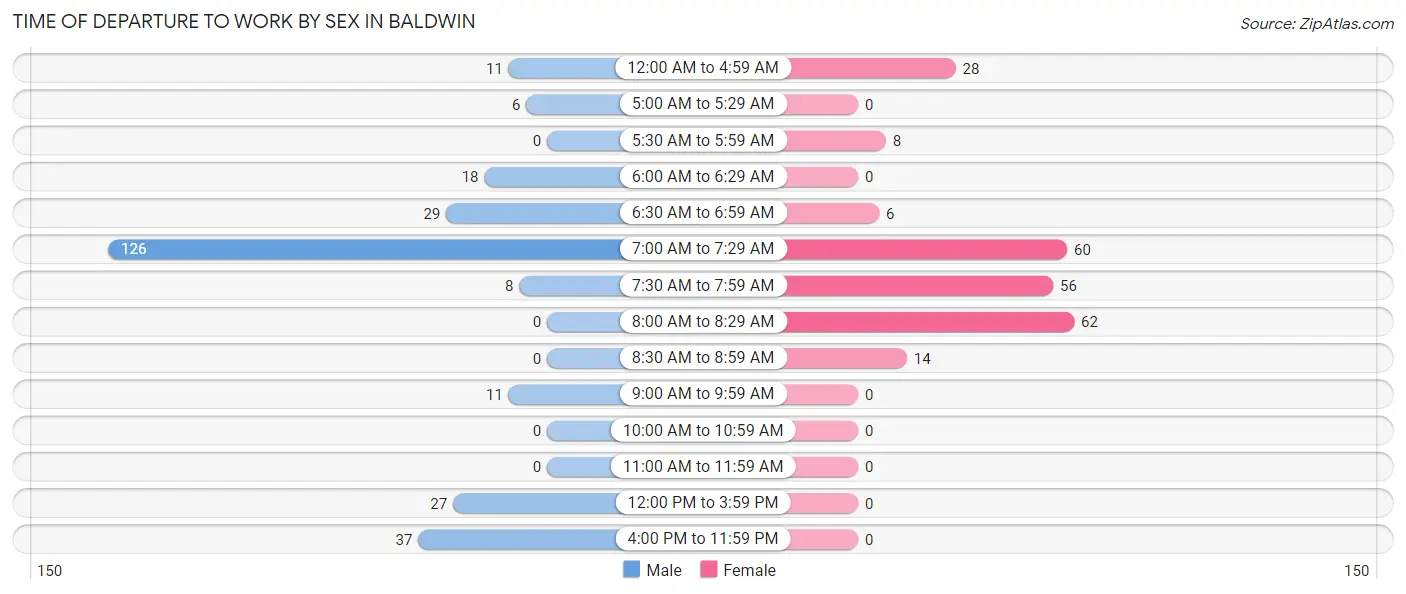
| Time of Departure | Male | Female |
| 12:00 AM to 4:59 AM | 11 (4.0%) | 28 (12.0%) |
| 5:00 AM to 5:29 AM | 6 (2.2%) | 0 (0.0%) |
| 5:30 AM to 5:59 AM | 0 (0.0%) | 8 (3.4%) |
| 6:00 AM to 6:29 AM | 18 (6.6%) | 0 (0.0%) |
| 6:30 AM to 6:59 AM | 29 (10.6%) | 6 (2.6%) |
| 7:00 AM to 7:29 AM | 126 (46.2%) | 60 (25.6%) |
| 7:30 AM to 7:59 AM | 8 (2.9%) | 56 (23.9%) |
| 8:00 AM to 8:29 AM | 0 (0.0%) | 62 (26.5%) |
| 8:30 AM to 8:59 AM | 0 (0.0%) | 14 (6.0%) |
| 9:00 AM to 9:59 AM | 11 (4.0%) | 0 (0.0%) |
| 10:00 AM to 10:59 AM | 0 (0.0%) | 0 (0.0%) |
| 11:00 AM to 11:59 AM | 0 (0.0%) | 0 (0.0%) |
| 12:00 PM to 3:59 PM | 27 (9.9%) | 0 (0.0%) |
| 4:00 PM to 11:59 PM | 37 (13.6%) | 0 (0.0%) |
| Total | 273 (100.0%) | 234 (100.0%) |
Housing Occupancy in Baldwin
Occupancy by Ownership in Baldwin
Of the total 747 dwellings in Baldwin, owner-occupied units account for 367 (49.1%), while renter-occupied units make up 380 (50.9%).
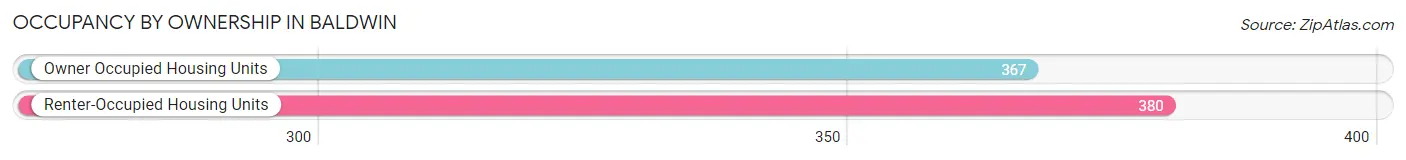
| Occupancy | # Housing Units | % Housing Units |
| Owner Occupied Housing Units | 367 | 49.1% |
| Renter-Occupied Housing Units | 380 | 50.9% |
| Total Occupied Housing Units | 747 | 100.0% |
Occupancy by Household Size in Baldwin
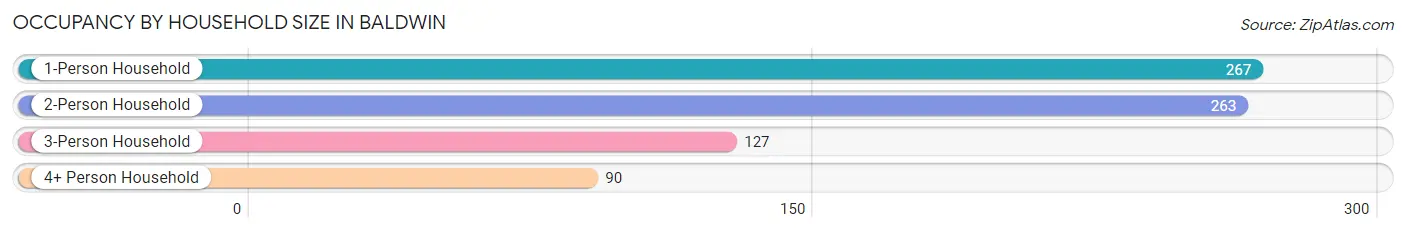
| Household Size | # Housing Units | % Housing Units |
| 1-Person Household | 267 | 35.7% |
| 2-Person Household | 263 | 35.2% |
| 3-Person Household | 127 | 17.0% |
| 4+ Person Household | 90 | 12.0% |
| Total Housing Units | 747 | 100.0% |
Occupancy by Ownership by Household Size in Baldwin
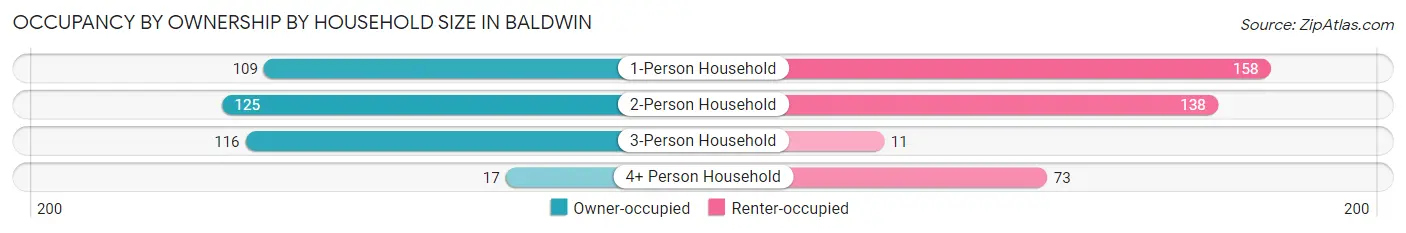
| Household Size | Owner-occupied | Renter-occupied |
| 1-Person Household | 109 (40.8%) | 158 (59.2%) |
| 2-Person Household | 125 (47.5%) | 138 (52.5%) |
| 3-Person Household | 116 (91.3%) | 11 (8.7%) |
| 4+ Person Household | 17 (18.9%) | 73 (81.1%) |
| Total Housing Units | 367 (49.1%) | 380 (50.9%) |
Occupancy by Educational Attainment in Baldwin
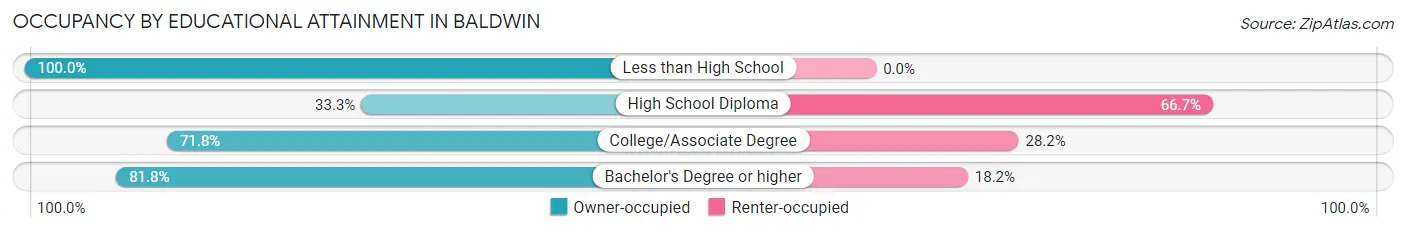
| Household Size | Owner-occupied | Renter-occupied |
| Less than High School | 58 (100.0%) | 0 (0.0%) |
| High School Diploma | 166 (33.3%) | 333 (66.7%) |
| College/Associate Degree | 89 (71.8%) | 35 (28.2%) |
| Bachelor's Degree or higher | 54 (81.8%) | 12 (18.2%) |
Occupancy by Age of Householder in Baldwin
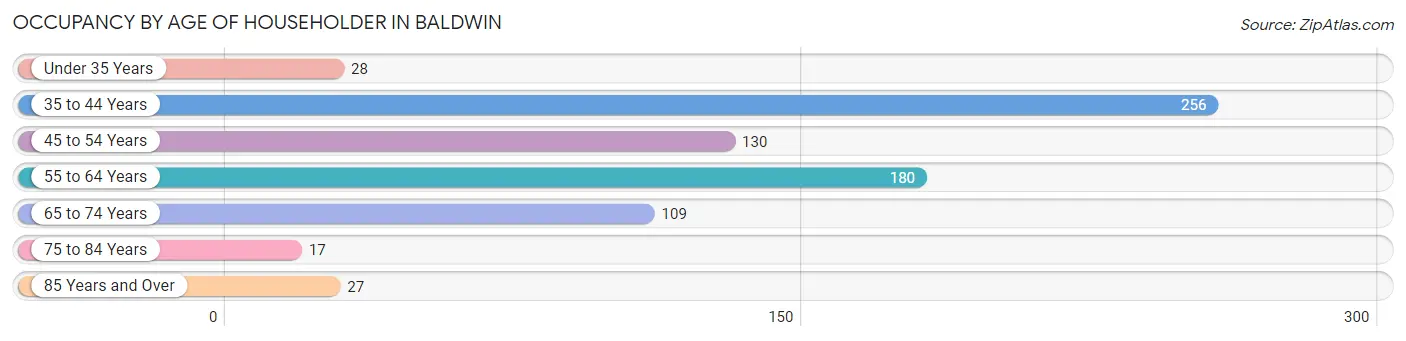
| Age Bracket | # Households | % Households |
| Under 35 Years | 28 | 3.7% |
| 35 to 44 Years | 256 | 34.3% |
| 45 to 54 Years | 130 | 17.4% |
| 55 to 64 Years | 180 | 24.1% |
| 65 to 74 Years | 109 | 14.6% |
| 75 to 84 Years | 17 | 2.3% |
| 85 Years and Over | 27 | 3.6% |
| Total | 747 | 100.0% |
Housing Finances in Baldwin
Median Income by Occupancy in Baldwin
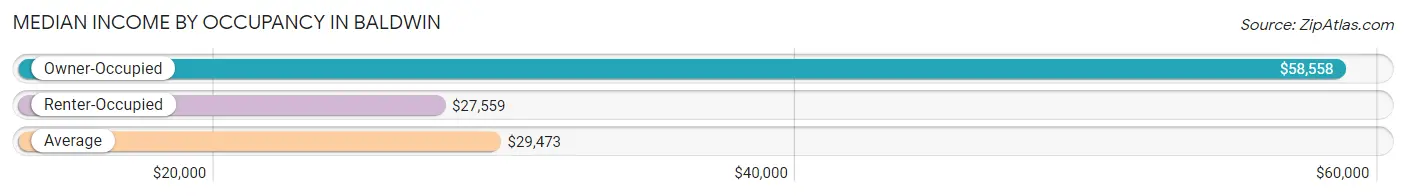
| Occupancy Type | # Households | Median Income |
| Owner-Occupied | 367 (49.1%) | $58,558 |
| Renter-Occupied | 380 (50.9%) | $27,559 |
| Average | 747 (100.0%) | $29,473 |
Occupancy by Householder Income Bracket in Baldwin
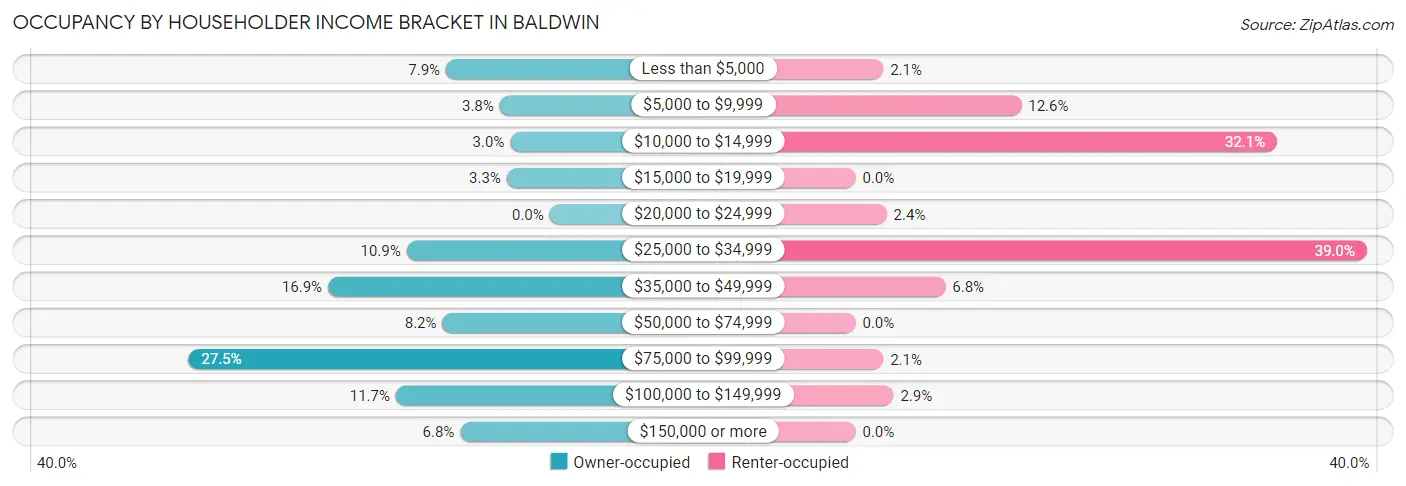
| Income Bracket | Owner-occupied | Renter-occupied |
| Less than $5,000 | 29 (7.9%) | 8 (2.1%) |
| $5,000 to $9,999 | 14 (3.8%) | 48 (12.6%) |
| $10,000 to $14,999 | 11 (3.0%) | 122 (32.1%) |
| $15,000 to $19,999 | 12 (3.3%) | 0 (0.0%) |
| $20,000 to $24,999 | 0 (0.0%) | 9 (2.4%) |
| $25,000 to $34,999 | 40 (10.9%) | 148 (39.0%) |
| $35,000 to $49,999 | 62 (16.9%) | 26 (6.8%) |
| $50,000 to $74,999 | 30 (8.2%) | 0 (0.0%) |
| $75,000 to $99,999 | 101 (27.5%) | 8 (2.1%) |
| $100,000 to $149,999 | 43 (11.7%) | 11 (2.9%) |
| $150,000 or more | 25 (6.8%) | 0 (0.0%) |
| Total | 367 (100.0%) | 380 (100.0%) |
Monthly Housing Cost Tiers in Baldwin
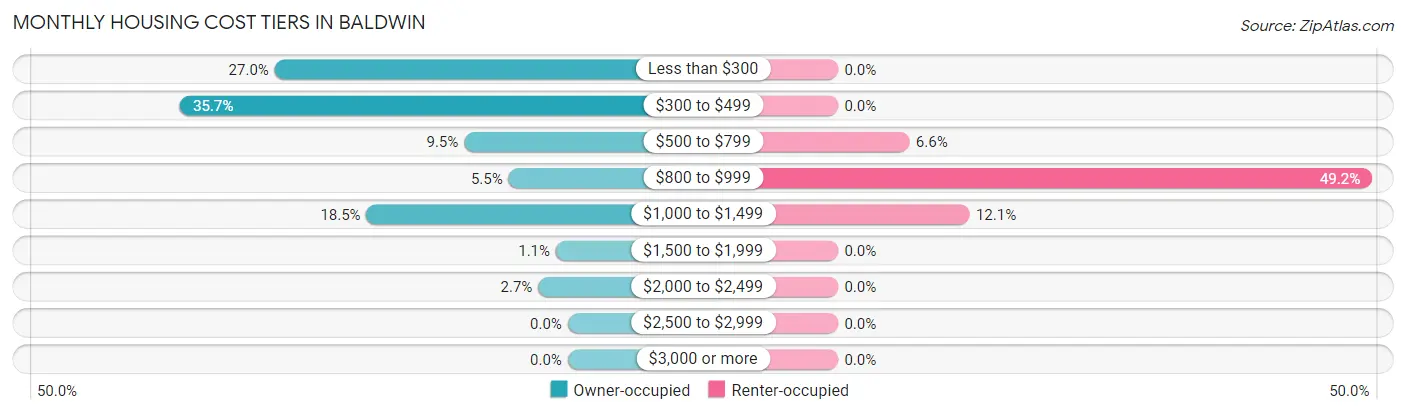
| Monthly Cost | Owner-occupied | Renter-occupied |
| Less than $300 | 99 (27.0%) | 0 (0.0%) |
| $300 to $499 | 131 (35.7%) | 0 (0.0%) |
| $500 to $799 | 35 (9.5%) | 25 (6.6%) |
| $800 to $999 | 20 (5.4%) | 187 (49.2%) |
| $1,000 to $1,499 | 68 (18.5%) | 46 (12.1%) |
| $1,500 to $1,999 | 4 (1.1%) | 0 (0.0%) |
| $2,000 to $2,499 | 10 (2.7%) | 0 (0.0%) |
| $2,500 to $2,999 | 0 (0.0%) | 0 (0.0%) |
| $3,000 or more | 0 (0.0%) | 0 (0.0%) |
| Total | 367 (100.0%) | 380 (100.0%) |
Physical Housing Characteristics in Baldwin
Housing Structures in Baldwin
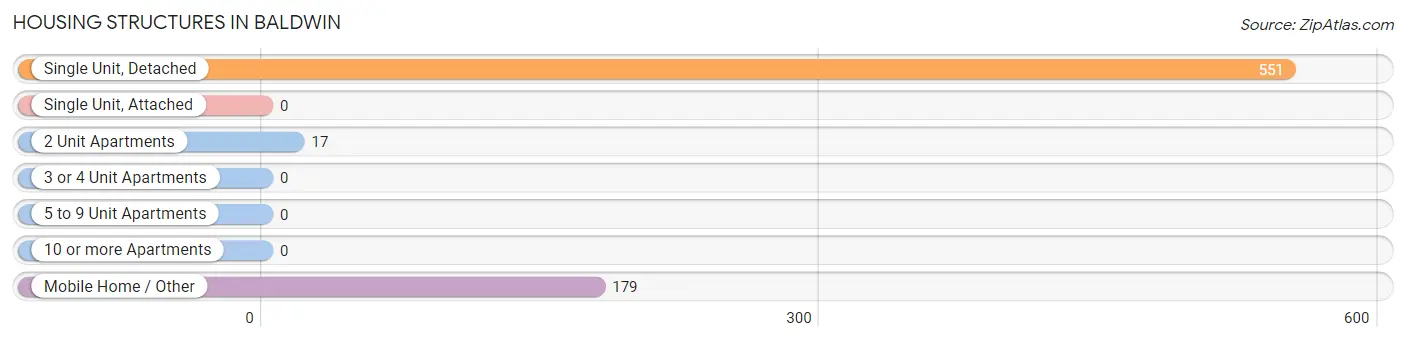
| Structure Type | # Housing Units | % Housing Units |
| Single Unit, Detached | 551 | 73.8% |
| Single Unit, Attached | 0 | 0.0% |
| 2 Unit Apartments | 17 | 2.3% |
| 3 or 4 Unit Apartments | 0 | 0.0% |
| 5 to 9 Unit Apartments | 0 | 0.0% |
| 10 or more Apartments | 0 | 0.0% |
| Mobile Home / Other | 179 | 24.0% |
| Total | 747 | 100.0% |
Housing Structures by Occupancy in Baldwin
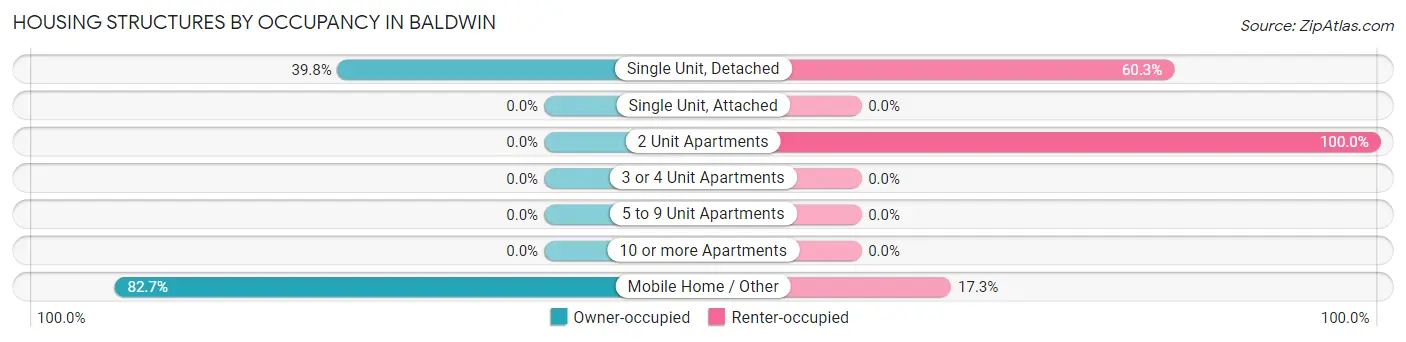
| Structure Type | Owner-occupied | Renter-occupied |
| Single Unit, Detached | 219 (39.8%) | 332 (60.3%) |
| Single Unit, Attached | 0 (0.0%) | 0 (0.0%) |
| 2 Unit Apartments | 0 (0.0%) | 17 (100.0%) |
| 3 or 4 Unit Apartments | 0 (0.0%) | 0 (0.0%) |
| 5 to 9 Unit Apartments | 0 (0.0%) | 0 (0.0%) |
| 10 or more Apartments | 0 (0.0%) | 0 (0.0%) |
| Mobile Home / Other | 148 (82.7%) | 31 (17.3%) |
| Total | 367 (49.1%) | 380 (50.9%) |
Housing Structures by Number of Rooms in Baldwin
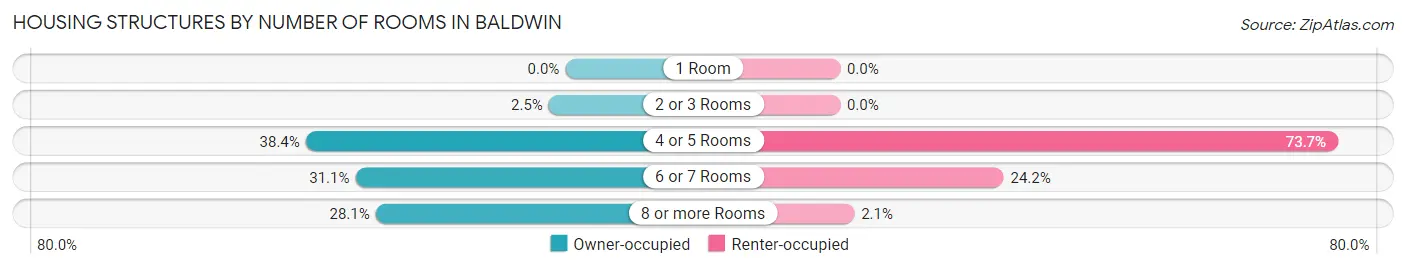
| Number of Rooms | Owner-occupied | Renter-occupied |
| 1 Room | 0 (0.0%) | 0 (0.0%) |
| 2 or 3 Rooms | 9 (2.5%) | 0 (0.0%) |
| 4 or 5 Rooms | 141 (38.4%) | 280 (73.7%) |
| 6 or 7 Rooms | 114 (31.1%) | 92 (24.2%) |
| 8 or more Rooms | 103 (28.1%) | 8 (2.1%) |
| Total | 367 (100.0%) | 380 (100.0%) |
Housing Structure by Heating Type in Baldwin
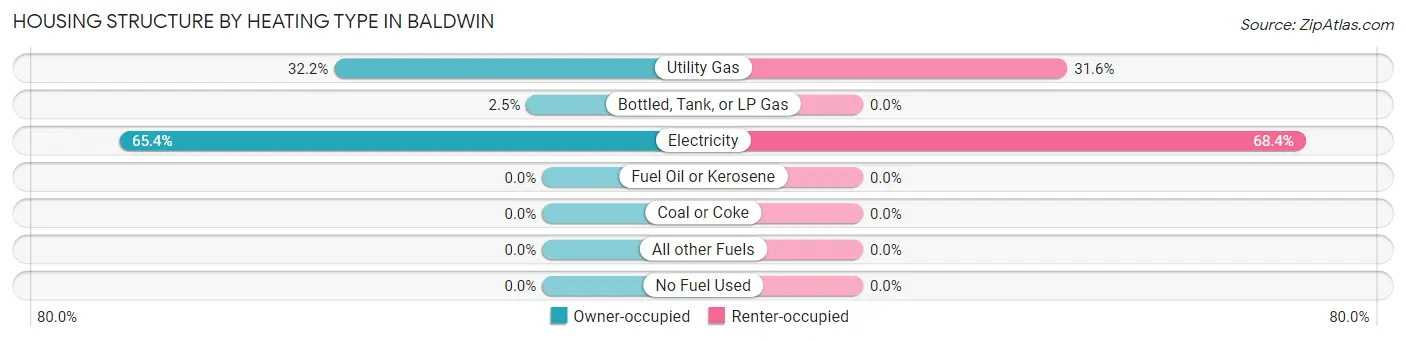
| Heating Type | Owner-occupied | Renter-occupied |
| Utility Gas | 118 (32.2%) | 120 (31.6%) |
| Bottled, Tank, or LP Gas | 9 (2.5%) | 0 (0.0%) |
| Electricity | 240 (65.4%) | 260 (68.4%) |
| Fuel Oil or Kerosene | 0 (0.0%) | 0 (0.0%) |
| Coal or Coke | 0 (0.0%) | 0 (0.0%) |
| All other Fuels | 0 (0.0%) | 0 (0.0%) |
| No Fuel Used | 0 (0.0%) | 0 (0.0%) |
| Total | 367 (100.0%) | 380 (100.0%) |
Household Vehicle Usage in Baldwin
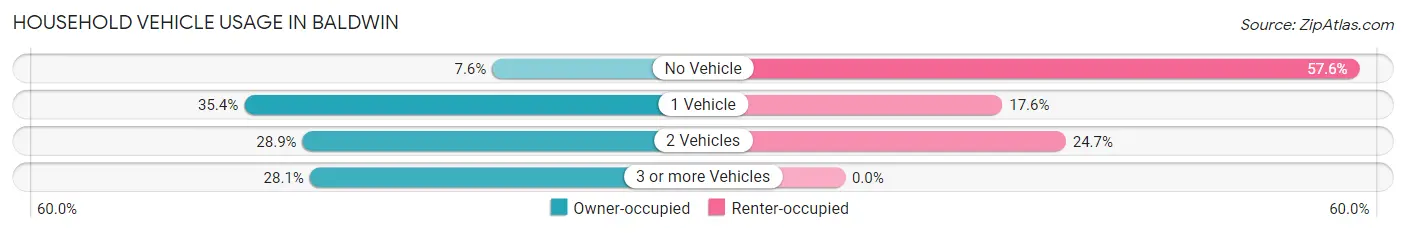
| Vehicles per Household | Owner-occupied | Renter-occupied |
| No Vehicle | 28 (7.6%) | 219 (57.6%) |
| 1 Vehicle | 130 (35.4%) | 67 (17.6%) |
| 2 Vehicles | 106 (28.9%) | 94 (24.7%) |
| 3 or more Vehicles | 103 (28.1%) | 0 (0.0%) |
| Total | 367 (100.0%) | 380 (100.0%) |
Real Estate & Mortgages in Baldwin
Real Estate and Mortgage Overview in Baldwin
| Characteristic | Without Mortgage | With Mortgage |
| Housing Units | 260 | 107 |
| Median Property Value | $89,500 | $135,400 |
| Median Household Income | $44,868 | $15 |
| Monthly Housing Costs | $341 | $0 |
| Real Estate Taxes | $199 | $31 |
Property Value by Mortgage Status in Baldwin
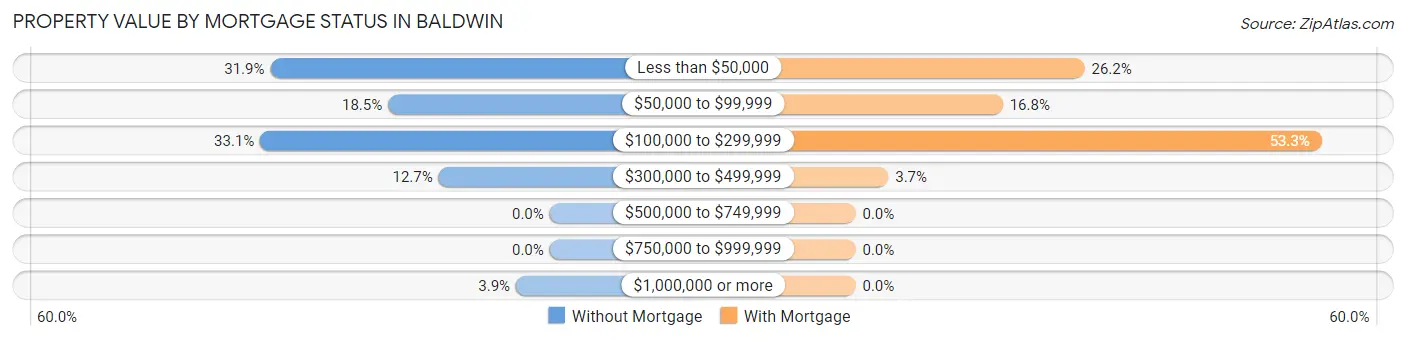
| Property Value | Without Mortgage | With Mortgage |
| Less than $50,000 | 83 (31.9%) | 28 (26.2%) |
| $50,000 to $99,999 | 48 (18.5%) | 18 (16.8%) |
| $100,000 to $299,999 | 86 (33.1%) | 57 (53.3%) |
| $300,000 to $499,999 | 33 (12.7%) | 4 (3.7%) |
| $500,000 to $749,999 | 0 (0.0%) | 0 (0.0%) |
| $750,000 to $999,999 | 0 (0.0%) | 0 (0.0%) |
| $1,000,000 or more | 10 (3.8%) | 0 (0.0%) |
| Total | 260 (100.0%) | 107 (100.0%) |
Household Income by Mortgage Status in Baldwin
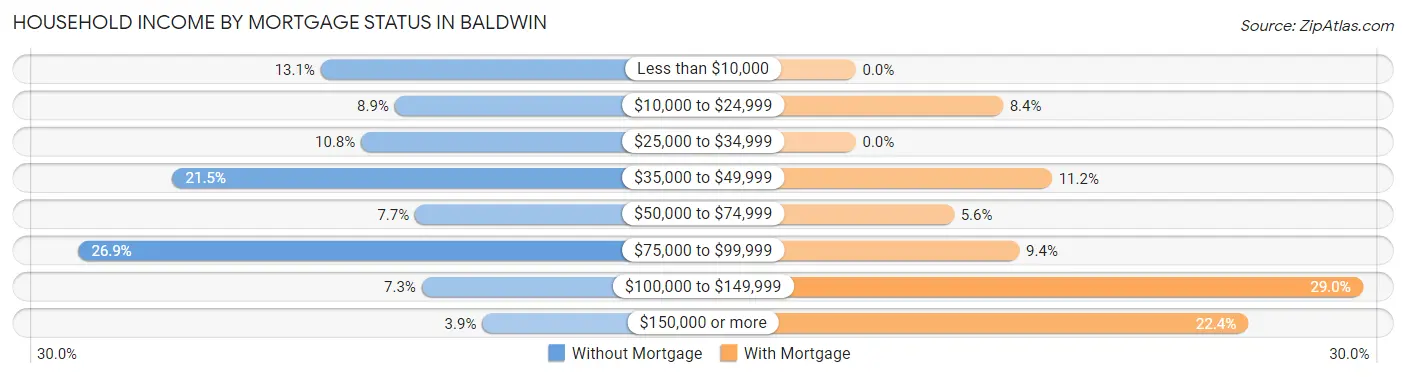
| Household Income | Without Mortgage | With Mortgage |
| Less than $10,000 | 34 (13.1%) | 0 (0.0%) |
| $10,000 to $24,999 | 23 (8.8%) | 9 (8.4%) |
| $25,000 to $34,999 | 28 (10.8%) | 0 (0.0%) |
| $35,000 to $49,999 | 56 (21.5%) | 12 (11.2%) |
| $50,000 to $74,999 | 20 (7.7%) | 6 (5.6%) |
| $75,000 to $99,999 | 70 (26.9%) | 10 (9.3%) |
| $100,000 to $149,999 | 19 (7.3%) | 31 (29.0%) |
| $150,000 or more | 10 (3.8%) | 24 (22.4%) |
| Total | 260 (100.0%) | 107 (100.0%) |
Property Value to Household Income Ratio in Baldwin
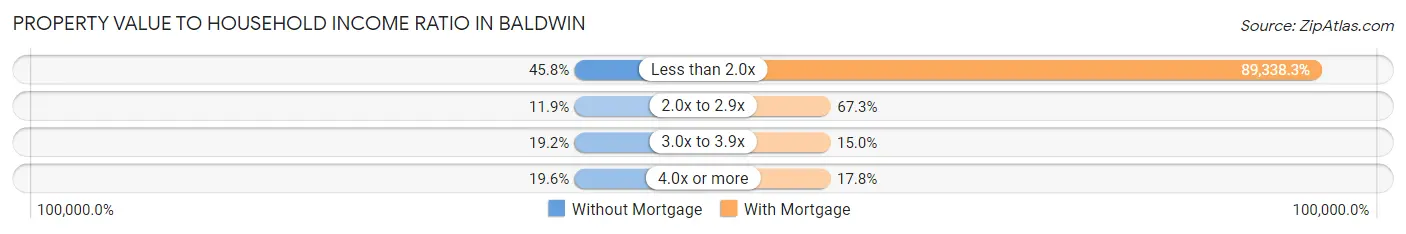
| Value-to-Income Ratio | Without Mortgage | With Mortgage |
| Less than 2.0x | 119 (45.8%) | 95,592 (89,338.3%) |
| 2.0x to 2.9x | 31 (11.9%) | 72 (67.3%) |
| 3.0x to 3.9x | 50 (19.2%) | 16 (14.9%) |
| 4.0x or more | 51 (19.6%) | 19 (17.8%) |
| Total | 260 (100.0%) | 107 (100.0%) |
Real Estate Taxes by Mortgage Status in Baldwin
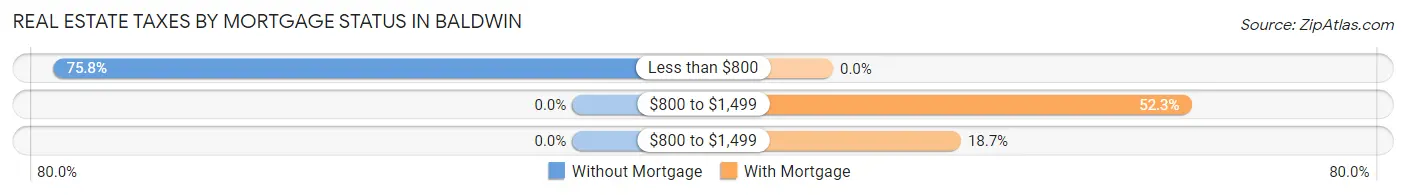
| Property Taxes | Without Mortgage | With Mortgage |
| Less than $800 | 197 (75.8%) | 0 (0.0%) |
| $800 to $1,499 | 0 (0.0%) | 56 (52.3%) |
| $800 to $1,499 | 0 (0.0%) | 20 (18.7%) |
| Total | 260 (100.0%) | 107 (100.0%) |
Health & Disability in Baldwin
Health Insurance Coverage by Age in Baldwin
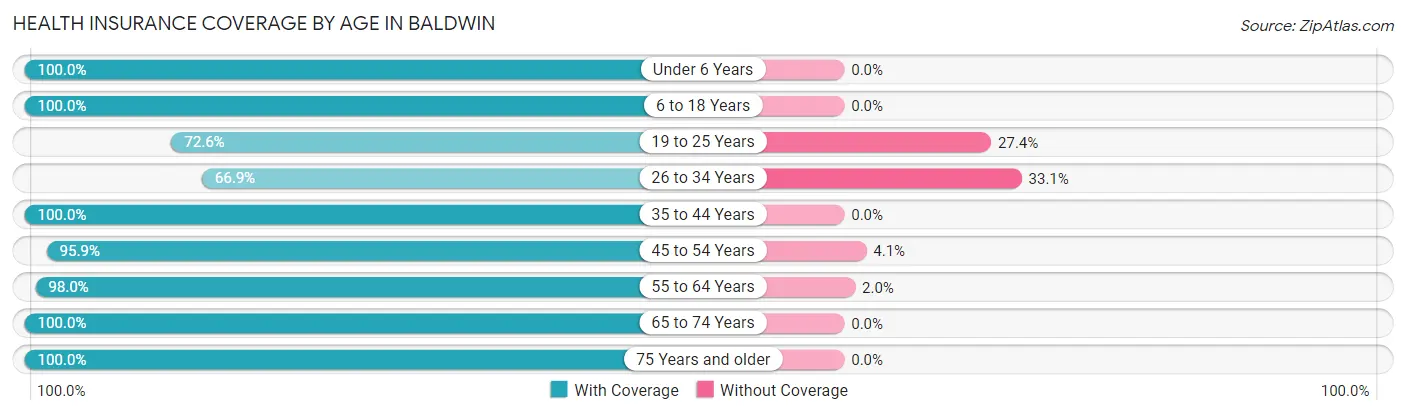
| Age Bracket | With Coverage | Without Coverage |
| Under 6 Years | 135 (100.0%) | 0 (0.0%) |
| 6 to 18 Years | 111 (100.0%) | 0 (0.0%) |
| 19 to 25 Years | 122 (72.6%) | 46 (27.4%) |
| 26 to 34 Years | 340 (66.9%) | 168 (33.1%) |
| 35 to 44 Years | 339 (100.0%) | 0 (0.0%) |
| 45 to 54 Years | 210 (95.9%) | 9 (4.1%) |
| 55 to 64 Years | 339 (98.0%) | 7 (2.0%) |
| 65 to 74 Years | 139 (100.0%) | 0 (0.0%) |
| 75 Years and older | 100 (100.0%) | 0 (0.0%) |
| Total | 1,835 (88.9%) | 230 (11.1%) |
Health Insurance Coverage by Citizenship Status in Baldwin
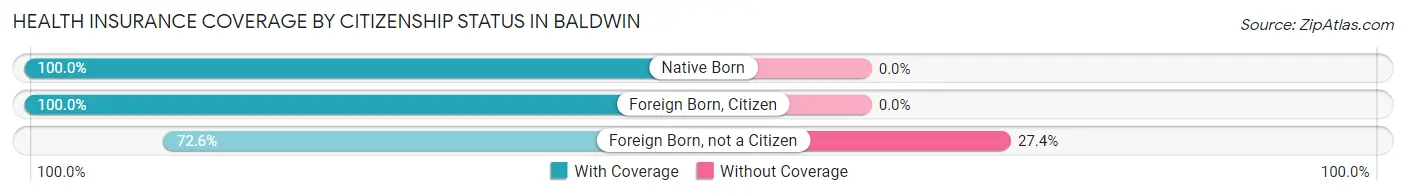
| Citizenship Status | With Coverage | Without Coverage |
| Native Born | 135 (100.0%) | 0 (0.0%) |
| Foreign Born, Citizen | 111 (100.0%) | 0 (0.0%) |
| Foreign Born, not a Citizen | 122 (72.6%) | 46 (27.4%) |
Health Insurance Coverage by Household Income in Baldwin
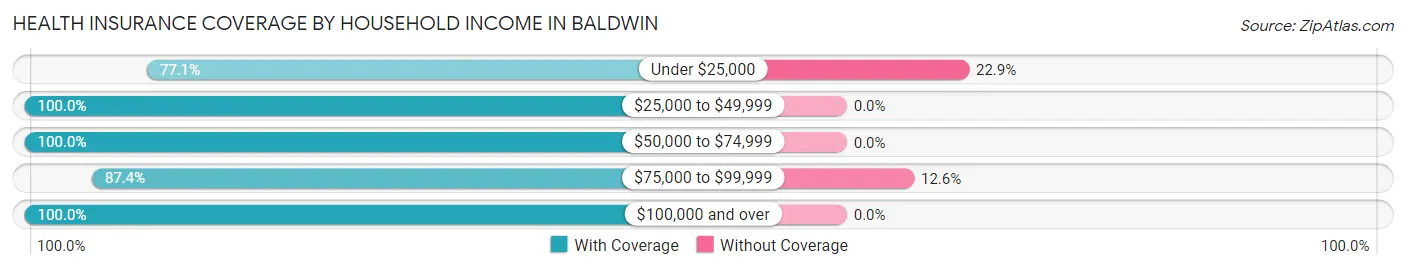
| Household Income | With Coverage | Without Coverage |
| Under $25,000 | 619 (77.1%) | 184 (22.9%) |
| $25,000 to $49,999 | 595 (100.0%) | 0 (0.0%) |
| $50,000 to $74,999 | 49 (100.0%) | 0 (0.0%) |
| $75,000 to $99,999 | 319 (87.4%) | 46 (12.6%) |
| $100,000 and over | 249 (100.0%) | 0 (0.0%) |
Public vs Private Health Insurance Coverage by Age in Baldwin
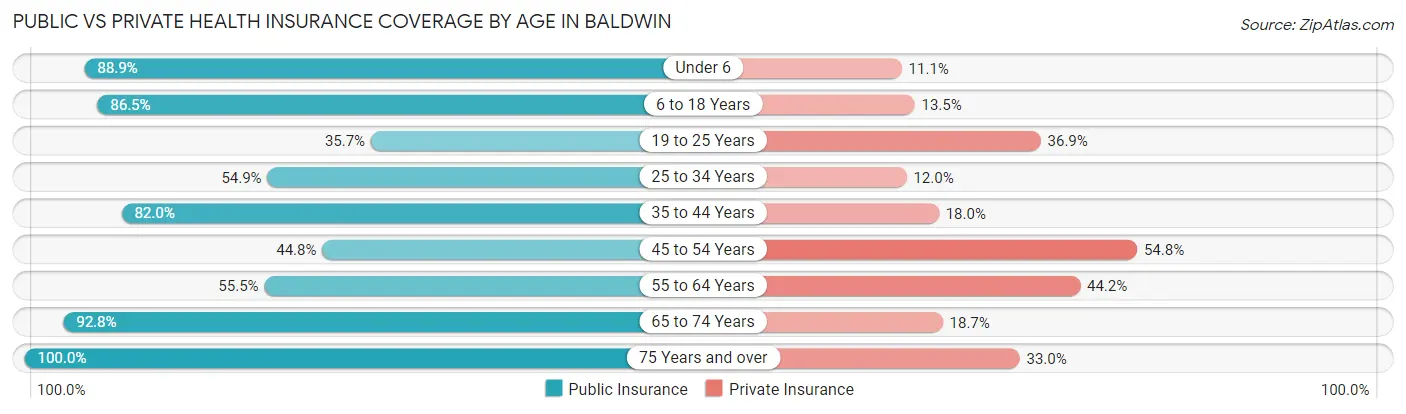
| Age Bracket | Public Insurance | Private Insurance |
| Under 6 | 120 (88.9%) | 15 (11.1%) |
| 6 to 18 Years | 96 (86.5%) | 15 (13.5%) |
| 19 to 25 Years | 60 (35.7%) | 62 (36.9%) |
| 25 to 34 Years | 279 (54.9%) | 61 (12.0%) |
| 35 to 44 Years | 278 (82.0%) | 61 (18.0%) |
| 45 to 54 Years | 98 (44.8%) | 120 (54.8%) |
| 55 to 64 Years | 192 (55.5%) | 153 (44.2%) |
| 65 to 74 Years | 129 (92.8%) | 26 (18.7%) |
| 75 Years and over | 100 (100.0%) | 33 (33.0%) |
| Total | 1,352 (65.5%) | 546 (26.4%) |
Disability Status by Sex by Age in Baldwin
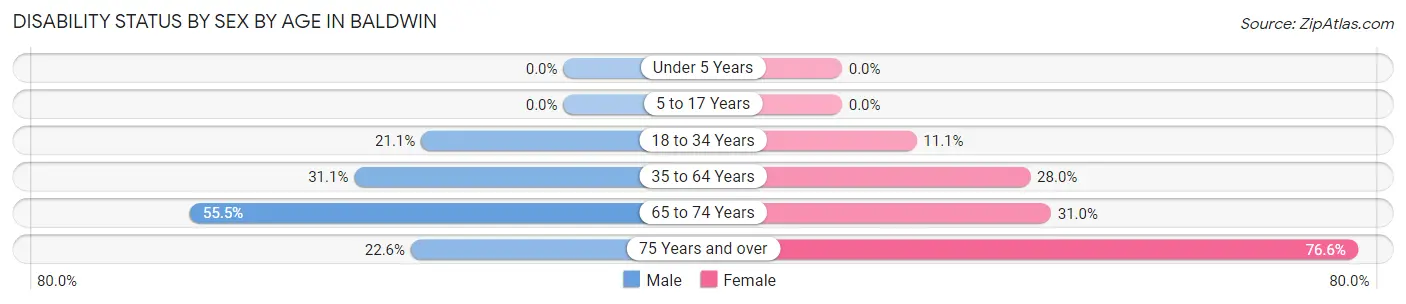
| Age Bracket | Male | Female |
| Under 5 Years | 0 (0.0%) | 0 (0.0%) |
| 5 to 17 Years | 0 (0.0%) | 0 (0.0%) |
| 18 to 34 Years | 83 (21.1%) | 33 (11.1%) |
| 35 to 64 Years | 163 (31.0%) | 106 (28.0%) |
| 65 to 74 Years | 61 (55.4%) | 9 (31.0%) |
| 75 Years and over | 12 (22.6%) | 36 (76.6%) |
Disability Class by Sex by Age in Baldwin
Disability Class: Hearing Difficulty
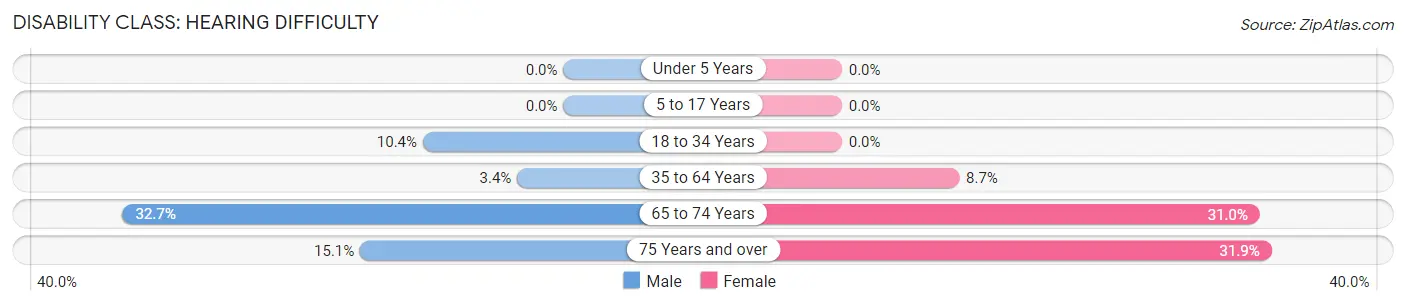
| Age Bracket | Male | Female |
| Under 5 Years | 0 (0.0%) | 0 (0.0%) |
| 5 to 17 Years | 0 (0.0%) | 0 (0.0%) |
| 18 to 34 Years | 41 (10.4%) | 0 (0.0%) |
| 35 to 64 Years | 18 (3.4%) | 33 (8.7%) |
| 65 to 74 Years | 36 (32.7%) | 9 (31.0%) |
| 75 Years and over | 8 (15.1%) | 15 (31.9%) |
Disability Class: Vision Difficulty
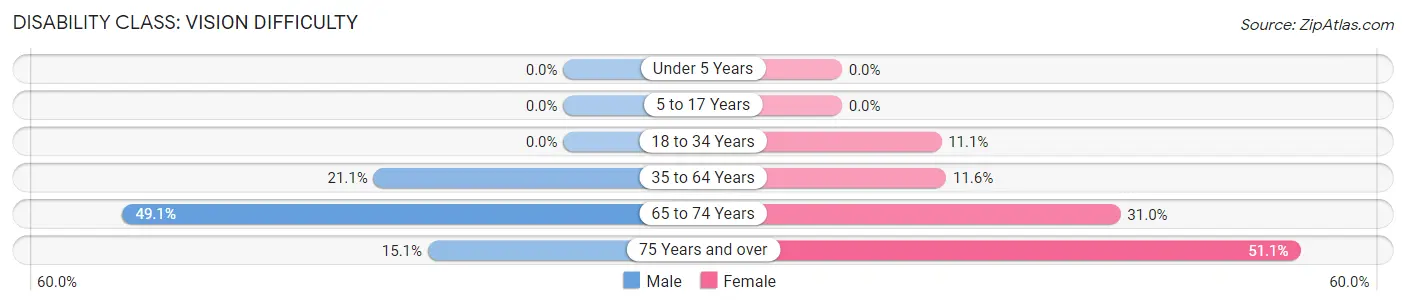
| Age Bracket | Male | Female |
| Under 5 Years | 0 (0.0%) | 0 (0.0%) |
| 5 to 17 Years | 0 (0.0%) | 0 (0.0%) |
| 18 to 34 Years | 0 (0.0%) | 33 (11.1%) |
| 35 to 64 Years | 111 (21.1%) | 44 (11.6%) |
| 65 to 74 Years | 54 (49.1%) | 9 (31.0%) |
| 75 Years and over | 8 (15.1%) | 24 (51.1%) |
Disability Class: Cognitive Difficulty
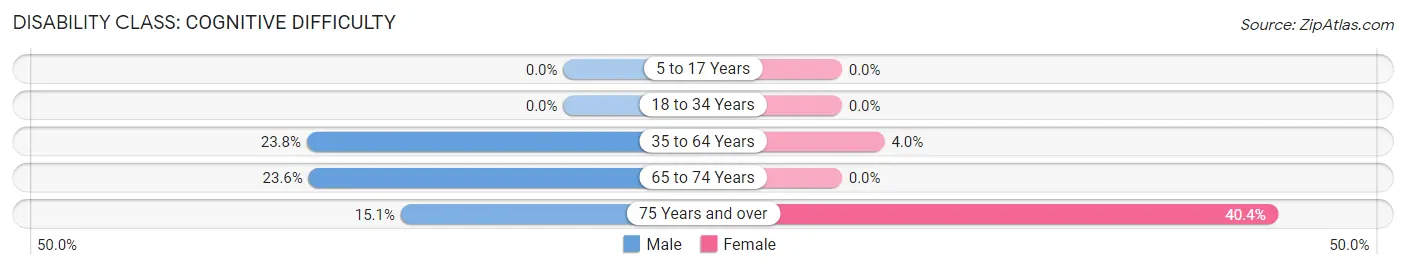
| Age Bracket | Male | Female |
| 5 to 17 Years | 0 (0.0%) | 0 (0.0%) |
| 18 to 34 Years | 0 (0.0%) | 0 (0.0%) |
| 35 to 64 Years | 125 (23.8%) | 15 (4.0%) |
| 65 to 74 Years | 26 (23.6%) | 0 (0.0%) |
| 75 Years and over | 8 (15.1%) | 19 (40.4%) |
Disability Class: Ambulatory Difficulty
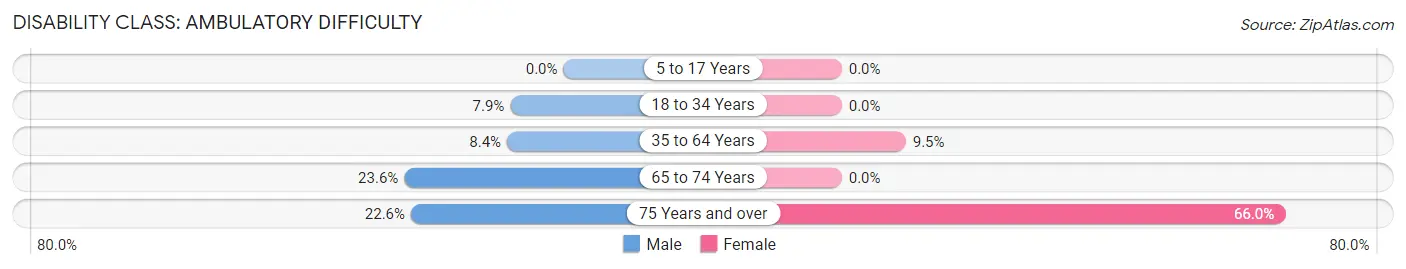
| Age Bracket | Male | Female |
| 5 to 17 Years | 0 (0.0%) | 0 (0.0%) |
| 18 to 34 Years | 31 (7.9%) | 0 (0.0%) |
| 35 to 64 Years | 44 (8.4%) | 36 (9.5%) |
| 65 to 74 Years | 26 (23.6%) | 0 (0.0%) |
| 75 Years and over | 12 (22.6%) | 31 (66.0%) |
Disability Class: Self-Care Difficulty
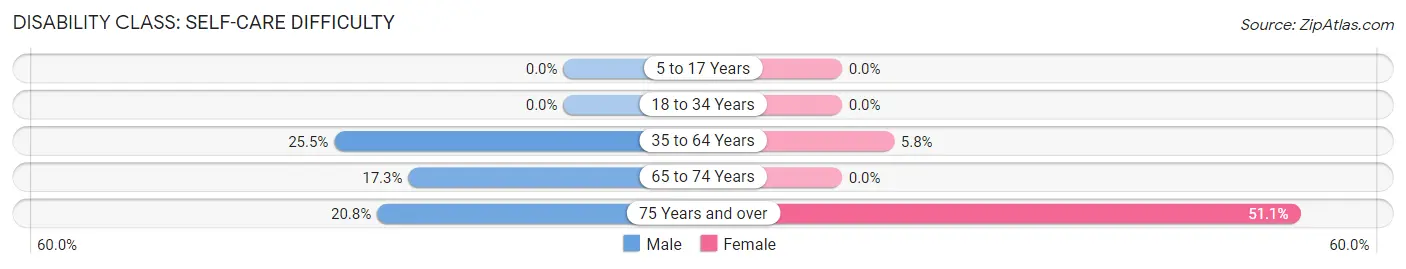
| Age Bracket | Male | Female |
| 5 to 17 Years | 0 (0.0%) | 0 (0.0%) |
| 18 to 34 Years | 0 (0.0%) | 0 (0.0%) |
| 35 to 64 Years | 134 (25.5%) | 22 (5.8%) |
| 65 to 74 Years | 19 (17.3%) | 0 (0.0%) |
| 75 Years and over | 11 (20.7%) | 24 (51.1%) |
Technology Access in Baldwin
Computing Device Access in Baldwin
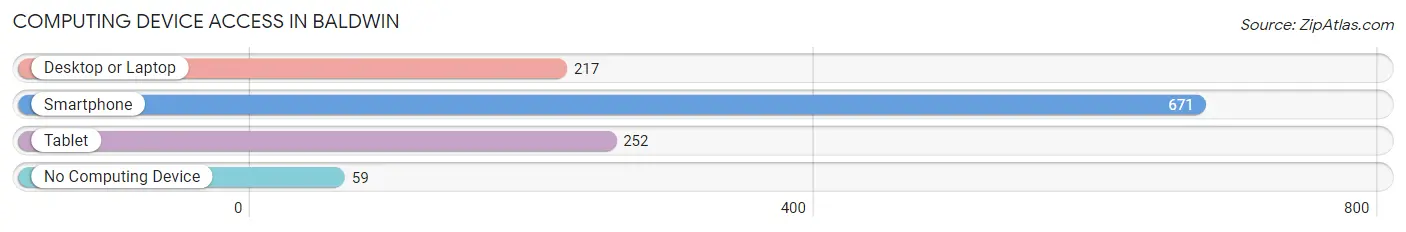
| Device Type | # Households | % Households |
| Desktop or Laptop | 217 | 29.0% |
| Smartphone | 671 | 89.8% |
| Tablet | 252 | 33.7% |
| No Computing Device | 59 | 7.9% |
| Total | 747 | 100.0% |
Internet Access in Baldwin
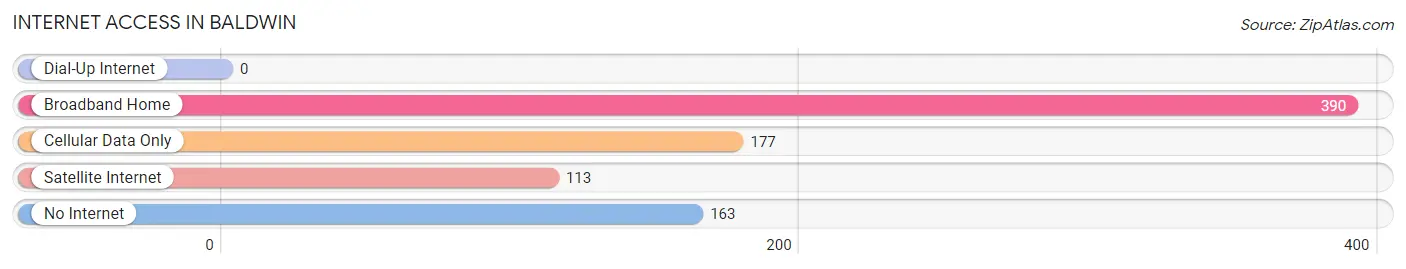
| Internet Type | # Households | % Households |
| Dial-Up Internet | 0 | 0.0% |
| Broadband Home | 390 | 52.2% |
| Cellular Data Only | 177 | 23.7% |
| Satellite Internet | 113 | 15.1% |
| No Internet | 163 | 21.8% |
| Total | 747 | 100.0% |
Baldwin Summary
Baldwin is a small town located in the state of Louisiana, in the United States of America. It is situated in the northern part of the state, in the parish of St. Mary. The town has a population of approximately 1,000 people, and is located on the banks of the Atchafalaya River.
History
The town of Baldwin was founded in 1845 by a group of settlers from the nearby town of Franklin. The settlers were looking for a place to settle and start a new life, and they chose the area around the Atchafalaya River. The town was named after the first settler, John Baldwin.
The town grew slowly over the years, and by the early 1900s, it had become a thriving community. The town was home to a variety of businesses, including a sawmill, a cotton gin, and a general store. The town also had a school, a post office, and a church.
In the late 1940s, the town began to decline as the population moved away to larger cities. By the 1970s, the town had become a ghost town, with only a few residents remaining. In the 1980s, the town began to experience a revival, as new businesses and residents moved into the area.
Geography
Baldwin is located in the northern part of the state of Louisiana, in the parish of St. Mary. The town is situated on the banks of the Atchafalaya River, and is surrounded by swampland and forests. The town is located approximately 30 miles south of Baton Rouge, and is about an hour’s drive from New Orleans.
The town is located in a humid subtropical climate zone, and experiences hot, humid summers and mild winters. The average temperature in the summer is around 90 degrees Fahrenheit, and the average temperature in the winter is around 50 degrees Fahrenheit.
Economy
The economy of Baldwin is largely based on agriculture and forestry. The town is home to several farms, which produce a variety of crops, including corn, soybeans, and cotton. The town is also home to several timber companies, which harvest timber from the surrounding forests.
In addition to agriculture and forestry, the town is also home to several small businesses, including restaurants, stores, and other services. The town is also home to a few manufacturing companies, which produce a variety of products, including furniture and clothing.
Demographics
As of the 2010 census, the population of Baldwin was 1,000 people. The town is predominantly white, with approximately 90% of the population being white. The remaining 10% of the population is made up of African Americans, Hispanics, and other ethnicities.
The median household income in Baldwin is approximately $30,000, and the median home value is around $90,000. The town has a high rate of poverty, with approximately 25% of the population living below the poverty line.
Conclusion
Baldwin is a small town located in the northern part of the state of Louisiana. The town has a population of approximately 1,000 people, and is situated on the banks of the Atchafalaya River. The town’s economy is largely based on agriculture and forestry, and the town is home to several small businesses. The town is predominantly white, with approximately 90% of the population being white. The median household income in Baldwin is approximately $30,000, and the median home value is around $90,000.
Common Questions
What is Per Capita Income in Baldwin?
Per Capita income in Baldwin is $19,550.
What is the Median Family Income in Baldwin?
Median Family Income in Baldwin is $42,887.
What is the Median Household income in Baldwin?
Median Household Income in Baldwin is $29,473.
What is Income or Wage Gap in Baldwin?
Income or Wage Gap in Baldwin is 19.4%.
Women in Baldwin earn 80.6 cents for every dollar earned by a man.
What is Inequality or Gini Index in Baldwin?
Inequality or Gini Index in Baldwin is 0.48.
What is the Total Population of Baldwin?
Total Population of Baldwin is 2,065.
What is the Total Male Population of Baldwin?
Total Male Population of Baldwin is 1,115.
What is the Total Female Population of Baldwin?
Total Female Population of Baldwin is 950.
What is the Ratio of Males per 100 Females in Baldwin?
There are 117.37 Males per 100 Females in Baldwin.
What is the Ratio of Females per 100 Males in Baldwin?
There are 85.20 Females per 100 Males in Baldwin.
What is the Median Population Age in Baldwin?
Median Population Age in Baldwin is 37.6 Years.
What is the Average Family Size in Baldwin
Average Family Size in Baldwin is 3.6 People.
What is the Average Household Size in Baldwin
Average Household Size in Baldwin is 2.8 People.
How Large is the Labor Force in Baldwin?
There are 530 People in the Labor Forcein in Baldwin.
What is the Percentage of People in the Labor Force in Baldwin?
28.7% of People are in the Labor Force in Baldwin.
What is the Unemployment Rate in Baldwin?
Unemployment Rate in Baldwin is 0.8%.