Atlanta, LA Map & Demographics
Atlanta Map
Atlanta Overview
$21,421
PER CAPITA INCOME
$76,250
AVG FAMILY INCOME
4.0%
WAGE / INCOME GAP [ % ]
96.0¢/ $1
WAGE / INCOME GAP [ $ ]
0.52
INEQUALITY / GINI INDEX
159
TOTAL POPULATION
72
MALE POPULATION
87
FEMALE POPULATION
82.76
MALES / 100 FEMALES
120.83
FEMALES / 100 MALES
37.0
MEDIAN AGE
4.8
AVG FAMILY SIZE
3.5
AVG HOUSEHOLD SIZE
70
LABOR FORCE [ PEOPLE ]
49.0%
PERCENT IN LABOR FORCE
4.3%
UNEMPLOYMENT RATE
Atlanta Zip Codes
Income in Atlanta
Income Overview in Atlanta
| Characteristic | Number | Measure |
| Per Capita Income | 159 | $21,421 |
| Median Family Income | 28 | $76,250 |
| Mean Family Income | 28 | $79,875 |
| Median Household Income | 45 | $0 |
| Mean Household Income | 45 | $53,791 |
| Income Deficit | 28 | $0 |
| Wage / Income Gap (%) | 159 | 4.03% |
| Wage / Income Gap ($) | 159 | 95.97¢ per $1 |
| Gini / Inequality Index | 159 | 0.52 |
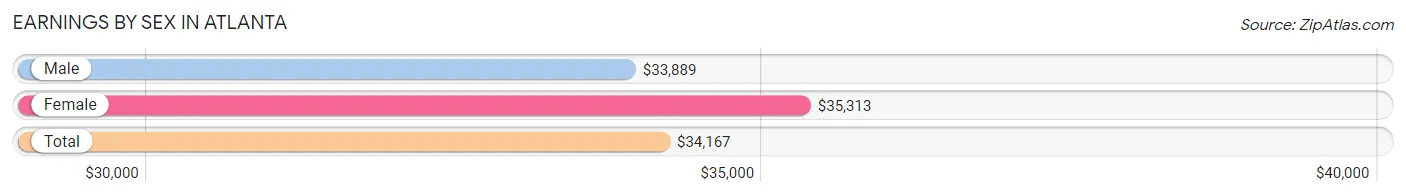
Earnings by Sex in Atlanta
Average Earnings in Atlanta are $34,167, $33,889 for men and $35,313 for women, a difference of 4.0%.
| Sex | Number | Average Earnings |
| Male | 36 (50.0%) | $33,889 |
| Female | 36 (50.0%) | $35,313 |
| Total | 72 (100.0%) | $34,167 |
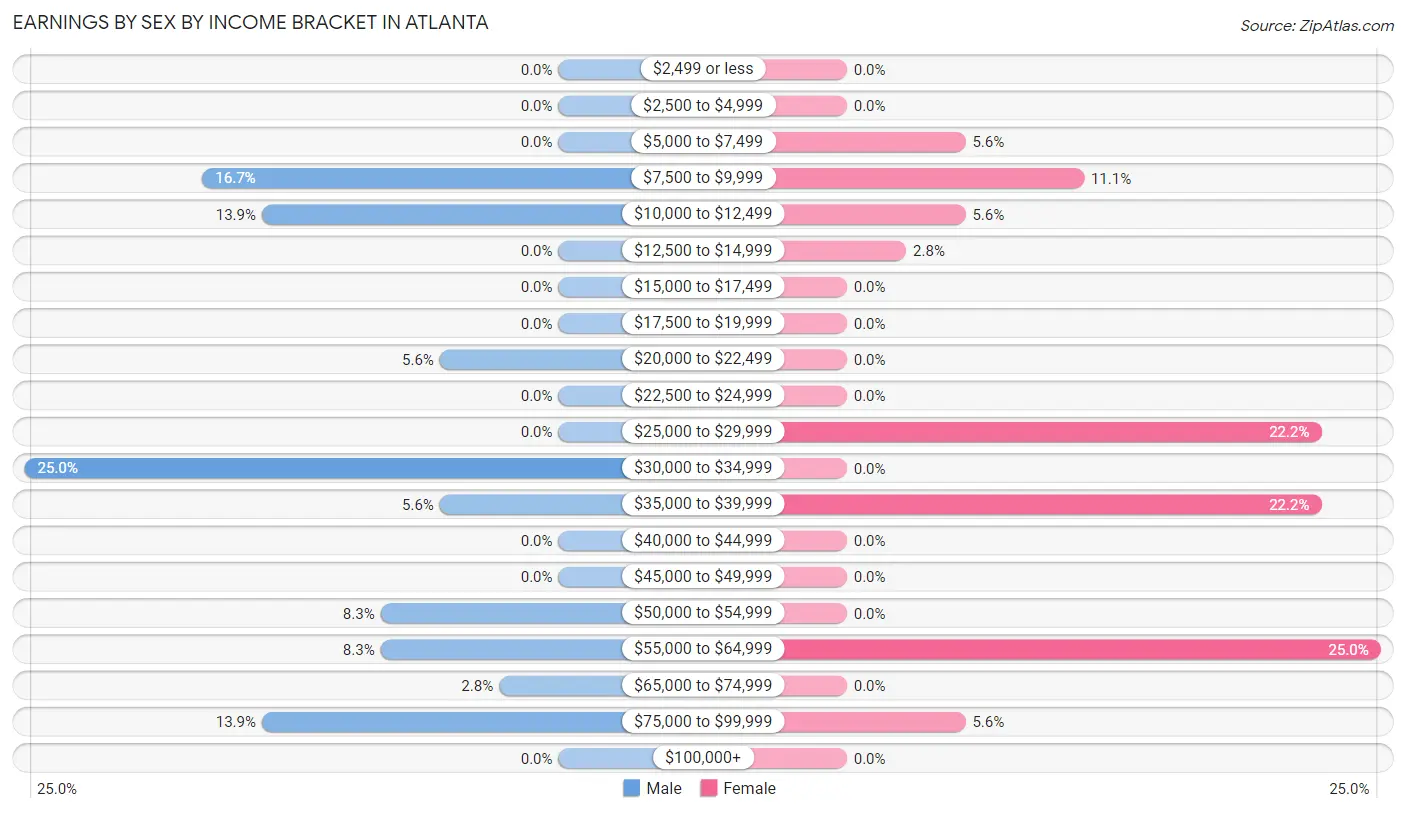
Earnings by Sex by Income Bracket in Atlanta
The most common earnings brackets in Atlanta are $30,000 to $34,999 for men (9 | 25.0%) and $55,000 to $64,999 for women (9 | 25.0%).
| Income | Male | Female |
| $2,499 or less | 0 (0.0%) | 0 (0.0%) |
| $2,500 to $4,999 | 0 (0.0%) | 0 (0.0%) |
| $5,000 to $7,499 | 0 (0.0%) | 2 (5.6%) |
| $7,500 to $9,999 | 6 (16.7%) | 4 (11.1%) |
| $10,000 to $12,499 | 5 (13.9%) | 2 (5.6%) |
| $12,500 to $14,999 | 0 (0.0%) | 1 (2.8%) |
| $15,000 to $17,499 | 0 (0.0%) | 0 (0.0%) |
| $17,500 to $19,999 | 0 (0.0%) | 0 (0.0%) |
| $20,000 to $22,499 | 2 (5.6%) | 0 (0.0%) |
| $22,500 to $24,999 | 0 (0.0%) | 0 (0.0%) |
| $25,000 to $29,999 | 0 (0.0%) | 8 (22.2%) |
| $30,000 to $34,999 | 9 (25.0%) | 0 (0.0%) |
| $35,000 to $39,999 | 2 (5.6%) | 8 (22.2%) |
| $40,000 to $44,999 | 0 (0.0%) | 0 (0.0%) |
| $45,000 to $49,999 | 0 (0.0%) | 0 (0.0%) |
| $50,000 to $54,999 | 3 (8.3%) | 0 (0.0%) |
| $55,000 to $64,999 | 3 (8.3%) | 9 (25.0%) |
| $65,000 to $74,999 | 1 (2.8%) | 0 (0.0%) |
| $75,000 to $99,999 | 5 (13.9%) | 2 (5.6%) |
| $100,000+ | 0 (0.0%) | 0 (0.0%) |
| Total | 36 (100.0%) | 36 (100.0%) |
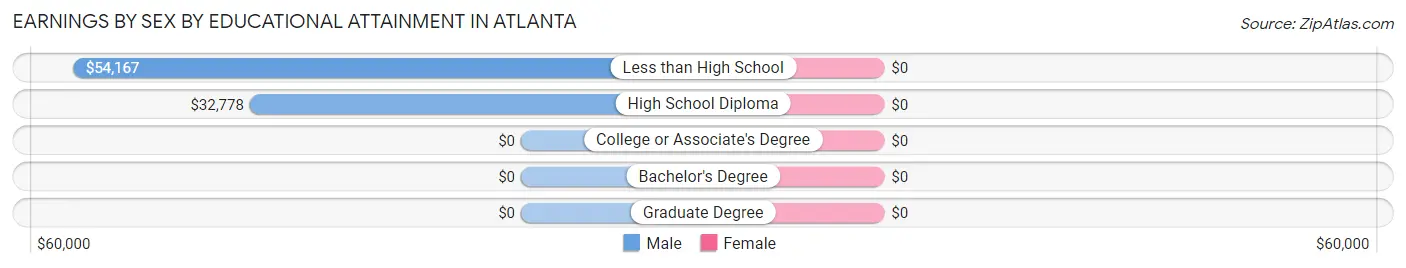
Earnings by Sex by Educational Attainment in Atlanta
| Educational Attainment | Male Income | Female Income |
| Less than High School | $54,167 | $0 |
| High School Diploma | $32,778 | $0 |
| College or Associate's Degree | - | - |
| Bachelor's Degree | - | - |
| Graduate Degree | - | - |
| Total | $34,722 | $35,781 |
Family Income in Atlanta
Family Income Brackets in Atlanta
According to the Atlanta family income data, there are 7 families falling into the $15,000 to $24,999 income range, which is the most common income bracket and makes up 25.0% of all families.
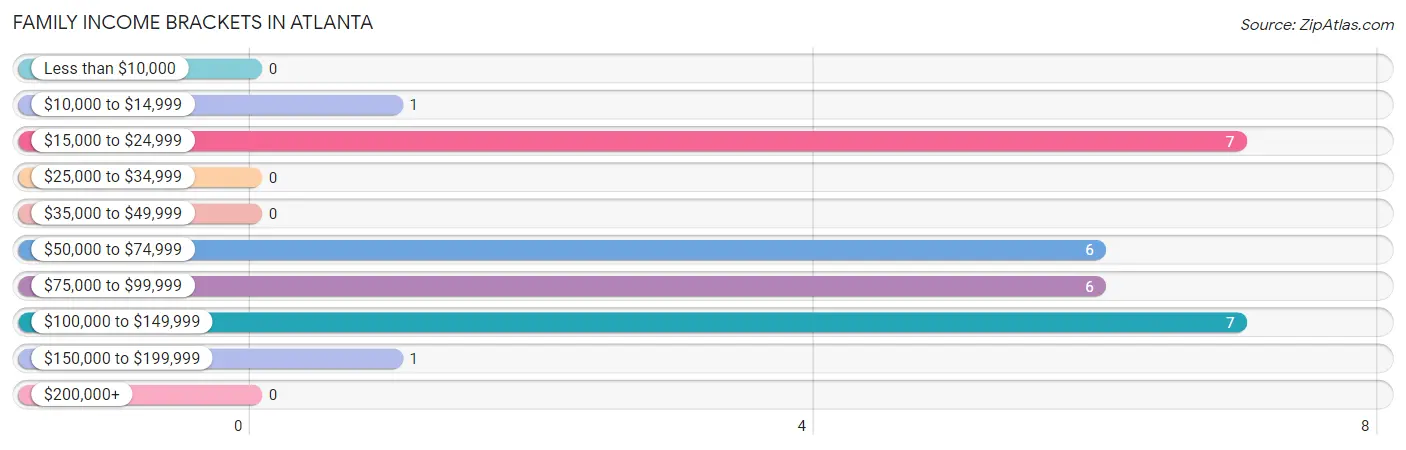
| Income Bracket | # Families | % Families |
| Less than $10,000 | 0 | 0.0% |
| $10,000 to $14,999 | 1 | 3.6% |
| $15,000 to $24,999 | 7 | 25.0% |
| $25,000 to $34,999 | 0 | 0.0% |
| $35,000 to $49,999 | 0 | 0.0% |
| $50,000 to $74,999 | 6 | 21.4% |
| $75,000 to $99,999 | 6 | 21.4% |
| $100,000 to $149,999 | 7 | 25.0% |
| $150,000 to $199,999 | 1 | 3.6% |
| $200,000+ | 0 | 0.0% |
Family Income by Famaliy Size in Atlanta
2-person families (15 | 53.6%) account for the highest median family income in Atlanta with $78,750 per family, while 2-person families (15 | 53.6%) have the highest median income of $39,375 per family member.
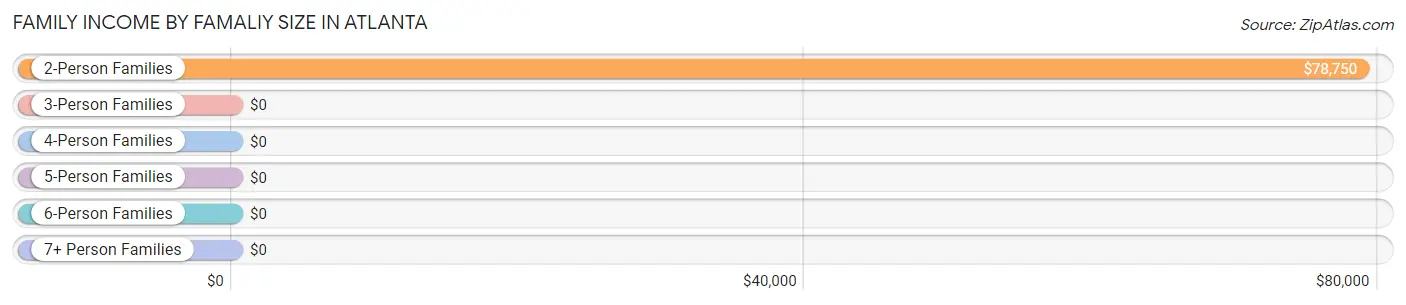
| Income Bracket | # Families | Median Income |
| 2-Person Families | 15 (53.6%) | $78,750 |
| 3-Person Families | 5 (17.9%) | $0 |
| 4-Person Families | 3 (10.7%) | $0 |
| 5-Person Families | 0 (0.0%) | $0 |
| 6-Person Families | 0 (0.0%) | $0 |
| 7+ Person Families | 5 (17.9%) | $0 |
| Total | 28 (100.0%) | $76,250 |
Family Income by Number of Earners in Atlanta
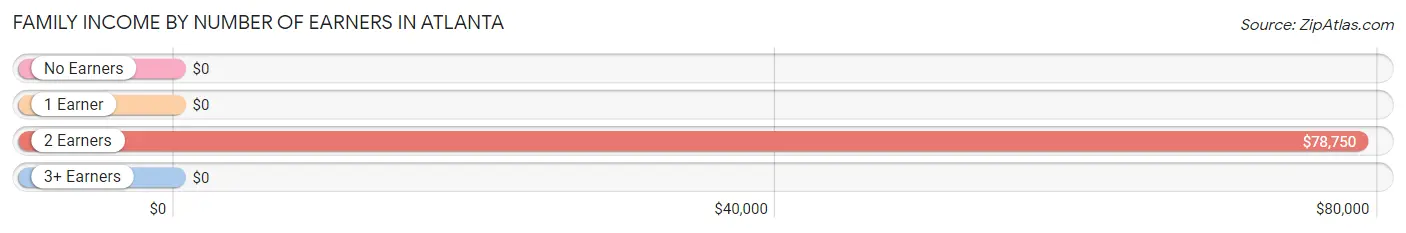
| Number of Earners | # Families | Median Income |
| No Earners | 4 (14.3%) | $0 |
| 1 Earner | 12 (42.9%) | $0 |
| 2 Earners | 5 (17.9%) | $78,750 |
| 3+ Earners | 7 (25.0%) | $0 |
| Total | 28 (100.0%) | $76,250 |
Household Income in Atlanta
Household Income Brackets in Atlanta
With 13 households falling in the category, the less than $10,000 income range is the most frequent in Atlanta, accounting for 28.9% of all households.
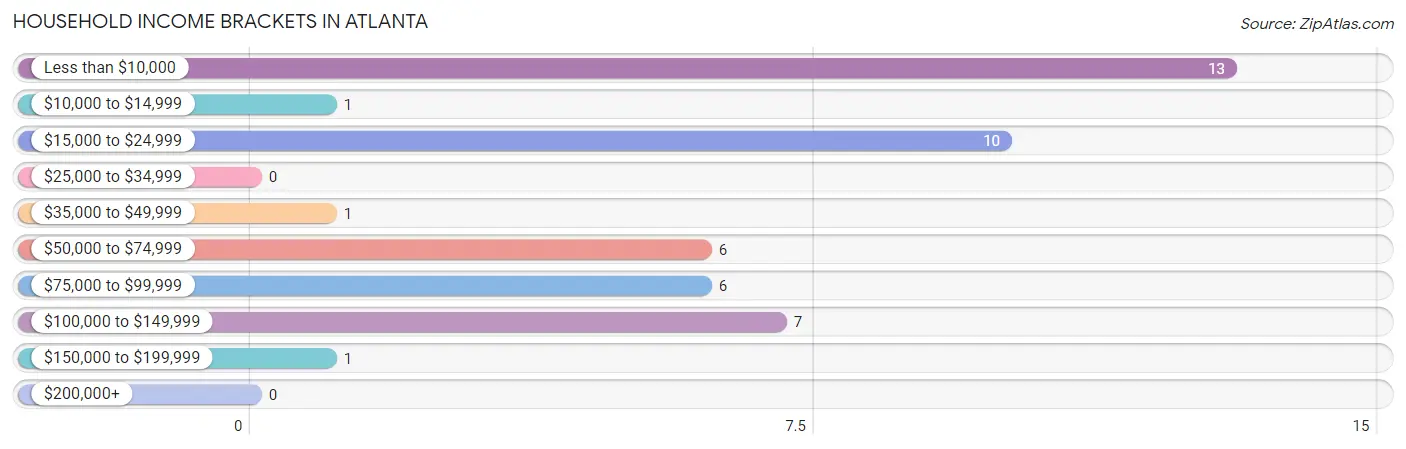
| Income Bracket | # Households | % Households |
| Less than $10,000 | 13 | 28.9% |
| $10,000 to $14,999 | 1 | 2.2% |
| $15,000 to $24,999 | 10 | 22.2% |
| $25,000 to $34,999 | 0 | 0.0% |
| $35,000 to $49,999 | 1 | 2.2% |
| $50,000 to $74,999 | 6 | 13.3% |
| $75,000 to $99,999 | 6 | 13.3% |
| $100,000 to $149,999 | 7 | 15.6% |
| $150,000 to $199,999 | 1 | 2.2% |
| $200,000+ | 0 | 0.0% |
Household Income by Householder Age in Atlanta
The median household income in Atlanta is $0, with the highest median household income of $73,333 found in the 45 to 64 years age bracket for the primary householder. A total of 12 households (26.7%) fall into this category.
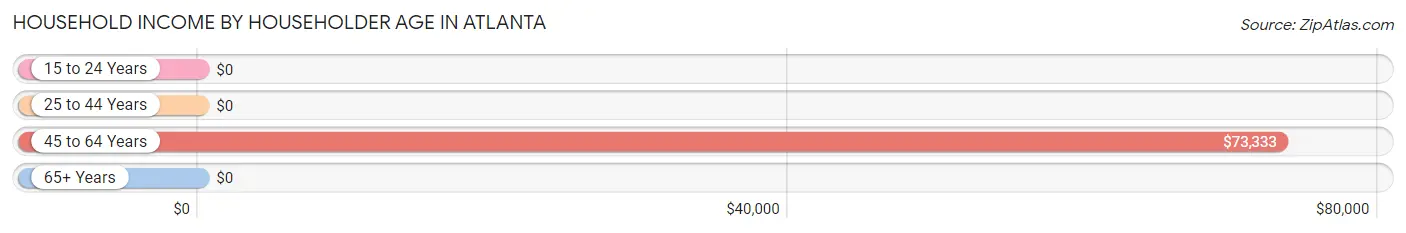
| Income Bracket | # Households | Median Income |
| 15 to 24 Years | 0 (0.0%) | $0 |
| 25 to 44 Years | 23 (51.1%) | $0 |
| 45 to 64 Years | 12 (26.7%) | $73,333 |
| 65+ Years | 10 (22.2%) | $0 |
| Total | 45 (100.0%) | $0 |
Poverty in Atlanta
Income Below Poverty by Sex and Age in Atlanta
With 12.5% poverty level for males and 28.7% for females among the residents of Atlanta, 18 to 24 year old males and 35 to 44 year old females are the most vulnerable to poverty, with 6 males (100.0%) and 15 females (48.4%) in their respective age groups living below the poverty level.
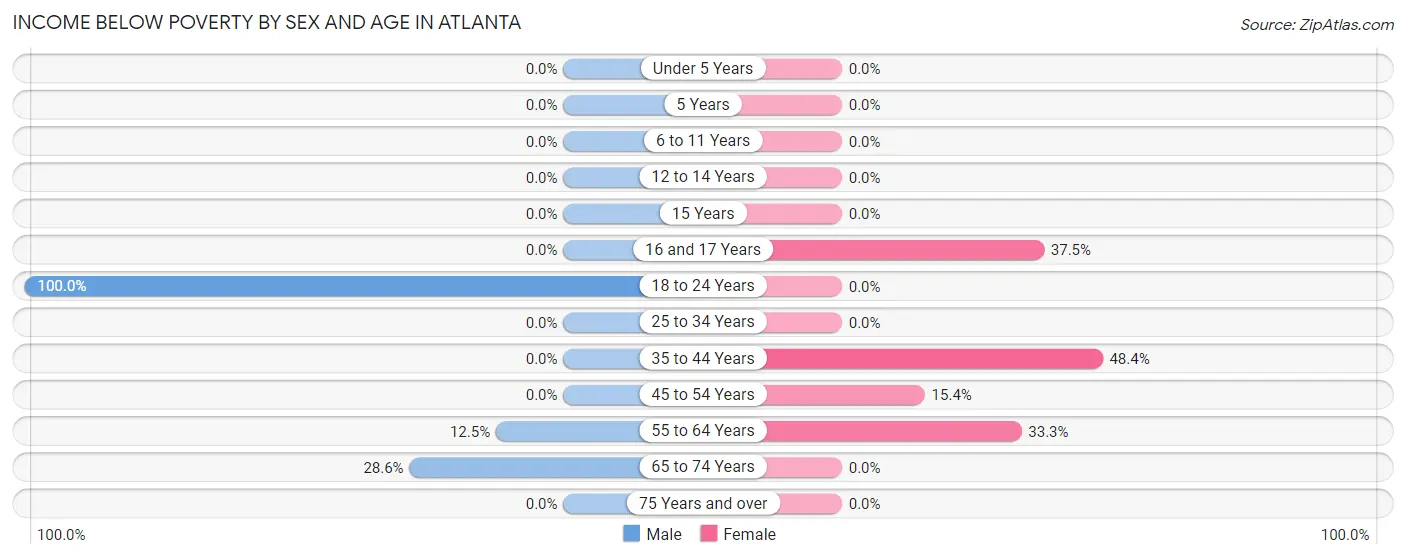
| Age Bracket | Male | Female |
| Under 5 Years | 0 (0.0%) | 0 (0.0%) |
| 5 Years | 0 (0.0%) | 0 (0.0%) |
| 6 to 11 Years | 0 (0.0%) | 0 (0.0%) |
| 12 to 14 Years | 0 (0.0%) | 0 (0.0%) |
| 15 Years | 0 (0.0%) | 0 (0.0%) |
| 16 and 17 Years | 0 (0.0%) | 6 (37.5%) |
| 18 to 24 Years | 6 (100.0%) | 0 (0.0%) |
| 25 to 34 Years | 0 (0.0%) | 0 (0.0%) |
| 35 to 44 Years | 0 (0.0%) | 15 (48.4%) |
| 45 to 54 Years | 0 (0.0%) | 2 (15.4%) |
| 55 to 64 Years | 1 (12.5%) | 2 (33.3%) |
| 65 to 74 Years | 2 (28.6%) | 0 (0.0%) |
| 75 Years and over | 0 (0.0%) | 0 (0.0%) |
| Total | 9 (12.5%) | 25 (28.7%) |
Income Above Poverty by Sex and Age in Atlanta
According to the poverty statistics in Atlanta, males aged 6 to 11 years and females aged 6 to 11 years are the age groups that are most secure financially, with 100.0% of males and 100.0% of females in these age groups living above the poverty line.
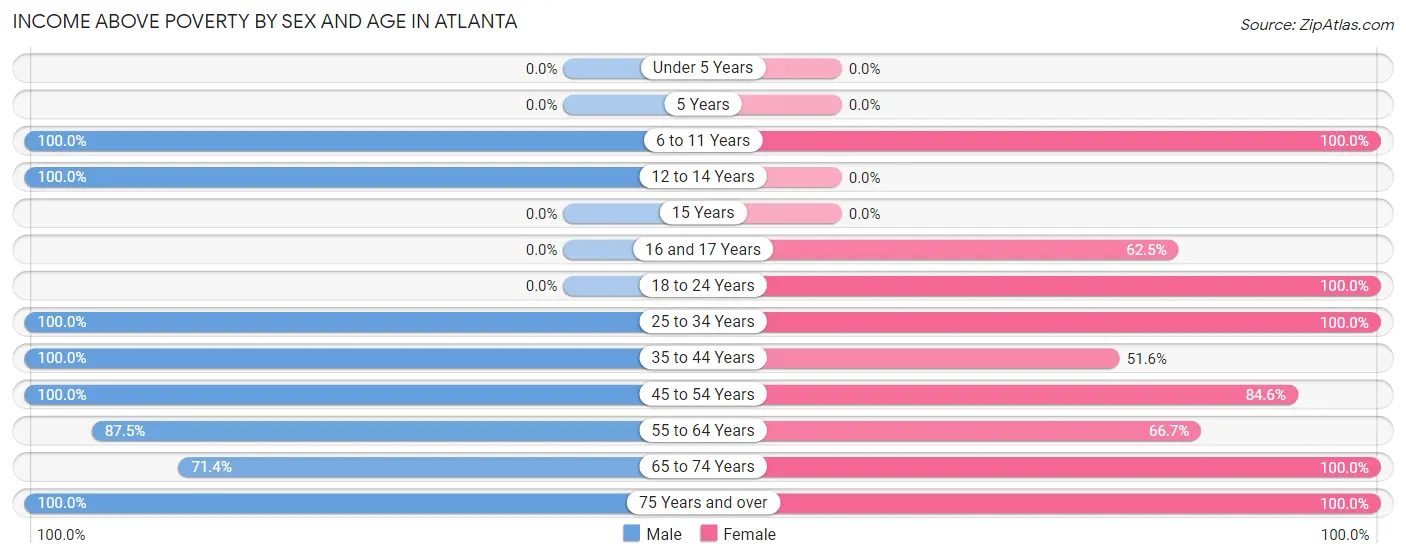
| Age Bracket | Male | Female |
| Under 5 Years | 0 (0.0%) | 0 (0.0%) |
| 5 Years | 0 (0.0%) | 0 (0.0%) |
| 6 to 11 Years | 4 (100.0%) | 2 (100.0%) |
| 12 to 14 Years | 10 (100.0%) | 0 (0.0%) |
| 15 Years | 0 (0.0%) | 0 (0.0%) |
| 16 and 17 Years | 0 (0.0%) | 10 (62.5%) |
| 18 to 24 Years | 0 (0.0%) | 3 (100.0%) |
| 25 to 34 Years | 13 (100.0%) | 12 (100.0%) |
| 35 to 44 Years | 10 (100.0%) | 16 (51.6%) |
| 45 to 54 Years | 13 (100.0%) | 11 (84.6%) |
| 55 to 64 Years | 7 (87.5%) | 4 (66.7%) |
| 65 to 74 Years | 5 (71.4%) | 2 (100.0%) |
| 75 Years and over | 1 (100.0%) | 2 (100.0%) |
| Total | 63 (87.5%) | 62 (71.3%) |
Income Below Poverty Among Married-Couple Families in Atlanta
The poverty statistics for married-couple families in Atlanta show that 12.5% or 3 of the total 24 families live below the poverty line. Families with no children have the highest poverty rate of 18.8%, comprising of 3 families. On the other hand, families with 1 or 2 children have the lowest poverty rate of 0.0%, which includes 0 families.
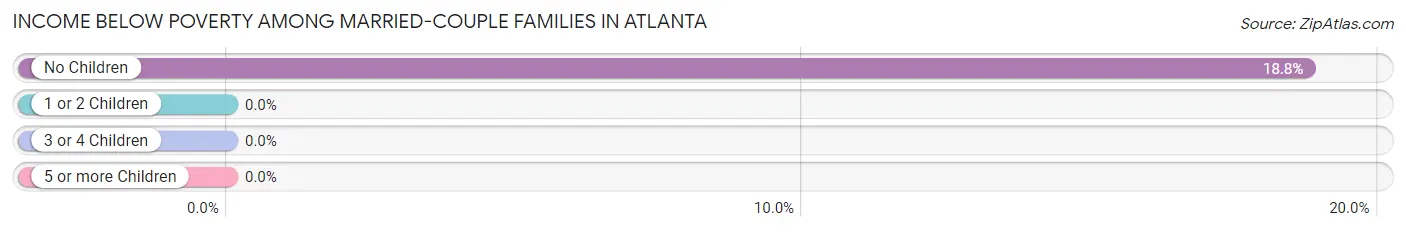
| Children | Above Poverty | Below Poverty |
| No Children | 13 (81.2%) | 3 (18.8%) |
| 1 or 2 Children | 8 (100.0%) | 0 (0.0%) |
| 3 or 4 Children | 0 (0.0%) | 0 (0.0%) |
| 5 or more Children | 0 (0.0%) | 0 (0.0%) |
| Total | 21 (87.5%) | 3 (12.5%) |
Income Below Poverty Among Single-Parent Households in Atlanta
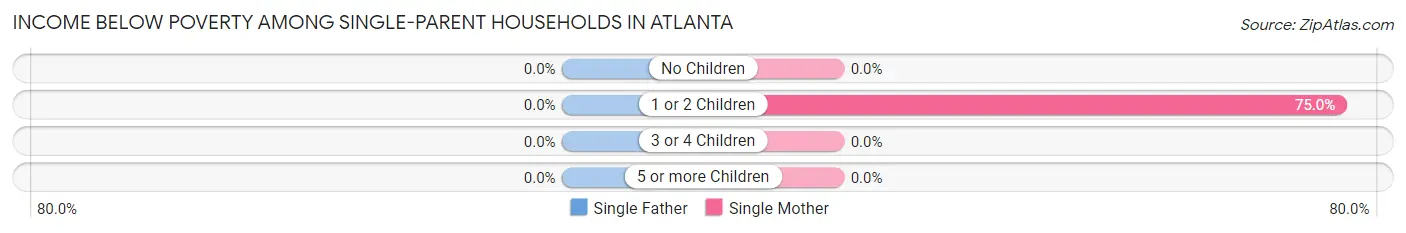
| Children | Single Father | Single Mother |
| No Children | 0 (0.0%) | 0 (0.0%) |
| 1 or 2 Children | 0 (0.0%) | 3 (75.0%) |
| 3 or 4 Children | 0 (0.0%) | 0 (0.0%) |
| 5 or more Children | 0 (0.0%) | 0 (0.0%) |
| Total | 0 (0.0%) | 3 (75.0%) |
Income Below Poverty Among Married-Couple vs Single-Parent Households in Atlanta
The poverty data for Atlanta shows that 3 of the married-couple family households (12.5%) and 3 of the single-parent households (75.0%) are living below the poverty level. Within the married-couple family households, those with no children have the highest poverty rate, with 3 households (18.8%) falling below the poverty line. Among the single-parent households, those with 1 or 2 children have the highest poverty rate, with 3 household (75.0%) living below poverty.
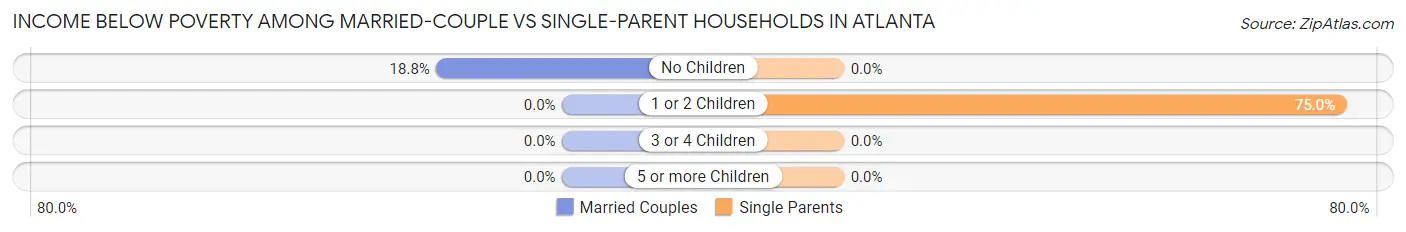
| Children | Married-Couple Families | Single-Parent Households |
| No Children | 3 (18.8%) | 0 (0.0%) |
| 1 or 2 Children | 0 (0.0%) | 3 (75.0%) |
| 3 or 4 Children | 0 (0.0%) | 0 (0.0%) |
| 5 or more Children | 0 (0.0%) | 0 (0.0%) |
| Total | 3 (12.5%) | 3 (75.0%) |
Race in Atlanta
The most populous races in Atlanta are White / Caucasian (123 | 77.4%), Black / African American (33 | 20.7%), and Two or more Races (3 | 1.9%).
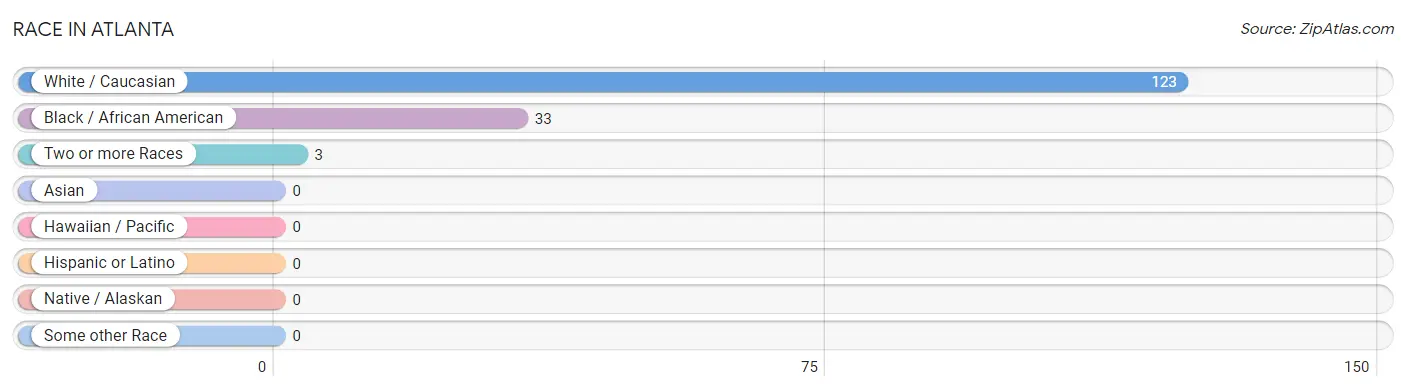
| Race | # Population | % Population |
| Asian | 0 | 0.0% |
| Black / African American | 33 | 20.7% |
| Hawaiian / Pacific | 0 | 0.0% |
| Hispanic or Latino | 0 | 0.0% |
| Native / Alaskan | 0 | 0.0% |
| White / Caucasian | 123 | 77.4% |
| Two or more Races | 3 | 1.9% |
| Some other Race | 0 | 0.0% |
| Total | 159 | 100.0% |
Ancestry in Atlanta
The most populous ancestries reported in Atlanta are Irish (5 | 3.1%), American (2 | 1.3%), English (2 | 1.3%), and Scottish (2 | 1.3%), together accounting for 6.9% of all Atlanta residents.
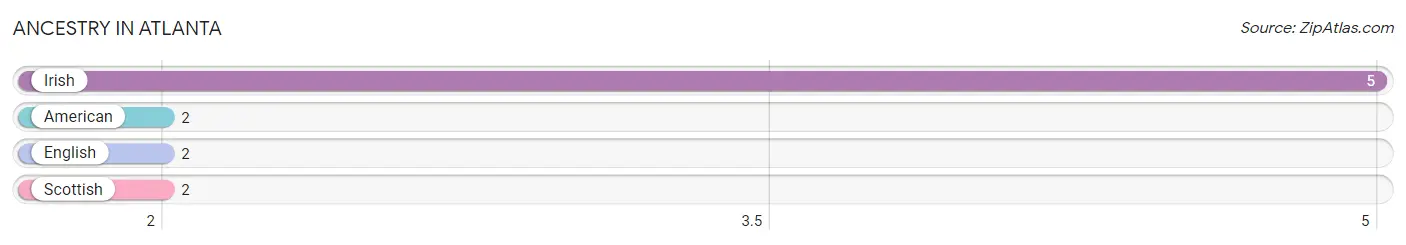
| Ancestry | # Population | % Population |
| American | 2 | 1.3% |
| English | 2 | 1.3% |
| Irish | 5 | 3.1% |
| Scottish | 2 | 1.3% | View All 4 Rows |
Immigrants in Atlanta

| Immigration Origin | # Population | % Population | View All 0 Rows |
Sex and Age in Atlanta
Sex and Age in Atlanta
The most populous age groups in Atlanta are 10 to 14 Years (14 | 19.4%) for men and 15 to 19 Years (19 | 21.8%) for women.
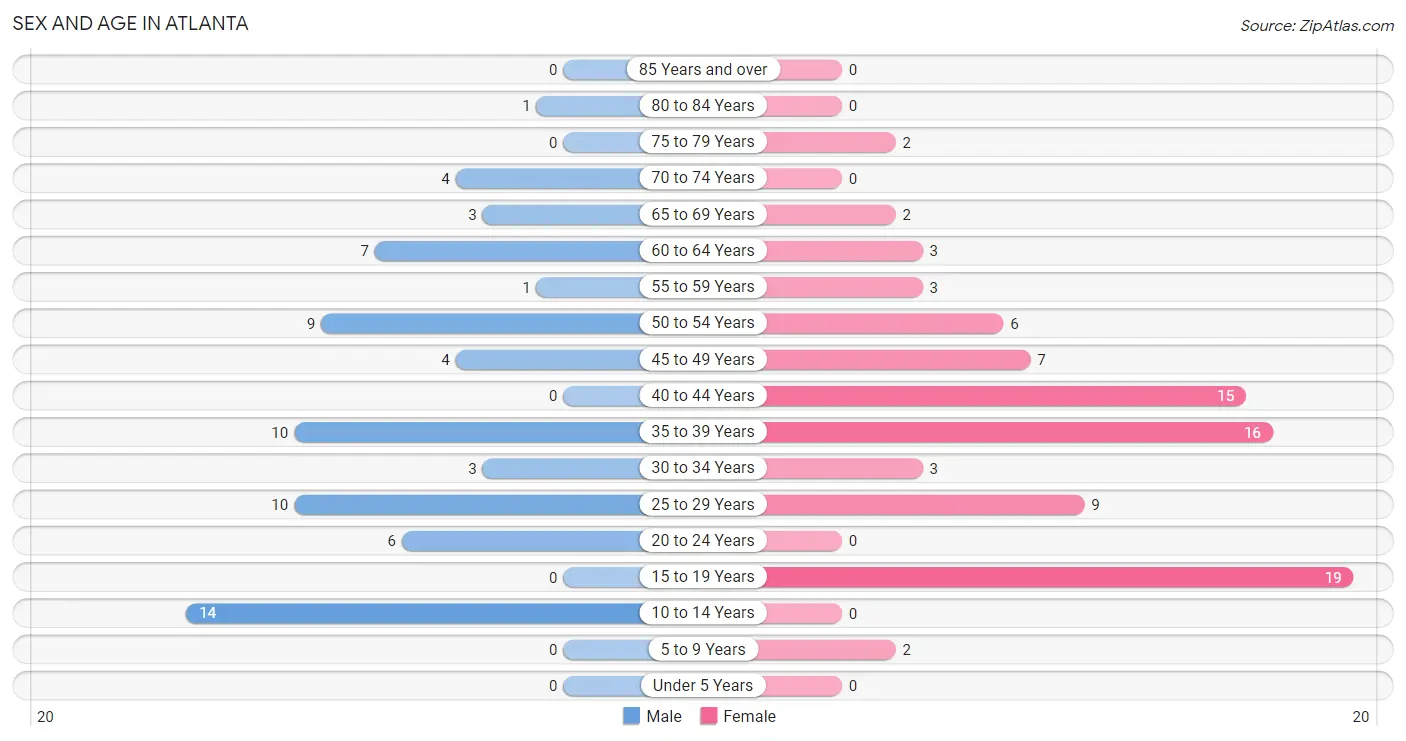
| Age Bracket | Male | Female |
| Under 5 Years | 0 (0.0%) | 0 (0.0%) |
| 5 to 9 Years | 0 (0.0%) | 2 (2.3%) |
| 10 to 14 Years | 14 (19.4%) | 0 (0.0%) |
| 15 to 19 Years | 0 (0.0%) | 19 (21.8%) |
| 20 to 24 Years | 6 (8.3%) | 0 (0.0%) |
| 25 to 29 Years | 10 (13.9%) | 9 (10.3%) |
| 30 to 34 Years | 3 (4.2%) | 3 (3.5%) |
| 35 to 39 Years | 10 (13.9%) | 16 (18.4%) |
| 40 to 44 Years | 0 (0.0%) | 15 (17.2%) |
| 45 to 49 Years | 4 (5.6%) | 7 (8.1%) |
| 50 to 54 Years | 9 (12.5%) | 6 (6.9%) |
| 55 to 59 Years | 1 (1.4%) | 3 (3.5%) |
| 60 to 64 Years | 7 (9.7%) | 3 (3.5%) |
| 65 to 69 Years | 3 (4.2%) | 2 (2.3%) |
| 70 to 74 Years | 4 (5.6%) | 0 (0.0%) |
| 75 to 79 Years | 0 (0.0%) | 2 (2.3%) |
| 80 to 84 Years | 1 (1.4%) | 0 (0.0%) |
| 85 Years and over | 0 (0.0%) | 0 (0.0%) |
| Total | 72 (100.0%) | 87 (100.0%) |
Families and Households in Atlanta
Median Family Size in Atlanta
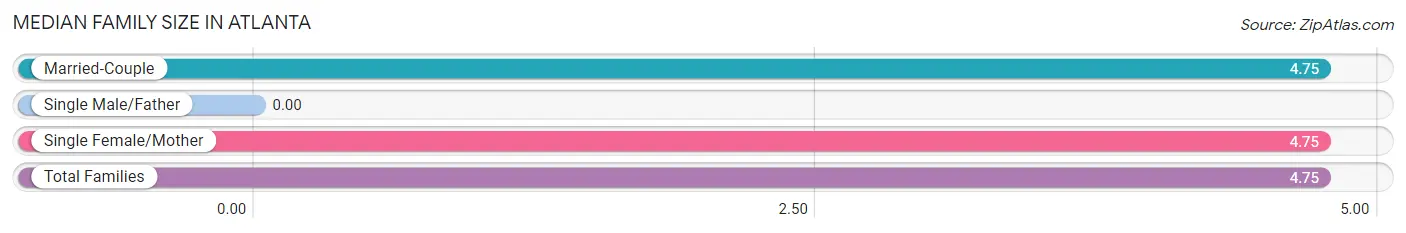
| Family Type | # Families | Family Size |
| Married-Couple | 24 (85.7%) | 4.75 |
| Single Male/Father | 0 (0.0%) | - |
| Single Female/Mother | 4 (14.3%) | 4.75 |
| Total Families | 28 (100.0%) | 4.75 |
Median Household Size in Atlanta
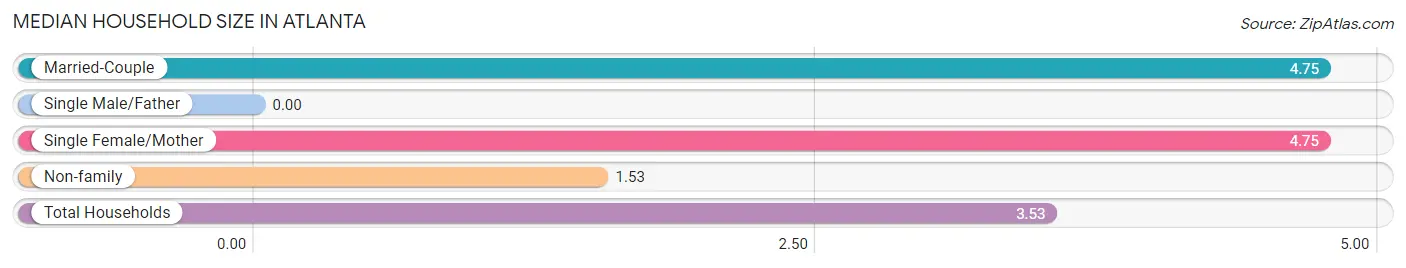
| Household Type | # Households | Household Size |
| Married-Couple | 24 (53.3%) | 4.75 |
| Single Male/Father | 0 (0.0%) | - |
| Single Female/Mother | 4 (8.9%) | 4.75 |
| Non-family | 17 (37.8%) | 1.53 |
| Total Households | 45 (100.0%) | 3.53 |
Household Size by Marriage Status in Atlanta
Out of a total of 45 households in Atlanta, 28 (62.2%) are family households, while 17 (37.8%) are nonfamily households. The most numerous type of family households are 2-person households, comprising 15, and the most common type of nonfamily households are 1-person households, comprising 16.
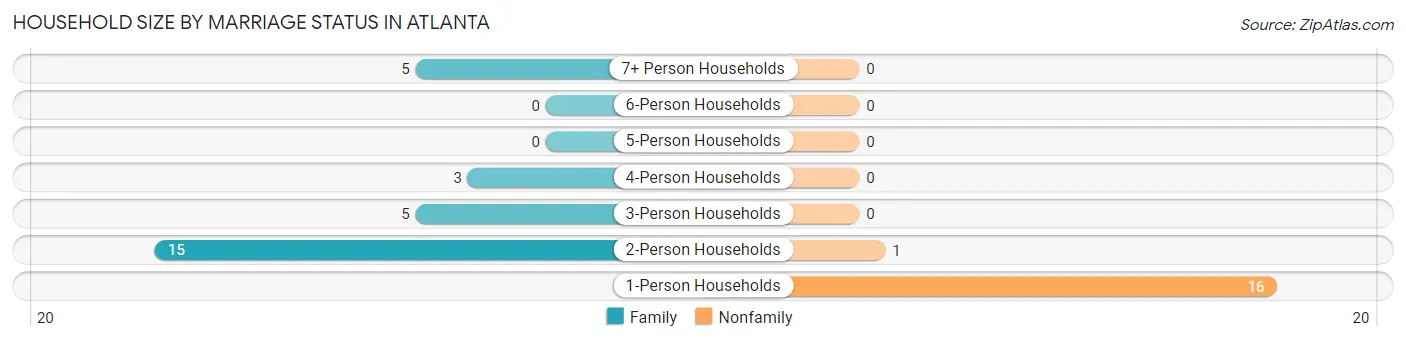
| Household Size | Family Households | Nonfamily Households |
| 1-Person Households | - | 16 (35.6%) |
| 2-Person Households | 15 (33.3%) | 1 (2.2%) |
| 3-Person Households | 5 (11.1%) | 0 (0.0%) |
| 4-Person Households | 3 (6.7%) | 0 (0.0%) |
| 5-Person Households | 0 (0.0%) | 0 (0.0%) |
| 6-Person Households | 0 (0.0%) | 0 (0.0%) |
| 7+ Person Households | 5 (11.1%) | 0 (0.0%) |
| Total | 28 (62.2%) | 17 (37.8%) |
Female Fertility in Atlanta
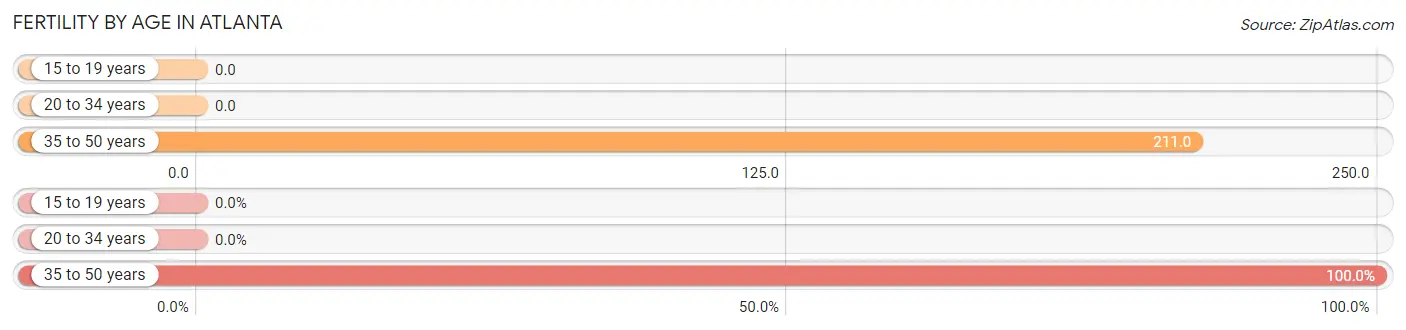
Fertility by Age in Atlanta
Average fertility rate in Atlanta is 116.0 births per 1,000 women. Women in the age bracket of 35 to 50 years have the highest fertility rate with 211.0 births per 1,000 women. Women in the age bracket of 35 to 50 years acount for 100.0% of all women with births.
| Age Bracket | Women with Births | Births / 1,000 Women |
| 15 to 19 years | 0 (0.0%) | 0.0 |
| 20 to 34 years | 0 (0.0%) | 0.0 |
| 35 to 50 years | 8 (100.0%) | 211.0 |
| Total | 8 (100.0%) | 116.0 |
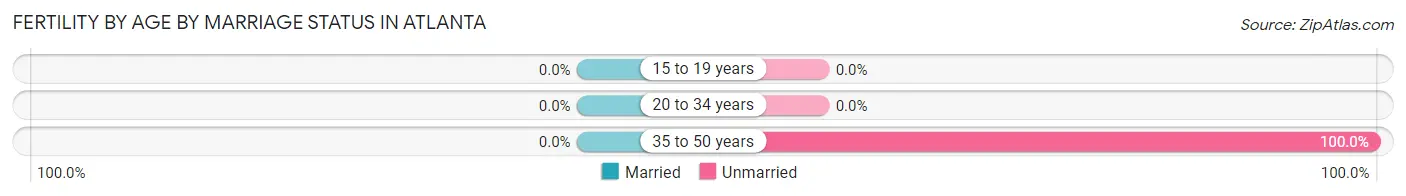
Fertility by Age by Marriage Status in Atlanta
| Age Bracket | Married | Unmarried |
| 15 to 19 years | 0 (0.0%) | 0 (0.0%) |
| 20 to 34 years | 0 (0.0%) | 0 (0.0%) |
| 35 to 50 years | 0 (0.0%) | 8 (100.0%) |
| Total | 0 (0.0%) | 8 (100.0%) |
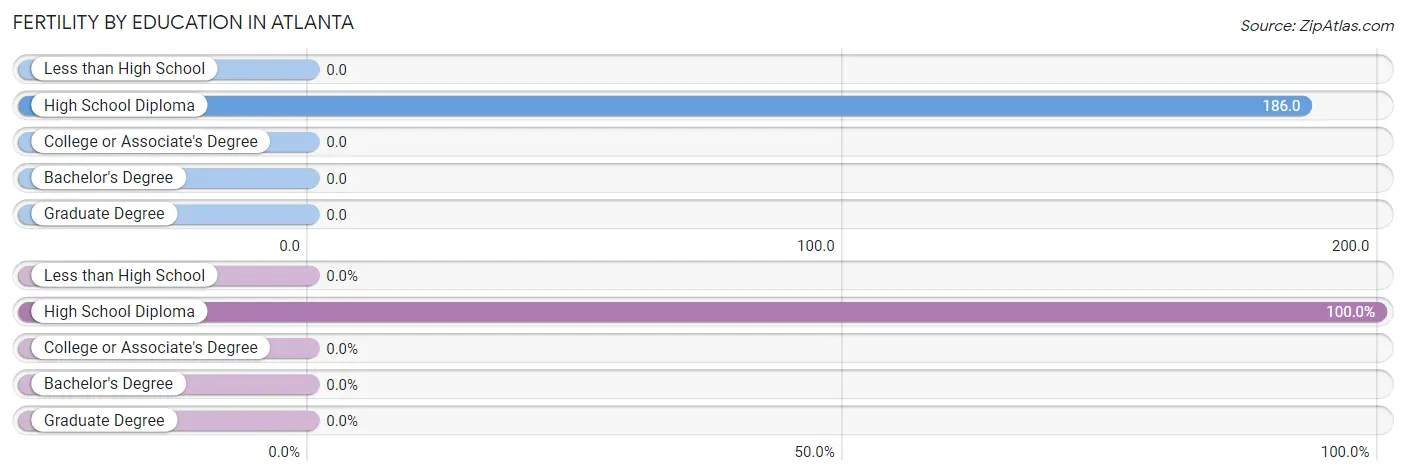
Fertility by Education in Atlanta
| Educational Attainment | Women with Births | Births / 1,000 Women |
| Less than High School | 0 (0.0%) | 0.0 |
| High School Diploma | 8 (100.0%) | 186.0 |
| College or Associate's Degree | 0 (0.0%) | 0.0 |
| Bachelor's Degree | 0 (0.0%) | 0.0 |
| Graduate Degree | 0 (0.0%) | 0.0 |
| Total | 8 (100.0%) | 116.0 |
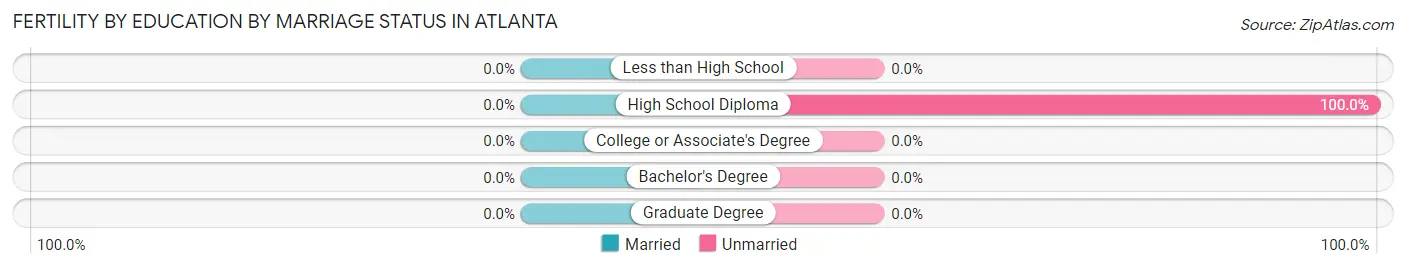
Fertility by Education by Marriage Status in Atlanta
| Educational Attainment | Married | Unmarried |
| Less than High School | 0 (0.0%) | 0 (0.0%) |
| High School Diploma | 0 (0.0%) | 8 (100.0%) |
| College or Associate's Degree | 0 (0.0%) | 0 (0.0%) |
| Bachelor's Degree | 0 (0.0%) | 0 (0.0%) |
| Graduate Degree | 0 (0.0%) | 0 (0.0%) |
| Total | 0 (0.0%) | 8 (100.0%) |
Employment Characteristics in Atlanta
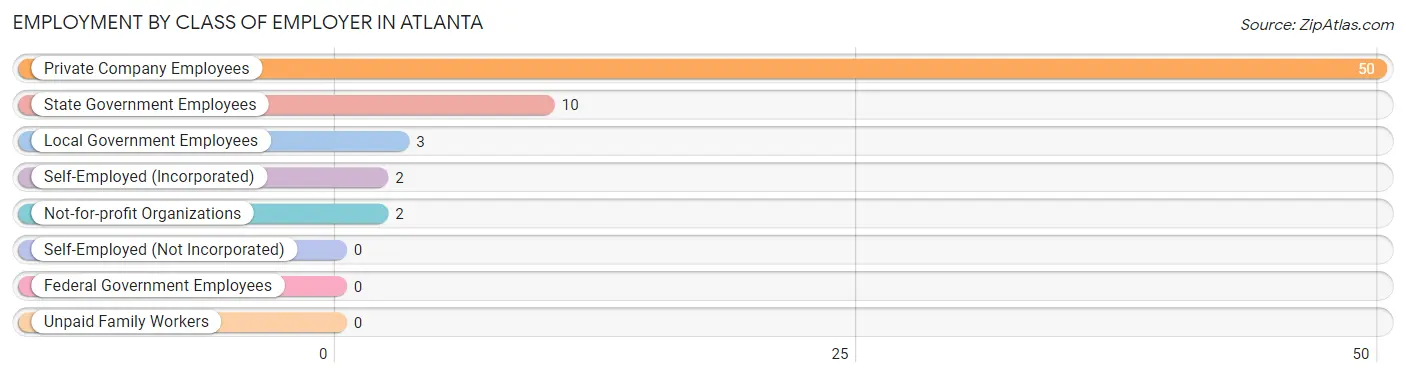
Employment by Class of Employer in Atlanta
Among the 67 employed individuals in Atlanta, private company employees (50 | 74.6%), state government employees (10 | 14.9%), and local government employees (3 | 4.5%) make up the most common classes of employment.
| Employer Class | # Employees | % Employees |
| Private Company Employees | 50 | 74.6% |
| Self-Employed (Incorporated) | 2 | 3.0% |
| Self-Employed (Not Incorporated) | 0 | 0.0% |
| Not-for-profit Organizations | 2 | 3.0% |
| Local Government Employees | 3 | 4.5% |
| State Government Employees | 10 | 14.9% |
| Federal Government Employees | 0 | 0.0% |
| Unpaid Family Workers | 0 | 0.0% |
| Total | 67 | 100.0% |
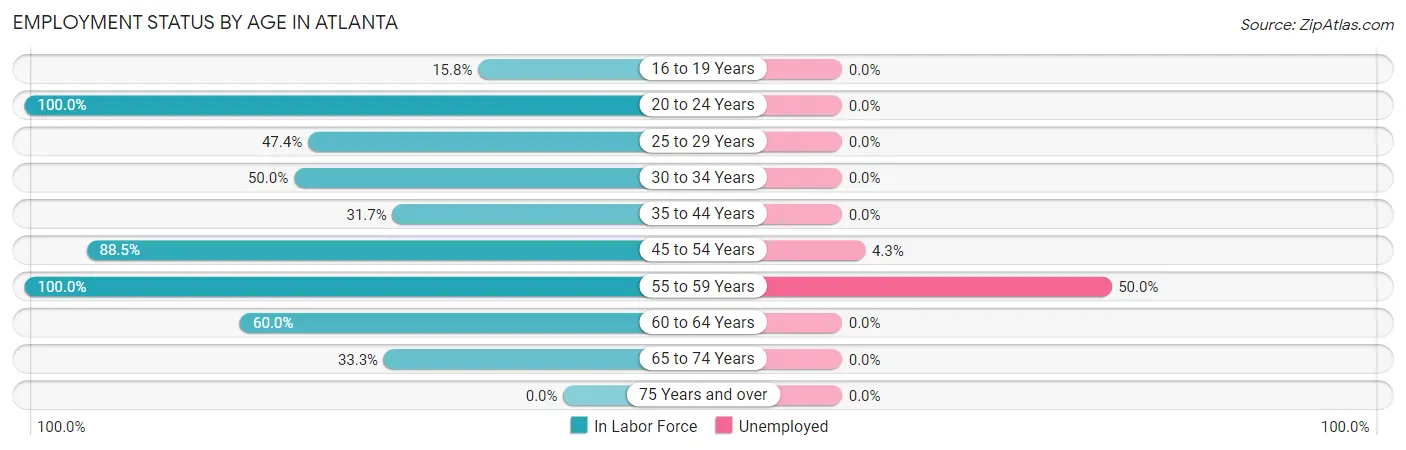
Employment Status by Age in Atlanta
According to the labor force statistics for Atlanta, out of the total population over 16 years of age (143), 49.0% or 70 individuals are in the labor force, with 4.3% or 3 of them unemployed. The age group with the highest labor force participation rate is 20 to 24 years, with 100.0% or 6 individuals in the labor force. Within the labor force, the 55 to 59 years age range has the highest percentage of unemployed individuals, with 50.0% or 2 of them being unemployed.
| Age Bracket | In Labor Force | Unemployed |
| 16 to 19 Years | 3 (15.8%) | 0 (0.0%) |
| 20 to 24 Years | 6 (100.0%) | 0 (0.0%) |
| 25 to 29 Years | 9 (47.4%) | 0 (0.0%) |
| 30 to 34 Years | 3 (50.0%) | 0 (0.0%) |
| 35 to 44 Years | 13 (31.7%) | 0 (0.0%) |
| 45 to 54 Years | 23 (88.5%) | 1 (4.3%) |
| 55 to 59 Years | 4 (100.0%) | 2 (50.0%) |
| 60 to 64 Years | 6 (60.0%) | 0 (0.0%) |
| 65 to 74 Years | 3 (33.3%) | 0 (0.0%) |
| 75 Years and over | 0 (0.0%) | 0 (0.0%) |
| Total | 70 (49.0%) | 3 (4.3%) |
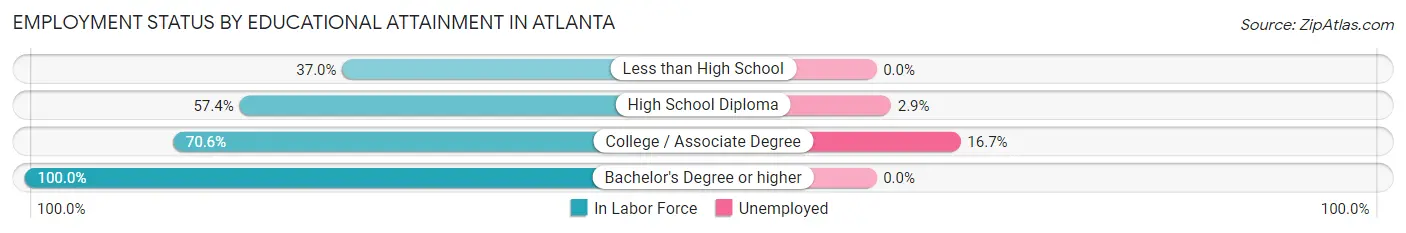
Employment Status by Educational Attainment in Atlanta
According to labor force statistics for Atlanta, 54.7% of individuals (58) out of the total population between 25 and 64 years of age (106) are in the labor force, with 5.2% or 3 of them being unemployed. The group with the highest labor force participation rate are those with the educational attainment of bachelor's degree or higher, with 100.0% or 1 individuals in the labor force. Within the labor force, individuals with college / associate degree education have the highest percentage of unemployment, with 16.7% or 2 of them being unemployed.
| Educational Attainment | In Labor Force | Unemployed |
| Less than High School | 10 (37.0%) | 0 (0.0%) |
| High School Diploma | 35 (57.4%) | 2 (2.9%) |
| College / Associate Degree | 12 (70.6%) | 3 (16.7%) |
| Bachelor's Degree or higher | 1 (100.0%) | 0 (0.0%) |
| Total | 58 (54.7%) | 6 (5.2%) |
Employment Occupations by Sex in Atlanta
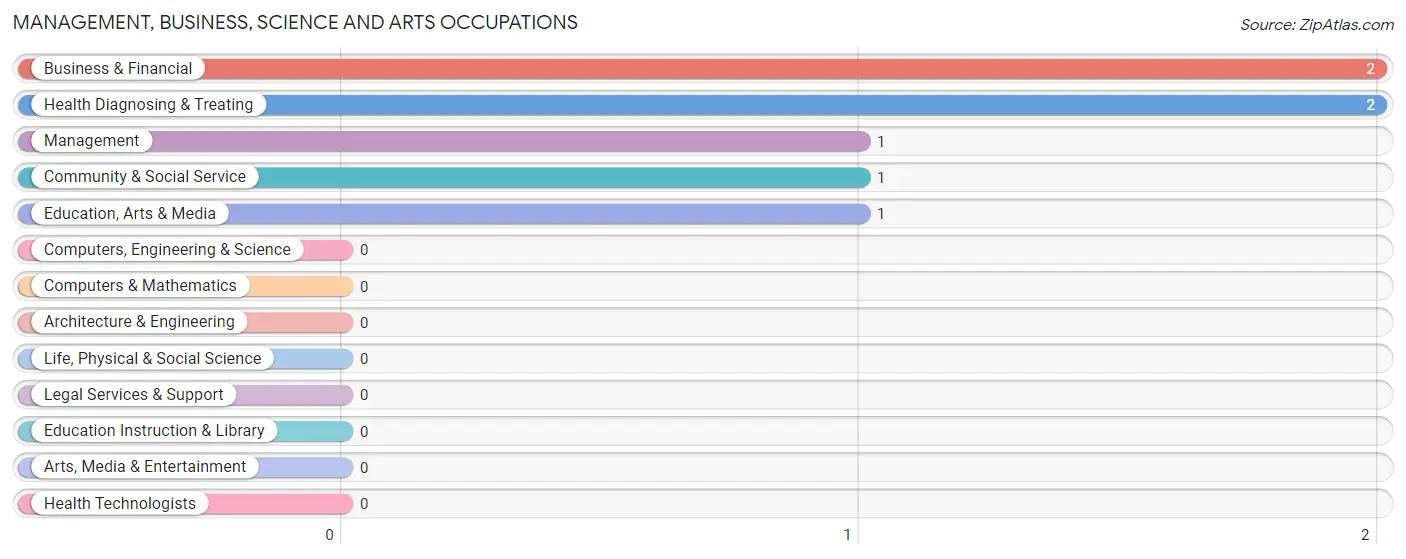
Management, Business, Science and Arts Occupations
The most common Management, Business, Science and Arts occupations in Atlanta are Business & Financial (2 | 3.0%), Health Diagnosing & Treating (2 | 3.0%), Management (1 | 1.5%), Community & Social Service (1 | 1.5%), and Education, Arts & Media (1 | 1.5%).
Management, Business, Science and Arts Occupations by Sex
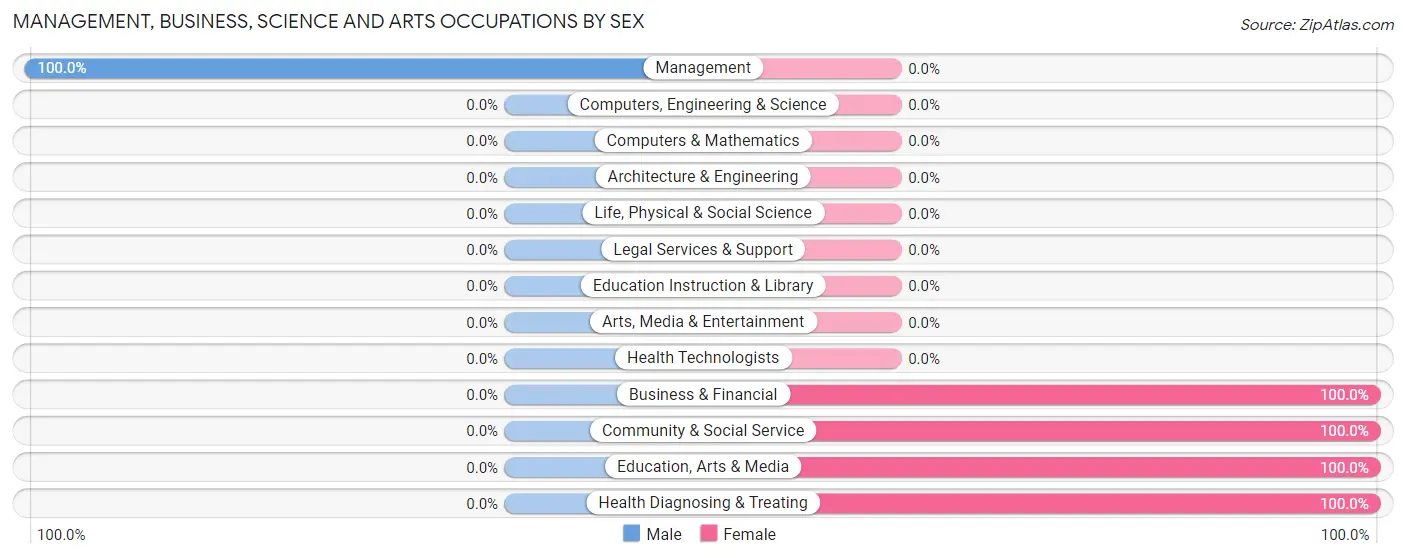
| Occupation | Male | Female |
| Management | 1 (100.0%) | 0 (0.0%) |
| Business & Financial | 0 (0.0%) | 2 (100.0%) |
| Computers, Engineering & Science | 0 (0.0%) | 0 (0.0%) |
| Computers & Mathematics | 0 (0.0%) | 0 (0.0%) |
| Architecture & Engineering | 0 (0.0%) | 0 (0.0%) |
| Life, Physical & Social Science | 0 (0.0%) | 0 (0.0%) |
| Community & Social Service | 0 (0.0%) | 1 (100.0%) |
| Education, Arts & Media | 0 (0.0%) | 1 (100.0%) |
| Legal Services & Support | 0 (0.0%) | 0 (0.0%) |
| Education Instruction & Library | 0 (0.0%) | 0 (0.0%) |
| Arts, Media & Entertainment | 0 (0.0%) | 0 (0.0%) |
| Health Diagnosing & Treating | 0 (0.0%) | 2 (100.0%) |
| Health Technologists | 0 (0.0%) | 0 (0.0%) |
| Total (Category) | 1 (16.7%) | 5 (83.3%) |
| Total (Overall) | 36 (53.7%) | 31 (46.3%) |
Services Occupations
The most common Services occupations in Atlanta are Food Preparation & Serving (19 | 28.4%), Security & Protection (9 | 13.4%), Law Enforcement (9 | 13.4%), and Personal Care & Service (1 | 1.5%).
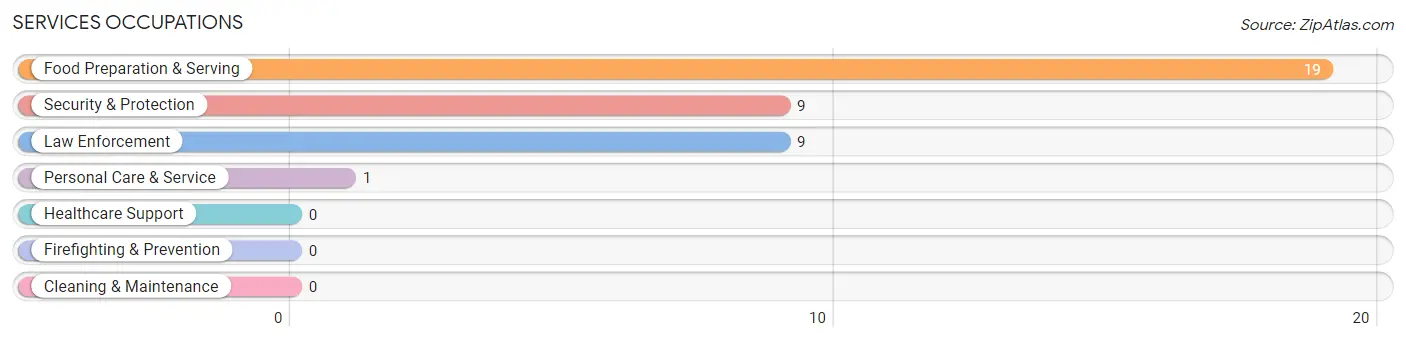
Services Occupations by Sex
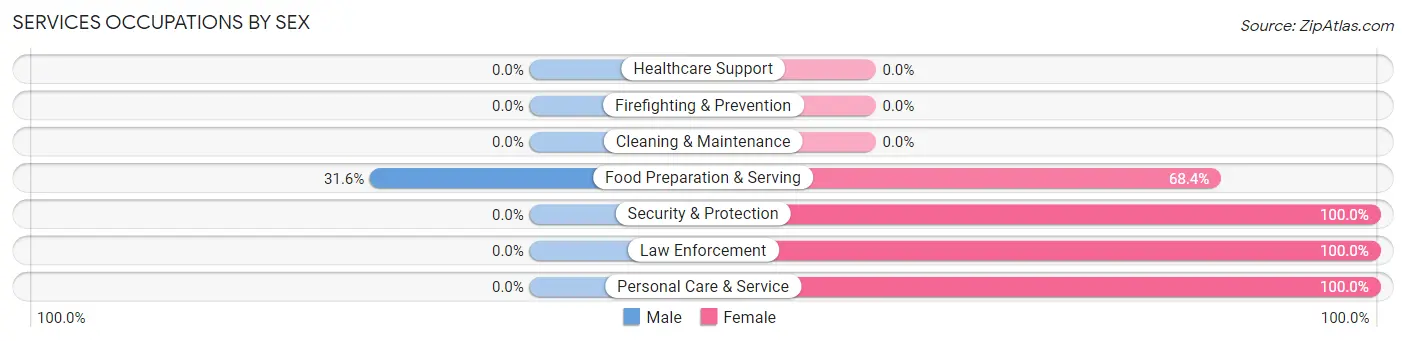
| Occupation | Male | Female |
| Healthcare Support | 0 (0.0%) | 0 (0.0%) |
| Security & Protection | 0 (0.0%) | 9 (100.0%) |
| Firefighting & Prevention | 0 (0.0%) | 0 (0.0%) |
| Law Enforcement | 0 (0.0%) | 9 (100.0%) |
| Food Preparation & Serving | 6 (31.6%) | 13 (68.4%) |
| Cleaning & Maintenance | 0 (0.0%) | 0 (0.0%) |
| Personal Care & Service | 0 (0.0%) | 1 (100.0%) |
| Total (Category) | 6 (20.7%) | 23 (79.3%) |
| Total (Overall) | 36 (53.7%) | 31 (46.3%) |
Sales and Office Occupations
The most common Sales and Office occupations in Atlanta are , and Office & Administration (3 | 4.5%).
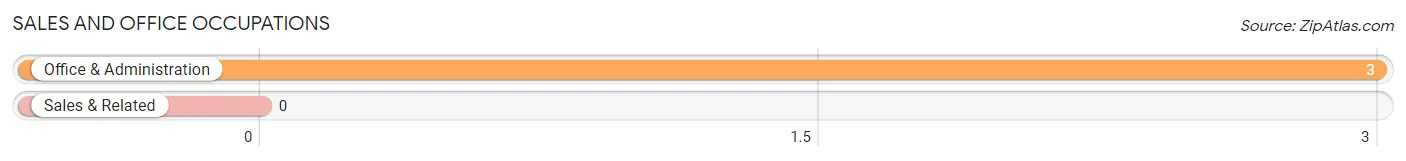
Sales and Office Occupations by Sex

| Occupation | Male | Female |
| Sales & Related | 0 (0.0%) | 0 (0.0%) |
| Office & Administration | 0 (0.0%) | 3 (100.0%) |
| Total (Category) | 0 (0.0%) | 3 (100.0%) |
| Total (Overall) | 36 (53.7%) | 31 (46.3%) |
Natural Resources, Construction and Maintenance Occupations
The most common Natural Resources, Construction and Maintenance occupations in Atlanta are Farming, Fishing & Forestry (9 | 13.4%), and Construction & Extraction (5 | 7.5%).

Natural Resources, Construction and Maintenance Occupations by Sex

| Occupation | Male | Female |
| Farming, Fishing & Forestry | 9 (100.0%) | 0 (0.0%) |
| Construction & Extraction | 5 (100.0%) | 0 (0.0%) |
| Installation, Maintenance & Repair | 0 (0.0%) | 0 (0.0%) |
| Total (Category) | 14 (100.0%) | 0 (0.0%) |
| Total (Overall) | 36 (53.7%) | 31 (46.3%) |
Production, Transportation and Moving Occupations
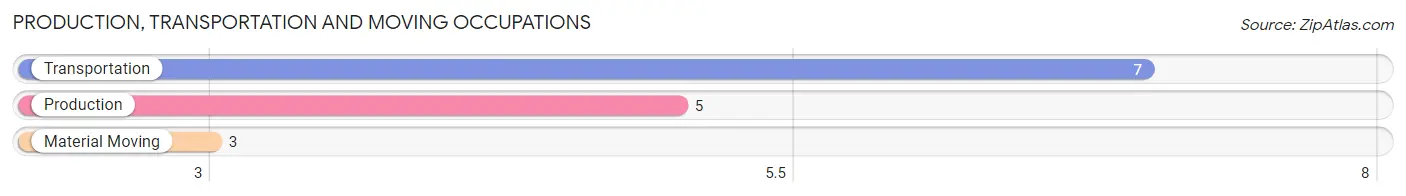
The most common Production, Transportation and Moving occupations in Atlanta are Transportation (7 | 10.4%), Production (5 | 7.5%), and Material Moving (3 | 4.5%).
Production, Transportation and Moving Occupations by Sex
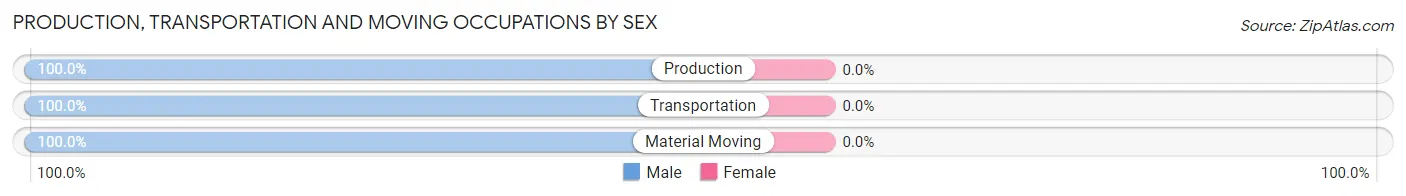
| Occupation | Male | Female |
| Production | 5 (100.0%) | 0 (0.0%) |
| Transportation | 7 (100.0%) | 0 (0.0%) |
| Material Moving | 3 (100.0%) | 0 (0.0%) |
| Total (Category) | 15 (100.0%) | 0 (0.0%) |
| Total (Overall) | 36 (53.7%) | 31 (46.3%) |
Employment Industries by Sex in Atlanta
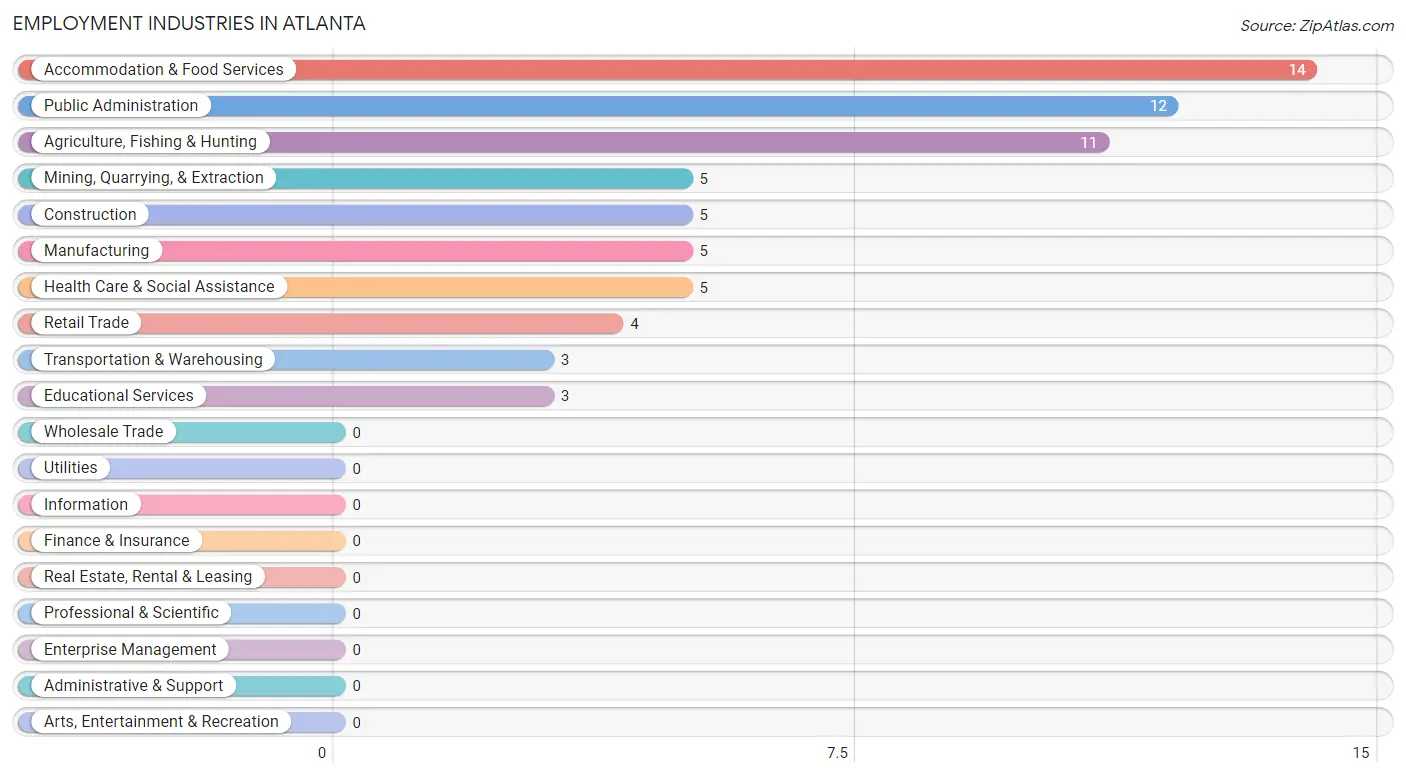
Employment Industries in Atlanta
The major employment industries in Atlanta include Accommodation & Food Services (14 | 20.9%), Public Administration (12 | 17.9%), Agriculture, Fishing & Hunting (11 | 16.4%), Mining, Quarrying, & Extraction (5 | 7.5%), and Construction (5 | 7.5%).
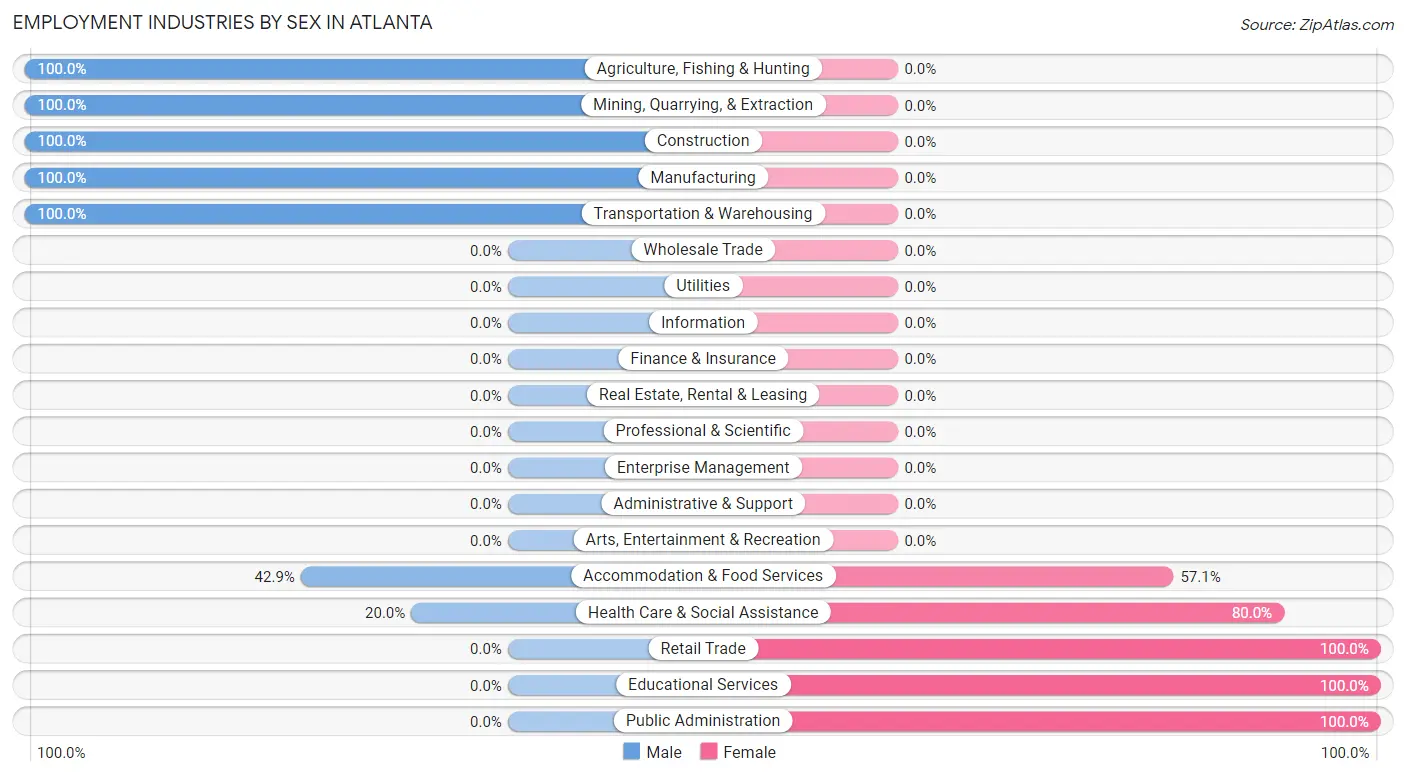
Employment Industries by Sex in Atlanta
The Atlanta industries that see more men than women are Agriculture, Fishing & Hunting (100.0%), Mining, Quarrying, & Extraction (100.0%), and Construction (100.0%), whereas the industries that tend to have a higher number of women are Retail Trade (100.0%), Educational Services (100.0%), and Public Administration (100.0%).
| Industry | Male | Female |
| Agriculture, Fishing & Hunting | 11 (100.0%) | 0 (0.0%) |
| Mining, Quarrying, & Extraction | 5 (100.0%) | 0 (0.0%) |
| Construction | 5 (100.0%) | 0 (0.0%) |
| Manufacturing | 5 (100.0%) | 0 (0.0%) |
| Wholesale Trade | 0 (0.0%) | 0 (0.0%) |
| Retail Trade | 0 (0.0%) | 4 (100.0%) |
| Transportation & Warehousing | 3 (100.0%) | 0 (0.0%) |
| Utilities | 0 (0.0%) | 0 (0.0%) |
| Information | 0 (0.0%) | 0 (0.0%) |
| Finance & Insurance | 0 (0.0%) | 0 (0.0%) |
| Real Estate, Rental & Leasing | 0 (0.0%) | 0 (0.0%) |
| Professional & Scientific | 0 (0.0%) | 0 (0.0%) |
| Enterprise Management | 0 (0.0%) | 0 (0.0%) |
| Administrative & Support | 0 (0.0%) | 0 (0.0%) |
| Educational Services | 0 (0.0%) | 3 (100.0%) |
| Health Care & Social Assistance | 1 (20.0%) | 4 (80.0%) |
| Arts, Entertainment & Recreation | 0 (0.0%) | 0 (0.0%) |
| Accommodation & Food Services | 6 (42.9%) | 8 (57.1%) |
| Public Administration | 0 (0.0%) | 12 (100.0%) |
| Total | 36 (53.7%) | 31 (46.3%) |
Education in Atlanta
School Enrollment in Atlanta
The most common levels of schooling among the 29 students in Atlanta are middle school (10 | 34.5%), high school (10 | 34.5%), and elementary school (6 | 20.7%).
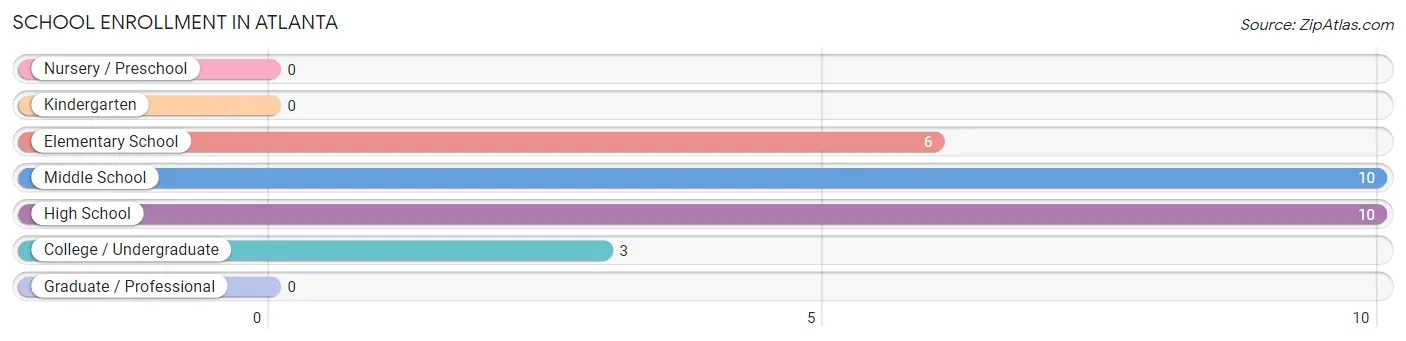
| School Level | # Students | % Students |
| Nursery / Preschool | 0 | 0.0% |
| Kindergarten | 0 | 0.0% |
| Elementary School | 6 | 20.7% |
| Middle School | 10 | 34.5% |
| High School | 10 | 34.5% |
| College / Undergraduate | 3 | 10.3% |
| Graduate / Professional | 0 | 0.0% |
| Total | 29 | 100.0% |
School Enrollment by Age by Funding Source in Atlanta
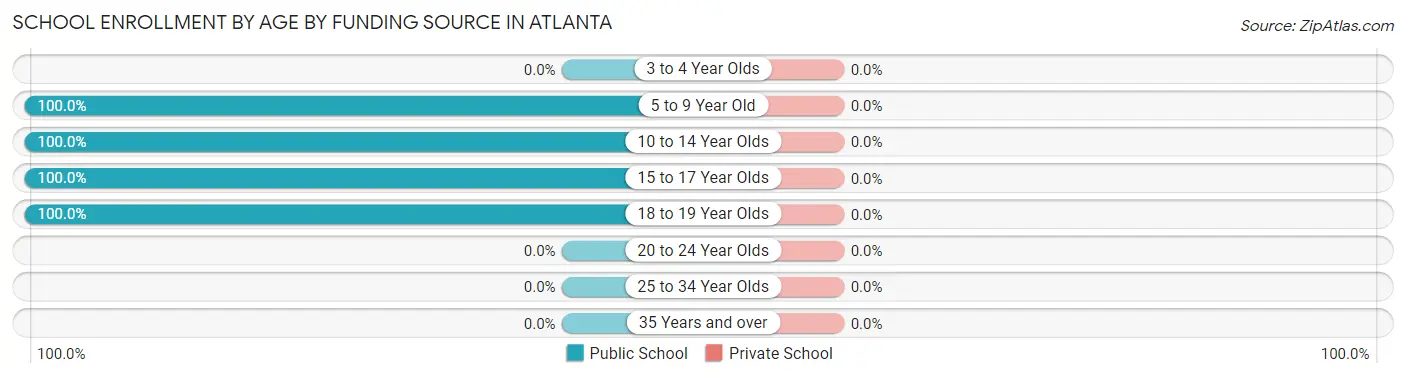
| Age Bracket | Public School | Private School |
| 3 to 4 Year Olds | 0 (0.0%) | 0 (0.0%) |
| 5 to 9 Year Old | 2 (100.0%) | 0 (0.0%) |
| 10 to 14 Year Olds | 14 (100.0%) | 0 (0.0%) |
| 15 to 17 Year Olds | 10 (100.0%) | 0 (0.0%) |
| 18 to 19 Year Olds | 3 (100.0%) | 0 (0.0%) |
| 20 to 24 Year Olds | 0 (0.0%) | 0 (0.0%) |
| 25 to 34 Year Olds | 0 (0.0%) | 0 (0.0%) |
| 35 Years and over | 0 (0.0%) | 0 (0.0%) |
| Total | 29 (100.0%) | 0 (0.0%) |
Educational Attainment by Field of Study in Atlanta
Psychology (1 | 50.0%), and social sciences (1 | 50.0%) are the most common fields of study among 2 individuals in Atlanta who have obtained a bachelor's degree or higher.
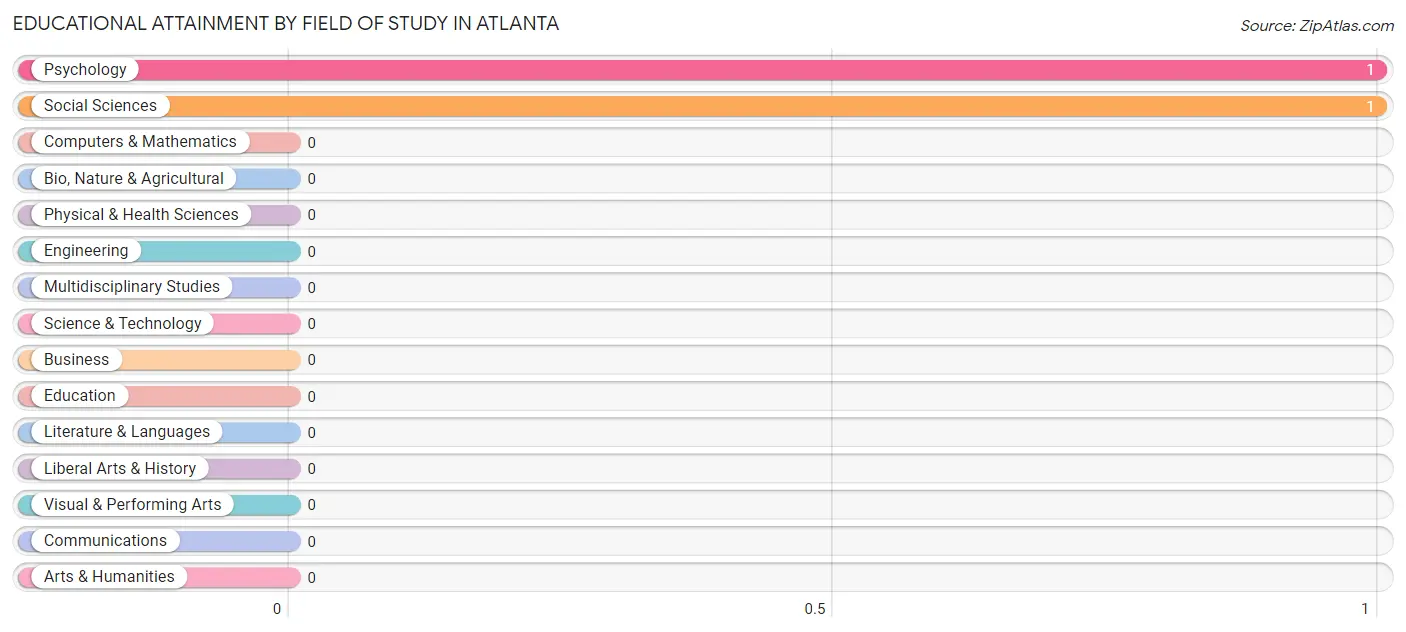
| Field of Study | # Graduates | % Graduates |
| Computers & Mathematics | 0 | 0.0% |
| Bio, Nature & Agricultural | 0 | 0.0% |
| Physical & Health Sciences | 0 | 0.0% |
| Psychology | 1 | 50.0% |
| Social Sciences | 1 | 50.0% |
| Engineering | 0 | 0.0% |
| Multidisciplinary Studies | 0 | 0.0% |
| Science & Technology | 0 | 0.0% |
| Business | 0 | 0.0% |
| Education | 0 | 0.0% |
| Literature & Languages | 0 | 0.0% |
| Liberal Arts & History | 0 | 0.0% |
| Visual & Performing Arts | 0 | 0.0% |
| Communications | 0 | 0.0% |
| Arts & Humanities | 0 | 0.0% |
| Total | 2 | 100.0% |
Transportation & Commute in Atlanta
Vehicle Availability by Sex in Atlanta
The most prevalent vehicle ownership categories in Atlanta are males with 2 vehicles (23, accounting for 63.9%) and females with 2 vehicles (3, making up 74.2%).
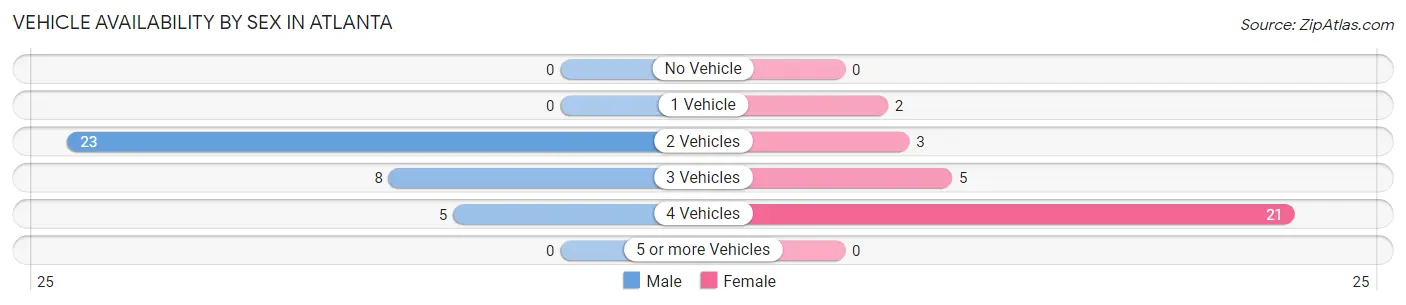
| Vehicles Available | Male | Female |
| No Vehicle | 0 (0.0%) | 0 (0.0%) |
| 1 Vehicle | 0 (0.0%) | 2 (6.5%) |
| 2 Vehicles | 23 (63.9%) | 3 (9.7%) |
| 3 Vehicles | 8 (22.2%) | 5 (16.1%) |
| 4 Vehicles | 5 (13.9%) | 21 (67.7%) |
| 5 or more Vehicles | 0 (0.0%) | 0 (0.0%) |
| Total | 36 (100.0%) | 31 (100.0%) |
Commute Time in Atlanta
The most frequently occuring commute durations in Atlanta are 20 to 24 minutes (28 commuters, 41.8%), 45 to 59 minutes (17 commuters, 25.4%), and 10 to 14 minutes (11 commuters, 16.4%).
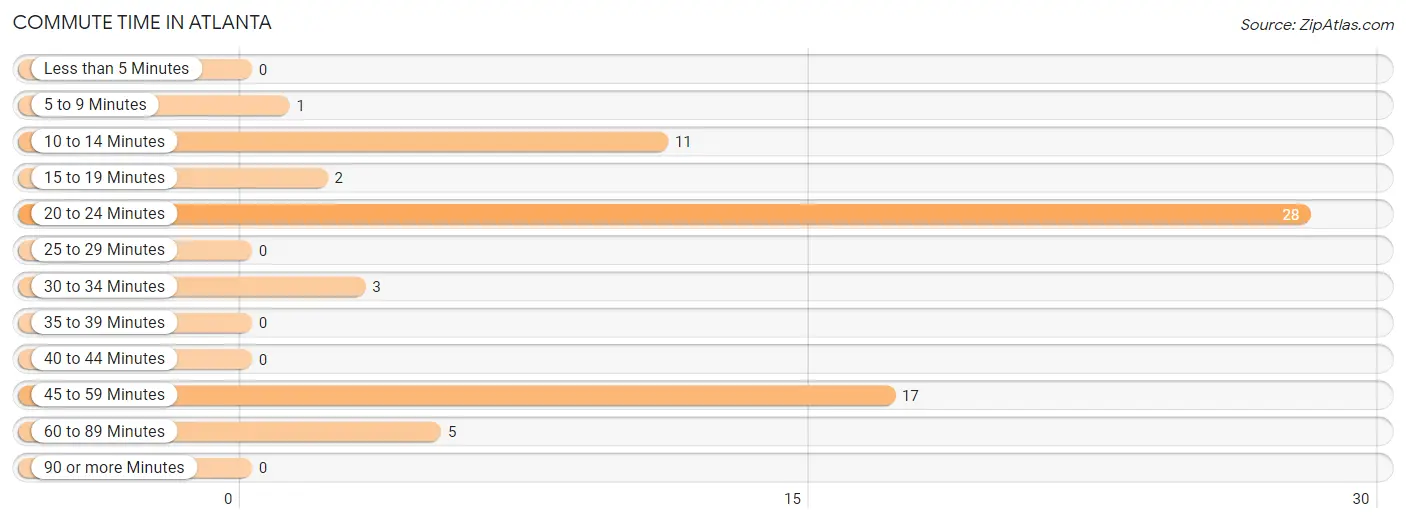
| Commute Time | # Commuters | % Commuters |
| Less than 5 Minutes | 0 | 0.0% |
| 5 to 9 Minutes | 1 | 1.5% |
| 10 to 14 Minutes | 11 | 16.4% |
| 15 to 19 Minutes | 2 | 3.0% |
| 20 to 24 Minutes | 28 | 41.8% |
| 25 to 29 Minutes | 0 | 0.0% |
| 30 to 34 Minutes | 3 | 4.5% |
| 35 to 39 Minutes | 0 | 0.0% |
| 40 to 44 Minutes | 0 | 0.0% |
| 45 to 59 Minutes | 17 | 25.4% |
| 60 to 89 Minutes | 5 | 7.5% |
| 90 or more Minutes | 0 | 0.0% |
Commute Time by Sex in Atlanta
The most common commute times in Atlanta are 45 to 59 minutes (17 commuters, 47.2%) for males and 20 to 24 minutes (17 commuters, 54.8%) for females.
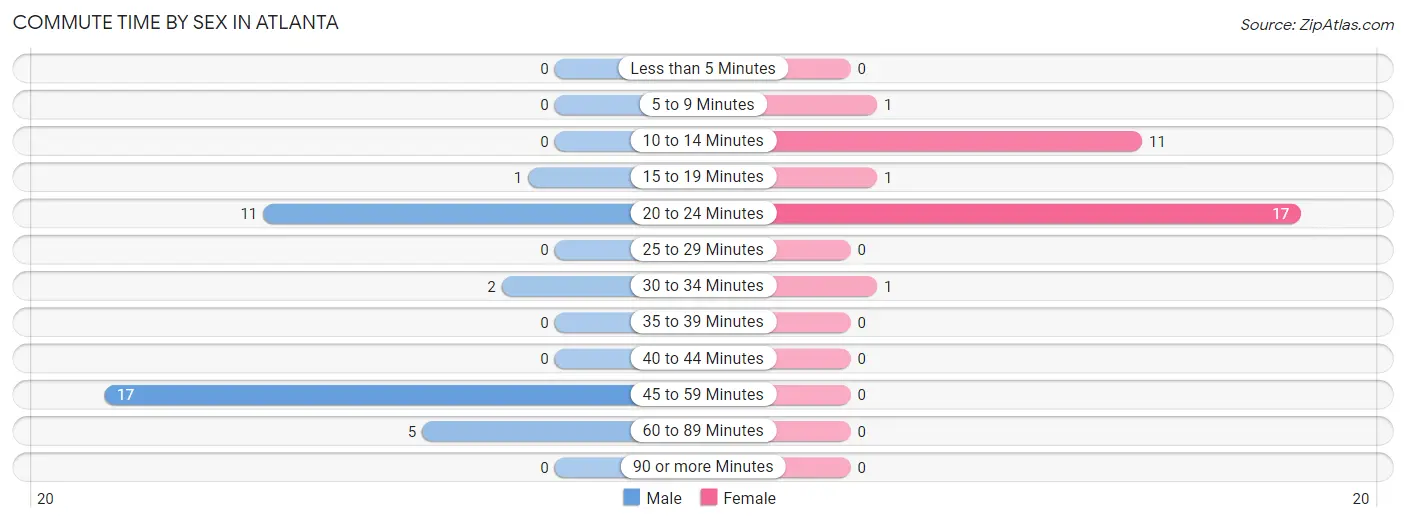
| Commute Time | Male | Female |
| Less than 5 Minutes | 0 (0.0%) | 0 (0.0%) |
| 5 to 9 Minutes | 0 (0.0%) | 1 (3.2%) |
| 10 to 14 Minutes | 0 (0.0%) | 11 (35.5%) |
| 15 to 19 Minutes | 1 (2.8%) | 1 (3.2%) |
| 20 to 24 Minutes | 11 (30.6%) | 17 (54.8%) |
| 25 to 29 Minutes | 0 (0.0%) | 0 (0.0%) |
| 30 to 34 Minutes | 2 (5.6%) | 1 (3.2%) |
| 35 to 39 Minutes | 0 (0.0%) | 0 (0.0%) |
| 40 to 44 Minutes | 0 (0.0%) | 0 (0.0%) |
| 45 to 59 Minutes | 17 (47.2%) | 0 (0.0%) |
| 60 to 89 Minutes | 5 (13.9%) | 0 (0.0%) |
| 90 or more Minutes | 0 (0.0%) | 0 (0.0%) |
Time of Departure to Work by Sex in Atlanta
The most frequent times of departure to work in Atlanta are 12:00 AM to 4:59 AM (22, 61.1%) for males and 5:30 AM to 5:59 AM (9, 29.0%) for females.
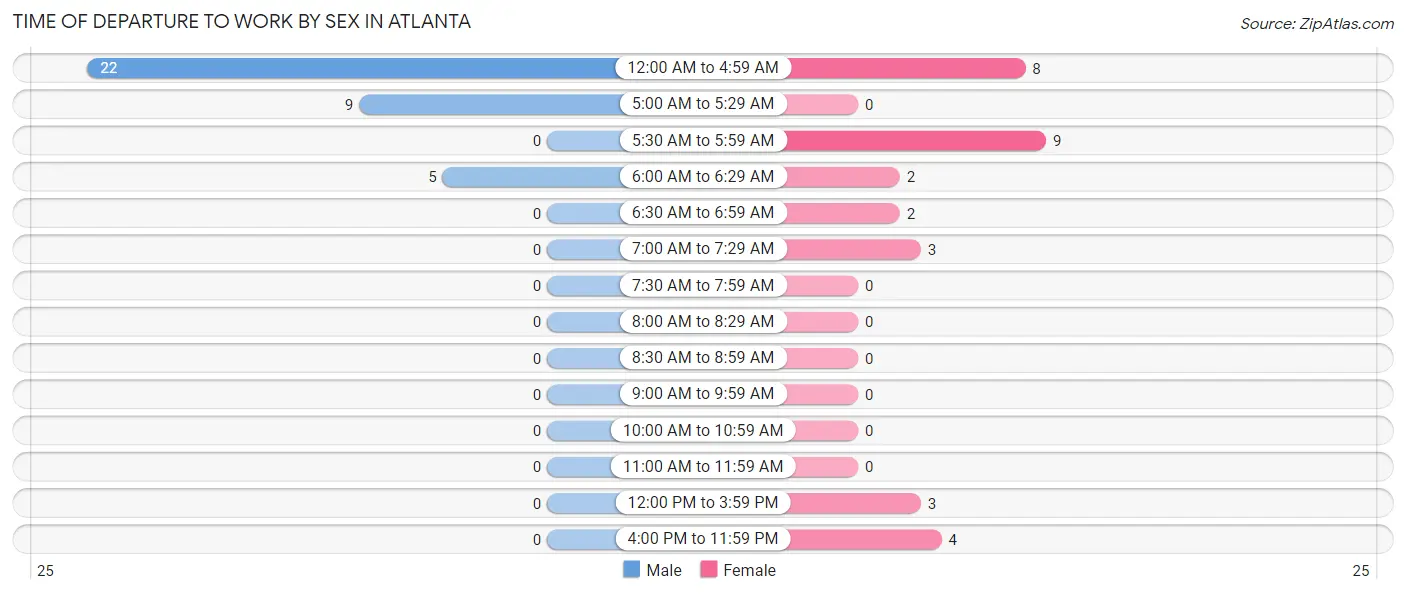
| Time of Departure | Male | Female |
| 12:00 AM to 4:59 AM | 22 (61.1%) | 8 (25.8%) |
| 5:00 AM to 5:29 AM | 9 (25.0%) | 0 (0.0%) |
| 5:30 AM to 5:59 AM | 0 (0.0%) | 9 (29.0%) |
| 6:00 AM to 6:29 AM | 5 (13.9%) | 2 (6.5%) |
| 6:30 AM to 6:59 AM | 0 (0.0%) | 2 (6.5%) |
| 7:00 AM to 7:29 AM | 0 (0.0%) | 3 (9.7%) |
| 7:30 AM to 7:59 AM | 0 (0.0%) | 0 (0.0%) |
| 8:00 AM to 8:29 AM | 0 (0.0%) | 0 (0.0%) |
| 8:30 AM to 8:59 AM | 0 (0.0%) | 0 (0.0%) |
| 9:00 AM to 9:59 AM | 0 (0.0%) | 0 (0.0%) |
| 10:00 AM to 10:59 AM | 0 (0.0%) | 0 (0.0%) |
| 11:00 AM to 11:59 AM | 0 (0.0%) | 0 (0.0%) |
| 12:00 PM to 3:59 PM | 0 (0.0%) | 3 (9.7%) |
| 4:00 PM to 11:59 PM | 0 (0.0%) | 4 (12.9%) |
| Total | 36 (100.0%) | 31 (100.0%) |
Housing Occupancy in Atlanta
Occupancy by Ownership in Atlanta
Of the total 45 dwellings in Atlanta, owner-occupied units account for 30 (66.7%), while renter-occupied units make up 15 (33.3%).
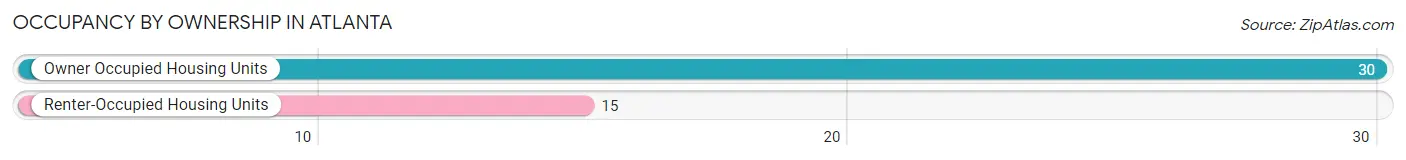
| Occupancy | # Housing Units | % Housing Units |
| Owner Occupied Housing Units | 30 | 66.7% |
| Renter-Occupied Housing Units | 15 | 33.3% |
| Total Occupied Housing Units | 45 | 100.0% |
Occupancy by Household Size in Atlanta
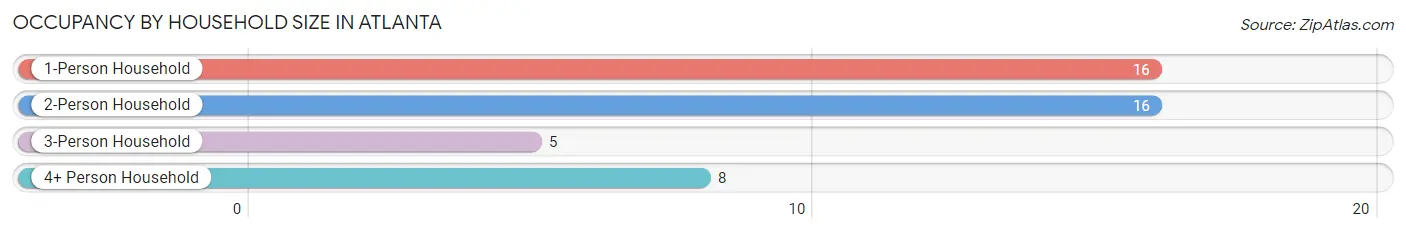
| Household Size | # Housing Units | % Housing Units |
| 1-Person Household | 16 | 35.6% |
| 2-Person Household | 16 | 35.6% |
| 3-Person Household | 5 | 11.1% |
| 4+ Person Household | 8 | 17.8% |
| Total Housing Units | 45 | 100.0% |
Occupancy by Ownership by Household Size in Atlanta
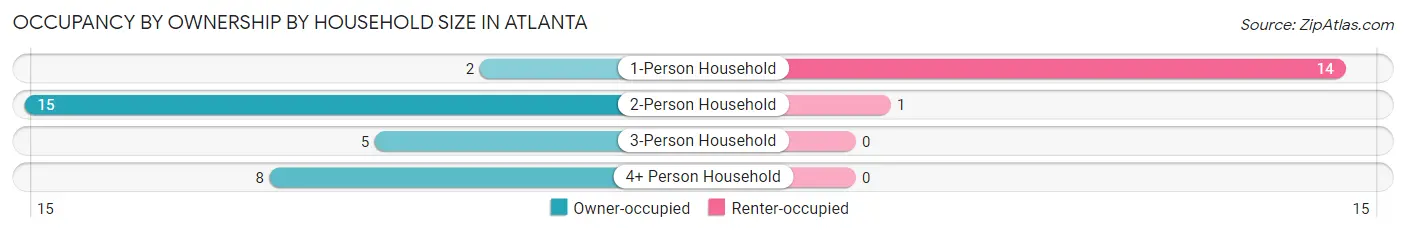
| Household Size | Owner-occupied | Renter-occupied |
| 1-Person Household | 2 (12.5%) | 14 (87.5%) |
| 2-Person Household | 15 (93.8%) | 1 (6.2%) |
| 3-Person Household | 5 (100.0%) | 0 (0.0%) |
| 4+ Person Household | 8 (100.0%) | 0 (0.0%) |
| Total Housing Units | 30 (66.7%) | 15 (33.3%) |
Occupancy by Educational Attainment in Atlanta
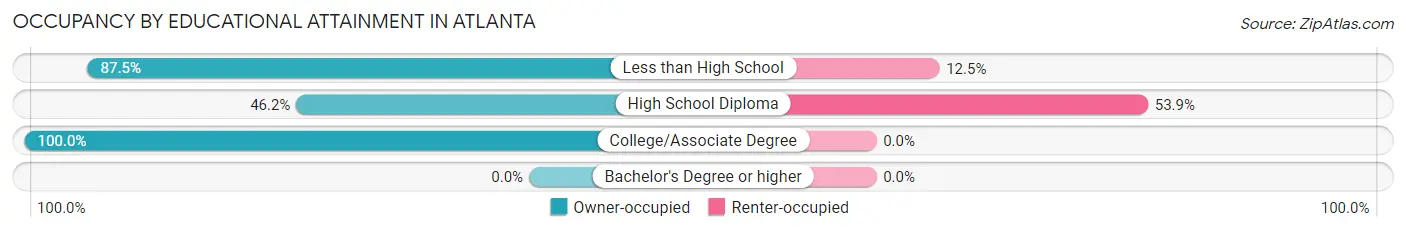
| Household Size | Owner-occupied | Renter-occupied |
| Less than High School | 7 (87.5%) | 1 (12.5%) |
| High School Diploma | 12 (46.2%) | 14 (53.8%) |
| College/Associate Degree | 11 (100.0%) | 0 (0.0%) |
| Bachelor's Degree or higher | 0 (0.0%) | 0 (0.0%) |
Occupancy by Age of Householder in Atlanta
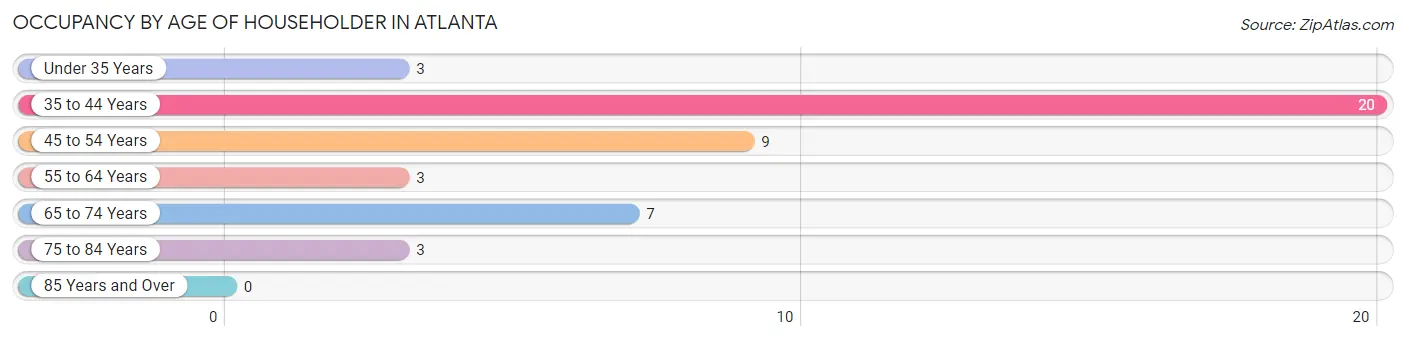
| Age Bracket | # Households | % Households |
| Under 35 Years | 3 | 6.7% |
| 35 to 44 Years | 20 | 44.4% |
| 45 to 54 Years | 9 | 20.0% |
| 55 to 64 Years | 3 | 6.7% |
| 65 to 74 Years | 7 | 15.6% |
| 75 to 84 Years | 3 | 6.7% |
| 85 Years and Over | 0 | 0.0% |
| Total | 45 | 100.0% |
Housing Finances in Atlanta
Median Income by Occupancy in Atlanta
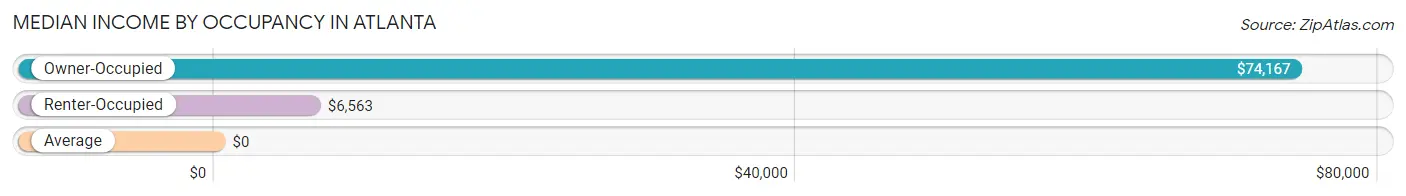
| Occupancy Type | # Households | Median Income |
| Owner-Occupied | 30 (66.7%) | $74,167 |
| Renter-Occupied | 15 (33.3%) | $6,563 |
| Average | 45 (100.0%) | $0 |
Occupancy by Householder Income Bracket in Atlanta
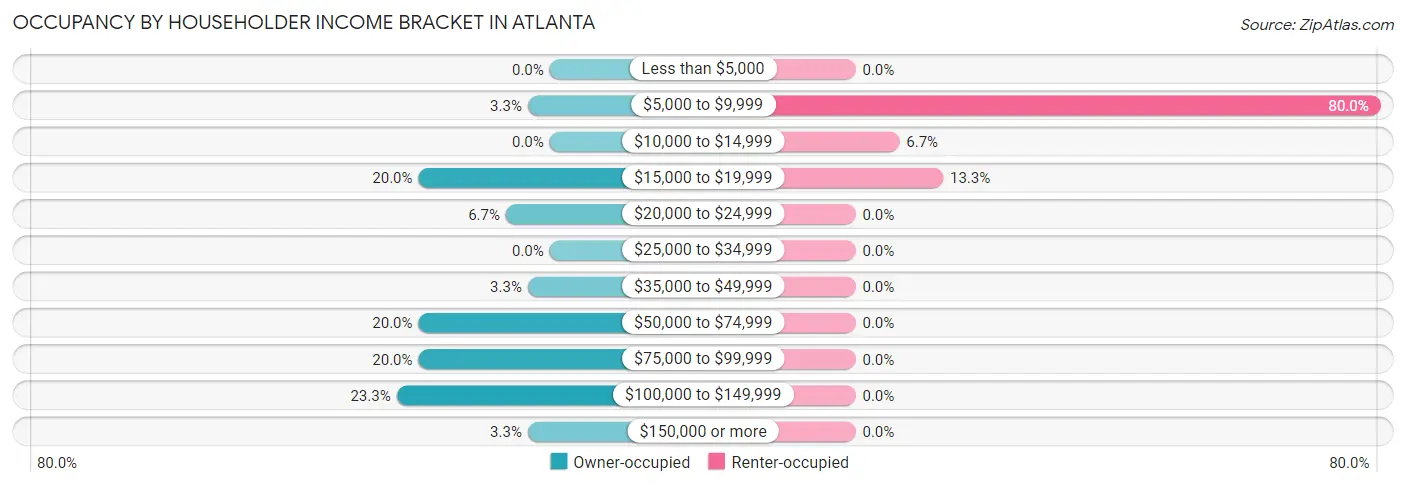
| Income Bracket | Owner-occupied | Renter-occupied |
| Less than $5,000 | 0 (0.0%) | 0 (0.0%) |
| $5,000 to $9,999 | 1 (3.3%) | 12 (80.0%) |
| $10,000 to $14,999 | 0 (0.0%) | 1 (6.7%) |
| $15,000 to $19,999 | 6 (20.0%) | 2 (13.3%) |
| $20,000 to $24,999 | 2 (6.7%) | 0 (0.0%) |
| $25,000 to $34,999 | 0 (0.0%) | 0 (0.0%) |
| $35,000 to $49,999 | 1 (3.3%) | 0 (0.0%) |
| $50,000 to $74,999 | 6 (20.0%) | 0 (0.0%) |
| $75,000 to $99,999 | 6 (20.0%) | 0 (0.0%) |
| $100,000 to $149,999 | 7 (23.3%) | 0 (0.0%) |
| $150,000 or more | 1 (3.3%) | 0 (0.0%) |
| Total | 30 (100.0%) | 15 (100.0%) |
Monthly Housing Cost Tiers in Atlanta
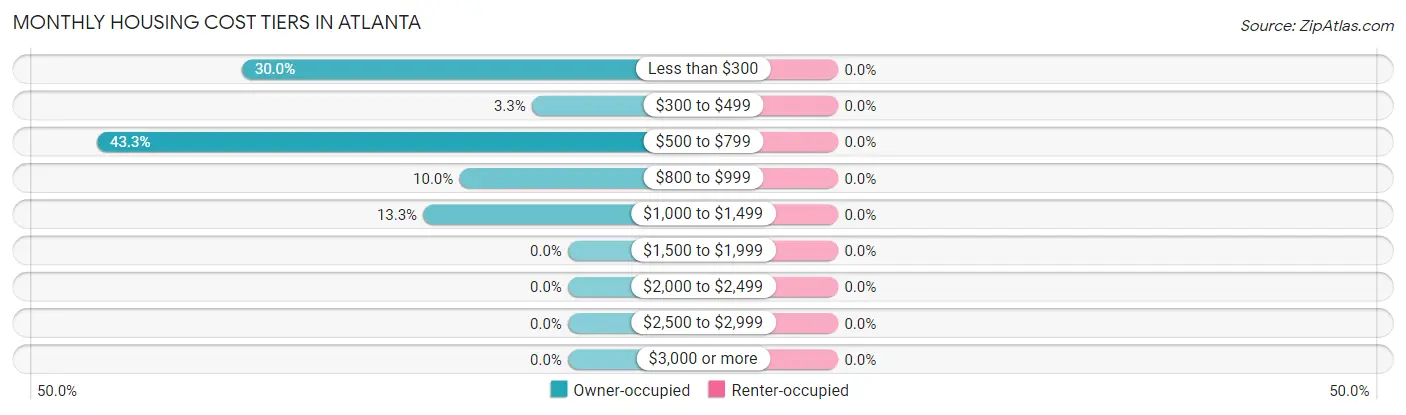
| Monthly Cost | Owner-occupied | Renter-occupied |
| Less than $300 | 9 (30.0%) | 0 (0.0%) |
| $300 to $499 | 1 (3.3%) | 0 (0.0%) |
| $500 to $799 | 13 (43.3%) | 0 (0.0%) |
| $800 to $999 | 3 (10.0%) | 0 (0.0%) |
| $1,000 to $1,499 | 4 (13.3%) | 0 (0.0%) |
| $1,500 to $1,999 | 0 (0.0%) | 0 (0.0%) |
| $2,000 to $2,499 | 0 (0.0%) | 0 (0.0%) |
| $2,500 to $2,999 | 0 (0.0%) | 0 (0.0%) |
| $3,000 or more | 0 (0.0%) | 0 (0.0%) |
| Total | 30 (100.0%) | 15 (100.0%) |
Physical Housing Characteristics in Atlanta
Housing Structures in Atlanta
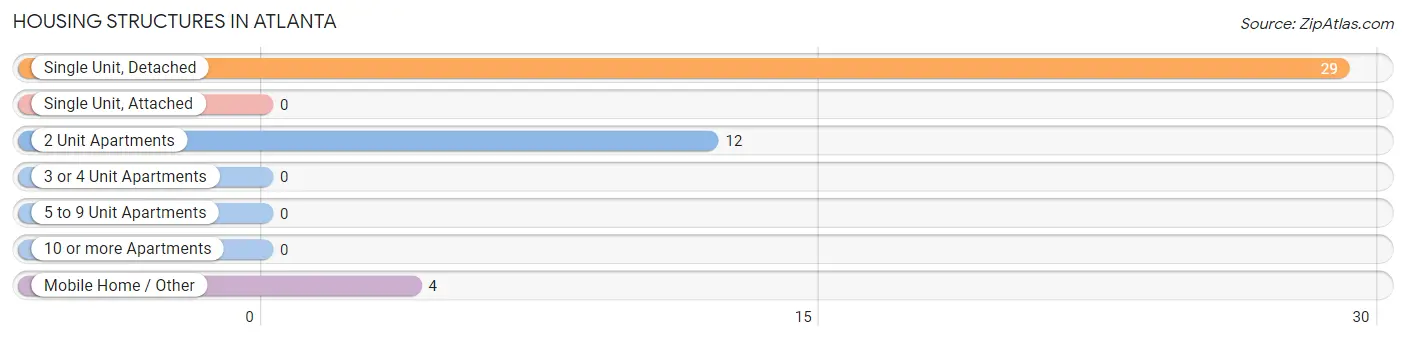
| Structure Type | # Housing Units | % Housing Units |
| Single Unit, Detached | 29 | 64.4% |
| Single Unit, Attached | 0 | 0.0% |
| 2 Unit Apartments | 12 | 26.7% |
| 3 or 4 Unit Apartments | 0 | 0.0% |
| 5 to 9 Unit Apartments | 0 | 0.0% |
| 10 or more Apartments | 0 | 0.0% |
| Mobile Home / Other | 4 | 8.9% |
| Total | 45 | 100.0% |
Housing Structures by Occupancy in Atlanta
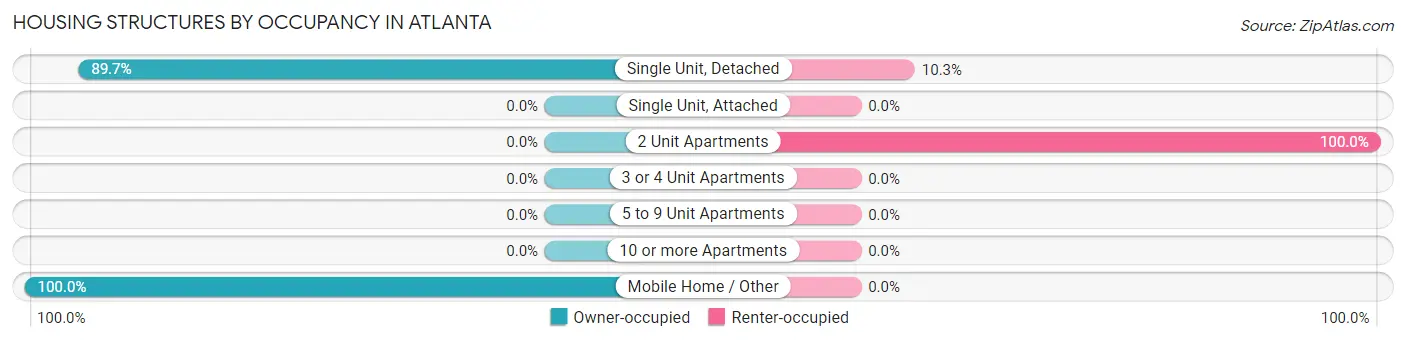
| Structure Type | Owner-occupied | Renter-occupied |
| Single Unit, Detached | 26 (89.7%) | 3 (10.3%) |
| Single Unit, Attached | 0 (0.0%) | 0 (0.0%) |
| 2 Unit Apartments | 0 (0.0%) | 12 (100.0%) |
| 3 or 4 Unit Apartments | 0 (0.0%) | 0 (0.0%) |
| 5 to 9 Unit Apartments | 0 (0.0%) | 0 (0.0%) |
| 10 or more Apartments | 0 (0.0%) | 0 (0.0%) |
| Mobile Home / Other | 4 (100.0%) | 0 (0.0%) |
| Total | 30 (66.7%) | 15 (33.3%) |
Housing Structures by Number of Rooms in Atlanta
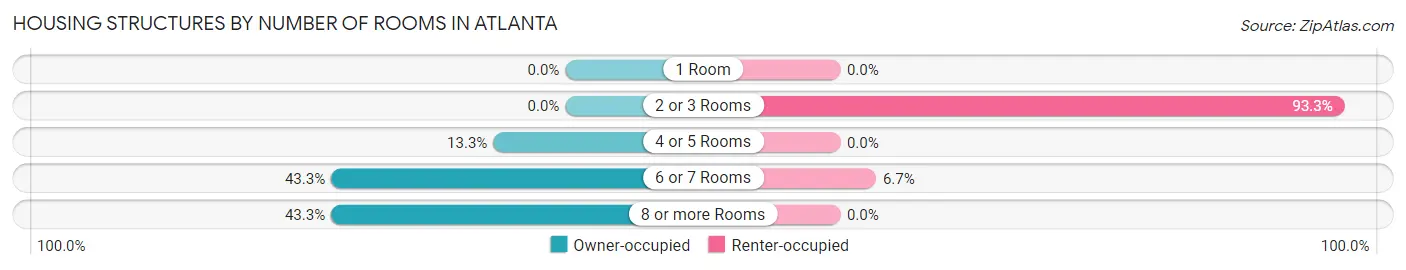
| Number of Rooms | Owner-occupied | Renter-occupied |
| 1 Room | 0 (0.0%) | 0 (0.0%) |
| 2 or 3 Rooms | 0 (0.0%) | 14 (93.3%) |
| 4 or 5 Rooms | 4 (13.3%) | 0 (0.0%) |
| 6 or 7 Rooms | 13 (43.3%) | 1 (6.7%) |
| 8 or more Rooms | 13 (43.3%) | 0 (0.0%) |
| Total | 30 (100.0%) | 15 (100.0%) |
Housing Structure by Heating Type in Atlanta
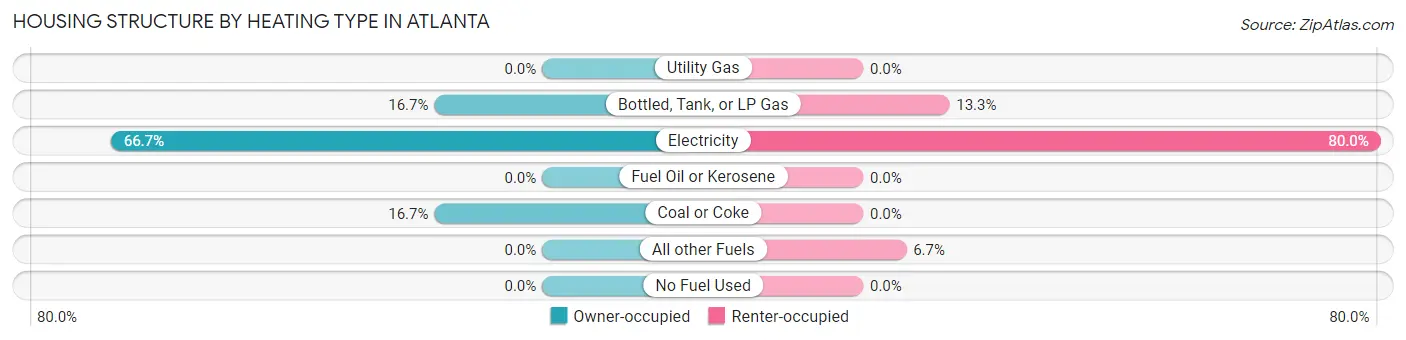
| Heating Type | Owner-occupied | Renter-occupied |
| Utility Gas | 0 (0.0%) | 0 (0.0%) |
| Bottled, Tank, or LP Gas | 5 (16.7%) | 2 (13.3%) |
| Electricity | 20 (66.7%) | 12 (80.0%) |
| Fuel Oil or Kerosene | 0 (0.0%) | 0 (0.0%) |
| Coal or Coke | 5 (16.7%) | 0 (0.0%) |
| All other Fuels | 0 (0.0%) | 1 (6.7%) |
| No Fuel Used | 0 (0.0%) | 0 (0.0%) |
| Total | 30 (100.0%) | 15 (100.0%) |
Household Vehicle Usage in Atlanta
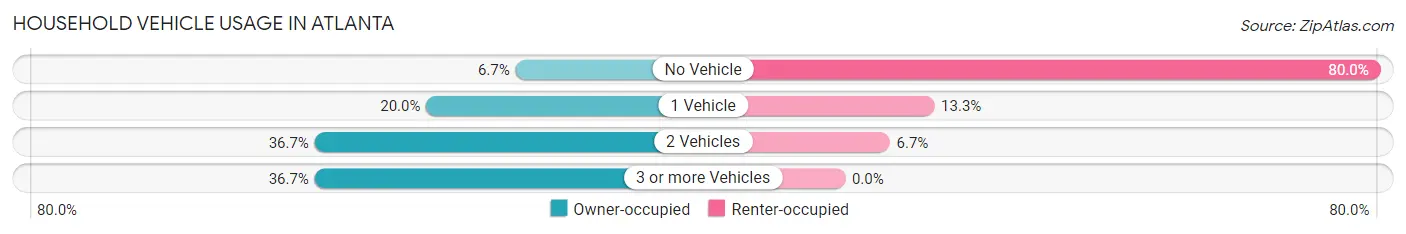
| Vehicles per Household | Owner-occupied | Renter-occupied |
| No Vehicle | 2 (6.7%) | 12 (80.0%) |
| 1 Vehicle | 6 (20.0%) | 2 (13.3%) |
| 2 Vehicles | 11 (36.7%) | 1 (6.7%) |
| 3 or more Vehicles | 11 (36.7%) | 0 (0.0%) |
| Total | 30 (100.0%) | 15 (100.0%) |
Real Estate & Mortgages in Atlanta
Real Estate and Mortgage Overview in Atlanta
| Characteristic | Without Mortgage | With Mortgage |
| Housing Units | 24 | 6 |
| Median Property Value | $55,000 | $162,500 |
| Median Household Income | $73,333 | $0 |
| Monthly Housing Costs | - | - |
| Real Estate Taxes | $199 | $2 |
Property Value by Mortgage Status in Atlanta
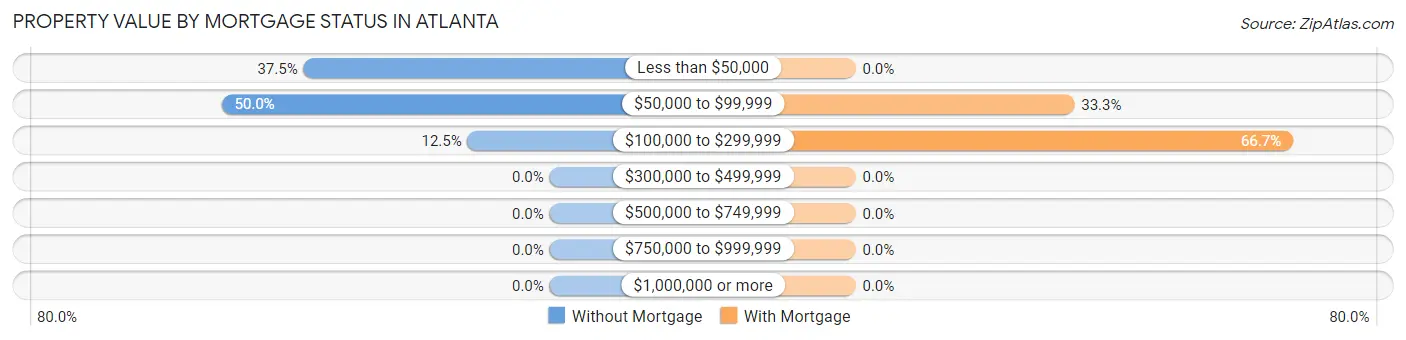
| Property Value | Without Mortgage | With Mortgage |
| Less than $50,000 | 9 (37.5%) | 0 (0.0%) |
| $50,000 to $99,999 | 12 (50.0%) | 2 (33.3%) |
| $100,000 to $299,999 | 3 (12.5%) | 4 (66.7%) |
| $300,000 to $499,999 | 0 (0.0%) | 0 (0.0%) |
| $500,000 to $749,999 | 0 (0.0%) | 0 (0.0%) |
| $750,000 to $999,999 | 0 (0.0%) | 0 (0.0%) |
| $1,000,000 or more | 0 (0.0%) | 0 (0.0%) |
| Total | 24 (100.0%) | 6 (100.0%) |
Household Income by Mortgage Status in Atlanta
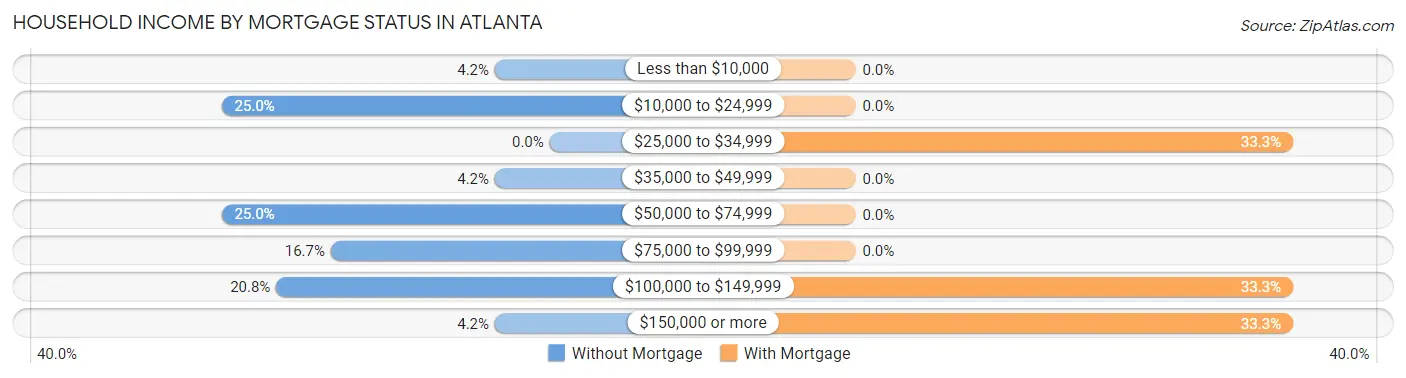
| Household Income | Without Mortgage | With Mortgage |
| Less than $10,000 | 1 (4.2%) | 0 (0.0%) |
| $10,000 to $24,999 | 6 (25.0%) | 0 (0.0%) |
| $25,000 to $34,999 | 0 (0.0%) | 2 (33.3%) |
| $35,000 to $49,999 | 1 (4.2%) | 0 (0.0%) |
| $50,000 to $74,999 | 6 (25.0%) | 0 (0.0%) |
| $75,000 to $99,999 | 4 (16.7%) | 0 (0.0%) |
| $100,000 to $149,999 | 5 (20.8%) | 2 (33.3%) |
| $150,000 or more | 1 (4.2%) | 2 (33.3%) |
| Total | 24 (100.0%) | 6 (100.0%) |
Property Value to Household Income Ratio in Atlanta
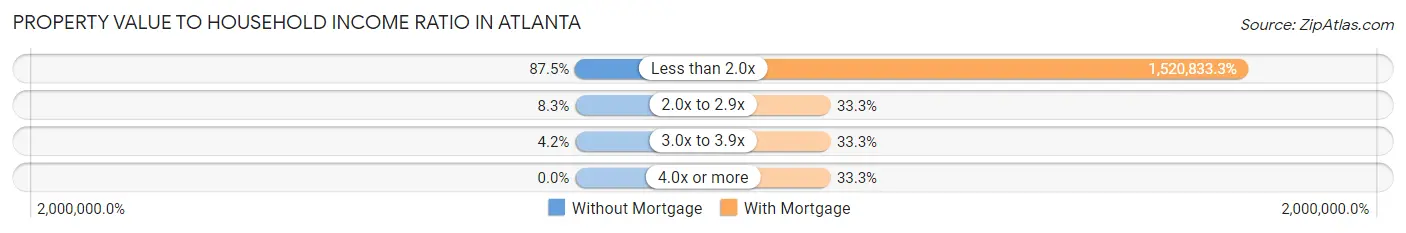
| Value-to-Income Ratio | Without Mortgage | With Mortgage |
| Less than 2.0x | 21 (87.5%) | 91,250 (1,520,833.3%) |
| 2.0x to 2.9x | 2 (8.3%) | 2 (33.3%) |
| 3.0x to 3.9x | 1 (4.2%) | 2 (33.3%) |
| 4.0x or more | 0 (0.0%) | 2 (33.3%) |
| Total | 24 (100.0%) | 6 (100.0%) |
Real Estate Taxes by Mortgage Status in Atlanta
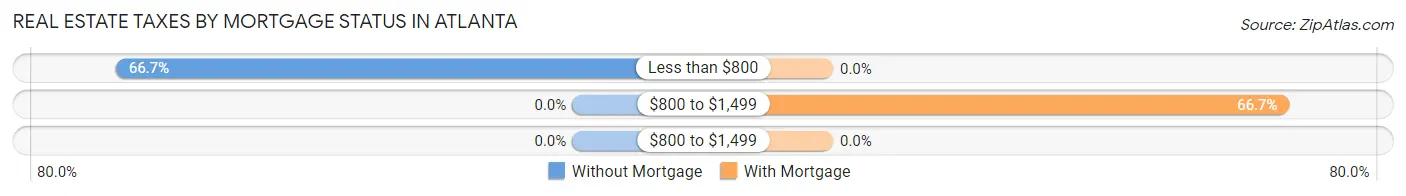
| Property Taxes | Without Mortgage | With Mortgage |
| Less than $800 | 16 (66.7%) | 0 (0.0%) |
| $800 to $1,499 | 0 (0.0%) | 4 (66.7%) |
| $800 to $1,499 | 0 (0.0%) | 0 (0.0%) |
| Total | 24 (100.0%) | 6 (100.0%) |
Health & Disability in Atlanta
Health Insurance Coverage by Age in Atlanta
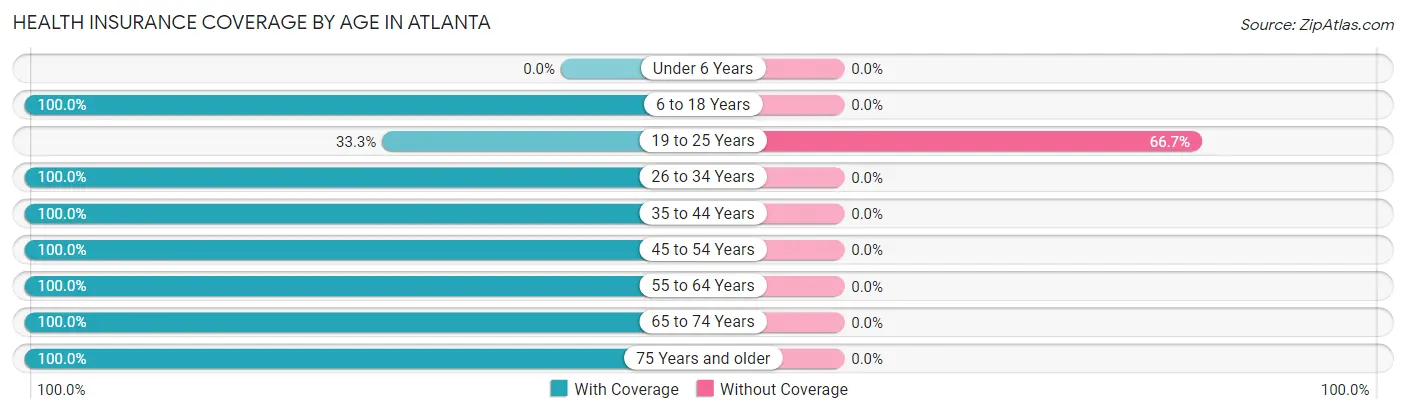
| Age Bracket | With Coverage | Without Coverage |
| Under 6 Years | 0 (0.0%) | 0 (0.0%) |
| 6 to 18 Years | 32 (100.0%) | 0 (0.0%) |
| 19 to 25 Years | 3 (33.3%) | 6 (66.7%) |
| 26 to 34 Years | 25 (100.0%) | 0 (0.0%) |
| 35 to 44 Years | 41 (100.0%) | 0 (0.0%) |
| 45 to 54 Years | 26 (100.0%) | 0 (0.0%) |
| 55 to 64 Years | 14 (100.0%) | 0 (0.0%) |
| 65 to 74 Years | 9 (100.0%) | 0 (0.0%) |
| 75 Years and older | 3 (100.0%) | 0 (0.0%) |
| Total | 153 (96.2%) | 6 (3.8%) |
Health Insurance Coverage by Citizenship Status in Atlanta

| Citizenship Status | With Coverage | Without Coverage |
| Native Born | 0 (0.0%) | 0 (0.0%) |
| Foreign Born, Citizen | 32 (100.0%) | 0 (0.0%) |
| Foreign Born, not a Citizen | 3 (33.3%) | 6 (66.7%) |
Health Insurance Coverage by Household Income in Atlanta
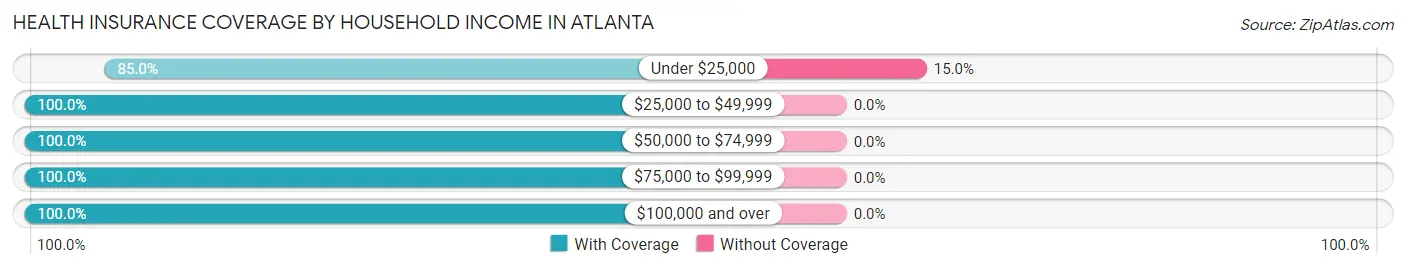
| Household Income | With Coverage | Without Coverage |
| Under $25,000 | 34 (85.0%) | 6 (15.0%) |
| $25,000 to $49,999 | 10 (100.0%) | 0 (0.0%) |
| $50,000 to $74,999 | 21 (100.0%) | 0 (0.0%) |
| $75,000 to $99,999 | 14 (100.0%) | 0 (0.0%) |
| $100,000 and over | 74 (100.0%) | 0 (0.0%) |
Public vs Private Health Insurance Coverage by Age in Atlanta
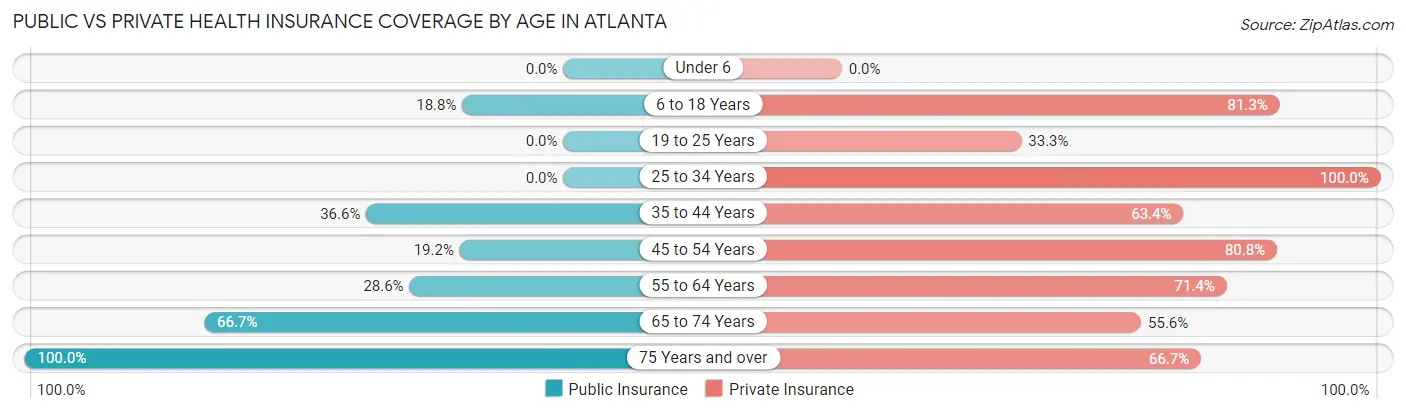
| Age Bracket | Public Insurance | Private Insurance |
| Under 6 | 0 (0.0%) | 0 (0.0%) |
| 6 to 18 Years | 6 (18.8%) | 26 (81.2%) |
| 19 to 25 Years | 0 (0.0%) | 3 (33.3%) |
| 25 to 34 Years | 0 (0.0%) | 25 (100.0%) |
| 35 to 44 Years | 15 (36.6%) | 26 (63.4%) |
| 45 to 54 Years | 5 (19.2%) | 21 (80.8%) |
| 55 to 64 Years | 4 (28.6%) | 10 (71.4%) |
| 65 to 74 Years | 6 (66.7%) | 5 (55.6%) |
| 75 Years and over | 3 (100.0%) | 2 (66.7%) |
| Total | 39 (24.5%) | 118 (74.2%) |
Disability Status by Sex by Age in Atlanta
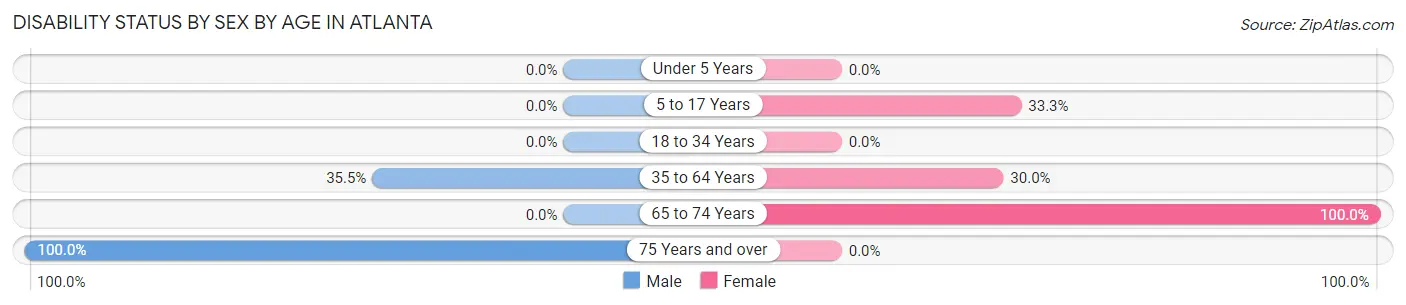
| Age Bracket | Male | Female |
| Under 5 Years | 0 (0.0%) | 0 (0.0%) |
| 5 to 17 Years | 0 (0.0%) | 6 (33.3%) |
| 18 to 34 Years | 0 (0.0%) | 0 (0.0%) |
| 35 to 64 Years | 11 (35.5%) | 15 (30.0%) |
| 65 to 74 Years | 0 (0.0%) | 2 (100.0%) |
| 75 Years and over | 1 (100.0%) | 0 (0.0%) |
Disability Class by Sex by Age in Atlanta
Disability Class: Hearing Difficulty
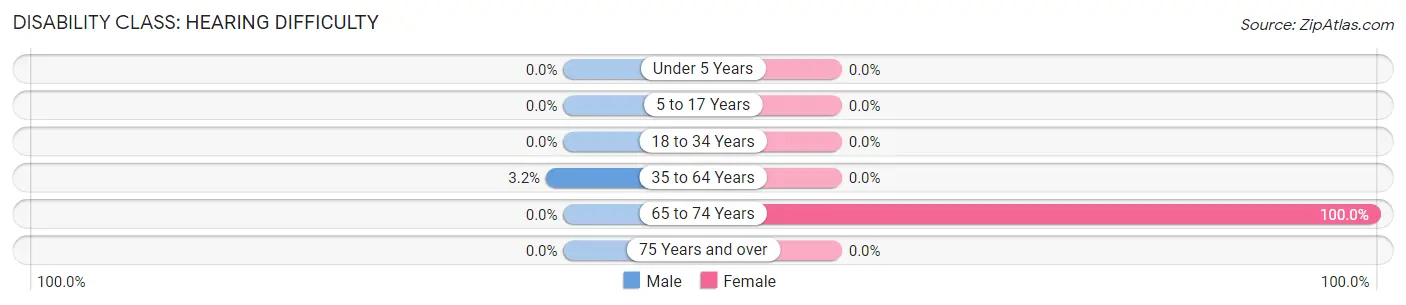
| Age Bracket | Male | Female |
| Under 5 Years | 0 (0.0%) | 0 (0.0%) |
| 5 to 17 Years | 0 (0.0%) | 0 (0.0%) |
| 18 to 34 Years | 0 (0.0%) | 0 (0.0%) |
| 35 to 64 Years | 1 (3.2%) | 0 (0.0%) |
| 65 to 74 Years | 0 (0.0%) | 2 (100.0%) |
| 75 Years and over | 0 (0.0%) | 0 (0.0%) |
Disability Class: Vision Difficulty
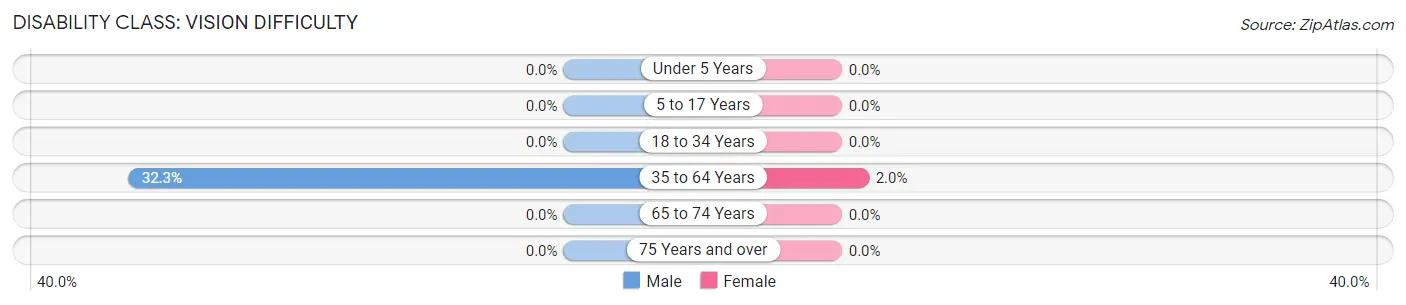
| Age Bracket | Male | Female |
| Under 5 Years | 0 (0.0%) | 0 (0.0%) |
| 5 to 17 Years | 0 (0.0%) | 0 (0.0%) |
| 18 to 34 Years | 0 (0.0%) | 0 (0.0%) |
| 35 to 64 Years | 10 (32.3%) | 1 (2.0%) |
| 65 to 74 Years | 0 (0.0%) | 0 (0.0%) |
| 75 Years and over | 0 (0.0%) | 0 (0.0%) |
Disability Class: Cognitive Difficulty
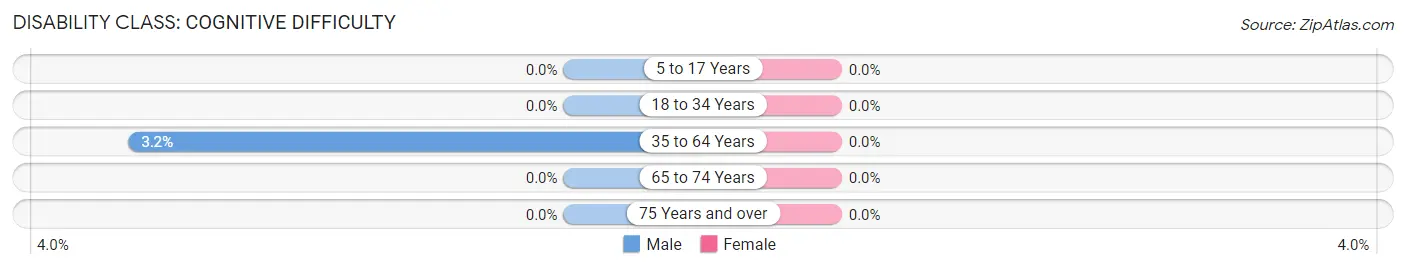
| Age Bracket | Male | Female |
| 5 to 17 Years | 0 (0.0%) | 0 (0.0%) |
| 18 to 34 Years | 0 (0.0%) | 0 (0.0%) |
| 35 to 64 Years | 1 (3.2%) | 0 (0.0%) |
| 65 to 74 Years | 0 (0.0%) | 0 (0.0%) |
| 75 Years and over | 0 (0.0%) | 0 (0.0%) |
Disability Class: Ambulatory Difficulty
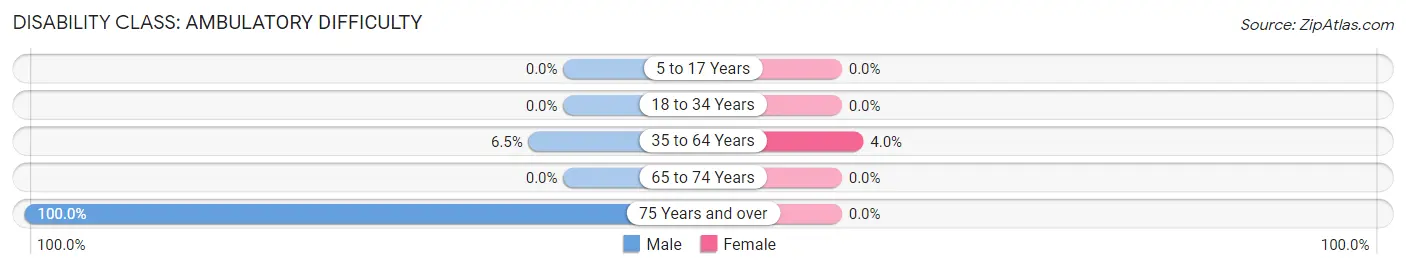
| Age Bracket | Male | Female |
| 5 to 17 Years | 0 (0.0%) | 0 (0.0%) |
| 18 to 34 Years | 0 (0.0%) | 0 (0.0%) |
| 35 to 64 Years | 2 (6.5%) | 2 (4.0%) |
| 65 to 74 Years | 0 (0.0%) | 0 (0.0%) |
| 75 Years and over | 1 (100.0%) | 0 (0.0%) |
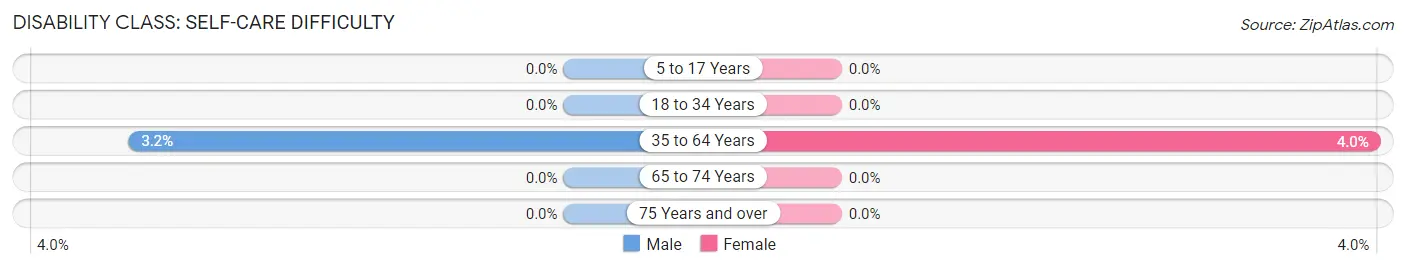
Disability Class: Self-Care Difficulty
| Age Bracket | Male | Female |
| 5 to 17 Years | 0 (0.0%) | 0 (0.0%) |
| 18 to 34 Years | 0 (0.0%) | 0 (0.0%) |
| 35 to 64 Years | 1 (3.2%) | 2 (4.0%) |
| 65 to 74 Years | 0 (0.0%) | 0 (0.0%) |
| 75 Years and over | 0 (0.0%) | 0 (0.0%) |
Technology Access in Atlanta
Computing Device Access in Atlanta
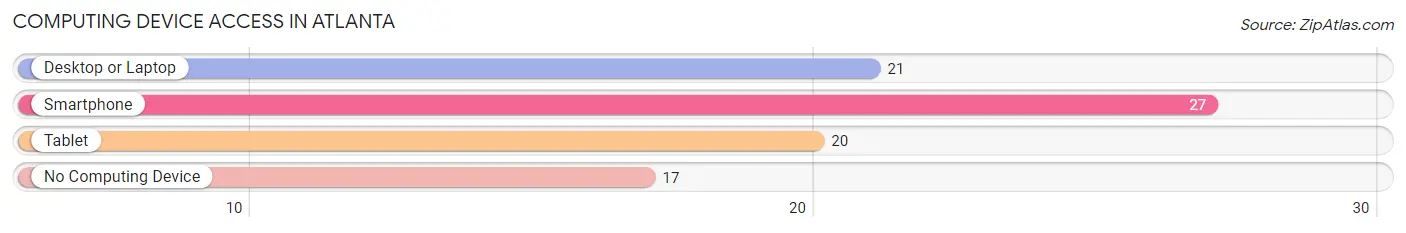
| Device Type | # Households | % Households |
| Desktop or Laptop | 21 | 46.7% |
| Smartphone | 27 | 60.0% |
| Tablet | 20 | 44.4% |
| No Computing Device | 17 | 37.8% |
| Total | 45 | 100.0% |
Internet Access in Atlanta
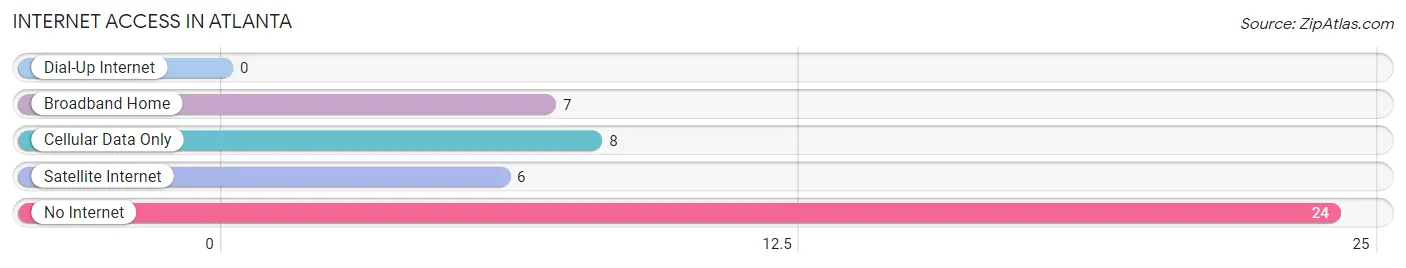
| Internet Type | # Households | % Households |
| Dial-Up Internet | 0 | 0.0% |
| Broadband Home | 7 | 15.6% |
| Cellular Data Only | 8 | 17.8% |
| Satellite Internet | 6 | 13.3% |
| No Internet | 24 | 53.3% |
| Total | 45 | 100.0% |
Atlanta Summary
Atlanta
Atlanta is the capital and most populous city in the U.S. state of Georgia. It is the cultural and economic center of the Atlanta metropolitan area, home to more than 6 million people and the ninth-largest metropolitan area in the United States. Atlanta is the county seat of Fulton County, and a small portion of the city extends eastward into DeKalb County.
History
Atlanta was founded in 1837 at the intersection of two railroad lines, and the city rose from the ashes of the American Civil War to become a national center of commerce. In the decades following the Civil War, the city earned a reputation as the "New South" capital of the United States. During the 1950s and 1960s, Atlanta became a major organizing center of the civil rights movement, with Dr. Martin Luther King Jr., Ralph David Abernathy, and many other locals playing major roles in the movement's leadership.
Geography
Atlanta is located in the foothills of the Appalachian Mountains, about 80 miles (130 km) northwest of the Atlantic Ocean. The city is situated among the rolling hills of the Piedmont region of the southeastern United States. The city is located at the northern edge of the Blue Ridge Mountains, a mountain range in the Appalachian Mountains system.
Economy
Atlanta is the economic and cultural center of the Atlanta metropolitan area, home to 5.7 million people and the ninth-largest metropolitan area in the United States. The city is home to the world headquarters of corporations such as The Coca-Cola Company, Turner Broadcasting, The Home Depot, Delta Air Lines, AT&T Mobility, UPS, and Chick-fil-A.
Demographics
As of the 2010 census, Atlanta had a population of 420,003. The racial makeup of the city was 54.0% Black or African American, 38.4% White, 3.1% Asian, 0.2% Native American, 0.1% Pacific Islander, 2.3% from other races, and 1.9% from two or more races. Hispanics or Latinos of any race were 6.2% of the population.
Los Angeles
Los Angeles is the second-most populous city in the United States, after New York City, and the most populous city in the state of California. With an estimated population of nearly four million people, it is the cultural, financial, and commercial center of Southern California.
History
Los Angeles was founded in 1781 by Spanish governor Felipe de Neve as El Pueblo de Nuestra Señora la Reina de los Angeles de Porciuncula. It became a part of Mexico in 1821 following the Mexican War of Independence. In 1848, at the end of the Mexican–American War, Los Angeles and the rest of California were purchased as part of the Treaty of Guadalupe Hidalgo, thereby becoming part of the United States.
Geography
Los Angeles is located in a large basin in Southern California, adjacent to the Pacific Ocean, with mountains as high as 10,000 feet (3,000 m), and deserts. The city, which covers about 469 square miles (1,210 km2), is the seat of Los Angeles County, the most populated county in the United States.
Economy
Los Angeles is a global city, with strengths in business, international trade, entertainment, culture, media, fashion, science, sports, technology, education, medicine, and research. It has been ranked 6th in the Global Cities Index and 9th in the Global Economic Power Index. The Los Angeles metropolitan area also has a gross metropolitan product of $1.0 trillion, making it the third-largest in the world, after the Greater Tokyo and New York metropolitan areas.
Demographics
As of the 2010 United States Census, there were 3,792,621 people, 1,457,500 households, and 898,512 families residing in the city. The population density was 8,092.3 people per square mile (3,119.3/km2). There were 1,659,872 housing units at an average density of 3,541.5 per square mile (1,366.2/km2). The racial makeup of the city was 49.8% White (31.8% Non-Hispanic White), 11.2% African American, 0.8% Native American, 10.8% Asian, 0.3% Pacific Islander, 25.5% from other races, and 2.4% from two or more races. Hispanics or Latinos of any race were 50.4% of the population.
Common Questions
What is Per Capita Income in Atlanta?
Per Capita income in Atlanta is $21,421.
What is the Median Family Income in Atlanta?
Median Family Income in Atlanta is $76,250.
What is Income or Wage Gap in Atlanta?
Income or Wage Gap in Atlanta is 4.0%.
Women in Atlanta earn 96.0 cents for every dollar earned by a man.
What is Inequality or Gini Index in Atlanta?
Inequality or Gini Index in Atlanta is 0.52.
What is the Total Population of Atlanta?
Total Population of Atlanta is 159.
What is the Total Male Population of Atlanta?
Total Male Population of Atlanta is 72.
What is the Total Female Population of Atlanta?
Total Female Population of Atlanta is 87.
What is the Ratio of Males per 100 Females in Atlanta?
There are 82.76 Males per 100 Females in Atlanta.
What is the Ratio of Females per 100 Males in Atlanta?
There are 120.83 Females per 100 Males in Atlanta.
What is the Median Population Age in Atlanta?
Median Population Age in Atlanta is 37.0 Years.
What is the Average Family Size in Atlanta
Average Family Size in Atlanta is 4.8 People.
What is the Average Household Size in Atlanta
Average Household Size in Atlanta is 3.5 People.
How Large is the Labor Force in Atlanta?
There are 70 People in the Labor Forcein in Atlanta.
What is the Percentage of People in the Labor Force in Atlanta?
49.0% of People are in the Labor Force in Atlanta.
What is the Unemployment Rate in Atlanta?
Unemployment Rate in Atlanta is 4.3%.