Abita Springs, LA Map & Demographics
Abita Springs Map
Abita Springs Overview
$36,141
PER CAPITA INCOME
$108,523
AVG FAMILY INCOME
$80,212
AVG HOUSEHOLD INCOME
37.7%
WAGE / INCOME GAP [ % ]
62.3¢/ $1
WAGE / INCOME GAP [ $ ]
0.39
INEQUALITY / GINI INDEX
2,639
TOTAL POPULATION
1,173
MALE POPULATION
1,466
FEMALE POPULATION
80.01
MALES / 100 FEMALES
124.98
FEMALES / 100 MALES
40.1
MEDIAN AGE
3.1
AVG FAMILY SIZE
2.5
AVG HOUSEHOLD SIZE
1,264
LABOR FORCE [ PEOPLE ]
62.2%
PERCENT IN LABOR FORCE
3.1%
UNEMPLOYMENT RATE
Abita Springs Zip Codes
Abita Springs Area Codes
Income in Abita Springs
Income Overview in Abita Springs
Per Capita Income in Abita Springs is $36,141, while median incomes of families and households are $108,523 and $80,212 respectively.
| Characteristic | Number | Measure |
| Per Capita Income | 2,639 | $36,141 |
| Median Family Income | 693 | $108,523 |
| Mean Family Income | 693 | $115,929 |
| Median Household Income | 1,052 | $80,212 |
| Mean Household Income | 1,052 | $90,917 |
| Income Deficit | 693 | $0 |
| Wage / Income Gap (%) | 2,639 | 37.70% |
| Wage / Income Gap ($) | 2,639 | 62.30¢ per $1 |
| Gini / Inequality Index | 2,639 | 0.39 |
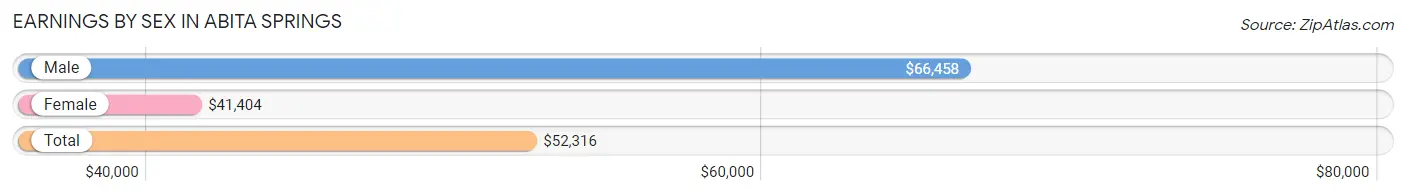
Earnings by Sex in Abita Springs
Average Earnings in Abita Springs are $52,316, $66,458 for men and $41,404 for women, a difference of 37.7%.
| Sex | Number | Average Earnings |
| Male | 701 (52.0%) | $66,458 |
| Female | 646 (48.0%) | $41,404 |
| Total | 1,347 (100.0%) | $52,316 |
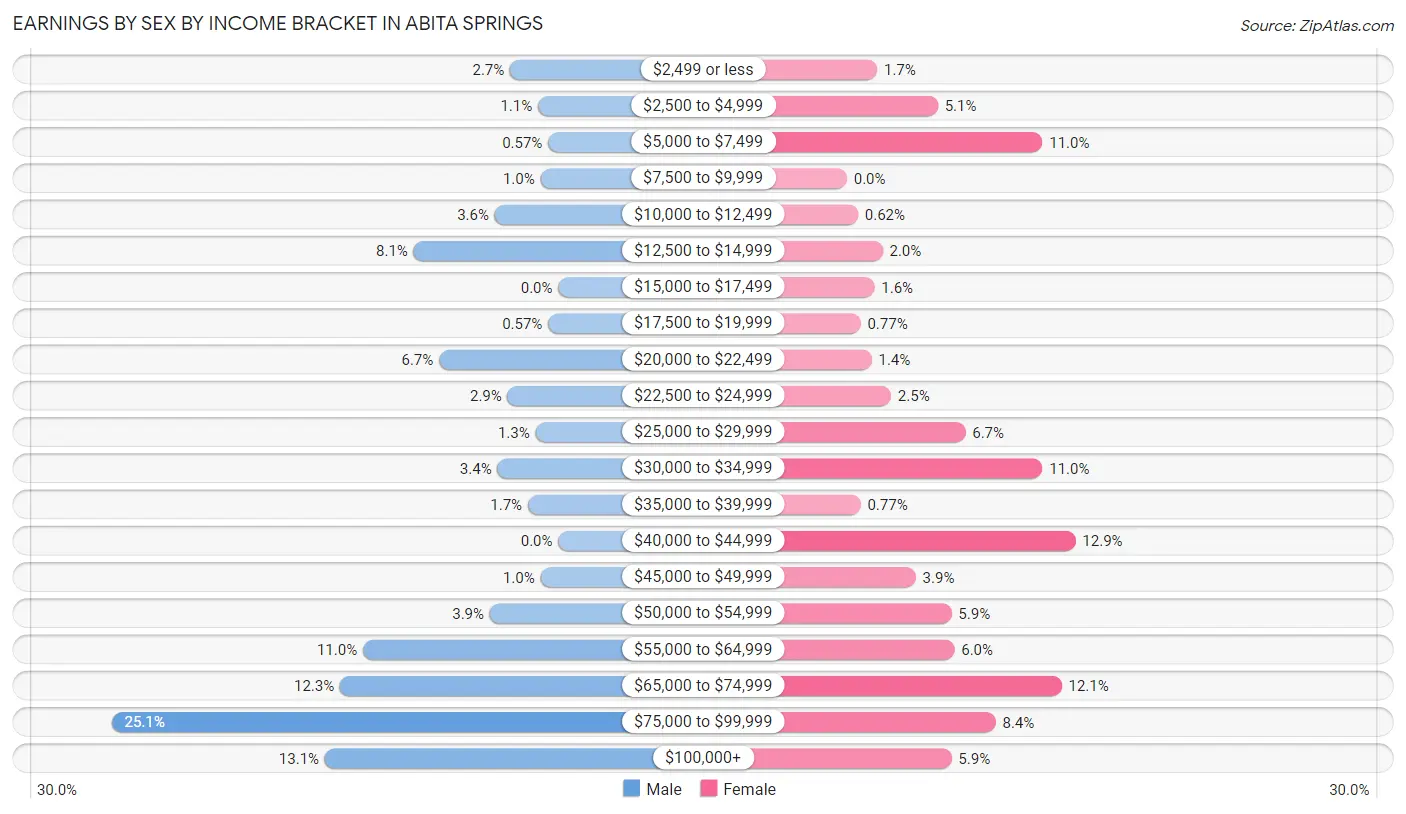
Earnings by Sex by Income Bracket in Abita Springs
The most common earnings brackets in Abita Springs are $75,000 to $99,999 for men (176 | 25.1%) and $40,000 to $44,999 for women (83 | 12.9%).
| Income | Male | Female |
| $2,499 or less | 19 (2.7%) | 11 (1.7%) |
| $2,500 to $4,999 | 8 (1.1%) | 33 (5.1%) |
| $5,000 to $7,499 | 4 (0.6%) | 71 (11.0%) |
| $7,500 to $9,999 | 7 (1.0%) | 0 (0.0%) |
| $10,000 to $12,499 | 25 (3.6%) | 4 (0.6%) |
| $12,500 to $14,999 | 57 (8.1%) | 13 (2.0%) |
| $15,000 to $17,499 | 0 (0.0%) | 10 (1.5%) |
| $17,500 to $19,999 | 4 (0.6%) | 5 (0.8%) |
| $20,000 to $22,499 | 47 (6.7%) | 9 (1.4%) |
| $22,500 to $24,999 | 20 (2.9%) | 16 (2.5%) |
| $25,000 to $29,999 | 9 (1.3%) | 43 (6.7%) |
| $30,000 to $34,999 | 24 (3.4%) | 71 (11.0%) |
| $35,000 to $39,999 | 12 (1.7%) | 5 (0.8%) |
| $40,000 to $44,999 | 0 (0.0%) | 83 (12.9%) |
| $45,000 to $49,999 | 7 (1.0%) | 25 (3.9%) |
| $50,000 to $54,999 | 27 (3.8%) | 38 (5.9%) |
| $55,000 to $64,999 | 77 (11.0%) | 39 (6.0%) |
| $65,000 to $74,999 | 86 (12.3%) | 78 (12.1%) |
| $75,000 to $99,999 | 176 (25.1%) | 54 (8.4%) |
| $100,000+ | 92 (13.1%) | 38 (5.9%) |
| Total | 701 (100.0%) | 646 (100.0%) |
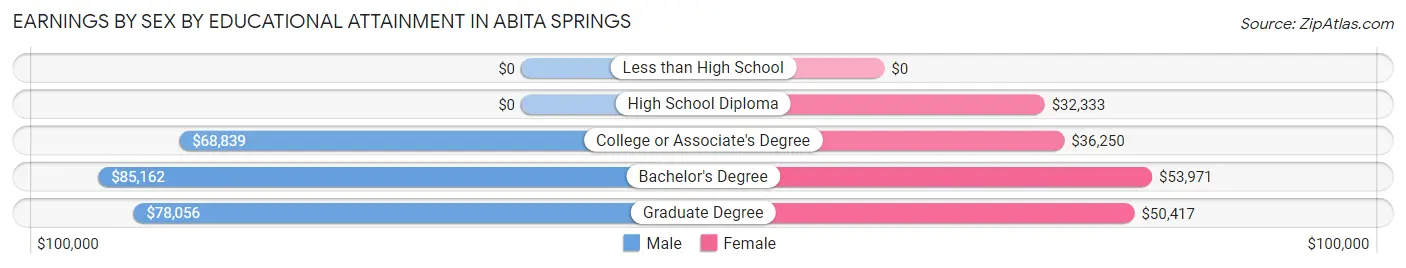
Earnings by Sex by Educational Attainment in Abita Springs
Average earnings in Abita Springs are $68,494 for men and $42,740 for women, a difference of 37.6%. Men with an educational attainment of bachelor's degree enjoy the highest average annual earnings of $85,162, while those with college or associate's degree education earn the least with $68,839. Women with an educational attainment of bachelor's degree earn the most with the average annual earnings of $53,971, while those with high school diploma education have the smallest earnings of $32,333.
| Educational Attainment | Male Income | Female Income |
| Less than High School | - | - |
| High School Diploma | - | - |
| College or Associate's Degree | $68,839 | $36,250 |
| Bachelor's Degree | $85,162 | $53,971 |
| Graduate Degree | $78,056 | $50,417 |
| Total | $68,494 | $42,740 |
Family Income in Abita Springs
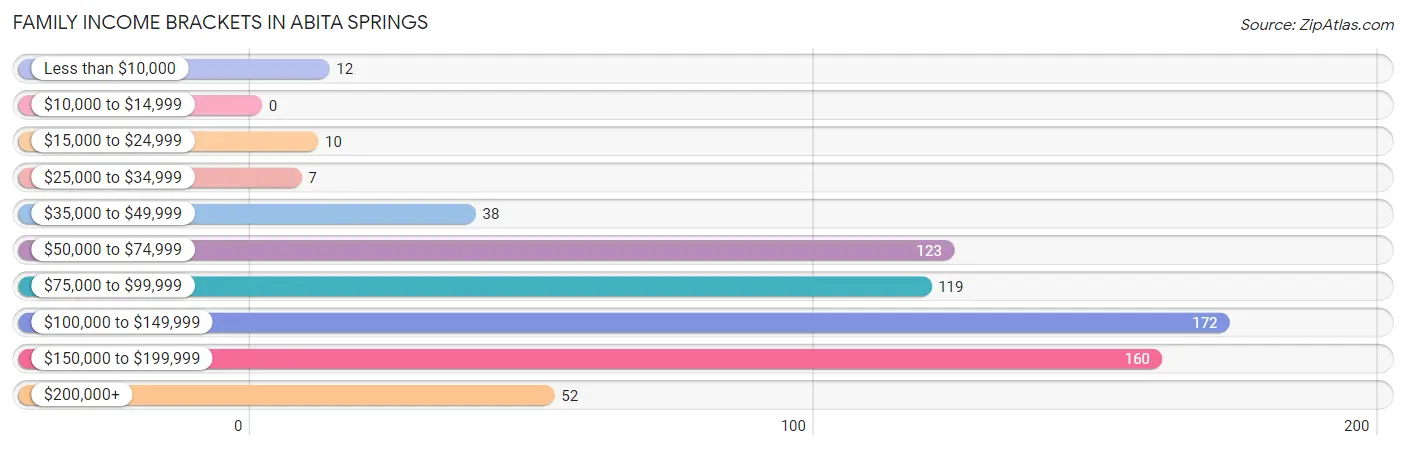
Family Income Brackets in Abita Springs
According to the Abita Springs family income data, there are 172 families falling into the $100,000 to $149,999 income range, which is the most common income bracket and makes up 24.8% of all families.
| Income Bracket | # Families | % Families |
| Less than $10,000 | 12 | 1.7% |
| $10,000 to $14,999 | 0 | 0.0% |
| $15,000 to $24,999 | 10 | 1.4% |
| $25,000 to $34,999 | 7 | 1.0% |
| $35,000 to $49,999 | 38 | 5.5% |
| $50,000 to $74,999 | 123 | 17.7% |
| $75,000 to $99,999 | 119 | 17.2% |
| $100,000 to $149,999 | 172 | 24.8% |
| $150,000 to $199,999 | 160 | 23.1% |
| $200,000+ | 52 | 7.5% |
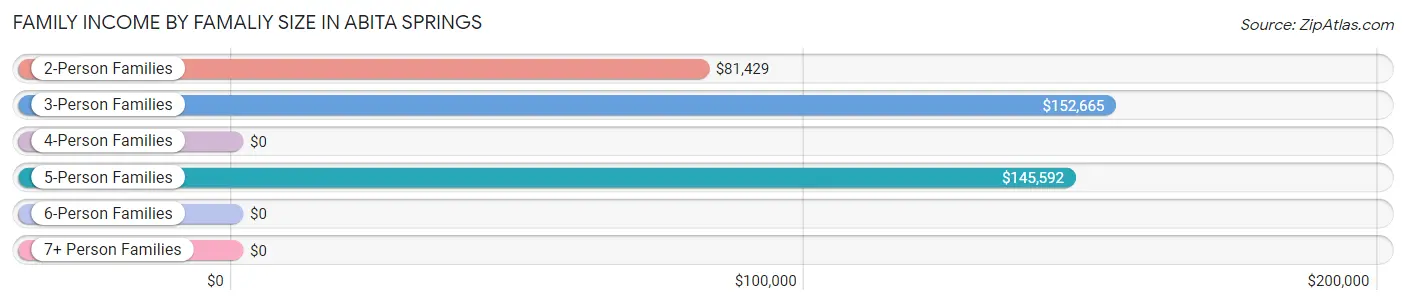
Family Income by Famaliy Size in Abita Springs
3-person families (254 | 36.6%) account for the highest median family income in Abita Springs with $152,665 per family, while 3-person families (254 | 36.6%) have the highest median income of $50,888 per family member.
| Income Bracket | # Families | Median Income |
| 2-Person Families | 270 (39.0%) | $81,429 |
| 3-Person Families | 254 (36.6%) | $152,665 |
| 4-Person Families | 108 (15.6%) | $0 |
| 5-Person Families | 61 (8.8%) | $145,592 |
| 6-Person Families | 0 (0.0%) | $0 |
| 7+ Person Families | 0 (0.0%) | $0 |
| Total | 693 (100.0%) | $108,523 |
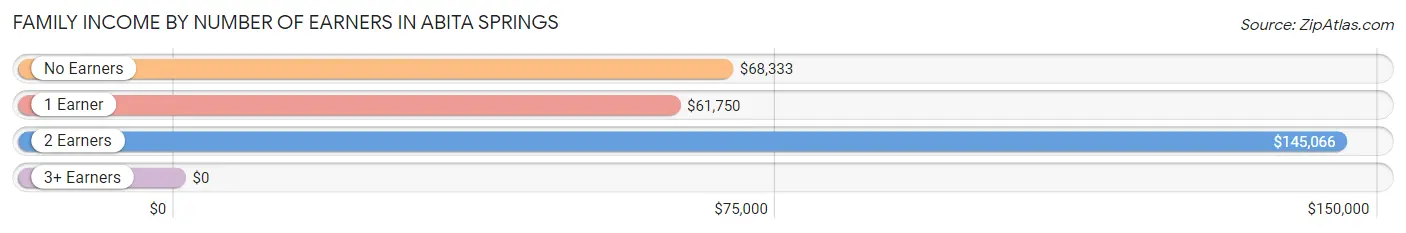
Family Income by Number of Earners in Abita Springs
| Number of Earners | # Families | Median Income |
| No Earners | 102 (14.7%) | $68,333 |
| 1 Earner | 151 (21.8%) | $61,750 |
| 2 Earners | 393 (56.7%) | $145,066 |
| 3+ Earners | 47 (6.8%) | $0 |
| Total | 693 (100.0%) | $108,523 |
Household Income in Abita Springs
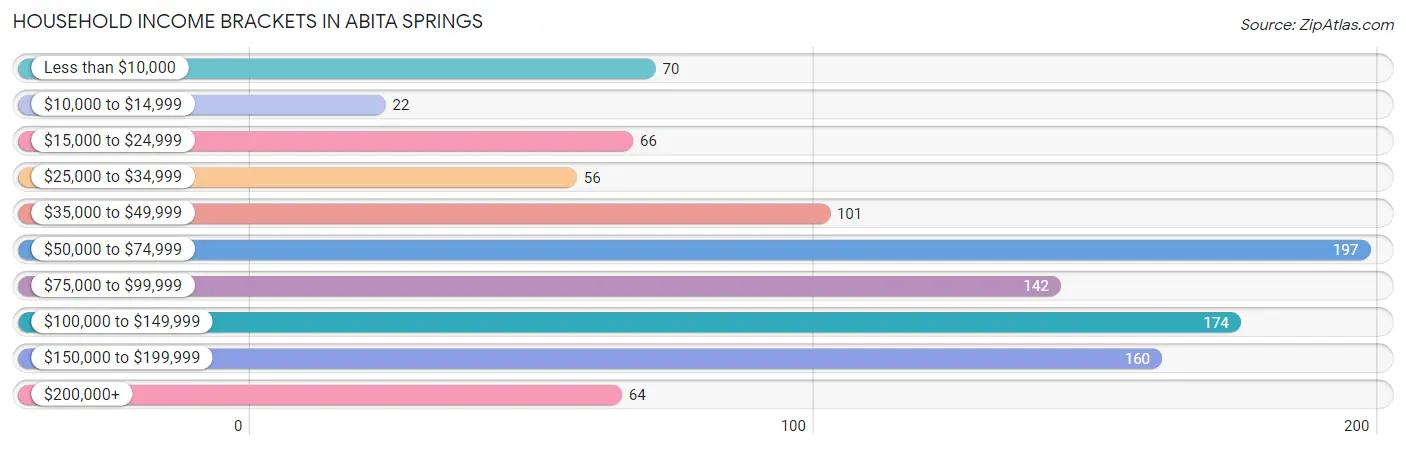
Household Income Brackets in Abita Springs
With 197 households falling in the category, the $50,000 to $74,999 income range is the most frequent in Abita Springs, accounting for 18.7% of all households. In contrast, only 22 households (2.1%) fall into the $10,000 to $14,999 income bracket, making it the least populous group.
| Income Bracket | # Households | % Households |
| Less than $10,000 | 70 | 6.7% |
| $10,000 to $14,999 | 22 | 2.1% |
| $15,000 to $24,999 | 66 | 6.3% |
| $25,000 to $34,999 | 56 | 5.3% |
| $35,000 to $49,999 | 101 | 9.6% |
| $50,000 to $74,999 | 197 | 18.7% |
| $75,000 to $99,999 | 142 | 13.5% |
| $100,000 to $149,999 | 174 | 16.5% |
| $150,000 to $199,999 | 160 | 15.2% |
| $200,000+ | 64 | 6.1% |
Household Income by Householder Age in Abita Springs
The median household income in Abita Springs is $80,212, with the highest median household income of $111,250 found in the 25 to 44 years age bracket for the primary householder. A total of 338 households (32.1%) fall into this category.
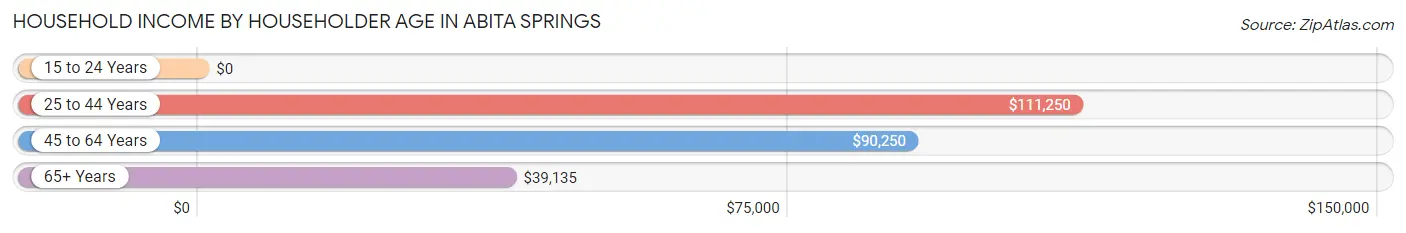
| Income Bracket | # Households | Median Income |
| 15 to 24 Years | 0 (0.0%) | $0 |
| 25 to 44 Years | 338 (32.1%) | $111,250 |
| 45 to 64 Years | 367 (34.9%) | $90,250 |
| 65+ Years | 347 (33.0%) | $39,135 |
| Total | 1,052 (100.0%) | $80,212 |
Poverty in Abita Springs
Income Below Poverty by Sex and Age in Abita Springs
With 7.8% poverty level for males and 7.3% for females among the residents of Abita Springs, 25 to 34 year old males and 75 year old and over females are the most vulnerable to poverty, with 57 males (22.4%) and 48 females (31.4%) in their respective age groups living below the poverty level.
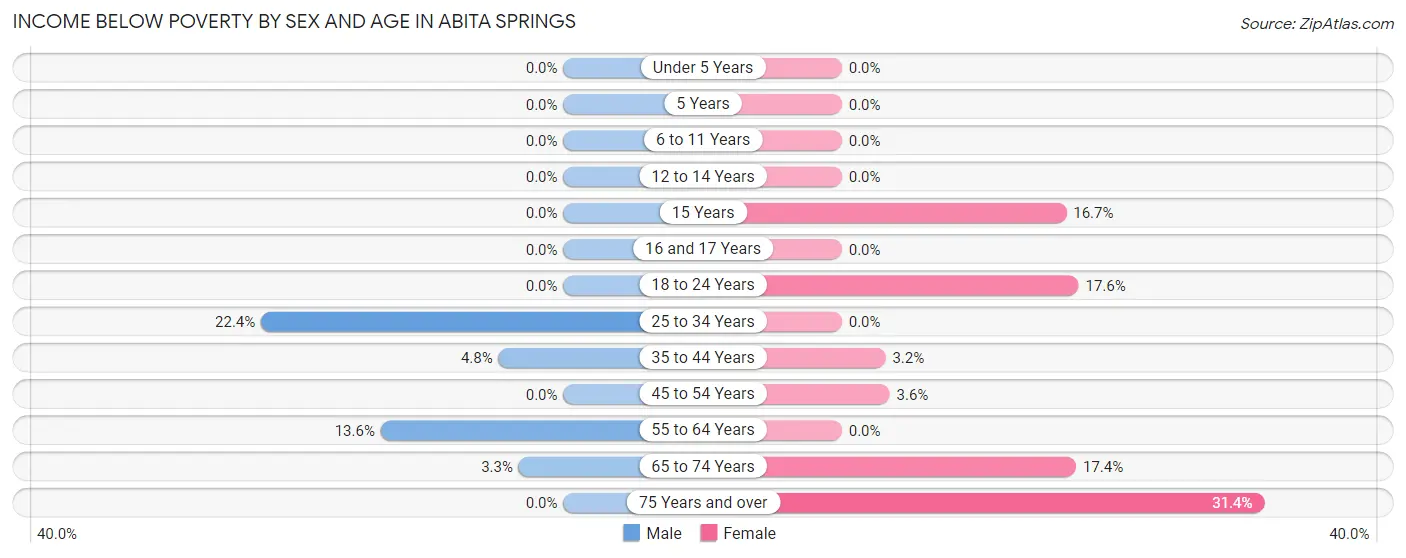
| Age Bracket | Male | Female |
| Under 5 Years | 0 (0.0%) | 0 (0.0%) |
| 5 Years | 0 (0.0%) | 0 (0.0%) |
| 6 to 11 Years | 0 (0.0%) | 0 (0.0%) |
| 12 to 14 Years | 0 (0.0%) | 0 (0.0%) |
| 15 Years | 0 (0.0%) | 7 (16.7%) |
| 16 and 17 Years | 0 (0.0%) | 0 (0.0%) |
| 18 to 24 Years | 0 (0.0%) | 16 (17.6%) |
| 25 to 34 Years | 57 (22.4%) | 0 (0.0%) |
| 35 to 44 Years | 5 (4.8%) | 6 (3.2%) |
| 45 to 54 Years | 0 (0.0%) | 6 (3.5%) |
| 55 to 64 Years | 24 (13.6%) | 0 (0.0%) |
| 65 to 74 Years | 5 (3.3%) | 24 (17.4%) |
| 75 Years and over | 0 (0.0%) | 48 (31.4%) |
| Total | 91 (7.8%) | 107 (7.3%) |
Income Above Poverty by Sex and Age in Abita Springs
According to the poverty statistics in Abita Springs, males aged under 5 years and females aged under 5 years are the age groups that are most secure financially, with 100.0% of males and 100.0% of females in these age groups living above the poverty line.
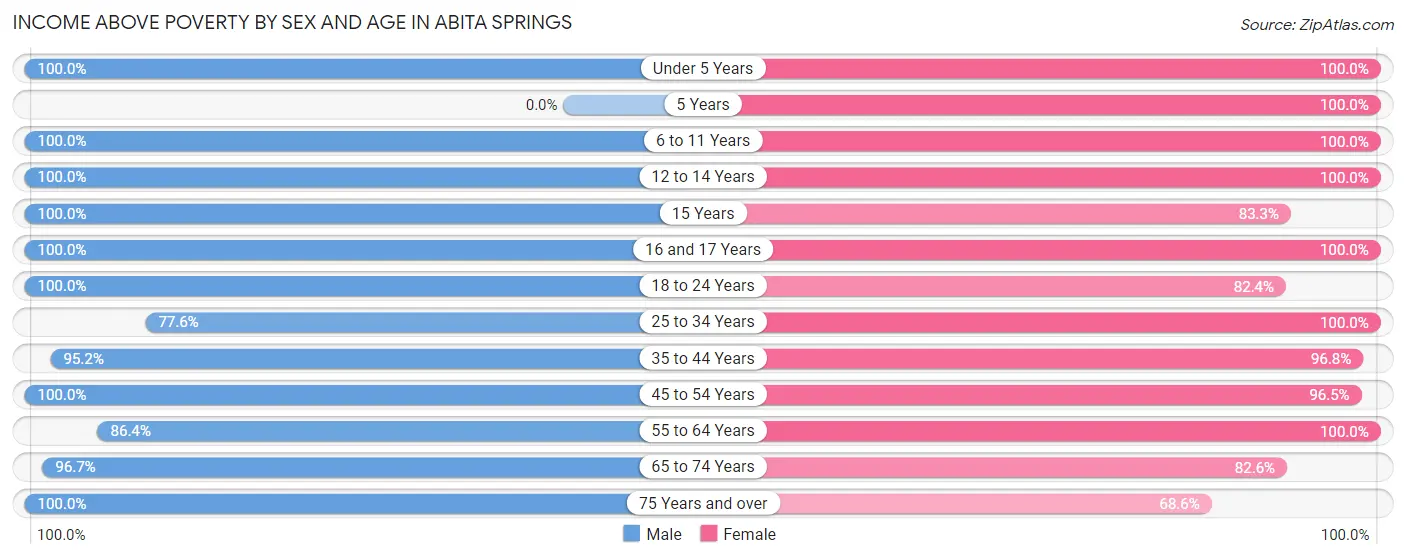
| Age Bracket | Male | Female |
| Under 5 Years | 167 (100.0%) | 79 (100.0%) |
| 5 Years | 0 (0.0%) | 27 (100.0%) |
| 6 to 11 Years | 11 (100.0%) | 86 (100.0%) |
| 12 to 14 Years | 21 (100.0%) | 161 (100.0%) |
| 15 Years | 9 (100.0%) | 35 (83.3%) |
| 16 and 17 Years | 10 (100.0%) | 37 (100.0%) |
| 18 to 24 Years | 47 (100.0%) | 75 (82.4%) |
| 25 to 34 Years | 197 (77.6%) | 167 (100.0%) |
| 35 to 44 Years | 99 (95.2%) | 179 (96.8%) |
| 45 to 54 Years | 154 (100.0%) | 163 (96.5%) |
| 55 to 64 Years | 153 (86.4%) | 127 (100.0%) |
| 65 to 74 Years | 146 (96.7%) | 114 (82.6%) |
| 75 Years and over | 68 (100.0%) | 105 (68.6%) |
| Total | 1,082 (92.2%) | 1,355 (92.7%) |
Income Below Poverty Among Married-Couple Families in Abita Springs
The poverty statistics for married-couple families in Abita Springs show that 1.1% or 6 of the total 550 families live below the poverty line. Families with no children have the highest poverty rate of 2.5%, comprising of 6 families. On the other hand, families with 1 or 2 children have the lowest poverty rate of 0.0%, which includes 0 families.
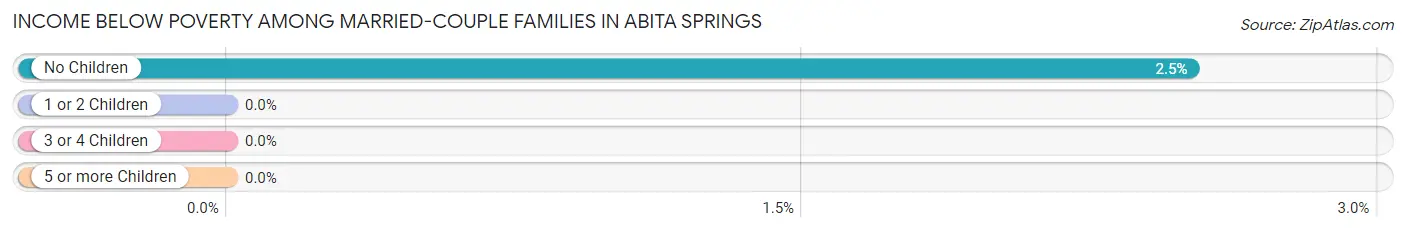
| Children | Above Poverty | Below Poverty |
| No Children | 233 (97.5%) | 6 (2.5%) |
| 1 or 2 Children | 270 (100.0%) | 0 (0.0%) |
| 3 or 4 Children | 41 (100.0%) | 0 (0.0%) |
| 5 or more Children | 0 (0.0%) | 0 (0.0%) |
| Total | 544 (98.9%) | 6 (1.1%) |
Income Below Poverty Among Single-Parent Households in Abita Springs
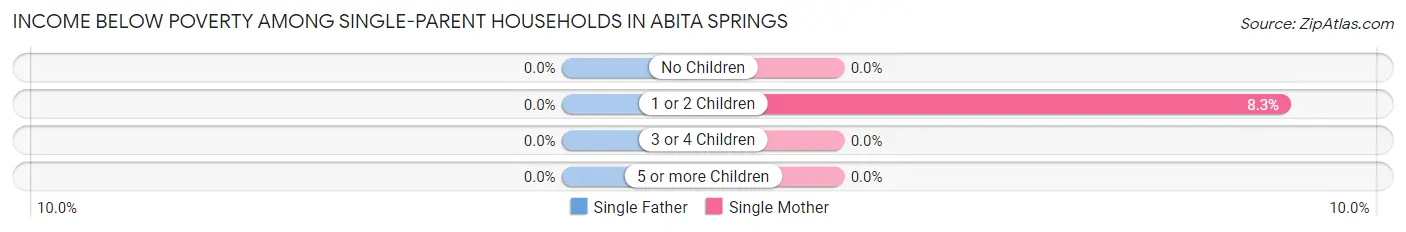
| Children | Single Father | Single Mother |
| No Children | 0 (0.0%) | 0 (0.0%) |
| 1 or 2 Children | 0 (0.0%) | 6 (8.3%) |
| 3 or 4 Children | 0 (0.0%) | 0 (0.0%) |
| 5 or more Children | 0 (0.0%) | 0 (0.0%) |
| Total | 0 (0.0%) | 6 (4.8%) |
Income Below Poverty Among Married-Couple vs Single-Parent Households in Abita Springs
The poverty data for Abita Springs shows that 6 of the married-couple family households (1.1%) and 6 of the single-parent households (4.2%) are living below the poverty level. Within the married-couple family households, those with no children have the highest poverty rate, with 6 households (2.5%) falling below the poverty line. Among the single-parent households, those with 1 or 2 children have the highest poverty rate, with 6 household (8.3%) living below poverty.
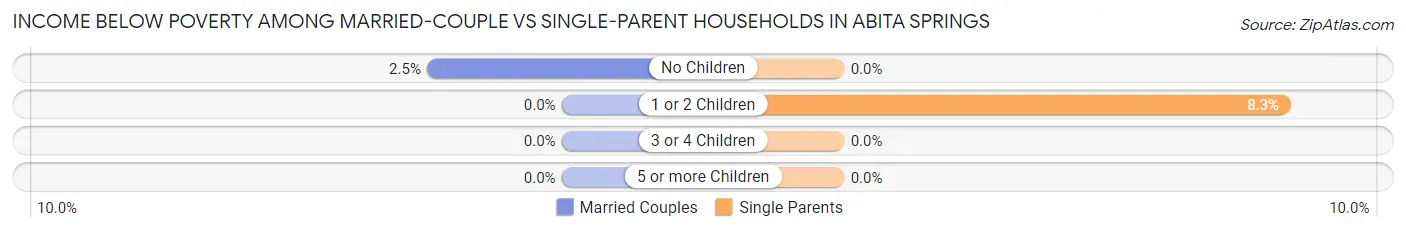
| Children | Married-Couple Families | Single-Parent Households |
| No Children | 6 (2.5%) | 0 (0.0%) |
| 1 or 2 Children | 0 (0.0%) | 6 (8.3%) |
| 3 or 4 Children | 0 (0.0%) | 0 (0.0%) |
| 5 or more Children | 0 (0.0%) | 0 (0.0%) |
| Total | 6 (1.1%) | 6 (4.2%) |
Race in Abita Springs
The most populous races in Abita Springs are White / Caucasian (2,185 | 82.8%), Black / African American (293 | 11.1%), and Hispanic or Latino (192 | 7.3%).
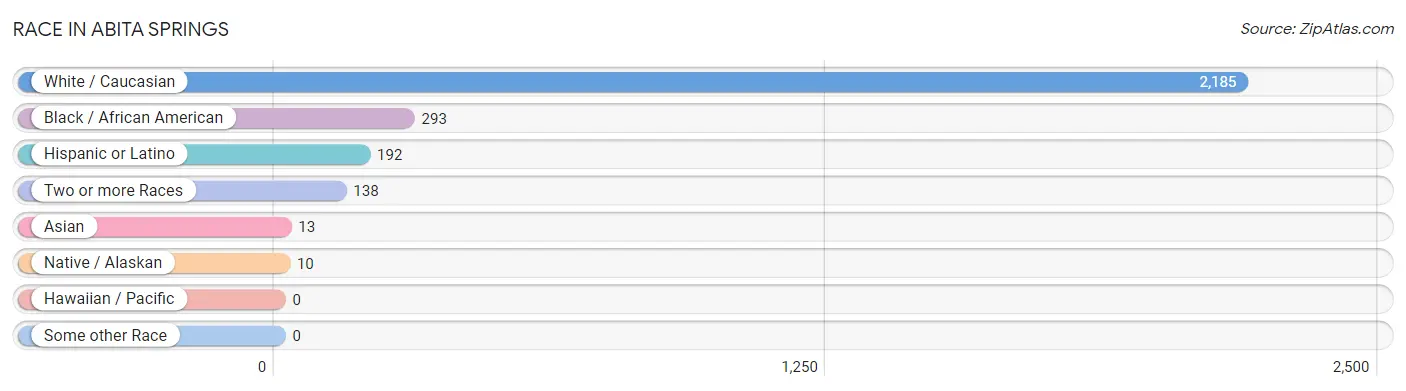
| Race | # Population | % Population |
| Asian | 13 | 0.5% |
| Black / African American | 293 | 11.1% |
| Hawaiian / Pacific | 0 | 0.0% |
| Hispanic or Latino | 192 | 7.3% |
| Native / Alaskan | 10 | 0.4% |
| White / Caucasian | 2,185 | 82.8% |
| Two or more Races | 138 | 5.2% |
| Some other Race | 0 | 0.0% |
| Total | 2,639 | 100.0% |
Ancestry in Abita Springs
The most populous ancestries reported in Abita Springs are Irish (695 | 26.3%), German (611 | 23.2%), French (413 | 15.7%), English (338 | 12.8%), and Italian (276 | 10.5%), together accounting for 88.4% of all Abita Springs residents.
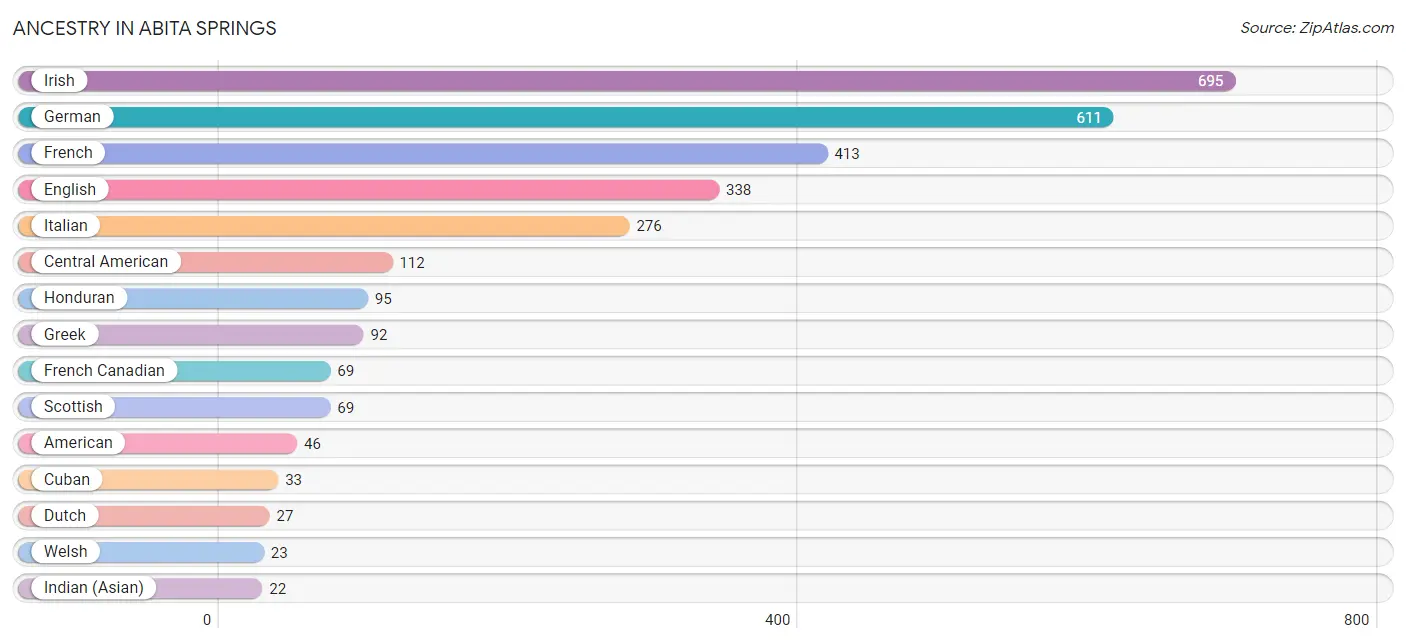
| Ancestry | # Population | % Population |
| African | 3 | 0.1% |
| American | 46 | 1.7% |
| Arab | 3 | 0.1% |
| British | 17 | 0.6% |
| Cajun | 7 | 0.3% |
| Central American | 112 | 4.2% |
| Chilean | 1 | 0.0% |
| Cuban | 33 | 1.3% |
| Danish | 14 | 0.5% |
| Dutch | 27 | 1.0% |
| Ecuadorian | 9 | 0.3% |
| Egyptian | 3 | 0.1% |
| English | 338 | 12.8% |
| European | 14 | 0.5% |
| French | 413 | 15.7% |
| French Canadian | 69 | 2.6% |
| German | 611 | 23.2% |
| Greek | 92 | 3.5% |
| Guatemalan | 14 | 0.5% |
| Honduran | 95 | 3.6% |
| Houma | 2 | 0.1% |
| Hungarian | 8 | 0.3% |
| Indian (Asian) | 22 | 0.8% |
| Irish | 695 | 26.3% |
| Italian | 276 | 10.5% |
| Korean | 11 | 0.4% |
| Mexican | 19 | 0.7% |
| Paraguayan | 3 | 0.1% |
| Portuguese | 2 | 0.1% |
| Russian | 11 | 0.4% |
| Scotch-Irish | 17 | 0.6% |
| Scottish | 69 | 2.6% |
| South American | 13 | 0.5% |
| South American Indian | 2 | 0.1% |
| Spaniard | 5 | 0.2% |
| Spanish | 10 | 0.4% |
| Subsaharan African | 3 | 0.1% |
| Swedish | 14 | 0.5% |
| Welsh | 23 | 0.9% |
| Yugoslavian | 3 | 0.1% | View All 40 Rows |
Immigrants in Abita Springs
The most numerous immigrant groups reported in Abita Springs came from Canada (13 | 0.5%), Latin America (13 | 0.5%), South America (10 | 0.4%), Ecuador (4 | 0.2%), and England (4 | 0.2%), together accounting for 1.7% of all Abita Springs residents.
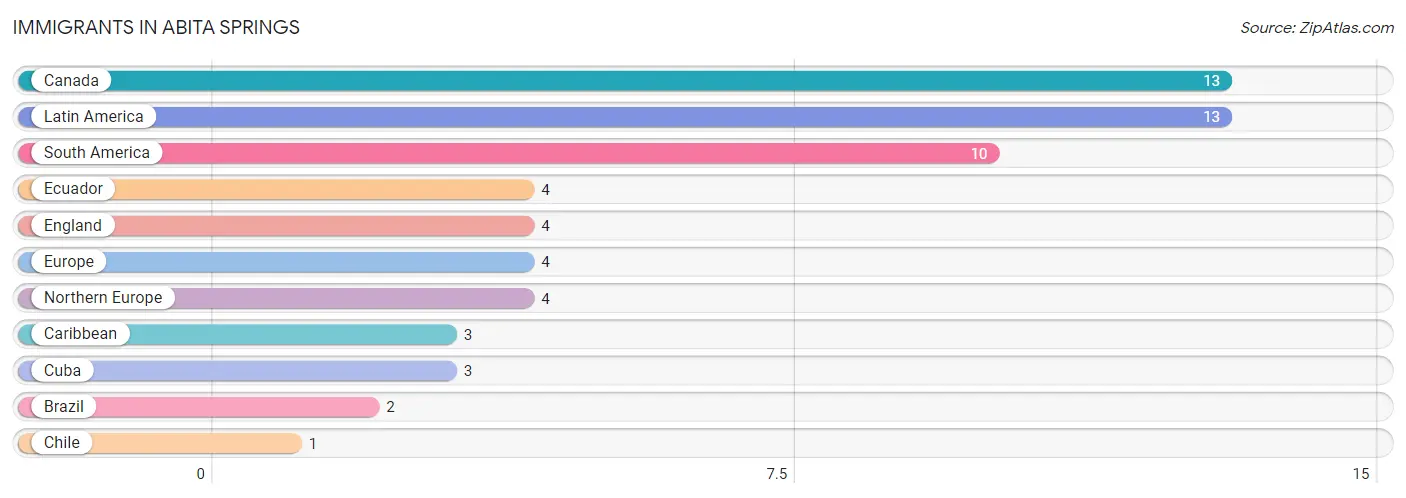
| Immigration Origin | # Population | % Population |
| Brazil | 2 | 0.1% |
| Canada | 13 | 0.5% |
| Caribbean | 3 | 0.1% |
| Chile | 1 | 0.0% |
| Cuba | 3 | 0.1% |
| Ecuador | 4 | 0.2% |
| England | 4 | 0.2% |
| Europe | 4 | 0.2% |
| Latin America | 13 | 0.5% |
| Northern Europe | 4 | 0.2% |
| South America | 10 | 0.4% | View All 11 Rows |
Sex and Age in Abita Springs
Sex and Age in Abita Springs
The most populous age groups in Abita Springs are 25 to 29 Years (169 | 14.4%) for men and 10 to 14 Years (179 | 12.2%) for women.
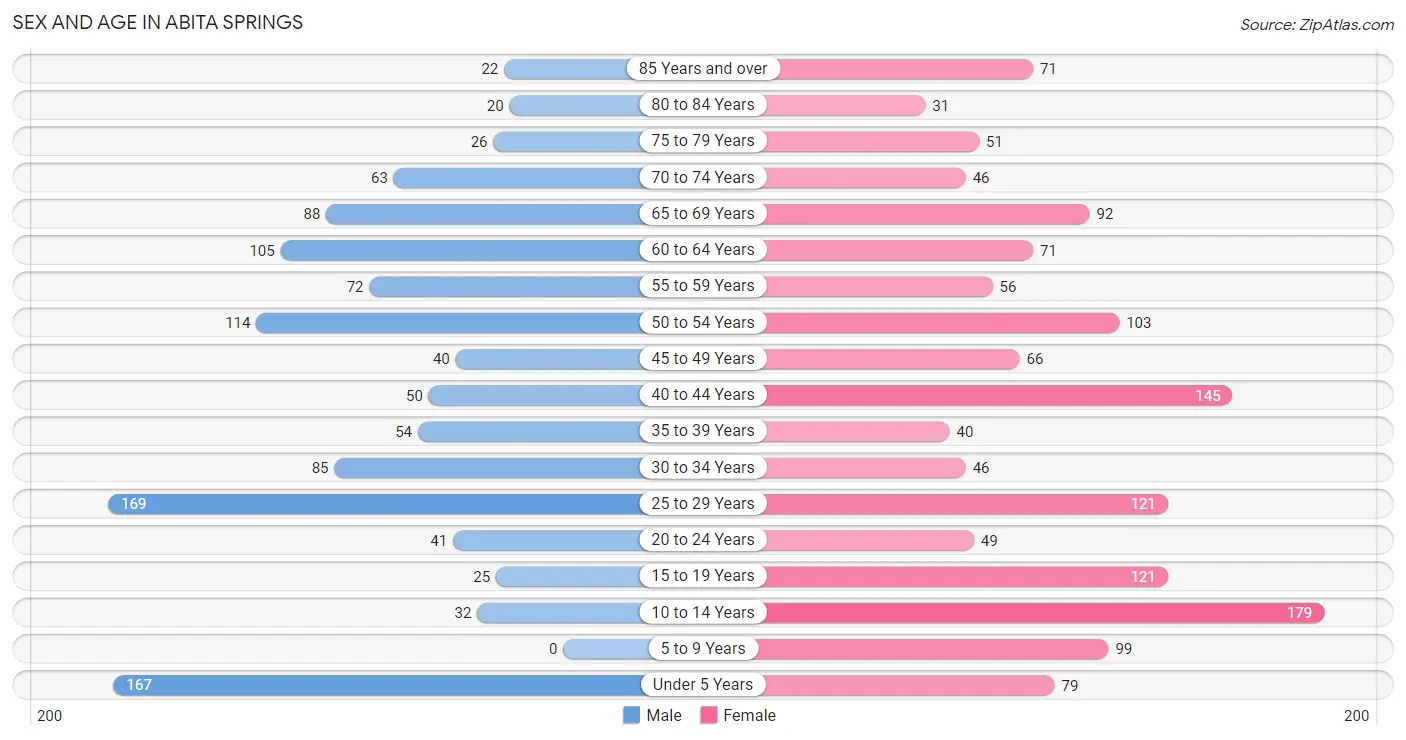
| Age Bracket | Male | Female |
| Under 5 Years | 167 (14.2%) | 79 (5.4%) |
| 5 to 9 Years | 0 (0.0%) | 99 (6.8%) |
| 10 to 14 Years | 32 (2.7%) | 179 (12.2%) |
| 15 to 19 Years | 25 (2.1%) | 121 (8.3%) |
| 20 to 24 Years | 41 (3.5%) | 49 (3.3%) |
| 25 to 29 Years | 169 (14.4%) | 121 (8.3%) |
| 30 to 34 Years | 85 (7.2%) | 46 (3.1%) |
| 35 to 39 Years | 54 (4.6%) | 40 (2.7%) |
| 40 to 44 Years | 50 (4.3%) | 145 (9.9%) |
| 45 to 49 Years | 40 (3.4%) | 66 (4.5%) |
| 50 to 54 Years | 114 (9.7%) | 103 (7.0%) |
| 55 to 59 Years | 72 (6.1%) | 56 (3.8%) |
| 60 to 64 Years | 105 (8.9%) | 71 (4.8%) |
| 65 to 69 Years | 88 (7.5%) | 92 (6.3%) |
| 70 to 74 Years | 63 (5.4%) | 46 (3.1%) |
| 75 to 79 Years | 26 (2.2%) | 51 (3.5%) |
| 80 to 84 Years | 20 (1.7%) | 31 (2.1%) |
| 85 Years and over | 22 (1.9%) | 71 (4.8%) |
| Total | 1,173 (100.0%) | 1,466 (100.0%) |
Families and Households in Abita Springs
Median Family Size in Abita Springs
The median family size in Abita Springs is 3.08 persons per family, with single male/father families (19 | 2.7%) accounting for the largest median family size of 3.63 persons per family. On the other hand, married-couple families (550 | 79.4%) represent the smallest median family size with 3.03 persons per family.
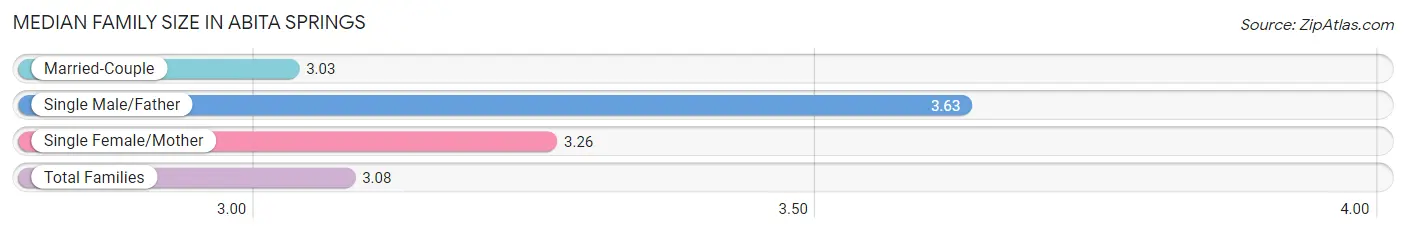
| Family Type | # Families | Family Size |
| Married-Couple | 550 (79.4%) | 3.03 |
| Single Male/Father | 19 (2.7%) | 3.63 |
| Single Female/Mother | 124 (17.9%) | 3.26 |
| Total Families | 693 (100.0%) | 3.08 |
Median Household Size in Abita Springs
The median household size in Abita Springs is 2.50 persons per household, with single female/mother households (124 | 11.8%) accounting for the largest median household size of 3.72 persons per household. non-family households (359 | 34.1%) represent the smallest median household size with 1.20 persons per household.
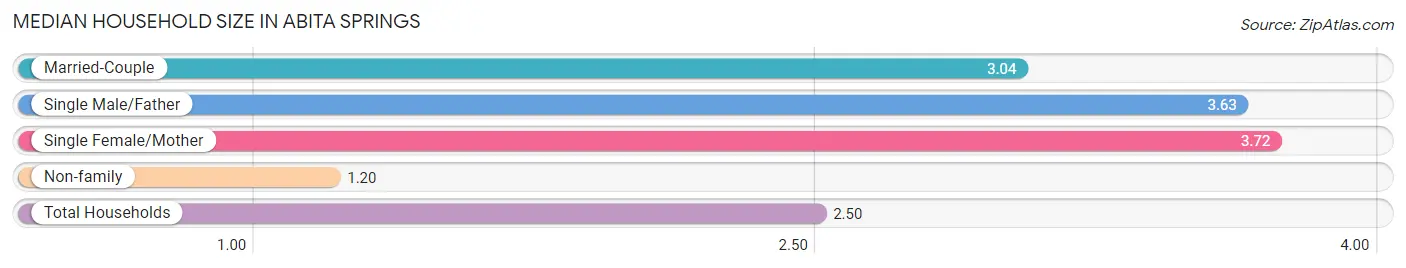
| Household Type | # Households | Household Size |
| Married-Couple | 550 (52.3%) | 3.04 |
| Single Male/Father | 19 (1.8%) | 3.63 |
| Single Female/Mother | 124 (11.8%) | 3.72 |
| Non-family | 359 (34.1%) | 1.20 |
| Total Households | 1,052 (100.0%) | 2.50 |
Household Size by Marriage Status in Abita Springs
Out of a total of 1,052 households in Abita Springs, 693 (65.9%) are family households, while 359 (34.1%) are nonfamily households. The most numerous type of family households are 2-person households, comprising 264, and the most common type of nonfamily households are 1-person households, comprising 297.
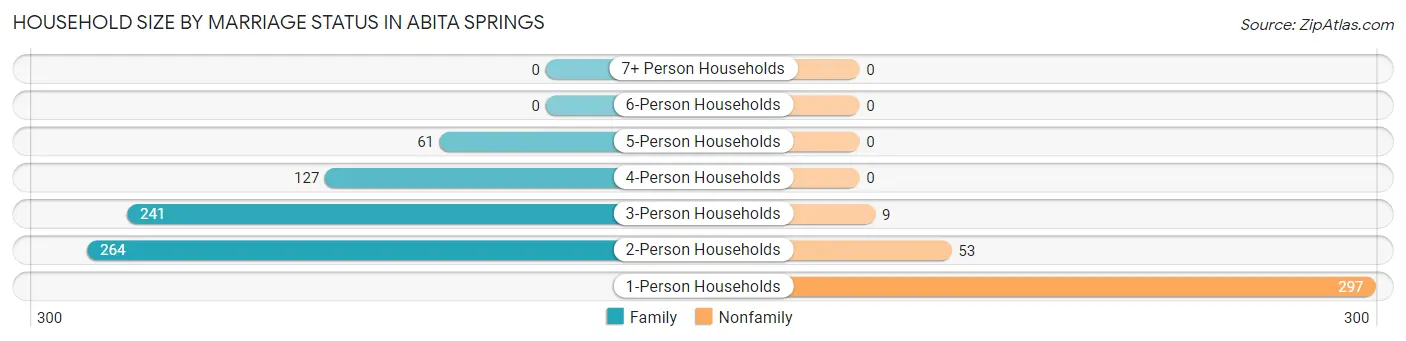
| Household Size | Family Households | Nonfamily Households |
| 1-Person Households | - | 297 (28.2%) |
| 2-Person Households | 264 (25.1%) | 53 (5.0%) |
| 3-Person Households | 241 (22.9%) | 9 (0.9%) |
| 4-Person Households | 127 (12.1%) | 0 (0.0%) |
| 5-Person Households | 61 (5.8%) | 0 (0.0%) |
| 6-Person Households | 0 (0.0%) | 0 (0.0%) |
| 7+ Person Households | 0 (0.0%) | 0 (0.0%) |
| Total | 693 (65.9%) | 359 (34.1%) |
Female Fertility in Abita Springs
Fertility by Age in Abita Springs
Average fertility rate in Abita Springs is 118.0 births per 1,000 women. Women in the age bracket of 20 to 34 years have the highest fertility rate with 273.0 births per 1,000 women. Women in the age bracket of 20 to 34 years acount for 81.9% of all women with births.
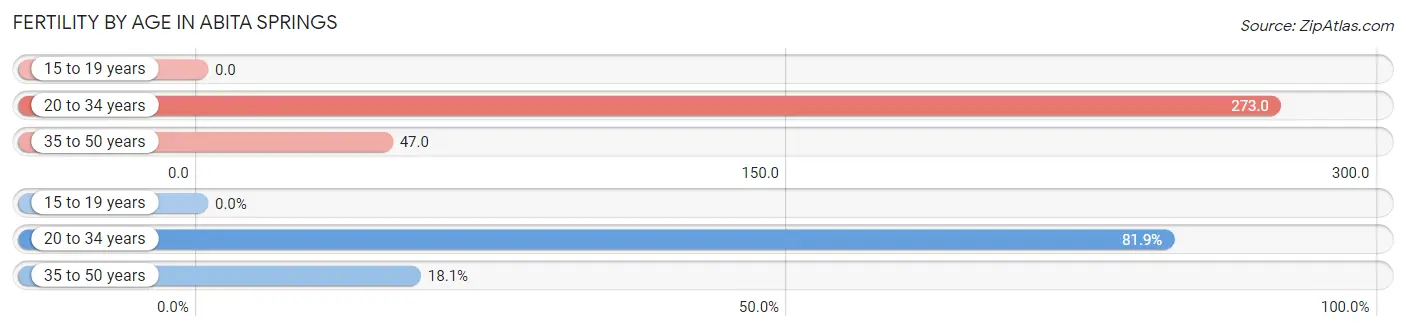
| Age Bracket | Women with Births | Births / 1,000 Women |
| 15 to 19 years | 0 (0.0%) | 0.0 |
| 20 to 34 years | 59 (81.9%) | 273.0 |
| 35 to 50 years | 13 (18.1%) | 47.0 |
| Total | 72 (100.0%) | 118.0 |
Fertility by Age by Marriage Status in Abita Springs
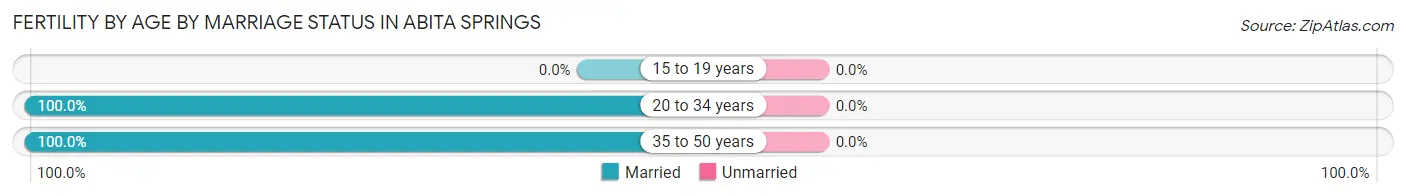
| Age Bracket | Married | Unmarried |
| 15 to 19 years | 0 (0.0%) | 0 (0.0%) |
| 20 to 34 years | 59 (100.0%) | 0 (0.0%) |
| 35 to 50 years | 13 (100.0%) | 0 (0.0%) |
| Total | 72 (100.0%) | 0 (0.0%) |
Fertility by Education in Abita Springs
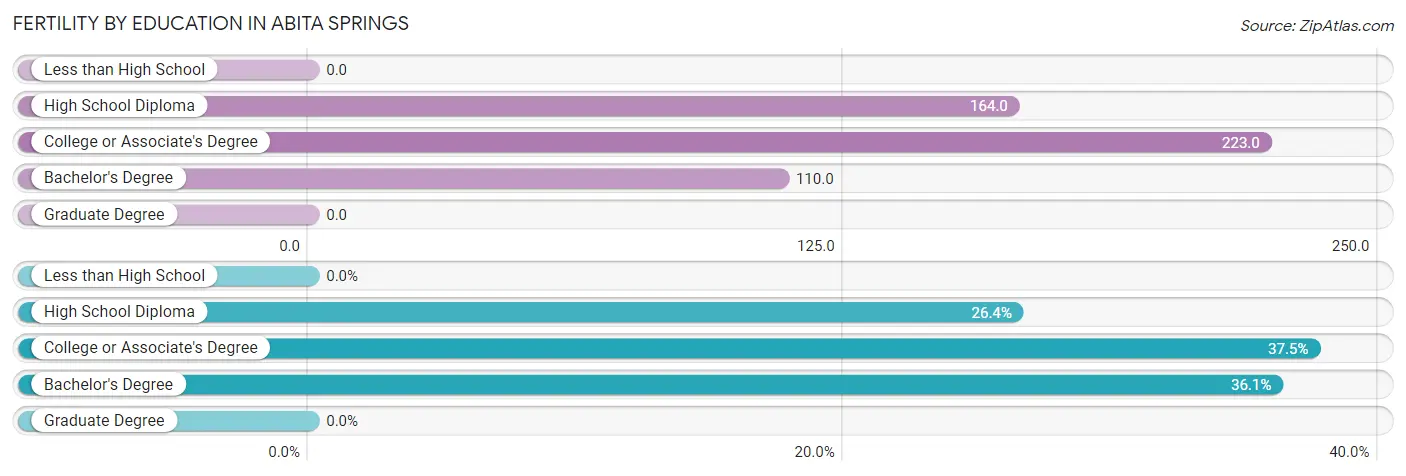
| Educational Attainment | Women with Births | Births / 1,000 Women |
| Less than High School | 0 (0.0%) | 0.0 |
| High School Diploma | 19 (26.4%) | 164.0 |
| College or Associate's Degree | 27 (37.5%) | 223.0 |
| Bachelor's Degree | 26 (36.1%) | 110.0 |
| Graduate Degree | 0 (0.0%) | 0.0 |
| Total | 72 (100.0%) | 118.0 |
Fertility by Education by Marriage Status in Abita Springs
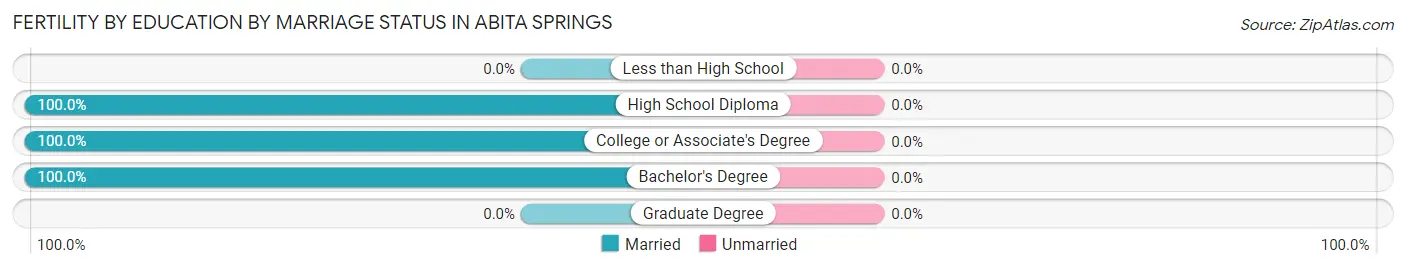
| Educational Attainment | Married | Unmarried |
| Less than High School | 0 (0.0%) | 0 (0.0%) |
| High School Diploma | 19 (100.0%) | 0 (0.0%) |
| College or Associate's Degree | 27 (100.0%) | 0 (0.0%) |
| Bachelor's Degree | 26 (100.0%) | 0 (0.0%) |
| Graduate Degree | 0 (0.0%) | 0 (0.0%) |
| Total | 72 (100.0%) | 0 (0.0%) |
Employment Characteristics in Abita Springs
Employment by Class of Employer in Abita Springs
Among the 1,201 employed individuals in Abita Springs, private company employees (699 | 58.2%), self-employed (incorporated) (171 | 14.2%), and local government employees (87 | 7.2%) make up the most common classes of employment.
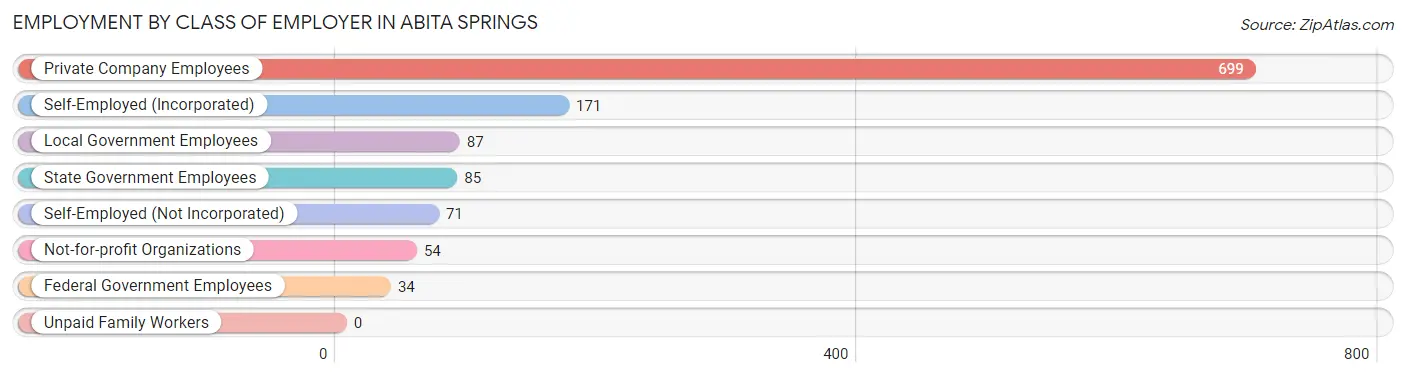
| Employer Class | # Employees | % Employees |
| Private Company Employees | 699 | 58.2% |
| Self-Employed (Incorporated) | 171 | 14.2% |
| Self-Employed (Not Incorporated) | 71 | 5.9% |
| Not-for-profit Organizations | 54 | 4.5% |
| Local Government Employees | 87 | 7.2% |
| State Government Employees | 85 | 7.1% |
| Federal Government Employees | 34 | 2.8% |
| Unpaid Family Workers | 0 | 0.0% |
| Total | 1,201 | 100.0% |
Employment Status by Age in Abita Springs
According to the labor force statistics for Abita Springs, out of the total population over 16 years of age (2,032), 62.2% or 1,264 individuals are in the labor force, with 3.1% or 39 of them unemployed. The age group with the highest labor force participation rate is 30 to 34 years, with 100.0% or 131 individuals in the labor force. Within the labor force, the 65 to 74 years age range has the highest percentage of unemployed individuals, with 15.2% or 10 of them being unemployed.
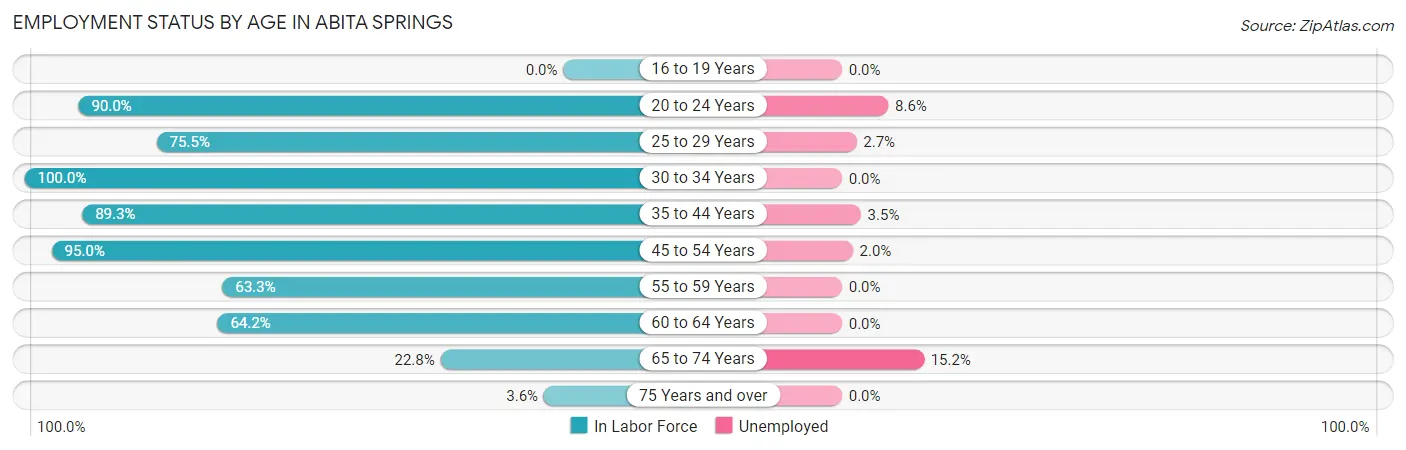
| Age Bracket | In Labor Force | Unemployed |
| 16 to 19 Years | 0 (0.0%) | 0 (0.0%) |
| 20 to 24 Years | 81 (90.0%) | 7 (8.6%) |
| 25 to 29 Years | 219 (75.5%) | 6 (2.7%) |
| 30 to 34 Years | 131 (100.0%) | 0 (0.0%) |
| 35 to 44 Years | 258 (89.3%) | 9 (3.5%) |
| 45 to 54 Years | 307 (95.0%) | 6 (2.0%) |
| 55 to 59 Years | 81 (63.3%) | 0 (0.0%) |
| 60 to 64 Years | 113 (64.2%) | 0 (0.0%) |
| 65 to 74 Years | 66 (22.8%) | 10 (15.2%) |
| 75 Years and over | 8 (3.6%) | 0 (0.0%) |
| Total | 1,264 (62.2%) | 39 (3.1%) |
Employment Status by Educational Attainment in Abita Springs
According to labor force statistics for Abita Springs, 82.9% of individuals (1,108) out of the total population between 25 and 64 years of age (1,337) are in the labor force, with 1.9% or 21 of them being unemployed. The group with the highest labor force participation rate are those with the educational attainment of high school diploma, with 94.0% or 264 individuals in the labor force. Within the labor force, individuals with college / associate degree education have the highest percentage of unemployment, with 6.2% or 16 of them being unemployed.
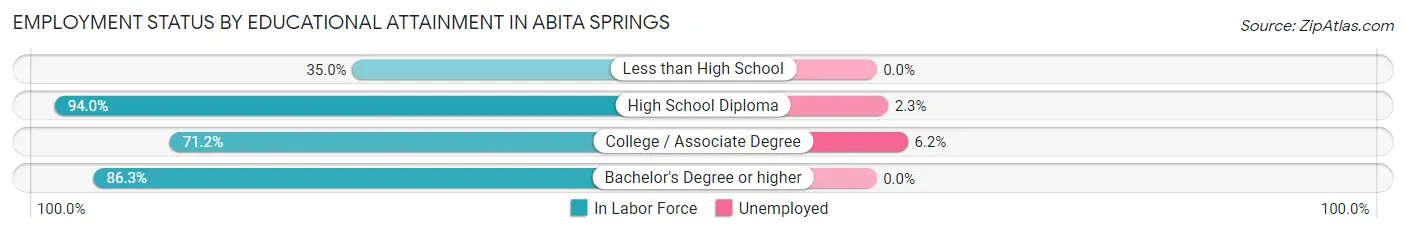
| Educational Attainment | In Labor Force | Unemployed |
| Less than High School | 7 (35.0%) | 0 (0.0%) |
| High School Diploma | 264 (94.0%) | 6 (2.3%) |
| College / Associate Degree | 264 (71.2%) | 23 (6.2%) |
| Bachelor's Degree or higher | 574 (86.3%) | 0 (0.0%) |
| Total | 1,108 (82.9%) | 25 (1.9%) |
Employment Occupations by Sex in Abita Springs
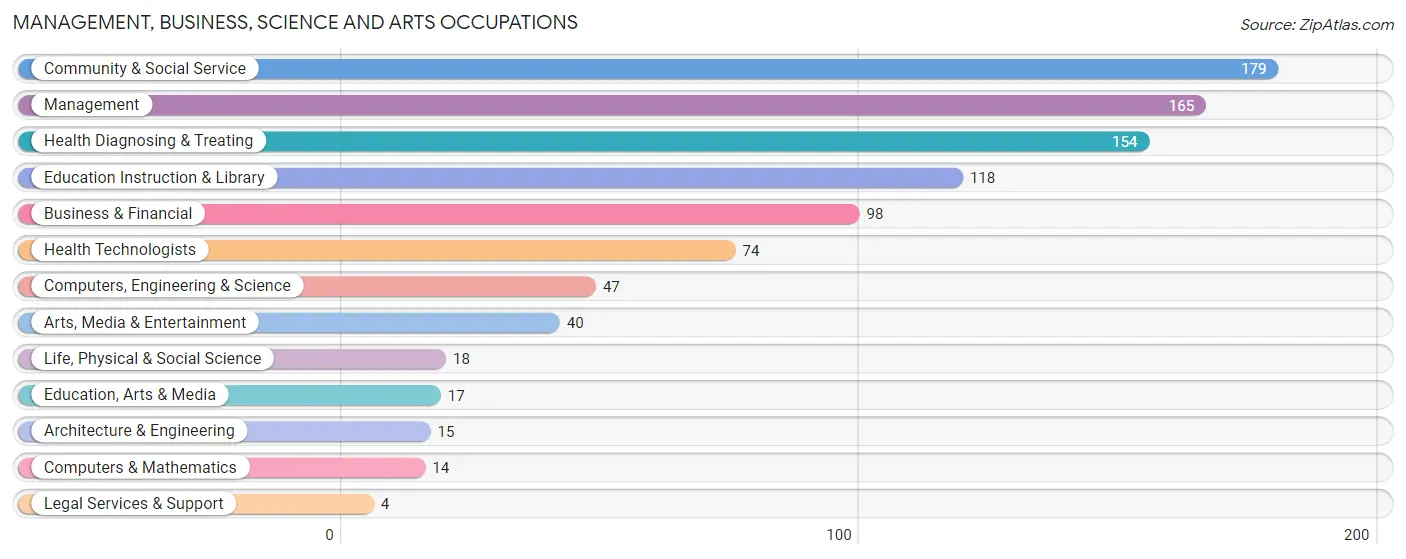
Management, Business, Science and Arts Occupations
The most common Management, Business, Science and Arts occupations in Abita Springs are Community & Social Service (179 | 14.9%), Management (165 | 13.7%), Health Diagnosing & Treating (154 | 12.8%), Education Instruction & Library (118 | 9.8%), and Business & Financial (98 | 8.1%).
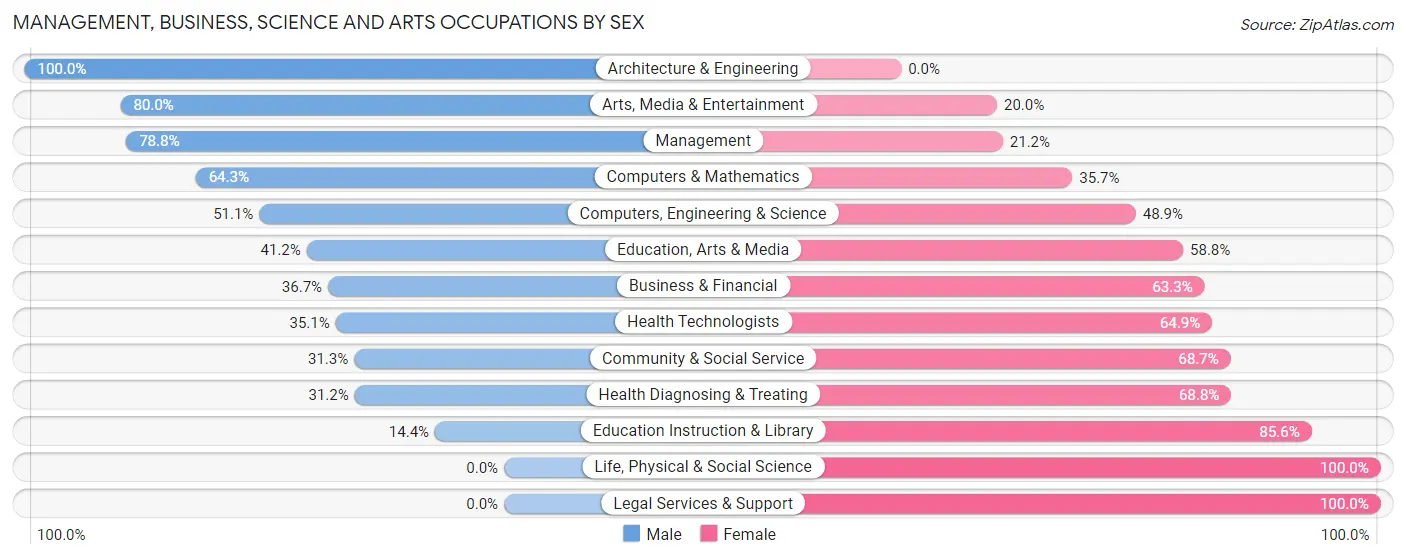
Management, Business, Science and Arts Occupations by Sex
Within the Management, Business, Science and Arts occupations in Abita Springs, the most male-oriented occupations are Architecture & Engineering (100.0%), Arts, Media & Entertainment (80.0%), and Management (78.8%), while the most female-oriented occupations are Life, Physical & Social Science (100.0%), Legal Services & Support (100.0%), and Education Instruction & Library (85.6%).
| Occupation | Male | Female |
| Management | 130 (78.8%) | 35 (21.2%) |
| Business & Financial | 36 (36.7%) | 62 (63.3%) |
| Computers, Engineering & Science | 24 (51.1%) | 23 (48.9%) |
| Computers & Mathematics | 9 (64.3%) | 5 (35.7%) |
| Architecture & Engineering | 15 (100.0%) | 0 (0.0%) |
| Life, Physical & Social Science | 0 (0.0%) | 18 (100.0%) |
| Community & Social Service | 56 (31.3%) | 123 (68.7%) |
| Education, Arts & Media | 7 (41.2%) | 10 (58.8%) |
| Legal Services & Support | 0 (0.0%) | 4 (100.0%) |
| Education Instruction & Library | 17 (14.4%) | 101 (85.6%) |
| Arts, Media & Entertainment | 32 (80.0%) | 8 (20.0%) |
| Health Diagnosing & Treating | 48 (31.2%) | 106 (68.8%) |
| Health Technologists | 26 (35.1%) | 48 (64.9%) |
| Total (Category) | 294 (45.7%) | 349 (54.3%) |
| Total (Overall) | 626 (52.0%) | 578 (48.0%) |
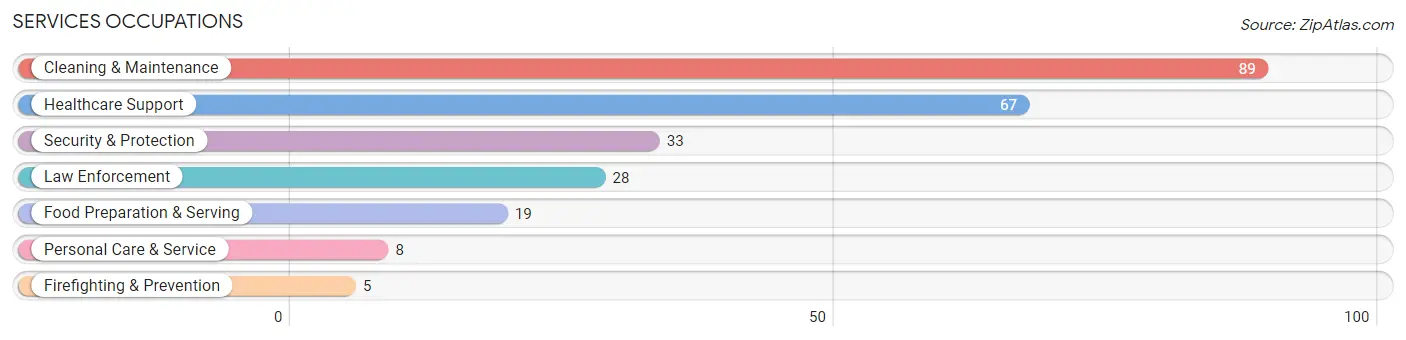
Services Occupations
The most common Services occupations in Abita Springs are Cleaning & Maintenance (89 | 7.4%), Healthcare Support (67 | 5.6%), Security & Protection (33 | 2.7%), Law Enforcement (28 | 2.3%), and Food Preparation & Serving (19 | 1.6%).
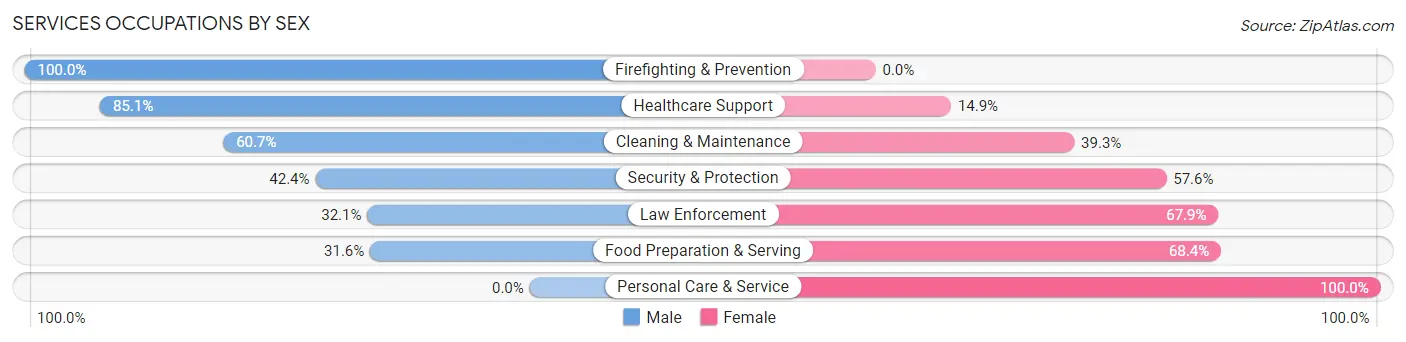
Services Occupations by Sex
Within the Services occupations in Abita Springs, the most male-oriented occupations are Firefighting & Prevention (100.0%), Healthcare Support (85.1%), and Cleaning & Maintenance (60.7%), while the most female-oriented occupations are Personal Care & Service (100.0%), Food Preparation & Serving (68.4%), and Law Enforcement (67.9%).
| Occupation | Male | Female |
| Healthcare Support | 57 (85.1%) | 10 (14.9%) |
| Security & Protection | 14 (42.4%) | 19 (57.6%) |
| Firefighting & Prevention | 5 (100.0%) | 0 (0.0%) |
| Law Enforcement | 9 (32.1%) | 19 (67.9%) |
| Food Preparation & Serving | 6 (31.6%) | 13 (68.4%) |
| Cleaning & Maintenance | 54 (60.7%) | 35 (39.3%) |
| Personal Care & Service | 0 (0.0%) | 8 (100.0%) |
| Total (Category) | 131 (60.7%) | 85 (39.4%) |
| Total (Overall) | 626 (52.0%) | 578 (48.0%) |
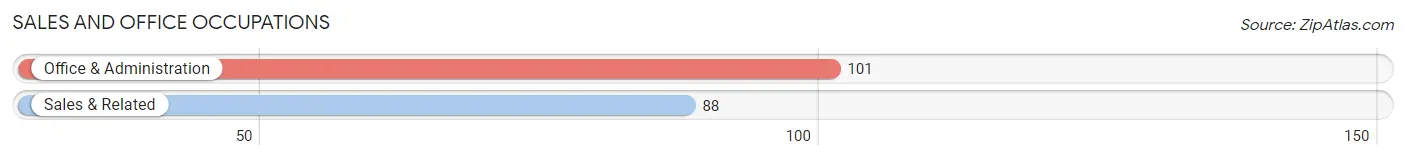
Sales and Office Occupations
The most common Sales and Office occupations in Abita Springs are Office & Administration (101 | 8.4%), and Sales & Related (88 | 7.3%).
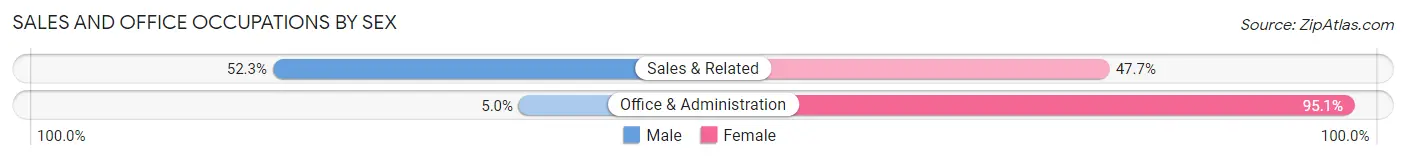
Sales and Office Occupations by Sex
| Occupation | Male | Female |
| Sales & Related | 46 (52.3%) | 42 (47.7%) |
| Office & Administration | 5 (5.0%) | 96 (95.1%) |
| Total (Category) | 51 (27.0%) | 138 (73.0%) |
| Total (Overall) | 626 (52.0%) | 578 (48.0%) |
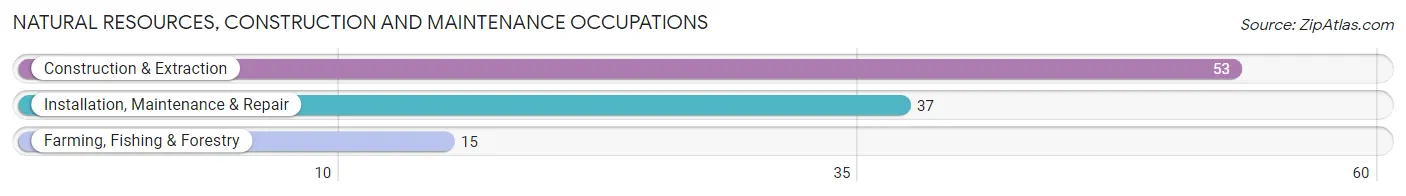
Natural Resources, Construction and Maintenance Occupations
The most common Natural Resources, Construction and Maintenance occupations in Abita Springs are Construction & Extraction (53 | 4.4%), Installation, Maintenance & Repair (37 | 3.1%), and Farming, Fishing & Forestry (15 | 1.3%).
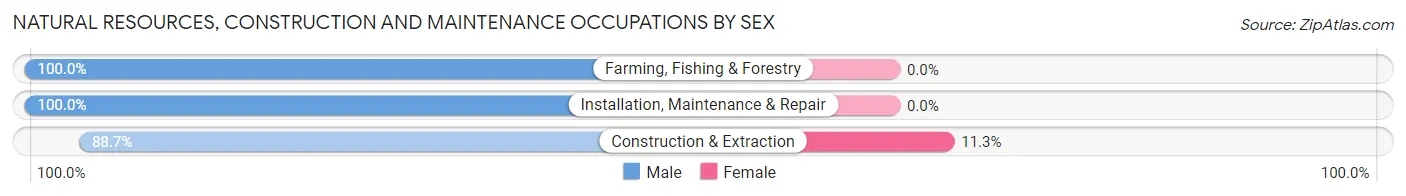
Natural Resources, Construction and Maintenance Occupations by Sex
| Occupation | Male | Female |
| Farming, Fishing & Forestry | 15 (100.0%) | 0 (0.0%) |
| Construction & Extraction | 47 (88.7%) | 6 (11.3%) |
| Installation, Maintenance & Repair | 37 (100.0%) | 0 (0.0%) |
| Total (Category) | 99 (94.3%) | 6 (5.7%) |
| Total (Overall) | 626 (52.0%) | 578 (48.0%) |
Production, Transportation and Moving Occupations
The most common Production, Transportation and Moving occupations in Abita Springs are Transportation (27 | 2.2%), and Production (24 | 2.0%).
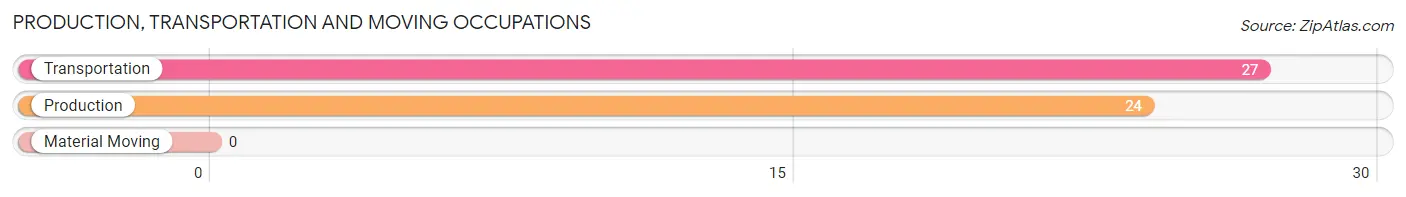
Production, Transportation and Moving Occupations by Sex
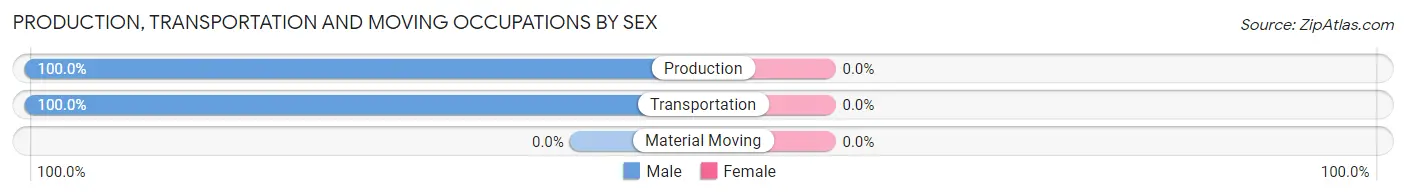
| Occupation | Male | Female |
| Production | 24 (100.0%) | 0 (0.0%) |
| Transportation | 27 (100.0%) | 0 (0.0%) |
| Material Moving | 0 (0.0%) | 0 (0.0%) |
| Total (Category) | 51 (100.0%) | 0 (0.0%) |
| Total (Overall) | 626 (52.0%) | 578 (48.0%) |
Employment Industries by Sex in Abita Springs
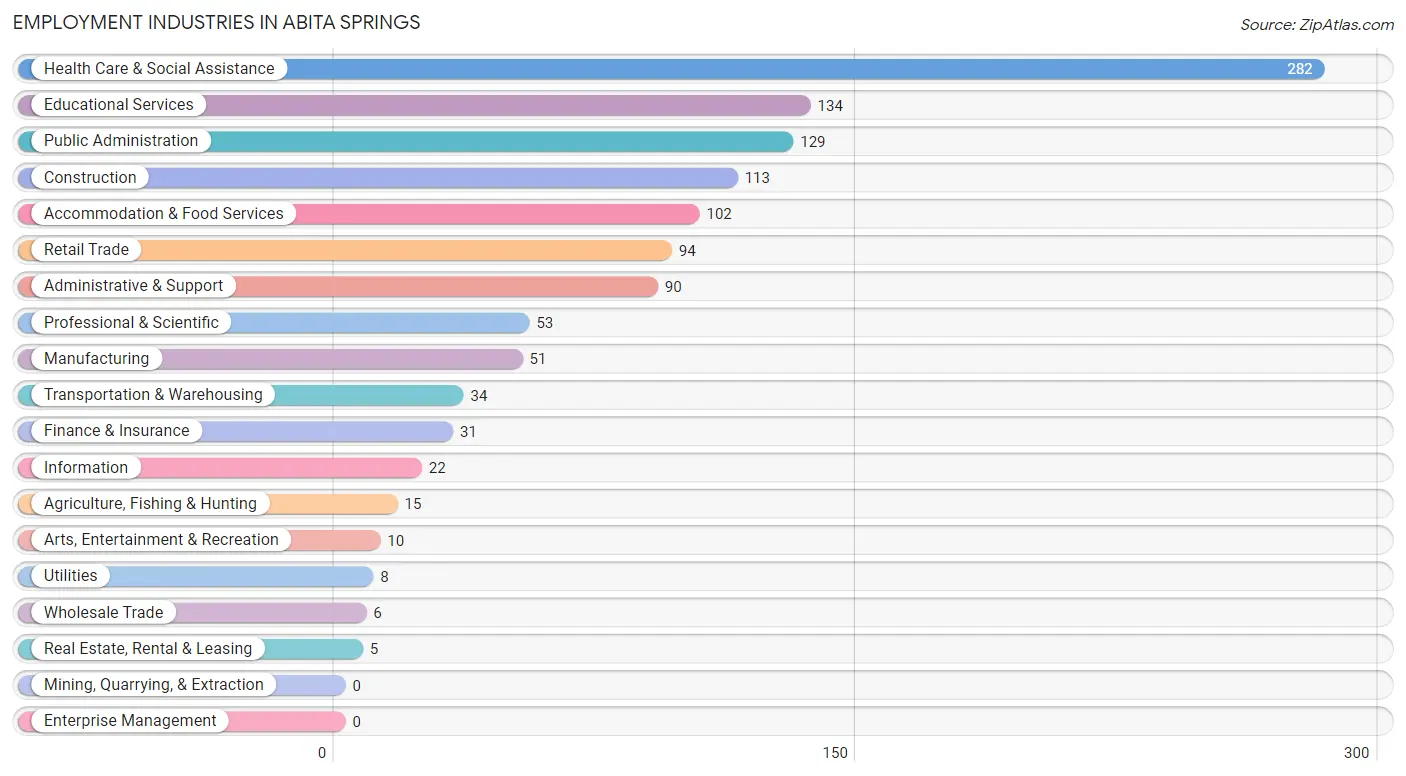
Employment Industries in Abita Springs
The major employment industries in Abita Springs include Health Care & Social Assistance (282 | 23.4%), Educational Services (134 | 11.1%), Public Administration (129 | 10.7%), Construction (113 | 9.4%), and Accommodation & Food Services (102 | 8.5%).
Employment Industries by Sex in Abita Springs
The Abita Springs industries that see more men than women are Agriculture, Fishing & Hunting (100.0%), Manufacturing (100.0%), and Transportation & Warehousing (100.0%), whereas the industries that tend to have a higher number of women are Utilities (100.0%), Educational Services (87.3%), and Public Administration (82.2%).
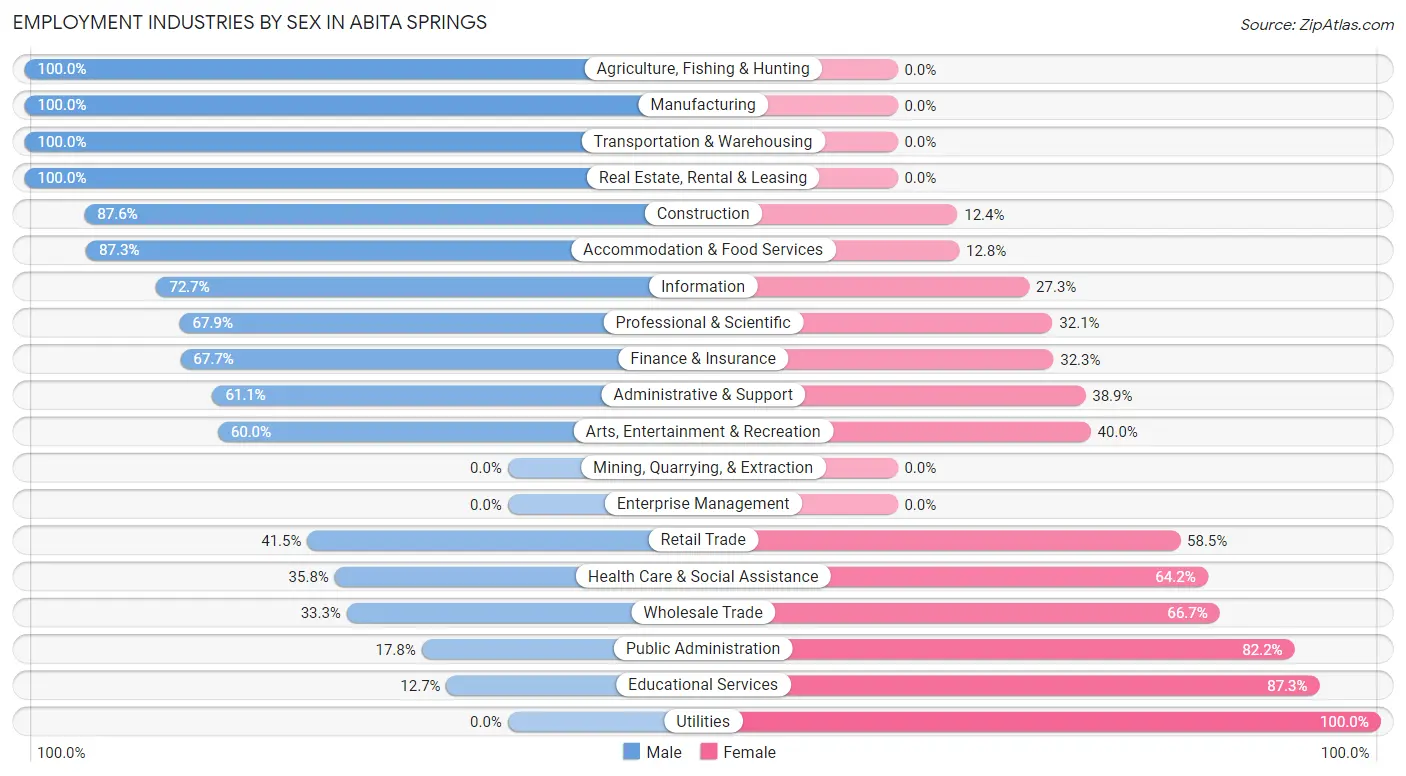
| Industry | Male | Female |
| Agriculture, Fishing & Hunting | 15 (100.0%) | 0 (0.0%) |
| Mining, Quarrying, & Extraction | 0 (0.0%) | 0 (0.0%) |
| Construction | 99 (87.6%) | 14 (12.4%) |
| Manufacturing | 51 (100.0%) | 0 (0.0%) |
| Wholesale Trade | 2 (33.3%) | 4 (66.7%) |
| Retail Trade | 39 (41.5%) | 55 (58.5%) |
| Transportation & Warehousing | 34 (100.0%) | 0 (0.0%) |
| Utilities | 0 (0.0%) | 8 (100.0%) |
| Information | 16 (72.7%) | 6 (27.3%) |
| Finance & Insurance | 21 (67.7%) | 10 (32.3%) |
| Real Estate, Rental & Leasing | 5 (100.0%) | 0 (0.0%) |
| Professional & Scientific | 36 (67.9%) | 17 (32.1%) |
| Enterprise Management | 0 (0.0%) | 0 (0.0%) |
| Administrative & Support | 55 (61.1%) | 35 (38.9%) |
| Educational Services | 17 (12.7%) | 117 (87.3%) |
| Health Care & Social Assistance | 101 (35.8%) | 181 (64.2%) |
| Arts, Entertainment & Recreation | 6 (60.0%) | 4 (40.0%) |
| Accommodation & Food Services | 89 (87.3%) | 13 (12.8%) |
| Public Administration | 23 (17.8%) | 106 (82.2%) |
| Total | 626 (52.0%) | 578 (48.0%) |
Education in Abita Springs
School Enrollment in Abita Springs
The most common levels of schooling among the 558 students in Abita Springs are middle school (198 | 35.5%), high school (116 | 20.8%), and graduate / professional (91 | 16.3%).
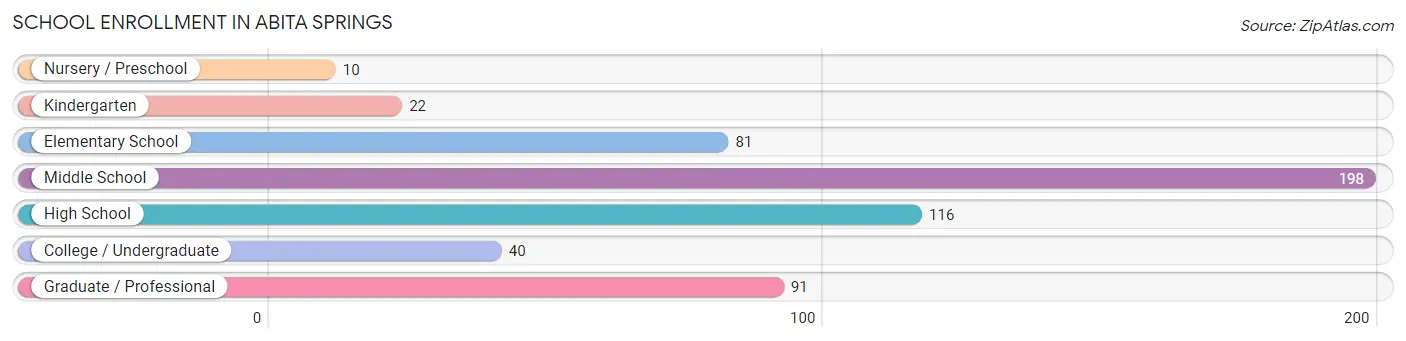
| School Level | # Students | % Students |
| Nursery / Preschool | 10 | 1.8% |
| Kindergarten | 22 | 3.9% |
| Elementary School | 81 | 14.5% |
| Middle School | 198 | 35.5% |
| High School | 116 | 20.8% |
| College / Undergraduate | 40 | 7.2% |
| Graduate / Professional | 91 | 16.3% |
| Total | 558 | 100.0% |
School Enrollment by Age by Funding Source in Abita Springs
Out of a total of 558 students who are enrolled in schools in Abita Springs, 196 (35.1%) attend a private institution, while the remaining 362 (64.9%) are enrolled in public schools. The age group of 3 to 4 year olds has the highest likelihood of being enrolled in private schools, with 5 (100.0% in the age bracket) enrolled. Conversely, the age group of 18 to 19 year olds has the lowest likelihood of being enrolled in a private school, with 28 (100.0% in the age bracket) attending a public institution.
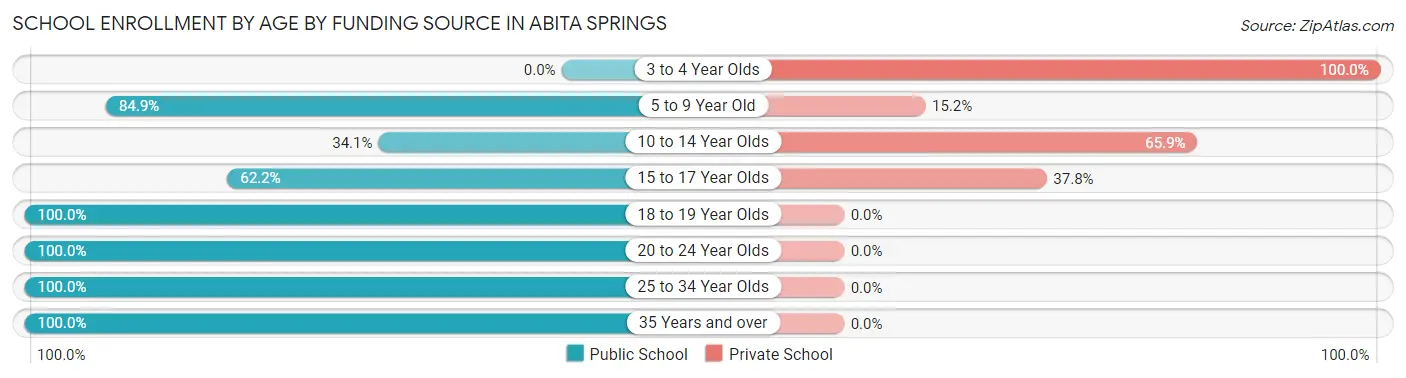
| Age Bracket | Public School | Private School |
| 3 to 4 Year Olds | 0 (0.0%) | 5 (100.0%) |
| 5 to 9 Year Old | 84 (84.9%) | 15 (15.1%) |
| 10 to 14 Year Olds | 72 (34.1%) | 139 (65.9%) |
| 15 to 17 Year Olds | 61 (62.2%) | 37 (37.8%) |
| 18 to 19 Year Olds | 28 (100.0%) | 0 (0.0%) |
| 20 to 24 Year Olds | 9 (100.0%) | 0 (0.0%) |
| 25 to 34 Year Olds | 31 (100.0%) | 0 (0.0%) |
| 35 Years and over | 77 (100.0%) | 0 (0.0%) |
| Total | 362 (64.9%) | 196 (35.1%) |
Educational Attainment by Field of Study in Abita Springs
Business (207 | 23.3%), science & technology (157 | 17.7%), education (98 | 11.1%), liberal arts & history (92 | 10.4%), and visual & performing arts (55 | 6.2%) are the most common fields of study among 887 individuals in Abita Springs who have obtained a bachelor's degree or higher.
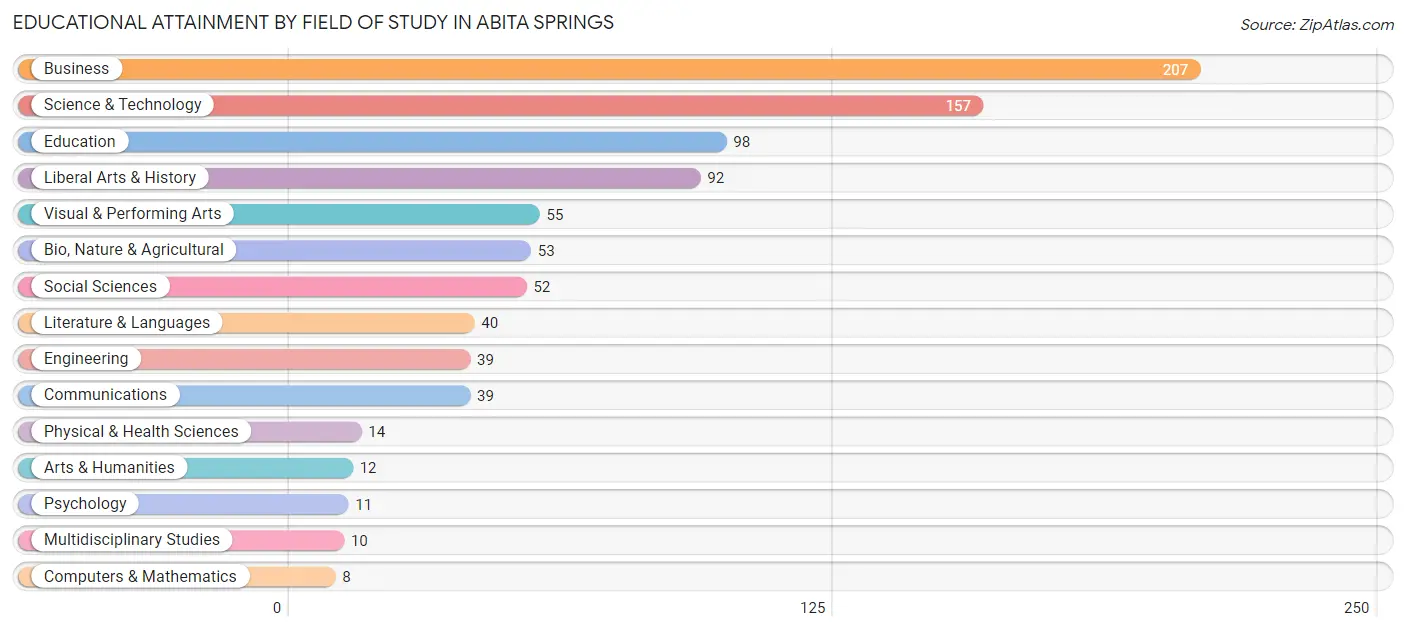
| Field of Study | # Graduates | % Graduates |
| Computers & Mathematics | 8 | 0.9% |
| Bio, Nature & Agricultural | 53 | 6.0% |
| Physical & Health Sciences | 14 | 1.6% |
| Psychology | 11 | 1.2% |
| Social Sciences | 52 | 5.9% |
| Engineering | 39 | 4.4% |
| Multidisciplinary Studies | 10 | 1.1% |
| Science & Technology | 157 | 17.7% |
| Business | 207 | 23.3% |
| Education | 98 | 11.1% |
| Literature & Languages | 40 | 4.5% |
| Liberal Arts & History | 92 | 10.4% |
| Visual & Performing Arts | 55 | 6.2% |
| Communications | 39 | 4.4% |
| Arts & Humanities | 12 | 1.3% |
| Total | 887 | 100.0% |
Transportation & Commute in Abita Springs
Vehicle Availability by Sex in Abita Springs
The most prevalent vehicle ownership categories in Abita Springs are males with 2 vehicles (257, accounting for 40.9%) and females with 2 vehicles (266, making up 44.9%).
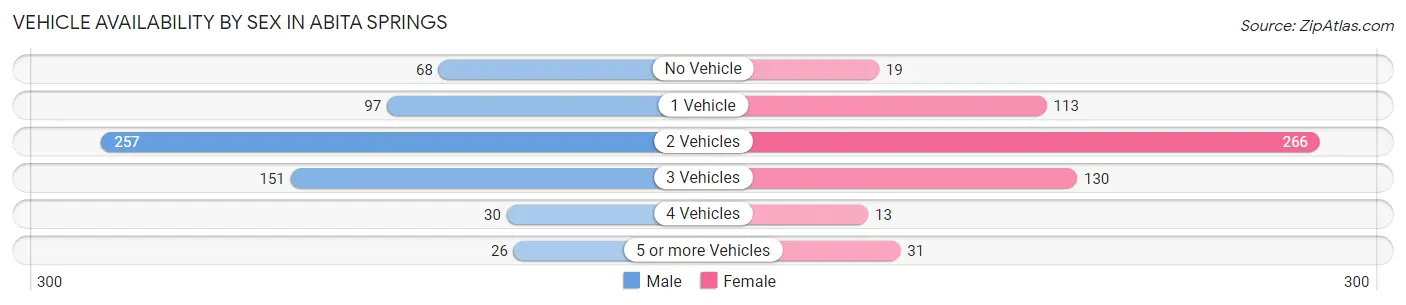
| Vehicles Available | Male | Female |
| No Vehicle | 68 (10.8%) | 19 (3.3%) |
| 1 Vehicle | 97 (15.4%) | 113 (19.8%) |
| 2 Vehicles | 257 (40.9%) | 266 (46.5%) |
| 3 Vehicles | 151 (24.0%) | 130 (22.7%) |
| 4 Vehicles | 30 (4.8%) | 13 (2.3%) |
| 5 or more Vehicles | 26 (4.1%) | 31 (5.4%) |
| Total | 629 (100.0%) | 572 (100.0%) |
Commute Time in Abita Springs
The most frequently occuring commute durations in Abita Springs are 15 to 19 minutes (162 commuters, 15.8%), 30 to 34 minutes (160 commuters, 15.6%), and 90 or more minutes (134 commuters, 13.1%).
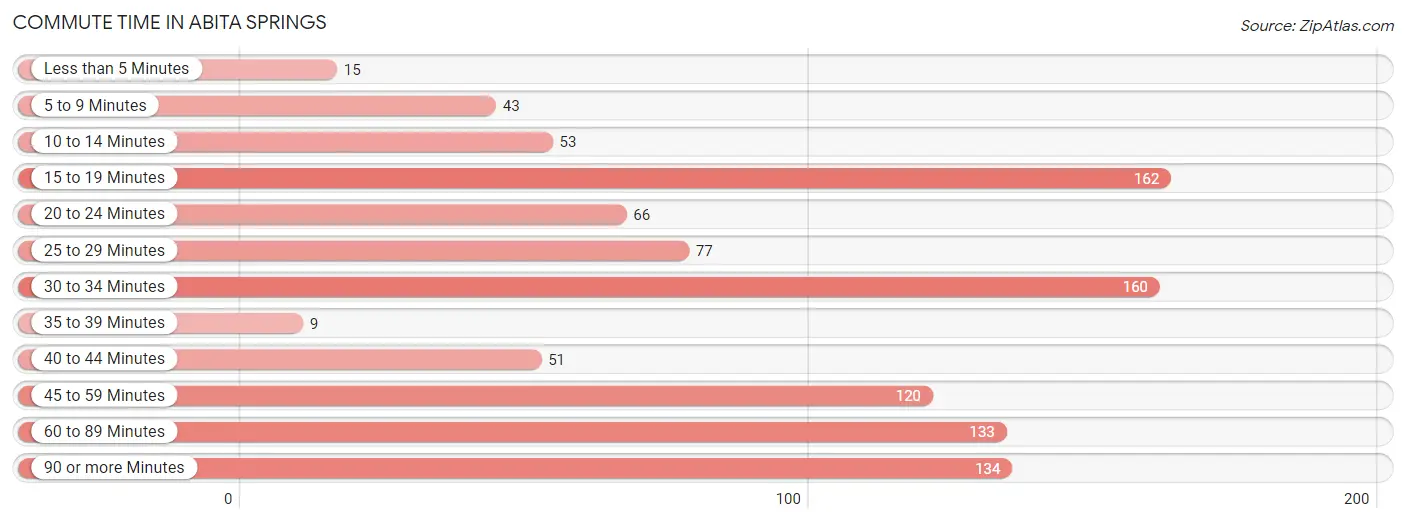
| Commute Time | # Commuters | % Commuters |
| Less than 5 Minutes | 15 | 1.5% |
| 5 to 9 Minutes | 43 | 4.2% |
| 10 to 14 Minutes | 53 | 5.2% |
| 15 to 19 Minutes | 162 | 15.8% |
| 20 to 24 Minutes | 66 | 6.5% |
| 25 to 29 Minutes | 77 | 7.5% |
| 30 to 34 Minutes | 160 | 15.6% |
| 35 to 39 Minutes | 9 | 0.9% |
| 40 to 44 Minutes | 51 | 5.0% |
| 45 to 59 Minutes | 120 | 11.7% |
| 60 to 89 Minutes | 133 | 13.0% |
| 90 or more Minutes | 134 | 13.1% |
Commute Time by Sex in Abita Springs
The most common commute times in Abita Springs are 90 or more minutes (134 commuters, 24.8%) for males and 15 to 19 minutes (93 commuters, 19.3%) for females.
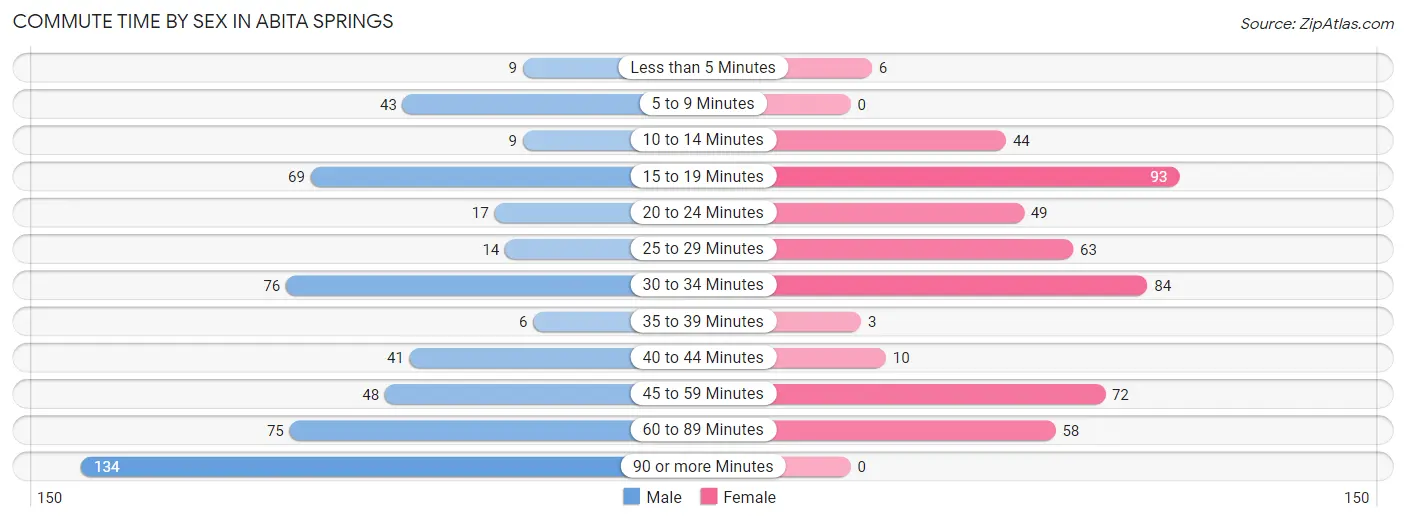
| Commute Time | Male | Female |
| Less than 5 Minutes | 9 (1.7%) | 6 (1.2%) |
| 5 to 9 Minutes | 43 (8.0%) | 0 (0.0%) |
| 10 to 14 Minutes | 9 (1.7%) | 44 (9.1%) |
| 15 to 19 Minutes | 69 (12.8%) | 93 (19.3%) |
| 20 to 24 Minutes | 17 (3.1%) | 49 (10.2%) |
| 25 to 29 Minutes | 14 (2.6%) | 63 (13.1%) |
| 30 to 34 Minutes | 76 (14.1%) | 84 (17.4%) |
| 35 to 39 Minutes | 6 (1.1%) | 3 (0.6%) |
| 40 to 44 Minutes | 41 (7.6%) | 10 (2.1%) |
| 45 to 59 Minutes | 48 (8.9%) | 72 (14.9%) |
| 60 to 89 Minutes | 75 (13.9%) | 58 (12.0%) |
| 90 or more Minutes | 134 (24.8%) | 0 (0.0%) |
Time of Departure to Work by Sex in Abita Springs
The most frequent times of departure to work in Abita Springs are 12:00 AM to 4:59 AM (93, 17.2%) for males and 8:00 AM to 8:29 AM (110, 22.8%) for females.
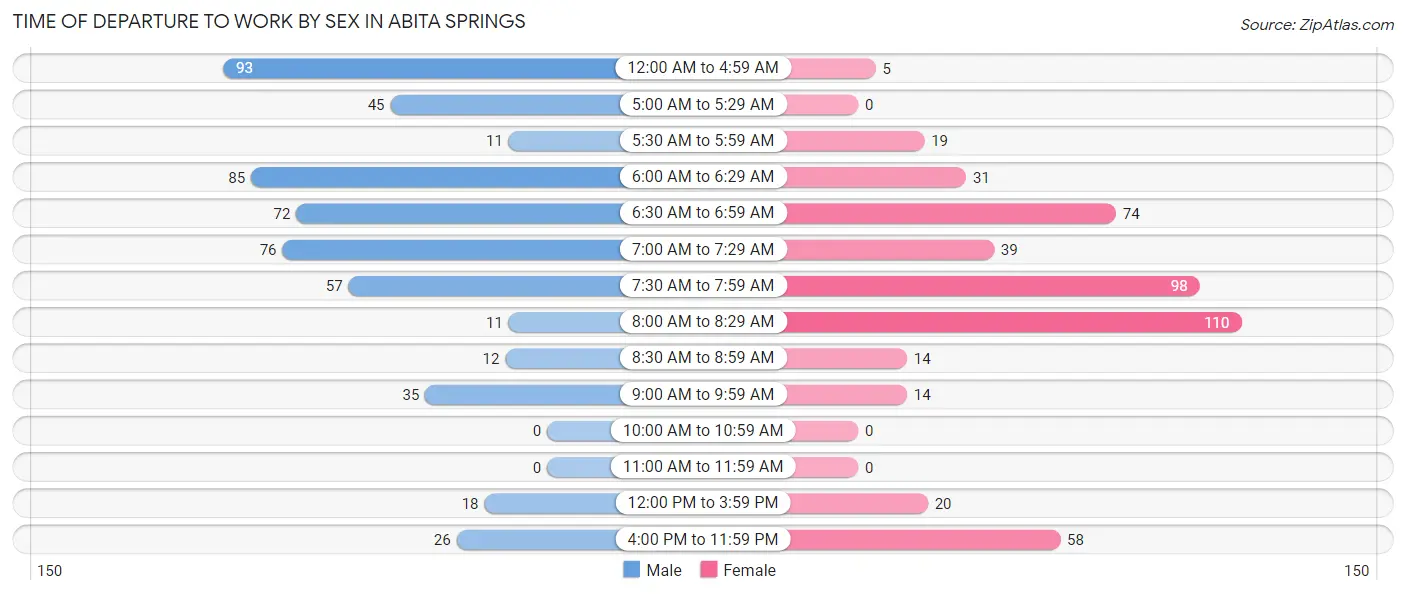
| Time of Departure | Male | Female |
| 12:00 AM to 4:59 AM | 93 (17.2%) | 5 (1.0%) |
| 5:00 AM to 5:29 AM | 45 (8.3%) | 0 (0.0%) |
| 5:30 AM to 5:59 AM | 11 (2.0%) | 19 (3.9%) |
| 6:00 AM to 6:29 AM | 85 (15.7%) | 31 (6.4%) |
| 6:30 AM to 6:59 AM | 72 (13.3%) | 74 (15.3%) |
| 7:00 AM to 7:29 AM | 76 (14.1%) | 39 (8.1%) |
| 7:30 AM to 7:59 AM | 57 (10.5%) | 98 (20.3%) |
| 8:00 AM to 8:29 AM | 11 (2.0%) | 110 (22.8%) |
| 8:30 AM to 8:59 AM | 12 (2.2%) | 14 (2.9%) |
| 9:00 AM to 9:59 AM | 35 (6.5%) | 14 (2.9%) |
| 10:00 AM to 10:59 AM | 0 (0.0%) | 0 (0.0%) |
| 11:00 AM to 11:59 AM | 0 (0.0%) | 0 (0.0%) |
| 12:00 PM to 3:59 PM | 18 (3.3%) | 20 (4.2%) |
| 4:00 PM to 11:59 PM | 26 (4.8%) | 58 (12.0%) |
| Total | 541 (100.0%) | 482 (100.0%) |
Housing Occupancy in Abita Springs
Occupancy by Ownership in Abita Springs
Of the total 1,052 dwellings in Abita Springs, owner-occupied units account for 884 (84.0%), while renter-occupied units make up 168 (16.0%).
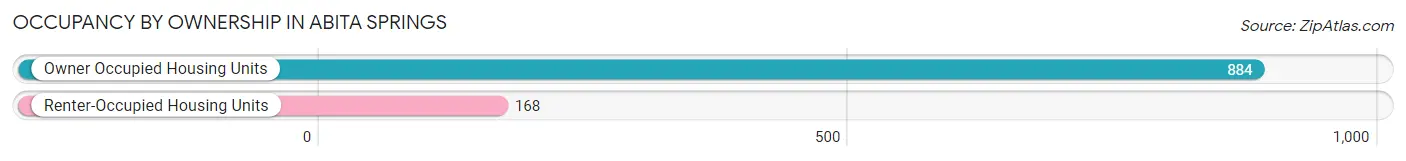
| Occupancy | # Housing Units | % Housing Units |
| Owner Occupied Housing Units | 884 | 84.0% |
| Renter-Occupied Housing Units | 168 | 16.0% |
| Total Occupied Housing Units | 1,052 | 100.0% |
Occupancy by Household Size in Abita Springs
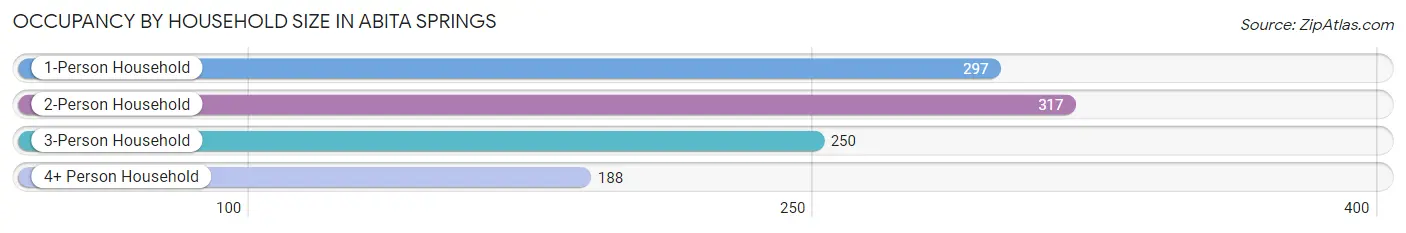
| Household Size | # Housing Units | % Housing Units |
| 1-Person Household | 297 | 28.2% |
| 2-Person Household | 317 | 30.1% |
| 3-Person Household | 250 | 23.8% |
| 4+ Person Household | 188 | 17.9% |
| Total Housing Units | 1,052 | 100.0% |
Occupancy by Ownership by Household Size in Abita Springs
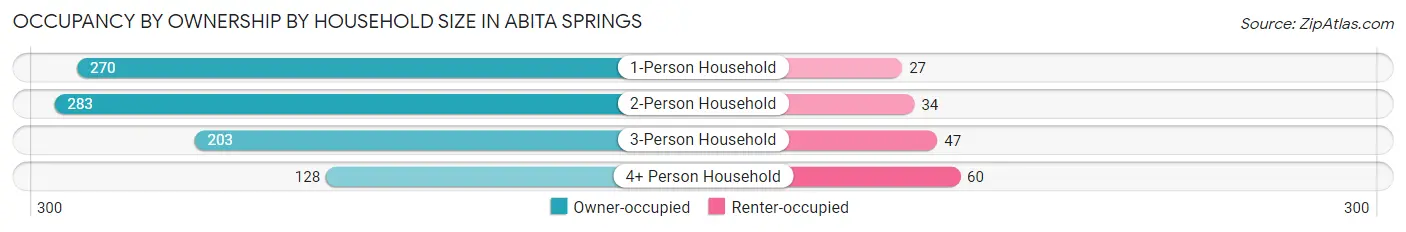
| Household Size | Owner-occupied | Renter-occupied |
| 1-Person Household | 270 (90.9%) | 27 (9.1%) |
| 2-Person Household | 283 (89.3%) | 34 (10.7%) |
| 3-Person Household | 203 (81.2%) | 47 (18.8%) |
| 4+ Person Household | 128 (68.1%) | 60 (31.9%) |
| Total Housing Units | 884 (84.0%) | 168 (16.0%) |
Occupancy by Educational Attainment in Abita Springs
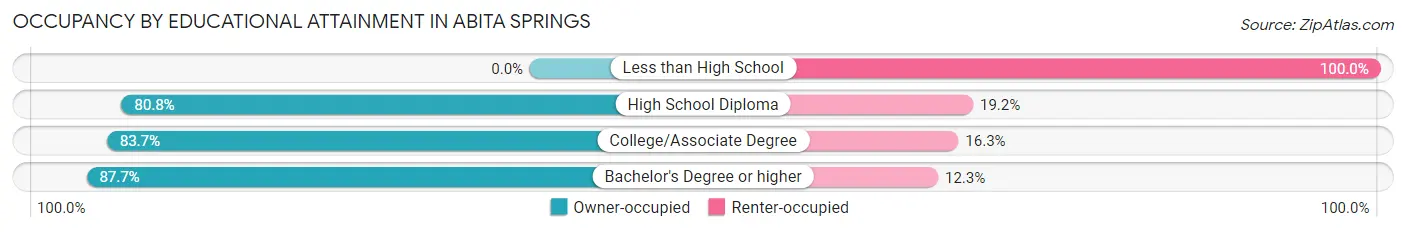
| Household Size | Owner-occupied | Renter-occupied |
| Less than High School | 0 (0.0%) | 12 (100.0%) |
| High School Diploma | 181 (80.8%) | 43 (19.2%) |
| College/Associate Degree | 267 (83.7%) | 52 (16.3%) |
| Bachelor's Degree or higher | 436 (87.7%) | 61 (12.3%) |
Occupancy by Age of Householder in Abita Springs
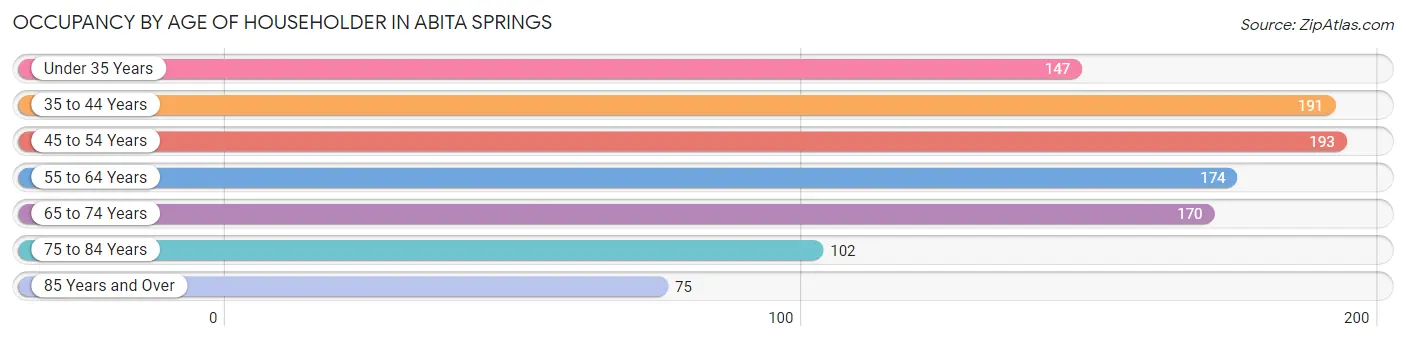
| Age Bracket | # Households | % Households |
| Under 35 Years | 147 | 14.0% |
| 35 to 44 Years | 191 | 18.2% |
| 45 to 54 Years | 193 | 18.3% |
| 55 to 64 Years | 174 | 16.5% |
| 65 to 74 Years | 170 | 16.2% |
| 75 to 84 Years | 102 | 9.7% |
| 85 Years and Over | 75 | 7.1% |
| Total | 1,052 | 100.0% |
Housing Finances in Abita Springs
Median Income by Occupancy in Abita Springs
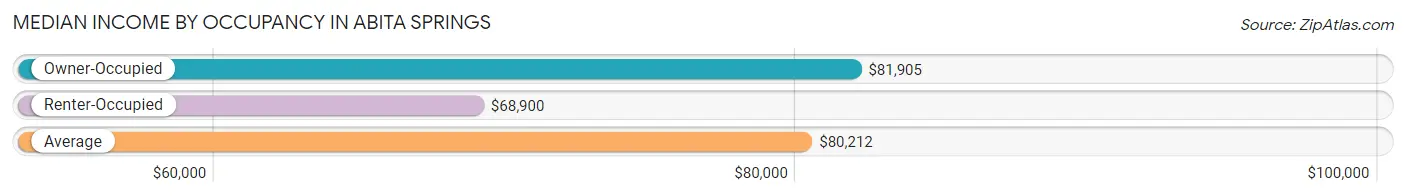
| Occupancy Type | # Households | Median Income |
| Owner-Occupied | 884 (84.0%) | $81,905 |
| Renter-Occupied | 168 (16.0%) | $68,900 |
| Average | 1,052 (100.0%) | $80,212 |
Occupancy by Householder Income Bracket in Abita Springs
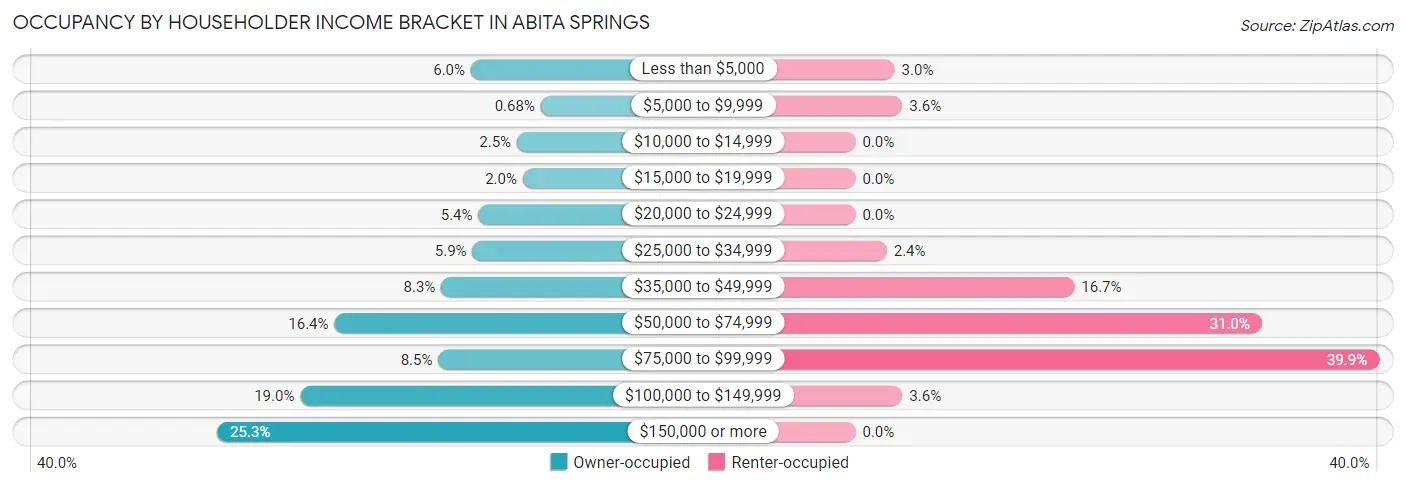
| Income Bracket | Owner-occupied | Renter-occupied |
| Less than $5,000 | 53 (6.0%) | 5 (3.0%) |
| $5,000 to $9,999 | 6 (0.7%) | 6 (3.6%) |
| $10,000 to $14,999 | 22 (2.5%) | 0 (0.0%) |
| $15,000 to $19,999 | 18 (2.0%) | 0 (0.0%) |
| $20,000 to $24,999 | 48 (5.4%) | 0 (0.0%) |
| $25,000 to $34,999 | 52 (5.9%) | 4 (2.4%) |
| $35,000 to $49,999 | 73 (8.3%) | 28 (16.7%) |
| $50,000 to $74,999 | 145 (16.4%) | 52 (30.9%) |
| $75,000 to $99,999 | 75 (8.5%) | 67 (39.9%) |
| $100,000 to $149,999 | 168 (19.0%) | 6 (3.6%) |
| $150,000 or more | 224 (25.3%) | 0 (0.0%) |
| Total | 884 (100.0%) | 168 (100.0%) |
Monthly Housing Cost Tiers in Abita Springs
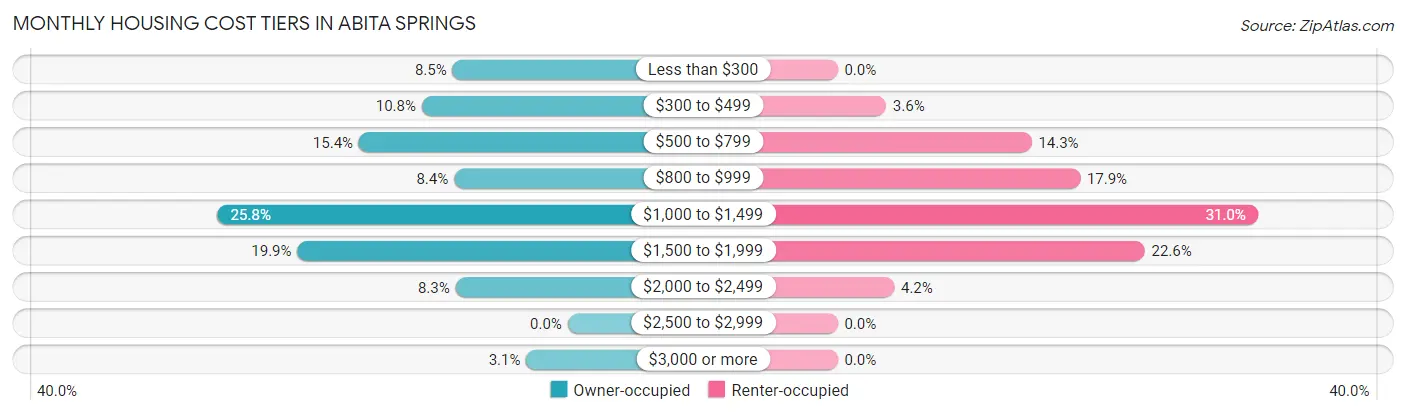
| Monthly Cost | Owner-occupied | Renter-occupied |
| Less than $300 | 75 (8.5%) | 0 (0.0%) |
| $300 to $499 | 95 (10.7%) | 6 (3.6%) |
| $500 to $799 | 136 (15.4%) | 24 (14.3%) |
| $800 to $999 | 74 (8.4%) | 30 (17.9%) |
| $1,000 to $1,499 | 228 (25.8%) | 52 (30.9%) |
| $1,500 to $1,999 | 176 (19.9%) | 38 (22.6%) |
| $2,000 to $2,499 | 73 (8.3%) | 7 (4.2%) |
| $2,500 to $2,999 | 0 (0.0%) | 0 (0.0%) |
| $3,000 or more | 27 (3.0%) | 0 (0.0%) |
| Total | 884 (100.0%) | 168 (100.0%) |
Physical Housing Characteristics in Abita Springs
Housing Structures in Abita Springs
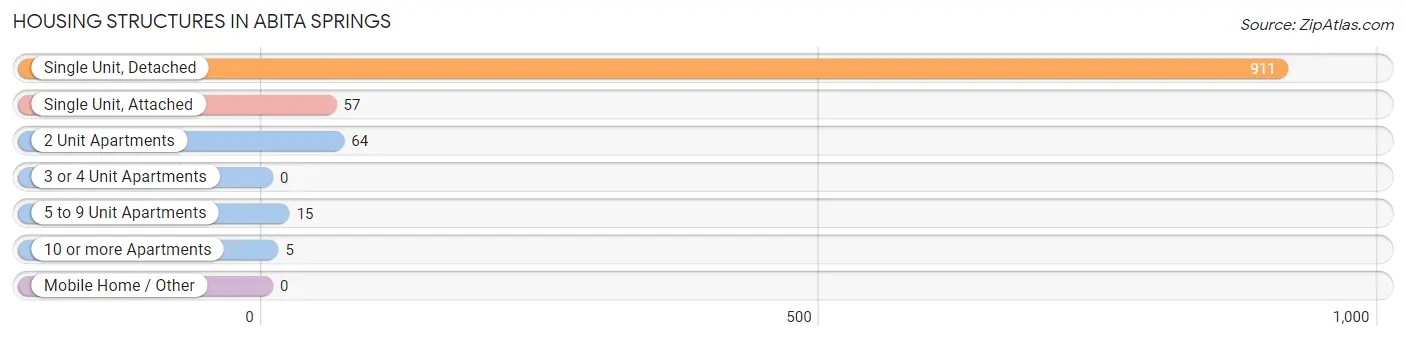
| Structure Type | # Housing Units | % Housing Units |
| Single Unit, Detached | 911 | 86.6% |
| Single Unit, Attached | 57 | 5.4% |
| 2 Unit Apartments | 64 | 6.1% |
| 3 or 4 Unit Apartments | 0 | 0.0% |
| 5 to 9 Unit Apartments | 15 | 1.4% |
| 10 or more Apartments | 5 | 0.5% |
| Mobile Home / Other | 0 | 0.0% |
| Total | 1,052 | 100.0% |
Housing Structures by Occupancy in Abita Springs
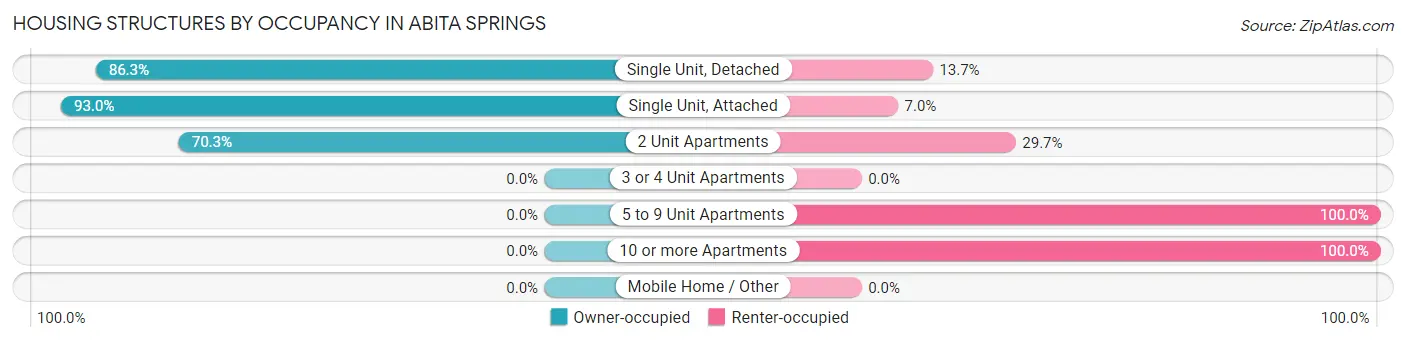
| Structure Type | Owner-occupied | Renter-occupied |
| Single Unit, Detached | 786 (86.3%) | 125 (13.7%) |
| Single Unit, Attached | 53 (93.0%) | 4 (7.0%) |
| 2 Unit Apartments | 45 (70.3%) | 19 (29.7%) |
| 3 or 4 Unit Apartments | 0 (0.0%) | 0 (0.0%) |
| 5 to 9 Unit Apartments | 0 (0.0%) | 15 (100.0%) |
| 10 or more Apartments | 0 (0.0%) | 5 (100.0%) |
| Mobile Home / Other | 0 (0.0%) | 0 (0.0%) |
| Total | 884 (84.0%) | 168 (16.0%) |
Housing Structures by Number of Rooms in Abita Springs
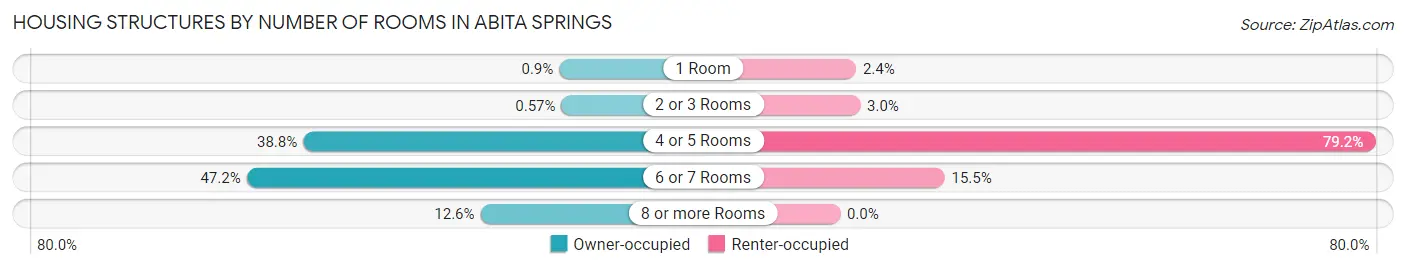
| Number of Rooms | Owner-occupied | Renter-occupied |
| 1 Room | 8 (0.9%) | 4 (2.4%) |
| 2 or 3 Rooms | 5 (0.6%) | 5 (3.0%) |
| 4 or 5 Rooms | 343 (38.8%) | 133 (79.2%) |
| 6 or 7 Rooms | 417 (47.2%) | 26 (15.5%) |
| 8 or more Rooms | 111 (12.6%) | 0 (0.0%) |
| Total | 884 (100.0%) | 168 (100.0%) |
Housing Structure by Heating Type in Abita Springs
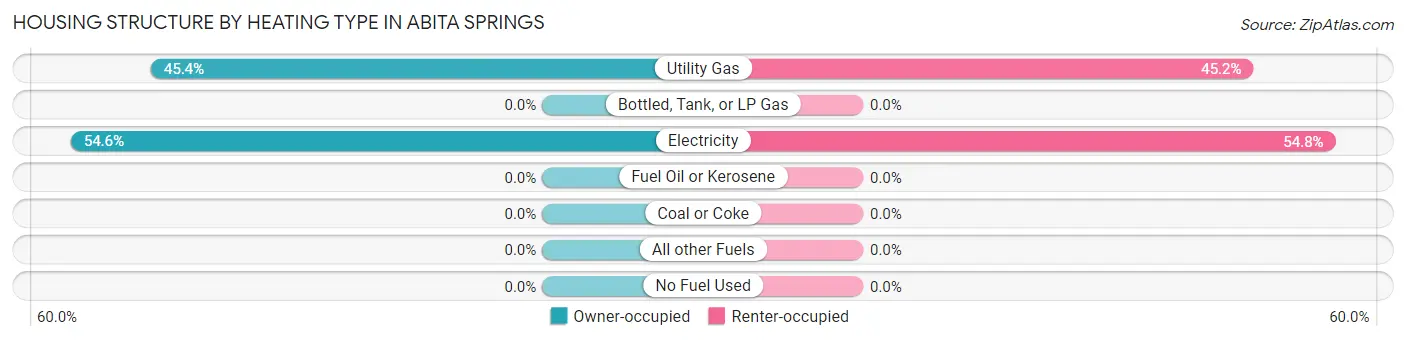
| Heating Type | Owner-occupied | Renter-occupied |
| Utility Gas | 401 (45.4%) | 76 (45.2%) |
| Bottled, Tank, or LP Gas | 0 (0.0%) | 0 (0.0%) |
| Electricity | 483 (54.6%) | 92 (54.8%) |
| Fuel Oil or Kerosene | 0 (0.0%) | 0 (0.0%) |
| Coal or Coke | 0 (0.0%) | 0 (0.0%) |
| All other Fuels | 0 (0.0%) | 0 (0.0%) |
| No Fuel Used | 0 (0.0%) | 0 (0.0%) |
| Total | 884 (100.0%) | 168 (100.0%) |
Household Vehicle Usage in Abita Springs
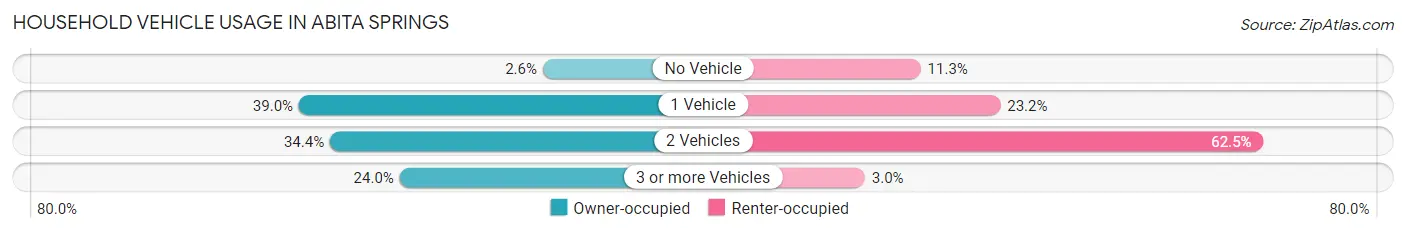
| Vehicles per Household | Owner-occupied | Renter-occupied |
| No Vehicle | 23 (2.6%) | 19 (11.3%) |
| 1 Vehicle | 345 (39.0%) | 39 (23.2%) |
| 2 Vehicles | 304 (34.4%) | 105 (62.5%) |
| 3 or more Vehicles | 212 (24.0%) | 5 (3.0%) |
| Total | 884 (100.0%) | 168 (100.0%) |
Real Estate & Mortgages in Abita Springs
Real Estate and Mortgage Overview in Abita Springs
| Characteristic | Without Mortgage | With Mortgage |
| Housing Units | 285 | 599 |
| Median Property Value | $187,500 | $252,500 |
| Median Household Income | $51,705 | $201 |
| Monthly Housing Costs | $466 | $27 |
| Real Estate Taxes | $1,170 | $0 |
Property Value by Mortgage Status in Abita Springs
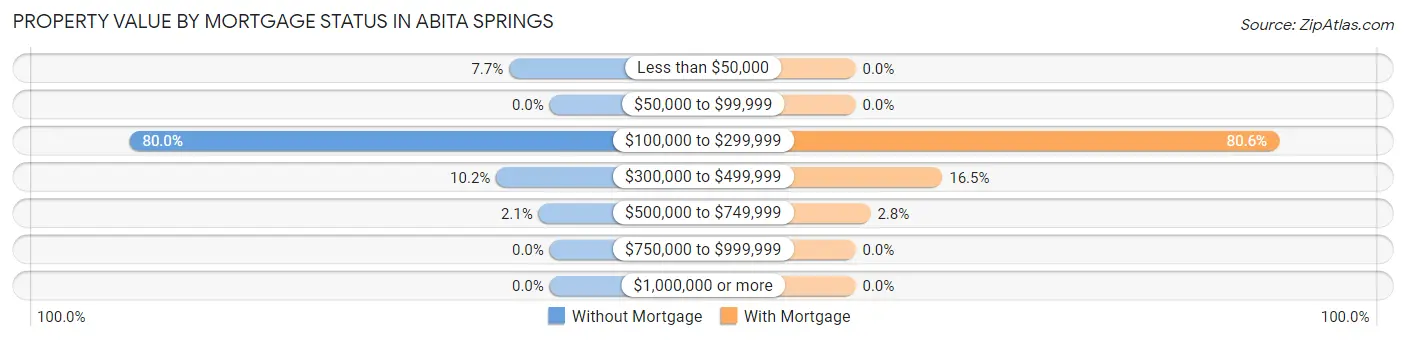
| Property Value | Without Mortgage | With Mortgage |
| Less than $50,000 | 22 (7.7%) | 0 (0.0%) |
| $50,000 to $99,999 | 0 (0.0%) | 0 (0.0%) |
| $100,000 to $299,999 | 228 (80.0%) | 483 (80.6%) |
| $300,000 to $499,999 | 29 (10.2%) | 99 (16.5%) |
| $500,000 to $749,999 | 6 (2.1%) | 17 (2.8%) |
| $750,000 to $999,999 | 0 (0.0%) | 0 (0.0%) |
| $1,000,000 or more | 0 (0.0%) | 0 (0.0%) |
| Total | 285 (100.0%) | 599 (100.0%) |
Household Income by Mortgage Status in Abita Springs
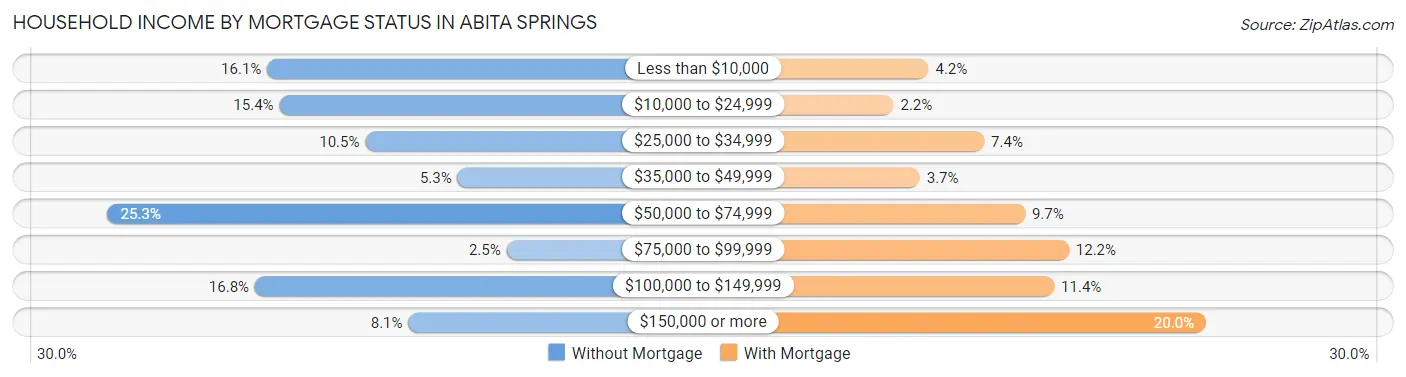
| Household Income | Without Mortgage | With Mortgage |
| Less than $10,000 | 46 (16.1%) | 25 (4.2%) |
| $10,000 to $24,999 | 44 (15.4%) | 13 (2.2%) |
| $25,000 to $34,999 | 30 (10.5%) | 44 (7.3%) |
| $35,000 to $49,999 | 15 (5.3%) | 22 (3.7%) |
| $50,000 to $74,999 | 72 (25.3%) | 58 (9.7%) |
| $75,000 to $99,999 | 7 (2.5%) | 73 (12.2%) |
| $100,000 to $149,999 | 48 (16.8%) | 68 (11.4%) |
| $150,000 or more | 23 (8.1%) | 120 (20.0%) |
| Total | 285 (100.0%) | 599 (100.0%) |
Property Value to Household Income Ratio in Abita Springs
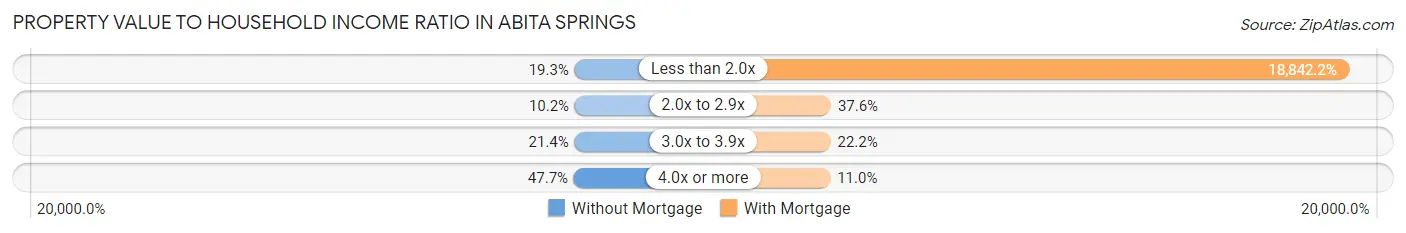
| Value-to-Income Ratio | Without Mortgage | With Mortgage |
| Less than 2.0x | 55 (19.3%) | 112,865 (18,842.2%) |
| 2.0x to 2.9x | 29 (10.2%) | 225 (37.6%) |
| 3.0x to 3.9x | 61 (21.4%) | 133 (22.2%) |
| 4.0x or more | 136 (47.7%) | 66 (11.0%) |
| Total | 285 (100.0%) | 599 (100.0%) |
Real Estate Taxes by Mortgage Status in Abita Springs
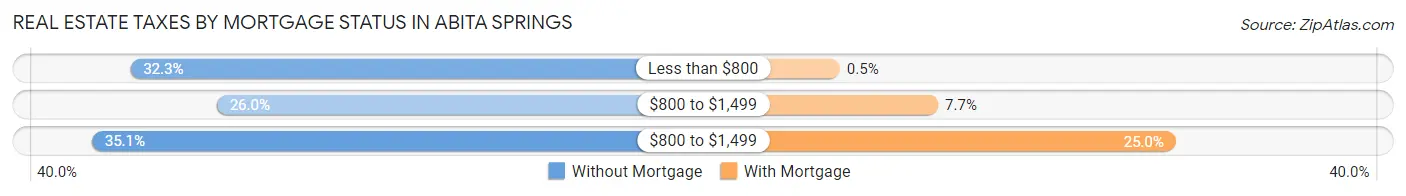
| Property Taxes | Without Mortgage | With Mortgage |
| Less than $800 | 92 (32.3%) | 3 (0.5%) |
| $800 to $1,499 | 74 (26.0%) | 46 (7.7%) |
| $800 to $1,499 | 100 (35.1%) | 150 (25.0%) |
| Total | 285 (100.0%) | 599 (100.0%) |
Health & Disability in Abita Springs
Health Insurance Coverage by Age in Abita Springs
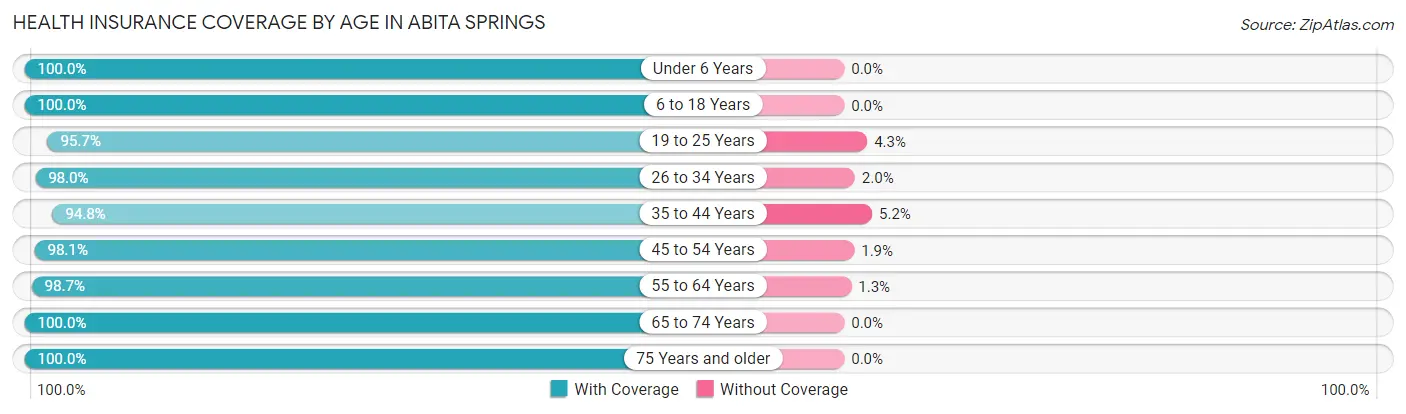
| Age Bracket | With Coverage | Without Coverage |
| Under 6 Years | 273 (100.0%) | 0 (0.0%) |
| 6 to 18 Years | 401 (100.0%) | 0 (0.0%) |
| 19 to 25 Years | 157 (95.7%) | 7 (4.3%) |
| 26 to 34 Years | 346 (98.0%) | 7 (2.0%) |
| 35 to 44 Years | 274 (94.8%) | 15 (5.2%) |
| 45 to 54 Years | 317 (98.1%) | 6 (1.9%) |
| 55 to 64 Years | 300 (98.7%) | 4 (1.3%) |
| 65 to 74 Years | 289 (100.0%) | 0 (0.0%) |
| 75 Years and older | 221 (100.0%) | 0 (0.0%) |
| Total | 2,578 (98.5%) | 39 (1.5%) |
Health Insurance Coverage by Citizenship Status in Abita Springs
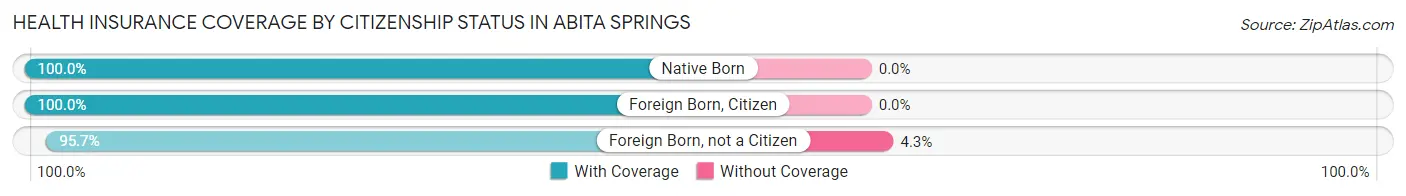
| Citizenship Status | With Coverage | Without Coverage |
| Native Born | 273 (100.0%) | 0 (0.0%) |
| Foreign Born, Citizen | 401 (100.0%) | 0 (0.0%) |
| Foreign Born, not a Citizen | 157 (95.7%) | 7 (4.3%) |
Health Insurance Coverage by Household Income in Abita Springs
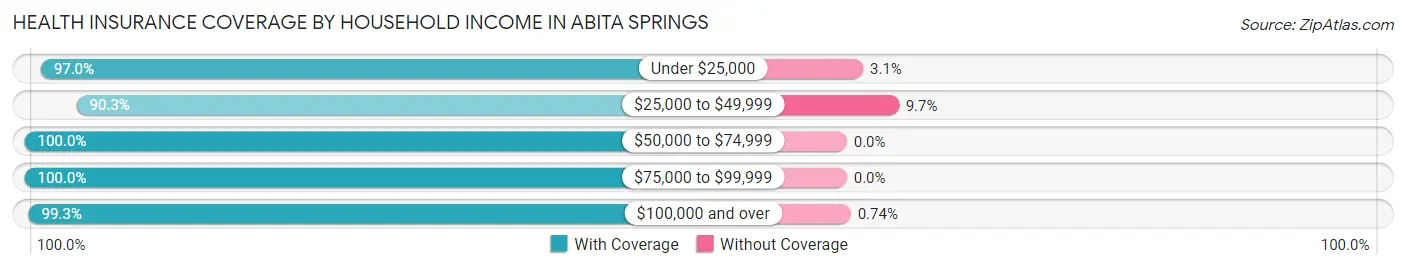
| Household Income | With Coverage | Without Coverage |
| Under $25,000 | 191 (97.0%) | 6 (3.0%) |
| $25,000 to $49,999 | 223 (90.3%) | 24 (9.7%) |
| $50,000 to $74,999 | 602 (100.0%) | 0 (0.0%) |
| $75,000 to $99,999 | 352 (100.0%) | 0 (0.0%) |
| $100,000 and over | 1,204 (99.3%) | 9 (0.7%) |
Public vs Private Health Insurance Coverage by Age in Abita Springs
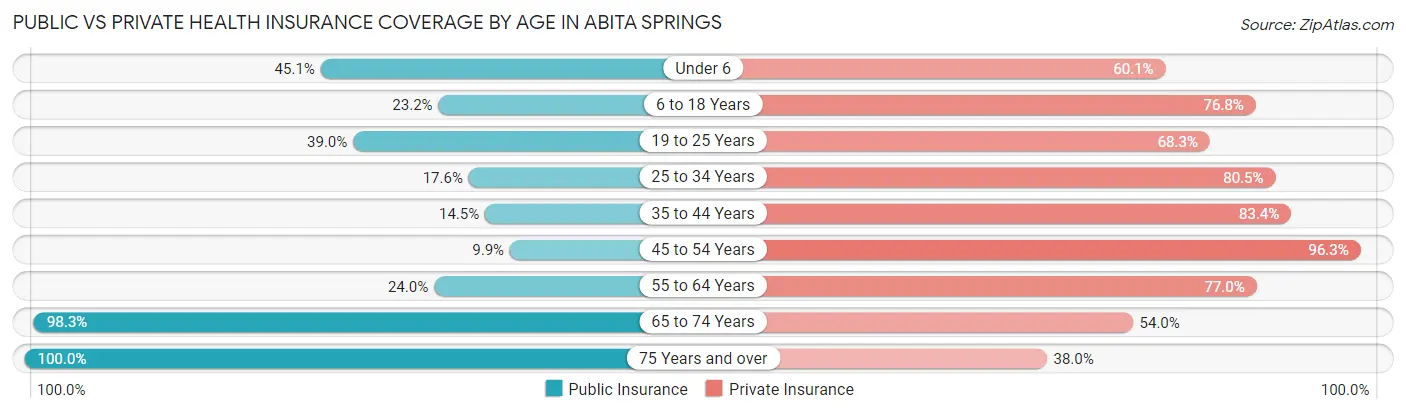
| Age Bracket | Public Insurance | Private Insurance |
| Under 6 | 123 (45.1%) | 164 (60.1%) |
| 6 to 18 Years | 93 (23.2%) | 308 (76.8%) |
| 19 to 25 Years | 64 (39.0%) | 112 (68.3%) |
| 25 to 34 Years | 62 (17.6%) | 284 (80.4%) |
| 35 to 44 Years | 42 (14.5%) | 241 (83.4%) |
| 45 to 54 Years | 32 (9.9%) | 311 (96.3%) |
| 55 to 64 Years | 73 (24.0%) | 234 (77.0%) |
| 65 to 74 Years | 284 (98.3%) | 156 (54.0%) |
| 75 Years and over | 221 (100.0%) | 84 (38.0%) |
| Total | 994 (38.0%) | 1,894 (72.4%) |
Disability Status by Sex by Age in Abita Springs
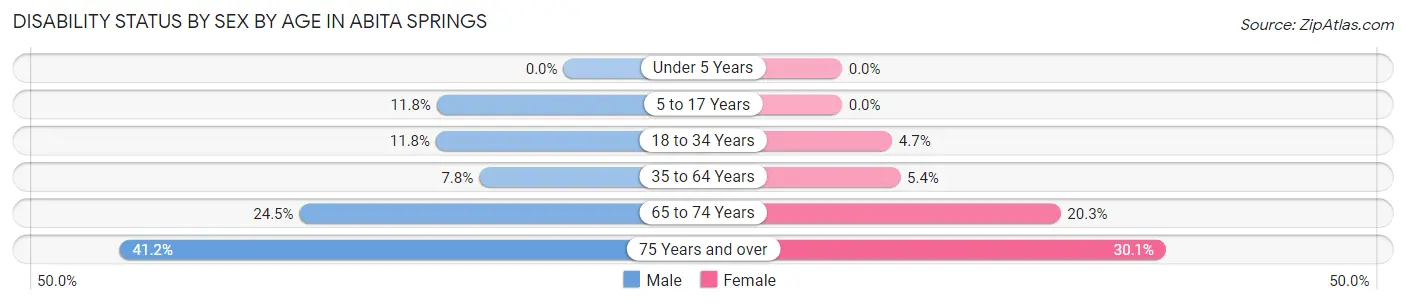
| Age Bracket | Male | Female |
| Under 5 Years | 0 (0.0%) | 0 (0.0%) |
| 5 to 17 Years | 6 (11.8%) | 0 (0.0%) |
| 18 to 34 Years | 33 (11.8%) | 12 (4.6%) |
| 35 to 64 Years | 34 (7.8%) | 26 (5.4%) |
| 65 to 74 Years | 37 (24.5%) | 28 (20.3%) |
| 75 Years and over | 28 (41.2%) | 46 (30.1%) |
Disability Class by Sex by Age in Abita Springs
Disability Class: Hearing Difficulty
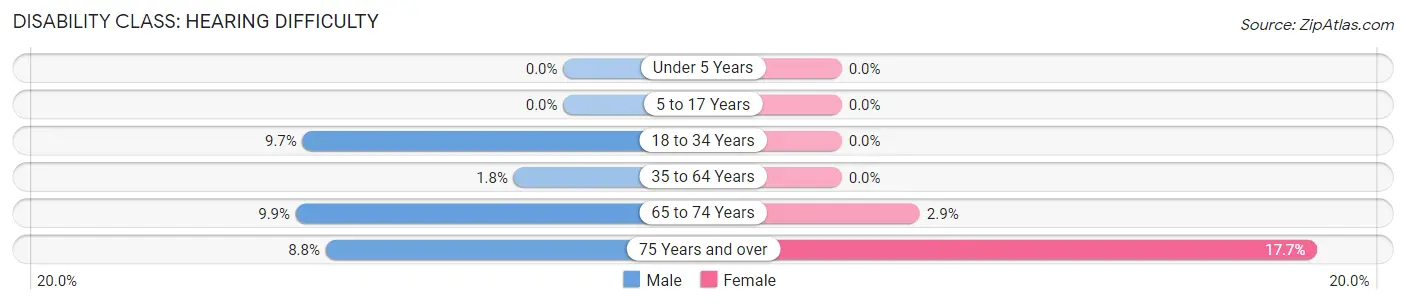
| Age Bracket | Male | Female |
| Under 5 Years | 0 (0.0%) | 0 (0.0%) |
| 5 to 17 Years | 0 (0.0%) | 0 (0.0%) |
| 18 to 34 Years | 27 (9.7%) | 0 (0.0%) |
| 35 to 64 Years | 8 (1.8%) | 0 (0.0%) |
| 65 to 74 Years | 15 (9.9%) | 4 (2.9%) |
| 75 Years and over | 6 (8.8%) | 27 (17.6%) |
Disability Class: Vision Difficulty
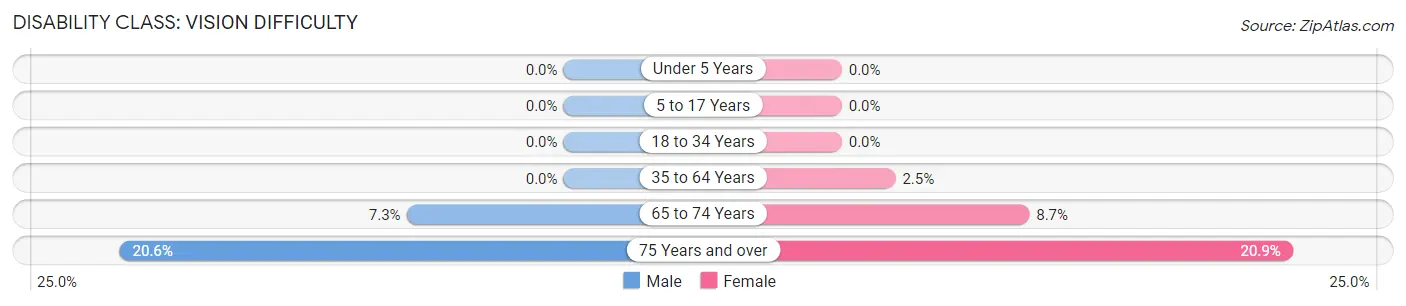
| Age Bracket | Male | Female |
| Under 5 Years | 0 (0.0%) | 0 (0.0%) |
| 5 to 17 Years | 0 (0.0%) | 0 (0.0%) |
| 18 to 34 Years | 0 (0.0%) | 0 (0.0%) |
| 35 to 64 Years | 0 (0.0%) | 12 (2.5%) |
| 65 to 74 Years | 11 (7.3%) | 12 (8.7%) |
| 75 Years and over | 14 (20.6%) | 32 (20.9%) |
Disability Class: Cognitive Difficulty
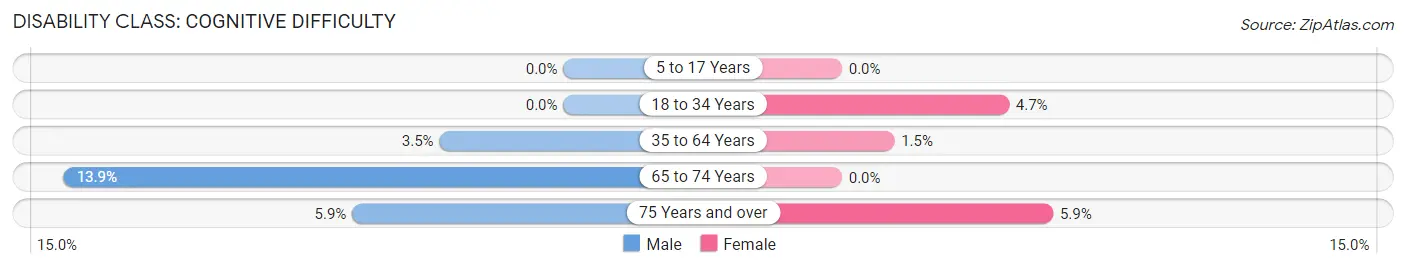
| Age Bracket | Male | Female |
| 5 to 17 Years | 0 (0.0%) | 0 (0.0%) |
| 18 to 34 Years | 0 (0.0%) | 12 (4.6%) |
| 35 to 64 Years | 15 (3.5%) | 7 (1.5%) |
| 65 to 74 Years | 21 (13.9%) | 0 (0.0%) |
| 75 Years and over | 4 (5.9%) | 9 (5.9%) |
Disability Class: Ambulatory Difficulty
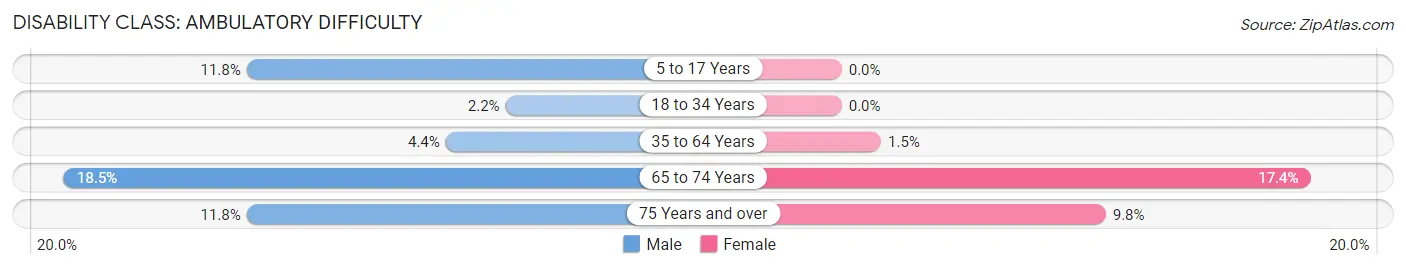
| Age Bracket | Male | Female |
| 5 to 17 Years | 6 (11.8%) | 0 (0.0%) |
| 18 to 34 Years | 6 (2.1%) | 0 (0.0%) |
| 35 to 64 Years | 19 (4.4%) | 7 (1.5%) |
| 65 to 74 Years | 28 (18.5%) | 24 (17.4%) |
| 75 Years and over | 8 (11.8%) | 15 (9.8%) |
Disability Class: Self-Care Difficulty
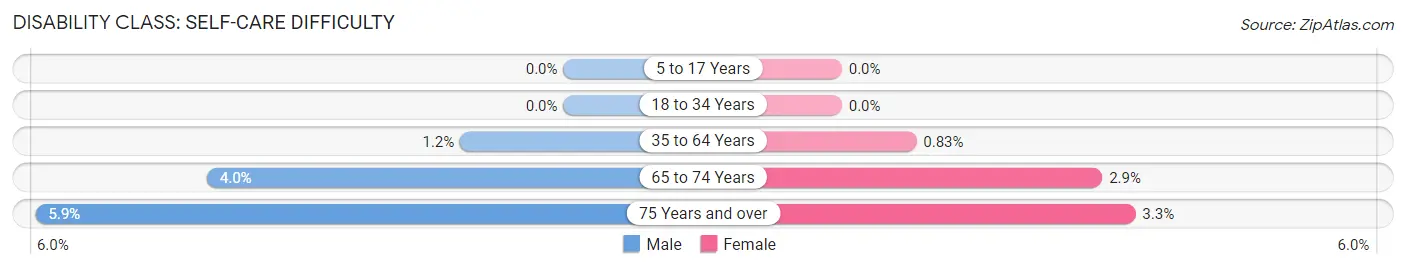
| Age Bracket | Male | Female |
| 5 to 17 Years | 0 (0.0%) | 0 (0.0%) |
| 18 to 34 Years | 0 (0.0%) | 0 (0.0%) |
| 35 to 64 Years | 5 (1.1%) | 4 (0.8%) |
| 65 to 74 Years | 6 (4.0%) | 4 (2.9%) |
| 75 Years and over | 4 (5.9%) | 5 (3.3%) |
Technology Access in Abita Springs
Computing Device Access in Abita Springs
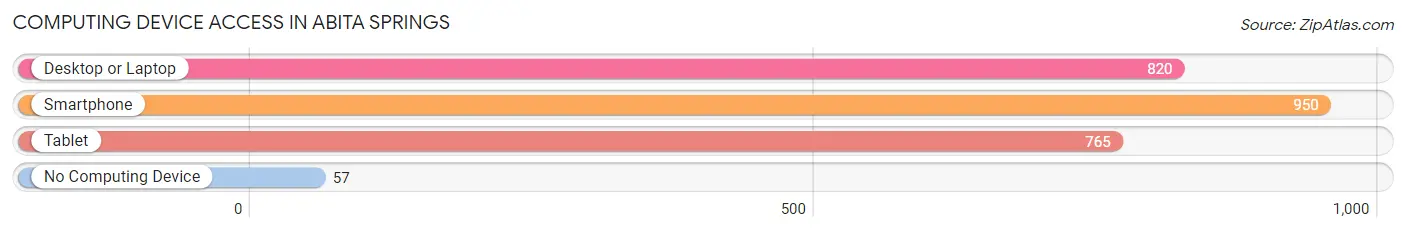
| Device Type | # Households | % Households |
| Desktop or Laptop | 820 | 77.9% |
| Smartphone | 950 | 90.3% |
| Tablet | 765 | 72.7% |
| No Computing Device | 57 | 5.4% |
| Total | 1,052 | 100.0% |
Internet Access in Abita Springs
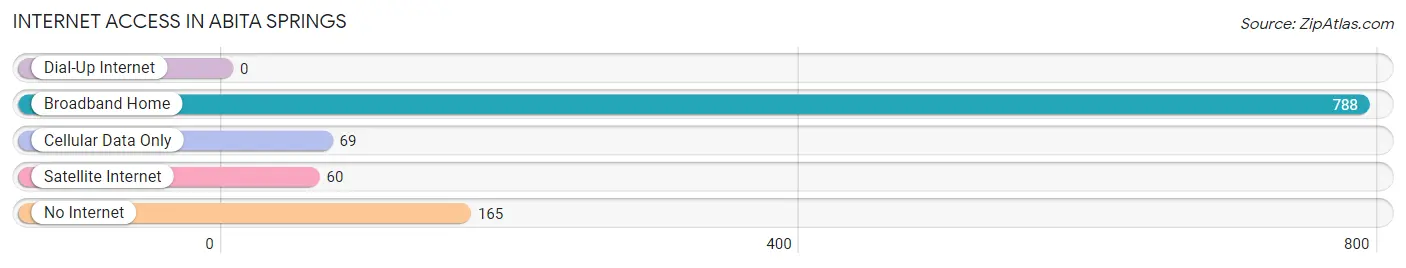
| Internet Type | # Households | % Households |
| Dial-Up Internet | 0 | 0.0% |
| Broadband Home | 788 | 74.9% |
| Cellular Data Only | 69 | 6.6% |
| Satellite Internet | 60 | 5.7% |
| No Internet | 165 | 15.7% |
| Total | 1,052 | 100.0% |
Abita Springs Summary
Abita Springs is a small town located in St. Tammany Parish, Louisiana, United States. It is situated on the north shore of Lake Pontchartrain, about 25 miles north of New Orleans. The town is known for its natural springs, which have been used for centuries by Native Americans and early settlers. Abita Springs is also home to the Abita Brewing Company, which produces a variety of craft beers.
History
The area around Abita Springs has been inhabited for thousands of years. Native Americans, including the Choctaw, Chickasaw, and Houma tribes, used the natural springs for medicinal and spiritual purposes. The first European settlers arrived in the area in the late 1700s, and the town was officially founded in 1834.
The town was named after the Abita River, which flows through the area. The river was named by the Choctaw Indians, who called it “Abita,” meaning “clear water.”
In the late 1800s, Abita Springs became a popular destination for tourists, who came to enjoy the natural springs and the town’s mild climate. The town was also known for its mineral springs, which were believed to have healing properties.
In the early 1900s, Abita Springs became a popular destination for artists and writers, who were drawn to the town’s natural beauty and peaceful atmosphere. The town was also home to a number of resorts, which attracted visitors from all over the country.
Geography
Abita Springs is located in St. Tammany Parish, Louisiana, about 25 miles north of New Orleans. The town is situated on the north shore of Lake Pontchartrain, and is surrounded by the Abita River and its tributaries. The town is located in a hilly area, with an elevation of about 50 feet above sea level.
The climate in Abita Springs is mild and humid, with hot summers and mild winters. The average annual temperature is around 70 degrees Fahrenheit, and the average annual precipitation is around 60 inches.
Economy
Abita Springs is a small town with a population of about 2,500 people. The town’s economy is largely based on tourism, as it is a popular destination for visitors from all over the country. The town is also home to the Abita Brewing Company, which produces a variety of craft beers.
The town is also home to a number of small businesses, including restaurants, shops, and art galleries. The town is also home to a number of festivals and events throughout the year, including the Abita Springs Crawfish Festival and the Abita Springs Jazz and Blues Festival.
Demographics
As of the 2010 census, the population of Abita Springs was 2,365. The racial makeup of the town was 94.3% White, 2.2% African American, 0.3% Native American, 0.7% Asian, 0.1% Pacific Islander, 0.7% from other races, and 1.9% from two or more races. Hispanic or Latino of any race were 2.2% of the population.
The median income for a household in Abita Springs was $45,000, and the median income for a family was $50,000. The per capita income for the town was $20,000. About 10.3% of families and 13.2% of the population were below the poverty line, including 17.2% of those under age 18 and 8.3% of those age 65 or over.
Common Questions
What is Per Capita Income in Abita Springs?
Per Capita income in Abita Springs is $36,141.
What is the Median Family Income in Abita Springs?
Median Family Income in Abita Springs is $108,523.
What is the Median Household income in Abita Springs?
Median Household Income in Abita Springs is $80,212.
What is Income or Wage Gap in Abita Springs?
Income or Wage Gap in Abita Springs is 37.7%.
Women in Abita Springs earn 62.3 cents for every dollar earned by a man.
What is Inequality or Gini Index in Abita Springs?
Inequality or Gini Index in Abita Springs is 0.39.
What is the Total Population of Abita Springs?
Total Population of Abita Springs is 2,639.
What is the Total Male Population of Abita Springs?
Total Male Population of Abita Springs is 1,173.
What is the Total Female Population of Abita Springs?
Total Female Population of Abita Springs is 1,466.
What is the Ratio of Males per 100 Females in Abita Springs?
There are 80.01 Males per 100 Females in Abita Springs.
What is the Ratio of Females per 100 Males in Abita Springs?
There are 124.98 Females per 100 Males in Abita Springs.
What is the Median Population Age in Abita Springs?
Median Population Age in Abita Springs is 40.1 Years.
What is the Average Family Size in Abita Springs
Average Family Size in Abita Springs is 3.1 People.
What is the Average Household Size in Abita Springs
Average Household Size in Abita Springs is 2.5 People.
How Large is the Labor Force in Abita Springs?
There are 1,264 People in the Labor Forcein in Abita Springs.
What is the Percentage of People in the Labor Force in Abita Springs?
62.2% of People are in the Labor Force in Abita Springs.
What is the Unemployment Rate in Abita Springs?
Unemployment Rate in Abita Springs is 3.1%.