Abbeville, LA Map & Demographics
Abbeville Map
Abbeville Overview
$22,605
PER CAPITA INCOME
$40,532
AVG FAMILY INCOME
$39,566
AVG HOUSEHOLD INCOME
38.8%
WAGE / INCOME GAP [ % ]
61.2¢/ $1
WAGE / INCOME GAP [ $ ]
0.48
INEQUALITY / GINI INDEX
11,213
TOTAL POPULATION
4,696
MALE POPULATION
6,517
FEMALE POPULATION
72.06
MALES / 100 FEMALES
138.78
FEMALES / 100 MALES
33.1
MEDIAN AGE
3.0
AVG FAMILY SIZE
2.4
AVG HOUSEHOLD SIZE
4,809
LABOR FORCE [ PEOPLE ]
56.1%
PERCENT IN LABOR FORCE
6.8%
UNEMPLOYMENT RATE
Abbeville Zip Codes
Abbeville Area Codes
Income in Abbeville
Income Overview in Abbeville
Per Capita Income in Abbeville is $22,605, while median incomes of families and households are $40,532 and $39,566 respectively.
| Characteristic | Number | Measure |
| Per Capita Income | 11,213 | $22,605 |
| Median Family Income | 2,976 | $40,532 |
| Mean Family Income | 2,976 | $60,206 |
| Median Household Income | 4,522 | $39,566 |
| Mean Household Income | 4,522 | $53,618 |
| Income Deficit | 2,976 | $0 |
| Wage / Income Gap (%) | 11,213 | 38.83% |
| Wage / Income Gap ($) | 11,213 | 61.17¢ per $1 |
| Gini / Inequality Index | 11,213 | 0.48 |
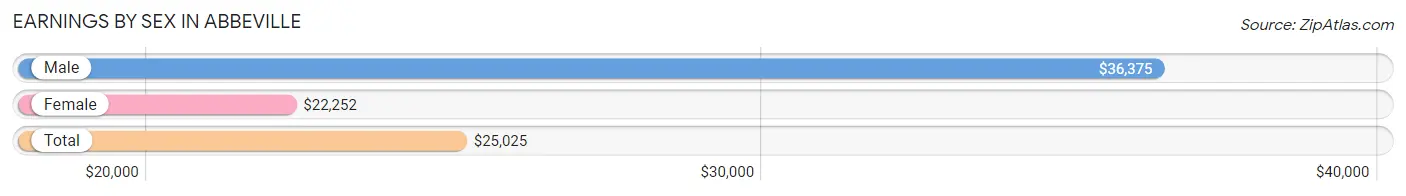
Earnings by Sex in Abbeville
Average Earnings in Abbeville are $25,025, $36,375 for men and $22,252 for women, a difference of 38.8%.
| Sex | Number | Average Earnings |
| Male | 2,232 (46.2%) | $36,375 |
| Female | 2,603 (53.8%) | $22,252 |
| Total | 4,835 (100.0%) | $25,025 |
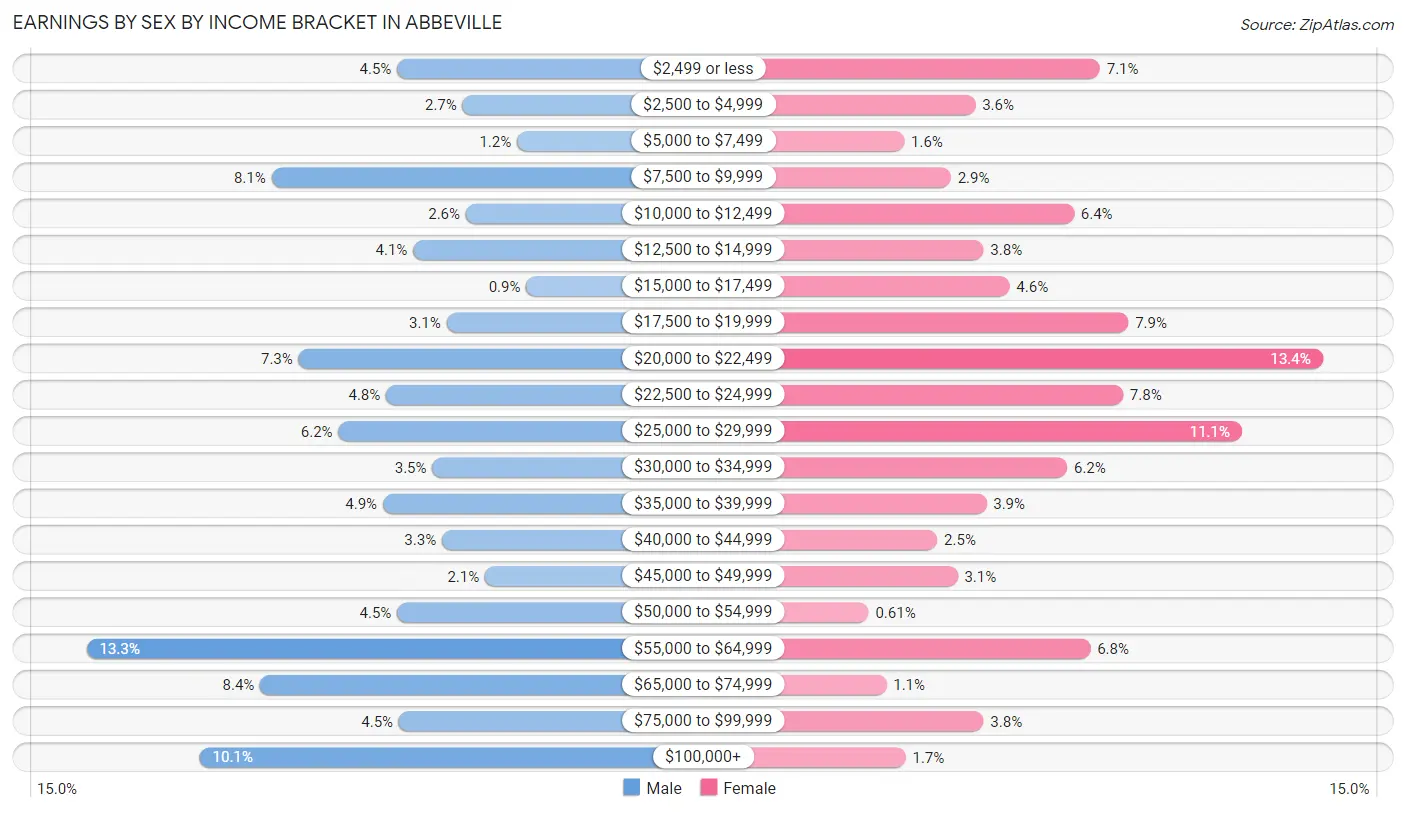
Earnings by Sex by Income Bracket in Abbeville
The most common earnings brackets in Abbeville are $55,000 to $64,999 for men (296 | 13.3%) and $20,000 to $22,499 for women (348 | 13.4%).
| Income | Male | Female |
| $2,499 or less | 101 (4.5%) | 185 (7.1%) |
| $2,500 to $4,999 | 60 (2.7%) | 94 (3.6%) |
| $5,000 to $7,499 | 26 (1.2%) | 42 (1.6%) |
| $7,500 to $9,999 | 180 (8.1%) | 76 (2.9%) |
| $10,000 to $12,499 | 58 (2.6%) | 166 (6.4%) |
| $12,500 to $14,999 | 91 (4.1%) | 100 (3.8%) |
| $15,000 to $17,499 | 20 (0.9%) | 119 (4.6%) |
| $17,500 to $19,999 | 70 (3.1%) | 206 (7.9%) |
| $20,000 to $22,499 | 163 (7.3%) | 348 (13.4%) |
| $22,500 to $24,999 | 108 (4.8%) | 202 (7.8%) |
| $25,000 to $29,999 | 138 (6.2%) | 289 (11.1%) |
| $30,000 to $34,999 | 79 (3.5%) | 161 (6.2%) |
| $35,000 to $39,999 | 110 (4.9%) | 102 (3.9%) |
| $40,000 to $44,999 | 73 (3.3%) | 66 (2.5%) |
| $45,000 to $49,999 | 46 (2.1%) | 81 (3.1%) |
| $50,000 to $54,999 | 101 (4.5%) | 16 (0.6%) |
| $55,000 to $64,999 | 296 (13.3%) | 178 (6.8%) |
| $65,000 to $74,999 | 187 (8.4%) | 29 (1.1%) |
| $75,000 to $99,999 | 100 (4.5%) | 100 (3.8%) |
| $100,000+ | 225 (10.1%) | 43 (1.7%) |
| Total | 2,232 (100.0%) | 2,603 (100.0%) |
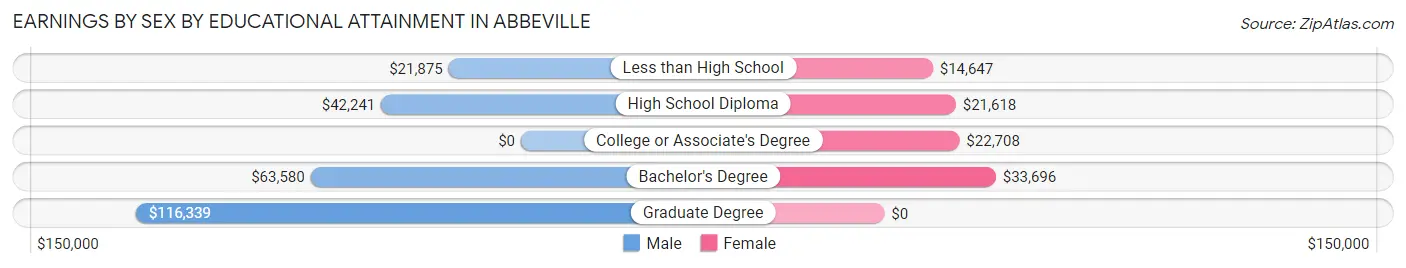
Earnings by Sex by Educational Attainment in Abbeville
Average earnings in Abbeville are $41,288 for men and $22,185 for women, a difference of 46.3%. Men with an educational attainment of graduate degree enjoy the highest average annual earnings of $116,339, while those with less than high school education earn the least with $21,875. Women with an educational attainment of bachelor's degree earn the most with the average annual earnings of $33,696, while those with less than high school education have the smallest earnings of $14,647.
| Educational Attainment | Male Income | Female Income |
| Less than High School | $21,875 | $14,647 |
| High School Diploma | $42,241 | $21,618 |
| College or Associate's Degree | - | - |
| Bachelor's Degree | $63,580 | $33,696 |
| Graduate Degree | $116,339 | $0 |
| Total | $41,288 | $22,185 |
Family Income in Abbeville
Family Income Brackets in Abbeville
According to the Abbeville family income data, there are 699 families falling into the $15,000 to $24,999 income range, which is the most common income bracket and makes up 23.5% of all families. Conversely, the $150,000 to $199,999 income bracket is the least frequent group with only 98 families (3.3%) belonging to this category.
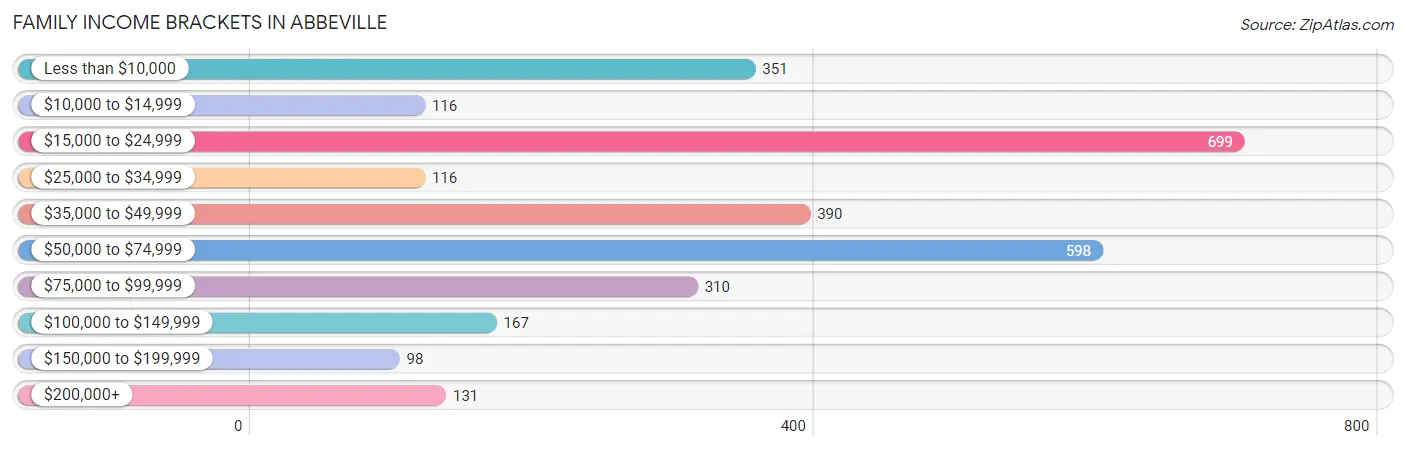
| Income Bracket | # Families | % Families |
| Less than $10,000 | 351 | 11.8% |
| $10,000 to $14,999 | 116 | 3.9% |
| $15,000 to $24,999 | 699 | 23.5% |
| $25,000 to $34,999 | 116 | 3.9% |
| $35,000 to $49,999 | 390 | 13.1% |
| $50,000 to $74,999 | 598 | 20.1% |
| $75,000 to $99,999 | 310 | 10.4% |
| $100,000 to $149,999 | 167 | 5.6% |
| $150,000 to $199,999 | 98 | 3.3% |
| $200,000+ | 131 | 4.4% |
Family Income by Famaliy Size in Abbeville
5-person families (216 | 7.3%) account for the highest median family income in Abbeville with $60,735 per family, while 2-person families (1,631 | 54.8%) have the highest median income of $19,334 per family member.
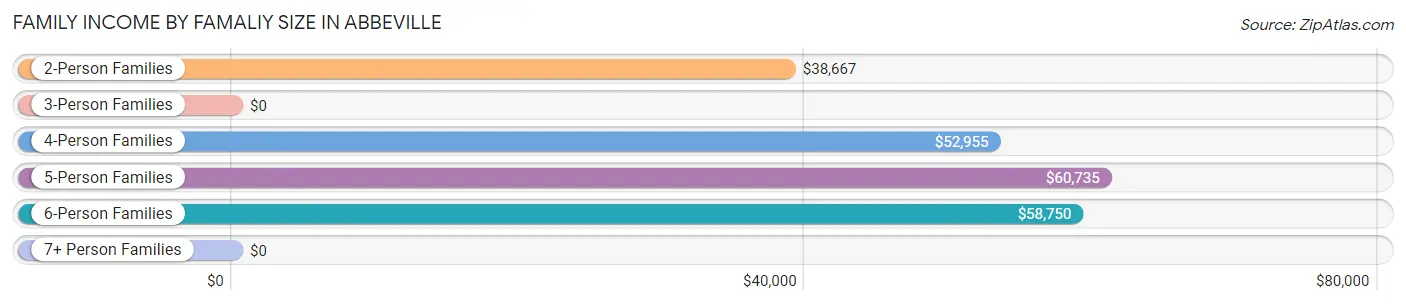
| Income Bracket | # Families | Median Income |
| 2-Person Families | 1,631 (54.8%) | $38,667 |
| 3-Person Families | 731 (24.6%) | $0 |
| 4-Person Families | 310 (10.4%) | $52,955 |
| 5-Person Families | 216 (7.3%) | $60,735 |
| 6-Person Families | 55 (1.8%) | $58,750 |
| 7+ Person Families | 33 (1.1%) | $0 |
| Total | 2,976 (100.0%) | $40,532 |
Family Income by Number of Earners in Abbeville
The median family income in Abbeville is $40,532, with families comprising 2 earners (902) having the highest median family income of $74,688, while families with no earners (651) have the lowest median family income of $20,984, accounting for 30.3% and 21.9% of families, respectively.
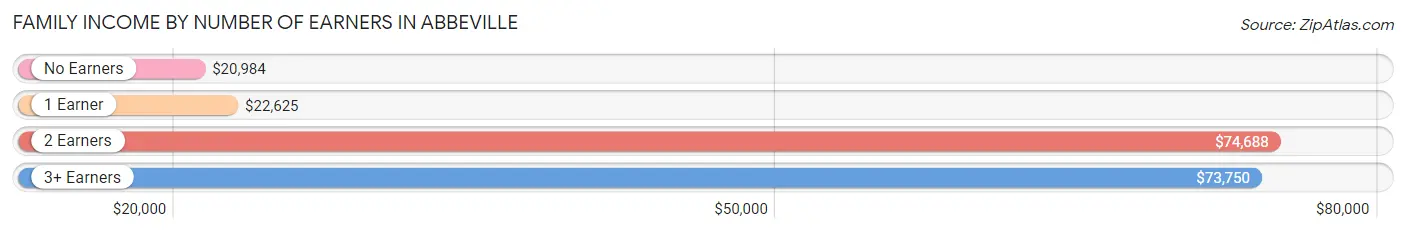
| Number of Earners | # Families | Median Income |
| No Earners | 651 (21.9%) | $20,984 |
| 1 Earner | 1,268 (42.6%) | $22,625 |
| 2 Earners | 902 (30.3%) | $74,688 |
| 3+ Earners | 155 (5.2%) | $73,750 |
| Total | 2,976 (100.0%) | $40,532 |
Household Income in Abbeville
Household Income Brackets in Abbeville
With 1,167 households falling in the category, the $15,000 to $24,999 income range is the most frequent in Abbeville, accounting for 25.8% of all households. In contrast, only 118 households (2.6%) fall into the $150,000 to $199,999 income bracket, making it the least populous group.
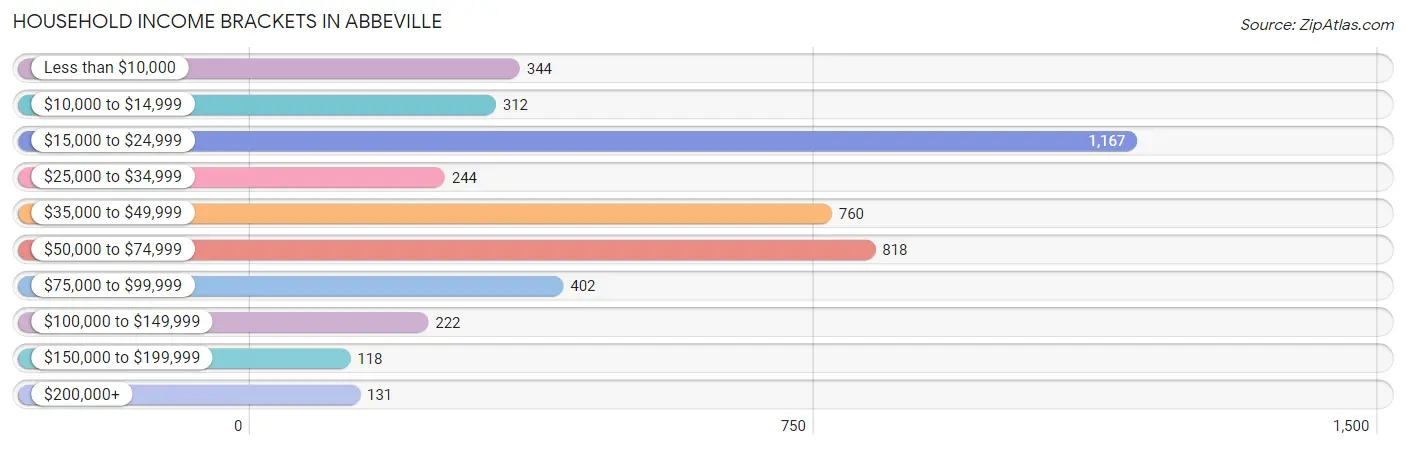
| Income Bracket | # Households | % Households |
| Less than $10,000 | 344 | 7.6% |
| $10,000 to $14,999 | 312 | 6.9% |
| $15,000 to $24,999 | 1,167 | 25.8% |
| $25,000 to $34,999 | 244 | 5.4% |
| $35,000 to $49,999 | 760 | 16.8% |
| $50,000 to $74,999 | 818 | 18.1% |
| $75,000 to $99,999 | 402 | 8.9% |
| $100,000 to $149,999 | 222 | 4.9% |
| $150,000 to $199,999 | 118 | 2.6% |
| $200,000+ | 131 | 2.9% |
Household Income by Householder Age in Abbeville
The median household income in Abbeville is $39,566, with the highest median household income of $48,661 found in the 45 to 64 years age bracket for the primary householder. A total of 1,269 households (28.1%) fall into this category. Meanwhile, the 15 to 24 years age bracket for the primary householder has the lowest median household income of $24,333, with 376 households (8.3%) in this group.
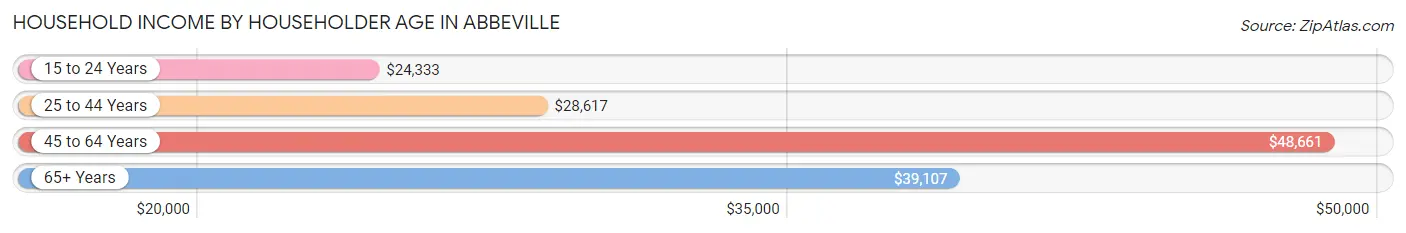
| Income Bracket | # Households | Median Income |
| 15 to 24 Years | 376 (8.3%) | $24,333 |
| 25 to 44 Years | 1,474 (32.6%) | $28,617 |
| 45 to 64 Years | 1,269 (28.1%) | $48,661 |
| 65+ Years | 1,403 (31.0%) | $39,107 |
| Total | 4,522 (100.0%) | $39,566 |
Poverty in Abbeville
Income Below Poverty by Sex and Age in Abbeville
With 26.0% poverty level for males and 35.8% for females among the residents of Abbeville, under 5 year old males and 6 to 11 year old females are the most vulnerable to poverty, with 244 males (64.5%) and 388 females (72.8%) in their respective age groups living below the poverty level.
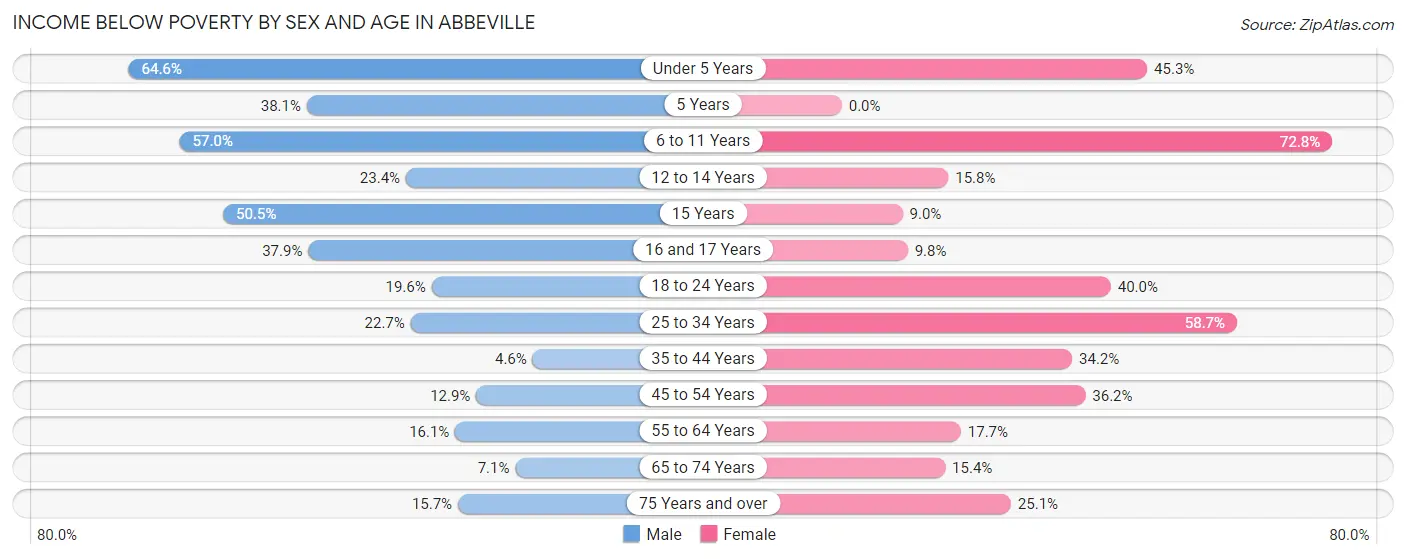
| Age Bracket | Male | Female |
| Under 5 Years | 244 (64.5%) | 209 (45.3%) |
| 5 Years | 8 (38.1%) | 0 (0.0%) |
| 6 to 11 Years | 306 (57.0%) | 388 (72.8%) |
| 12 to 14 Years | 36 (23.4%) | 43 (15.8%) |
| 15 Years | 48 (50.5%) | 13 (9.0%) |
| 16 and 17 Years | 50 (37.9%) | 19 (9.8%) |
| 18 to 24 Years | 81 (19.6%) | 302 (40.0%) |
| 25 to 34 Years | 191 (22.7%) | 552 (58.7%) |
| 35 to 44 Years | 14 (4.6%) | 197 (34.2%) |
| 45 to 54 Years | 62 (12.9%) | 221 (36.2%) |
| 55 to 64 Years | 88 (16.1%) | 105 (17.7%) |
| 65 to 74 Years | 34 (7.1%) | 124 (15.3%) |
| 75 Years and over | 36 (15.7%) | 114 (25.1%) |
| Total | 1,198 (26.0%) | 2,287 (35.8%) |
Income Above Poverty by Sex and Age in Abbeville
According to the poverty statistics in Abbeville, males aged 35 to 44 years and females aged 5 years are the age groups that are most secure financially, with 95.4% of males and 100.0% of females in these age groups living above the poverty line.
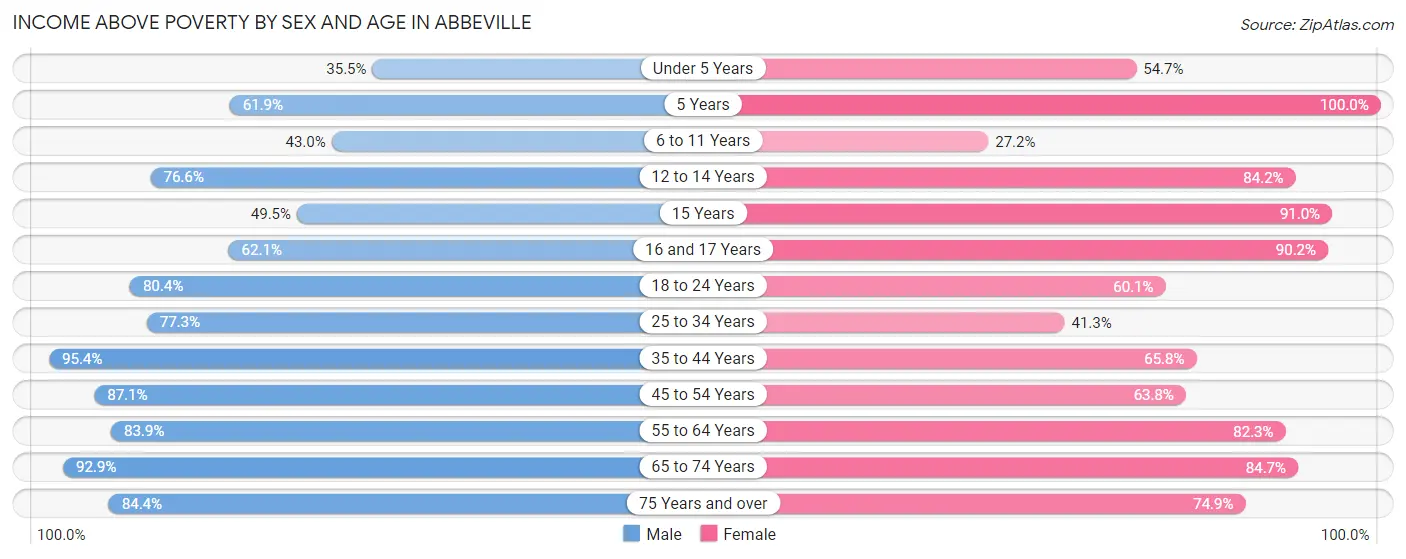
| Age Bracket | Male | Female |
| Under 5 Years | 134 (35.4%) | 252 (54.7%) |
| 5 Years | 13 (61.9%) | 45 (100.0%) |
| 6 to 11 Years | 231 (43.0%) | 145 (27.2%) |
| 12 to 14 Years | 118 (76.6%) | 229 (84.2%) |
| 15 Years | 47 (49.5%) | 131 (91.0%) |
| 16 and 17 Years | 82 (62.1%) | 175 (90.2%) |
| 18 to 24 Years | 333 (80.4%) | 454 (60.1%) |
| 25 to 34 Years | 651 (77.3%) | 389 (41.3%) |
| 35 to 44 Years | 293 (95.4%) | 379 (65.8%) |
| 45 to 54 Years | 417 (87.1%) | 390 (63.8%) |
| 55 to 64 Years | 460 (83.9%) | 489 (82.3%) |
| 65 to 74 Years | 442 (92.9%) | 684 (84.7%) |
| 75 Years and over | 194 (84.4%) | 340 (74.9%) |
| Total | 3,415 (74.0%) | 4,102 (64.2%) |
Income Below Poverty Among Married-Couple Families in Abbeville
The poverty statistics for married-couple families in Abbeville show that 10.0% or 119 of the total 1,191 families live below the poverty line. Families with 3 or 4 children have the highest poverty rate of 17.7%, comprising of 29 families. On the other hand, families with 1 or 2 children have the lowest poverty rate of 4.8%, which includes 14 families.
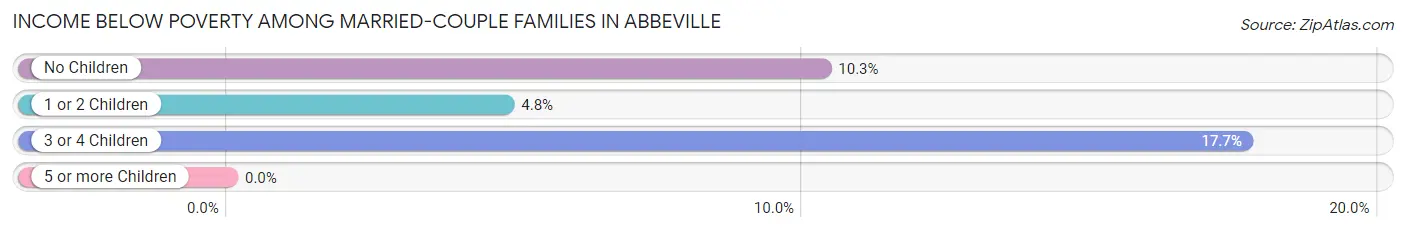
| Children | Above Poverty | Below Poverty |
| No Children | 660 (89.7%) | 76 (10.3%) |
| 1 or 2 Children | 277 (95.2%) | 14 (4.8%) |
| 3 or 4 Children | 135 (82.3%) | 29 (17.7%) |
| 5 or more Children | 0 (0.0%) | 0 (0.0%) |
| Total | 1,072 (90.0%) | 119 (10.0%) |
Income Below Poverty Among Single-Parent Households in Abbeville
According to the poverty data in Abbeville, 10.4% or 20 single-father households and 52.1% or 829 single-mother households are living below the poverty line. Among single-father households, those with 1 or 2 children have the highest poverty rate, with 20 households (25.3%) experiencing poverty. Likewise, among single-mother households, those with 3 or 4 children have the highest poverty rate, with 136 households (100.0%) falling below the poverty line.
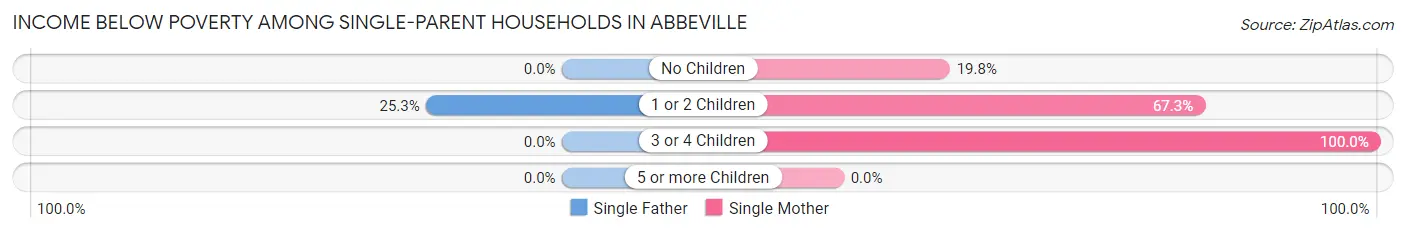
| Children | Single Father | Single Mother |
| No Children | 0 (0.0%) | 117 (19.8%) |
| 1 or 2 Children | 20 (25.3%) | 576 (67.3%) |
| 3 or 4 Children | 0 (0.0%) | 136 (100.0%) |
| 5 or more Children | 0 (0.0%) | 0 (0.0%) |
| Total | 20 (10.4%) | 829 (52.1%) |
Income Below Poverty Among Married-Couple vs Single-Parent Households in Abbeville
The poverty data for Abbeville shows that 119 of the married-couple family households (10.0%) and 849 of the single-parent households (47.6%) are living below the poverty level. Within the married-couple family households, those with 3 or 4 children have the highest poverty rate, with 29 households (17.7%) falling below the poverty line. Among the single-parent households, those with 3 or 4 children have the highest poverty rate, with 136 household (100.0%) living below poverty.
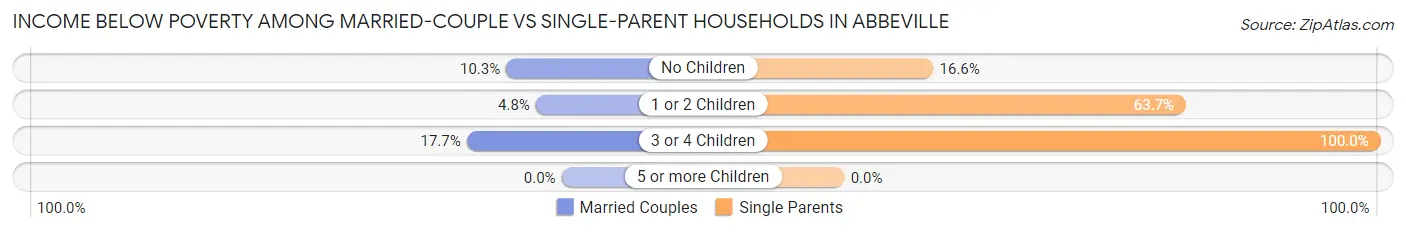
| Children | Married-Couple Families | Single-Parent Households |
| No Children | 76 (10.3%) | 117 (16.6%) |
| 1 or 2 Children | 14 (4.8%) | 596 (63.7%) |
| 3 or 4 Children | 29 (17.7%) | 136 (100.0%) |
| 5 or more Children | 0 (0.0%) | 0 (0.0%) |
| Total | 119 (10.0%) | 849 (47.6%) |
Race in Abbeville
The most populous races in Abbeville are Black / African American (5,145 | 45.9%), White / Caucasian (4,738 | 42.2%), and Two or more Races (609 | 5.4%).
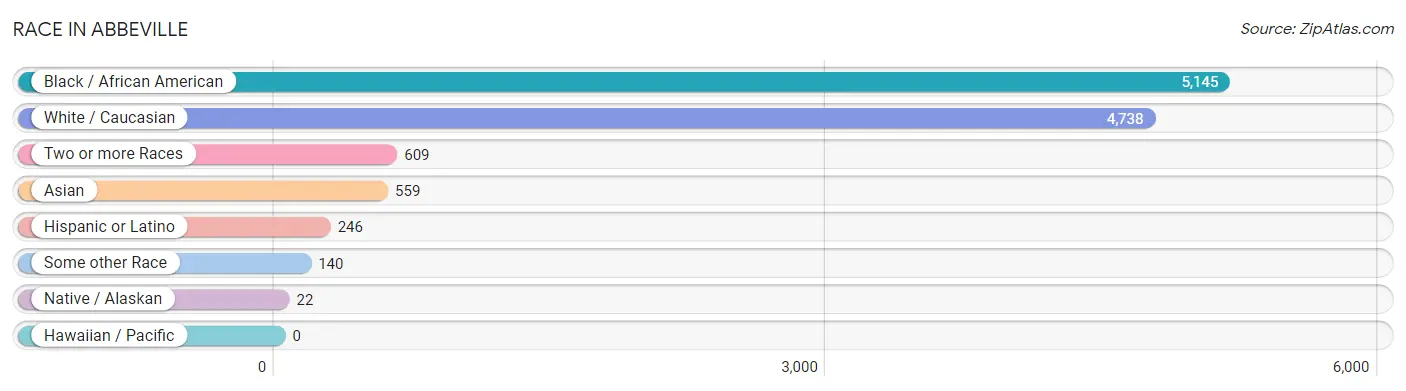
| Race | # Population | % Population |
| Asian | 559 | 5.0% |
| Black / African American | 5,145 | 45.9% |
| Hawaiian / Pacific | 0 | 0.0% |
| Hispanic or Latino | 246 | 2.2% |
| Native / Alaskan | 22 | 0.2% |
| White / Caucasian | 4,738 | 42.2% |
| Two or more Races | 609 | 5.4% |
| Some other Race | 140 | 1.3% |
| Total | 11,213 | 100.0% |
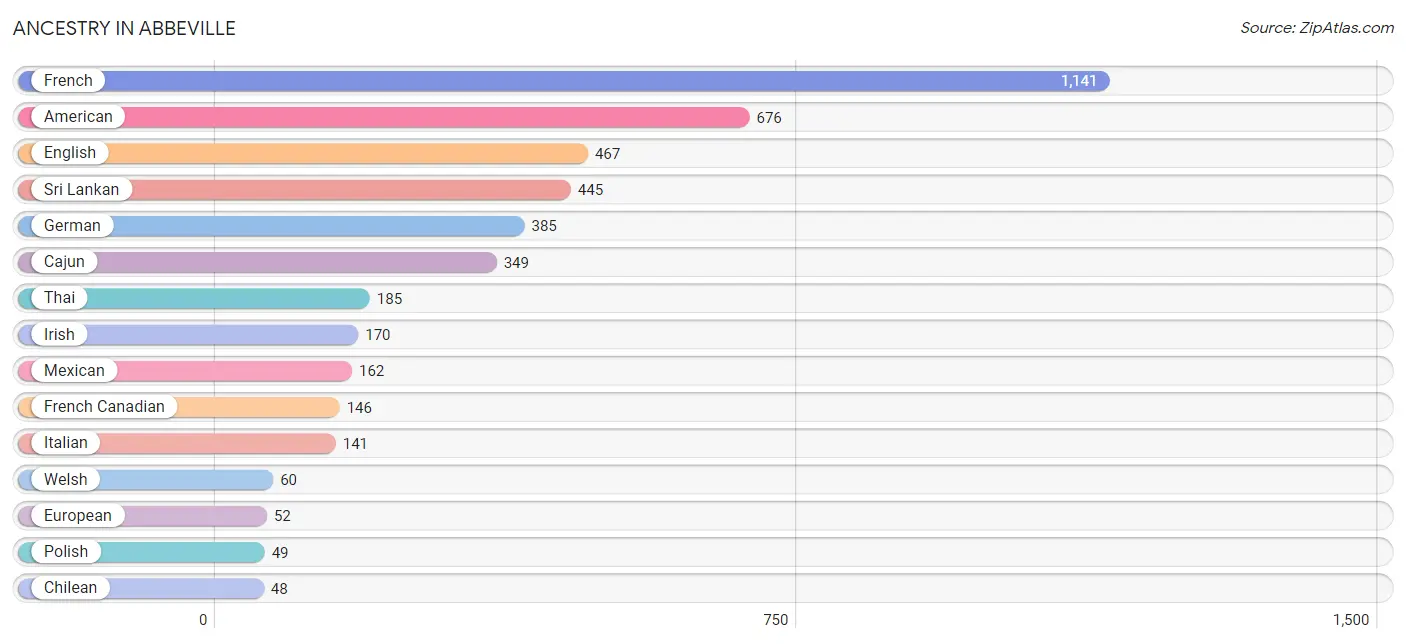
Ancestry in Abbeville
The most populous ancestries reported in Abbeville are French (1,141 | 10.2%), American (676 | 6.0%), English (467 | 4.2%), Sri Lankan (445 | 4.0%), and German (385 | 3.4%), together accounting for 27.8% of all Abbeville residents.
| Ancestry | # Population | % Population |
| African | 27 | 0.2% |
| American | 676 | 6.0% |
| Cajun | 349 | 3.1% |
| Canadian | 12 | 0.1% |
| Chilean | 48 | 0.4% |
| Dutch | 9 | 0.1% |
| Eastern European | 11 | 0.1% |
| English | 467 | 4.2% |
| European | 52 | 0.5% |
| French | 1,141 | 10.2% |
| French Canadian | 146 | 1.3% |
| German | 385 | 3.4% |
| Houma | 22 | 0.2% |
| Irish | 170 | 1.5% |
| Italian | 141 | 1.3% |
| Korean | 12 | 0.1% |
| Mexican | 162 | 1.4% |
| Polish | 49 | 0.4% |
| Portuguese | 18 | 0.2% |
| Scotch-Irish | 44 | 0.4% |
| South American | 48 | 0.4% |
| Sri Lankan | 445 | 4.0% |
| Subsaharan African | 27 | 0.2% |
| Thai | 185 | 1.7% |
| Trinidadian and Tobagonian | 7 | 0.1% |
| Welsh | 60 | 0.5% |
| West Indian | 1 | 0.0% | View All 27 Rows |
Immigrants in Abbeville
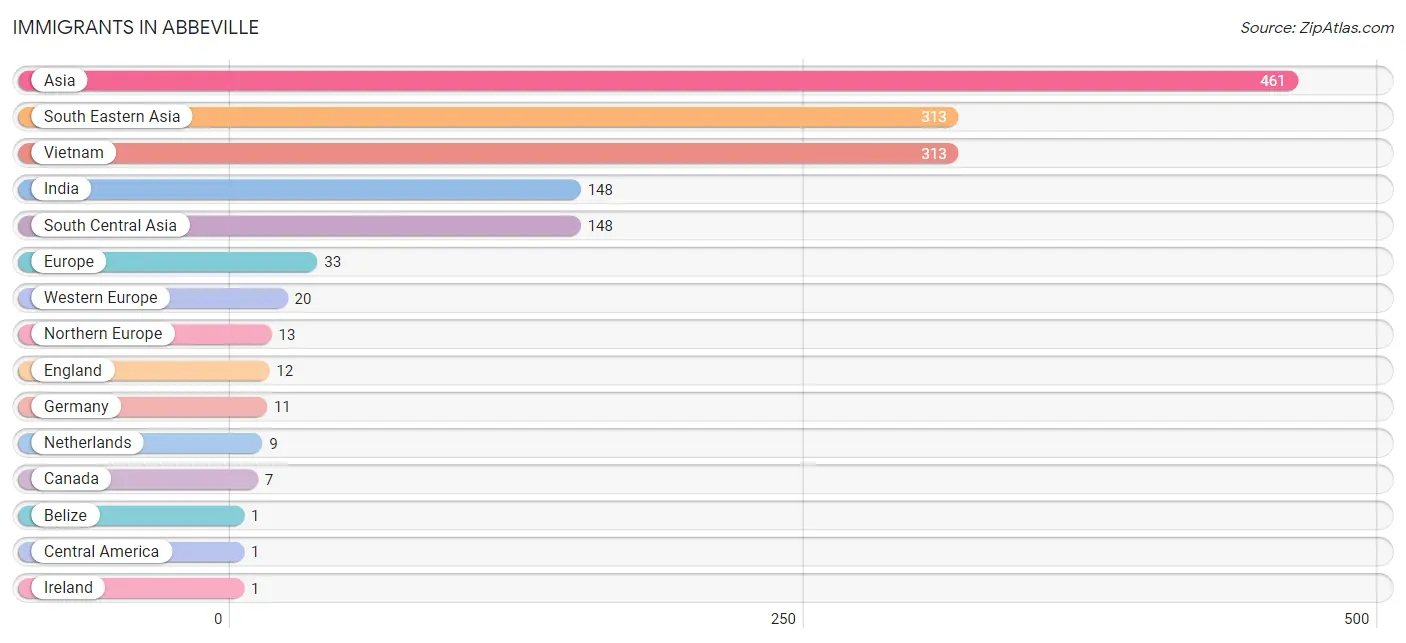
The most numerous immigrant groups reported in Abbeville came from Asia (461 | 4.1%), South Eastern Asia (313 | 2.8%), Vietnam (313 | 2.8%), India (148 | 1.3%), and South Central Asia (148 | 1.3%), together accounting for 12.3% of all Abbeville residents.
| Immigration Origin | # Population | % Population |
| Asia | 461 | 4.1% |
| Belize | 1 | 0.0% |
| Canada | 7 | 0.1% |
| Central America | 1 | 0.0% |
| England | 12 | 0.1% |
| Europe | 33 | 0.3% |
| Germany | 11 | 0.1% |
| India | 148 | 1.3% |
| Ireland | 1 | 0.0% |
| Latin America | 1 | 0.0% |
| Netherlands | 9 | 0.1% |
| Northern Europe | 13 | 0.1% |
| South Central Asia | 148 | 1.3% |
| South Eastern Asia | 313 | 2.8% |
| Vietnam | 313 | 2.8% |
| Western Europe | 20 | 0.2% | View All 16 Rows |
Sex and Age in Abbeville
Sex and Age in Abbeville
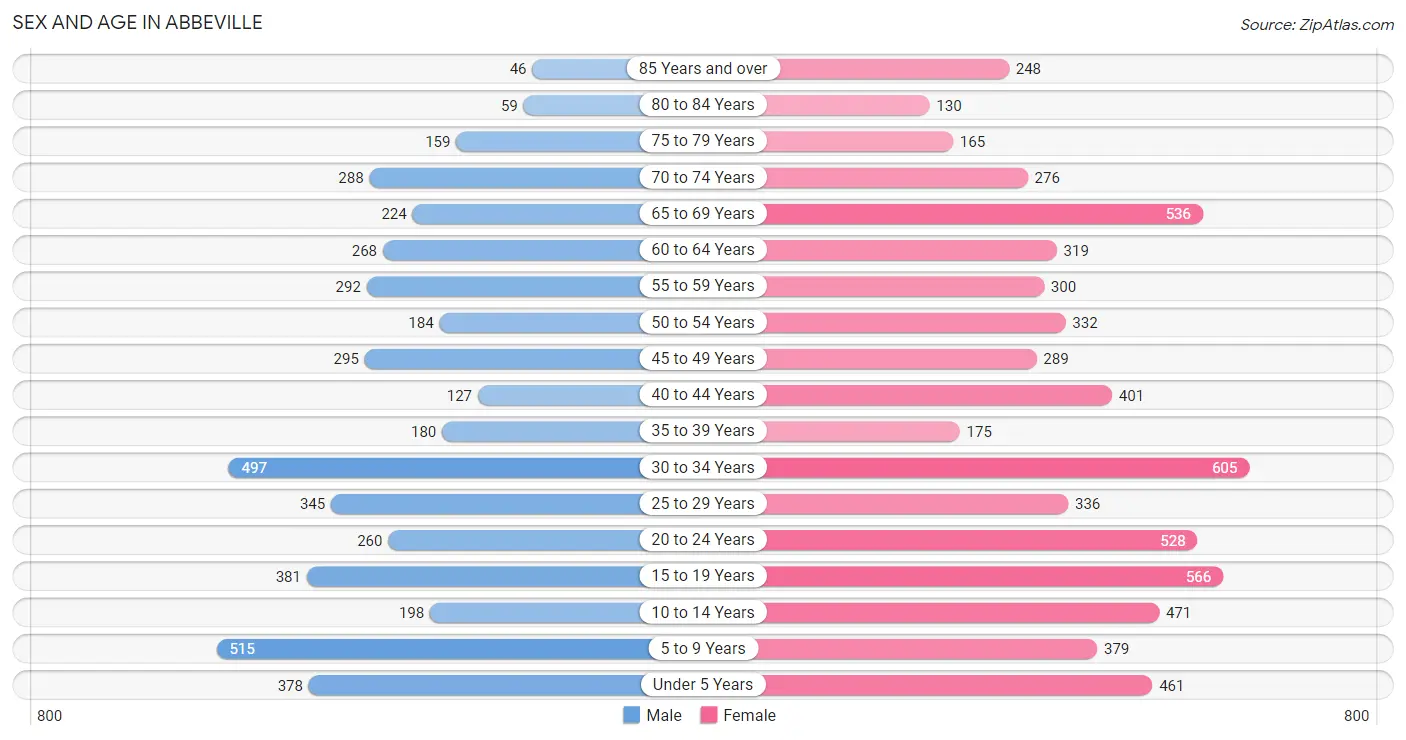
The most populous age groups in Abbeville are 5 to 9 Years (515 | 11.0%) for men and 30 to 34 Years (605 | 9.3%) for women.
| Age Bracket | Male | Female |
| Under 5 Years | 378 (8.1%) | 461 (7.1%) |
| 5 to 9 Years | 515 (11.0%) | 379 (5.8%) |
| 10 to 14 Years | 198 (4.2%) | 471 (7.2%) |
| 15 to 19 Years | 381 (8.1%) | 566 (8.7%) |
| 20 to 24 Years | 260 (5.5%) | 528 (8.1%) |
| 25 to 29 Years | 345 (7.3%) | 336 (5.2%) |
| 30 to 34 Years | 497 (10.6%) | 605 (9.3%) |
| 35 to 39 Years | 180 (3.8%) | 175 (2.7%) |
| 40 to 44 Years | 127 (2.7%) | 401 (6.1%) |
| 45 to 49 Years | 295 (6.3%) | 289 (4.4%) |
| 50 to 54 Years | 184 (3.9%) | 332 (5.1%) |
| 55 to 59 Years | 292 (6.2%) | 300 (4.6%) |
| 60 to 64 Years | 268 (5.7%) | 319 (4.9%) |
| 65 to 69 Years | 224 (4.8%) | 536 (8.2%) |
| 70 to 74 Years | 288 (6.1%) | 276 (4.2%) |
| 75 to 79 Years | 159 (3.4%) | 165 (2.5%) |
| 80 to 84 Years | 59 (1.3%) | 130 (2.0%) |
| 85 Years and over | 46 (1.0%) | 248 (3.8%) |
| Total | 4,696 (100.0%) | 6,517 (100.0%) |
Families and Households in Abbeville
Median Family Size in Abbeville
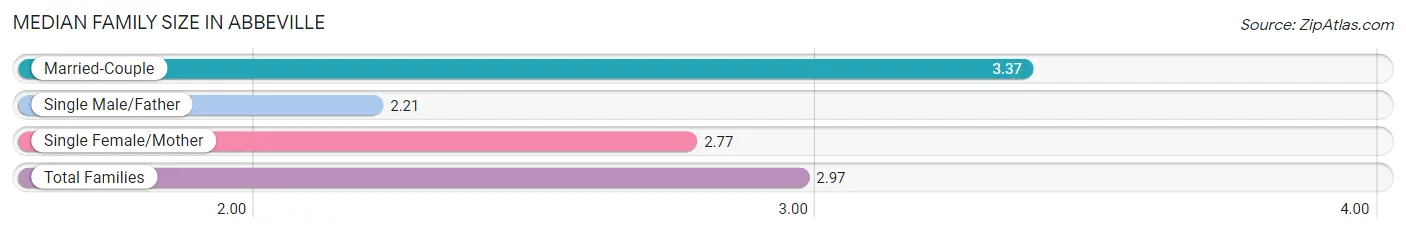
The median family size in Abbeville is 2.97 persons per family, with married-couple families (1,191 | 40.0%) accounting for the largest median family size of 3.37 persons per family. On the other hand, single male/father families (193 | 6.5%) represent the smallest median family size with 2.21 persons per family.
| Family Type | # Families | Family Size |
| Married-Couple | 1,191 (40.0%) | 3.37 |
| Single Male/Father | 193 (6.5%) | 2.21 |
| Single Female/Mother | 1,592 (53.5%) | 2.77 |
| Total Families | 2,976 (100.0%) | 2.97 |
Median Household Size in Abbeville
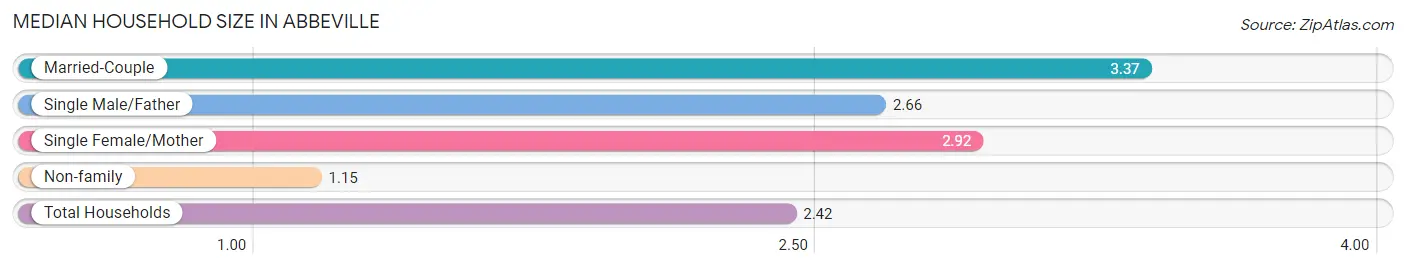
The median household size in Abbeville is 2.42 persons per household, with married-couple households (1,191 | 26.3%) accounting for the largest median household size of 3.37 persons per household. non-family households (1,546 | 34.2%) represent the smallest median household size with 1.15 persons per household.
| Household Type | # Households | Household Size |
| Married-Couple | 1,191 (26.3%) | 3.37 |
| Single Male/Father | 193 (4.3%) | 2.66 |
| Single Female/Mother | 1,592 (35.2%) | 2.92 |
| Non-family | 1,546 (34.2%) | 1.15 |
| Total Households | 4,522 (100.0%) | 2.42 |
Household Size by Marriage Status in Abbeville
Out of a total of 4,522 households in Abbeville, 2,976 (65.8%) are family households, while 1,546 (34.2%) are nonfamily households. The most numerous type of family households are 2-person households, comprising 1,374, and the most common type of nonfamily households are 1-person households, comprising 1,265.
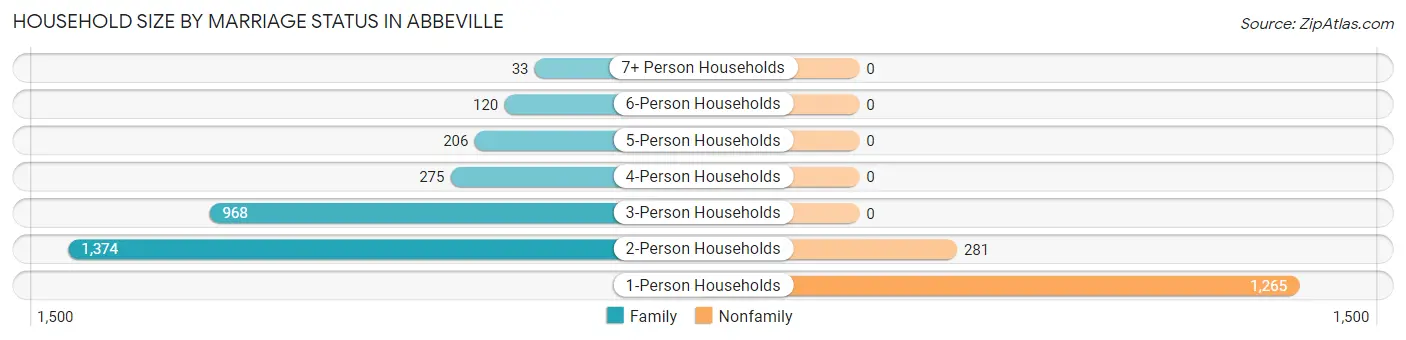
| Household Size | Family Households | Nonfamily Households |
| 1-Person Households | - | 1,265 (28.0%) |
| 2-Person Households | 1,374 (30.4%) | 281 (6.2%) |
| 3-Person Households | 968 (21.4%) | 0 (0.0%) |
| 4-Person Households | 275 (6.1%) | 0 (0.0%) |
| 5-Person Households | 206 (4.6%) | 0 (0.0%) |
| 6-Person Households | 120 (2.6%) | 0 (0.0%) |
| 7+ Person Households | 33 (0.7%) | 0 (0.0%) |
| Total | 2,976 (65.8%) | 1,546 (34.2%) |
Female Fertility in Abbeville
Fertility by Age in Abbeville
Average fertility rate in Abbeville is 131.0 births per 1,000 women. Women in the age bracket of 20 to 34 years have the highest fertility rate with 264.0 births per 1,000 women. Women in the age bracket of 20 to 34 years acount for 100.0% of all women with births.
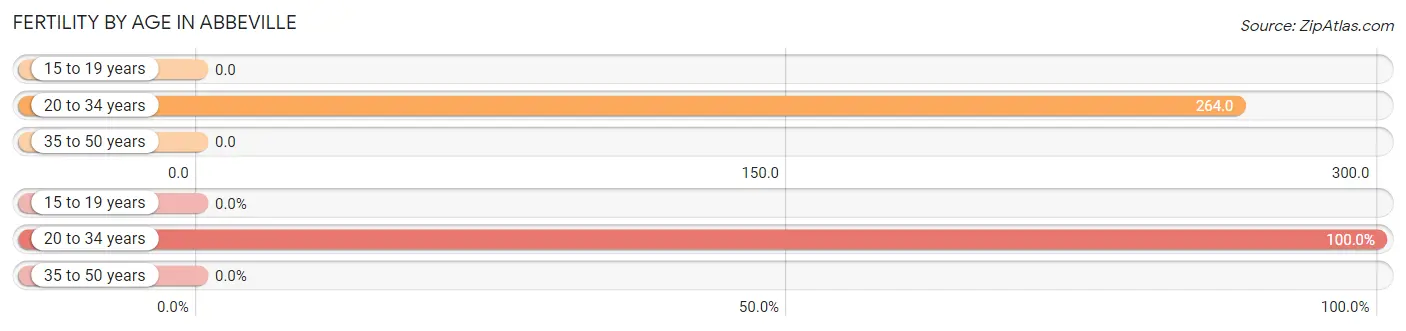
| Age Bracket | Women with Births | Births / 1,000 Women |
| 15 to 19 years | 0 (0.0%) | 0.0 |
| 20 to 34 years | 388 (100.0%) | 264.0 |
| 35 to 50 years | 0 (0.0%) | 0.0 |
| Total | 388 (100.0%) | 131.0 |
Fertility by Age by Marriage Status in Abbeville
56.4% of women with births (388) in Abbeville are married. The highest percentage of unmarried women with births falls into 20 to 34 years age bracket with 43.6% of them unmarried at the time of birth, while the lowest percentage of unmarried women with births belong to 20 to 34 years age bracket with 43.6% of them unmarried.
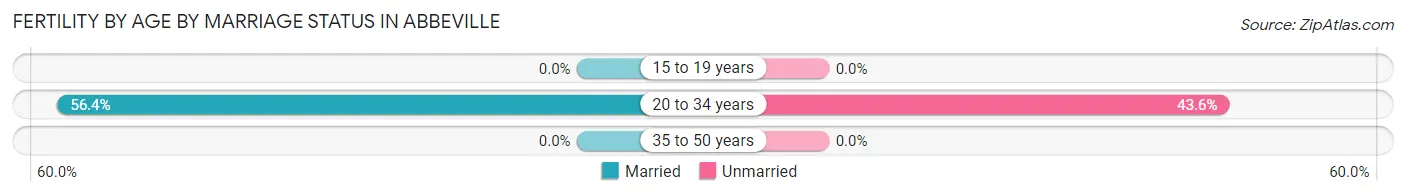
| Age Bracket | Married | Unmarried |
| 15 to 19 years | 0 (0.0%) | 0 (0.0%) |
| 20 to 34 years | 219 (56.4%) | 169 (43.6%) |
| 35 to 50 years | 0 (0.0%) | 0 (0.0%) |
| Total | 219 (56.4%) | 169 (43.6%) |
Fertility by Education in Abbeville
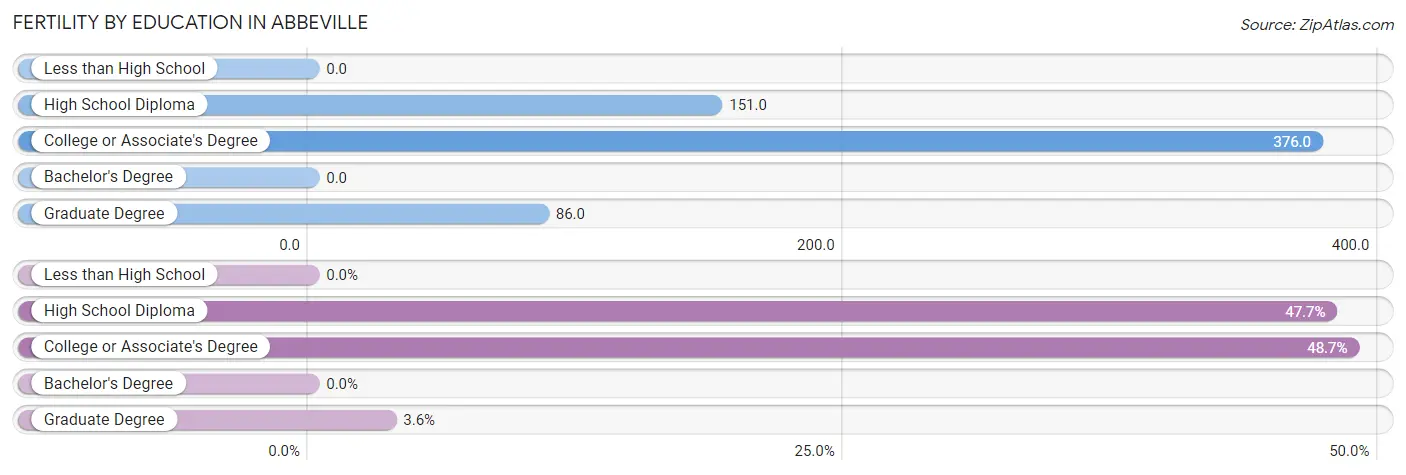
| Educational Attainment | Women with Births | Births / 1,000 Women |
| Less than High School | 0 (0.0%) | 0.0 |
| High School Diploma | 185 (47.7%) | 151.0 |
| College or Associate's Degree | 189 (48.7%) | 376.0 |
| Bachelor's Degree | 0 (0.0%) | 0.0 |
| Graduate Degree | 14 (3.6%) | 86.0 |
| Total | 388 (100.0%) | 131.0 |
Fertility by Education by Marriage Status in Abbeville
43.6% of women with births in Abbeville are unmarried. Women with the educational attainment of graduate degree are most likely to be married with 100.0% of them married at childbirth, while women with the educational attainment of high school diploma are least likely to be married with 71.9% of them unmarried at childbirth.
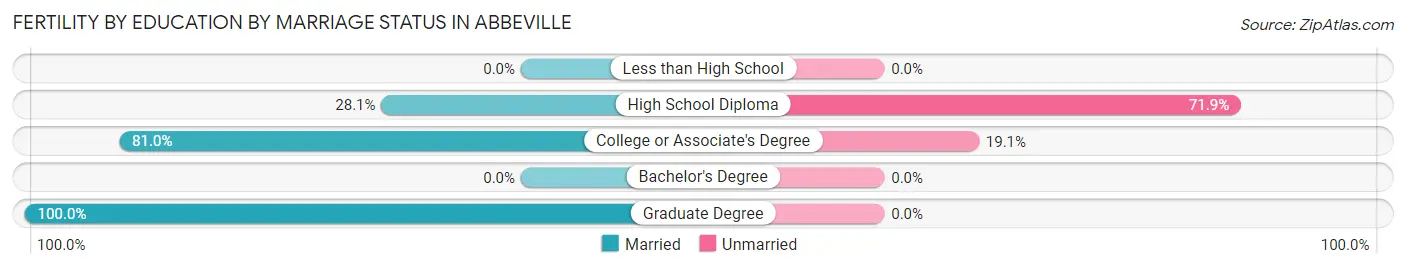
| Educational Attainment | Married | Unmarried |
| Less than High School | 0 (0.0%) | 0 (0.0%) |
| High School Diploma | 52 (28.1%) | 133 (71.9%) |
| College or Associate's Degree | 153 (80.9%) | 36 (19.1%) |
| Bachelor's Degree | 0 (0.0%) | 0 (0.0%) |
| Graduate Degree | 14 (100.0%) | 0 (0.0%) |
| Total | 219 (56.4%) | 169 (43.6%) |
Employment Characteristics in Abbeville
Employment by Class of Employer in Abbeville
Among the 4,390 employed individuals in Abbeville, private company employees (3,170 | 72.2%), local government employees (311 | 7.1%), and self-employed (not incorporated) (307 | 7.0%) make up the most common classes of employment.
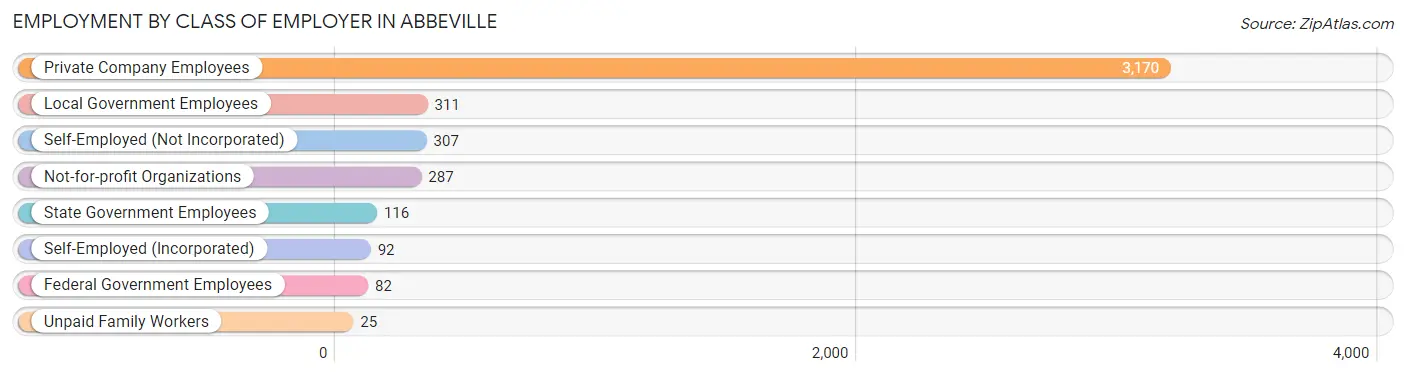
| Employer Class | # Employees | % Employees |
| Private Company Employees | 3,170 | 72.2% |
| Self-Employed (Incorporated) | 92 | 2.1% |
| Self-Employed (Not Incorporated) | 307 | 7.0% |
| Not-for-profit Organizations | 287 | 6.5% |
| Local Government Employees | 311 | 7.1% |
| State Government Employees | 116 | 2.6% |
| Federal Government Employees | 82 | 1.9% |
| Unpaid Family Workers | 25 | 0.6% |
| Total | 4,390 | 100.0% |
Employment Status by Age in Abbeville
According to the labor force statistics for Abbeville, out of the total population over 16 years of age (8,572), 56.1% or 4,809 individuals are in the labor force, with 6.8% or 327 of them unemployed. The age group with the highest labor force participation rate is 35 to 44 years, with 92.3% or 815 individuals in the labor force. Within the labor force, the 25 to 29 years age range has the highest percentage of unemployed individuals, with 22.6% or 99 of them being unemployed.
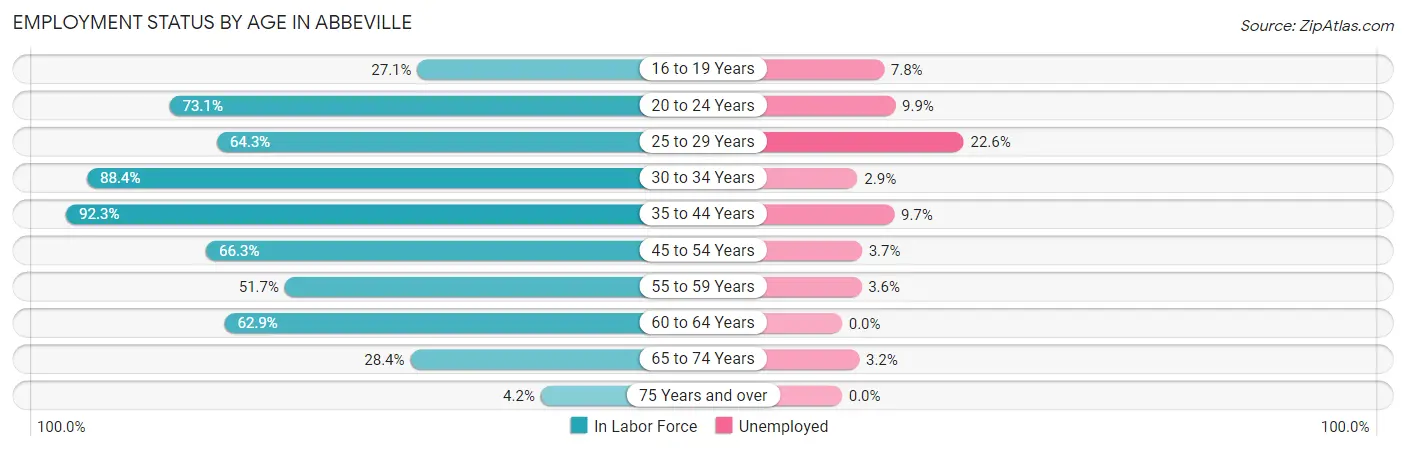
| Age Bracket | In Labor Force | Unemployed |
| 16 to 19 Years | 192 (27.1%) | 15 (7.8%) |
| 20 to 24 Years | 576 (73.1%) | 57 (9.9%) |
| 25 to 29 Years | 438 (64.3%) | 99 (22.6%) |
| 30 to 34 Years | 974 (88.4%) | 28 (2.9%) |
| 35 to 44 Years | 815 (92.3%) | 79 (9.7%) |
| 45 to 54 Years | 729 (66.3%) | 27 (3.7%) |
| 55 to 59 Years | 306 (51.7%) | 11 (3.6%) |
| 60 to 64 Years | 369 (62.9%) | 0 (0.0%) |
| 65 to 74 Years | 376 (28.4%) | 12 (3.2%) |
| 75 Years and over | 34 (4.2%) | 0 (0.0%) |
| Total | 4,809 (56.1%) | 327 (6.8%) |
Employment Status by Educational Attainment in Abbeville
According to labor force statistics for Abbeville, 73.4% of individuals (3,630) out of the total population between 25 and 64 years of age (4,945) are in the labor force, with 6.7% or 243 of them being unemployed. The group with the highest labor force participation rate are those with the educational attainment of bachelor's degree or higher, with 85.8% or 606 individuals in the labor force. Within the labor force, individuals with less than high school education have the highest percentage of unemployment, with 14.8% or 98 of them being unemployed.
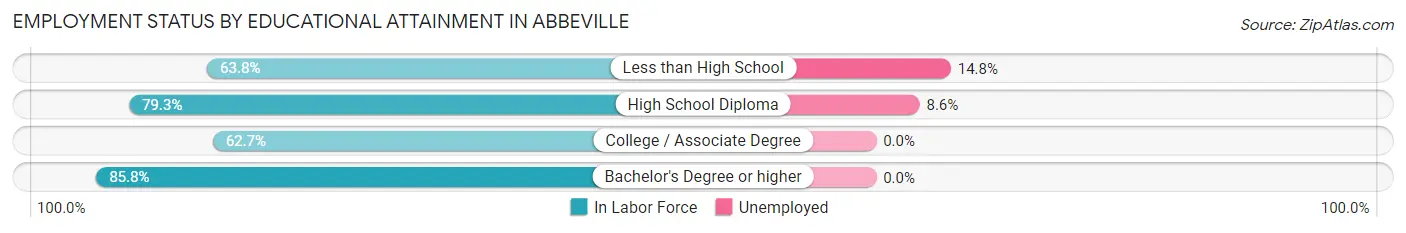
| Educational Attainment | In Labor Force | Unemployed |
| Less than High School | 662 (63.8%) | 153 (14.8%) |
| High School Diploma | 1,695 (79.3%) | 184 (8.6%) |
| College / Associate Degree | 667 (62.7%) | 0 (0.0%) |
| Bachelor's Degree or higher | 606 (85.8%) | 0 (0.0%) |
| Total | 3,630 (73.4%) | 331 (6.7%) |
Employment Occupations by Sex in Abbeville
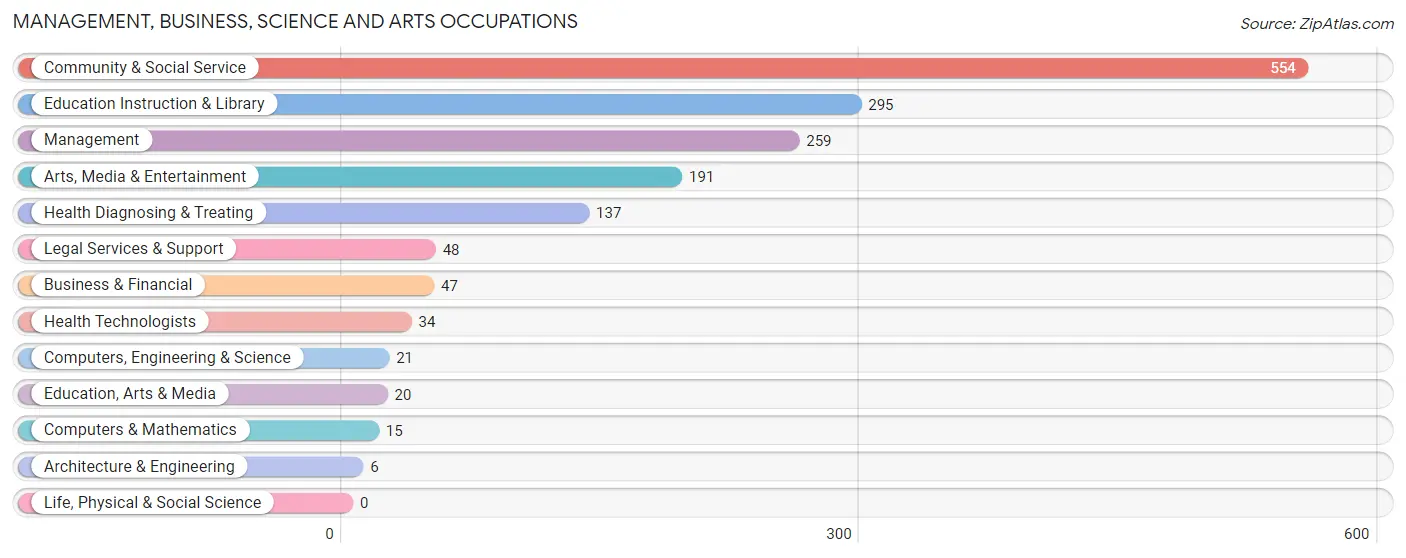
Management, Business, Science and Arts Occupations
The most common Management, Business, Science and Arts occupations in Abbeville are Community & Social Service (554 | 12.4%), Education Instruction & Library (295 | 6.6%), Management (259 | 5.8%), Arts, Media & Entertainment (191 | 4.3%), and Health Diagnosing & Treating (137 | 3.1%).
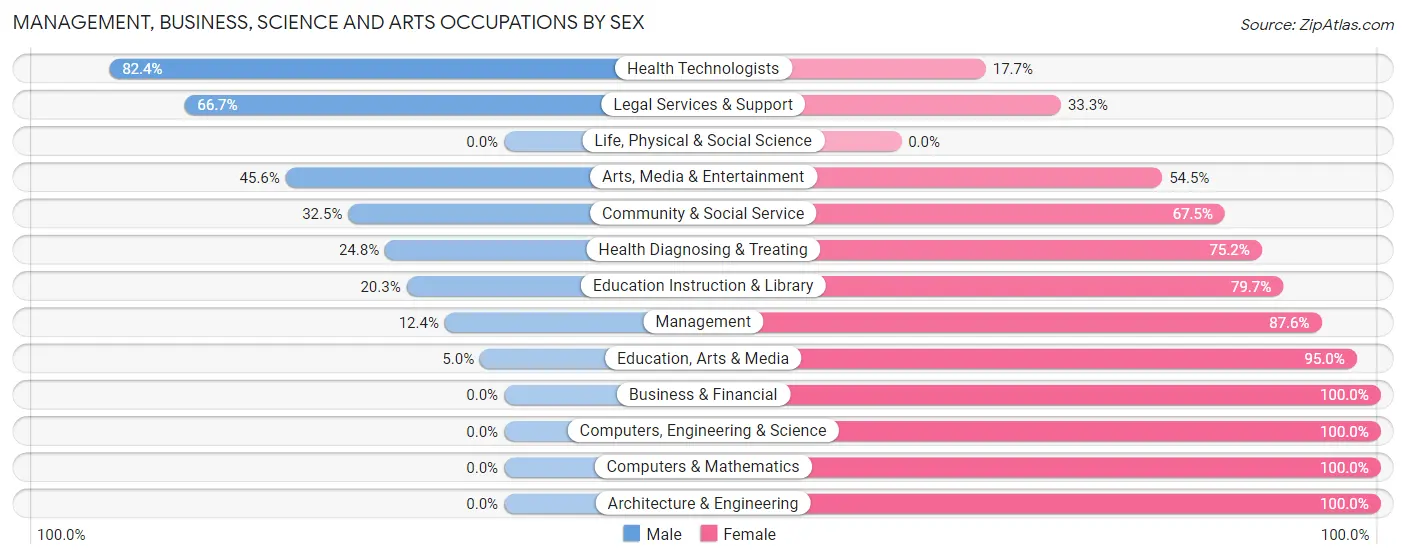
Management, Business, Science and Arts Occupations by Sex
Within the Management, Business, Science and Arts occupations in Abbeville, the most male-oriented occupations are Health Technologists (82.4%), Legal Services & Support (66.7%), and Arts, Media & Entertainment (45.6%), while the most female-oriented occupations are Business & Financial (100.0%), Computers, Engineering & Science (100.0%), and Computers & Mathematics (100.0%).
| Occupation | Male | Female |
| Management | 32 (12.4%) | 227 (87.6%) |
| Business & Financial | 0 (0.0%) | 47 (100.0%) |
| Computers, Engineering & Science | 0 (0.0%) | 21 (100.0%) |
| Computers & Mathematics | 0 (0.0%) | 15 (100.0%) |
| Architecture & Engineering | 0 (0.0%) | 6 (100.0%) |
| Life, Physical & Social Science | 0 (0.0%) | 0 (0.0%) |
| Community & Social Service | 180 (32.5%) | 374 (67.5%) |
| Education, Arts & Media | 1 (5.0%) | 19 (95.0%) |
| Legal Services & Support | 32 (66.7%) | 16 (33.3%) |
| Education Instruction & Library | 60 (20.3%) | 235 (79.7%) |
| Arts, Media & Entertainment | 87 (45.6%) | 104 (54.4%) |
| Health Diagnosing & Treating | 34 (24.8%) | 103 (75.2%) |
| Health Technologists | 28 (82.4%) | 6 (17.6%) |
| Total (Category) | 246 (24.2%) | 772 (75.8%) |
| Total (Overall) | 2,042 (45.6%) | 2,439 (54.4%) |
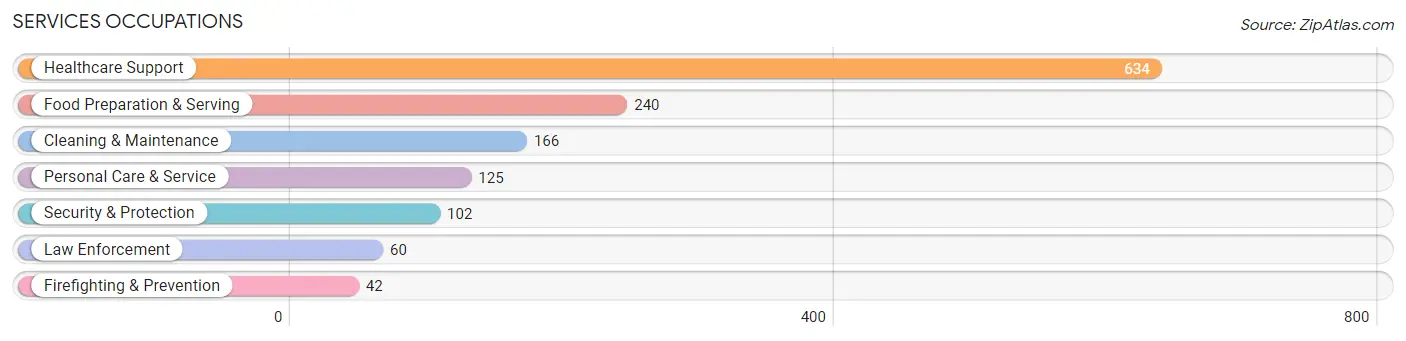
Services Occupations
The most common Services occupations in Abbeville are Healthcare Support (634 | 14.1%), Food Preparation & Serving (240 | 5.4%), Cleaning & Maintenance (166 | 3.7%), Personal Care & Service (125 | 2.8%), and Security & Protection (102 | 2.3%).
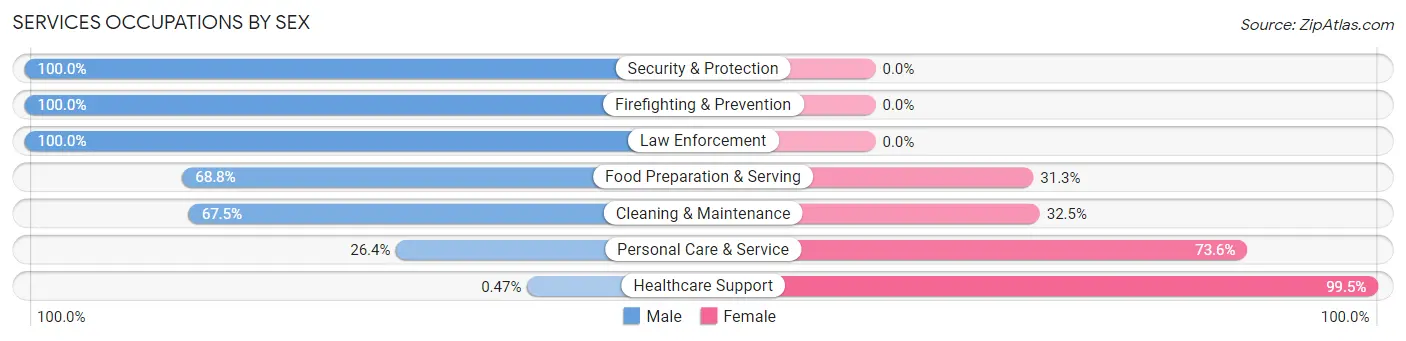
Services Occupations by Sex
Within the Services occupations in Abbeville, the most male-oriented occupations are Security & Protection (100.0%), Firefighting & Prevention (100.0%), and Law Enforcement (100.0%), while the most female-oriented occupations are Healthcare Support (99.5%), Personal Care & Service (73.6%), and Cleaning & Maintenance (32.5%).
| Occupation | Male | Female |
| Healthcare Support | 3 (0.5%) | 631 (99.5%) |
| Security & Protection | 102 (100.0%) | 0 (0.0%) |
| Firefighting & Prevention | 42 (100.0%) | 0 (0.0%) |
| Law Enforcement | 60 (100.0%) | 0 (0.0%) |
| Food Preparation & Serving | 165 (68.8%) | 75 (31.2%) |
| Cleaning & Maintenance | 112 (67.5%) | 54 (32.5%) |
| Personal Care & Service | 33 (26.4%) | 92 (73.6%) |
| Total (Category) | 415 (32.8%) | 852 (67.2%) |
| Total (Overall) | 2,042 (45.6%) | 2,439 (54.4%) |
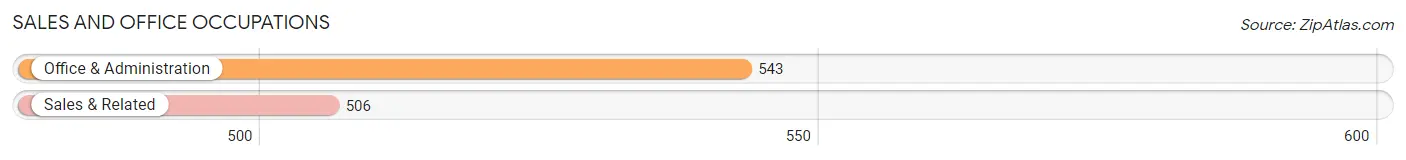
Sales and Office Occupations
The most common Sales and Office occupations in Abbeville are Office & Administration (543 | 12.1%), and Sales & Related (506 | 11.3%).
Sales and Office Occupations by Sex
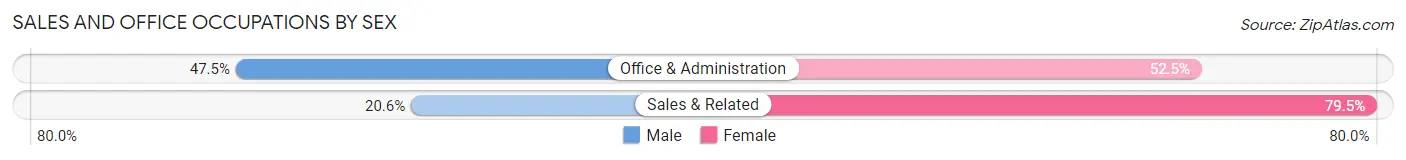
| Occupation | Male | Female |
| Sales & Related | 104 (20.5%) | 402 (79.4%) |
| Office & Administration | 258 (47.5%) | 285 (52.5%) |
| Total (Category) | 362 (34.5%) | 687 (65.5%) |
| Total (Overall) | 2,042 (45.6%) | 2,439 (54.4%) |
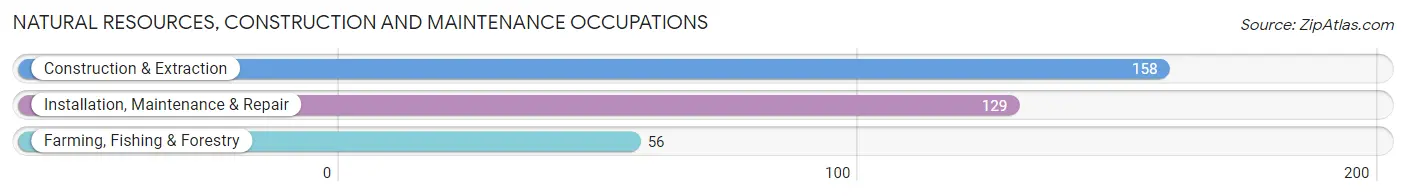
Natural Resources, Construction and Maintenance Occupations
The most common Natural Resources, Construction and Maintenance occupations in Abbeville are Construction & Extraction (158 | 3.5%), Installation, Maintenance & Repair (129 | 2.9%), and Farming, Fishing & Forestry (56 | 1.3%).
Natural Resources, Construction and Maintenance Occupations by Sex
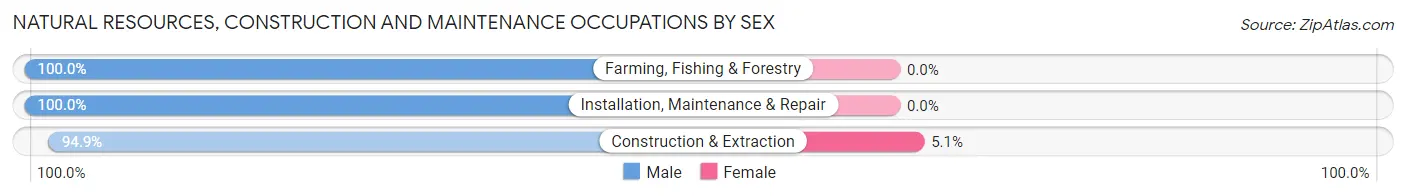
| Occupation | Male | Female |
| Farming, Fishing & Forestry | 56 (100.0%) | 0 (0.0%) |
| Construction & Extraction | 150 (94.9%) | 8 (5.1%) |
| Installation, Maintenance & Repair | 129 (100.0%) | 0 (0.0%) |
| Total (Category) | 335 (97.7%) | 8 (2.3%) |
| Total (Overall) | 2,042 (45.6%) | 2,439 (54.4%) |
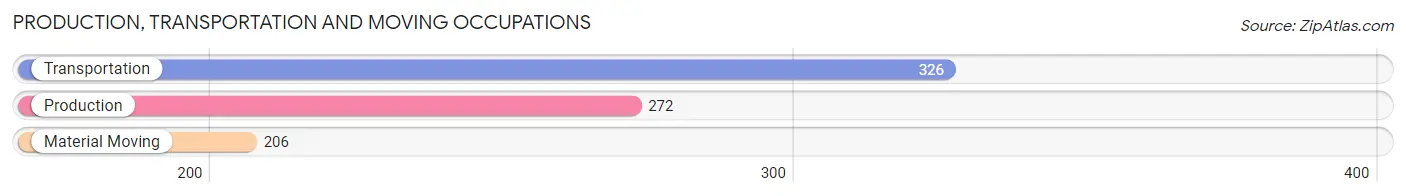
Production, Transportation and Moving Occupations
The most common Production, Transportation and Moving occupations in Abbeville are Transportation (326 | 7.3%), Production (272 | 6.1%), and Material Moving (206 | 4.6%).
Production, Transportation and Moving Occupations by Sex
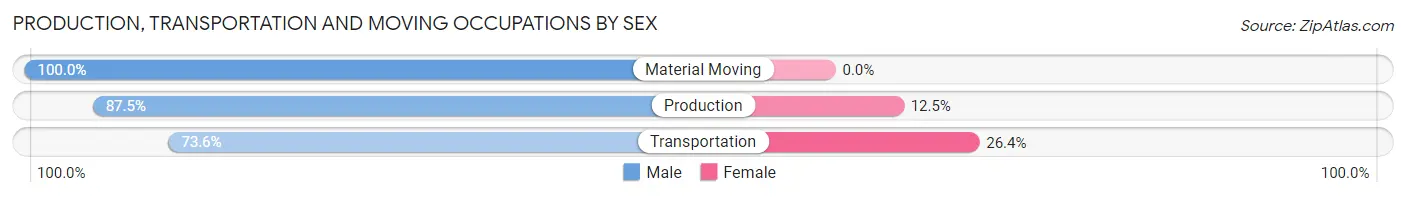
| Occupation | Male | Female |
| Production | 238 (87.5%) | 34 (12.5%) |
| Transportation | 240 (73.6%) | 86 (26.4%) |
| Material Moving | 206 (100.0%) | 0 (0.0%) |
| Total (Category) | 684 (85.1%) | 120 (14.9%) |
| Total (Overall) | 2,042 (45.6%) | 2,439 (54.4%) |
Employment Industries by Sex in Abbeville
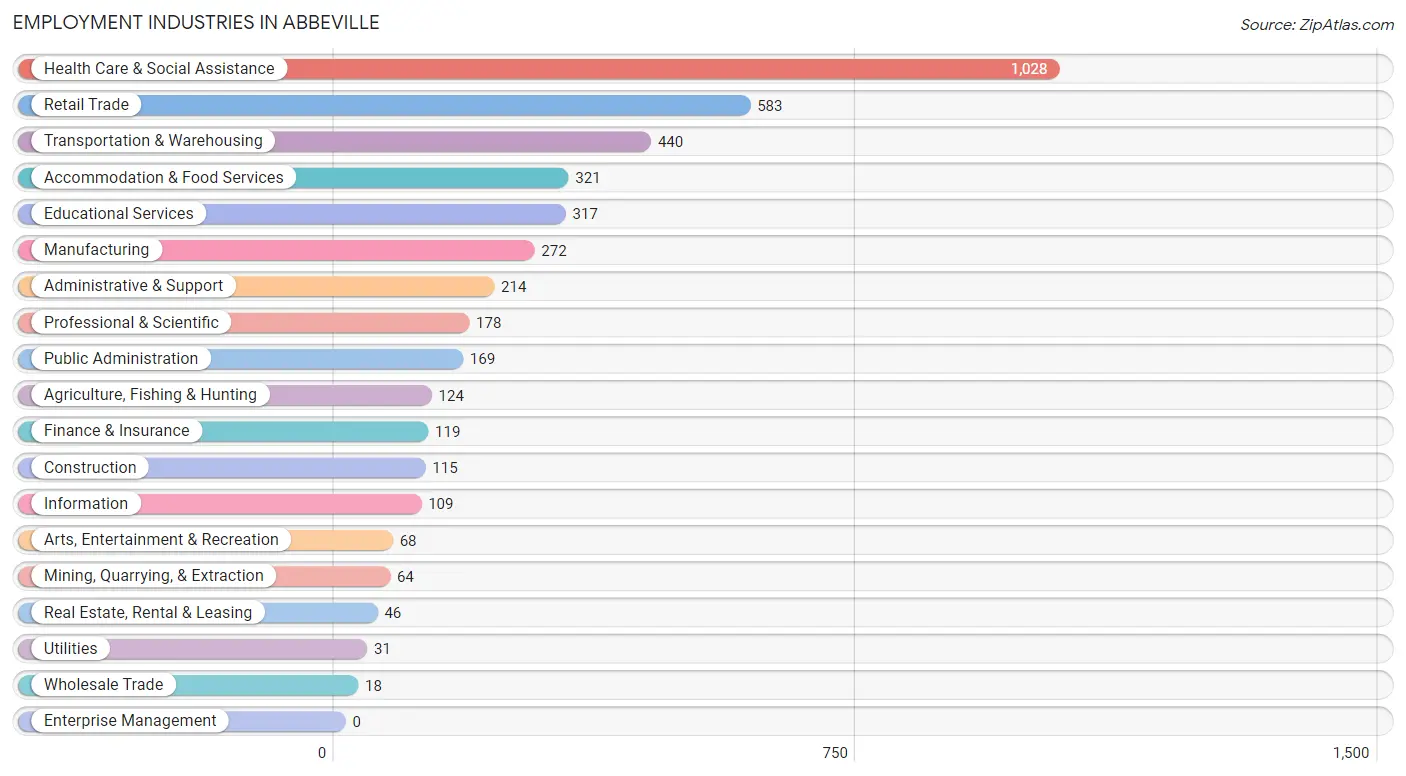
Employment Industries in Abbeville
The major employment industries in Abbeville include Health Care & Social Assistance (1,028 | 22.9%), Retail Trade (583 | 13.0%), Transportation & Warehousing (440 | 9.8%), Accommodation & Food Services (321 | 7.2%), and Educational Services (317 | 7.1%).
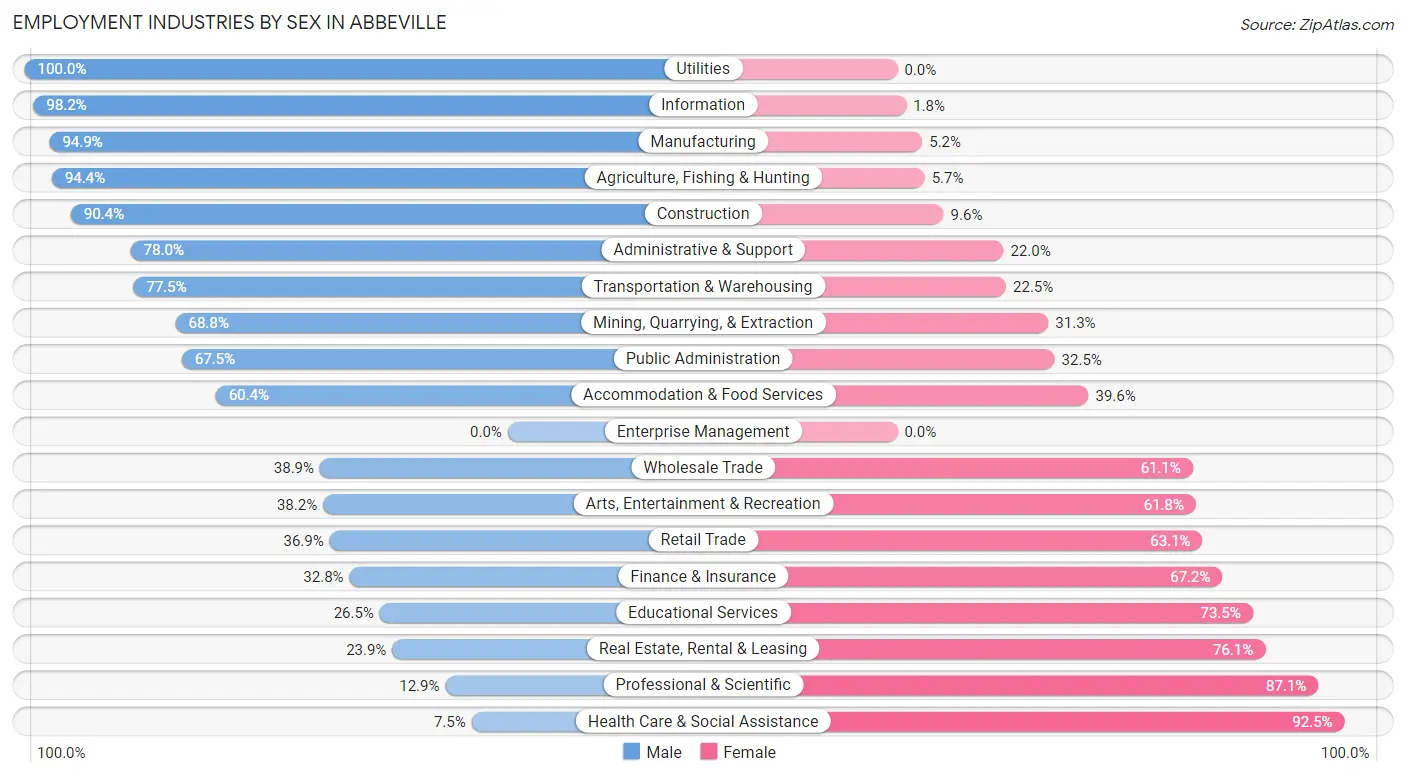
Employment Industries by Sex in Abbeville
The Abbeville industries that see more men than women are Utilities (100.0%), Information (98.2%), and Manufacturing (94.9%), whereas the industries that tend to have a higher number of women are Health Care & Social Assistance (92.5%), Professional & Scientific (87.1%), and Real Estate, Rental & Leasing (76.1%).
| Industry | Male | Female |
| Agriculture, Fishing & Hunting | 117 (94.4%) | 7 (5.7%) |
| Mining, Quarrying, & Extraction | 44 (68.8%) | 20 (31.2%) |
| Construction | 104 (90.4%) | 11 (9.6%) |
| Manufacturing | 258 (94.9%) | 14 (5.1%) |
| Wholesale Trade | 7 (38.9%) | 11 (61.1%) |
| Retail Trade | 215 (36.9%) | 368 (63.1%) |
| Transportation & Warehousing | 341 (77.5%) | 99 (22.5%) |
| Utilities | 31 (100.0%) | 0 (0.0%) |
| Information | 107 (98.2%) | 2 (1.8%) |
| Finance & Insurance | 39 (32.8%) | 80 (67.2%) |
| Real Estate, Rental & Leasing | 11 (23.9%) | 35 (76.1%) |
| Professional & Scientific | 23 (12.9%) | 155 (87.1%) |
| Enterprise Management | 0 (0.0%) | 0 (0.0%) |
| Administrative & Support | 167 (78.0%) | 47 (22.0%) |
| Educational Services | 84 (26.5%) | 233 (73.5%) |
| Health Care & Social Assistance | 77 (7.5%) | 951 (92.5%) |
| Arts, Entertainment & Recreation | 26 (38.2%) | 42 (61.8%) |
| Accommodation & Food Services | 194 (60.4%) | 127 (39.6%) |
| Public Administration | 114 (67.5%) | 55 (32.5%) |
| Total | 2,042 (45.6%) | 2,439 (54.4%) |
Education in Abbeville
School Enrollment in Abbeville
The most common levels of schooling among the 2,620 students in Abbeville are elementary school (852 | 32.5%), high school (612 | 23.4%), and middle school (465 | 17.7%).
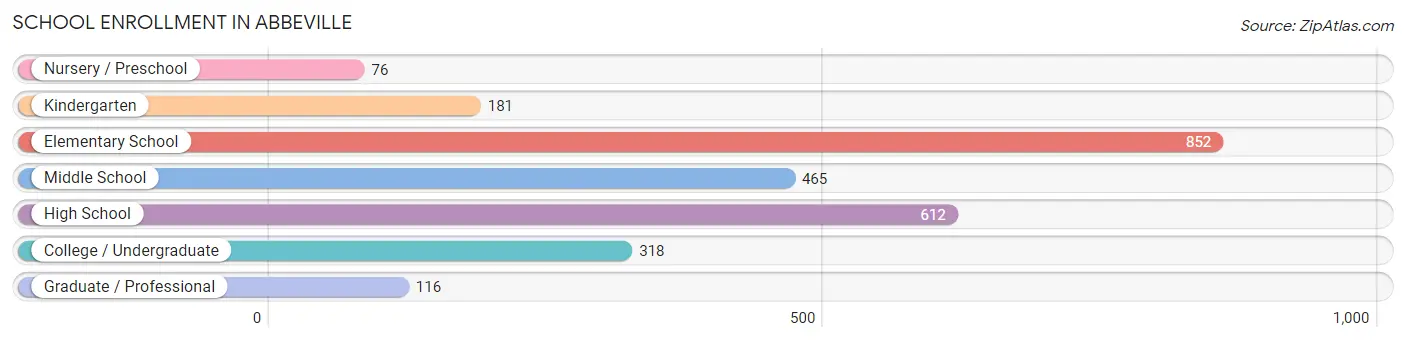
| School Level | # Students | % Students |
| Nursery / Preschool | 76 | 2.9% |
| Kindergarten | 181 | 6.9% |
| Elementary School | 852 | 32.5% |
| Middle School | 465 | 17.7% |
| High School | 612 | 23.4% |
| College / Undergraduate | 318 | 12.1% |
| Graduate / Professional | 116 | 4.4% |
| Total | 2,620 | 100.0% |
School Enrollment by Age by Funding Source in Abbeville
Out of a total of 2,620 students who are enrolled in schools in Abbeville, 325 (12.4%) attend a private institution, while the remaining 2,295 (87.6%) are enrolled in public schools. The age group of 35 years and over has the highest likelihood of being enrolled in private schools, with 69 (44.5% in the age bracket) enrolled. Conversely, the age group of 25 to 34 year olds has the lowest likelihood of being enrolled in a private school, with 48 (98.0% in the age bracket) attending a public institution.
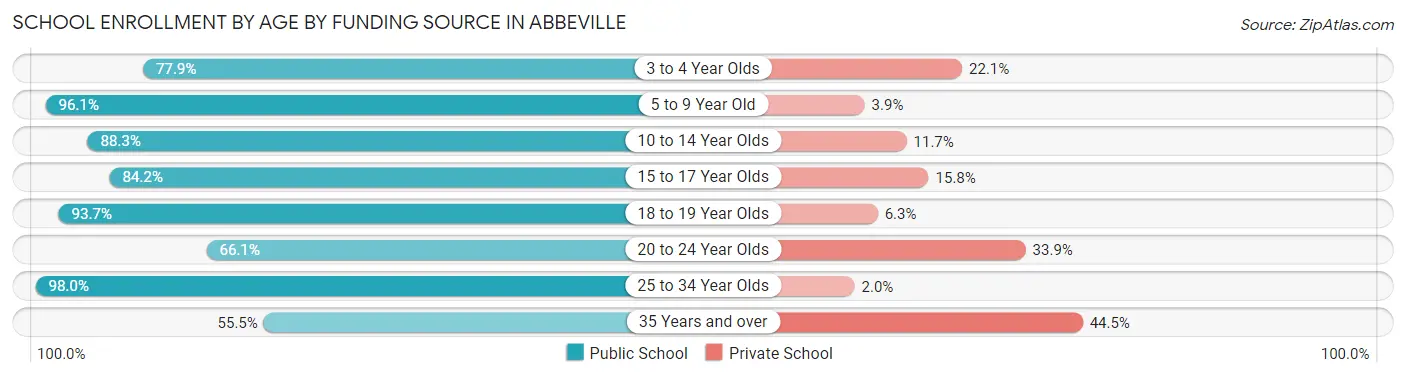
| Age Bracket | Public School | Private School |
| 3 to 4 Year Olds | 53 (77.9%) | 15 (22.1%) |
| 5 to 9 Year Old | 859 (96.1%) | 35 (3.9%) |
| 10 to 14 Year Olds | 580 (88.3%) | 77 (11.7%) |
| 15 to 17 Year Olds | 399 (84.2%) | 75 (15.8%) |
| 18 to 19 Year Olds | 192 (93.7%) | 13 (6.3%) |
| 20 to 24 Year Olds | 78 (66.1%) | 40 (33.9%) |
| 25 to 34 Year Olds | 48 (98.0%) | 1 (2.0%) |
| 35 Years and over | 86 (55.5%) | 69 (44.5%) |
| Total | 2,295 (87.6%) | 325 (12.4%) |
Educational Attainment by Field of Study in Abbeville
Education (266 | 26.8%), business (195 | 19.7%), science & technology (150 | 15.1%), arts & humanities (77 | 7.8%), and communications (74 | 7.5%) are the most common fields of study among 991 individuals in Abbeville who have obtained a bachelor's degree or higher.
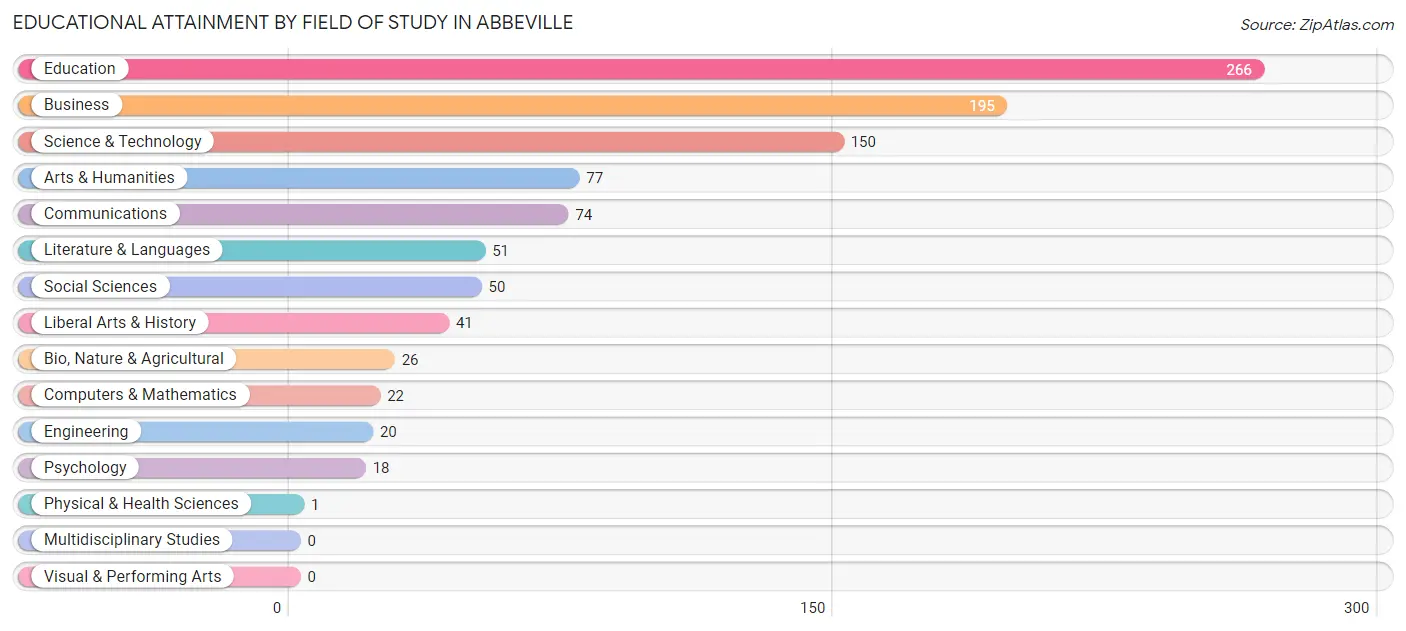
| Field of Study | # Graduates | % Graduates |
| Computers & Mathematics | 22 | 2.2% |
| Bio, Nature & Agricultural | 26 | 2.6% |
| Physical & Health Sciences | 1 | 0.1% |
| Psychology | 18 | 1.8% |
| Social Sciences | 50 | 5.1% |
| Engineering | 20 | 2.0% |
| Multidisciplinary Studies | 0 | 0.0% |
| Science & Technology | 150 | 15.1% |
| Business | 195 | 19.7% |
| Education | 266 | 26.8% |
| Literature & Languages | 51 | 5.1% |
| Liberal Arts & History | 41 | 4.1% |
| Visual & Performing Arts | 0 | 0.0% |
| Communications | 74 | 7.5% |
| Arts & Humanities | 77 | 7.8% |
| Total | 991 | 100.0% |
Transportation & Commute in Abbeville
Vehicle Availability by Sex in Abbeville
The most prevalent vehicle ownership categories in Abbeville are males with 2 vehicles (1,092, accounting for 55.6%) and females with 2 vehicles (747, making up 45.0%).
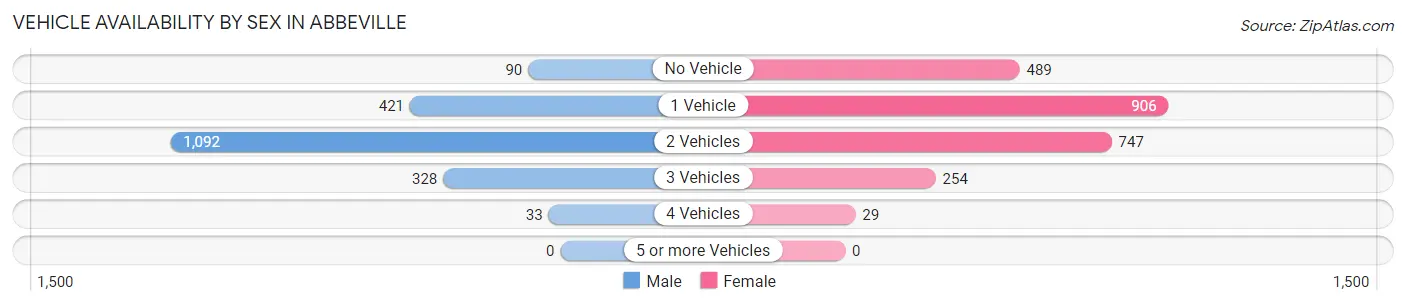
| Vehicles Available | Male | Female |
| No Vehicle | 90 (4.6%) | 489 (20.2%) |
| 1 Vehicle | 421 (21.4%) | 906 (37.4%) |
| 2 Vehicles | 1,092 (55.6%) | 747 (30.8%) |
| 3 Vehicles | 328 (16.7%) | 254 (10.5%) |
| 4 Vehicles | 33 (1.7%) | 29 (1.2%) |
| 5 or more Vehicles | 0 (0.0%) | 0 (0.0%) |
| Total | 1,964 (100.0%) | 2,425 (100.0%) |
Commute Time in Abbeville
The most frequently occuring commute durations in Abbeville are 5 to 9 minutes (1,145 commuters, 27.4%), 30 to 34 minutes (766 commuters, 18.3%), and 10 to 14 minutes (391 commuters, 9.3%).
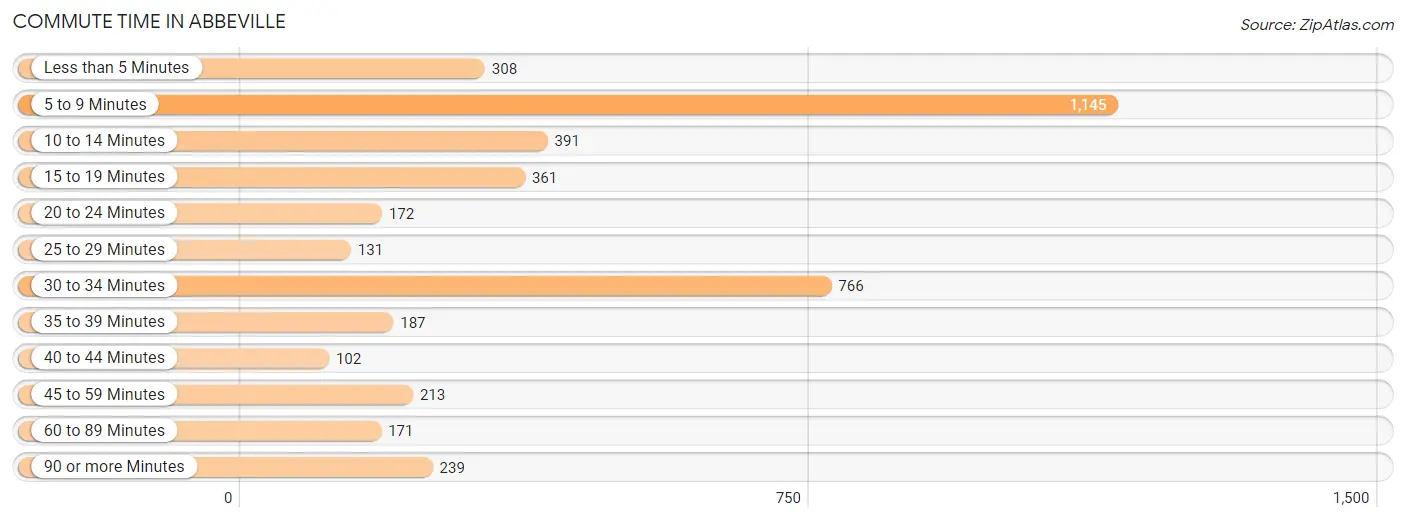
| Commute Time | # Commuters | % Commuters |
| Less than 5 Minutes | 308 | 7.4% |
| 5 to 9 Minutes | 1,145 | 27.4% |
| 10 to 14 Minutes | 391 | 9.3% |
| 15 to 19 Minutes | 361 | 8.6% |
| 20 to 24 Minutes | 172 | 4.1% |
| 25 to 29 Minutes | 131 | 3.1% |
| 30 to 34 Minutes | 766 | 18.3% |
| 35 to 39 Minutes | 187 | 4.5% |
| 40 to 44 Minutes | 102 | 2.4% |
| 45 to 59 Minutes | 213 | 5.1% |
| 60 to 89 Minutes | 171 | 4.1% |
| 90 or more Minutes | 239 | 5.7% |
Commute Time by Sex in Abbeville
The most common commute times in Abbeville are 30 to 34 minutes (486 commuters, 24.9%) for males and 5 to 9 minutes (763 commuters, 34.2%) for females.
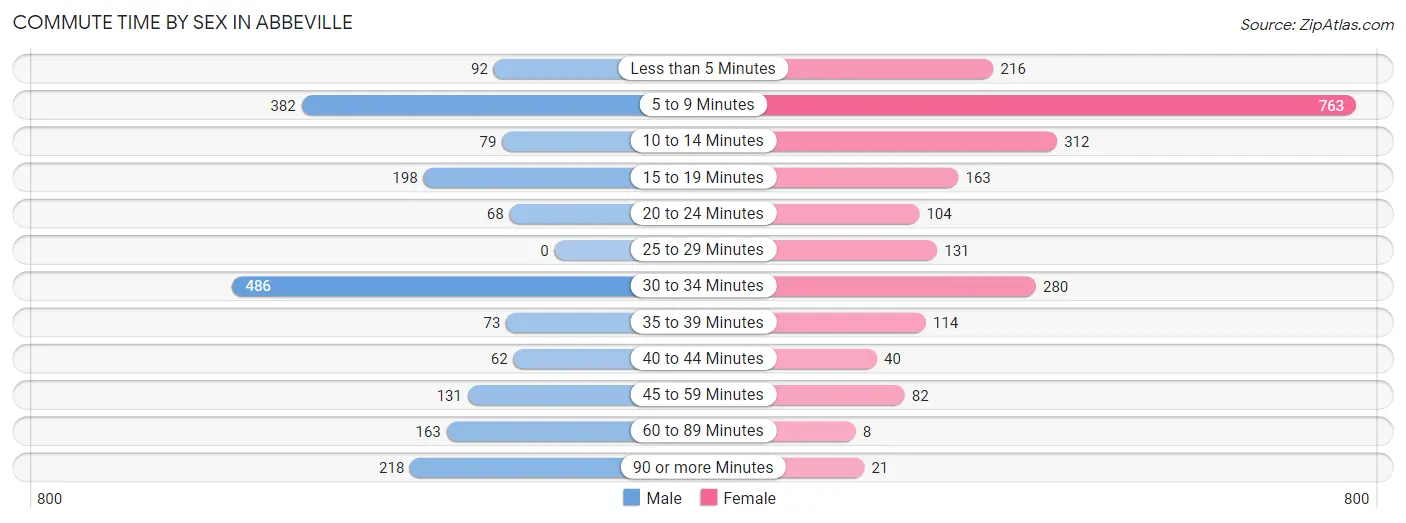
| Commute Time | Male | Female |
| Less than 5 Minutes | 92 (4.7%) | 216 (9.7%) |
| 5 to 9 Minutes | 382 (19.6%) | 763 (34.2%) |
| 10 to 14 Minutes | 79 (4.1%) | 312 (14.0%) |
| 15 to 19 Minutes | 198 (10.1%) | 163 (7.3%) |
| 20 to 24 Minutes | 68 (3.5%) | 104 (4.7%) |
| 25 to 29 Minutes | 0 (0.0%) | 131 (5.9%) |
| 30 to 34 Minutes | 486 (24.9%) | 280 (12.5%) |
| 35 to 39 Minutes | 73 (3.7%) | 114 (5.1%) |
| 40 to 44 Minutes | 62 (3.2%) | 40 (1.8%) |
| 45 to 59 Minutes | 131 (6.7%) | 82 (3.7%) |
| 60 to 89 Minutes | 163 (8.4%) | 8 (0.4%) |
| 90 or more Minutes | 218 (11.2%) | 21 (0.9%) |
Time of Departure to Work by Sex in Abbeville
The most frequent times of departure to work in Abbeville are 12:00 AM to 4:59 AM (370, 19.0%) for males and 12:00 PM to 3:59 PM (395, 17.7%) for females.
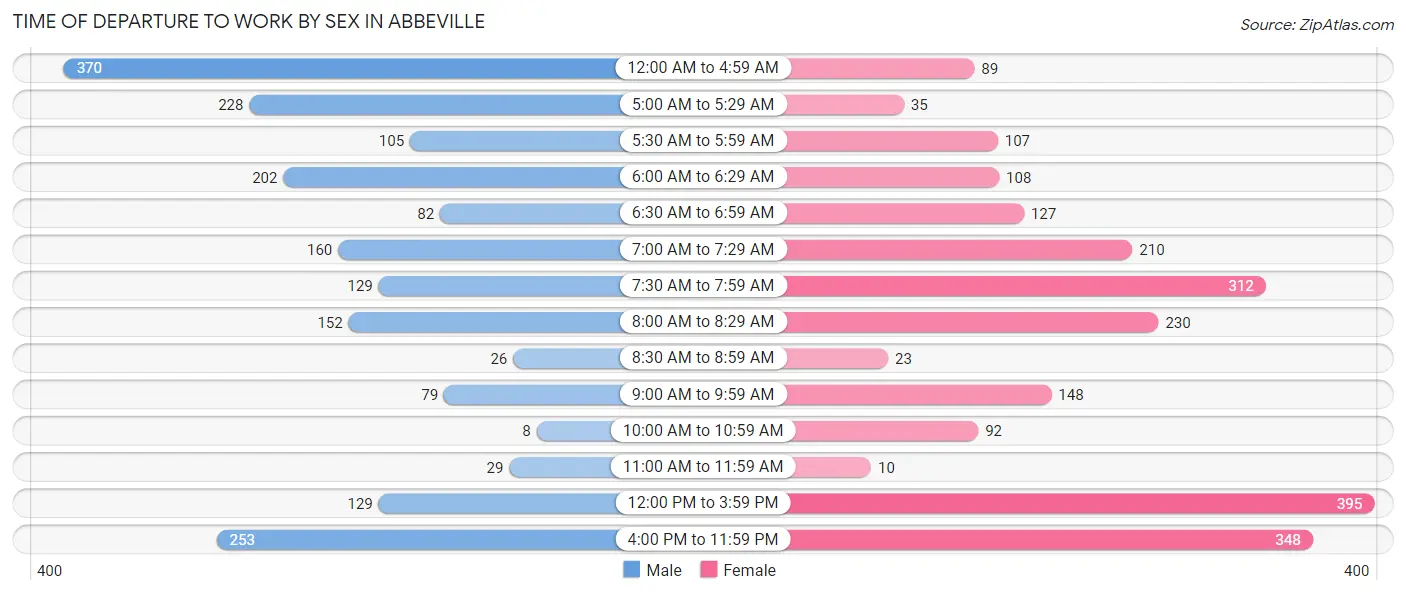
| Time of Departure | Male | Female |
| 12:00 AM to 4:59 AM | 370 (19.0%) | 89 (4.0%) |
| 5:00 AM to 5:29 AM | 228 (11.7%) | 35 (1.6%) |
| 5:30 AM to 5:59 AM | 105 (5.4%) | 107 (4.8%) |
| 6:00 AM to 6:29 AM | 202 (10.3%) | 108 (4.8%) |
| 6:30 AM to 6:59 AM | 82 (4.2%) | 127 (5.7%) |
| 7:00 AM to 7:29 AM | 160 (8.2%) | 210 (9.4%) |
| 7:30 AM to 7:59 AM | 129 (6.6%) | 312 (14.0%) |
| 8:00 AM to 8:29 AM | 152 (7.8%) | 230 (10.3%) |
| 8:30 AM to 8:59 AM | 26 (1.3%) | 23 (1.0%) |
| 9:00 AM to 9:59 AM | 79 (4.1%) | 148 (6.6%) |
| 10:00 AM to 10:59 AM | 8 (0.4%) | 92 (4.1%) |
| 11:00 AM to 11:59 AM | 29 (1.5%) | 10 (0.4%) |
| 12:00 PM to 3:59 PM | 129 (6.6%) | 395 (17.7%) |
| 4:00 PM to 11:59 PM | 253 (13.0%) | 348 (15.6%) |
| Total | 1,952 (100.0%) | 2,234 (100.0%) |
Housing Occupancy in Abbeville
Occupancy by Ownership in Abbeville
Of the total 4,522 dwellings in Abbeville, owner-occupied units account for 2,435 (53.8%), while renter-occupied units make up 2,087 (46.2%).
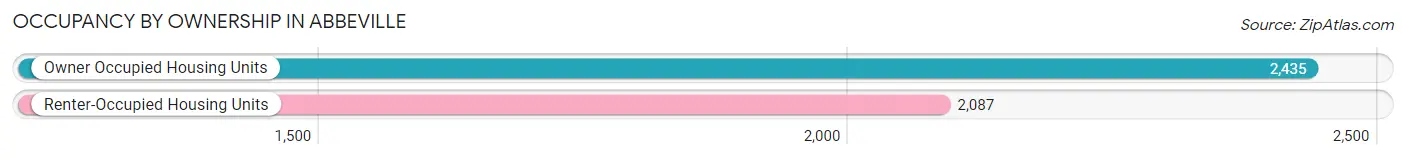
| Occupancy | # Housing Units | % Housing Units |
| Owner Occupied Housing Units | 2,435 | 53.8% |
| Renter-Occupied Housing Units | 2,087 | 46.2% |
| Total Occupied Housing Units | 4,522 | 100.0% |
Occupancy by Household Size in Abbeville
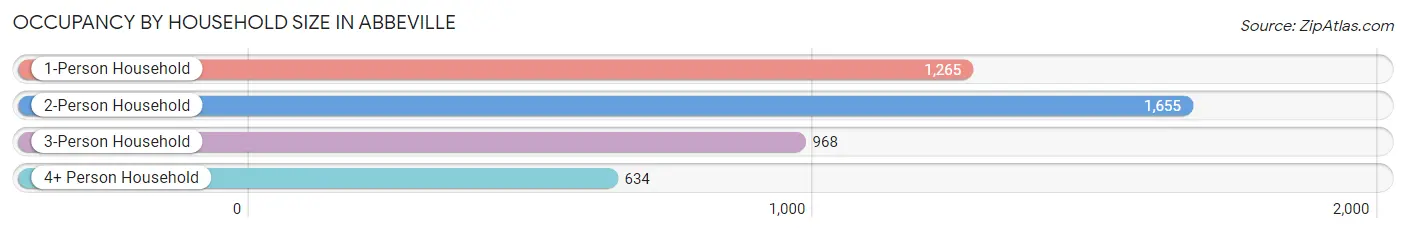
| Household Size | # Housing Units | % Housing Units |
| 1-Person Household | 1,265 | 28.0% |
| 2-Person Household | 1,655 | 36.6% |
| 3-Person Household | 968 | 21.4% |
| 4+ Person Household | 634 | 14.0% |
| Total Housing Units | 4,522 | 100.0% |
Occupancy by Ownership by Household Size in Abbeville
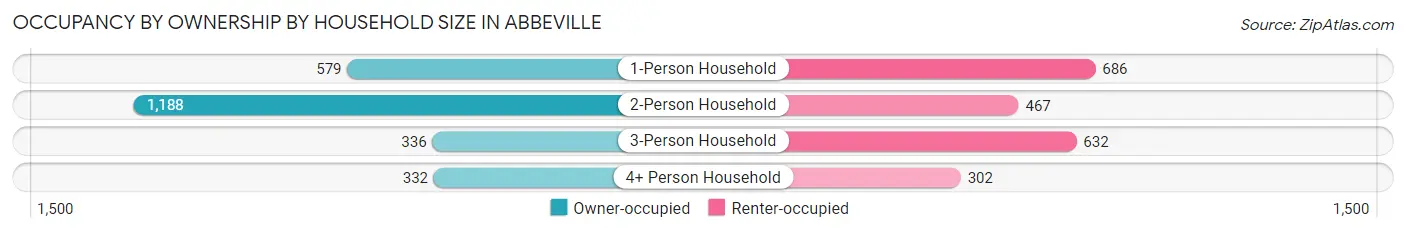
| Household Size | Owner-occupied | Renter-occupied |
| 1-Person Household | 579 (45.8%) | 686 (54.2%) |
| 2-Person Household | 1,188 (71.8%) | 467 (28.2%) |
| 3-Person Household | 336 (34.7%) | 632 (65.3%) |
| 4+ Person Household | 332 (52.4%) | 302 (47.6%) |
| Total Housing Units | 2,435 (53.8%) | 2,087 (46.2%) |
Occupancy by Educational Attainment in Abbeville
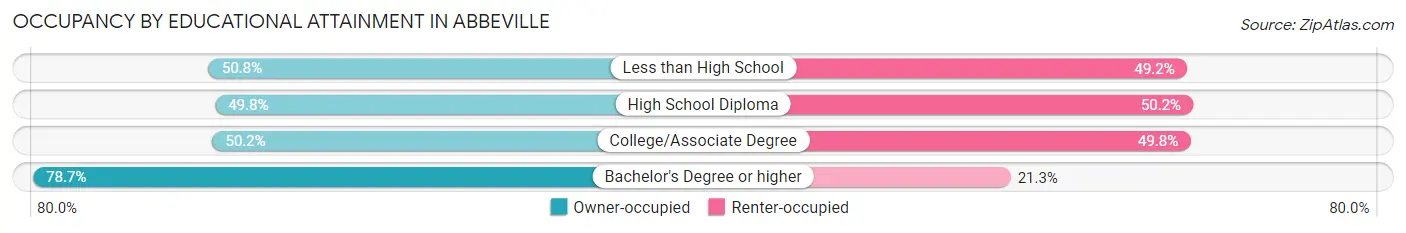
| Household Size | Owner-occupied | Renter-occupied |
| Less than High School | 390 (50.8%) | 378 (49.2%) |
| High School Diploma | 1,018 (49.8%) | 1,028 (50.2%) |
| College/Associate Degree | 559 (50.2%) | 554 (49.8%) |
| Bachelor's Degree or higher | 468 (78.7%) | 127 (21.3%) |
Occupancy by Age of Householder in Abbeville
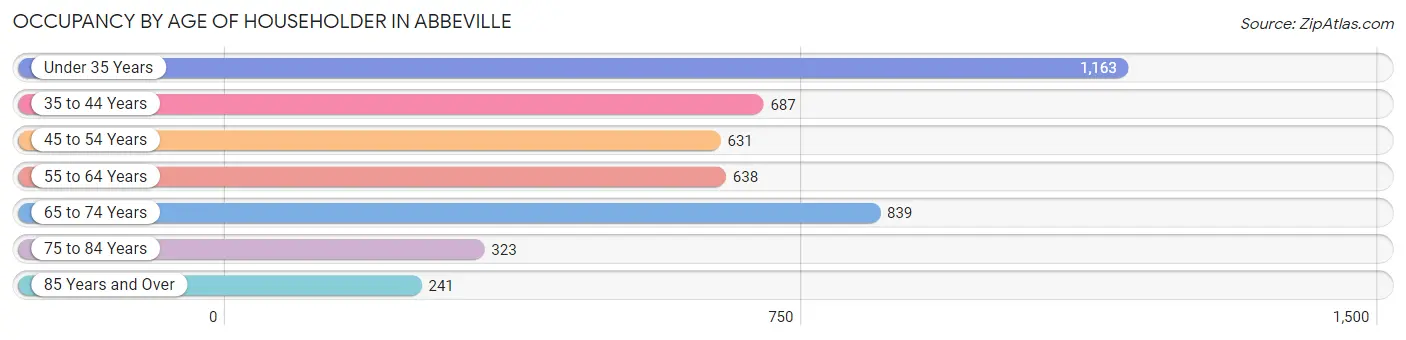
| Age Bracket | # Households | % Households |
| Under 35 Years | 1,163 | 25.7% |
| 35 to 44 Years | 687 | 15.2% |
| 45 to 54 Years | 631 | 14.0% |
| 55 to 64 Years | 638 | 14.1% |
| 65 to 74 Years | 839 | 18.5% |
| 75 to 84 Years | 323 | 7.1% |
| 85 Years and Over | 241 | 5.3% |
| Total | 4,522 | 100.0% |
Housing Finances in Abbeville
Median Income by Occupancy in Abbeville
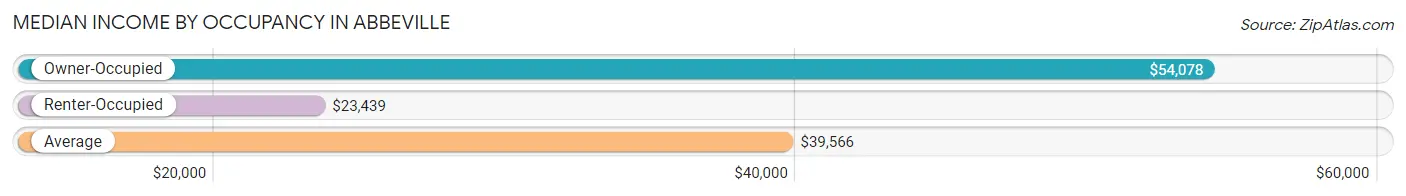
| Occupancy Type | # Households | Median Income |
| Owner-Occupied | 2,435 (53.8%) | $54,078 |
| Renter-Occupied | 2,087 (46.2%) | $23,439 |
| Average | 4,522 (100.0%) | $39,566 |
Occupancy by Householder Income Bracket in Abbeville
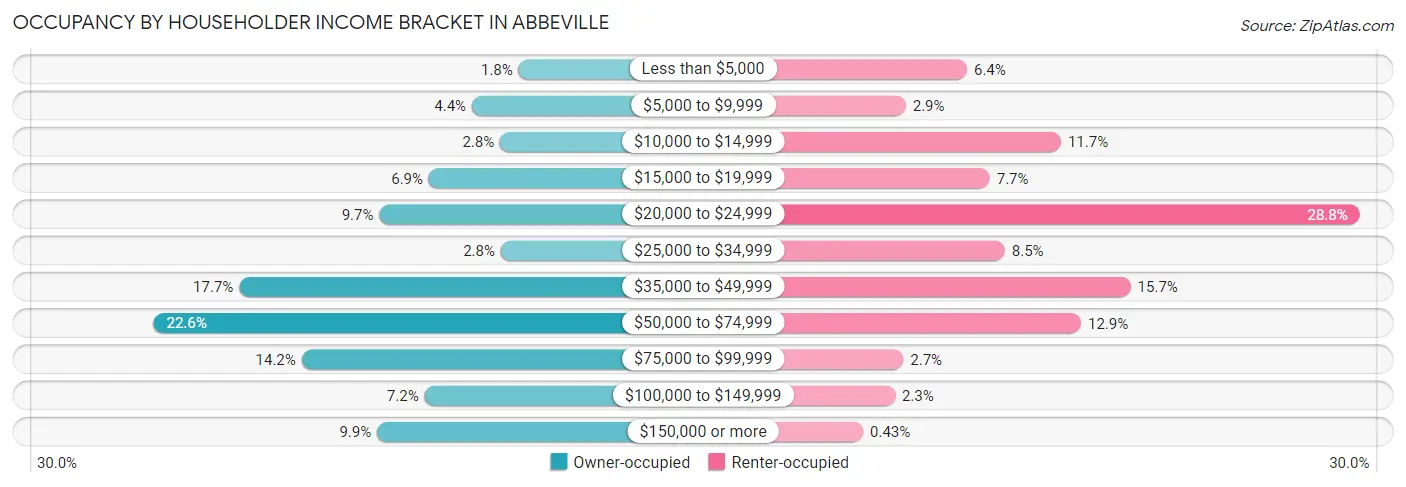
| Income Bracket | Owner-occupied | Renter-occupied |
| Less than $5,000 | 43 (1.8%) | 133 (6.4%) |
| $5,000 to $9,999 | 108 (4.4%) | 60 (2.9%) |
| $10,000 to $14,999 | 69 (2.8%) | 245 (11.7%) |
| $15,000 to $19,999 | 168 (6.9%) | 160 (7.7%) |
| $20,000 to $24,999 | 237 (9.7%) | 601 (28.8%) |
| $25,000 to $34,999 | 68 (2.8%) | 178 (8.5%) |
| $35,000 to $49,999 | 432 (17.7%) | 328 (15.7%) |
| $50,000 to $74,999 | 551 (22.6%) | 269 (12.9%) |
| $75,000 to $99,999 | 345 (14.2%) | 57 (2.7%) |
| $100,000 to $149,999 | 174 (7.1%) | 47 (2.2%) |
| $150,000 or more | 240 (9.9%) | 9 (0.4%) |
| Total | 2,435 (100.0%) | 2,087 (100.0%) |
Monthly Housing Cost Tiers in Abbeville
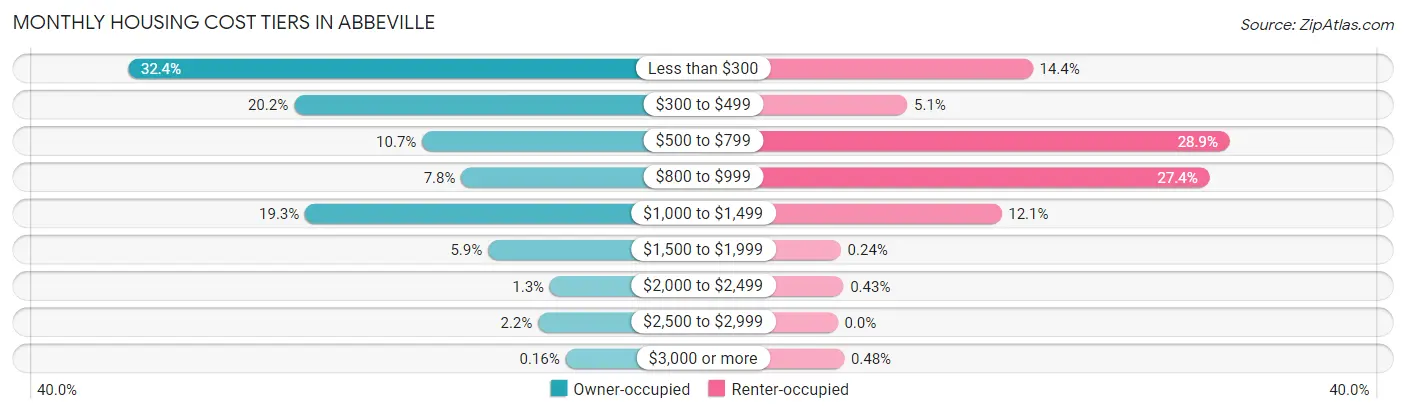
| Monthly Cost | Owner-occupied | Renter-occupied |
| Less than $300 | 789 (32.4%) | 300 (14.4%) |
| $300 to $499 | 491 (20.2%) | 107 (5.1%) |
| $500 to $799 | 261 (10.7%) | 603 (28.9%) |
| $800 to $999 | 191 (7.8%) | 572 (27.4%) |
| $1,000 to $1,499 | 471 (19.3%) | 252 (12.1%) |
| $1,500 to $1,999 | 143 (5.9%) | 5 (0.2%) |
| $2,000 to $2,499 | 32 (1.3%) | 9 (0.4%) |
| $2,500 to $2,999 | 53 (2.2%) | 0 (0.0%) |
| $3,000 or more | 4 (0.2%) | 10 (0.5%) |
| Total | 2,435 (100.0%) | 2,087 (100.0%) |
Physical Housing Characteristics in Abbeville
Housing Structures in Abbeville
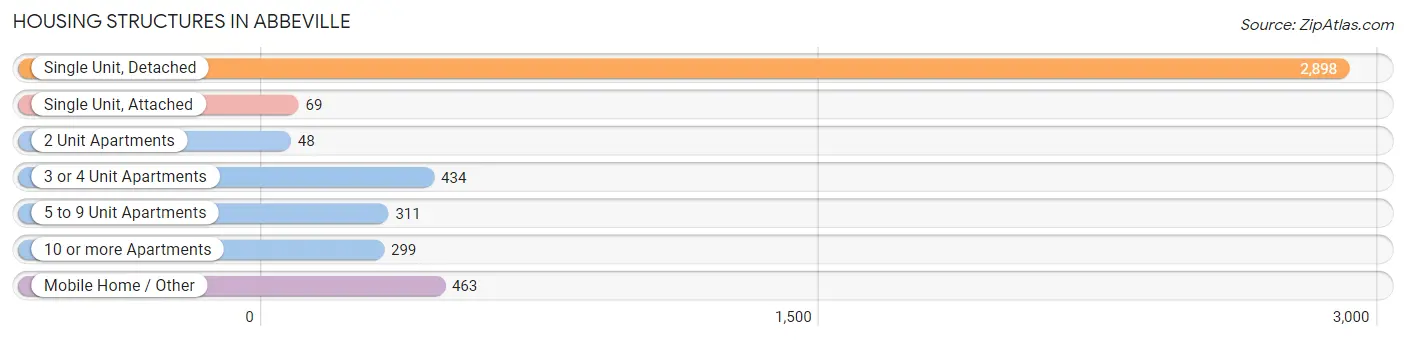
| Structure Type | # Housing Units | % Housing Units |
| Single Unit, Detached | 2,898 | 64.1% |
| Single Unit, Attached | 69 | 1.5% |
| 2 Unit Apartments | 48 | 1.1% |
| 3 or 4 Unit Apartments | 434 | 9.6% |
| 5 to 9 Unit Apartments | 311 | 6.9% |
| 10 or more Apartments | 299 | 6.6% |
| Mobile Home / Other | 463 | 10.2% |
| Total | 4,522 | 100.0% |
Housing Structures by Occupancy in Abbeville
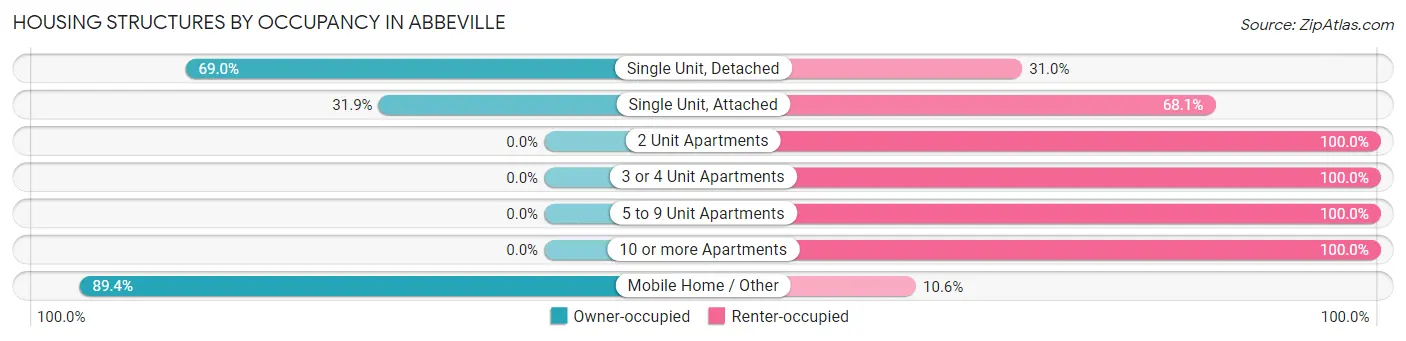
| Structure Type | Owner-occupied | Renter-occupied |
| Single Unit, Detached | 1,999 (69.0%) | 899 (31.0%) |
| Single Unit, Attached | 22 (31.9%) | 47 (68.1%) |
| 2 Unit Apartments | 0 (0.0%) | 48 (100.0%) |
| 3 or 4 Unit Apartments | 0 (0.0%) | 434 (100.0%) |
| 5 to 9 Unit Apartments | 0 (0.0%) | 311 (100.0%) |
| 10 or more Apartments | 0 (0.0%) | 299 (100.0%) |
| Mobile Home / Other | 414 (89.4%) | 49 (10.6%) |
| Total | 2,435 (53.8%) | 2,087 (46.2%) |
Housing Structures by Number of Rooms in Abbeville
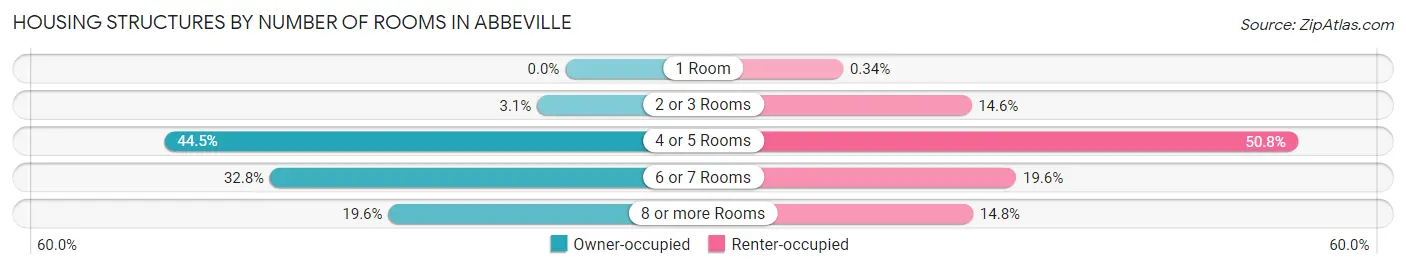
| Number of Rooms | Owner-occupied | Renter-occupied |
| 1 Room | 0 (0.0%) | 7 (0.3%) |
| 2 or 3 Rooms | 76 (3.1%) | 304 (14.6%) |
| 4 or 5 Rooms | 1,083 (44.5%) | 1,060 (50.8%) |
| 6 or 7 Rooms | 798 (32.8%) | 408 (19.6%) |
| 8 or more Rooms | 478 (19.6%) | 308 (14.8%) |
| Total | 2,435 (100.0%) | 2,087 (100.0%) |
Housing Structure by Heating Type in Abbeville
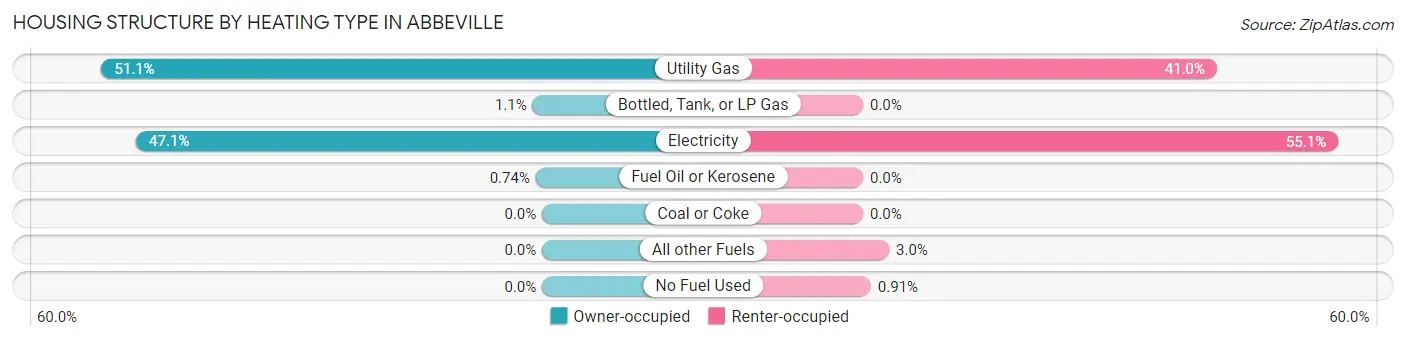
| Heating Type | Owner-occupied | Renter-occupied |
| Utility Gas | 1,244 (51.1%) | 856 (41.0%) |
| Bottled, Tank, or LP Gas | 27 (1.1%) | 0 (0.0%) |
| Electricity | 1,146 (47.1%) | 1,149 (55.1%) |
| Fuel Oil or Kerosene | 18 (0.7%) | 0 (0.0%) |
| Coal or Coke | 0 (0.0%) | 0 (0.0%) |
| All other Fuels | 0 (0.0%) | 63 (3.0%) |
| No Fuel Used | 0 (0.0%) | 19 (0.9%) |
| Total | 2,435 (100.0%) | 2,087 (100.0%) |
Household Vehicle Usage in Abbeville
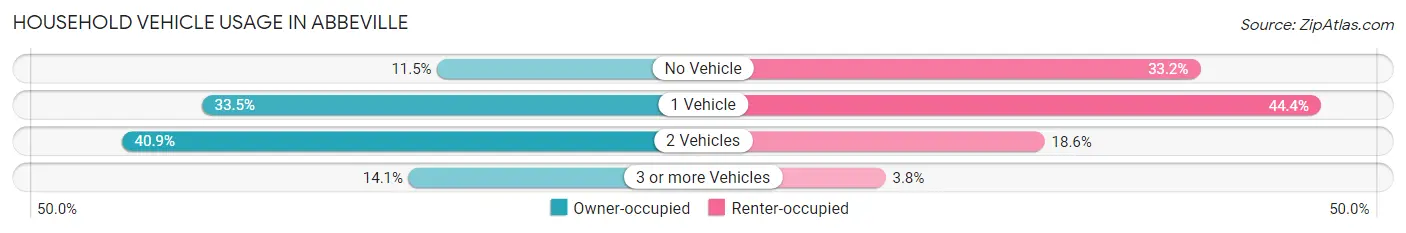
| Vehicles per Household | Owner-occupied | Renter-occupied |
| No Vehicle | 279 (11.5%) | 692 (33.2%) |
| 1 Vehicle | 815 (33.5%) | 927 (44.4%) |
| 2 Vehicles | 997 (40.9%) | 389 (18.6%) |
| 3 or more Vehicles | 344 (14.1%) | 79 (3.8%) |
| Total | 2,435 (100.0%) | 2,087 (100.0%) |
Real Estate & Mortgages in Abbeville
Real Estate and Mortgage Overview in Abbeville
| Characteristic | Without Mortgage | With Mortgage |
| Housing Units | 1,581 | 854 |
| Median Property Value | $81,700 | $133,600 |
| Median Household Income | $44,507 | $163 |
| Monthly Housing Costs | $301 | $4 |
| Real Estate Taxes | $199 | $159 |
Property Value by Mortgage Status in Abbeville
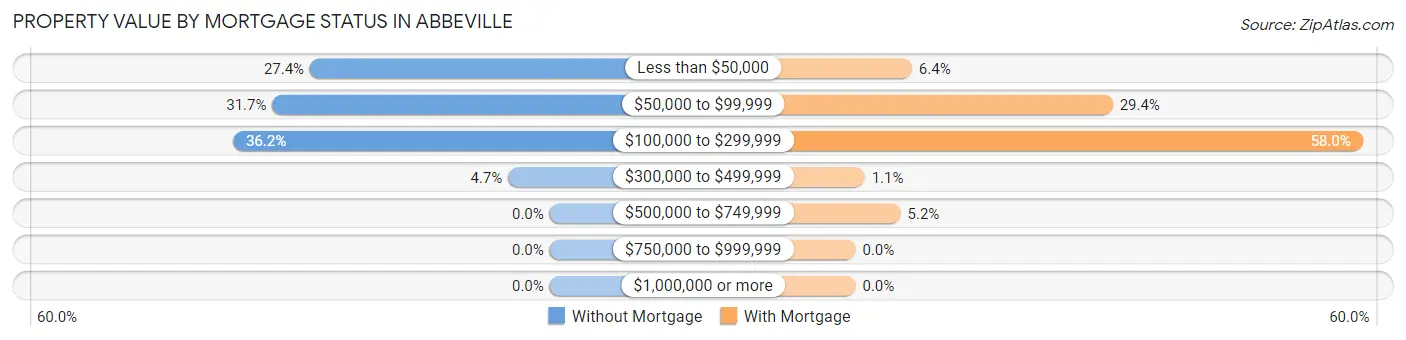
| Property Value | Without Mortgage | With Mortgage |
| Less than $50,000 | 433 (27.4%) | 55 (6.4%) |
| $50,000 to $99,999 | 501 (31.7%) | 251 (29.4%) |
| $100,000 to $299,999 | 572 (36.2%) | 495 (58.0%) |
| $300,000 to $499,999 | 75 (4.7%) | 9 (1.1%) |
| $500,000 to $749,999 | 0 (0.0%) | 44 (5.1%) |
| $750,000 to $999,999 | 0 (0.0%) | 0 (0.0%) |
| $1,000,000 or more | 0 (0.0%) | 0 (0.0%) |
| Total | 1,581 (100.0%) | 854 (100.0%) |
Household Income by Mortgage Status in Abbeville
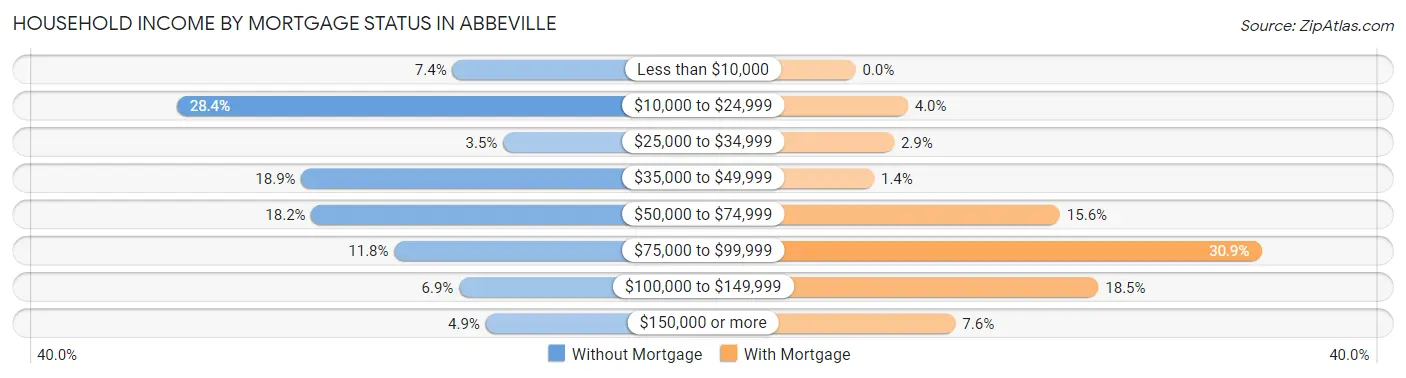
| Household Income | Without Mortgage | With Mortgage |
| Less than $10,000 | 117 (7.4%) | 0 (0.0%) |
| $10,000 to $24,999 | 449 (28.4%) | 34 (4.0%) |
| $25,000 to $34,999 | 56 (3.5%) | 25 (2.9%) |
| $35,000 to $49,999 | 299 (18.9%) | 12 (1.4%) |
| $50,000 to $74,999 | 287 (18.1%) | 133 (15.6%) |
| $75,000 to $99,999 | 187 (11.8%) | 264 (30.9%) |
| $100,000 to $149,999 | 109 (6.9%) | 158 (18.5%) |
| $150,000 or more | 77 (4.9%) | 65 (7.6%) |
| Total | 1,581 (100.0%) | 854 (100.0%) |
Property Value to Household Income Ratio in Abbeville
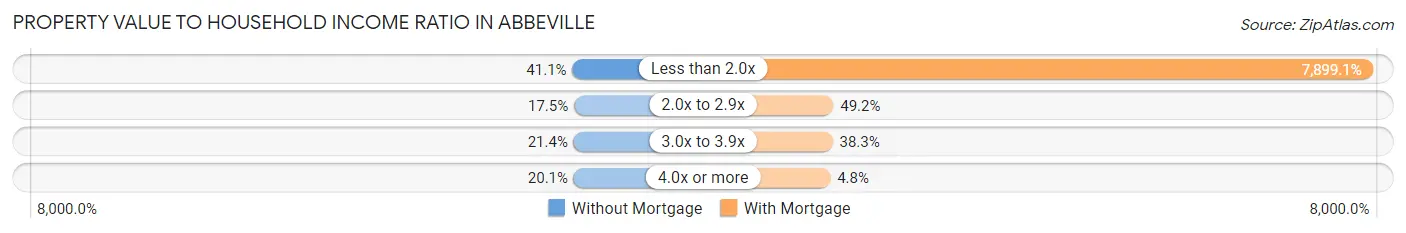
| Value-to-Income Ratio | Without Mortgage | With Mortgage |
| Less than 2.0x | 649 (41.0%) | 67,458 (7,899.1%) |
| 2.0x to 2.9x | 276 (17.5%) | 420 (49.2%) |
| 3.0x to 3.9x | 338 (21.4%) | 327 (38.3%) |
| 4.0x or more | 318 (20.1%) | 41 (4.8%) |
| Total | 1,581 (100.0%) | 854 (100.0%) |
Real Estate Taxes by Mortgage Status in Abbeville
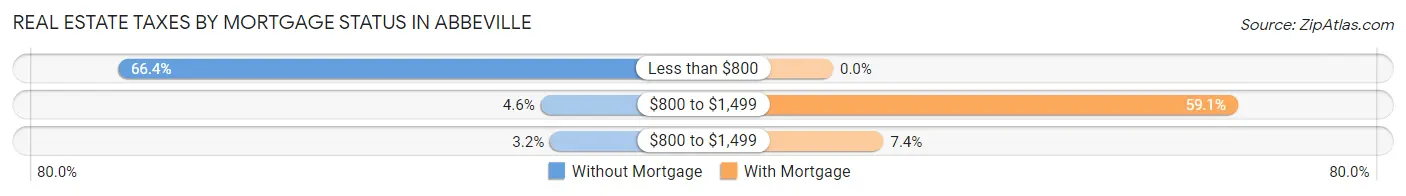
| Property Taxes | Without Mortgage | With Mortgage |
| Less than $800 | 1,049 (66.3%) | 0 (0.0%) |
| $800 to $1,499 | 73 (4.6%) | 505 (59.1%) |
| $800 to $1,499 | 51 (3.2%) | 63 (7.4%) |
| Total | 1,581 (100.0%) | 854 (100.0%) |
Health & Disability in Abbeville
Health Insurance Coverage by Age in Abbeville
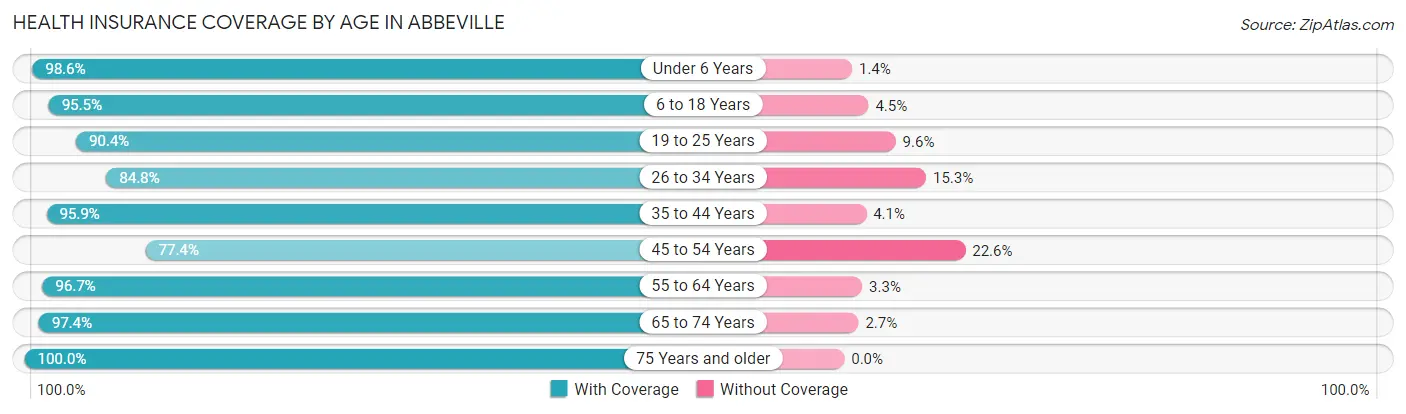
| Age Bracket | With Coverage | Without Coverage |
| Under 6 Years | 892 (98.6%) | 13 (1.4%) |
| 6 to 18 Years | 2,077 (95.5%) | 98 (4.5%) |
| 19 to 25 Years | 1,086 (90.4%) | 115 (9.6%) |
| 26 to 34 Years | 1,389 (84.8%) | 250 (15.2%) |
| 35 to 44 Years | 847 (95.9%) | 36 (4.1%) |
| 45 to 54 Years | 844 (77.4%) | 246 (22.6%) |
| 55 to 64 Years | 1,104 (96.7%) | 38 (3.3%) |
| 65 to 74 Years | 1,250 (97.4%) | 34 (2.6%) |
| 75 Years and older | 684 (100.0%) | 0 (0.0%) |
| Total | 10,173 (92.5%) | 830 (7.5%) |
Health Insurance Coverage by Citizenship Status in Abbeville
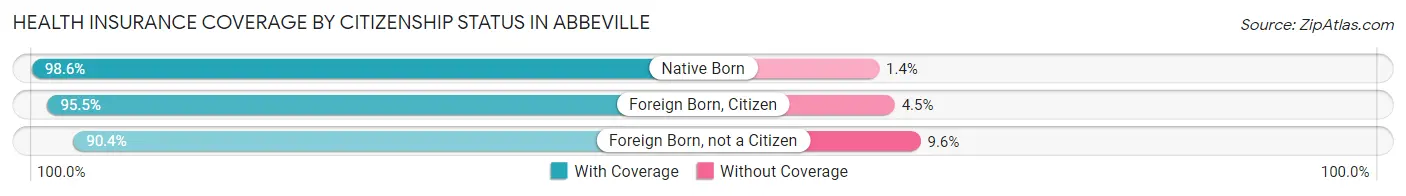
| Citizenship Status | With Coverage | Without Coverage |
| Native Born | 892 (98.6%) | 13 (1.4%) |
| Foreign Born, Citizen | 2,077 (95.5%) | 98 (4.5%) |
| Foreign Born, not a Citizen | 1,086 (90.4%) | 115 (9.6%) |
Health Insurance Coverage by Household Income in Abbeville
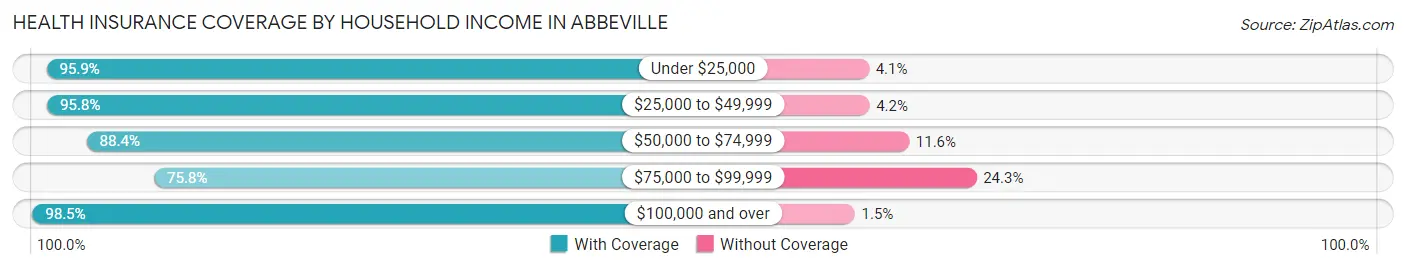
| Household Income | With Coverage | Without Coverage |
| Under $25,000 | 3,621 (95.9%) | 155 (4.1%) |
| $25,000 to $49,999 | 2,235 (95.8%) | 98 (4.2%) |
| $50,000 to $74,999 | 2,233 (88.4%) | 294 (11.6%) |
| $75,000 to $99,999 | 828 (75.7%) | 265 (24.2%) |
| $100,000 and over | 1,212 (98.5%) | 18 (1.5%) |
Public vs Private Health Insurance Coverage by Age in Abbeville
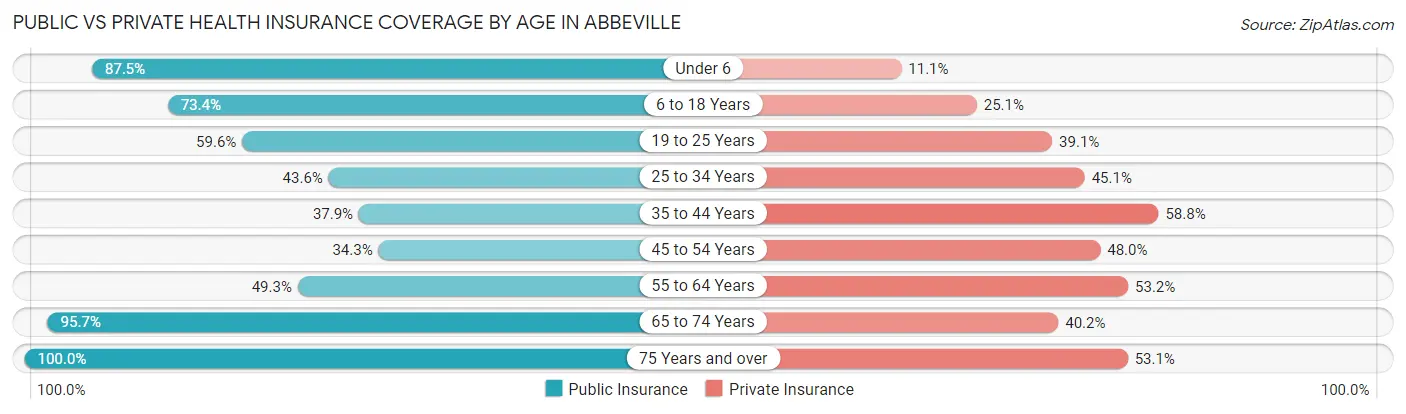
| Age Bracket | Public Insurance | Private Insurance |
| Under 6 | 792 (87.5%) | 100 (11.1%) |
| 6 to 18 Years | 1,597 (73.4%) | 545 (25.1%) |
| 19 to 25 Years | 716 (59.6%) | 469 (39.1%) |
| 25 to 34 Years | 714 (43.6%) | 739 (45.1%) |
| 35 to 44 Years | 335 (37.9%) | 519 (58.8%) |
| 45 to 54 Years | 374 (34.3%) | 523 (48.0%) |
| 55 to 64 Years | 563 (49.3%) | 607 (53.1%) |
| 65 to 74 Years | 1,229 (95.7%) | 516 (40.2%) |
| 75 Years and over | 684 (100.0%) | 363 (53.1%) |
| Total | 7,004 (63.7%) | 4,381 (39.8%) |
Disability Status by Sex by Age in Abbeville
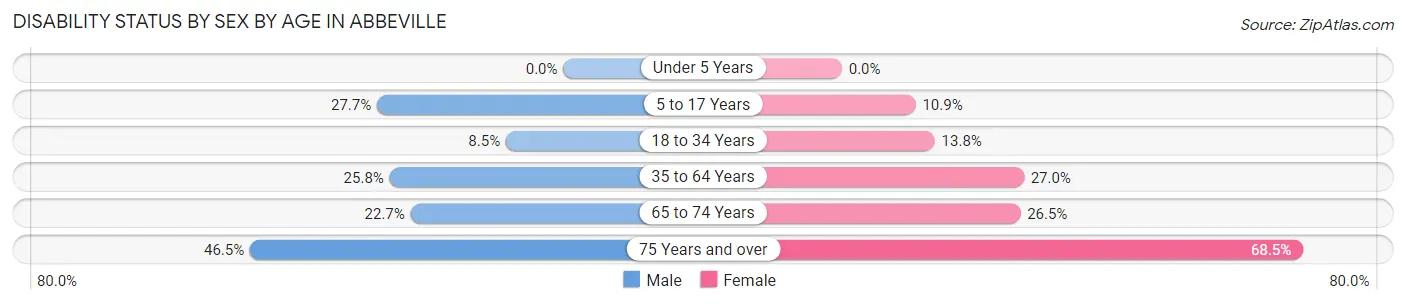
| Age Bracket | Male | Female |
| Under 5 Years | 0 (0.0%) | 0 (0.0%) |
| 5 to 17 Years | 260 (27.7%) | 130 (10.9%) |
| 18 to 34 Years | 107 (8.5%) | 234 (13.8%) |
| 35 to 64 Years | 344 (25.8%) | 481 (27.0%) |
| 65 to 74 Years | 108 (22.7%) | 214 (26.5%) |
| 75 Years and over | 107 (46.5%) | 311 (68.5%) |
Disability Class by Sex by Age in Abbeville
Disability Class: Hearing Difficulty
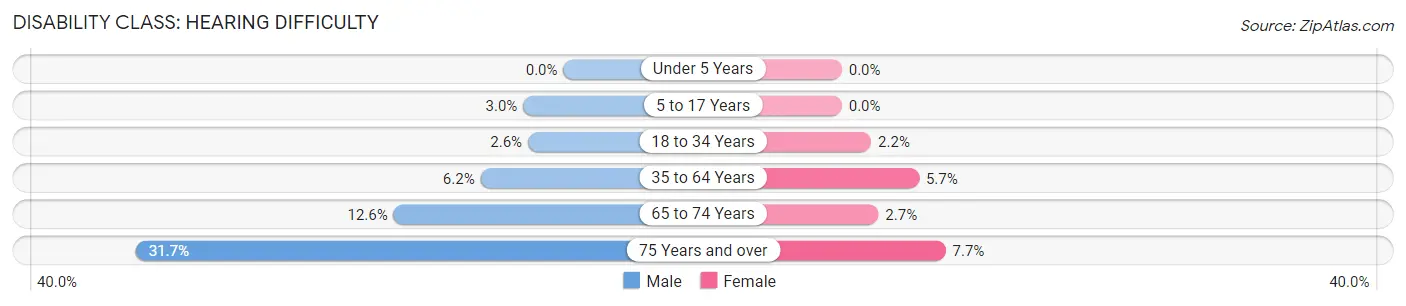
| Age Bracket | Male | Female |
| Under 5 Years | 0 (0.0%) | 0 (0.0%) |
| 5 to 17 Years | 28 (3.0%) | 0 (0.0%) |
| 18 to 34 Years | 33 (2.6%) | 37 (2.2%) |
| 35 to 64 Years | 82 (6.1%) | 102 (5.7%) |
| 65 to 74 Years | 60 (12.6%) | 22 (2.7%) |
| 75 Years and over | 73 (31.7%) | 35 (7.7%) |
Disability Class: Vision Difficulty
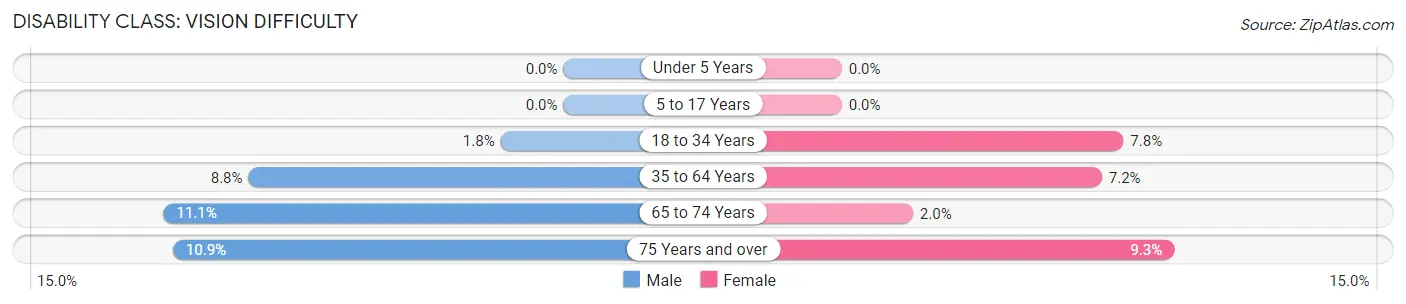
| Age Bracket | Male | Female |
| Under 5 Years | 0 (0.0%) | 0 (0.0%) |
| 5 to 17 Years | 0 (0.0%) | 0 (0.0%) |
| 18 to 34 Years | 22 (1.8%) | 133 (7.8%) |
| 35 to 64 Years | 117 (8.8%) | 129 (7.2%) |
| 65 to 74 Years | 53 (11.1%) | 16 (2.0%) |
| 75 Years and over | 25 (10.9%) | 42 (9.2%) |
Disability Class: Cognitive Difficulty
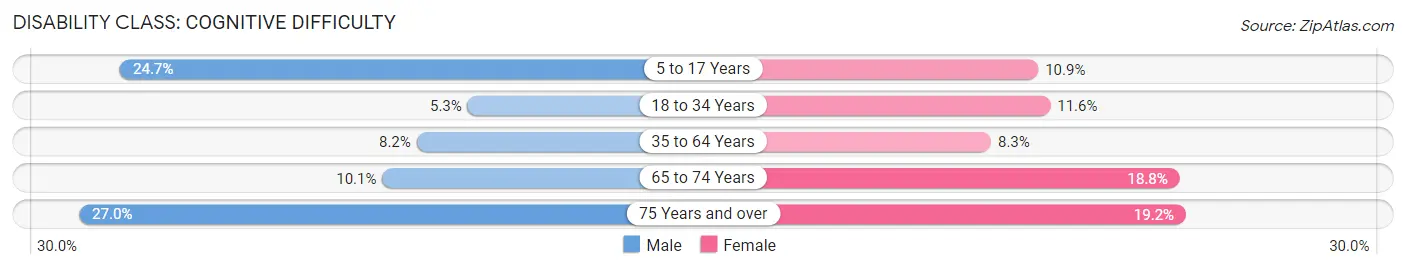
| Age Bracket | Male | Female |
| 5 to 17 Years | 232 (24.7%) | 130 (10.9%) |
| 18 to 34 Years | 67 (5.3%) | 197 (11.6%) |
| 35 to 64 Years | 109 (8.2%) | 148 (8.3%) |
| 65 to 74 Years | 48 (10.1%) | 152 (18.8%) |
| 75 Years and over | 62 (27.0%) | 87 (19.2%) |
Disability Class: Ambulatory Difficulty
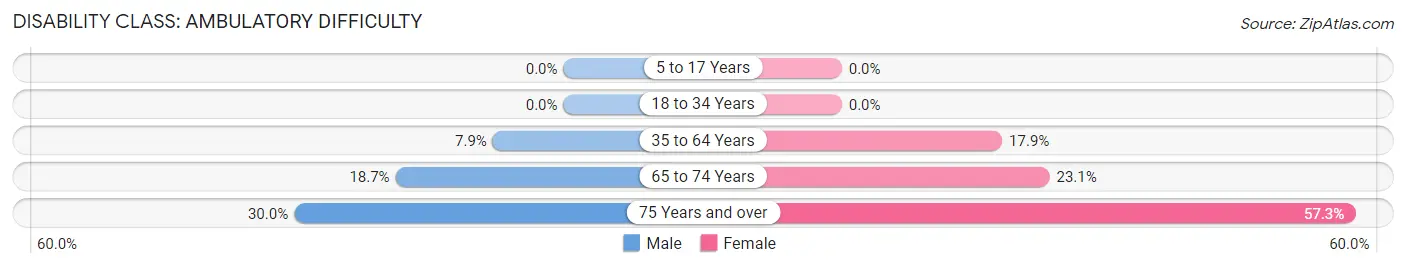
| Age Bracket | Male | Female |
| 5 to 17 Years | 0 (0.0%) | 0 (0.0%) |
| 18 to 34 Years | 0 (0.0%) | 0 (0.0%) |
| 35 to 64 Years | 105 (7.9%) | 318 (17.9%) |
| 65 to 74 Years | 89 (18.7%) | 187 (23.1%) |
| 75 Years and over | 69 (30.0%) | 260 (57.3%) |
Disability Class: Self-Care Difficulty
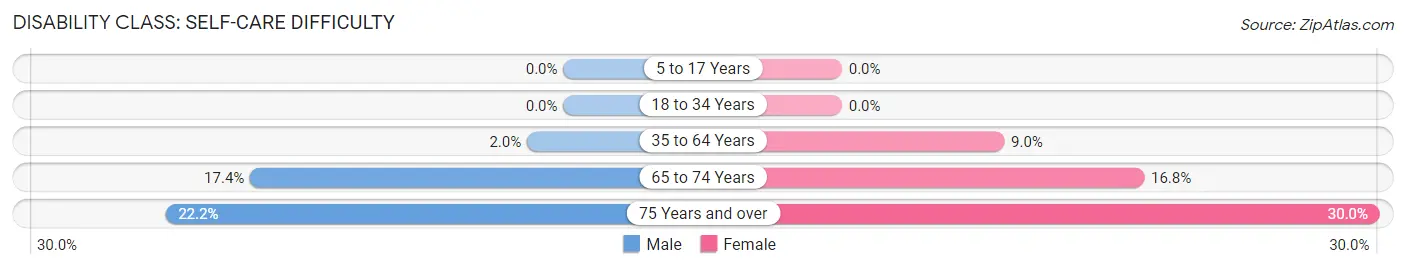
| Age Bracket | Male | Female |
| 5 to 17 Years | 0 (0.0%) | 0 (0.0%) |
| 18 to 34 Years | 0 (0.0%) | 0 (0.0%) |
| 35 to 64 Years | 27 (2.0%) | 161 (9.0%) |
| 65 to 74 Years | 83 (17.4%) | 136 (16.8%) |
| 75 Years and over | 51 (22.2%) | 136 (30.0%) |
Technology Access in Abbeville
Computing Device Access in Abbeville
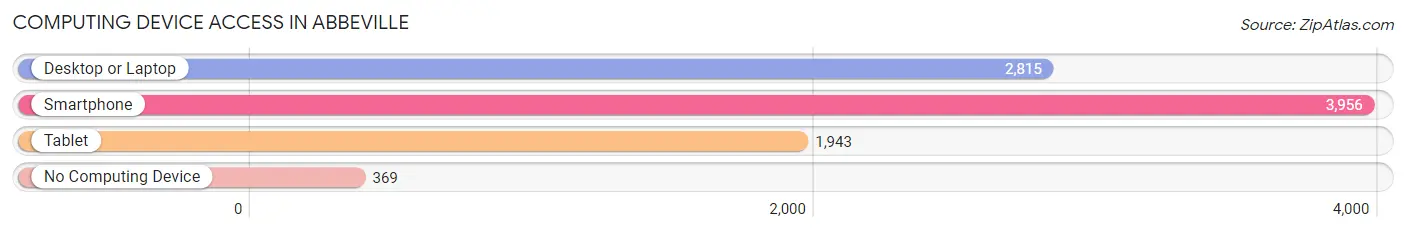
| Device Type | # Households | % Households |
| Desktop or Laptop | 2,815 | 62.3% |
| Smartphone | 3,956 | 87.5% |
| Tablet | 1,943 | 43.0% |
| No Computing Device | 369 | 8.2% |
| Total | 4,522 | 100.0% |
Internet Access in Abbeville
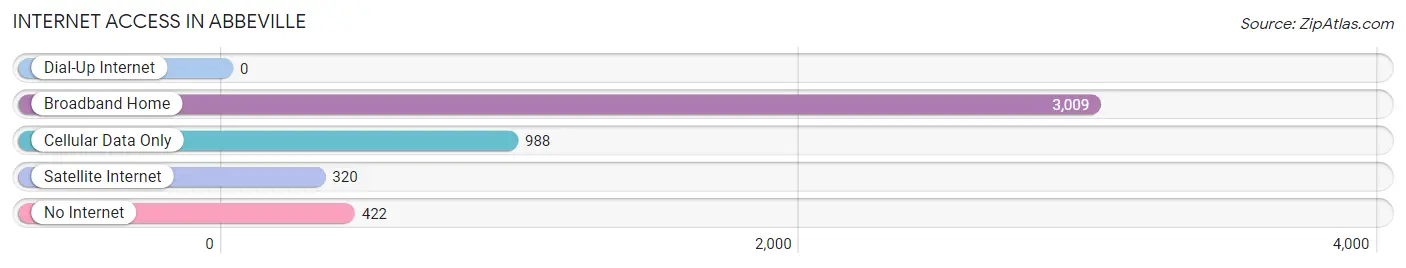
| Internet Type | # Households | % Households |
| Dial-Up Internet | 0 | 0.0% |
| Broadband Home | 3,009 | 66.5% |
| Cellular Data Only | 988 | 21.8% |
| Satellite Internet | 320 | 7.1% |
| No Internet | 422 | 9.3% |
| Total | 4,522 | 100.0% |
Abbeville Summary
Abbeville is a city located in Vermilion Parish, Louisiana, United States. It is the parish seat of Vermilion Parish and is located on the Vermilion River. As of the 2010 census, the population of Abbeville was 12,257.
History
Abbeville was founded in 1843 by Father Joseph Anthonioz, a French priest from Lyon, France. He named the town after his hometown of Abbeville, France. The town was incorporated in 1848 and was the first city in Vermilion Parish.
Abbeville was an important port city during the 19th century. It was a major shipping point for cotton, sugar, and other goods. The city was also a major center for the production of sugar cane and rice.
Geography
Abbeville is located at 29°58'N 92°7'W (29.967, -92.117). According to the United States Census Bureau, the city has a total area of 5.2 square miles (13.4 km2), of which 5.1 square miles (13.2 km2) is land and 0.1 square miles (0.2 km2) is water.
Economy
Abbeville is a major center for the production of sugar cane and rice. The city is also home to several oil and gas companies, as well as a number of manufacturing and service businesses.
Demographics
As of the 2010 census, there were 12,257 people, 4,845 households, and 3,092 families residing in the city. The population density was 2,400.3 people per square mile (926.2/km2). There were 5,093 housing units at an average density of 990.3 per square mile (382.2/km2). The racial makeup of the city was 68.2% White, 28.3% African American, 0.3% Native American, 0.7% Asian, 0.1% Pacific Islander, 0.7% from other races, and 1.7% from two or more races. Hispanic or Latino of any race were 2.7% of the population.
There were 4,845 households, out of which 28.7% had children under the age of 18 living with them, 41.2% were married couples living together, 18.2% had a female householder with no husband present, and 36.2% were non-families. 32.2% of all households were made up of individuals, and 14.2% had someone living alone who was 65 years of age or older. The average household size was 2.45 and the average family size was 3.09.
In the city, the population was spread out, with 25.2% under the age of 18, 8.7% from 18 to 24, 24.7% from 25 to 44, 22.7% from 45 to 64, and 18.7% who were 65 years of age or older. The median age was 38 years. For every 100 females, there were 87.2 males. For every 100 females age 18 and over, there were 82.2 males.
The median income for a household in the city was $27,845, and the median income for a family was $35,945. Males had a median income of $31,813 versus $20,945 for females. The per capita income for the city was $15,945. About 17.2% of families and 20.7% of the population were below the poverty line, including 28.2% of those under age 18 and 16.2% of those age 65 or over.
Common Questions
What is Per Capita Income in Abbeville?
Per Capita income in Abbeville is $22,605.
What is the Median Family Income in Abbeville?
Median Family Income in Abbeville is $40,532.
What is the Median Household income in Abbeville?
Median Household Income in Abbeville is $39,566.
What is Income or Wage Gap in Abbeville?
Income or Wage Gap in Abbeville is 38.8%.
Women in Abbeville earn 61.2 cents for every dollar earned by a man.
What is Inequality or Gini Index in Abbeville?
Inequality or Gini Index in Abbeville is 0.48.
What is the Total Population of Abbeville?
Total Population of Abbeville is 11,213.
What is the Total Male Population of Abbeville?
Total Male Population of Abbeville is 4,696.
What is the Total Female Population of Abbeville?
Total Female Population of Abbeville is 6,517.
What is the Ratio of Males per 100 Females in Abbeville?
There are 72.06 Males per 100 Females in Abbeville.
What is the Ratio of Females per 100 Males in Abbeville?
There are 138.78 Females per 100 Males in Abbeville.
What is the Median Population Age in Abbeville?
Median Population Age in Abbeville is 33.1 Years.
What is the Average Family Size in Abbeville
Average Family Size in Abbeville is 3.0 People.
What is the Average Household Size in Abbeville
Average Household Size in Abbeville is 2.4 People.
How Large is the Labor Force in Abbeville?
There are 4,809 People in the Labor Forcein in Abbeville.
What is the Percentage of People in the Labor Force in Abbeville?
56.1% of People are in the Labor Force in Abbeville.
What is the Unemployment Rate in Abbeville?
Unemployment Rate in Abbeville is 6.8%.