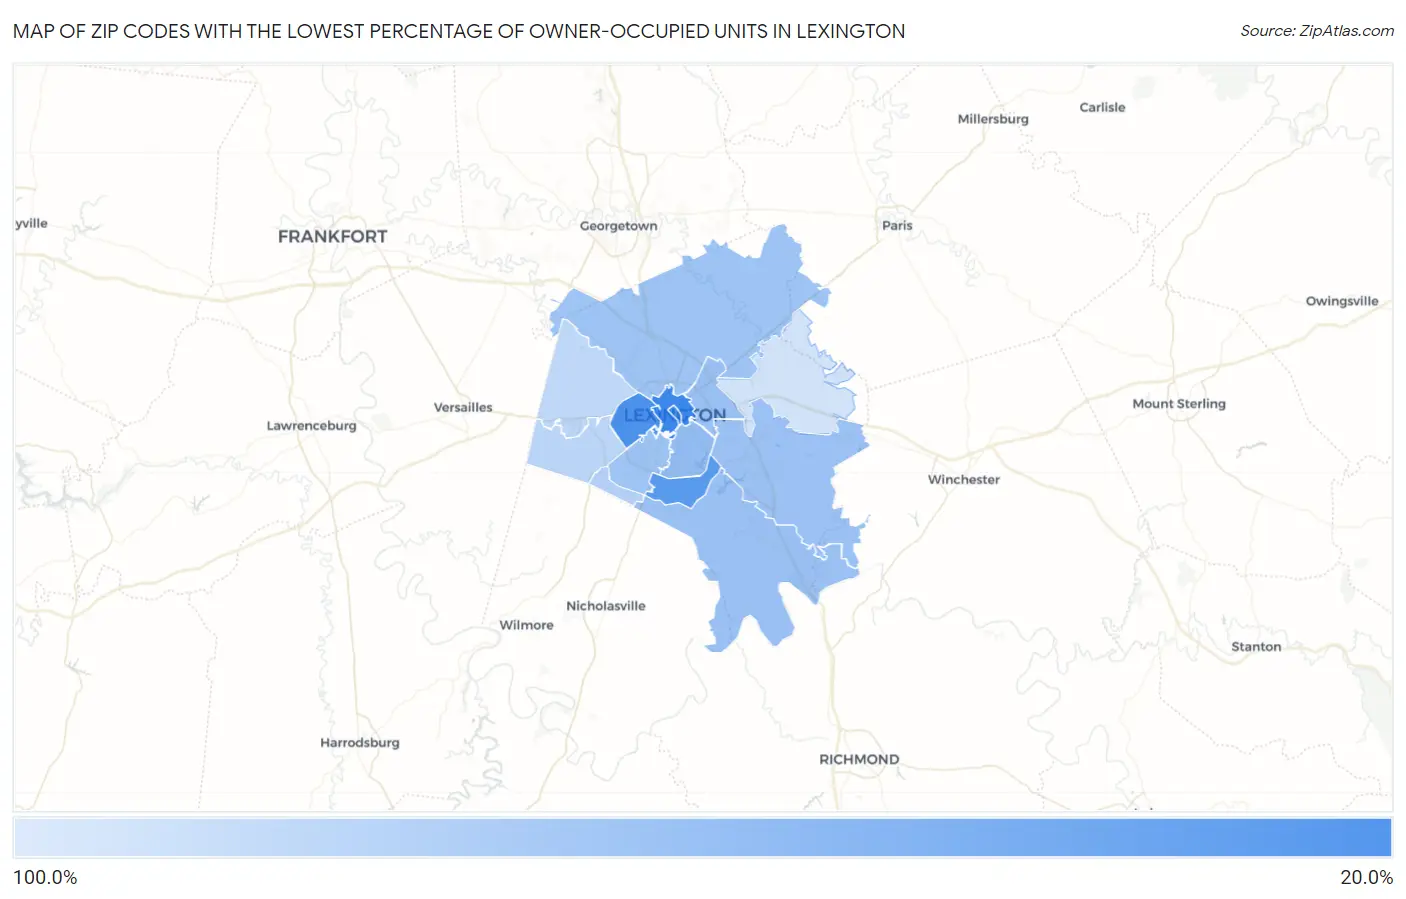
Zip Codes with the Lowest Percentage of Owner-Occupied Units in Lexington, KY
RELATED REPORTS & OPTIONS
Lowest Owner-Occupied
Lexington
Compare Zip Codes
Map of Zip Codes with the Lowest Percentage of Owner-Occupied Units in Lexington
85.3%
27.5%
Zip Codes with the Lowest Percentage of Owner-Occupied Units in Lexington, KY
| Zip Code | % Owner-Occupied | vs State | vs National | |
| 1. | 40508 | 27.5% | 68.1%(-40.6)#13 | 64.8%(-37.3)#638 |
| 2. | 40507 | 30.1% | 68.1%(-38.0)#15 | 64.8%(-34.7)#773 |
| 3. | 40504 | 32.5% | 68.1%(-35.6)#17 | 64.8%(-32.3)#913 |
| 4. | 40517 | 37.7% | 68.1%(-30.4)#21 | 64.8%(-27.1)#1,306 |
| 5. | 40502 | 58.6% | 68.1%(-9.51)#81 | 64.8%(-6.21)#4,699 |
| 6. | 40505 | 61.2% | 68.1%(-6.95)#100 | 64.8%(-3.65)#5,484 |
| 7. | 40515 | 61.2% | 68.1%(-6.95)#101 | 64.8%(-3.65)#5,485 |
| 8. | 40509 | 62.1% | 68.1%(-6.00)#107 | 64.8%(-2.70)#5,838 |
| 9. | 40511 | 63.2% | 68.1%(-4.91)#113 | 64.8%(-1.61)#6,278 |
| 10. | 40503 | 63.2% | 68.1%(-4.88)#114 | 64.8%(-1.58)#6,295 |
| 11. | 40514 | 72.5% | 68.1%(+4.36)#246 | 64.8%(+7.66)#11,422 |
| 12. | 40513 | 75.3% | 68.1%(+7.14)#307 | 64.8%(+10.4)#13,575 |
| 13. | 40510 | 78.1% | 68.1%(+10.0)#372 | 64.8%(+13.3)#16,178 |
| 14. | 40516 | 85.3% | 68.1%(+17.2)#528 | 64.8%(+20.5)#23,176 |
1
Common Questions
What are the Top 10 Zip Codes with the Lowest Percentage of Owner-Occupied Units in Lexington, KY?
Top 10 Zip Codes with the Lowest Percentage of Owner-Occupied Units in Lexington, KY are:
What zip code has the Lowest Percentage of Owner-Occupied Units in Lexington, KY?
40508 has the Lowest Percentage of Owner-Occupied Units in Lexington, KY with 27.5%.
What is the Percentage of Owner-Occupied Units in Lexington, KY?
Percentage of Owner-Occupied Units in Lexington is 54.3%.
What is the Percentage of Owner-Occupied Units in Kentucky?
Percentage of Owner-Occupied Units in Kentucky is 68.1%.
What is the Percentage of Owner-Occupied Units in the United States?
Percentage of Owner-Occupied Units in the United States is 64.8%.