Zip Codes with the Highest Percentage of Population Employed in Agriculture, Fishing & Hunting in Covington, KY
RELATED REPORTS & OPTIONS
Agriculture, Fishing & Hunting
Covington
Compare Zip Codes
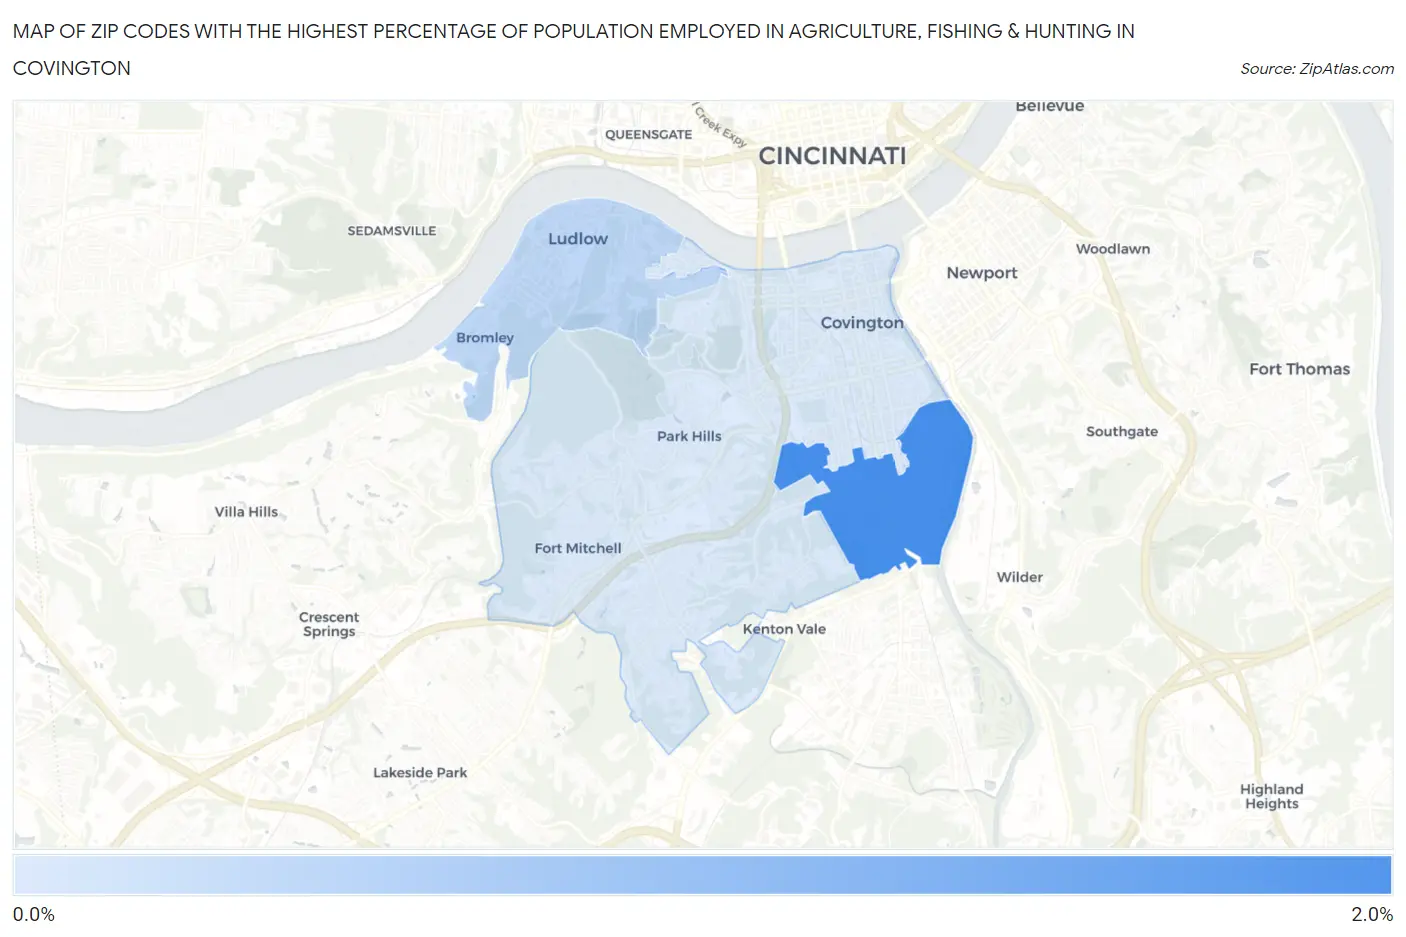
Map of Zip Codes with the Highest Percentage of Population Employed in Agriculture, Fishing & Hunting in Covington
0.0%
2.0%
Zip Codes with the Highest Percentage of Population Employed in Agriculture, Fishing & Hunting in Covington, KY
| Zip Code | % Employed | vs State | vs National | |
| 1. | 41014 | 1.5% | 1.3%(+0.198)#231 | 1.2%(+0.313)#14,251 |
| 2. | 41016 | 0.60% | 1.3%(-0.717)#322 | 1.2%(-0.601)#18,501 |
| 3. | 41011 | 0.38% | 1.3%(-0.937)#349 | 1.2%(-0.821)#20,357 |
1
Common Questions
What are the Top Zip Codes with the Highest Percentage of Population Employed in Agriculture, Fishing & Hunting in Covington, KY?
Top Zip Codes with the Highest Percentage of Population Employed in Agriculture, Fishing & Hunting in Covington, KY are:
What zip code has the Highest Percentage of Population Employed in Agriculture, Fishing & Hunting in Covington, KY?
41014 has the Highest Percentage of Population Employed in Agriculture, Fishing & Hunting in Covington, KY with 1.5%.
What is the Percentage of Population Employed in Agriculture, Fishing & Hunting in Covington, KY?
Percentage of Population Employed in Agriculture, Fishing & Hunting in Covington is 0.42%.
What is the Percentage of Population Employed in Agriculture, Fishing & Hunting in Kentucky?
Percentage of Population Employed in Agriculture, Fishing & Hunting in Kentucky is 1.3%.
What is the Percentage of Population Employed in Agriculture, Fishing & Hunting in the United States?
Percentage of Population Employed in Agriculture, Fishing & Hunting in the United States is 1.2%.