Winchester, ID Map & Demographics
Winchester Map
Winchester Overview
$28,524
PER CAPITA INCOME
$66,250
AVG FAMILY INCOME
$44,167
AVG HOUSEHOLD INCOME
51.5%
WAGE / INCOME GAP [ % ]
48.5¢/ $1
WAGE / INCOME GAP [ $ ]
$8,300
FAMILY INCOME DEFICIT
0.44
INEQUALITY / GINI INDEX
263
TOTAL POPULATION
157
MALE POPULATION
106
FEMALE POPULATION
148.11
MALES / 100 FEMALES
67.52
FEMALES / 100 MALES
55.9
MEDIAN AGE
2.8
AVG FAMILY SIZE
2.0
AVG HOUSEHOLD SIZE
104
LABOR FORCE [ PEOPLE ]
45.0%
PERCENT IN LABOR FORCE
5.8%
UNEMPLOYMENT RATE
Winchester Zip Codes
Winchester Area Codes
Income in Winchester
Income Overview in Winchester
Per Capita Income in Winchester is $28,524, while median incomes of families and households are $66,250 and $44,167 respectively.
| Characteristic | Number | Measure |
| Per Capita Income | 263 | $28,524 |
| Median Family Income | 57 | $66,250 |
| Mean Family Income | 57 | $77,495 |
| Median Household Income | 112 | $44,167 |
| Mean Household Income | 112 | $59,881 |
| Income Deficit | 57 | $8,300 |
| Wage / Income Gap (%) | 263 | 51.51% |
| Wage / Income Gap ($) | 263 | 48.49¢ per $1 |
| Gini / Inequality Index | 263 | 0.44 |
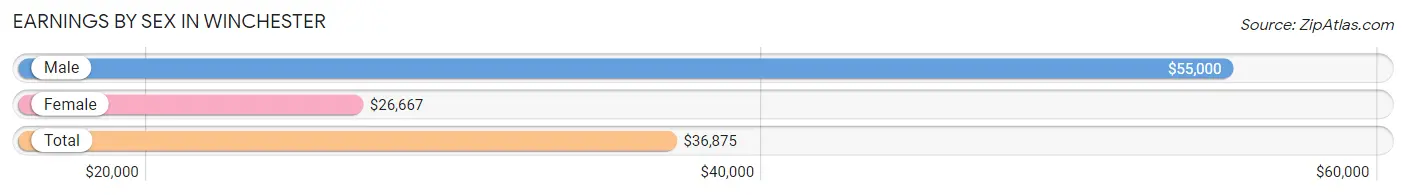
Earnings by Sex in Winchester
Average Earnings in Winchester are $36,875, $55,000 for men and $26,667 for women, a difference of 51.5%.
| Sex | Number | Average Earnings |
| Male | 66 (55.0%) | $55,000 |
| Female | 54 (45.0%) | $26,667 |
| Total | 120 (100.0%) | $36,875 |
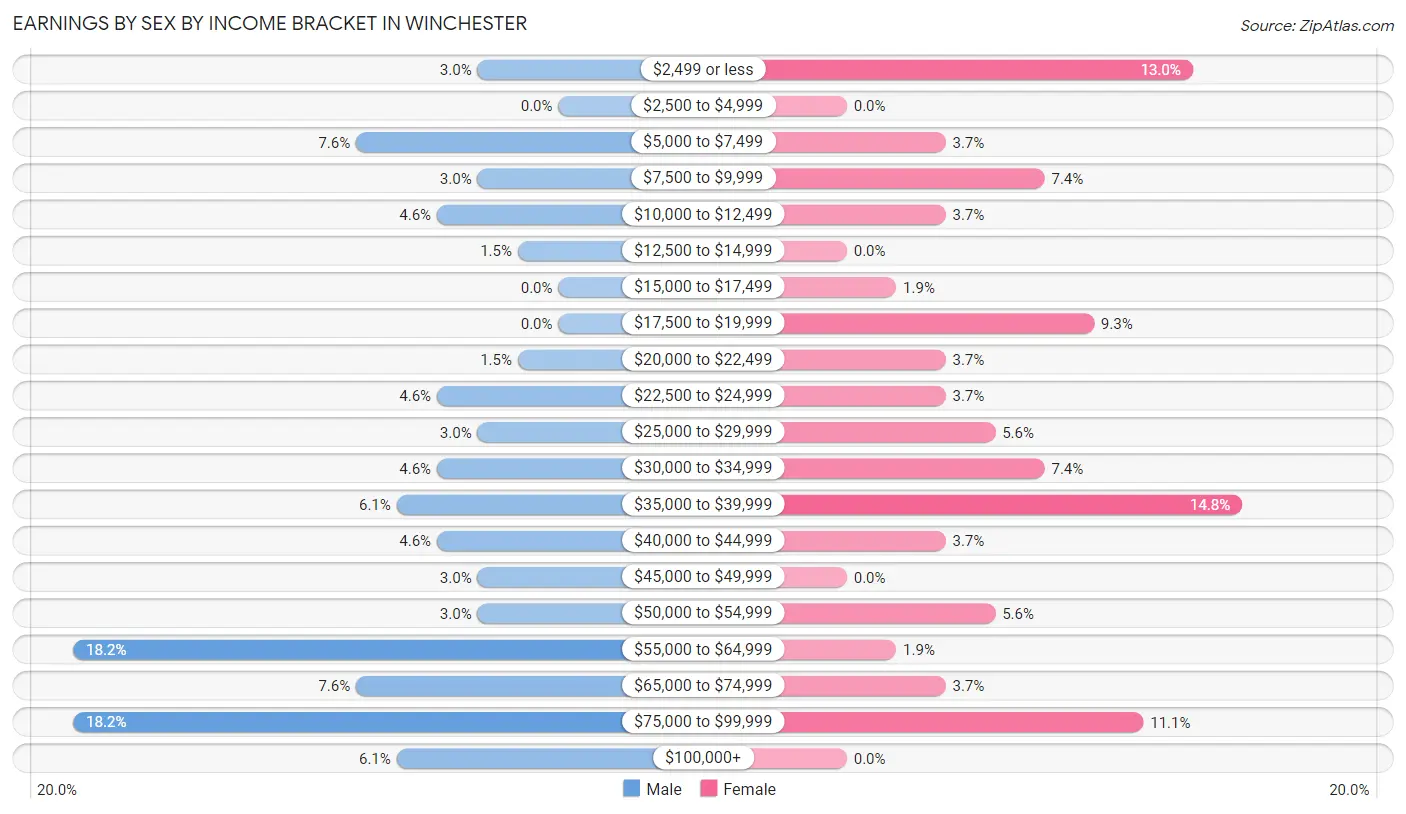
Earnings by Sex by Income Bracket in Winchester
The most common earnings brackets in Winchester are $55,000 to $64,999 for men (12 | 18.2%) and $35,000 to $39,999 for women (8 | 14.8%).
| Income | Male | Female |
| $2,499 or less | 2 (3.0%) | 7 (13.0%) |
| $2,500 to $4,999 | 0 (0.0%) | 0 (0.0%) |
| $5,000 to $7,499 | 5 (7.6%) | 2 (3.7%) |
| $7,500 to $9,999 | 2 (3.0%) | 4 (7.4%) |
| $10,000 to $12,499 | 3 (4.5%) | 2 (3.7%) |
| $12,500 to $14,999 | 1 (1.5%) | 0 (0.0%) |
| $15,000 to $17,499 | 0 (0.0%) | 1 (1.8%) |
| $17,500 to $19,999 | 0 (0.0%) | 5 (9.3%) |
| $20,000 to $22,499 | 1 (1.5%) | 2 (3.7%) |
| $22,500 to $24,999 | 3 (4.5%) | 2 (3.7%) |
| $25,000 to $29,999 | 2 (3.0%) | 3 (5.6%) |
| $30,000 to $34,999 | 3 (4.5%) | 4 (7.4%) |
| $35,000 to $39,999 | 4 (6.1%) | 8 (14.8%) |
| $40,000 to $44,999 | 3 (4.5%) | 2 (3.7%) |
| $45,000 to $49,999 | 2 (3.0%) | 0 (0.0%) |
| $50,000 to $54,999 | 2 (3.0%) | 3 (5.6%) |
| $55,000 to $64,999 | 12 (18.2%) | 1 (1.8%) |
| $65,000 to $74,999 | 5 (7.6%) | 2 (3.7%) |
| $75,000 to $99,999 | 12 (18.2%) | 6 (11.1%) |
| $100,000+ | 4 (6.1%) | 0 (0.0%) |
| Total | 66 (100.0%) | 54 (100.0%) |
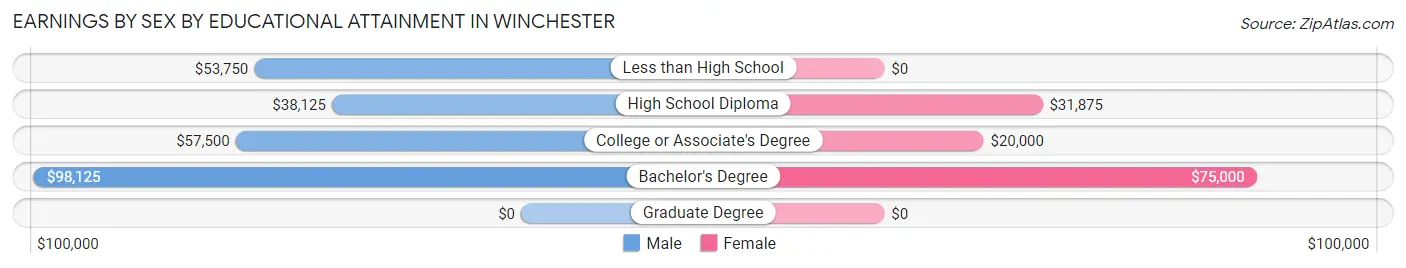
Earnings by Sex by Educational Attainment in Winchester
Average earnings in Winchester are $55,750 for men and $28,750 for women, a difference of 48.4%. Men with an educational attainment of bachelor's degree enjoy the highest average annual earnings of $98,125, while those with high school diploma education earn the least with $38,125. Women with an educational attainment of bachelor's degree earn the most with the average annual earnings of $75,000, while those with college or associate's degree education have the smallest earnings of $20,000.
| Educational Attainment | Male Income | Female Income |
| Less than High School | $53,750 | $0 |
| High School Diploma | $38,125 | $31,875 |
| College or Associate's Degree | $57,500 | $20,000 |
| Bachelor's Degree | $98,125 | $75,000 |
| Graduate Degree | - | - |
| Total | $55,750 | $28,750 |
Family Income in Winchester
Family Income Brackets in Winchester
According to the Winchester family income data, there are 12 families falling into the $50,000 to $74,999 income range, which is the most common income bracket and makes up 21.0% of all families.
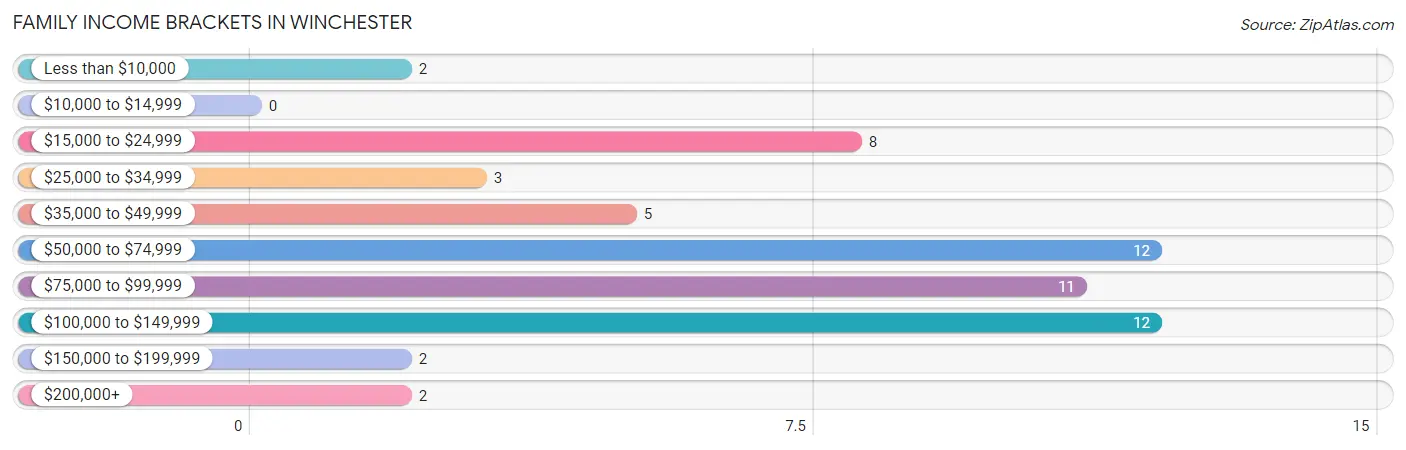
| Income Bracket | # Families | % Families |
| Less than $10,000 | 2 | 3.5% |
| $10,000 to $14,999 | 0 | 0.0% |
| $15,000 to $24,999 | 8 | 14.0% |
| $25,000 to $34,999 | 3 | 5.3% |
| $35,000 to $49,999 | 5 | 8.8% |
| $50,000 to $74,999 | 12 | 21.1% |
| $75,000 to $99,999 | 11 | 19.3% |
| $100,000 to $149,999 | 12 | 21.1% |
| $150,000 to $199,999 | 2 | 3.5% |
| $200,000+ | 2 | 3.5% |
Family Income by Famaliy Size in Winchester
5-person families (8 | 14.0%) account for the highest median family income in Winchester with $125,833 per family, while 2-person families (36 | 63.2%) have the highest median income of $28,750 per family member.
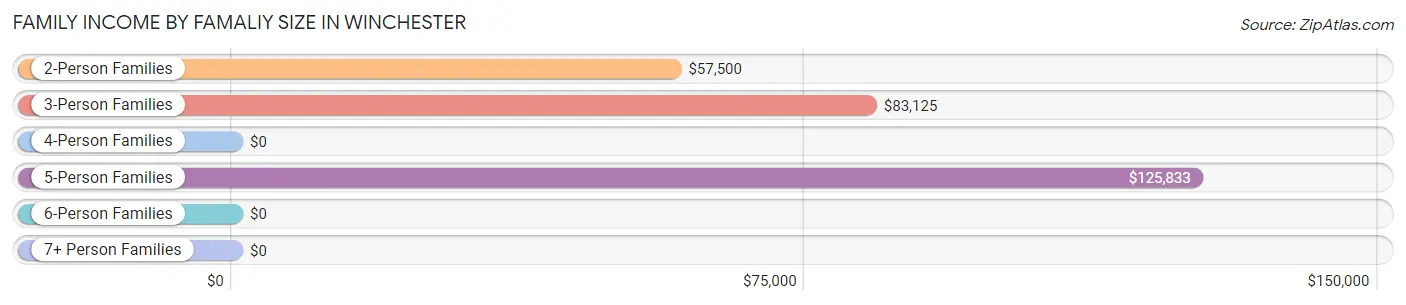
| Income Bracket | # Families | Median Income |
| 2-Person Families | 36 (63.2%) | $57,500 |
| 3-Person Families | 5 (8.8%) | $83,125 |
| 4-Person Families | 8 (14.0%) | $0 |
| 5-Person Families | 8 (14.0%) | $125,833 |
| 6-Person Families | 0 (0.0%) | $0 |
| 7+ Person Families | 0 (0.0%) | $0 |
| Total | 57 (100.0%) | $66,250 |
Family Income by Number of Earners in Winchester
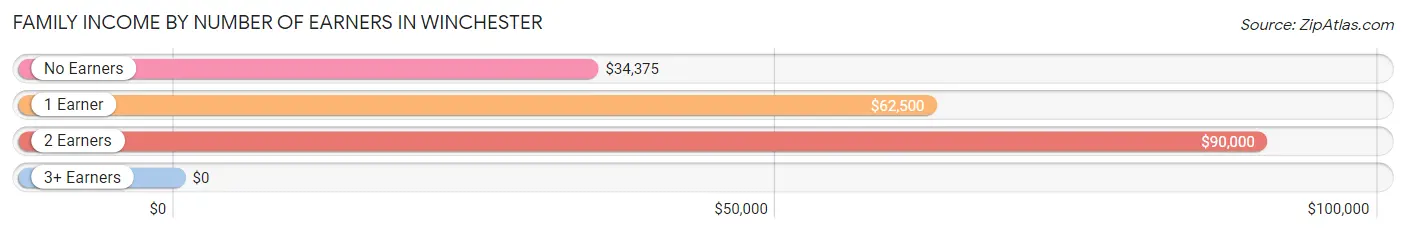
| Number of Earners | # Families | Median Income |
| No Earners | 15 (26.3%) | $34,375 |
| 1 Earner | 10 (17.5%) | $62,500 |
| 2 Earners | 30 (52.6%) | $90,000 |
| 3+ Earners | 2 (3.5%) | $0 |
| Total | 57 (100.0%) | $66,250 |
Household Income in Winchester
Household Income Brackets in Winchester
With 18 households falling in the category, the $15,000 to $24,999 income range is the most frequent in Winchester, accounting for 16.1% of all households. In contrast, only 2 households (1.8%) fall into the $200,000+ income bracket, making it the least populous group.
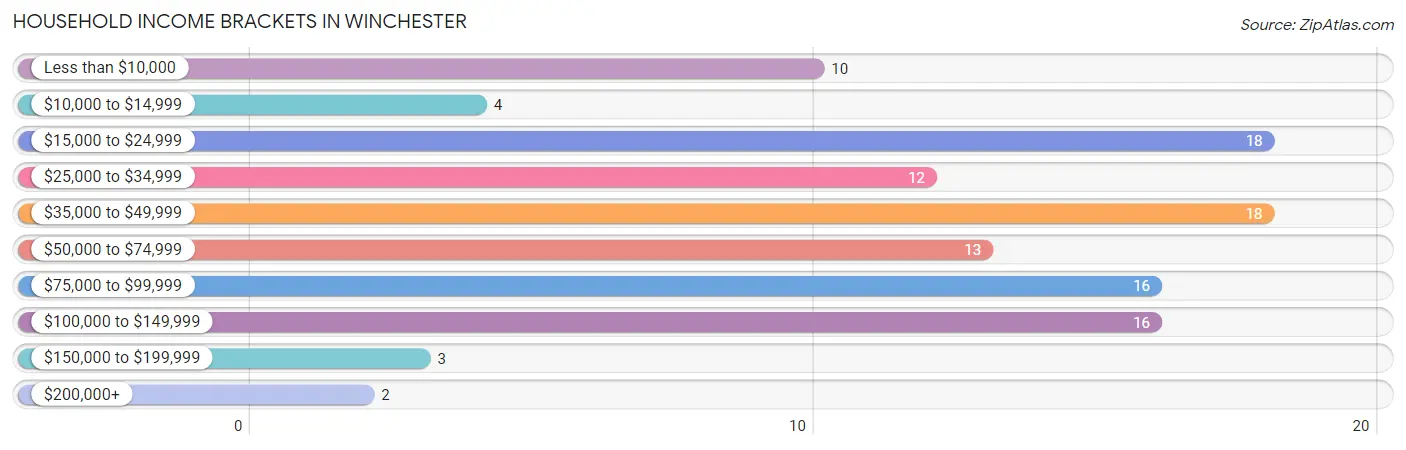
| Income Bracket | # Households | % Households |
| Less than $10,000 | 10 | 8.9% |
| $10,000 to $14,999 | 4 | 3.6% |
| $15,000 to $24,999 | 18 | 16.1% |
| $25,000 to $34,999 | 12 | 10.7% |
| $35,000 to $49,999 | 18 | 16.1% |
| $50,000 to $74,999 | 13 | 11.6% |
| $75,000 to $99,999 | 16 | 14.3% |
| $100,000 to $149,999 | 16 | 14.3% |
| $150,000 to $199,999 | 3 | 2.7% |
| $200,000+ | 2 | 1.8% |
Household Income by Householder Age in Winchester
The median household income in Winchester is $44,167, with the highest median household income of $97,917 found in the 25 to 44 years age bracket for the primary householder. A total of 26 households (23.2%) fall into this category. Meanwhile, the 15 to 24 years age bracket for the primary householder has the lowest median household income of $0, with 2 households (1.8%) in this group.
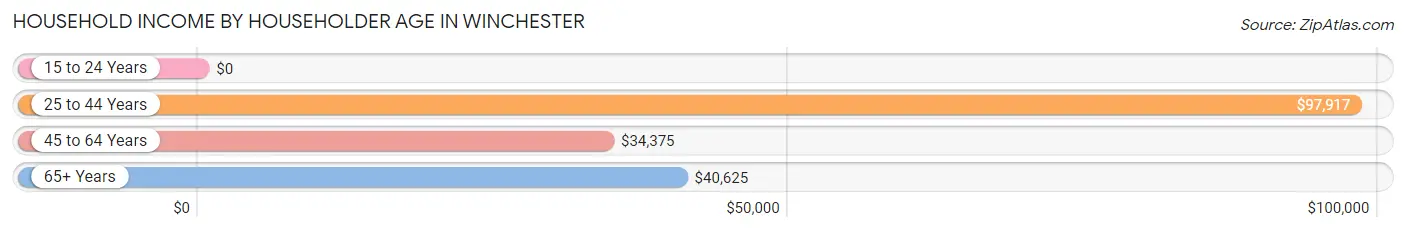
| Income Bracket | # Households | Median Income |
| 15 to 24 Years | 2 (1.8%) | $0 |
| 25 to 44 Years | 26 (23.2%) | $97,917 |
| 45 to 64 Years | 47 (42.0%) | $34,375 |
| 65+ Years | 37 (33.0%) | $40,625 |
| Total | 112 (100.0%) | $44,167 |
Poverty in Winchester
Income Below Poverty by Sex and Age in Winchester
With 29.3% poverty level for males and 16.0% for females among the residents of Winchester, 75 year old and over males and 45 to 54 year old females are the most vulnerable to poverty, with 27 males (64.3%) and 5 females (35.7%) in their respective age groups living below the poverty level.
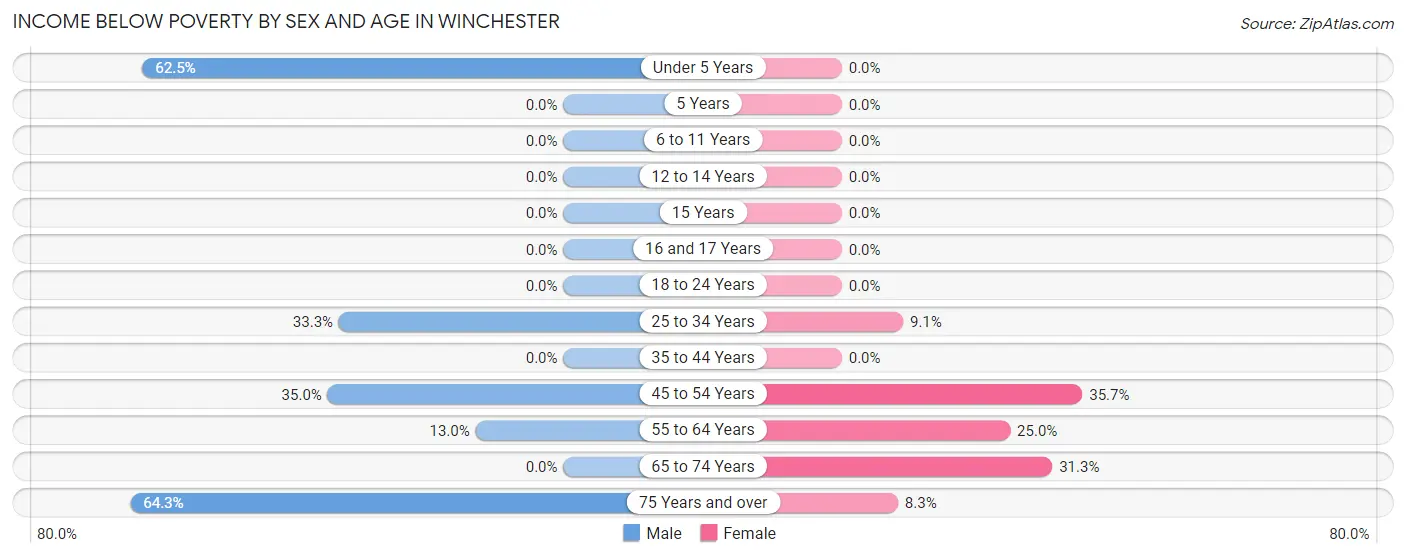
| Age Bracket | Male | Female |
| Under 5 Years | 5 (62.5%) | 0 (0.0%) |
| 5 Years | 0 (0.0%) | 0 (0.0%) |
| 6 to 11 Years | 0 (0.0%) | 0 (0.0%) |
| 12 to 14 Years | 0 (0.0%) | 0 (0.0%) |
| 15 Years | 0 (0.0%) | 0 (0.0%) |
| 16 and 17 Years | 0 (0.0%) | 0 (0.0%) |
| 18 to 24 Years | 0 (0.0%) | 0 (0.0%) |
| 25 to 34 Years | 4 (33.3%) | 1 (9.1%) |
| 35 to 44 Years | 0 (0.0%) | 0 (0.0%) |
| 45 to 54 Years | 7 (35.0%) | 5 (35.7%) |
| 55 to 64 Years | 3 (13.0%) | 5 (25.0%) |
| 65 to 74 Years | 0 (0.0%) | 5 (31.2%) |
| 75 Years and over | 27 (64.3%) | 1 (8.3%) |
| Total | 46 (29.3%) | 17 (16.0%) |
Income Above Poverty by Sex and Age in Winchester
According to the poverty statistics in Winchester, males aged 6 to 11 years and females aged under 5 years are the age groups that are most secure financially, with 100.0% of males and 100.0% of females in these age groups living above the poverty line.
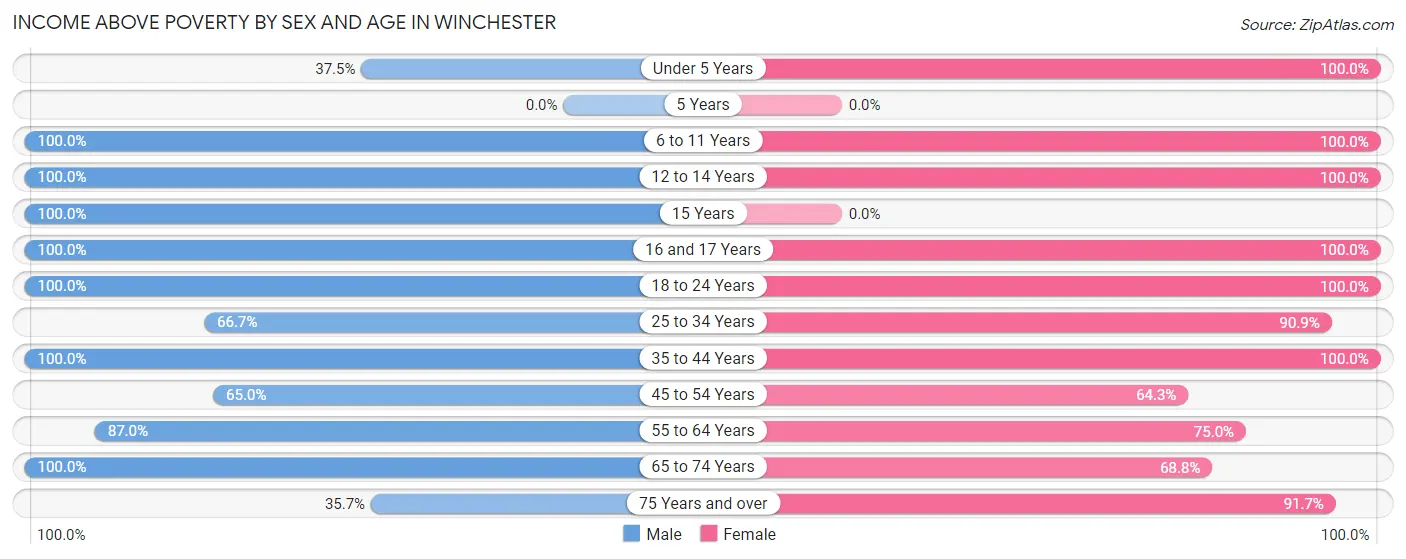
| Age Bracket | Male | Female |
| Under 5 Years | 3 (37.5%) | 2 (100.0%) |
| 5 Years | 0 (0.0%) | 0 (0.0%) |
| 6 to 11 Years | 5 (100.0%) | 4 (100.0%) |
| 12 to 14 Years | 4 (100.0%) | 8 (100.0%) |
| 15 Years | 1 (100.0%) | 0 (0.0%) |
| 16 and 17 Years | 3 (100.0%) | 2 (100.0%) |
| 18 to 24 Years | 5 (100.0%) | 2 (100.0%) |
| 25 to 34 Years | 8 (66.7%) | 10 (90.9%) |
| 35 to 44 Years | 12 (100.0%) | 15 (100.0%) |
| 45 to 54 Years | 13 (65.0%) | 9 (64.3%) |
| 55 to 64 Years | 20 (87.0%) | 15 (75.0%) |
| 65 to 74 Years | 22 (100.0%) | 11 (68.8%) |
| 75 Years and over | 15 (35.7%) | 11 (91.7%) |
| Total | 111 (70.7%) | 89 (84.0%) |
Income Below Poverty Among Married-Couple Families in Winchester
The poverty statistics for married-couple families in Winchester show that 13.5% or 7 of the total 52 families live below the poverty line. Families with 1 or 2 children have the highest poverty rate of 20.0%, comprising of 3 families. On the other hand, families with 3 or 4 children have the lowest poverty rate of 0.0%, which includes 0 families.
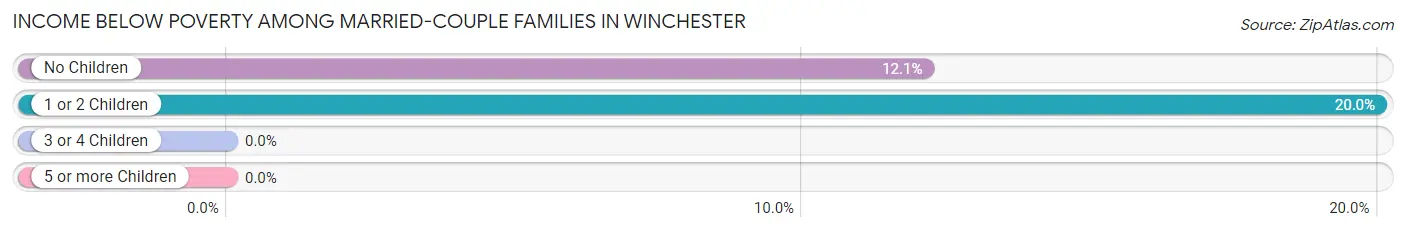
| Children | Above Poverty | Below Poverty |
| No Children | 29 (87.9%) | 4 (12.1%) |
| 1 or 2 Children | 12 (80.0%) | 3 (20.0%) |
| 3 or 4 Children | 4 (100.0%) | 0 (0.0%) |
| 5 or more Children | 0 (0.0%) | 0 (0.0%) |
| Total | 45 (86.5%) | 7 (13.5%) |
Income Below Poverty Among Single-Parent Households in Winchester
| Children | Single Father | Single Mother |
| No Children | 0 (0.0%) | 0 (0.0%) |
| 1 or 2 Children | 0 (0.0%) | 0 (0.0%) |
| 3 or 4 Children | 0 (0.0%) | 0 (0.0%) |
| 5 or more Children | 0 (0.0%) | 0 (0.0%) |
| Total | 0 (0.0%) | 0 (0.0%) |
Income Below Poverty Among Married-Couple vs Single-Parent Households in Winchester
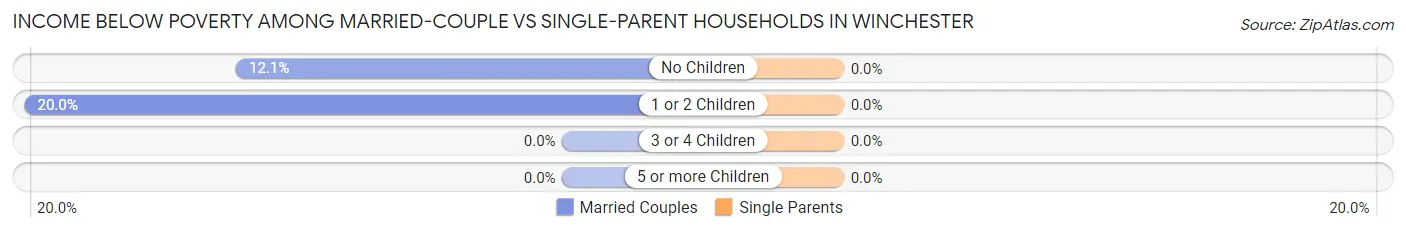
| Children | Married-Couple Families | Single-Parent Households |
| No Children | 4 (12.1%) | 0 (0.0%) |
| 1 or 2 Children | 3 (20.0%) | 0 (0.0%) |
| 3 or 4 Children | 0 (0.0%) | 0 (0.0%) |
| 5 or more Children | 0 (0.0%) | 0 (0.0%) |
| Total | 7 (13.5%) | 0 (0.0%) |
Race in Winchester
The most populous races in Winchester are White / Caucasian (236 | 89.7%), Two or more Races (13 | 4.9%), and Hispanic or Latino (8 | 3.0%).
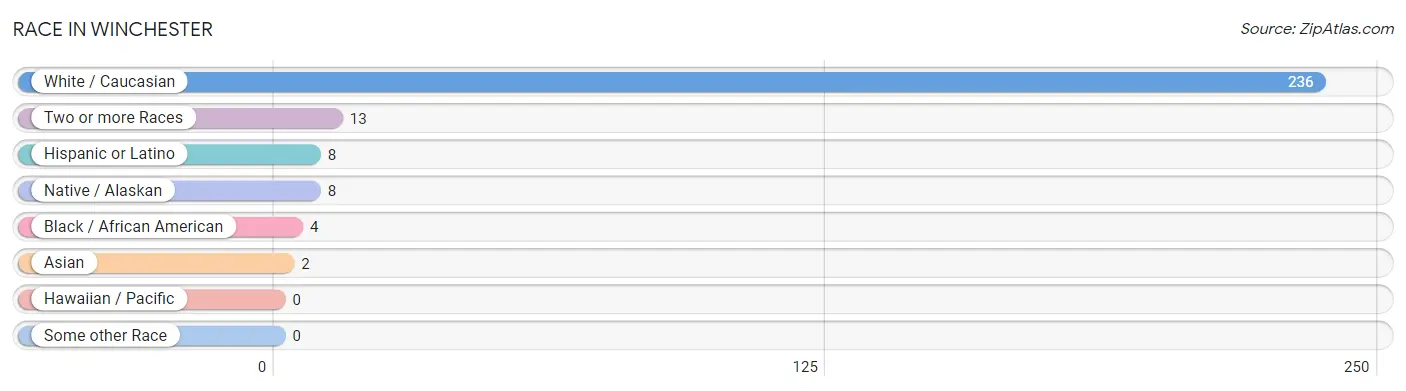
| Race | # Population | % Population |
| Asian | 2 | 0.8% |
| Black / African American | 4 | 1.5% |
| Hawaiian / Pacific | 0 | 0.0% |
| Hispanic or Latino | 8 | 3.0% |
| Native / Alaskan | 8 | 3.0% |
| White / Caucasian | 236 | 89.7% |
| Two or more Races | 13 | 4.9% |
| Some other Race | 0 | 0.0% |
| Total | 263 | 100.0% |
Ancestry in Winchester
The most populous ancestries reported in Winchester are German (53 | 20.2%), Norwegian (26 | 9.9%), Irish (25 | 9.5%), English (24 | 9.1%), and Scottish (14 | 5.3%), together accounting for 54.0% of all Winchester residents.
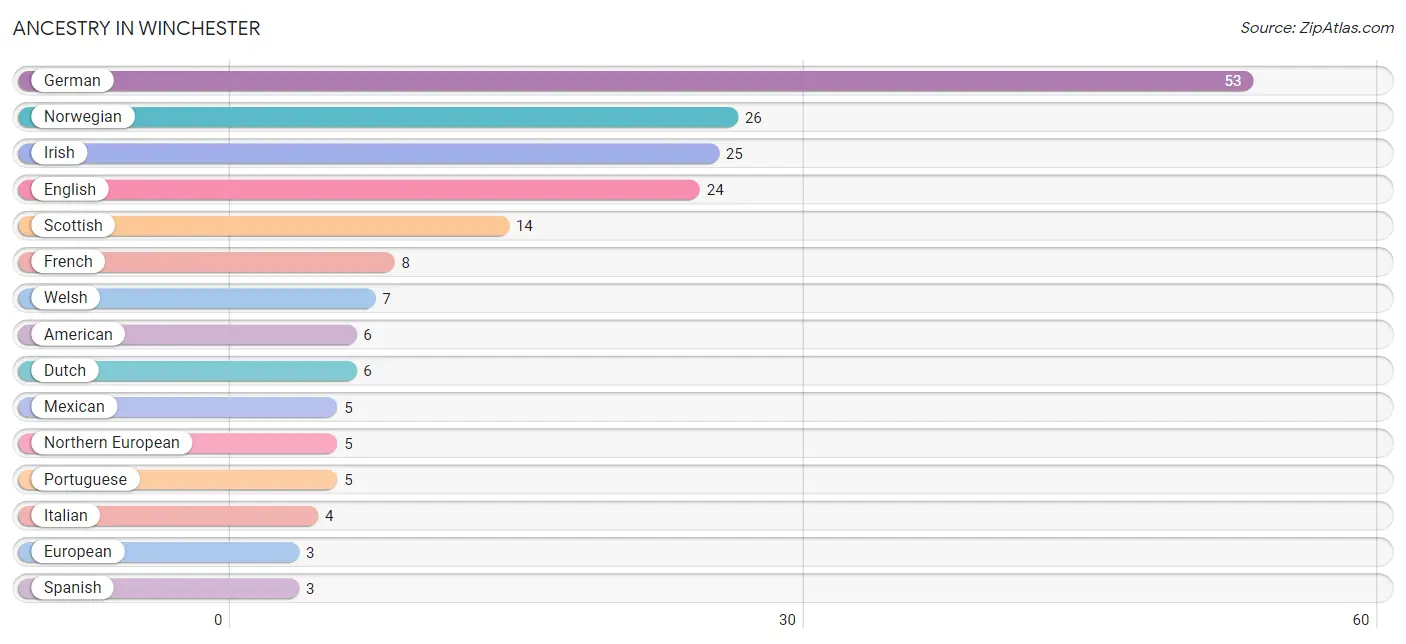
| Ancestry | # Population | % Population |
| American | 6 | 2.3% |
| Bhutanese | 2 | 0.8% |
| British | 1 | 0.4% |
| Choctaw | 2 | 0.8% |
| Czech | 2 | 0.8% |
| Dutch | 6 | 2.3% |
| English | 24 | 9.1% |
| European | 3 | 1.1% |
| French | 8 | 3.0% |
| French Canadian | 1 | 0.4% |
| German | 53 | 20.2% |
| Irish | 25 | 9.5% |
| Italian | 4 | 1.5% |
| Korean | 1 | 0.4% |
| Mexican | 5 | 1.9% |
| Northern European | 5 | 1.9% |
| Norwegian | 26 | 9.9% |
| Portuguese | 5 | 1.9% |
| Scotch-Irish | 1 | 0.4% |
| Scottish | 14 | 5.3% |
| Spanish | 3 | 1.1% |
| Swedish | 3 | 1.1% |
| Welsh | 7 | 2.7% | View All 23 Rows |
Immigrants in Winchester
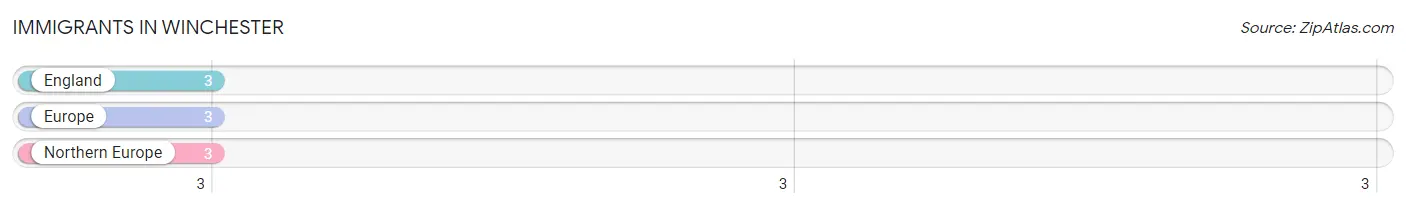
The most numerous immigrant groups reported in Winchester came from England (3 | 1.1%), Europe (3 | 1.1%), and Northern Europe (3 | 1.1%), together accounting for 3.4% of all Winchester residents.
| Immigration Origin | # Population | % Population |
| England | 3 | 1.1% |
| Europe | 3 | 1.1% |
| Northern Europe | 3 | 1.1% | View All 3 Rows |
Sex and Age in Winchester
Sex and Age in Winchester
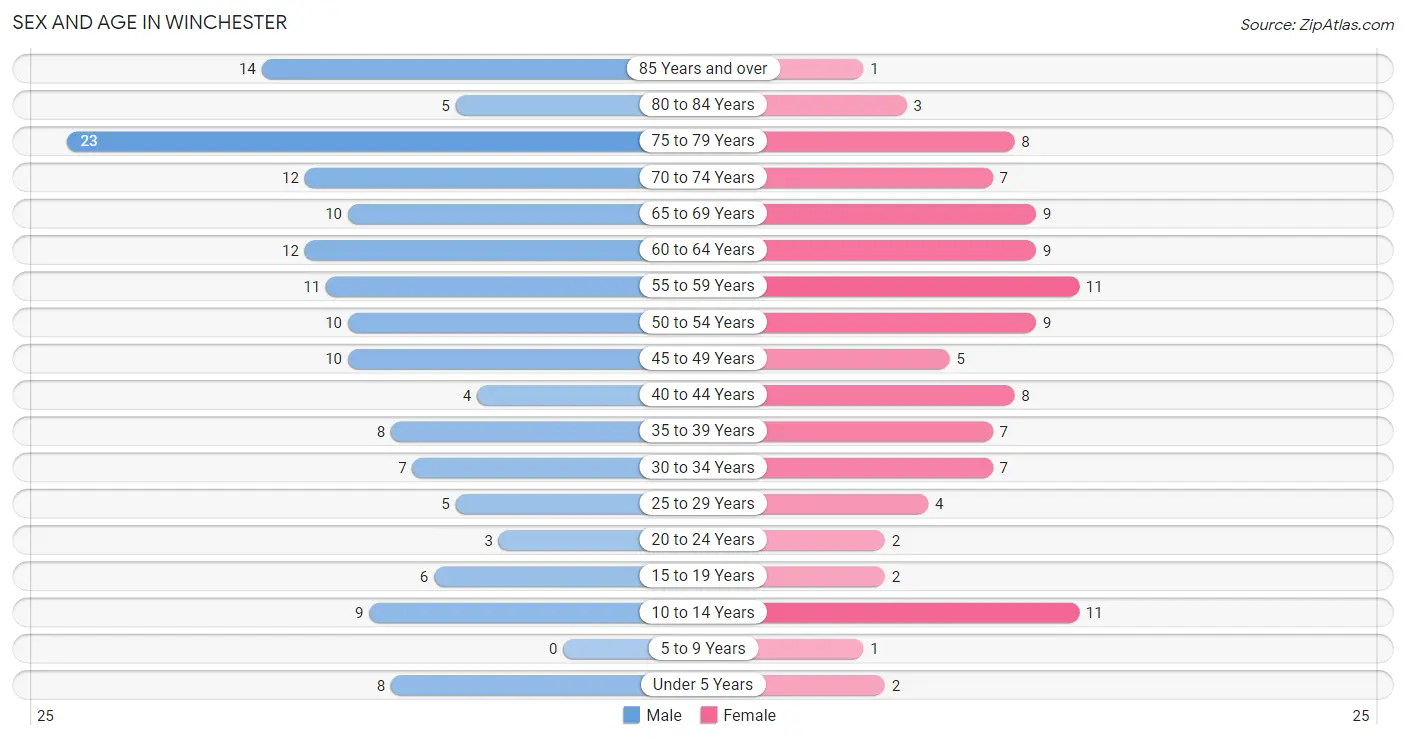
The most populous age groups in Winchester are 75 to 79 Years (23 | 14.6%) for men and 10 to 14 Years (11 | 10.4%) for women.
| Age Bracket | Male | Female |
| Under 5 Years | 8 (5.1%) | 2 (1.9%) |
| 5 to 9 Years | 0 (0.0%) | 1 (0.9%) |
| 10 to 14 Years | 9 (5.7%) | 11 (10.4%) |
| 15 to 19 Years | 6 (3.8%) | 2 (1.9%) |
| 20 to 24 Years | 3 (1.9%) | 2 (1.9%) |
| 25 to 29 Years | 5 (3.2%) | 4 (3.8%) |
| 30 to 34 Years | 7 (4.5%) | 7 (6.6%) |
| 35 to 39 Years | 8 (5.1%) | 7 (6.6%) |
| 40 to 44 Years | 4 (2.5%) | 8 (7.5%) |
| 45 to 49 Years | 10 (6.4%) | 5 (4.7%) |
| 50 to 54 Years | 10 (6.4%) | 9 (8.5%) |
| 55 to 59 Years | 11 (7.0%) | 11 (10.4%) |
| 60 to 64 Years | 12 (7.6%) | 9 (8.5%) |
| 65 to 69 Years | 10 (6.4%) | 9 (8.5%) |
| 70 to 74 Years | 12 (7.6%) | 7 (6.6%) |
| 75 to 79 Years | 23 (14.6%) | 8 (7.5%) |
| 80 to 84 Years | 5 (3.2%) | 3 (2.8%) |
| 85 Years and over | 14 (8.9%) | 1 (0.9%) |
| Total | 157 (100.0%) | 106 (100.0%) |
Families and Households in Winchester
Median Family Size in Winchester
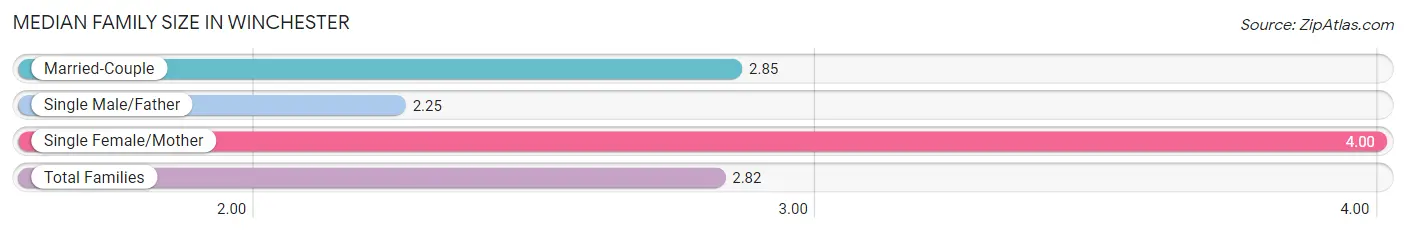
The median family size in Winchester is 2.82 persons per family, with single female/mother families (1 | 1.8%) accounting for the largest median family size of 4 persons per family. On the other hand, single male/father families (4 | 7.0%) represent the smallest median family size with 2.25 persons per family.
| Family Type | # Families | Family Size |
| Married-Couple | 52 (91.2%) | 2.85 |
| Single Male/Father | 4 (7.0%) | 2.25 |
| Single Female/Mother | 1 (1.8%) | 4.00 |
| Total Families | 57 (100.0%) | 2.82 |
Median Household Size in Winchester
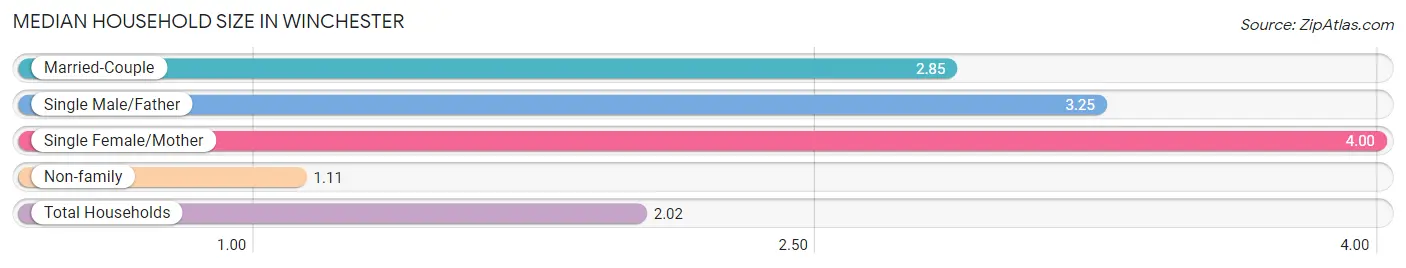
The median household size in Winchester is 2.02 persons per household, with single female/mother households (1 | 0.9%) accounting for the largest median household size of 4 persons per household. non-family households (55 | 49.1%) represent the smallest median household size with 1.11 persons per household.
| Household Type | # Households | Household Size |
| Married-Couple | 52 (46.4%) | 2.85 |
| Single Male/Father | 4 (3.6%) | 3.25 |
| Single Female/Mother | 1 (0.9%) | 4.00 |
| Non-family | 55 (49.1%) | 1.11 |
| Total Households | 112 (100.0%) | 2.02 |
Household Size by Marriage Status in Winchester
Out of a total of 112 households in Winchester, 57 (50.9%) are family households, while 55 (49.1%) are nonfamily households. The most numerous type of family households are 2-person households, comprising 35, and the most common type of nonfamily households are 1-person households, comprising 51.
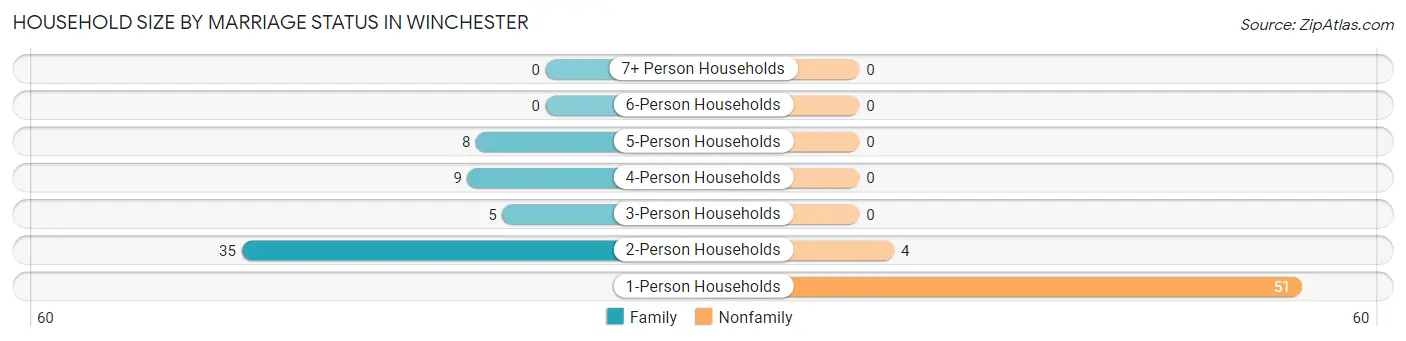
| Household Size | Family Households | Nonfamily Households |
| 1-Person Households | - | 51 (45.5%) |
| 2-Person Households | 35 (31.2%) | 4 (3.6%) |
| 3-Person Households | 5 (4.5%) | 0 (0.0%) |
| 4-Person Households | 9 (8.0%) | 0 (0.0%) |
| 5-Person Households | 8 (7.1%) | 0 (0.0%) |
| 6-Person Households | 0 (0.0%) | 0 (0.0%) |
| 7+ Person Households | 0 (0.0%) | 0 (0.0%) |
| Total | 57 (50.9%) | 55 (49.1%) |
Female Fertility in Winchester
Fertility by Age in Winchester
Average fertility rate in Winchester is 75.0 births per 1,000 women. Women in the age bracket of 35 to 50 years have the highest fertility rate with 80.0 births per 1,000 women. Women in the age bracket of 35 to 50 years acount for 66.7% of all women with births.
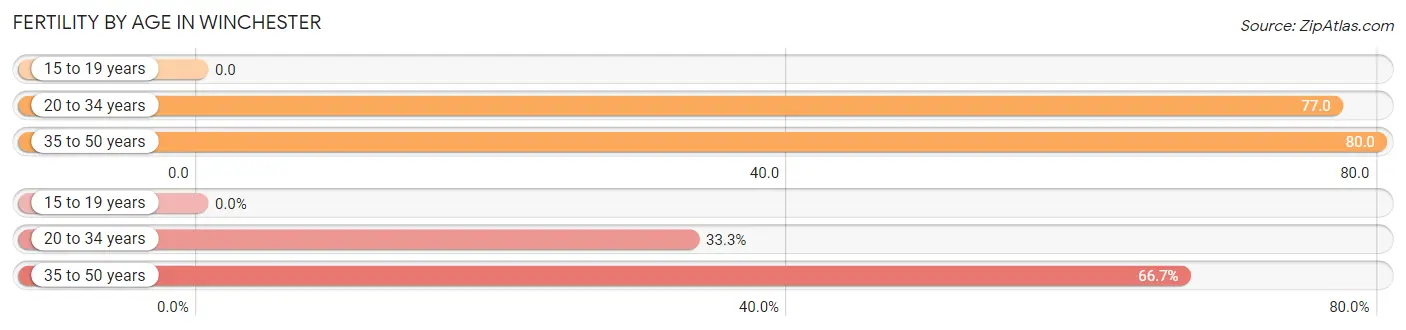
| Age Bracket | Women with Births | Births / 1,000 Women |
| 15 to 19 years | 0 (0.0%) | 0.0 |
| 20 to 34 years | 1 (33.3%) | 77.0 |
| 35 to 50 years | 2 (66.7%) | 80.0 |
| Total | 3 (100.0%) | 75.0 |
Fertility by Age by Marriage Status in Winchester
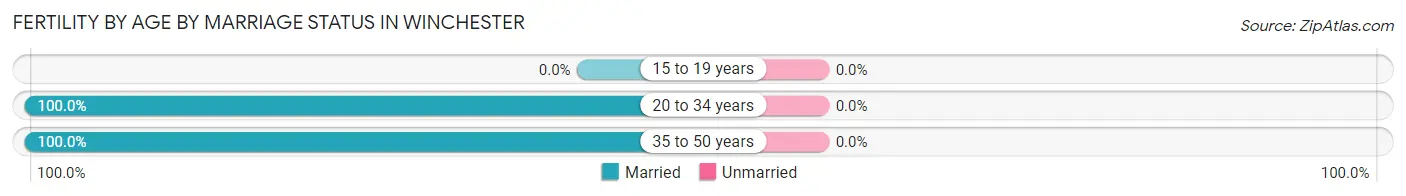
| Age Bracket | Married | Unmarried |
| 15 to 19 years | 0 (0.0%) | 0 (0.0%) |
| 20 to 34 years | 1 (100.0%) | 0 (0.0%) |
| 35 to 50 years | 2 (100.0%) | 0 (0.0%) |
| Total | 3 (100.0%) | 0 (0.0%) |
Fertility by Education in Winchester
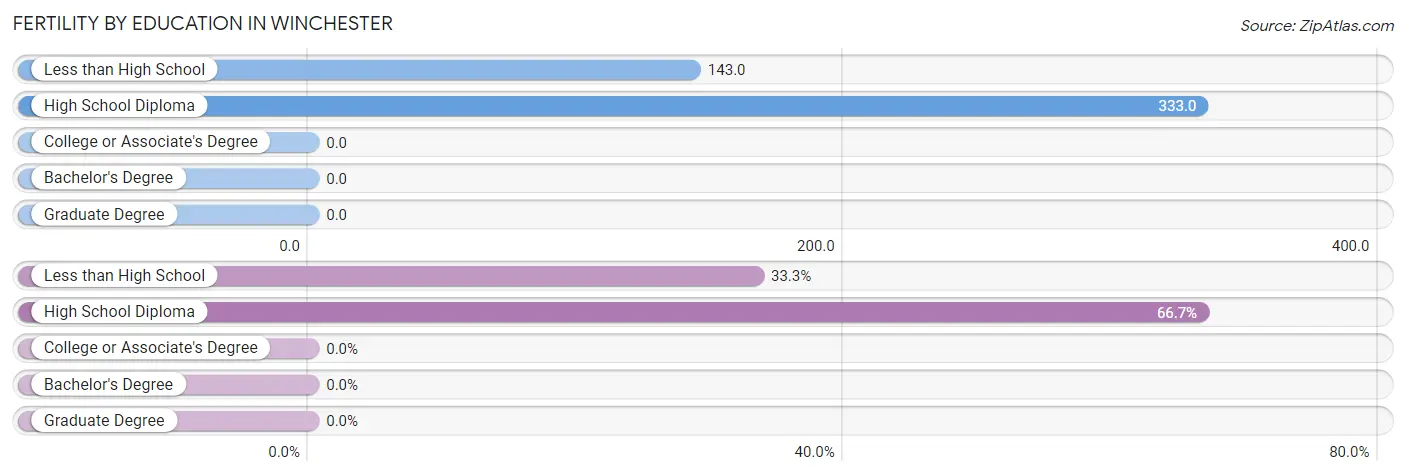
| Educational Attainment | Women with Births | Births / 1,000 Women |
| Less than High School | 1 (33.3%) | 143.0 |
| High School Diploma | 2 (66.7%) | 333.0 |
| College or Associate's Degree | 0 (0.0%) | 0.0 |
| Bachelor's Degree | 0 (0.0%) | 0.0 |
| Graduate Degree | 0 (0.0%) | 0.0 |
| Total | 3 (100.0%) | 75.0 |
Fertility by Education by Marriage Status in Winchester
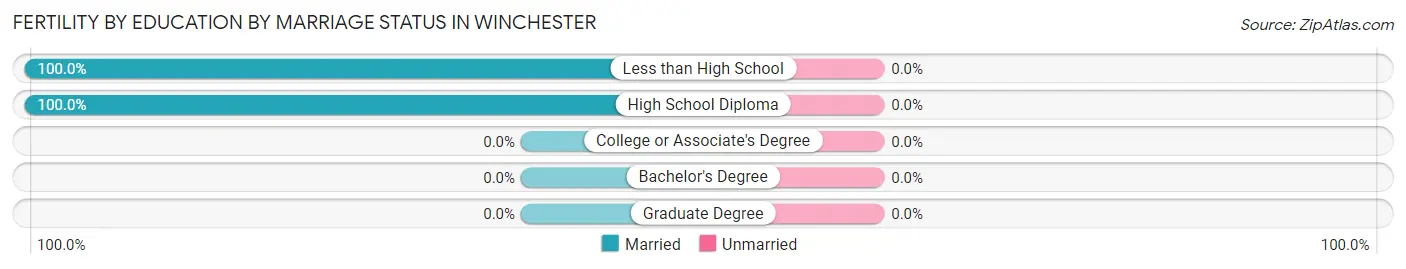
| Educational Attainment | Married | Unmarried |
| Less than High School | 1 (100.0%) | 0 (0.0%) |
| High School Diploma | 2 (100.0%) | 0 (0.0%) |
| College or Associate's Degree | 0 (0.0%) | 0 (0.0%) |
| Bachelor's Degree | 0 (0.0%) | 0 (0.0%) |
| Graduate Degree | 0 (0.0%) | 0 (0.0%) |
| Total | 3 (100.0%) | 0 (0.0%) |
Employment Characteristics in Winchester
Employment by Class of Employer in Winchester
Among the 98 employed individuals in Winchester, private company employees (51 | 52.0%), local government employees (13 | 13.3%), and self-employed (not incorporated) (10 | 10.2%) make up the most common classes of employment.
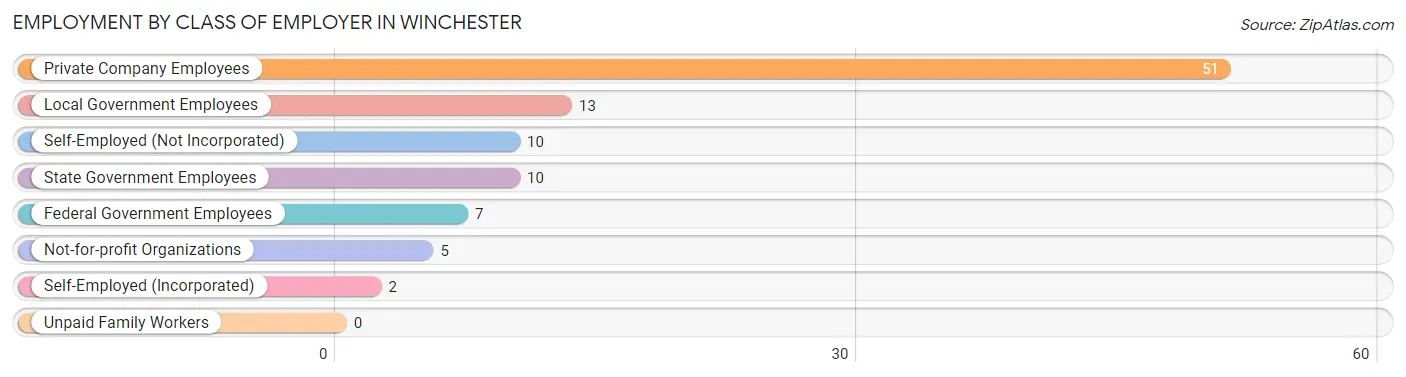
| Employer Class | # Employees | % Employees |
| Private Company Employees | 51 | 52.0% |
| Self-Employed (Incorporated) | 2 | 2.0% |
| Self-Employed (Not Incorporated) | 10 | 10.2% |
| Not-for-profit Organizations | 5 | 5.1% |
| Local Government Employees | 13 | 13.3% |
| State Government Employees | 10 | 10.2% |
| Federal Government Employees | 7 | 7.1% |
| Unpaid Family Workers | 0 | 0.0% |
| Total | 98 | 100.0% |
Employment Status by Age in Winchester
According to the labor force statistics for Winchester, out of the total population over 16 years of age (231), 45.0% or 104 individuals are in the labor force, with 5.8% or 6 of them unemployed. The age group with the highest labor force participation rate is 20 to 24 years, with 100.0% or 5 individuals in the labor force. Within the labor force, the 45 to 54 years age range has the highest percentage of unemployed individuals, with 24.0% or 6 of them being unemployed.
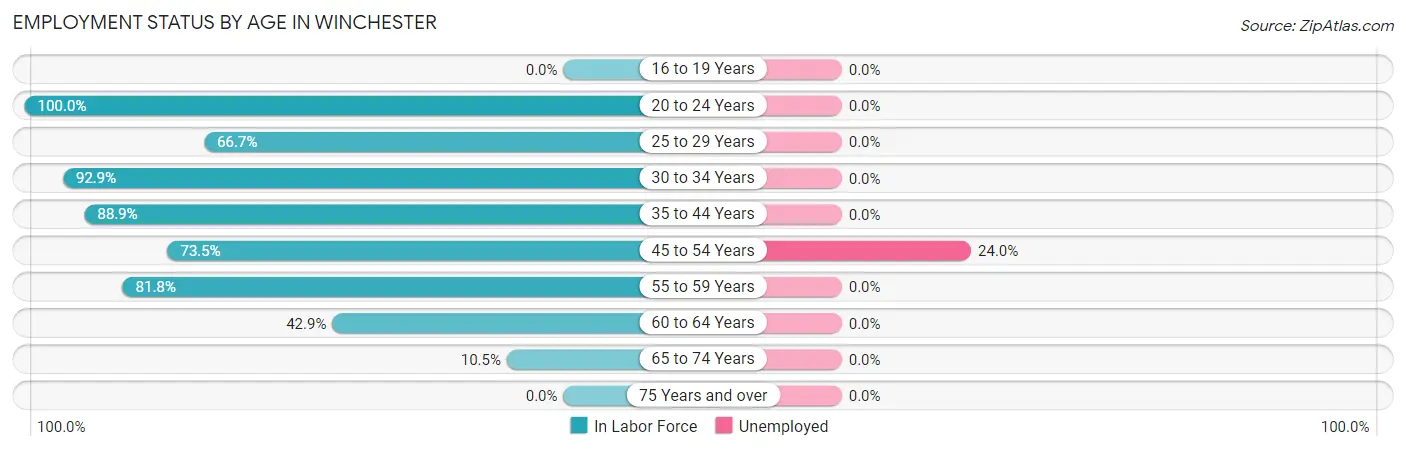
| Age Bracket | In Labor Force | Unemployed |
| 16 to 19 Years | 0 (0.0%) | 0 (0.0%) |
| 20 to 24 Years | 5 (100.0%) | 0 (0.0%) |
| 25 to 29 Years | 6 (66.7%) | 0 (0.0%) |
| 30 to 34 Years | 13 (92.9%) | 0 (0.0%) |
| 35 to 44 Years | 24 (88.9%) | 0 (0.0%) |
| 45 to 54 Years | 25 (73.5%) | 6 (24.0%) |
| 55 to 59 Years | 18 (81.8%) | 0 (0.0%) |
| 60 to 64 Years | 9 (42.9%) | 0 (0.0%) |
| 65 to 74 Years | 4 (10.5%) | 0 (0.0%) |
| 75 Years and over | 0 (0.0%) | 0 (0.0%) |
| Total | 104 (45.0%) | 6 (5.8%) |
Employment Status by Educational Attainment in Winchester
According to labor force statistics for Winchester, 74.8% of individuals (95) out of the total population between 25 and 64 years of age (127) are in the labor force, with 6.3% or 6 of them being unemployed. The group with the highest labor force participation rate are those with the educational attainment of less than high school, with 90.0% or 9 individuals in the labor force. Within the labor force, individuals with college / associate degree education have the highest percentage of unemployment, with 12.5% or 6 of them being unemployed.
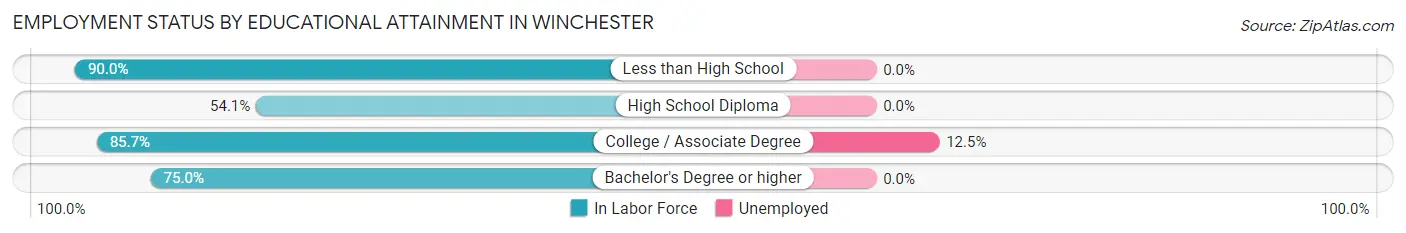
| Educational Attainment | In Labor Force | Unemployed |
| Less than High School | 9 (90.0%) | 0 (0.0%) |
| High School Diploma | 20 (54.1%) | 0 (0.0%) |
| College / Associate Degree | 48 (85.7%) | 7 (12.5%) |
| Bachelor's Degree or higher | 18 (75.0%) | 0 (0.0%) |
| Total | 95 (74.8%) | 8 (6.3%) |
Employment Occupations by Sex in Winchester
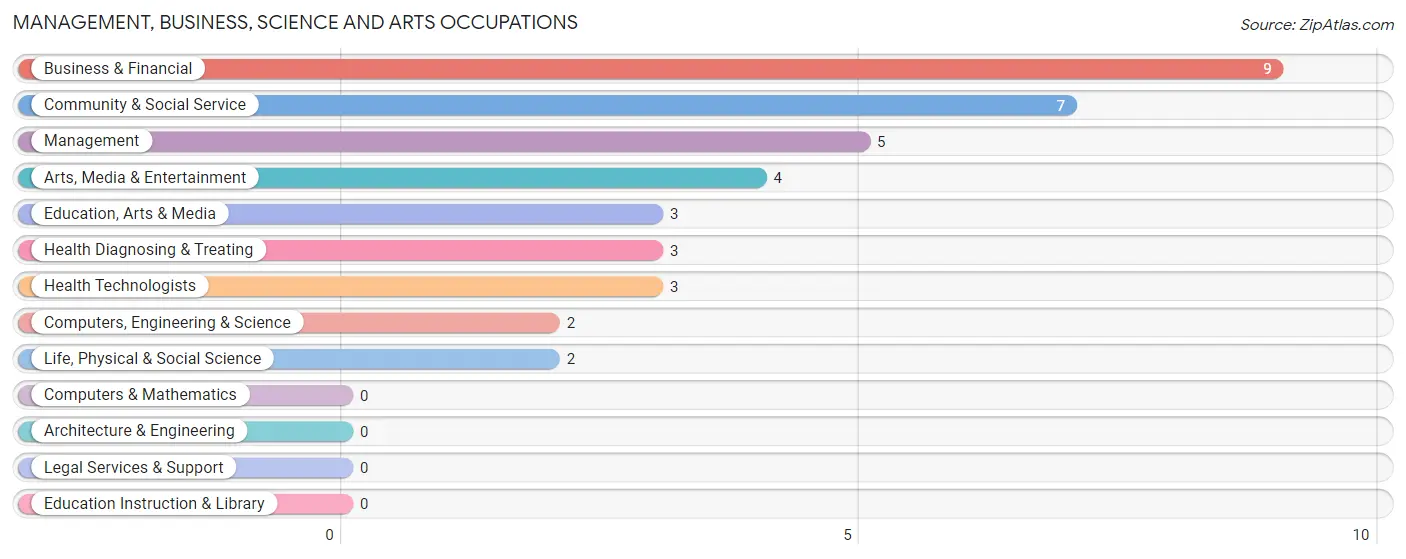
Management, Business, Science and Arts Occupations
The most common Management, Business, Science and Arts occupations in Winchester are Business & Financial (9 | 9.2%), Community & Social Service (7 | 7.1%), Management (5 | 5.1%), Arts, Media & Entertainment (4 | 4.1%), and Education, Arts & Media (3 | 3.1%).
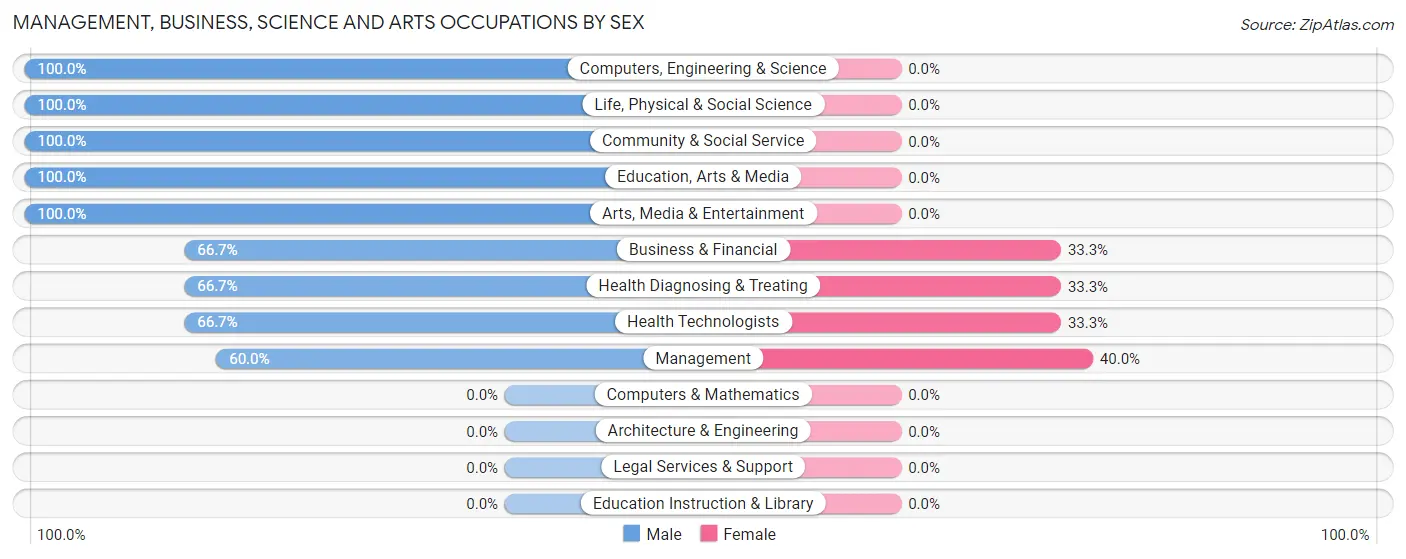
Management, Business, Science and Arts Occupations by Sex
Within the Management, Business, Science and Arts occupations in Winchester, the most male-oriented occupations are Computers, Engineering & Science (100.0%), Life, Physical & Social Science (100.0%), and Community & Social Service (100.0%), while the most female-oriented occupations are Management (40.0%), Business & Financial (33.3%), and Health Diagnosing & Treating (33.3%).
| Occupation | Male | Female |
| Management | 3 (60.0%) | 2 (40.0%) |
| Business & Financial | 6 (66.7%) | 3 (33.3%) |
| Computers, Engineering & Science | 2 (100.0%) | 0 (0.0%) |
| Computers & Mathematics | 0 (0.0%) | 0 (0.0%) |
| Architecture & Engineering | 0 (0.0%) | 0 (0.0%) |
| Life, Physical & Social Science | 2 (100.0%) | 0 (0.0%) |
| Community & Social Service | 7 (100.0%) | 0 (0.0%) |
| Education, Arts & Media | 3 (100.0%) | 0 (0.0%) |
| Legal Services & Support | 0 (0.0%) | 0 (0.0%) |
| Education Instruction & Library | 0 (0.0%) | 0 (0.0%) |
| Arts, Media & Entertainment | 4 (100.0%) | 0 (0.0%) |
| Health Diagnosing & Treating | 2 (66.7%) | 1 (33.3%) |
| Health Technologists | 2 (66.7%) | 1 (33.3%) |
| Total (Category) | 20 (76.9%) | 6 (23.1%) |
| Total (Overall) | 59 (60.2%) | 39 (39.8%) |
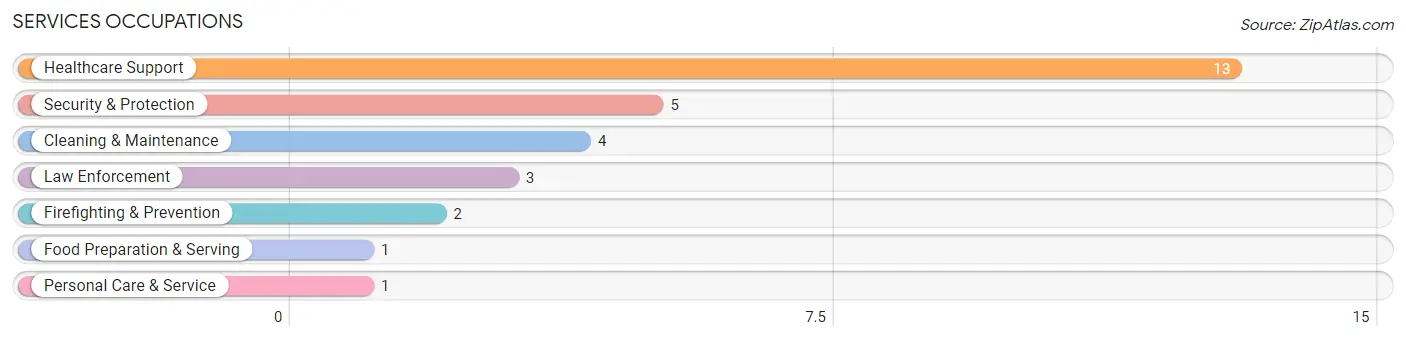
Services Occupations
The most common Services occupations in Winchester are Healthcare Support (13 | 13.3%), Security & Protection (5 | 5.1%), Cleaning & Maintenance (4 | 4.1%), Law Enforcement (3 | 3.1%), and Firefighting & Prevention (2 | 2.0%).
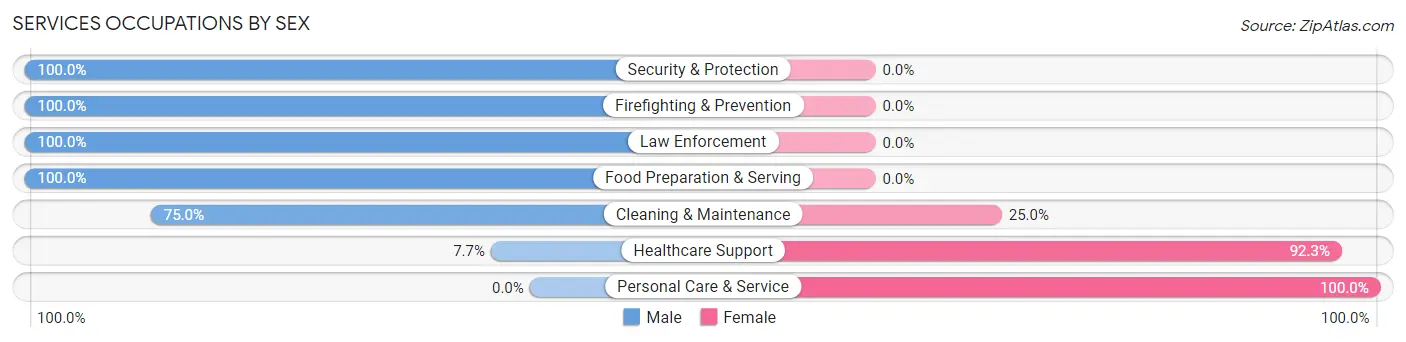
Services Occupations by Sex
Within the Services occupations in Winchester, the most male-oriented occupations are Security & Protection (100.0%), Firefighting & Prevention (100.0%), and Law Enforcement (100.0%), while the most female-oriented occupations are Personal Care & Service (100.0%), Healthcare Support (92.3%), and Cleaning & Maintenance (25.0%).
| Occupation | Male | Female |
| Healthcare Support | 1 (7.7%) | 12 (92.3%) |
| Security & Protection | 5 (100.0%) | 0 (0.0%) |
| Firefighting & Prevention | 2 (100.0%) | 0 (0.0%) |
| Law Enforcement | 3 (100.0%) | 0 (0.0%) |
| Food Preparation & Serving | 1 (100.0%) | 0 (0.0%) |
| Cleaning & Maintenance | 3 (75.0%) | 1 (25.0%) |
| Personal Care & Service | 0 (0.0%) | 1 (100.0%) |
| Total (Category) | 10 (41.7%) | 14 (58.3%) |
| Total (Overall) | 59 (60.2%) | 39 (39.8%) |
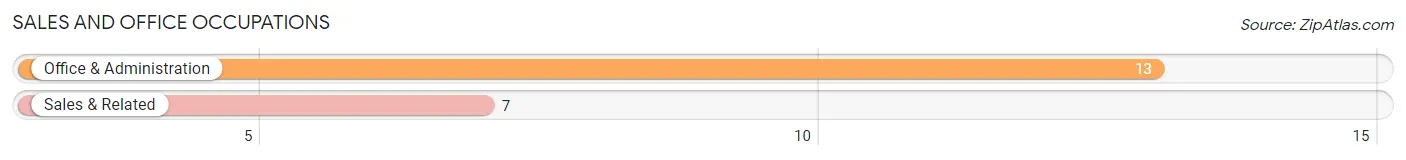
Sales and Office Occupations
The most common Sales and Office occupations in Winchester are Office & Administration (13 | 13.3%), and Sales & Related (7 | 7.1%).
Sales and Office Occupations by Sex
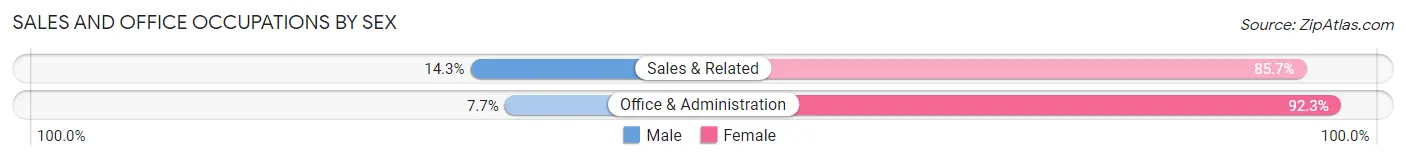
| Occupation | Male | Female |
| Sales & Related | 1 (14.3%) | 6 (85.7%) |
| Office & Administration | 1 (7.7%) | 12 (92.3%) |
| Total (Category) | 2 (10.0%) | 18 (90.0%) |
| Total (Overall) | 59 (60.2%) | 39 (39.8%) |
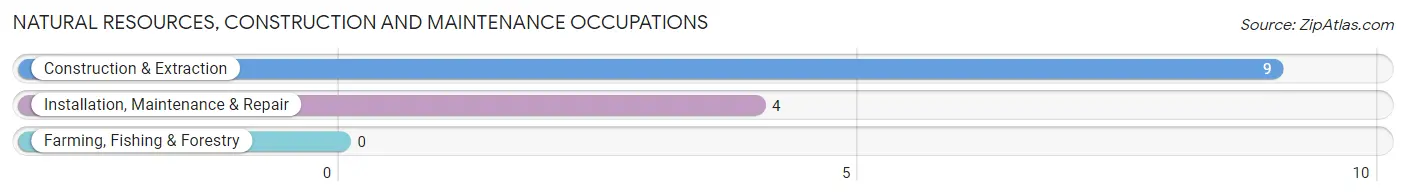
Natural Resources, Construction and Maintenance Occupations
The most common Natural Resources, Construction and Maintenance occupations in Winchester are Construction & Extraction (9 | 9.2%), and Installation, Maintenance & Repair (4 | 4.1%).
Natural Resources, Construction and Maintenance Occupations by Sex
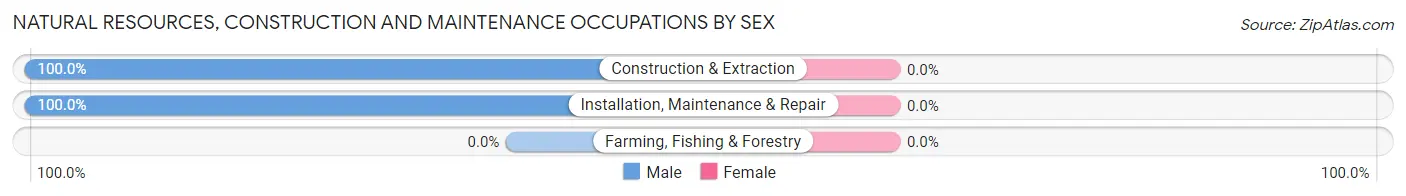
| Occupation | Male | Female |
| Farming, Fishing & Forestry | 0 (0.0%) | 0 (0.0%) |
| Construction & Extraction | 9 (100.0%) | 0 (0.0%) |
| Installation, Maintenance & Repair | 4 (100.0%) | 0 (0.0%) |
| Total (Category) | 13 (100.0%) | 0 (0.0%) |
| Total (Overall) | 59 (60.2%) | 39 (39.8%) |
Production, Transportation and Moving Occupations
The most common Production, Transportation and Moving occupations in Winchester are Production (9 | 9.2%), and Transportation (6 | 6.1%).
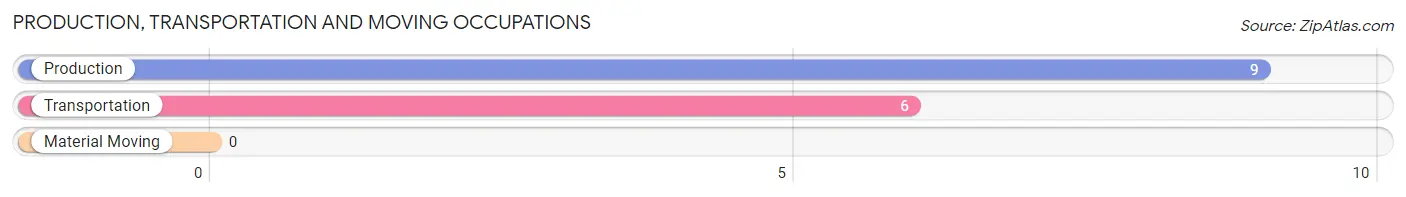
Production, Transportation and Moving Occupations by Sex
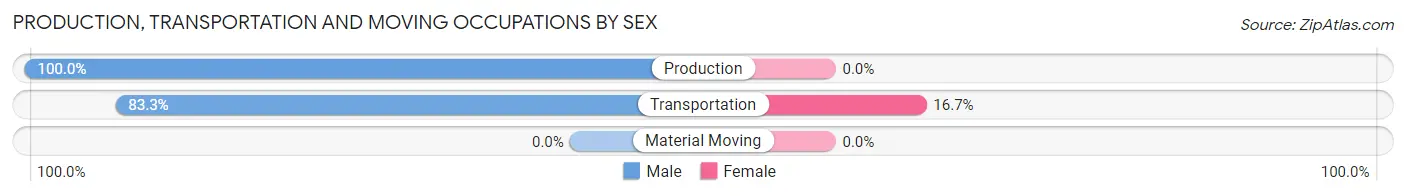
| Occupation | Male | Female |
| Production | 9 (100.0%) | 0 (0.0%) |
| Transportation | 5 (83.3%) | 1 (16.7%) |
| Material Moving | 0 (0.0%) | 0 (0.0%) |
| Total (Category) | 14 (93.3%) | 1 (6.7%) |
| Total (Overall) | 59 (60.2%) | 39 (39.8%) |
Employment Industries by Sex in Winchester
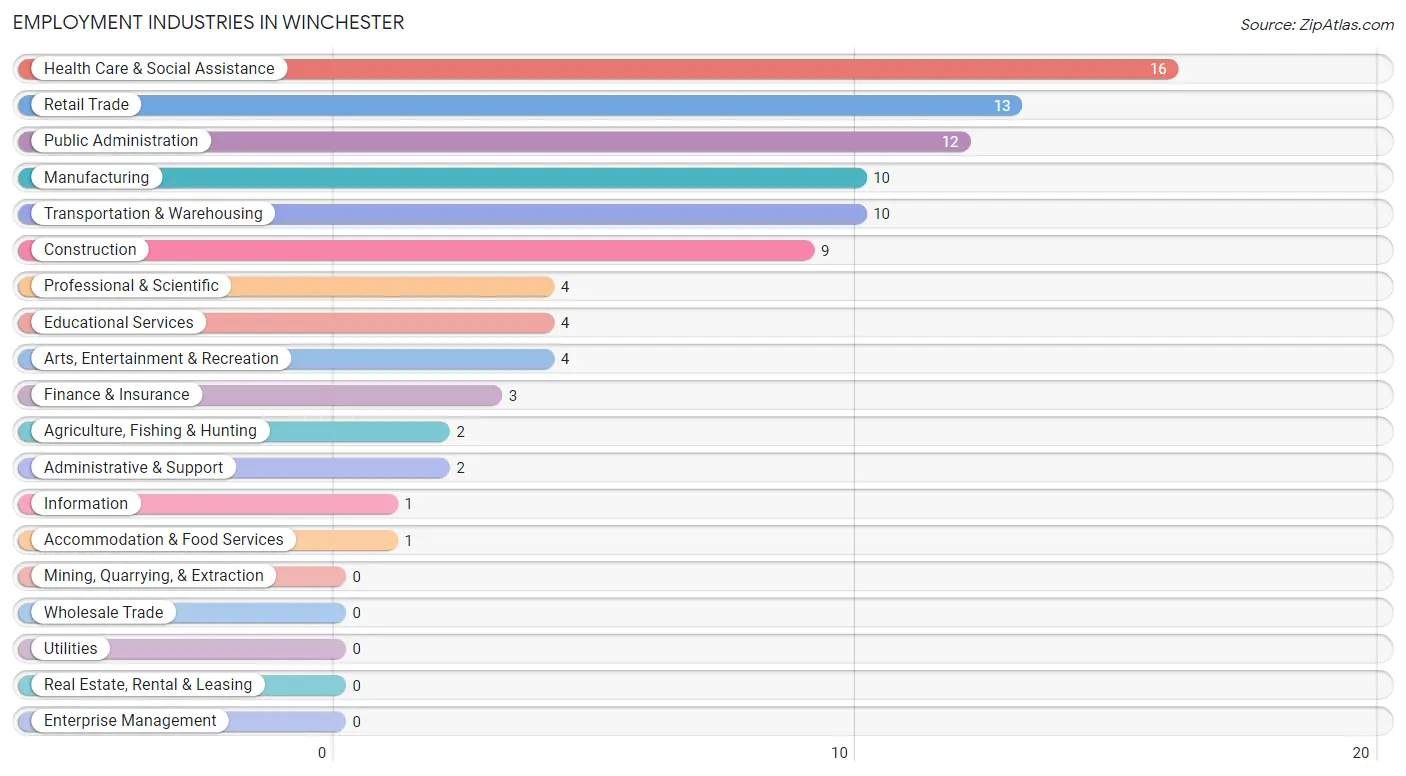
Employment Industries in Winchester
The major employment industries in Winchester include Health Care & Social Assistance (16 | 16.3%), Retail Trade (13 | 13.3%), Public Administration (12 | 12.2%), Manufacturing (10 | 10.2%), and Transportation & Warehousing (10 | 10.2%).
Employment Industries by Sex in Winchester
The Winchester industries that see more men than women are Agriculture, Fishing & Hunting (100.0%), Construction (100.0%), and Manufacturing (100.0%), whereas the industries that tend to have a higher number of women are Health Care & Social Assistance (81.2%), Transportation & Warehousing (70.0%), and Public Administration (58.3%).
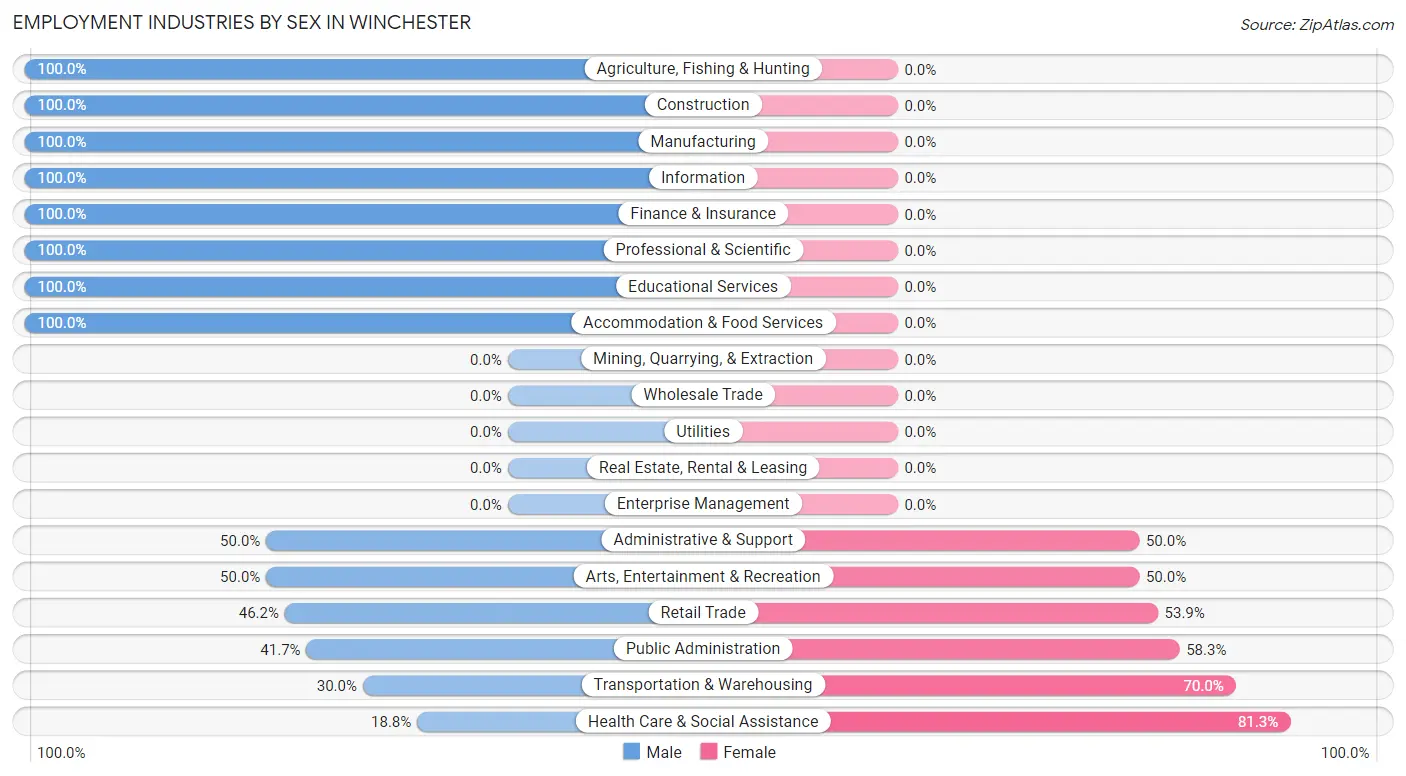
| Industry | Male | Female |
| Agriculture, Fishing & Hunting | 2 (100.0%) | 0 (0.0%) |
| Mining, Quarrying, & Extraction | 0 (0.0%) | 0 (0.0%) |
| Construction | 9 (100.0%) | 0 (0.0%) |
| Manufacturing | 10 (100.0%) | 0 (0.0%) |
| Wholesale Trade | 0 (0.0%) | 0 (0.0%) |
| Retail Trade | 6 (46.2%) | 7 (53.8%) |
| Transportation & Warehousing | 3 (30.0%) | 7 (70.0%) |
| Utilities | 0 (0.0%) | 0 (0.0%) |
| Information | 1 (100.0%) | 0 (0.0%) |
| Finance & Insurance | 3 (100.0%) | 0 (0.0%) |
| Real Estate, Rental & Leasing | 0 (0.0%) | 0 (0.0%) |
| Professional & Scientific | 4 (100.0%) | 0 (0.0%) |
| Enterprise Management | 0 (0.0%) | 0 (0.0%) |
| Administrative & Support | 1 (50.0%) | 1 (50.0%) |
| Educational Services | 4 (100.0%) | 0 (0.0%) |
| Health Care & Social Assistance | 3 (18.8%) | 13 (81.2%) |
| Arts, Entertainment & Recreation | 2 (50.0%) | 2 (50.0%) |
| Accommodation & Food Services | 1 (100.0%) | 0 (0.0%) |
| Public Administration | 5 (41.7%) | 7 (58.3%) |
| Total | 59 (60.2%) | 39 (39.8%) |
Education in Winchester
School Enrollment in Winchester
The most common levels of schooling among the 31 students in Winchester are middle school (11 | 35.5%), high school (10 | 32.3%), and elementary school (5 | 16.1%).
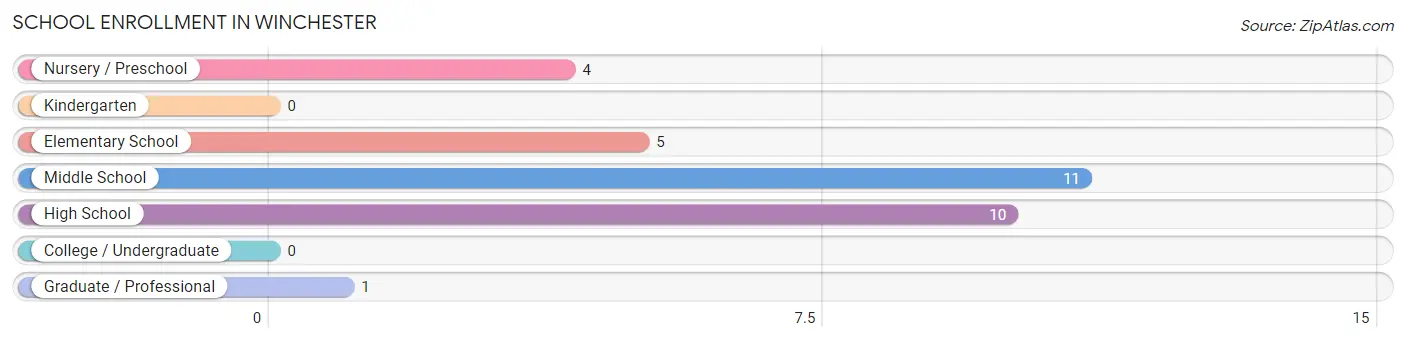
| School Level | # Students | % Students |
| Nursery / Preschool | 4 | 12.9% |
| Kindergarten | 0 | 0.0% |
| Elementary School | 5 | 16.1% |
| Middle School | 11 | 35.5% |
| High School | 10 | 32.3% |
| College / Undergraduate | 0 | 0.0% |
| Graduate / Professional | 1 | 3.2% |
| Total | 31 | 100.0% |
School Enrollment by Age by Funding Source in Winchester
Out of a total of 31 students who are enrolled in schools in Winchester, 5 (16.1%) attend a private institution, while the remaining 26 (83.9%) are enrolled in public schools. The age group of 35 years and over has the highest likelihood of being enrolled in private schools, with 1 (100.0% in the age bracket) enrolled. Conversely, the age group of 3 to 4 year olds has the lowest likelihood of being enrolled in a private school, with 4 (100.0% in the age bracket) attending a public institution.
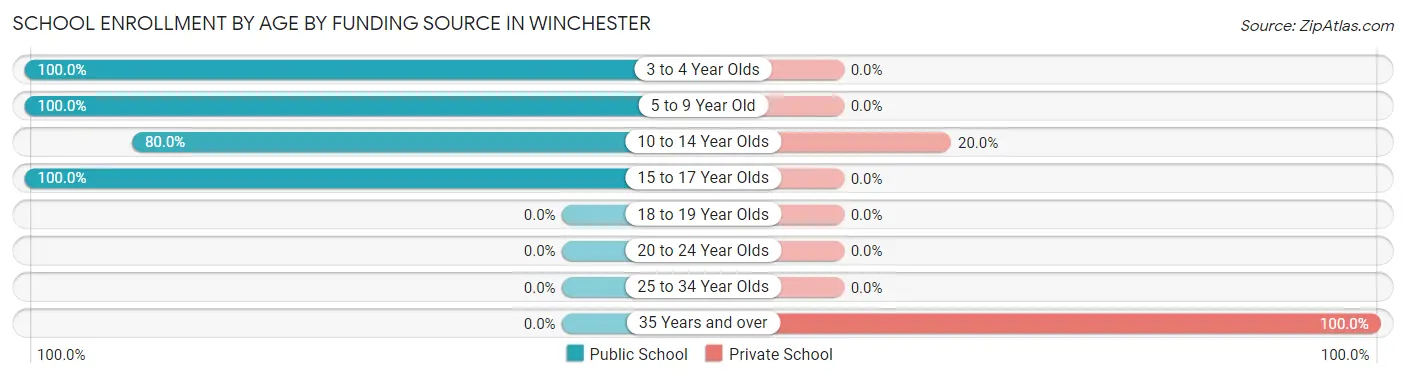
| Age Bracket | Public School | Private School |
| 3 to 4 Year Olds | 4 (100.0%) | 0 (0.0%) |
| 5 to 9 Year Old | 1 (100.0%) | 0 (0.0%) |
| 10 to 14 Year Olds | 16 (80.0%) | 4 (20.0%) |
| 15 to 17 Year Olds | 5 (100.0%) | 0 (0.0%) |
| 18 to 19 Year Olds | 0 (0.0%) | 0 (0.0%) |
| 20 to 24 Year Olds | 0 (0.0%) | 0 (0.0%) |
| 25 to 34 Year Olds | 0 (0.0%) | 0 (0.0%) |
| 35 Years and over | 0 (0.0%) | 1 (100.0%) |
| Total | 26 (83.9%) | 5 (16.1%) |
Educational Attainment by Field of Study in Winchester
Business (8 | 23.5%), science & technology (6 | 17.6%), computers & mathematics (4 | 11.8%), bio, nature & agricultural (4 | 11.8%), and liberal arts & history (4 | 11.8%) are the most common fields of study among 34 individuals in Winchester who have obtained a bachelor's degree or higher.
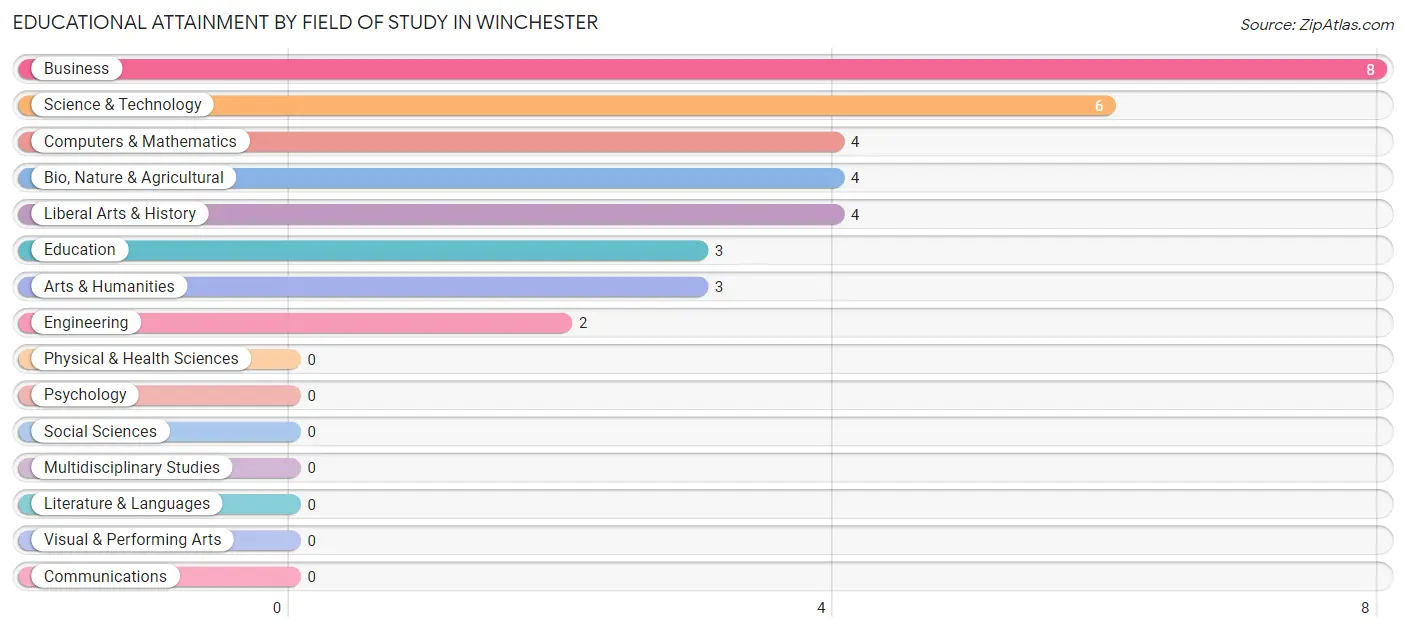
| Field of Study | # Graduates | % Graduates |
| Computers & Mathematics | 4 | 11.8% |
| Bio, Nature & Agricultural | 4 | 11.8% |
| Physical & Health Sciences | 0 | 0.0% |
| Psychology | 0 | 0.0% |
| Social Sciences | 0 | 0.0% |
| Engineering | 2 | 5.9% |
| Multidisciplinary Studies | 0 | 0.0% |
| Science & Technology | 6 | 17.6% |
| Business | 8 | 23.5% |
| Education | 3 | 8.8% |
| Literature & Languages | 0 | 0.0% |
| Liberal Arts & History | 4 | 11.8% |
| Visual & Performing Arts | 0 | 0.0% |
| Communications | 0 | 0.0% |
| Arts & Humanities | 3 | 8.8% |
| Total | 34 | 100.0% |
Transportation & Commute in Winchester
Vehicle Availability by Sex in Winchester
The most prevalent vehicle ownership categories in Winchester are males with 2 vehicles (20, accounting for 35.1%) and females with 2 vehicles (8, making up 51.3%).
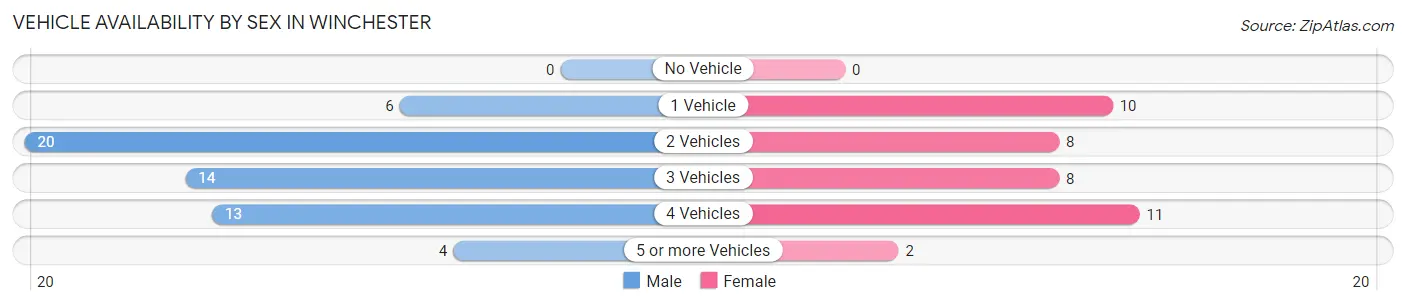
| Vehicles Available | Male | Female |
| No Vehicle | 0 (0.0%) | 0 (0.0%) |
| 1 Vehicle | 6 (10.5%) | 10 (25.6%) |
| 2 Vehicles | 20 (35.1%) | 8 (20.5%) |
| 3 Vehicles | 14 (24.6%) | 8 (20.5%) |
| 4 Vehicles | 13 (22.8%) | 11 (28.2%) |
| 5 or more Vehicles | 4 (7.0%) | 2 (5.1%) |
| Total | 57 (100.0%) | 39 (100.0%) |
Commute Time in Winchester
The most frequently occuring commute durations in Winchester are less than 5 minutes (17 commuters, 19.5%), 40 to 44 minutes (17 commuters, 19.5%), and 5 to 9 minutes (11 commuters, 12.6%).
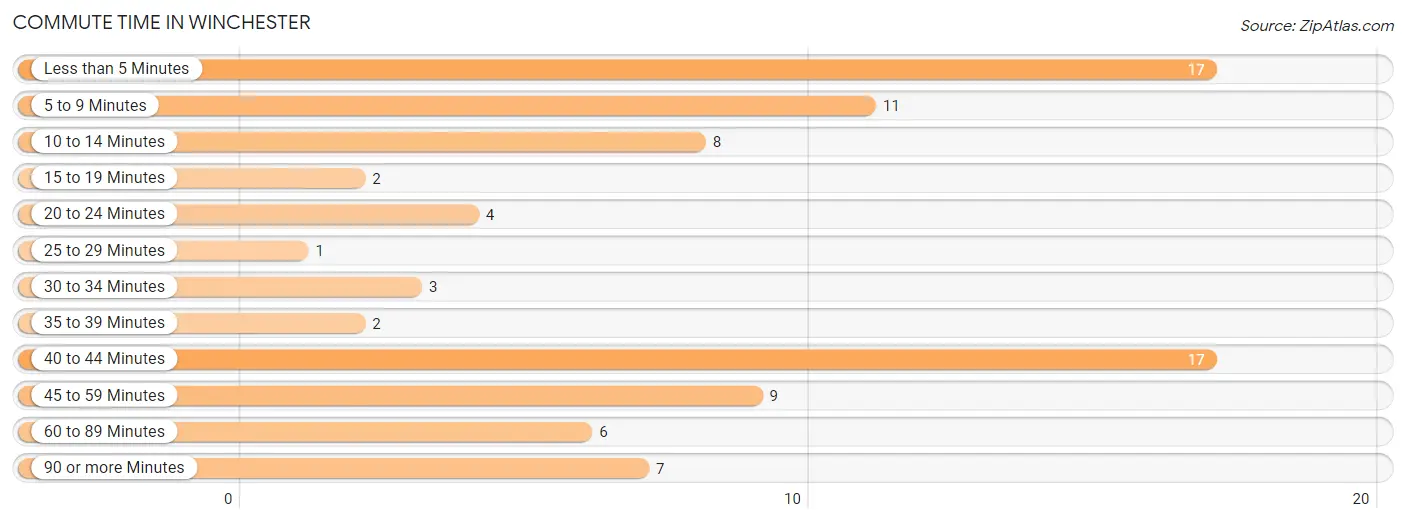
| Commute Time | # Commuters | % Commuters |
| Less than 5 Minutes | 17 | 19.5% |
| 5 to 9 Minutes | 11 | 12.6% |
| 10 to 14 Minutes | 8 | 9.2% |
| 15 to 19 Minutes | 2 | 2.3% |
| 20 to 24 Minutes | 4 | 4.6% |
| 25 to 29 Minutes | 1 | 1.1% |
| 30 to 34 Minutes | 3 | 3.5% |
| 35 to 39 Minutes | 2 | 2.3% |
| 40 to 44 Minutes | 17 | 19.5% |
| 45 to 59 Minutes | 9 | 10.3% |
| 60 to 89 Minutes | 6 | 6.9% |
| 90 or more Minutes | 7 | 8.1% |
Commute Time by Sex in Winchester
The most common commute times in Winchester are 40 to 44 minutes (14 commuters, 27.5%) for males and less than 5 minutes (10 commuters, 27.8%) for females.
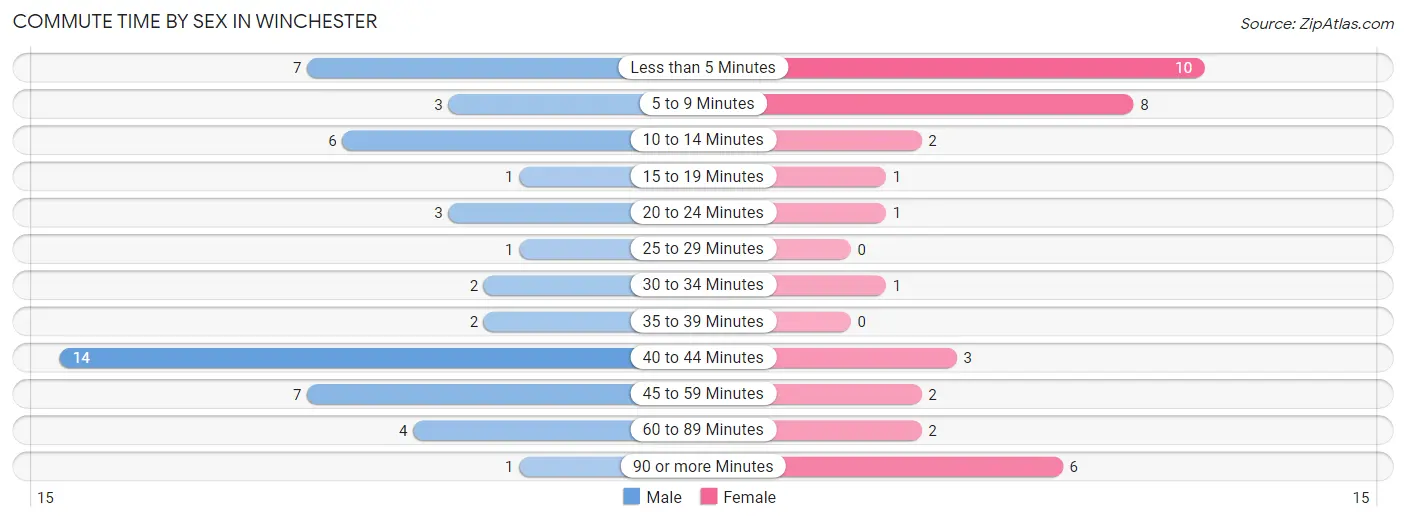
| Commute Time | Male | Female |
| Less than 5 Minutes | 7 (13.7%) | 10 (27.8%) |
| 5 to 9 Minutes | 3 (5.9%) | 8 (22.2%) |
| 10 to 14 Minutes | 6 (11.8%) | 2 (5.6%) |
| 15 to 19 Minutes | 1 (2.0%) | 1 (2.8%) |
| 20 to 24 Minutes | 3 (5.9%) | 1 (2.8%) |
| 25 to 29 Minutes | 1 (2.0%) | 0 (0.0%) |
| 30 to 34 Minutes | 2 (3.9%) | 1 (2.8%) |
| 35 to 39 Minutes | 2 (3.9%) | 0 (0.0%) |
| 40 to 44 Minutes | 14 (27.5%) | 3 (8.3%) |
| 45 to 59 Minutes | 7 (13.7%) | 2 (5.6%) |
| 60 to 89 Minutes | 4 (7.8%) | 2 (5.6%) |
| 90 or more Minutes | 1 (2.0%) | 6 (16.7%) |
Time of Departure to Work by Sex in Winchester
The most frequent times of departure to work in Winchester are 12:00 AM to 4:59 AM (12, 23.5%) for males and 7:30 AM to 7:59 AM (9, 25.0%) for females.
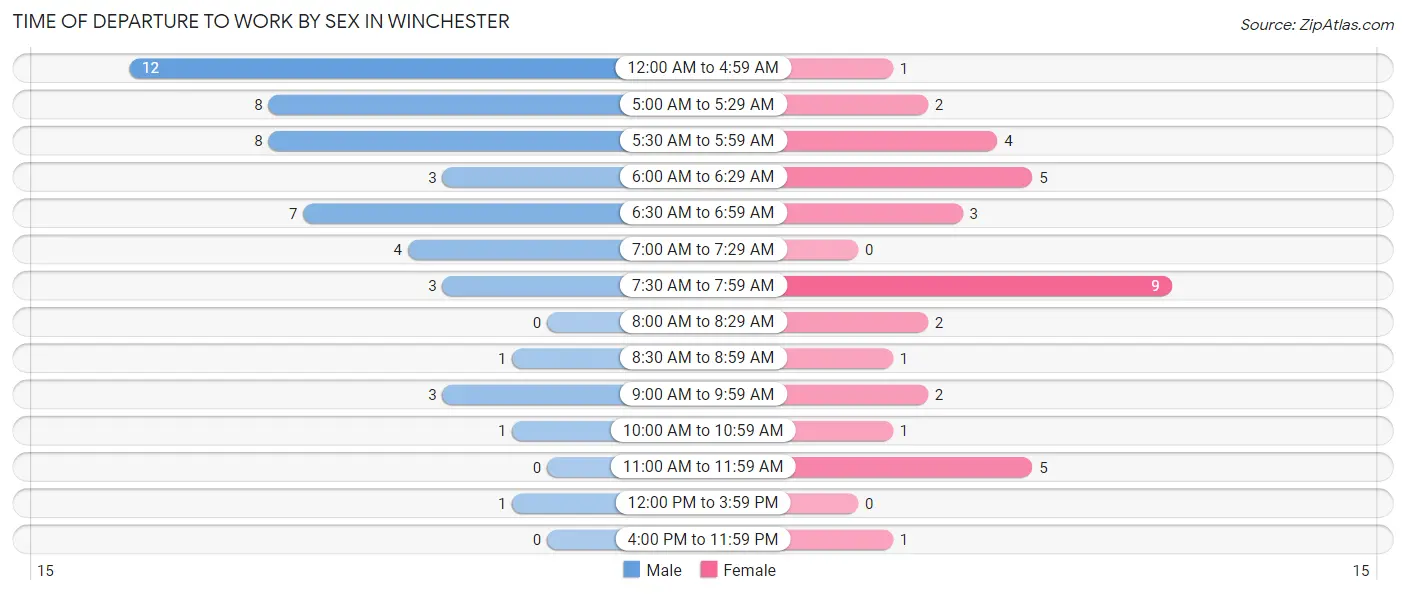
| Time of Departure | Male | Female |
| 12:00 AM to 4:59 AM | 12 (23.5%) | 1 (2.8%) |
| 5:00 AM to 5:29 AM | 8 (15.7%) | 2 (5.6%) |
| 5:30 AM to 5:59 AM | 8 (15.7%) | 4 (11.1%) |
| 6:00 AM to 6:29 AM | 3 (5.9%) | 5 (13.9%) |
| 6:30 AM to 6:59 AM | 7 (13.7%) | 3 (8.3%) |
| 7:00 AM to 7:29 AM | 4 (7.8%) | 0 (0.0%) |
| 7:30 AM to 7:59 AM | 3 (5.9%) | 9 (25.0%) |
| 8:00 AM to 8:29 AM | 0 (0.0%) | 2 (5.6%) |
| 8:30 AM to 8:59 AM | 1 (2.0%) | 1 (2.8%) |
| 9:00 AM to 9:59 AM | 3 (5.9%) | 2 (5.6%) |
| 10:00 AM to 10:59 AM | 1 (2.0%) | 1 (2.8%) |
| 11:00 AM to 11:59 AM | 0 (0.0%) | 5 (13.9%) |
| 12:00 PM to 3:59 PM | 1 (2.0%) | 0 (0.0%) |
| 4:00 PM to 11:59 PM | 0 (0.0%) | 1 (2.8%) |
| Total | 51 (100.0%) | 36 (100.0%) |
Housing Occupancy in Winchester
Occupancy by Ownership in Winchester
Of the total 112 dwellings in Winchester, owner-occupied units account for 82 (73.2%), while renter-occupied units make up 30 (26.8%).
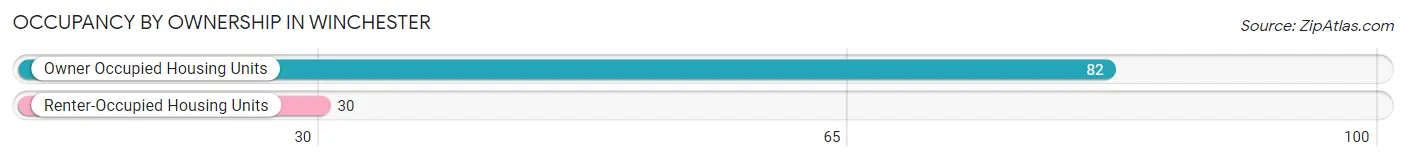
| Occupancy | # Housing Units | % Housing Units |
| Owner Occupied Housing Units | 82 | 73.2% |
| Renter-Occupied Housing Units | 30 | 26.8% |
| Total Occupied Housing Units | 112 | 100.0% |
Occupancy by Household Size in Winchester
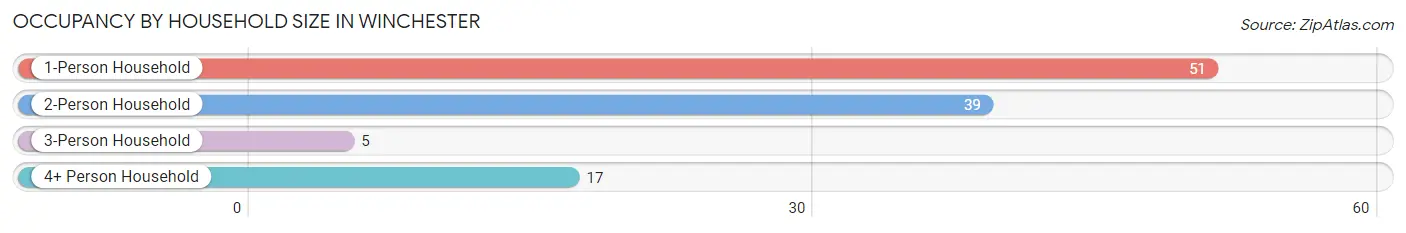
| Household Size | # Housing Units | % Housing Units |
| 1-Person Household | 51 | 45.5% |
| 2-Person Household | 39 | 34.8% |
| 3-Person Household | 5 | 4.5% |
| 4+ Person Household | 17 | 15.2% |
| Total Housing Units | 112 | 100.0% |
Occupancy by Ownership by Household Size in Winchester
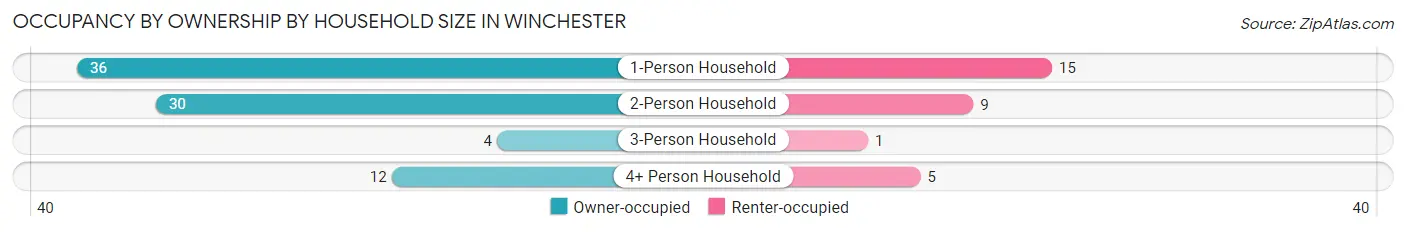
| Household Size | Owner-occupied | Renter-occupied |
| 1-Person Household | 36 (70.6%) | 15 (29.4%) |
| 2-Person Household | 30 (76.9%) | 9 (23.1%) |
| 3-Person Household | 4 (80.0%) | 1 (20.0%) |
| 4+ Person Household | 12 (70.6%) | 5 (29.4%) |
| Total Housing Units | 82 (73.2%) | 30 (26.8%) |
Occupancy by Educational Attainment in Winchester
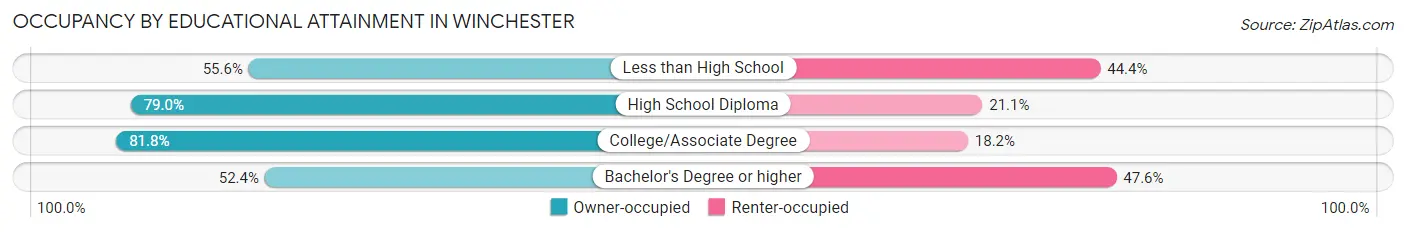
| Household Size | Owner-occupied | Renter-occupied |
| Less than High School | 5 (55.6%) | 4 (44.4%) |
| High School Diploma | 30 (78.9%) | 8 (21.0%) |
| College/Associate Degree | 36 (81.8%) | 8 (18.2%) |
| Bachelor's Degree or higher | 11 (52.4%) | 10 (47.6%) |
Occupancy by Age of Householder in Winchester
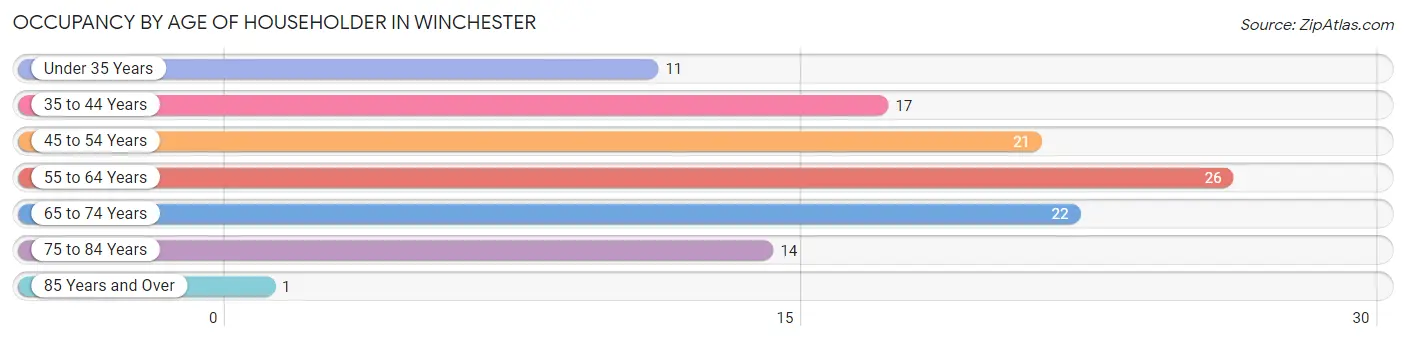
| Age Bracket | # Households | % Households |
| Under 35 Years | 11 | 9.8% |
| 35 to 44 Years | 17 | 15.2% |
| 45 to 54 Years | 21 | 18.8% |
| 55 to 64 Years | 26 | 23.2% |
| 65 to 74 Years | 22 | 19.6% |
| 75 to 84 Years | 14 | 12.5% |
| 85 Years and Over | 1 | 0.9% |
| Total | 112 | 100.0% |
Housing Finances in Winchester
Median Income by Occupancy in Winchester
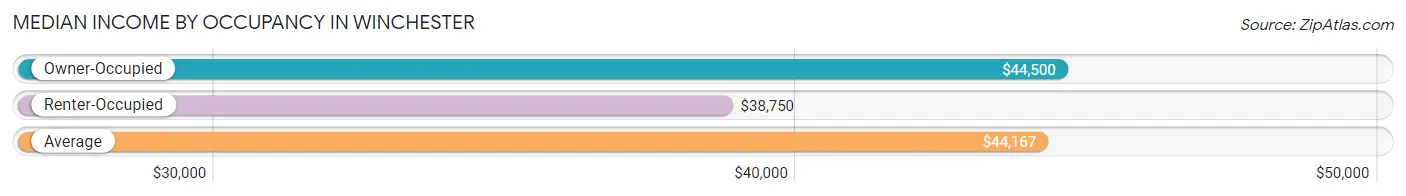
| Occupancy Type | # Households | Median Income |
| Owner-Occupied | 82 (73.2%) | $44,500 |
| Renter-Occupied | 30 (26.8%) | $38,750 |
| Average | 112 (100.0%) | $44,167 |
Occupancy by Householder Income Bracket in Winchester
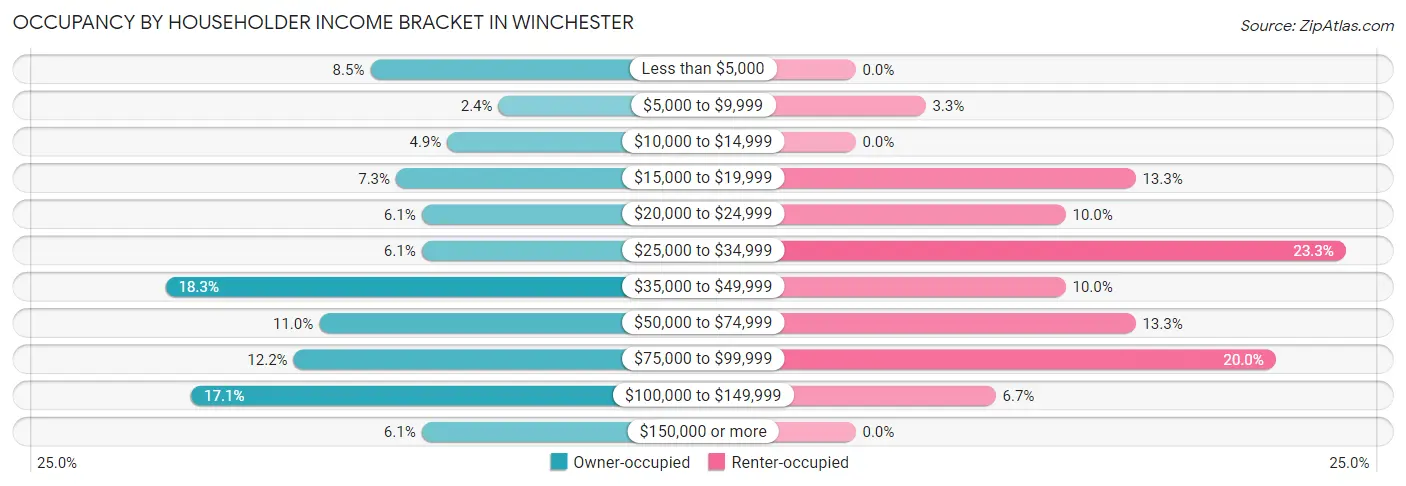
| Income Bracket | Owner-occupied | Renter-occupied |
| Less than $5,000 | 7 (8.5%) | 0 (0.0%) |
| $5,000 to $9,999 | 2 (2.4%) | 1 (3.3%) |
| $10,000 to $14,999 | 4 (4.9%) | 0 (0.0%) |
| $15,000 to $19,999 | 6 (7.3%) | 4 (13.3%) |
| $20,000 to $24,999 | 5 (6.1%) | 3 (10.0%) |
| $25,000 to $34,999 | 5 (6.1%) | 7 (23.3%) |
| $35,000 to $49,999 | 15 (18.3%) | 3 (10.0%) |
| $50,000 to $74,999 | 9 (11.0%) | 4 (13.3%) |
| $75,000 to $99,999 | 10 (12.2%) | 6 (20.0%) |
| $100,000 to $149,999 | 14 (17.1%) | 2 (6.7%) |
| $150,000 or more | 5 (6.1%) | 0 (0.0%) |
| Total | 82 (100.0%) | 30 (100.0%) |
Monthly Housing Cost Tiers in Winchester
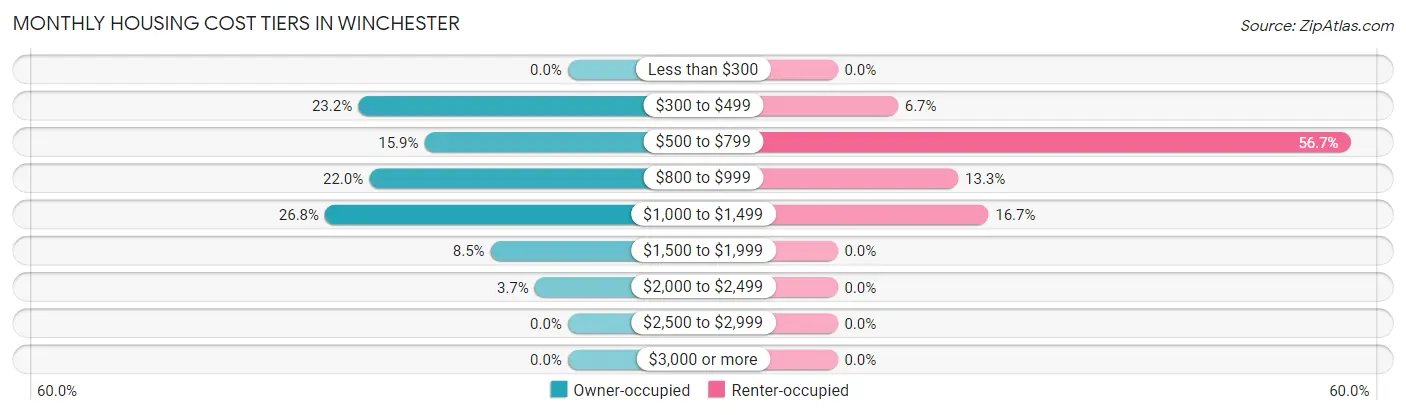
| Monthly Cost | Owner-occupied | Renter-occupied |
| Less than $300 | 0 (0.0%) | 0 (0.0%) |
| $300 to $499 | 19 (23.2%) | 2 (6.7%) |
| $500 to $799 | 13 (15.9%) | 17 (56.7%) |
| $800 to $999 | 18 (22.0%) | 4 (13.3%) |
| $1,000 to $1,499 | 22 (26.8%) | 5 (16.7%) |
| $1,500 to $1,999 | 7 (8.5%) | 0 (0.0%) |
| $2,000 to $2,499 | 3 (3.7%) | 0 (0.0%) |
| $2,500 to $2,999 | 0 (0.0%) | 0 (0.0%) |
| $3,000 or more | 0 (0.0%) | 0 (0.0%) |
| Total | 82 (100.0%) | 30 (100.0%) |
Physical Housing Characteristics in Winchester
Housing Structures in Winchester
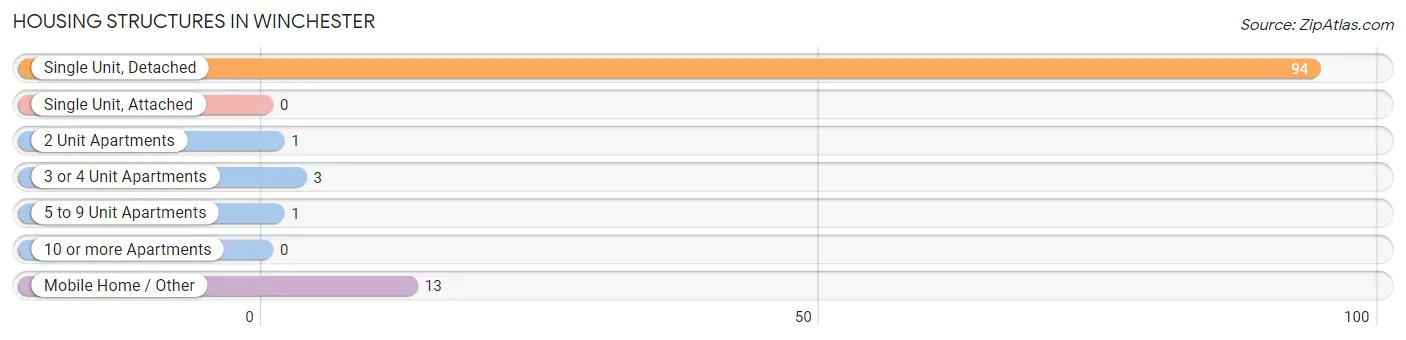
| Structure Type | # Housing Units | % Housing Units |
| Single Unit, Detached | 94 | 83.9% |
| Single Unit, Attached | 0 | 0.0% |
| 2 Unit Apartments | 1 | 0.9% |
| 3 or 4 Unit Apartments | 3 | 2.7% |
| 5 to 9 Unit Apartments | 1 | 0.9% |
| 10 or more Apartments | 0 | 0.0% |
| Mobile Home / Other | 13 | 11.6% |
| Total | 112 | 100.0% |
Housing Structures by Occupancy in Winchester
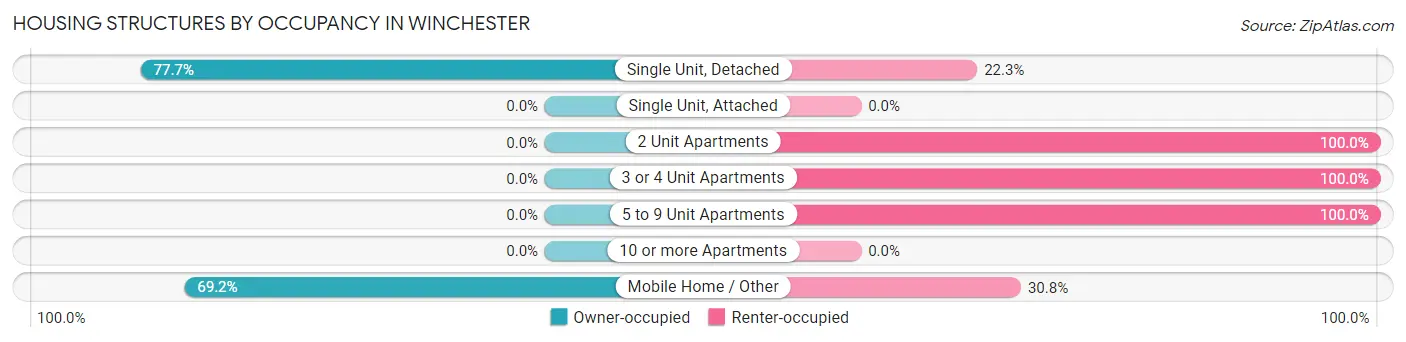
| Structure Type | Owner-occupied | Renter-occupied |
| Single Unit, Detached | 73 (77.7%) | 21 (22.3%) |
| Single Unit, Attached | 0 (0.0%) | 0 (0.0%) |
| 2 Unit Apartments | 0 (0.0%) | 1 (100.0%) |
| 3 or 4 Unit Apartments | 0 (0.0%) | 3 (100.0%) |
| 5 to 9 Unit Apartments | 0 (0.0%) | 1 (100.0%) |
| 10 or more Apartments | 0 (0.0%) | 0 (0.0%) |
| Mobile Home / Other | 9 (69.2%) | 4 (30.8%) |
| Total | 82 (73.2%) | 30 (26.8%) |
Housing Structures by Number of Rooms in Winchester
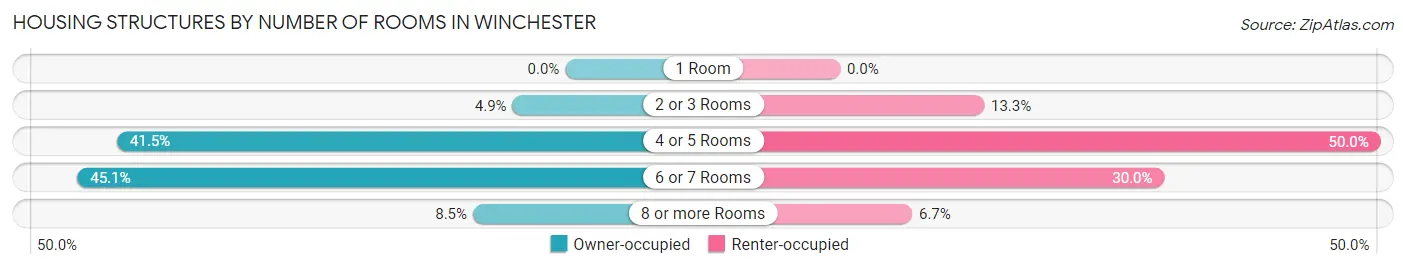
| Number of Rooms | Owner-occupied | Renter-occupied |
| 1 Room | 0 (0.0%) | 0 (0.0%) |
| 2 or 3 Rooms | 4 (4.9%) | 4 (13.3%) |
| 4 or 5 Rooms | 34 (41.5%) | 15 (50.0%) |
| 6 or 7 Rooms | 37 (45.1%) | 9 (30.0%) |
| 8 or more Rooms | 7 (8.5%) | 2 (6.7%) |
| Total | 82 (100.0%) | 30 (100.0%) |
Housing Structure by Heating Type in Winchester
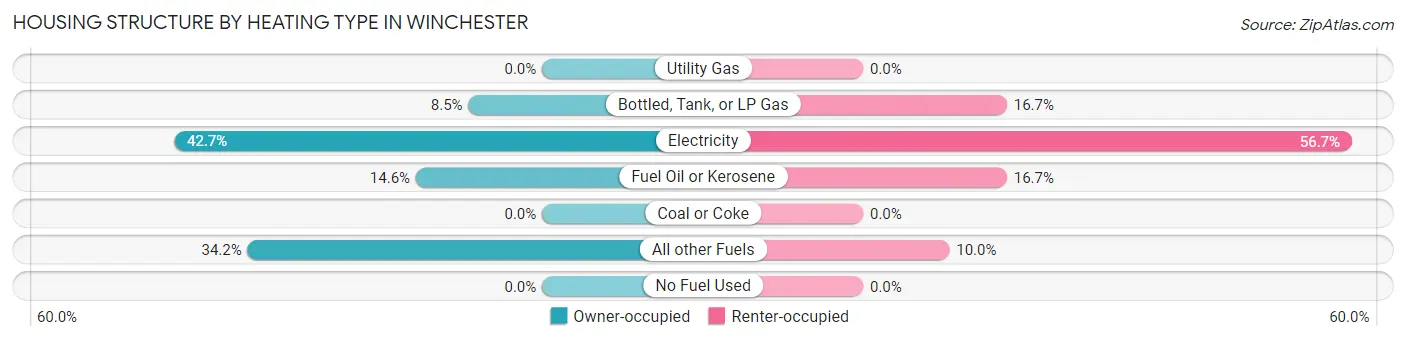
| Heating Type | Owner-occupied | Renter-occupied |
| Utility Gas | 0 (0.0%) | 0 (0.0%) |
| Bottled, Tank, or LP Gas | 7 (8.5%) | 5 (16.7%) |
| Electricity | 35 (42.7%) | 17 (56.7%) |
| Fuel Oil or Kerosene | 12 (14.6%) | 5 (16.7%) |
| Coal or Coke | 0 (0.0%) | 0 (0.0%) |
| All other Fuels | 28 (34.2%) | 3 (10.0%) |
| No Fuel Used | 0 (0.0%) | 0 (0.0%) |
| Total | 82 (100.0%) | 30 (100.0%) |
Household Vehicle Usage in Winchester
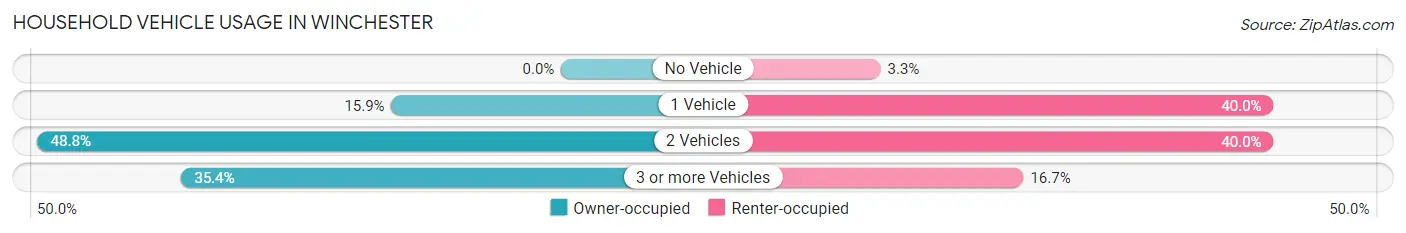
| Vehicles per Household | Owner-occupied | Renter-occupied |
| No Vehicle | 0 (0.0%) | 1 (3.3%) |
| 1 Vehicle | 13 (15.9%) | 12 (40.0%) |
| 2 Vehicles | 40 (48.8%) | 12 (40.0%) |
| 3 or more Vehicles | 29 (35.4%) | 5 (16.7%) |
| Total | 82 (100.0%) | 30 (100.0%) |
Real Estate & Mortgages in Winchester
Real Estate and Mortgage Overview in Winchester
| Characteristic | Without Mortgage | With Mortgage |
| Housing Units | 25 | 57 |
| Median Property Value | $152,500 | $193,800 |
| Median Household Income | $45,625 | $4 |
| Monthly Housing Costs | $444 | $0 |
| Real Estate Taxes | $1,525 | $2 |
Property Value by Mortgage Status in Winchester
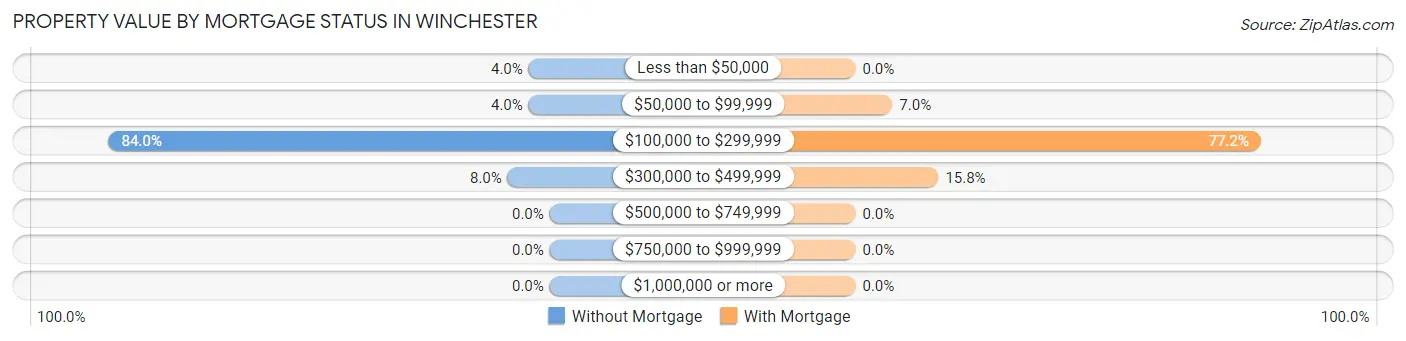
| Property Value | Without Mortgage | With Mortgage |
| Less than $50,000 | 1 (4.0%) | 0 (0.0%) |
| $50,000 to $99,999 | 1 (4.0%) | 4 (7.0%) |
| $100,000 to $299,999 | 21 (84.0%) | 44 (77.2%) |
| $300,000 to $499,999 | 2 (8.0%) | 9 (15.8%) |
| $500,000 to $749,999 | 0 (0.0%) | 0 (0.0%) |
| $750,000 to $999,999 | 0 (0.0%) | 0 (0.0%) |
| $1,000,000 or more | 0 (0.0%) | 0 (0.0%) |
| Total | 25 (100.0%) | 57 (100.0%) |
Household Income by Mortgage Status in Winchester
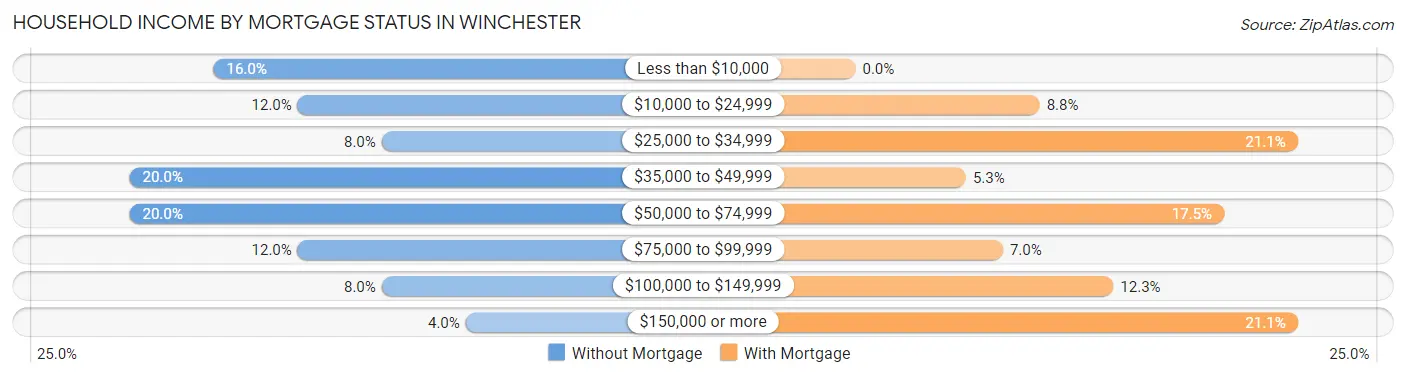
| Household Income | Without Mortgage | With Mortgage |
| Less than $10,000 | 4 (16.0%) | 0 (0.0%) |
| $10,000 to $24,999 | 3 (12.0%) | 5 (8.8%) |
| $25,000 to $34,999 | 2 (8.0%) | 12 (21.0%) |
| $35,000 to $49,999 | 5 (20.0%) | 3 (5.3%) |
| $50,000 to $74,999 | 5 (20.0%) | 10 (17.5%) |
| $75,000 to $99,999 | 3 (12.0%) | 4 (7.0%) |
| $100,000 to $149,999 | 2 (8.0%) | 7 (12.3%) |
| $150,000 or more | 1 (4.0%) | 12 (21.0%) |
| Total | 25 (100.0%) | 57 (100.0%) |
Property Value to Household Income Ratio in Winchester
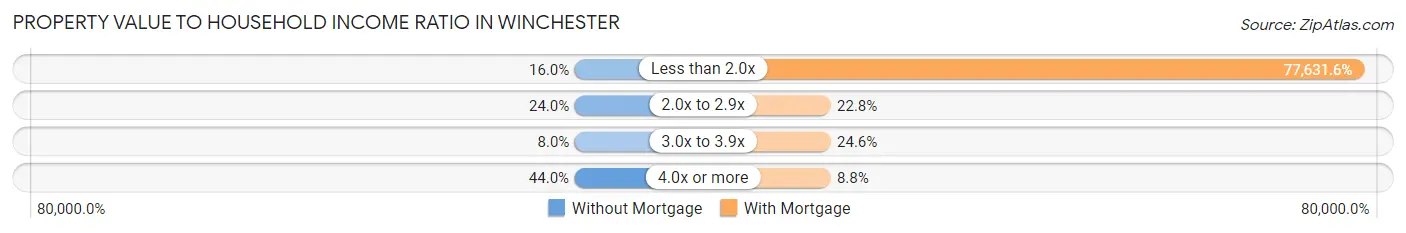
| Value-to-Income Ratio | Without Mortgage | With Mortgage |
| Less than 2.0x | 4 (16.0%) | 44,250 (77,631.6%) |
| 2.0x to 2.9x | 6 (24.0%) | 13 (22.8%) |
| 3.0x to 3.9x | 2 (8.0%) | 14 (24.6%) |
| 4.0x or more | 11 (44.0%) | 5 (8.8%) |
| Total | 25 (100.0%) | 57 (100.0%) |
Real Estate Taxes by Mortgage Status in Winchester
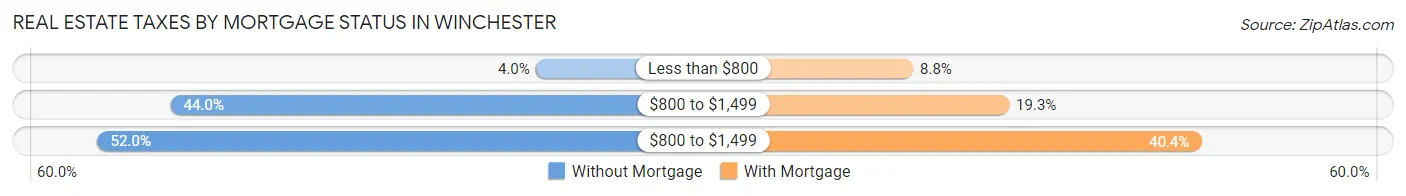
| Property Taxes | Without Mortgage | With Mortgage |
| Less than $800 | 1 (4.0%) | 5 (8.8%) |
| $800 to $1,499 | 11 (44.0%) | 11 (19.3%) |
| $800 to $1,499 | 13 (52.0%) | 23 (40.4%) |
| Total | 25 (100.0%) | 57 (100.0%) |
Health & Disability in Winchester
Health Insurance Coverage by Age in Winchester
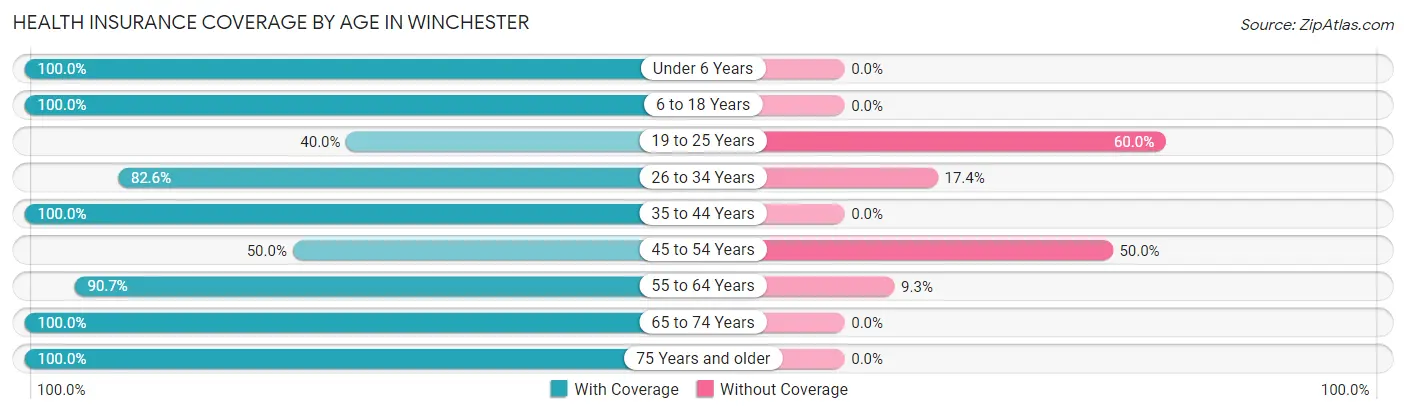
| Age Bracket | With Coverage | Without Coverage |
| Under 6 Years | 10 (100.0%) | 0 (0.0%) |
| 6 to 18 Years | 29 (100.0%) | 0 (0.0%) |
| 19 to 25 Years | 2 (40.0%) | 3 (60.0%) |
| 26 to 34 Years | 19 (82.6%) | 4 (17.4%) |
| 35 to 44 Years | 27 (100.0%) | 0 (0.0%) |
| 45 to 54 Years | 17 (50.0%) | 17 (50.0%) |
| 55 to 64 Years | 39 (90.7%) | 4 (9.3%) |
| 65 to 74 Years | 38 (100.0%) | 0 (0.0%) |
| 75 Years and older | 54 (100.0%) | 0 (0.0%) |
| Total | 235 (89.3%) | 28 (10.6%) |
Health Insurance Coverage by Citizenship Status in Winchester
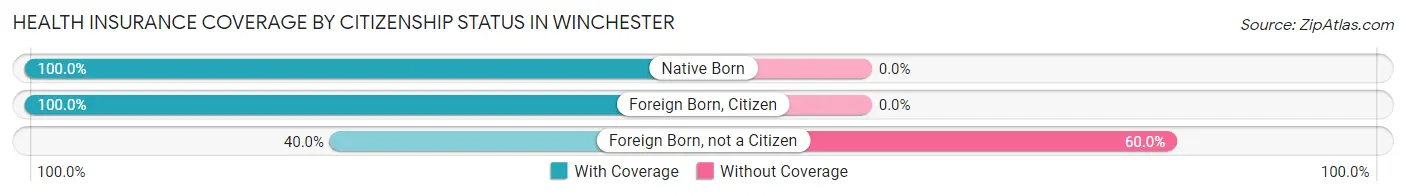
| Citizenship Status | With Coverage | Without Coverage |
| Native Born | 10 (100.0%) | 0 (0.0%) |
| Foreign Born, Citizen | 29 (100.0%) | 0 (0.0%) |
| Foreign Born, not a Citizen | 2 (40.0%) | 3 (60.0%) |
Health Insurance Coverage by Household Income in Winchester
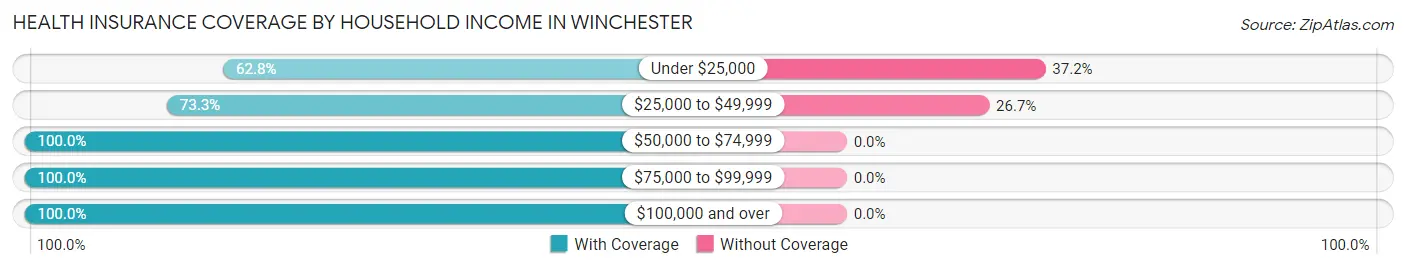
| Household Income | With Coverage | Without Coverage |
| Under $25,000 | 27 (62.8%) | 16 (37.2%) |
| $25,000 to $49,999 | 33 (73.3%) | 12 (26.7%) |
| $50,000 to $74,999 | 36 (100.0%) | 0 (0.0%) |
| $75,000 to $99,999 | 36 (100.0%) | 0 (0.0%) |
| $100,000 and over | 66 (100.0%) | 0 (0.0%) |
Public vs Private Health Insurance Coverage by Age in Winchester
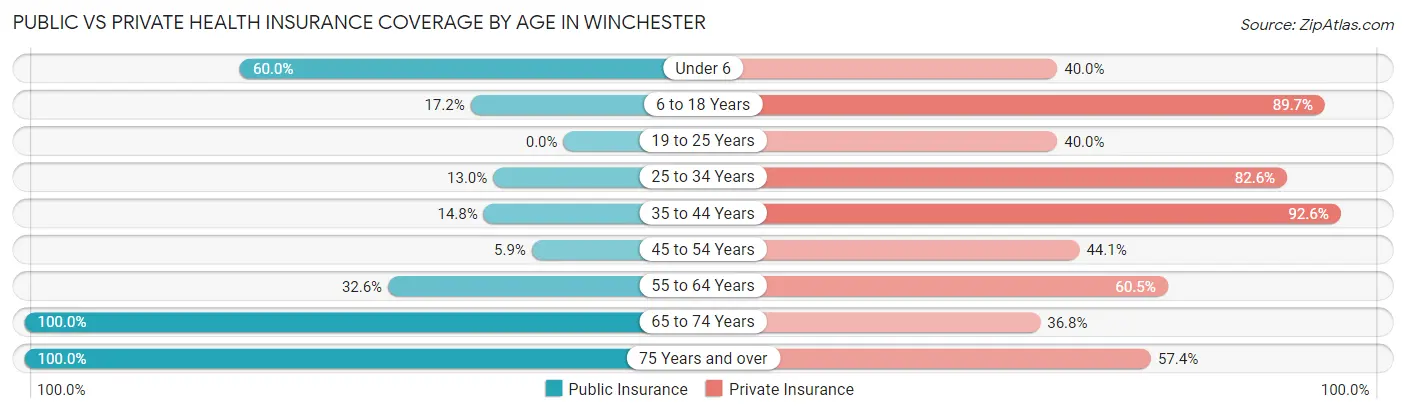
| Age Bracket | Public Insurance | Private Insurance |
| Under 6 | 6 (60.0%) | 4 (40.0%) |
| 6 to 18 Years | 5 (17.2%) | 26 (89.7%) |
| 19 to 25 Years | 0 (0.0%) | 2 (40.0%) |
| 25 to 34 Years | 3 (13.0%) | 19 (82.6%) |
| 35 to 44 Years | 4 (14.8%) | 25 (92.6%) |
| 45 to 54 Years | 2 (5.9%) | 15 (44.1%) |
| 55 to 64 Years | 14 (32.6%) | 26 (60.5%) |
| 65 to 74 Years | 38 (100.0%) | 14 (36.8%) |
| 75 Years and over | 54 (100.0%) | 31 (57.4%) |
| Total | 126 (47.9%) | 162 (61.6%) |
Disability Status by Sex by Age in Winchester
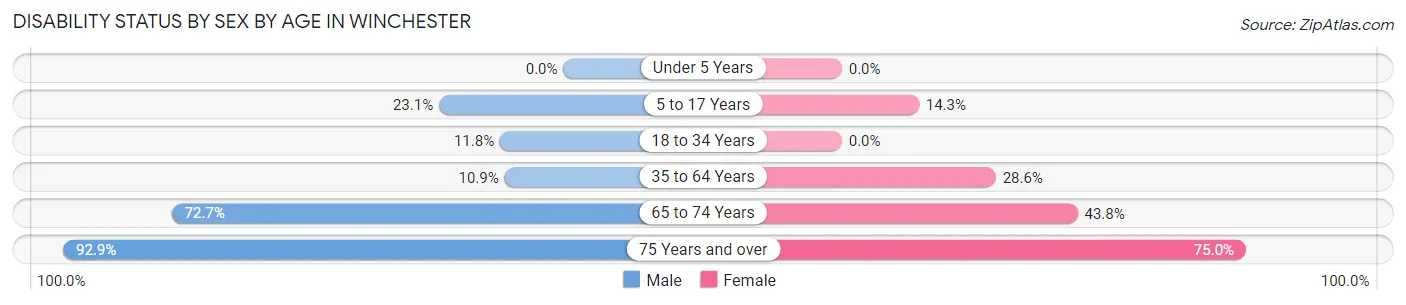
| Age Bracket | Male | Female |
| Under 5 Years | 0 (0.0%) | 0 (0.0%) |
| 5 to 17 Years | 3 (23.1%) | 2 (14.3%) |
| 18 to 34 Years | 2 (11.8%) | 0 (0.0%) |
| 35 to 64 Years | 6 (10.9%) | 14 (28.6%) |
| 65 to 74 Years | 16 (72.7%) | 7 (43.8%) |
| 75 Years and over | 39 (92.9%) | 9 (75.0%) |
Disability Class by Sex by Age in Winchester
Disability Class: Hearing Difficulty
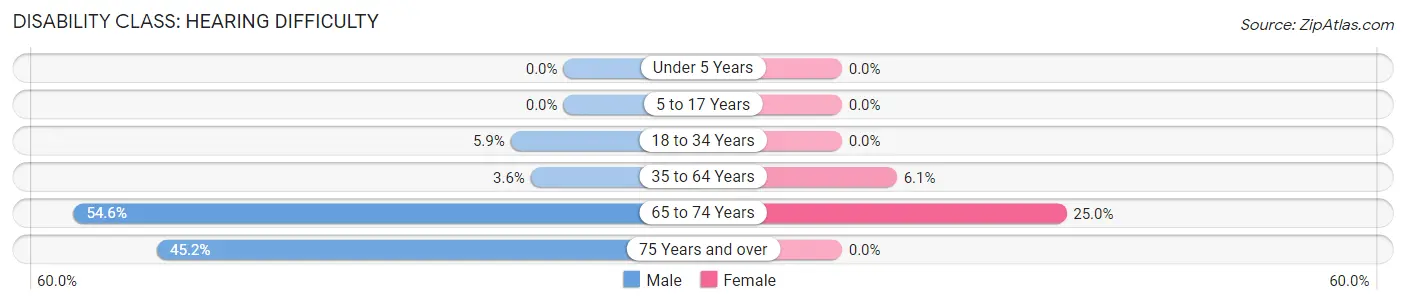
| Age Bracket | Male | Female |
| Under 5 Years | 0 (0.0%) | 0 (0.0%) |
| 5 to 17 Years | 0 (0.0%) | 0 (0.0%) |
| 18 to 34 Years | 1 (5.9%) | 0 (0.0%) |
| 35 to 64 Years | 2 (3.6%) | 3 (6.1%) |
| 65 to 74 Years | 12 (54.5%) | 4 (25.0%) |
| 75 Years and over | 19 (45.2%) | 0 (0.0%) |
Disability Class: Vision Difficulty
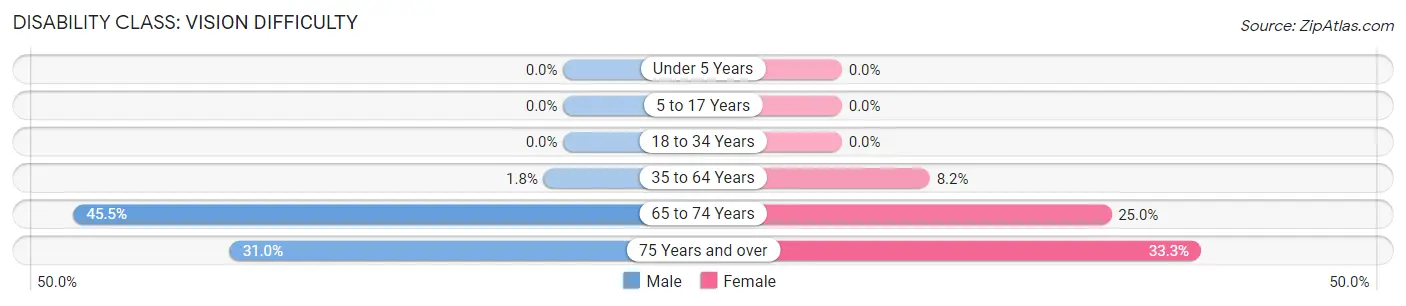
| Age Bracket | Male | Female |
| Under 5 Years | 0 (0.0%) | 0 (0.0%) |
| 5 to 17 Years | 0 (0.0%) | 0 (0.0%) |
| 18 to 34 Years | 0 (0.0%) | 0 (0.0%) |
| 35 to 64 Years | 1 (1.8%) | 4 (8.2%) |
| 65 to 74 Years | 10 (45.5%) | 4 (25.0%) |
| 75 Years and over | 13 (30.9%) | 4 (33.3%) |
Disability Class: Cognitive Difficulty
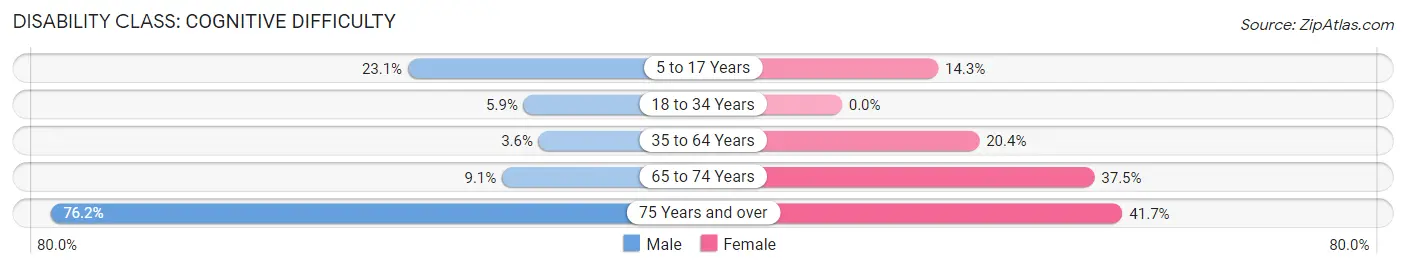
| Age Bracket | Male | Female |
| 5 to 17 Years | 3 (23.1%) | 2 (14.3%) |
| 18 to 34 Years | 1 (5.9%) | 0 (0.0%) |
| 35 to 64 Years | 2 (3.6%) | 10 (20.4%) |
| 65 to 74 Years | 2 (9.1%) | 6 (37.5%) |
| 75 Years and over | 32 (76.2%) | 5 (41.7%) |
Disability Class: Ambulatory Difficulty
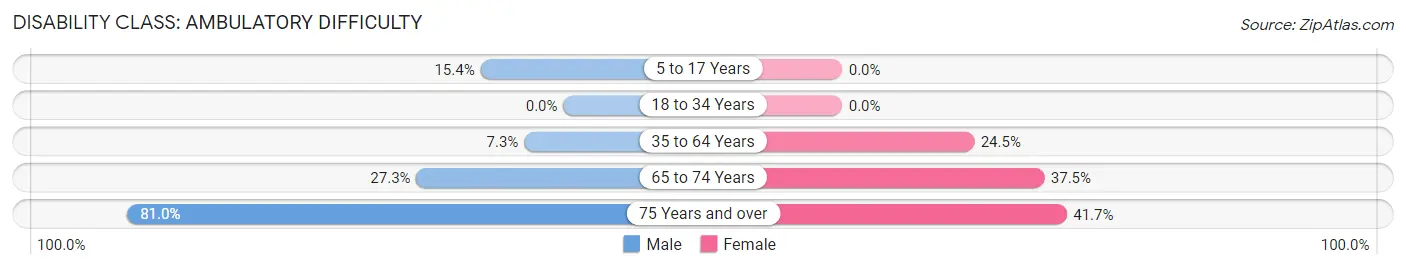
| Age Bracket | Male | Female |
| 5 to 17 Years | 2 (15.4%) | 0 (0.0%) |
| 18 to 34 Years | 0 (0.0%) | 0 (0.0%) |
| 35 to 64 Years | 4 (7.3%) | 12 (24.5%) |
| 65 to 74 Years | 6 (27.3%) | 6 (37.5%) |
| 75 Years and over | 34 (80.9%) | 5 (41.7%) |
Disability Class: Self-Care Difficulty
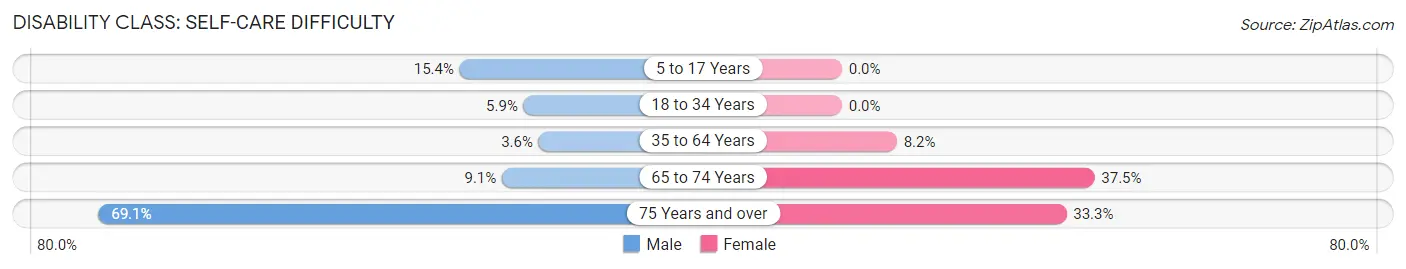
| Age Bracket | Male | Female |
| 5 to 17 Years | 2 (15.4%) | 0 (0.0%) |
| 18 to 34 Years | 1 (5.9%) | 0 (0.0%) |
| 35 to 64 Years | 2 (3.6%) | 4 (8.2%) |
| 65 to 74 Years | 2 (9.1%) | 6 (37.5%) |
| 75 Years and over | 29 (69.1%) | 4 (33.3%) |
Technology Access in Winchester
Computing Device Access in Winchester
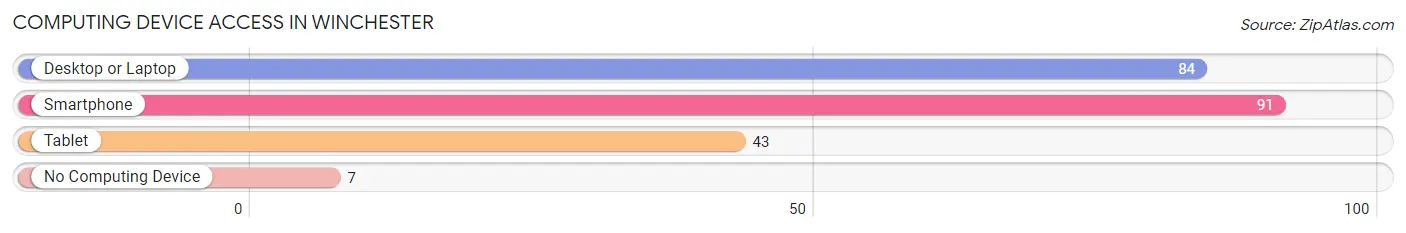
| Device Type | # Households | % Households |
| Desktop or Laptop | 84 | 75.0% |
| Smartphone | 91 | 81.2% |
| Tablet | 43 | 38.4% |
| No Computing Device | 7 | 6.2% |
| Total | 112 | 100.0% |
Internet Access in Winchester
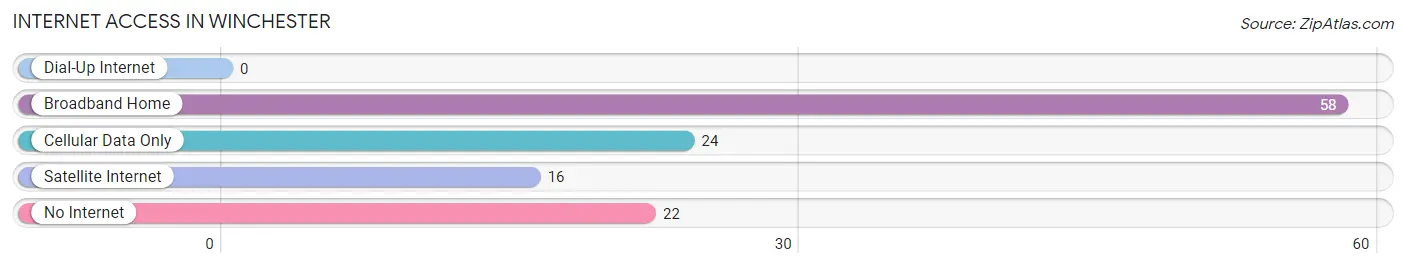
| Internet Type | # Households | % Households |
| Dial-Up Internet | 0 | 0.0% |
| Broadband Home | 58 | 51.8% |
| Cellular Data Only | 24 | 21.4% |
| Satellite Internet | 16 | 14.3% |
| No Internet | 22 | 19.6% |
| Total | 112 | 100.0% |
Winchester Summary
Winchester, Idaho is a small city located in the northern part of the state, in the county of Shoshone. It is situated in the Clearwater River Valley, at an elevation of 2,845 feet. The city is surrounded by the Clearwater National Forest and is home to a population of approximately 1,000 people.
History
The area that is now Winchester was first settled in the late 1800s by miners and loggers. The town was originally known as “Clearwater” and was later renamed “Winchester” in honor of the Winchester Repeating Arms Company. The town was officially incorporated in 1909.
In the early 1900s, Winchester was a bustling mining and logging town. The town was home to several sawmills, a flour mill, a creamery, and a number of other businesses. The town also had a railroad station, which connected it to the rest of the state.
In the 1920s, the town began to decline as the mining and logging industries moved away. The town’s population decreased and many of the businesses closed. The town was revitalized in the 1950s when the Clearwater National Forest was established and the town became a popular destination for outdoor recreation.
Geography
Winchester is located in the northern part of Idaho, in the county of Shoshone. It is situated in the Clearwater River Valley, at an elevation of 2,845 feet. The city is surrounded by the Clearwater National Forest and is home to a population of approximately 1,000 people.
The city is located in a mountainous region and is surrounded by several mountain ranges, including the Bitterroot Mountains, the Clearwater Mountains, and the Selkirk Mountains. The city is also located near several lakes, including Lake Coeur d’Alene, Lake Pend Oreille, and Priest Lake.
Economy
The economy of Winchester is largely based on tourism and outdoor recreation. The city is home to several resorts and campgrounds, as well as a number of restaurants and other businesses catering to tourists. The city is also home to several logging and mining operations, as well as a number of small businesses.
Demographics
As of the 2010 census, the population of Winchester was 1,000 people. The racial makeup of the city was 95.2% White, 0.7% Native American, 0.3% Asian, 0.1% Pacific Islander, 0.1% from other races, and 3.7% from two or more races. The median household income was $35,000 and the median family income was $41,000. The per capita income was $17,000.
Conclusion
Winchester, Idaho is a small city located in the northern part of the state, in the county of Shoshone. It is situated in the Clearwater River Valley, at an elevation of 2,845 feet. The city is surrounded by the Clearwater National Forest and is home to a population of approximately 1,000 people. The economy of Winchester is largely based on tourism and outdoor recreation, and the city is home to several resorts and campgrounds, as well as a number of restaurants and other businesses catering to tourists. The racial makeup of the city is 95.2% White, 0.7% Native American, 0.3% Asian, 0.1% Pacific Islander, 0.1% from other races, and 3.7% from two or more races. The median household income was $35,000 and the median family income was $41,000. The per capita income was $17,000.
Common Questions
What is Per Capita Income in Winchester?
Per Capita income in Winchester is $28,524.
What is the Median Family Income in Winchester?
Median Family Income in Winchester is $66,250.
What is the Median Household income in Winchester?
Median Household Income in Winchester is $44,167.
What is Income or Wage Gap in Winchester?
Income or Wage Gap in Winchester is 51.5%.
Women in Winchester earn 48.5 cents for every dollar earned by a man.
What is Family Income Deficit in Winchester?
Family Income Deficit in Winchester is $8,300.
Families that are below poverty line in Winchester earn $8,300 less on average than the poverty threshold level.
What is Inequality or Gini Index in Winchester?
Inequality or Gini Index in Winchester is 0.44.
What is the Total Population of Winchester?
Total Population of Winchester is 263.
What is the Total Male Population of Winchester?
Total Male Population of Winchester is 157.
What is the Total Female Population of Winchester?
Total Female Population of Winchester is 106.
What is the Ratio of Males per 100 Females in Winchester?
There are 148.11 Males per 100 Females in Winchester.
What is the Ratio of Females per 100 Males in Winchester?
There are 67.52 Females per 100 Males in Winchester.
What is the Median Population Age in Winchester?
Median Population Age in Winchester is 55.9 Years.
What is the Average Family Size in Winchester
Average Family Size in Winchester is 2.8 People.
What is the Average Household Size in Winchester
Average Household Size in Winchester is 2.0 People.
How Large is the Labor Force in Winchester?
There are 104 People in the Labor Forcein in Winchester.
What is the Percentage of People in the Labor Force in Winchester?
45.0% of People are in the Labor Force in Winchester.
What is the Unemployment Rate in Winchester?
Unemployment Rate in Winchester is 5.8%.