Weston, ID Map & Demographics
Weston Map
Weston Overview
$22,822
PER CAPITA INCOME
$79,583
AVG FAMILY INCOME
$80,000
AVG HOUSEHOLD INCOME
45.0%
WAGE / INCOME GAP [ % ]
55.0¢/ $1
WAGE / INCOME GAP [ $ ]
0.27
INEQUALITY / GINI INDEX
527
TOTAL POPULATION
259
MALE POPULATION
268
FEMALE POPULATION
96.64
MALES / 100 FEMALES
103.47
FEMALES / 100 MALES
26.0
MEDIAN AGE
3.7
AVG FAMILY SIZE
3.6
AVG HOUSEHOLD SIZE
218
LABOR FORCE [ PEOPLE ]
65.1%
PERCENT IN LABOR FORCE
6.9%
UNEMPLOYMENT RATE
Weston Zip Codes
Weston Area Codes
Income in Weston
Income Overview in Weston
Per Capita Income in Weston is $22,822, while median incomes of families and households are $79,583 and $80,000 respectively.
| Characteristic | Number | Measure |
| Per Capita Income | 527 | $22,822 |
| Median Family Income | 135 | $79,583 |
| Mean Family Income | 135 | $85,441 |
| Median Household Income | 148 | $80,000 |
| Mean Household Income | 148 | $82,616 |
| Income Deficit | 135 | $0 |
| Wage / Income Gap (%) | 527 | 45.04% |
| Wage / Income Gap ($) | 527 | 54.96¢ per $1 |
| Gini / Inequality Index | 527 | 0.27 |
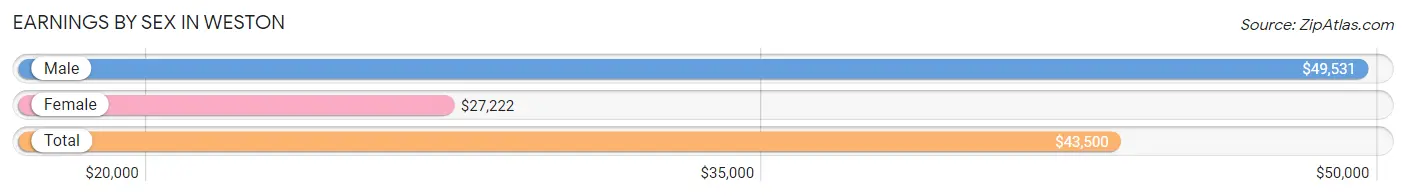
Earnings by Sex in Weston
Average Earnings in Weston are $43,500, $49,531 for men and $27,222 for women, a difference of 45.0%.
| Sex | Number | Average Earnings |
| Male | 152 (64.4%) | $49,531 |
| Female | 84 (35.6%) | $27,222 |
| Total | 236 (100.0%) | $43,500 |
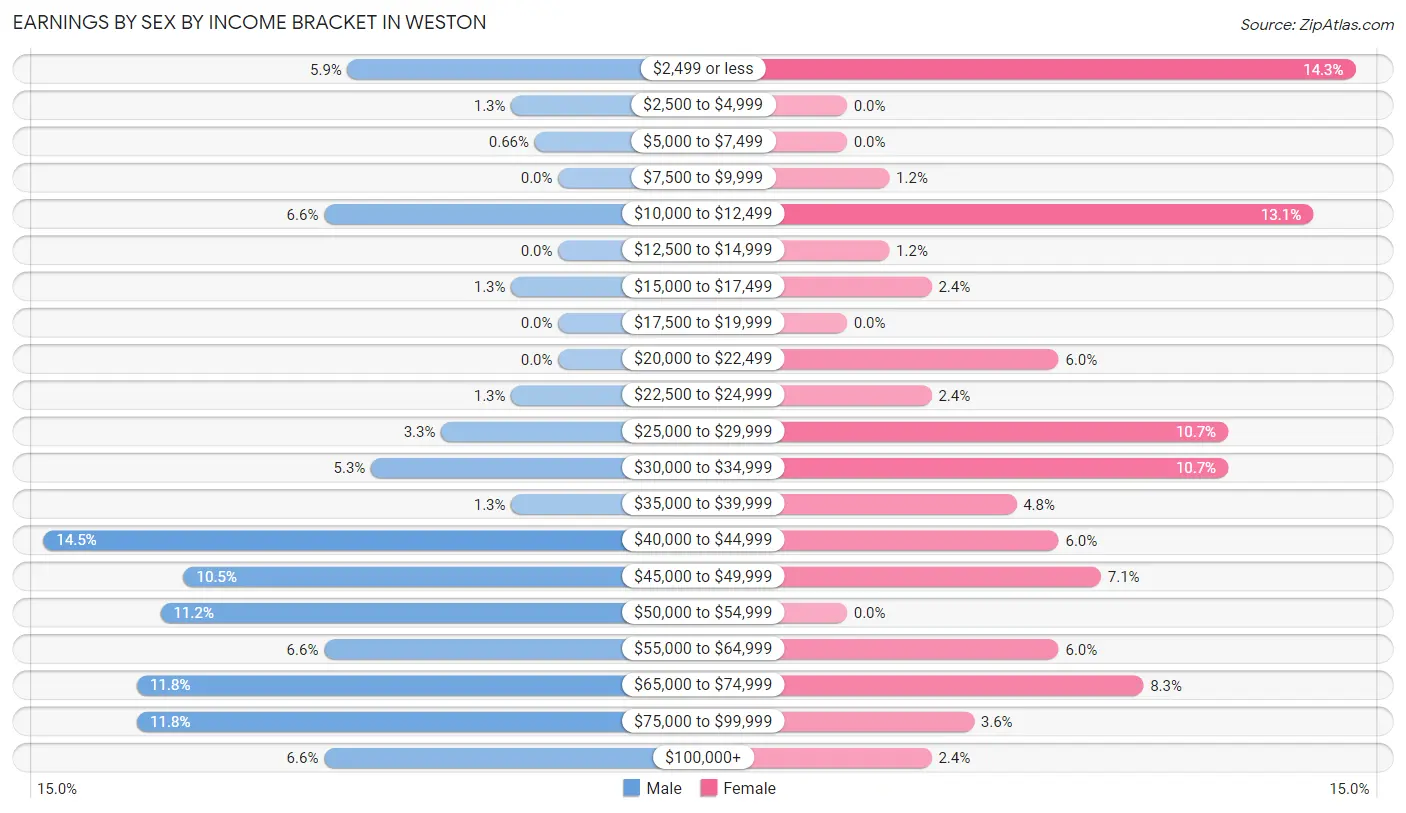
Earnings by Sex by Income Bracket in Weston
The most common earnings brackets in Weston are $40,000 to $44,999 for men (22 | 14.5%) and $2,499 or less for women (12 | 14.3%).
| Income | Male | Female |
| $2,499 or less | 9 (5.9%) | 12 (14.3%) |
| $2,500 to $4,999 | 2 (1.3%) | 0 (0.0%) |
| $5,000 to $7,499 | 1 (0.7%) | 0 (0.0%) |
| $7,500 to $9,999 | 0 (0.0%) | 1 (1.2%) |
| $10,000 to $12,499 | 10 (6.6%) | 11 (13.1%) |
| $12,500 to $14,999 | 0 (0.0%) | 1 (1.2%) |
| $15,000 to $17,499 | 2 (1.3%) | 2 (2.4%) |
| $17,500 to $19,999 | 0 (0.0%) | 0 (0.0%) |
| $20,000 to $22,499 | 0 (0.0%) | 5 (5.9%) |
| $22,500 to $24,999 | 2 (1.3%) | 2 (2.4%) |
| $25,000 to $29,999 | 5 (3.3%) | 9 (10.7%) |
| $30,000 to $34,999 | 8 (5.3%) | 9 (10.7%) |
| $35,000 to $39,999 | 2 (1.3%) | 4 (4.8%) |
| $40,000 to $44,999 | 22 (14.5%) | 5 (5.9%) |
| $45,000 to $49,999 | 16 (10.5%) | 6 (7.1%) |
| $50,000 to $54,999 | 17 (11.2%) | 0 (0.0%) |
| $55,000 to $64,999 | 10 (6.6%) | 5 (5.9%) |
| $65,000 to $74,999 | 18 (11.8%) | 7 (8.3%) |
| $75,000 to $99,999 | 18 (11.8%) | 3 (3.6%) |
| $100,000+ | 10 (6.6%) | 2 (2.4%) |
| Total | 152 (100.0%) | 84 (100.0%) |
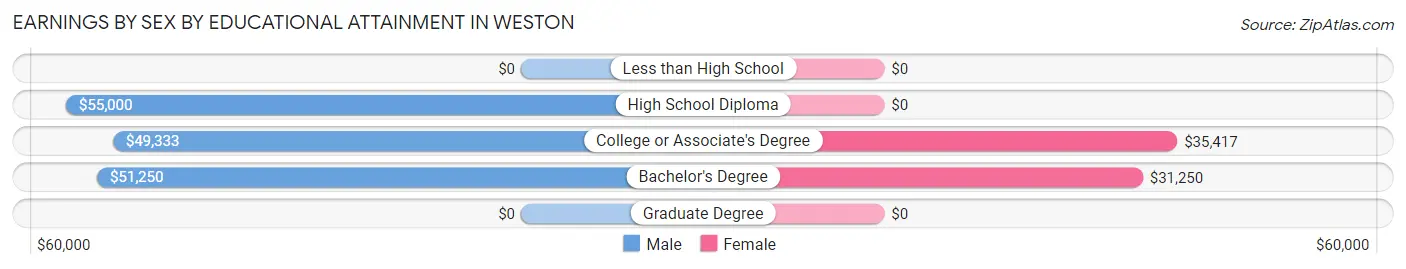
Earnings by Sex by Educational Attainment in Weston
Average earnings in Weston are $52,500 for men and $30,972 for women, a difference of 41.0%. Men with an educational attainment of high school diploma enjoy the highest average annual earnings of $55,000, while those with college or associate's degree education earn the least with $49,333. Women with an educational attainment of college or associate's degree earn the most with the average annual earnings of $35,417, while those with bachelor's degree education have the smallest earnings of $31,250.
| Educational Attainment | Male Income | Female Income |
| Less than High School | - | - |
| High School Diploma | $55,000 | $0 |
| College or Associate's Degree | $49,333 | $35,417 |
| Bachelor's Degree | $51,250 | $31,250 |
| Graduate Degree | - | - |
| Total | $52,500 | $30,972 |
Family Income in Weston
Family Income Brackets in Weston
According to the Weston family income data, there are 52 families falling into the $75,000 to $99,999 income range, which is the most common income bracket and makes up 38.5% of all families.
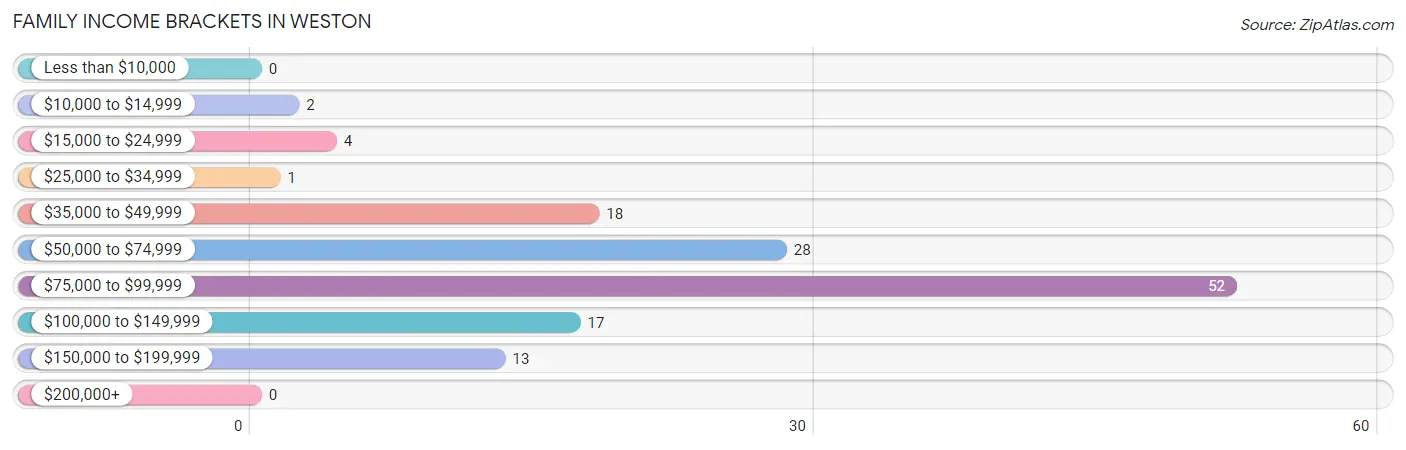
| Income Bracket | # Families | % Families |
| Less than $10,000 | 0 | 0.0% |
| $10,000 to $14,999 | 2 | 1.5% |
| $15,000 to $24,999 | 4 | 3.0% |
| $25,000 to $34,999 | 1 | 0.7% |
| $35,000 to $49,999 | 18 | 13.3% |
| $50,000 to $74,999 | 28 | 20.7% |
| $75,000 to $99,999 | 52 | 38.5% |
| $100,000 to $149,999 | 17 | 12.6% |
| $150,000 to $199,999 | 13 | 9.6% |
| $200,000+ | 0 | 0.0% |
Family Income by Famaliy Size in Weston
6-person families (13 | 9.6%) account for the highest median family income in Weston with $157,969 per family, while 2-person families (50 | 37.0%) have the highest median income of $35,000 per family member.
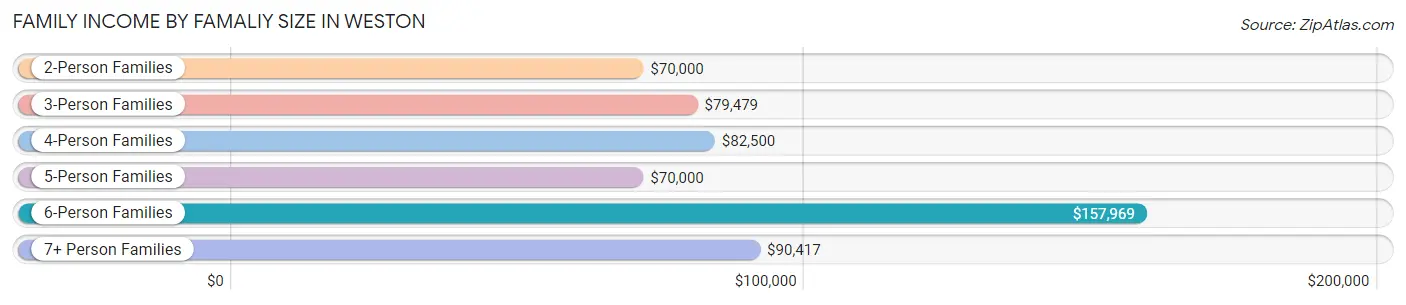
| Income Bracket | # Families | Median Income |
| 2-Person Families | 50 (37.0%) | $70,000 |
| 3-Person Families | 35 (25.9%) | $79,479 |
| 4-Person Families | 14 (10.4%) | $82,500 |
| 5-Person Families | 14 (10.4%) | $70,000 |
| 6-Person Families | 13 (9.6%) | $157,969 |
| 7+ Person Families | 9 (6.7%) | $90,417 |
| Total | 135 (100.0%) | $79,583 |
Family Income by Number of Earners in Weston
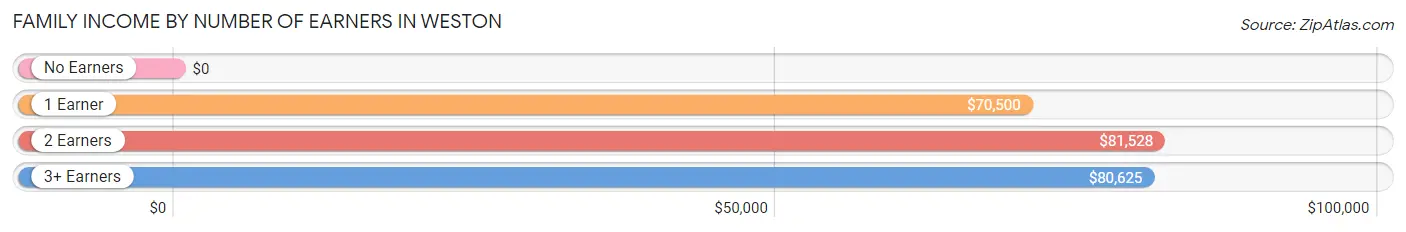
| Number of Earners | # Families | Median Income |
| No Earners | 9 (6.7%) | $0 |
| 1 Earner | 42 (31.1%) | $70,500 |
| 2 Earners | 77 (57.0%) | $81,528 |
| 3+ Earners | 7 (5.2%) | $80,625 |
| Total | 135 (100.0%) | $79,583 |
Household Income in Weston
Household Income Brackets in Weston
With 45 households falling in the category, the $75,000 to $99,999 income range is the most frequent in Weston, accounting for 30.4% of all households.
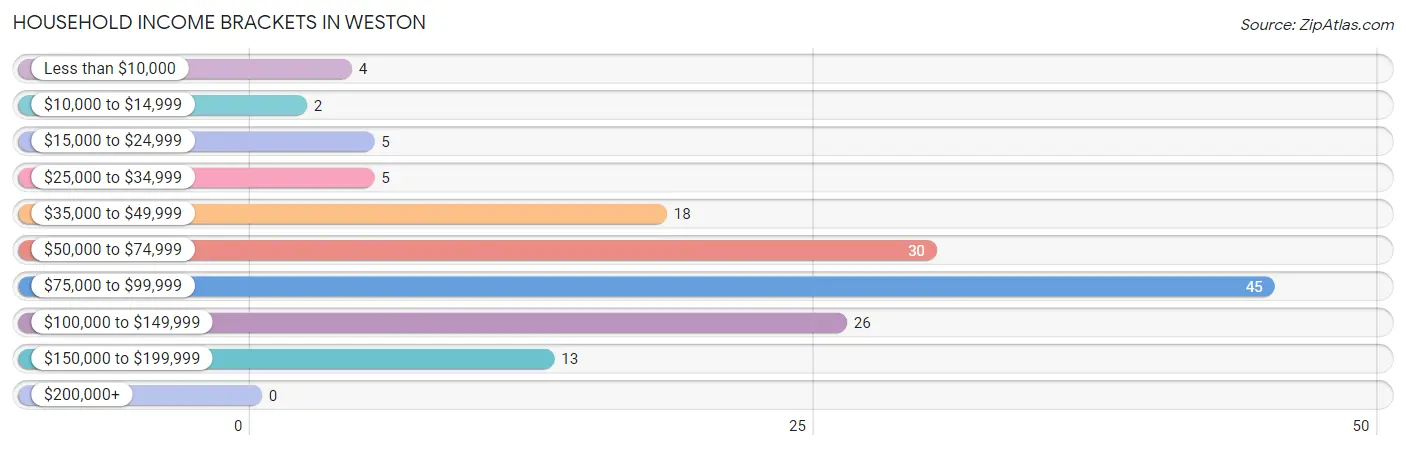
| Income Bracket | # Households | % Households |
| Less than $10,000 | 4 | 2.7% |
| $10,000 to $14,999 | 2 | 1.4% |
| $15,000 to $24,999 | 5 | 3.4% |
| $25,000 to $34,999 | 5 | 3.4% |
| $35,000 to $49,999 | 18 | 12.2% |
| $50,000 to $74,999 | 30 | 20.3% |
| $75,000 to $99,999 | 45 | 30.4% |
| $100,000 to $149,999 | 26 | 17.6% |
| $150,000 to $199,999 | 13 | 8.8% |
| $200,000+ | 0 | 0.0% |
Household Income by Householder Age in Weston
The median household income in Weston is $80,000, with the highest median household income of $82,679 found in the 25 to 44 years age bracket for the primary householder. A total of 61 households (41.2%) fall into this category. Meanwhile, the 15 to 24 years age bracket for the primary householder has the lowest median household income of $0, with 13 households (8.8%) in this group.
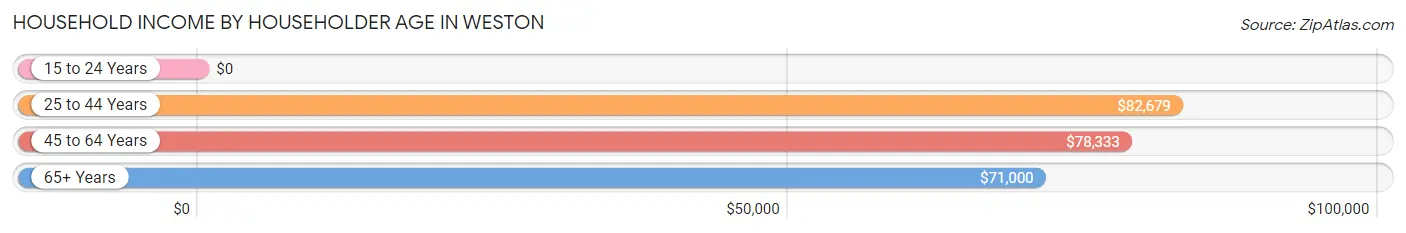
| Income Bracket | # Households | Median Income |
| 15 to 24 Years | 13 (8.8%) | $0 |
| 25 to 44 Years | 61 (41.2%) | $82,679 |
| 45 to 64 Years | 54 (36.5%) | $78,333 |
| 65+ Years | 20 (13.5%) | $71,000 |
| Total | 148 (100.0%) | $80,000 |
Poverty in Weston
Income Below Poverty by Sex and Age in Weston
With 1.2% poverty level for males and 3.0% for females among the residents of Weston, 55 to 64 year old males and 55 to 64 year old females are the most vulnerable to poverty, with 2 males (9.1%) and 7 females (21.9%) in their respective age groups living below the poverty level.
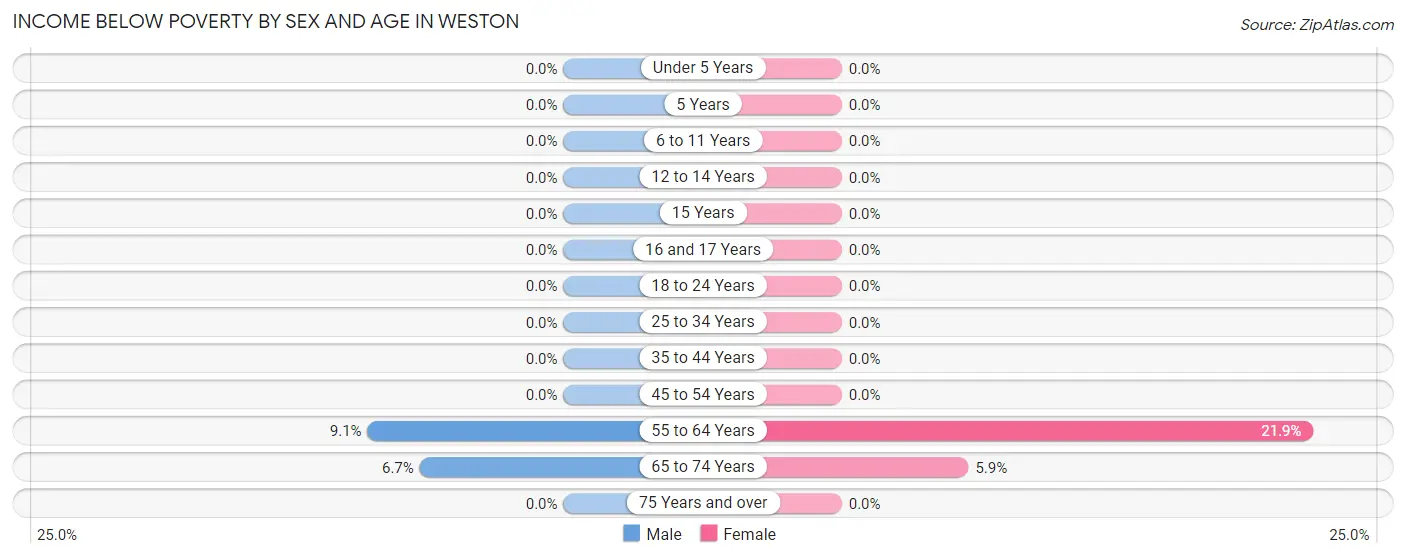
| Age Bracket | Male | Female |
| Under 5 Years | 0 (0.0%) | 0 (0.0%) |
| 5 Years | 0 (0.0%) | 0 (0.0%) |
| 6 to 11 Years | 0 (0.0%) | 0 (0.0%) |
| 12 to 14 Years | 0 (0.0%) | 0 (0.0%) |
| 15 Years | 0 (0.0%) | 0 (0.0%) |
| 16 and 17 Years | 0 (0.0%) | 0 (0.0%) |
| 18 to 24 Years | 0 (0.0%) | 0 (0.0%) |
| 25 to 34 Years | 0 (0.0%) | 0 (0.0%) |
| 35 to 44 Years | 0 (0.0%) | 0 (0.0%) |
| 45 to 54 Years | 0 (0.0%) | 0 (0.0%) |
| 55 to 64 Years | 2 (9.1%) | 7 (21.9%) |
| 65 to 74 Years | 1 (6.7%) | 1 (5.9%) |
| 75 Years and over | 0 (0.0%) | 0 (0.0%) |
| Total | 3 (1.2%) | 8 (3.0%) |
Income Above Poverty by Sex and Age in Weston
According to the poverty statistics in Weston, males aged under 5 years and females aged under 5 years are the age groups that are most secure financially, with 100.0% of males and 100.0% of females in these age groups living above the poverty line.
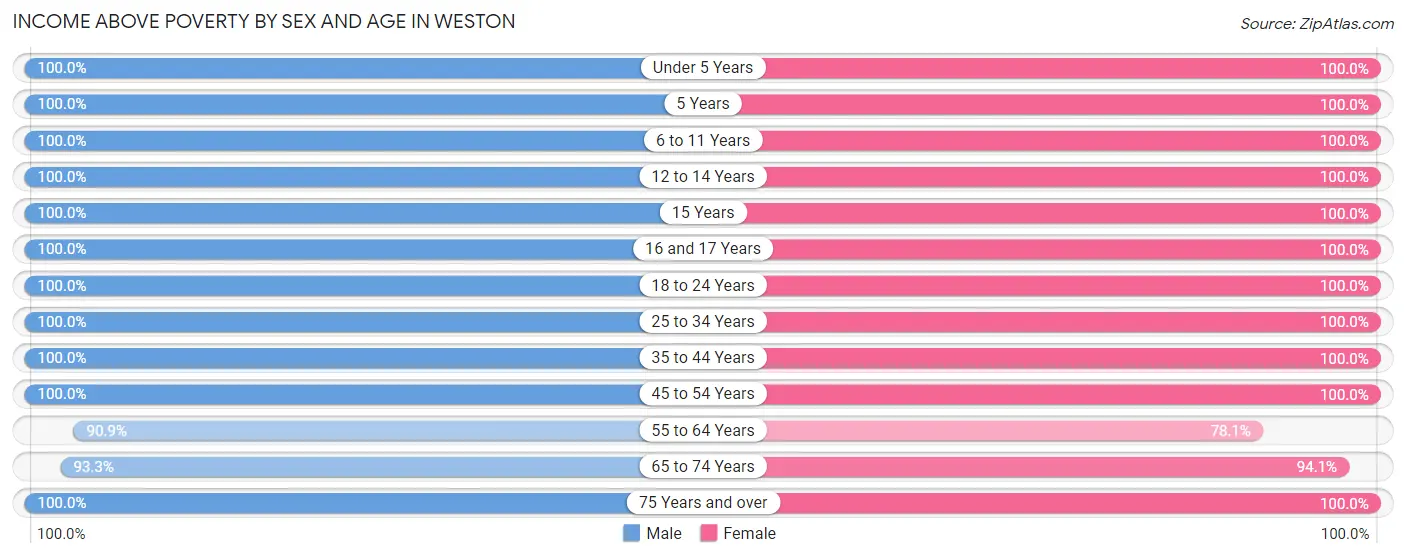
| Age Bracket | Male | Female |
| Under 5 Years | 25 (100.0%) | 27 (100.0%) |
| 5 Years | 1 (100.0%) | 4 (100.0%) |
| 6 to 11 Years | 26 (100.0%) | 58 (100.0%) |
| 12 to 14 Years | 24 (100.0%) | 16 (100.0%) |
| 15 Years | 2 (100.0%) | 6 (100.0%) |
| 16 and 17 Years | 12 (100.0%) | 5 (100.0%) |
| 18 to 24 Years | 15 (100.0%) | 28 (100.0%) |
| 25 to 34 Years | 48 (100.0%) | 25 (100.0%) |
| 35 to 44 Years | 44 (100.0%) | 25 (100.0%) |
| 45 to 54 Years | 16 (100.0%) | 14 (100.0%) |
| 55 to 64 Years | 20 (90.9%) | 25 (78.1%) |
| 65 to 74 Years | 14 (93.3%) | 16 (94.1%) |
| 75 Years and over | 9 (100.0%) | 8 (100.0%) |
| Total | 256 (98.8%) | 257 (97.0%) |
Income Below Poverty Among Married-Couple Families in Weston
The poverty statistics for married-couple families in Weston show that 1.7% or 2 of the total 117 families live below the poverty line. Families with no children have the highest poverty rate of 3.6%, comprising of 2 families. On the other hand, families with 1 or 2 children have the lowest poverty rate of 0.0%, which includes 0 families.
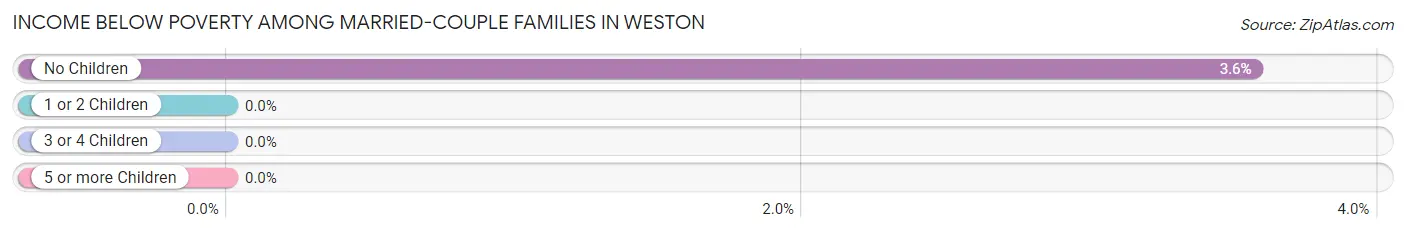
| Children | Above Poverty | Below Poverty |
| No Children | 54 (96.4%) | 2 (3.6%) |
| 1 or 2 Children | 40 (100.0%) | 0 (0.0%) |
| 3 or 4 Children | 14 (100.0%) | 0 (0.0%) |
| 5 or more Children | 7 (100.0%) | 0 (0.0%) |
| Total | 115 (98.3%) | 2 (1.7%) |
Income Below Poverty Among Single-Parent Households in Weston
| Children | Single Father | Single Mother |
| No Children | 0 (0.0%) | 0 (0.0%) |
| 1 or 2 Children | 0 (0.0%) | 0 (0.0%) |
| 3 or 4 Children | 0 (0.0%) | 0 (0.0%) |
| 5 or more Children | 0 (0.0%) | 0 (0.0%) |
| Total | 0 (0.0%) | 0 (0.0%) |
Income Below Poverty Among Married-Couple vs Single-Parent Households in Weston
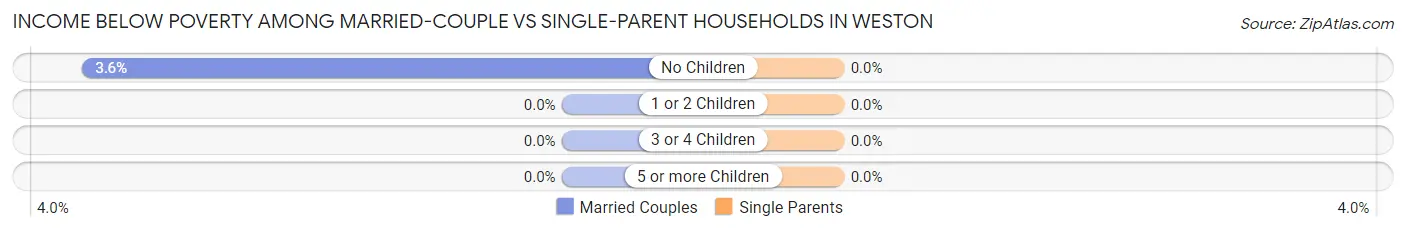
| Children | Married-Couple Families | Single-Parent Households |
| No Children | 2 (3.6%) | 0 (0.0%) |
| 1 or 2 Children | 0 (0.0%) | 0 (0.0%) |
| 3 or 4 Children | 0 (0.0%) | 0 (0.0%) |
| 5 or more Children | 0 (0.0%) | 0 (0.0%) |
| Total | 2 (1.7%) | 0 (0.0%) |
Race in Weston
The most populous races in Weston are White / Caucasian (460 | 87.3%), Two or more Races (64 | 12.1%), and Hispanic or Latino (59 | 11.2%).
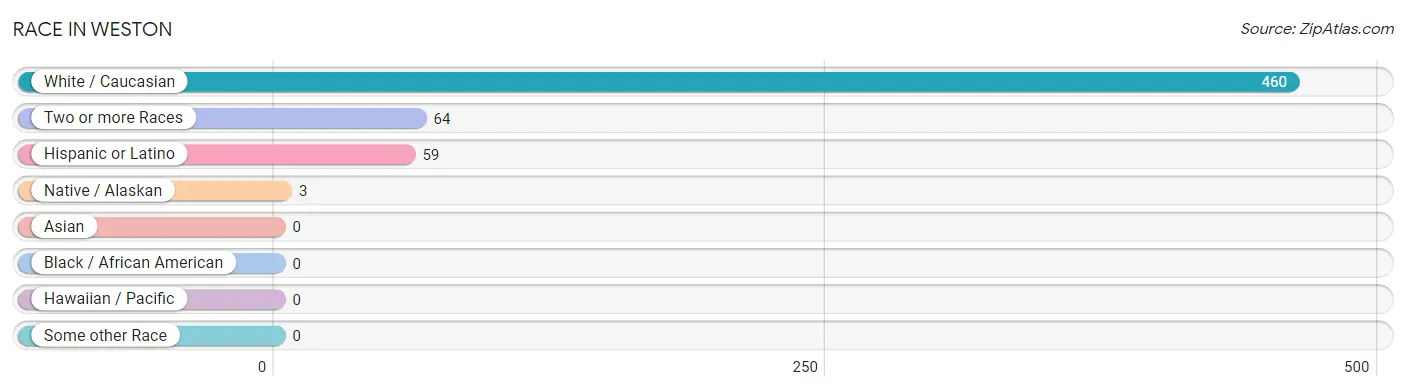
| Race | # Population | % Population |
| Asian | 0 | 0.0% |
| Black / African American | 0 | 0.0% |
| Hawaiian / Pacific | 0 | 0.0% |
| Hispanic or Latino | 59 | 11.2% |
| Native / Alaskan | 3 | 0.6% |
| White / Caucasian | 460 | 87.3% |
| Two or more Races | 64 | 12.1% |
| Some other Race | 0 | 0.0% |
| Total | 527 | 100.0% |
Ancestry in Weston
The most populous ancestries reported in Weston are English (162 | 30.7%), Scottish (50 | 9.5%), Pueblo (37 | 7.0%), Spaniard (37 | 7.0%), and Danish (35 | 6.6%), together accounting for 60.9% of all Weston residents.
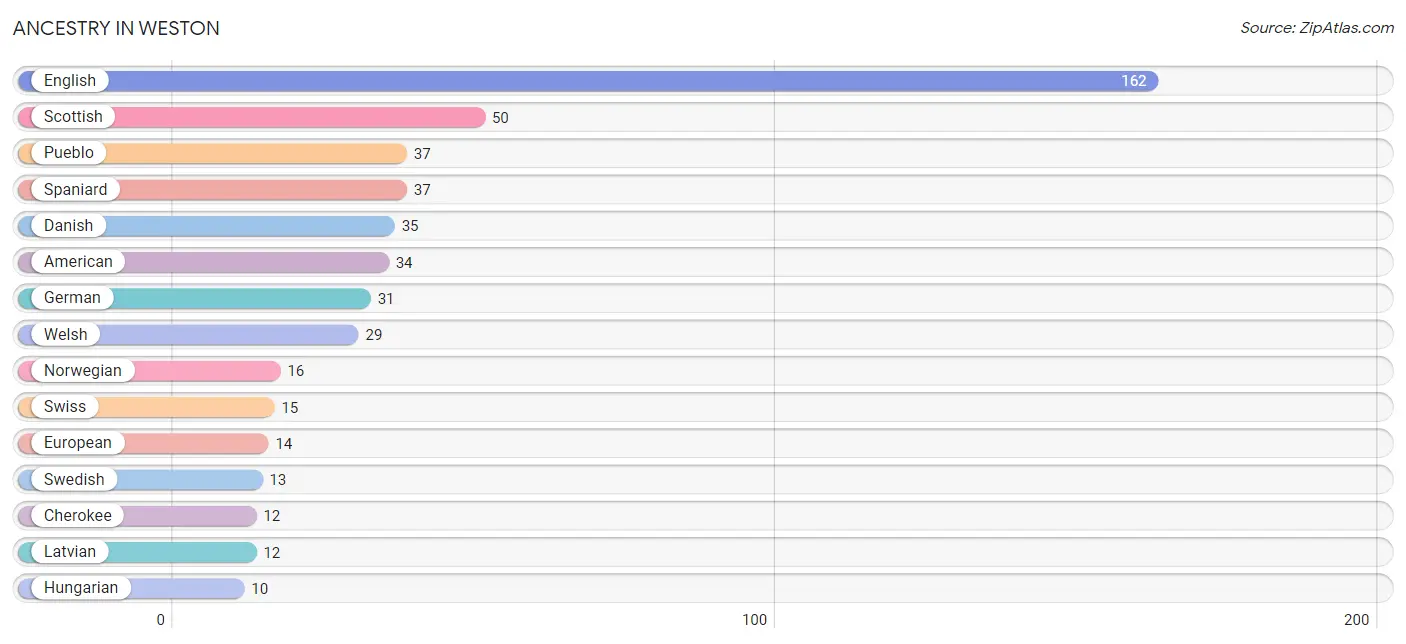
| Ancestry | # Population | % Population |
| American | 34 | 6.5% |
| British | 4 | 0.8% |
| Canadian | 3 | 0.6% |
| Cherokee | 12 | 2.3% |
| Danish | 35 | 6.6% |
| Dutch | 4 | 0.8% |
| English | 162 | 30.7% |
| European | 14 | 2.7% |
| French | 8 | 1.5% |
| German | 31 | 5.9% |
| Hungarian | 10 | 1.9% |
| Irish | 5 | 0.9% |
| Italian | 2 | 0.4% |
| Latvian | 12 | 2.3% |
| Mexican | 5 | 0.9% |
| Norwegian | 16 | 3.0% |
| Pueblo | 37 | 7.0% |
| Russian | 1 | 0.2% |
| Scotch-Irish | 2 | 0.4% |
| Scottish | 50 | 9.5% |
| Spaniard | 37 | 7.0% |
| Swedish | 13 | 2.5% |
| Swiss | 15 | 2.9% |
| Welsh | 29 | 5.5% | View All 24 Rows |
Immigrants in Weston
The most numerous immigrant groups reported in Weston came from , and Canada (4 | 0.8%), together accounting for 0.8% of all Weston residents.

| Immigration Origin | # Population | % Population |
| Canada | 4 | 0.8% | View All 1 Rows |
Sex and Age in Weston
Sex and Age in Weston
The most populous age groups in Weston are 35 to 39 Years (30 | 11.6%) for men and 10 to 14 Years (42 | 15.7%) for women.
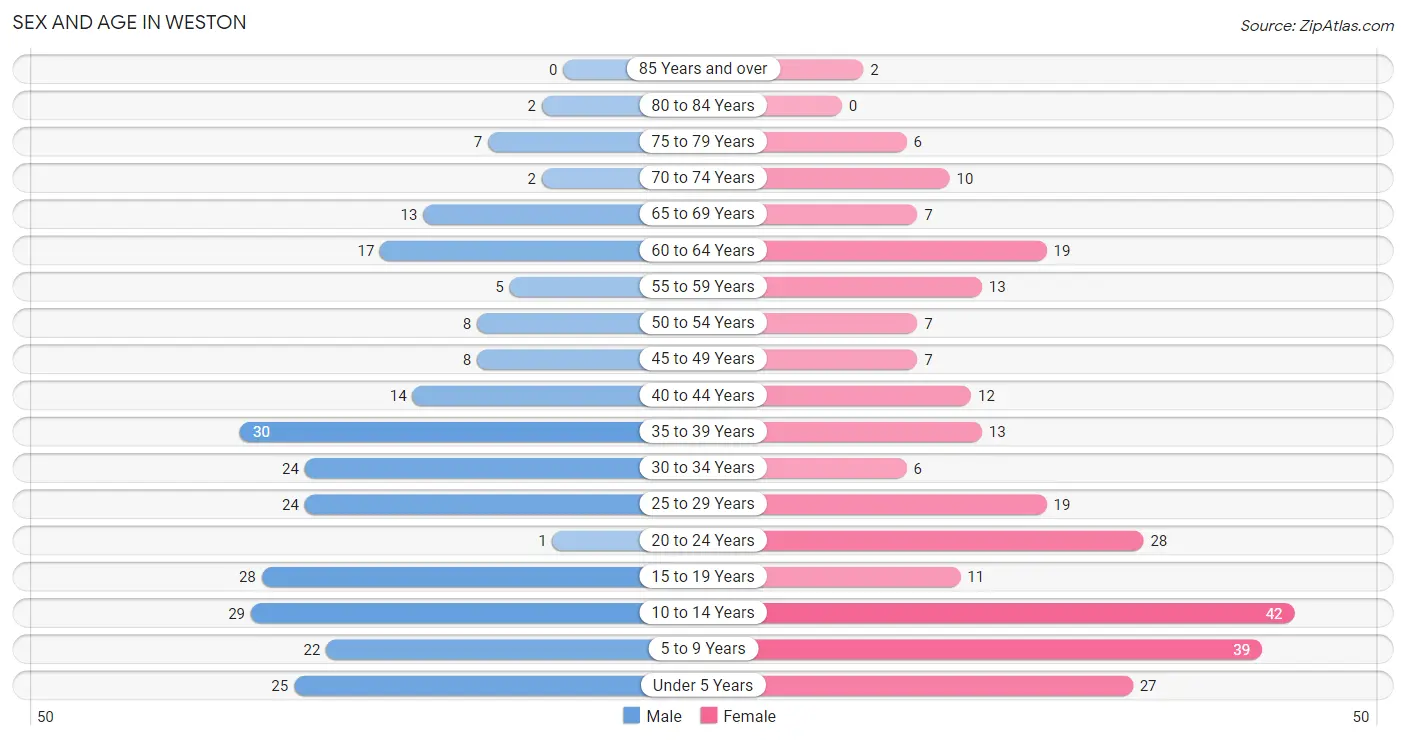
| Age Bracket | Male | Female |
| Under 5 Years | 25 (9.7%) | 27 (10.1%) |
| 5 to 9 Years | 22 (8.5%) | 39 (14.5%) |
| 10 to 14 Years | 29 (11.2%) | 42 (15.7%) |
| 15 to 19 Years | 28 (10.8%) | 11 (4.1%) |
| 20 to 24 Years | 1 (0.4%) | 28 (10.4%) |
| 25 to 29 Years | 24 (9.3%) | 19 (7.1%) |
| 30 to 34 Years | 24 (9.3%) | 6 (2.2%) |
| 35 to 39 Years | 30 (11.6%) | 13 (4.9%) |
| 40 to 44 Years | 14 (5.4%) | 12 (4.5%) |
| 45 to 49 Years | 8 (3.1%) | 7 (2.6%) |
| 50 to 54 Years | 8 (3.1%) | 7 (2.6%) |
| 55 to 59 Years | 5 (1.9%) | 13 (4.9%) |
| 60 to 64 Years | 17 (6.6%) | 19 (7.1%) |
| 65 to 69 Years | 13 (5.0%) | 7 (2.6%) |
| 70 to 74 Years | 2 (0.8%) | 10 (3.7%) |
| 75 to 79 Years | 7 (2.7%) | 6 (2.2%) |
| 80 to 84 Years | 2 (0.8%) | 0 (0.0%) |
| 85 Years and over | 0 (0.0%) | 2 (0.7%) |
| Total | 259 (100.0%) | 268 (100.0%) |
Families and Households in Weston
Median Family Size in Weston
The median family size in Weston is 3.73 persons per family, with single male/father families (13 | 9.6%) accounting for the largest median family size of 4.85 persons per family. On the other hand, single female/mother families (5 | 3.7%) represent the smallest median family size with 3.00 persons per family.
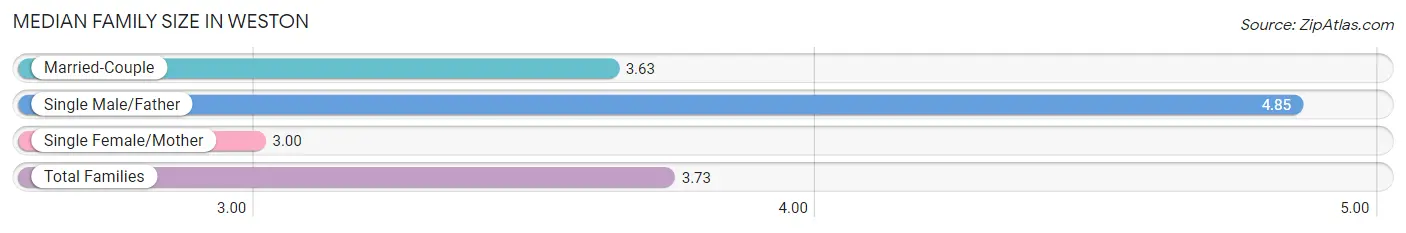
| Family Type | # Families | Family Size |
| Married-Couple | 117 (86.7%) | 3.63 |
| Single Male/Father | 13 (9.6%) | 4.85 |
| Single Female/Mother | 5 (3.7%) | 3.00 |
| Total Families | 135 (100.0%) | 3.73 |
Median Household Size in Weston
The median household size in Weston is 3.56 persons per household, with single male/father households (13 | 8.8%) accounting for the largest median household size of 4.92 persons per household. non-family households (13 | 8.8%) represent the smallest median household size with 1.31 persons per household.
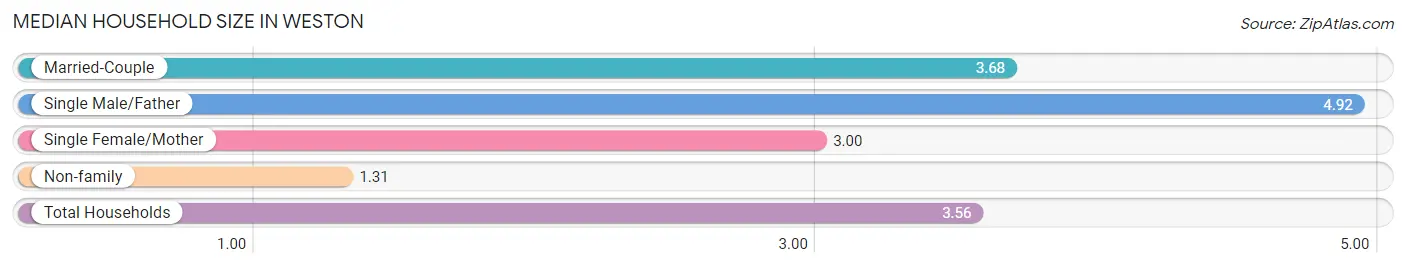
| Household Type | # Households | Household Size |
| Married-Couple | 117 (79.0%) | 3.68 |
| Single Male/Father | 13 (8.8%) | 4.92 |
| Single Female/Mother | 5 (3.4%) | 3.00 |
| Non-family | 13 (8.8%) | 1.31 |
| Total Households | 148 (100.0%) | 3.56 |
Household Size by Marriage Status in Weston
Out of a total of 148 households in Weston, 135 (91.2%) are family households, while 13 (8.8%) are nonfamily households. The most numerous type of family households are 2-person households, comprising 50, and the most common type of nonfamily households are 1-person households, comprising 9.
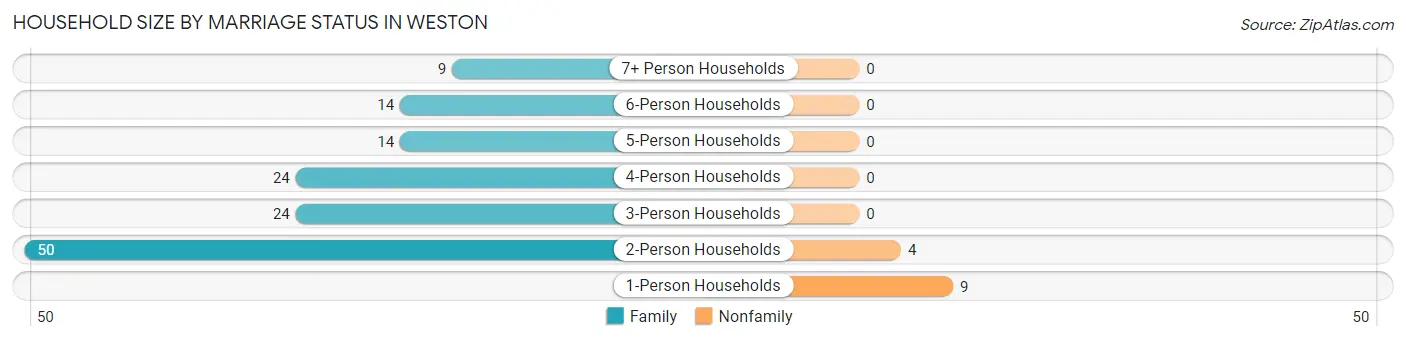
| Household Size | Family Households | Nonfamily Households |
| 1-Person Households | - | 9 (6.1%) |
| 2-Person Households | 50 (33.8%) | 4 (2.7%) |
| 3-Person Households | 24 (16.2%) | 0 (0.0%) |
| 4-Person Households | 24 (16.2%) | 0 (0.0%) |
| 5-Person Households | 14 (9.5%) | 0 (0.0%) |
| 6-Person Households | 14 (9.5%) | 0 (0.0%) |
| 7+ Person Households | 9 (6.1%) | 0 (0.0%) |
| Total | 135 (91.2%) | 13 (8.8%) |
Female Fertility in Weston
Fertility by Age in Weston
Average fertility rate in Weston is 260.0 births per 1,000 women. Women in the age bracket of 20 to 34 years have the highest fertility rate with 434.0 births per 1,000 women. Women in the age bracket of 20 to 34 years acount for 92.0% of all women with births.
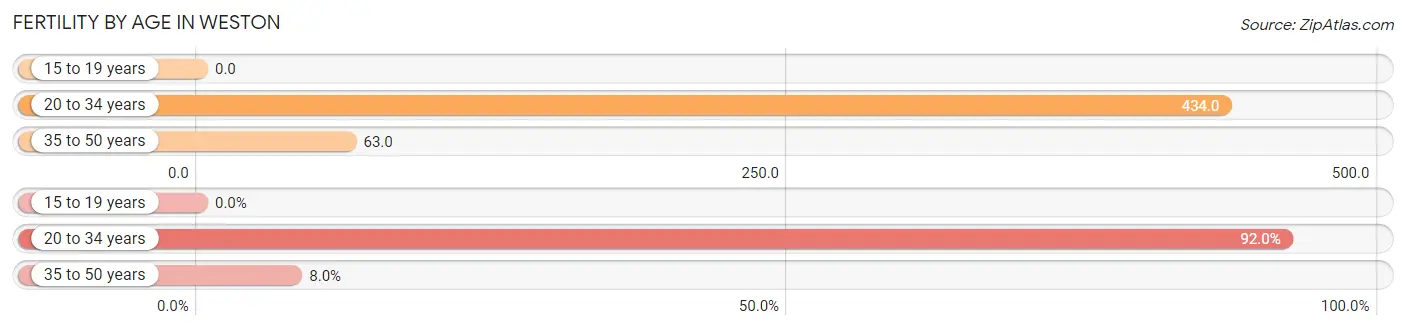
| Age Bracket | Women with Births | Births / 1,000 Women |
| 15 to 19 years | 0 (0.0%) | 0.0 |
| 20 to 34 years | 23 (92.0%) | 434.0 |
| 35 to 50 years | 2 (8.0%) | 63.0 |
| Total | 25 (100.0%) | 260.0 |
Fertility by Age by Marriage Status in Weston
96.0% of women with births (25) in Weston are married. The highest percentage of unmarried women with births falls into 20 to 34 years age bracket with 4.3% of them unmarried at the time of birth, while the lowest percentage of unmarried women with births belong to 35 to 50 years age bracket with 0.0% of them unmarried.
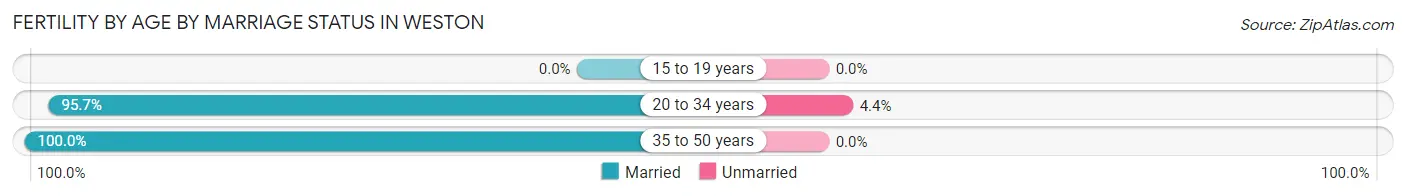
| Age Bracket | Married | Unmarried |
| 15 to 19 years | 0 (0.0%) | 0 (0.0%) |
| 20 to 34 years | 22 (95.7%) | 1 (4.3%) |
| 35 to 50 years | 2 (100.0%) | 0 (0.0%) |
| Total | 24 (96.0%) | 1 (4.0%) |
Fertility by Education in Weston
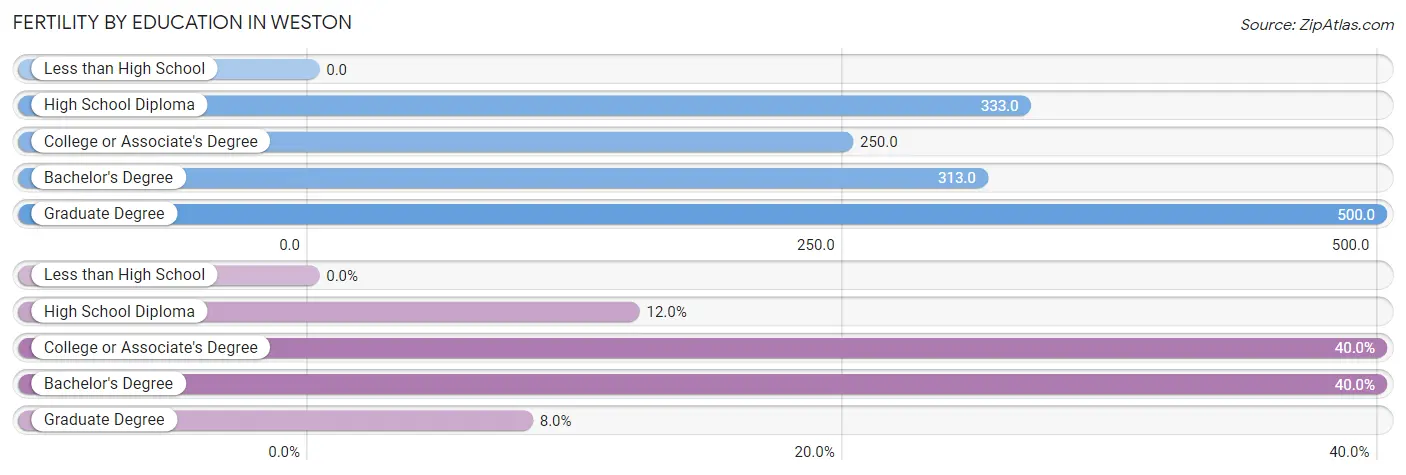
| Educational Attainment | Women with Births | Births / 1,000 Women |
| Less than High School | 0 (0.0%) | 0.0 |
| High School Diploma | 3 (12.0%) | 333.0 |
| College or Associate's Degree | 10 (40.0%) | 250.0 |
| Bachelor's Degree | 10 (40.0%) | 313.0 |
| Graduate Degree | 2 (8.0%) | 500.0 |
| Total | 25 (100.0%) | 260.0 |
Fertility by Education by Marriage Status in Weston
4.0% of women with births in Weston are unmarried. Women with the educational attainment of high school diploma are most likely to be married with 100.0% of them married at childbirth, while women with the educational attainment of bachelor's degree are least likely to be married with 10.0% of them unmarried at childbirth.
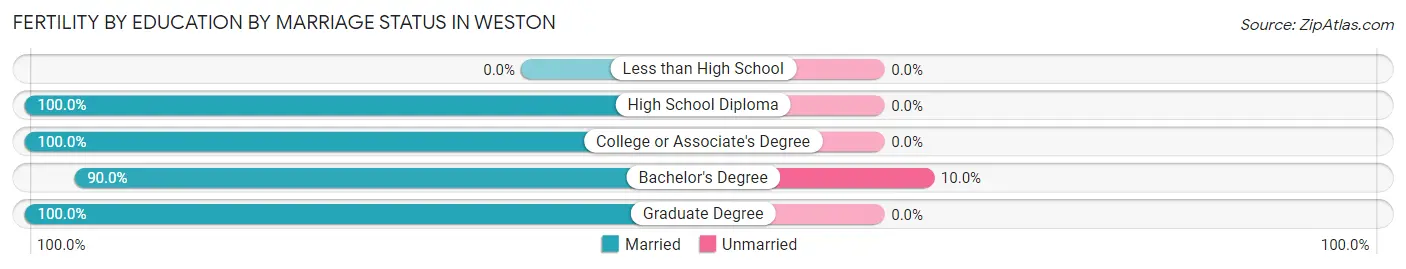
| Educational Attainment | Married | Unmarried |
| Less than High School | 0 (0.0%) | 0 (0.0%) |
| High School Diploma | 3 (100.0%) | 0 (0.0%) |
| College or Associate's Degree | 10 (100.0%) | 0 (0.0%) |
| Bachelor's Degree | 9 (90.0%) | 1 (10.0%) |
| Graduate Degree | 2 (100.0%) | 0 (0.0%) |
| Total | 24 (96.0%) | 1 (4.0%) |
Employment Characteristics in Weston
Employment by Class of Employer in Weston
Among the 203 employed individuals in Weston, private company employees (139 | 68.5%), local government employees (22 | 10.8%), and self-employed (not incorporated) (13 | 6.4%) make up the most common classes of employment.
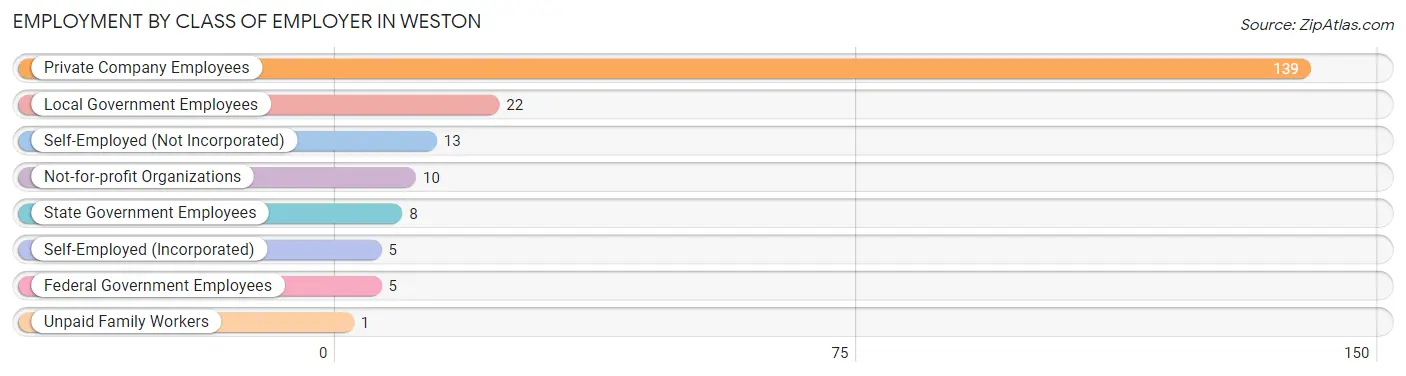
| Employer Class | # Employees | % Employees |
| Private Company Employees | 139 | 68.5% |
| Self-Employed (Incorporated) | 5 | 2.5% |
| Self-Employed (Not Incorporated) | 13 | 6.4% |
| Not-for-profit Organizations | 10 | 4.9% |
| Local Government Employees | 22 | 10.8% |
| State Government Employees | 8 | 3.9% |
| Federal Government Employees | 5 | 2.5% |
| Unpaid Family Workers | 1 | 0.5% |
| Total | 203 | 100.0% |
Employment Status by Age in Weston
According to the labor force statistics for Weston, out of the total population over 16 years of age (335), 65.1% or 218 individuals are in the labor force, with 6.9% or 15 of them unemployed. The age group with the highest labor force participation rate is 25 to 29 years, with 90.7% or 39 individuals in the labor force. Within the labor force, the 16 to 19 years age range has the highest percentage of unemployed individuals, with 52.6% or 10 of them being unemployed.
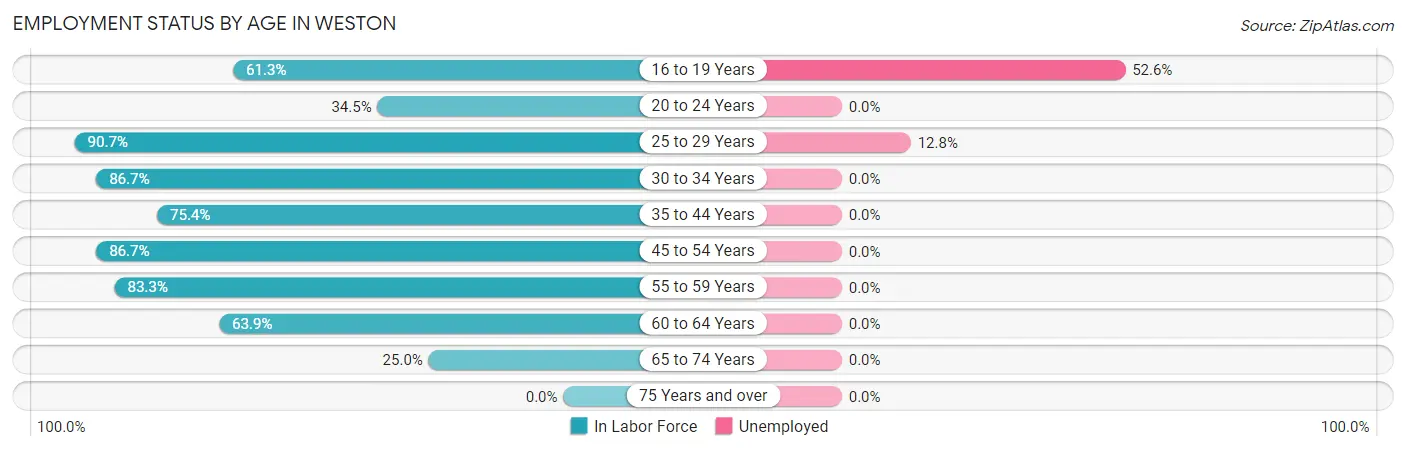
| Age Bracket | In Labor Force | Unemployed |
| 16 to 19 Years | 19 (61.3%) | 10 (52.6%) |
| 20 to 24 Years | 10 (34.5%) | 0 (0.0%) |
| 25 to 29 Years | 39 (90.7%) | 5 (12.8%) |
| 30 to 34 Years | 26 (86.7%) | 0 (0.0%) |
| 35 to 44 Years | 52 (75.4%) | 0 (0.0%) |
| 45 to 54 Years | 26 (86.7%) | 0 (0.0%) |
| 55 to 59 Years | 15 (83.3%) | 0 (0.0%) |
| 60 to 64 Years | 23 (63.9%) | 0 (0.0%) |
| 65 to 74 Years | 8 (25.0%) | 0 (0.0%) |
| 75 Years and over | 0 (0.0%) | 0 (0.0%) |
| Total | 218 (65.1%) | 15 (6.9%) |
Employment Status by Educational Attainment in Weston
According to labor force statistics for Weston, 80.1% of individuals (181) out of the total population between 25 and 64 years of age (226) are in the labor force, with 2.8% or 5 of them being unemployed. The group with the highest labor force participation rate are those with the educational attainment of less than high school, with 100.0% or 7 individuals in the labor force. Within the labor force, individuals with college / associate degree education have the highest percentage of unemployment, with 3.8% or 3 of them being unemployed.
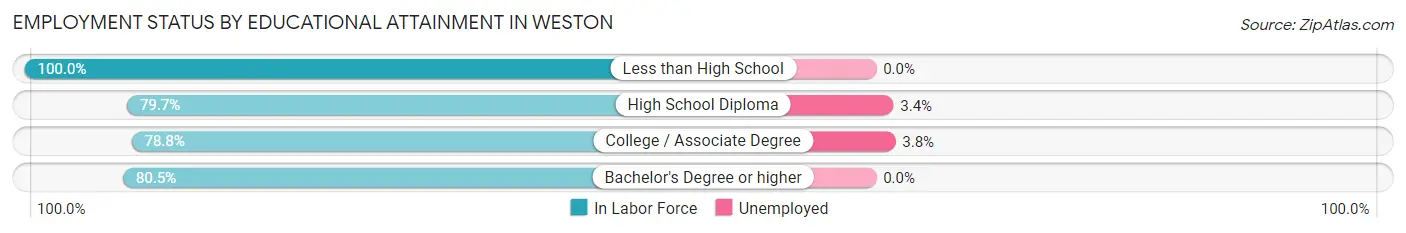
| Educational Attainment | In Labor Force | Unemployed |
| Less than High School | 7 (100.0%) | 0 (0.0%) |
| High School Diploma | 59 (79.7%) | 3 (3.4%) |
| College / Associate Degree | 82 (78.8%) | 4 (3.8%) |
| Bachelor's Degree or higher | 33 (80.5%) | 0 (0.0%) |
| Total | 181 (80.1%) | 6 (2.8%) |
Employment Occupations by Sex in Weston
Management, Business, Science and Arts Occupations
The most common Management, Business, Science and Arts occupations in Weston are Community & Social Service (25 | 12.4%), Management (18 | 9.0%), Education Instruction & Library (15 | 7.5%), Computers, Engineering & Science (11 | 5.5%), and Arts, Media & Entertainment (10 | 5.0%).
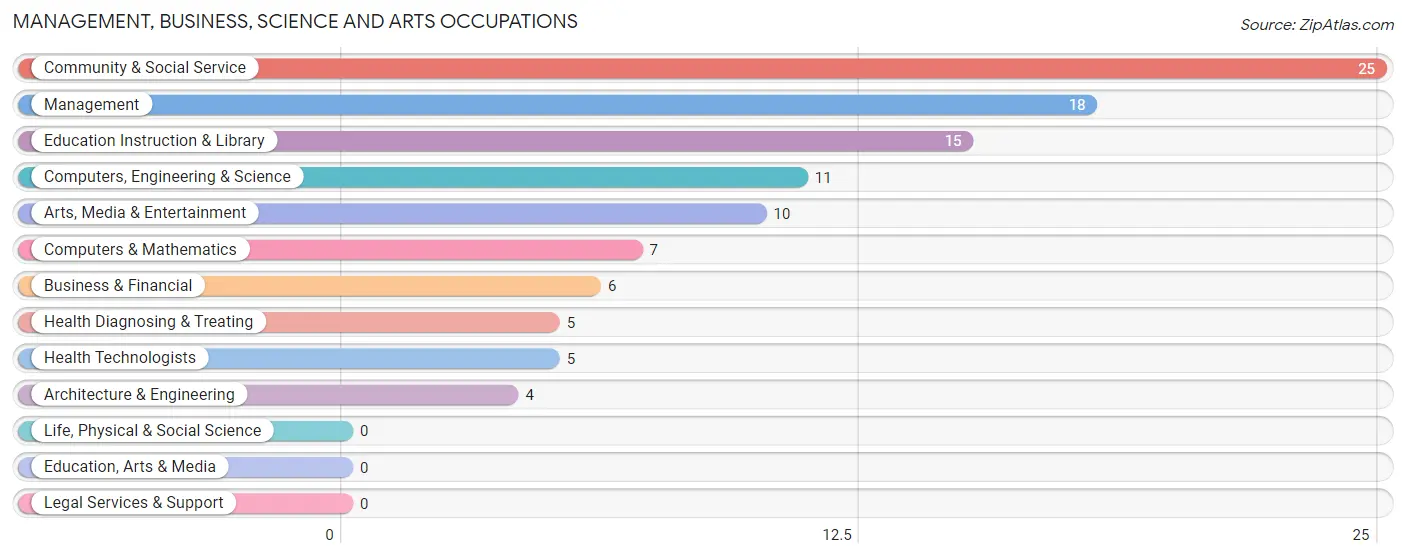
Management, Business, Science and Arts Occupations by Sex
Within the Management, Business, Science and Arts occupations in Weston, the most male-oriented occupations are Business & Financial (100.0%), Architecture & Engineering (100.0%), and Computers, Engineering & Science (63.6%), while the most female-oriented occupations are Health Diagnosing & Treating (100.0%), Health Technologists (100.0%), and Education Instruction & Library (86.7%).
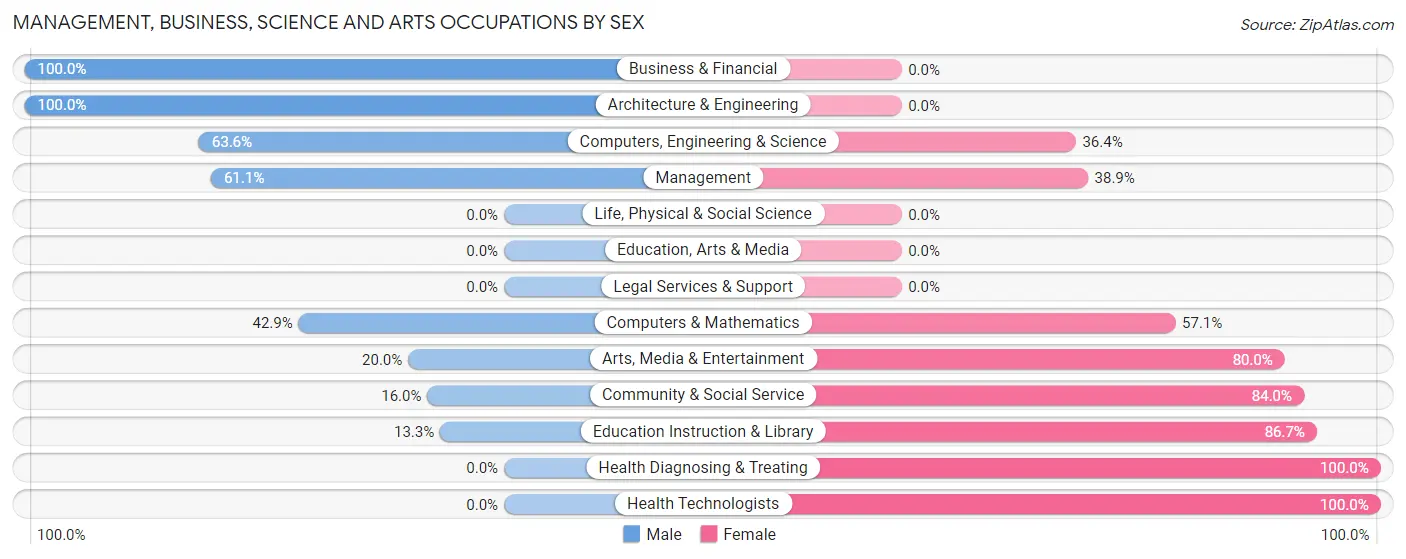
| Occupation | Male | Female |
| Management | 11 (61.1%) | 7 (38.9%) |
| Business & Financial | 6 (100.0%) | 0 (0.0%) |
| Computers, Engineering & Science | 7 (63.6%) | 4 (36.4%) |
| Computers & Mathematics | 3 (42.9%) | 4 (57.1%) |
| Architecture & Engineering | 4 (100.0%) | 0 (0.0%) |
| Life, Physical & Social Science | 0 (0.0%) | 0 (0.0%) |
| Community & Social Service | 4 (16.0%) | 21 (84.0%) |
| Education, Arts & Media | 0 (0.0%) | 0 (0.0%) |
| Legal Services & Support | 0 (0.0%) | 0 (0.0%) |
| Education Instruction & Library | 2 (13.3%) | 13 (86.7%) |
| Arts, Media & Entertainment | 2 (20.0%) | 8 (80.0%) |
| Health Diagnosing & Treating | 0 (0.0%) | 5 (100.0%) |
| Health Technologists | 0 (0.0%) | 5 (100.0%) |
| Total (Category) | 28 (43.1%) | 37 (56.9%) |
| Total (Overall) | 134 (66.7%) | 67 (33.3%) |
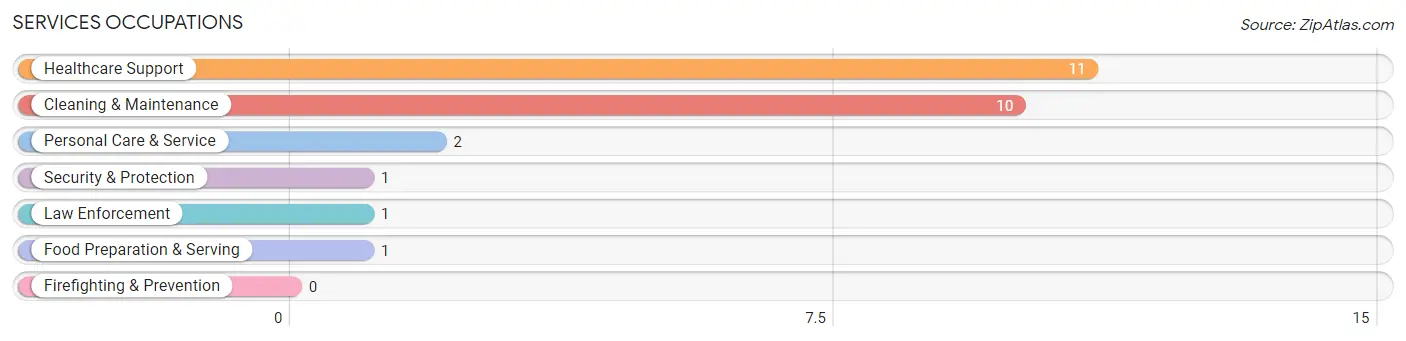
Services Occupations
The most common Services occupations in Weston are Healthcare Support (11 | 5.5%), Cleaning & Maintenance (10 | 5.0%), Personal Care & Service (2 | 1.0%), Security & Protection (1 | 0.5%), and Law Enforcement (1 | 0.5%).
Services Occupations by Sex
Within the Services occupations in Weston, the most male-oriented occupations are Security & Protection (100.0%), Law Enforcement (100.0%), and Cleaning & Maintenance (80.0%), while the most female-oriented occupations are Healthcare Support (100.0%), Food Preparation & Serving (100.0%), and Personal Care & Service (50.0%).
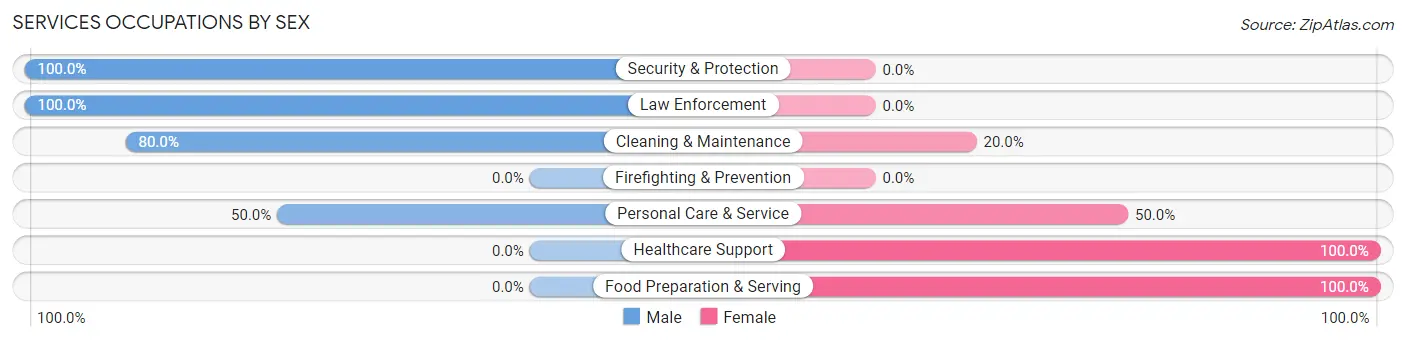
| Occupation | Male | Female |
| Healthcare Support | 0 (0.0%) | 11 (100.0%) |
| Security & Protection | 1 (100.0%) | 0 (0.0%) |
| Firefighting & Prevention | 0 (0.0%) | 0 (0.0%) |
| Law Enforcement | 1 (100.0%) | 0 (0.0%) |
| Food Preparation & Serving | 0 (0.0%) | 1 (100.0%) |
| Cleaning & Maintenance | 8 (80.0%) | 2 (20.0%) |
| Personal Care & Service | 1 (50.0%) | 1 (50.0%) |
| Total (Category) | 10 (40.0%) | 15 (60.0%) |
| Total (Overall) | 134 (66.7%) | 67 (33.3%) |
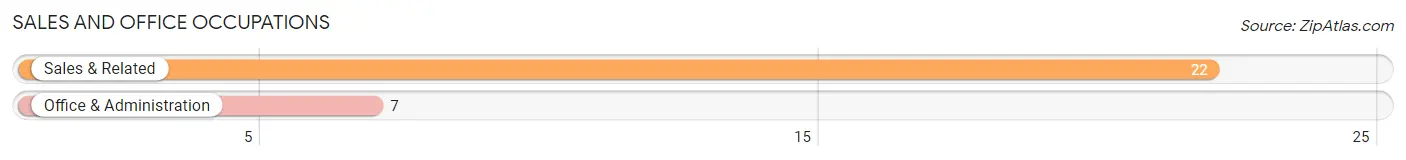
Sales and Office Occupations
The most common Sales and Office occupations in Weston are Sales & Related (22 | 11.0%), and Office & Administration (7 | 3.5%).
Sales and Office Occupations by Sex

| Occupation | Male | Female |
| Sales & Related | 22 (100.0%) | 0 (0.0%) |
| Office & Administration | 0 (0.0%) | 7 (100.0%) |
| Total (Category) | 22 (75.9%) | 7 (24.1%) |
| Total (Overall) | 134 (66.7%) | 67 (33.3%) |
Natural Resources, Construction and Maintenance Occupations
The most common Natural Resources, Construction and Maintenance occupations in Weston are Installation, Maintenance & Repair (25 | 12.4%), Construction & Extraction (6 | 3.0%), and Farming, Fishing & Forestry (3 | 1.5%).
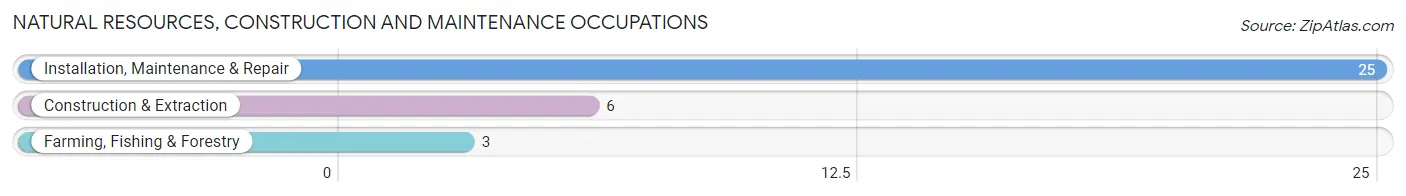
Natural Resources, Construction and Maintenance Occupations by Sex
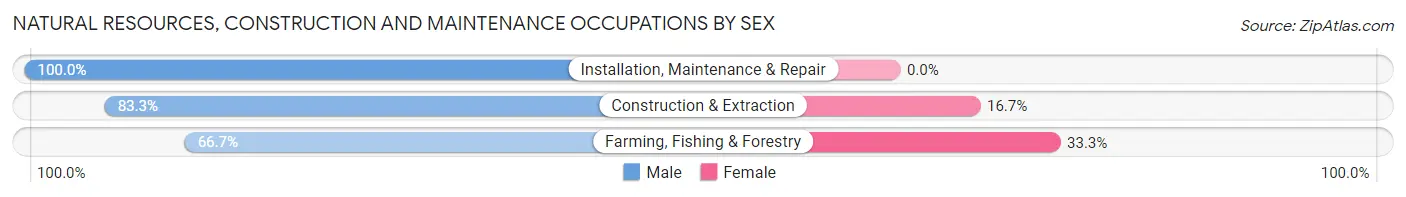
| Occupation | Male | Female |
| Farming, Fishing & Forestry | 2 (66.7%) | 1 (33.3%) |
| Construction & Extraction | 5 (83.3%) | 1 (16.7%) |
| Installation, Maintenance & Repair | 25 (100.0%) | 0 (0.0%) |
| Total (Category) | 32 (94.1%) | 2 (5.9%) |
| Total (Overall) | 134 (66.7%) | 67 (33.3%) |
Production, Transportation and Moving Occupations
The most common Production, Transportation and Moving occupations in Weston are Production (29 | 14.4%), Transportation (17 | 8.5%), and Material Moving (2 | 1.0%).
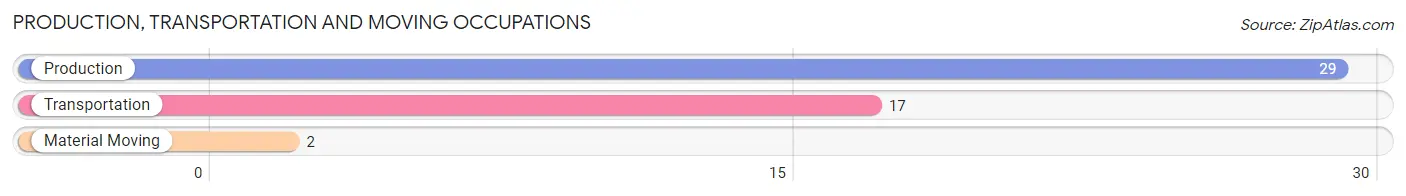
Production, Transportation and Moving Occupations by Sex
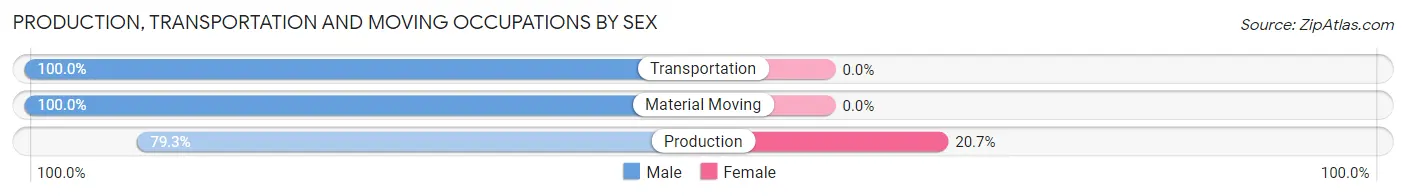
| Occupation | Male | Female |
| Production | 23 (79.3%) | 6 (20.7%) |
| Transportation | 17 (100.0%) | 0 (0.0%) |
| Material Moving | 2 (100.0%) | 0 (0.0%) |
| Total (Category) | 42 (87.5%) | 6 (12.5%) |
| Total (Overall) | 134 (66.7%) | 67 (33.3%) |
Employment Industries by Sex in Weston
Employment Industries in Weston
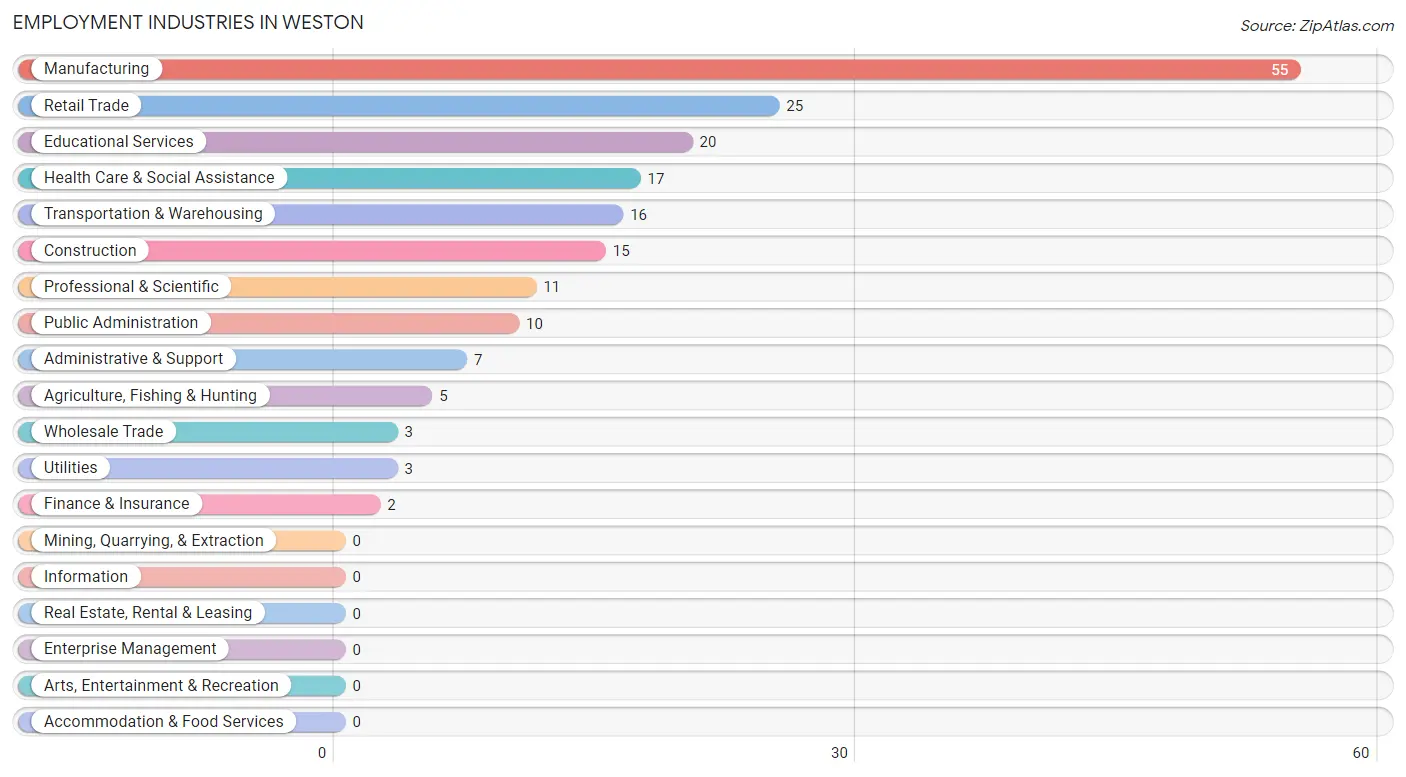
The major employment industries in Weston include Manufacturing (55 | 27.4%), Retail Trade (25 | 12.4%), Educational Services (20 | 10.0%), Health Care & Social Assistance (17 | 8.5%), and Transportation & Warehousing (16 | 8.0%).
Employment Industries by Sex in Weston
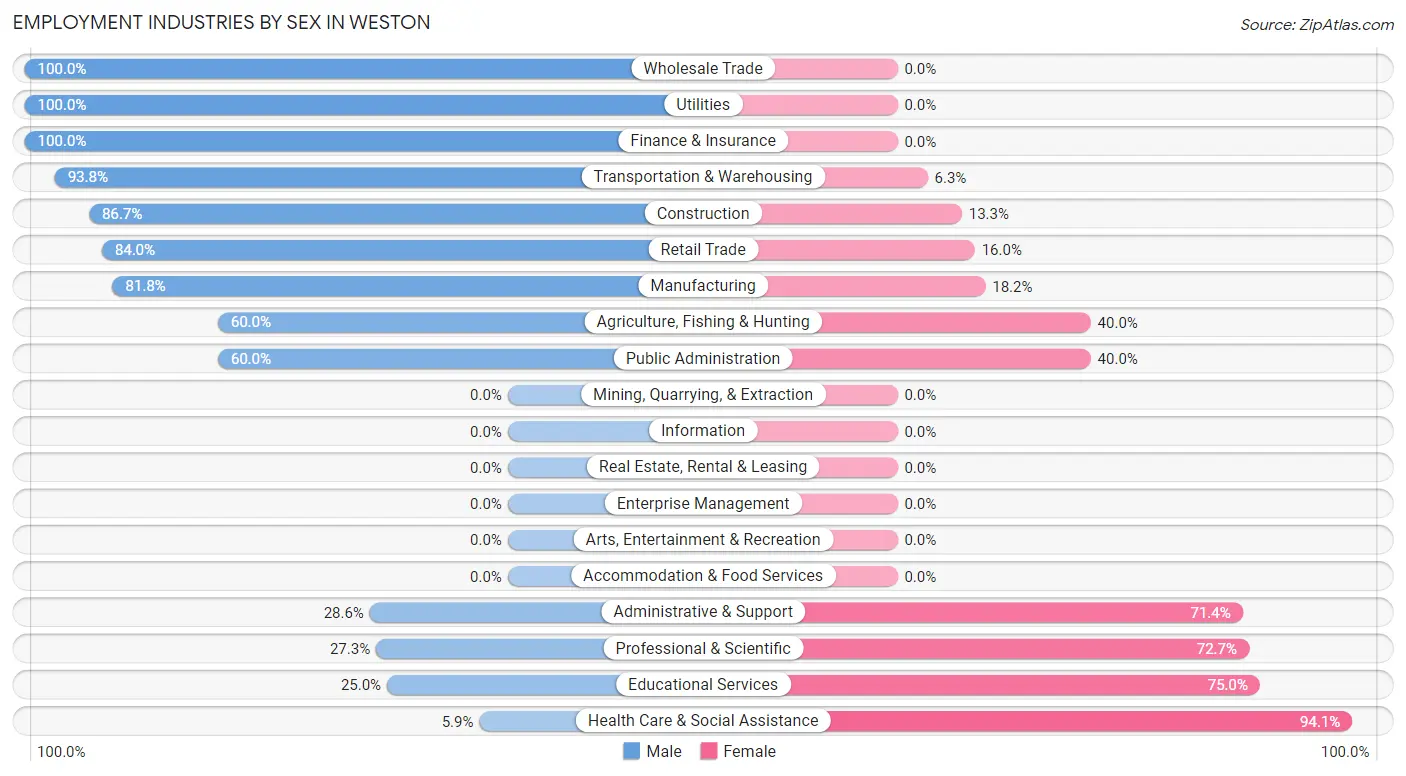
The Weston industries that see more men than women are Wholesale Trade (100.0%), Utilities (100.0%), and Finance & Insurance (100.0%), whereas the industries that tend to have a higher number of women are Health Care & Social Assistance (94.1%), Educational Services (75.0%), and Professional & Scientific (72.7%).
| Industry | Male | Female |
| Agriculture, Fishing & Hunting | 3 (60.0%) | 2 (40.0%) |
| Mining, Quarrying, & Extraction | 0 (0.0%) | 0 (0.0%) |
| Construction | 13 (86.7%) | 2 (13.3%) |
| Manufacturing | 45 (81.8%) | 10 (18.2%) |
| Wholesale Trade | 3 (100.0%) | 0 (0.0%) |
| Retail Trade | 21 (84.0%) | 4 (16.0%) |
| Transportation & Warehousing | 15 (93.8%) | 1 (6.2%) |
| Utilities | 3 (100.0%) | 0 (0.0%) |
| Information | 0 (0.0%) | 0 (0.0%) |
| Finance & Insurance | 2 (100.0%) | 0 (0.0%) |
| Real Estate, Rental & Leasing | 0 (0.0%) | 0 (0.0%) |
| Professional & Scientific | 3 (27.3%) | 8 (72.7%) |
| Enterprise Management | 0 (0.0%) | 0 (0.0%) |
| Administrative & Support | 2 (28.6%) | 5 (71.4%) |
| Educational Services | 5 (25.0%) | 15 (75.0%) |
| Health Care & Social Assistance | 1 (5.9%) | 16 (94.1%) |
| Arts, Entertainment & Recreation | 0 (0.0%) | 0 (0.0%) |
| Accommodation & Food Services | 0 (0.0%) | 0 (0.0%) |
| Public Administration | 6 (60.0%) | 4 (40.0%) |
| Total | 134 (66.7%) | 67 (33.3%) |
Education in Weston
School Enrollment in Weston
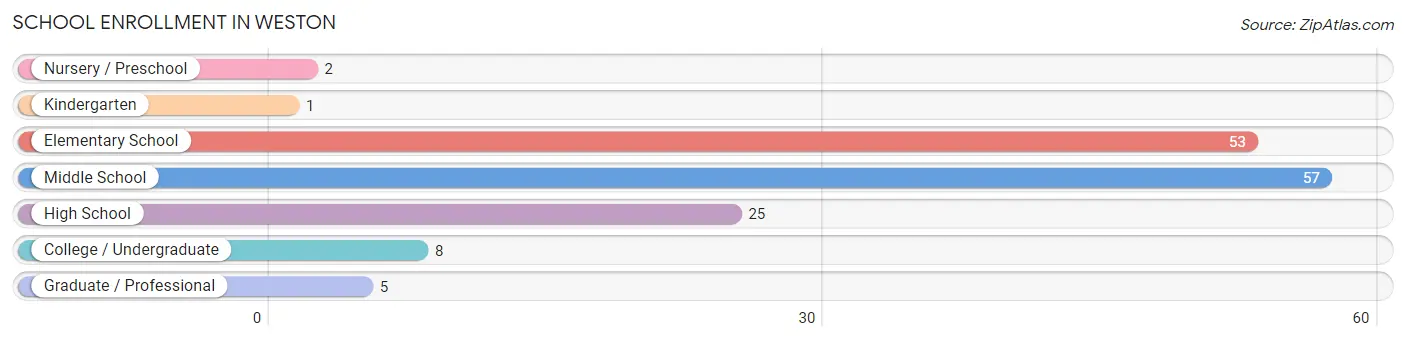
The most common levels of schooling among the 151 students in Weston are middle school (57 | 37.8%), elementary school (53 | 35.1%), and high school (25 | 16.6%).
| School Level | # Students | % Students |
| Nursery / Preschool | 2 | 1.3% |
| Kindergarten | 1 | 0.7% |
| Elementary School | 53 | 35.1% |
| Middle School | 57 | 37.8% |
| High School | 25 | 16.6% |
| College / Undergraduate | 8 | 5.3% |
| Graduate / Professional | 5 | 3.3% |
| Total | 151 | 100.0% |
School Enrollment by Age by Funding Source in Weston
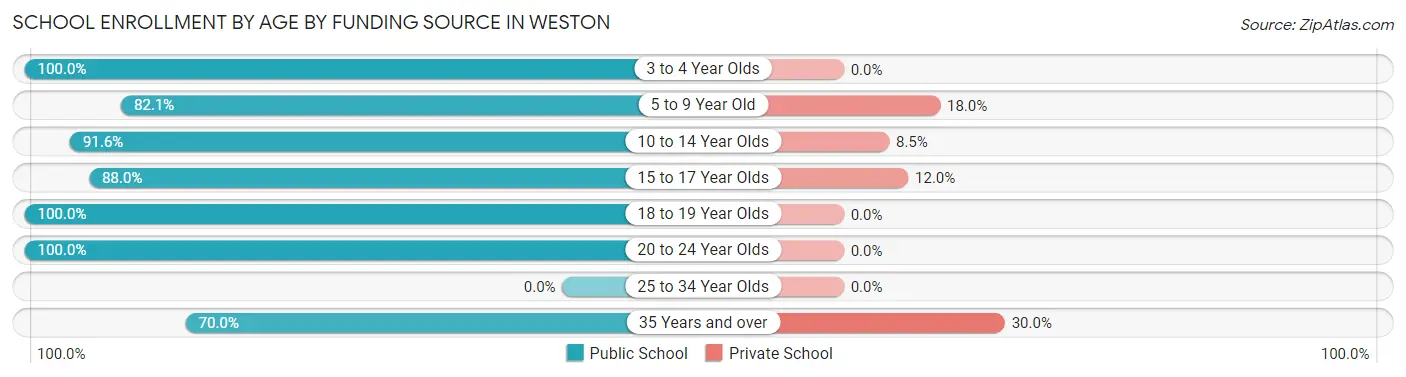
Out of a total of 151 students who are enrolled in schools in Weston, 19 (12.6%) attend a private institution, while the remaining 132 (87.4%) are enrolled in public schools. The age group of 35 years and over has the highest likelihood of being enrolled in private schools, with 3 (30.0% in the age bracket) enrolled. Conversely, the age group of 3 to 4 year olds has the lowest likelihood of being enrolled in a private school, with 1 (100.0% in the age bracket) attending a public institution.
| Age Bracket | Public School | Private School |
| 3 to 4 Year Olds | 1 (100.0%) | 0 (0.0%) |
| 5 to 9 Year Old | 32 (82.1%) | 7 (17.9%) |
| 10 to 14 Year Olds | 65 (91.5%) | 6 (8.5%) |
| 15 to 17 Year Olds | 22 (88.0%) | 3 (12.0%) |
| 18 to 19 Year Olds | 2 (100.0%) | 0 (0.0%) |
| 20 to 24 Year Olds | 3 (100.0%) | 0 (0.0%) |
| 25 to 34 Year Olds | 0 (0.0%) | 0 (0.0%) |
| 35 Years and over | 7 (70.0%) | 3 (30.0%) |
| Total | 132 (87.4%) | 19 (12.6%) |
Educational Attainment by Field of Study in Weston
Education (10 | 18.9%), visual & performing arts (9 | 17.0%), science & technology (7 | 13.2%), arts & humanities (6 | 11.3%), and bio, nature & agricultural (5 | 9.4%) are the most common fields of study among 53 individuals in Weston who have obtained a bachelor's degree or higher.
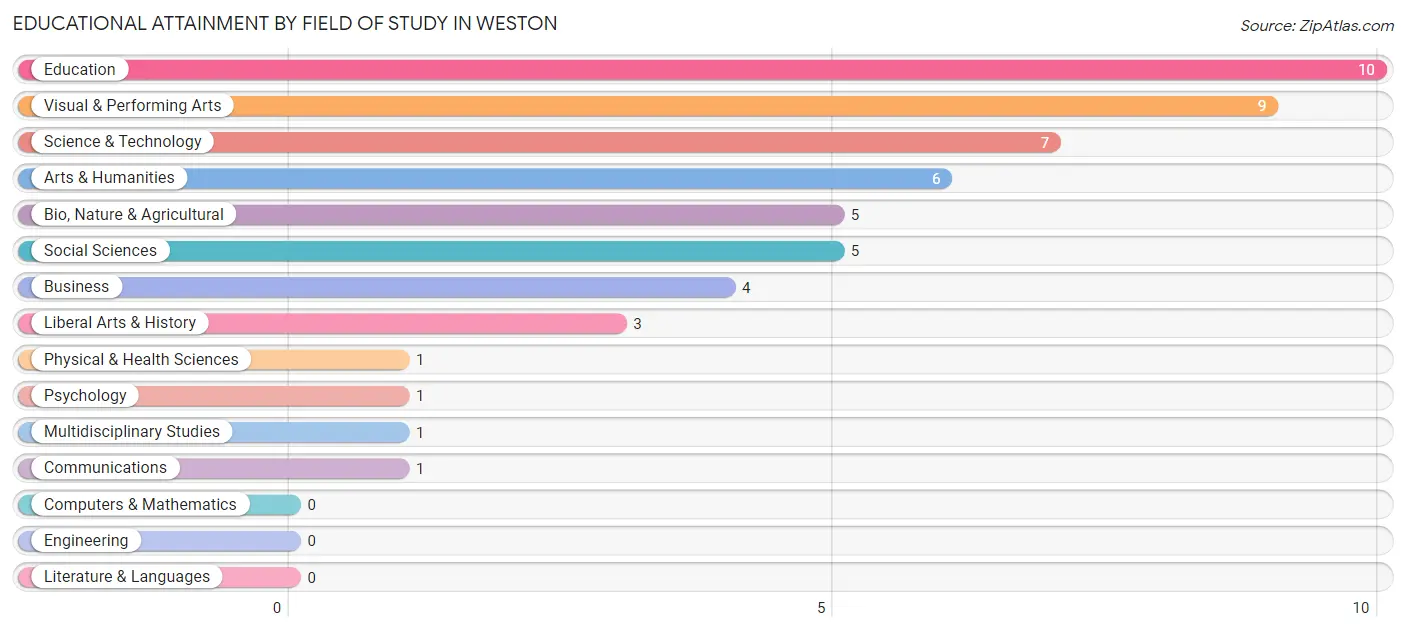
| Field of Study | # Graduates | % Graduates |
| Computers & Mathematics | 0 | 0.0% |
| Bio, Nature & Agricultural | 5 | 9.4% |
| Physical & Health Sciences | 1 | 1.9% |
| Psychology | 1 | 1.9% |
| Social Sciences | 5 | 9.4% |
| Engineering | 0 | 0.0% |
| Multidisciplinary Studies | 1 | 1.9% |
| Science & Technology | 7 | 13.2% |
| Business | 4 | 7.5% |
| Education | 10 | 18.9% |
| Literature & Languages | 0 | 0.0% |
| Liberal Arts & History | 3 | 5.7% |
| Visual & Performing Arts | 9 | 17.0% |
| Communications | 1 | 1.9% |
| Arts & Humanities | 6 | 11.3% |
| Total | 53 | 100.0% |
Transportation & Commute in Weston
Vehicle Availability by Sex in Weston
The most prevalent vehicle ownership categories in Weston are males with 3 vehicles (44, accounting for 32.4%) and females with 3 vehicles (35, making up 65.7%).
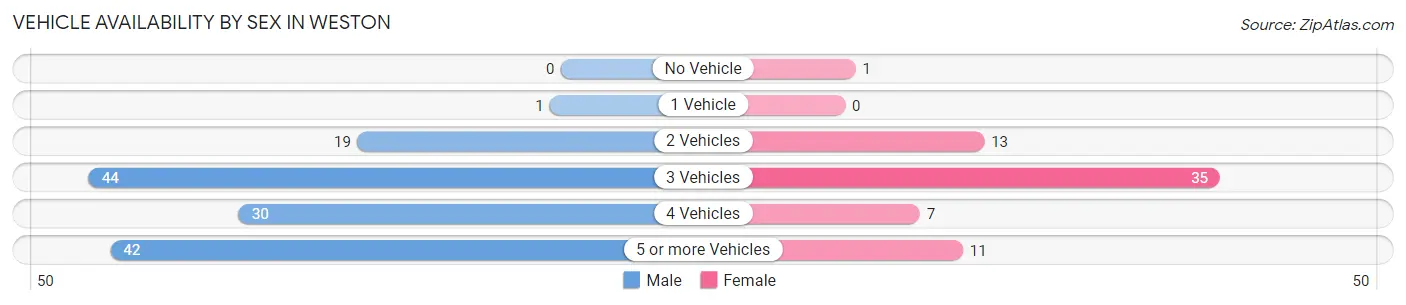
| Vehicles Available | Male | Female |
| No Vehicle | 0 (0.0%) | 1 (1.5%) |
| 1 Vehicle | 1 (0.7%) | 0 (0.0%) |
| 2 Vehicles | 19 (14.0%) | 13 (19.4%) |
| 3 Vehicles | 44 (32.4%) | 35 (52.2%) |
| 4 Vehicles | 30 (22.1%) | 7 (10.4%) |
| 5 or more Vehicles | 42 (30.9%) | 11 (16.4%) |
| Total | 136 (100.0%) | 67 (100.0%) |
Commute Time in Weston
The most frequently occuring commute durations in Weston are 15 to 19 minutes (40 commuters, 22.1%), 30 to 34 minutes (40 commuters, 22.1%), and 20 to 24 minutes (26 commuters, 14.4%).
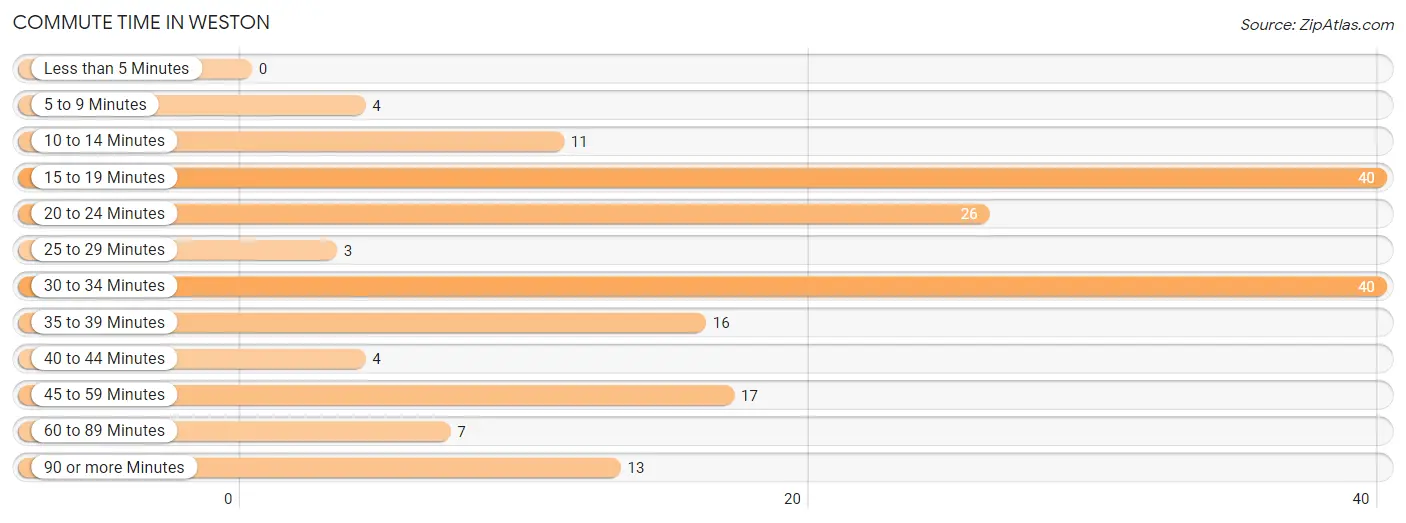
| Commute Time | # Commuters | % Commuters |
| Less than 5 Minutes | 0 | 0.0% |
| 5 to 9 Minutes | 4 | 2.2% |
| 10 to 14 Minutes | 11 | 6.1% |
| 15 to 19 Minutes | 40 | 22.1% |
| 20 to 24 Minutes | 26 | 14.4% |
| 25 to 29 Minutes | 3 | 1.7% |
| 30 to 34 Minutes | 40 | 22.1% |
| 35 to 39 Minutes | 16 | 8.8% |
| 40 to 44 Minutes | 4 | 2.2% |
| 45 to 59 Minutes | 17 | 9.4% |
| 60 to 89 Minutes | 7 | 3.9% |
| 90 or more Minutes | 13 | 7.2% |
Commute Time by Sex in Weston
The most common commute times in Weston are 30 to 34 minutes (30 commuters, 24.0%) for males and 15 to 19 minutes (13 commuters, 23.2%) for females.
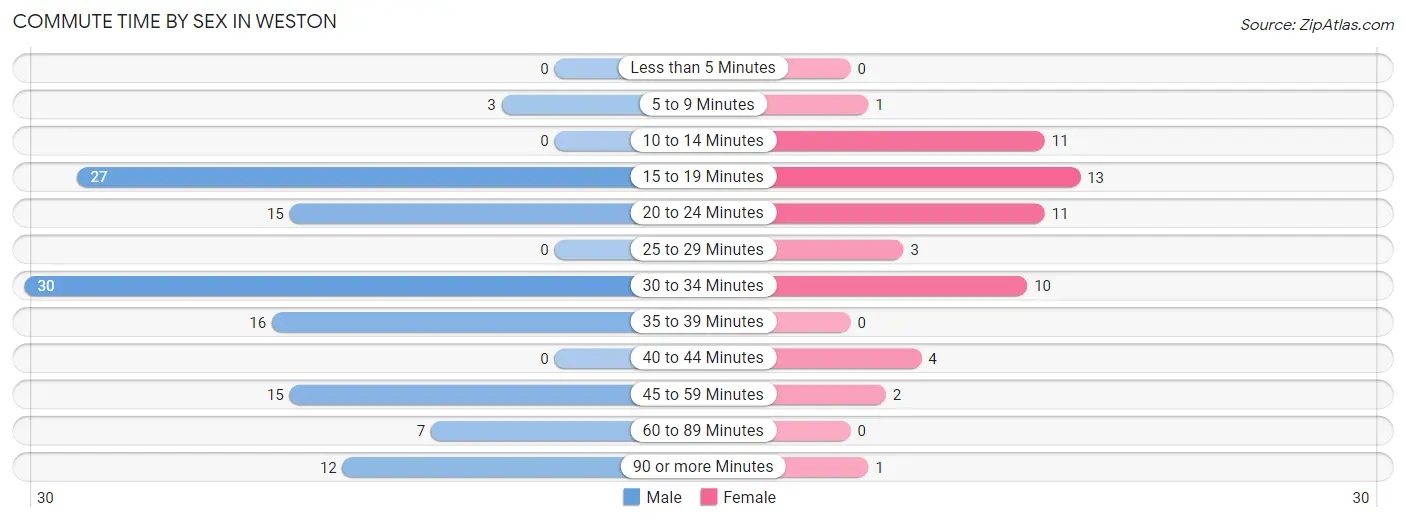
| Commute Time | Male | Female |
| Less than 5 Minutes | 0 (0.0%) | 0 (0.0%) |
| 5 to 9 Minutes | 3 (2.4%) | 1 (1.8%) |
| 10 to 14 Minutes | 0 (0.0%) | 11 (19.6%) |
| 15 to 19 Minutes | 27 (21.6%) | 13 (23.2%) |
| 20 to 24 Minutes | 15 (12.0%) | 11 (19.6%) |
| 25 to 29 Minutes | 0 (0.0%) | 3 (5.4%) |
| 30 to 34 Minutes | 30 (24.0%) | 10 (17.9%) |
| 35 to 39 Minutes | 16 (12.8%) | 0 (0.0%) |
| 40 to 44 Minutes | 0 (0.0%) | 4 (7.1%) |
| 45 to 59 Minutes | 15 (12.0%) | 2 (3.6%) |
| 60 to 89 Minutes | 7 (5.6%) | 0 (0.0%) |
| 90 or more Minutes | 12 (9.6%) | 1 (1.8%) |
Time of Departure to Work by Sex in Weston
The most frequent times of departure to work in Weston are 6:30 AM to 6:59 AM (24, 19.2%) for males and 7:30 AM to 7:59 AM (15, 26.8%) for females.
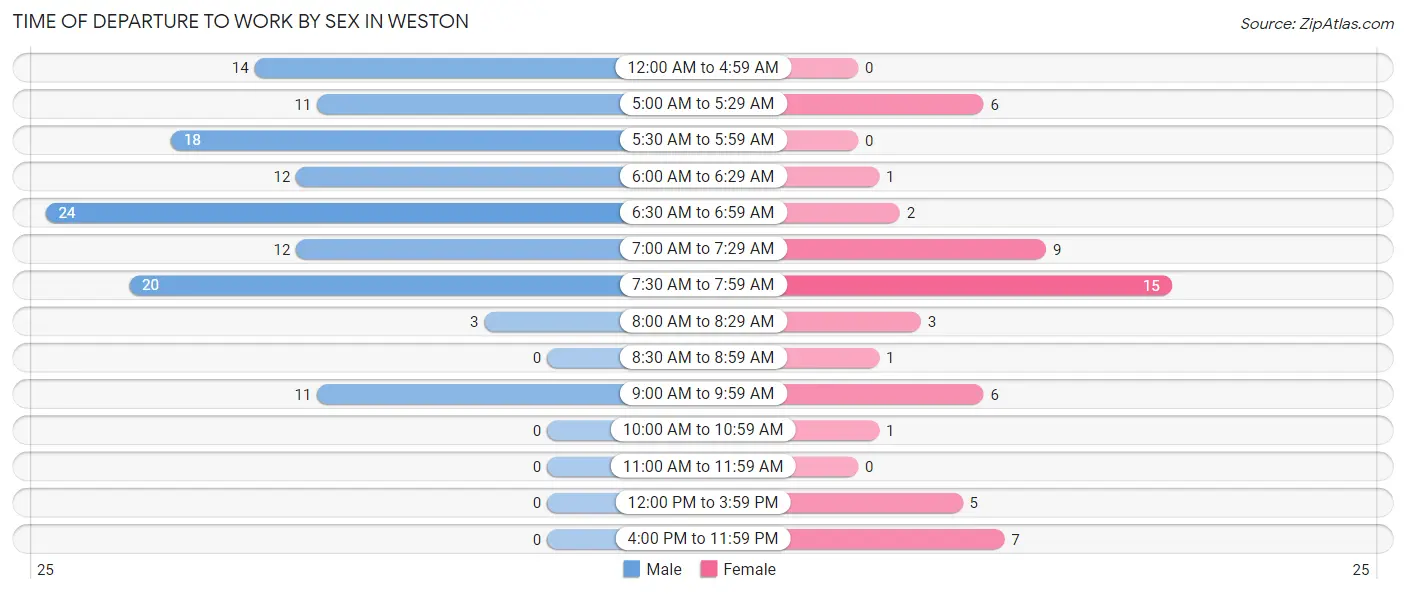
| Time of Departure | Male | Female |
| 12:00 AM to 4:59 AM | 14 (11.2%) | 0 (0.0%) |
| 5:00 AM to 5:29 AM | 11 (8.8%) | 6 (10.7%) |
| 5:30 AM to 5:59 AM | 18 (14.4%) | 0 (0.0%) |
| 6:00 AM to 6:29 AM | 12 (9.6%) | 1 (1.8%) |
| 6:30 AM to 6:59 AM | 24 (19.2%) | 2 (3.6%) |
| 7:00 AM to 7:29 AM | 12 (9.6%) | 9 (16.1%) |
| 7:30 AM to 7:59 AM | 20 (16.0%) | 15 (26.8%) |
| 8:00 AM to 8:29 AM | 3 (2.4%) | 3 (5.4%) |
| 8:30 AM to 8:59 AM | 0 (0.0%) | 1 (1.8%) |
| 9:00 AM to 9:59 AM | 11 (8.8%) | 6 (10.7%) |
| 10:00 AM to 10:59 AM | 0 (0.0%) | 1 (1.8%) |
| 11:00 AM to 11:59 AM | 0 (0.0%) | 0 (0.0%) |
| 12:00 PM to 3:59 PM | 0 (0.0%) | 5 (8.9%) |
| 4:00 PM to 11:59 PM | 0 (0.0%) | 7 (12.5%) |
| Total | 125 (100.0%) | 56 (100.0%) |
Housing Occupancy in Weston
Occupancy by Ownership in Weston
Of the total 148 dwellings in Weston, owner-occupied units account for 137 (92.6%), while renter-occupied units make up 11 (7.4%).
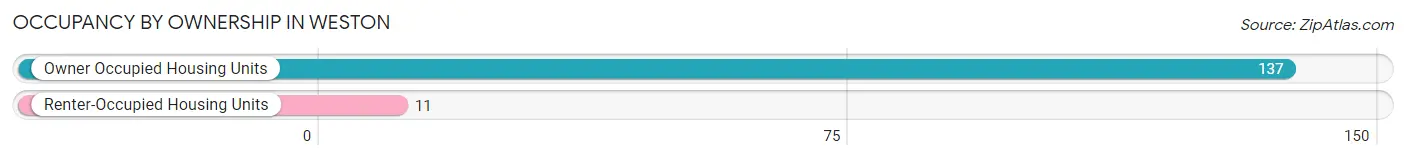
| Occupancy | # Housing Units | % Housing Units |
| Owner Occupied Housing Units | 137 | 92.6% |
| Renter-Occupied Housing Units | 11 | 7.4% |
| Total Occupied Housing Units | 148 | 100.0% |
Occupancy by Household Size in Weston
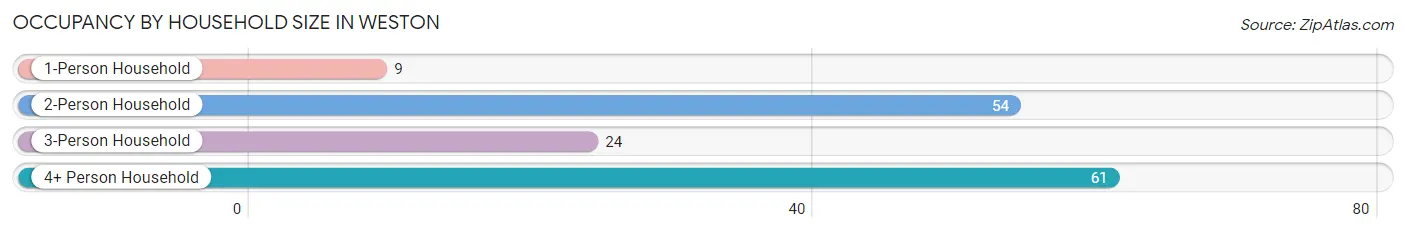
| Household Size | # Housing Units | % Housing Units |
| 1-Person Household | 9 | 6.1% |
| 2-Person Household | 54 | 36.5% |
| 3-Person Household | 24 | 16.2% |
| 4+ Person Household | 61 | 41.2% |
| Total Housing Units | 148 | 100.0% |
Occupancy by Ownership by Household Size in Weston
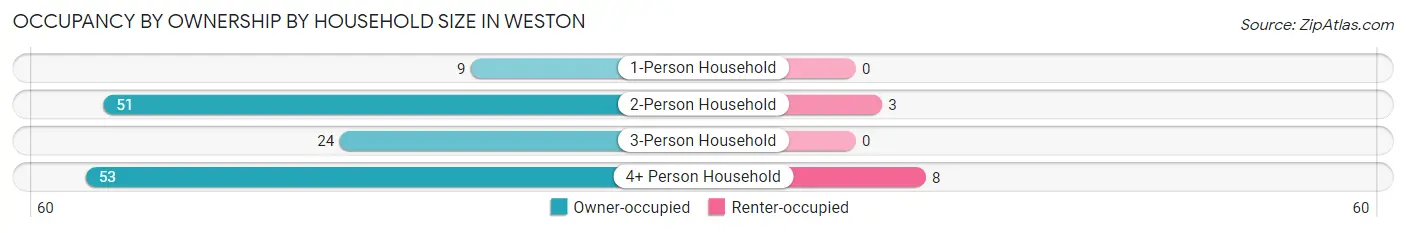
| Household Size | Owner-occupied | Renter-occupied |
| 1-Person Household | 9 (100.0%) | 0 (0.0%) |
| 2-Person Household | 51 (94.4%) | 3 (5.6%) |
| 3-Person Household | 24 (100.0%) | 0 (0.0%) |
| 4+ Person Household | 53 (86.9%) | 8 (13.1%) |
| Total Housing Units | 137 (92.6%) | 11 (7.4%) |
Occupancy by Educational Attainment in Weston
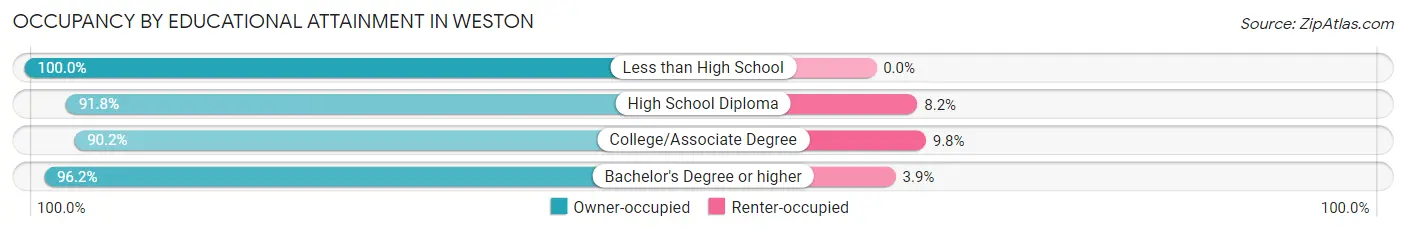
| Household Size | Owner-occupied | Renter-occupied |
| Less than High School | 12 (100.0%) | 0 (0.0%) |
| High School Diploma | 45 (91.8%) | 4 (8.2%) |
| College/Associate Degree | 55 (90.2%) | 6 (9.8%) |
| Bachelor's Degree or higher | 25 (96.2%) | 1 (3.8%) |
Occupancy by Age of Householder in Weston
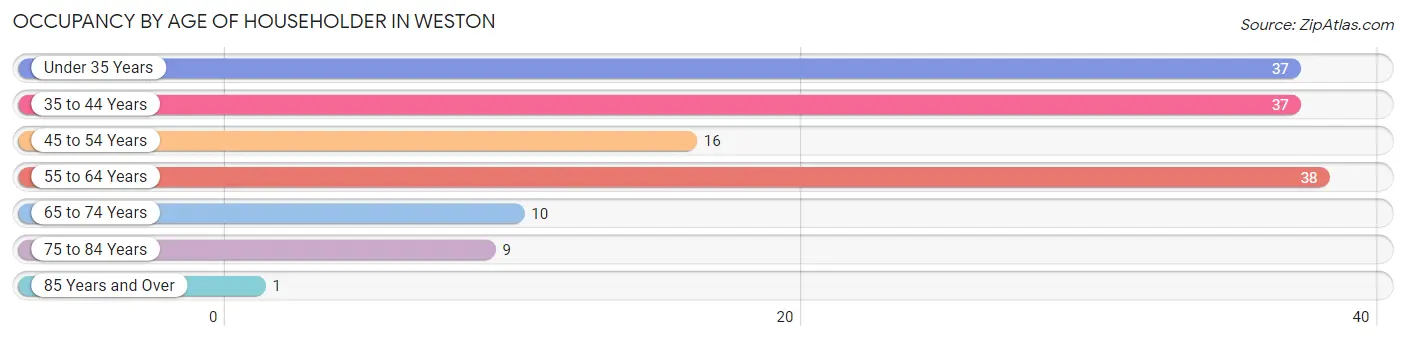
| Age Bracket | # Households | % Households |
| Under 35 Years | 37 | 25.0% |
| 35 to 44 Years | 37 | 25.0% |
| 45 to 54 Years | 16 | 10.8% |
| 55 to 64 Years | 38 | 25.7% |
| 65 to 74 Years | 10 | 6.8% |
| 75 to 84 Years | 9 | 6.1% |
| 85 Years and Over | 1 | 0.7% |
| Total | 148 | 100.0% |
Housing Finances in Weston
Median Income by Occupancy in Weston
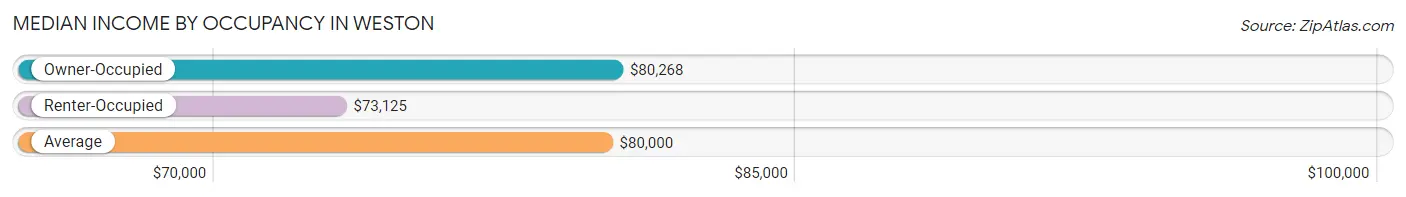
| Occupancy Type | # Households | Median Income |
| Owner-Occupied | 137 (92.6%) | $80,268 |
| Renter-Occupied | 11 (7.4%) | $73,125 |
| Average | 148 (100.0%) | $80,000 |
Occupancy by Householder Income Bracket in Weston
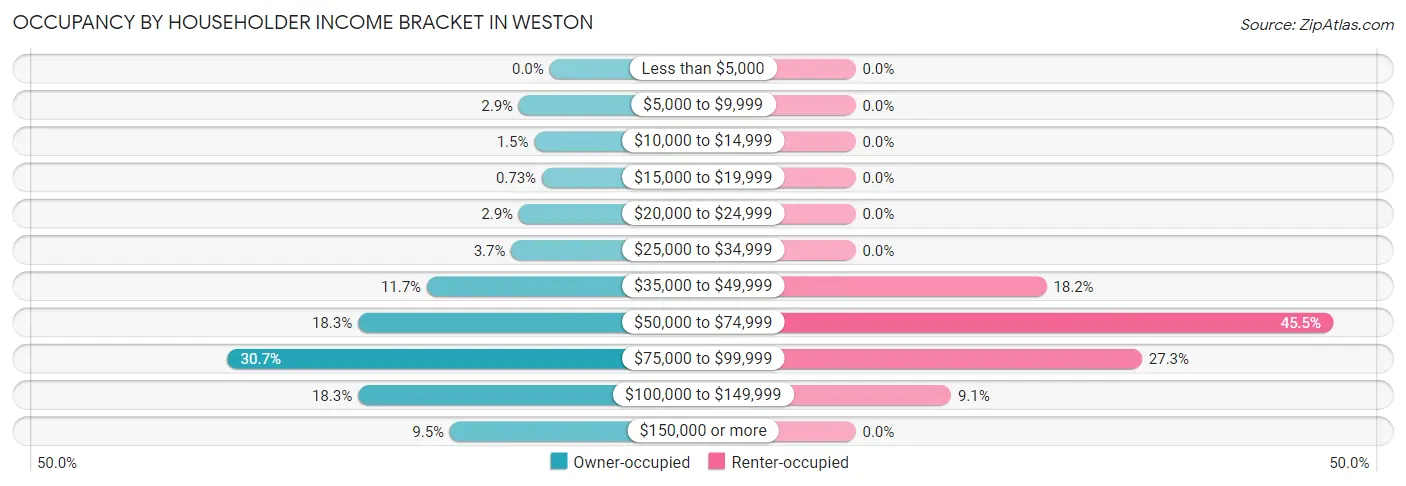
| Income Bracket | Owner-occupied | Renter-occupied |
| Less than $5,000 | 0 (0.0%) | 0 (0.0%) |
| $5,000 to $9,999 | 4 (2.9%) | 0 (0.0%) |
| $10,000 to $14,999 | 2 (1.5%) | 0 (0.0%) |
| $15,000 to $19,999 | 1 (0.7%) | 0 (0.0%) |
| $20,000 to $24,999 | 4 (2.9%) | 0 (0.0%) |
| $25,000 to $34,999 | 5 (3.6%) | 0 (0.0%) |
| $35,000 to $49,999 | 16 (11.7%) | 2 (18.2%) |
| $50,000 to $74,999 | 25 (18.2%) | 5 (45.5%) |
| $75,000 to $99,999 | 42 (30.7%) | 3 (27.3%) |
| $100,000 to $149,999 | 25 (18.2%) | 1 (9.1%) |
| $150,000 or more | 13 (9.5%) | 0 (0.0%) |
| Total | 137 (100.0%) | 11 (100.0%) |
Monthly Housing Cost Tiers in Weston
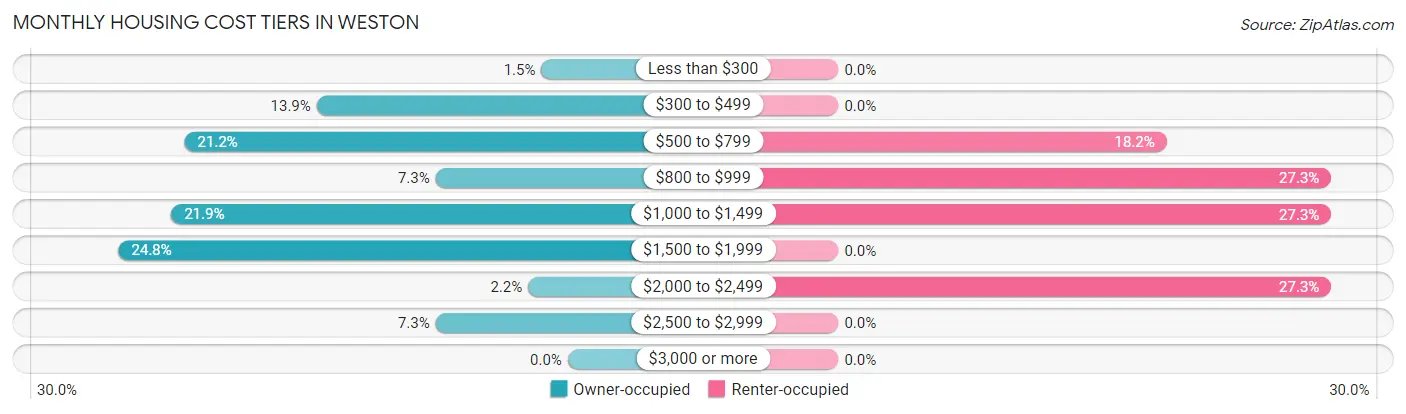
| Monthly Cost | Owner-occupied | Renter-occupied |
| Less than $300 | 2 (1.5%) | 0 (0.0%) |
| $300 to $499 | 19 (13.9%) | 0 (0.0%) |
| $500 to $799 | 29 (21.2%) | 2 (18.2%) |
| $800 to $999 | 10 (7.3%) | 3 (27.3%) |
| $1,000 to $1,499 | 30 (21.9%) | 3 (27.3%) |
| $1,500 to $1,999 | 34 (24.8%) | 0 (0.0%) |
| $2,000 to $2,499 | 3 (2.2%) | 3 (27.3%) |
| $2,500 to $2,999 | 10 (7.3%) | 0 (0.0%) |
| $3,000 or more | 0 (0.0%) | 0 (0.0%) |
| Total | 137 (100.0%) | 11 (100.0%) |
Physical Housing Characteristics in Weston
Housing Structures in Weston
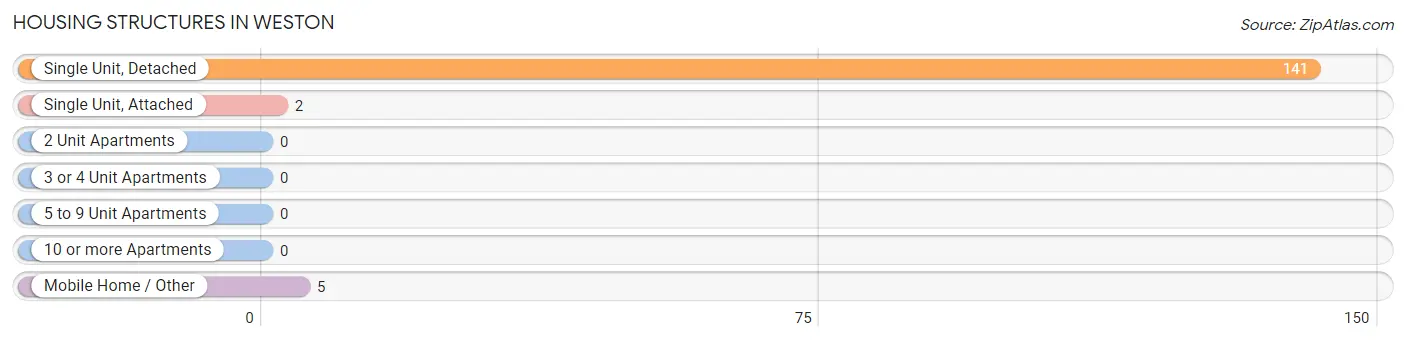
| Structure Type | # Housing Units | % Housing Units |
| Single Unit, Detached | 141 | 95.3% |
| Single Unit, Attached | 2 | 1.3% |
| 2 Unit Apartments | 0 | 0.0% |
| 3 or 4 Unit Apartments | 0 | 0.0% |
| 5 to 9 Unit Apartments | 0 | 0.0% |
| 10 or more Apartments | 0 | 0.0% |
| Mobile Home / Other | 5 | 3.4% |
| Total | 148 | 100.0% |
Housing Structures by Occupancy in Weston
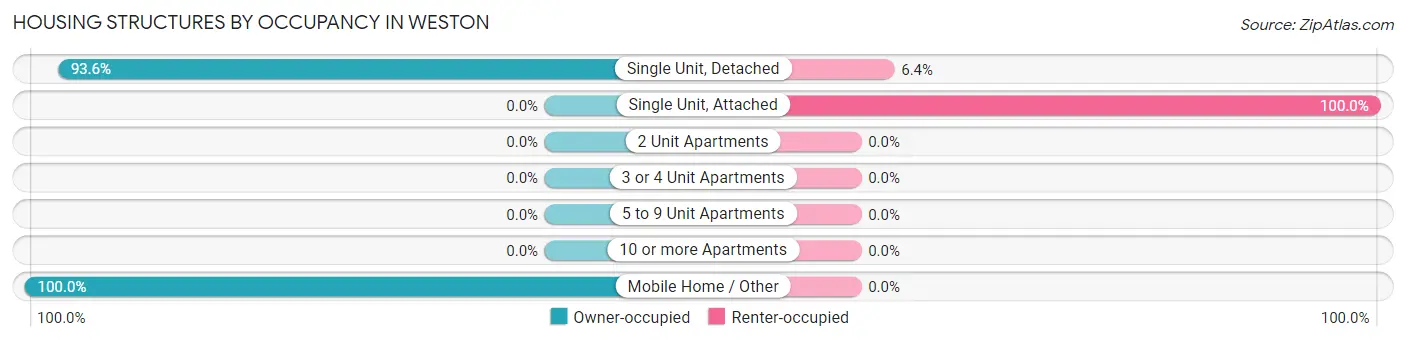
| Structure Type | Owner-occupied | Renter-occupied |
| Single Unit, Detached | 132 (93.6%) | 9 (6.4%) |
| Single Unit, Attached | 0 (0.0%) | 2 (100.0%) |
| 2 Unit Apartments | 0 (0.0%) | 0 (0.0%) |
| 3 or 4 Unit Apartments | 0 (0.0%) | 0 (0.0%) |
| 5 to 9 Unit Apartments | 0 (0.0%) | 0 (0.0%) |
| 10 or more Apartments | 0 (0.0%) | 0 (0.0%) |
| Mobile Home / Other | 5 (100.0%) | 0 (0.0%) |
| Total | 137 (92.6%) | 11 (7.4%) |
Housing Structures by Number of Rooms in Weston
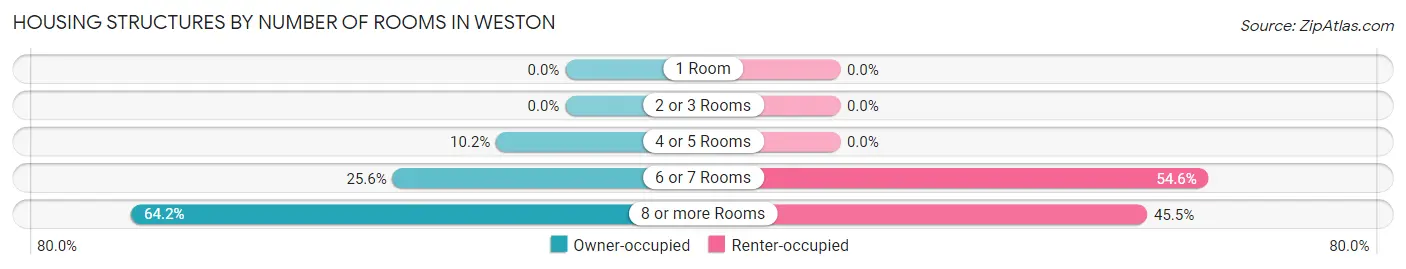
| Number of Rooms | Owner-occupied | Renter-occupied |
| 1 Room | 0 (0.0%) | 0 (0.0%) |
| 2 or 3 Rooms | 0 (0.0%) | 0 (0.0%) |
| 4 or 5 Rooms | 14 (10.2%) | 0 (0.0%) |
| 6 or 7 Rooms | 35 (25.6%) | 6 (54.5%) |
| 8 or more Rooms | 88 (64.2%) | 5 (45.5%) |
| Total | 137 (100.0%) | 11 (100.0%) |
Housing Structure by Heating Type in Weston
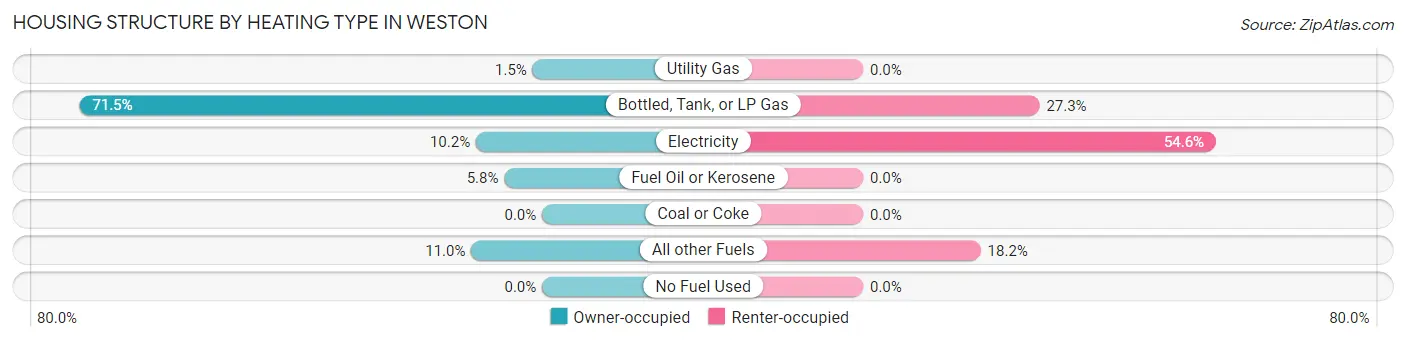
| Heating Type | Owner-occupied | Renter-occupied |
| Utility Gas | 2 (1.5%) | 0 (0.0%) |
| Bottled, Tank, or LP Gas | 98 (71.5%) | 3 (27.3%) |
| Electricity | 14 (10.2%) | 6 (54.5%) |
| Fuel Oil or Kerosene | 8 (5.8%) | 0 (0.0%) |
| Coal or Coke | 0 (0.0%) | 0 (0.0%) |
| All other Fuels | 15 (11.0%) | 2 (18.2%) |
| No Fuel Used | 0 (0.0%) | 0 (0.0%) |
| Total | 137 (100.0%) | 11 (100.0%) |
Household Vehicle Usage in Weston
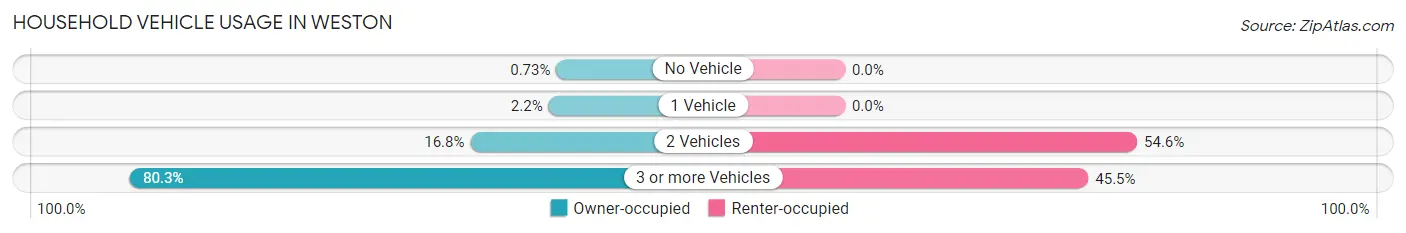
| Vehicles per Household | Owner-occupied | Renter-occupied |
| No Vehicle | 1 (0.7%) | 0 (0.0%) |
| 1 Vehicle | 3 (2.2%) | 0 (0.0%) |
| 2 Vehicles | 23 (16.8%) | 6 (54.5%) |
| 3 or more Vehicles | 110 (80.3%) | 5 (45.5%) |
| Total | 137 (100.0%) | 11 (100.0%) |
Real Estate & Mortgages in Weston
Real Estate and Mortgage Overview in Weston
| Characteristic | Without Mortgage | With Mortgage |
| Housing Units | 38 | 99 |
| Median Property Value | $278,100 | $311,400 |
| Median Household Income | $80,500 | $11 |
| Monthly Housing Costs | $467 | $0 |
| Real Estate Taxes | $1,250 | $4 |
Property Value by Mortgage Status in Weston
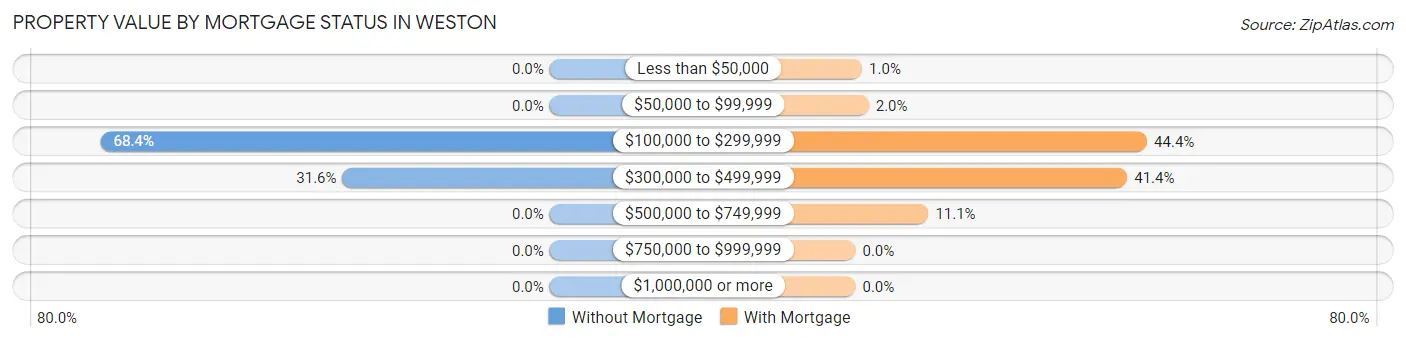
| Property Value | Without Mortgage | With Mortgage |
| Less than $50,000 | 0 (0.0%) | 1 (1.0%) |
| $50,000 to $99,999 | 0 (0.0%) | 2 (2.0%) |
| $100,000 to $299,999 | 26 (68.4%) | 44 (44.4%) |
| $300,000 to $499,999 | 12 (31.6%) | 41 (41.4%) |
| $500,000 to $749,999 | 0 (0.0%) | 11 (11.1%) |
| $750,000 to $999,999 | 0 (0.0%) | 0 (0.0%) |
| $1,000,000 or more | 0 (0.0%) | 0 (0.0%) |
| Total | 38 (100.0%) | 99 (100.0%) |
Household Income by Mortgage Status in Weston
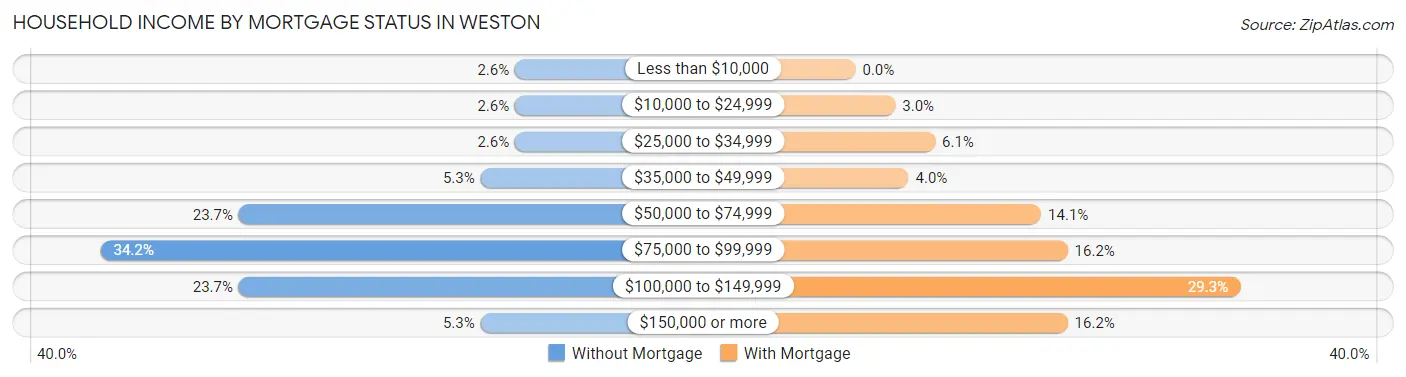
| Household Income | Without Mortgage | With Mortgage |
| Less than $10,000 | 1 (2.6%) | 0 (0.0%) |
| $10,000 to $24,999 | 1 (2.6%) | 3 (3.0%) |
| $25,000 to $34,999 | 1 (2.6%) | 6 (6.1%) |
| $35,000 to $49,999 | 2 (5.3%) | 4 (4.0%) |
| $50,000 to $74,999 | 9 (23.7%) | 14 (14.1%) |
| $75,000 to $99,999 | 13 (34.2%) | 16 (16.2%) |
| $100,000 to $149,999 | 9 (23.7%) | 29 (29.3%) |
| $150,000 or more | 2 (5.3%) | 16 (16.2%) |
| Total | 38 (100.0%) | 99 (100.0%) |
Property Value to Household Income Ratio in Weston
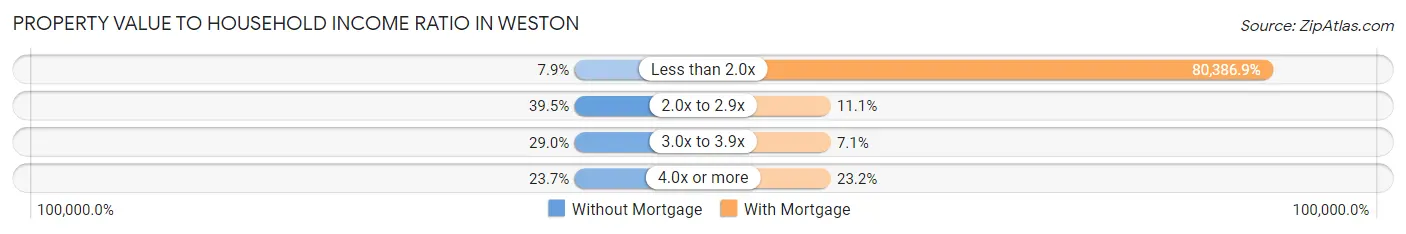
| Value-to-Income Ratio | Without Mortgage | With Mortgage |
| Less than 2.0x | 3 (7.9%) | 79,583 (80,386.9%) |
| 2.0x to 2.9x | 15 (39.5%) | 11 (11.1%) |
| 3.0x to 3.9x | 11 (28.9%) | 7 (7.1%) |
| 4.0x or more | 9 (23.7%) | 23 (23.2%) |
| Total | 38 (100.0%) | 99 (100.0%) |
Real Estate Taxes by Mortgage Status in Weston
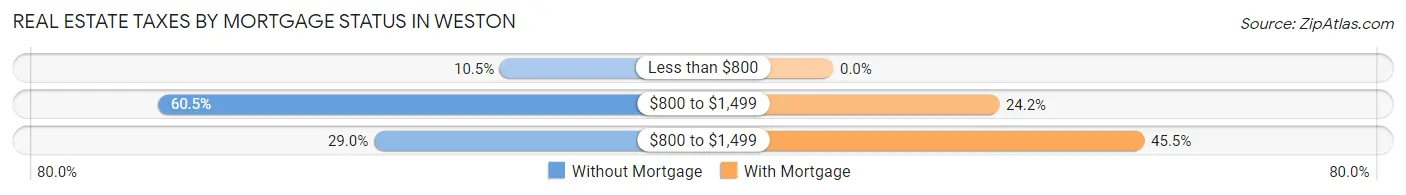
| Property Taxes | Without Mortgage | With Mortgage |
| Less than $800 | 4 (10.5%) | 0 (0.0%) |
| $800 to $1,499 | 23 (60.5%) | 24 (24.2%) |
| $800 to $1,499 | 11 (28.9%) | 45 (45.5%) |
| Total | 38 (100.0%) | 99 (100.0%) |
Health & Disability in Weston
Health Insurance Coverage by Age in Weston
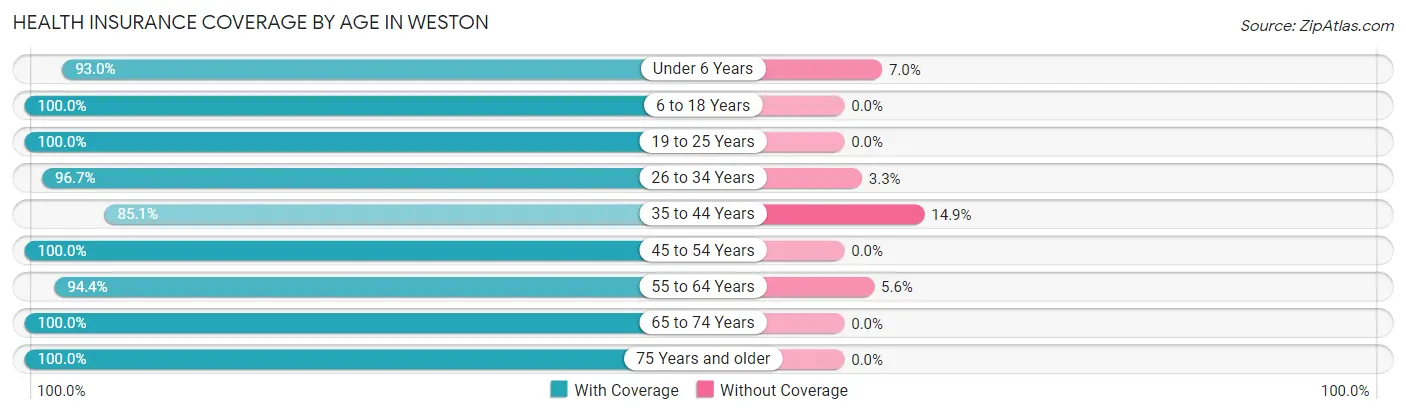
| Age Bracket | With Coverage | Without Coverage |
| Under 6 Years | 53 (93.0%) | 4 (7.0%) |
| 6 to 18 Years | 166 (100.0%) | 0 (0.0%) |
| 19 to 25 Years | 41 (100.0%) | 0 (0.0%) |
| 26 to 34 Years | 59 (96.7%) | 2 (3.3%) |
| 35 to 44 Years | 57 (85.1%) | 10 (14.9%) |
| 45 to 54 Years | 30 (100.0%) | 0 (0.0%) |
| 55 to 64 Years | 51 (94.4%) | 3 (5.6%) |
| 65 to 74 Years | 32 (100.0%) | 0 (0.0%) |
| 75 Years and older | 17 (100.0%) | 0 (0.0%) |
| Total | 506 (96.4%) | 19 (3.6%) |
Health Insurance Coverage by Citizenship Status in Weston
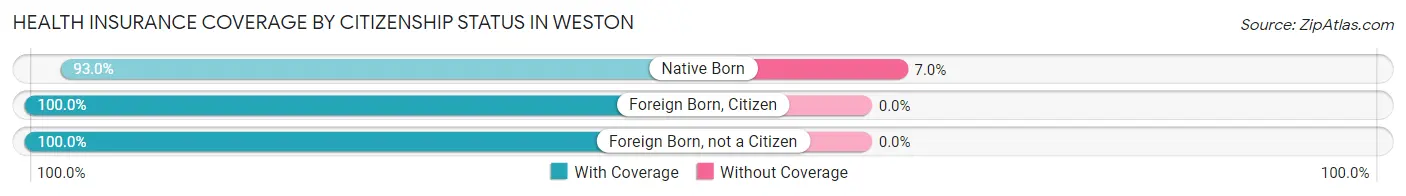
| Citizenship Status | With Coverage | Without Coverage |
| Native Born | 53 (93.0%) | 4 (7.0%) |
| Foreign Born, Citizen | 166 (100.0%) | 0 (0.0%) |
| Foreign Born, not a Citizen | 41 (100.0%) | 0 (0.0%) |
Health Insurance Coverage by Household Income in Weston
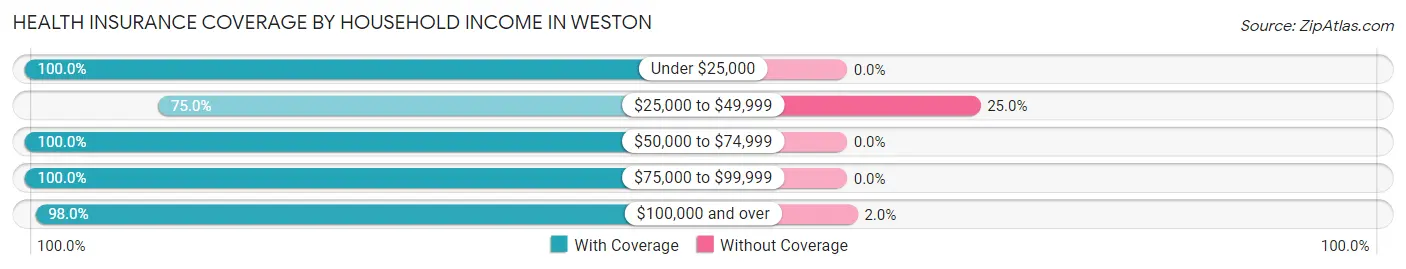
| Household Income | With Coverage | Without Coverage |
| Under $25,000 | 18 (100.0%) | 0 (0.0%) |
| $25,000 to $49,999 | 48 (75.0%) | 16 (25.0%) |
| $50,000 to $74,999 | 134 (100.0%) | 0 (0.0%) |
| $75,000 to $99,999 | 159 (100.0%) | 0 (0.0%) |
| $100,000 and over | 147 (98.0%) | 3 (2.0%) |
Public vs Private Health Insurance Coverage by Age in Weston
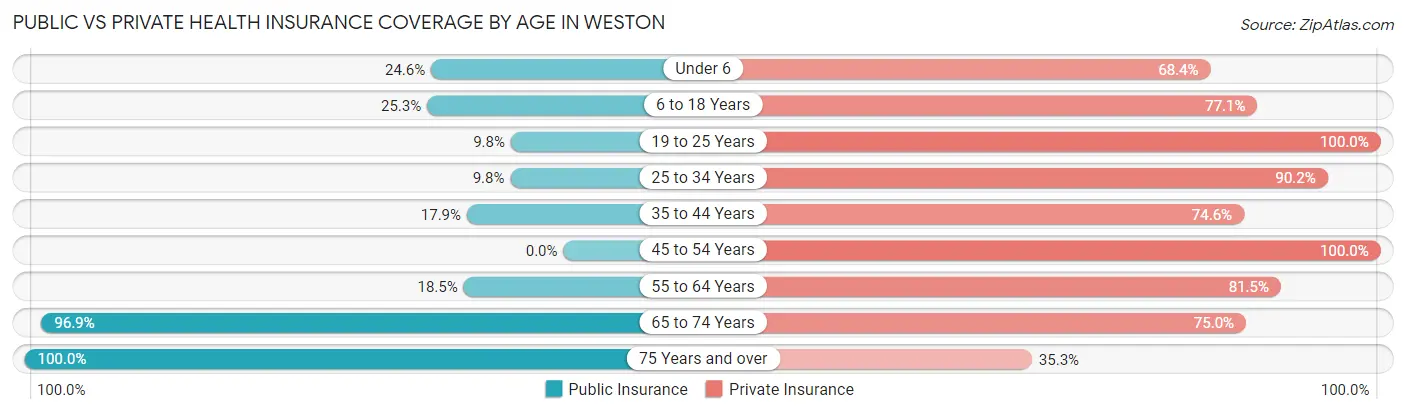
| Age Bracket | Public Insurance | Private Insurance |
| Under 6 | 14 (24.6%) | 39 (68.4%) |
| 6 to 18 Years | 42 (25.3%) | 128 (77.1%) |
| 19 to 25 Years | 4 (9.8%) | 41 (100.0%) |
| 25 to 34 Years | 6 (9.8%) | 55 (90.2%) |
| 35 to 44 Years | 12 (17.9%) | 50 (74.6%) |
| 45 to 54 Years | 0 (0.0%) | 30 (100.0%) |
| 55 to 64 Years | 10 (18.5%) | 44 (81.5%) |
| 65 to 74 Years | 31 (96.9%) | 24 (75.0%) |
| 75 Years and over | 17 (100.0%) | 6 (35.3%) |
| Total | 136 (25.9%) | 417 (79.4%) |
Disability Status by Sex by Age in Weston
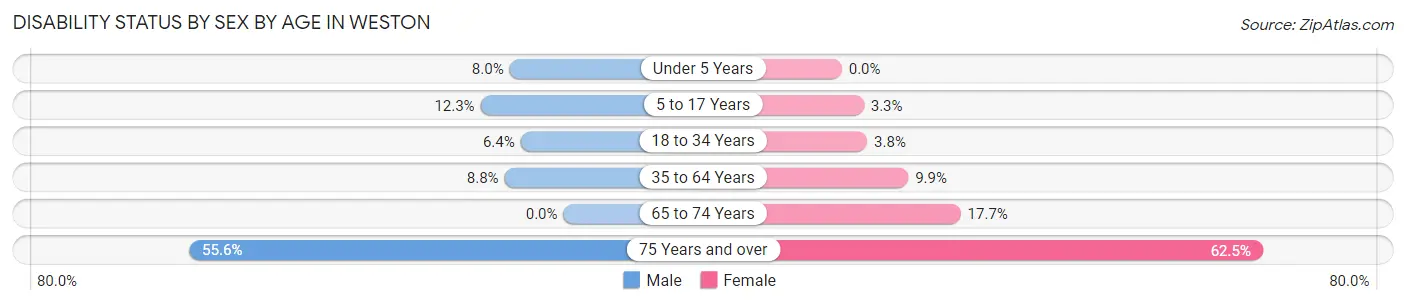
| Age Bracket | Male | Female |
| Under 5 Years | 2 (8.0%) | 0 (0.0%) |
| 5 to 17 Years | 8 (12.3%) | 3 (3.3%) |
| 18 to 34 Years | 4 (6.4%) | 2 (3.8%) |
| 35 to 64 Years | 7 (8.7%) | 7 (9.9%) |
| 65 to 74 Years | 0 (0.0%) | 3 (17.6%) |
| 75 Years and over | 5 (55.6%) | 5 (62.5%) |
Disability Class by Sex by Age in Weston
Disability Class: Hearing Difficulty
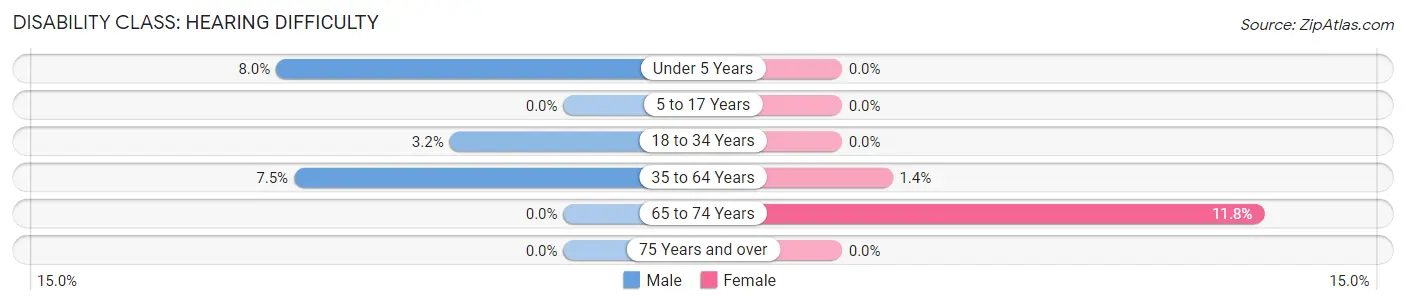
| Age Bracket | Male | Female |
| Under 5 Years | 2 (8.0%) | 0 (0.0%) |
| 5 to 17 Years | 0 (0.0%) | 0 (0.0%) |
| 18 to 34 Years | 2 (3.2%) | 0 (0.0%) |
| 35 to 64 Years | 6 (7.5%) | 1 (1.4%) |
| 65 to 74 Years | 0 (0.0%) | 2 (11.8%) |
| 75 Years and over | 0 (0.0%) | 0 (0.0%) |
Disability Class: Vision Difficulty
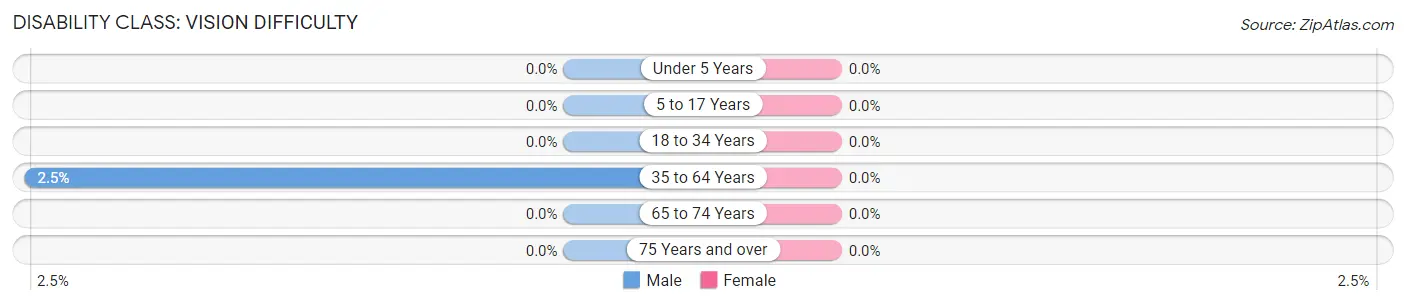
| Age Bracket | Male | Female |
| Under 5 Years | 0 (0.0%) | 0 (0.0%) |
| 5 to 17 Years | 0 (0.0%) | 0 (0.0%) |
| 18 to 34 Years | 0 (0.0%) | 0 (0.0%) |
| 35 to 64 Years | 2 (2.5%) | 0 (0.0%) |
| 65 to 74 Years | 0 (0.0%) | 0 (0.0%) |
| 75 Years and over | 0 (0.0%) | 0 (0.0%) |
Disability Class: Cognitive Difficulty
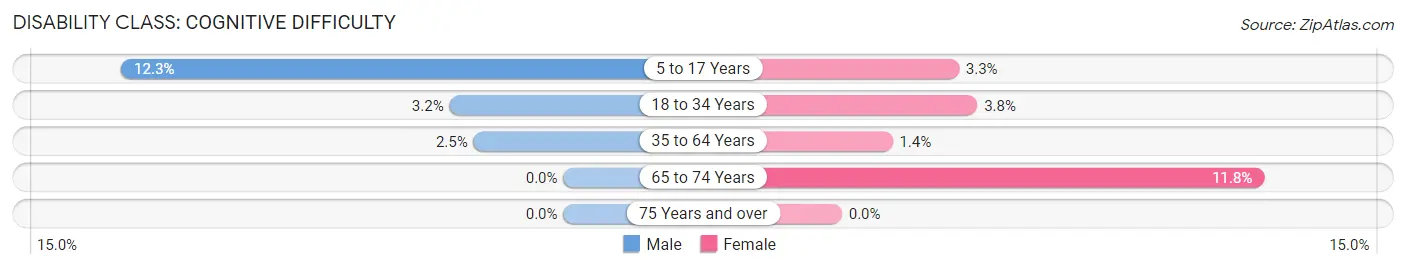
| Age Bracket | Male | Female |
| 5 to 17 Years | 8 (12.3%) | 3 (3.3%) |
| 18 to 34 Years | 2 (3.2%) | 2 (3.8%) |
| 35 to 64 Years | 2 (2.5%) | 1 (1.4%) |
| 65 to 74 Years | 0 (0.0%) | 2 (11.8%) |
| 75 Years and over | 0 (0.0%) | 0 (0.0%) |
Disability Class: Ambulatory Difficulty
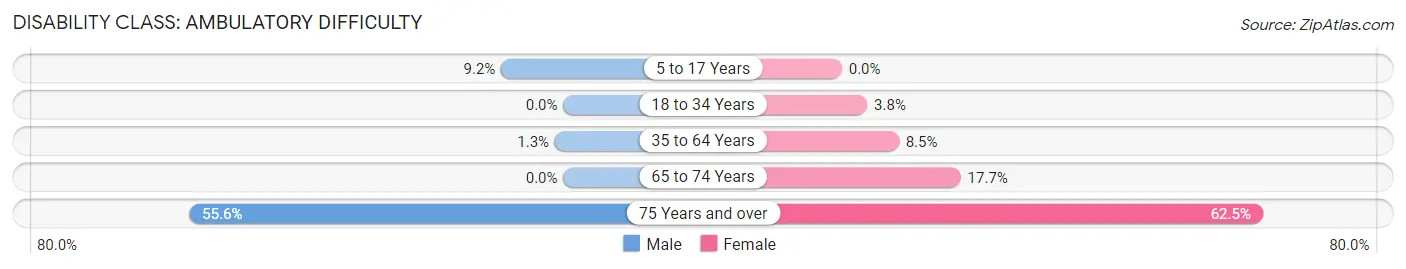
| Age Bracket | Male | Female |
| 5 to 17 Years | 6 (9.2%) | 0 (0.0%) |
| 18 to 34 Years | 0 (0.0%) | 2 (3.8%) |
| 35 to 64 Years | 1 (1.3%) | 6 (8.5%) |
| 65 to 74 Years | 0 (0.0%) | 3 (17.6%) |
| 75 Years and over | 5 (55.6%) | 5 (62.5%) |
Disability Class: Self-Care Difficulty
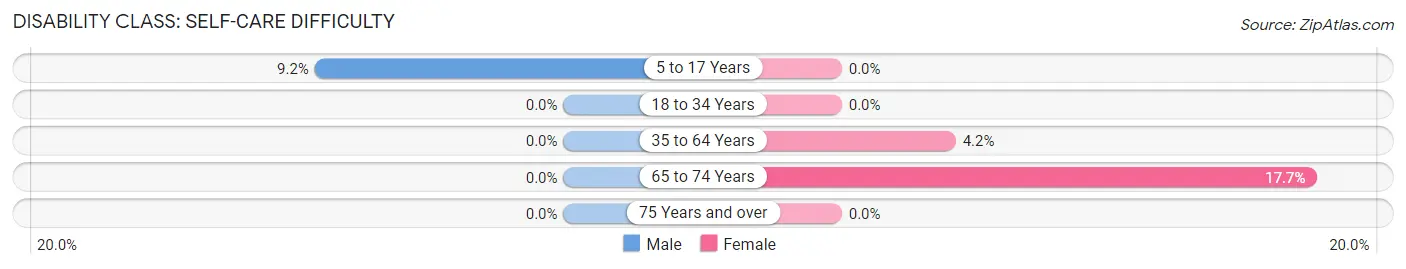
| Age Bracket | Male | Female |
| 5 to 17 Years | 6 (9.2%) | 0 (0.0%) |
| 18 to 34 Years | 0 (0.0%) | 0 (0.0%) |
| 35 to 64 Years | 0 (0.0%) | 3 (4.2%) |
| 65 to 74 Years | 0 (0.0%) | 3 (17.6%) |
| 75 Years and over | 0 (0.0%) | 0 (0.0%) |
Technology Access in Weston
Computing Device Access in Weston
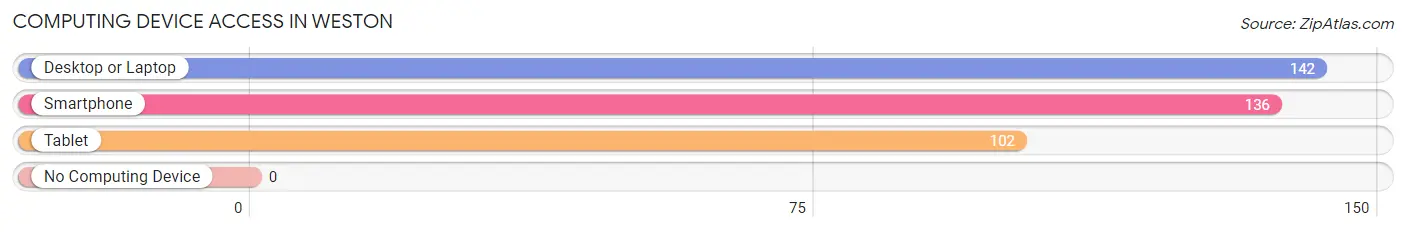
| Device Type | # Households | % Households |
| Desktop or Laptop | 142 | 96.0% |
| Smartphone | 136 | 91.9% |
| Tablet | 102 | 68.9% |
| No Computing Device | 0 | 0.0% |
| Total | 148 | 100.0% |
Internet Access in Weston
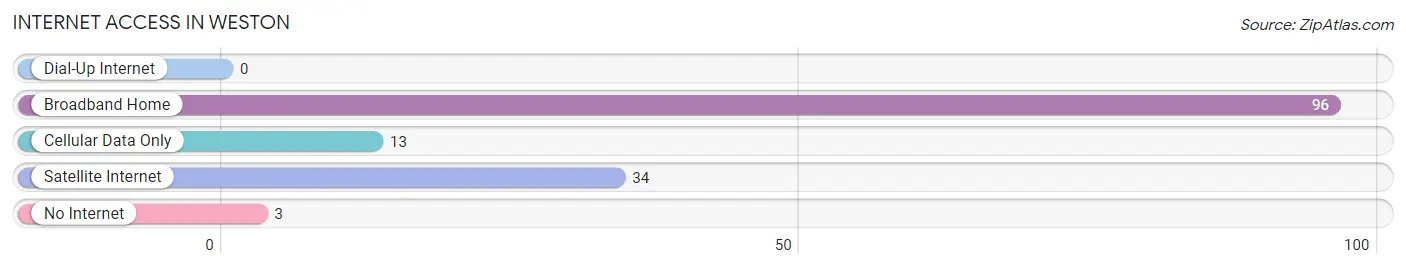
| Internet Type | # Households | % Households |
| Dial-Up Internet | 0 | 0.0% |
| Broadband Home | 96 | 64.9% |
| Cellular Data Only | 13 | 8.8% |
| Satellite Internet | 34 | 23.0% |
| No Internet | 3 | 2.0% |
| Total | 148 | 100.0% |
Weston Summary
Weston, Idaho is a small city located in Franklin County, Idaho. It is situated in the southeastern part of the state, near the Utah border. The city has a population of approximately 1,000 people and is part of the larger Idaho Falls metropolitan area.
History
Weston was founded in 1883 by a group of Mormon settlers from Utah. The settlers were led by William Weston, who was the first mayor of the city. The city was originally named Westonville, but the name was changed to Weston in 1891.
The city was an important stop on the Oregon Short Line Railroad, which connected the Pacific Northwest to the Midwest. The railroad brought economic growth to the area, and Weston became a center for agriculture and commerce.
Geography
Weston is located in the Snake River Plain, a large area of flat land in the southeastern part of Idaho. The city is situated at an elevation of 4,890 feet above sea level. The city is surrounded by mountains, including the Grand Teton Mountains to the west and the Snake River Mountains to the east.
The climate in Weston is semi-arid, with hot summers and cold winters. The average annual temperature is 44 degrees Fahrenheit, and the average annual precipitation is 11.5 inches.
Economy
The economy of Weston is largely based on agriculture. The city is home to several large farms, which produce a variety of crops, including potatoes, wheat, corn, and hay. The city is also home to several food processing plants, which process and package the crops grown in the area.
In addition to agriculture, Weston is home to several small businesses, including restaurants, retail stores, and service providers. The city is also home to a small manufacturing sector, which produces a variety of products, including furniture, clothing, and electronics.
Demographics
As of the 2010 census, the population of Weston was 1,000 people. The racial makeup of the city was 95.2% White, 0.7% Native American, 0.3% Asian, 0.2% African American, and 3.6% from other races. The median household income in Weston was $37,500, and the median family income was $45,000.
The population of Weston is largely Mormon, with approximately 70% of the population belonging to the Church of Jesus Christ of Latter-day Saints. The city is also home to a small Catholic population, as well as a small number of other religious denominations.
Conclusion
Weston, Idaho is a small city located in Franklin County, Idaho. It is situated in the southeastern part of the state, near the Utah border. The city has a population of approximately 1,000 people and is part of the larger Idaho Falls metropolitan area. The economy of Weston is largely based on agriculture, and the city is home to several small businesses, including restaurants, retail stores, and service providers. The population of Weston is largely Mormon, with approximately 70% of the population belonging to the Church of Jesus Christ of Latter-day Saints.
Common Questions
What is Per Capita Income in Weston?
Per Capita income in Weston is $22,822.
What is the Median Family Income in Weston?
Median Family Income in Weston is $79,583.
What is the Median Household income in Weston?
Median Household Income in Weston is $80,000.
What is Income or Wage Gap in Weston?
Income or Wage Gap in Weston is 45.0%.
Women in Weston earn 55.0 cents for every dollar earned by a man.
What is Inequality or Gini Index in Weston?
Inequality or Gini Index in Weston is 0.27.
What is the Total Population of Weston?
Total Population of Weston is 527.
What is the Total Male Population of Weston?
Total Male Population of Weston is 259.
What is the Total Female Population of Weston?
Total Female Population of Weston is 268.
What is the Ratio of Males per 100 Females in Weston?
There are 96.64 Males per 100 Females in Weston.
What is the Ratio of Females per 100 Males in Weston?
There are 103.47 Females per 100 Males in Weston.
What is the Median Population Age in Weston?
Median Population Age in Weston is 26.0 Years.
What is the Average Family Size in Weston
Average Family Size in Weston is 3.7 People.
What is the Average Household Size in Weston
Average Household Size in Weston is 3.6 People.
How Large is the Labor Force in Weston?
There are 218 People in the Labor Forcein in Weston.
What is the Percentage of People in the Labor Force in Weston?
65.1% of People are in the Labor Force in Weston.
What is the Unemployment Rate in Weston?
Unemployment Rate in Weston is 6.9%.