Weippe, ID Map & Demographics
Weippe Map
Weippe Overview
$22,148
PER CAPITA INCOME
$47,344
AVG FAMILY INCOME
$27,422
AVG HOUSEHOLD INCOME
0.46
INEQUALITY / GINI INDEX
369
TOTAL POPULATION
133
MALE POPULATION
236
FEMALE POPULATION
56.36
MALES / 100 FEMALES
177.44
FEMALES / 100 MALES
62.5
MEDIAN AGE
2.5
AVG FAMILY SIZE
1.9
AVG HOUSEHOLD SIZE
114
LABOR FORCE [ PEOPLE ]
32.4%
PERCENT IN LABOR FORCE
Weippe Zip Codes
Weippe Area Codes
Income in Weippe
Income Overview in Weippe
Per Capita Income in Weippe is $22,148, while median incomes of families and households are $47,344 and $27,422 respectively.
| Characteristic | Number | Measure |
| Per Capita Income | 369 | $22,148 |
| Median Family Income | 95 | $47,344 |
| Mean Family Income | 95 | $58,659 |
| Median Household Income | 198 | $27,422 |
| Mean Household Income | 198 | $39,037 |
| Income Deficit | 95 | $0 |
| Wage / Income Gap (%) | 369 | 0.00% |
| Wage / Income Gap ($) | 369 | 100.00¢ per $1 |
| Gini / Inequality Index | 369 | 0.46 |
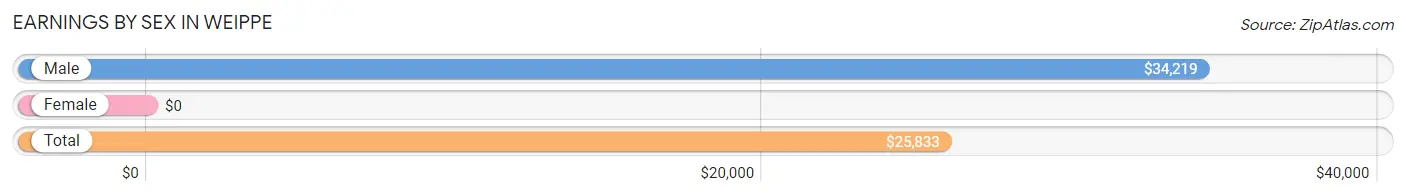
Earnings by Sex in Weippe
| Sex | Number | Average Earnings |
| Male | 69 (52.3%) | $34,219 |
| Female | 63 (47.7%) | $0 |
| Total | 132 (100.0%) | $25,833 |
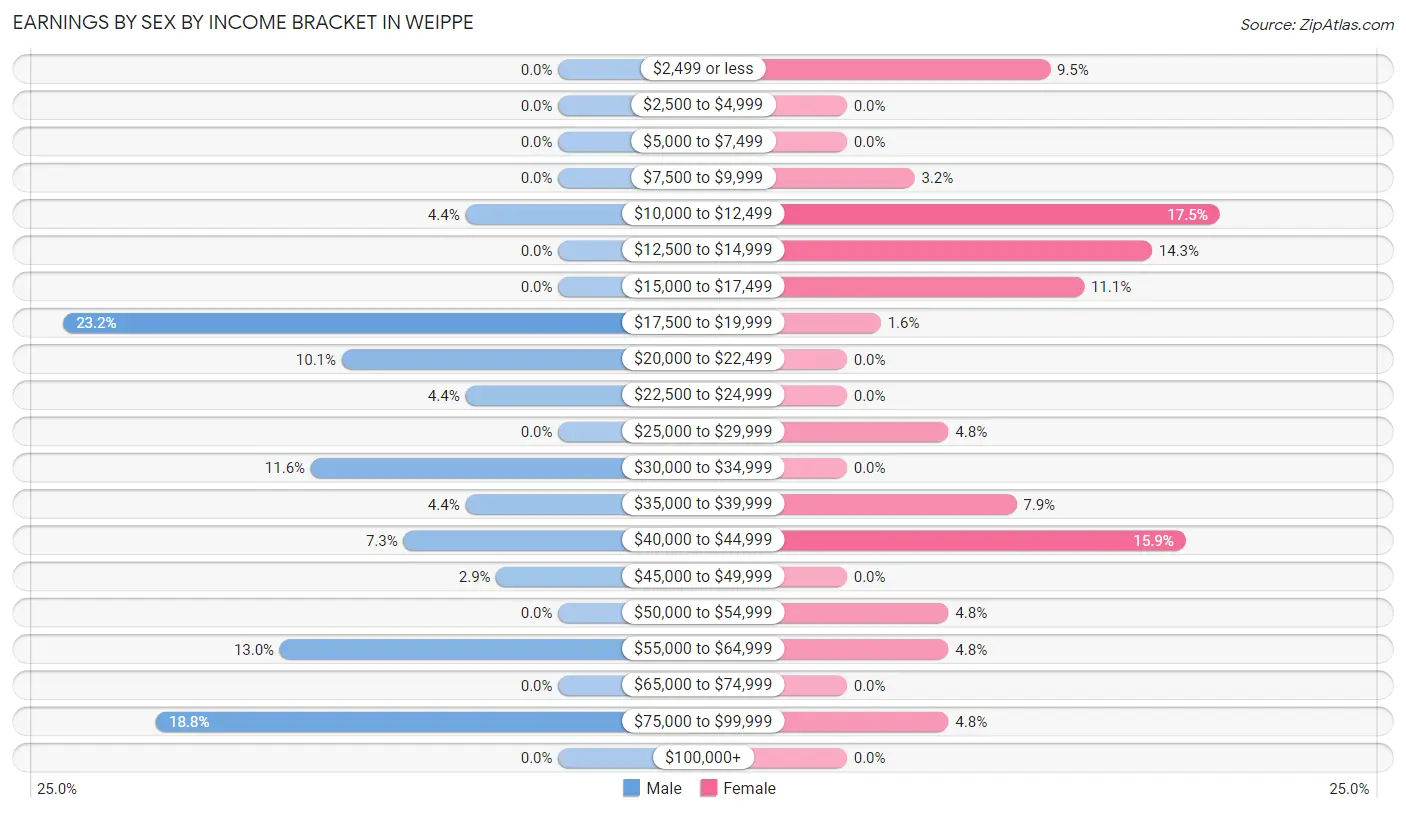
Earnings by Sex by Income Bracket in Weippe
The most common earnings brackets in Weippe are $17,500 to $19,999 for men (16 | 23.2%) and $10,000 to $12,499 for women (11 | 17.5%).
| Income | Male | Female |
| $2,499 or less | 0 (0.0%) | 6 (9.5%) |
| $2,500 to $4,999 | 0 (0.0%) | 0 (0.0%) |
| $5,000 to $7,499 | 0 (0.0%) | 0 (0.0%) |
| $7,500 to $9,999 | 0 (0.0%) | 2 (3.2%) |
| $10,000 to $12,499 | 3 (4.3%) | 11 (17.5%) |
| $12,500 to $14,999 | 0 (0.0%) | 9 (14.3%) |
| $15,000 to $17,499 | 0 (0.0%) | 7 (11.1%) |
| $17,500 to $19,999 | 16 (23.2%) | 1 (1.6%) |
| $20,000 to $22,499 | 7 (10.1%) | 0 (0.0%) |
| $22,500 to $24,999 | 3 (4.3%) | 0 (0.0%) |
| $25,000 to $29,999 | 0 (0.0%) | 3 (4.8%) |
| $30,000 to $34,999 | 8 (11.6%) | 0 (0.0%) |
| $35,000 to $39,999 | 3 (4.3%) | 5 (7.9%) |
| $40,000 to $44,999 | 5 (7.2%) | 10 (15.9%) |
| $45,000 to $49,999 | 2 (2.9%) | 0 (0.0%) |
| $50,000 to $54,999 | 0 (0.0%) | 3 (4.8%) |
| $55,000 to $64,999 | 9 (13.0%) | 3 (4.8%) |
| $65,000 to $74,999 | 0 (0.0%) | 0 (0.0%) |
| $75,000 to $99,999 | 13 (18.8%) | 3 (4.8%) |
| $100,000+ | 0 (0.0%) | 0 (0.0%) |
| Total | 69 (100.0%) | 63 (100.0%) |
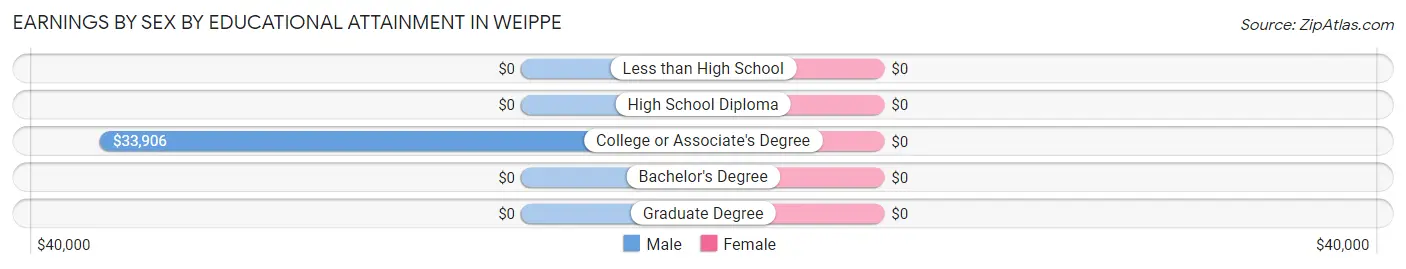
Earnings by Sex by Educational Attainment in Weippe
| Educational Attainment | Male Income | Female Income |
| Less than High School | - | - |
| High School Diploma | - | - |
| College or Associate's Degree | $33,906 | $0 |
| Bachelor's Degree | - | - |
| Graduate Degree | - | - |
| Total | $34,688 | $0 |
Family Income in Weippe
Family Income Brackets in Weippe
According to the Weippe family income data, there are 24 families falling into the $35,000 to $49,999 income range, which is the most common income bracket and makes up 25.3% of all families.

| Income Bracket | # Families | % Families |
| Less than $10,000 | 8 | 8.4% |
| $10,000 to $14,999 | 2 | 2.1% |
| $15,000 to $24,999 | 2 | 2.1% |
| $25,000 to $34,999 | 14 | 14.7% |
| $35,000 to $49,999 | 24 | 25.3% |
| $50,000 to $74,999 | 16 | 16.8% |
| $75,000 to $99,999 | 19 | 20.0% |
| $100,000 to $149,999 | 10 | 10.5% |
| $150,000 to $199,999 | 0 | 0.0% |
| $200,000+ | 0 | 0.0% |
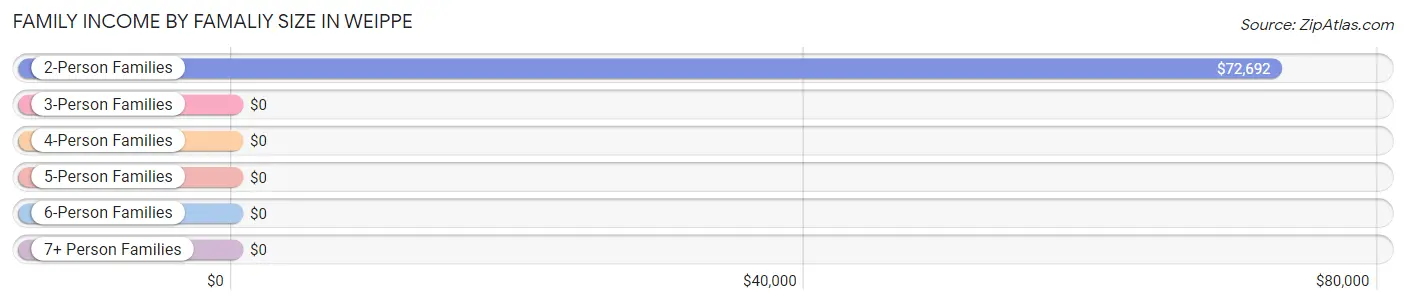
Family Income by Famaliy Size in Weippe
2-person families (76 | 80.0%) account for the highest median family income in Weippe with $72,692 per family, while 2-person families (76 | 80.0%) have the highest median income of $36,346 per family member.
| Income Bracket | # Families | Median Income |
| 2-Person Families | 76 (80.0%) | $72,692 |
| 3-Person Families | 16 (16.8%) | $0 |
| 4-Person Families | 3 (3.2%) | $0 |
| 5-Person Families | 0 (0.0%) | $0 |
| 6-Person Families | 0 (0.0%) | $0 |
| 7+ Person Families | 0 (0.0%) | $0 |
| Total | 95 (100.0%) | $47,344 |
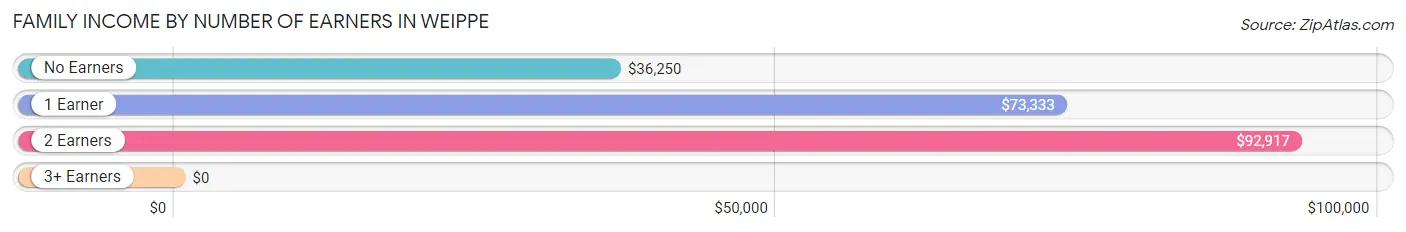
Family Income by Number of Earners in Weippe
| Number of Earners | # Families | Median Income |
| No Earners | 38 (40.0%) | $36,250 |
| 1 Earner | 24 (25.3%) | $73,333 |
| 2 Earners | 30 (31.6%) | $92,917 |
| 3+ Earners | 3 (3.2%) | $0 |
| Total | 95 (100.0%) | $47,344 |
Household Income in Weippe
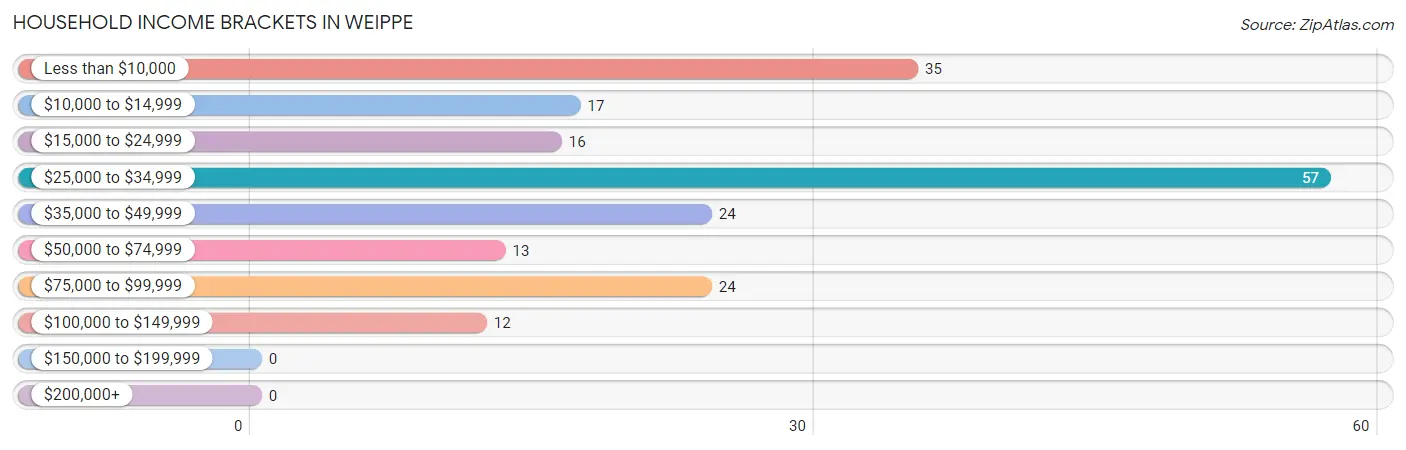
Household Income Brackets in Weippe
With 57 households falling in the category, the $25,000 to $34,999 income range is the most frequent in Weippe, accounting for 28.8% of all households.
| Income Bracket | # Households | % Households |
| Less than $10,000 | 35 | 17.7% |
| $10,000 to $14,999 | 17 | 8.6% |
| $15,000 to $24,999 | 16 | 8.1% |
| $25,000 to $34,999 | 57 | 28.8% |
| $35,000 to $49,999 | 24 | 12.1% |
| $50,000 to $74,999 | 13 | 6.6% |
| $75,000 to $99,999 | 24 | 12.1% |
| $100,000 to $149,999 | 12 | 6.1% |
| $150,000 to $199,999 | 0 | 0.0% |
| $200,000+ | 0 | 0.0% |
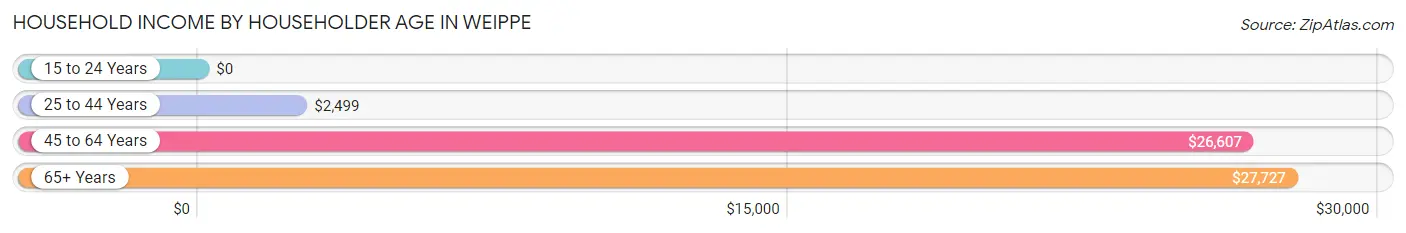
Household Income by Householder Age in Weippe
The median household income in Weippe is $27,422, with the highest median household income of $27,727 found in the 65+ years age bracket for the primary householder. A total of 114 households (57.6%) fall into this category. Meanwhile, the 15 to 24 years age bracket for the primary householder has the lowest median household income of $0, with 2 households (1.0%) in this group.
| Income Bracket | # Households | Median Income |
| 15 to 24 Years | 2 (1.0%) | $0 |
| 25 to 44 Years | 17 (8.6%) | $2,499 |
| 45 to 64 Years | 65 (32.8%) | $26,607 |
| 65+ Years | 114 (57.6%) | $27,727 |
| Total | 198 (100.0%) | $27,422 |
Poverty in Weippe
Income Below Poverty by Sex and Age in Weippe
With 19.6% poverty level for males and 38.1% for females among the residents of Weippe, 18 to 24 year old males and under 5 year old females are the most vulnerable to poverty, with 3 males (100.0%) and 11 females (84.6%) in their respective age groups living below the poverty level.
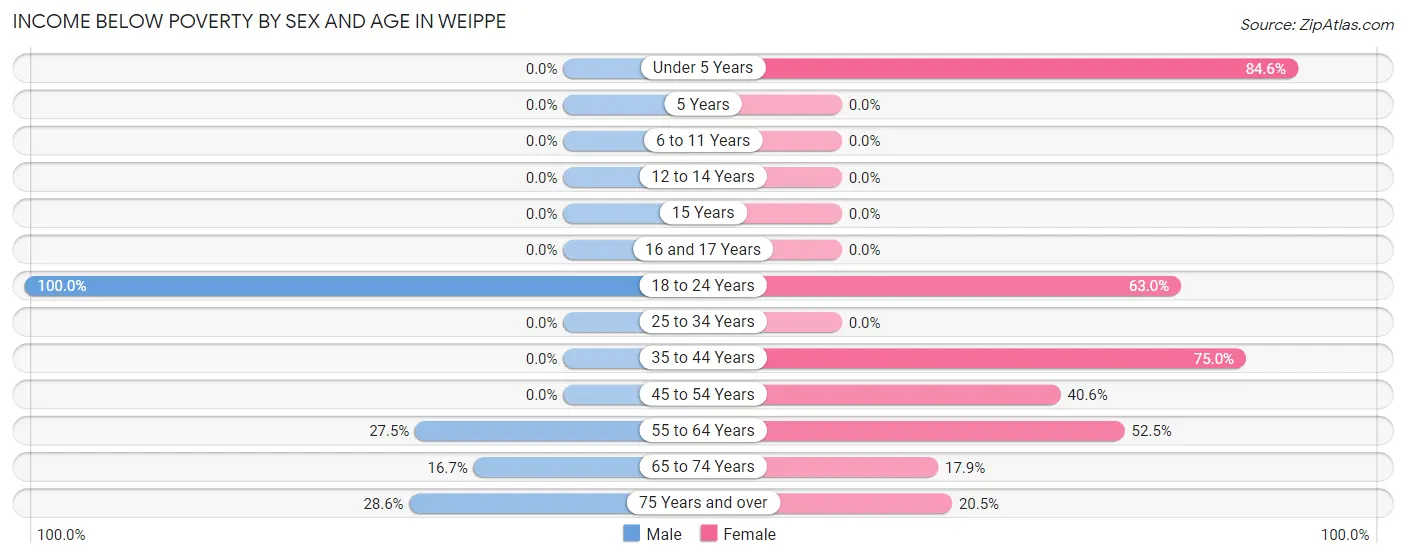
| Age Bracket | Male | Female |
| Under 5 Years | 0 (0.0%) | 11 (84.6%) |
| 5 Years | 0 (0.0%) | 0 (0.0%) |
| 6 to 11 Years | 0 (0.0%) | 0 (0.0%) |
| 12 to 14 Years | 0 (0.0%) | 0 (0.0%) |
| 15 Years | 0 (0.0%) | 0 (0.0%) |
| 16 and 17 Years | 0 (0.0%) | 0 (0.0%) |
| 18 to 24 Years | 3 (100.0%) | 17 (63.0%) |
| 25 to 34 Years | 0 (0.0%) | 0 (0.0%) |
| 35 to 44 Years | 0 (0.0%) | 9 (75.0%) |
| 45 to 54 Years | 0 (0.0%) | 13 (40.6%) |
| 55 to 64 Years | 11 (27.5%) | 21 (52.5%) |
| 65 to 74 Years | 8 (16.7%) | 10 (17.9%) |
| 75 Years and over | 4 (28.6%) | 9 (20.4%) |
| Total | 26 (19.6%) | 90 (38.1%) |
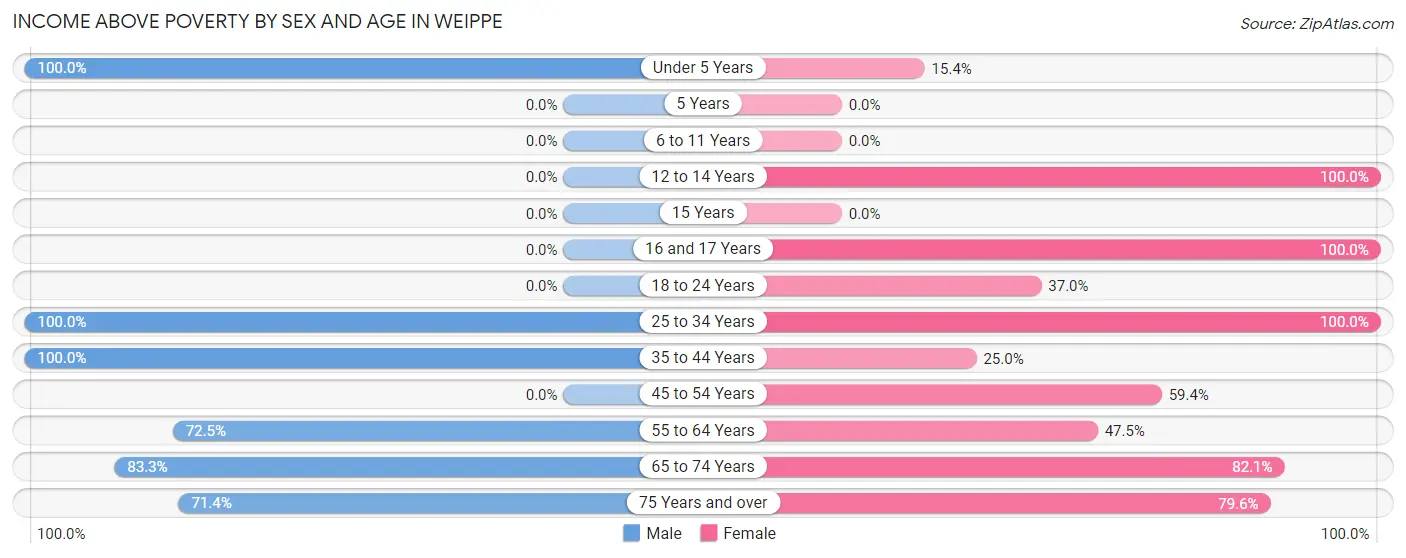
Income Above Poverty by Sex and Age in Weippe
According to the poverty statistics in Weippe, males aged under 5 years and females aged 12 to 14 years are the age groups that are most secure financially, with 100.0% of males and 100.0% of females in these age groups living above the poverty line.
| Age Bracket | Male | Female |
| Under 5 Years | 3 (100.0%) | 2 (15.4%) |
| 5 Years | 0 (0.0%) | 0 (0.0%) |
| 6 to 11 Years | 0 (0.0%) | 0 (0.0%) |
| 12 to 14 Years | 0 (0.0%) | 1 (100.0%) |
| 15 Years | 0 (0.0%) | 0 (0.0%) |
| 16 and 17 Years | 0 (0.0%) | 8 (100.0%) |
| 18 to 24 Years | 0 (0.0%) | 10 (37.0%) |
| 25 to 34 Years | 23 (100.0%) | 3 (100.0%) |
| 35 to 44 Years | 2 (100.0%) | 3 (25.0%) |
| 45 to 54 Years | 0 (0.0%) | 19 (59.4%) |
| 55 to 64 Years | 29 (72.5%) | 19 (47.5%) |
| 65 to 74 Years | 40 (83.3%) | 46 (82.1%) |
| 75 Years and over | 10 (71.4%) | 35 (79.5%) |
| Total | 107 (80.4%) | 146 (61.9%) |
Income Below Poverty Among Married-Couple Families in Weippe
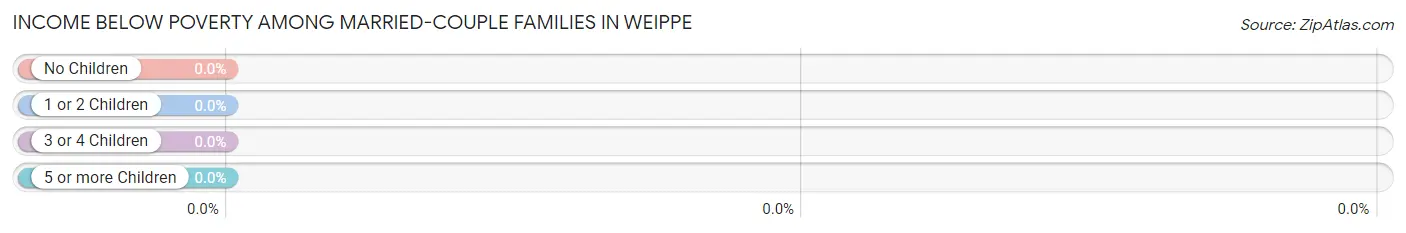
| Children | Above Poverty | Below Poverty |
| No Children | 63 (100.0%) | 0 (0.0%) |
| 1 or 2 Children | 3 (100.0%) | 0 (0.0%) |
| 3 or 4 Children | 0 (0.0%) | 0 (0.0%) |
| 5 or more Children | 0 (0.0%) | 0 (0.0%) |
| Total | 66 (100.0%) | 0 (0.0%) |
Income Below Poverty Among Single-Parent Households in Weippe
According to the poverty data in Weippe, 28.6% or 2 single-father households and 45.5% or 10 single-mother households are living below the poverty line. Among single-father households, those with no children have the highest poverty rate, with 2 households (100.0%) experiencing poverty. Likewise, among single-mother households, those with 1 or 2 children have the highest poverty rate, with 10 households (62.5%) falling below the poverty line.
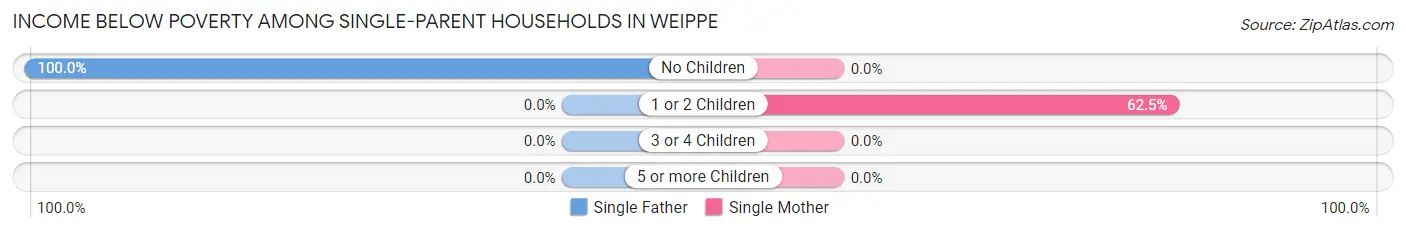
| Children | Single Father | Single Mother |
| No Children | 2 (100.0%) | 0 (0.0%) |
| 1 or 2 Children | 0 (0.0%) | 10 (62.5%) |
| 3 or 4 Children | 0 (0.0%) | 0 (0.0%) |
| 5 or more Children | 0 (0.0%) | 0 (0.0%) |
| Total | 2 (28.6%) | 10 (45.5%) |
Income Below Poverty Among Married-Couple vs Single-Parent Households in Weippe
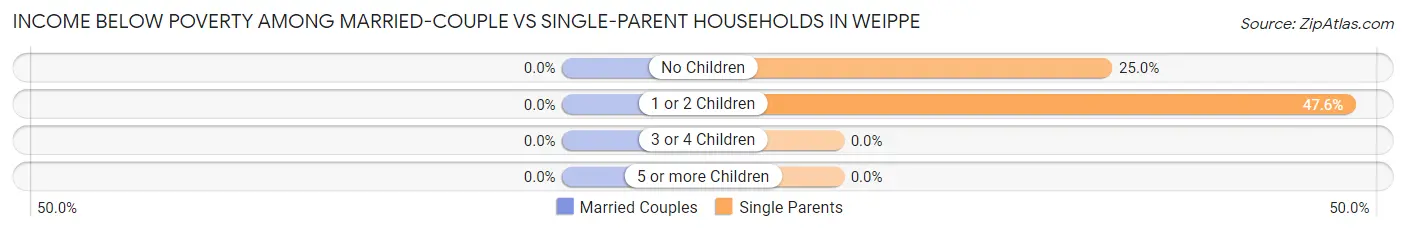
| Children | Married-Couple Families | Single-Parent Households |
| No Children | 0 (0.0%) | 2 (25.0%) |
| 1 or 2 Children | 0 (0.0%) | 10 (47.6%) |
| 3 or 4 Children | 0 (0.0%) | 0 (0.0%) |
| 5 or more Children | 0 (0.0%) | 0 (0.0%) |
| Total | 0 (0.0%) | 12 (41.4%) |
Race in Weippe
The most populous races in Weippe are White / Caucasian (342 | 92.7%), Two or more Races (20 | 5.4%), and Hispanic or Latino (13 | 3.5%).
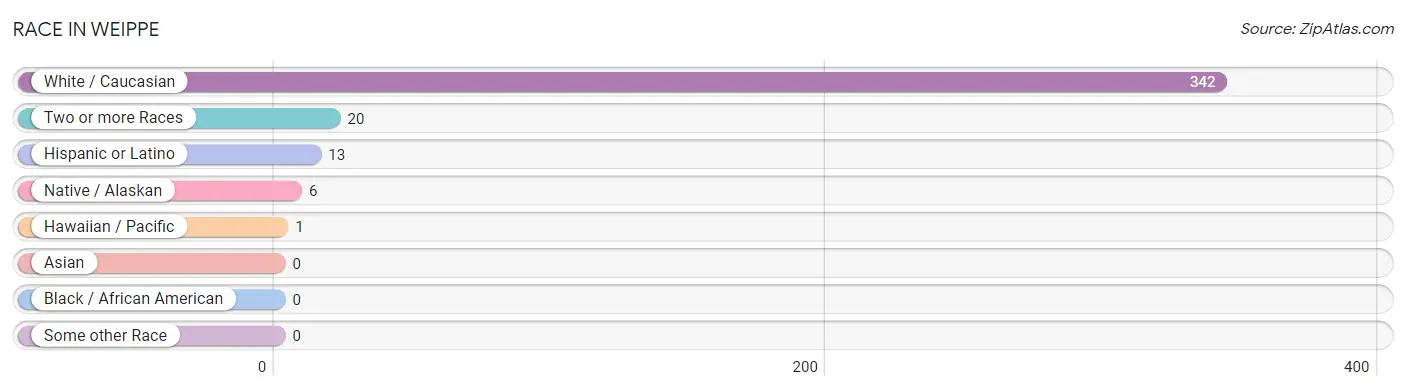
| Race | # Population | % Population |
| Asian | 0 | 0.0% |
| Black / African American | 0 | 0.0% |
| Hawaiian / Pacific | 1 | 0.3% |
| Hispanic or Latino | 13 | 3.5% |
| Native / Alaskan | 6 | 1.6% |
| White / Caucasian | 342 | 92.7% |
| Two or more Races | 20 | 5.4% |
| Some other Race | 0 | 0.0% |
| Total | 369 | 100.0% |
Ancestry in Weippe
The most populous ancestries reported in Weippe are American (49 | 13.3%), English (29 | 7.9%), German (28 | 7.6%), Irish (24 | 6.5%), and Norwegian (13 | 3.5%), together accounting for 38.8% of all Weippe residents.
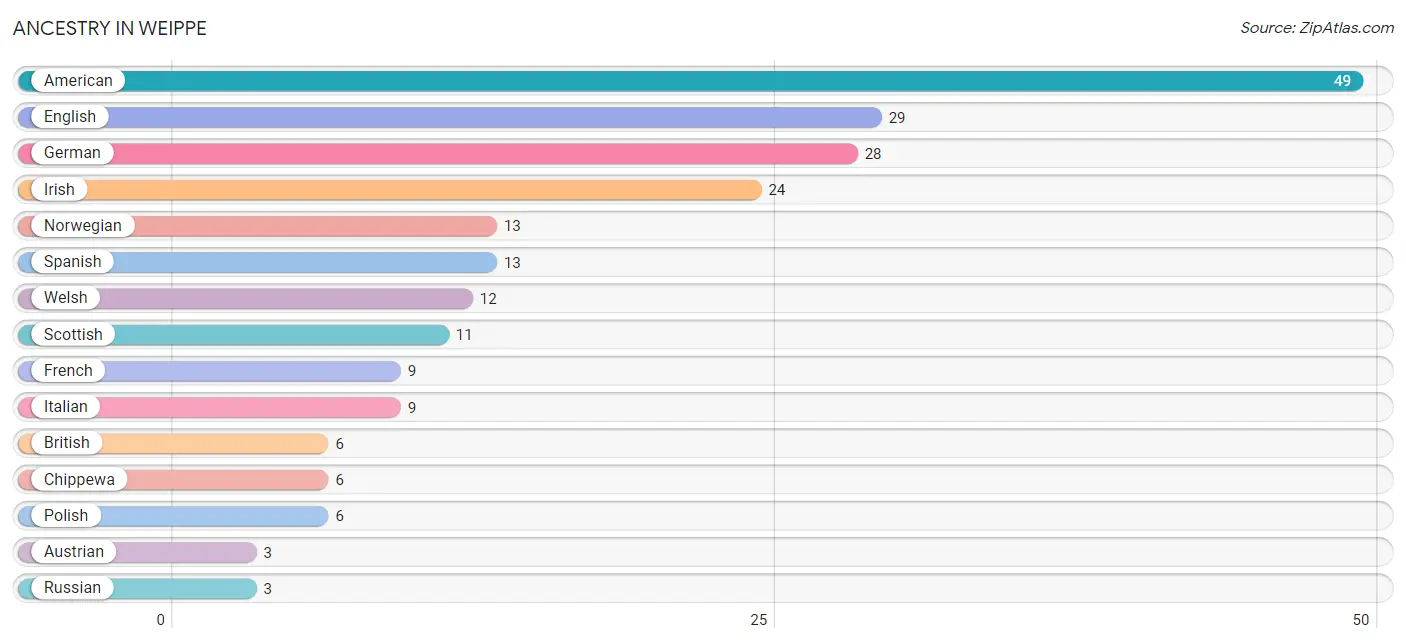
| Ancestry | # Population | % Population |
| American | 49 | 13.3% |
| Austrian | 3 | 0.8% |
| British | 6 | 1.6% |
| Chippewa | 6 | 1.6% |
| English | 29 | 7.9% |
| French | 9 | 2.4% |
| German | 28 | 7.6% |
| Irish | 24 | 6.5% |
| Italian | 9 | 2.4% |
| Native Hawaiian | 1 | 0.3% |
| Norwegian | 13 | 3.5% |
| Polish | 6 | 1.6% |
| Russian | 3 | 0.8% |
| Scottish | 11 | 3.0% |
| Spanish | 13 | 3.5% |
| Welsh | 12 | 3.3% | View All 16 Rows |
Immigrants in Weippe

| Immigration Origin | # Population | % Population | View All 0 Rows |
Sex and Age in Weippe
Sex and Age in Weippe
The most populous age groups in Weippe are 70 to 74 Years (34 | 25.6%) for men and 75 to 79 Years (41 | 17.4%) for women.
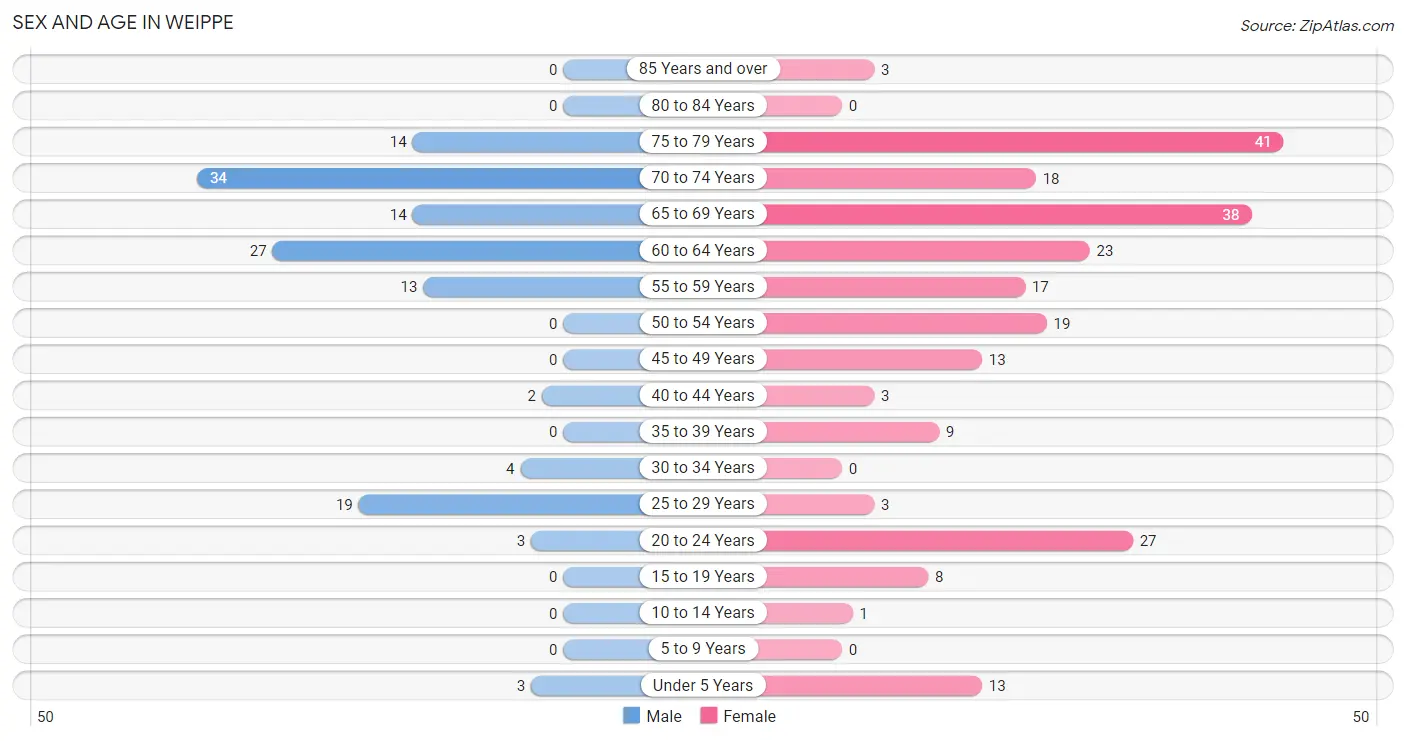
| Age Bracket | Male | Female |
| Under 5 Years | 3 (2.3%) | 13 (5.5%) |
| 5 to 9 Years | 0 (0.0%) | 0 (0.0%) |
| 10 to 14 Years | 0 (0.0%) | 1 (0.4%) |
| 15 to 19 Years | 0 (0.0%) | 8 (3.4%) |
| 20 to 24 Years | 3 (2.3%) | 27 (11.4%) |
| 25 to 29 Years | 19 (14.3%) | 3 (1.3%) |
| 30 to 34 Years | 4 (3.0%) | 0 (0.0%) |
| 35 to 39 Years | 0 (0.0%) | 9 (3.8%) |
| 40 to 44 Years | 2 (1.5%) | 3 (1.3%) |
| 45 to 49 Years | 0 (0.0%) | 13 (5.5%) |
| 50 to 54 Years | 0 (0.0%) | 19 (8.1%) |
| 55 to 59 Years | 13 (9.8%) | 17 (7.2%) |
| 60 to 64 Years | 27 (20.3%) | 23 (9.8%) |
| 65 to 69 Years | 14 (10.5%) | 38 (16.1%) |
| 70 to 74 Years | 34 (25.6%) | 18 (7.6%) |
| 75 to 79 Years | 14 (10.5%) | 41 (17.4%) |
| 80 to 84 Years | 0 (0.0%) | 0 (0.0%) |
| 85 Years and over | 0 (0.0%) | 3 (1.3%) |
| Total | 133 (100.0%) | 236 (100.0%) |
Families and Households in Weippe
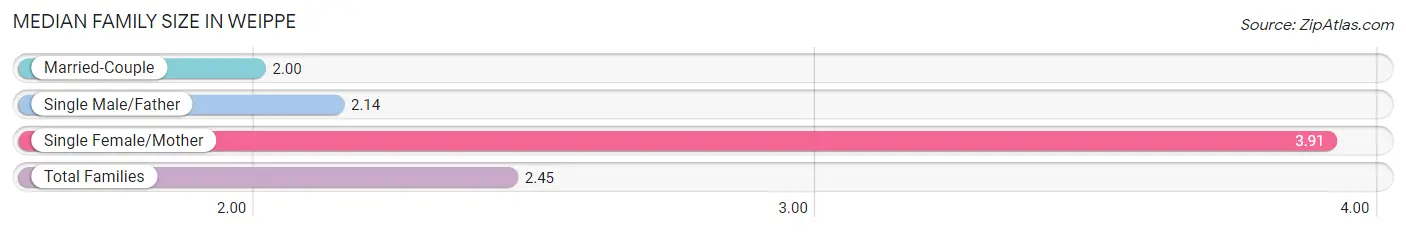
Median Family Size in Weippe
The median family size in Weippe is 2.45 persons per family, with single female/mother families (22 | 23.2%) accounting for the largest median family size of 3.91 persons per family. On the other hand, married-couple families (66 | 69.5%) represent the smallest median family size with 2.00 persons per family.
| Family Type | # Families | Family Size |
| Married-Couple | 66 (69.5%) | 2.00 |
| Single Male/Father | 7 (7.4%) | 2.14 |
| Single Female/Mother | 22 (23.2%) | 3.91 |
| Total Families | 95 (100.0%) | 2.45 |
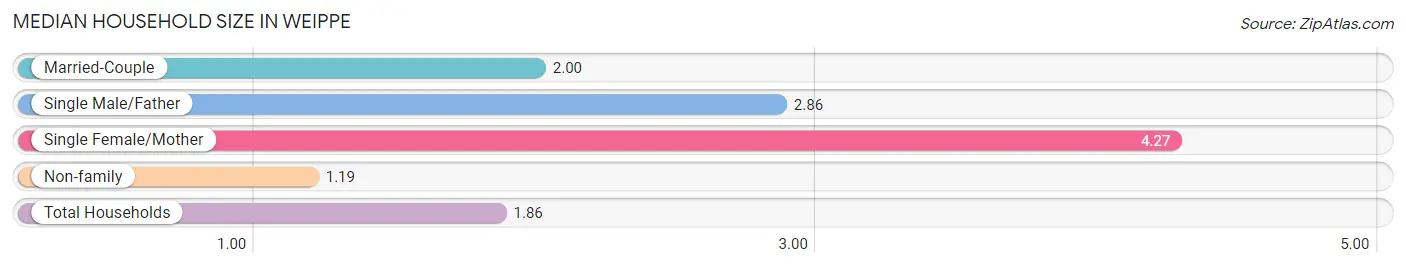
Median Household Size in Weippe
The median household size in Weippe is 1.86 persons per household, with single female/mother households (22 | 11.1%) accounting for the largest median household size of 4.27 persons per household. non-family households (103 | 52.0%) represent the smallest median household size with 1.19 persons per household.
| Household Type | # Households | Household Size |
| Married-Couple | 66 (33.3%) | 2.00 |
| Single Male/Father | 7 (3.5%) | 2.86 |
| Single Female/Mother | 22 (11.1%) | 4.27 |
| Non-family | 103 (52.0%) | 1.19 |
| Total Households | 198 (100.0%) | 1.86 |
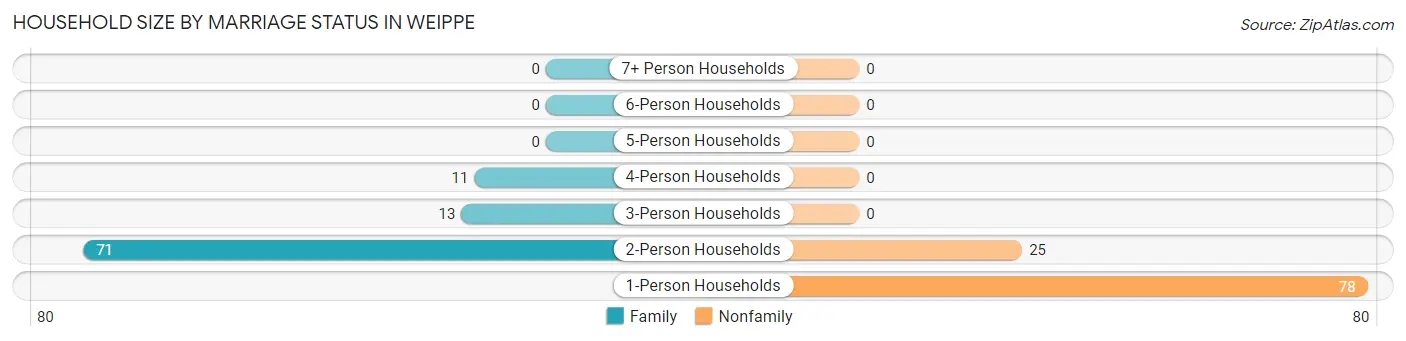
Household Size by Marriage Status in Weippe
Out of a total of 198 households in Weippe, 95 (48.0%) are family households, while 103 (52.0%) are nonfamily households. The most numerous type of family households are 2-person households, comprising 71, and the most common type of nonfamily households are 1-person households, comprising 78.
| Household Size | Family Households | Nonfamily Households |
| 1-Person Households | - | 78 (39.4%) |
| 2-Person Households | 71 (35.9%) | 25 (12.6%) |
| 3-Person Households | 13 (6.6%) | 0 (0.0%) |
| 4-Person Households | 11 (5.6%) | 0 (0.0%) |
| 5-Person Households | 0 (0.0%) | 0 (0.0%) |
| 6-Person Households | 0 (0.0%) | 0 (0.0%) |
| 7+ Person Households | 0 (0.0%) | 0 (0.0%) |
| Total | 95 (48.0%) | 103 (52.0%) |
Female Fertility in Weippe
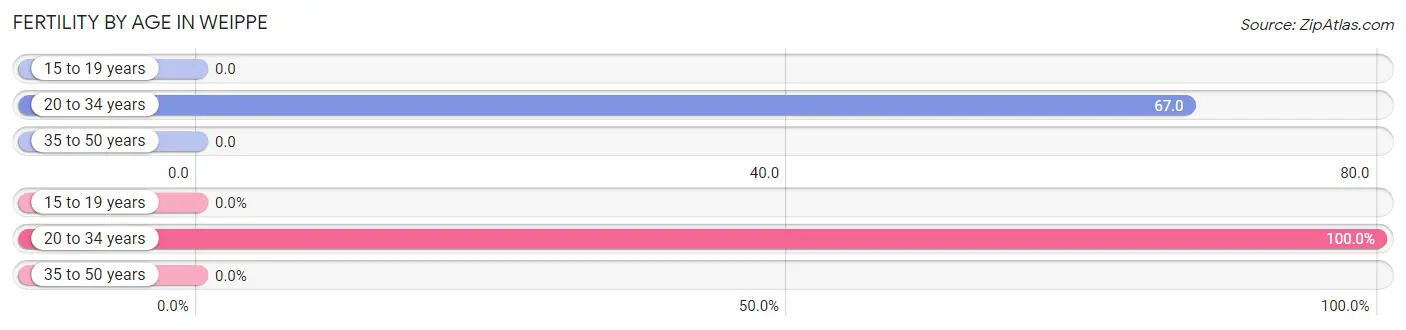
Fertility by Age in Weippe
Average fertility rate in Weippe is 32.0 births per 1,000 women. Women in the age bracket of 20 to 34 years have the highest fertility rate with 67.0 births per 1,000 women. Women in the age bracket of 20 to 34 years acount for 100.0% of all women with births.
| Age Bracket | Women with Births | Births / 1,000 Women |
| 15 to 19 years | 0 (0.0%) | 0.0 |
| 20 to 34 years | 2 (100.0%) | 67.0 |
| 35 to 50 years | 0 (0.0%) | 0.0 |
| Total | 2 (100.0%) | 32.0 |
Fertility by Age by Marriage Status in Weippe
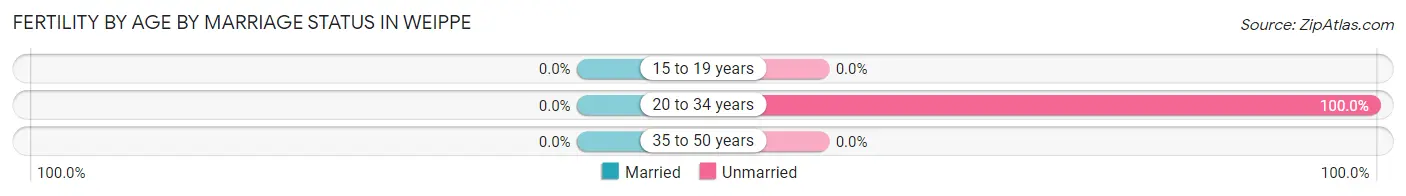
| Age Bracket | Married | Unmarried |
| 15 to 19 years | 0 (0.0%) | 0 (0.0%) |
| 20 to 34 years | 0 (0.0%) | 2 (100.0%) |
| 35 to 50 years | 0 (0.0%) | 0 (0.0%) |
| Total | 0 (0.0%) | 2 (100.0%) |
Fertility by Education in Weippe
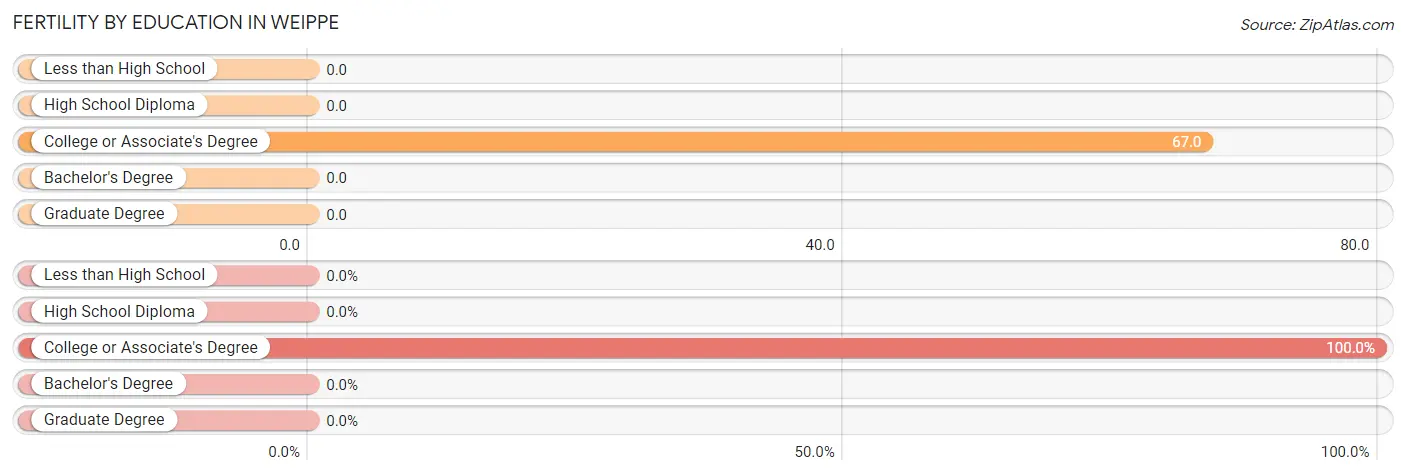
| Educational Attainment | Women with Births | Births / 1,000 Women |
| Less than High School | 0 (0.0%) | 0.0 |
| High School Diploma | 0 (0.0%) | 0.0 |
| College or Associate's Degree | 2 (100.0%) | 67.0 |
| Bachelor's Degree | 0 (0.0%) | 0.0 |
| Graduate Degree | 0 (0.0%) | 0.0 |
| Total | 2 (100.0%) | 32.0 |
Fertility by Education by Marriage Status in Weippe
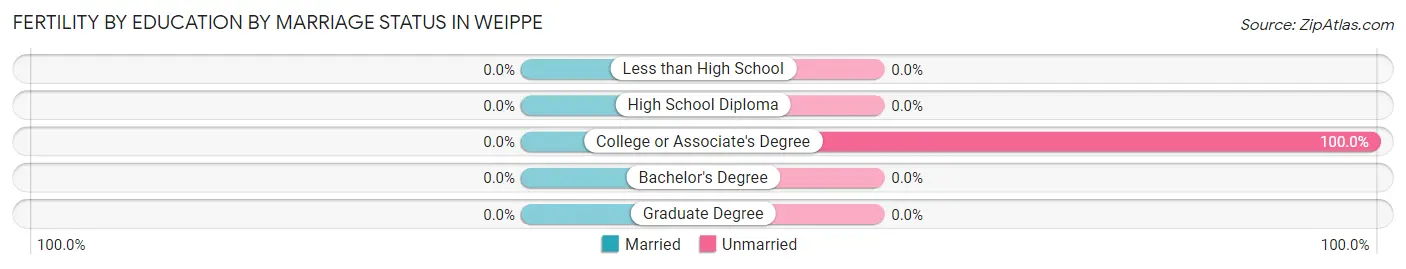
| Educational Attainment | Married | Unmarried |
| Less than High School | 0 (0.0%) | 0 (0.0%) |
| High School Diploma | 0 (0.0%) | 0 (0.0%) |
| College or Associate's Degree | 0 (0.0%) | 2 (100.0%) |
| Bachelor's Degree | 0 (0.0%) | 0 (0.0%) |
| Graduate Degree | 0 (0.0%) | 0 (0.0%) |
| Total | 0 (0.0%) | 2 (100.0%) |
Employment Characteristics in Weippe
Employment by Class of Employer in Weippe
Among the 114 employed individuals in Weippe, private company employees (82 | 71.9%), self-employed (not incorporated) (9 | 7.9%), and local government employees (8 | 7.0%) make up the most common classes of employment.
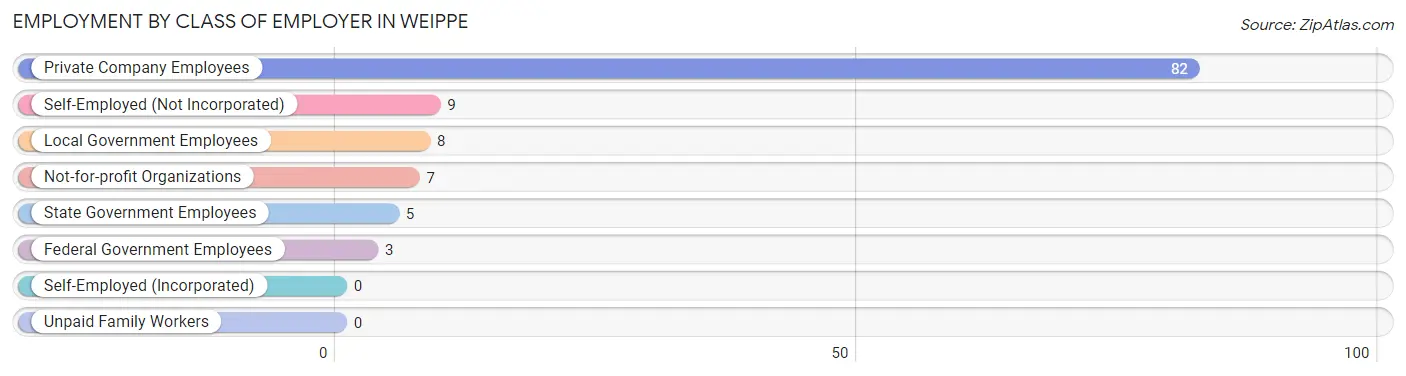
| Employer Class | # Employees | % Employees |
| Private Company Employees | 82 | 71.9% |
| Self-Employed (Incorporated) | 0 | 0.0% |
| Self-Employed (Not Incorporated) | 9 | 7.9% |
| Not-for-profit Organizations | 7 | 6.1% |
| Local Government Employees | 8 | 7.0% |
| State Government Employees | 5 | 4.4% |
| Federal Government Employees | 3 | 2.6% |
| Unpaid Family Workers | 0 | 0.0% |
| Total | 114 | 100.0% |
Employment Status by Age in Weippe
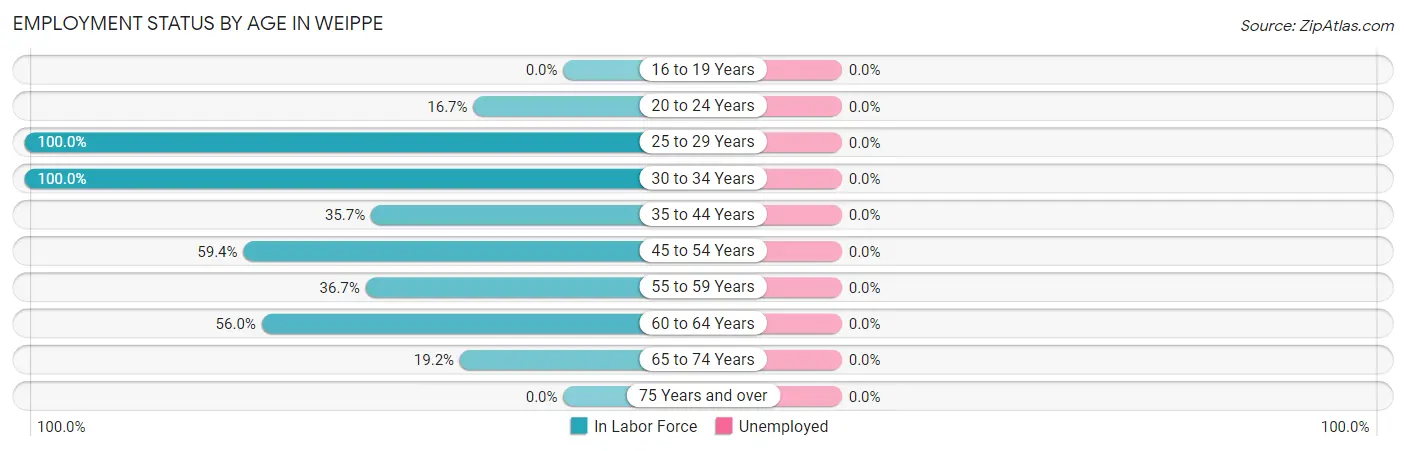
| Age Bracket | In Labor Force | Unemployed |
| 16 to 19 Years | 0 (0.0%) | 0 (0.0%) |
| 20 to 24 Years | 5 (16.7%) | 0 (0.0%) |
| 25 to 29 Years | 22 (100.0%) | 0 (0.0%) |
| 30 to 34 Years | 4 (100.0%) | 0 (0.0%) |
| 35 to 44 Years | 5 (35.7%) | 0 (0.0%) |
| 45 to 54 Years | 19 (59.4%) | 0 (0.0%) |
| 55 to 59 Years | 11 (36.7%) | 0 (0.0%) |
| 60 to 64 Years | 28 (56.0%) | 0 (0.0%) |
| 65 to 74 Years | 20 (19.2%) | 0 (0.0%) |
| 75 Years and over | 0 (0.0%) | 0 (0.0%) |
| Total | 114 (32.4%) | 0 (0.0%) |
Employment Status by Educational Attainment in Weippe
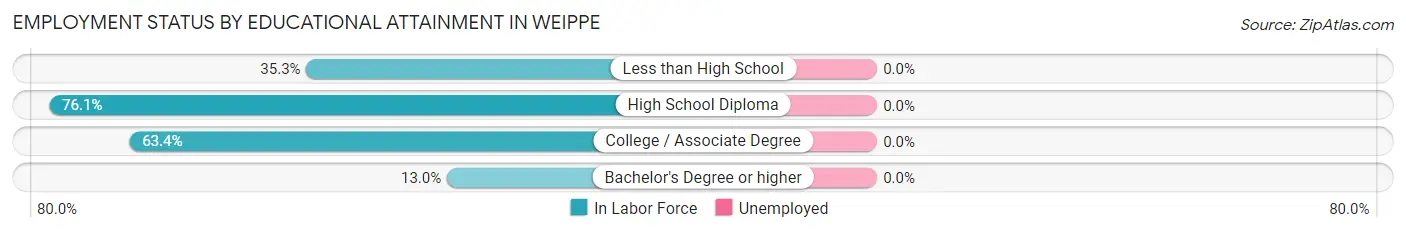
| Educational Attainment | In Labor Force | Unemployed |
| Less than High School | 6 (35.3%) | 0 (0.0%) |
| High School Diploma | 54 (76.1%) | 0 (0.0%) |
| College / Associate Degree | 26 (63.4%) | 0 (0.0%) |
| Bachelor's Degree or higher | 3 (13.0%) | 0 (0.0%) |
| Total | 89 (58.6%) | 0 (0.0%) |
Employment Occupations by Sex in Weippe
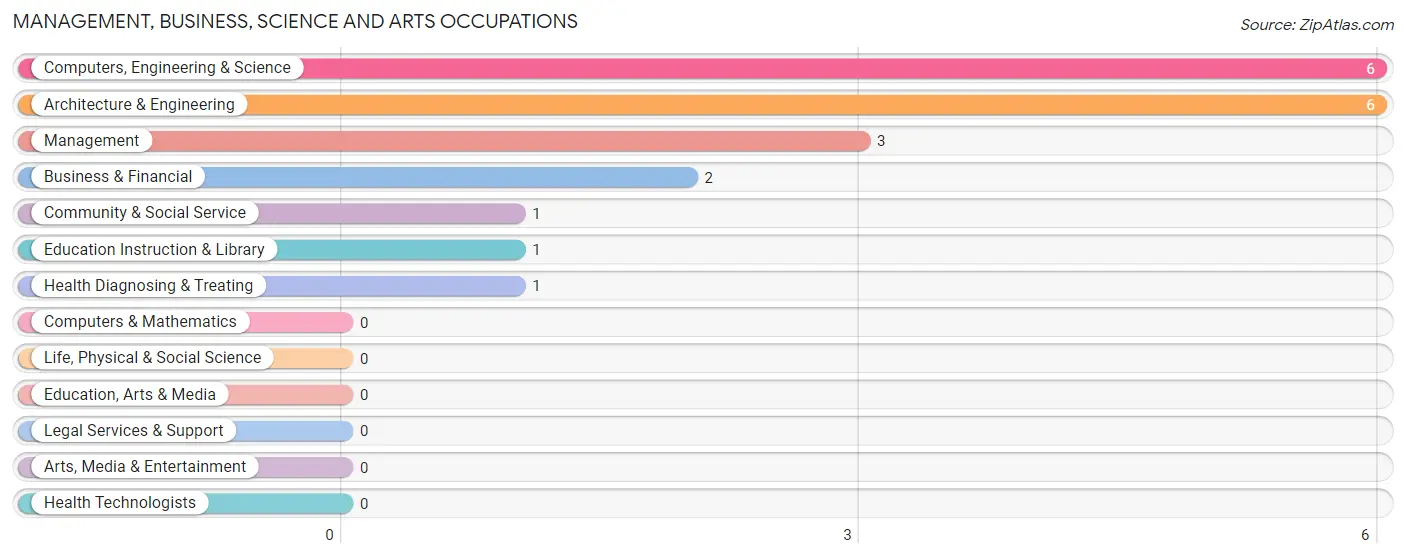
Management, Business, Science and Arts Occupations
The most common Management, Business, Science and Arts occupations in Weippe are Computers, Engineering & Science (6 | 5.3%), Architecture & Engineering (6 | 5.3%), Management (3 | 2.6%), Business & Financial (2 | 1.8%), and Community & Social Service (1 | 0.9%).
Management, Business, Science and Arts Occupations by Sex
Within the Management, Business, Science and Arts occupations in Weippe, the most male-oriented occupations are Computers, Engineering & Science (50.0%), and Architecture & Engineering (50.0%), while the most female-oriented occupations are Management (100.0%), Business & Financial (100.0%), and Community & Social Service (100.0%).
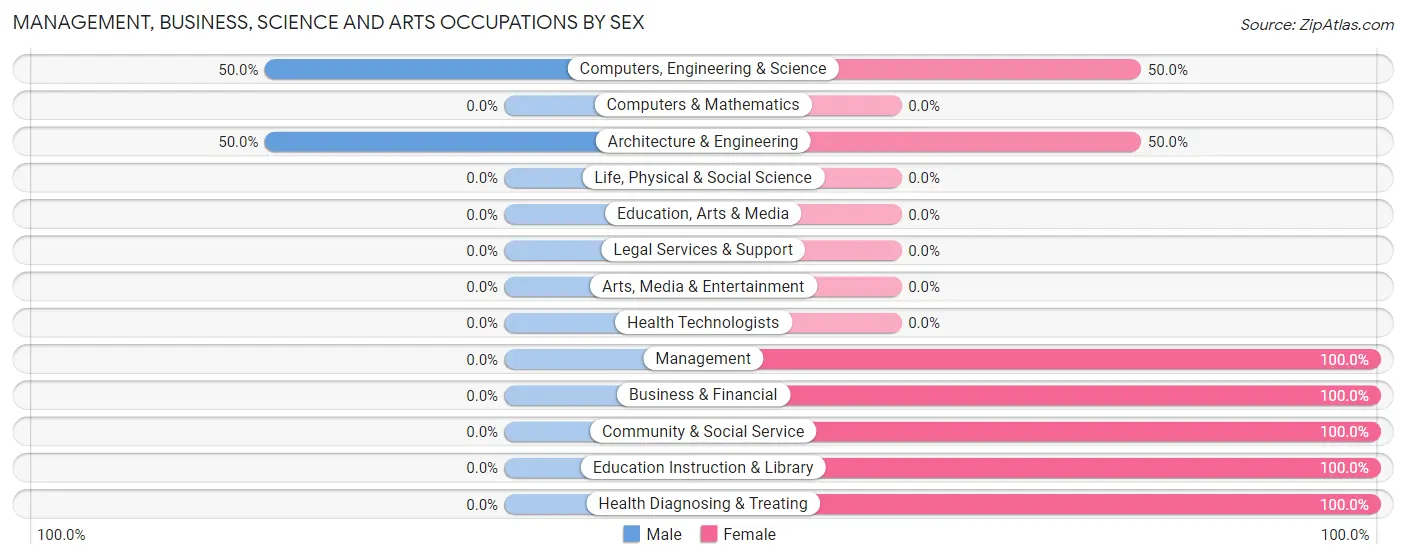
| Occupation | Male | Female |
| Management | 0 (0.0%) | 3 (100.0%) |
| Business & Financial | 0 (0.0%) | 2 (100.0%) |
| Computers, Engineering & Science | 3 (50.0%) | 3 (50.0%) |
| Computers & Mathematics | 0 (0.0%) | 0 (0.0%) |
| Architecture & Engineering | 3 (50.0%) | 3 (50.0%) |
| Life, Physical & Social Science | 0 (0.0%) | 0 (0.0%) |
| Community & Social Service | 0 (0.0%) | 1 (100.0%) |
| Education, Arts & Media | 0 (0.0%) | 0 (0.0%) |
| Legal Services & Support | 0 (0.0%) | 0 (0.0%) |
| Education Instruction & Library | 0 (0.0%) | 1 (100.0%) |
| Arts, Media & Entertainment | 0 (0.0%) | 0 (0.0%) |
| Health Diagnosing & Treating | 0 (0.0%) | 1 (100.0%) |
| Health Technologists | 0 (0.0%) | 0 (0.0%) |
| Total (Category) | 3 (23.1%) | 10 (76.9%) |
| Total (Overall) | 63 (55.3%) | 51 (44.7%) |
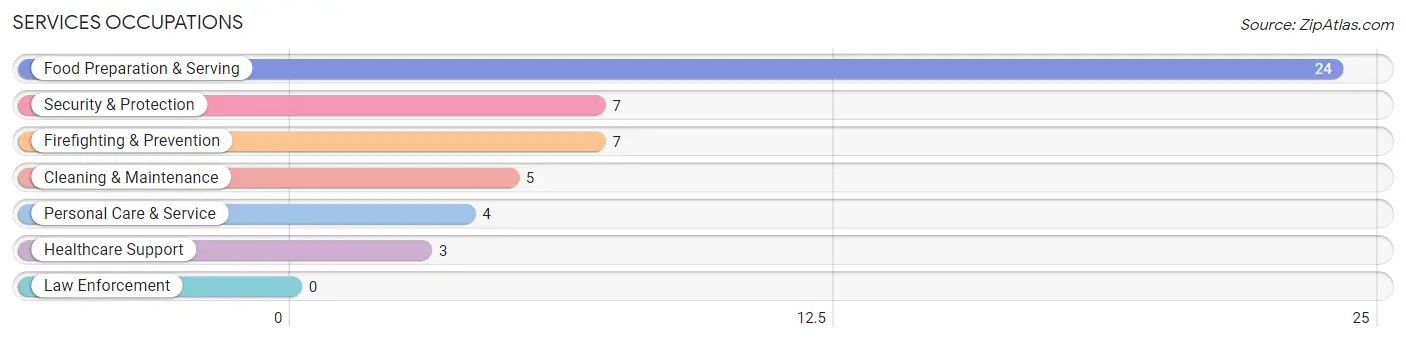
Services Occupations
The most common Services occupations in Weippe are Food Preparation & Serving (24 | 21.0%), Security & Protection (7 | 6.1%), Firefighting & Prevention (7 | 6.1%), Cleaning & Maintenance (5 | 4.4%), and Personal Care & Service (4 | 3.5%).
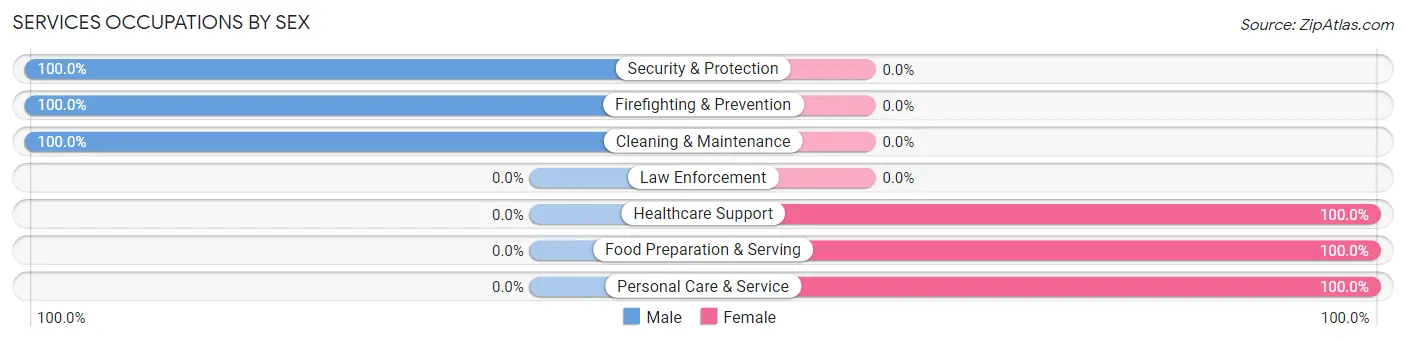
Services Occupations by Sex
Within the Services occupations in Weippe, the most male-oriented occupations are Security & Protection (100.0%), Firefighting & Prevention (100.0%), and Cleaning & Maintenance (100.0%), while the most female-oriented occupations are Healthcare Support (100.0%), Food Preparation & Serving (100.0%), and Personal Care & Service (100.0%).
| Occupation | Male | Female |
| Healthcare Support | 0 (0.0%) | 3 (100.0%) |
| Security & Protection | 7 (100.0%) | 0 (0.0%) |
| Firefighting & Prevention | 7 (100.0%) | 0 (0.0%) |
| Law Enforcement | 0 (0.0%) | 0 (0.0%) |
| Food Preparation & Serving | 0 (0.0%) | 24 (100.0%) |
| Cleaning & Maintenance | 5 (100.0%) | 0 (0.0%) |
| Personal Care & Service | 0 (0.0%) | 4 (100.0%) |
| Total (Category) | 12 (27.9%) | 31 (72.1%) |
| Total (Overall) | 63 (55.3%) | 51 (44.7%) |
Sales and Office Occupations
Sales and Office Occupations by Sex
| Occupation | Male | Female |
| Sales & Related | 0 (0.0%) | 0 (0.0%) |
| Office & Administration | 0 (0.0%) | 0 (0.0%) |
| Total (Category) | 0 (0.0%) | 0 (0.0%) |
| Total (Overall) | 63 (55.3%) | 51 (44.7%) |
Natural Resources, Construction and Maintenance Occupations
The most common Natural Resources, Construction and Maintenance occupations in Weippe are Construction & Extraction (29 | 25.4%), and Installation, Maintenance & Repair (3 | 2.6%).
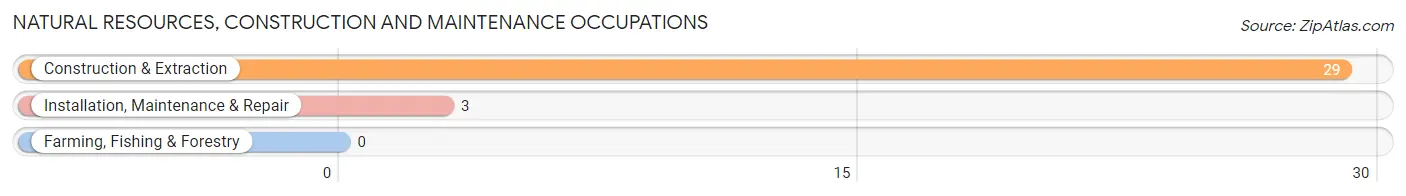
Natural Resources, Construction and Maintenance Occupations by Sex
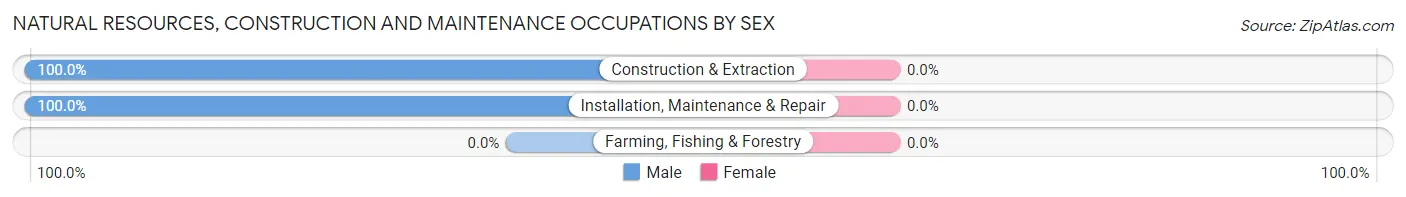
| Occupation | Male | Female |
| Farming, Fishing & Forestry | 0 (0.0%) | 0 (0.0%) |
| Construction & Extraction | 29 (100.0%) | 0 (0.0%) |
| Installation, Maintenance & Repair | 3 (100.0%) | 0 (0.0%) |
| Total (Category) | 32 (100.0%) | 0 (0.0%) |
| Total (Overall) | 63 (55.3%) | 51 (44.7%) |
Production, Transportation and Moving Occupations
The most common Production, Transportation and Moving occupations in Weippe are Production (19 | 16.7%), Transportation (4 | 3.5%), and Material Moving (3 | 2.6%).
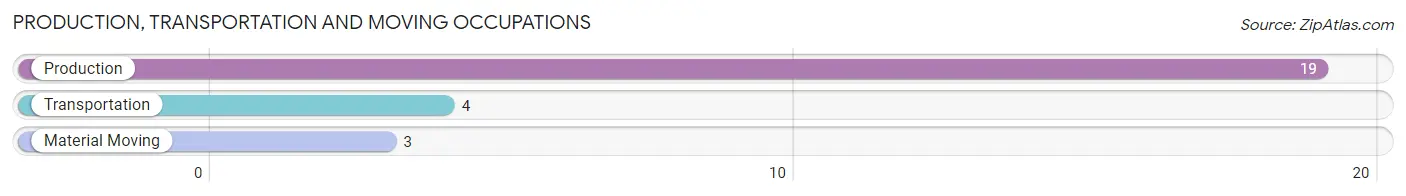
Production, Transportation and Moving Occupations by Sex
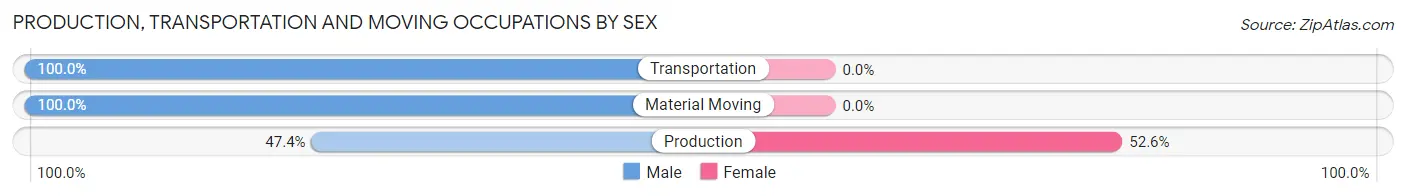
| Occupation | Male | Female |
| Production | 9 (47.4%) | 10 (52.6%) |
| Transportation | 4 (100.0%) | 0 (0.0%) |
| Material Moving | 3 (100.0%) | 0 (0.0%) |
| Total (Category) | 16 (61.5%) | 10 (38.5%) |
| Total (Overall) | 63 (55.3%) | 51 (44.7%) |
Employment Industries by Sex in Weippe
Employment Industries in Weippe
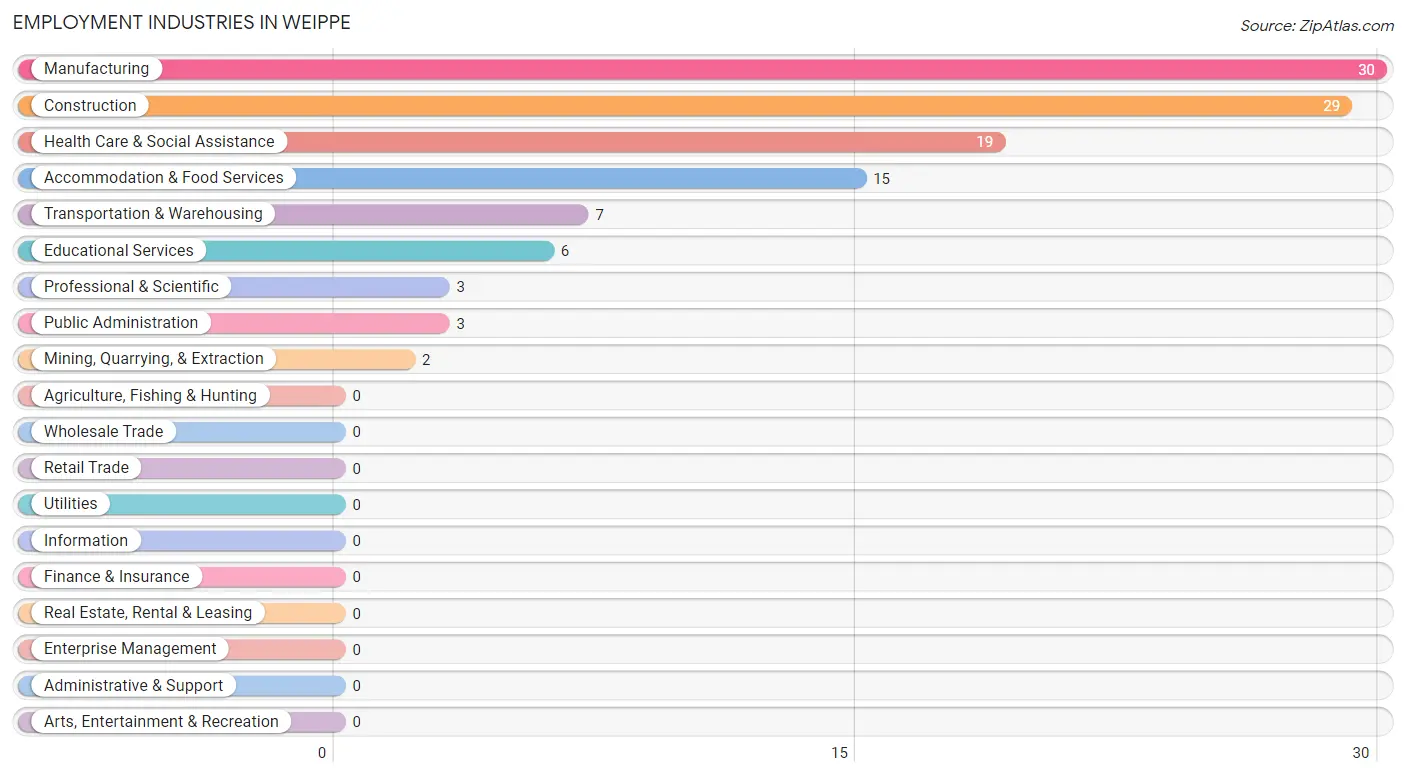
The major employment industries in Weippe include Manufacturing (30 | 26.3%), Construction (29 | 25.4%), Health Care & Social Assistance (19 | 16.7%), Accommodation & Food Services (15 | 13.2%), and Transportation & Warehousing (7 | 6.1%).
Employment Industries by Sex in Weippe
The Weippe industries that see more men than women are Mining, Quarrying, & Extraction (100.0%), Construction (100.0%), and Public Administration (100.0%), whereas the industries that tend to have a higher number of women are Professional & Scientific (100.0%), Educational Services (100.0%), and Accommodation & Food Services (100.0%).
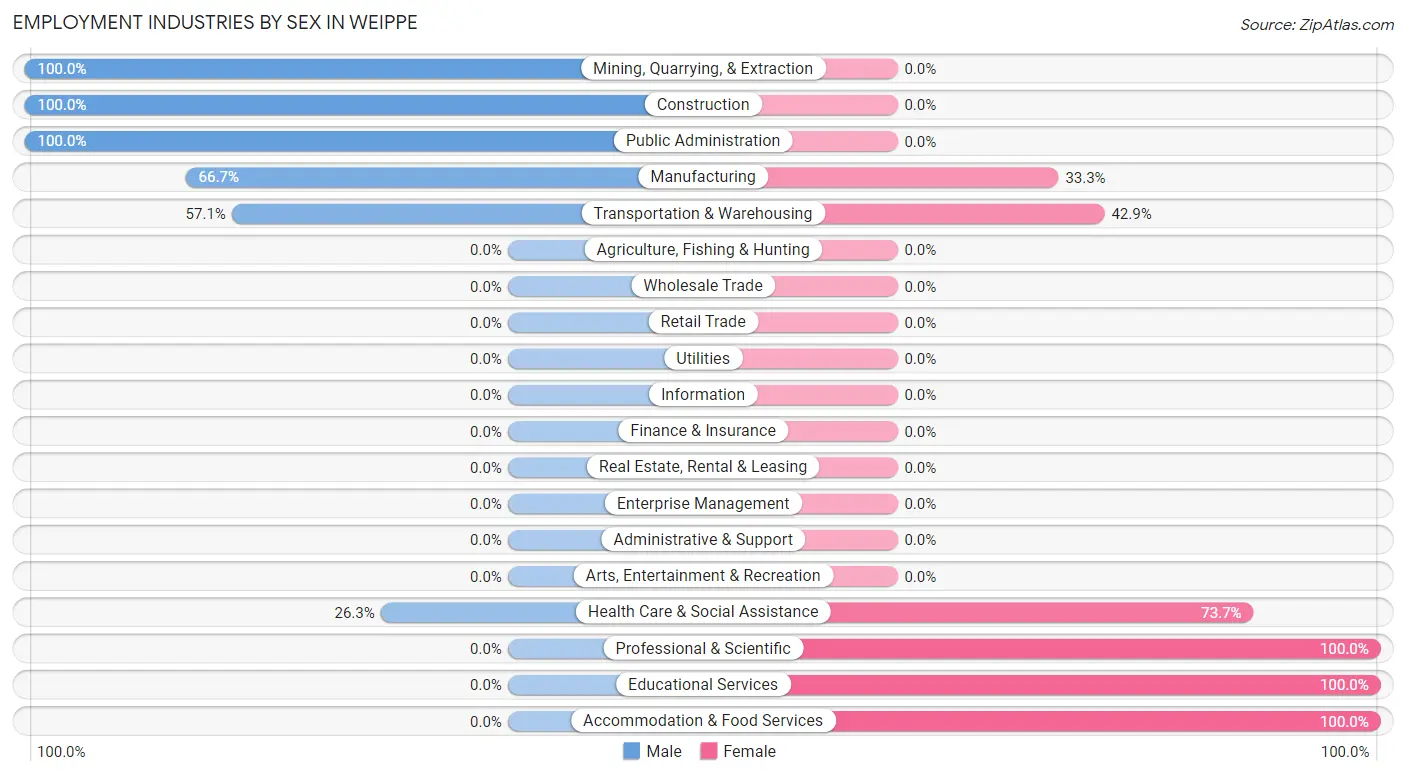
| Industry | Male | Female |
| Agriculture, Fishing & Hunting | 0 (0.0%) | 0 (0.0%) |
| Mining, Quarrying, & Extraction | 2 (100.0%) | 0 (0.0%) |
| Construction | 29 (100.0%) | 0 (0.0%) |
| Manufacturing | 20 (66.7%) | 10 (33.3%) |
| Wholesale Trade | 0 (0.0%) | 0 (0.0%) |
| Retail Trade | 0 (0.0%) | 0 (0.0%) |
| Transportation & Warehousing | 4 (57.1%) | 3 (42.9%) |
| Utilities | 0 (0.0%) | 0 (0.0%) |
| Information | 0 (0.0%) | 0 (0.0%) |
| Finance & Insurance | 0 (0.0%) | 0 (0.0%) |
| Real Estate, Rental & Leasing | 0 (0.0%) | 0 (0.0%) |
| Professional & Scientific | 0 (0.0%) | 3 (100.0%) |
| Enterprise Management | 0 (0.0%) | 0 (0.0%) |
| Administrative & Support | 0 (0.0%) | 0 (0.0%) |
| Educational Services | 0 (0.0%) | 6 (100.0%) |
| Health Care & Social Assistance | 5 (26.3%) | 14 (73.7%) |
| Arts, Entertainment & Recreation | 0 (0.0%) | 0 (0.0%) |
| Accommodation & Food Services | 0 (0.0%) | 15 (100.0%) |
| Public Administration | 3 (100.0%) | 0 (0.0%) |
| Total | 63 (55.3%) | 51 (44.7%) |
Education in Weippe
School Enrollment in Weippe
The most common levels of schooling among the 11 students in Weippe are high school (8 | 72.7%), college / undergraduate (2 | 18.2%), and middle school (1 | 9.1%).
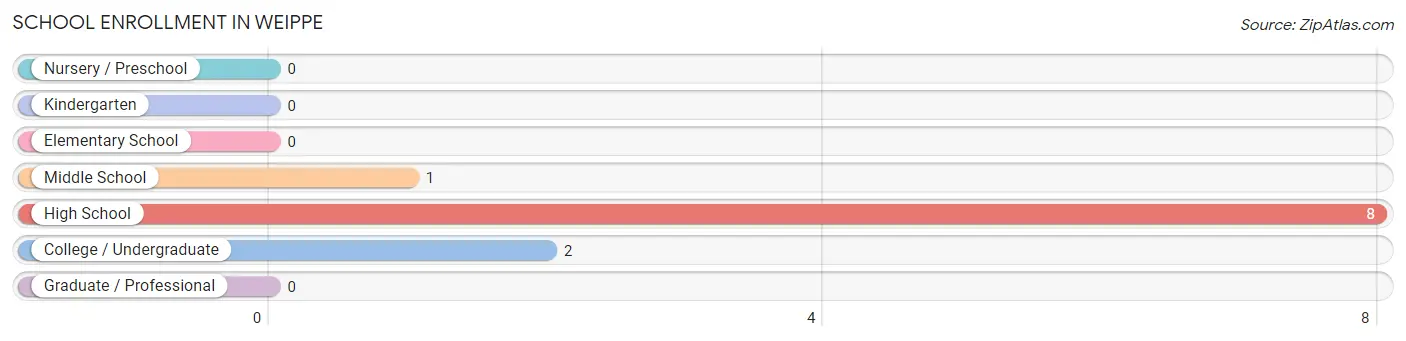
| School Level | # Students | % Students |
| Nursery / Preschool | 0 | 0.0% |
| Kindergarten | 0 | 0.0% |
| Elementary School | 0 | 0.0% |
| Middle School | 1 | 9.1% |
| High School | 8 | 72.7% |
| College / Undergraduate | 2 | 18.2% |
| Graduate / Professional | 0 | 0.0% |
| Total | 11 | 100.0% |
School Enrollment by Age by Funding Source in Weippe
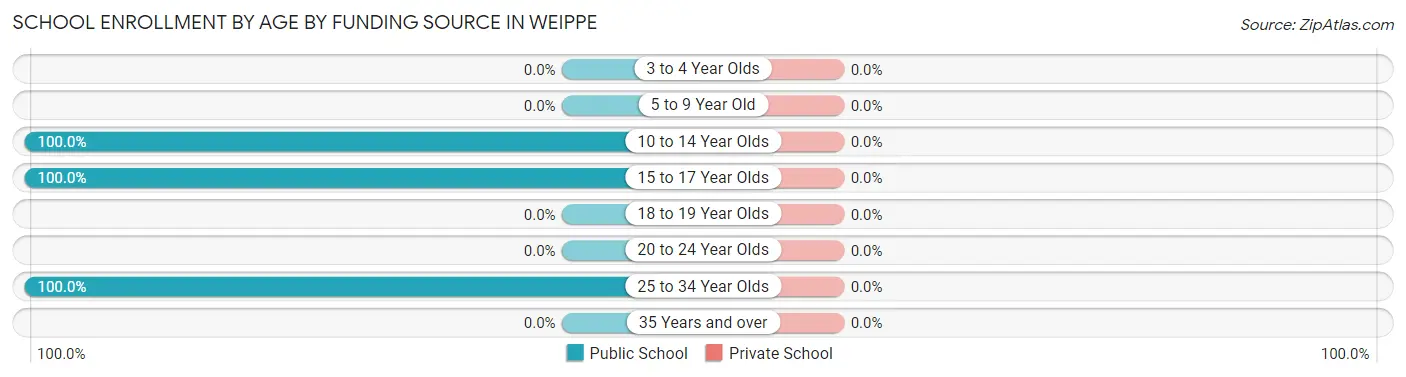
| Age Bracket | Public School | Private School |
| 3 to 4 Year Olds | 0 (0.0%) | 0 (0.0%) |
| 5 to 9 Year Old | 0 (0.0%) | 0 (0.0%) |
| 10 to 14 Year Olds | 1 (100.0%) | 0 (0.0%) |
| 15 to 17 Year Olds | 8 (100.0%) | 0 (0.0%) |
| 18 to 19 Year Olds | 0 (0.0%) | 0 (0.0%) |
| 20 to 24 Year Olds | 0 (0.0%) | 0 (0.0%) |
| 25 to 34 Year Olds | 2 (100.0%) | 0 (0.0%) |
| 35 Years and over | 0 (0.0%) | 0 (0.0%) |
| Total | 11 (100.0%) | 0 (0.0%) |
Educational Attainment by Field of Study in Weippe
Science & technology (13 | 34.2%), literature & languages (7 | 18.4%), visual & performing arts (7 | 18.4%), business (6 | 15.8%), and bio, nature & agricultural (5 | 13.2%) are the most common fields of study among 38 individuals in Weippe who have obtained a bachelor's degree or higher.
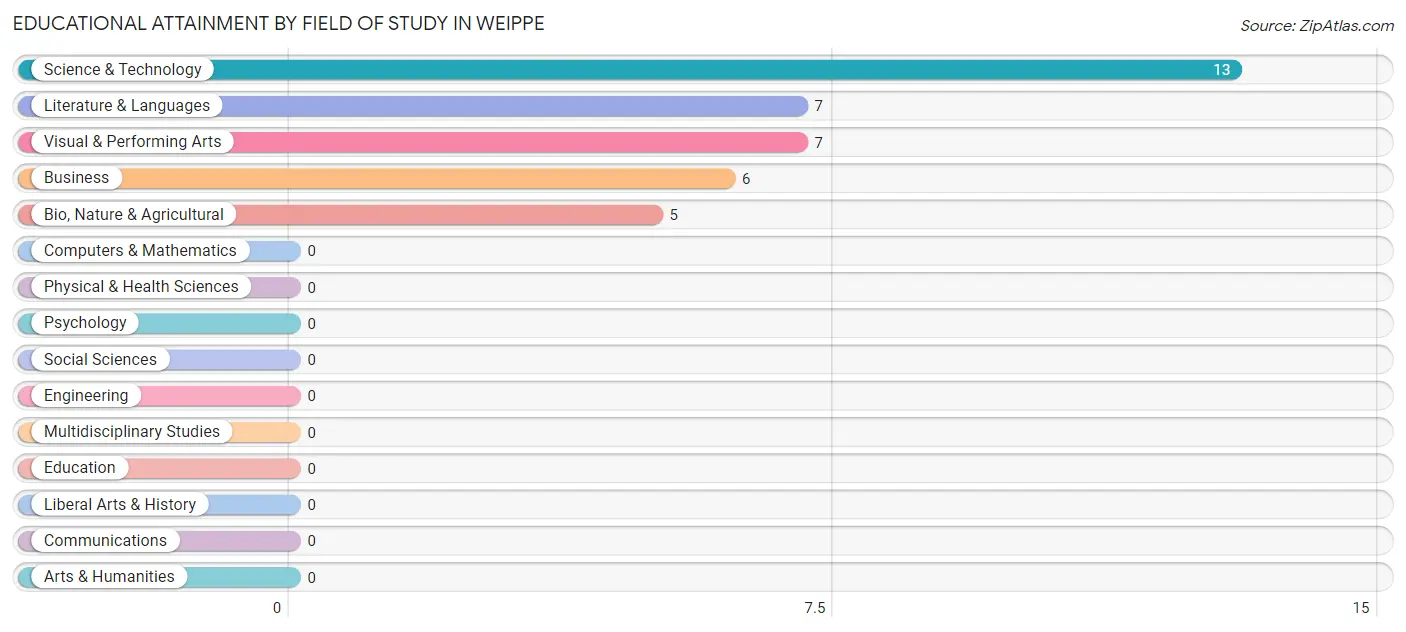
| Field of Study | # Graduates | % Graduates |
| Computers & Mathematics | 0 | 0.0% |
| Bio, Nature & Agricultural | 5 | 13.2% |
| Physical & Health Sciences | 0 | 0.0% |
| Psychology | 0 | 0.0% |
| Social Sciences | 0 | 0.0% |
| Engineering | 0 | 0.0% |
| Multidisciplinary Studies | 0 | 0.0% |
| Science & Technology | 13 | 34.2% |
| Business | 6 | 15.8% |
| Education | 0 | 0.0% |
| Literature & Languages | 7 | 18.4% |
| Liberal Arts & History | 0 | 0.0% |
| Visual & Performing Arts | 7 | 18.4% |
| Communications | 0 | 0.0% |
| Arts & Humanities | 0 | 0.0% |
| Total | 38 | 100.0% |
Transportation & Commute in Weippe
Vehicle Availability by Sex in Weippe
The most prevalent vehicle ownership categories in Weippe are males with 2 vehicles (23, accounting for 36.5%) and females with 2 vehicles (31, making up 45.1%).
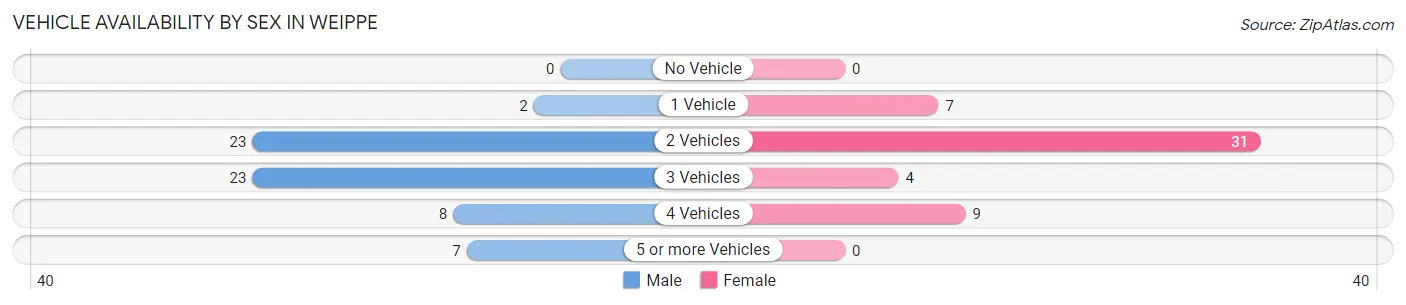
| Vehicles Available | Male | Female |
| No Vehicle | 0 (0.0%) | 0 (0.0%) |
| 1 Vehicle | 2 (3.2%) | 7 (13.7%) |
| 2 Vehicles | 23 (36.5%) | 31 (60.8%) |
| 3 Vehicles | 23 (36.5%) | 4 (7.8%) |
| 4 Vehicles | 8 (12.7%) | 9 (17.6%) |
| 5 or more Vehicles | 7 (11.1%) | 0 (0.0%) |
| Total | 63 (100.0%) | 51 (100.0%) |
Commute Time in Weippe
The most frequently occuring commute durations in Weippe are 40 to 44 minutes (26 commuters, 24.3%), 5 to 9 minutes (25 commuters, 23.4%), and less than 5 minutes (12 commuters, 11.2%).
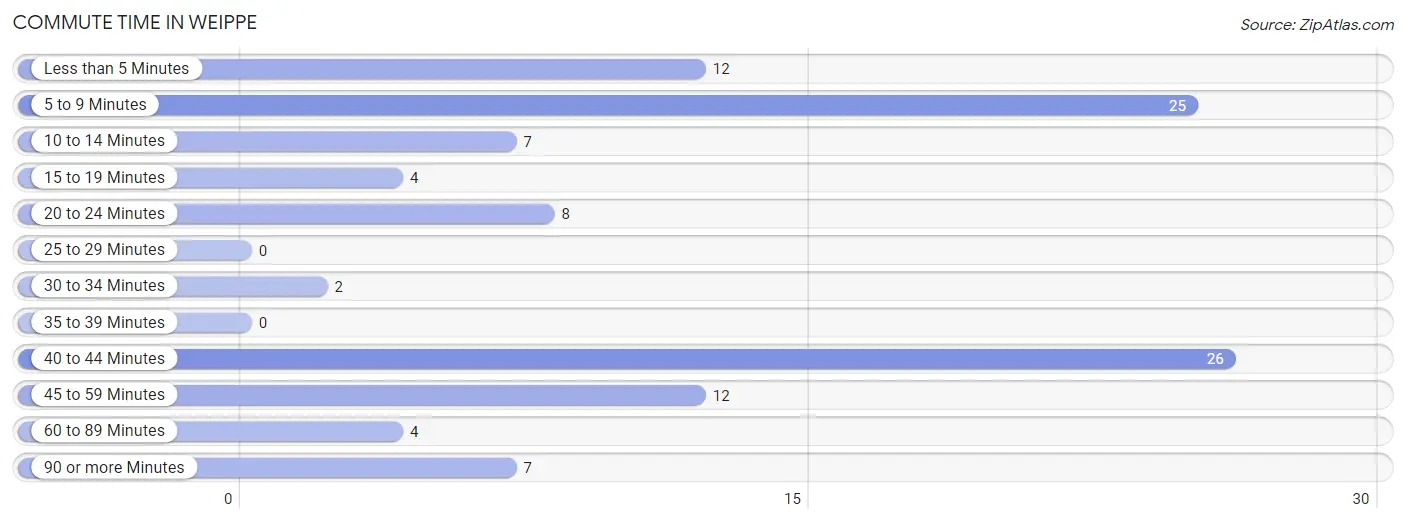
| Commute Time | # Commuters | % Commuters |
| Less than 5 Minutes | 12 | 11.2% |
| 5 to 9 Minutes | 25 | 23.4% |
| 10 to 14 Minutes | 7 | 6.5% |
| 15 to 19 Minutes | 4 | 3.7% |
| 20 to 24 Minutes | 8 | 7.5% |
| 25 to 29 Minutes | 0 | 0.0% |
| 30 to 34 Minutes | 2 | 1.9% |
| 35 to 39 Minutes | 0 | 0.0% |
| 40 to 44 Minutes | 26 | 24.3% |
| 45 to 59 Minutes | 12 | 11.2% |
| 60 to 89 Minutes | 4 | 3.7% |
| 90 or more Minutes | 7 | 6.5% |
Commute Time by Sex in Weippe
The most common commute times in Weippe are 5 to 9 minutes (23 commuters, 36.5%) for males and 40 to 44 minutes (13 commuters, 29.5%) for females.
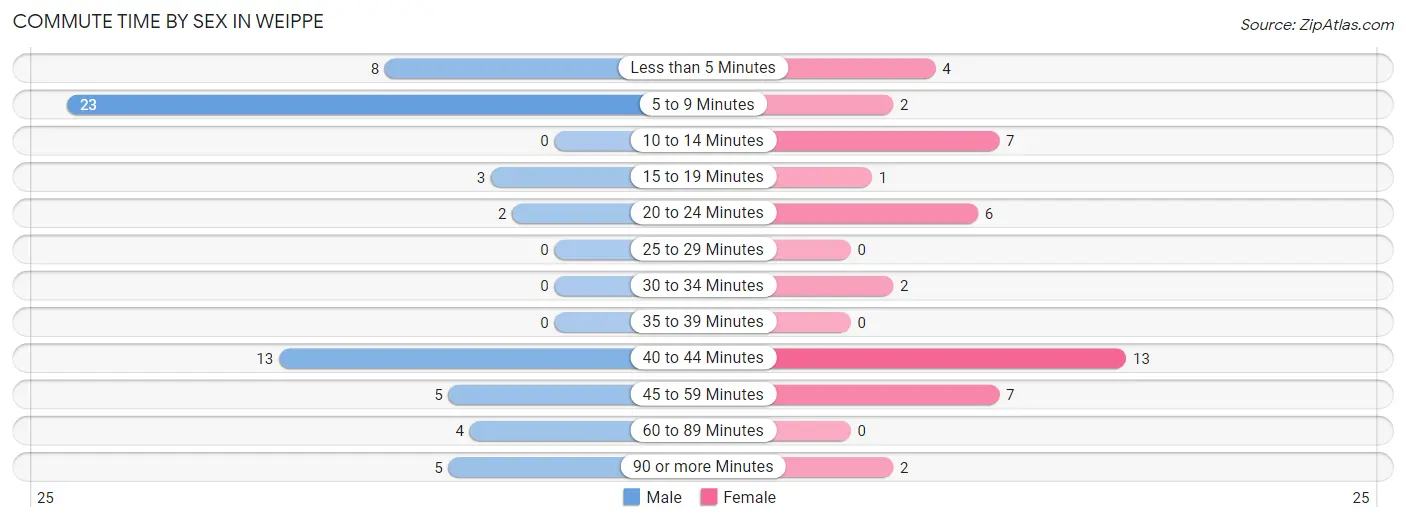
| Commute Time | Male | Female |
| Less than 5 Minutes | 8 (12.7%) | 4 (9.1%) |
| 5 to 9 Minutes | 23 (36.5%) | 2 (4.5%) |
| 10 to 14 Minutes | 0 (0.0%) | 7 (15.9%) |
| 15 to 19 Minutes | 3 (4.8%) | 1 (2.3%) |
| 20 to 24 Minutes | 2 (3.2%) | 6 (13.6%) |
| 25 to 29 Minutes | 0 (0.0%) | 0 (0.0%) |
| 30 to 34 Minutes | 0 (0.0%) | 2 (4.5%) |
| 35 to 39 Minutes | 0 (0.0%) | 0 (0.0%) |
| 40 to 44 Minutes | 13 (20.6%) | 13 (29.5%) |
| 45 to 59 Minutes | 5 (7.9%) | 7 (15.9%) |
| 60 to 89 Minutes | 4 (6.4%) | 0 (0.0%) |
| 90 or more Minutes | 5 (7.9%) | 2 (4.5%) |
Time of Departure to Work by Sex in Weippe
The most frequent times of departure to work in Weippe are 12:00 PM to 3:59 PM (26, 41.3%) for males and 5:00 AM to 5:29 AM (15, 34.1%) for females.
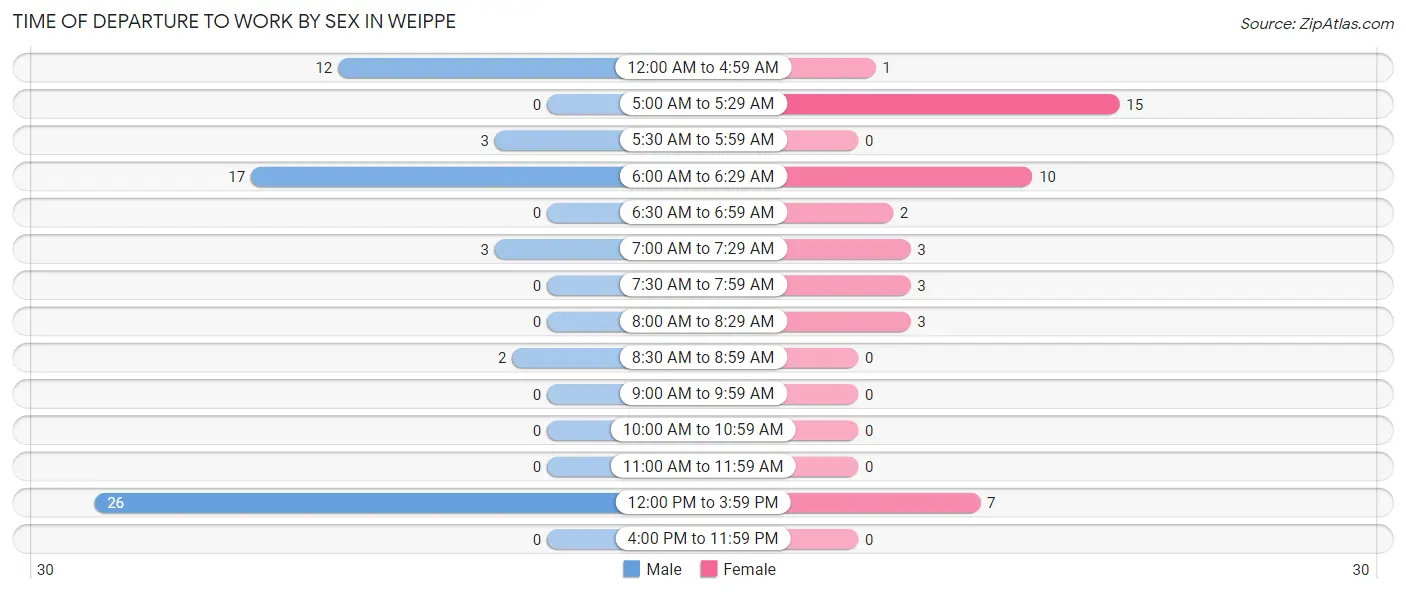
| Time of Departure | Male | Female |
| 12:00 AM to 4:59 AM | 12 (19.1%) | 1 (2.3%) |
| 5:00 AM to 5:29 AM | 0 (0.0%) | 15 (34.1%) |
| 5:30 AM to 5:59 AM | 3 (4.8%) | 0 (0.0%) |
| 6:00 AM to 6:29 AM | 17 (27.0%) | 10 (22.7%) |
| 6:30 AM to 6:59 AM | 0 (0.0%) | 2 (4.5%) |
| 7:00 AM to 7:29 AM | 3 (4.8%) | 3 (6.8%) |
| 7:30 AM to 7:59 AM | 0 (0.0%) | 3 (6.8%) |
| 8:00 AM to 8:29 AM | 0 (0.0%) | 3 (6.8%) |
| 8:30 AM to 8:59 AM | 2 (3.2%) | 0 (0.0%) |
| 9:00 AM to 9:59 AM | 0 (0.0%) | 0 (0.0%) |
| 10:00 AM to 10:59 AM | 0 (0.0%) | 0 (0.0%) |
| 11:00 AM to 11:59 AM | 0 (0.0%) | 0 (0.0%) |
| 12:00 PM to 3:59 PM | 26 (41.3%) | 7 (15.9%) |
| 4:00 PM to 11:59 PM | 0 (0.0%) | 0 (0.0%) |
| Total | 63 (100.0%) | 44 (100.0%) |
Housing Occupancy in Weippe
Occupancy by Ownership in Weippe
Of the total 198 dwellings in Weippe, owner-occupied units account for 150 (75.8%), while renter-occupied units make up 48 (24.2%).
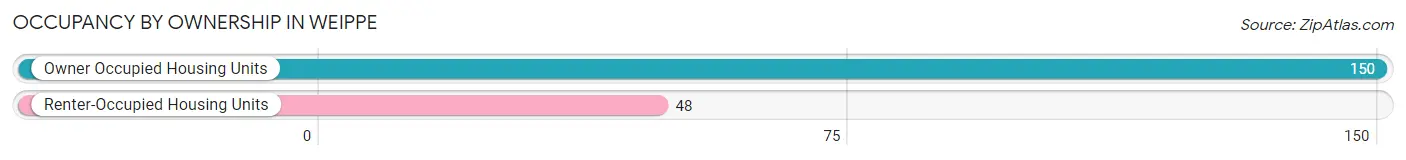
| Occupancy | # Housing Units | % Housing Units |
| Owner Occupied Housing Units | 150 | 75.8% |
| Renter-Occupied Housing Units | 48 | 24.2% |
| Total Occupied Housing Units | 198 | 100.0% |
Occupancy by Household Size in Weippe
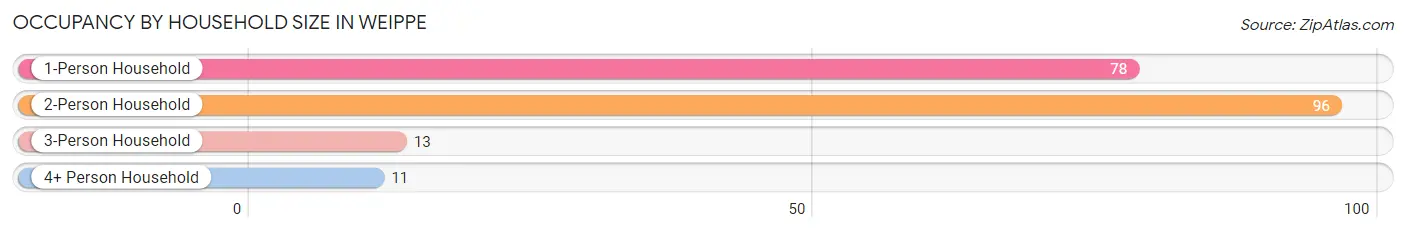
| Household Size | # Housing Units | % Housing Units |
| 1-Person Household | 78 | 39.4% |
| 2-Person Household | 96 | 48.5% |
| 3-Person Household | 13 | 6.6% |
| 4+ Person Household | 11 | 5.6% |
| Total Housing Units | 198 | 100.0% |
Occupancy by Ownership by Household Size in Weippe
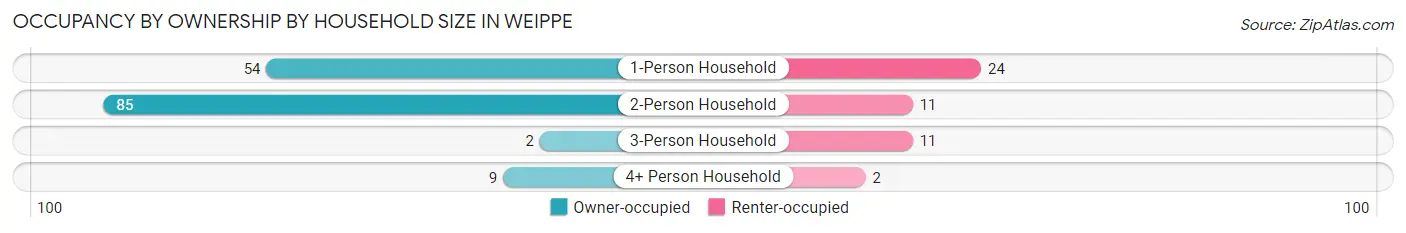
| Household Size | Owner-occupied | Renter-occupied |
| 1-Person Household | 54 (69.2%) | 24 (30.8%) |
| 2-Person Household | 85 (88.5%) | 11 (11.5%) |
| 3-Person Household | 2 (15.4%) | 11 (84.6%) |
| 4+ Person Household | 9 (81.8%) | 2 (18.2%) |
| Total Housing Units | 150 (75.8%) | 48 (24.2%) |
Occupancy by Educational Attainment in Weippe
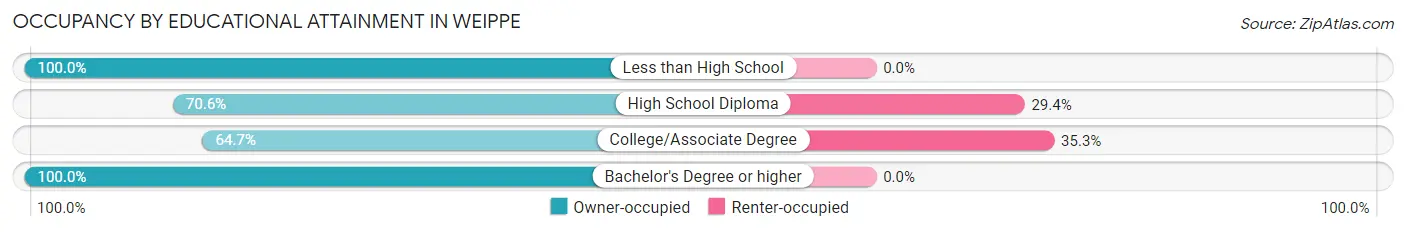
| Household Size | Owner-occupied | Renter-occupied |
| Less than High School | 17 (100.0%) | 0 (0.0%) |
| High School Diploma | 72 (70.6%) | 30 (29.4%) |
| College/Associate Degree | 33 (64.7%) | 18 (35.3%) |
| Bachelor's Degree or higher | 28 (100.0%) | 0 (0.0%) |
Occupancy by Age of Householder in Weippe
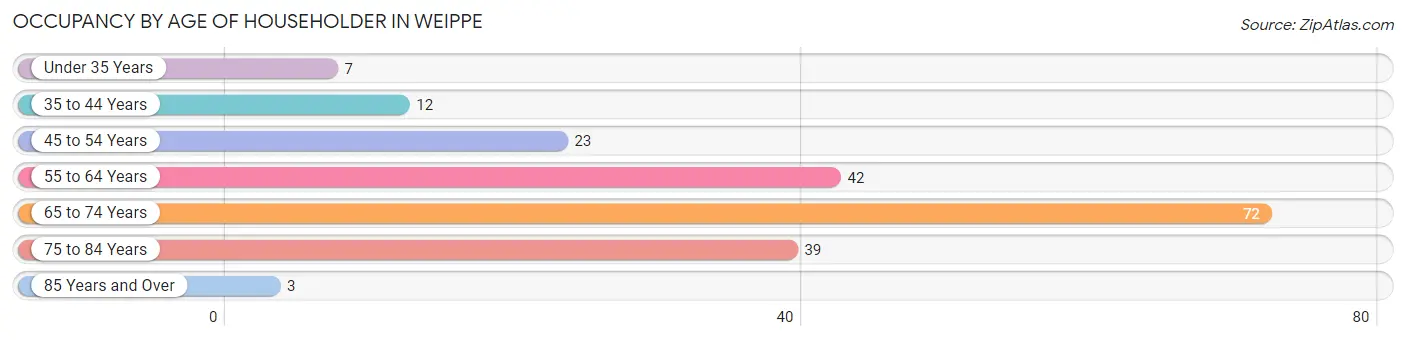
| Age Bracket | # Households | % Households |
| Under 35 Years | 7 | 3.5% |
| 35 to 44 Years | 12 | 6.1% |
| 45 to 54 Years | 23 | 11.6% |
| 55 to 64 Years | 42 | 21.2% |
| 65 to 74 Years | 72 | 36.4% |
| 75 to 84 Years | 39 | 19.7% |
| 85 Years and Over | 3 | 1.5% |
| Total | 198 | 100.0% |
Housing Finances in Weippe
Median Income by Occupancy in Weippe
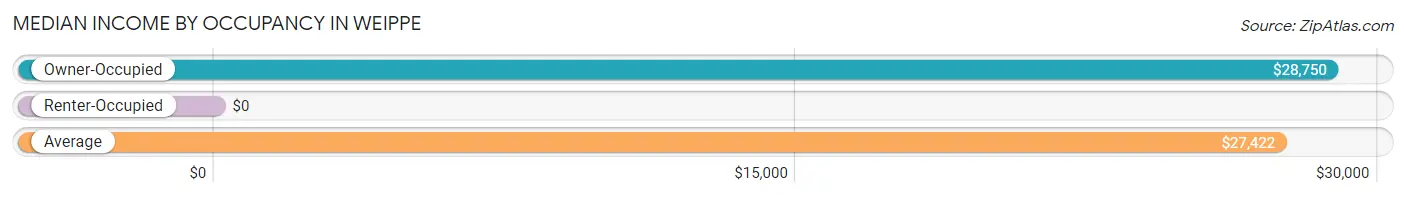
| Occupancy Type | # Households | Median Income |
| Owner-Occupied | 150 (75.8%) | $28,750 |
| Renter-Occupied | 48 (24.2%) | $0 |
| Average | 198 (100.0%) | $27,422 |
Occupancy by Householder Income Bracket in Weippe
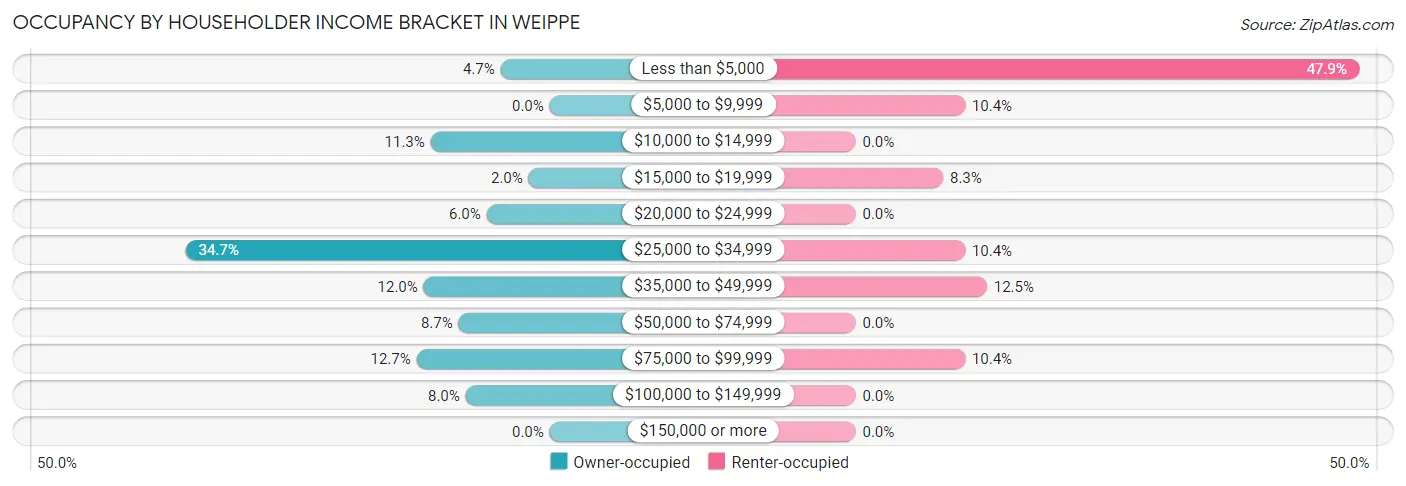
| Income Bracket | Owner-occupied | Renter-occupied |
| Less than $5,000 | 7 (4.7%) | 23 (47.9%) |
| $5,000 to $9,999 | 0 (0.0%) | 5 (10.4%) |
| $10,000 to $14,999 | 17 (11.3%) | 0 (0.0%) |
| $15,000 to $19,999 | 3 (2.0%) | 4 (8.3%) |
| $20,000 to $24,999 | 9 (6.0%) | 0 (0.0%) |
| $25,000 to $34,999 | 52 (34.7%) | 5 (10.4%) |
| $35,000 to $49,999 | 18 (12.0%) | 6 (12.5%) |
| $50,000 to $74,999 | 13 (8.7%) | 0 (0.0%) |
| $75,000 to $99,999 | 19 (12.7%) | 5 (10.4%) |
| $100,000 to $149,999 | 12 (8.0%) | 0 (0.0%) |
| $150,000 or more | 0 (0.0%) | 0 (0.0%) |
| Total | 150 (100.0%) | 48 (100.0%) |
Monthly Housing Cost Tiers in Weippe
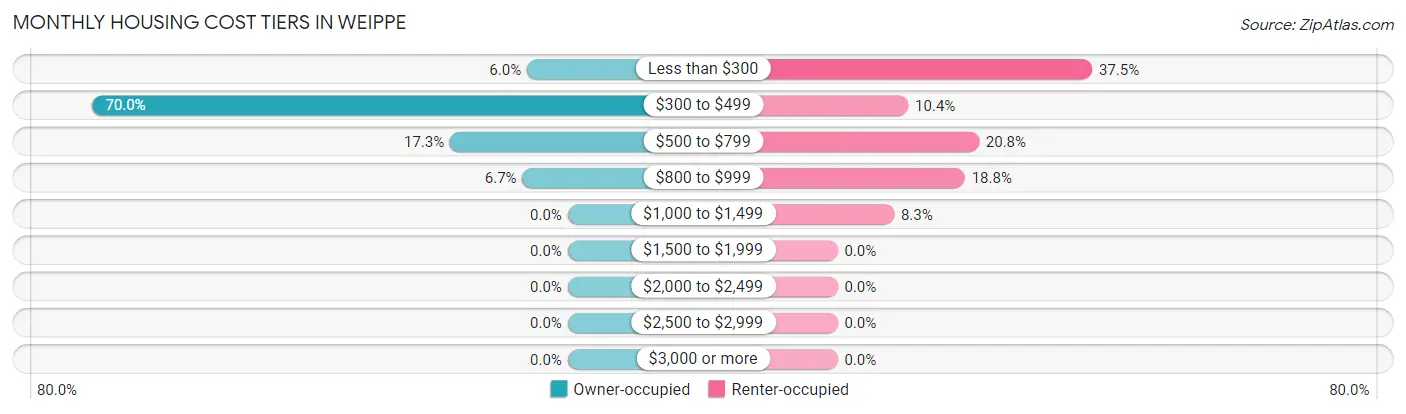
| Monthly Cost | Owner-occupied | Renter-occupied |
| Less than $300 | 9 (6.0%) | 18 (37.5%) |
| $300 to $499 | 105 (70.0%) | 5 (10.4%) |
| $500 to $799 | 26 (17.3%) | 10 (20.8%) |
| $800 to $999 | 10 (6.7%) | 9 (18.8%) |
| $1,000 to $1,499 | 0 (0.0%) | 4 (8.3%) |
| $1,500 to $1,999 | 0 (0.0%) | 0 (0.0%) |
| $2,000 to $2,499 | 0 (0.0%) | 0 (0.0%) |
| $2,500 to $2,999 | 0 (0.0%) | 0 (0.0%) |
| $3,000 or more | 0 (0.0%) | 0 (0.0%) |
| Total | 150 (100.0%) | 48 (100.0%) |
Physical Housing Characteristics in Weippe
Housing Structures in Weippe
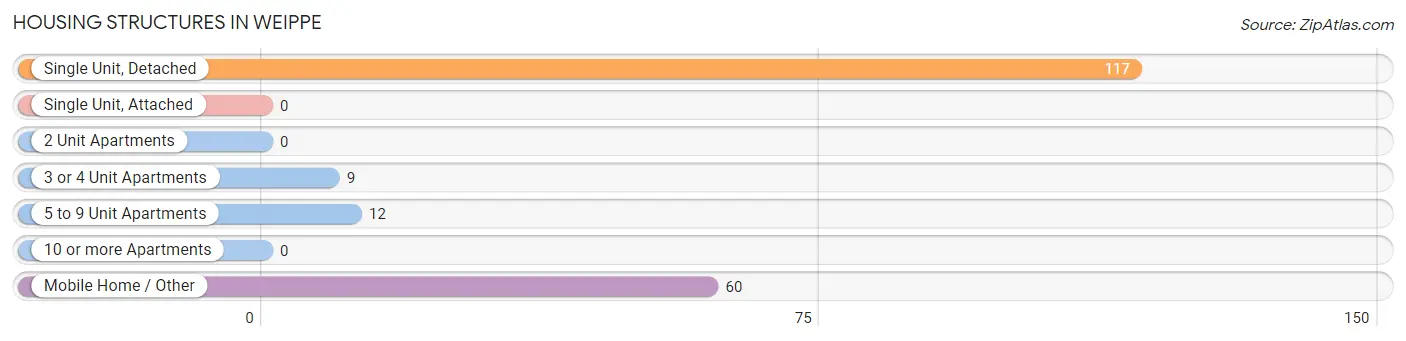
| Structure Type | # Housing Units | % Housing Units |
| Single Unit, Detached | 117 | 59.1% |
| Single Unit, Attached | 0 | 0.0% |
| 2 Unit Apartments | 0 | 0.0% |
| 3 or 4 Unit Apartments | 9 | 4.5% |
| 5 to 9 Unit Apartments | 12 | 6.1% |
| 10 or more Apartments | 0 | 0.0% |
| Mobile Home / Other | 60 | 30.3% |
| Total | 198 | 100.0% |
Housing Structures by Occupancy in Weippe
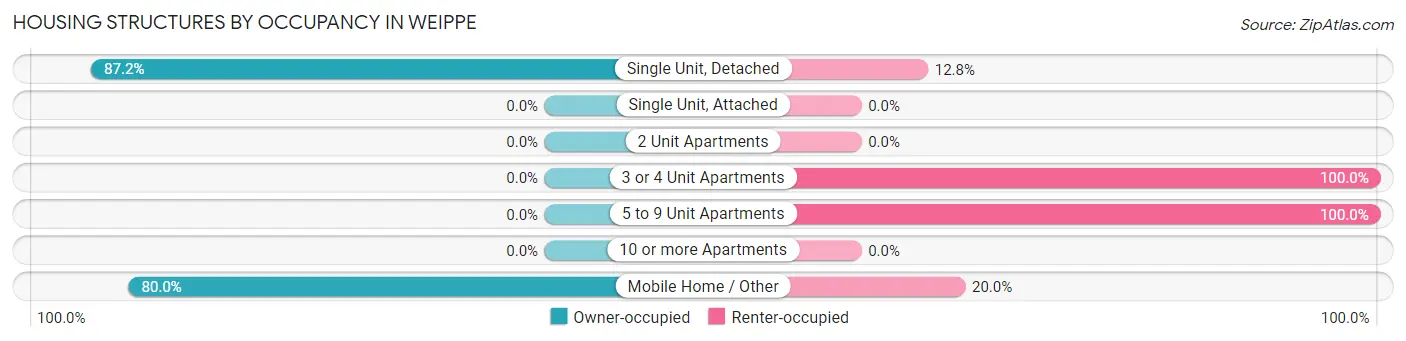
| Structure Type | Owner-occupied | Renter-occupied |
| Single Unit, Detached | 102 (87.2%) | 15 (12.8%) |
| Single Unit, Attached | 0 (0.0%) | 0 (0.0%) |
| 2 Unit Apartments | 0 (0.0%) | 0 (0.0%) |
| 3 or 4 Unit Apartments | 0 (0.0%) | 9 (100.0%) |
| 5 to 9 Unit Apartments | 0 (0.0%) | 12 (100.0%) |
| 10 or more Apartments | 0 (0.0%) | 0 (0.0%) |
| Mobile Home / Other | 48 (80.0%) | 12 (20.0%) |
| Total | 150 (75.8%) | 48 (24.2%) |
Housing Structures by Number of Rooms in Weippe
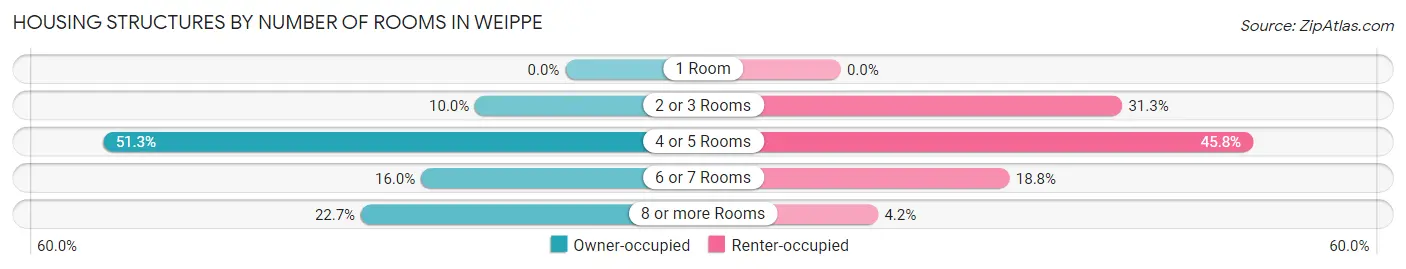
| Number of Rooms | Owner-occupied | Renter-occupied |
| 1 Room | 0 (0.0%) | 0 (0.0%) |
| 2 or 3 Rooms | 15 (10.0%) | 15 (31.2%) |
| 4 or 5 Rooms | 77 (51.3%) | 22 (45.8%) |
| 6 or 7 Rooms | 24 (16.0%) | 9 (18.8%) |
| 8 or more Rooms | 34 (22.7%) | 2 (4.2%) |
| Total | 150 (100.0%) | 48 (100.0%) |
Housing Structure by Heating Type in Weippe
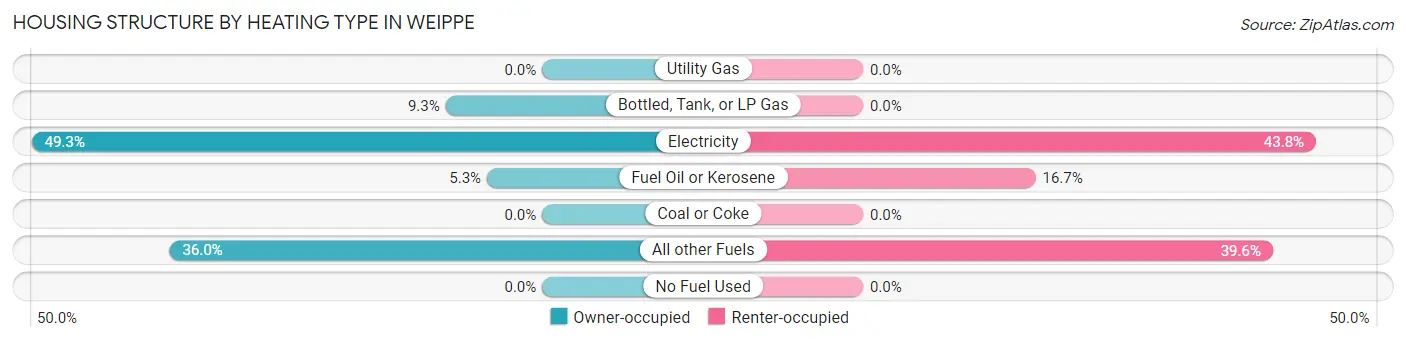
| Heating Type | Owner-occupied | Renter-occupied |
| Utility Gas | 0 (0.0%) | 0 (0.0%) |
| Bottled, Tank, or LP Gas | 14 (9.3%) | 0 (0.0%) |
| Electricity | 74 (49.3%) | 21 (43.8%) |
| Fuel Oil or Kerosene | 8 (5.3%) | 8 (16.7%) |
| Coal or Coke | 0 (0.0%) | 0 (0.0%) |
| All other Fuels | 54 (36.0%) | 19 (39.6%) |
| No Fuel Used | 0 (0.0%) | 0 (0.0%) |
| Total | 150 (100.0%) | 48 (100.0%) |
Household Vehicle Usage in Weippe
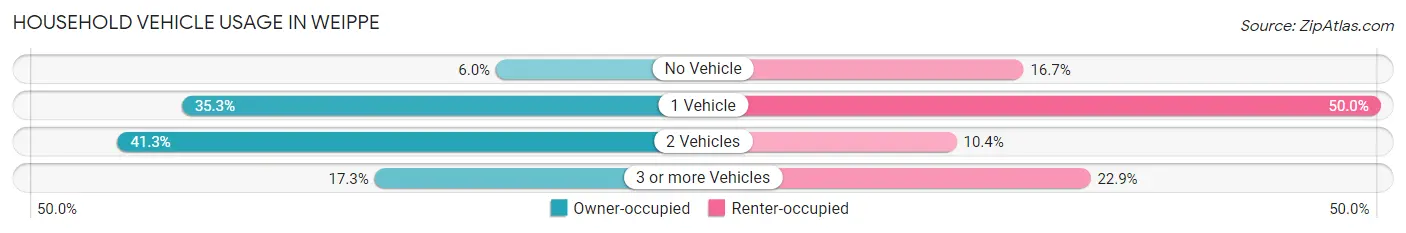
| Vehicles per Household | Owner-occupied | Renter-occupied |
| No Vehicle | 9 (6.0%) | 8 (16.7%) |
| 1 Vehicle | 53 (35.3%) | 24 (50.0%) |
| 2 Vehicles | 62 (41.3%) | 5 (10.4%) |
| 3 or more Vehicles | 26 (17.3%) | 11 (22.9%) |
| Total | 150 (100.0%) | 48 (100.0%) |
Real Estate & Mortgages in Weippe
Real Estate and Mortgage Overview in Weippe
| Characteristic | Without Mortgage | With Mortgage |
| Housing Units | 143 | 7 |
| Median Property Value | $104,600 | $145,800 |
| Median Household Income | $28,173 | $0 |
| Monthly Housing Costs | $399 | $0 |
| Real Estate Taxes | $802 | $0 |
Property Value by Mortgage Status in Weippe
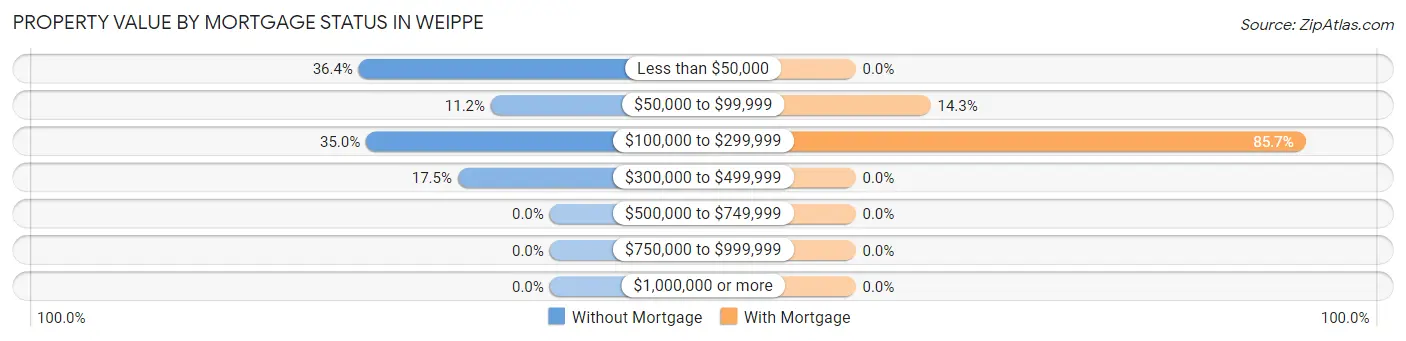
| Property Value | Without Mortgage | With Mortgage |
| Less than $50,000 | 52 (36.4%) | 0 (0.0%) |
| $50,000 to $99,999 | 16 (11.2%) | 1 (14.3%) |
| $100,000 to $299,999 | 50 (35.0%) | 6 (85.7%) |
| $300,000 to $499,999 | 25 (17.5%) | 0 (0.0%) |
| $500,000 to $749,999 | 0 (0.0%) | 0 (0.0%) |
| $750,000 to $999,999 | 0 (0.0%) | 0 (0.0%) |
| $1,000,000 or more | 0 (0.0%) | 0 (0.0%) |
| Total | 143 (100.0%) | 7 (100.0%) |
Household Income by Mortgage Status in Weippe
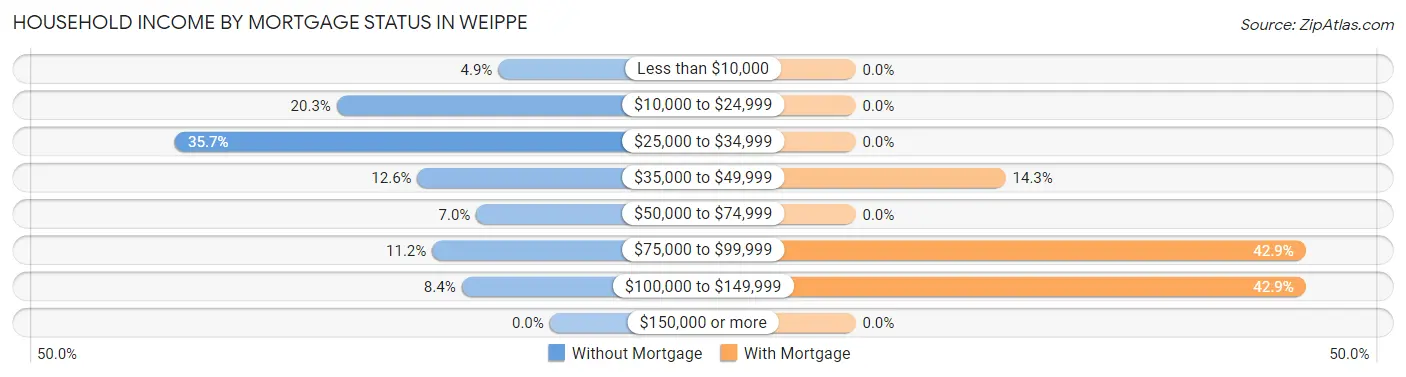
| Household Income | Without Mortgage | With Mortgage |
| Less than $10,000 | 7 (4.9%) | 0 (0.0%) |
| $10,000 to $24,999 | 29 (20.3%) | 0 (0.0%) |
| $25,000 to $34,999 | 51 (35.7%) | 0 (0.0%) |
| $35,000 to $49,999 | 18 (12.6%) | 1 (14.3%) |
| $50,000 to $74,999 | 10 (7.0%) | 0 (0.0%) |
| $75,000 to $99,999 | 16 (11.2%) | 3 (42.9%) |
| $100,000 to $149,999 | 12 (8.4%) | 3 (42.9%) |
| $150,000 or more | 0 (0.0%) | 0 (0.0%) |
| Total | 143 (100.0%) | 7 (100.0%) |
Property Value to Household Income Ratio in Weippe
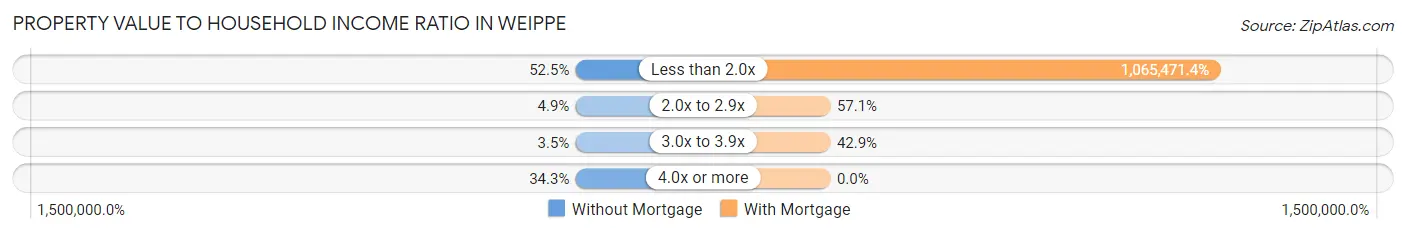
| Value-to-Income Ratio | Without Mortgage | With Mortgage |
| Less than 2.0x | 75 (52.4%) | 74,583 (1,065,471.4%) |
| 2.0x to 2.9x | 7 (4.9%) | 4 (57.1%) |
| 3.0x to 3.9x | 5 (3.5%) | 3 (42.9%) |
| 4.0x or more | 49 (34.3%) | 0 (0.0%) |
| Total | 143 (100.0%) | 7 (100.0%) |
Real Estate Taxes by Mortgage Status in Weippe
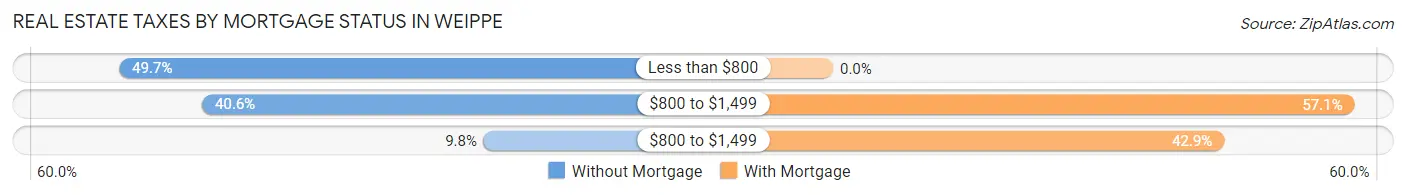
| Property Taxes | Without Mortgage | With Mortgage |
| Less than $800 | 71 (49.6%) | 0 (0.0%) |
| $800 to $1,499 | 58 (40.6%) | 4 (57.1%) |
| $800 to $1,499 | 14 (9.8%) | 3 (42.9%) |
| Total | 143 (100.0%) | 7 (100.0%) |
Health & Disability in Weippe
Health Insurance Coverage by Age in Weippe
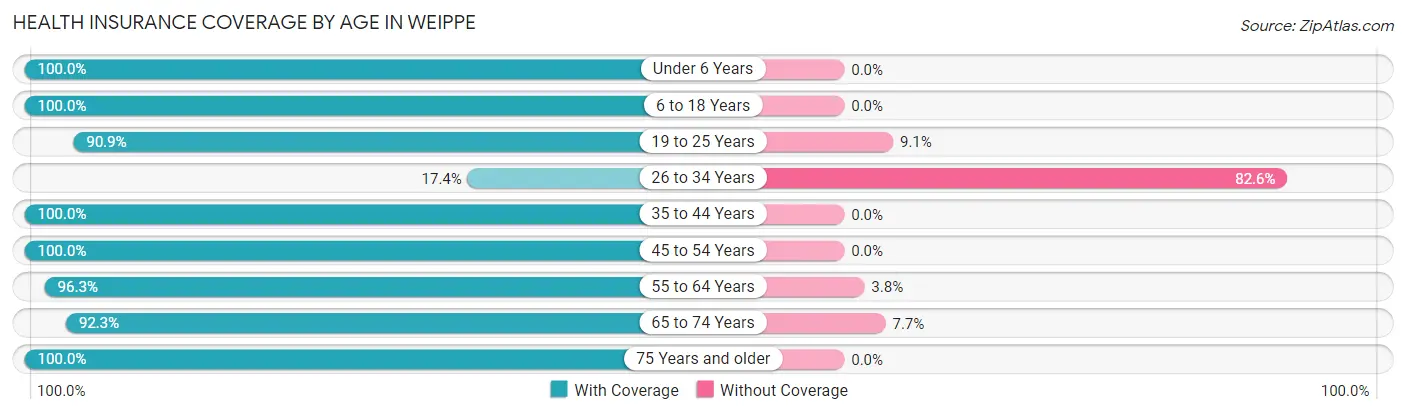
| Age Bracket | With Coverage | Without Coverage |
| Under 6 Years | 16 (100.0%) | 0 (0.0%) |
| 6 to 18 Years | 9 (100.0%) | 0 (0.0%) |
| 19 to 25 Years | 30 (90.9%) | 3 (9.1%) |
| 26 to 34 Years | 4 (17.4%) | 19 (82.6%) |
| 35 to 44 Years | 14 (100.0%) | 0 (0.0%) |
| 45 to 54 Years | 32 (100.0%) | 0 (0.0%) |
| 55 to 64 Years | 77 (96.3%) | 3 (3.7%) |
| 65 to 74 Years | 96 (92.3%) | 8 (7.7%) |
| 75 Years and older | 58 (100.0%) | 0 (0.0%) |
| Total | 336 (91.1%) | 33 (8.9%) |
Health Insurance Coverage by Citizenship Status in Weippe
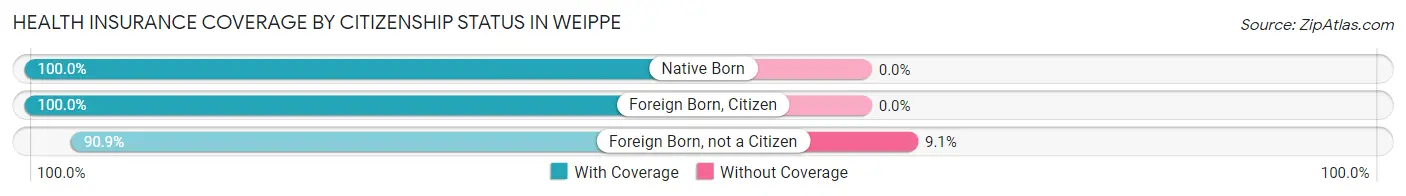
| Citizenship Status | With Coverage | Without Coverage |
| Native Born | 16 (100.0%) | 0 (0.0%) |
| Foreign Born, Citizen | 9 (100.0%) | 0 (0.0%) |
| Foreign Born, not a Citizen | 30 (90.9%) | 3 (9.1%) |
Health Insurance Coverage by Household Income in Weippe
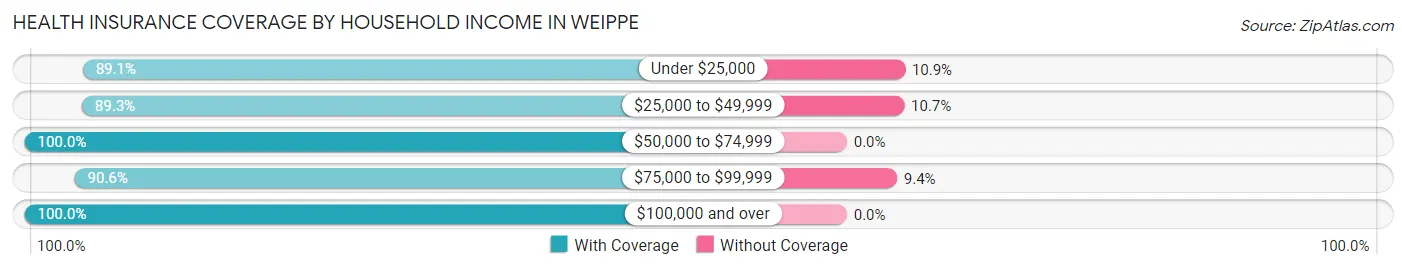
| Household Income | With Coverage | Without Coverage |
| Under $25,000 | 90 (89.1%) | 11 (10.9%) |
| $25,000 to $49,999 | 133 (89.3%) | 16 (10.7%) |
| $50,000 to $74,999 | 24 (100.0%) | 0 (0.0%) |
| $75,000 to $99,999 | 58 (90.6%) | 6 (9.4%) |
| $100,000 and over | 31 (100.0%) | 0 (0.0%) |
Public vs Private Health Insurance Coverage by Age in Weippe
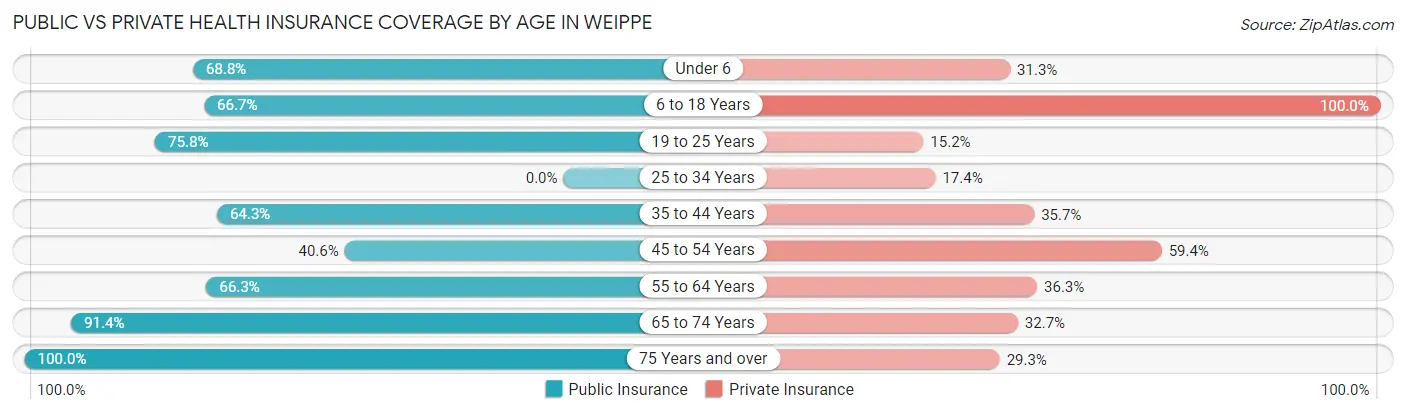
| Age Bracket | Public Insurance | Private Insurance |
| Under 6 | 11 (68.8%) | 5 (31.2%) |
| 6 to 18 Years | 6 (66.7%) | 9 (100.0%) |
| 19 to 25 Years | 25 (75.8%) | 5 (15.1%) |
| 25 to 34 Years | 0 (0.0%) | 4 (17.4%) |
| 35 to 44 Years | 9 (64.3%) | 5 (35.7%) |
| 45 to 54 Years | 13 (40.6%) | 19 (59.4%) |
| 55 to 64 Years | 53 (66.2%) | 29 (36.2%) |
| 65 to 74 Years | 95 (91.3%) | 34 (32.7%) |
| 75 Years and over | 58 (100.0%) | 17 (29.3%) |
| Total | 270 (73.2%) | 127 (34.4%) |
Disability Status by Sex by Age in Weippe
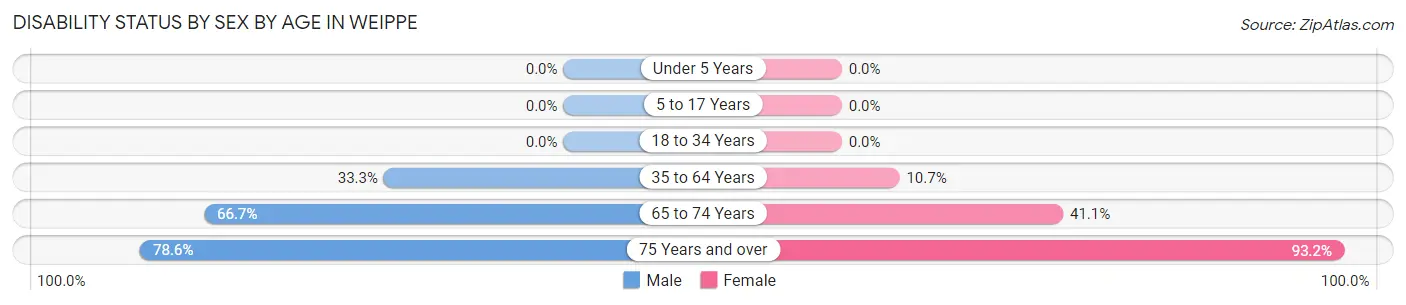
| Age Bracket | Male | Female |
| Under 5 Years | 0 (0.0%) | 0 (0.0%) |
| 5 to 17 Years | 0 (0.0%) | 0 (0.0%) |
| 18 to 34 Years | 0 (0.0%) | 0 (0.0%) |
| 35 to 64 Years | 14 (33.3%) | 9 (10.7%) |
| 65 to 74 Years | 32 (66.7%) | 23 (41.1%) |
| 75 Years and over | 11 (78.6%) | 41 (93.2%) |
Disability Class by Sex by Age in Weippe
Disability Class: Hearing Difficulty
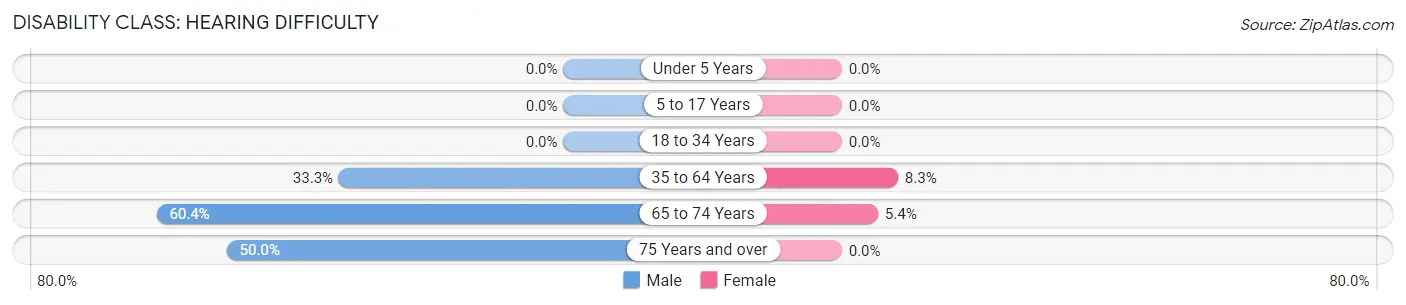
| Age Bracket | Male | Female |
| Under 5 Years | 0 (0.0%) | 0 (0.0%) |
| 5 to 17 Years | 0 (0.0%) | 0 (0.0%) |
| 18 to 34 Years | 0 (0.0%) | 0 (0.0%) |
| 35 to 64 Years | 14 (33.3%) | 7 (8.3%) |
| 65 to 74 Years | 29 (60.4%) | 3 (5.4%) |
| 75 Years and over | 7 (50.0%) | 0 (0.0%) |
Disability Class: Vision Difficulty
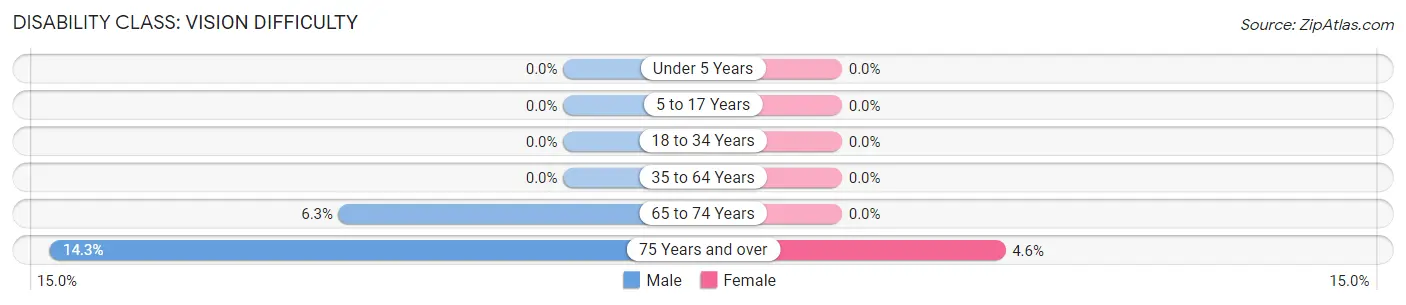
| Age Bracket | Male | Female |
| Under 5 Years | 0 (0.0%) | 0 (0.0%) |
| 5 to 17 Years | 0 (0.0%) | 0 (0.0%) |
| 18 to 34 Years | 0 (0.0%) | 0 (0.0%) |
| 35 to 64 Years | 0 (0.0%) | 0 (0.0%) |
| 65 to 74 Years | 3 (6.2%) | 0 (0.0%) |
| 75 Years and over | 2 (14.3%) | 2 (4.5%) |
Disability Class: Cognitive Difficulty
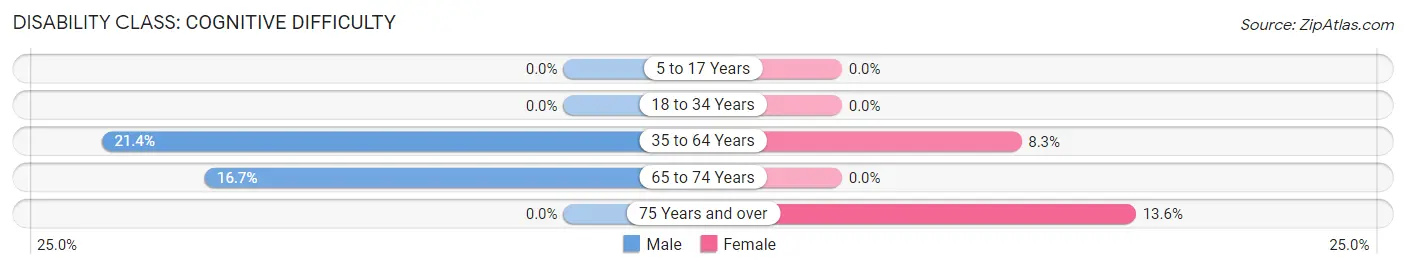
| Age Bracket | Male | Female |
| 5 to 17 Years | 0 (0.0%) | 0 (0.0%) |
| 18 to 34 Years | 0 (0.0%) | 0 (0.0%) |
| 35 to 64 Years | 9 (21.4%) | 7 (8.3%) |
| 65 to 74 Years | 8 (16.7%) | 0 (0.0%) |
| 75 Years and over | 0 (0.0%) | 6 (13.6%) |
Disability Class: Ambulatory Difficulty
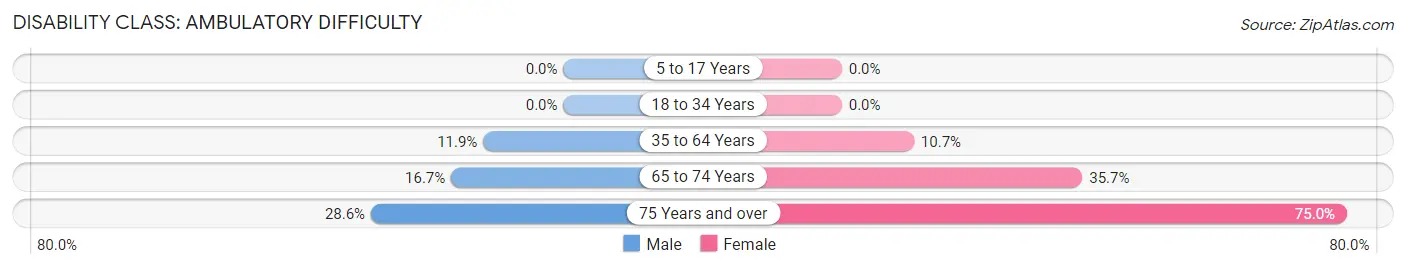
| Age Bracket | Male | Female |
| 5 to 17 Years | 0 (0.0%) | 0 (0.0%) |
| 18 to 34 Years | 0 (0.0%) | 0 (0.0%) |
| 35 to 64 Years | 5 (11.9%) | 9 (10.7%) |
| 65 to 74 Years | 8 (16.7%) | 20 (35.7%) |
| 75 Years and over | 4 (28.6%) | 33 (75.0%) |
Disability Class: Self-Care Difficulty
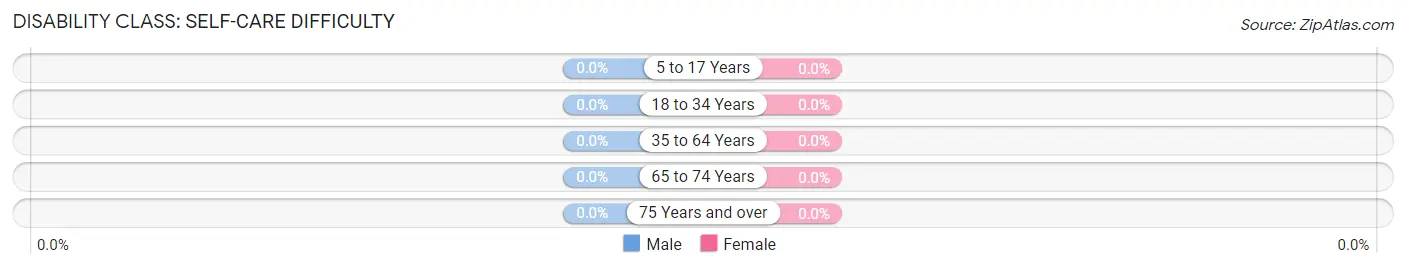
| Age Bracket | Male | Female |
| 5 to 17 Years | 0 (0.0%) | 0 (0.0%) |
| 18 to 34 Years | 0 (0.0%) | 0 (0.0%) |
| 35 to 64 Years | 0 (0.0%) | 0 (0.0%) |
| 65 to 74 Years | 0 (0.0%) | 0 (0.0%) |
| 75 Years and over | 0 (0.0%) | 0 (0.0%) |
Technology Access in Weippe
Computing Device Access in Weippe
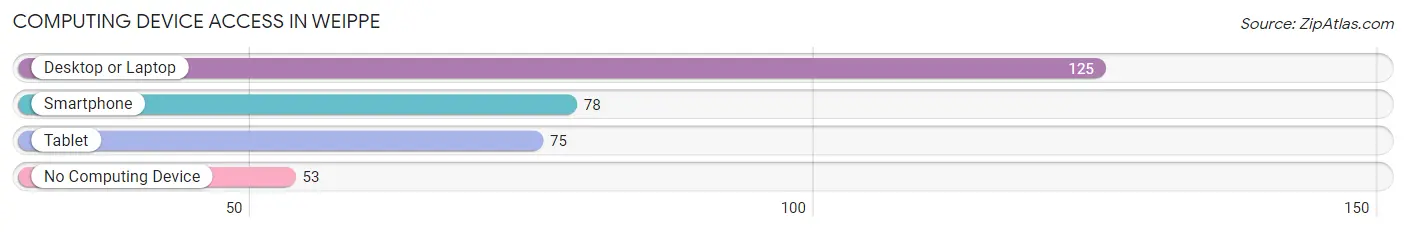
| Device Type | # Households | % Households |
| Desktop or Laptop | 125 | 63.1% |
| Smartphone | 78 | 39.4% |
| Tablet | 75 | 37.9% |
| No Computing Device | 53 | 26.8% |
| Total | 198 | 100.0% |
Internet Access in Weippe
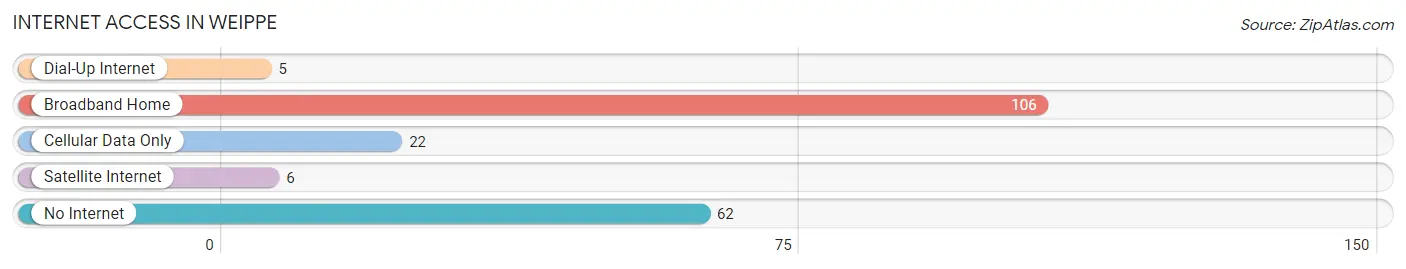
| Internet Type | # Households | % Households |
| Dial-Up Internet | 5 | 2.5% |
| Broadband Home | 106 | 53.5% |
| Cellular Data Only | 22 | 11.1% |
| Satellite Internet | 6 | 3.0% |
| No Internet | 62 | 31.3% |
| Total | 198 | 100.0% |
Weippe Summary
Weippe is a small town located in Clearwater County, Idaho. It is situated in the foothills of the Bitterroot Mountains, about 30 miles east of the Idaho-Montana border. The town was founded in 1864 by gold miners and was originally known as Weippe Prairie. It is the oldest settlement in Clearwater County and is home to about 500 people.
History
Weippe was founded in 1864 by gold miners who were searching for gold in the nearby mountains. The town was originally known as Weippe Prairie and was the first settlement in Clearwater County. The town was named after the Nez Perce Indian Chief Weippe, who was a leader of the Nez Perce tribe during the Nez Perce War of 1877.
The town was an important stop on the Mullan Road, which was the first wagon road to cross the Rocky Mountains. The road was built in the 1860s and connected the Missouri River to the Pacific Northwest. The town was also an important stop on the Oregon Trail, which was used by settlers traveling to the Pacific Northwest in the mid-1800s.
In the early 1900s, Weippe was a thriving logging and mining town. The town was home to several sawmills and a large lumber mill. The town also had a large copper mine, which was in operation until the 1950s.
Geography
Weippe is located in the foothills of the Bitterroot Mountains, about 30 miles east of the Idaho-Montana border. The town is situated at an elevation of 2,890 feet and is surrounded by mountains and forests. The nearby mountains are part of the Clearwater National Forest and are home to a variety of wildlife, including elk, deer, and bear.
The town is located on the Weippe Prairie, which is a large grassland that stretches for miles. The prairie is home to a variety of wildlife, including antelope, coyotes, and birds. The prairie is also home to a variety of wildflowers, including Indian paintbrush, lupine, and wild roses.
Economy
Weippe’s economy is largely based on tourism and logging. The town is home to several tourist attractions, including the Weippe Discovery Center, which is a museum dedicated to the history of the town and the surrounding area. The town is also home to several outdoor recreation areas, including the Weippe Wildlife Management Area, which is a popular spot for hunting and fishing.
The town is also home to several logging companies, which harvest timber from the nearby forests. The timber is then processed at the local sawmills and lumber mills.
Demographics
As of the 2010 census, the population of Weippe was 498. The town is predominantly white, with about 95% of the population being white. The median household income is $35,000 and the median age is 44. The town is home to a variety of religious denominations, including Catholic, Protestant, and Mormon.
Common Questions
What is Per Capita Income in Weippe?
Per Capita income in Weippe is $22,148.
What is the Median Family Income in Weippe?
Median Family Income in Weippe is $47,344.
What is the Median Household income in Weippe?
Median Household Income in Weippe is $27,422.
What is Inequality or Gini Index in Weippe?
Inequality or Gini Index in Weippe is 0.46.
What is the Total Population of Weippe?
Total Population of Weippe is 369.
What is the Total Male Population of Weippe?
Total Male Population of Weippe is 133.
What is the Total Female Population of Weippe?
Total Female Population of Weippe is 236.
What is the Ratio of Males per 100 Females in Weippe?
There are 56.36 Males per 100 Females in Weippe.
What is the Ratio of Females per 100 Males in Weippe?
There are 177.44 Females per 100 Males in Weippe.
What is the Median Population Age in Weippe?
Median Population Age in Weippe is 62.5 Years.
What is the Average Family Size in Weippe
Average Family Size in Weippe is 2.5 People.
What is the Average Household Size in Weippe
Average Household Size in Weippe is 1.9 People.
How Large is the Labor Force in Weippe?
There are 114 People in the Labor Forcein in Weippe.
What is the Percentage of People in the Labor Force in Weippe?
32.4% of People are in the Labor Force in Weippe.