Teton, ID Map & Demographics
Teton Map
Teton Overview
$28,081
PER CAPITA INCOME
$66,458
AVG FAMILY INCOME
$57,083
AVG HOUSEHOLD INCOME
46.7%
WAGE / INCOME GAP [ % ]
53.3¢/ $1
WAGE / INCOME GAP [ $ ]
0.43
INEQUALITY / GINI INDEX
909
TOTAL POPULATION
409
MALE POPULATION
500
FEMALE POPULATION
81.80
MALES / 100 FEMALES
122.25
FEMALES / 100 MALES
30.8
MEDIAN AGE
3.7
AVG FAMILY SIZE
3.3
AVG HOUSEHOLD SIZE
394
LABOR FORCE [ PEOPLE ]
65.7%
PERCENT IN LABOR FORCE
4.8%
UNEMPLOYMENT RATE
Teton Zip Codes
Teton Area Codes
Income in Teton
Income Overview in Teton
Per Capita Income in Teton is $28,081, while median incomes of families and households are $66,458 and $57,083 respectively.
| Characteristic | Number | Measure |
| Per Capita Income | 909 | $28,081 |
| Median Family Income | 236 | $66,458 |
| Mean Family Income | 236 | $83,115 |
| Median Household Income | 276 | $57,083 |
| Mean Household Income | 276 | $76,196 |
| Income Deficit | 236 | $0 |
| Wage / Income Gap (%) | 909 | 46.74% |
| Wage / Income Gap ($) | 909 | 53.26¢ per $1 |
| Gini / Inequality Index | 909 | 0.43 |
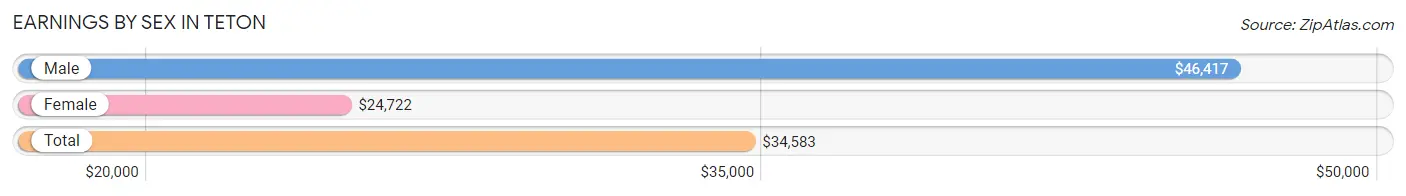
Earnings by Sex in Teton
Average Earnings in Teton are $34,583, $46,417 for men and $24,722 for women, a difference of 46.7%.
| Sex | Number | Average Earnings |
| Male | 233 (54.8%) | $46,417 |
| Female | 192 (45.2%) | $24,722 |
| Total | 425 (100.0%) | $34,583 |
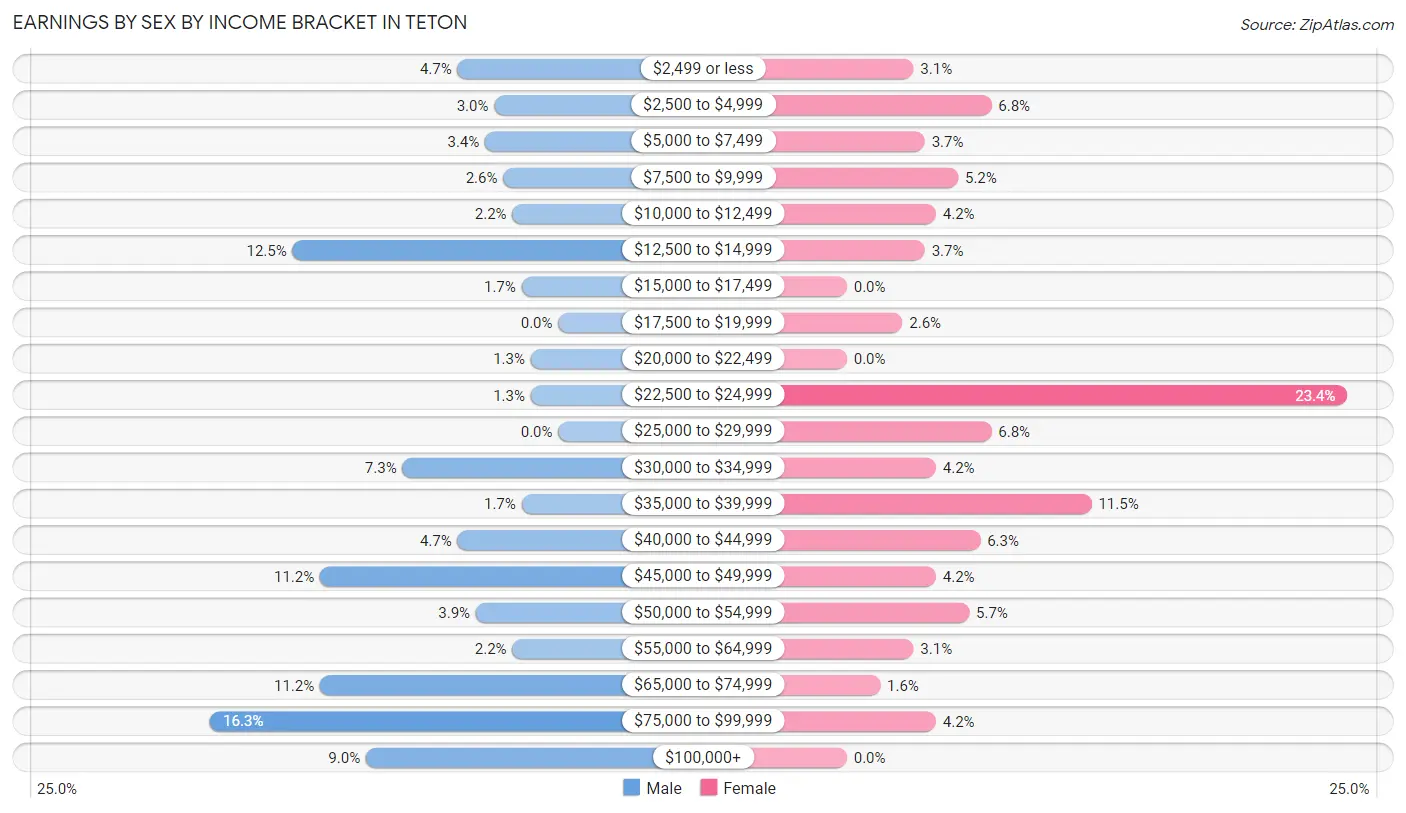
Earnings by Sex by Income Bracket in Teton
The most common earnings brackets in Teton are $75,000 to $99,999 for men (38 | 16.3%) and $22,500 to $24,999 for women (45 | 23.4%).
| Income | Male | Female |
| $2,499 or less | 11 (4.7%) | 6 (3.1%) |
| $2,500 to $4,999 | 7 (3.0%) | 13 (6.8%) |
| $5,000 to $7,499 | 8 (3.4%) | 7 (3.6%) |
| $7,500 to $9,999 | 6 (2.6%) | 10 (5.2%) |
| $10,000 to $12,499 | 5 (2.1%) | 8 (4.2%) |
| $12,500 to $14,999 | 29 (12.4%) | 7 (3.6%) |
| $15,000 to $17,499 | 4 (1.7%) | 0 (0.0%) |
| $17,500 to $19,999 | 0 (0.0%) | 5 (2.6%) |
| $20,000 to $22,499 | 3 (1.3%) | 0 (0.0%) |
| $22,500 to $24,999 | 3 (1.3%) | 45 (23.4%) |
| $25,000 to $29,999 | 0 (0.0%) | 13 (6.8%) |
| $30,000 to $34,999 | 17 (7.3%) | 8 (4.2%) |
| $35,000 to $39,999 | 4 (1.7%) | 22 (11.5%) |
| $40,000 to $44,999 | 11 (4.7%) | 12 (6.2%) |
| $45,000 to $49,999 | 26 (11.2%) | 8 (4.2%) |
| $50,000 to $54,999 | 9 (3.9%) | 11 (5.7%) |
| $55,000 to $64,999 | 5 (2.1%) | 6 (3.1%) |
| $65,000 to $74,999 | 26 (11.2%) | 3 (1.6%) |
| $75,000 to $99,999 | 38 (16.3%) | 8 (4.2%) |
| $100,000+ | 21 (9.0%) | 0 (0.0%) |
| Total | 233 (100.0%) | 192 (100.0%) |
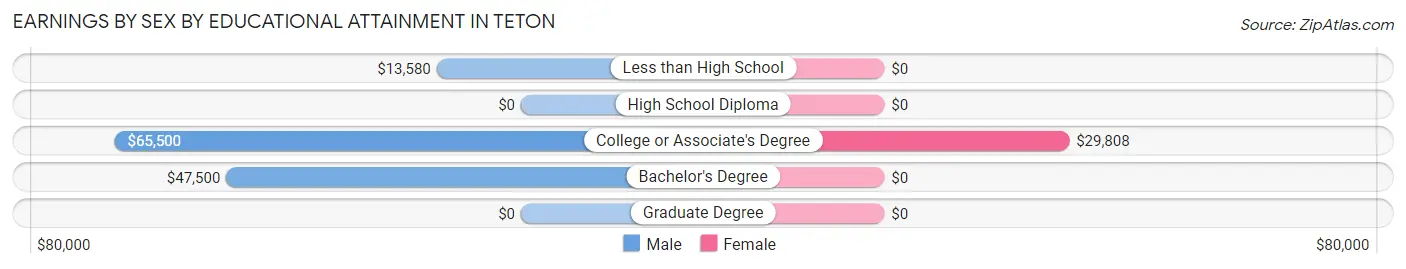
Earnings by Sex by Educational Attainment in Teton
Average earnings in Teton are $50,000 for men and $24,545 for women, a difference of 50.9%. Men with an educational attainment of college or associate's degree enjoy the highest average annual earnings of $65,500, while those with less than high school education earn the least with $13,580. Women with an educational attainment of college or associate's degree earn the most with the average annual earnings of $29,808, while those with college or associate's degree education have the smallest earnings of $29,808.
| Educational Attainment | Male Income | Female Income |
| Less than High School | $13,580 | $0 |
| High School Diploma | - | - |
| College or Associate's Degree | $65,500 | $29,808 |
| Bachelor's Degree | $47,500 | $0 |
| Graduate Degree | - | - |
| Total | $50,000 | $24,545 |
Family Income in Teton
Family Income Brackets in Teton
According to the Teton family income data, there are 45 families falling into the $15,000 to $24,999 income range, which is the most common income bracket and makes up 19.1% of all families.
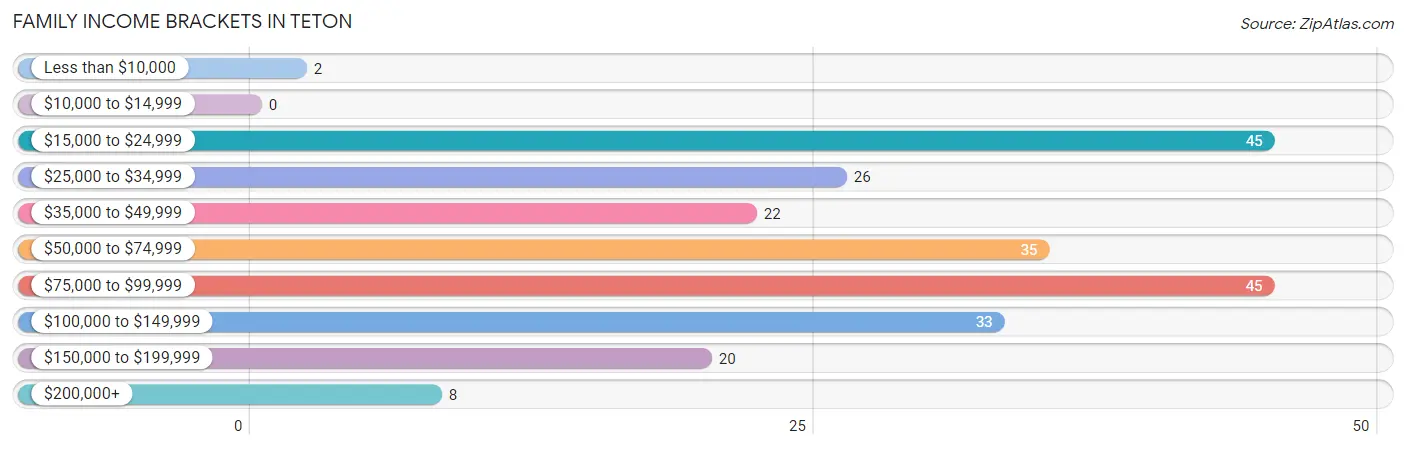
| Income Bracket | # Families | % Families |
| Less than $10,000 | 2 | 0.8% |
| $10,000 to $14,999 | 0 | 0.0% |
| $15,000 to $24,999 | 45 | 19.1% |
| $25,000 to $34,999 | 26 | 11.0% |
| $35,000 to $49,999 | 22 | 9.3% |
| $50,000 to $74,999 | 35 | 14.8% |
| $75,000 to $99,999 | 45 | 19.1% |
| $100,000 to $149,999 | 33 | 14.0% |
| $150,000 to $199,999 | 20 | 8.5% |
| $200,000+ | 8 | 3.4% |
Family Income by Famaliy Size in Teton
5-person families (21 | 8.9%) account for the highest median family income in Teton with $91,750 per family, while 2-person families (79 | 33.5%) have the highest median income of $37,552 per family member.
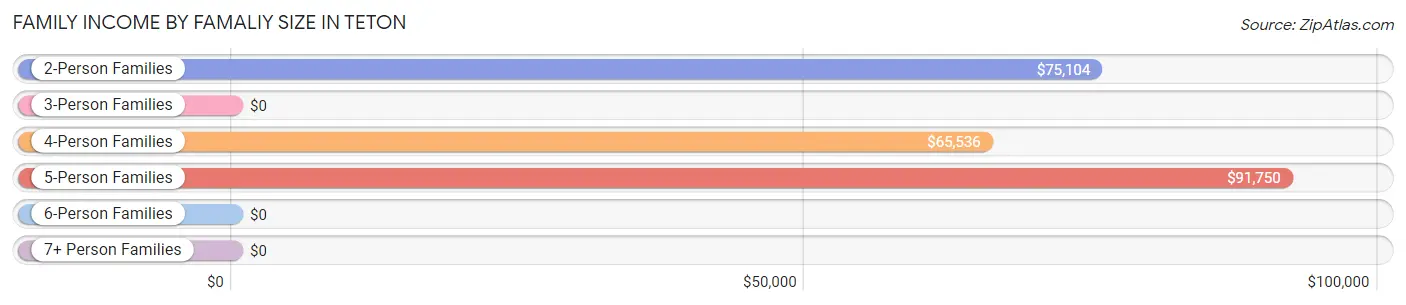
| Income Bracket | # Families | Median Income |
| 2-Person Families | 79 (33.5%) | $75,104 |
| 3-Person Families | 83 (35.2%) | $0 |
| 4-Person Families | 25 (10.6%) | $65,536 |
| 5-Person Families | 21 (8.9%) | $91,750 |
| 6-Person Families | 9 (3.8%) | $0 |
| 7+ Person Families | 19 (8.1%) | $0 |
| Total | 236 (100.0%) | $66,458 |
Family Income by Number of Earners in Teton
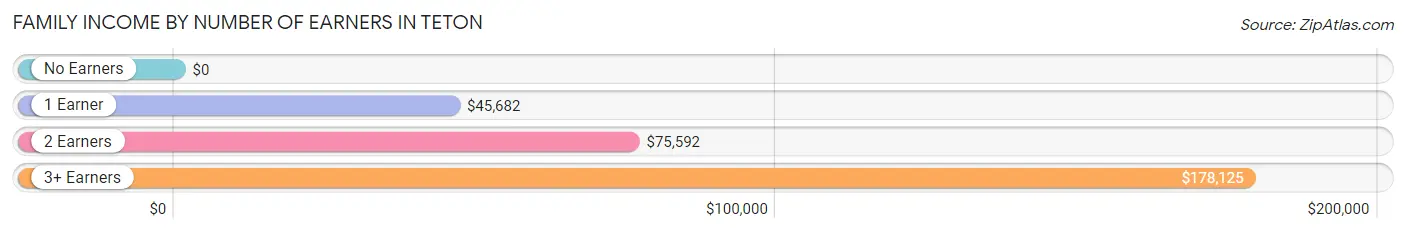
| Number of Earners | # Families | Median Income |
| No Earners | 10 (4.2%) | $0 |
| 1 Earner | 112 (47.5%) | $45,682 |
| 2 Earners | 91 (38.6%) | $75,592 |
| 3+ Earners | 23 (9.8%) | $178,125 |
| Total | 236 (100.0%) | $66,458 |
Household Income in Teton
Household Income Brackets in Teton
With 45 households falling in the category, the $15,000 to $24,999 income range is the most frequent in Teton, accounting for 16.3% of all households. In contrast, only 2 households (0.7%) fall into the less than $10,000 income bracket, making it the least populous group.
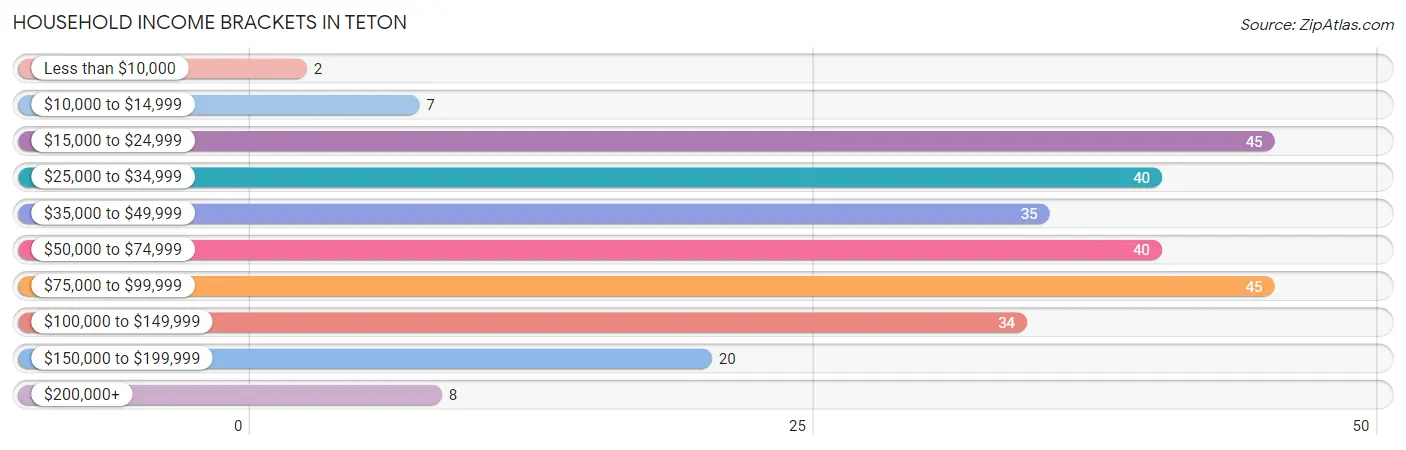
| Income Bracket | # Households | % Households |
| Less than $10,000 | 2 | 0.7% |
| $10,000 to $14,999 | 7 | 2.5% |
| $15,000 to $24,999 | 45 | 16.3% |
| $25,000 to $34,999 | 40 | 14.5% |
| $35,000 to $49,999 | 35 | 12.7% |
| $50,000 to $74,999 | 40 | 14.5% |
| $75,000 to $99,999 | 45 | 16.3% |
| $100,000 to $149,999 | 34 | 12.3% |
| $150,000 to $199,999 | 20 | 7.2% |
| $200,000+ | 8 | 2.9% |
Household Income by Householder Age in Teton
The median household income in Teton is $57,083, with the highest median household income of $75,833 found in the 45 to 64 years age bracket for the primary householder. A total of 80 households (29.0%) fall into this category. Meanwhile, the 15 to 24 years age bracket for the primary householder has the lowest median household income of $0, with 14 households (5.1%) in this group.
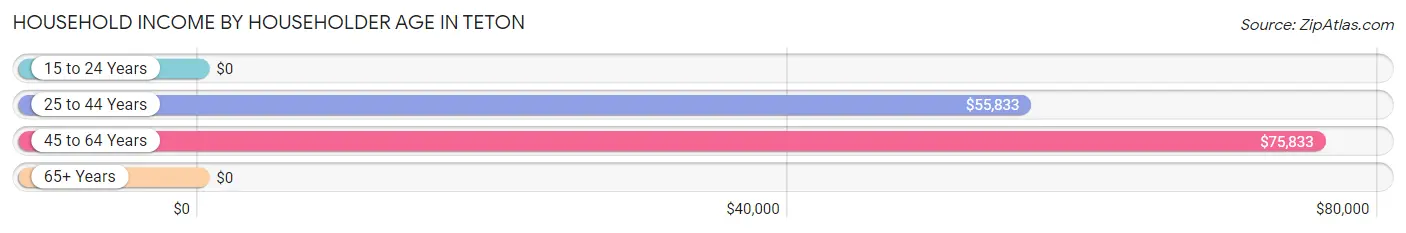
| Income Bracket | # Households | Median Income |
| 15 to 24 Years | 14 (5.1%) | $0 |
| 25 to 44 Years | 114 (41.3%) | $55,833 |
| 45 to 64 Years | 80 (29.0%) | $75,833 |
| 65+ Years | 68 (24.6%) | $0 |
| Total | 276 (100.0%) | $57,083 |
Poverty in Teton
Income Below Poverty by Sex and Age in Teton
With 9.0% poverty level for males and 35.2% for females among the residents of Teton, 18 to 24 year old males and 16 and 17 year old females are the most vulnerable to poverty, with 14 males (34.2%) and 6 females (100.0%) in their respective age groups living below the poverty level.
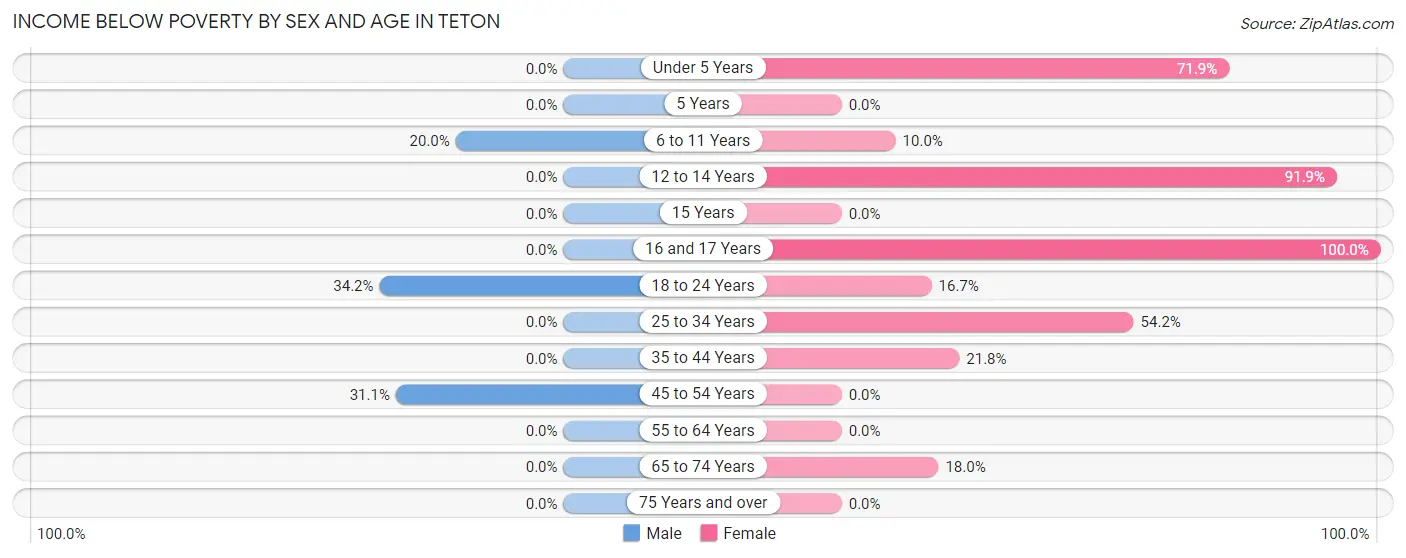
| Age Bracket | Male | Female |
| Under 5 Years | 0 (0.0%) | 69 (71.9%) |
| 5 Years | 0 (0.0%) | 0 (0.0%) |
| 6 to 11 Years | 9 (20.0%) | 4 (10.0%) |
| 12 to 14 Years | 0 (0.0%) | 34 (91.9%) |
| 15 Years | 0 (0.0%) | 0 (0.0%) |
| 16 and 17 Years | 0 (0.0%) | 6 (100.0%) |
| 18 to 24 Years | 14 (34.2%) | 5 (16.7%) |
| 25 to 34 Years | 0 (0.0%) | 39 (54.2%) |
| 35 to 44 Years | 0 (0.0%) | 12 (21.8%) |
| 45 to 54 Years | 14 (31.1%) | 0 (0.0%) |
| 55 to 64 Years | 0 (0.0%) | 0 (0.0%) |
| 65 to 74 Years | 0 (0.0%) | 7 (17.9%) |
| 75 Years and over | 0 (0.0%) | 0 (0.0%) |
| Total | 37 (9.0%) | 176 (35.2%) |
Income Above Poverty by Sex and Age in Teton
According to the poverty statistics in Teton, males aged under 5 years and females aged 5 years are the age groups that are most secure financially, with 100.0% of males and 100.0% of females in these age groups living above the poverty line.
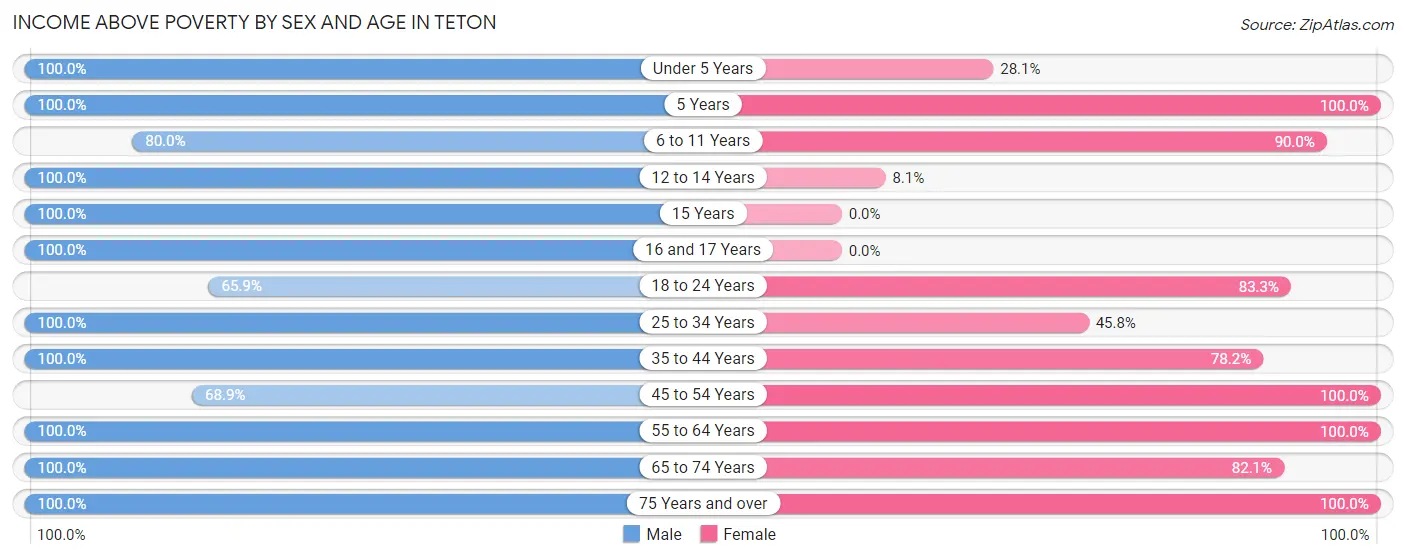
| Age Bracket | Male | Female |
| Under 5 Years | 59 (100.0%) | 27 (28.1%) |
| 5 Years | 2 (100.0%) | 9 (100.0%) |
| 6 to 11 Years | 36 (80.0%) | 36 (90.0%) |
| 12 to 14 Years | 17 (100.0%) | 3 (8.1%) |
| 15 Years | 4 (100.0%) | 0 (0.0%) |
| 16 and 17 Years | 2 (100.0%) | 0 (0.0%) |
| 18 to 24 Years | 27 (65.8%) | 25 (83.3%) |
| 25 to 34 Years | 24 (100.0%) | 33 (45.8%) |
| 35 to 44 Years | 31 (100.0%) | 43 (78.2%) |
| 45 to 54 Years | 31 (68.9%) | 26 (100.0%) |
| 55 to 64 Years | 77 (100.0%) | 54 (100.0%) |
| 65 to 74 Years | 47 (100.0%) | 32 (82.1%) |
| 75 Years and over | 15 (100.0%) | 36 (100.0%) |
| Total | 372 (90.9%) | 324 (64.8%) |
Income Below Poverty Among Married-Couple Families in Teton
The poverty statistics for married-couple families in Teton show that 9.0% or 17 of the total 188 families live below the poverty line. Families with 5 or more children have the highest poverty rate of 30.0%, comprising of 3 families. On the other hand, families with 1 or 2 children have the lowest poverty rate of 0.0%, which includes 0 families.
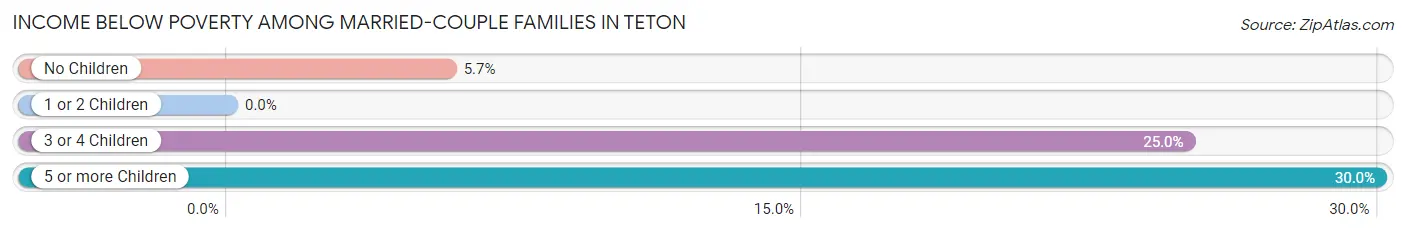
| Children | Above Poverty | Below Poverty |
| No Children | 99 (94.3%) | 6 (5.7%) |
| 1 or 2 Children | 41 (100.0%) | 0 (0.0%) |
| 3 or 4 Children | 24 (75.0%) | 8 (25.0%) |
| 5 or more Children | 7 (70.0%) | 3 (30.0%) |
| Total | 171 (91.0%) | 17 (9.0%) |
Income Below Poverty Among Single-Parent Households in Teton
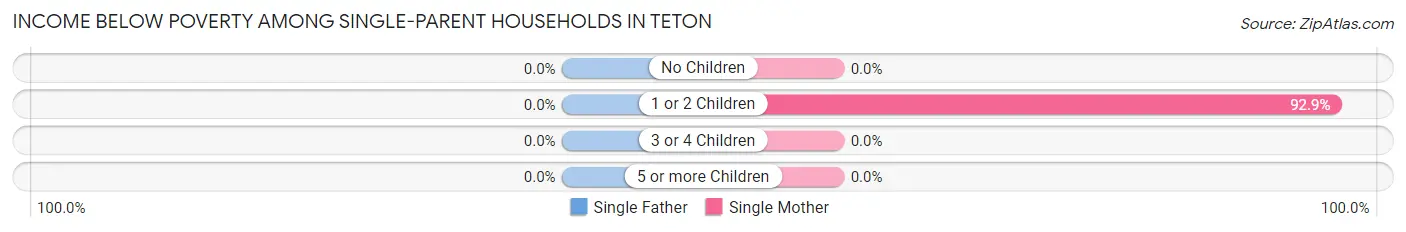
| Children | Single Father | Single Mother |
| No Children | 0 (0.0%) | 0 (0.0%) |
| 1 or 2 Children | 0 (0.0%) | 39 (92.9%) |
| 3 or 4 Children | 0 (0.0%) | 0 (0.0%) |
| 5 or more Children | 0 (0.0%) | 0 (0.0%) |
| Total | 0 (0.0%) | 39 (81.2%) |
Income Below Poverty Among Married-Couple vs Single-Parent Households in Teton
The poverty data for Teton shows that 17 of the married-couple family households (9.0%) and 39 of the single-parent households (81.2%) are living below the poverty level. Within the married-couple family households, those with 5 or more children have the highest poverty rate, with 3 households (30.0%) falling below the poverty line. Among the single-parent households, those with 1 or 2 children have the highest poverty rate, with 39 household (92.9%) living below poverty.
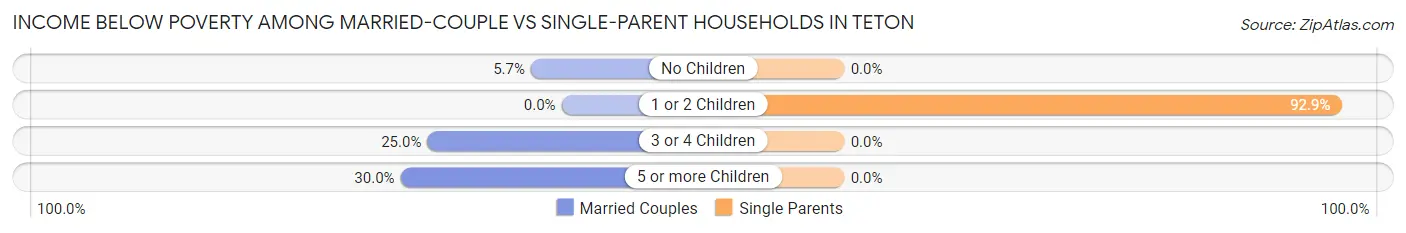
| Children | Married-Couple Families | Single-Parent Households |
| No Children | 6 (5.7%) | 0 (0.0%) |
| 1 or 2 Children | 0 (0.0%) | 39 (92.9%) |
| 3 or 4 Children | 8 (25.0%) | 0 (0.0%) |
| 5 or more Children | 3 (30.0%) | 0 (0.0%) |
| Total | 17 (9.0%) | 39 (81.2%) |
Race in Teton
The most populous races in Teton are White / Caucasian (892 | 98.1%), Hispanic or Latino (296 | 32.6%), and Some other Race (17 | 1.9%).
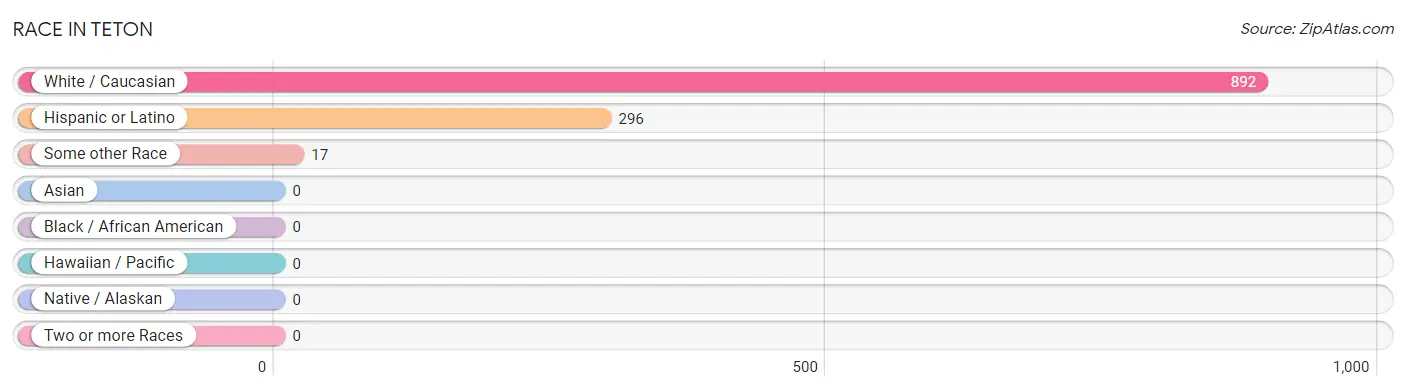
| Race | # Population | % Population |
| Asian | 0 | 0.0% |
| Black / African American | 0 | 0.0% |
| Hawaiian / Pacific | 0 | 0.0% |
| Hispanic or Latino | 296 | 32.6% |
| Native / Alaskan | 0 | 0.0% |
| White / Caucasian | 892 | 98.1% |
| Two or more Races | 0 | 0.0% |
| Some other Race | 17 | 1.9% |
| Total | 909 | 100.0% |
Ancestry in Teton
The most populous ancestries reported in Teton are Mexican (289 | 31.8%), English (166 | 18.3%), German (112 | 12.3%), Italian (76 | 8.4%), and Scottish (48 | 5.3%), together accounting for 76.0% of all Teton residents.
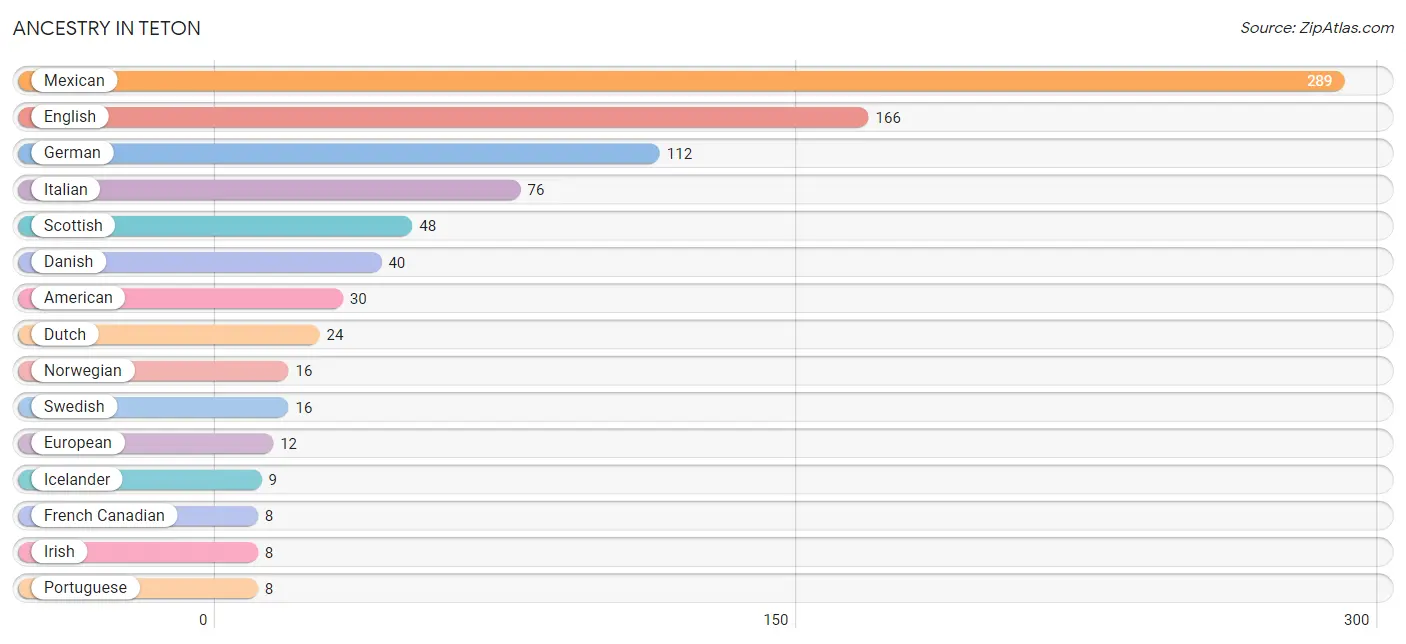
| Ancestry | # Population | % Population |
| American | 30 | 3.3% |
| Croatian | 7 | 0.8% |
| Danish | 40 | 4.4% |
| Dutch | 24 | 2.6% |
| English | 166 | 18.3% |
| European | 12 | 1.3% |
| French Canadian | 8 | 0.9% |
| German | 112 | 12.3% |
| Icelander | 9 | 1.0% |
| Irish | 8 | 0.9% |
| Italian | 76 | 8.4% |
| Mexican | 289 | 31.8% |
| Norwegian | 16 | 1.8% |
| Polish | 3 | 0.3% |
| Portuguese | 8 | 0.9% |
| Scandinavian | 7 | 0.8% |
| Scottish | 48 | 5.3% |
| Spaniard | 7 | 0.8% |
| Swedish | 16 | 1.8% |
| Welsh | 6 | 0.7% | View All 20 Rows |
Immigrants in Teton
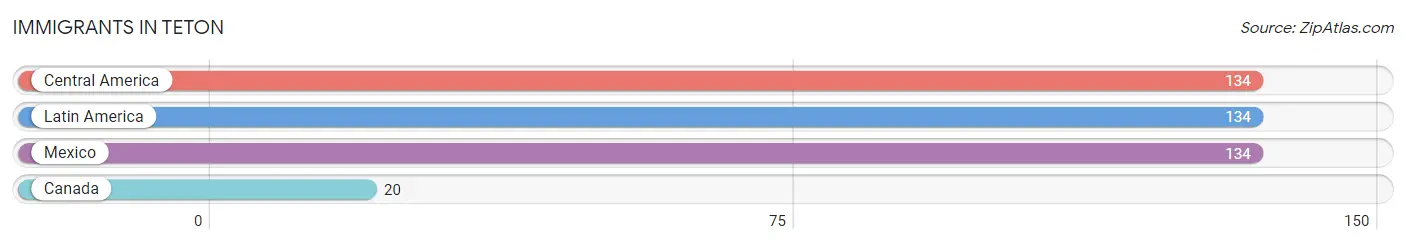
The most numerous immigrant groups reported in Teton came from Central America (134 | 14.7%), Latin America (134 | 14.7%), Mexico (134 | 14.7%), and Canada (20 | 2.2%), together accounting for 46.4% of all Teton residents.
| Immigration Origin | # Population | % Population |
| Canada | 20 | 2.2% |
| Central America | 134 | 14.7% |
| Latin America | 134 | 14.7% |
| Mexico | 134 | 14.7% | View All 4 Rows |
Sex and Age in Teton
Sex and Age in Teton
The most populous age groups in Teton are 55 to 59 Years (68 | 16.6%) for men and Under 5 Years (96 | 19.2%) for women.
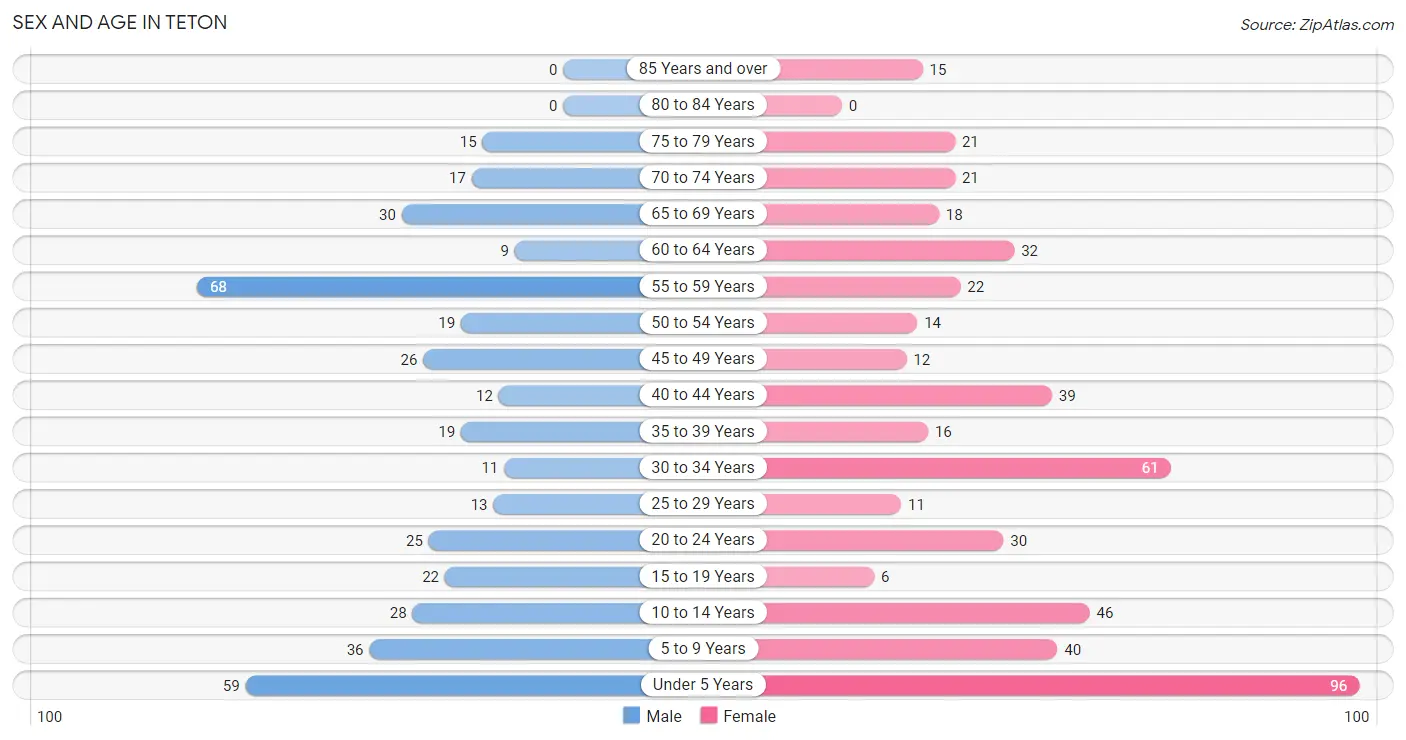
| Age Bracket | Male | Female |
| Under 5 Years | 59 (14.4%) | 96 (19.2%) |
| 5 to 9 Years | 36 (8.8%) | 40 (8.0%) |
| 10 to 14 Years | 28 (6.9%) | 46 (9.2%) |
| 15 to 19 Years | 22 (5.4%) | 6 (1.2%) |
| 20 to 24 Years | 25 (6.1%) | 30 (6.0%) |
| 25 to 29 Years | 13 (3.2%) | 11 (2.2%) |
| 30 to 34 Years | 11 (2.7%) | 61 (12.2%) |
| 35 to 39 Years | 19 (4.6%) | 16 (3.2%) |
| 40 to 44 Years | 12 (2.9%) | 39 (7.8%) |
| 45 to 49 Years | 26 (6.4%) | 12 (2.4%) |
| 50 to 54 Years | 19 (4.6%) | 14 (2.8%) |
| 55 to 59 Years | 68 (16.6%) | 22 (4.4%) |
| 60 to 64 Years | 9 (2.2%) | 32 (6.4%) |
| 65 to 69 Years | 30 (7.3%) | 18 (3.6%) |
| 70 to 74 Years | 17 (4.2%) | 21 (4.2%) |
| 75 to 79 Years | 15 (3.7%) | 21 (4.2%) |
| 80 to 84 Years | 0 (0.0%) | 0 (0.0%) |
| 85 Years and over | 0 (0.0%) | 15 (3.0%) |
| Total | 409 (100.0%) | 500 (100.0%) |
Families and Households in Teton
Median Family Size in Teton
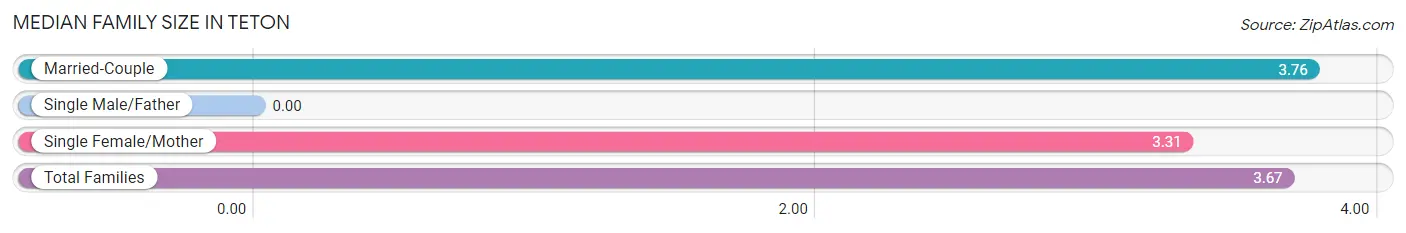
| Family Type | # Families | Family Size |
| Married-Couple | 188 (79.7%) | 3.76 |
| Single Male/Father | 0 (0.0%) | - |
| Single Female/Mother | 48 (20.3%) | 3.31 |
| Total Families | 236 (100.0%) | 3.67 |
Median Household Size in Teton
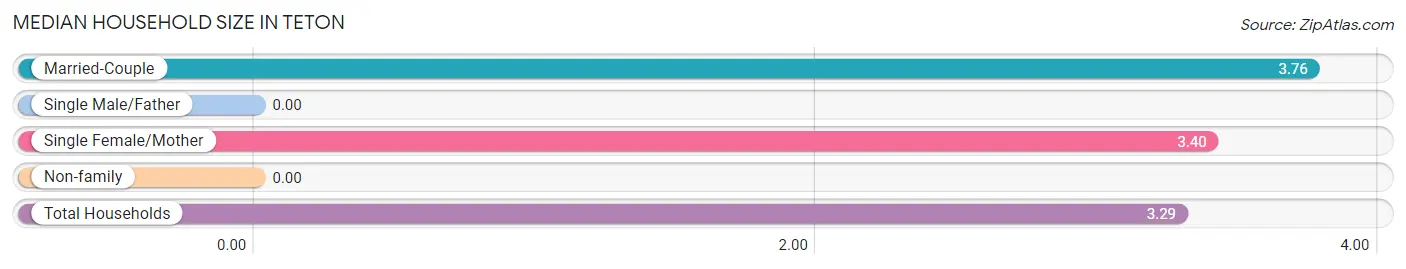
| Household Type | # Households | Household Size |
| Married-Couple | 188 (68.1%) | 3.76 |
| Single Male/Father | 0 (0.0%) | - |
| Single Female/Mother | 48 (17.4%) | 3.40 |
| Non-family | 40 (14.5%) | - |
| Total Households | 276 (100.0%) | 3.29 |
Household Size by Marriage Status in Teton
Out of a total of 276 households in Teton, 236 (85.5%) are family households, while 40 (14.5%) are nonfamily households. The most numerous type of family households are 3-person households, comprising 86, and the most common type of nonfamily households are 1-person households, comprising 40.
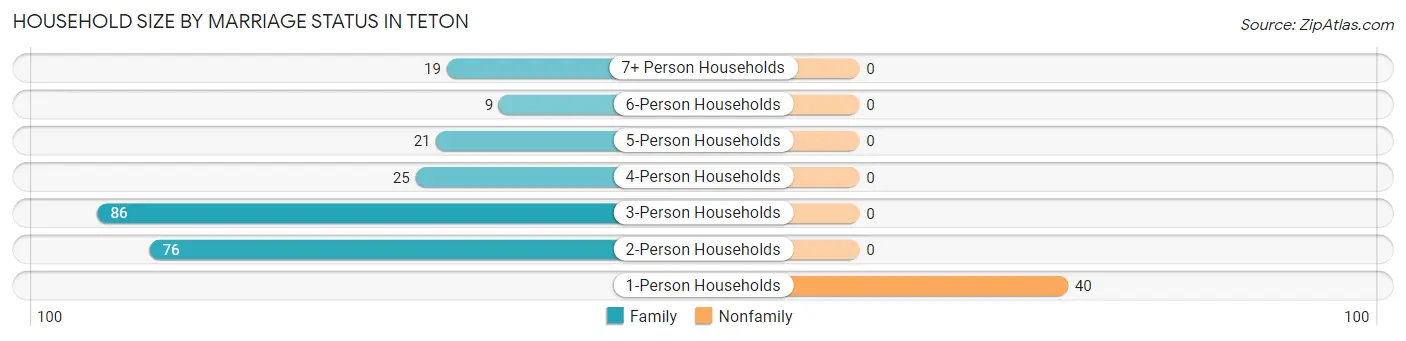
| Household Size | Family Households | Nonfamily Households |
| 1-Person Households | - | 40 (14.5%) |
| 2-Person Households | 76 (27.5%) | 0 (0.0%) |
| 3-Person Households | 86 (31.2%) | 0 (0.0%) |
| 4-Person Households | 25 (9.1%) | 0 (0.0%) |
| 5-Person Households | 21 (7.6%) | 0 (0.0%) |
| 6-Person Households | 9 (3.3%) | 0 (0.0%) |
| 7+ Person Households | 19 (6.9%) | 0 (0.0%) |
| Total | 236 (85.5%) | 40 (14.5%) |
Female Fertility in Teton
Fertility by Age in Teton
Average fertility rate in Teton is 149.0 births per 1,000 women. Women in the age bracket of 20 to 34 years have the highest fertility rate with 255.0 births per 1,000 women. Women in the age bracket of 20 to 34 years acount for 100.0% of all women with births.
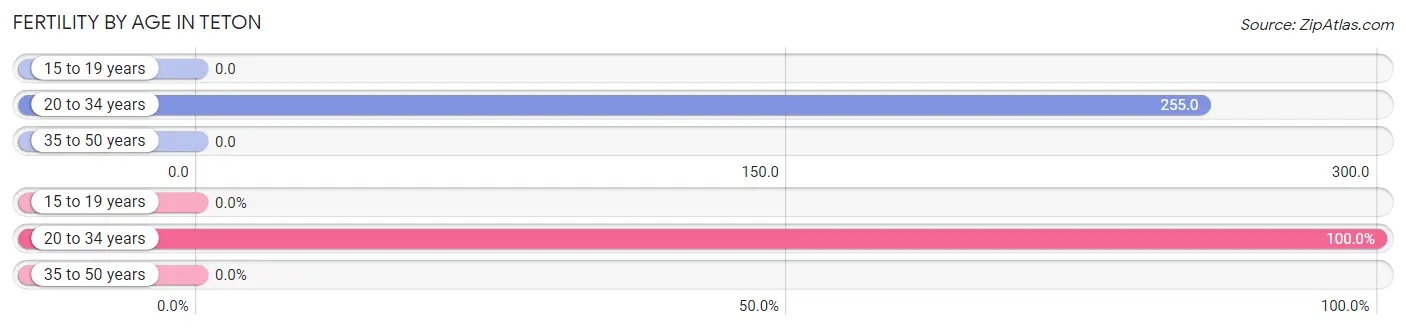
| Age Bracket | Women with Births | Births / 1,000 Women |
| 15 to 19 years | 0 (0.0%) | 0.0 |
| 20 to 34 years | 26 (100.0%) | 255.0 |
| 35 to 50 years | 0 (0.0%) | 0.0 |
| Total | 26 (100.0%) | 149.0 |
Fertility by Age by Marriage Status in Teton
92.3% of women with births (26) in Teton are married. The highest percentage of unmarried women with births falls into 20 to 34 years age bracket with 7.7% of them unmarried at the time of birth, while the lowest percentage of unmarried women with births belong to 20 to 34 years age bracket with 7.7% of them unmarried.
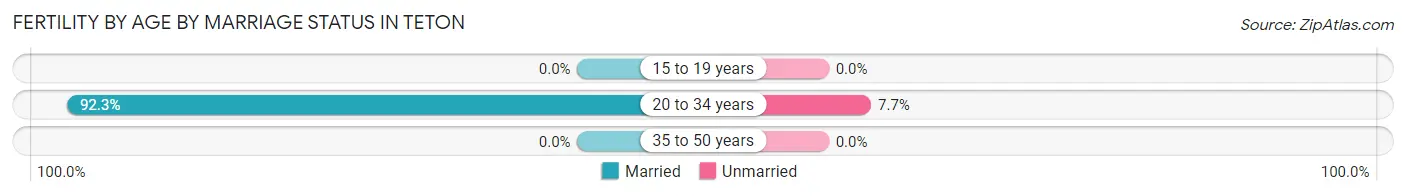
| Age Bracket | Married | Unmarried |
| 15 to 19 years | 0 (0.0%) | 0 (0.0%) |
| 20 to 34 years | 24 (92.3%) | 2 (7.7%) |
| 35 to 50 years | 0 (0.0%) | 0 (0.0%) |
| Total | 24 (92.3%) | 2 (7.7%) |
Fertility by Education in Teton
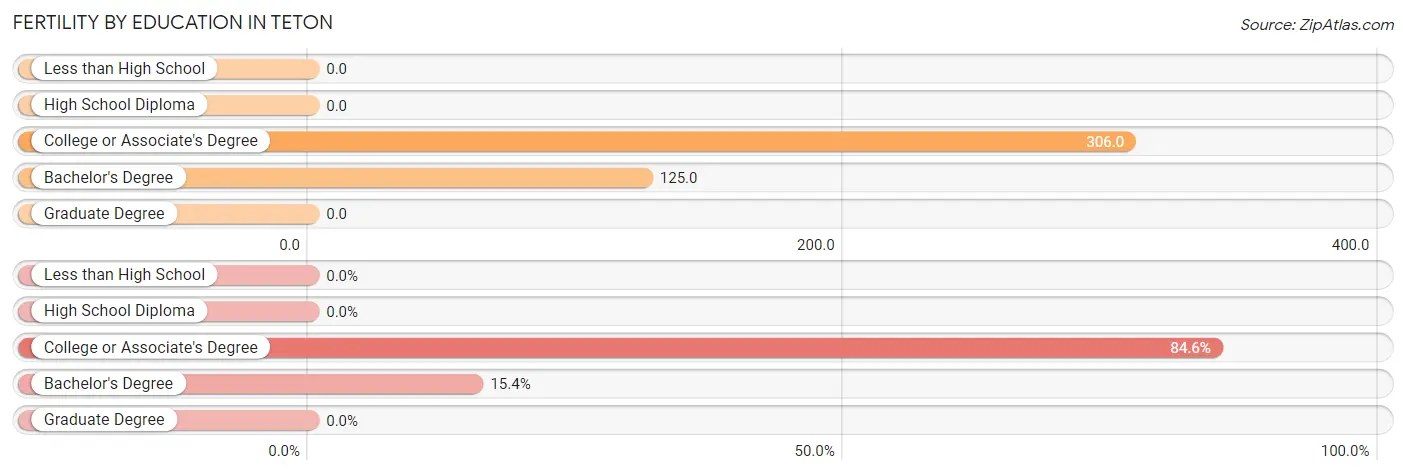
| Educational Attainment | Women with Births | Births / 1,000 Women |
| Less than High School | 0 (0.0%) | 0.0 |
| High School Diploma | 0 (0.0%) | 0.0 |
| College or Associate's Degree | 22 (84.6%) | 306.0 |
| Bachelor's Degree | 4 (15.4%) | 125.0 |
| Graduate Degree | 0 (0.0%) | 0.0 |
| Total | 26 (100.0%) | 149.0 |
Fertility by Education by Marriage Status in Teton
7.7% of women with births in Teton are unmarried. Women with the educational attainment of bachelor's degree are most likely to be married with 100.0% of them married at childbirth, while women with the educational attainment of college or associate's degree are least likely to be married with 9.1% of them unmarried at childbirth.
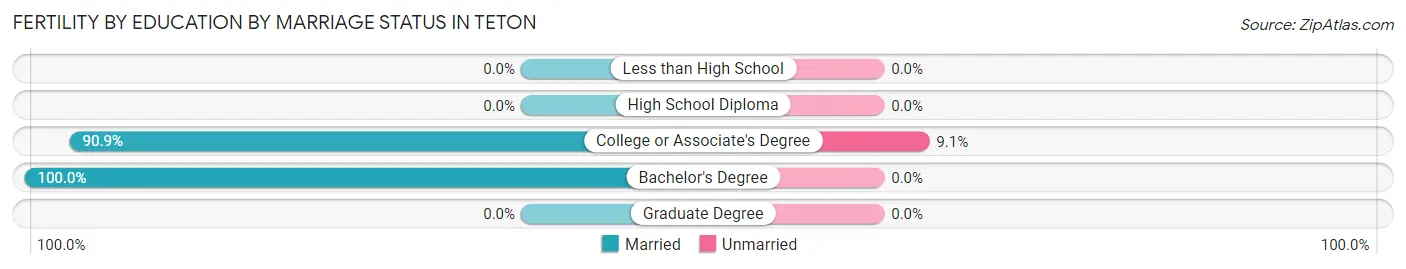
| Educational Attainment | Married | Unmarried |
| Less than High School | 0 (0.0%) | 0 (0.0%) |
| High School Diploma | 0 (0.0%) | 0 (0.0%) |
| College or Associate's Degree | 20 (90.9%) | 2 (9.1%) |
| Bachelor's Degree | 4 (100.0%) | 0 (0.0%) |
| Graduate Degree | 0 (0.0%) | 0 (0.0%) |
| Total | 24 (92.3%) | 2 (7.7%) |
Employment Characteristics in Teton
Employment by Class of Employer in Teton
Among the 375 employed individuals in Teton, private company employees (224 | 59.7%), local government employees (37 | 9.9%), and not-for-profit organizations (34 | 9.1%) make up the most common classes of employment.
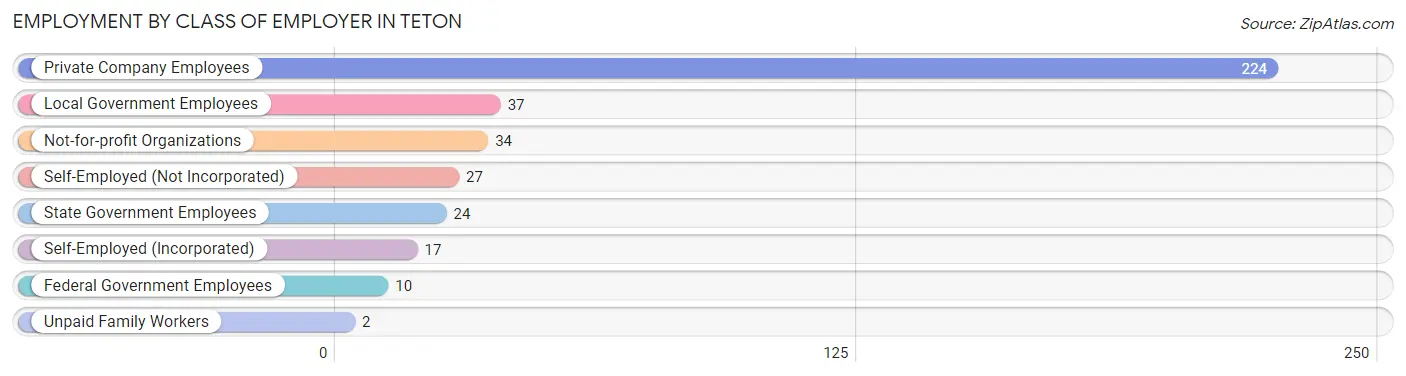
| Employer Class | # Employees | % Employees |
| Private Company Employees | 224 | 59.7% |
| Self-Employed (Incorporated) | 17 | 4.5% |
| Self-Employed (Not Incorporated) | 27 | 7.2% |
| Not-for-profit Organizations | 34 | 9.1% |
| Local Government Employees | 37 | 9.9% |
| State Government Employees | 24 | 6.4% |
| Federal Government Employees | 10 | 2.7% |
| Unpaid Family Workers | 2 | 0.5% |
| Total | 375 | 100.0% |
Employment Status by Age in Teton
According to the labor force statistics for Teton, out of the total population over 16 years of age (600), 65.7% or 394 individuals are in the labor force, with 4.8% or 19 of them unemployed. The age group with the highest labor force participation rate is 25 to 29 years, with 95.8% or 23 individuals in the labor force. Within the labor force, the 16 to 19 years age range has the highest percentage of unemployed individuals, with 100.0% or 10 of them being unemployed.
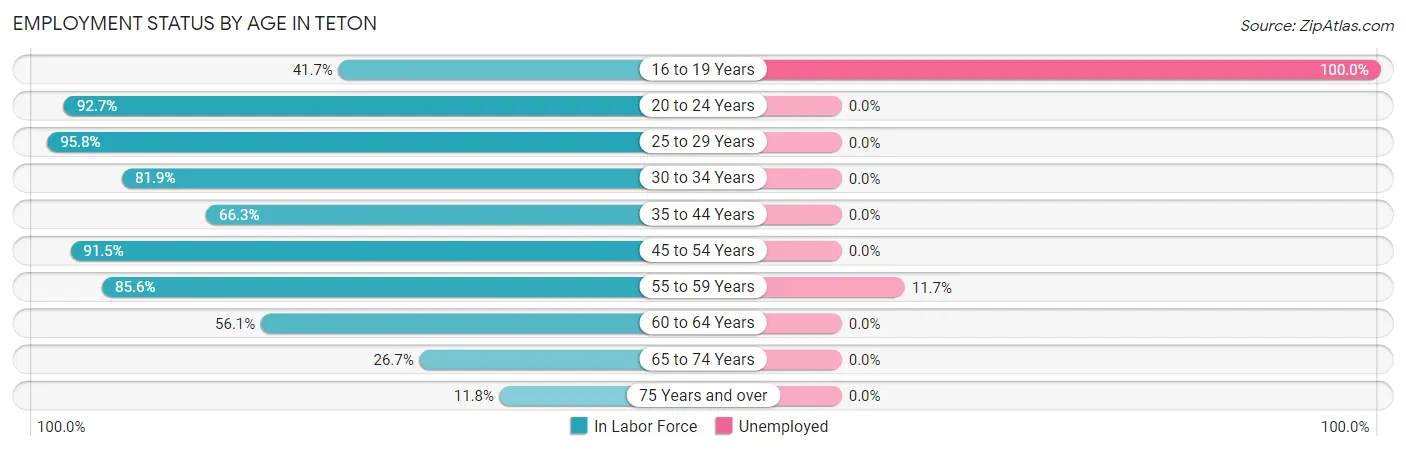
| Age Bracket | In Labor Force | Unemployed |
| 16 to 19 Years | 10 (41.7%) | 10 (100.0%) |
| 20 to 24 Years | 51 (92.7%) | 0 (0.0%) |
| 25 to 29 Years | 23 (95.8%) | 0 (0.0%) |
| 30 to 34 Years | 59 (81.9%) | 0 (0.0%) |
| 35 to 44 Years | 57 (66.3%) | 0 (0.0%) |
| 45 to 54 Years | 65 (91.5%) | 0 (0.0%) |
| 55 to 59 Years | 77 (85.6%) | 9 (11.7%) |
| 60 to 64 Years | 23 (56.1%) | 0 (0.0%) |
| 65 to 74 Years | 23 (26.7%) | 0 (0.0%) |
| 75 Years and over | 6 (11.8%) | 0 (0.0%) |
| Total | 394 (65.7%) | 19 (4.8%) |
Employment Status by Educational Attainment in Teton
According to labor force statistics for Teton, 79.2% of individuals (304) out of the total population between 25 and 64 years of age (384) are in the labor force, with 3.0% or 9 of them being unemployed. The group with the highest labor force participation rate are those with the educational attainment of high school diploma, with 87.7% or 93 individuals in the labor force. Within the labor force, individuals with college / associate degree education have the highest percentage of unemployment, with 10.5% or 9 of them being unemployed.
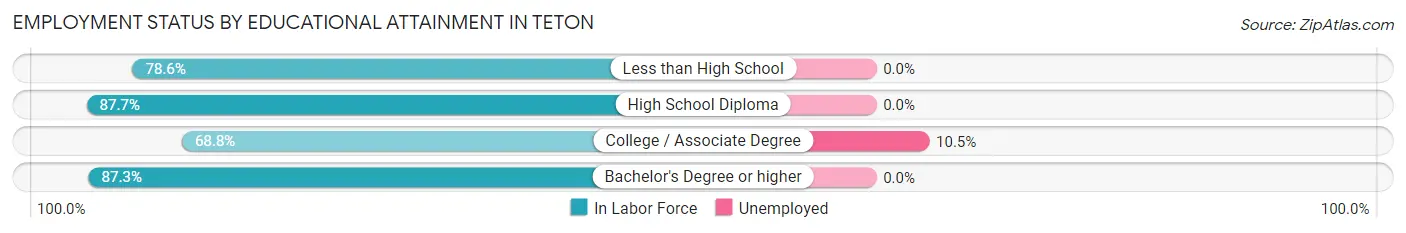
| Educational Attainment | In Labor Force | Unemployed |
| Less than High School | 77 (78.6%) | 0 (0.0%) |
| High School Diploma | 93 (87.7%) | 0 (0.0%) |
| College / Associate Degree | 86 (68.8%) | 13 (10.5%) |
| Bachelor's Degree or higher | 48 (87.3%) | 0 (0.0%) |
| Total | 304 (79.2%) | 12 (3.0%) |
Employment Occupations by Sex in Teton
Management, Business, Science and Arts Occupations
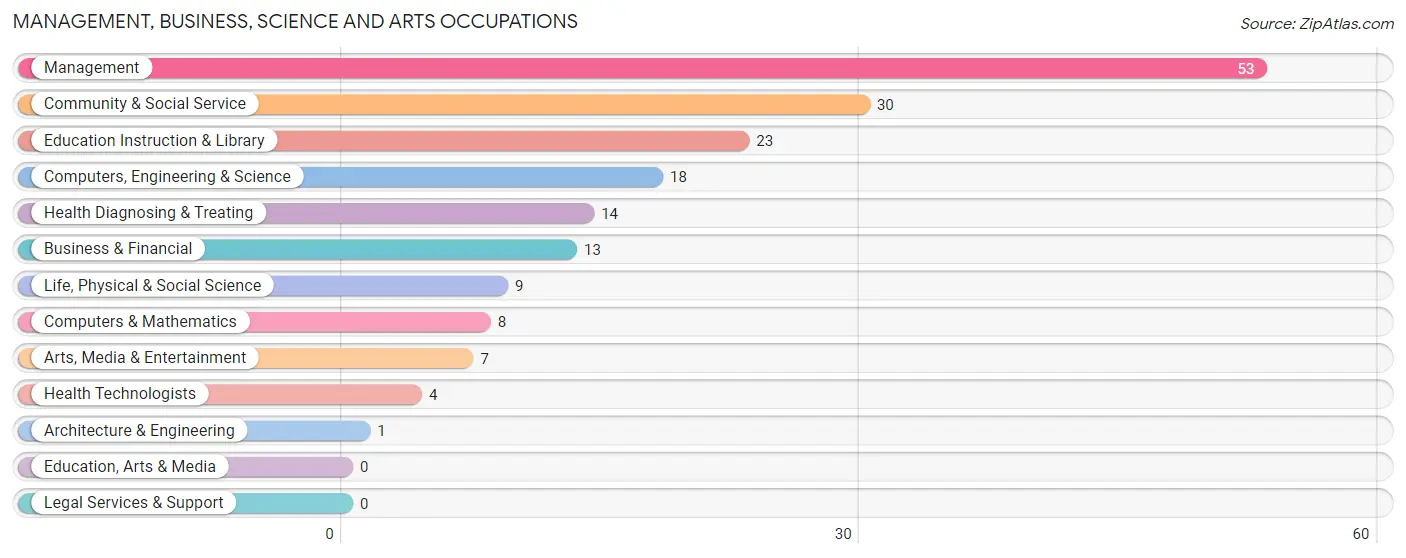
The most common Management, Business, Science and Arts occupations in Teton are Management (53 | 14.1%), Community & Social Service (30 | 8.0%), Education Instruction & Library (23 | 6.1%), Computers, Engineering & Science (18 | 4.8%), and Health Diagnosing & Treating (14 | 3.7%).
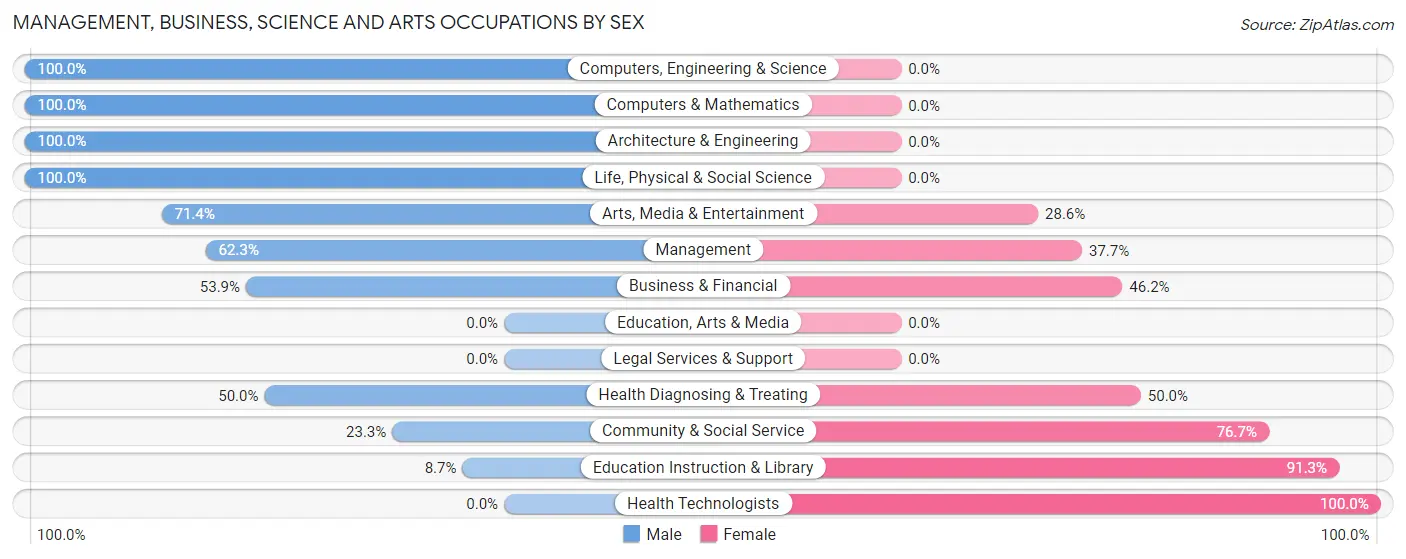
Management, Business, Science and Arts Occupations by Sex
Within the Management, Business, Science and Arts occupations in Teton, the most male-oriented occupations are Computers, Engineering & Science (100.0%), Computers & Mathematics (100.0%), and Architecture & Engineering (100.0%), while the most female-oriented occupations are Health Technologists (100.0%), Education Instruction & Library (91.3%), and Community & Social Service (76.7%).
| Occupation | Male | Female |
| Management | 33 (62.3%) | 20 (37.7%) |
| Business & Financial | 7 (53.8%) | 6 (46.2%) |
| Computers, Engineering & Science | 18 (100.0%) | 0 (0.0%) |
| Computers & Mathematics | 8 (100.0%) | 0 (0.0%) |
| Architecture & Engineering | 1 (100.0%) | 0 (0.0%) |
| Life, Physical & Social Science | 9 (100.0%) | 0 (0.0%) |
| Community & Social Service | 7 (23.3%) | 23 (76.7%) |
| Education, Arts & Media | 0 (0.0%) | 0 (0.0%) |
| Legal Services & Support | 0 (0.0%) | 0 (0.0%) |
| Education Instruction & Library | 2 (8.7%) | 21 (91.3%) |
| Arts, Media & Entertainment | 5 (71.4%) | 2 (28.6%) |
| Health Diagnosing & Treating | 7 (50.0%) | 7 (50.0%) |
| Health Technologists | 0 (0.0%) | 4 (100.0%) |
| Total (Category) | 72 (56.2%) | 56 (43.8%) |
| Total (Overall) | 203 (54.1%) | 172 (45.9%) |
Services Occupations
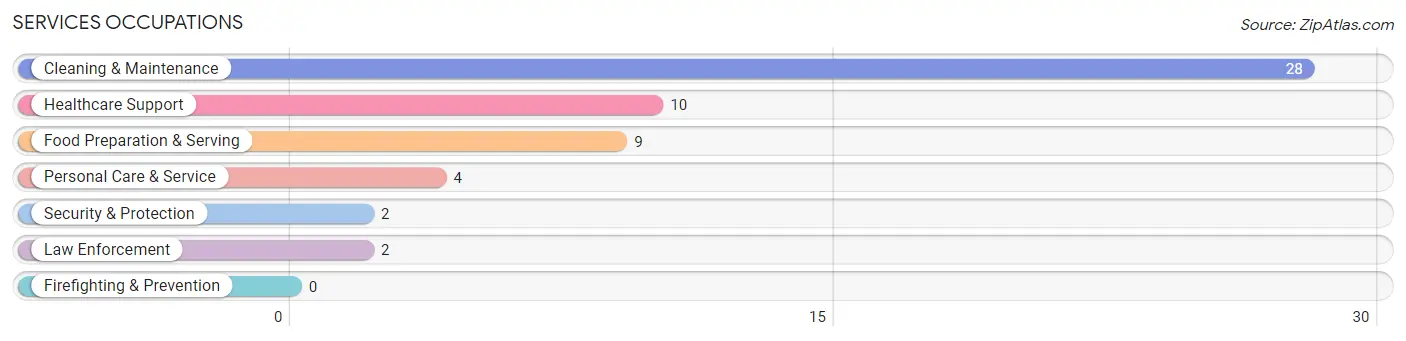
The most common Services occupations in Teton are Cleaning & Maintenance (28 | 7.5%), Healthcare Support (10 | 2.7%), Food Preparation & Serving (9 | 2.4%), Personal Care & Service (4 | 1.1%), and Security & Protection (2 | 0.5%).
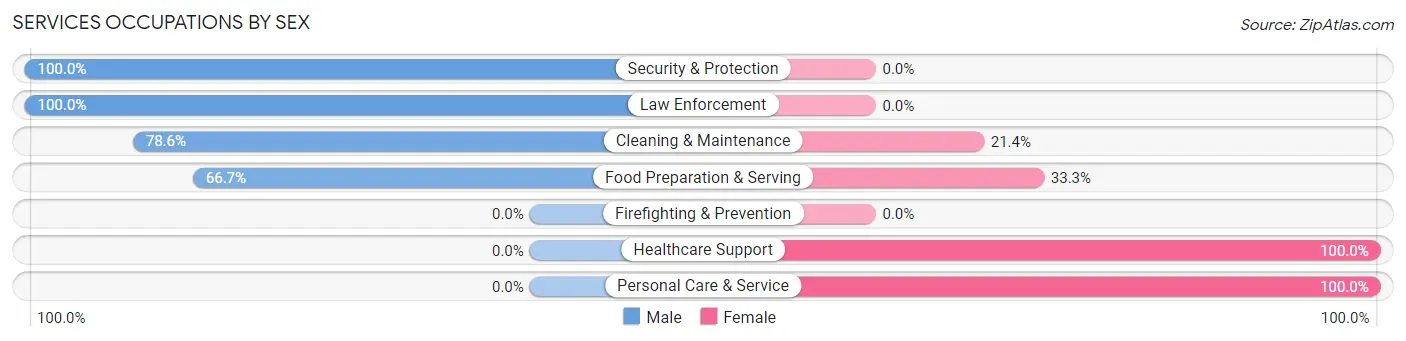
Services Occupations by Sex
Within the Services occupations in Teton, the most male-oriented occupations are Security & Protection (100.0%), Law Enforcement (100.0%), and Cleaning & Maintenance (78.6%), while the most female-oriented occupations are Healthcare Support (100.0%), Personal Care & Service (100.0%), and Food Preparation & Serving (33.3%).
| Occupation | Male | Female |
| Healthcare Support | 0 (0.0%) | 10 (100.0%) |
| Security & Protection | 2 (100.0%) | 0 (0.0%) |
| Firefighting & Prevention | 0 (0.0%) | 0 (0.0%) |
| Law Enforcement | 2 (100.0%) | 0 (0.0%) |
| Food Preparation & Serving | 6 (66.7%) | 3 (33.3%) |
| Cleaning & Maintenance | 22 (78.6%) | 6 (21.4%) |
| Personal Care & Service | 0 (0.0%) | 4 (100.0%) |
| Total (Category) | 30 (56.6%) | 23 (43.4%) |
| Total (Overall) | 203 (54.1%) | 172 (45.9%) |
Sales and Office Occupations
The most common Sales and Office occupations in Teton are Office & Administration (47 | 12.5%), and Sales & Related (18 | 4.8%).
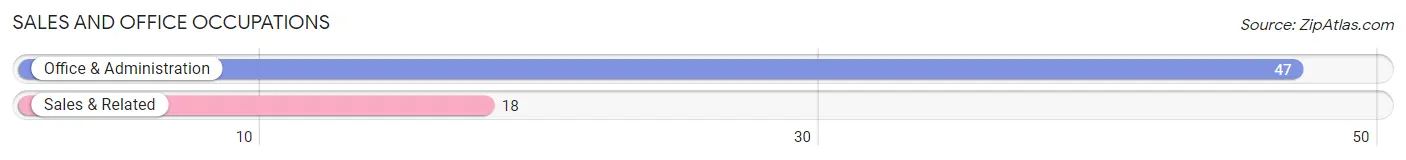
Sales and Office Occupations by Sex
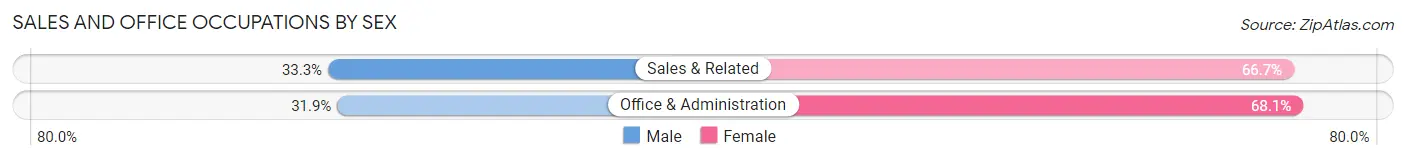
| Occupation | Male | Female |
| Sales & Related | 6 (33.3%) | 12 (66.7%) |
| Office & Administration | 15 (31.9%) | 32 (68.1%) |
| Total (Category) | 21 (32.3%) | 44 (67.7%) |
| Total (Overall) | 203 (54.1%) | 172 (45.9%) |
Natural Resources, Construction and Maintenance Occupations
The most common Natural Resources, Construction and Maintenance occupations in Teton are Construction & Extraction (39 | 10.4%), Installation, Maintenance & Repair (17 | 4.5%), and Farming, Fishing & Forestry (9 | 2.4%).
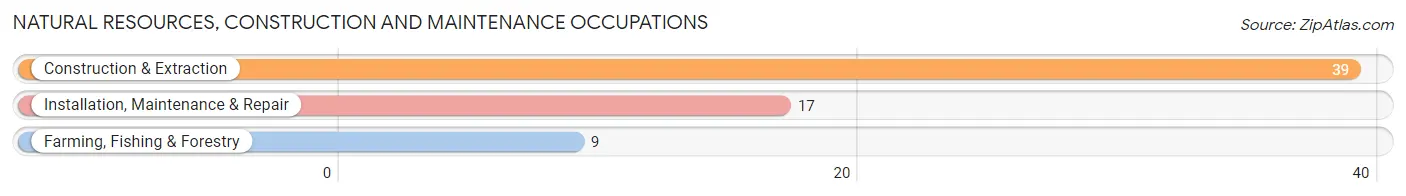
Natural Resources, Construction and Maintenance Occupations by Sex
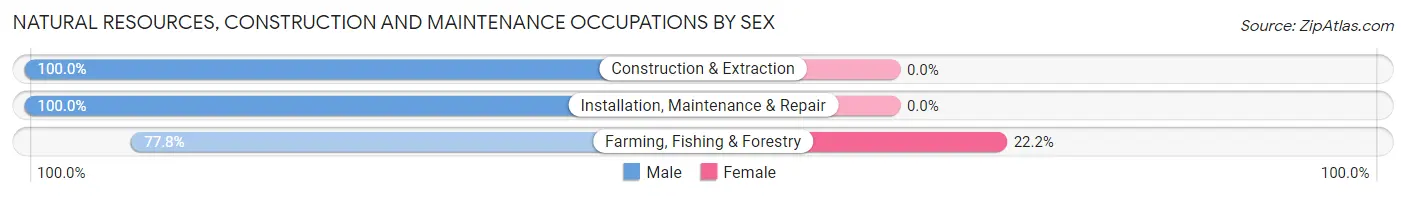
| Occupation | Male | Female |
| Farming, Fishing & Forestry | 7 (77.8%) | 2 (22.2%) |
| Construction & Extraction | 39 (100.0%) | 0 (0.0%) |
| Installation, Maintenance & Repair | 17 (100.0%) | 0 (0.0%) |
| Total (Category) | 63 (96.9%) | 2 (3.1%) |
| Total (Overall) | 203 (54.1%) | 172 (45.9%) |
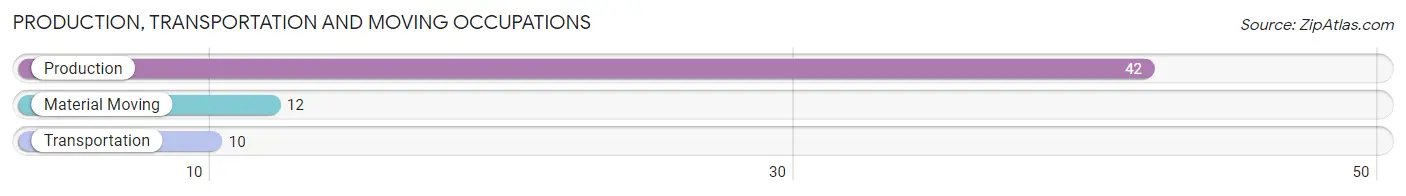
Production, Transportation and Moving Occupations
The most common Production, Transportation and Moving occupations in Teton are Production (42 | 11.2%), Material Moving (12 | 3.2%), and Transportation (10 | 2.7%).
Production, Transportation and Moving Occupations by Sex
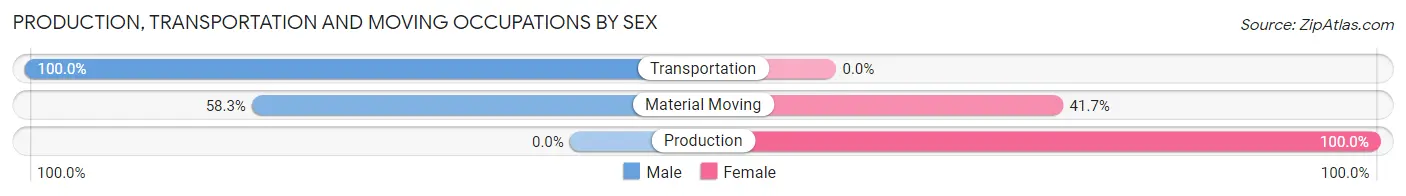
| Occupation | Male | Female |
| Production | 0 (0.0%) | 42 (100.0%) |
| Transportation | 10 (100.0%) | 0 (0.0%) |
| Material Moving | 7 (58.3%) | 5 (41.7%) |
| Total (Category) | 17 (26.6%) | 47 (73.4%) |
| Total (Overall) | 203 (54.1%) | 172 (45.9%) |
Employment Industries by Sex in Teton
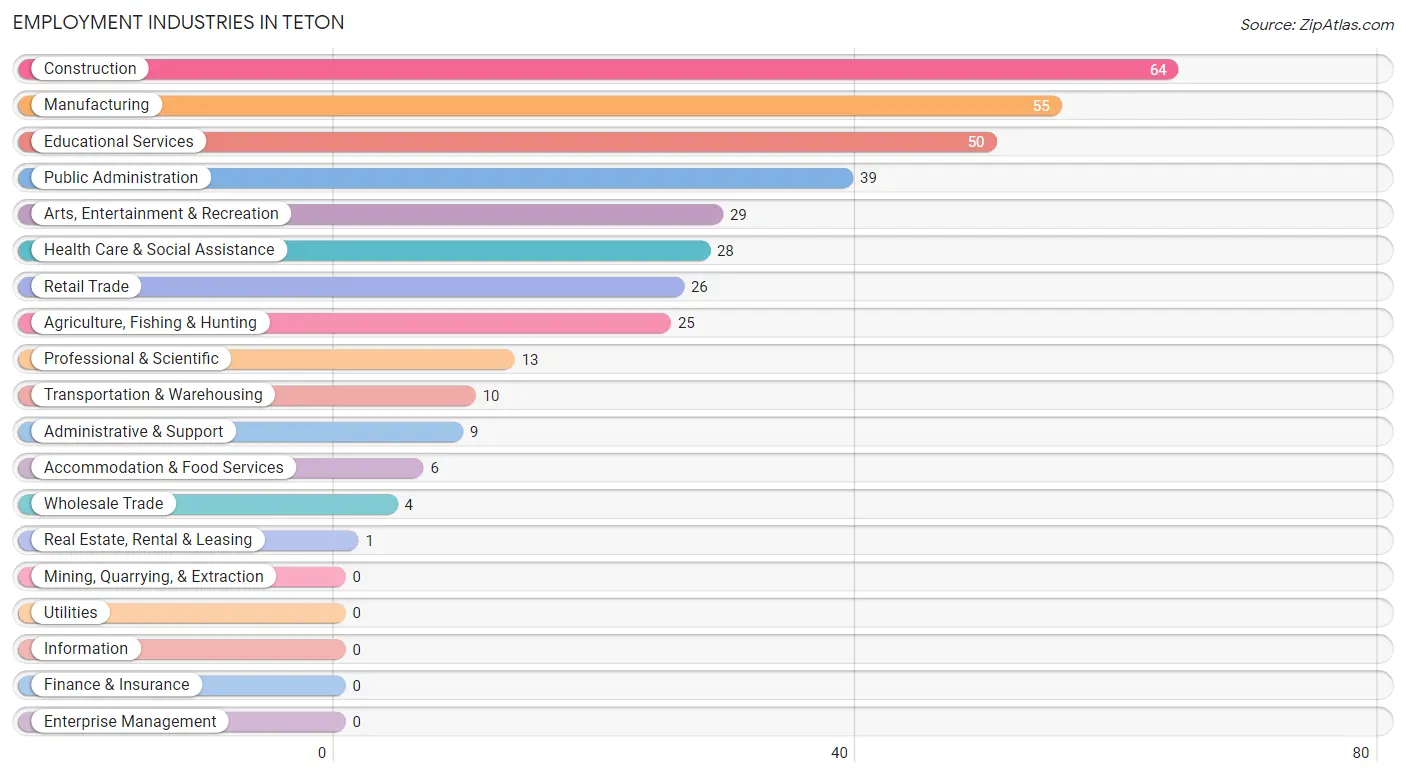
Employment Industries in Teton
The major employment industries in Teton include Construction (64 | 17.1%), Manufacturing (55 | 14.7%), Educational Services (50 | 13.3%), Public Administration (39 | 10.4%), and Arts, Entertainment & Recreation (29 | 7.7%).
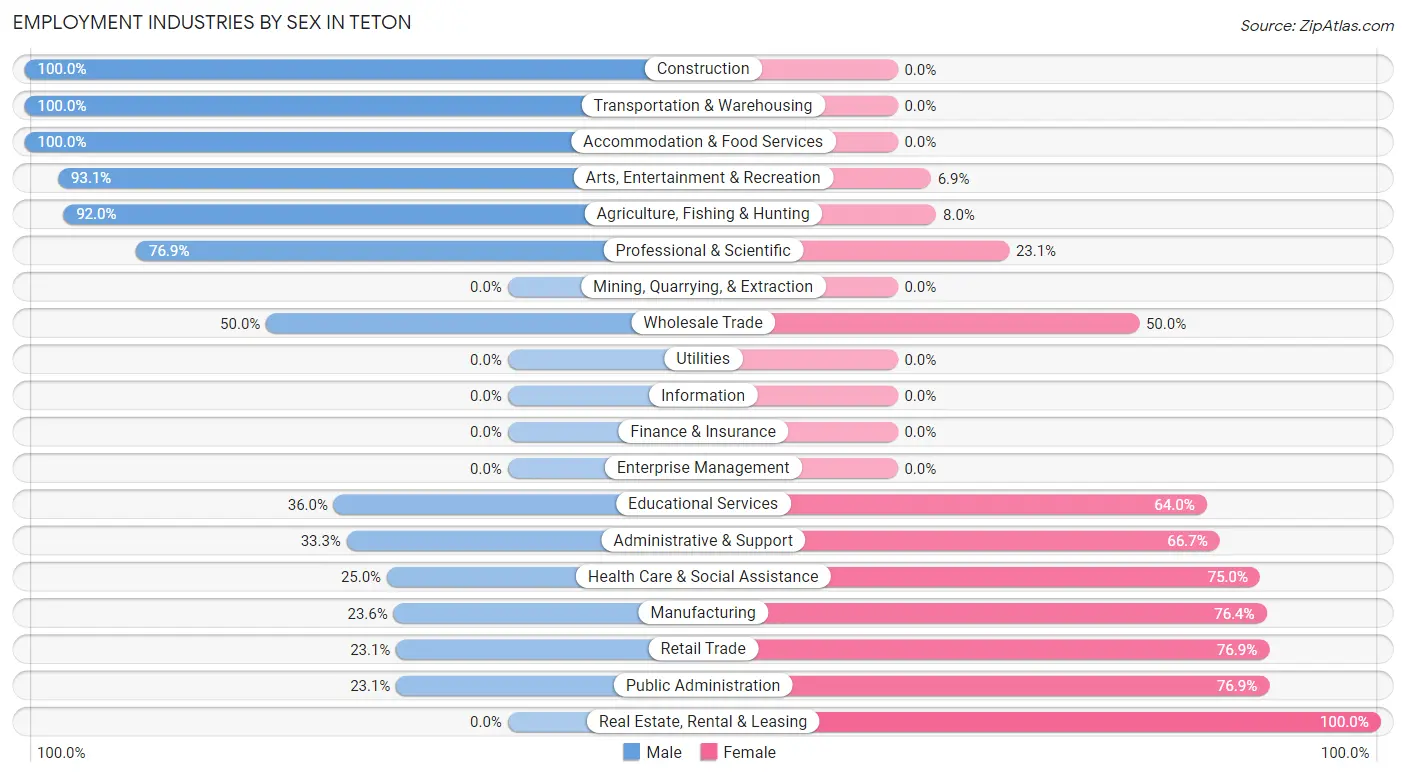
Employment Industries by Sex in Teton
The Teton industries that see more men than women are Construction (100.0%), Transportation & Warehousing (100.0%), and Accommodation & Food Services (100.0%), whereas the industries that tend to have a higher number of women are Real Estate, Rental & Leasing (100.0%), Retail Trade (76.9%), and Public Administration (76.9%).
| Industry | Male | Female |
| Agriculture, Fishing & Hunting | 23 (92.0%) | 2 (8.0%) |
| Mining, Quarrying, & Extraction | 0 (0.0%) | 0 (0.0%) |
| Construction | 64 (100.0%) | 0 (0.0%) |
| Manufacturing | 13 (23.6%) | 42 (76.4%) |
| Wholesale Trade | 2 (50.0%) | 2 (50.0%) |
| Retail Trade | 6 (23.1%) | 20 (76.9%) |
| Transportation & Warehousing | 10 (100.0%) | 0 (0.0%) |
| Utilities | 0 (0.0%) | 0 (0.0%) |
| Information | 0 (0.0%) | 0 (0.0%) |
| Finance & Insurance | 0 (0.0%) | 0 (0.0%) |
| Real Estate, Rental & Leasing | 0 (0.0%) | 1 (100.0%) |
| Professional & Scientific | 10 (76.9%) | 3 (23.1%) |
| Enterprise Management | 0 (0.0%) | 0 (0.0%) |
| Administrative & Support | 3 (33.3%) | 6 (66.7%) |
| Educational Services | 18 (36.0%) | 32 (64.0%) |
| Health Care & Social Assistance | 7 (25.0%) | 21 (75.0%) |
| Arts, Entertainment & Recreation | 27 (93.1%) | 2 (6.9%) |
| Accommodation & Food Services | 6 (100.0%) | 0 (0.0%) |
| Public Administration | 9 (23.1%) | 30 (76.9%) |
| Total | 203 (54.1%) | 172 (45.9%) |
Education in Teton
School Enrollment in Teton
The most common levels of schooling among the 229 students in Teton are middle school (71 | 31.0%), elementary school (47 | 20.5%), and college / undergraduate (47 | 20.5%).
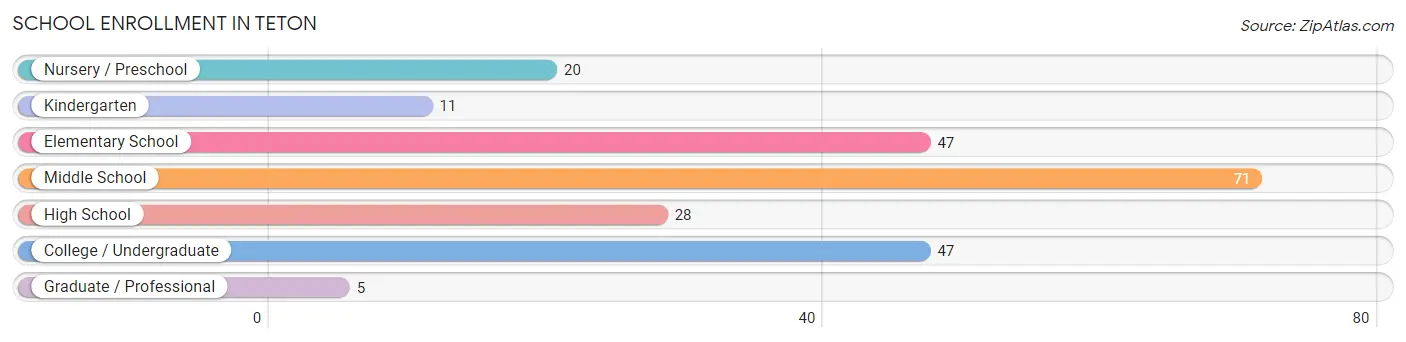
| School Level | # Students | % Students |
| Nursery / Preschool | 20 | 8.7% |
| Kindergarten | 11 | 4.8% |
| Elementary School | 47 | 20.5% |
| Middle School | 71 | 31.0% |
| High School | 28 | 12.2% |
| College / Undergraduate | 47 | 20.5% |
| Graduate / Professional | 5 | 2.2% |
| Total | 229 | 100.0% |
School Enrollment by Age by Funding Source in Teton
Out of a total of 229 students who are enrolled in schools in Teton, 26 (11.4%) attend a private institution, while the remaining 203 (88.6%) are enrolled in public schools. The age group of 20 to 24 year olds has the highest likelihood of being enrolled in private schools, with 26 (81.2% in the age bracket) enrolled. Conversely, the age group of 3 to 4 year olds has the lowest likelihood of being enrolled in a private school, with 11 (100.0% in the age bracket) attending a public institution.
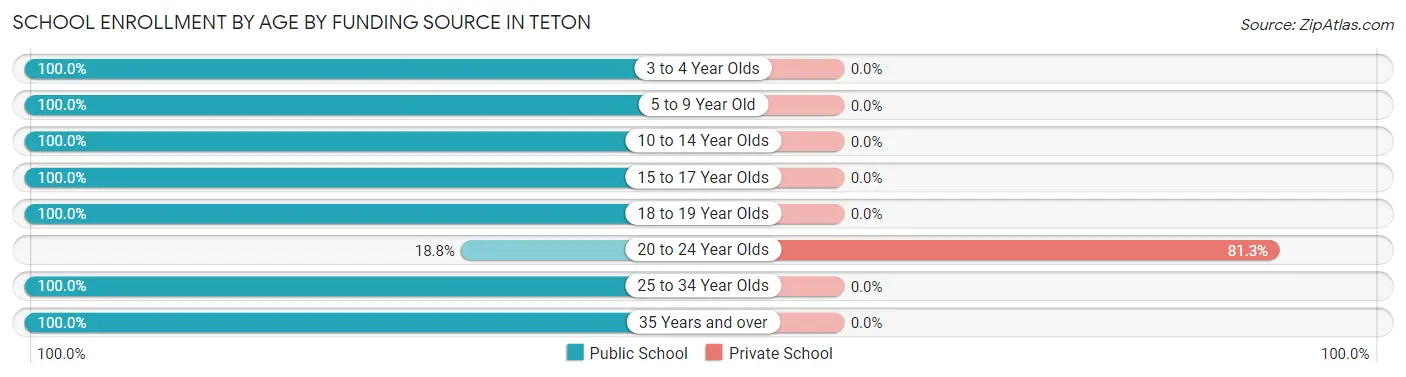
| Age Bracket | Public School | Private School |
| 3 to 4 Year Olds | 11 (100.0%) | 0 (0.0%) |
| 5 to 9 Year Old | 64 (100.0%) | 0 (0.0%) |
| 10 to 14 Year Olds | 74 (100.0%) | 0 (0.0%) |
| 15 to 17 Year Olds | 12 (100.0%) | 0 (0.0%) |
| 18 to 19 Year Olds | 16 (100.0%) | 0 (0.0%) |
| 20 to 24 Year Olds | 6 (18.8%) | 26 (81.2%) |
| 25 to 34 Year Olds | 15 (100.0%) | 0 (0.0%) |
| 35 Years and over | 5 (100.0%) | 0 (0.0%) |
| Total | 203 (88.6%) | 26 (11.4%) |
Educational Attainment by Field of Study in Teton
Education (31 | 33.7%), science & technology (17 | 18.5%), social sciences (12 | 13.0%), visual & performing arts (11 | 12.0%), and literature & languages (7 | 7.6%) are the most common fields of study among 92 individuals in Teton who have obtained a bachelor's degree or higher.
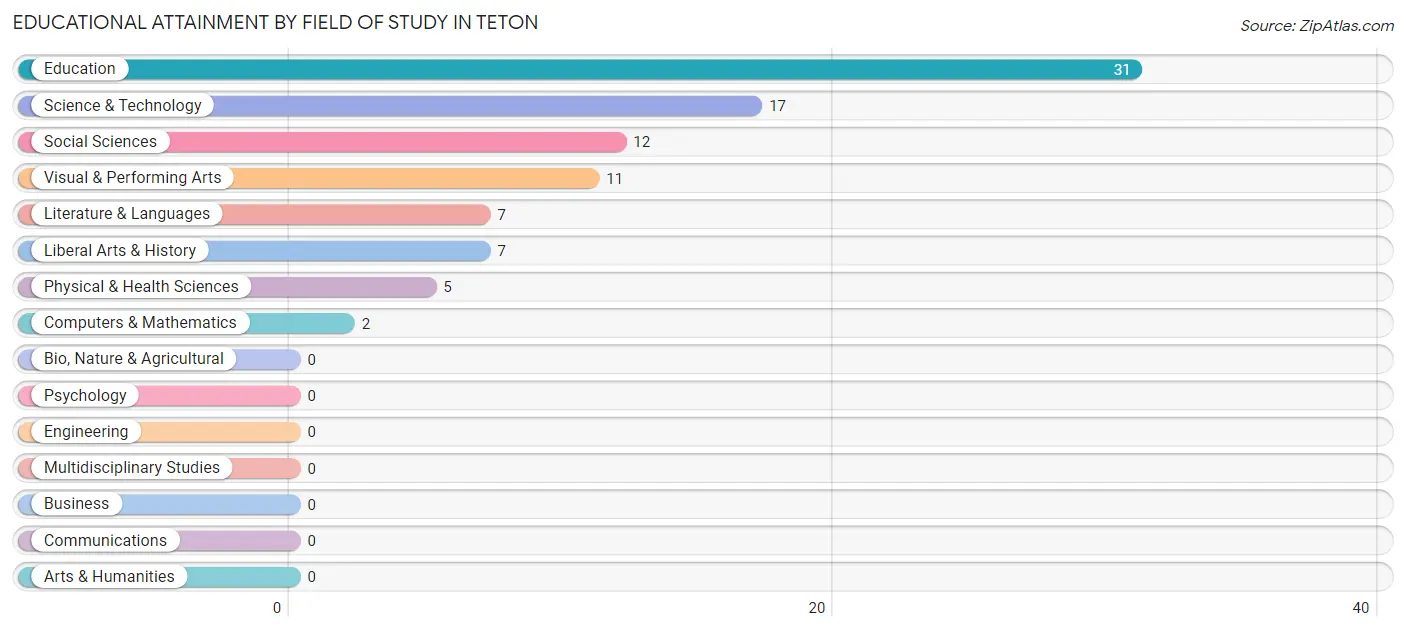
| Field of Study | # Graduates | % Graduates |
| Computers & Mathematics | 2 | 2.2% |
| Bio, Nature & Agricultural | 0 | 0.0% |
| Physical & Health Sciences | 5 | 5.4% |
| Psychology | 0 | 0.0% |
| Social Sciences | 12 | 13.0% |
| Engineering | 0 | 0.0% |
| Multidisciplinary Studies | 0 | 0.0% |
| Science & Technology | 17 | 18.5% |
| Business | 0 | 0.0% |
| Education | 31 | 33.7% |
| Literature & Languages | 7 | 7.6% |
| Liberal Arts & History | 7 | 7.6% |
| Visual & Performing Arts | 11 | 12.0% |
| Communications | 0 | 0.0% |
| Arts & Humanities | 0 | 0.0% |
| Total | 92 | 100.0% |
Transportation & Commute in Teton
Vehicle Availability by Sex in Teton
The most prevalent vehicle ownership categories in Teton are males with 3 vehicles (108, accounting for 53.2%) and females with 3 vehicles (70, making up 62.8%).
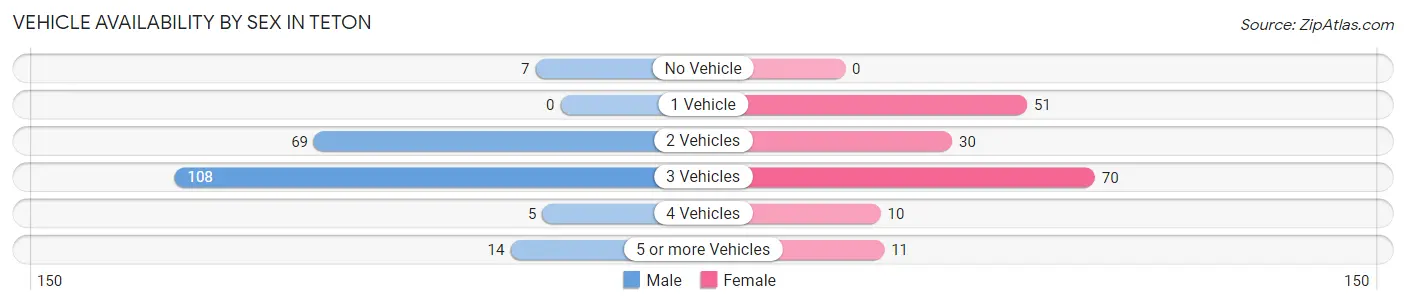
| Vehicles Available | Male | Female |
| No Vehicle | 7 (3.5%) | 0 (0.0%) |
| 1 Vehicle | 0 (0.0%) | 51 (29.6%) |
| 2 Vehicles | 69 (34.0%) | 30 (17.4%) |
| 3 Vehicles | 108 (53.2%) | 70 (40.7%) |
| 4 Vehicles | 5 (2.5%) | 10 (5.8%) |
| 5 or more Vehicles | 14 (6.9%) | 11 (6.4%) |
| Total | 203 (100.0%) | 172 (100.0%) |
Commute Time in Teton
The most frequently occuring commute durations in Teton are 15 to 19 minutes (103 commuters, 31.1%), 10 to 14 minutes (71 commuters, 21.4%), and 45 to 59 minutes (51 commuters, 15.4%).
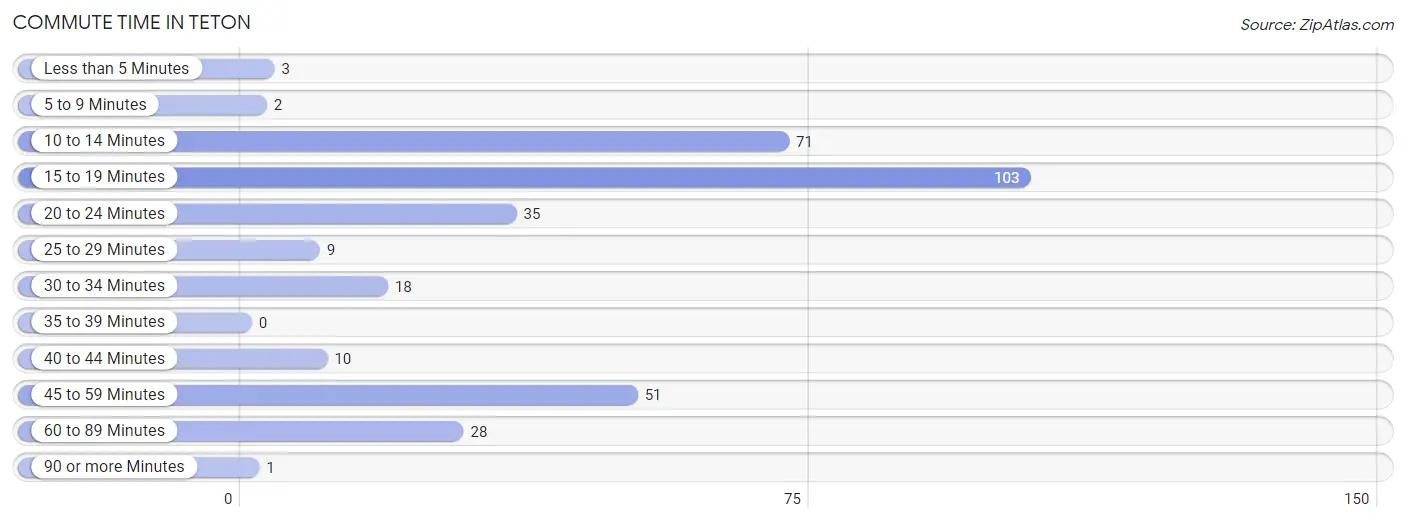
| Commute Time | # Commuters | % Commuters |
| Less than 5 Minutes | 3 | 0.9% |
| 5 to 9 Minutes | 2 | 0.6% |
| 10 to 14 Minutes | 71 | 21.4% |
| 15 to 19 Minutes | 103 | 31.1% |
| 20 to 24 Minutes | 35 | 10.6% |
| 25 to 29 Minutes | 9 | 2.7% |
| 30 to 34 Minutes | 18 | 5.4% |
| 35 to 39 Minutes | 0 | 0.0% |
| 40 to 44 Minutes | 10 | 3.0% |
| 45 to 59 Minutes | 51 | 15.4% |
| 60 to 89 Minutes | 28 | 8.5% |
| 90 or more Minutes | 1 | 0.3% |
Commute Time by Sex in Teton
The most common commute times in Teton are 10 to 14 minutes (58 commuters, 32.0%) for males and 15 to 19 minutes (82 commuters, 54.7%) for females.
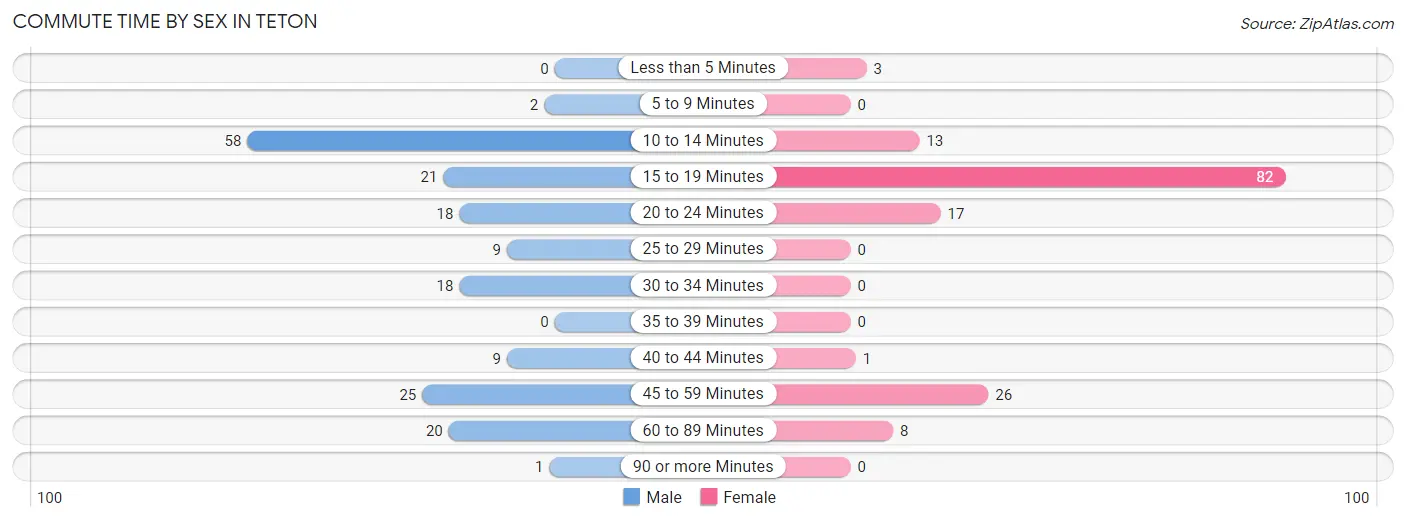
| Commute Time | Male | Female |
| Less than 5 Minutes | 0 (0.0%) | 3 (2.0%) |
| 5 to 9 Minutes | 2 (1.1%) | 0 (0.0%) |
| 10 to 14 Minutes | 58 (32.0%) | 13 (8.7%) |
| 15 to 19 Minutes | 21 (11.6%) | 82 (54.7%) |
| 20 to 24 Minutes | 18 (9.9%) | 17 (11.3%) |
| 25 to 29 Minutes | 9 (5.0%) | 0 (0.0%) |
| 30 to 34 Minutes | 18 (9.9%) | 0 (0.0%) |
| 35 to 39 Minutes | 0 (0.0%) | 0 (0.0%) |
| 40 to 44 Minutes | 9 (5.0%) | 1 (0.7%) |
| 45 to 59 Minutes | 25 (13.8%) | 26 (17.3%) |
| 60 to 89 Minutes | 20 (11.1%) | 8 (5.3%) |
| 90 or more Minutes | 1 (0.5%) | 0 (0.0%) |
Time of Departure to Work by Sex in Teton
The most frequent times of departure to work in Teton are 6:30 AM to 6:59 AM (47, 26.0%) for males and 6:00 AM to 6:29 AM (40, 26.7%) for females.
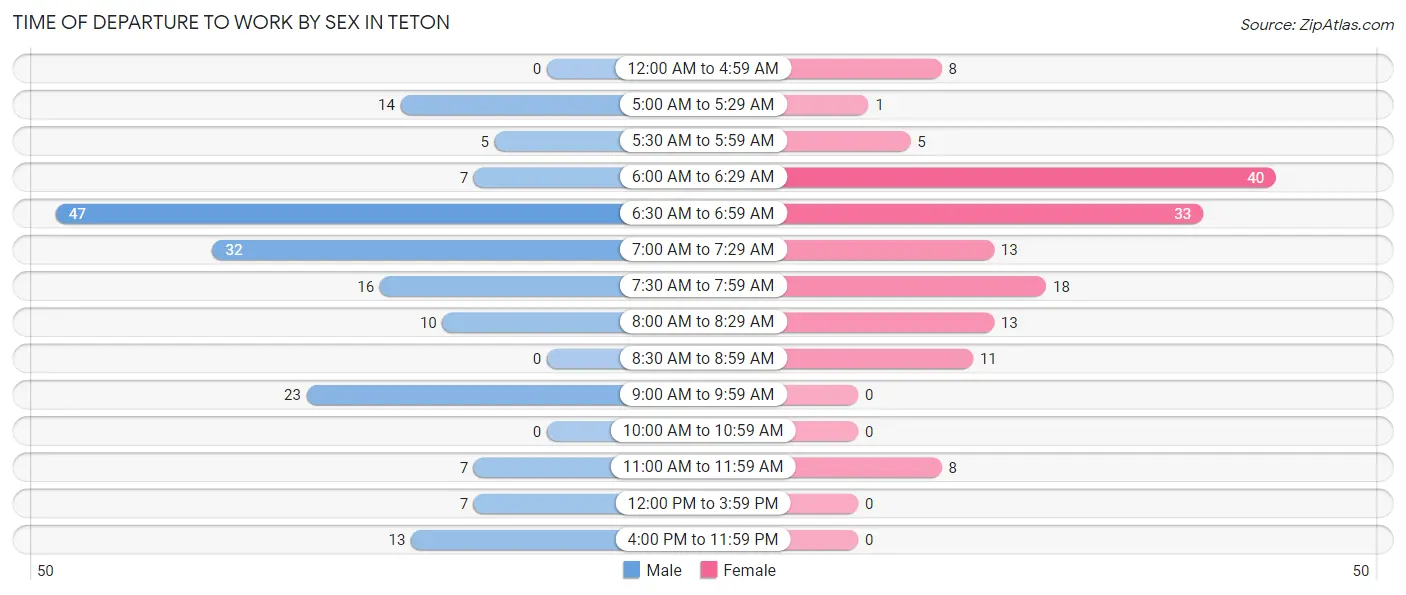
| Time of Departure | Male | Female |
| 12:00 AM to 4:59 AM | 0 (0.0%) | 8 (5.3%) |
| 5:00 AM to 5:29 AM | 14 (7.7%) | 1 (0.7%) |
| 5:30 AM to 5:59 AM | 5 (2.8%) | 5 (3.3%) |
| 6:00 AM to 6:29 AM | 7 (3.9%) | 40 (26.7%) |
| 6:30 AM to 6:59 AM | 47 (26.0%) | 33 (22.0%) |
| 7:00 AM to 7:29 AM | 32 (17.7%) | 13 (8.7%) |
| 7:30 AM to 7:59 AM | 16 (8.8%) | 18 (12.0%) |
| 8:00 AM to 8:29 AM | 10 (5.5%) | 13 (8.7%) |
| 8:30 AM to 8:59 AM | 0 (0.0%) | 11 (7.3%) |
| 9:00 AM to 9:59 AM | 23 (12.7%) | 0 (0.0%) |
| 10:00 AM to 10:59 AM | 0 (0.0%) | 0 (0.0%) |
| 11:00 AM to 11:59 AM | 7 (3.9%) | 8 (5.3%) |
| 12:00 PM to 3:59 PM | 7 (3.9%) | 0 (0.0%) |
| 4:00 PM to 11:59 PM | 13 (7.2%) | 0 (0.0%) |
| Total | 181 (100.0%) | 150 (100.0%) |
Housing Occupancy in Teton
Occupancy by Ownership in Teton
Of the total 276 dwellings in Teton, owner-occupied units account for 242 (87.7%), while renter-occupied units make up 34 (12.3%).
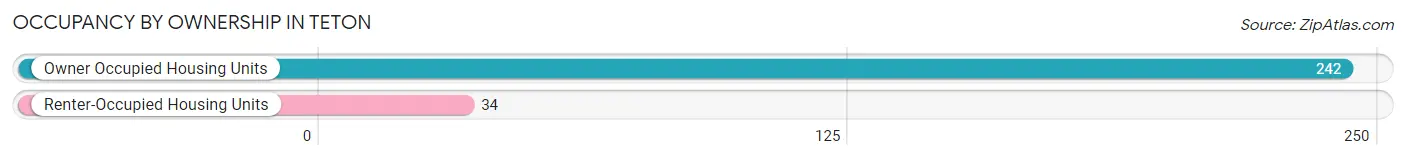
| Occupancy | # Housing Units | % Housing Units |
| Owner Occupied Housing Units | 242 | 87.7% |
| Renter-Occupied Housing Units | 34 | 12.3% |
| Total Occupied Housing Units | 276 | 100.0% |
Occupancy by Household Size in Teton
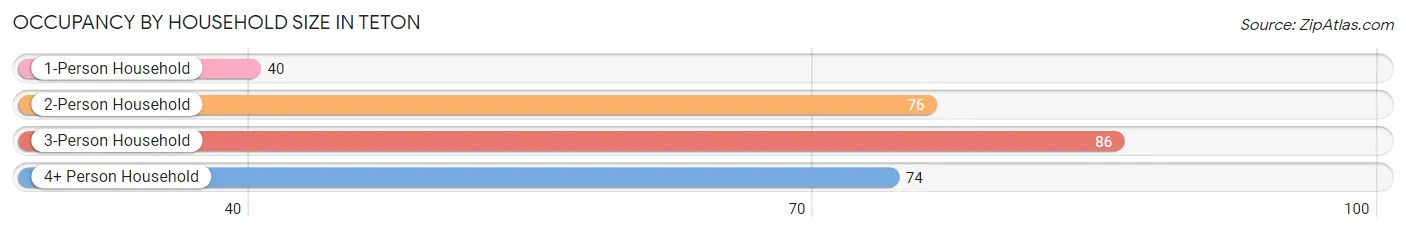
| Household Size | # Housing Units | % Housing Units |
| 1-Person Household | 40 | 14.5% |
| 2-Person Household | 76 | 27.5% |
| 3-Person Household | 86 | 31.2% |
| 4+ Person Household | 74 | 26.8% |
| Total Housing Units | 276 | 100.0% |
Occupancy by Ownership by Household Size in Teton
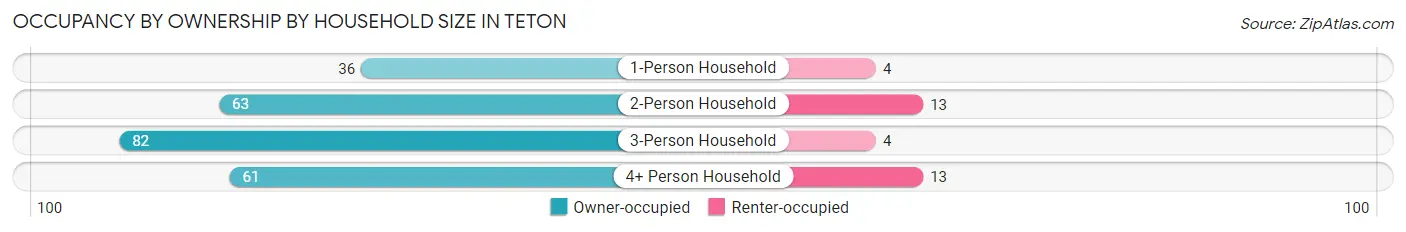
| Household Size | Owner-occupied | Renter-occupied |
| 1-Person Household | 36 (90.0%) | 4 (10.0%) |
| 2-Person Household | 63 (82.9%) | 13 (17.1%) |
| 3-Person Household | 82 (95.4%) | 4 (4.6%) |
| 4+ Person Household | 61 (82.4%) | 13 (17.6%) |
| Total Housing Units | 242 (87.7%) | 34 (12.3%) |
Occupancy by Educational Attainment in Teton
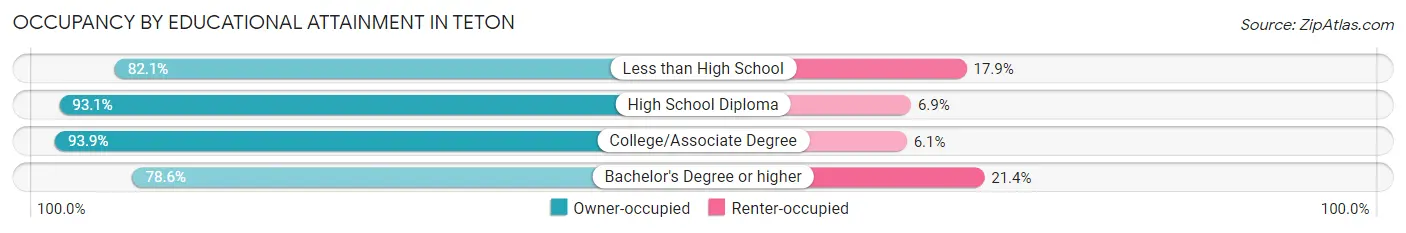
| Household Size | Owner-occupied | Renter-occupied |
| Less than High School | 55 (82.1%) | 12 (17.9%) |
| High School Diploma | 81 (93.1%) | 6 (6.9%) |
| College/Associate Degree | 62 (93.9%) | 4 (6.1%) |
| Bachelor's Degree or higher | 44 (78.6%) | 12 (21.4%) |
Occupancy by Age of Householder in Teton
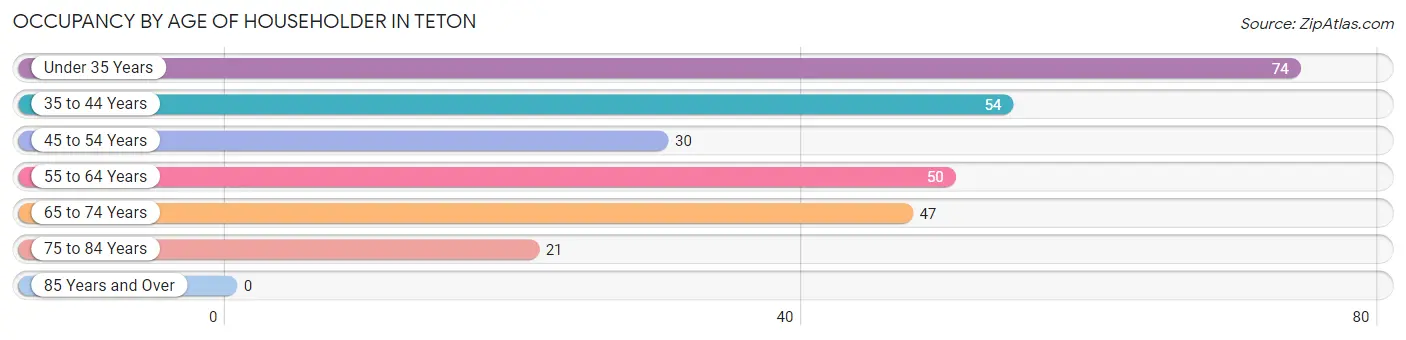
| Age Bracket | # Households | % Households |
| Under 35 Years | 74 | 26.8% |
| 35 to 44 Years | 54 | 19.6% |
| 45 to 54 Years | 30 | 10.9% |
| 55 to 64 Years | 50 | 18.1% |
| 65 to 74 Years | 47 | 17.0% |
| 75 to 84 Years | 21 | 7.6% |
| 85 Years and Over | 0 | 0.0% |
| Total | 276 | 100.0% |
Housing Finances in Teton
Median Income by Occupancy in Teton
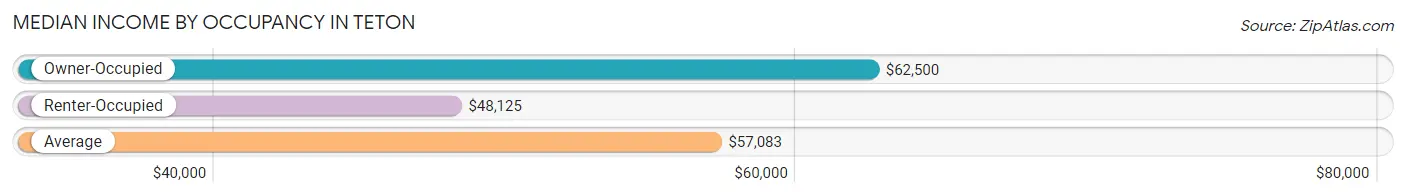
| Occupancy Type | # Households | Median Income |
| Owner-Occupied | 242 (87.7%) | $62,500 |
| Renter-Occupied | 34 (12.3%) | $48,125 |
| Average | 276 (100.0%) | $57,083 |
Occupancy by Householder Income Bracket in Teton
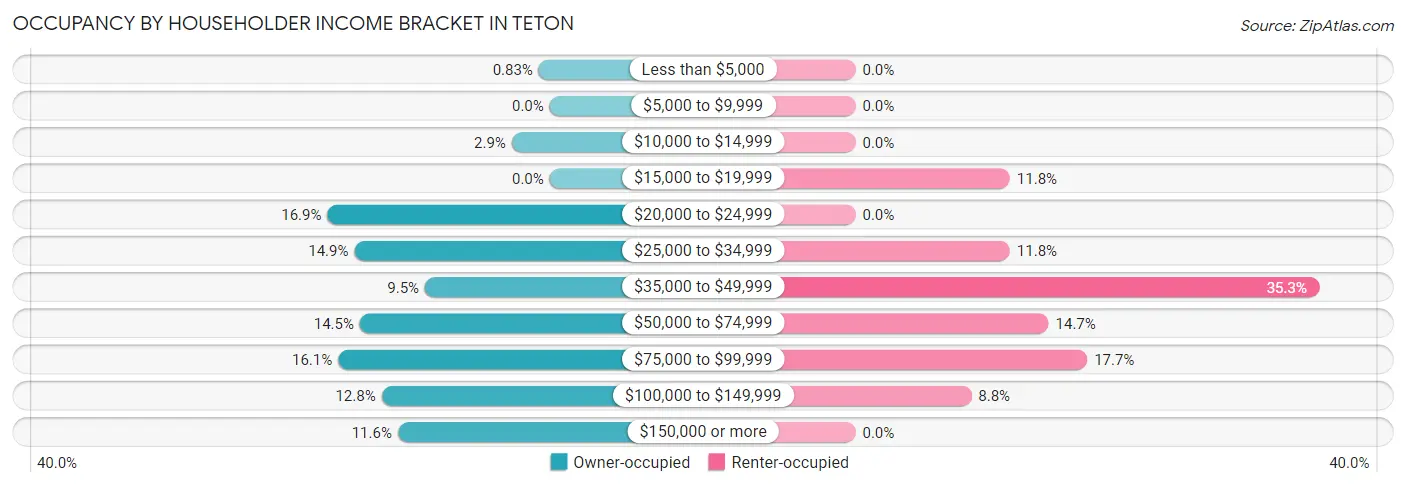
| Income Bracket | Owner-occupied | Renter-occupied |
| Less than $5,000 | 2 (0.8%) | 0 (0.0%) |
| $5,000 to $9,999 | 0 (0.0%) | 0 (0.0%) |
| $10,000 to $14,999 | 7 (2.9%) | 0 (0.0%) |
| $15,000 to $19,999 | 0 (0.0%) | 4 (11.8%) |
| $20,000 to $24,999 | 41 (16.9%) | 0 (0.0%) |
| $25,000 to $34,999 | 36 (14.9%) | 4 (11.8%) |
| $35,000 to $49,999 | 23 (9.5%) | 12 (35.3%) |
| $50,000 to $74,999 | 35 (14.5%) | 5 (14.7%) |
| $75,000 to $99,999 | 39 (16.1%) | 6 (17.6%) |
| $100,000 to $149,999 | 31 (12.8%) | 3 (8.8%) |
| $150,000 or more | 28 (11.6%) | 0 (0.0%) |
| Total | 242 (100.0%) | 34 (100.0%) |
Monthly Housing Cost Tiers in Teton
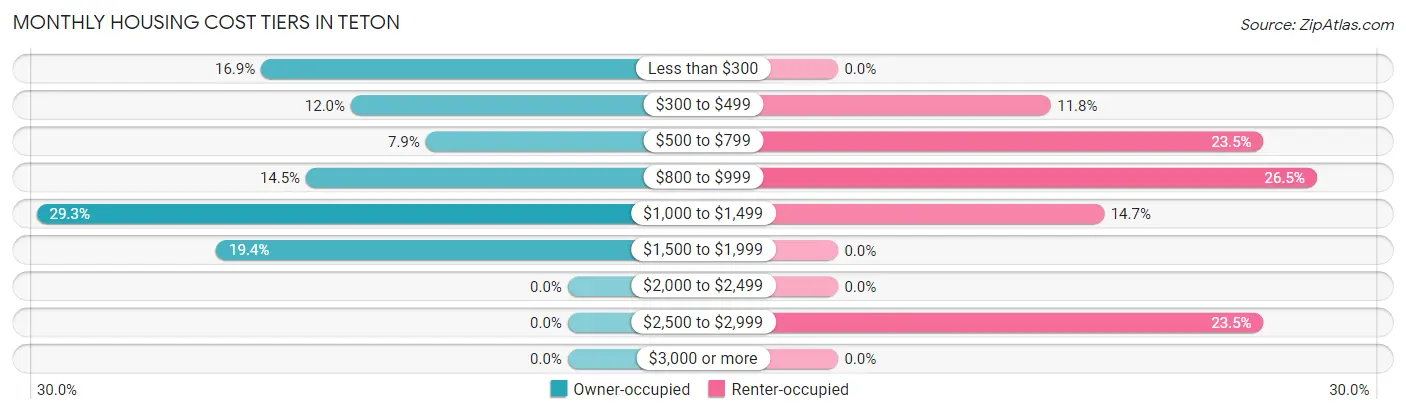
| Monthly Cost | Owner-occupied | Renter-occupied |
| Less than $300 | 41 (16.9%) | 0 (0.0%) |
| $300 to $499 | 29 (12.0%) | 4 (11.8%) |
| $500 to $799 | 19 (7.9%) | 8 (23.5%) |
| $800 to $999 | 35 (14.5%) | 9 (26.5%) |
| $1,000 to $1,499 | 71 (29.3%) | 5 (14.7%) |
| $1,500 to $1,999 | 47 (19.4%) | 0 (0.0%) |
| $2,000 to $2,499 | 0 (0.0%) | 0 (0.0%) |
| $2,500 to $2,999 | 0 (0.0%) | 8 (23.5%) |
| $3,000 or more | 0 (0.0%) | 0 (0.0%) |
| Total | 242 (100.0%) | 34 (100.0%) |
Physical Housing Characteristics in Teton
Housing Structures in Teton
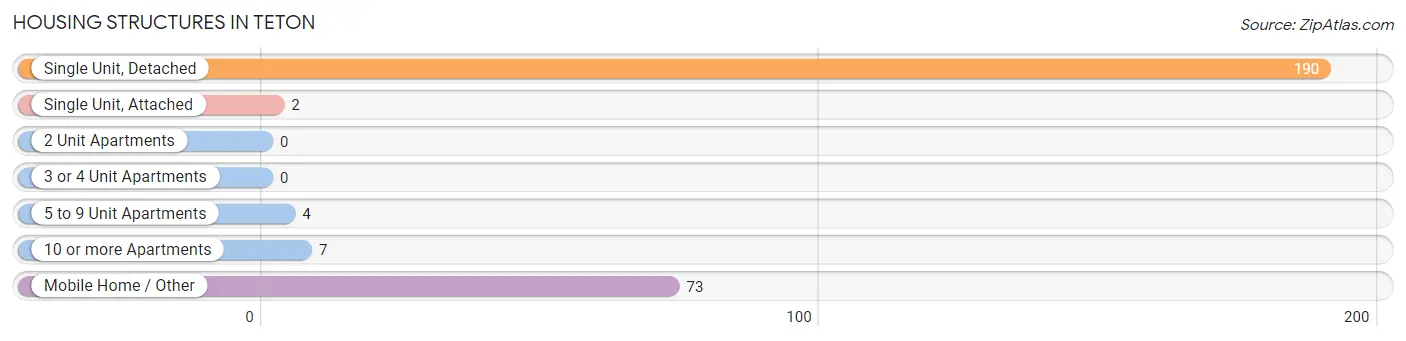
| Structure Type | # Housing Units | % Housing Units |
| Single Unit, Detached | 190 | 68.8% |
| Single Unit, Attached | 2 | 0.7% |
| 2 Unit Apartments | 0 | 0.0% |
| 3 or 4 Unit Apartments | 0 | 0.0% |
| 5 to 9 Unit Apartments | 4 | 1.5% |
| 10 or more Apartments | 7 | 2.5% |
| Mobile Home / Other | 73 | 26.5% |
| Total | 276 | 100.0% |
Housing Structures by Occupancy in Teton
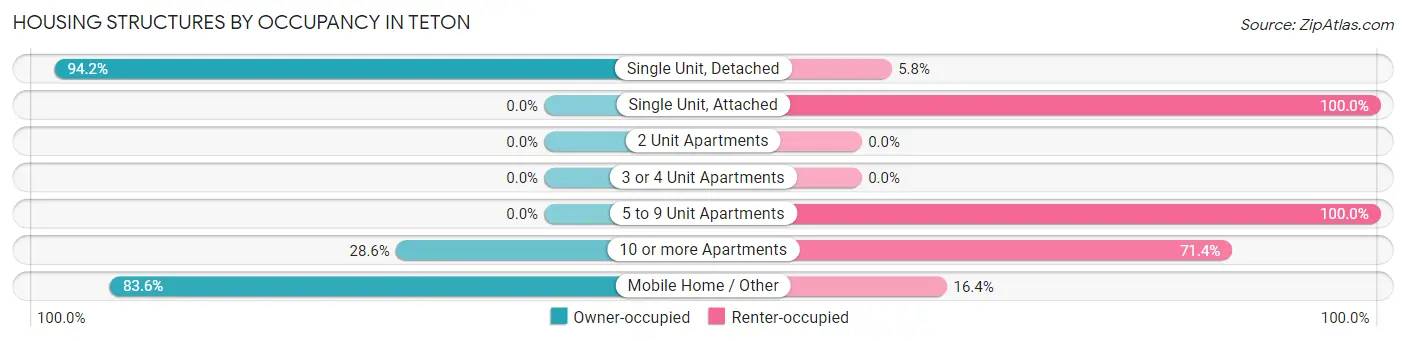
| Structure Type | Owner-occupied | Renter-occupied |
| Single Unit, Detached | 179 (94.2%) | 11 (5.8%) |
| Single Unit, Attached | 0 (0.0%) | 2 (100.0%) |
| 2 Unit Apartments | 0 (0.0%) | 0 (0.0%) |
| 3 or 4 Unit Apartments | 0 (0.0%) | 0 (0.0%) |
| 5 to 9 Unit Apartments | 0 (0.0%) | 4 (100.0%) |
| 10 or more Apartments | 2 (28.6%) | 5 (71.4%) |
| Mobile Home / Other | 61 (83.6%) | 12 (16.4%) |
| Total | 242 (87.7%) | 34 (12.3%) |
Housing Structures by Number of Rooms in Teton
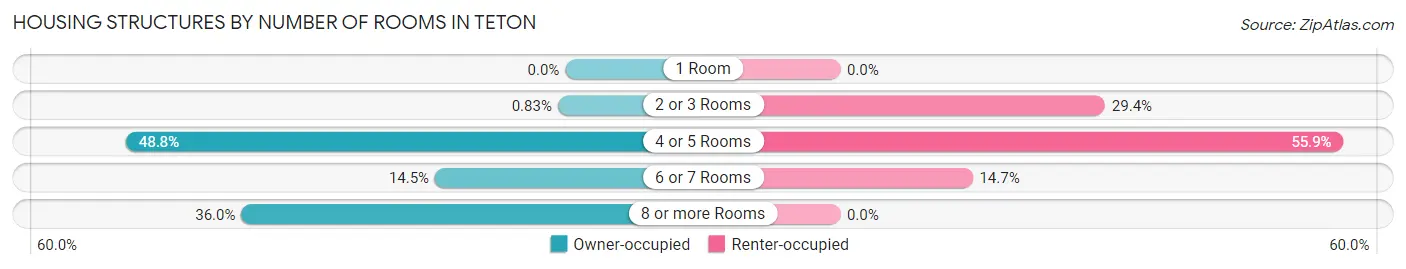
| Number of Rooms | Owner-occupied | Renter-occupied |
| 1 Room | 0 (0.0%) | 0 (0.0%) |
| 2 or 3 Rooms | 2 (0.8%) | 10 (29.4%) |
| 4 or 5 Rooms | 118 (48.8%) | 19 (55.9%) |
| 6 or 7 Rooms | 35 (14.5%) | 5 (14.7%) |
| 8 or more Rooms | 87 (35.9%) | 0 (0.0%) |
| Total | 242 (100.0%) | 34 (100.0%) |
Housing Structure by Heating Type in Teton
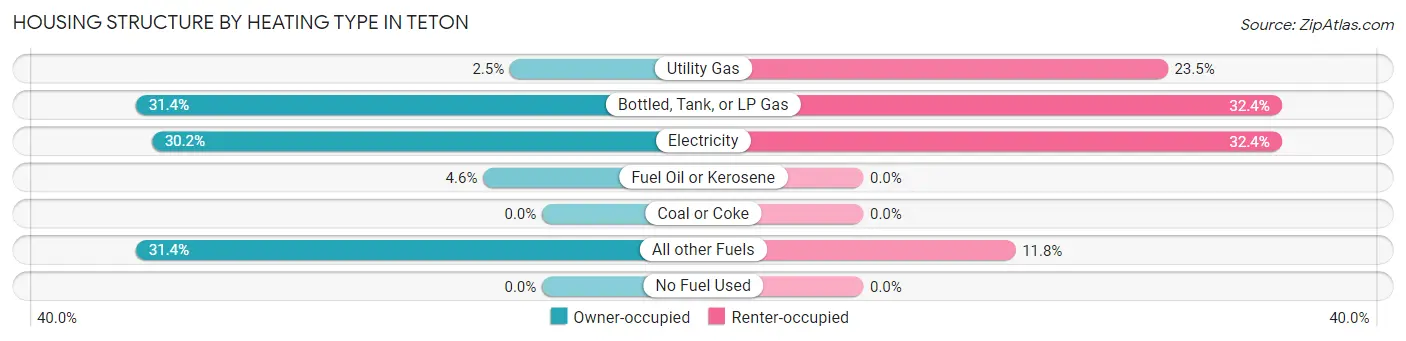
| Heating Type | Owner-occupied | Renter-occupied |
| Utility Gas | 6 (2.5%) | 8 (23.5%) |
| Bottled, Tank, or LP Gas | 76 (31.4%) | 11 (32.4%) |
| Electricity | 73 (30.2%) | 11 (32.4%) |
| Fuel Oil or Kerosene | 11 (4.5%) | 0 (0.0%) |
| Coal or Coke | 0 (0.0%) | 0 (0.0%) |
| All other Fuels | 76 (31.4%) | 4 (11.8%) |
| No Fuel Used | 0 (0.0%) | 0 (0.0%) |
| Total | 242 (100.0%) | 34 (100.0%) |
Household Vehicle Usage in Teton
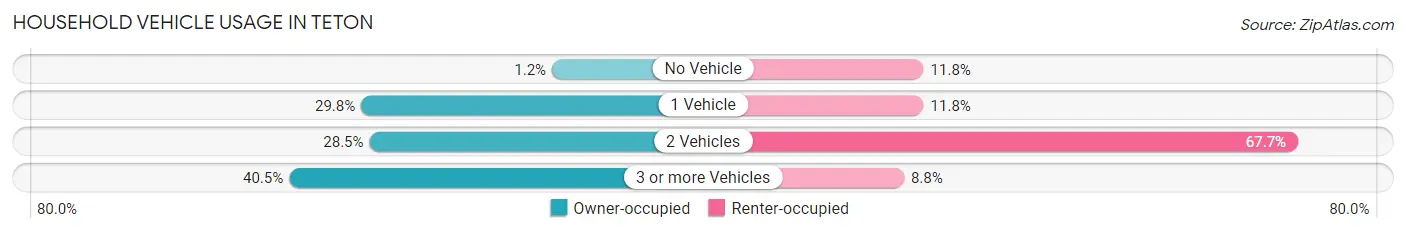
| Vehicles per Household | Owner-occupied | Renter-occupied |
| No Vehicle | 3 (1.2%) | 4 (11.8%) |
| 1 Vehicle | 72 (29.7%) | 4 (11.8%) |
| 2 Vehicles | 69 (28.5%) | 23 (67.6%) |
| 3 or more Vehicles | 98 (40.5%) | 3 (8.8%) |
| Total | 242 (100.0%) | 34 (100.0%) |
Real Estate & Mortgages in Teton
Real Estate and Mortgage Overview in Teton
| Characteristic | Without Mortgage | With Mortgage |
| Housing Units | 92 | 150 |
| Median Property Value | - | - |
| Median Household Income | $24,756 | $20 |
| Monthly Housing Costs | $358 | $0 |
| Real Estate Taxes | $1,255 | $0 |
Property Value by Mortgage Status in Teton
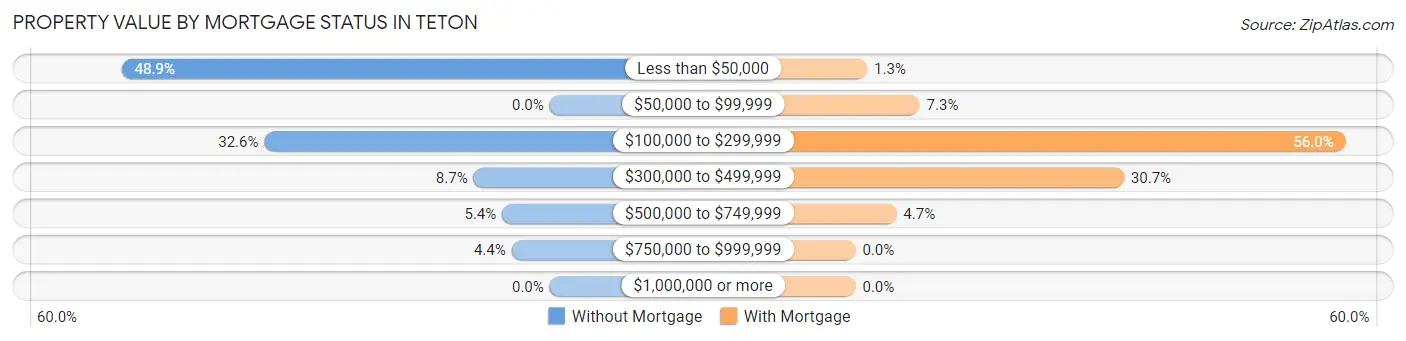
| Property Value | Without Mortgage | With Mortgage |
| Less than $50,000 | 45 (48.9%) | 2 (1.3%) |
| $50,000 to $99,999 | 0 (0.0%) | 11 (7.3%) |
| $100,000 to $299,999 | 30 (32.6%) | 84 (56.0%) |
| $300,000 to $499,999 | 8 (8.7%) | 46 (30.7%) |
| $500,000 to $749,999 | 5 (5.4%) | 7 (4.7%) |
| $750,000 to $999,999 | 4 (4.3%) | 0 (0.0%) |
| $1,000,000 or more | 0 (0.0%) | 0 (0.0%) |
| Total | 92 (100.0%) | 150 (100.0%) |
Household Income by Mortgage Status in Teton
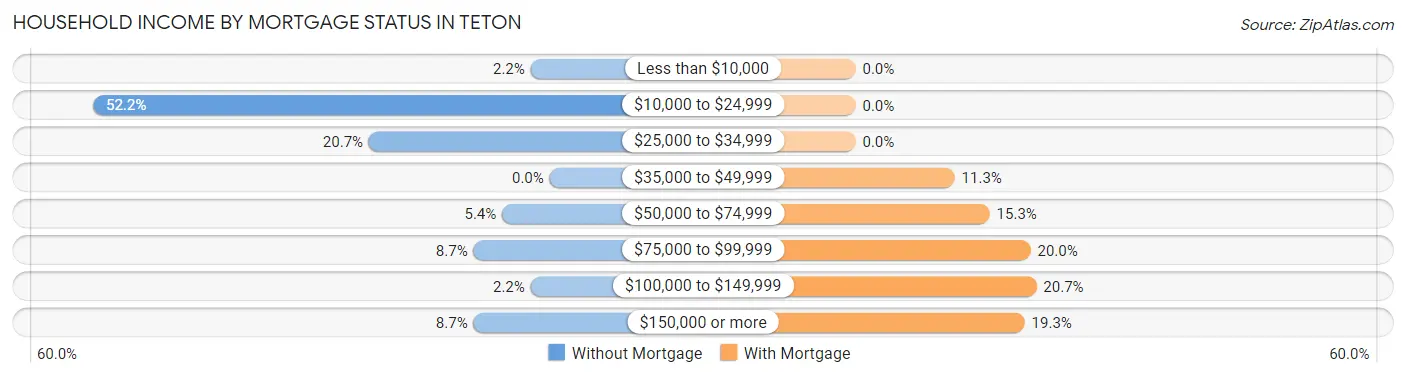
| Household Income | Without Mortgage | With Mortgage |
| Less than $10,000 | 2 (2.2%) | 0 (0.0%) |
| $10,000 to $24,999 | 48 (52.2%) | 0 (0.0%) |
| $25,000 to $34,999 | 19 (20.6%) | 0 (0.0%) |
| $35,000 to $49,999 | 0 (0.0%) | 17 (11.3%) |
| $50,000 to $74,999 | 5 (5.4%) | 23 (15.3%) |
| $75,000 to $99,999 | 8 (8.7%) | 30 (20.0%) |
| $100,000 to $149,999 | 2 (2.2%) | 31 (20.7%) |
| $150,000 or more | 8 (8.7%) | 29 (19.3%) |
| Total | 92 (100.0%) | 150 (100.0%) |
Property Value to Household Income Ratio in Teton
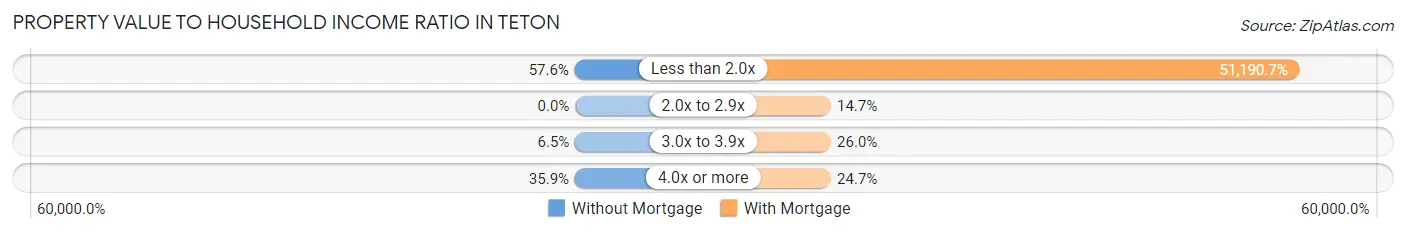
| Value-to-Income Ratio | Without Mortgage | With Mortgage |
| Less than 2.0x | 53 (57.6%) | 76,786 (51,190.7%) |
| 2.0x to 2.9x | 0 (0.0%) | 22 (14.7%) |
| 3.0x to 3.9x | 6 (6.5%) | 39 (26.0%) |
| 4.0x or more | 33 (35.9%) | 37 (24.7%) |
| Total | 92 (100.0%) | 150 (100.0%) |
Real Estate Taxes by Mortgage Status in Teton
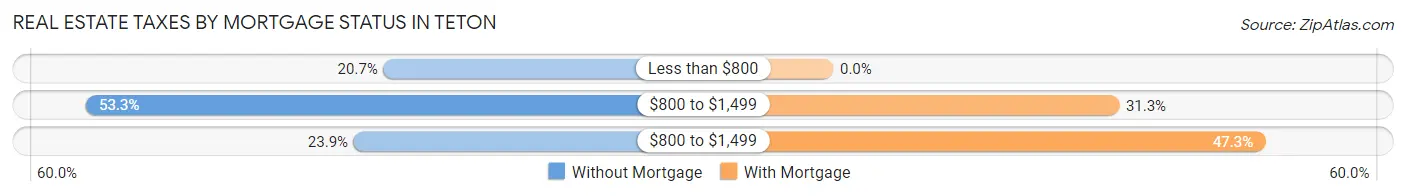
| Property Taxes | Without Mortgage | With Mortgage |
| Less than $800 | 19 (20.6%) | 0 (0.0%) |
| $800 to $1,499 | 49 (53.3%) | 47 (31.3%) |
| $800 to $1,499 | 22 (23.9%) | 71 (47.3%) |
| Total | 92 (100.0%) | 150 (100.0%) |
Health & Disability in Teton
Health Insurance Coverage by Age in Teton
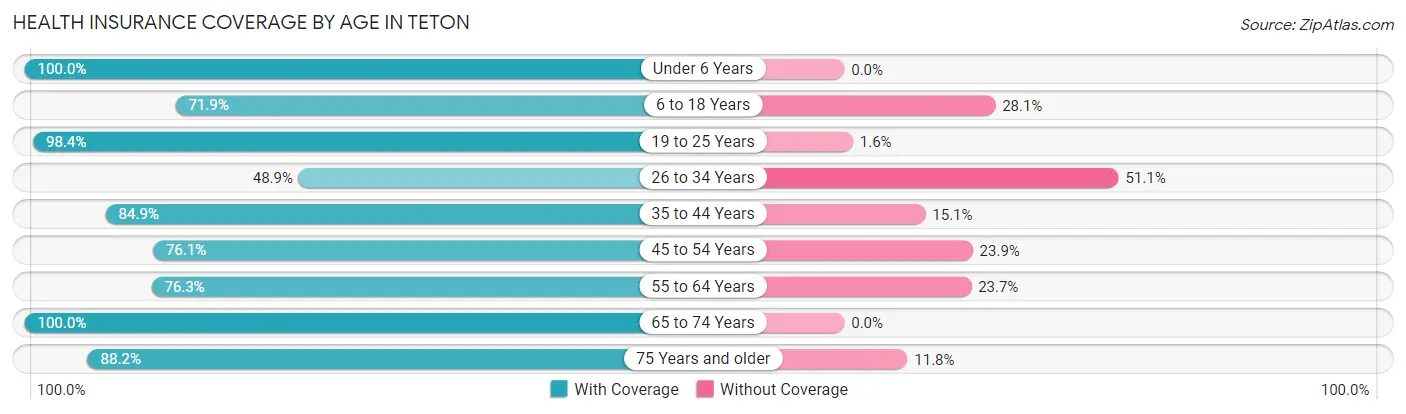
| Age Bracket | With Coverage | Without Coverage |
| Under 6 Years | 166 (100.0%) | 0 (0.0%) |
| 6 to 18 Years | 120 (71.9%) | 47 (28.1%) |
| 19 to 25 Years | 62 (98.4%) | 1 (1.6%) |
| 26 to 34 Years | 43 (48.9%) | 45 (51.1%) |
| 35 to 44 Years | 73 (84.9%) | 13 (15.1%) |
| 45 to 54 Years | 54 (76.1%) | 17 (23.9%) |
| 55 to 64 Years | 100 (76.3%) | 31 (23.7%) |
| 65 to 74 Years | 86 (100.0%) | 0 (0.0%) |
| 75 Years and older | 45 (88.2%) | 6 (11.8%) |
| Total | 749 (82.4%) | 160 (17.6%) |
Health Insurance Coverage by Citizenship Status in Teton
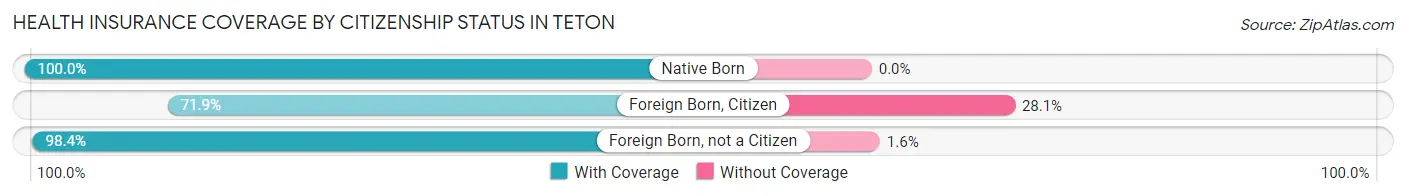
| Citizenship Status | With Coverage | Without Coverage |
| Native Born | 166 (100.0%) | 0 (0.0%) |
| Foreign Born, Citizen | 120 (71.9%) | 47 (28.1%) |
| Foreign Born, not a Citizen | 62 (98.4%) | 1 (1.6%) |
Health Insurance Coverage by Household Income in Teton
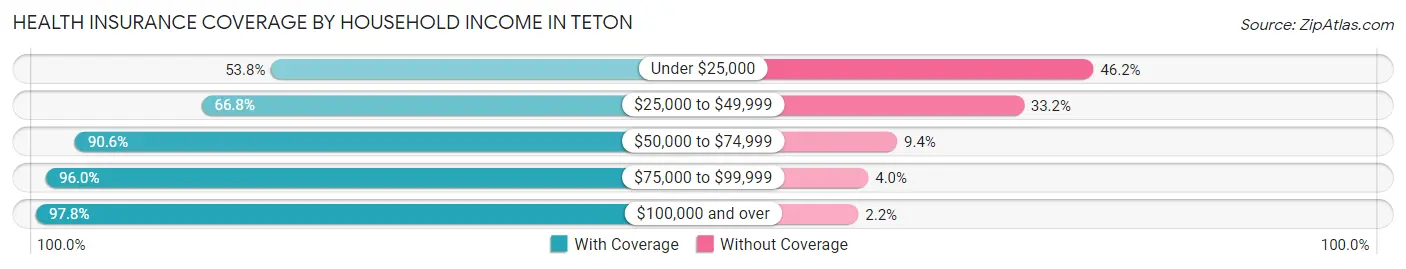
| Household Income | With Coverage | Without Coverage |
| Under $25,000 | 78 (53.8%) | 67 (46.2%) |
| $25,000 to $49,999 | 129 (66.8%) | 64 (33.2%) |
| $50,000 to $74,999 | 173 (90.6%) | 18 (9.4%) |
| $75,000 to $99,999 | 143 (96.0%) | 6 (4.0%) |
| $100,000 and over | 226 (97.8%) | 5 (2.2%) |
Public vs Private Health Insurance Coverage by Age in Teton
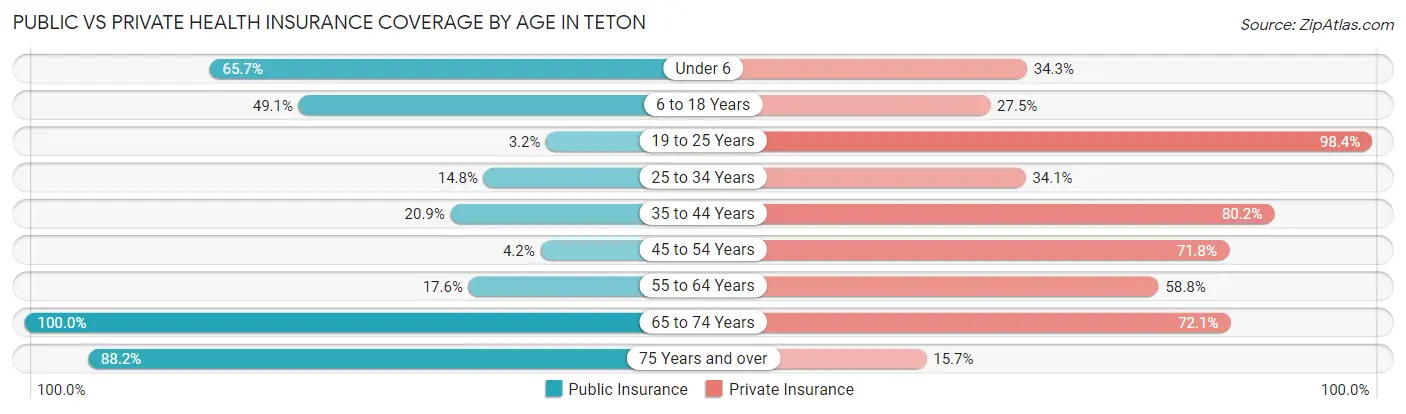
| Age Bracket | Public Insurance | Private Insurance |
| Under 6 | 109 (65.7%) | 57 (34.3%) |
| 6 to 18 Years | 82 (49.1%) | 46 (27.5%) |
| 19 to 25 Years | 2 (3.2%) | 62 (98.4%) |
| 25 to 34 Years | 13 (14.8%) | 30 (34.1%) |
| 35 to 44 Years | 18 (20.9%) | 69 (80.2%) |
| 45 to 54 Years | 3 (4.2%) | 51 (71.8%) |
| 55 to 64 Years | 23 (17.6%) | 77 (58.8%) |
| 65 to 74 Years | 86 (100.0%) | 62 (72.1%) |
| 75 Years and over | 45 (88.2%) | 8 (15.7%) |
| Total | 381 (41.9%) | 462 (50.8%) |
Disability Status by Sex by Age in Teton
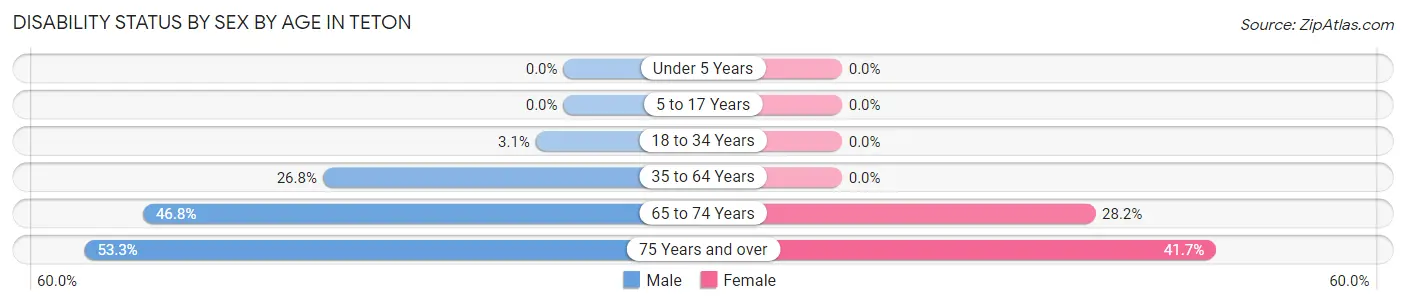
| Age Bracket | Male | Female |
| Under 5 Years | 0 (0.0%) | 0 (0.0%) |
| 5 to 17 Years | 0 (0.0%) | 0 (0.0%) |
| 18 to 34 Years | 2 (3.1%) | 0 (0.0%) |
| 35 to 64 Years | 41 (26.8%) | 0 (0.0%) |
| 65 to 74 Years | 22 (46.8%) | 11 (28.2%) |
| 75 Years and over | 8 (53.3%) | 15 (41.7%) |
Disability Class by Sex by Age in Teton
Disability Class: Hearing Difficulty
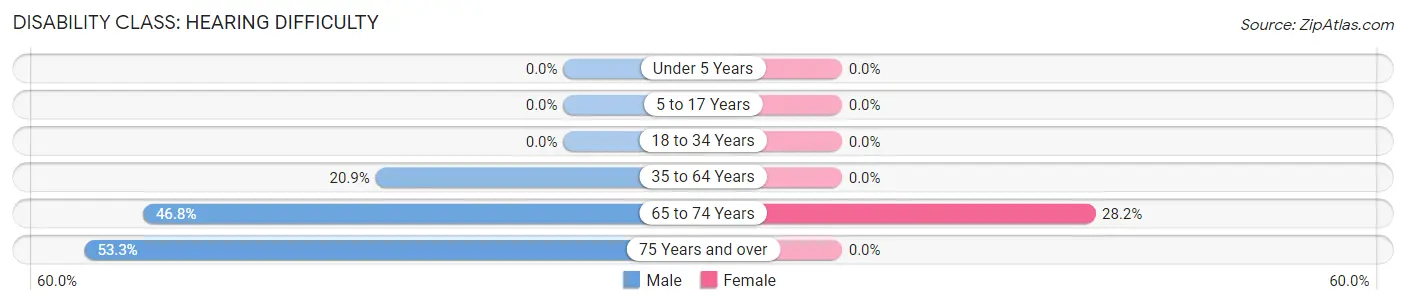
| Age Bracket | Male | Female |
| Under 5 Years | 0 (0.0%) | 0 (0.0%) |
| 5 to 17 Years | 0 (0.0%) | 0 (0.0%) |
| 18 to 34 Years | 0 (0.0%) | 0 (0.0%) |
| 35 to 64 Years | 32 (20.9%) | 0 (0.0%) |
| 65 to 74 Years | 22 (46.8%) | 11 (28.2%) |
| 75 Years and over | 8 (53.3%) | 0 (0.0%) |
Disability Class: Vision Difficulty
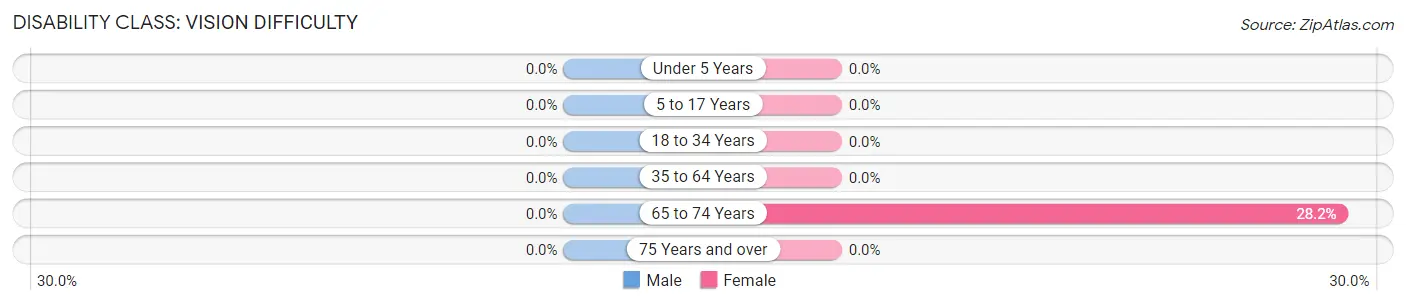
| Age Bracket | Male | Female |
| Under 5 Years | 0 (0.0%) | 0 (0.0%) |
| 5 to 17 Years | 0 (0.0%) | 0 (0.0%) |
| 18 to 34 Years | 0 (0.0%) | 0 (0.0%) |
| 35 to 64 Years | 0 (0.0%) | 0 (0.0%) |
| 65 to 74 Years | 0 (0.0%) | 11 (28.2%) |
| 75 Years and over | 0 (0.0%) | 0 (0.0%) |
Disability Class: Cognitive Difficulty
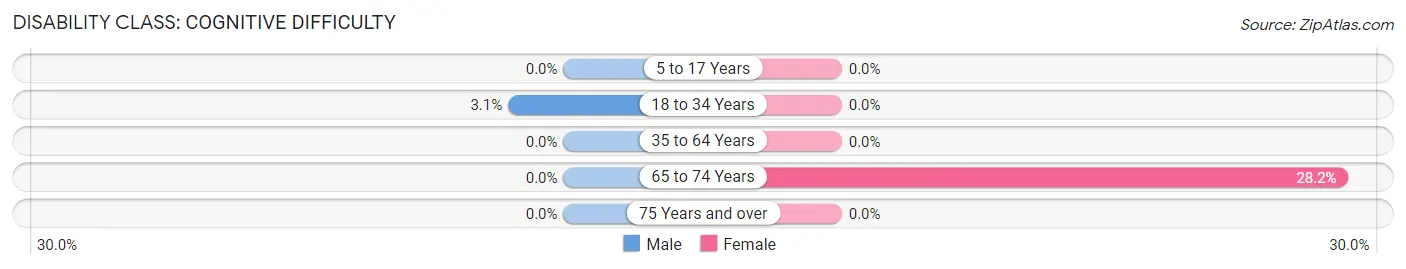
| Age Bracket | Male | Female |
| 5 to 17 Years | 0 (0.0%) | 0 (0.0%) |
| 18 to 34 Years | 2 (3.1%) | 0 (0.0%) |
| 35 to 64 Years | 0 (0.0%) | 0 (0.0%) |
| 65 to 74 Years | 0 (0.0%) | 11 (28.2%) |
| 75 Years and over | 0 (0.0%) | 0 (0.0%) |
Disability Class: Ambulatory Difficulty
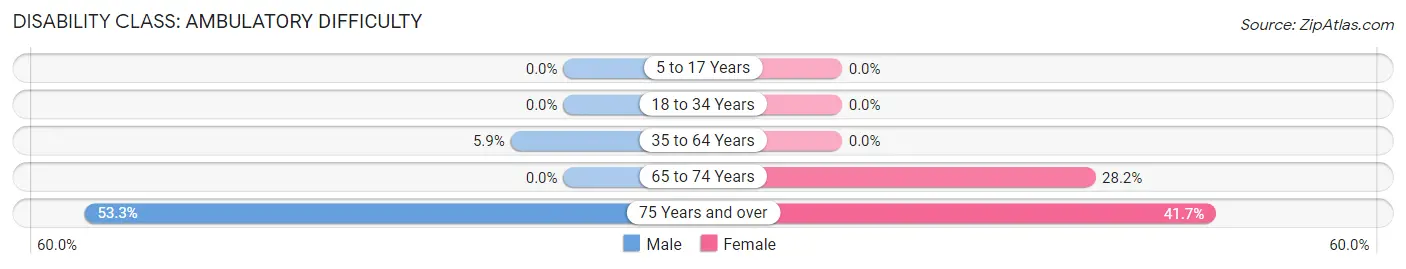
| Age Bracket | Male | Female |
| 5 to 17 Years | 0 (0.0%) | 0 (0.0%) |
| 18 to 34 Years | 0 (0.0%) | 0 (0.0%) |
| 35 to 64 Years | 9 (5.9%) | 0 (0.0%) |
| 65 to 74 Years | 0 (0.0%) | 11 (28.2%) |
| 75 Years and over | 8 (53.3%) | 15 (41.7%) |
Disability Class: Self-Care Difficulty
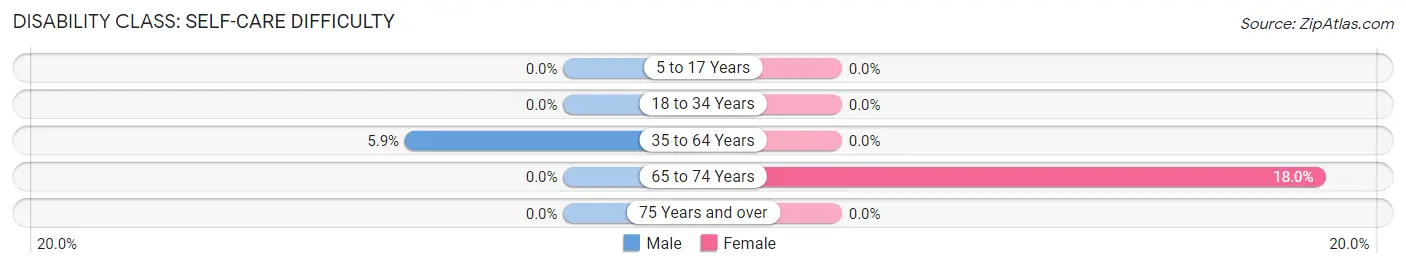
| Age Bracket | Male | Female |
| 5 to 17 Years | 0 (0.0%) | 0 (0.0%) |
| 18 to 34 Years | 0 (0.0%) | 0 (0.0%) |
| 35 to 64 Years | 9 (5.9%) | 0 (0.0%) |
| 65 to 74 Years | 0 (0.0%) | 7 (17.9%) |
| 75 Years and over | 0 (0.0%) | 0 (0.0%) |
Technology Access in Teton
Computing Device Access in Teton
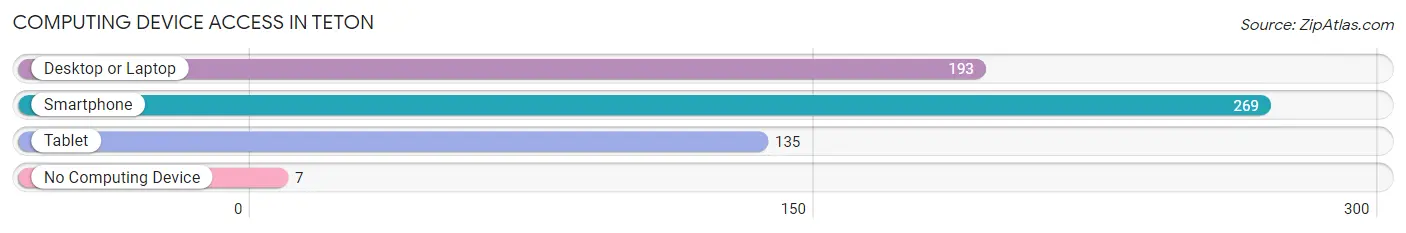
| Device Type | # Households | % Households |
| Desktop or Laptop | 193 | 69.9% |
| Smartphone | 269 | 97.5% |
| Tablet | 135 | 48.9% |
| No Computing Device | 7 | 2.5% |
| Total | 276 | 100.0% |
Internet Access in Teton
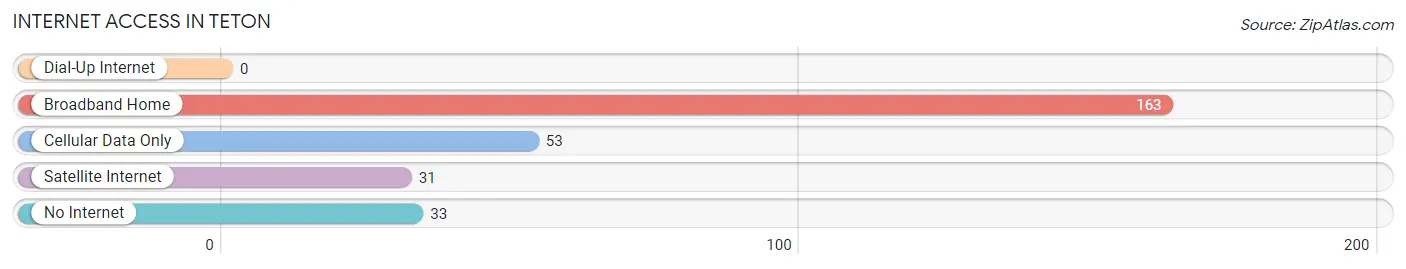
| Internet Type | # Households | % Households |
| Dial-Up Internet | 0 | 0.0% |
| Broadband Home | 163 | 59.1% |
| Cellular Data Only | 53 | 19.2% |
| Satellite Internet | 31 | 11.2% |
| No Internet | 33 | 12.0% |
| Total | 276 | 100.0% |
Teton Summary
Teton, Idaho is a small city located in the southeastern corner of the state, near the border of Wyoming. It is the county seat of Teton County and is home to a population of just over 1,000 people. The city is situated in a valley surrounded by the Teton Mountains, which provide a stunning backdrop to the city.
History
Teton was first settled in the late 1800s by Mormon pioneers who were looking for a place to settle and raise their families. The city was officially incorporated in 1891 and was named after the nearby Teton Mountains. The city quickly grew and became a hub for the surrounding agricultural communities. In the early 1900s, the city was home to a number of businesses, including a bank, a hotel, a newspaper, and a number of stores.
Geography
Teton is located in the southeastern corner of Idaho, near the border of Wyoming. The city is situated in a valley surrounded by the Teton Mountains, which provide a stunning backdrop to the city. The city is located at an elevation of 5,000 feet and has a total area of 1.2 square miles. The city is located in a semi-arid climate, with hot summers and cold winters.
Economy
Teton’s economy is largely based on agriculture and tourism. The city is home to a number of farms and ranches, which produce a variety of crops and livestock. The city is also home to a number of tourist attractions, including the Teton Valley Museum, the Teton County Historical Society, and the Teton County Fairgrounds. The city is also home to a number of businesses, including restaurants, retail stores, and hotels.
Demographics
As of the 2010 census, Teton had a population of 1,072 people. The racial makeup of the city was 95.2% White, 0.7% Native American, 0.3% Asian, 0.2% Pacific Islander, 0.1% African American, and 3.5% from other races. The median household income was $37,917 and the median family income was $45,000. The per capita income was $19,945.
Teton is a small city with a rich history and a vibrant economy. The city is home to a diverse population and is a great place to live, work, and play. With its stunning mountain backdrop and its close proximity to Wyoming, Teton is a great place to call home.
Common Questions
What is Per Capita Income in Teton?
Per Capita income in Teton is $28,081.
What is the Median Family Income in Teton?
Median Family Income in Teton is $66,458.
What is the Median Household income in Teton?
Median Household Income in Teton is $57,083.
What is Income or Wage Gap in Teton?
Income or Wage Gap in Teton is 46.7%.
Women in Teton earn 53.3 cents for every dollar earned by a man.
What is Inequality or Gini Index in Teton?
Inequality or Gini Index in Teton is 0.43.
What is the Total Population of Teton?
Total Population of Teton is 909.
What is the Total Male Population of Teton?
Total Male Population of Teton is 409.
What is the Total Female Population of Teton?
Total Female Population of Teton is 500.
What is the Ratio of Males per 100 Females in Teton?
There are 81.80 Males per 100 Females in Teton.
What is the Ratio of Females per 100 Males in Teton?
There are 122.25 Females per 100 Males in Teton.
What is the Median Population Age in Teton?
Median Population Age in Teton is 30.8 Years.
What is the Average Family Size in Teton
Average Family Size in Teton is 3.7 People.
What is the Average Household Size in Teton
Average Household Size in Teton is 3.3 People.
How Large is the Labor Force in Teton?
There are 394 People in the Labor Forcein in Teton.
What is the Percentage of People in the Labor Force in Teton?
65.7% of People are in the Labor Force in Teton.
What is the Unemployment Rate in Teton?
Unemployment Rate in Teton is 4.8%.