Spirit Lake, ID Map & Demographics
Spirit Lake Map
Spirit Lake Overview
$29,674
PER CAPITA INCOME
$81,131
AVG FAMILY INCOME
$61,625
AVG HOUSEHOLD INCOME
42.0%
WAGE / INCOME GAP [ % ]
58.0¢/ $1
WAGE / INCOME GAP [ $ ]
0.34
INEQUALITY / GINI INDEX
2,375
TOTAL POPULATION
1,264
MALE POPULATION
1,111
FEMALE POPULATION
113.77
MALES / 100 FEMALES
87.90
FEMALES / 100 MALES
40.1
MEDIAN AGE
3.2
AVG FAMILY SIZE
2.5
AVG HOUSEHOLD SIZE
1,112
LABOR FORCE [ PEOPLE ]
62.1%
PERCENT IN LABOR FORCE
3.8%
UNEMPLOYMENT RATE
Spirit Lake Zip Codes
Spirit Lake Area Codes
Income in Spirit Lake
Income Overview in Spirit Lake
Per Capita Income in Spirit Lake is $29,674, while median incomes of families and households are $81,131 and $61,625 respectively.
| Characteristic | Number | Measure |
| Per Capita Income | 2,375 | $29,674 |
| Median Family Income | 637 | $81,131 |
| Mean Family Income | 637 | $87,053 |
| Median Household Income | 927 | $61,625 |
| Mean Household Income | 927 | $75,153 |
| Income Deficit | 637 | $0 |
| Wage / Income Gap (%) | 2,375 | 42.00% |
| Wage / Income Gap ($) | 2,375 | 58.00¢ per $1 |
| Gini / Inequality Index | 2,375 | 0.34 |
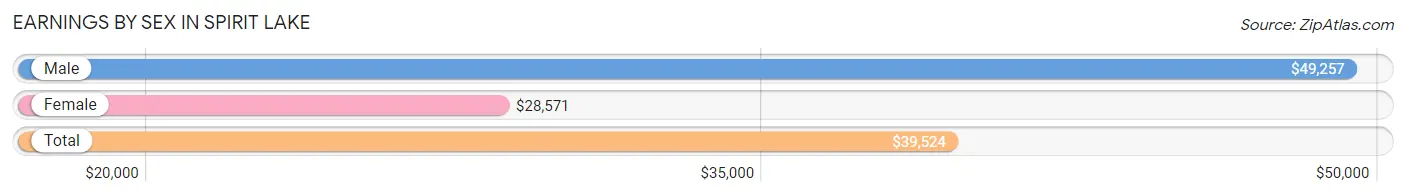
Earnings by Sex in Spirit Lake
Average Earnings in Spirit Lake are $39,524, $49,257 for men and $28,571 for women, a difference of 42.0%.
| Sex | Number | Average Earnings |
| Male | 710 (59.1%) | $49,257 |
| Female | 492 (40.9%) | $28,571 |
| Total | 1,202 (100.0%) | $39,524 |
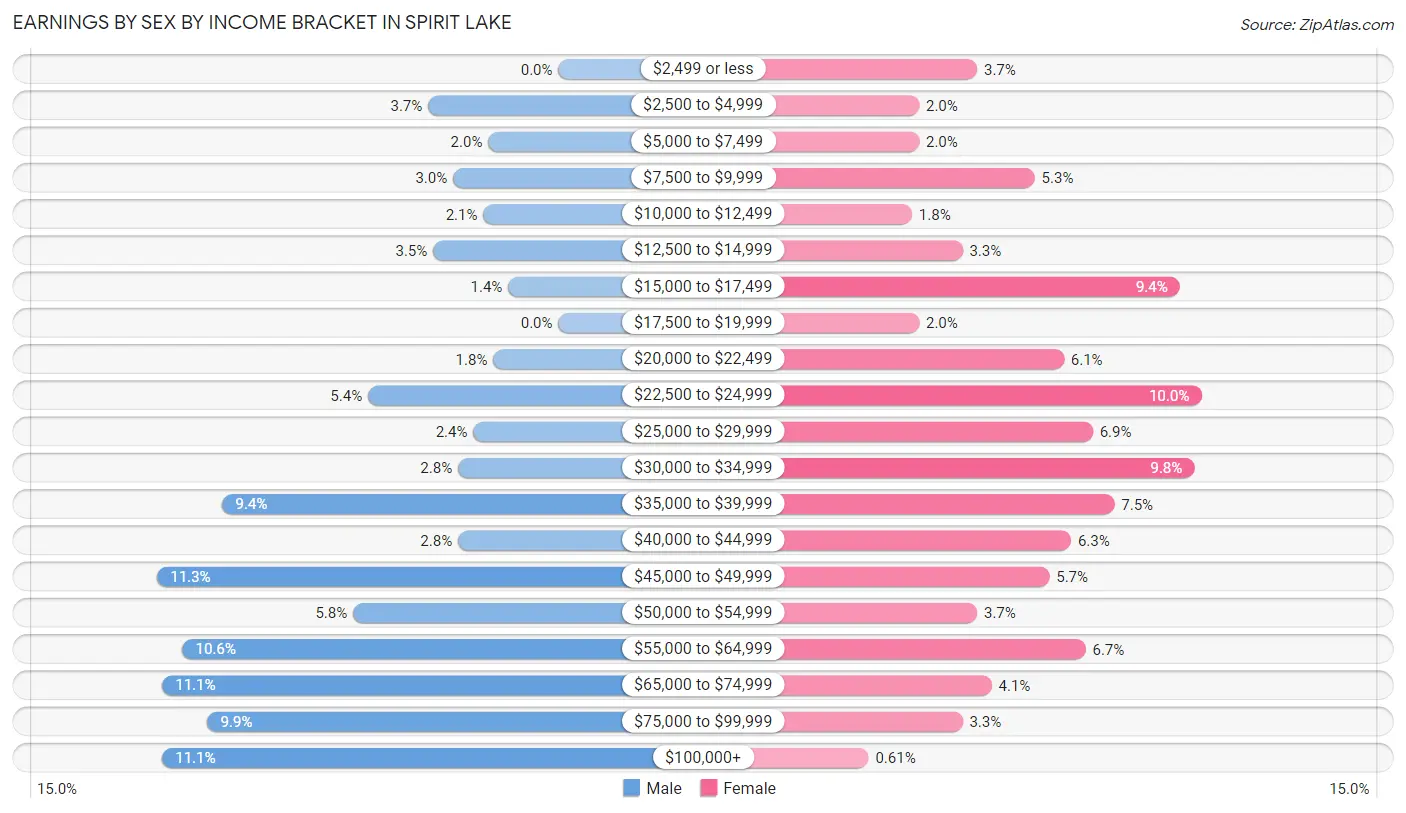
Earnings by Sex by Income Bracket in Spirit Lake
The most common earnings brackets in Spirit Lake are $45,000 to $49,999 for men (80 | 11.3%) and $22,500 to $24,999 for women (49 | 10.0%).
| Income | Male | Female |
| $2,499 or less | 0 (0.0%) | 18 (3.7%) |
| $2,500 to $4,999 | 26 (3.7%) | 10 (2.0%) |
| $5,000 to $7,499 | 14 (2.0%) | 10 (2.0%) |
| $7,500 to $9,999 | 21 (3.0%) | 26 (5.3%) |
| $10,000 to $12,499 | 15 (2.1%) | 9 (1.8%) |
| $12,500 to $14,999 | 25 (3.5%) | 16 (3.3%) |
| $15,000 to $17,499 | 10 (1.4%) | 46 (9.3%) |
| $17,500 to $19,999 | 0 (0.0%) | 10 (2.0%) |
| $20,000 to $22,499 | 13 (1.8%) | 30 (6.1%) |
| $22,500 to $24,999 | 38 (5.3%) | 49 (10.0%) |
| $25,000 to $29,999 | 17 (2.4%) | 34 (6.9%) |
| $30,000 to $34,999 | 20 (2.8%) | 48 (9.8%) |
| $35,000 to $39,999 | 67 (9.4%) | 37 (7.5%) |
| $40,000 to $44,999 | 20 (2.8%) | 31 (6.3%) |
| $45,000 to $49,999 | 80 (11.3%) | 28 (5.7%) |
| $50,000 to $54,999 | 41 (5.8%) | 18 (3.7%) |
| $55,000 to $64,999 | 75 (10.6%) | 33 (6.7%) |
| $65,000 to $74,999 | 79 (11.1%) | 20 (4.1%) |
| $75,000 to $99,999 | 70 (9.9%) | 16 (3.3%) |
| $100,000+ | 79 (11.1%) | 3 (0.6%) |
| Total | 710 (100.0%) | 492 (100.0%) |
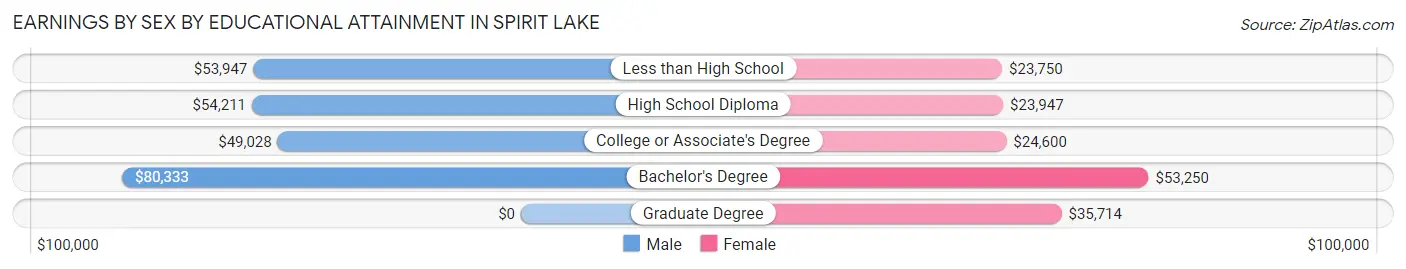
Earnings by Sex by Educational Attainment in Spirit Lake
Average earnings in Spirit Lake are $54,211 for men and $28,690 for women, a difference of 47.1%. Men with an educational attainment of bachelor's degree enjoy the highest average annual earnings of $80,333, while those with college or associate's degree education earn the least with $49,028. Women with an educational attainment of bachelor's degree earn the most with the average annual earnings of $53,250, while those with less than high school education have the smallest earnings of $23,750.
| Educational Attainment | Male Income | Female Income |
| Less than High School | $53,947 | $23,750 |
| High School Diploma | $54,211 | $23,947 |
| College or Associate's Degree | $49,028 | $24,600 |
| Bachelor's Degree | $80,333 | $53,250 |
| Graduate Degree | - | - |
| Total | $54,211 | $28,690 |
Family Income in Spirit Lake
Family Income Brackets in Spirit Lake
According to the Spirit Lake family income data, there are 145 families falling into the $100,000 to $149,999 income range, which is the most common income bracket and makes up 22.8% of all families. Conversely, the less than $10,000 income bracket is the least frequent group with only 9 families (1.4%) belonging to this category.
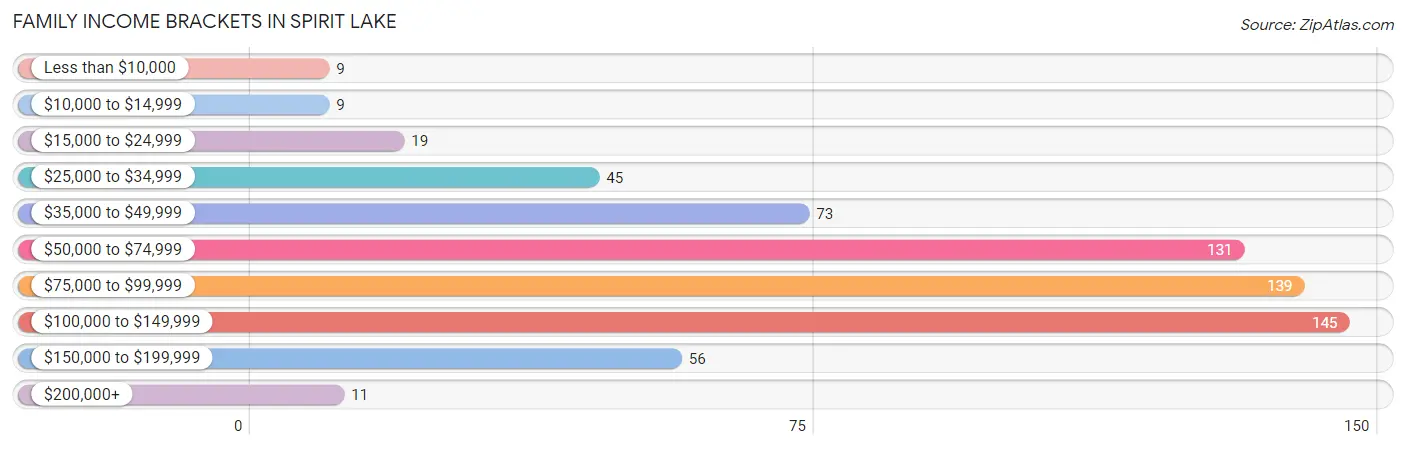
| Income Bracket | # Families | % Families |
| Less than $10,000 | 9 | 1.4% |
| $10,000 to $14,999 | 9 | 1.4% |
| $15,000 to $24,999 | 19 | 3.0% |
| $25,000 to $34,999 | 45 | 7.1% |
| $35,000 to $49,999 | 73 | 11.5% |
| $50,000 to $74,999 | 131 | 20.6% |
| $75,000 to $99,999 | 139 | 21.8% |
| $100,000 to $149,999 | 145 | 22.8% |
| $150,000 to $199,999 | 56 | 8.8% |
| $200,000+ | 11 | 1.7% |
Family Income by Famaliy Size in Spirit Lake
4-person families (135 | 21.2%) account for the highest median family income in Spirit Lake with $94,958 per family, while 2-person families (280 | 44.0%) have the highest median income of $36,562 per family member.
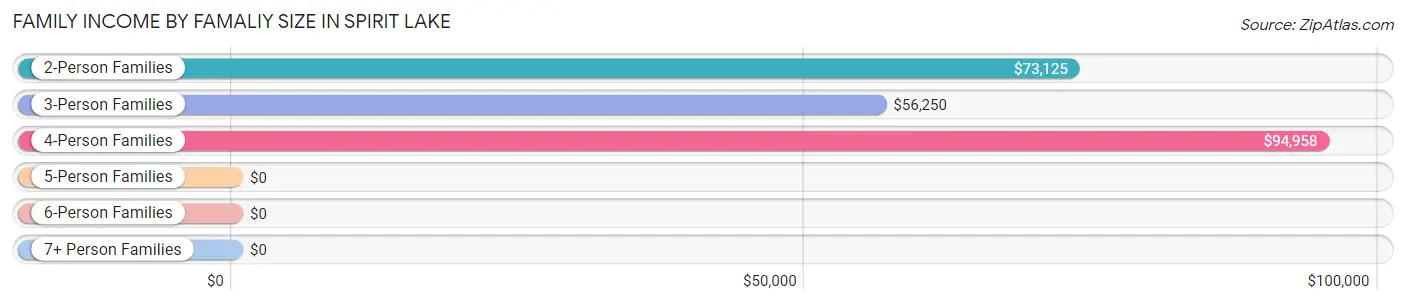
| Income Bracket | # Families | Median Income |
| 2-Person Families | 280 (44.0%) | $73,125 |
| 3-Person Families | 138 (21.7%) | $56,250 |
| 4-Person Families | 135 (21.2%) | $94,958 |
| 5-Person Families | 74 (11.6%) | $0 |
| 6-Person Families | 8 (1.3%) | $0 |
| 7+ Person Families | 2 (0.3%) | $0 |
| Total | 637 (100.0%) | $81,131 |
Family Income by Number of Earners in Spirit Lake
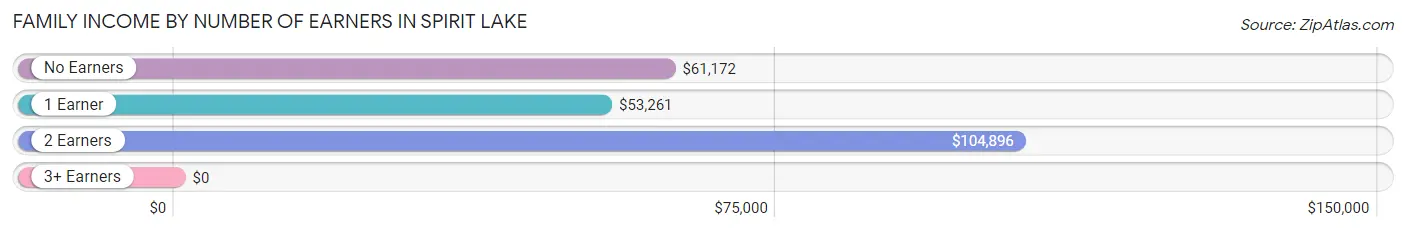
| Number of Earners | # Families | Median Income |
| No Earners | 83 (13.0%) | $61,172 |
| 1 Earner | 210 (33.0%) | $53,261 |
| 2 Earners | 311 (48.8%) | $104,896 |
| 3+ Earners | 33 (5.2%) | $0 |
| Total | 637 (100.0%) | $81,131 |
Household Income in Spirit Lake
Household Income Brackets in Spirit Lake
With 183 households falling in the category, the $35,000 to $49,999 income range is the most frequent in Spirit Lake, accounting for 19.7% of all households. In contrast, only 11 households (1.2%) fall into the $200,000+ income bracket, making it the least populous group.
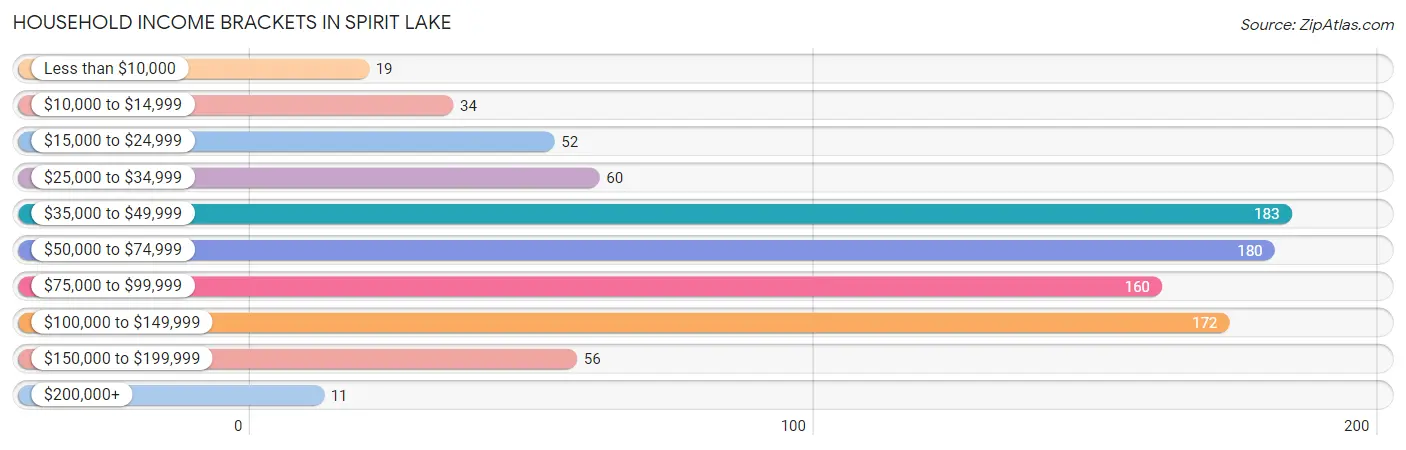
| Income Bracket | # Households | % Households |
| Less than $10,000 | 19 | 2.0% |
| $10,000 to $14,999 | 34 | 3.7% |
| $15,000 to $24,999 | 52 | 5.6% |
| $25,000 to $34,999 | 60 | 6.5% |
| $35,000 to $49,999 | 183 | 19.7% |
| $50,000 to $74,999 | 180 | 19.4% |
| $75,000 to $99,999 | 160 | 17.3% |
| $100,000 to $149,999 | 172 | 18.6% |
| $150,000 to $199,999 | 56 | 6.0% |
| $200,000+ | 11 | 1.2% |
Household Income by Householder Age in Spirit Lake
The median household income in Spirit Lake is $61,625, with the highest median household income of $84,125 found in the 25 to 44 years age bracket for the primary householder. A total of 259 households (27.9%) fall into this category. Meanwhile, the 65+ years age bracket for the primary householder has the lowest median household income of $50,313, with 211 households (22.8%) in this group.
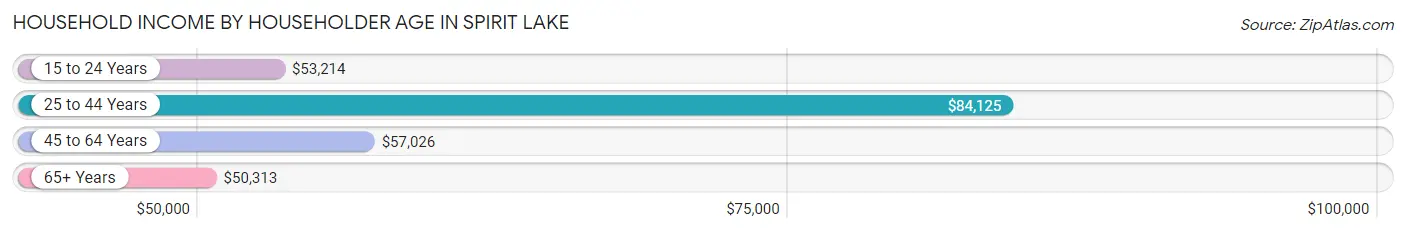
| Income Bracket | # Households | Median Income |
| 15 to 24 Years | 38 (4.1%) | $53,214 |
| 25 to 44 Years | 259 (27.9%) | $84,125 |
| 45 to 64 Years | 419 (45.2%) | $57,026 |
| 65+ Years | 211 (22.8%) | $50,313 |
| Total | 927 (100.0%) | $61,625 |
Poverty in Spirit Lake
Income Below Poverty by Sex and Age in Spirit Lake
With 4.2% poverty level for males and 4.7% for females among the residents of Spirit Lake, 15 year old males and 18 to 24 year old females are the most vulnerable to poverty, with 8 males (100.0%) and 9 females (12.9%) in their respective age groups living below the poverty level.
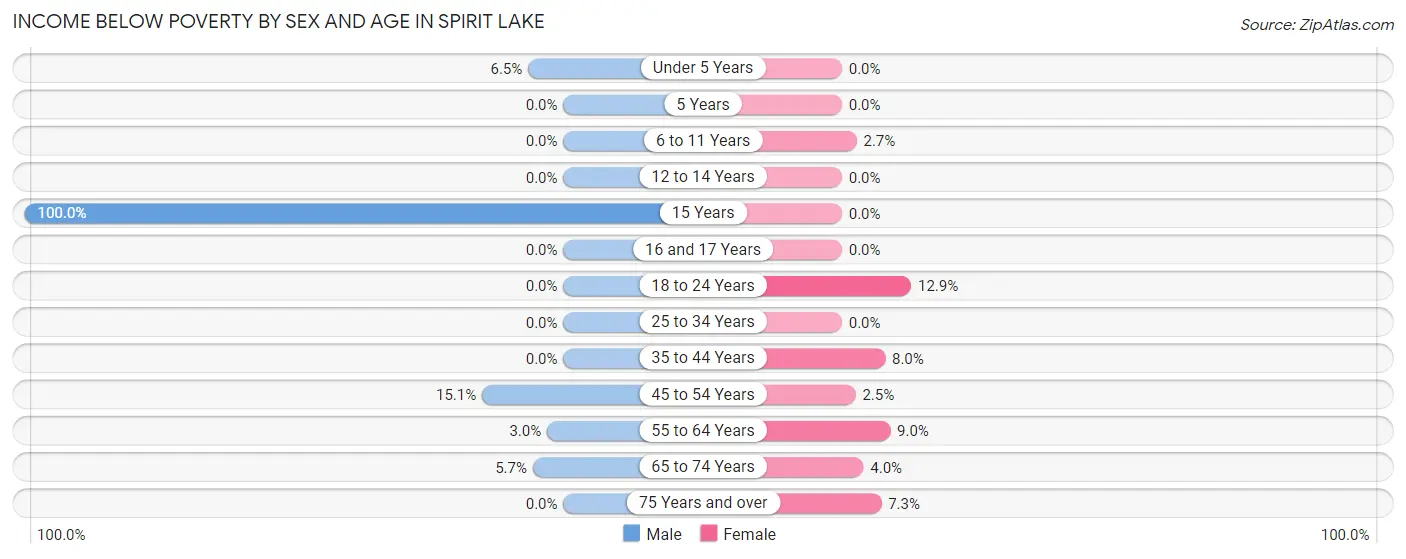
| Age Bracket | Male | Female |
| Under 5 Years | 7 (6.5%) | 0 (0.0%) |
| 5 Years | 0 (0.0%) | 0 (0.0%) |
| 6 to 11 Years | 0 (0.0%) | 4 (2.7%) |
| 12 to 14 Years | 0 (0.0%) | 0 (0.0%) |
| 15 Years | 8 (100.0%) | 0 (0.0%) |
| 16 and 17 Years | 0 (0.0%) | 0 (0.0%) |
| 18 to 24 Years | 0 (0.0%) | 9 (12.9%) |
| 25 to 34 Years | 0 (0.0%) | 0 (0.0%) |
| 35 to 44 Years | 0 (0.0%) | 11 (8.0%) |
| 45 to 54 Years | 24 (15.1%) | 3 (2.5%) |
| 55 to 64 Years | 6 (3.0%) | 18 (9.0%) |
| 65 to 74 Years | 8 (5.7%) | 4 (4.0%) |
| 75 Years and over | 0 (0.0%) | 3 (7.3%) |
| Total | 53 (4.2%) | 52 (4.7%) |
Income Above Poverty by Sex and Age in Spirit Lake
According to the poverty statistics in Spirit Lake, males aged 5 years and females aged under 5 years are the age groups that are most secure financially, with 100.0% of males and 100.0% of females in these age groups living above the poverty line.
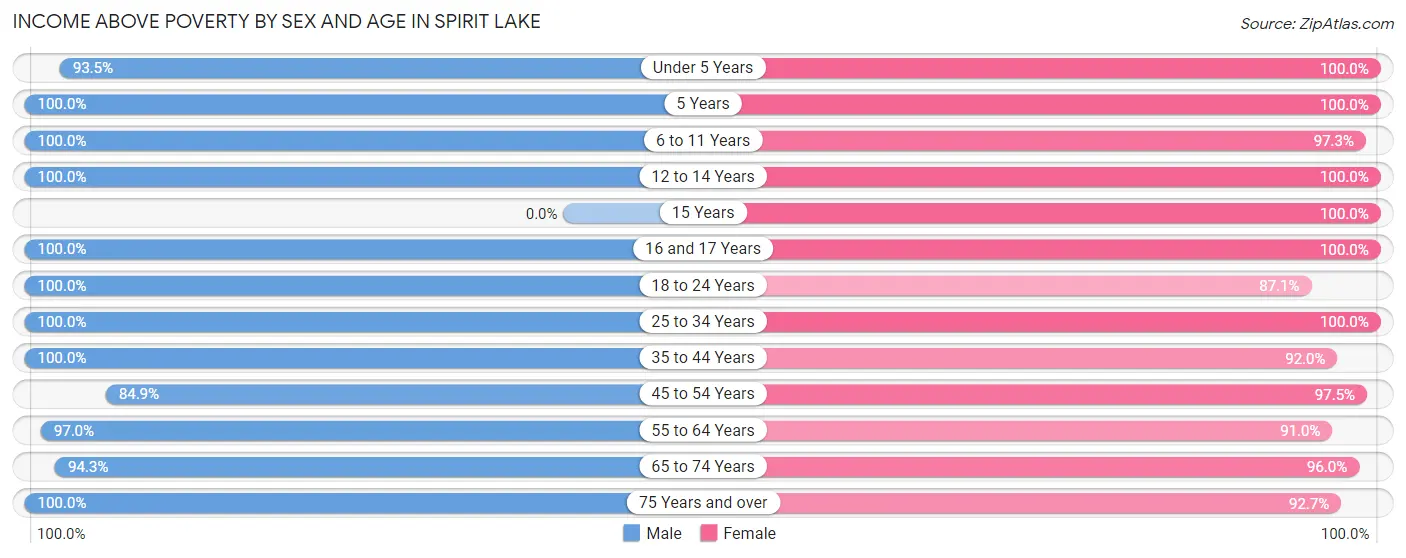
| Age Bracket | Male | Female |
| Under 5 Years | 100 (93.5%) | 111 (100.0%) |
| 5 Years | 9 (100.0%) | 26 (100.0%) |
| 6 to 11 Years | 47 (100.0%) | 142 (97.3%) |
| 12 to 14 Years | 96 (100.0%) | 30 (100.0%) |
| 15 Years | 0 (0.0%) | 4 (100.0%) |
| 16 and 17 Years | 19 (100.0%) | 11 (100.0%) |
| 18 to 24 Years | 136 (100.0%) | 61 (87.1%) |
| 25 to 34 Years | 137 (100.0%) | 116 (100.0%) |
| 35 to 44 Years | 140 (100.0%) | 126 (92.0%) |
| 45 to 54 Years | 135 (84.9%) | 115 (97.5%) |
| 55 to 64 Years | 193 (97.0%) | 183 (91.0%) |
| 65 to 74 Years | 133 (94.3%) | 96 (96.0%) |
| 75 Years and over | 66 (100.0%) | 38 (92.7%) |
| Total | 1,211 (95.8%) | 1,059 (95.3%) |
Income Below Poverty Among Married-Couple Families in Spirit Lake
The poverty statistics for married-couple families in Spirit Lake show that 1.7% or 9 of the total 523 families live below the poverty line. Families with no children have the highest poverty rate of 2.9%, comprising of 9 families. On the other hand, families with 1 or 2 children have the lowest poverty rate of 0.0%, which includes 0 families.
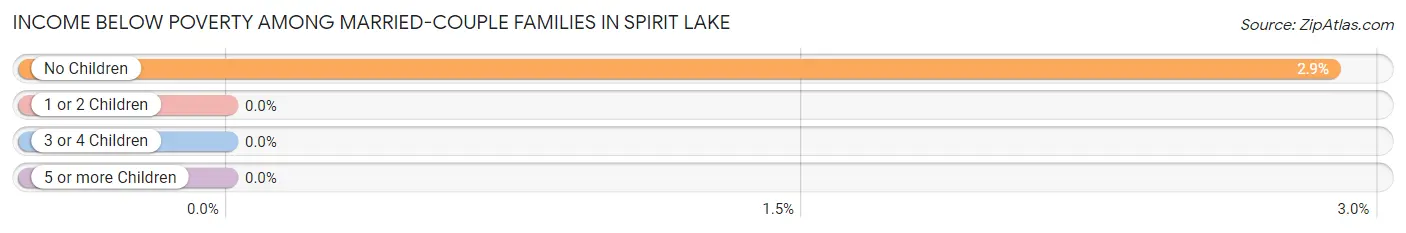
| Children | Above Poverty | Below Poverty |
| No Children | 303 (97.1%) | 9 (2.9%) |
| 1 or 2 Children | 129 (100.0%) | 0 (0.0%) |
| 3 or 4 Children | 82 (100.0%) | 0 (0.0%) |
| 5 or more Children | 0 (0.0%) | 0 (0.0%) |
| Total | 514 (98.3%) | 9 (1.7%) |
Income Below Poverty Among Single-Parent Households in Spirit Lake
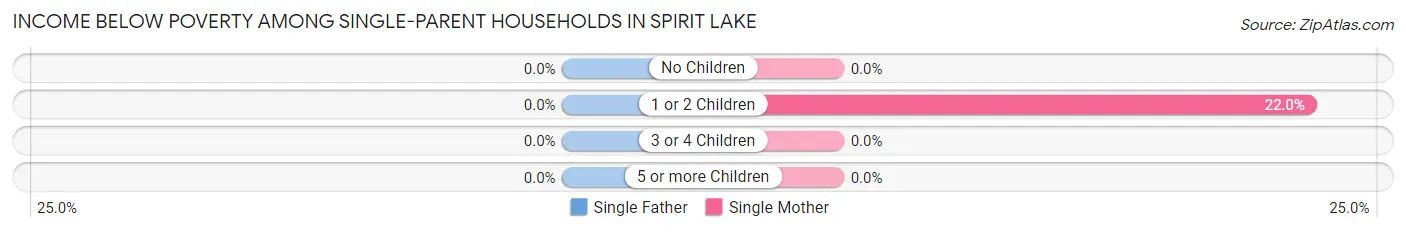
| Children | Single Father | Single Mother |
| No Children | 0 (0.0%) | 0 (0.0%) |
| 1 or 2 Children | 0 (0.0%) | 13 (22.0%) |
| 3 or 4 Children | 0 (0.0%) | 0 (0.0%) |
| 5 or more Children | 0 (0.0%) | 0 (0.0%) |
| Total | 0 (0.0%) | 13 (18.6%) |
Income Below Poverty Among Married-Couple vs Single-Parent Households in Spirit Lake
The poverty data for Spirit Lake shows that 9 of the married-couple family households (1.7%) and 13 of the single-parent households (11.4%) are living below the poverty level. Within the married-couple family households, those with no children have the highest poverty rate, with 9 households (2.9%) falling below the poverty line. Among the single-parent households, those with 1 or 2 children have the highest poverty rate, with 13 household (13.8%) living below poverty.
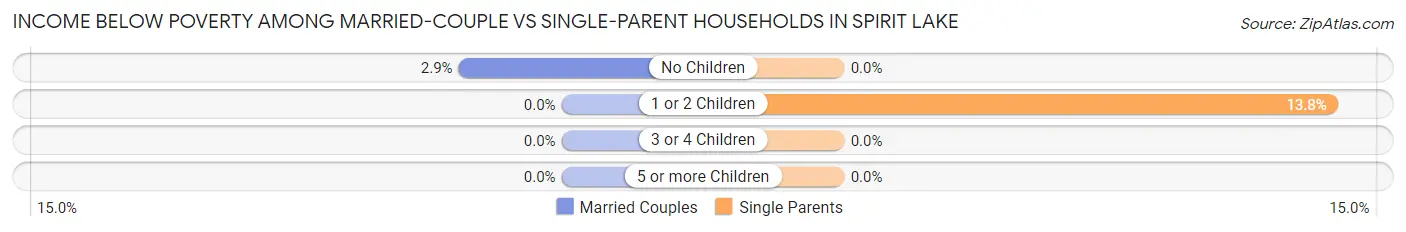
| Children | Married-Couple Families | Single-Parent Households |
| No Children | 9 (2.9%) | 0 (0.0%) |
| 1 or 2 Children | 0 (0.0%) | 13 (13.8%) |
| 3 or 4 Children | 0 (0.0%) | 0 (0.0%) |
| 5 or more Children | 0 (0.0%) | 0 (0.0%) |
| Total | 9 (1.7%) | 13 (11.4%) |
Race in Spirit Lake
The most populous races in Spirit Lake are White / Caucasian (2,261 | 95.2%), Two or more Races (90 | 3.8%), and Hispanic or Latino (62 | 2.6%).
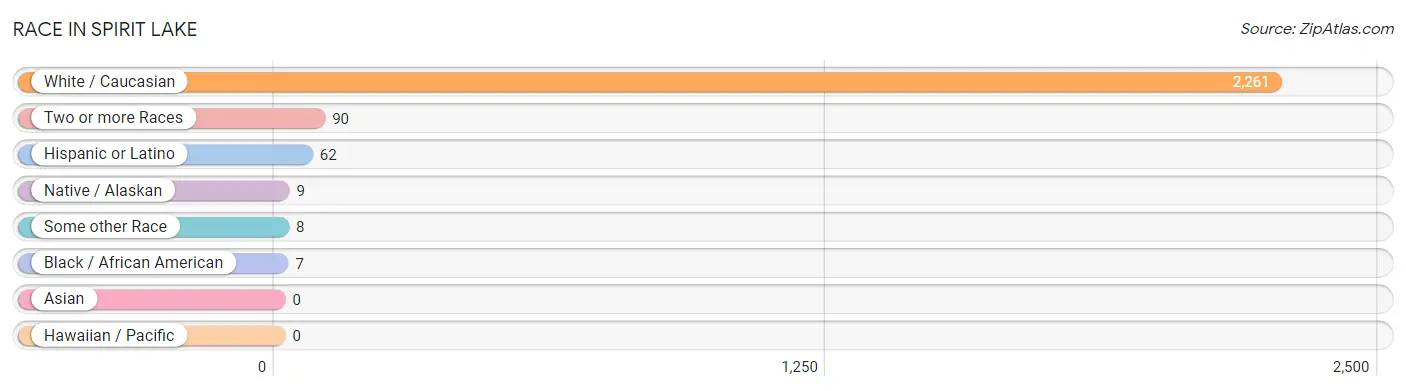
| Race | # Population | % Population |
| Asian | 0 | 0.0% |
| Black / African American | 7 | 0.3% |
| Hawaiian / Pacific | 0 | 0.0% |
| Hispanic or Latino | 62 | 2.6% |
| Native / Alaskan | 9 | 0.4% |
| White / Caucasian | 2,261 | 95.2% |
| Two or more Races | 90 | 3.8% |
| Some other Race | 8 | 0.3% |
| Total | 2,375 | 100.0% |
Ancestry in Spirit Lake
The most populous ancestries reported in Spirit Lake are German (769 | 32.4%), English (355 | 14.9%), Irish (316 | 13.3%), Scandinavian (144 | 6.1%), and French (132 | 5.6%), together accounting for 72.3% of all Spirit Lake residents.
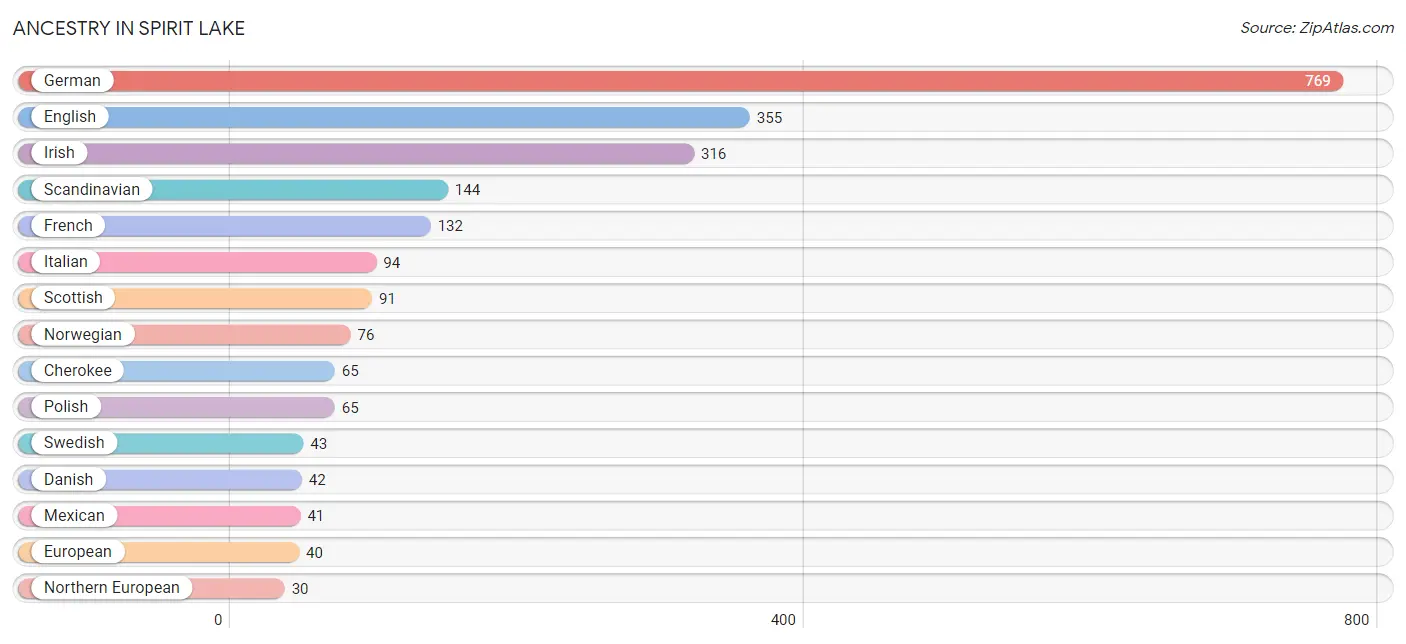
| Ancestry | # Population | % Population |
| American | 18 | 0.8% |
| Argentinean | 3 | 0.1% |
| Austrian | 13 | 0.5% |
| British | 10 | 0.4% |
| Cherokee | 65 | 2.7% |
| Croatian | 6 | 0.3% |
| Danish | 42 | 1.8% |
| Dutch | 18 | 0.8% |
| English | 355 | 14.9% |
| European | 40 | 1.7% |
| Finnish | 5 | 0.2% |
| French | 132 | 5.6% |
| German | 769 | 32.4% |
| Icelander | 11 | 0.5% |
| Irish | 316 | 13.3% |
| Italian | 94 | 4.0% |
| Mexican | 41 | 1.7% |
| Northern European | 30 | 1.3% |
| Norwegian | 76 | 3.2% |
| Paraguayan | 6 | 0.3% |
| Polish | 65 | 2.7% |
| Portuguese | 26 | 1.1% |
| Russian | 12 | 0.5% |
| Scandinavian | 144 | 6.1% |
| Scotch-Irish | 27 | 1.1% |
| Scottish | 91 | 3.8% |
| South American | 9 | 0.4% |
| Subsaharan African | 2 | 0.1% |
| Swedish | 43 | 1.8% |
| Swiss | 4 | 0.2% |
| Welsh | 6 | 0.3% | View All 31 Rows |
Immigrants in Spirit Lake
The most numerous immigrant groups reported in Spirit Lake came from Latin America (9 | 0.4%), South America (9 | 0.4%), Europe (4 | 0.2%), Germany (4 | 0.2%), and Western Europe (4 | 0.2%), together accounting for 1.3% of all Spirit Lake residents.
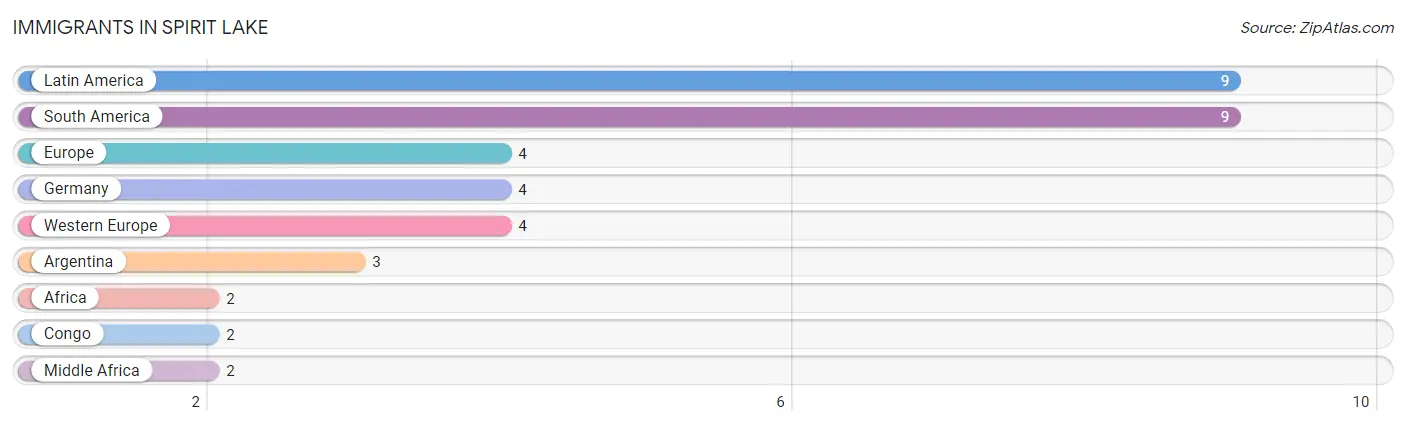
| Immigration Origin | # Population | % Population |
| Africa | 2 | 0.1% |
| Argentina | 3 | 0.1% |
| Congo | 2 | 0.1% |
| Europe | 4 | 0.2% |
| Germany | 4 | 0.2% |
| Latin America | 9 | 0.4% |
| Middle Africa | 2 | 0.1% |
| South America | 9 | 0.4% |
| Western Europe | 4 | 0.2% | View All 9 Rows |
Sex and Age in Spirit Lake
Sex and Age in Spirit Lake
The most populous age groups in Spirit Lake are 60 to 64 Years (126 | 10.0%) for men and 60 to 64 Years (124 | 11.2%) for women.
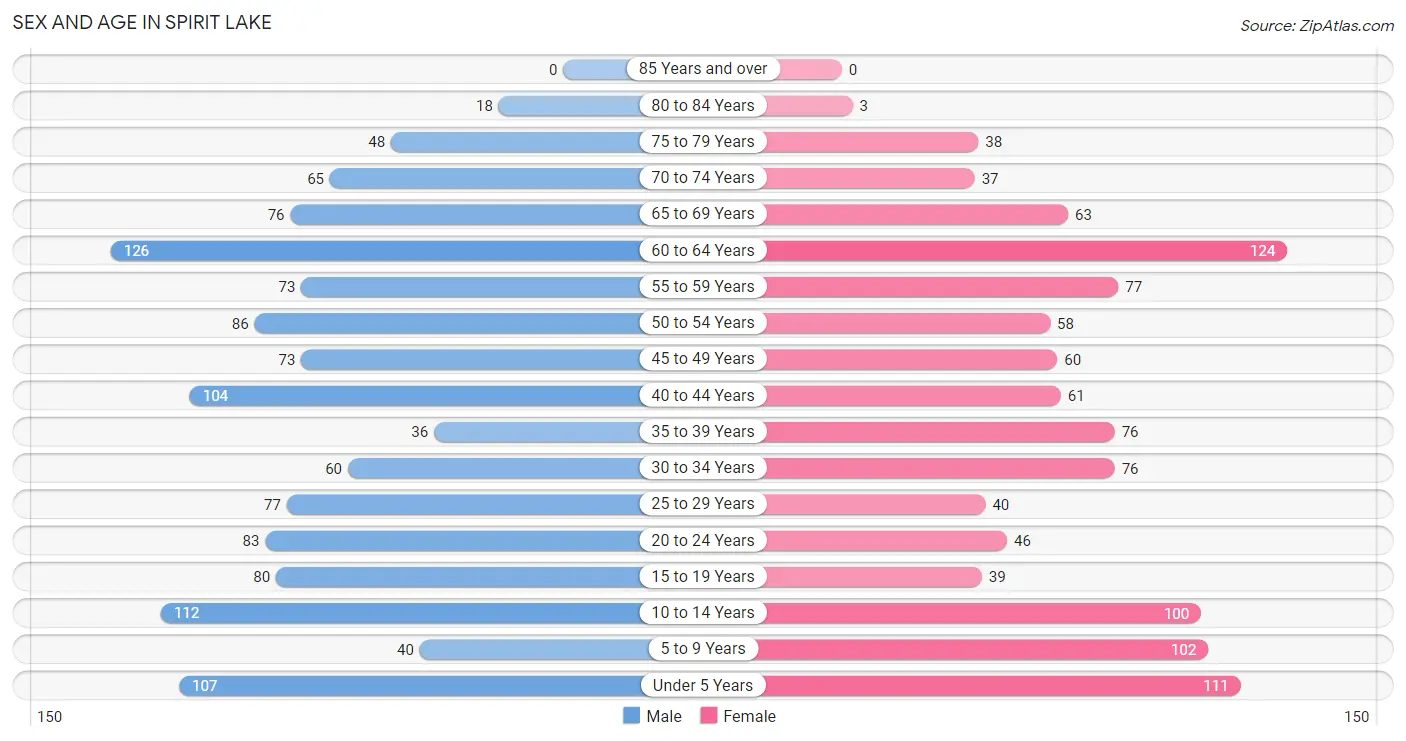
| Age Bracket | Male | Female |
| Under 5 Years | 107 (8.5%) | 111 (10.0%) |
| 5 to 9 Years | 40 (3.2%) | 102 (9.2%) |
| 10 to 14 Years | 112 (8.9%) | 100 (9.0%) |
| 15 to 19 Years | 80 (6.3%) | 39 (3.5%) |
| 20 to 24 Years | 83 (6.6%) | 46 (4.1%) |
| 25 to 29 Years | 77 (6.1%) | 40 (3.6%) |
| 30 to 34 Years | 60 (4.8%) | 76 (6.8%) |
| 35 to 39 Years | 36 (2.9%) | 76 (6.8%) |
| 40 to 44 Years | 104 (8.2%) | 61 (5.5%) |
| 45 to 49 Years | 73 (5.8%) | 60 (5.4%) |
| 50 to 54 Years | 86 (6.8%) | 58 (5.2%) |
| 55 to 59 Years | 73 (5.8%) | 77 (6.9%) |
| 60 to 64 Years | 126 (10.0%) | 124 (11.2%) |
| 65 to 69 Years | 76 (6.0%) | 63 (5.7%) |
| 70 to 74 Years | 65 (5.1%) | 37 (3.3%) |
| 75 to 79 Years | 48 (3.8%) | 38 (3.4%) |
| 80 to 84 Years | 18 (1.4%) | 3 (0.3%) |
| 85 Years and over | 0 (0.0%) | 0 (0.0%) |
| Total | 1,264 (100.0%) | 1,111 (100.0%) |
Families and Households in Spirit Lake
Median Family Size in Spirit Lake
The median family size in Spirit Lake is 3.16 persons per family, with single female/mother families (70 | 11.0%) accounting for the largest median family size of 3.26 persons per family. On the other hand, single male/father families (44 | 6.9%) represent the smallest median family size with 2.82 persons per family.
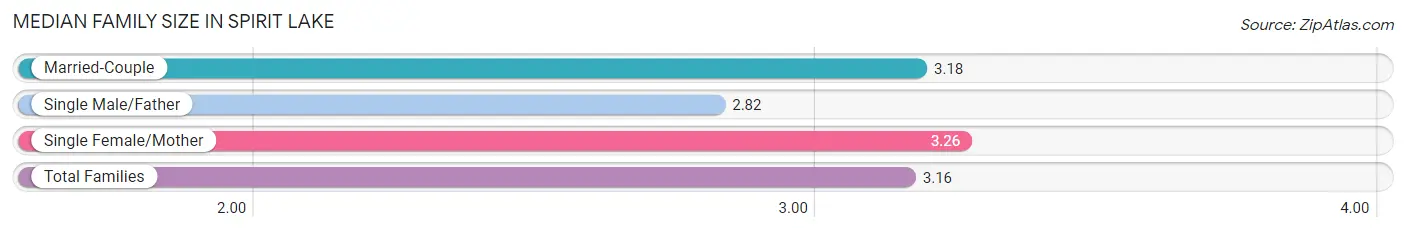
| Family Type | # Families | Family Size |
| Married-Couple | 523 (82.1%) | 3.18 |
| Single Male/Father | 44 (6.9%) | 2.82 |
| Single Female/Mother | 70 (11.0%) | 3.26 |
| Total Families | 637 (100.0%) | 3.16 |
Median Household Size in Spirit Lake
The median household size in Spirit Lake is 2.54 persons per household, with single female/mother households (70 | 7.5%) accounting for the largest median household size of 3.54 persons per household. non-family households (290 | 31.3%) represent the smallest median household size with 1.08 persons per household.
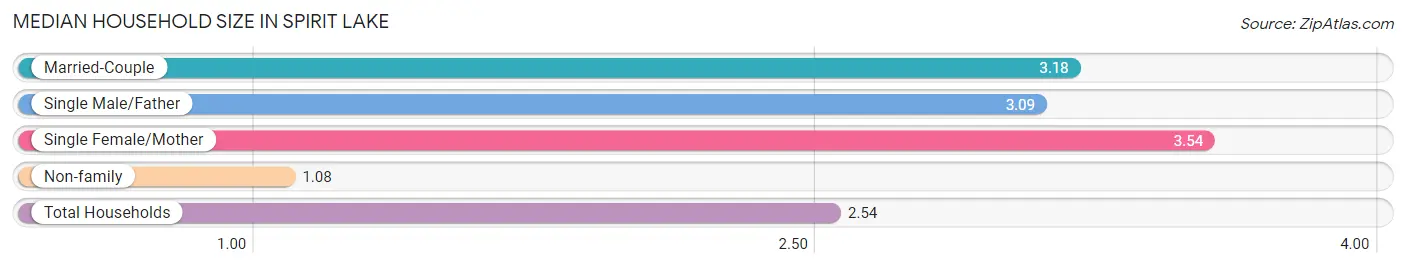
| Household Type | # Households | Household Size |
| Married-Couple | 523 (56.4%) | 3.18 |
| Single Male/Father | 44 (4.8%) | 3.09 |
| Single Female/Mother | 70 (7.5%) | 3.54 |
| Non-family | 290 (31.3%) | 1.08 |
| Total Households | 927 (100.0%) | 2.54 |
Household Size by Marriage Status in Spirit Lake
Out of a total of 927 households in Spirit Lake, 637 (68.7%) are family households, while 290 (31.3%) are nonfamily households. The most numerous type of family households are 2-person households, comprising 262, and the most common type of nonfamily households are 1-person households, comprising 273.
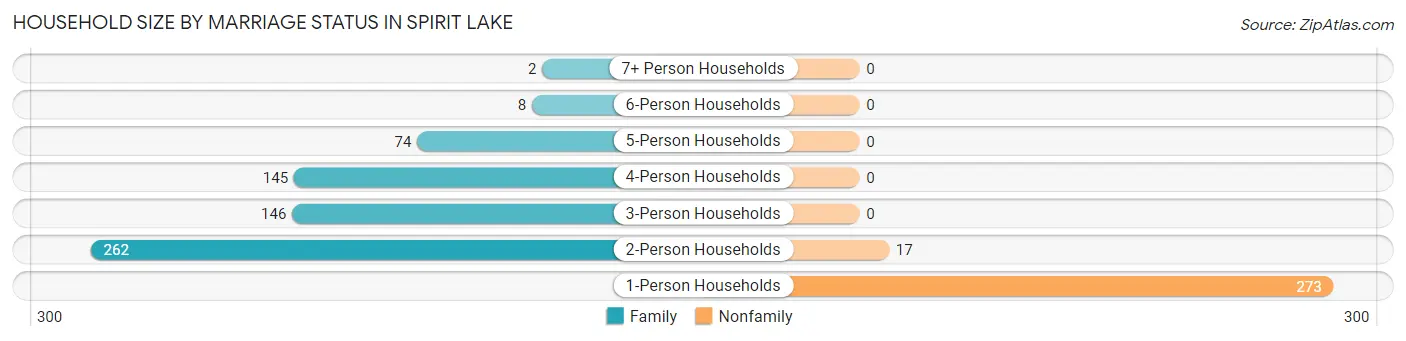
| Household Size | Family Households | Nonfamily Households |
| 1-Person Households | - | 273 (29.4%) |
| 2-Person Households | 262 (28.3%) | 17 (1.8%) |
| 3-Person Households | 146 (15.8%) | 0 (0.0%) |
| 4-Person Households | 145 (15.6%) | 0 (0.0%) |
| 5-Person Households | 74 (8.0%) | 0 (0.0%) |
| 6-Person Households | 8 (0.9%) | 0 (0.0%) |
| 7+ Person Households | 2 (0.2%) | 0 (0.0%) |
| Total | 637 (68.7%) | 290 (31.3%) |
Female Fertility in Spirit Lake
Fertility by Age in Spirit Lake
Average fertility rate in Spirit Lake is 89.0 births per 1,000 women. Women in the age bracket of 20 to 34 years have the highest fertility rate with 173.0 births per 1,000 women. Women in the age bracket of 20 to 34 years acount for 77.8% of all women with births.
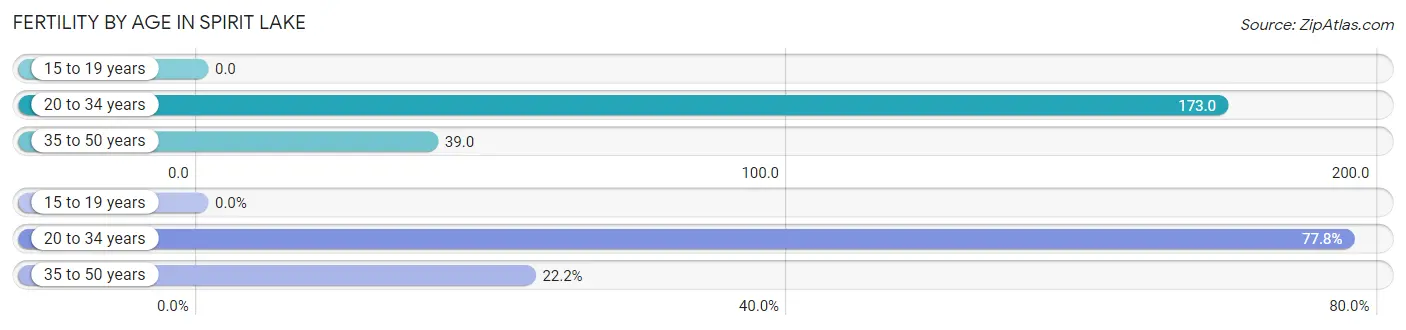
| Age Bracket | Women with Births | Births / 1,000 Women |
| 15 to 19 years | 0 (0.0%) | 0.0 |
| 20 to 34 years | 28 (77.8%) | 173.0 |
| 35 to 50 years | 8 (22.2%) | 39.0 |
| Total | 36 (100.0%) | 89.0 |
Fertility by Age by Marriage Status in Spirit Lake
66.7% of women with births (36) in Spirit Lake are married. The highest percentage of unmarried women with births falls into 20 to 34 years age bracket with 42.9% of them unmarried at the time of birth, while the lowest percentage of unmarried women with births belong to 35 to 50 years age bracket with 0.0% of them unmarried.
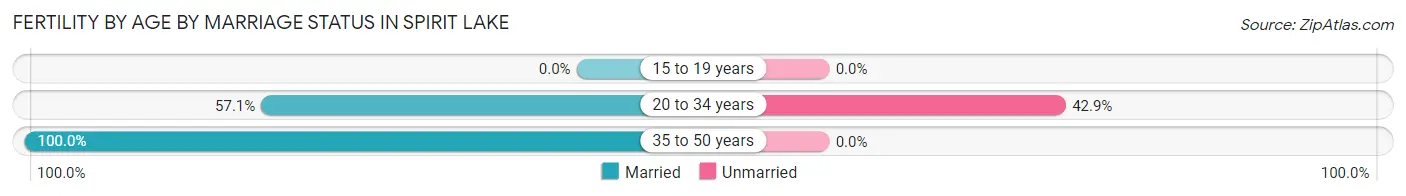
| Age Bracket | Married | Unmarried |
| 15 to 19 years | 0 (0.0%) | 0 (0.0%) |
| 20 to 34 years | 16 (57.1%) | 12 (42.9%) |
| 35 to 50 years | 8 (100.0%) | 0 (0.0%) |
| Total | 24 (66.7%) | 12 (33.3%) |
Fertility by Education in Spirit Lake
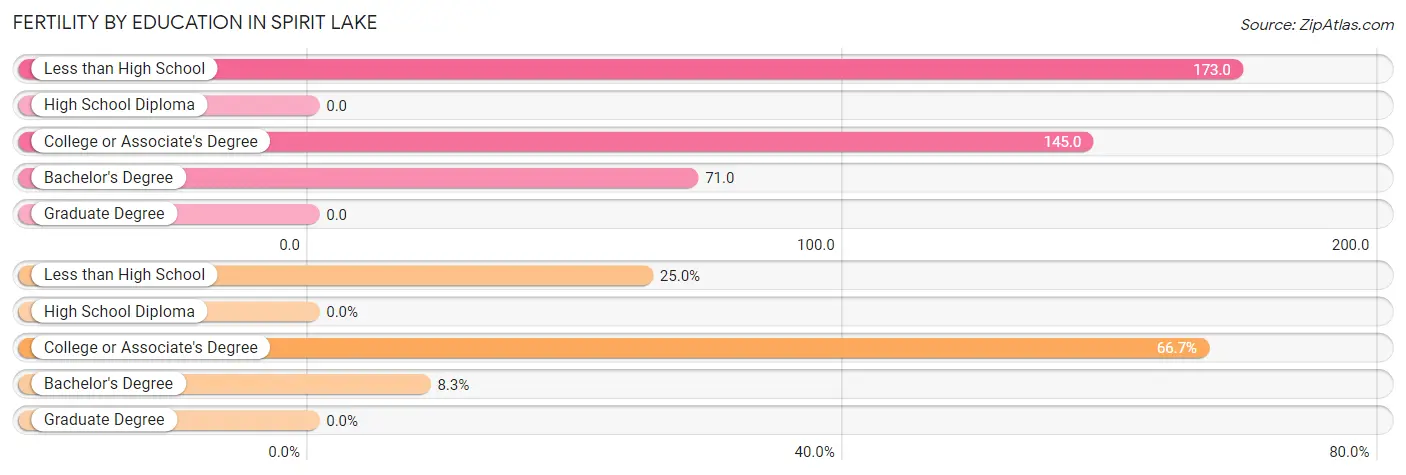
| Educational Attainment | Women with Births | Births / 1,000 Women |
| Less than High School | 9 (25.0%) | 173.0 |
| High School Diploma | 0 (0.0%) | 0.0 |
| College or Associate's Degree | 24 (66.7%) | 145.0 |
| Bachelor's Degree | 3 (8.3%) | 71.0 |
| Graduate Degree | 0 (0.0%) | 0.0 |
| Total | 36 (100.0%) | 89.0 |
Fertility by Education by Marriage Status in Spirit Lake
33.3% of women with births in Spirit Lake are unmarried. Women with the educational attainment of bachelor's degree are most likely to be married with 100.0% of them married at childbirth, while women with the educational attainment of less than high school are least likely to be married with 100.0% of them unmarried at childbirth.
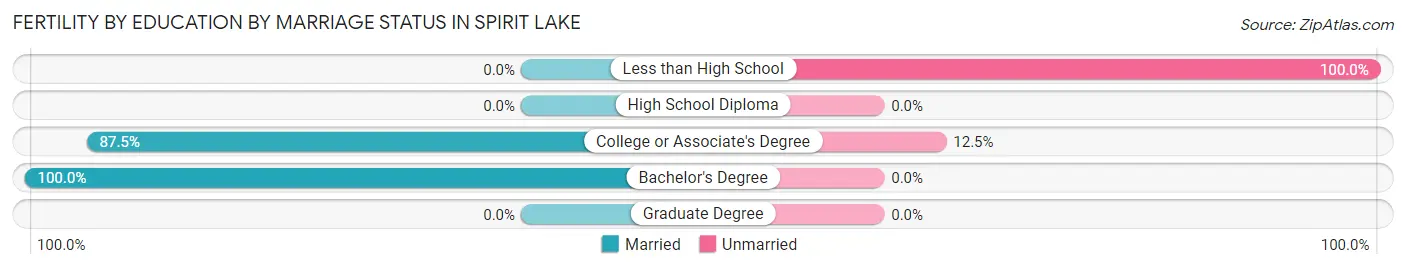
| Educational Attainment | Married | Unmarried |
| Less than High School | 0 (0.0%) | 9 (100.0%) |
| High School Diploma | 0 (0.0%) | 0 (0.0%) |
| College or Associate's Degree | 21 (87.5%) | 3 (12.5%) |
| Bachelor's Degree | 3 (100.0%) | 0 (0.0%) |
| Graduate Degree | 0 (0.0%) | 0 (0.0%) |
| Total | 24 (66.7%) | 12 (33.3%) |
Employment Characteristics in Spirit Lake
Employment by Class of Employer in Spirit Lake
Among the 1,048 employed individuals in Spirit Lake, private company employees (699 | 66.7%), local government employees (102 | 9.7%), and self-employed (incorporated) (78 | 7.4%) make up the most common classes of employment.
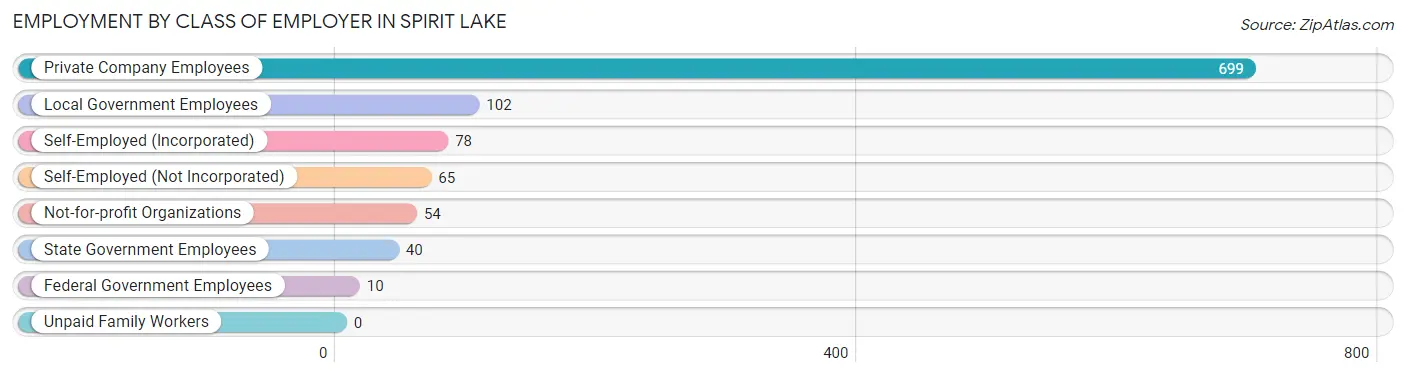
| Employer Class | # Employees | % Employees |
| Private Company Employees | 699 | 66.7% |
| Self-Employed (Incorporated) | 78 | 7.4% |
| Self-Employed (Not Incorporated) | 65 | 6.2% |
| Not-for-profit Organizations | 54 | 5.1% |
| Local Government Employees | 102 | 9.7% |
| State Government Employees | 40 | 3.8% |
| Federal Government Employees | 10 | 0.9% |
| Unpaid Family Workers | 0 | 0.0% |
| Total | 1,048 | 100.0% |
Employment Status by Age in Spirit Lake
According to the labor force statistics for Spirit Lake, out of the total population over 16 years of age (1,791), 62.1% or 1,112 individuals are in the labor force, with 3.8% or 42 of them unemployed. The age group with the highest labor force participation rate is 55 to 59 years, with 86.7% or 130 individuals in the labor force. Within the labor force, the 30 to 34 years age range has the highest percentage of unemployed individuals, with 18.2% or 20 of them being unemployed.
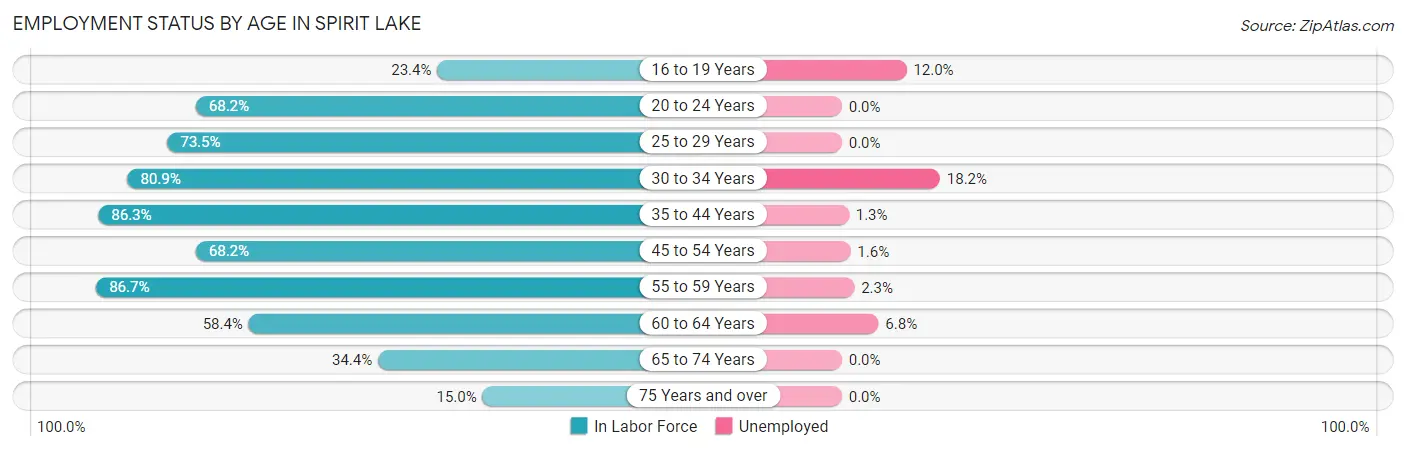
| Age Bracket | In Labor Force | Unemployed |
| 16 to 19 Years | 25 (23.4%) | 3 (12.0%) |
| 20 to 24 Years | 88 (68.2%) | 0 (0.0%) |
| 25 to 29 Years | 86 (73.5%) | 0 (0.0%) |
| 30 to 34 Years | 110 (80.9%) | 20 (18.2%) |
| 35 to 44 Years | 239 (86.3%) | 3 (1.3%) |
| 45 to 54 Years | 189 (68.2%) | 3 (1.6%) |
| 55 to 59 Years | 130 (86.7%) | 3 (2.3%) |
| 60 to 64 Years | 146 (58.4%) | 10 (6.8%) |
| 65 to 74 Years | 83 (34.4%) | 0 (0.0%) |
| 75 Years and over | 16 (15.0%) | 0 (0.0%) |
| Total | 1,112 (62.1%) | 42 (3.8%) |
Employment Status by Educational Attainment in Spirit Lake
According to labor force statistics for Spirit Lake, 74.6% of individuals (900) out of the total population between 25 and 64 years of age (1,207) are in the labor force, with 4.3% or 39 of them being unemployed. The group with the highest labor force participation rate are those with the educational attainment of bachelor's degree or higher, with 85.4% or 169 individuals in the labor force. Within the labor force, individuals with high school diploma education have the highest percentage of unemployment, with 9.8% or 26 of them being unemployed.
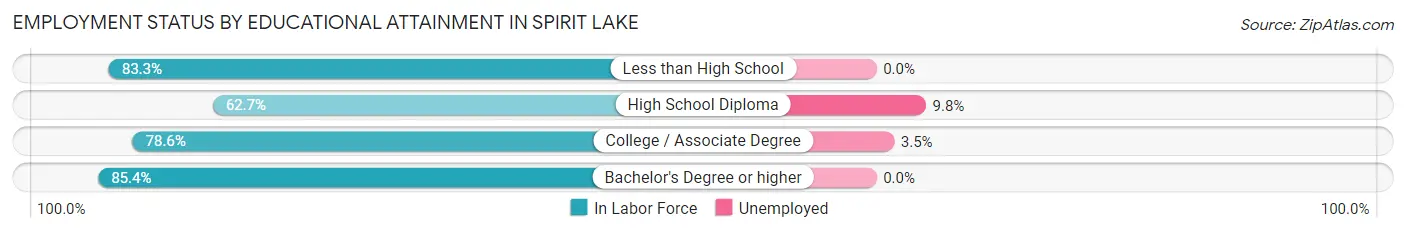
| Educational Attainment | In Labor Force | Unemployed |
| Less than High School | 95 (83.3%) | 0 (0.0%) |
| High School Diploma | 266 (62.7%) | 42 (9.8%) |
| College / Associate Degree | 370 (78.6%) | 16 (3.5%) |
| Bachelor's Degree or higher | 169 (85.4%) | 0 (0.0%) |
| Total | 900 (74.6%) | 52 (4.3%) |
Employment Occupations by Sex in Spirit Lake
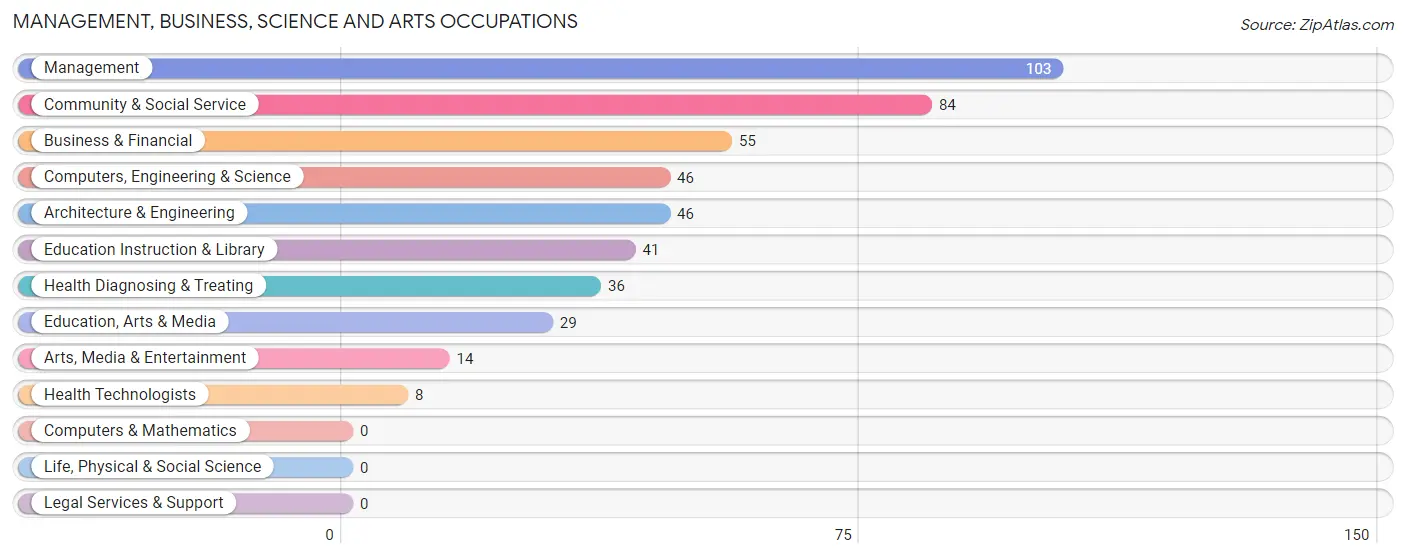
Management, Business, Science and Arts Occupations
The most common Management, Business, Science and Arts occupations in Spirit Lake are Management (103 | 9.6%), Community & Social Service (84 | 7.9%), Business & Financial (55 | 5.1%), Computers, Engineering & Science (46 | 4.3%), and Architecture & Engineering (46 | 4.3%).
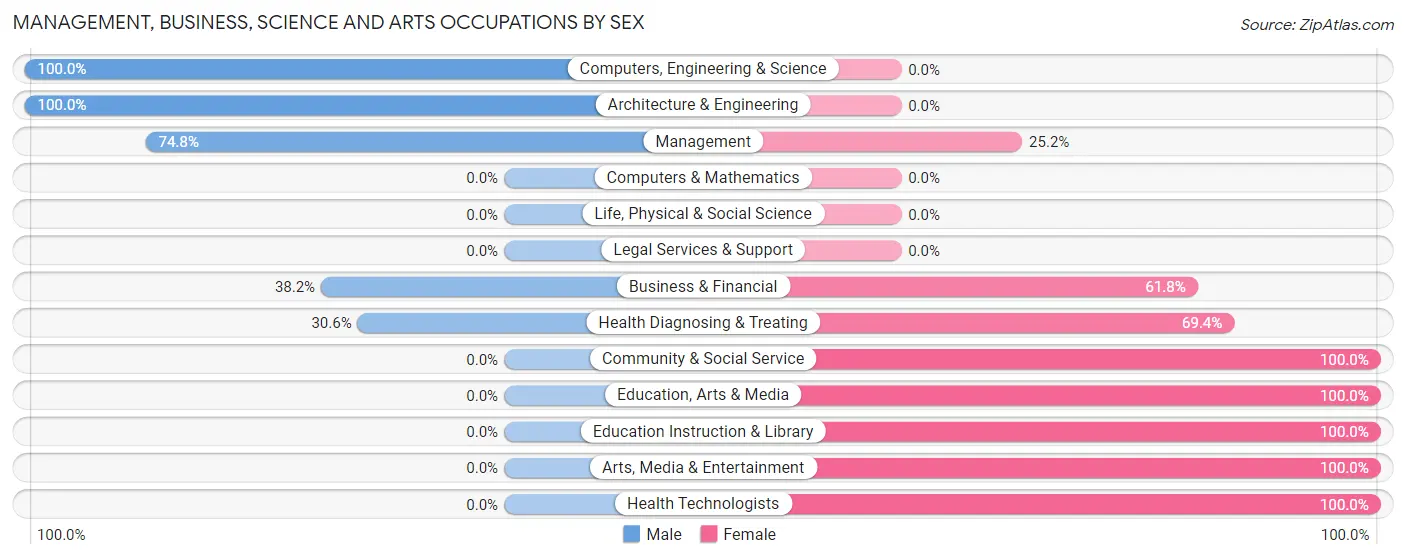
Management, Business, Science and Arts Occupations by Sex
Within the Management, Business, Science and Arts occupations in Spirit Lake, the most male-oriented occupations are Computers, Engineering & Science (100.0%), Architecture & Engineering (100.0%), and Management (74.8%), while the most female-oriented occupations are Community & Social Service (100.0%), Education, Arts & Media (100.0%), and Education Instruction & Library (100.0%).
| Occupation | Male | Female |
| Management | 77 (74.8%) | 26 (25.2%) |
| Business & Financial | 21 (38.2%) | 34 (61.8%) |
| Computers, Engineering & Science | 46 (100.0%) | 0 (0.0%) |
| Computers & Mathematics | 0 (0.0%) | 0 (0.0%) |
| Architecture & Engineering | 46 (100.0%) | 0 (0.0%) |
| Life, Physical & Social Science | 0 (0.0%) | 0 (0.0%) |
| Community & Social Service | 0 (0.0%) | 84 (100.0%) |
| Education, Arts & Media | 0 (0.0%) | 29 (100.0%) |
| Legal Services & Support | 0 (0.0%) | 0 (0.0%) |
| Education Instruction & Library | 0 (0.0%) | 41 (100.0%) |
| Arts, Media & Entertainment | 0 (0.0%) | 14 (100.0%) |
| Health Diagnosing & Treating | 11 (30.6%) | 25 (69.4%) |
| Health Technologists | 0 (0.0%) | 8 (100.0%) |
| Total (Category) | 155 (47.8%) | 169 (52.2%) |
| Total (Overall) | 634 (59.3%) | 436 (40.7%) |
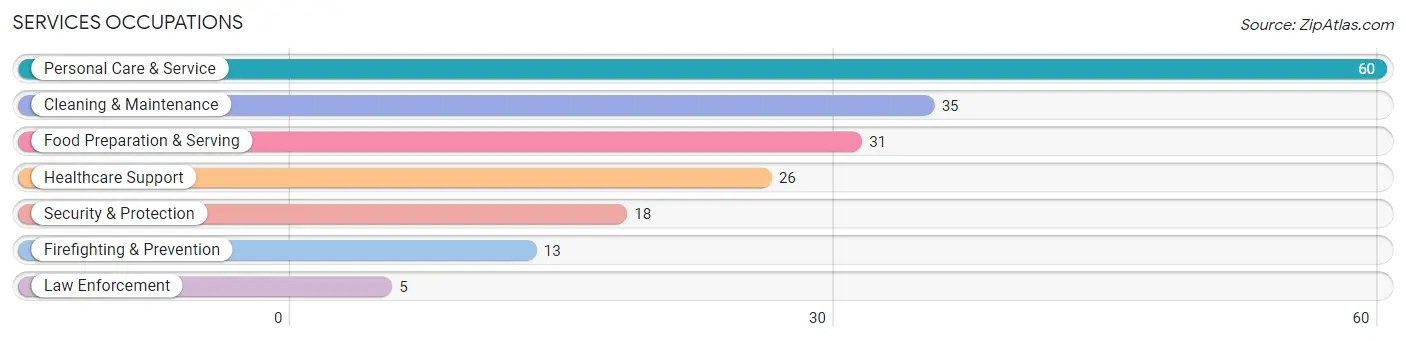
Services Occupations
The most common Services occupations in Spirit Lake are Personal Care & Service (60 | 5.6%), Cleaning & Maintenance (35 | 3.3%), Food Preparation & Serving (31 | 2.9%), Healthcare Support (26 | 2.4%), and Security & Protection (18 | 1.7%).
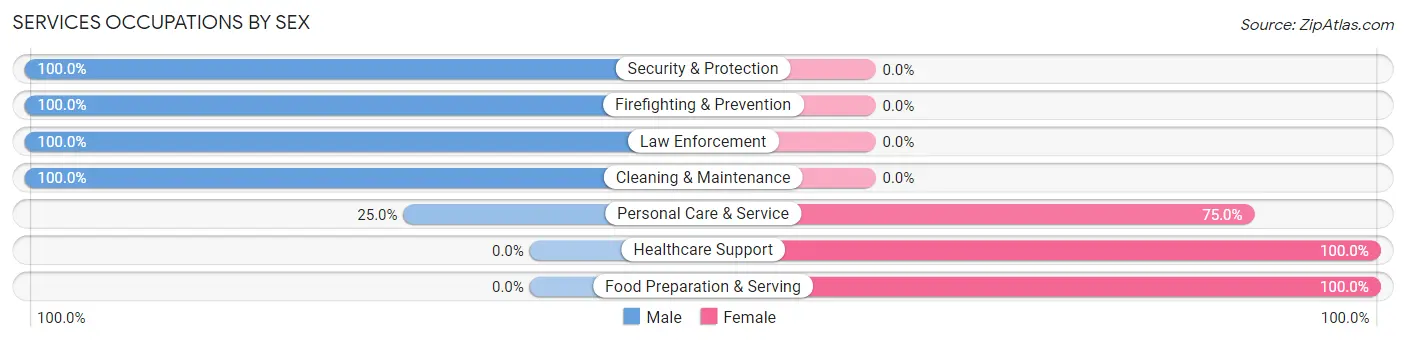
Services Occupations by Sex
Within the Services occupations in Spirit Lake, the most male-oriented occupations are Security & Protection (100.0%), Firefighting & Prevention (100.0%), and Law Enforcement (100.0%), while the most female-oriented occupations are Healthcare Support (100.0%), Food Preparation & Serving (100.0%), and Personal Care & Service (75.0%).
| Occupation | Male | Female |
| Healthcare Support | 0 (0.0%) | 26 (100.0%) |
| Security & Protection | 18 (100.0%) | 0 (0.0%) |
| Firefighting & Prevention | 13 (100.0%) | 0 (0.0%) |
| Law Enforcement | 5 (100.0%) | 0 (0.0%) |
| Food Preparation & Serving | 0 (0.0%) | 31 (100.0%) |
| Cleaning & Maintenance | 35 (100.0%) | 0 (0.0%) |
| Personal Care & Service | 15 (25.0%) | 45 (75.0%) |
| Total (Category) | 68 (40.0%) | 102 (60.0%) |
| Total (Overall) | 634 (59.3%) | 436 (40.7%) |
Sales and Office Occupations
The most common Sales and Office occupations in Spirit Lake are Sales & Related (184 | 17.2%), and Office & Administration (65 | 6.1%).
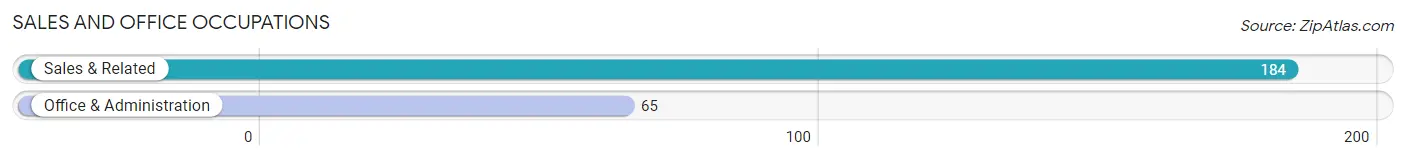
Sales and Office Occupations by Sex
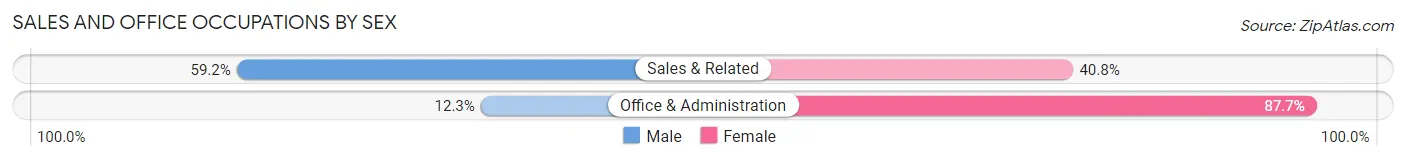
| Occupation | Male | Female |
| Sales & Related | 109 (59.2%) | 75 (40.8%) |
| Office & Administration | 8 (12.3%) | 57 (87.7%) |
| Total (Category) | 117 (47.0%) | 132 (53.0%) |
| Total (Overall) | 634 (59.3%) | 436 (40.7%) |
Natural Resources, Construction and Maintenance Occupations
The most common Natural Resources, Construction and Maintenance occupations in Spirit Lake are Construction & Extraction (122 | 11.4%), Installation, Maintenance & Repair (34 | 3.2%), and Farming, Fishing & Forestry (26 | 2.4%).
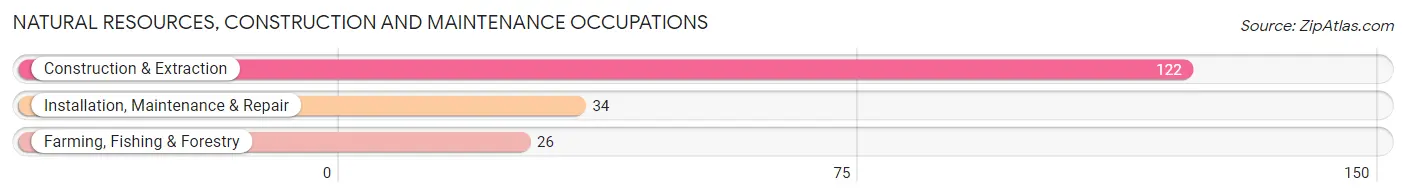
Natural Resources, Construction and Maintenance Occupations by Sex
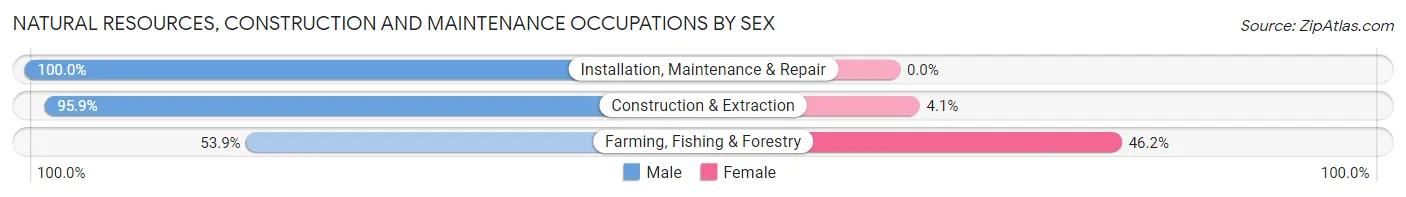
| Occupation | Male | Female |
| Farming, Fishing & Forestry | 14 (53.8%) | 12 (46.2%) |
| Construction & Extraction | 117 (95.9%) | 5 (4.1%) |
| Installation, Maintenance & Repair | 34 (100.0%) | 0 (0.0%) |
| Total (Category) | 165 (90.7%) | 17 (9.3%) |
| Total (Overall) | 634 (59.3%) | 436 (40.7%) |
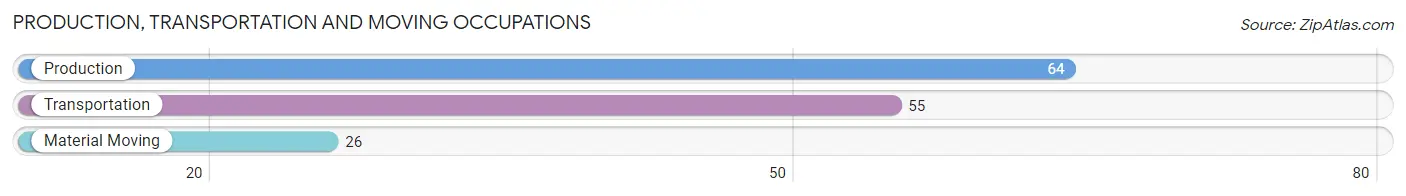
Production, Transportation and Moving Occupations
The most common Production, Transportation and Moving occupations in Spirit Lake are Production (64 | 6.0%), Transportation (55 | 5.1%), and Material Moving (26 | 2.4%).
Production, Transportation and Moving Occupations by Sex
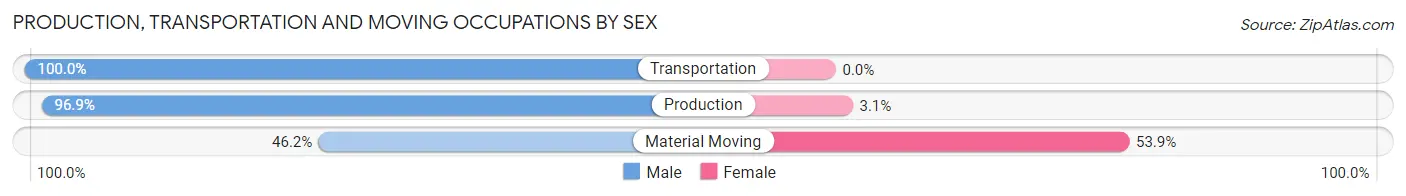
| Occupation | Male | Female |
| Production | 62 (96.9%) | 2 (3.1%) |
| Transportation | 55 (100.0%) | 0 (0.0%) |
| Material Moving | 12 (46.2%) | 14 (53.8%) |
| Total (Category) | 129 (89.0%) | 16 (11.0%) |
| Total (Overall) | 634 (59.3%) | 436 (40.7%) |
Employment Industries by Sex in Spirit Lake
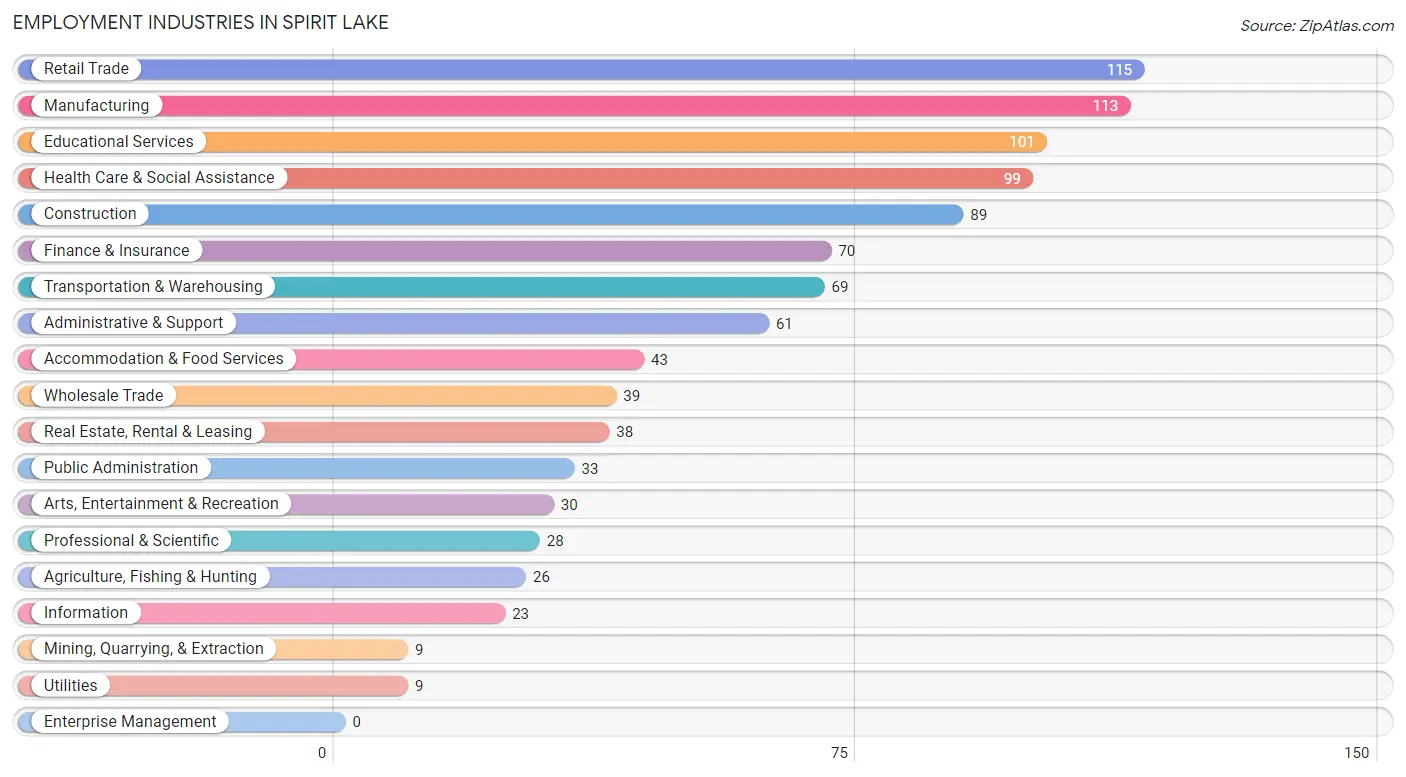
Employment Industries in Spirit Lake
The major employment industries in Spirit Lake include Retail Trade (115 | 10.7%), Manufacturing (113 | 10.6%), Educational Services (101 | 9.4%), Health Care & Social Assistance (99 | 9.2%), and Construction (89 | 8.3%).
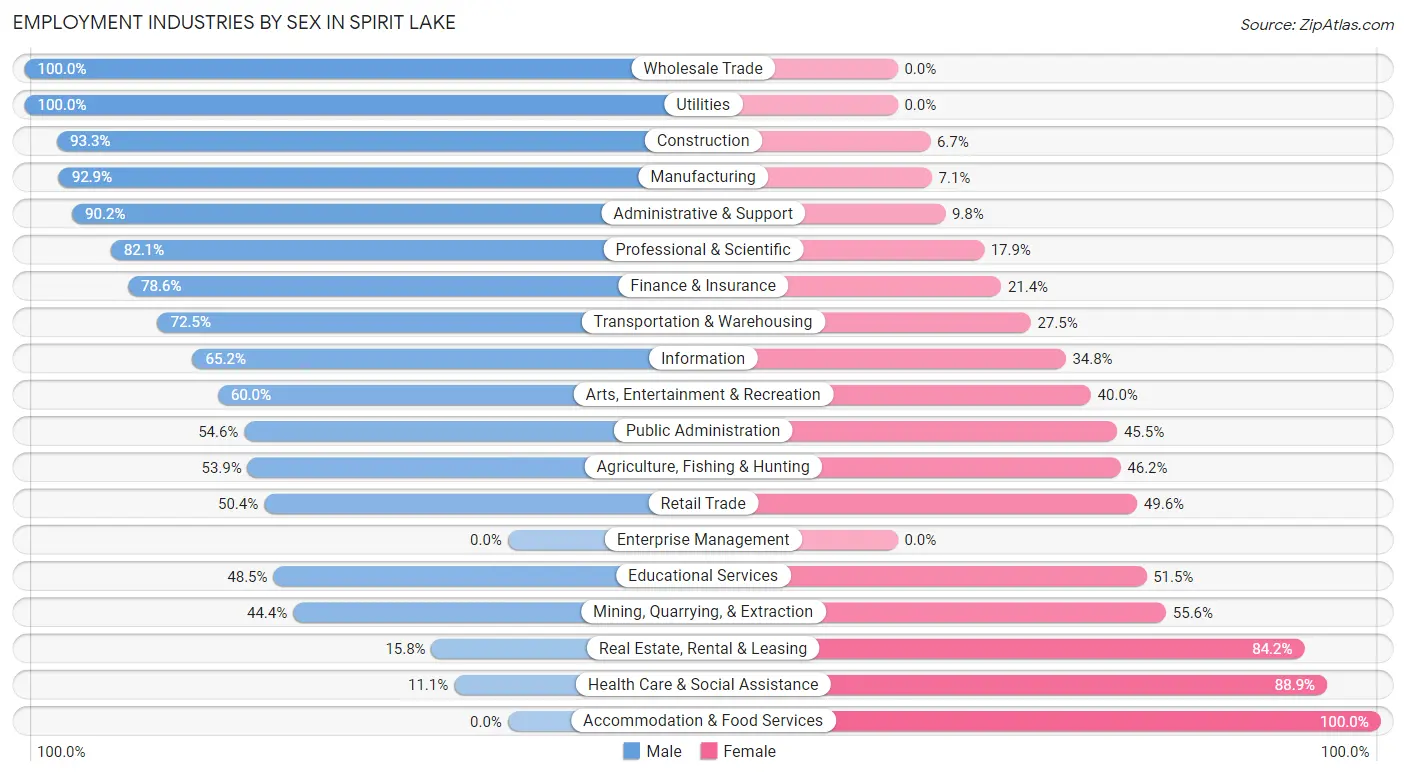
Employment Industries by Sex in Spirit Lake
The Spirit Lake industries that see more men than women are Wholesale Trade (100.0%), Utilities (100.0%), and Construction (93.3%), whereas the industries that tend to have a higher number of women are Accommodation & Food Services (100.0%), Health Care & Social Assistance (88.9%), and Real Estate, Rental & Leasing (84.2%).
| Industry | Male | Female |
| Agriculture, Fishing & Hunting | 14 (53.8%) | 12 (46.2%) |
| Mining, Quarrying, & Extraction | 4 (44.4%) | 5 (55.6%) |
| Construction | 83 (93.3%) | 6 (6.7%) |
| Manufacturing | 105 (92.9%) | 8 (7.1%) |
| Wholesale Trade | 39 (100.0%) | 0 (0.0%) |
| Retail Trade | 58 (50.4%) | 57 (49.6%) |
| Transportation & Warehousing | 50 (72.5%) | 19 (27.5%) |
| Utilities | 9 (100.0%) | 0 (0.0%) |
| Information | 15 (65.2%) | 8 (34.8%) |
| Finance & Insurance | 55 (78.6%) | 15 (21.4%) |
| Real Estate, Rental & Leasing | 6 (15.8%) | 32 (84.2%) |
| Professional & Scientific | 23 (82.1%) | 5 (17.9%) |
| Enterprise Management | 0 (0.0%) | 0 (0.0%) |
| Administrative & Support | 55 (90.2%) | 6 (9.8%) |
| Educational Services | 49 (48.5%) | 52 (51.5%) |
| Health Care & Social Assistance | 11 (11.1%) | 88 (88.9%) |
| Arts, Entertainment & Recreation | 18 (60.0%) | 12 (40.0%) |
| Accommodation & Food Services | 0 (0.0%) | 43 (100.0%) |
| Public Administration | 18 (54.5%) | 15 (45.5%) |
| Total | 634 (59.3%) | 436 (40.7%) |
Education in Spirit Lake
School Enrollment in Spirit Lake
The most common levels of schooling among the 478 students in Spirit Lake are middle school (143 | 29.9%), elementary school (127 | 26.6%), and high school (102 | 21.3%).

| School Level | # Students | % Students |
| Nursery / Preschool | 25 | 5.2% |
| Kindergarten | 15 | 3.1% |
| Elementary School | 127 | 26.6% |
| Middle School | 143 | 29.9% |
| High School | 102 | 21.3% |
| College / Undergraduate | 66 | 13.8% |
| Graduate / Professional | 0 | 0.0% |
| Total | 478 | 100.0% |
School Enrollment by Age by Funding Source in Spirit Lake
Out of a total of 478 students who are enrolled in schools in Spirit Lake, 44 (9.2%) attend a private institution, while the remaining 434 (90.8%) are enrolled in public schools. The age group of 35 years and over has the highest likelihood of being enrolled in private schools, with 4 (100.0% in the age bracket) enrolled. Conversely, the age group of 15 to 17 year olds has the lowest likelihood of being enrolled in a private school, with 34 (100.0% in the age bracket) attending a public institution.
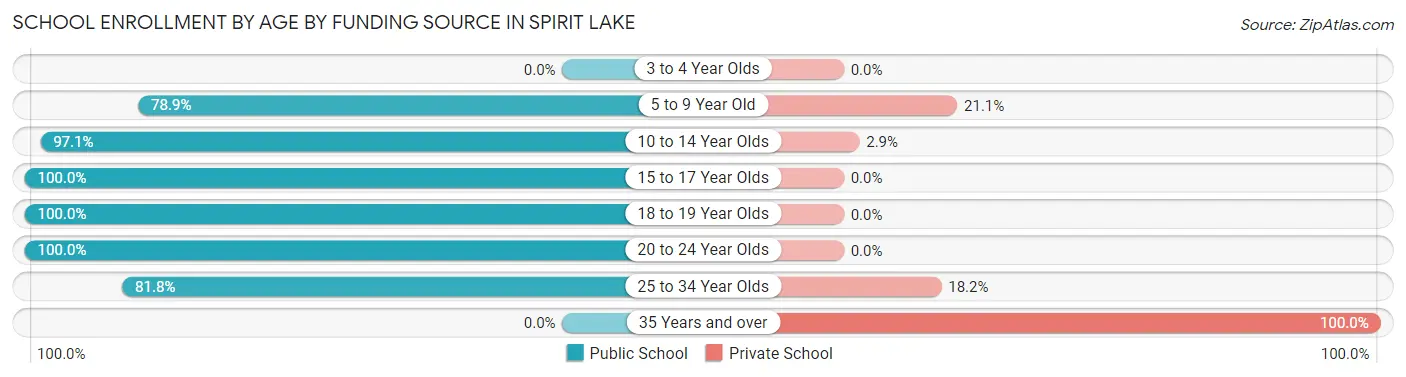
| Age Bracket | Public School | Private School |
| 3 to 4 Year Olds | 0 (0.0%) | 0 (0.0%) |
| 5 to 9 Year Old | 112 (78.9%) | 30 (21.1%) |
| 10 to 14 Year Olds | 200 (97.1%) | 6 (2.9%) |
| 15 to 17 Year Olds | 34 (100.0%) | 0 (0.0%) |
| 18 to 19 Year Olds | 56 (100.0%) | 0 (0.0%) |
| 20 to 24 Year Olds | 14 (100.0%) | 0 (0.0%) |
| 25 to 34 Year Olds | 18 (81.8%) | 4 (18.2%) |
| 35 Years and over | 0 (0.0%) | 4 (100.0%) |
| Total | 434 (90.8%) | 44 (9.2%) |
Educational Attainment by Field of Study in Spirit Lake
Business (69 | 21.2%), bio, nature & agricultural (39 | 12.0%), education (36 | 11.1%), psychology (30 | 9.2%), and arts & humanities (26 | 8.0%) are the most common fields of study among 325 individuals in Spirit Lake who have obtained a bachelor's degree or higher.
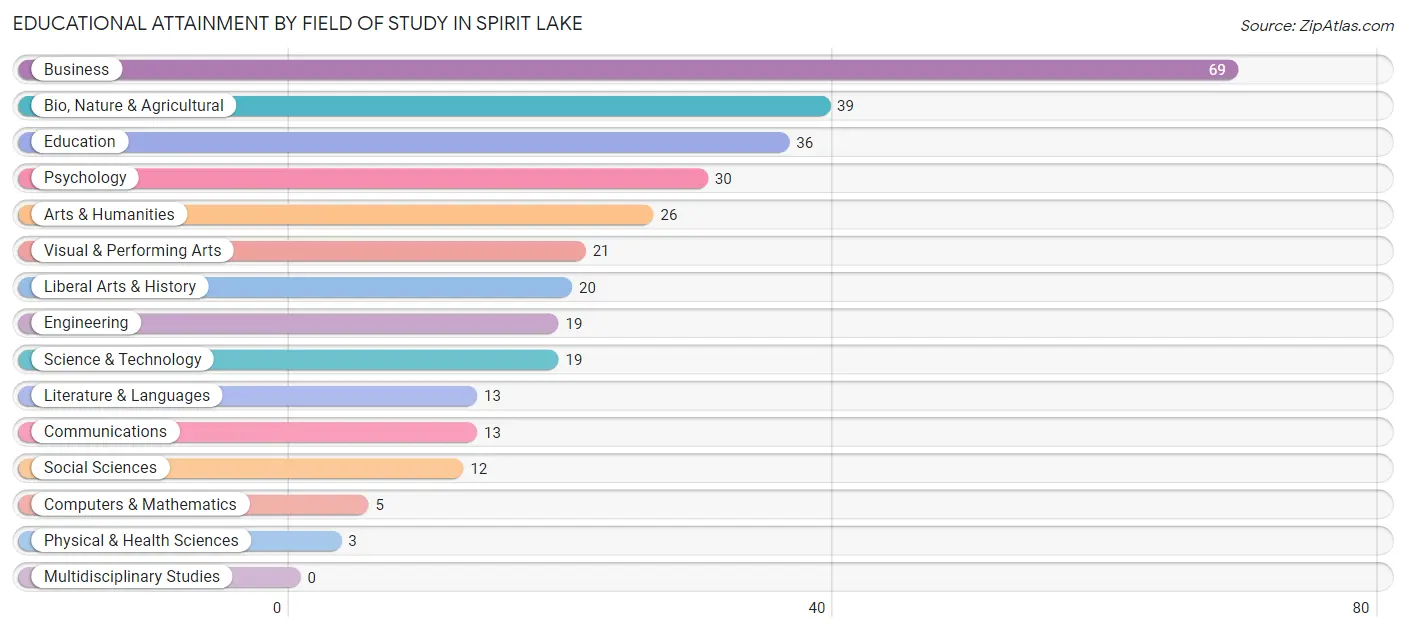
| Field of Study | # Graduates | % Graduates |
| Computers & Mathematics | 5 | 1.5% |
| Bio, Nature & Agricultural | 39 | 12.0% |
| Physical & Health Sciences | 3 | 0.9% |
| Psychology | 30 | 9.2% |
| Social Sciences | 12 | 3.7% |
| Engineering | 19 | 5.9% |
| Multidisciplinary Studies | 0 | 0.0% |
| Science & Technology | 19 | 5.9% |
| Business | 69 | 21.2% |
| Education | 36 | 11.1% |
| Literature & Languages | 13 | 4.0% |
| Liberal Arts & History | 20 | 6.1% |
| Visual & Performing Arts | 21 | 6.5% |
| Communications | 13 | 4.0% |
| Arts & Humanities | 26 | 8.0% |
| Total | 325 | 100.0% |
Transportation & Commute in Spirit Lake
Vehicle Availability by Sex in Spirit Lake
The most prevalent vehicle ownership categories in Spirit Lake are males with 2 vehicles (236, accounting for 38.4%) and females with 2 vehicles (125, making up 55.3%).
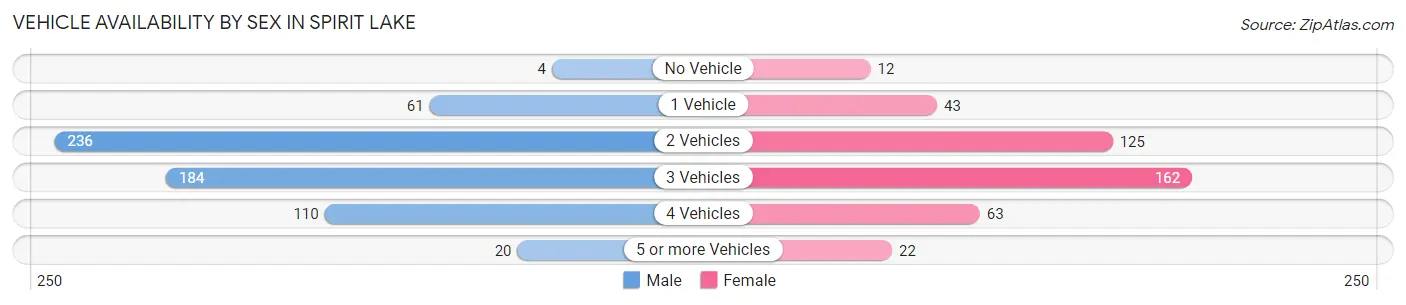
| Vehicles Available | Male | Female |
| No Vehicle | 4 (0.6%) | 12 (2.8%) |
| 1 Vehicle | 61 (9.9%) | 43 (10.1%) |
| 2 Vehicles | 236 (38.4%) | 125 (29.3%) |
| 3 Vehicles | 184 (29.9%) | 162 (37.9%) |
| 4 Vehicles | 110 (17.9%) | 63 (14.7%) |
| 5 or more Vehicles | 20 (3.3%) | 22 (5.1%) |
| Total | 615 (100.0%) | 427 (100.0%) |
Commute Time in Spirit Lake
The most frequently occuring commute durations in Spirit Lake are 30 to 34 minutes (193 commuters, 21.4%), 45 to 59 minutes (126 commuters, 14.0%), and 35 to 39 minutes (90 commuters, 10.0%).
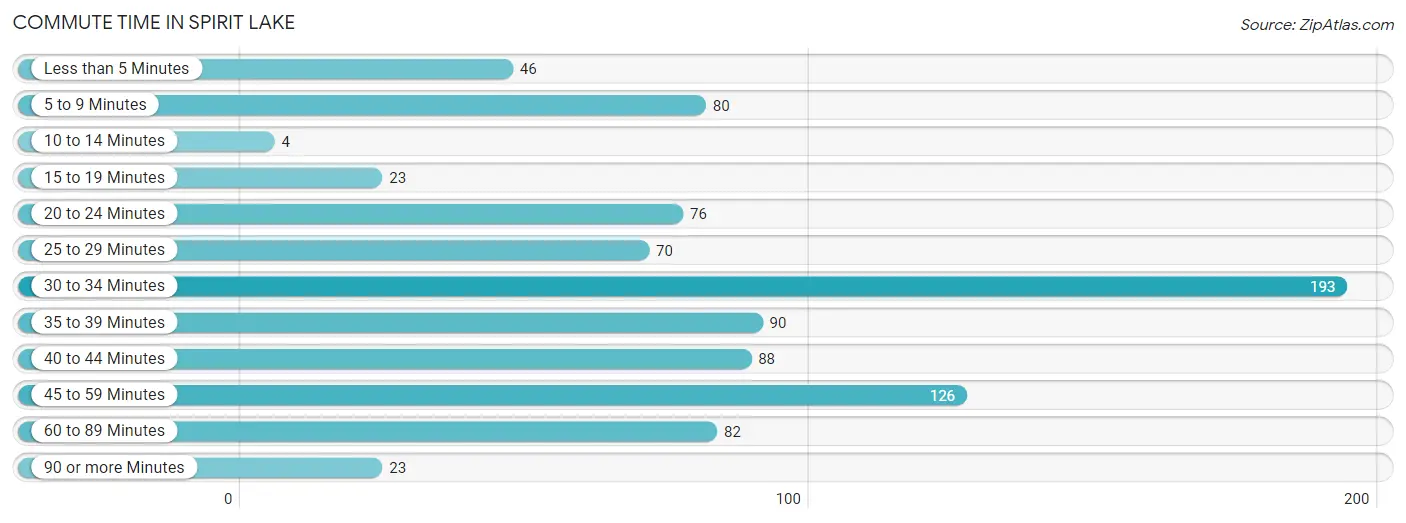
| Commute Time | # Commuters | % Commuters |
| Less than 5 Minutes | 46 | 5.1% |
| 5 to 9 Minutes | 80 | 8.9% |
| 10 to 14 Minutes | 4 | 0.4% |
| 15 to 19 Minutes | 23 | 2.5% |
| 20 to 24 Minutes | 76 | 8.4% |
| 25 to 29 Minutes | 70 | 7.8% |
| 30 to 34 Minutes | 193 | 21.4% |
| 35 to 39 Minutes | 90 | 10.0% |
| 40 to 44 Minutes | 88 | 9.8% |
| 45 to 59 Minutes | 126 | 14.0% |
| 60 to 89 Minutes | 82 | 9.1% |
| 90 or more Minutes | 23 | 2.5% |
Commute Time by Sex in Spirit Lake
The most common commute times in Spirit Lake are 30 to 34 minutes (138 commuters, 24.9%) for males and 35 to 39 minutes (60 commuters, 17.2%) for females.
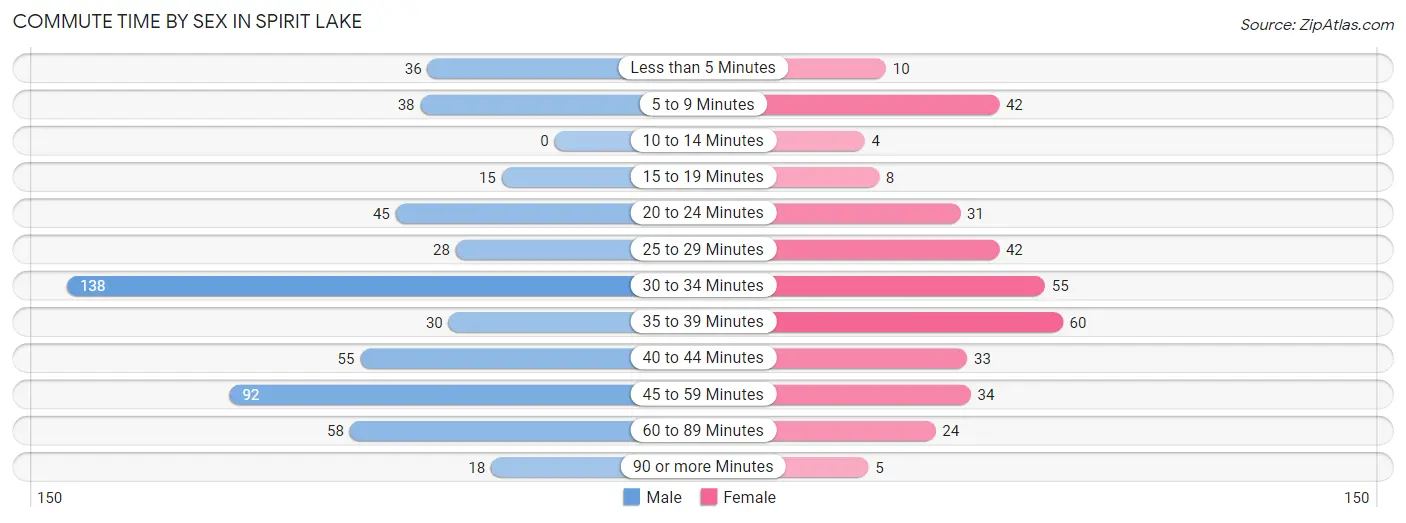
| Commute Time | Male | Female |
| Less than 5 Minutes | 36 (6.5%) | 10 (2.9%) |
| 5 to 9 Minutes | 38 (6.9%) | 42 (12.1%) |
| 10 to 14 Minutes | 0 (0.0%) | 4 (1.1%) |
| 15 to 19 Minutes | 15 (2.7%) | 8 (2.3%) |
| 20 to 24 Minutes | 45 (8.1%) | 31 (8.9%) |
| 25 to 29 Minutes | 28 (5.1%) | 42 (12.1%) |
| 30 to 34 Minutes | 138 (24.9%) | 55 (15.8%) |
| 35 to 39 Minutes | 30 (5.4%) | 60 (17.2%) |
| 40 to 44 Minutes | 55 (10.0%) | 33 (9.5%) |
| 45 to 59 Minutes | 92 (16.6%) | 34 (9.8%) |
| 60 to 89 Minutes | 58 (10.5%) | 24 (6.9%) |
| 90 or more Minutes | 18 (3.3%) | 5 (1.4%) |
Time of Departure to Work by Sex in Spirit Lake
The most frequent times of departure to work in Spirit Lake are 12:00 AM to 4:59 AM (163, 29.5%) for males and 7:30 AM to 7:59 AM (59, 17.0%) for females.
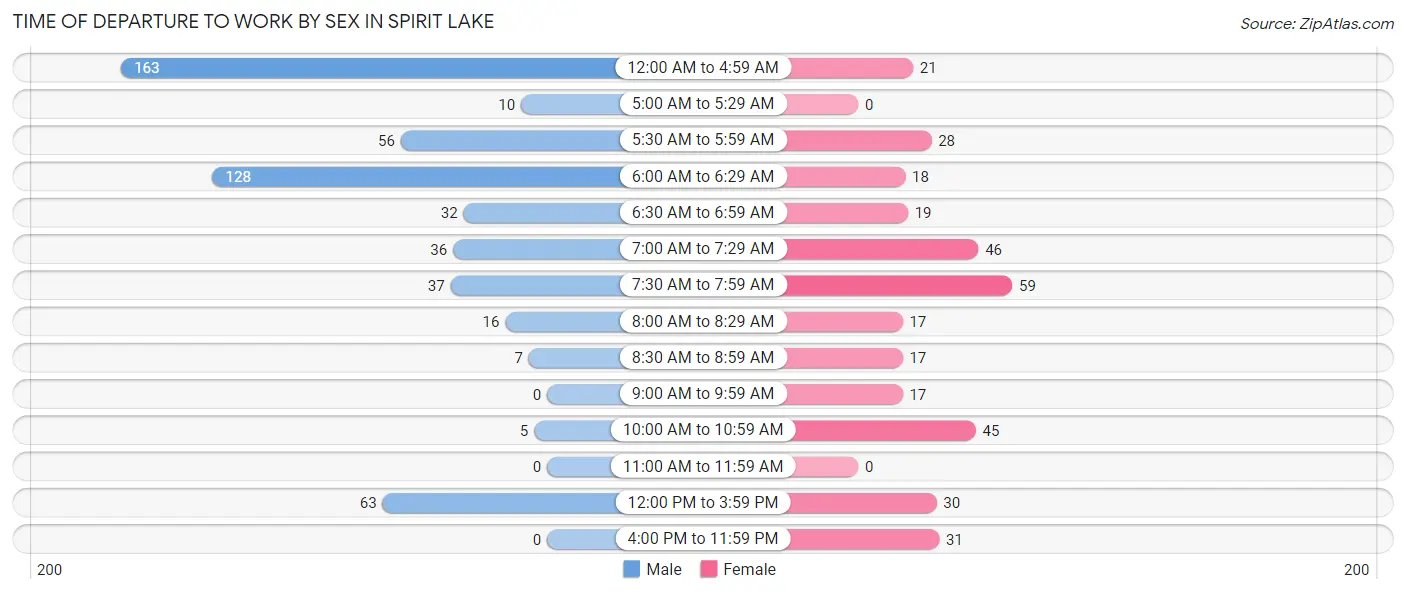
| Time of Departure | Male | Female |
| 12:00 AM to 4:59 AM | 163 (29.5%) | 21 (6.0%) |
| 5:00 AM to 5:29 AM | 10 (1.8%) | 0 (0.0%) |
| 5:30 AM to 5:59 AM | 56 (10.1%) | 28 (8.1%) |
| 6:00 AM to 6:29 AM | 128 (23.2%) | 18 (5.2%) |
| 6:30 AM to 6:59 AM | 32 (5.8%) | 19 (5.5%) |
| 7:00 AM to 7:29 AM | 36 (6.5%) | 46 (13.2%) |
| 7:30 AM to 7:59 AM | 37 (6.7%) | 59 (17.0%) |
| 8:00 AM to 8:29 AM | 16 (2.9%) | 17 (4.9%) |
| 8:30 AM to 8:59 AM | 7 (1.3%) | 17 (4.9%) |
| 9:00 AM to 9:59 AM | 0 (0.0%) | 17 (4.9%) |
| 10:00 AM to 10:59 AM | 5 (0.9%) | 45 (12.9%) |
| 11:00 AM to 11:59 AM | 0 (0.0%) | 0 (0.0%) |
| 12:00 PM to 3:59 PM | 63 (11.4%) | 30 (8.6%) |
| 4:00 PM to 11:59 PM | 0 (0.0%) | 31 (8.9%) |
| Total | 553 (100.0%) | 348 (100.0%) |
Housing Occupancy in Spirit Lake
Occupancy by Ownership in Spirit Lake
Of the total 927 dwellings in Spirit Lake, owner-occupied units account for 810 (87.4%), while renter-occupied units make up 117 (12.6%).
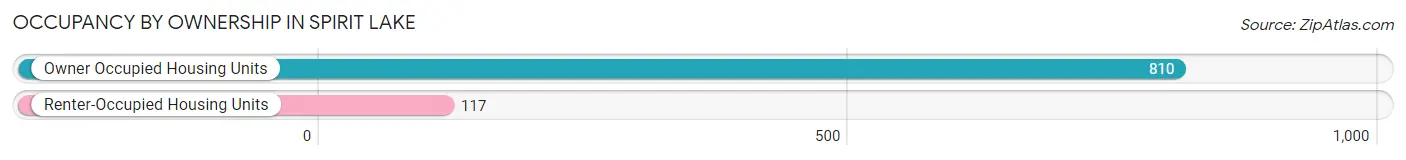
| Occupancy | # Housing Units | % Housing Units |
| Owner Occupied Housing Units | 810 | 87.4% |
| Renter-Occupied Housing Units | 117 | 12.6% |
| Total Occupied Housing Units | 927 | 100.0% |
Occupancy by Household Size in Spirit Lake
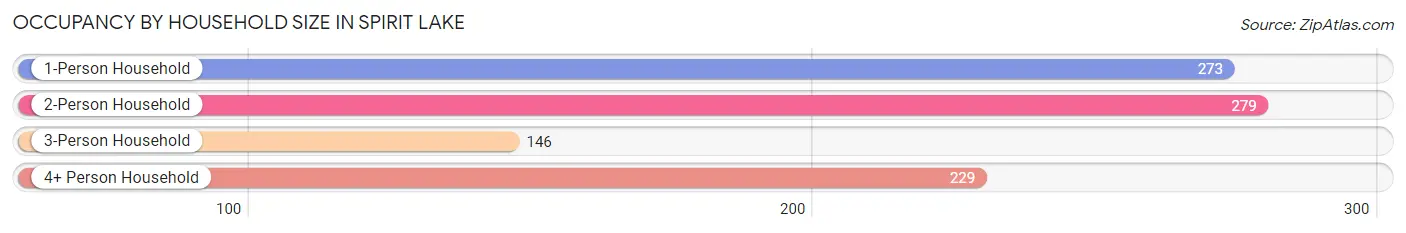
| Household Size | # Housing Units | % Housing Units |
| 1-Person Household | 273 | 29.4% |
| 2-Person Household | 279 | 30.1% |
| 3-Person Household | 146 | 15.8% |
| 4+ Person Household | 229 | 24.7% |
| Total Housing Units | 927 | 100.0% |
Occupancy by Ownership by Household Size in Spirit Lake
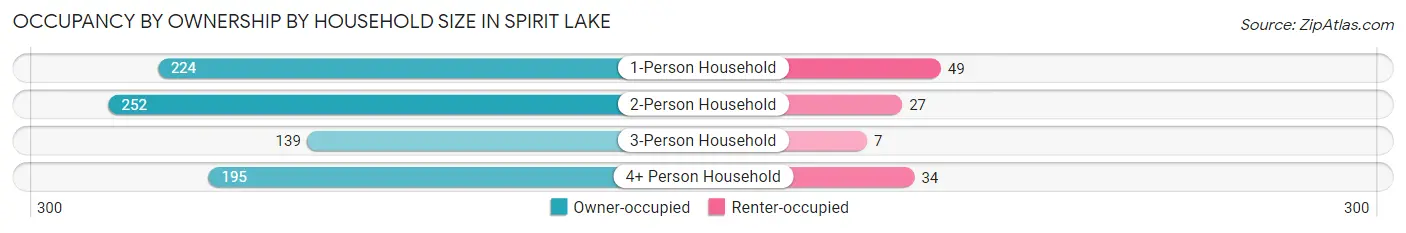
| Household Size | Owner-occupied | Renter-occupied |
| 1-Person Household | 224 (82.1%) | 49 (17.9%) |
| 2-Person Household | 252 (90.3%) | 27 (9.7%) |
| 3-Person Household | 139 (95.2%) | 7 (4.8%) |
| 4+ Person Household | 195 (85.2%) | 34 (14.8%) |
| Total Housing Units | 810 (87.4%) | 117 (12.6%) |
Occupancy by Educational Attainment in Spirit Lake
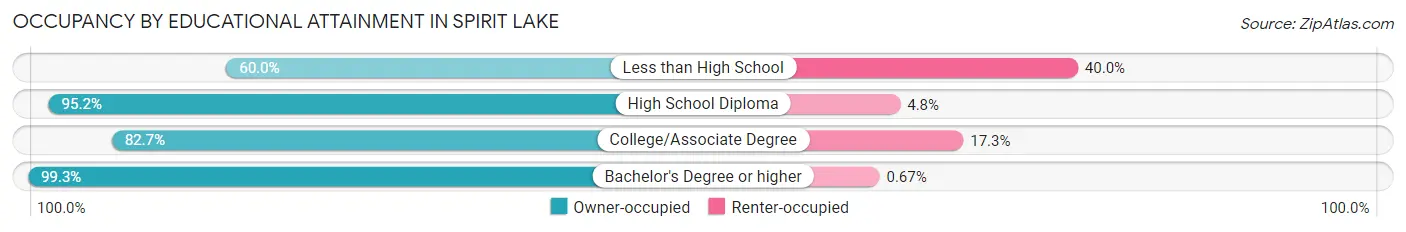
| Household Size | Owner-occupied | Renter-occupied |
| Less than High School | 48 (60.0%) | 32 (40.0%) |
| High School Diploma | 279 (95.2%) | 14 (4.8%) |
| College/Associate Degree | 335 (82.7%) | 70 (17.3%) |
| Bachelor's Degree or higher | 148 (99.3%) | 1 (0.7%) |
Occupancy by Age of Householder in Spirit Lake
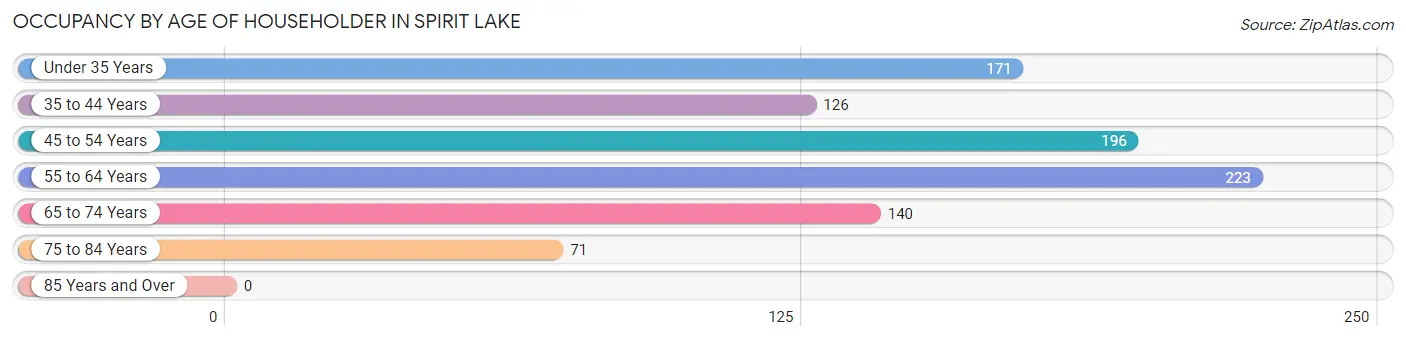
| Age Bracket | # Households | % Households |
| Under 35 Years | 171 | 18.4% |
| 35 to 44 Years | 126 | 13.6% |
| 45 to 54 Years | 196 | 21.1% |
| 55 to 64 Years | 223 | 24.1% |
| 65 to 74 Years | 140 | 15.1% |
| 75 to 84 Years | 71 | 7.7% |
| 85 Years and Over | 0 | 0.0% |
| Total | 927 | 100.0% |
Housing Finances in Spirit Lake
Median Income by Occupancy in Spirit Lake
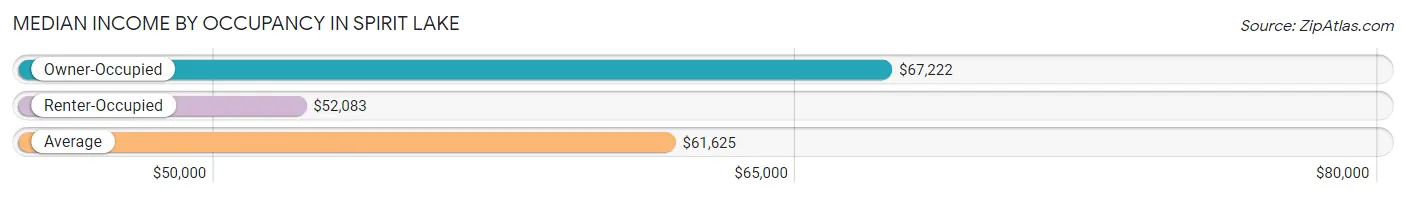
| Occupancy Type | # Households | Median Income |
| Owner-Occupied | 810 (87.4%) | $67,222 |
| Renter-Occupied | 117 (12.6%) | $52,083 |
| Average | 927 (100.0%) | $61,625 |
Occupancy by Householder Income Bracket in Spirit Lake
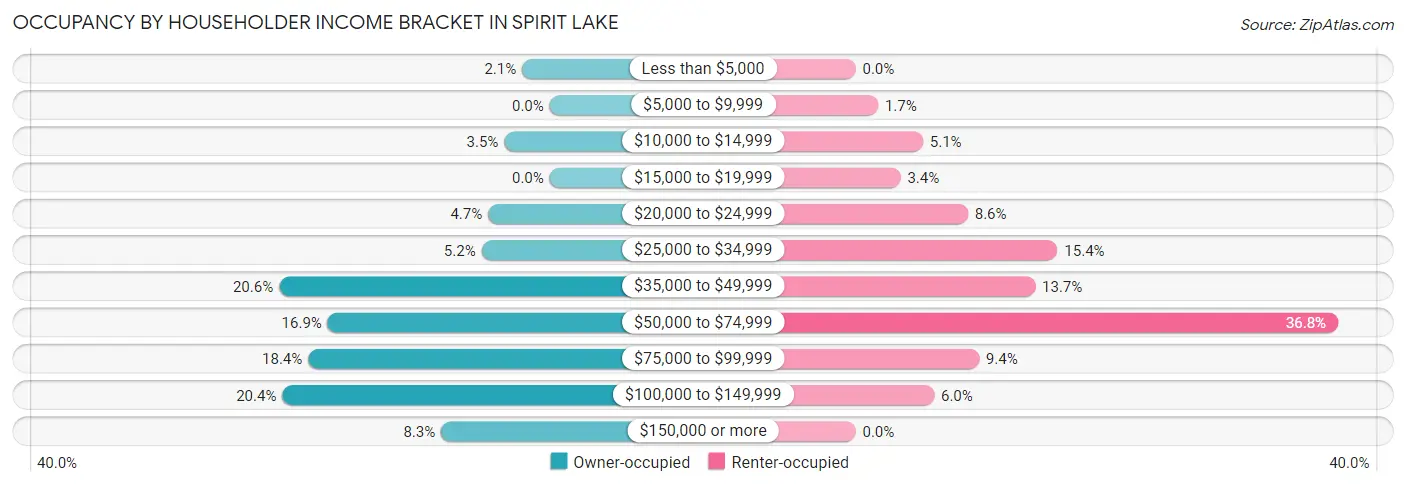
| Income Bracket | Owner-occupied | Renter-occupied |
| Less than $5,000 | 17 (2.1%) | 0 (0.0%) |
| $5,000 to $9,999 | 0 (0.0%) | 2 (1.7%) |
| $10,000 to $14,999 | 28 (3.5%) | 6 (5.1%) |
| $15,000 to $19,999 | 0 (0.0%) | 4 (3.4%) |
| $20,000 to $24,999 | 38 (4.7%) | 10 (8.6%) |
| $25,000 to $34,999 | 42 (5.2%) | 18 (15.4%) |
| $35,000 to $49,999 | 167 (20.6%) | 16 (13.7%) |
| $50,000 to $74,999 | 137 (16.9%) | 43 (36.7%) |
| $75,000 to $99,999 | 149 (18.4%) | 11 (9.4%) |
| $100,000 to $149,999 | 165 (20.4%) | 7 (6.0%) |
| $150,000 or more | 67 (8.3%) | 0 (0.0%) |
| Total | 810 (100.0%) | 117 (100.0%) |
Monthly Housing Cost Tiers in Spirit Lake
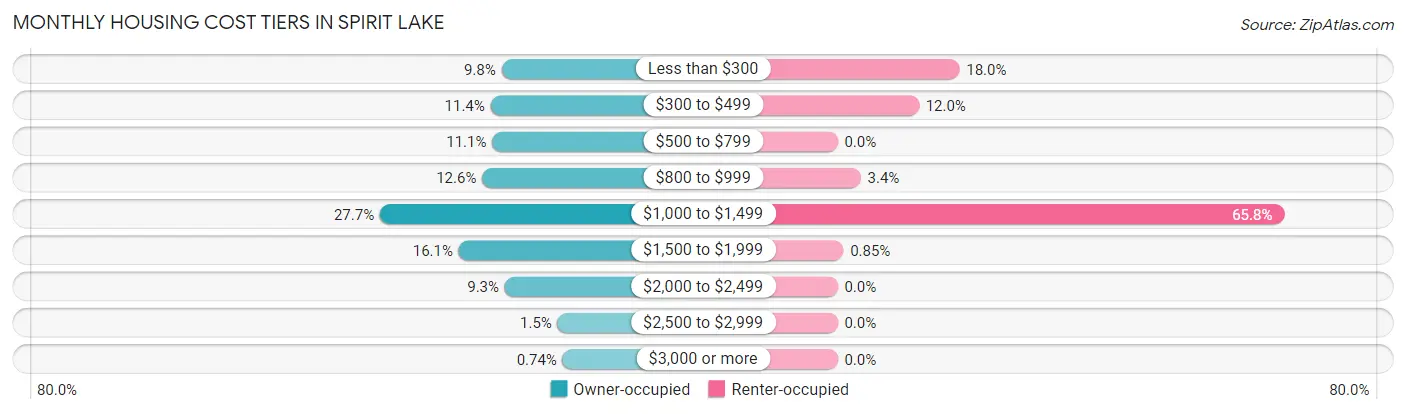
| Monthly Cost | Owner-occupied | Renter-occupied |
| Less than $300 | 79 (9.8%) | 21 (17.9%) |
| $300 to $499 | 92 (11.4%) | 14 (12.0%) |
| $500 to $799 | 90 (11.1%) | 0 (0.0%) |
| $800 to $999 | 102 (12.6%) | 4 (3.4%) |
| $1,000 to $1,499 | 224 (27.7%) | 77 (65.8%) |
| $1,500 to $1,999 | 130 (16.1%) | 1 (0.9%) |
| $2,000 to $2,499 | 75 (9.3%) | 0 (0.0%) |
| $2,500 to $2,999 | 12 (1.5%) | 0 (0.0%) |
| $3,000 or more | 6 (0.7%) | 0 (0.0%) |
| Total | 810 (100.0%) | 117 (100.0%) |
Physical Housing Characteristics in Spirit Lake
Housing Structures in Spirit Lake
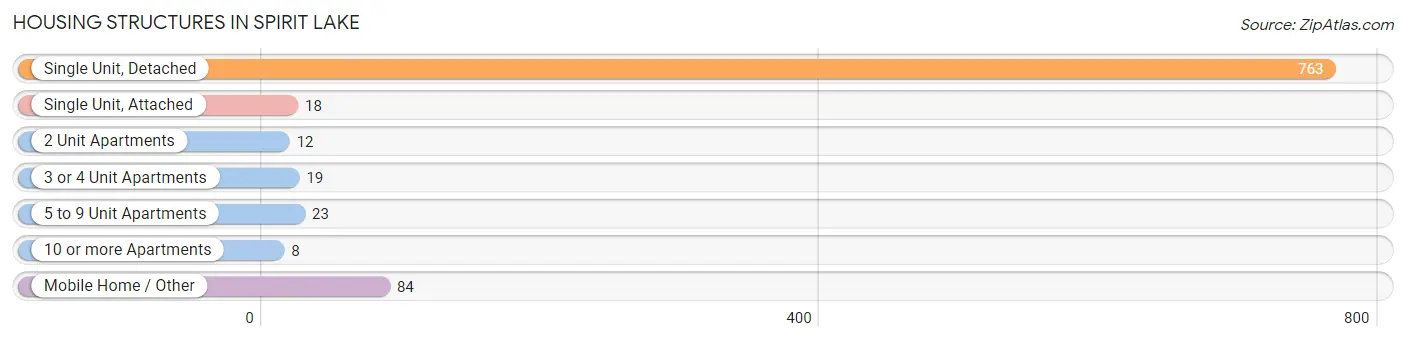
| Structure Type | # Housing Units | % Housing Units |
| Single Unit, Detached | 763 | 82.3% |
| Single Unit, Attached | 18 | 1.9% |
| 2 Unit Apartments | 12 | 1.3% |
| 3 or 4 Unit Apartments | 19 | 2.1% |
| 5 to 9 Unit Apartments | 23 | 2.5% |
| 10 or more Apartments | 8 | 0.9% |
| Mobile Home / Other | 84 | 9.1% |
| Total | 927 | 100.0% |
Housing Structures by Occupancy in Spirit Lake
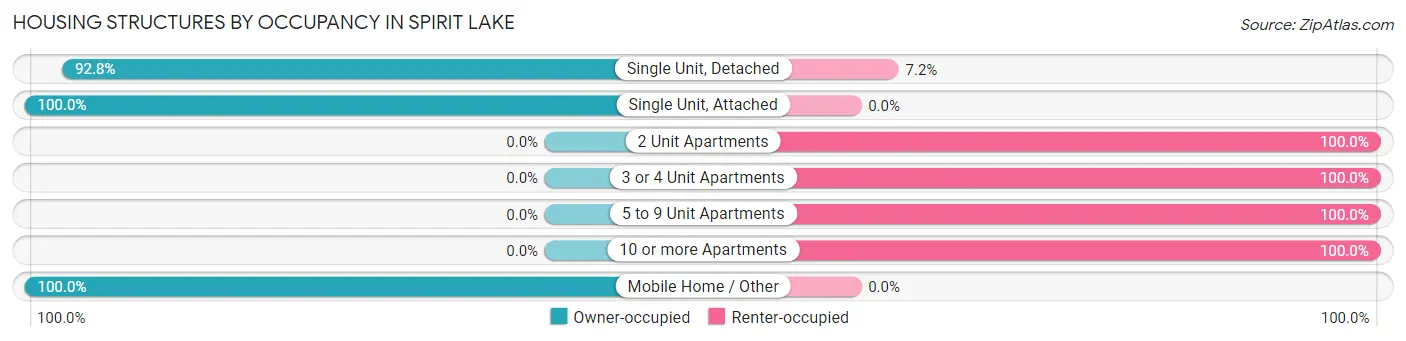
| Structure Type | Owner-occupied | Renter-occupied |
| Single Unit, Detached | 708 (92.8%) | 55 (7.2%) |
| Single Unit, Attached | 18 (100.0%) | 0 (0.0%) |
| 2 Unit Apartments | 0 (0.0%) | 12 (100.0%) |
| 3 or 4 Unit Apartments | 0 (0.0%) | 19 (100.0%) |
| 5 to 9 Unit Apartments | 0 (0.0%) | 23 (100.0%) |
| 10 or more Apartments | 0 (0.0%) | 8 (100.0%) |
| Mobile Home / Other | 84 (100.0%) | 0 (0.0%) |
| Total | 810 (87.4%) | 117 (12.6%) |
Housing Structures by Number of Rooms in Spirit Lake
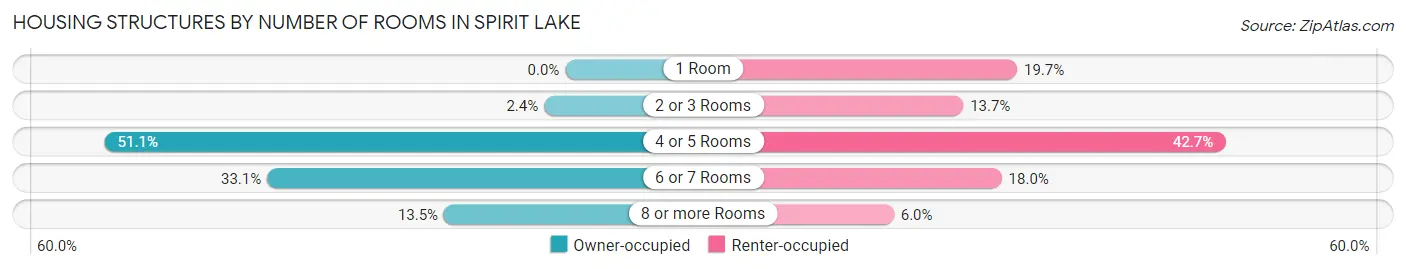
| Number of Rooms | Owner-occupied | Renter-occupied |
| 1 Room | 0 (0.0%) | 23 (19.7%) |
| 2 or 3 Rooms | 19 (2.4%) | 16 (13.7%) |
| 4 or 5 Rooms | 414 (51.1%) | 50 (42.7%) |
| 6 or 7 Rooms | 268 (33.1%) | 21 (17.9%) |
| 8 or more Rooms | 109 (13.5%) | 7 (6.0%) |
| Total | 810 (100.0%) | 117 (100.0%) |
Housing Structure by Heating Type in Spirit Lake
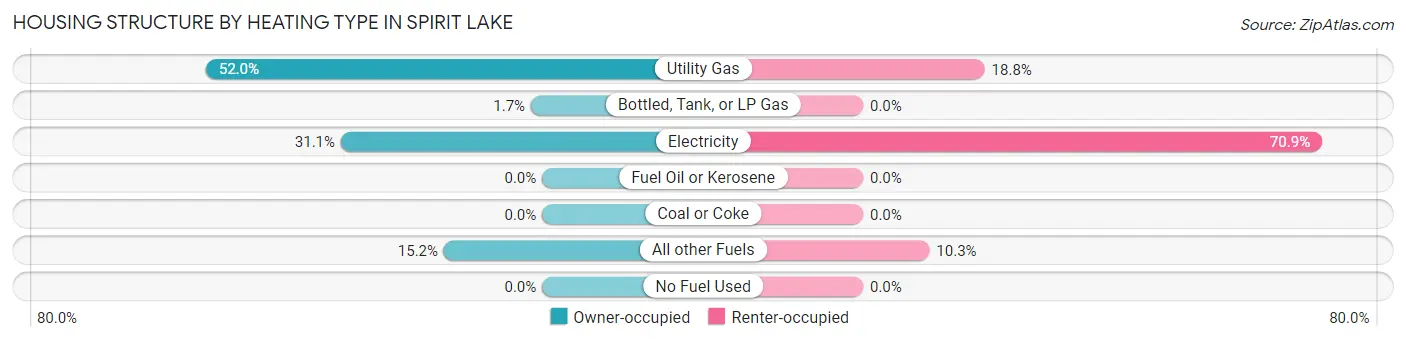
| Heating Type | Owner-occupied | Renter-occupied |
| Utility Gas | 421 (52.0%) | 22 (18.8%) |
| Bottled, Tank, or LP Gas | 14 (1.7%) | 0 (0.0%) |
| Electricity | 252 (31.1%) | 83 (70.9%) |
| Fuel Oil or Kerosene | 0 (0.0%) | 0 (0.0%) |
| Coal or Coke | 0 (0.0%) | 0 (0.0%) |
| All other Fuels | 123 (15.2%) | 12 (10.3%) |
| No Fuel Used | 0 (0.0%) | 0 (0.0%) |
| Total | 810 (100.0%) | 117 (100.0%) |
Household Vehicle Usage in Spirit Lake
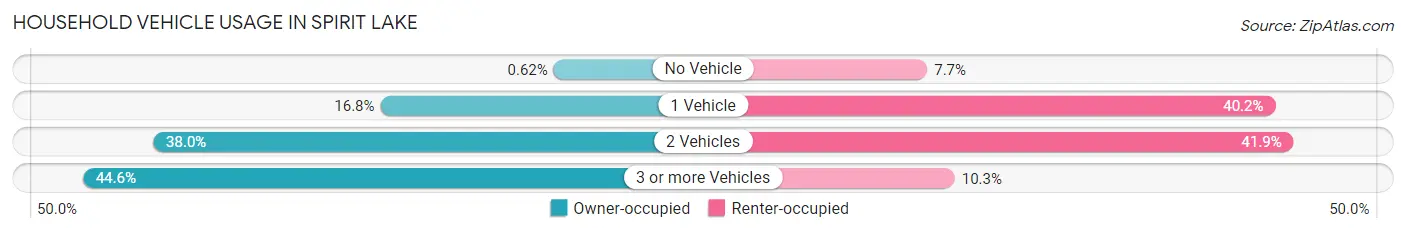
| Vehicles per Household | Owner-occupied | Renter-occupied |
| No Vehicle | 5 (0.6%) | 9 (7.7%) |
| 1 Vehicle | 136 (16.8%) | 47 (40.2%) |
| 2 Vehicles | 308 (38.0%) | 49 (41.9%) |
| 3 or more Vehicles | 361 (44.6%) | 12 (10.3%) |
| Total | 810 (100.0%) | 117 (100.0%) |
Real Estate & Mortgages in Spirit Lake
Real Estate and Mortgage Overview in Spirit Lake
| Characteristic | Without Mortgage | With Mortgage |
| Housing Units | 238 | 572 |
| Median Property Value | $332,700 | $332,800 |
| Median Household Income | $49,917 | $48 |
| Monthly Housing Costs | $409 | $6 |
| Real Estate Taxes | $1,276 | $42 |
Property Value by Mortgage Status in Spirit Lake
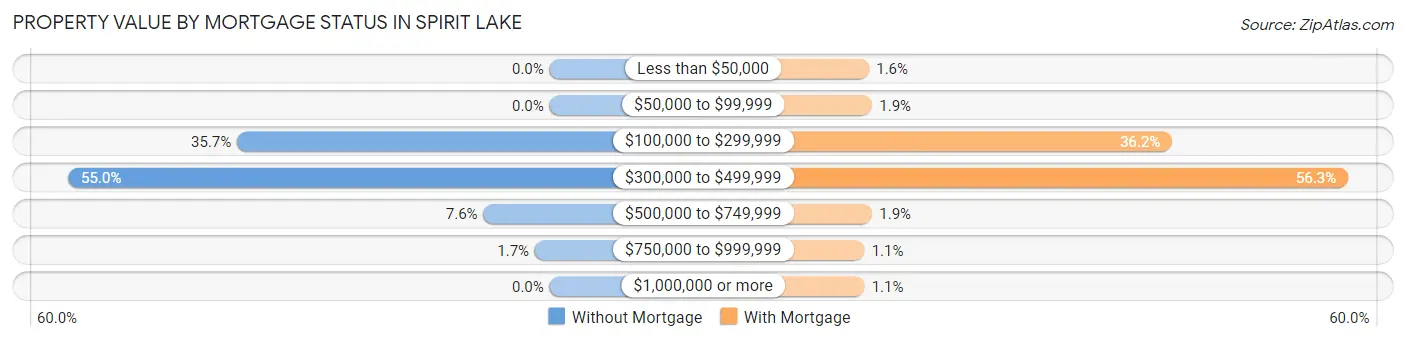
| Property Value | Without Mortgage | With Mortgage |
| Less than $50,000 | 0 (0.0%) | 9 (1.6%) |
| $50,000 to $99,999 | 0 (0.0%) | 11 (1.9%) |
| $100,000 to $299,999 | 85 (35.7%) | 207 (36.2%) |
| $300,000 to $499,999 | 131 (55.0%) | 322 (56.3%) |
| $500,000 to $749,999 | 18 (7.6%) | 11 (1.9%) |
| $750,000 to $999,999 | 4 (1.7%) | 6 (1.1%) |
| $1,000,000 or more | 0 (0.0%) | 6 (1.1%) |
| Total | 238 (100.0%) | 572 (100.0%) |
Household Income by Mortgage Status in Spirit Lake
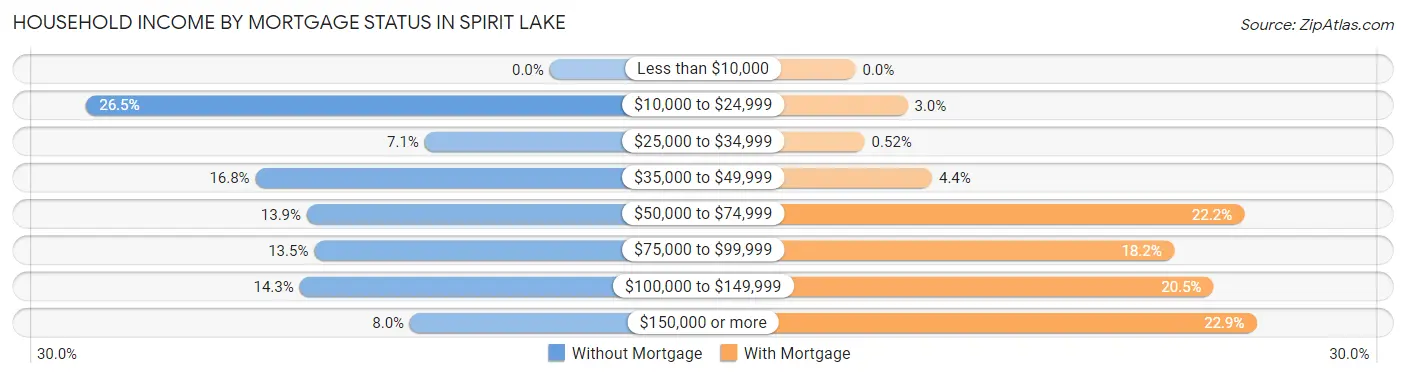
| Household Income | Without Mortgage | With Mortgage |
| Less than $10,000 | 0 (0.0%) | 0 (0.0%) |
| $10,000 to $24,999 | 63 (26.5%) | 17 (3.0%) |
| $25,000 to $34,999 | 17 (7.1%) | 3 (0.5%) |
| $35,000 to $49,999 | 40 (16.8%) | 25 (4.4%) |
| $50,000 to $74,999 | 33 (13.9%) | 127 (22.2%) |
| $75,000 to $99,999 | 32 (13.5%) | 104 (18.2%) |
| $100,000 to $149,999 | 34 (14.3%) | 117 (20.4%) |
| $150,000 or more | 19 (8.0%) | 131 (22.9%) |
| Total | 238 (100.0%) | 572 (100.0%) |
Property Value to Household Income Ratio in Spirit Lake
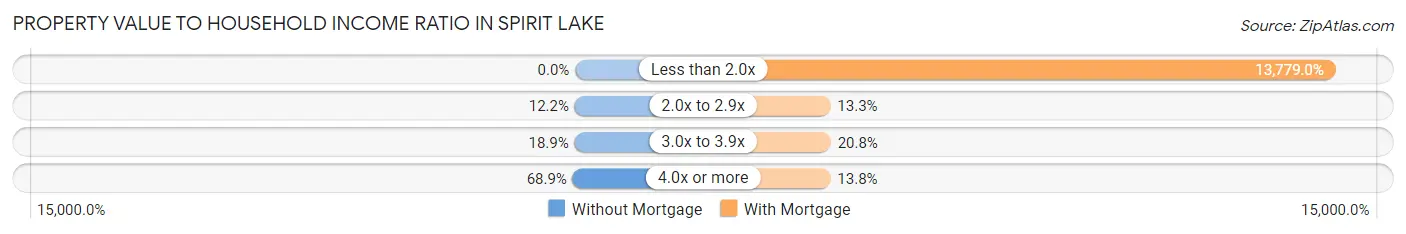
| Value-to-Income Ratio | Without Mortgage | With Mortgage |
| Less than 2.0x | 0 (0.0%) | 78,816 (13,779.0%) |
| 2.0x to 2.9x | 29 (12.2%) | 76 (13.3%) |
| 3.0x to 3.9x | 45 (18.9%) | 119 (20.8%) |
| 4.0x or more | 164 (68.9%) | 79 (13.8%) |
| Total | 238 (100.0%) | 572 (100.0%) |
Real Estate Taxes by Mortgage Status in Spirit Lake
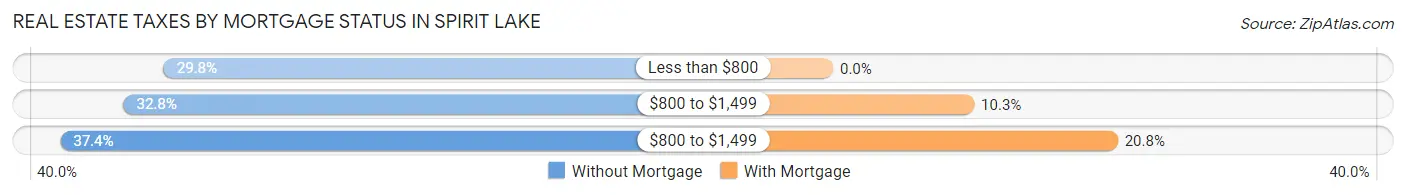
| Property Taxes | Without Mortgage | With Mortgage |
| Less than $800 | 71 (29.8%) | 0 (0.0%) |
| $800 to $1,499 | 78 (32.8%) | 59 (10.3%) |
| $800 to $1,499 | 89 (37.4%) | 119 (20.8%) |
| Total | 238 (100.0%) | 572 (100.0%) |
Health & Disability in Spirit Lake
Health Insurance Coverage by Age in Spirit Lake
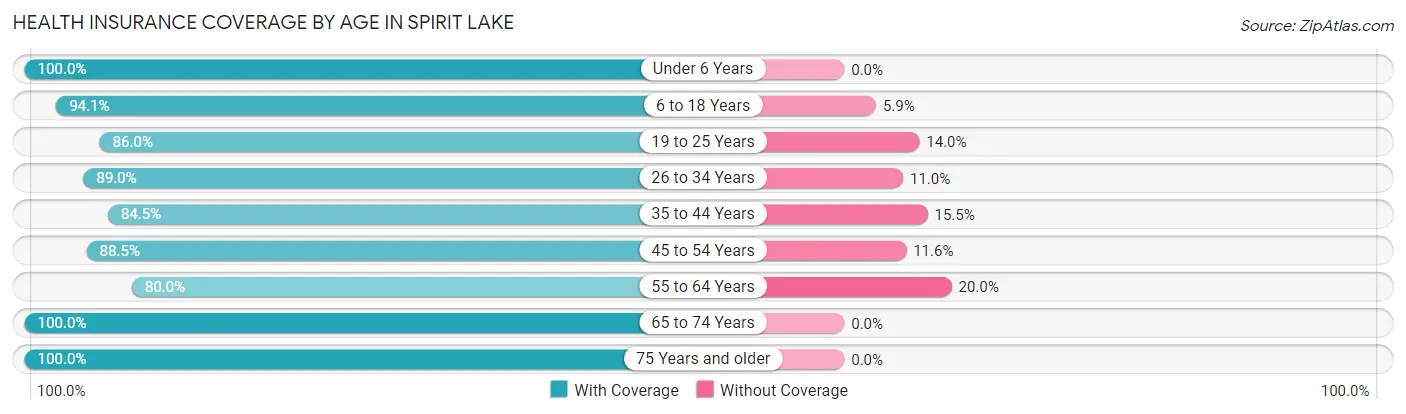
| Age Bracket | With Coverage | Without Coverage |
| Under 6 Years | 253 (100.0%) | 0 (0.0%) |
| 6 to 18 Years | 382 (94.1%) | 24 (5.9%) |
| 19 to 25 Years | 160 (86.0%) | 26 (14.0%) |
| 26 to 34 Years | 203 (89.0%) | 25 (11.0%) |
| 35 to 44 Years | 234 (84.5%) | 43 (15.5%) |
| 45 to 54 Years | 245 (88.4%) | 32 (11.6%) |
| 55 to 64 Years | 320 (80.0%) | 80 (20.0%) |
| 65 to 74 Years | 241 (100.0%) | 0 (0.0%) |
| 75 Years and older | 107 (100.0%) | 0 (0.0%) |
| Total | 2,145 (90.3%) | 230 (9.7%) |
Health Insurance Coverage by Citizenship Status in Spirit Lake
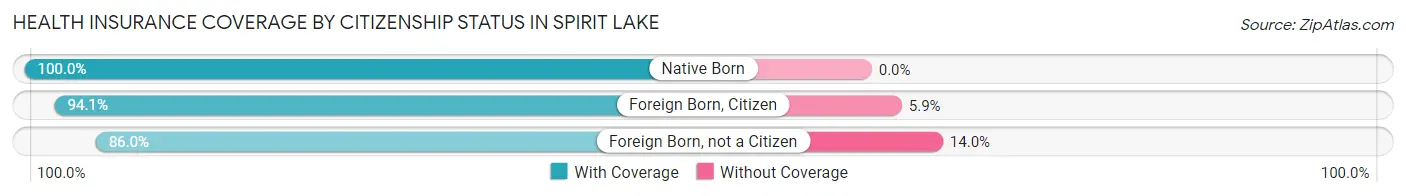
| Citizenship Status | With Coverage | Without Coverage |
| Native Born | 253 (100.0%) | 0 (0.0%) |
| Foreign Born, Citizen | 382 (94.1%) | 24 (5.9%) |
| Foreign Born, not a Citizen | 160 (86.0%) | 26 (14.0%) |
Health Insurance Coverage by Household Income in Spirit Lake
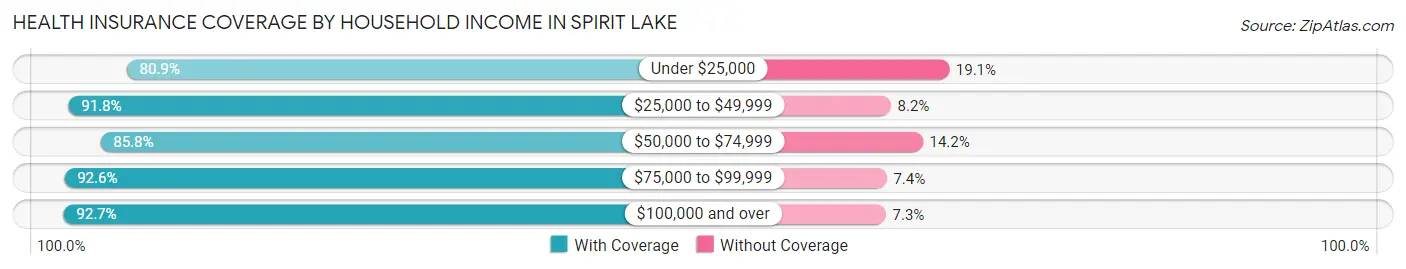
| Household Income | With Coverage | Without Coverage |
| Under $25,000 | 110 (80.9%) | 26 (19.1%) |
| $25,000 to $49,999 | 425 (91.8%) | 38 (8.2%) |
| $50,000 to $74,999 | 399 (85.8%) | 66 (14.2%) |
| $75,000 to $99,999 | 498 (92.6%) | 40 (7.4%) |
| $100,000 and over | 702 (92.7%) | 55 (7.3%) |
Public vs Private Health Insurance Coverage by Age in Spirit Lake
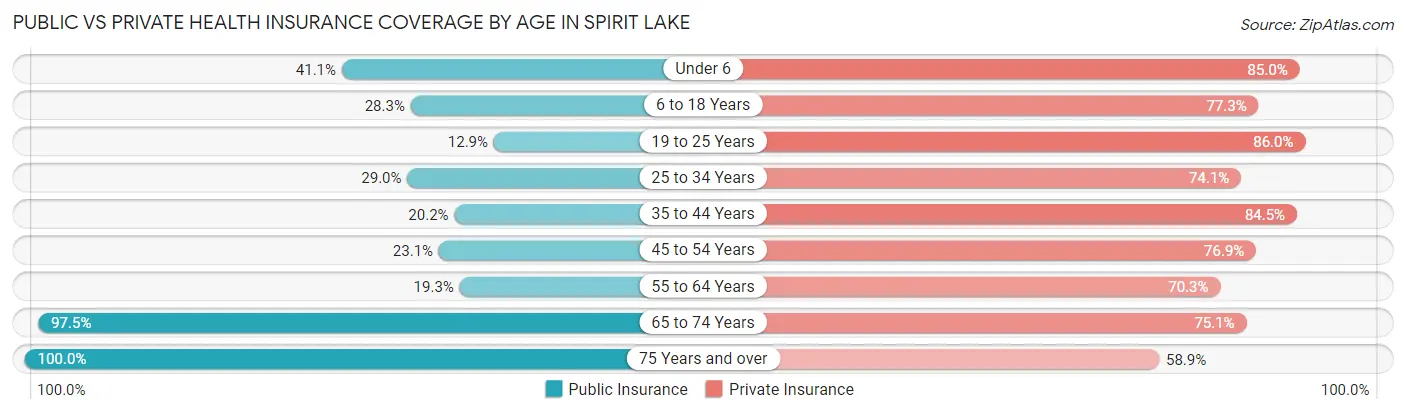
| Age Bracket | Public Insurance | Private Insurance |
| Under 6 | 104 (41.1%) | 215 (85.0%) |
| 6 to 18 Years | 115 (28.3%) | 314 (77.3%) |
| 19 to 25 Years | 24 (12.9%) | 160 (86.0%) |
| 25 to 34 Years | 66 (28.9%) | 169 (74.1%) |
| 35 to 44 Years | 56 (20.2%) | 234 (84.5%) |
| 45 to 54 Years | 64 (23.1%) | 213 (76.9%) |
| 55 to 64 Years | 77 (19.3%) | 281 (70.3%) |
| 65 to 74 Years | 235 (97.5%) | 181 (75.1%) |
| 75 Years and over | 107 (100.0%) | 63 (58.9%) |
| Total | 848 (35.7%) | 1,830 (77.0%) |
Disability Status by Sex by Age in Spirit Lake
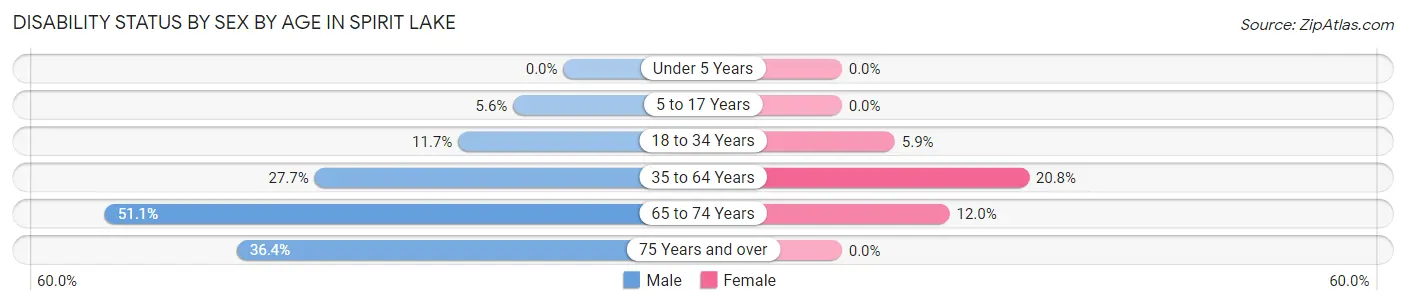
| Age Bracket | Male | Female |
| Under 5 Years | 0 (0.0%) | 0 (0.0%) |
| 5 to 17 Years | 10 (5.6%) | 0 (0.0%) |
| 18 to 34 Years | 32 (11.7%) | 11 (5.9%) |
| 35 to 64 Years | 138 (27.7%) | 95 (20.8%) |
| 65 to 74 Years | 72 (51.1%) | 12 (12.0%) |
| 75 Years and over | 24 (36.4%) | 0 (0.0%) |
Disability Class by Sex by Age in Spirit Lake
Disability Class: Hearing Difficulty
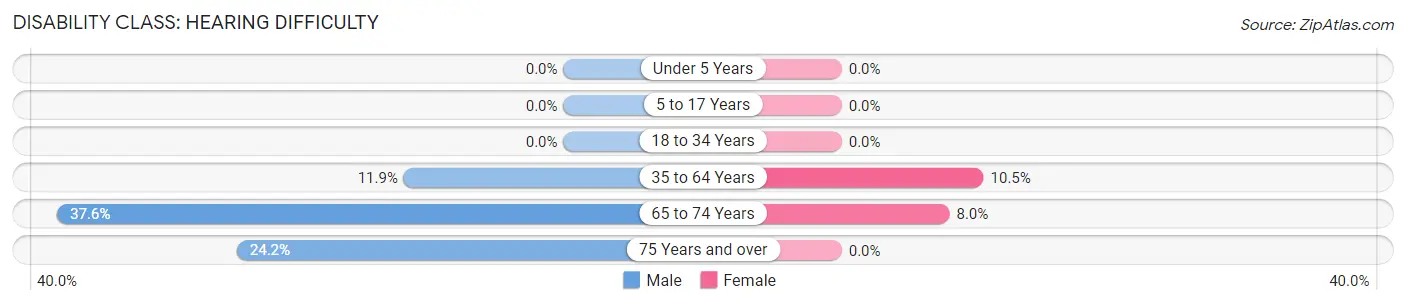
| Age Bracket | Male | Female |
| Under 5 Years | 0 (0.0%) | 0 (0.0%) |
| 5 to 17 Years | 0 (0.0%) | 0 (0.0%) |
| 18 to 34 Years | 0 (0.0%) | 0 (0.0%) |
| 35 to 64 Years | 59 (11.8%) | 48 (10.5%) |
| 65 to 74 Years | 53 (37.6%) | 8 (8.0%) |
| 75 Years and over | 16 (24.2%) | 0 (0.0%) |
Disability Class: Vision Difficulty
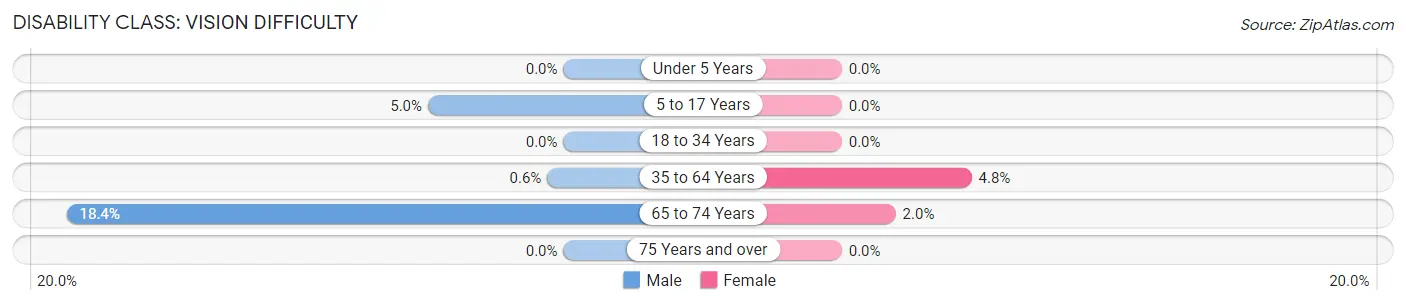
| Age Bracket | Male | Female |
| Under 5 Years | 0 (0.0%) | 0 (0.0%) |
| 5 to 17 Years | 9 (5.0%) | 0 (0.0%) |
| 18 to 34 Years | 0 (0.0%) | 0 (0.0%) |
| 35 to 64 Years | 3 (0.6%) | 22 (4.8%) |
| 65 to 74 Years | 26 (18.4%) | 2 (2.0%) |
| 75 Years and over | 0 (0.0%) | 0 (0.0%) |
Disability Class: Cognitive Difficulty
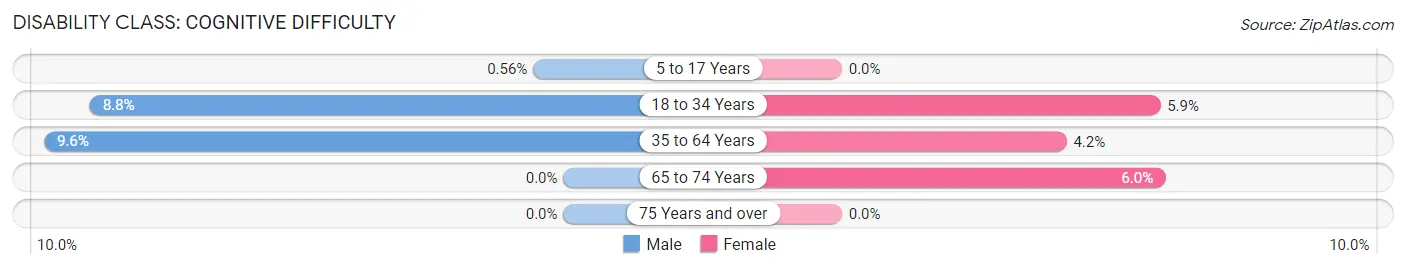
| Age Bracket | Male | Female |
| 5 to 17 Years | 1 (0.6%) | 0 (0.0%) |
| 18 to 34 Years | 24 (8.8%) | 11 (5.9%) |
| 35 to 64 Years | 48 (9.6%) | 19 (4.2%) |
| 65 to 74 Years | 0 (0.0%) | 6 (6.0%) |
| 75 Years and over | 0 (0.0%) | 0 (0.0%) |
Disability Class: Ambulatory Difficulty
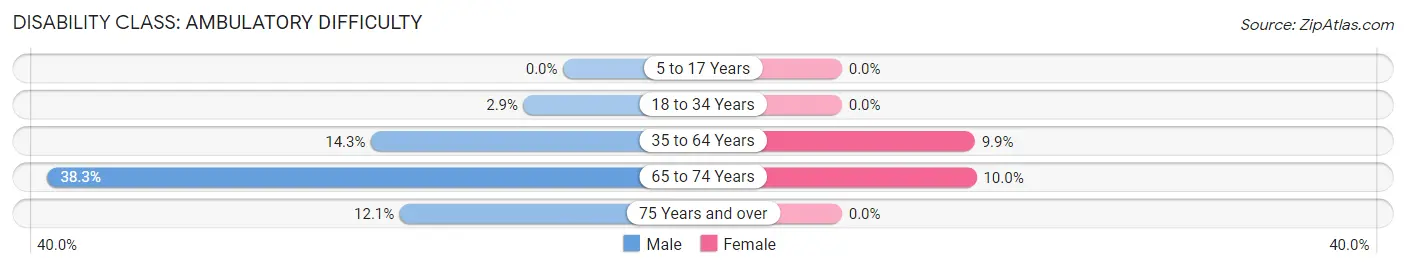
| Age Bracket | Male | Female |
| 5 to 17 Years | 0 (0.0%) | 0 (0.0%) |
| 18 to 34 Years | 8 (2.9%) | 0 (0.0%) |
| 35 to 64 Years | 71 (14.3%) | 45 (9.9%) |
| 65 to 74 Years | 54 (38.3%) | 10 (10.0%) |
| 75 Years and over | 8 (12.1%) | 0 (0.0%) |
Disability Class: Self-Care Difficulty
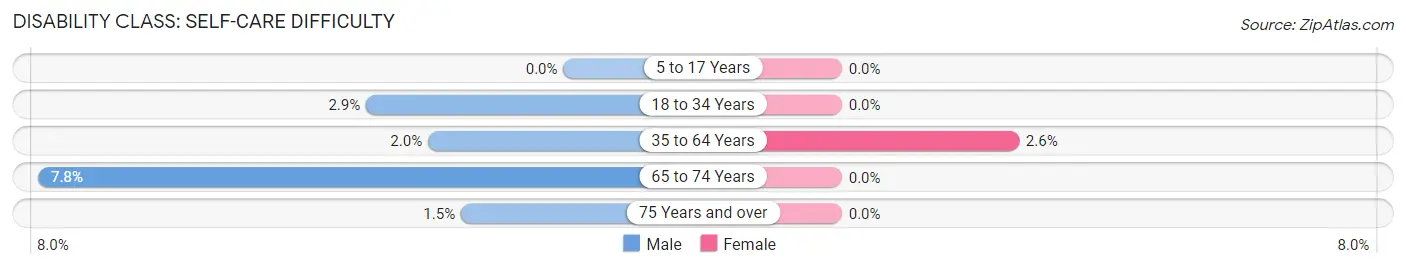
| Age Bracket | Male | Female |
| 5 to 17 Years | 0 (0.0%) | 0 (0.0%) |
| 18 to 34 Years | 8 (2.9%) | 0 (0.0%) |
| 35 to 64 Years | 10 (2.0%) | 12 (2.6%) |
| 65 to 74 Years | 11 (7.8%) | 0 (0.0%) |
| 75 Years and over | 1 (1.5%) | 0 (0.0%) |
Technology Access in Spirit Lake
Computing Device Access in Spirit Lake
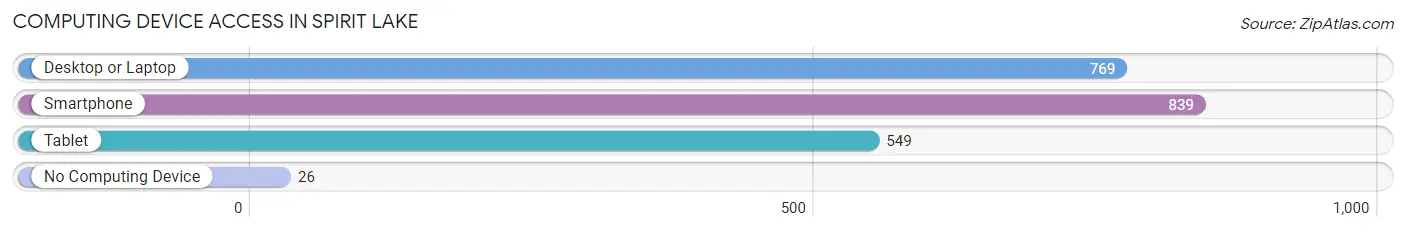
| Device Type | # Households | % Households |
| Desktop or Laptop | 769 | 83.0% |
| Smartphone | 839 | 90.5% |
| Tablet | 549 | 59.2% |
| No Computing Device | 26 | 2.8% |
| Total | 927 | 100.0% |
Internet Access in Spirit Lake
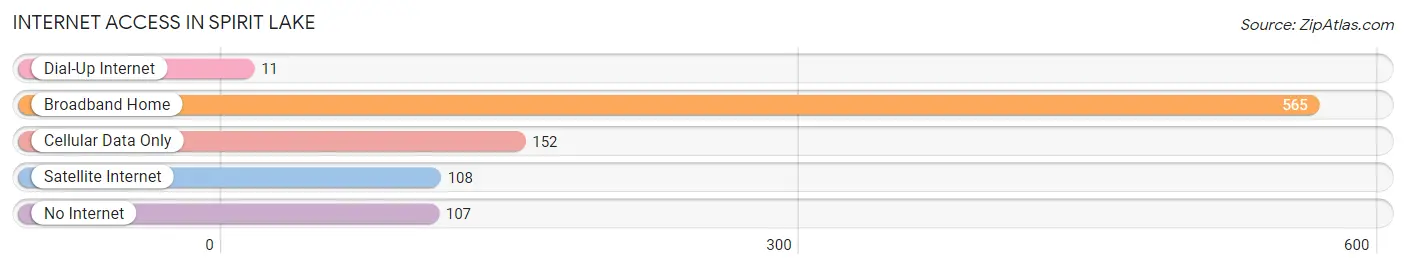
| Internet Type | # Households | % Households |
| Dial-Up Internet | 11 | 1.2% |
| Broadband Home | 565 | 61.0% |
| Cellular Data Only | 152 | 16.4% |
| Satellite Internet | 108 | 11.7% |
| No Internet | 107 | 11.5% |
| Total | 927 | 100.0% |
Spirit Lake Summary
Situated in the northern part of Idaho, the city of Spirit Lake is a small community of approximately 1,000 people. It is located in Kootenai County, about 25 miles north of Coeur d'Alene and about 30 miles south of the Canadian border. The city is surrounded by the beautiful natural beauty of the Idaho Panhandle, with its rolling hills, lush forests, and pristine lakes.
History
The area around Spirit Lake has been inhabited by Native Americans for centuries. The Coeur d'Alene Tribe, the Kootenai Tribe, and the Spokane Tribe all have a long history in the area. The first non-Native settlers arrived in the area in the late 1800s, and the town of Spirit Lake was officially established in 1891.
The town was named after the nearby Spirit Lake, which was named by the Coeur d'Alene Tribe. The lake was believed to be the home of a spirit, and the tribe believed that the spirit would protect them from harm.
The town of Spirit Lake quickly grew, and by the early 1900s, it had become a popular tourist destination. The town was known for its natural beauty, and it was a popular spot for fishing, hunting, and camping.
In the 1950s, the town began to decline as the timber industry in the area began to decline. The town was hit hard by the Great Recession of 2008, and many businesses closed. However, the town has since seen a resurgence, and it is now a popular destination for outdoor recreation and tourism.
Geography
Spirit Lake is located in the northern part of Idaho, in Kootenai County. It is situated in the Idaho Panhandle, and it is surrounded by rolling hills, lush forests, and pristine lakes. The city is located about 25 miles north of Coeur d'Alene and about 30 miles south of the Canadian border.
The city is located at an elevation of 2,400 feet, and it has a total area of 1.2 square miles. The city is located on the shores of Spirit Lake, which is a popular spot for fishing, swimming, and boating. The lake is also home to a variety of wildlife, including bald eagles, ospreys, and beavers.
Economy
The economy of Spirit Lake is largely based on tourism and outdoor recreation. The city is a popular destination for fishing, hunting, camping, and other outdoor activities. The city is also home to several businesses, including restaurants, shops, and lodging.
The city is also home to several manufacturing companies, including a wood products company and a metal fabrication company. The city is also home to a number of small businesses, including a grocery store, a hardware store, and a gas station.
Demographics
As of the 2010 census, the population of Spirit Lake was 1,039. The population is predominantly white, with about 95% of the population identifying as white. The median age of the population is 44.7 years, and the median household income is $41,944.
The city is home to a variety of religious denominations, including Catholic, Protestant, and Mormon. The city is also home to a variety of ethnicities, including Native American, Hispanic, and Asian.
Conclusion
Spirit Lake is a small city in northern Idaho, located in Kootenai County. The city is surrounded by the natural beauty of the Idaho Panhandle, and it is a popular destination for outdoor recreation and tourism. The city has a population of 1,039, and the economy is largely based on tourism and outdoor recreation. The city is also home to a variety of businesses, including restaurants, shops, and manufacturing companies.
Common Questions
What is Per Capita Income in Spirit Lake?
Per Capita income in Spirit Lake is $29,674.
What is the Median Family Income in Spirit Lake?
Median Family Income in Spirit Lake is $81,131.
What is the Median Household income in Spirit Lake?
Median Household Income in Spirit Lake is $61,625.
What is Income or Wage Gap in Spirit Lake?
Income or Wage Gap in Spirit Lake is 42.0%.
Women in Spirit Lake earn 58.0 cents for every dollar earned by a man.
What is Inequality or Gini Index in Spirit Lake?
Inequality or Gini Index in Spirit Lake is 0.34.
What is the Total Population of Spirit Lake?
Total Population of Spirit Lake is 2,375.
What is the Total Male Population of Spirit Lake?
Total Male Population of Spirit Lake is 1,264.
What is the Total Female Population of Spirit Lake?
Total Female Population of Spirit Lake is 1,111.
What is the Ratio of Males per 100 Females in Spirit Lake?
There are 113.77 Males per 100 Females in Spirit Lake.
What is the Ratio of Females per 100 Males in Spirit Lake?
There are 87.90 Females per 100 Males in Spirit Lake.
What is the Median Population Age in Spirit Lake?
Median Population Age in Spirit Lake is 40.1 Years.
What is the Average Family Size in Spirit Lake
Average Family Size in Spirit Lake is 3.2 People.
What is the Average Household Size in Spirit Lake
Average Household Size in Spirit Lake is 2.5 People.
How Large is the Labor Force in Spirit Lake?
There are 1,112 People in the Labor Forcein in Spirit Lake.
What is the Percentage of People in the Labor Force in Spirit Lake?
62.1% of People are in the Labor Force in Spirit Lake.
What is the Unemployment Rate in Spirit Lake?
Unemployment Rate in Spirit Lake is 3.8%.