Soda Springs, ID Map & Demographics
Soda Springs Map
Soda Springs Overview
$26,570
PER CAPITA INCOME
$75,000
AVG FAMILY INCOME
$44,301
AVG HOUSEHOLD INCOME
55.0%
WAGE / INCOME GAP [ % ]
45.0¢/ $1
WAGE / INCOME GAP [ $ ]
0.41
INEQUALITY / GINI INDEX
3,124
TOTAL POPULATION
1,587
MALE POPULATION
1,537
FEMALE POPULATION
103.25
MALES / 100 FEMALES
96.85
FEMALES / 100 MALES
37.0
MEDIAN AGE
3.5
AVG FAMILY SIZE
2.5
AVG HOUSEHOLD SIZE
1,531
LABOR FORCE [ PEOPLE ]
66.2%
PERCENT IN LABOR FORCE
2.5%
UNEMPLOYMENT RATE
Soda Springs Zip Codes
Soda Springs Area Codes
Income in Soda Springs
Income Overview in Soda Springs
Per Capita Income in Soda Springs is $26,570, while median incomes of families and households are $75,000 and $44,301 respectively.
| Characteristic | Number | Measure |
| Per Capita Income | 3,124 | $26,570 |
| Median Family Income | 718 | $75,000 |
| Mean Family Income | 718 | $83,503 |
| Median Household Income | 1,213 | $44,301 |
| Mean Household Income | 1,213 | $63,190 |
| Income Deficit | 718 | $0 |
| Wage / Income Gap (%) | 3,124 | 55.02% |
| Wage / Income Gap ($) | 3,124 | 44.98¢ per $1 |
| Gini / Inequality Index | 3,124 | 0.41 |
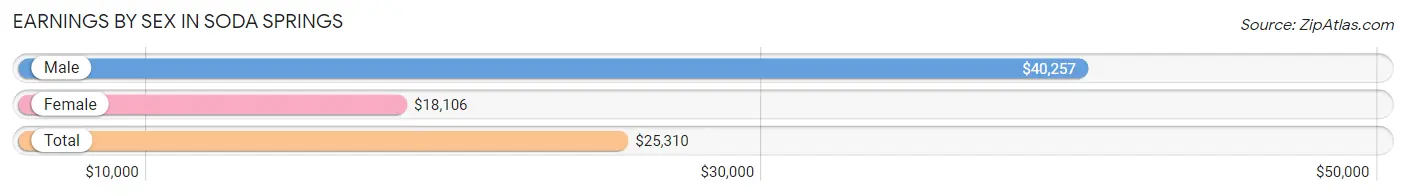
Earnings by Sex in Soda Springs
Average Earnings in Soda Springs are $25,310, $40,257 for men and $18,106 for women, a difference of 55.0%.
| Sex | Number | Average Earnings |
| Male | 911 (53.2%) | $40,257 |
| Female | 802 (46.8%) | $18,106 |
| Total | 1,713 (100.0%) | $25,310 |
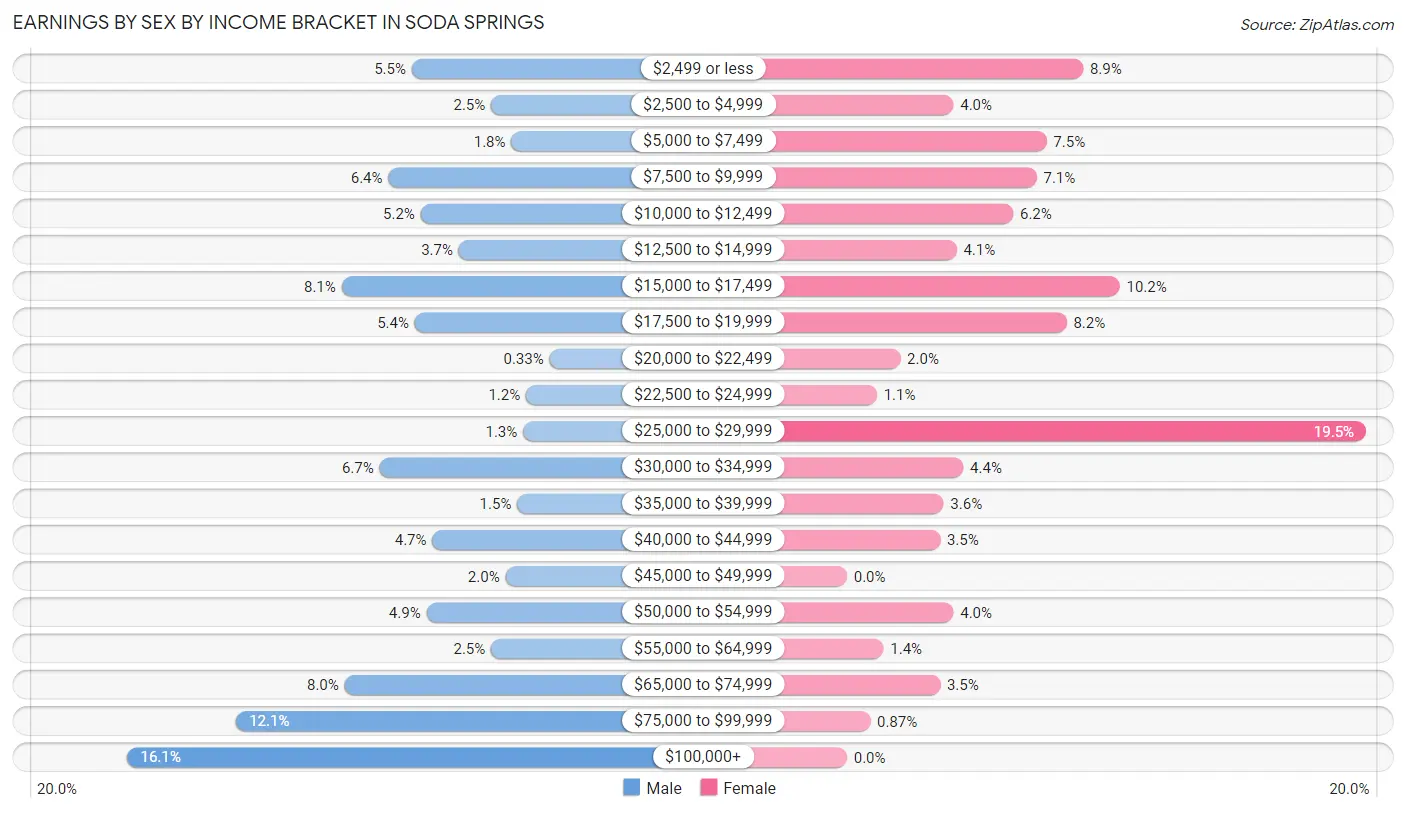
Earnings by Sex by Income Bracket in Soda Springs
The most common earnings brackets in Soda Springs are $100,000+ for men (147 | 16.1%) and $25,000 to $29,999 for women (156 | 19.5%).
| Income | Male | Female |
| $2,499 or less | 50 (5.5%) | 71 (8.8%) |
| $2,500 to $4,999 | 23 (2.5%) | 32 (4.0%) |
| $5,000 to $7,499 | 16 (1.8%) | 60 (7.5%) |
| $7,500 to $9,999 | 58 (6.4%) | 57 (7.1%) |
| $10,000 to $12,499 | 47 (5.2%) | 50 (6.2%) |
| $12,500 to $14,999 | 34 (3.7%) | 33 (4.1%) |
| $15,000 to $17,499 | 74 (8.1%) | 82 (10.2%) |
| $17,500 to $19,999 | 49 (5.4%) | 66 (8.2%) |
| $20,000 to $22,499 | 3 (0.3%) | 16 (2.0%) |
| $22,500 to $24,999 | 11 (1.2%) | 9 (1.1%) |
| $25,000 to $29,999 | 12 (1.3%) | 156 (19.5%) |
| $30,000 to $34,999 | 61 (6.7%) | 35 (4.4%) |
| $35,000 to $39,999 | 14 (1.5%) | 29 (3.6%) |
| $40,000 to $44,999 | 43 (4.7%) | 28 (3.5%) |
| $45,000 to $49,999 | 18 (2.0%) | 0 (0.0%) |
| $50,000 to $54,999 | 45 (4.9%) | 32 (4.0%) |
| $55,000 to $64,999 | 23 (2.5%) | 11 (1.4%) |
| $65,000 to $74,999 | 73 (8.0%) | 28 (3.5%) |
| $75,000 to $99,999 | 110 (12.1%) | 7 (0.9%) |
| $100,000+ | 147 (16.1%) | 0 (0.0%) |
| Total | 911 (100.0%) | 802 (100.0%) |
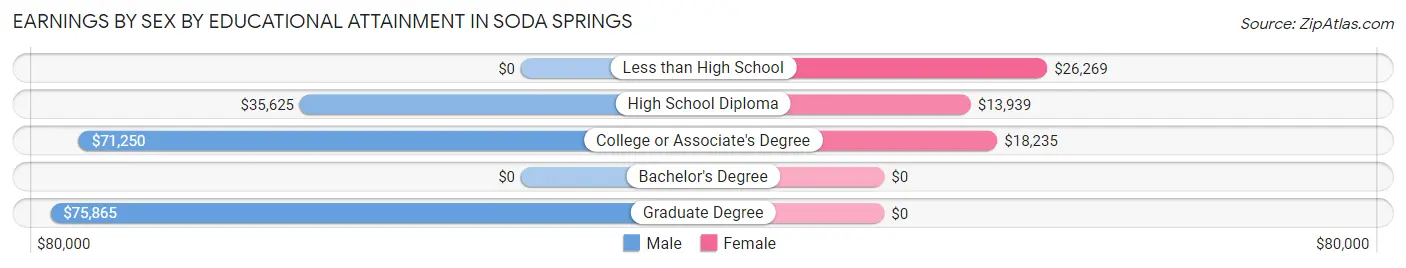
Earnings by Sex by Educational Attainment in Soda Springs
Average earnings in Soda Springs are $53,969 for men and $19,148 for women, a difference of 64.5%. Men with an educational attainment of graduate degree enjoy the highest average annual earnings of $75,865, while those with high school diploma education earn the least with $35,625. Women with an educational attainment of less than high school earn the most with the average annual earnings of $26,269, while those with high school diploma education have the smallest earnings of $13,939.
| Educational Attainment | Male Income | Female Income |
| Less than High School | - | - |
| High School Diploma | $35,625 | $13,939 |
| College or Associate's Degree | $71,250 | $18,235 |
| Bachelor's Degree | - | - |
| Graduate Degree | $75,865 | $0 |
| Total | $53,969 | $19,148 |
Family Income in Soda Springs
Family Income Brackets in Soda Springs
According to the Soda Springs family income data, there are 181 families falling into the $100,000 to $149,999 income range, which is the most common income bracket and makes up 25.2% of all families.
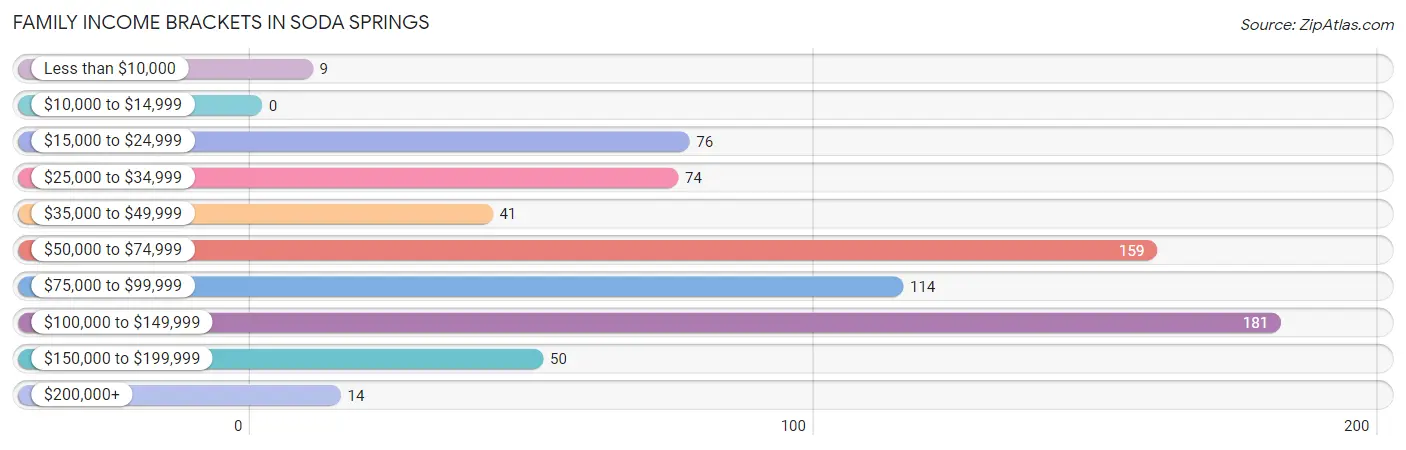
| Income Bracket | # Families | % Families |
| Less than $10,000 | 9 | 1.3% |
| $10,000 to $14,999 | 0 | 0.0% |
| $15,000 to $24,999 | 76 | 10.6% |
| $25,000 to $34,999 | 74 | 10.3% |
| $35,000 to $49,999 | 41 | 5.7% |
| $50,000 to $74,999 | 159 | 22.1% |
| $75,000 to $99,999 | 114 | 15.9% |
| $100,000 to $149,999 | 181 | 25.2% |
| $150,000 to $199,999 | 50 | 7.0% |
| $200,000+ | 14 | 1.9% |
Family Income by Famaliy Size in Soda Springs
6-person families (60 | 8.4%) account for the highest median family income in Soda Springs with $130,227 per family, while 2-person families (348 | 48.5%) have the highest median income of $32,792 per family member.
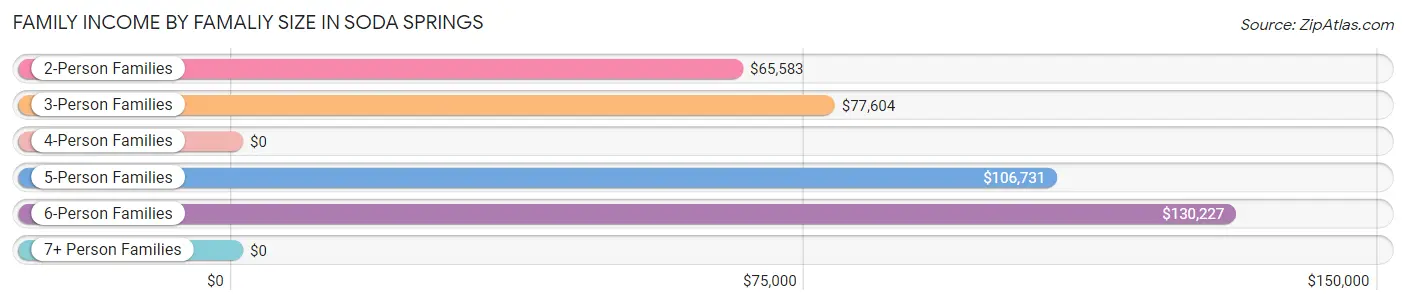
| Income Bracket | # Families | Median Income |
| 2-Person Families | 348 (48.5%) | $65,583 |
| 3-Person Families | 115 (16.0%) | $77,604 |
| 4-Person Families | 143 (19.9%) | $0 |
| 5-Person Families | 40 (5.6%) | $106,731 |
| 6-Person Families | 60 (8.4%) | $130,227 |
| 7+ Person Families | 12 (1.7%) | $0 |
| Total | 718 (100.0%) | $75,000 |
Family Income by Number of Earners in Soda Springs
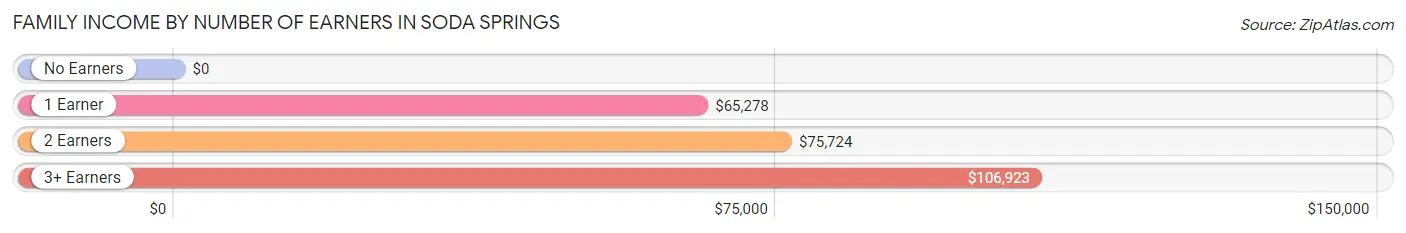
| Number of Earners | # Families | Median Income |
| No Earners | 51 (7.1%) | $0 |
| 1 Earner | 182 (25.4%) | $65,278 |
| 2 Earners | 407 (56.7%) | $75,724 |
| 3+ Earners | 78 (10.9%) | $106,923 |
| Total | 718 (100.0%) | $75,000 |
Household Income in Soda Springs
Household Income Brackets in Soda Springs
With 204 households falling in the category, the $15,000 to $24,999 income range is the most frequent in Soda Springs, accounting for 16.8% of all households. In contrast, only 15 households (1.2%) fall into the $200,000+ income bracket, making it the least populous group.
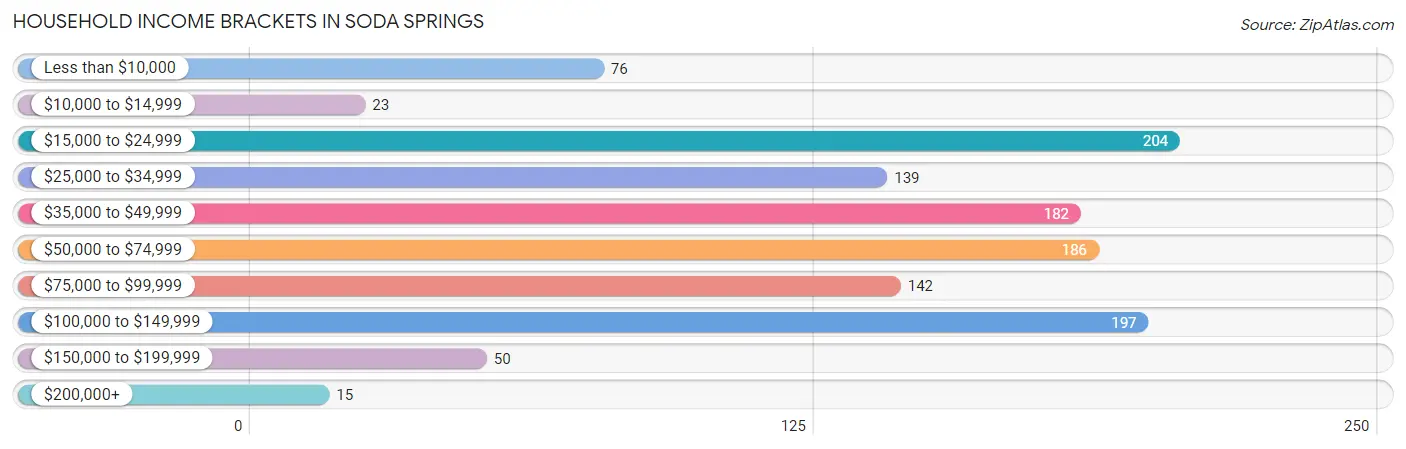
| Income Bracket | # Households | % Households |
| Less than $10,000 | 76 | 6.3% |
| $10,000 to $14,999 | 23 | 1.9% |
| $15,000 to $24,999 | 204 | 16.8% |
| $25,000 to $34,999 | 139 | 11.5% |
| $35,000 to $49,999 | 182 | 15.0% |
| $50,000 to $74,999 | 186 | 15.3% |
| $75,000 to $99,999 | 142 | 11.7% |
| $100,000 to $149,999 | 197 | 16.2% |
| $150,000 to $199,999 | 50 | 4.1% |
| $200,000+ | 15 | 1.2% |
Household Income by Householder Age in Soda Springs
The median household income in Soda Springs is $44,301, with the highest median household income of $65,179 found in the 45 to 64 years age bracket for the primary householder. A total of 425 households (35.0%) fall into this category. Meanwhile, the 15 to 24 years age bracket for the primary householder has the lowest median household income of $9,000, with 84 households (6.9%) in this group.
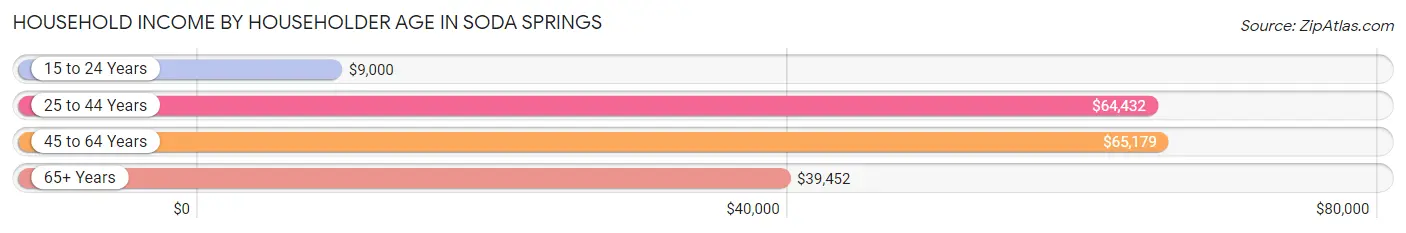
| Income Bracket | # Households | Median Income |
| 15 to 24 Years | 84 (6.9%) | $9,000 |
| 25 to 44 Years | 357 (29.4%) | $64,432 |
| 45 to 64 Years | 425 (35.0%) | $65,179 |
| 65+ Years | 347 (28.6%) | $39,452 |
| Total | 1,213 (100.0%) | $44,301 |
Poverty in Soda Springs
Income Below Poverty by Sex and Age in Soda Springs
With 13.7% poverty level for males and 9.8% for females among the residents of Soda Springs, 16 and 17 year old males and 25 to 34 year old females are the most vulnerable to poverty, with 15 males (51.7%) and 59 females (30.7%) in their respective age groups living below the poverty level.
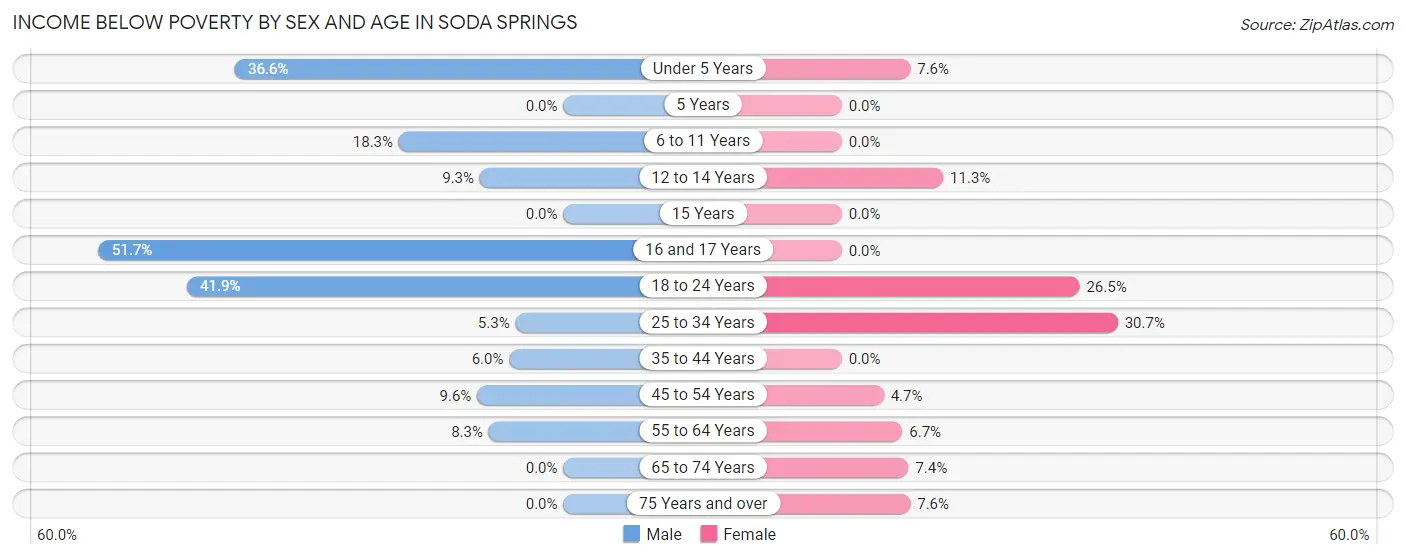
| Age Bracket | Male | Female |
| Under 5 Years | 34 (36.6%) | 10 (7.6%) |
| 5 Years | 0 (0.0%) | 0 (0.0%) |
| 6 to 11 Years | 37 (18.3%) | 0 (0.0%) |
| 12 to 14 Years | 8 (9.3%) | 21 (11.3%) |
| 15 Years | 0 (0.0%) | 0 (0.0%) |
| 16 and 17 Years | 15 (51.7%) | 0 (0.0%) |
| 18 to 24 Years | 62 (41.9%) | 18 (26.5%) |
| 25 to 34 Years | 9 (5.3%) | 59 (30.7%) |
| 35 to 44 Years | 13 (6.0%) | 0 (0.0%) |
| 45 to 54 Years | 12 (9.6%) | 7 (4.7%) |
| 55 to 64 Years | 20 (8.3%) | 13 (6.7%) |
| 65 to 74 Years | 0 (0.0%) | 11 (7.4%) |
| 75 Years and over | 0 (0.0%) | 10 (7.6%) |
| Total | 210 (13.7%) | 149 (9.8%) |
Income Above Poverty by Sex and Age in Soda Springs
According to the poverty statistics in Soda Springs, males aged 5 years and females aged 6 to 11 years are the age groups that are most secure financially, with 100.0% of males and 100.0% of females in these age groups living above the poverty line.
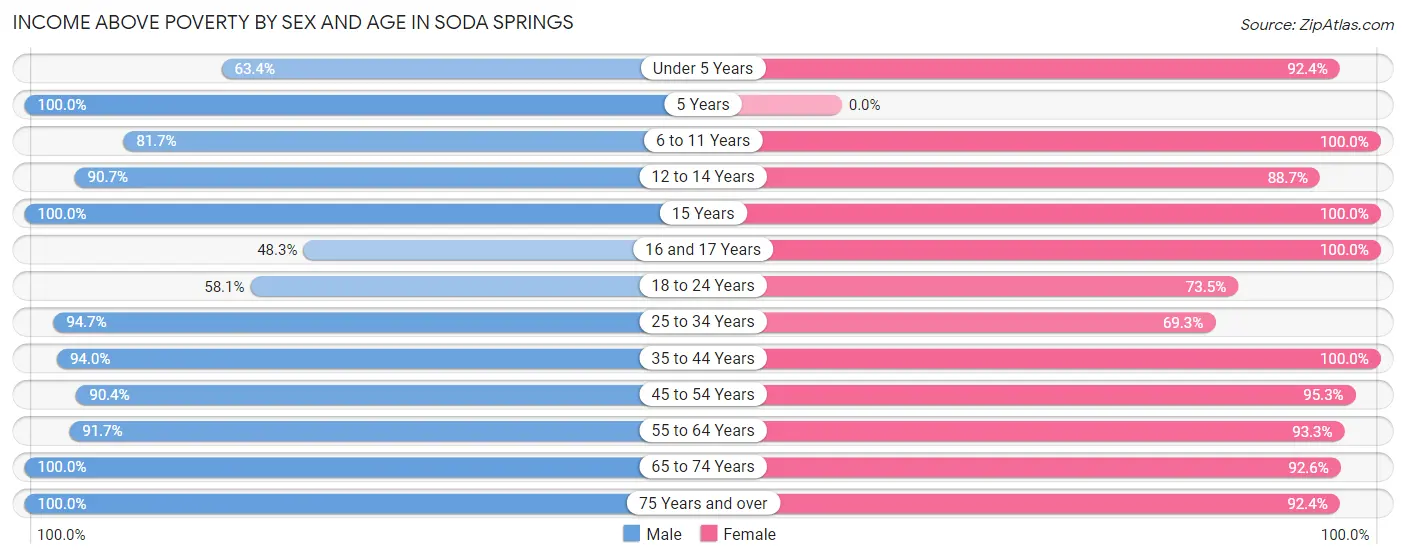
| Age Bracket | Male | Female |
| Under 5 Years | 59 (63.4%) | 121 (92.4%) |
| 5 Years | 24 (100.0%) | 0 (0.0%) |
| 6 to 11 Years | 165 (81.7%) | 62 (100.0%) |
| 12 to 14 Years | 78 (90.7%) | 165 (88.7%) |
| 15 Years | 5 (100.0%) | 22 (100.0%) |
| 16 and 17 Years | 14 (48.3%) | 30 (100.0%) |
| 18 to 24 Years | 86 (58.1%) | 50 (73.5%) |
| 25 to 34 Years | 160 (94.7%) | 133 (69.3%) |
| 35 to 44 Years | 203 (94.0%) | 203 (100.0%) |
| 45 to 54 Years | 113 (90.4%) | 143 (95.3%) |
| 55 to 64 Years | 221 (91.7%) | 180 (93.3%) |
| 65 to 74 Years | 147 (100.0%) | 137 (92.6%) |
| 75 Years and over | 46 (100.0%) | 121 (92.4%) |
| Total | 1,321 (86.3%) | 1,367 (90.2%) |
Income Below Poverty Among Married-Couple Families in Soda Springs
The poverty statistics for married-couple families in Soda Springs show that 6.2% or 38 of the total 612 families live below the poverty line. Families with 1 or 2 children have the highest poverty rate of 20.6%, comprising of 29 families. On the other hand, families with 3 or 4 children have the lowest poverty rate of 0.0%, which includes 0 families.
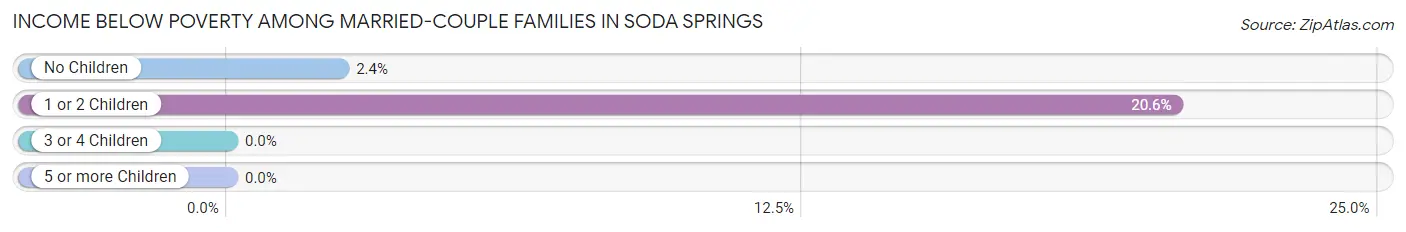
| Children | Above Poverty | Below Poverty |
| No Children | 363 (97.6%) | 9 (2.4%) |
| 1 or 2 Children | 112 (79.4%) | 29 (20.6%) |
| 3 or 4 Children | 87 (100.0%) | 0 (0.0%) |
| 5 or more Children | 12 (100.0%) | 0 (0.0%) |
| Total | 574 (93.8%) | 38 (6.2%) |
Income Below Poverty Among Single-Parent Households in Soda Springs
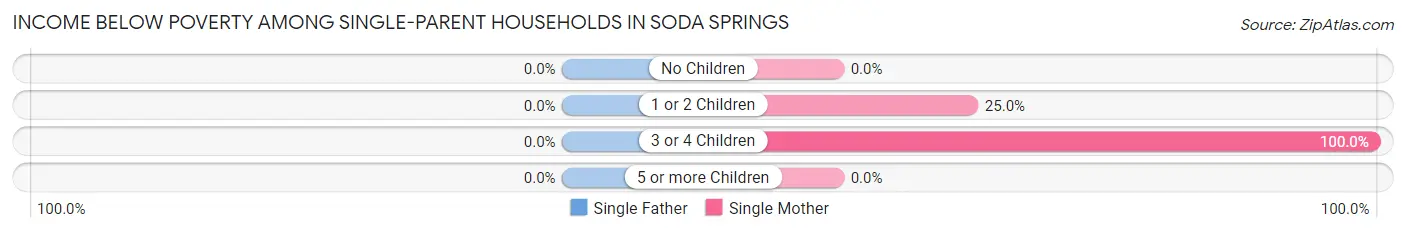
| Children | Single Father | Single Mother |
| No Children | 0 (0.0%) | 0 (0.0%) |
| 1 or 2 Children | 0 (0.0%) | 10 (25.0%) |
| 3 or 4 Children | 0 (0.0%) | 34 (100.0%) |
| 5 or more Children | 0 (0.0%) | 0 (0.0%) |
| Total | 0 (0.0%) | 44 (43.6%) |
Income Below Poverty Among Married-Couple vs Single-Parent Households in Soda Springs
The poverty data for Soda Springs shows that 38 of the married-couple family households (6.2%) and 44 of the single-parent households (41.5%) are living below the poverty level. Within the married-couple family households, those with 1 or 2 children have the highest poverty rate, with 29 households (20.6%) falling below the poverty line. Among the single-parent households, those with 3 or 4 children have the highest poverty rate, with 34 household (100.0%) living below poverty.
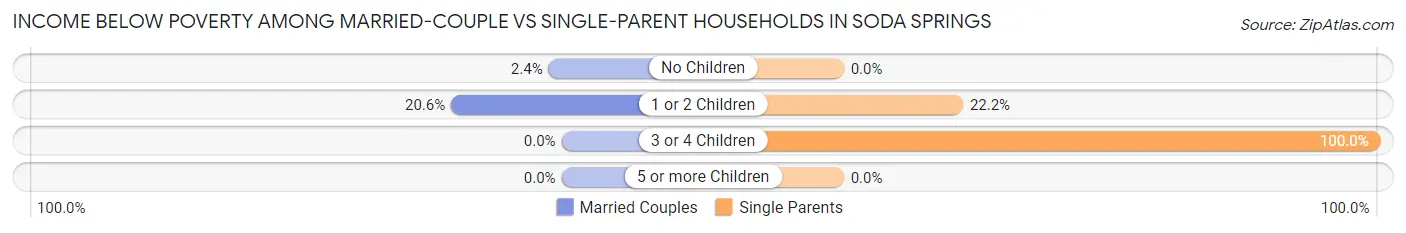
| Children | Married-Couple Families | Single-Parent Households |
| No Children | 9 (2.4%) | 0 (0.0%) |
| 1 or 2 Children | 29 (20.6%) | 10 (22.2%) |
| 3 or 4 Children | 0 (0.0%) | 34 (100.0%) |
| 5 or more Children | 0 (0.0%) | 0 (0.0%) |
| Total | 38 (6.2%) | 44 (41.5%) |
Race in Soda Springs
The most populous races in Soda Springs are White / Caucasian (2,992 | 95.8%), Two or more Races (111 | 3.5%), and Hispanic or Latino (19 | 0.6%).
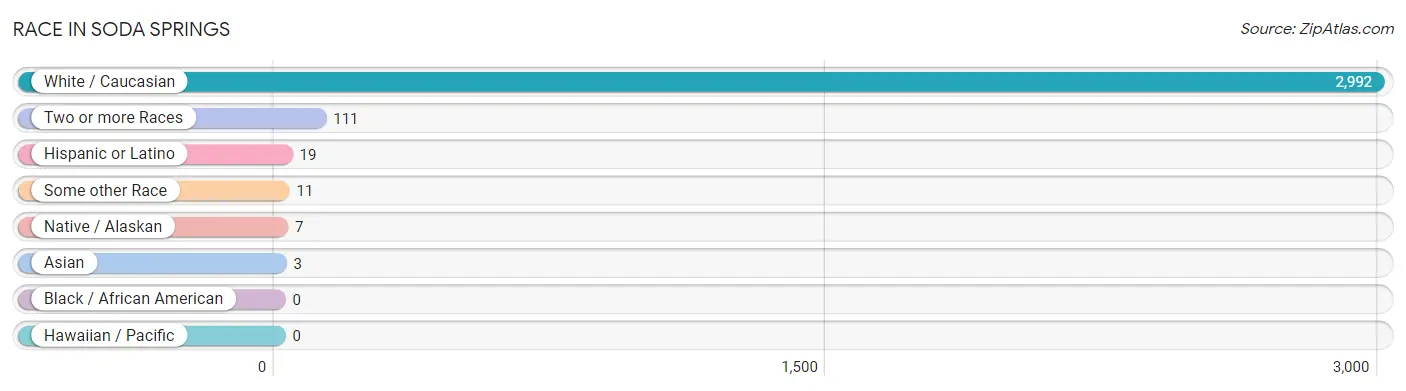
| Race | # Population | % Population |
| Asian | 3 | 0.1% |
| Black / African American | 0 | 0.0% |
| Hawaiian / Pacific | 0 | 0.0% |
| Hispanic or Latino | 19 | 0.6% |
| Native / Alaskan | 7 | 0.2% |
| White / Caucasian | 2,992 | 95.8% |
| Two or more Races | 111 | 3.5% |
| Some other Race | 11 | 0.4% |
| Total | 3,124 | 100.0% |
Ancestry in Soda Springs
The most populous ancestries reported in Soda Springs are English (479 | 15.3%), American (290 | 9.3%), German (257 | 8.2%), Italian (187 | 6.0%), and Irish (120 | 3.8%), together accounting for 42.7% of all Soda Springs residents.
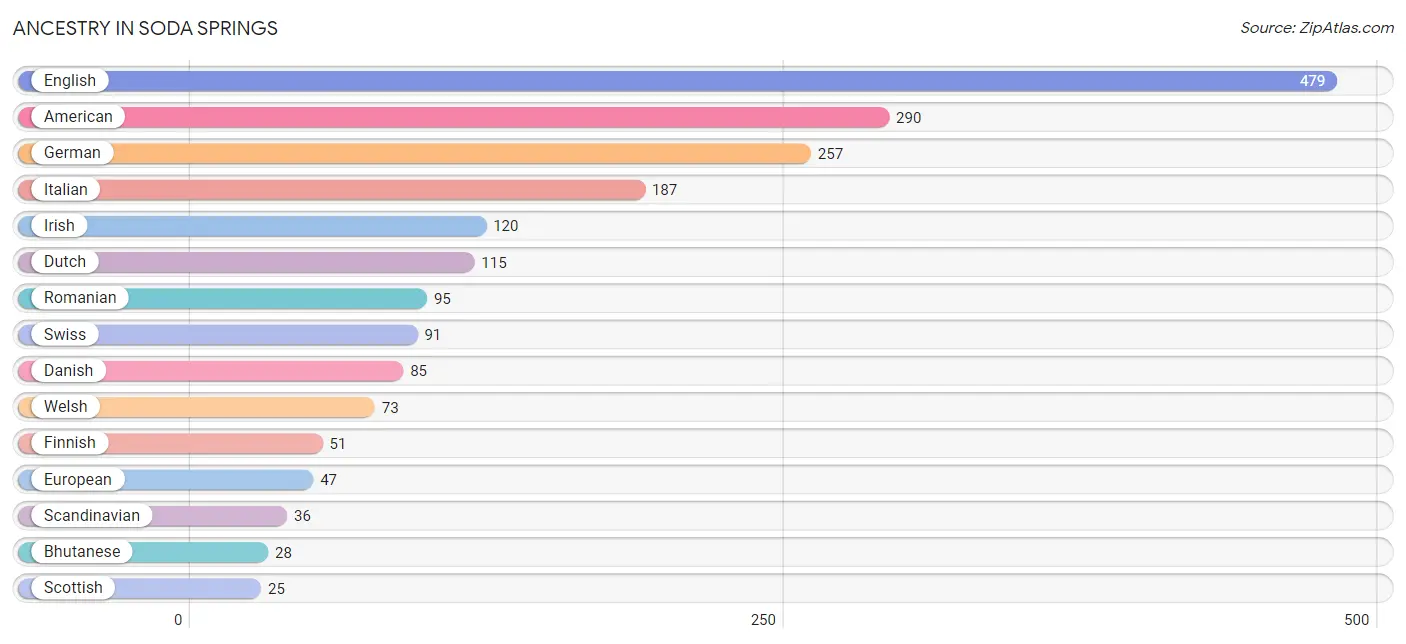
| Ancestry | # Population | % Population |
| American | 290 | 9.3% |
| Austrian | 2 | 0.1% |
| Bhutanese | 28 | 0.9% |
| Blackfeet | 11 | 0.4% |
| British | 21 | 0.7% |
| Canadian | 10 | 0.3% |
| Czech | 2 | 0.1% |
| Danish | 85 | 2.7% |
| Delaware | 1 | 0.0% |
| Dutch | 115 | 3.7% |
| English | 479 | 15.3% |
| European | 47 | 1.5% |
| Finnish | 51 | 1.6% |
| French Canadian | 11 | 0.4% |
| German | 257 | 8.2% |
| Icelander | 18 | 0.6% |
| Irish | 120 | 3.8% |
| Italian | 187 | 6.0% |
| Mexican | 19 | 0.6% |
| Navajo | 7 | 0.2% |
| Northern European | 12 | 0.4% |
| Norwegian | 5 | 0.2% |
| Polish | 11 | 0.4% |
| Romanian | 95 | 3.0% |
| Russian | 5 | 0.2% |
| Scandinavian | 36 | 1.1% |
| Scotch-Irish | 5 | 0.2% |
| Scottish | 25 | 0.8% |
| Swedish | 5 | 0.2% |
| Swiss | 91 | 2.9% |
| Thai | 3 | 0.1% |
| Welsh | 73 | 2.3% | View All 32 Rows |
Immigrants in Soda Springs
The most numerous immigrant groups reported in Soda Springs came from Latin America (14 | 0.4%), Africa (12 | 0.4%), South Africa (12 | 0.4%), Central America (11 | 0.4%), and Mexico (11 | 0.4%), together accounting for 1.9% of all Soda Springs residents.
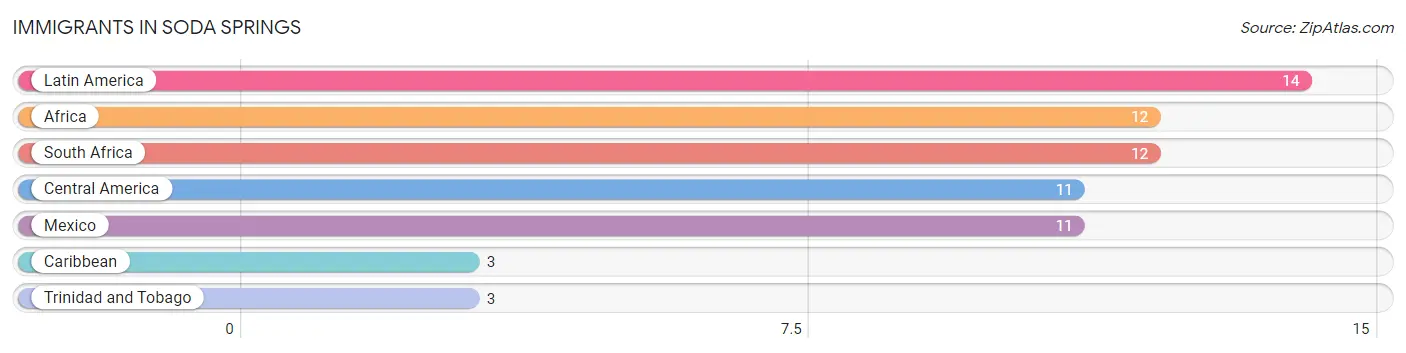
| Immigration Origin | # Population | % Population |
| Africa | 12 | 0.4% |
| Caribbean | 3 | 0.1% |
| Central America | 11 | 0.4% |
| Latin America | 14 | 0.4% |
| Mexico | 11 | 0.4% |
| South Africa | 12 | 0.4% |
| Trinidad and Tobago | 3 | 0.1% | View All 7 Rows |
Sex and Age in Soda Springs
Sex and Age in Soda Springs
The most populous age groups in Soda Springs are 10 to 14 Years (168 | 10.6%) for men and 10 to 14 Years (190 | 12.4%) for women.
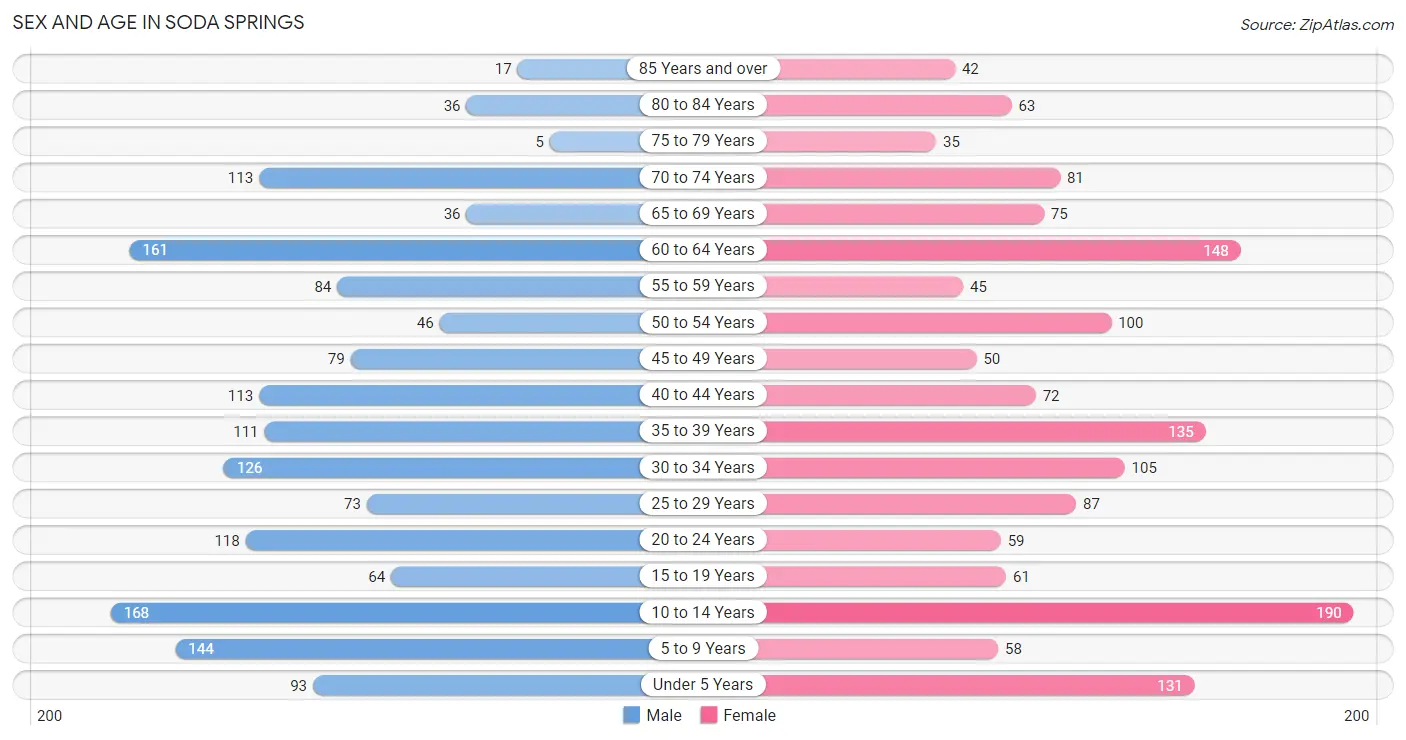
| Age Bracket | Male | Female |
| Under 5 Years | 93 (5.9%) | 131 (8.5%) |
| 5 to 9 Years | 144 (9.1%) | 58 (3.8%) |
| 10 to 14 Years | 168 (10.6%) | 190 (12.4%) |
| 15 to 19 Years | 64 (4.0%) | 61 (4.0%) |
| 20 to 24 Years | 118 (7.4%) | 59 (3.8%) |
| 25 to 29 Years | 73 (4.6%) | 87 (5.7%) |
| 30 to 34 Years | 126 (7.9%) | 105 (6.8%) |
| 35 to 39 Years | 111 (7.0%) | 135 (8.8%) |
| 40 to 44 Years | 113 (7.1%) | 72 (4.7%) |
| 45 to 49 Years | 79 (5.0%) | 50 (3.3%) |
| 50 to 54 Years | 46 (2.9%) | 100 (6.5%) |
| 55 to 59 Years | 84 (5.3%) | 45 (2.9%) |
| 60 to 64 Years | 161 (10.1%) | 148 (9.6%) |
| 65 to 69 Years | 36 (2.3%) | 75 (4.9%) |
| 70 to 74 Years | 113 (7.1%) | 81 (5.3%) |
| 75 to 79 Years | 5 (0.3%) | 35 (2.3%) |
| 80 to 84 Years | 36 (2.3%) | 63 (4.1%) |
| 85 Years and over | 17 (1.1%) | 42 (2.7%) |
| Total | 1,587 (100.0%) | 1,537 (100.0%) |
Families and Households in Soda Springs
Median Family Size in Soda Springs
The median family size in Soda Springs is 3.45 persons per family, with single female/mother families (101 | 14.1%) accounting for the largest median family size of 3.51 persons per family. On the other hand, single male/father families (5 | 0.7%) represent the smallest median family size with 2.60 persons per family.
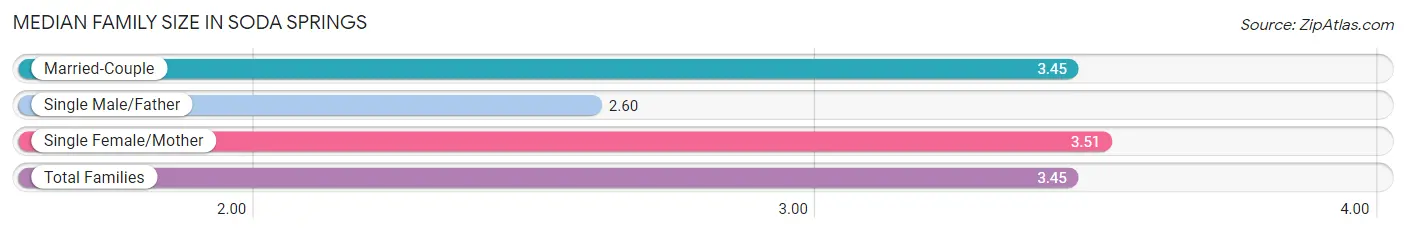
| Family Type | # Families | Family Size |
| Married-Couple | 612 (85.2%) | 3.45 |
| Single Male/Father | 5 (0.7%) | 2.60 |
| Single Female/Mother | 101 (14.1%) | 3.51 |
| Total Families | 718 (100.0%) | 3.45 |
Median Household Size in Soda Springs
The median household size in Soda Springs is 2.49 persons per household, with single female/mother households (101 | 8.3%) accounting for the largest median household size of 3.51 persons per household. non-family households (495 | 40.8%) represent the smallest median household size with 1.10 persons per household.
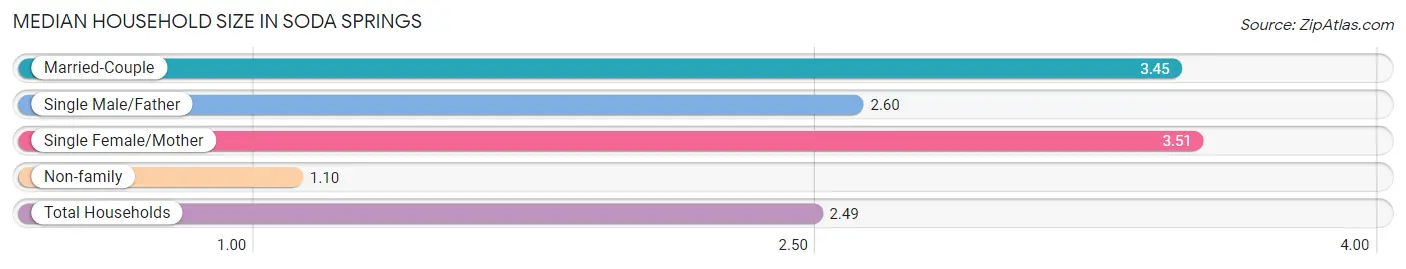
| Household Type | # Households | Household Size |
| Married-Couple | 612 (50.4%) | 3.45 |
| Single Male/Father | 5 (0.4%) | 2.60 |
| Single Female/Mother | 101 (8.3%) | 3.51 |
| Non-family | 495 (40.8%) | 1.10 |
| Total Households | 1,213 (100.0%) | 2.49 |
Household Size by Marriage Status in Soda Springs
Out of a total of 1,213 households in Soda Springs, 718 (59.2%) are family households, while 495 (40.8%) are nonfamily households. The most numerous type of family households are 2-person households, comprising 348, and the most common type of nonfamily households are 1-person households, comprising 453.
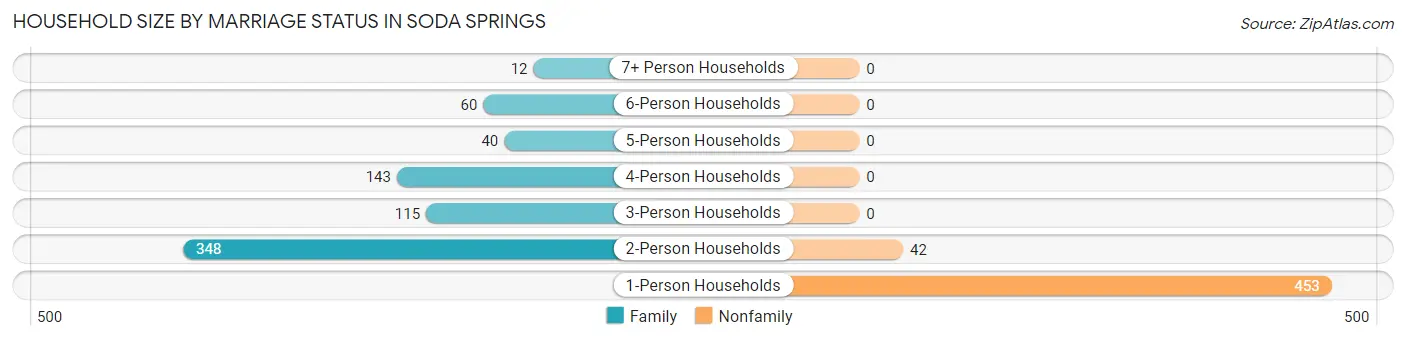
| Household Size | Family Households | Nonfamily Households |
| 1-Person Households | - | 453 (37.3%) |
| 2-Person Households | 348 (28.7%) | 42 (3.5%) |
| 3-Person Households | 115 (9.5%) | 0 (0.0%) |
| 4-Person Households | 143 (11.8%) | 0 (0.0%) |
| 5-Person Households | 40 (3.3%) | 0 (0.0%) |
| 6-Person Households | 60 (5.0%) | 0 (0.0%) |
| 7+ Person Households | 12 (1.0%) | 0 (0.0%) |
| Total | 718 (59.2%) | 495 (40.8%) |
Female Fertility in Soda Springs
Fertility by Age in Soda Springs
Average fertility rate in Soda Springs is 107.0 births per 1,000 women. Women in the age bracket of 20 to 34 years have the highest fertility rate with 235.0 births per 1,000 women. Women in the age bracket of 20 to 34 years acount for 90.8% of all women with births.
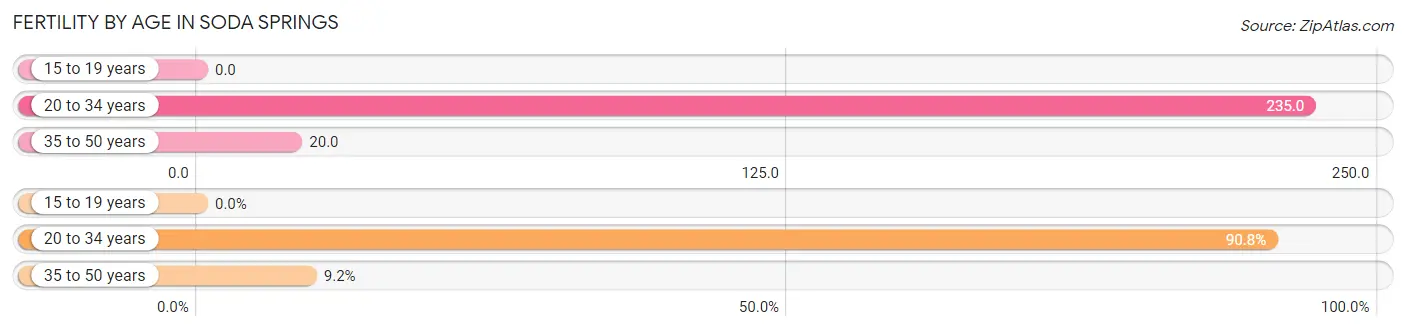
| Age Bracket | Women with Births | Births / 1,000 Women |
| 15 to 19 years | 0 (0.0%) | 0.0 |
| 20 to 34 years | 59 (90.8%) | 235.0 |
| 35 to 50 years | 6 (9.2%) | 20.0 |
| Total | 65 (100.0%) | 107.0 |
Fertility by Age by Marriage Status in Soda Springs
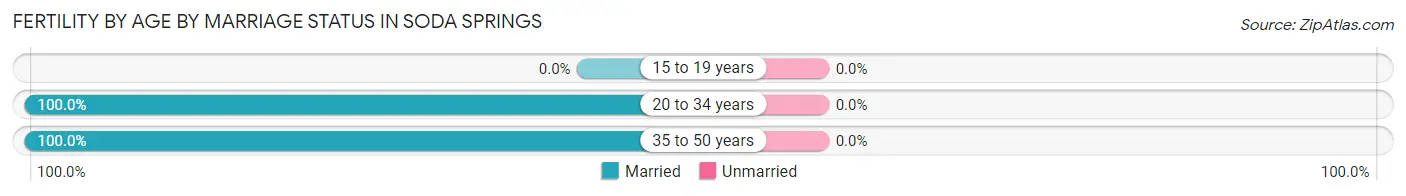
| Age Bracket | Married | Unmarried |
| 15 to 19 years | 0 (0.0%) | 0 (0.0%) |
| 20 to 34 years | 59 (100.0%) | 0 (0.0%) |
| 35 to 50 years | 6 (100.0%) | 0 (0.0%) |
| Total | 65 (100.0%) | 0 (0.0%) |
Fertility by Education in Soda Springs
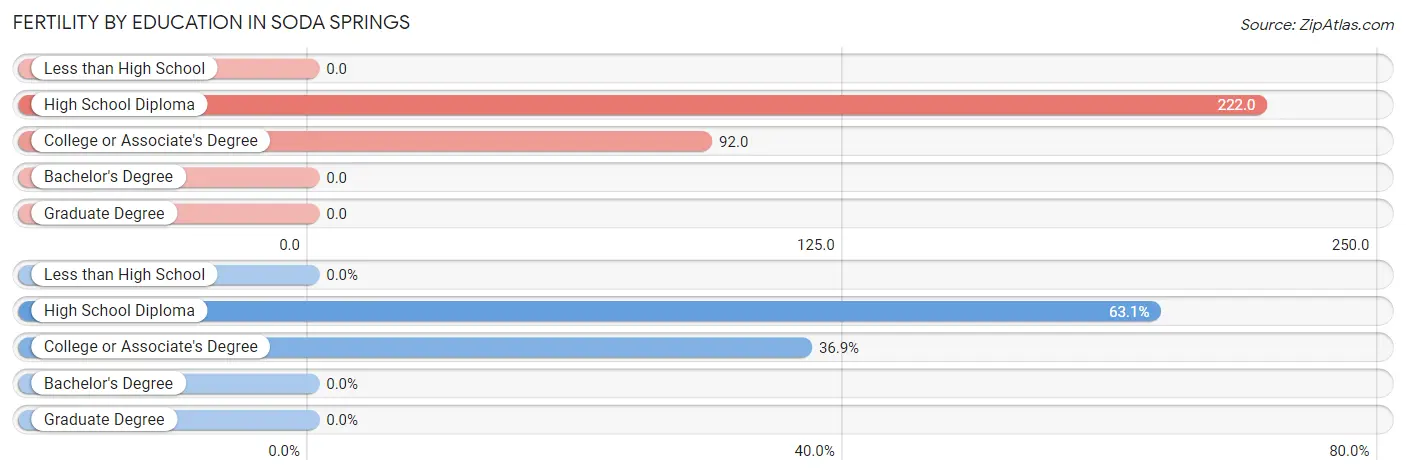
| Educational Attainment | Women with Births | Births / 1,000 Women |
| Less than High School | 0 (0.0%) | 0.0 |
| High School Diploma | 41 (63.1%) | 222.0 |
| College or Associate's Degree | 24 (36.9%) | 92.0 |
| Bachelor's Degree | 0 (0.0%) | 0.0 |
| Graduate Degree | 0 (0.0%) | 0.0 |
| Total | 65 (100.0%) | 107.0 |
Fertility by Education by Marriage Status in Soda Springs
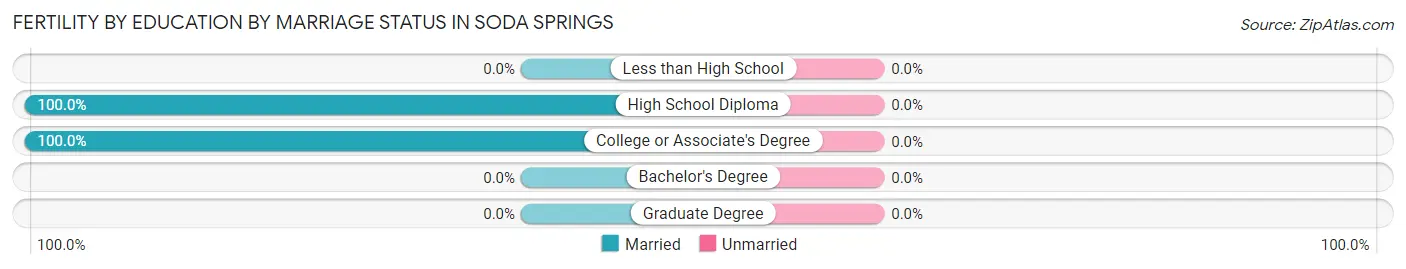
| Educational Attainment | Married | Unmarried |
| Less than High School | 0 (0.0%) | 0 (0.0%) |
| High School Diploma | 41 (100.0%) | 0 (0.0%) |
| College or Associate's Degree | 24 (100.0%) | 0 (0.0%) |
| Bachelor's Degree | 0 (0.0%) | 0 (0.0%) |
| Graduate Degree | 0 (0.0%) | 0 (0.0%) |
| Total | 65 (100.0%) | 0 (0.0%) |
Employment Characteristics in Soda Springs
Employment by Class of Employer in Soda Springs
Among the 1,454 employed individuals in Soda Springs, private company employees (909 | 62.5%), self-employed (not incorporated) (246 | 16.9%), and local government employees (145 | 10.0%) make up the most common classes of employment.
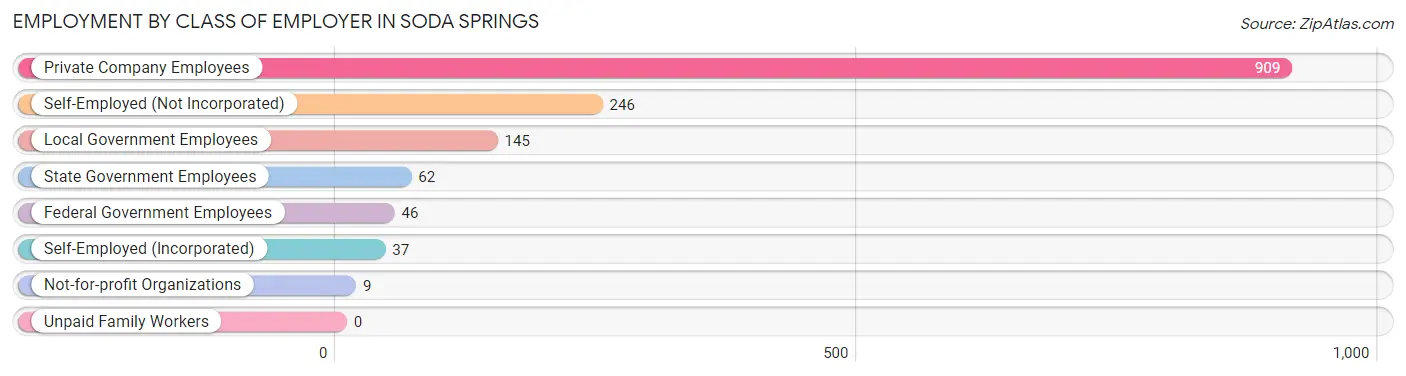
| Employer Class | # Employees | % Employees |
| Private Company Employees | 909 | 62.5% |
| Self-Employed (Incorporated) | 37 | 2.5% |
| Self-Employed (Not Incorporated) | 246 | 16.9% |
| Not-for-profit Organizations | 9 | 0.6% |
| Local Government Employees | 145 | 10.0% |
| State Government Employees | 62 | 4.3% |
| Federal Government Employees | 46 | 3.2% |
| Unpaid Family Workers | 0 | 0.0% |
| Total | 1,454 | 100.0% |
Employment Status by Age in Soda Springs
According to the labor force statistics for Soda Springs, out of the total population over 16 years of age (2,313), 66.2% or 1,531 individuals are in the labor force, with 2.5% or 38 of them unemployed. The age group with the highest labor force participation rate is 20 to 24 years, with 97.2% or 172 individuals in the labor force. Within the labor force, the 35 to 44 years age range has the highest percentage of unemployed individuals, with 8.9% or 33 of them being unemployed.
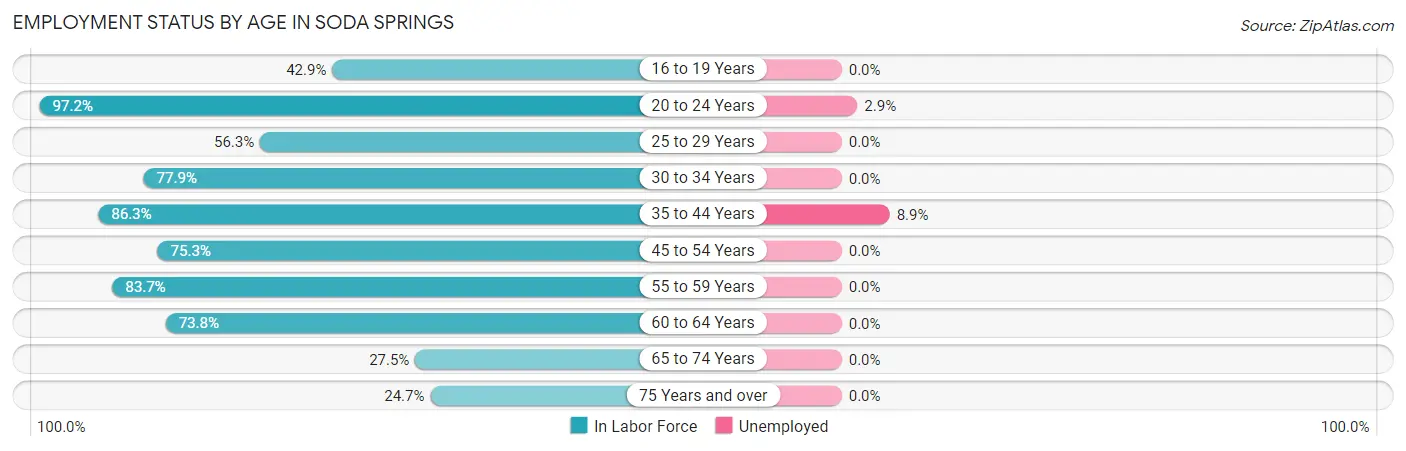
| Age Bracket | In Labor Force | Unemployed |
| 16 to 19 Years | 42 (42.9%) | 0 (0.0%) |
| 20 to 24 Years | 172 (97.2%) | 5 (2.9%) |
| 25 to 29 Years | 90 (56.3%) | 0 (0.0%) |
| 30 to 34 Years | 180 (77.9%) | 0 (0.0%) |
| 35 to 44 Years | 372 (86.3%) | 33 (8.9%) |
| 45 to 54 Years | 207 (75.3%) | 0 (0.0%) |
| 55 to 59 Years | 108 (83.7%) | 0 (0.0%) |
| 60 to 64 Years | 228 (73.8%) | 0 (0.0%) |
| 65 to 74 Years | 84 (27.5%) | 0 (0.0%) |
| 75 Years and over | 49 (24.7%) | 0 (0.0%) |
| Total | 1,531 (66.2%) | 38 (2.5%) |
Employment Status by Educational Attainment in Soda Springs
According to labor force statistics for Soda Springs, 77.2% of individuals (1,185) out of the total population between 25 and 64 years of age (1,535) are in the labor force, with 2.8% or 33 of them being unemployed. The group with the highest labor force participation rate are those with the educational attainment of bachelor's degree or higher, with 95.6% or 152 individuals in the labor force. Within the labor force, individuals with less than high school education have the highest percentage of unemployment, with 18.9% or 33 of them being unemployed.
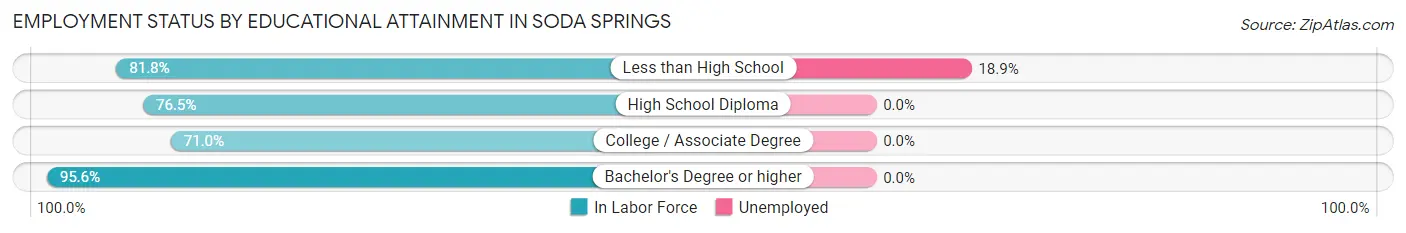
| Educational Attainment | In Labor Force | Unemployed |
| Less than High School | 175 (81.8%) | 40 (18.9%) |
| High School Diploma | 456 (76.5%) | 0 (0.0%) |
| College / Associate Degree | 402 (71.0%) | 0 (0.0%) |
| Bachelor's Degree or higher | 152 (95.6%) | 0 (0.0%) |
| Total | 1,185 (77.2%) | 43 (2.8%) |
Employment Occupations by Sex in Soda Springs
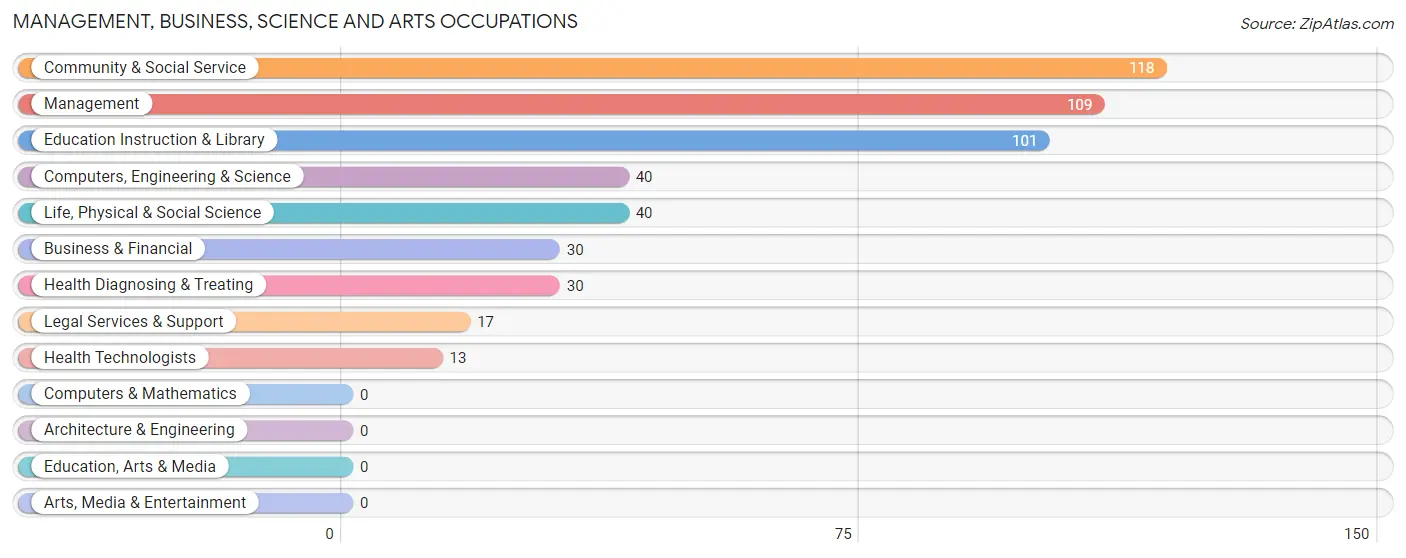
Management, Business, Science and Arts Occupations
The most common Management, Business, Science and Arts occupations in Soda Springs are Community & Social Service (118 | 8.0%), Management (109 | 7.4%), Education Instruction & Library (101 | 6.8%), Computers, Engineering & Science (40 | 2.7%), and Life, Physical & Social Science (40 | 2.7%).
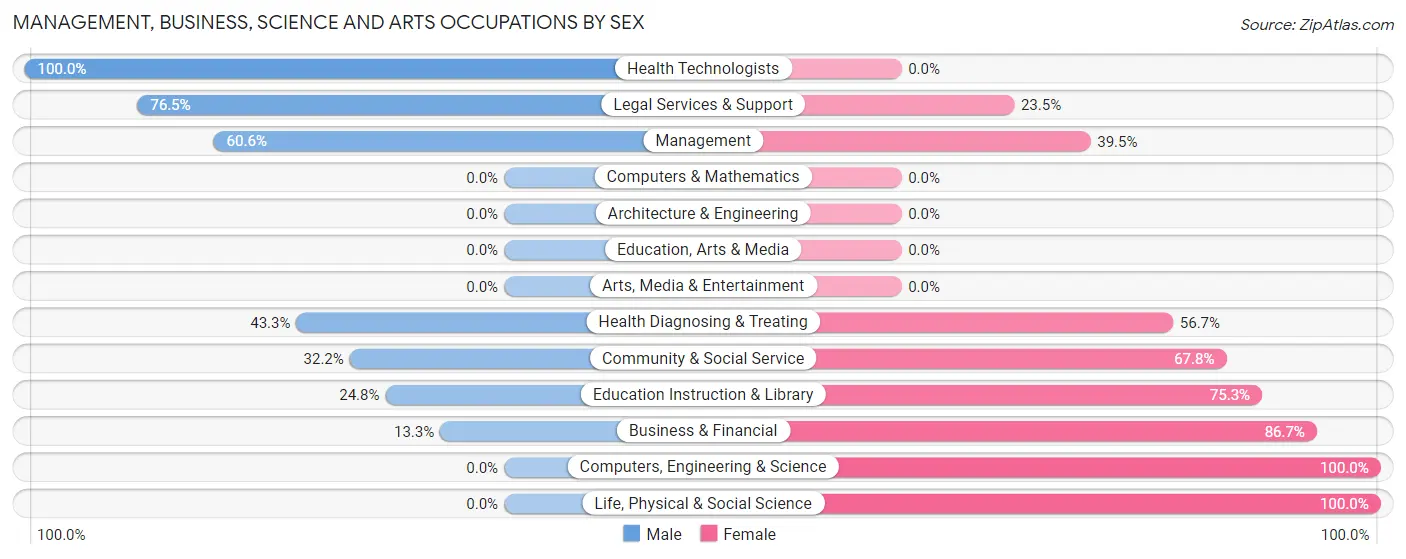
Management, Business, Science and Arts Occupations by Sex
Within the Management, Business, Science and Arts occupations in Soda Springs, the most male-oriented occupations are Health Technologists (100.0%), Legal Services & Support (76.5%), and Management (60.6%), while the most female-oriented occupations are Computers, Engineering & Science (100.0%), Life, Physical & Social Science (100.0%), and Business & Financial (86.7%).
| Occupation | Male | Female |
| Management | 66 (60.6%) | 43 (39.5%) |
| Business & Financial | 4 (13.3%) | 26 (86.7%) |
| Computers, Engineering & Science | 0 (0.0%) | 40 (100.0%) |
| Computers & Mathematics | 0 (0.0%) | 0 (0.0%) |
| Architecture & Engineering | 0 (0.0%) | 0 (0.0%) |
| Life, Physical & Social Science | 0 (0.0%) | 40 (100.0%) |
| Community & Social Service | 38 (32.2%) | 80 (67.8%) |
| Education, Arts & Media | 0 (0.0%) | 0 (0.0%) |
| Legal Services & Support | 13 (76.5%) | 4 (23.5%) |
| Education Instruction & Library | 25 (24.7%) | 76 (75.2%) |
| Arts, Media & Entertainment | 0 (0.0%) | 0 (0.0%) |
| Health Diagnosing & Treating | 13 (43.3%) | 17 (56.7%) |
| Health Technologists | 13 (100.0%) | 0 (0.0%) |
| Total (Category) | 121 (37.0%) | 206 (63.0%) |
| Total (Overall) | 743 (50.3%) | 734 (49.7%) |
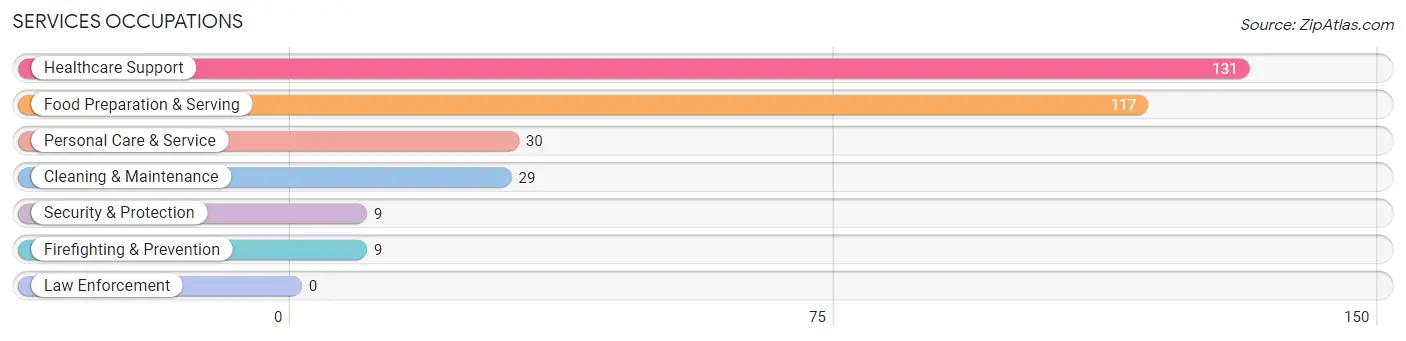
Services Occupations
The most common Services occupations in Soda Springs are Healthcare Support (131 | 8.9%), Food Preparation & Serving (117 | 7.9%), Personal Care & Service (30 | 2.0%), Cleaning & Maintenance (29 | 2.0%), and Security & Protection (9 | 0.6%).
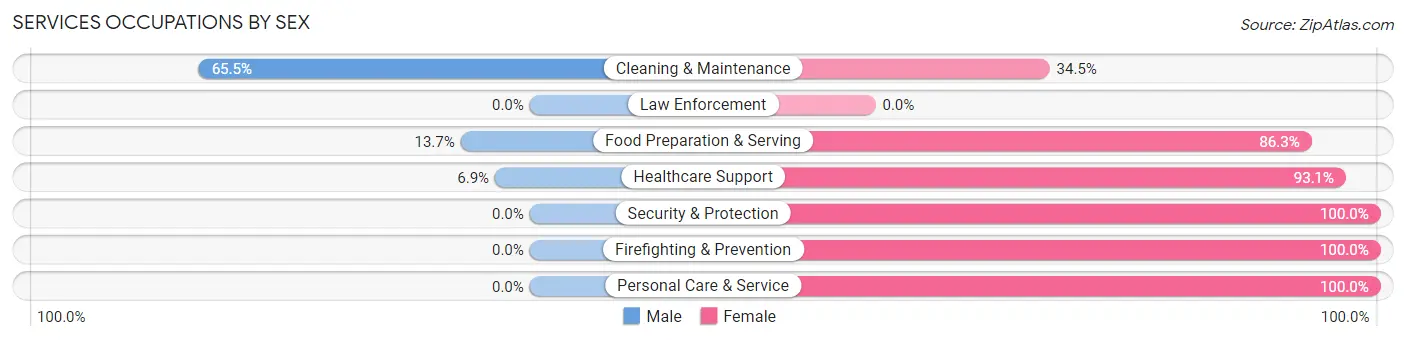
Services Occupations by Sex
Within the Services occupations in Soda Springs, the most male-oriented occupations are Cleaning & Maintenance (65.5%), Food Preparation & Serving (13.7%), and Healthcare Support (6.9%), while the most female-oriented occupations are Security & Protection (100.0%), Firefighting & Prevention (100.0%), and Personal Care & Service (100.0%).
| Occupation | Male | Female |
| Healthcare Support | 9 (6.9%) | 122 (93.1%) |
| Security & Protection | 0 (0.0%) | 9 (100.0%) |
| Firefighting & Prevention | 0 (0.0%) | 9 (100.0%) |
| Law Enforcement | 0 (0.0%) | 0 (0.0%) |
| Food Preparation & Serving | 16 (13.7%) | 101 (86.3%) |
| Cleaning & Maintenance | 19 (65.5%) | 10 (34.5%) |
| Personal Care & Service | 0 (0.0%) | 30 (100.0%) |
| Total (Category) | 44 (13.9%) | 272 (86.1%) |
| Total (Overall) | 743 (50.3%) | 734 (49.7%) |
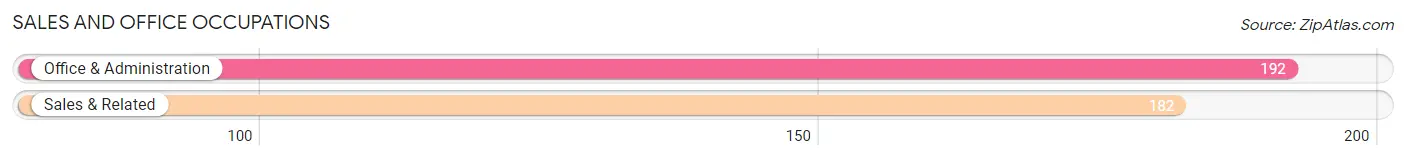
Sales and Office Occupations
The most common Sales and Office occupations in Soda Springs are Office & Administration (192 | 13.0%), and Sales & Related (182 | 12.3%).
Sales and Office Occupations by Sex
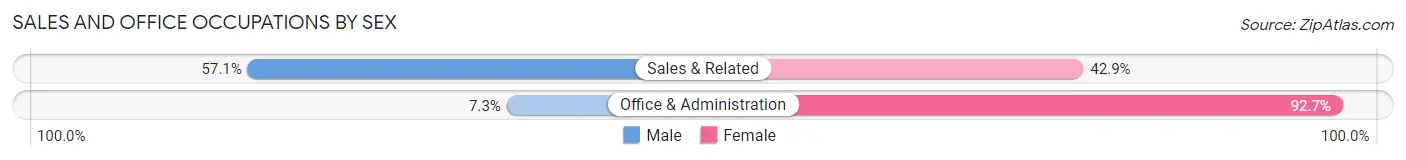
| Occupation | Male | Female |
| Sales & Related | 104 (57.1%) | 78 (42.9%) |
| Office & Administration | 14 (7.3%) | 178 (92.7%) |
| Total (Category) | 118 (31.6%) | 256 (68.4%) |
| Total (Overall) | 743 (50.3%) | 734 (49.7%) |
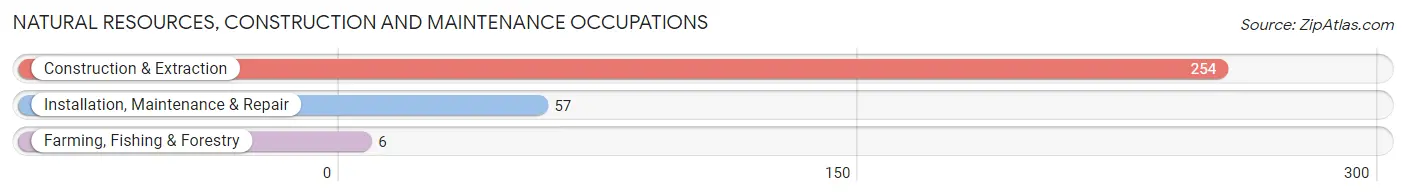
Natural Resources, Construction and Maintenance Occupations
The most common Natural Resources, Construction and Maintenance occupations in Soda Springs are Construction & Extraction (254 | 17.2%), Installation, Maintenance & Repair (57 | 3.9%), and Farming, Fishing & Forestry (6 | 0.4%).
Natural Resources, Construction and Maintenance Occupations by Sex
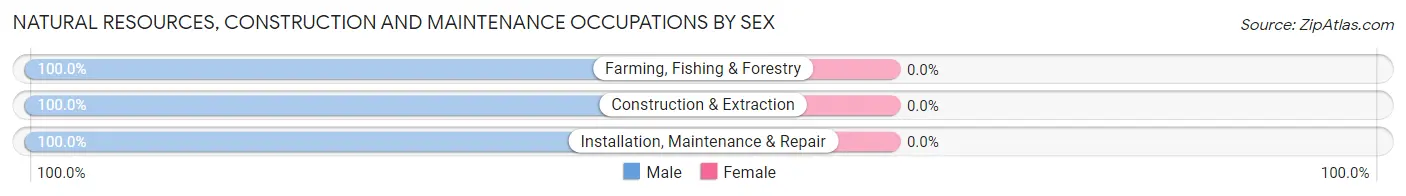
| Occupation | Male | Female |
| Farming, Fishing & Forestry | 6 (100.0%) | 0 (0.0%) |
| Construction & Extraction | 254 (100.0%) | 0 (0.0%) |
| Installation, Maintenance & Repair | 57 (100.0%) | 0 (0.0%) |
| Total (Category) | 317 (100.0%) | 0 (0.0%) |
| Total (Overall) | 743 (50.3%) | 734 (49.7%) |
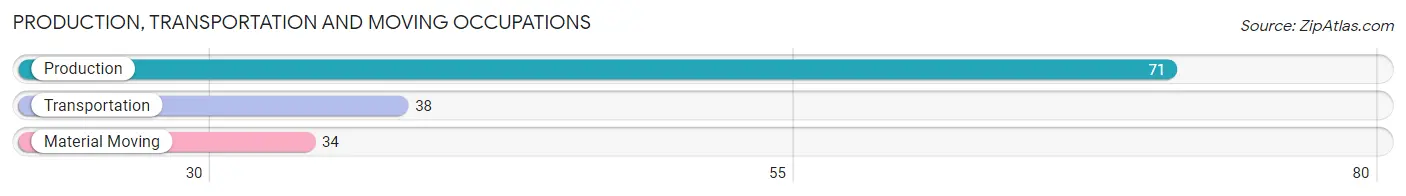
Production, Transportation and Moving Occupations
The most common Production, Transportation and Moving occupations in Soda Springs are Production (71 | 4.8%), Transportation (38 | 2.6%), and Material Moving (34 | 2.3%).
Production, Transportation and Moving Occupations by Sex
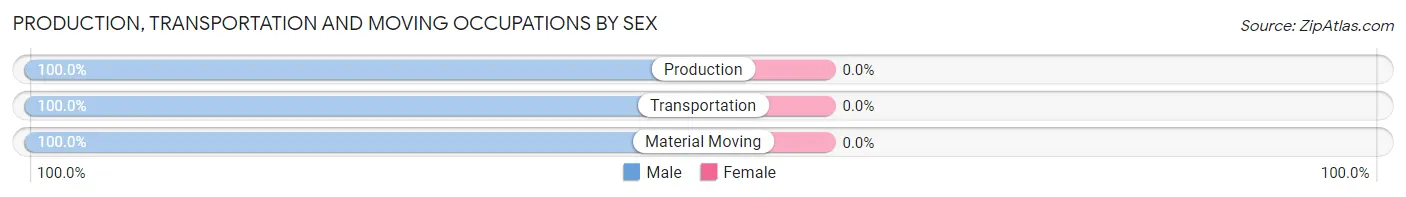
| Occupation | Male | Female |
| Production | 71 (100.0%) | 0 (0.0%) |
| Transportation | 38 (100.0%) | 0 (0.0%) |
| Material Moving | 34 (100.0%) | 0 (0.0%) |
| Total (Category) | 143 (100.0%) | 0 (0.0%) |
| Total (Overall) | 743 (50.3%) | 734 (49.7%) |
Employment Industries by Sex in Soda Springs
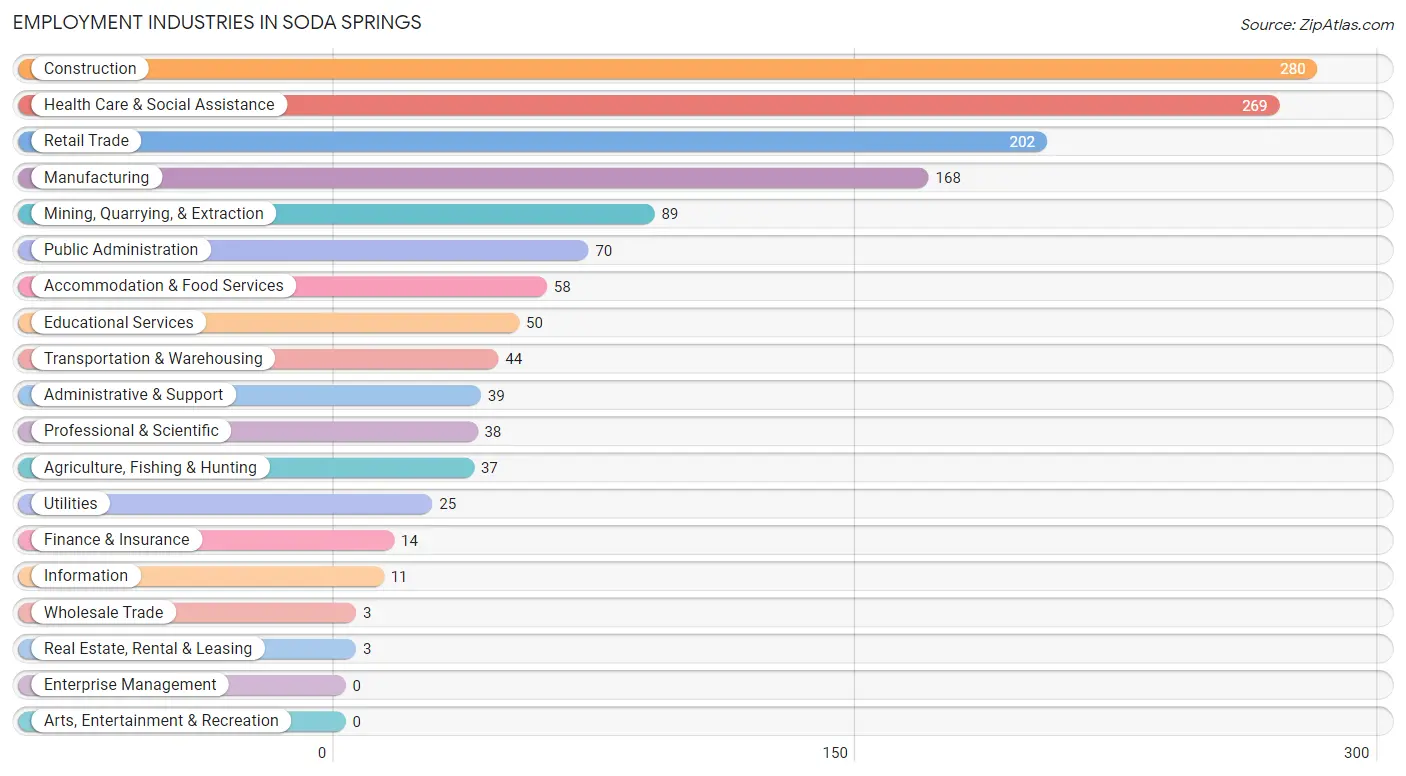
Employment Industries in Soda Springs
The major employment industries in Soda Springs include Construction (280 | 19.0%), Health Care & Social Assistance (269 | 18.2%), Retail Trade (202 | 13.7%), Manufacturing (168 | 11.4%), and Mining, Quarrying, & Extraction (89 | 6.0%).
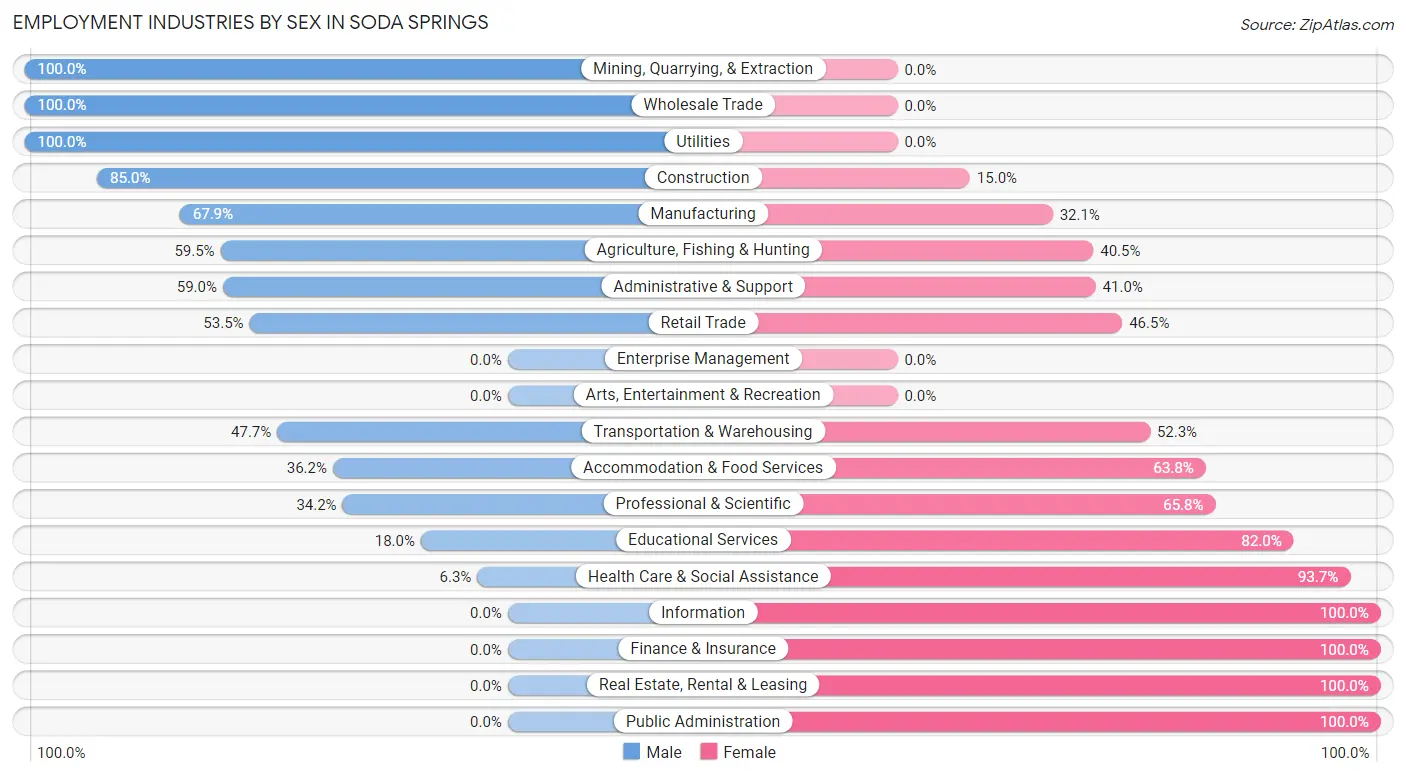
Employment Industries by Sex in Soda Springs
The Soda Springs industries that see more men than women are Mining, Quarrying, & Extraction (100.0%), Wholesale Trade (100.0%), and Utilities (100.0%), whereas the industries that tend to have a higher number of women are Information (100.0%), Finance & Insurance (100.0%), and Real Estate, Rental & Leasing (100.0%).
| Industry | Male | Female |
| Agriculture, Fishing & Hunting | 22 (59.5%) | 15 (40.5%) |
| Mining, Quarrying, & Extraction | 89 (100.0%) | 0 (0.0%) |
| Construction | 238 (85.0%) | 42 (15.0%) |
| Manufacturing | 114 (67.9%) | 54 (32.1%) |
| Wholesale Trade | 3 (100.0%) | 0 (0.0%) |
| Retail Trade | 108 (53.5%) | 94 (46.5%) |
| Transportation & Warehousing | 21 (47.7%) | 23 (52.3%) |
| Utilities | 25 (100.0%) | 0 (0.0%) |
| Information | 0 (0.0%) | 11 (100.0%) |
| Finance & Insurance | 0 (0.0%) | 14 (100.0%) |
| Real Estate, Rental & Leasing | 0 (0.0%) | 3 (100.0%) |
| Professional & Scientific | 13 (34.2%) | 25 (65.8%) |
| Enterprise Management | 0 (0.0%) | 0 (0.0%) |
| Administrative & Support | 23 (59.0%) | 16 (41.0%) |
| Educational Services | 9 (18.0%) | 41 (82.0%) |
| Health Care & Social Assistance | 17 (6.3%) | 252 (93.7%) |
| Arts, Entertainment & Recreation | 0 (0.0%) | 0 (0.0%) |
| Accommodation & Food Services | 21 (36.2%) | 37 (63.8%) |
| Public Administration | 0 (0.0%) | 70 (100.0%) |
| Total | 743 (50.3%) | 734 (49.7%) |
Education in Soda Springs
School Enrollment in Soda Springs
The most common levels of schooling among the 711 students in Soda Springs are middle school (251 | 35.3%), elementary school (185 | 26.0%), and high school (167 | 23.5%).
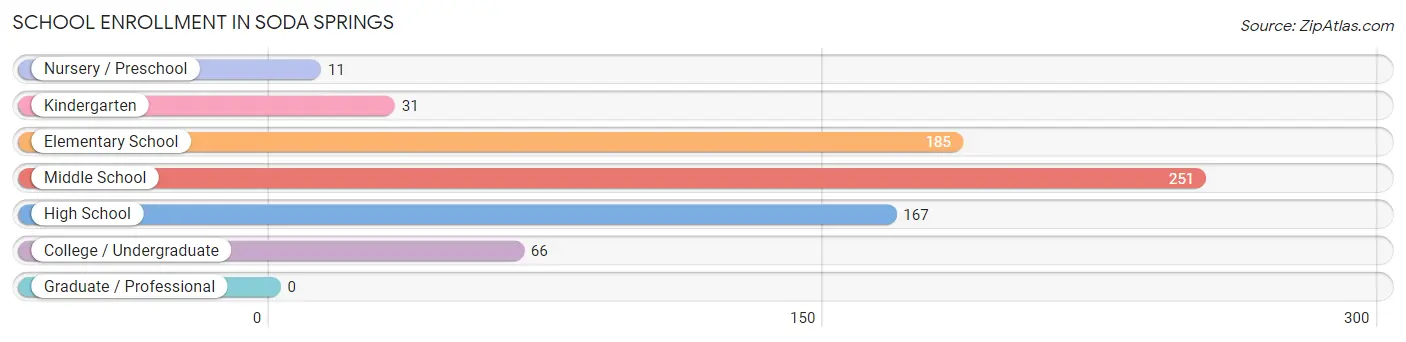
| School Level | # Students | % Students |
| Nursery / Preschool | 11 | 1.5% |
| Kindergarten | 31 | 4.4% |
| Elementary School | 185 | 26.0% |
| Middle School | 251 | 35.3% |
| High School | 167 | 23.5% |
| College / Undergraduate | 66 | 9.3% |
| Graduate / Professional | 0 | 0.0% |
| Total | 711 | 100.0% |
School Enrollment by Age by Funding Source in Soda Springs
Out of a total of 711 students who are enrolled in schools in Soda Springs, 27 (3.8%) attend a private institution, while the remaining 684 (96.2%) are enrolled in public schools. The age group of 5 to 9 year old has the highest likelihood of being enrolled in private schools, with 22 (10.9% in the age bracket) enrolled. Conversely, the age group of 10 to 14 year olds has the lowest likelihood of being enrolled in a private school, with 334 (100.0% in the age bracket) attending a public institution.
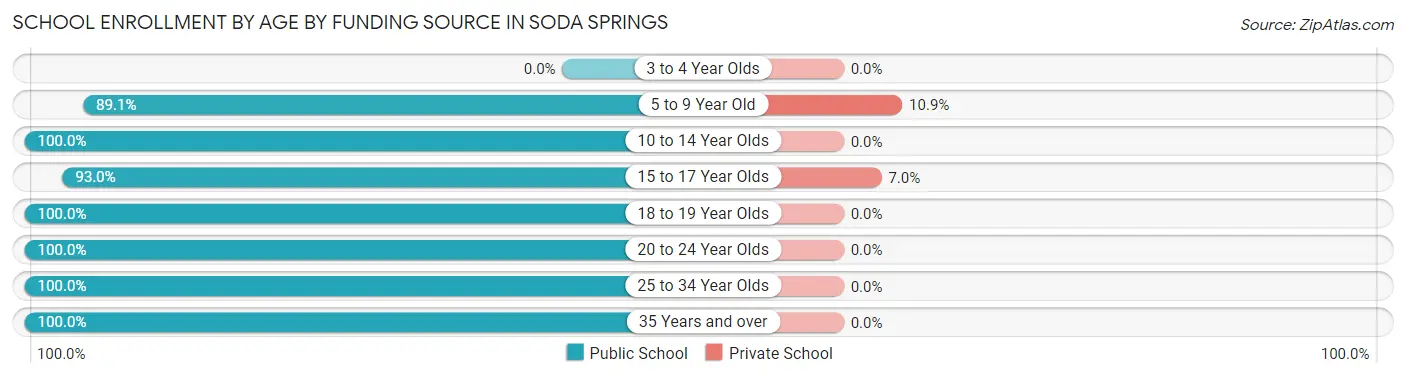
| Age Bracket | Public School | Private School |
| 3 to 4 Year Olds | 0 (0.0%) | 0 (0.0%) |
| 5 to 9 Year Old | 180 (89.1%) | 22 (10.9%) |
| 10 to 14 Year Olds | 334 (100.0%) | 0 (0.0%) |
| 15 to 17 Year Olds | 66 (93.0%) | 5 (7.0%) |
| 18 to 19 Year Olds | 30 (100.0%) | 0 (0.0%) |
| 20 to 24 Year Olds | 7 (100.0%) | 0 (0.0%) |
| 25 to 34 Year Olds | 59 (100.0%) | 0 (0.0%) |
| 35 Years and over | 8 (100.0%) | 0 (0.0%) |
| Total | 684 (96.2%) | 27 (3.8%) |
Educational Attainment by Field of Study in Soda Springs
Education (60 | 28.6%), business (54 | 25.7%), bio, nature & agricultural (21 | 10.0%), literature & languages (21 | 10.0%), and science & technology (16 | 7.6%) are the most common fields of study among 210 individuals in Soda Springs who have obtained a bachelor's degree or higher.
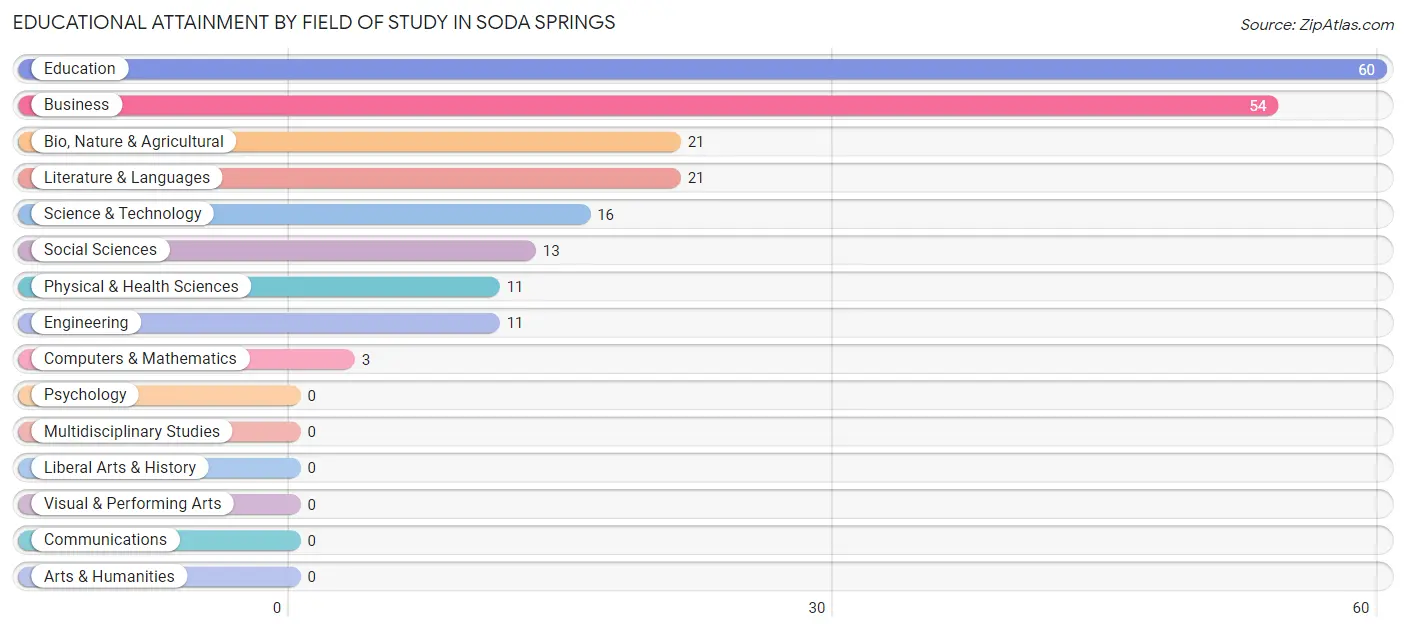
| Field of Study | # Graduates | % Graduates |
| Computers & Mathematics | 3 | 1.4% |
| Bio, Nature & Agricultural | 21 | 10.0% |
| Physical & Health Sciences | 11 | 5.2% |
| Psychology | 0 | 0.0% |
| Social Sciences | 13 | 6.2% |
| Engineering | 11 | 5.2% |
| Multidisciplinary Studies | 0 | 0.0% |
| Science & Technology | 16 | 7.6% |
| Business | 54 | 25.7% |
| Education | 60 | 28.6% |
| Literature & Languages | 21 | 10.0% |
| Liberal Arts & History | 0 | 0.0% |
| Visual & Performing Arts | 0 | 0.0% |
| Communications | 0 | 0.0% |
| Arts & Humanities | 0 | 0.0% |
| Total | 210 | 100.0% |
Transportation & Commute in Soda Springs
Vehicle Availability by Sex in Soda Springs
The most prevalent vehicle ownership categories in Soda Springs are males with 4 vehicles (222, accounting for 31.3%) and females with 4 vehicles (142, making up 30.2%).
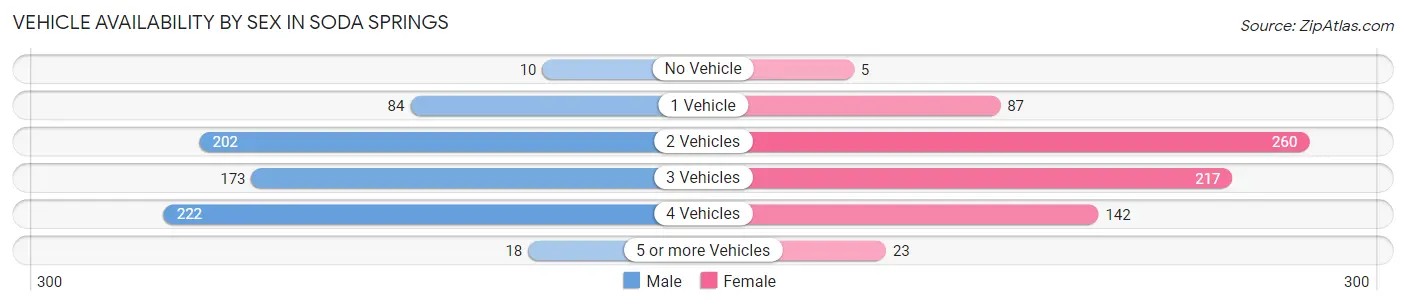
| Vehicles Available | Male | Female |
| No Vehicle | 10 (1.4%) | 5 (0.7%) |
| 1 Vehicle | 84 (11.8%) | 87 (11.8%) |
| 2 Vehicles | 202 (28.5%) | 260 (35.4%) |
| 3 Vehicles | 173 (24.4%) | 217 (29.6%) |
| 4 Vehicles | 222 (31.3%) | 142 (19.4%) |
| 5 or more Vehicles | 18 (2.5%) | 23 (3.1%) |
| Total | 709 (100.0%) | 734 (100.0%) |
Commute Time in Soda Springs
The most frequently occuring commute durations in Soda Springs are 5 to 9 minutes (435 commuters, 30.2%), less than 5 minutes (358 commuters, 24.9%), and 10 to 14 minutes (236 commuters, 16.4%).
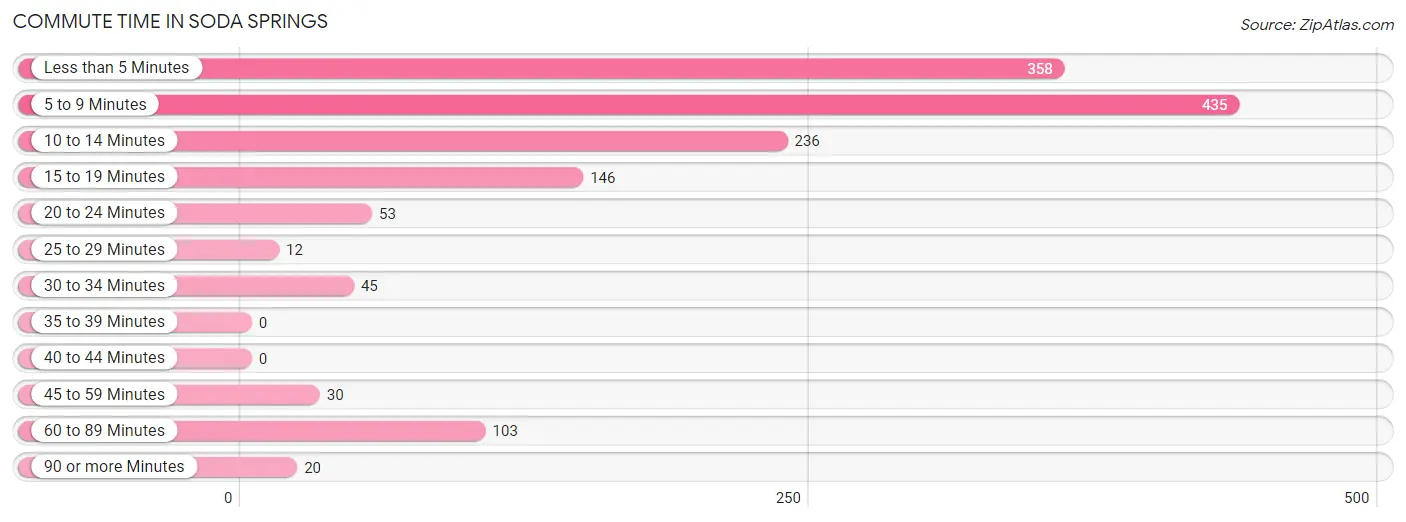
| Commute Time | # Commuters | % Commuters |
| Less than 5 Minutes | 358 | 24.9% |
| 5 to 9 Minutes | 435 | 30.2% |
| 10 to 14 Minutes | 236 | 16.4% |
| 15 to 19 Minutes | 146 | 10.2% |
| 20 to 24 Minutes | 53 | 3.7% |
| 25 to 29 Minutes | 12 | 0.8% |
| 30 to 34 Minutes | 45 | 3.1% |
| 35 to 39 Minutes | 0 | 0.0% |
| 40 to 44 Minutes | 0 | 0.0% |
| 45 to 59 Minutes | 30 | 2.1% |
| 60 to 89 Minutes | 103 | 7.2% |
| 90 or more Minutes | 20 | 1.4% |
Commute Time by Sex in Soda Springs
The most common commute times in Soda Springs are 5 to 9 minutes (156 commuters, 22.0%) for males and 5 to 9 minutes (279 commuters, 38.3%) for females.
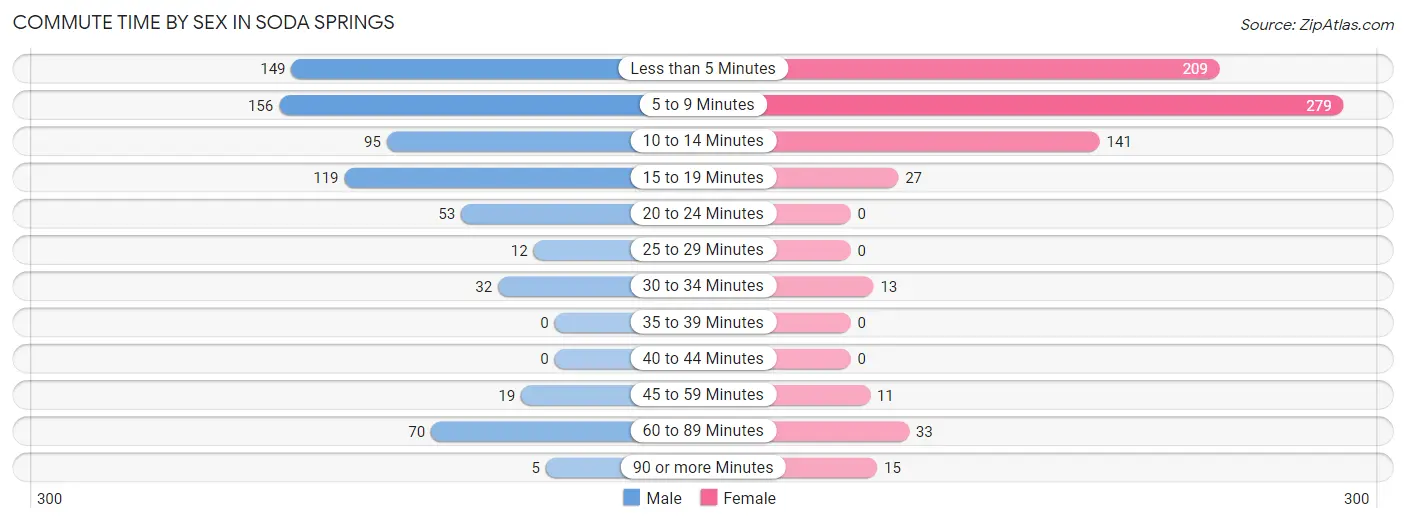
| Commute Time | Male | Female |
| Less than 5 Minutes | 149 (21.0%) | 209 (28.7%) |
| 5 to 9 Minutes | 156 (22.0%) | 279 (38.3%) |
| 10 to 14 Minutes | 95 (13.4%) | 141 (19.4%) |
| 15 to 19 Minutes | 119 (16.8%) | 27 (3.7%) |
| 20 to 24 Minutes | 53 (7.5%) | 0 (0.0%) |
| 25 to 29 Minutes | 12 (1.7%) | 0 (0.0%) |
| 30 to 34 Minutes | 32 (4.5%) | 13 (1.8%) |
| 35 to 39 Minutes | 0 (0.0%) | 0 (0.0%) |
| 40 to 44 Minutes | 0 (0.0%) | 0 (0.0%) |
| 45 to 59 Minutes | 19 (2.7%) | 11 (1.5%) |
| 60 to 89 Minutes | 70 (9.9%) | 33 (4.5%) |
| 90 or more Minutes | 5 (0.7%) | 15 (2.1%) |
Time of Departure to Work by Sex in Soda Springs
The most frequent times of departure to work in Soda Springs are 7:30 AM to 7:59 AM (144, 20.3%) for males and 8:00 AM to 8:29 AM (134, 18.4%) for females.
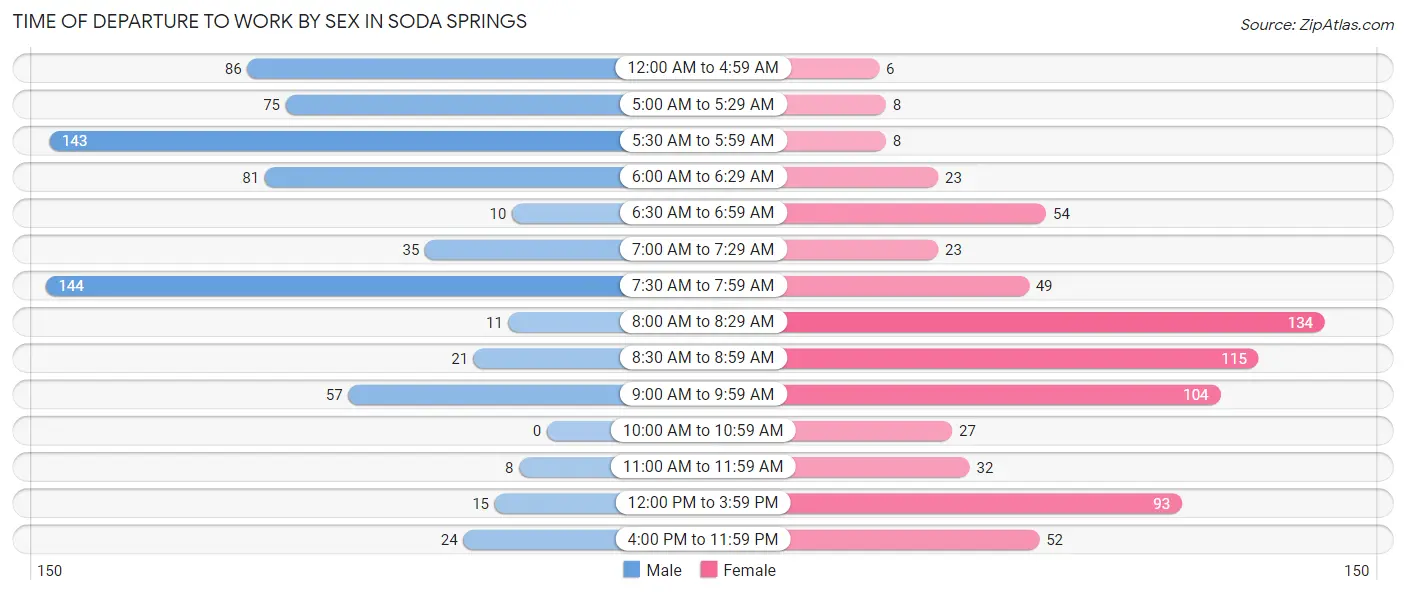
| Time of Departure | Male | Female |
| 12:00 AM to 4:59 AM | 86 (12.1%) | 6 (0.8%) |
| 5:00 AM to 5:29 AM | 75 (10.6%) | 8 (1.1%) |
| 5:30 AM to 5:59 AM | 143 (20.1%) | 8 (1.1%) |
| 6:00 AM to 6:29 AM | 81 (11.4%) | 23 (3.2%) |
| 6:30 AM to 6:59 AM | 10 (1.4%) | 54 (7.4%) |
| 7:00 AM to 7:29 AM | 35 (4.9%) | 23 (3.2%) |
| 7:30 AM to 7:59 AM | 144 (20.3%) | 49 (6.7%) |
| 8:00 AM to 8:29 AM | 11 (1.5%) | 134 (18.4%) |
| 8:30 AM to 8:59 AM | 21 (3.0%) | 115 (15.8%) |
| 9:00 AM to 9:59 AM | 57 (8.0%) | 104 (14.3%) |
| 10:00 AM to 10:59 AM | 0 (0.0%) | 27 (3.7%) |
| 11:00 AM to 11:59 AM | 8 (1.1%) | 32 (4.4%) |
| 12:00 PM to 3:59 PM | 15 (2.1%) | 93 (12.8%) |
| 4:00 PM to 11:59 PM | 24 (3.4%) | 52 (7.1%) |
| Total | 710 (100.0%) | 728 (100.0%) |
Housing Occupancy in Soda Springs
Occupancy by Ownership in Soda Springs
Of the total 1,213 dwellings in Soda Springs, owner-occupied units account for 857 (70.7%), while renter-occupied units make up 356 (29.3%).
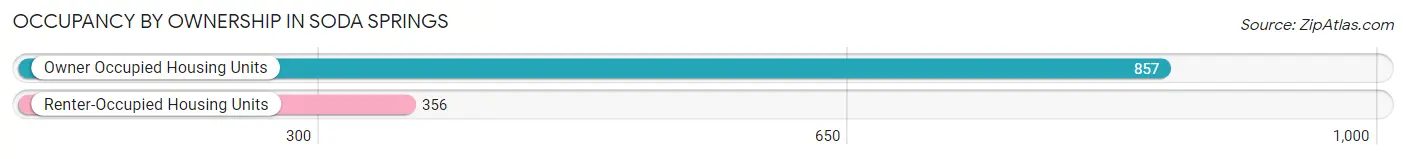
| Occupancy | # Housing Units | % Housing Units |
| Owner Occupied Housing Units | 857 | 70.7% |
| Renter-Occupied Housing Units | 356 | 29.3% |
| Total Occupied Housing Units | 1,213 | 100.0% |
Occupancy by Household Size in Soda Springs
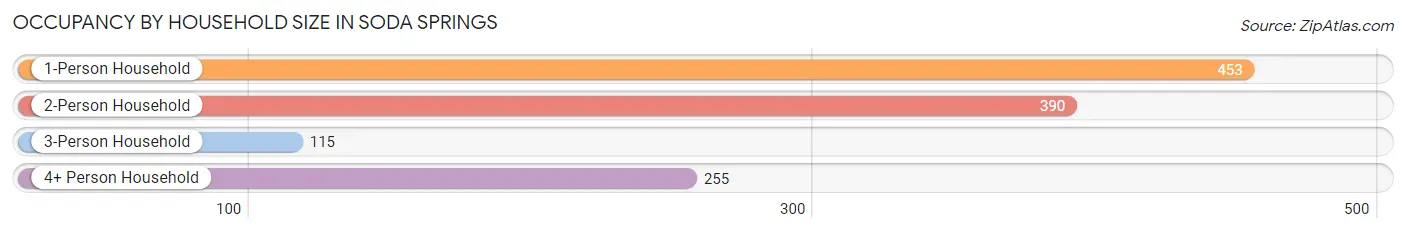
| Household Size | # Housing Units | % Housing Units |
| 1-Person Household | 453 | 37.3% |
| 2-Person Household | 390 | 32.2% |
| 3-Person Household | 115 | 9.5% |
| 4+ Person Household | 255 | 21.0% |
| Total Housing Units | 1,213 | 100.0% |
Occupancy by Ownership by Household Size in Soda Springs
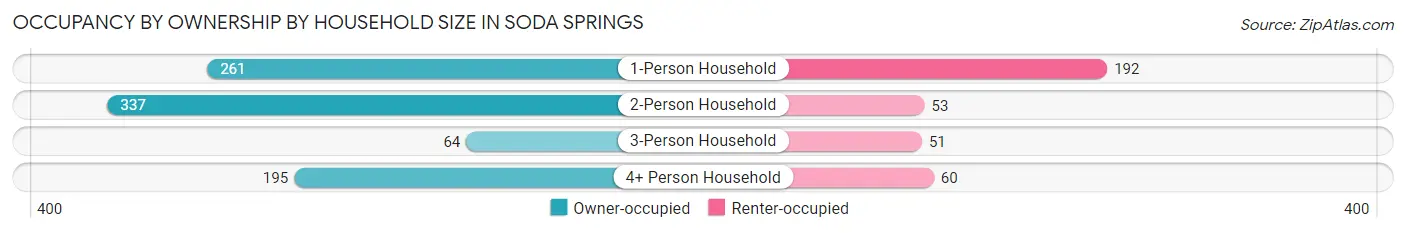
| Household Size | Owner-occupied | Renter-occupied |
| 1-Person Household | 261 (57.6%) | 192 (42.4%) |
| 2-Person Household | 337 (86.4%) | 53 (13.6%) |
| 3-Person Household | 64 (55.6%) | 51 (44.4%) |
| 4+ Person Household | 195 (76.5%) | 60 (23.5%) |
| Total Housing Units | 857 (70.7%) | 356 (29.3%) |
Occupancy by Educational Attainment in Soda Springs
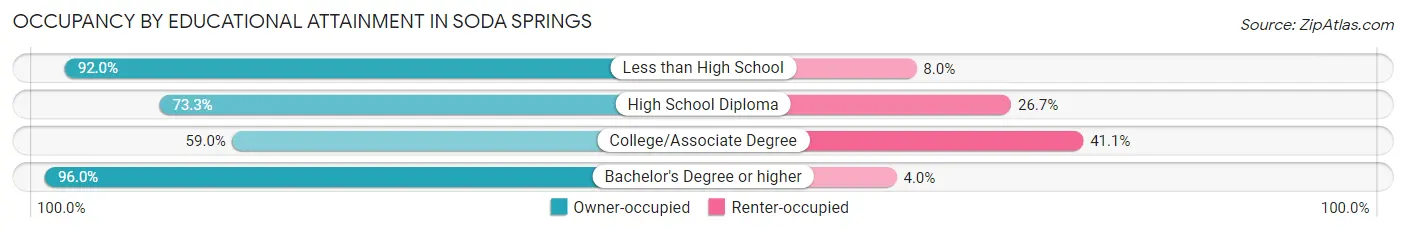
| Household Size | Owner-occupied | Renter-occupied |
| Less than High School | 150 (92.0%) | 13 (8.0%) |
| High School Diploma | 263 (73.3%) | 96 (26.7%) |
| College/Associate Degree | 349 (59.0%) | 243 (41.0%) |
| Bachelor's Degree or higher | 95 (96.0%) | 4 (4.0%) |
Occupancy by Age of Householder in Soda Springs
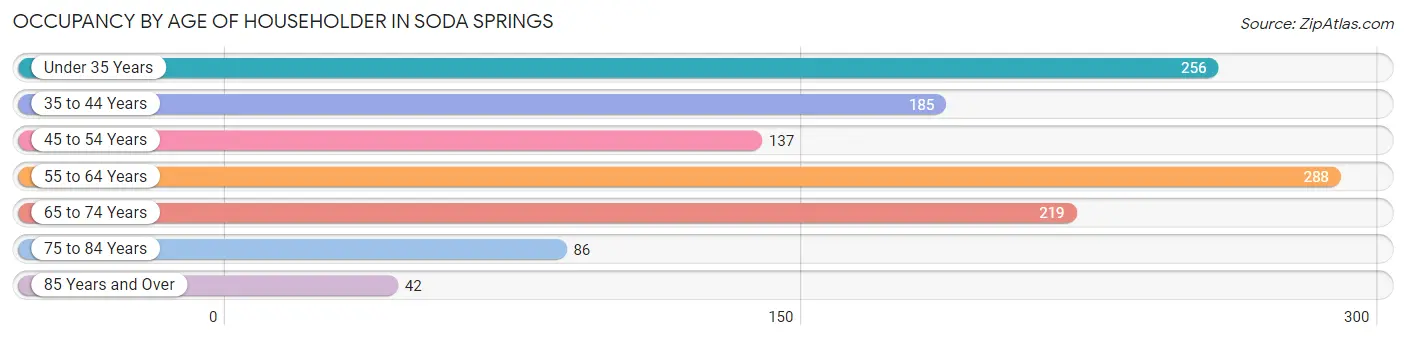
| Age Bracket | # Households | % Households |
| Under 35 Years | 256 | 21.1% |
| 35 to 44 Years | 185 | 15.2% |
| 45 to 54 Years | 137 | 11.3% |
| 55 to 64 Years | 288 | 23.7% |
| 65 to 74 Years | 219 | 18.0% |
| 75 to 84 Years | 86 | 7.1% |
| 85 Years and Over | 42 | 3.5% |
| Total | 1,213 | 100.0% |
Housing Finances in Soda Springs
Median Income by Occupancy in Soda Springs
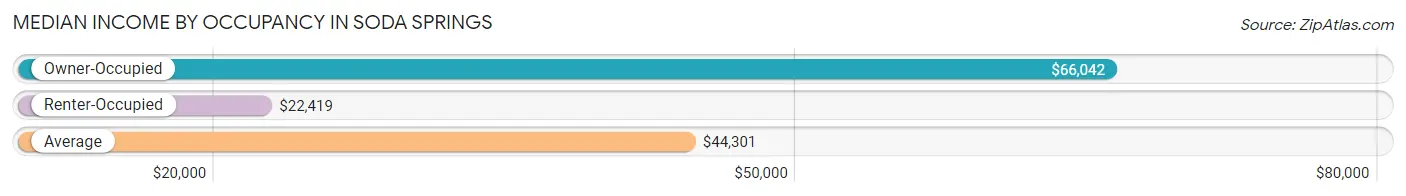
| Occupancy Type | # Households | Median Income |
| Owner-Occupied | 857 (70.7%) | $66,042 |
| Renter-Occupied | 356 (29.3%) | $22,419 |
| Average | 1,213 (100.0%) | $44,301 |
Occupancy by Householder Income Bracket in Soda Springs
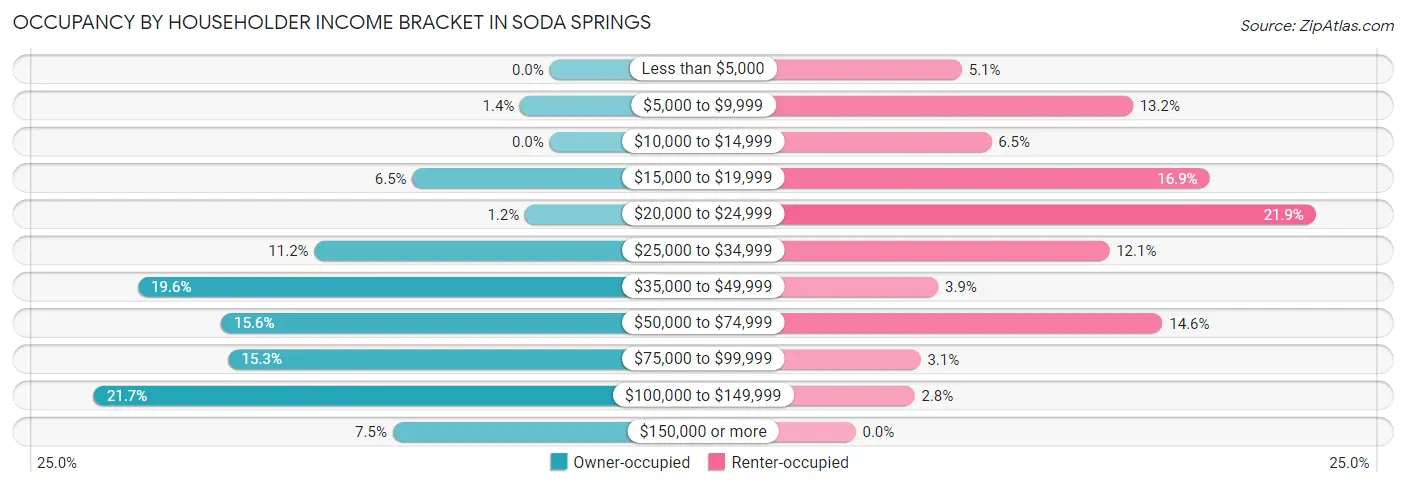
| Income Bracket | Owner-occupied | Renter-occupied |
| Less than $5,000 | 0 (0.0%) | 18 (5.1%) |
| $5,000 to $9,999 | 12 (1.4%) | 47 (13.2%) |
| $10,000 to $14,999 | 0 (0.0%) | 23 (6.5%) |
| $15,000 to $19,999 | 56 (6.5%) | 60 (16.9%) |
| $20,000 to $24,999 | 10 (1.2%) | 78 (21.9%) |
| $25,000 to $34,999 | 96 (11.2%) | 43 (12.1%) |
| $35,000 to $49,999 | 168 (19.6%) | 14 (3.9%) |
| $50,000 to $74,999 | 134 (15.6%) | 52 (14.6%) |
| $75,000 to $99,999 | 131 (15.3%) | 11 (3.1%) |
| $100,000 to $149,999 | 186 (21.7%) | 10 (2.8%) |
| $150,000 or more | 64 (7.5%) | 0 (0.0%) |
| Total | 857 (100.0%) | 356 (100.0%) |
Monthly Housing Cost Tiers in Soda Springs
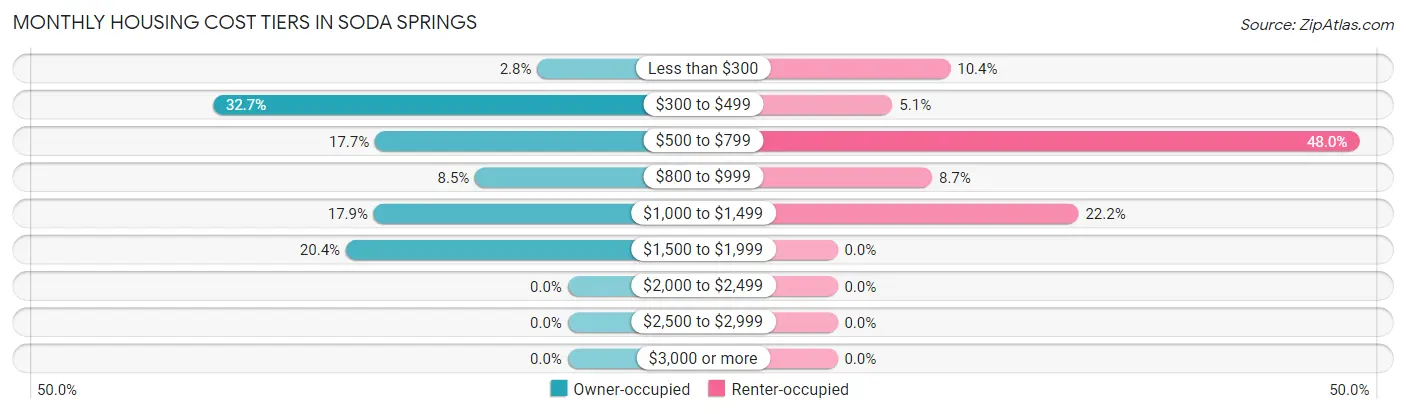
| Monthly Cost | Owner-occupied | Renter-occupied |
| Less than $300 | 24 (2.8%) | 37 (10.4%) |
| $300 to $499 | 280 (32.7%) | 18 (5.1%) |
| $500 to $799 | 152 (17.7%) | 171 (48.0%) |
| $800 to $999 | 73 (8.5%) | 31 (8.7%) |
| $1,000 to $1,499 | 153 (17.8%) | 79 (22.2%) |
| $1,500 to $1,999 | 175 (20.4%) | 0 (0.0%) |
| $2,000 to $2,499 | 0 (0.0%) | 0 (0.0%) |
| $2,500 to $2,999 | 0 (0.0%) | 0 (0.0%) |
| $3,000 or more | 0 (0.0%) | 0 (0.0%) |
| Total | 857 (100.0%) | 356 (100.0%) |
Physical Housing Characteristics in Soda Springs
Housing Structures in Soda Springs
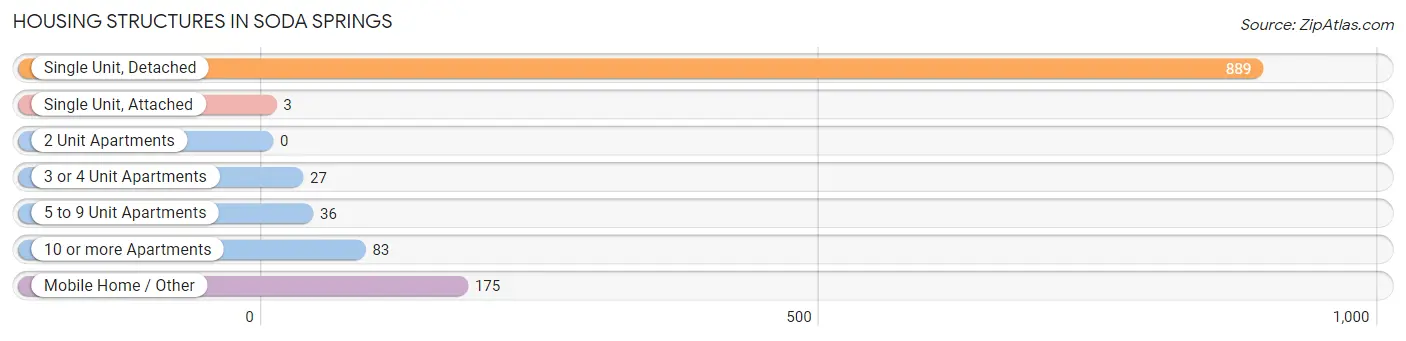
| Structure Type | # Housing Units | % Housing Units |
| Single Unit, Detached | 889 | 73.3% |
| Single Unit, Attached | 3 | 0.3% |
| 2 Unit Apartments | 0 | 0.0% |
| 3 or 4 Unit Apartments | 27 | 2.2% |
| 5 to 9 Unit Apartments | 36 | 3.0% |
| 10 or more Apartments | 83 | 6.8% |
| Mobile Home / Other | 175 | 14.4% |
| Total | 1,213 | 100.0% |
Housing Structures by Occupancy in Soda Springs
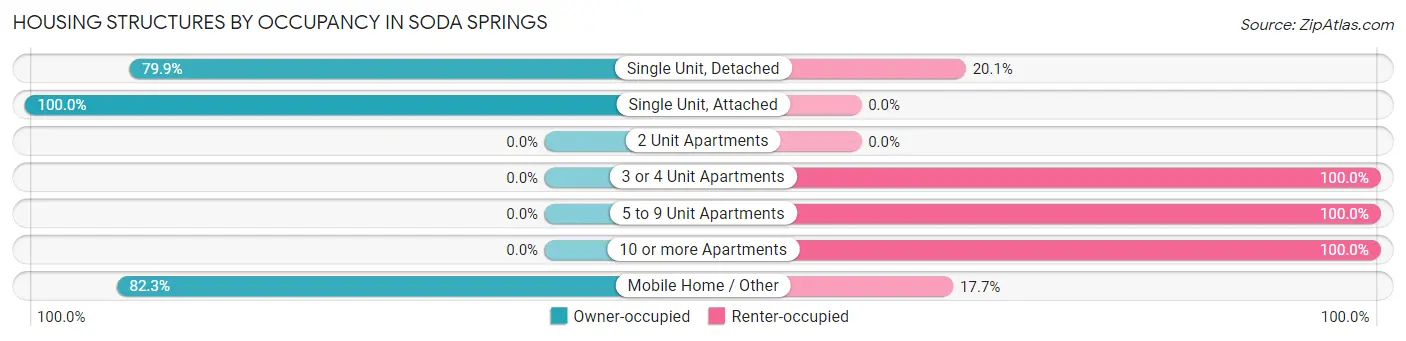
| Structure Type | Owner-occupied | Renter-occupied |
| Single Unit, Detached | 710 (79.9%) | 179 (20.1%) |
| Single Unit, Attached | 3 (100.0%) | 0 (0.0%) |
| 2 Unit Apartments | 0 (0.0%) | 0 (0.0%) |
| 3 or 4 Unit Apartments | 0 (0.0%) | 27 (100.0%) |
| 5 to 9 Unit Apartments | 0 (0.0%) | 36 (100.0%) |
| 10 or more Apartments | 0 (0.0%) | 83 (100.0%) |
| Mobile Home / Other | 144 (82.3%) | 31 (17.7%) |
| Total | 857 (70.7%) | 356 (29.3%) |
Housing Structures by Number of Rooms in Soda Springs
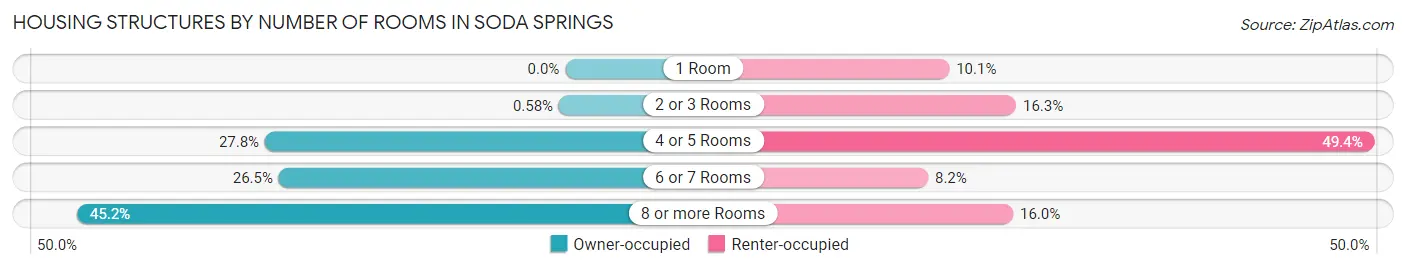
| Number of Rooms | Owner-occupied | Renter-occupied |
| 1 Room | 0 (0.0%) | 36 (10.1%) |
| 2 or 3 Rooms | 5 (0.6%) | 58 (16.3%) |
| 4 or 5 Rooms | 238 (27.8%) | 176 (49.4%) |
| 6 or 7 Rooms | 227 (26.5%) | 29 (8.2%) |
| 8 or more Rooms | 387 (45.2%) | 57 (16.0%) |
| Total | 857 (100.0%) | 356 (100.0%) |
Housing Structure by Heating Type in Soda Springs
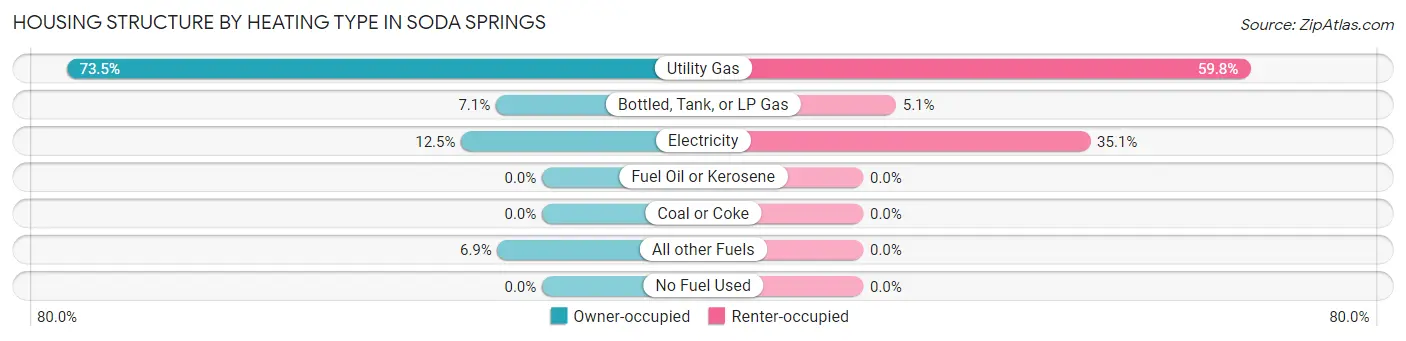
| Heating Type | Owner-occupied | Renter-occupied |
| Utility Gas | 630 (73.5%) | 213 (59.8%) |
| Bottled, Tank, or LP Gas | 61 (7.1%) | 18 (5.1%) |
| Electricity | 107 (12.5%) | 125 (35.1%) |
| Fuel Oil or Kerosene | 0 (0.0%) | 0 (0.0%) |
| Coal or Coke | 0 (0.0%) | 0 (0.0%) |
| All other Fuels | 59 (6.9%) | 0 (0.0%) |
| No Fuel Used | 0 (0.0%) | 0 (0.0%) |
| Total | 857 (100.0%) | 356 (100.0%) |
Household Vehicle Usage in Soda Springs
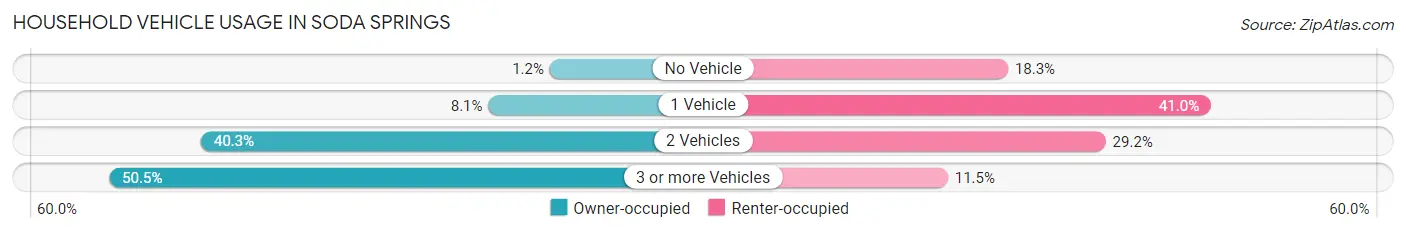
| Vehicles per Household | Owner-occupied | Renter-occupied |
| No Vehicle | 10 (1.2%) | 65 (18.3%) |
| 1 Vehicle | 69 (8.1%) | 146 (41.0%) |
| 2 Vehicles | 345 (40.3%) | 104 (29.2%) |
| 3 or more Vehicles | 433 (50.5%) | 41 (11.5%) |
| Total | 857 (100.0%) | 356 (100.0%) |
Real Estate & Mortgages in Soda Springs
Real Estate and Mortgage Overview in Soda Springs
| Characteristic | Without Mortgage | With Mortgage |
| Housing Units | 414 | 443 |
| Median Property Value | $160,100 | $213,100 |
| Median Household Income | $41,125 | $46 |
| Monthly Housing Costs | $375 | $0 |
| Real Estate Taxes | $1,390 | $0 |
Property Value by Mortgage Status in Soda Springs
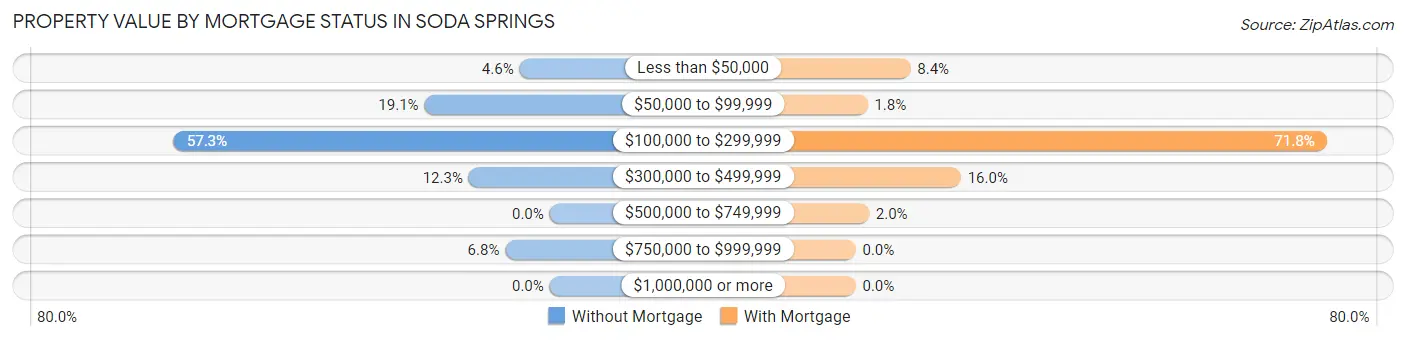
| Property Value | Without Mortgage | With Mortgage |
| Less than $50,000 | 19 (4.6%) | 37 (8.4%) |
| $50,000 to $99,999 | 79 (19.1%) | 8 (1.8%) |
| $100,000 to $299,999 | 237 (57.3%) | 318 (71.8%) |
| $300,000 to $499,999 | 51 (12.3%) | 71 (16.0%) |
| $500,000 to $749,999 | 0 (0.0%) | 9 (2.0%) |
| $750,000 to $999,999 | 28 (6.8%) | 0 (0.0%) |
| $1,000,000 or more | 0 (0.0%) | 0 (0.0%) |
| Total | 414 (100.0%) | 443 (100.0%) |
Household Income by Mortgage Status in Soda Springs
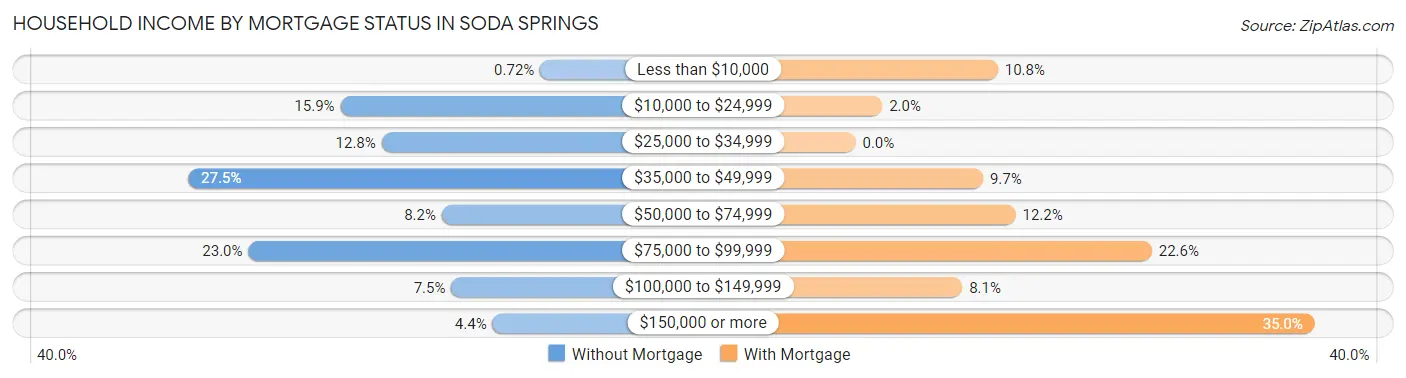
| Household Income | Without Mortgage | With Mortgage |
| Less than $10,000 | 3 (0.7%) | 48 (10.8%) |
| $10,000 to $24,999 | 66 (15.9%) | 9 (2.0%) |
| $25,000 to $34,999 | 53 (12.8%) | 0 (0.0%) |
| $35,000 to $49,999 | 114 (27.5%) | 43 (9.7%) |
| $50,000 to $74,999 | 34 (8.2%) | 54 (12.2%) |
| $75,000 to $99,999 | 95 (23.0%) | 100 (22.6%) |
| $100,000 to $149,999 | 31 (7.5%) | 36 (8.1%) |
| $150,000 or more | 18 (4.3%) | 155 (35.0%) |
| Total | 414 (100.0%) | 443 (100.0%) |
Property Value to Household Income Ratio in Soda Springs
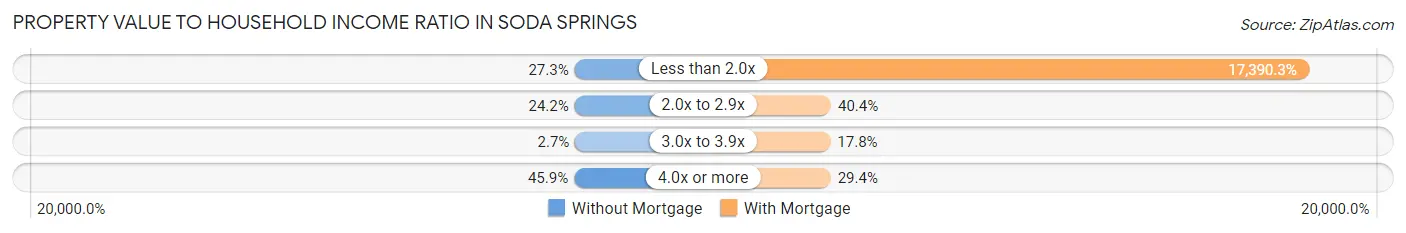
| Value-to-Income Ratio | Without Mortgage | With Mortgage |
| Less than 2.0x | 113 (27.3%) | 77,039 (17,390.3%) |
| 2.0x to 2.9x | 100 (24.1%) | 179 (40.4%) |
| 3.0x to 3.9x | 11 (2.7%) | 79 (17.8%) |
| 4.0x or more | 190 (45.9%) | 130 (29.3%) |
| Total | 414 (100.0%) | 443 (100.0%) |
Real Estate Taxes by Mortgage Status in Soda Springs
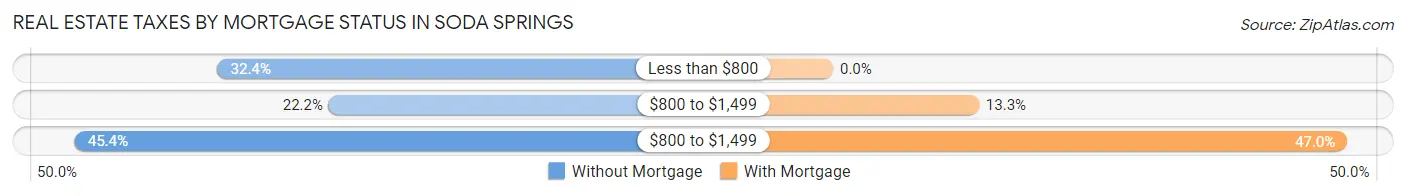
| Property Taxes | Without Mortgage | With Mortgage |
| Less than $800 | 134 (32.4%) | 0 (0.0%) |
| $800 to $1,499 | 92 (22.2%) | 59 (13.3%) |
| $800 to $1,499 | 188 (45.4%) | 208 (46.9%) |
| Total | 414 (100.0%) | 443 (100.0%) |
Health & Disability in Soda Springs
Health Insurance Coverage by Age in Soda Springs
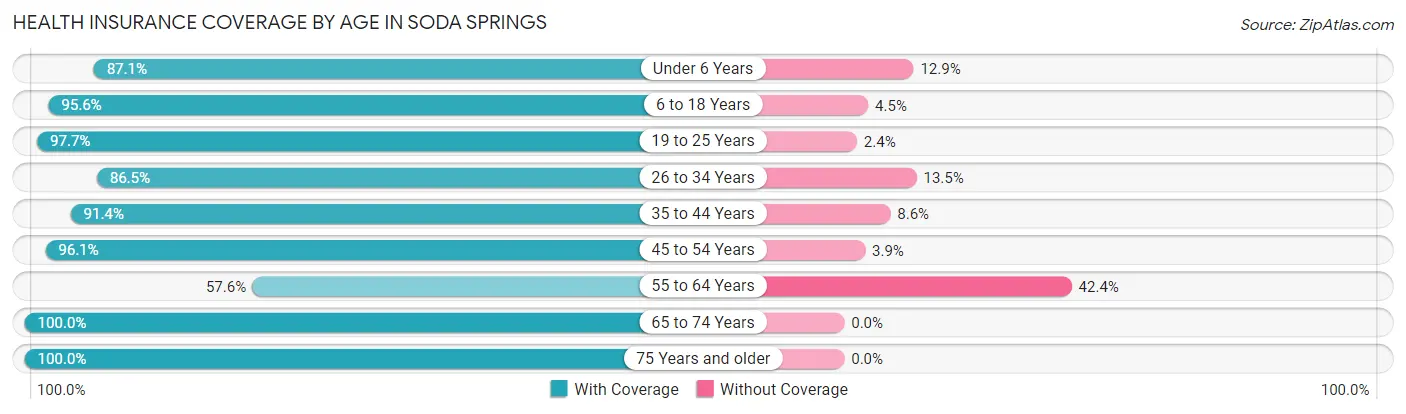
| Age Bracket | With Coverage | Without Coverage |
| Under 6 Years | 216 (87.1%) | 32 (12.9%) |
| 6 to 18 Years | 623 (95.6%) | 29 (4.4%) |
| 19 to 25 Years | 208 (97.7%) | 5 (2.4%) |
| 26 to 34 Years | 289 (86.5%) | 45 (13.5%) |
| 35 to 44 Years | 383 (91.4%) | 36 (8.6%) |
| 45 to 54 Years | 248 (96.1%) | 10 (3.9%) |
| 55 to 64 Years | 250 (57.6%) | 184 (42.4%) |
| 65 to 74 Years | 295 (100.0%) | 0 (0.0%) |
| 75 Years and older | 177 (100.0%) | 0 (0.0%) |
| Total | 2,689 (88.7%) | 341 (11.3%) |
Health Insurance Coverage by Citizenship Status in Soda Springs
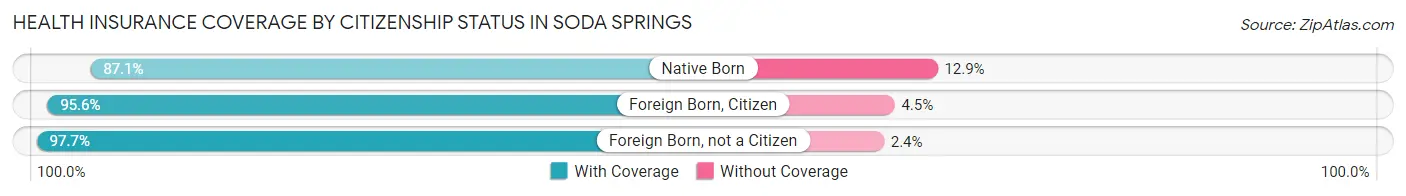
| Citizenship Status | With Coverage | Without Coverage |
| Native Born | 216 (87.1%) | 32 (12.9%) |
| Foreign Born, Citizen | 623 (95.6%) | 29 (4.4%) |
| Foreign Born, not a Citizen | 208 (97.7%) | 5 (2.4%) |
Health Insurance Coverage by Household Income in Soda Springs
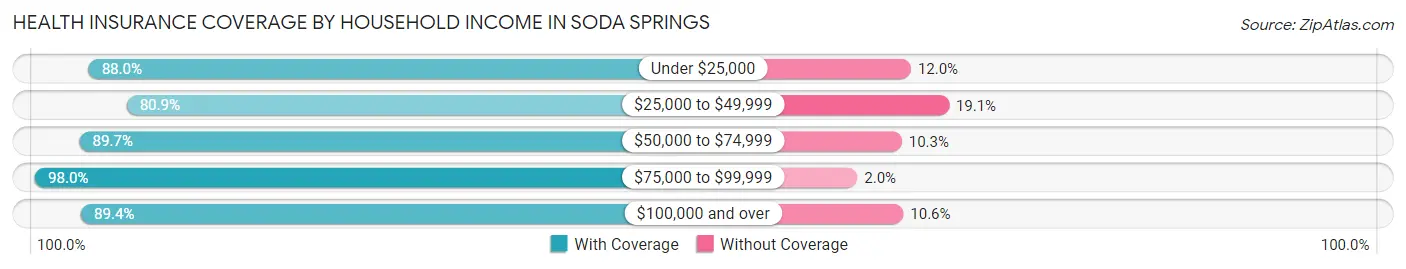
| Household Income | With Coverage | Without Coverage |
| Under $25,000 | 410 (88.0%) | 56 (12.0%) |
| $25,000 to $49,999 | 376 (80.9%) | 89 (19.1%) |
| $50,000 to $74,999 | 566 (89.7%) | 65 (10.3%) |
| $75,000 to $99,999 | 346 (98.0%) | 7 (2.0%) |
| $100,000 and over | 978 (89.4%) | 116 (10.6%) |
Public vs Private Health Insurance Coverage by Age in Soda Springs
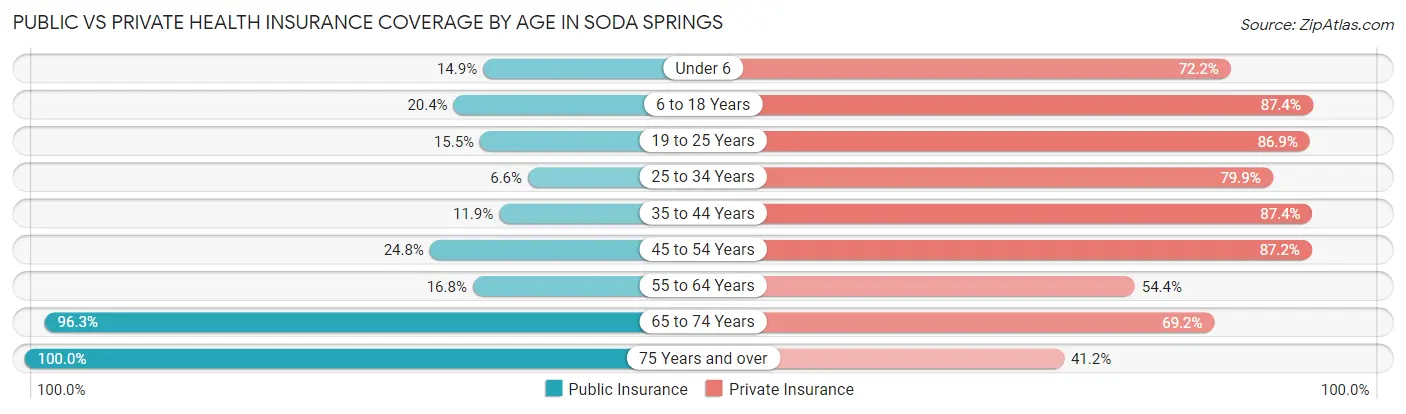
| Age Bracket | Public Insurance | Private Insurance |
| Under 6 | 37 (14.9%) | 179 (72.2%) |
| 6 to 18 Years | 133 (20.4%) | 570 (87.4%) |
| 19 to 25 Years | 33 (15.5%) | 185 (86.9%) |
| 25 to 34 Years | 22 (6.6%) | 267 (79.9%) |
| 35 to 44 Years | 50 (11.9%) | 366 (87.4%) |
| 45 to 54 Years | 64 (24.8%) | 225 (87.2%) |
| 55 to 64 Years | 73 (16.8%) | 236 (54.4%) |
| 65 to 74 Years | 284 (96.3%) | 204 (69.2%) |
| 75 Years and over | 177 (100.0%) | 73 (41.2%) |
| Total | 873 (28.8%) | 2,305 (76.1%) |
Disability Status by Sex by Age in Soda Springs
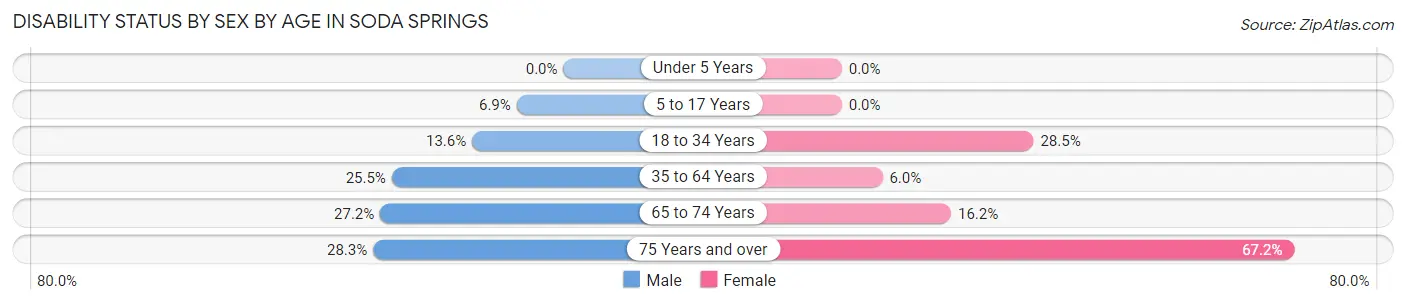
| Age Bracket | Male | Female |
| Under 5 Years | 0 (0.0%) | 0 (0.0%) |
| 5 to 17 Years | 24 (6.9%) | 0 (0.0%) |
| 18 to 34 Years | 43 (13.6%) | 74 (28.5%) |
| 35 to 64 Years | 144 (25.5%) | 33 (6.0%) |
| 65 to 74 Years | 40 (27.2%) | 24 (16.2%) |
| 75 Years and over | 13 (28.3%) | 88 (67.2%) |
Disability Class by Sex by Age in Soda Springs
Disability Class: Hearing Difficulty
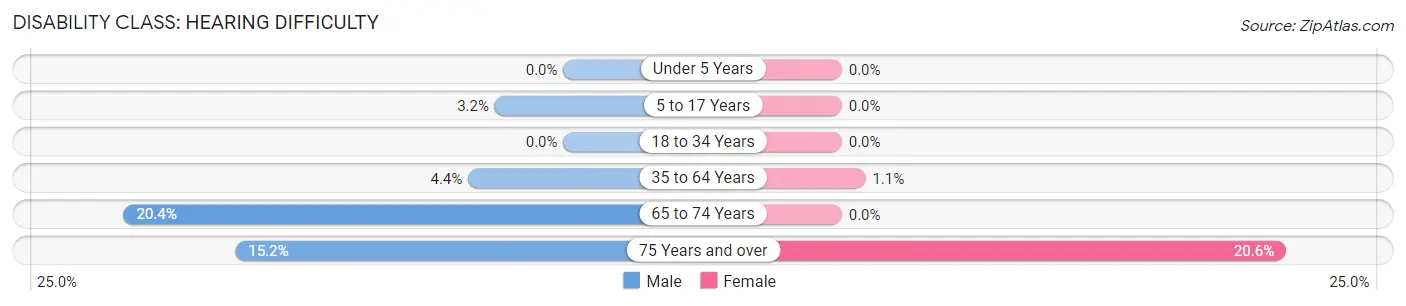
| Age Bracket | Male | Female |
| Under 5 Years | 0 (0.0%) | 0 (0.0%) |
| 5 to 17 Years | 11 (3.2%) | 0 (0.0%) |
| 18 to 34 Years | 0 (0.0%) | 0 (0.0%) |
| 35 to 64 Years | 25 (4.4%) | 6 (1.1%) |
| 65 to 74 Years | 30 (20.4%) | 0 (0.0%) |
| 75 Years and over | 7 (15.2%) | 27 (20.6%) |
Disability Class: Vision Difficulty
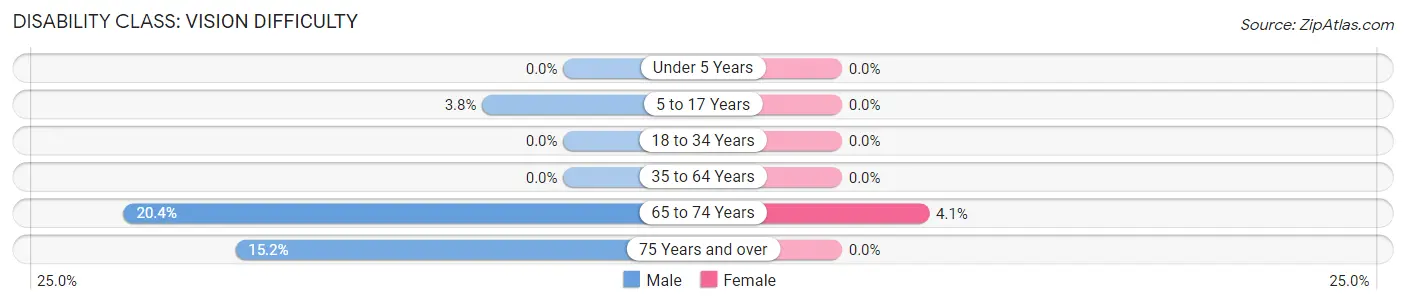
| Age Bracket | Male | Female |
| Under 5 Years | 0 (0.0%) | 0 (0.0%) |
| 5 to 17 Years | 13 (3.8%) | 0 (0.0%) |
| 18 to 34 Years | 0 (0.0%) | 0 (0.0%) |
| 35 to 64 Years | 0 (0.0%) | 0 (0.0%) |
| 65 to 74 Years | 30 (20.4%) | 6 (4.1%) |
| 75 Years and over | 7 (15.2%) | 0 (0.0%) |
Disability Class: Cognitive Difficulty
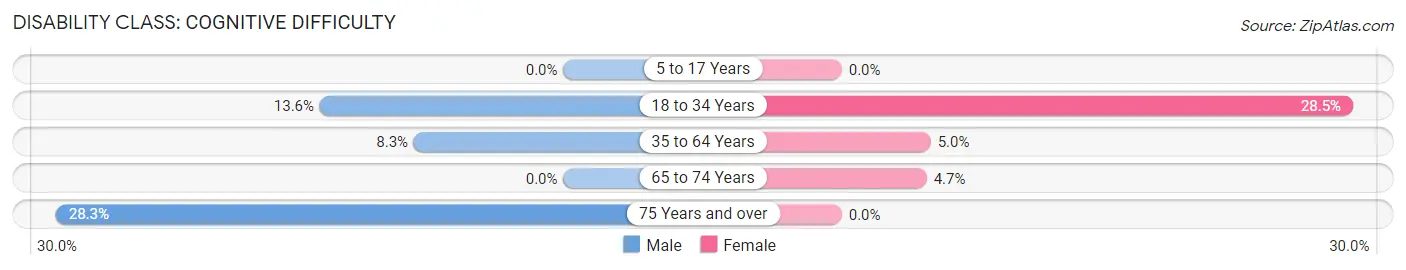
| Age Bracket | Male | Female |
| 5 to 17 Years | 0 (0.0%) | 0 (0.0%) |
| 18 to 34 Years | 43 (13.6%) | 74 (28.5%) |
| 35 to 64 Years | 47 (8.3%) | 27 (5.0%) |
| 65 to 74 Years | 0 (0.0%) | 7 (4.7%) |
| 75 Years and over | 13 (28.3%) | 0 (0.0%) |
Disability Class: Ambulatory Difficulty
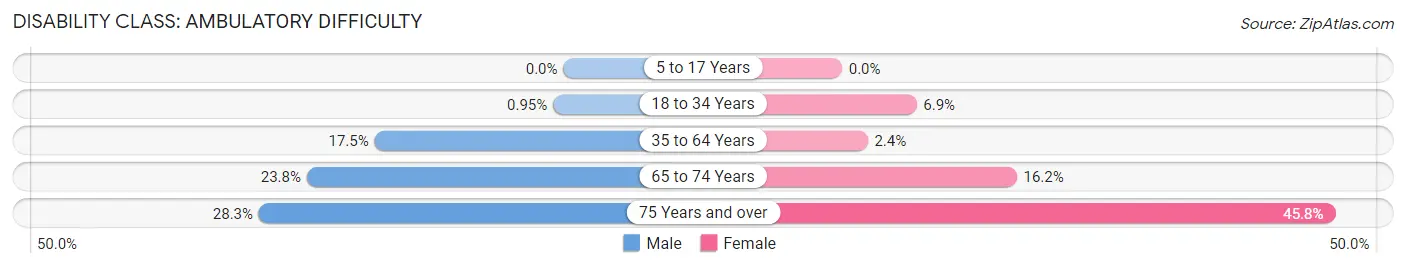
| Age Bracket | Male | Female |
| 5 to 17 Years | 0 (0.0%) | 0 (0.0%) |
| 18 to 34 Years | 3 (0.9%) | 18 (6.9%) |
| 35 to 64 Years | 99 (17.5%) | 13 (2.4%) |
| 65 to 74 Years | 35 (23.8%) | 24 (16.2%) |
| 75 Years and over | 13 (28.3%) | 60 (45.8%) |
Disability Class: Self-Care Difficulty
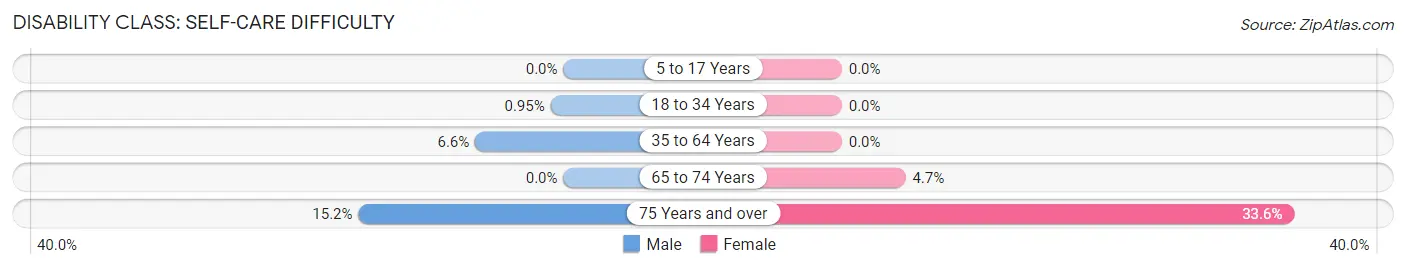
| Age Bracket | Male | Female |
| 5 to 17 Years | 0 (0.0%) | 0 (0.0%) |
| 18 to 34 Years | 3 (0.9%) | 0 (0.0%) |
| 35 to 64 Years | 37 (6.6%) | 0 (0.0%) |
| 65 to 74 Years | 0 (0.0%) | 7 (4.7%) |
| 75 Years and over | 7 (15.2%) | 44 (33.6%) |
Technology Access in Soda Springs
Computing Device Access in Soda Springs
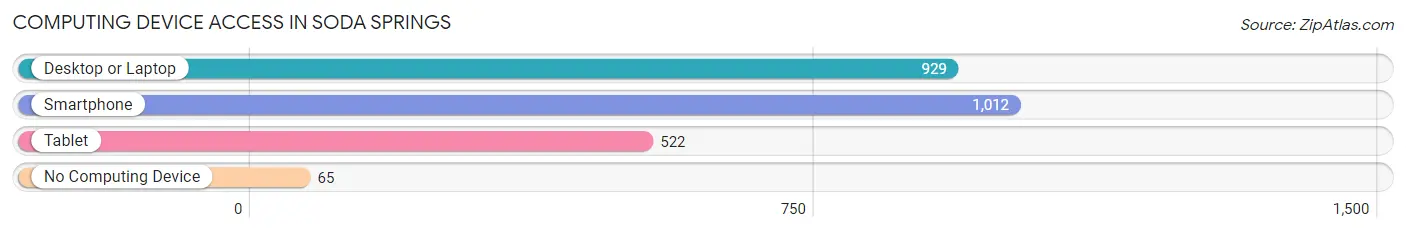
| Device Type | # Households | % Households |
| Desktop or Laptop | 929 | 76.6% |
| Smartphone | 1,012 | 83.4% |
| Tablet | 522 | 43.0% |
| No Computing Device | 65 | 5.4% |
| Total | 1,213 | 100.0% |
Internet Access in Soda Springs
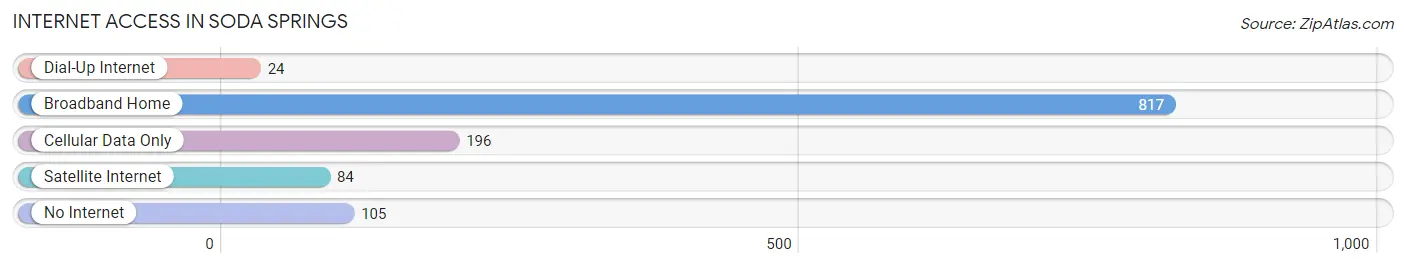
| Internet Type | # Households | % Households |
| Dial-Up Internet | 24 | 2.0% |
| Broadband Home | 817 | 67.3% |
| Cellular Data Only | 196 | 16.2% |
| Satellite Internet | 84 | 6.9% |
| No Internet | 105 | 8.7% |
| Total | 1,213 | 100.0% |
Soda Springs Summary
Soda Springs is a small city located in Caribou County, Idaho, United States. It is the county seat of Caribou County and is located in the southeastern part of the state. The city is situated at the base of the Caribou Mountains, near the headwaters of the Bear River. The population of Soda Springs was 2,719 at the 2010 census.
History
Soda Springs was first settled in 1864 by a group of Mormon pioneers led by William H. Walker. The pioneers were looking for a place to settle and build a fort, and they chose the area around Soda Springs because of its abundance of natural resources. The settlers built a fort and named it Fort Lemhi. The fort was used as a trading post and a place of refuge for travelers.
In 1868, the first post office was established in Soda Springs. The town was officially incorporated in 1883.
In the late 1800s, Soda Springs became a popular tourist destination due to its natural hot springs. The hot springs were believed to have healing properties, and people from all over the country came to take advantage of them. The town also became known for its soda water, which was bottled and sold in stores throughout the region.
In the early 1900s, the town began to grow and develop. The railroad arrived in 1906, and the town was connected to the rest of the country. The railroad also brought new businesses and industries to the area, including a sugar beet factory and a woolen mill.
Geography
Soda Springs is located in southeastern Idaho, at the base of the Caribou Mountains. The city is situated at an elevation of 5,845 feet (1,782 m). The city is located at the intersection of Interstate 15 and U.S. Route 30.
The city covers an area of 2.2 square miles (5.7 km2), all of which is land. The city is located in a high desert climate, with hot summers and cold winters. The average annual precipitation is 11.3 inches (286 mm).
Economy
Soda Springs is a small city with a population of just over 2,700 people. The city’s economy is largely based on tourism, agriculture, and manufacturing.
The city is home to several tourist attractions, including the world’s largest captive geyser, the Soda Springs Geyser. The geyser erupts every hour, and is a popular tourist destination. The city is also home to the Caribou County Historical Museum, which houses artifacts from the area’s history.
Agriculture is an important part of the local economy. The area is known for its production of potatoes, sugar beets, and hay. The city is also home to several manufacturing companies, including a wood products plant and a concrete block plant.
Demographics
As of the 2010 census, the population of Soda Springs was 2,719. The racial makeup of the city was 95.2% White, 0.3% African American, 0.7% Native American, 0.3% Asian, 0.1% Pacific Islander, 1.2% from other races, and 2.3% from two or more races. Hispanic or Latino of any race were 3.2% of the population.
The median income for a household in the city was $35,938, and the median income for a family was $41,250. The per capita income for the city was $17,845. About 11.2% of families and 14.2% of the population were below the poverty line, including 19.2% of those under age 18 and 8.2% of those age 65 or over.
Common Questions
What is Per Capita Income in Soda Springs?
Per Capita income in Soda Springs is $26,570.
What is the Median Family Income in Soda Springs?
Median Family Income in Soda Springs is $75,000.
What is the Median Household income in Soda Springs?
Median Household Income in Soda Springs is $44,301.
What is Income or Wage Gap in Soda Springs?
Income or Wage Gap in Soda Springs is 55.0%.
Women in Soda Springs earn 45.0 cents for every dollar earned by a man.
What is Inequality or Gini Index in Soda Springs?
Inequality or Gini Index in Soda Springs is 0.41.
What is the Total Population of Soda Springs?
Total Population of Soda Springs is 3,124.
What is the Total Male Population of Soda Springs?
Total Male Population of Soda Springs is 1,587.
What is the Total Female Population of Soda Springs?
Total Female Population of Soda Springs is 1,537.
What is the Ratio of Males per 100 Females in Soda Springs?
There are 103.25 Males per 100 Females in Soda Springs.
What is the Ratio of Females per 100 Males in Soda Springs?
There are 96.85 Females per 100 Males in Soda Springs.
What is the Median Population Age in Soda Springs?
Median Population Age in Soda Springs is 37.0 Years.
What is the Average Family Size in Soda Springs
Average Family Size in Soda Springs is 3.5 People.
What is the Average Household Size in Soda Springs
Average Household Size in Soda Springs is 2.5 People.
How Large is the Labor Force in Soda Springs?
There are 1,531 People in the Labor Forcein in Soda Springs.
What is the Percentage of People in the Labor Force in Soda Springs?
66.2% of People are in the Labor Force in Soda Springs.
What is the Unemployment Rate in Soda Springs?
Unemployment Rate in Soda Springs is 2.5%.