Salmon, ID Map & Demographics
Salmon Map
Salmon Overview
$30,796
PER CAPITA INCOME
$62,417
AVG FAMILY INCOME
$45,130
AVG HOUSEHOLD INCOME
8.9%
WAGE / INCOME GAP [ % ]
91.1¢/ $1
WAGE / INCOME GAP [ $ ]
0.55
INEQUALITY / GINI INDEX
3,147
TOTAL POPULATION
1,689
MALE POPULATION
1,458
FEMALE POPULATION
115.84
MALES / 100 FEMALES
86.32
FEMALES / 100 MALES
43.3
MEDIAN AGE
3.6
AVG FAMILY SIZE
2.4
AVG HOUSEHOLD SIZE
1,482
LABOR FORCE [ PEOPLE ]
56.4%
PERCENT IN LABOR FORCE
6.2%
UNEMPLOYMENT RATE
Salmon Zip Codes
Salmon Area Codes
Income in Salmon
Income Overview in Salmon
Per Capita Income in Salmon is $30,796, while median incomes of families and households are $62,417 and $45,130 respectively.
| Characteristic | Number | Measure |
| Per Capita Income | 3,147 | $30,796 |
| Median Family Income | 667 | $62,417 |
| Mean Family Income | 667 | $68,232 |
| Median Household Income | 1,263 | $45,130 |
| Mean Household Income | 1,263 | $68,766 |
| Income Deficit | 667 | $0 |
| Wage / Income Gap (%) | 3,147 | 8.93% |
| Wage / Income Gap ($) | 3,147 | 91.07¢ per $1 |
| Gini / Inequality Index | 3,147 | 0.55 |
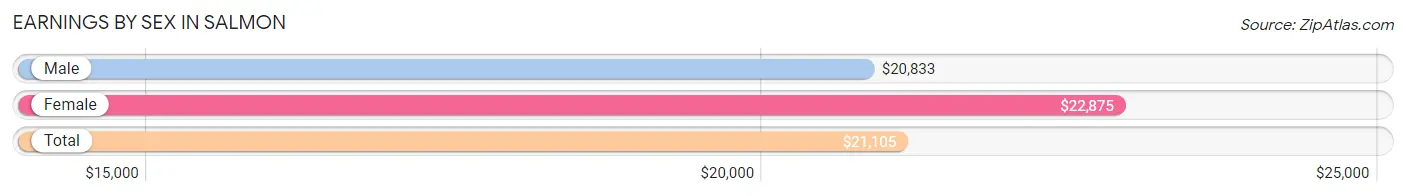
Earnings by Sex in Salmon
Average Earnings in Salmon are $21,105, $20,833 for men and $22,875 for women, a difference of 8.9%.
| Sex | Number | Average Earnings |
| Male | 864 (53.5%) | $20,833 |
| Female | 751 (46.5%) | $22,875 |
| Total | 1,615 (100.0%) | $21,105 |
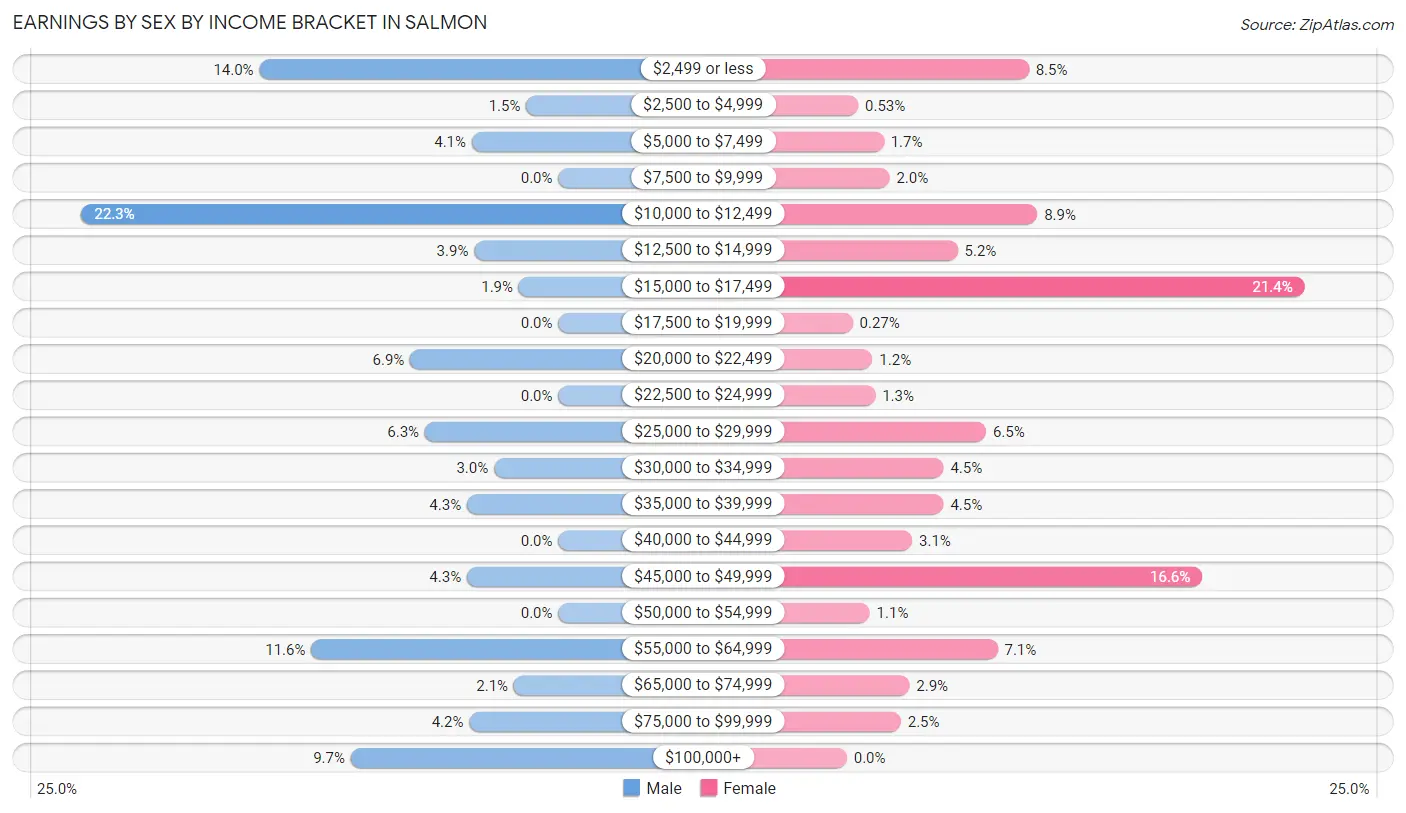
Earnings by Sex by Income Bracket in Salmon
The most common earnings brackets in Salmon are $10,000 to $12,499 for men (193 | 22.3%) and $15,000 to $17,499 for women (161 | 21.4%).
| Income | Male | Female |
| $2,499 or less | 121 (14.0%) | 64 (8.5%) |
| $2,500 to $4,999 | 13 (1.5%) | 4 (0.5%) |
| $5,000 to $7,499 | 35 (4.1%) | 13 (1.7%) |
| $7,500 to $9,999 | 0 (0.0%) | 15 (2.0%) |
| $10,000 to $12,499 | 193 (22.3%) | 67 (8.9%) |
| $12,500 to $14,999 | 34 (3.9%) | 39 (5.2%) |
| $15,000 to $17,499 | 16 (1.8%) | 161 (21.4%) |
| $17,500 to $19,999 | 0 (0.0%) | 2 (0.3%) |
| $20,000 to $22,499 | 60 (6.9%) | 9 (1.2%) |
| $22,500 to $24,999 | 0 (0.0%) | 10 (1.3%) |
| $25,000 to $29,999 | 54 (6.2%) | 49 (6.5%) |
| $30,000 to $34,999 | 26 (3.0%) | 34 (4.5%) |
| $35,000 to $39,999 | 37 (4.3%) | 34 (4.5%) |
| $40,000 to $44,999 | 0 (0.0%) | 23 (3.1%) |
| $45,000 to $49,999 | 37 (4.3%) | 125 (16.6%) |
| $50,000 to $54,999 | 0 (0.0%) | 8 (1.1%) |
| $55,000 to $64,999 | 100 (11.6%) | 53 (7.1%) |
| $65,000 to $74,999 | 18 (2.1%) | 22 (2.9%) |
| $75,000 to $99,999 | 36 (4.2%) | 19 (2.5%) |
| $100,000+ | 84 (9.7%) | 0 (0.0%) |
| Total | 864 (100.0%) | 751 (100.0%) |
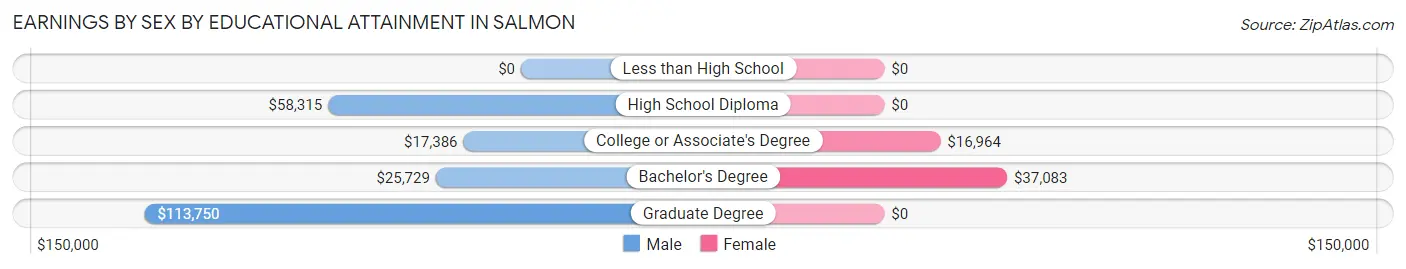
Earnings by Sex by Educational Attainment in Salmon
Average earnings in Salmon are $34,286 for men and $29,245 for women, a difference of 14.7%. Men with an educational attainment of graduate degree enjoy the highest average annual earnings of $113,750, while those with college or associate's degree education earn the least with $17,386. Women with an educational attainment of bachelor's degree earn the most with the average annual earnings of $37,083, while those with college or associate's degree education have the smallest earnings of $16,964.
| Educational Attainment | Male Income | Female Income |
| Less than High School | - | - |
| High School Diploma | $58,315 | $0 |
| College or Associate's Degree | $17,386 | $16,964 |
| Bachelor's Degree | $25,729 | $37,083 |
| Graduate Degree | $113,750 | $0 |
| Total | $34,286 | $29,245 |
Family Income in Salmon
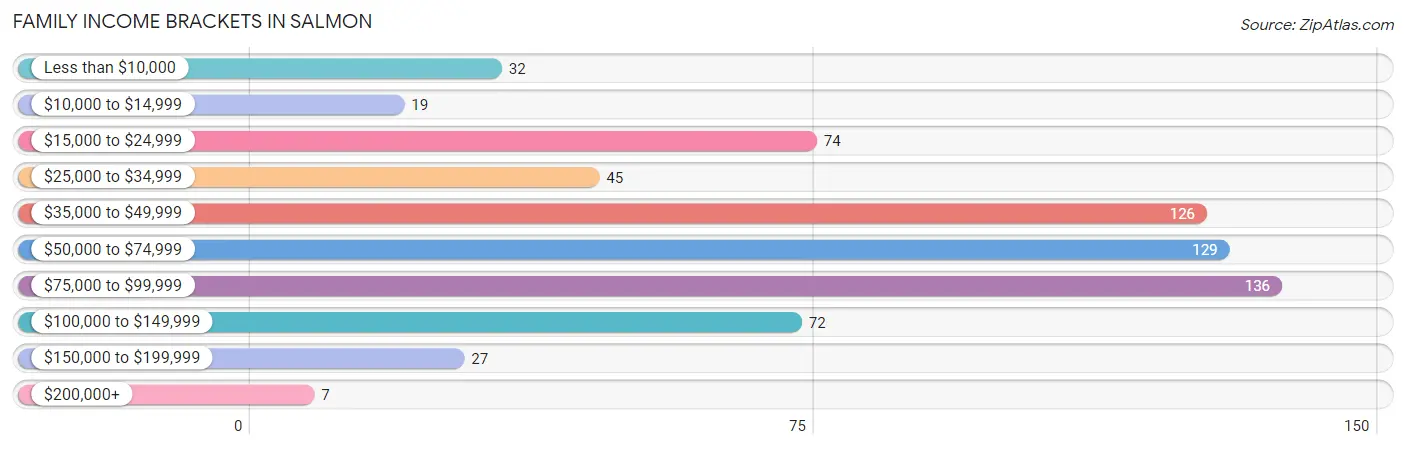
Family Income Brackets in Salmon
According to the Salmon family income data, there are 136 families falling into the $75,000 to $99,999 income range, which is the most common income bracket and makes up 20.4% of all families. Conversely, the $200,000+ income bracket is the least frequent group with only 7 families (1.1%) belonging to this category.
| Income Bracket | # Families | % Families |
| Less than $10,000 | 32 | 4.8% |
| $10,000 to $14,999 | 19 | 2.8% |
| $15,000 to $24,999 | 74 | 11.1% |
| $25,000 to $34,999 | 45 | 6.7% |
| $35,000 to $49,999 | 126 | 18.9% |
| $50,000 to $74,999 | 129 | 19.3% |
| $75,000 to $99,999 | 136 | 20.4% |
| $100,000 to $149,999 | 72 | 10.8% |
| $150,000 to $199,999 | 27 | 4.0% |
| $200,000+ | 7 | 1.0% |
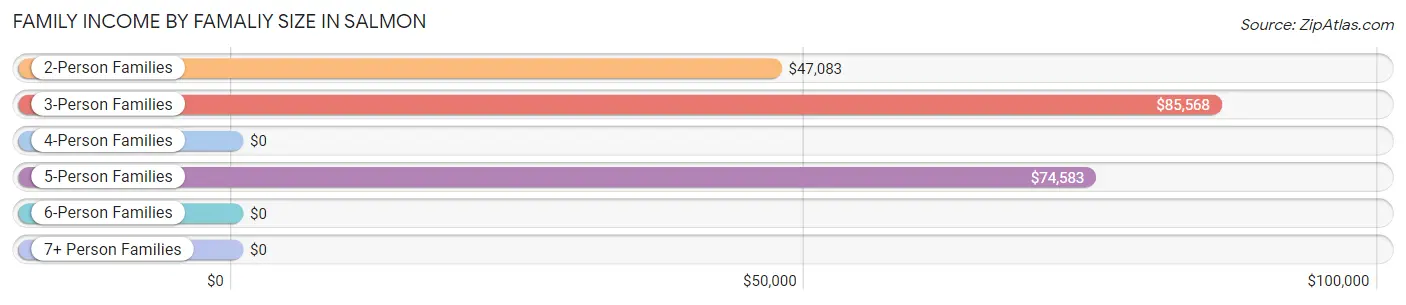
Family Income by Famaliy Size in Salmon
3-person families (70 | 10.5%) account for the highest median family income in Salmon with $85,568 per family, while 3-person families (70 | 10.5%) have the highest median income of $28,523 per family member.
| Income Bracket | # Families | Median Income |
| 2-Person Families | 366 (54.9%) | $47,083 |
| 3-Person Families | 70 (10.5%) | $85,568 |
| 4-Person Families | 89 (13.3%) | $0 |
| 5-Person Families | 123 (18.4%) | $74,583 |
| 6-Person Families | 19 (2.9%) | $0 |
| 7+ Person Families | 0 (0.0%) | $0 |
| Total | 667 (100.0%) | $62,417 |
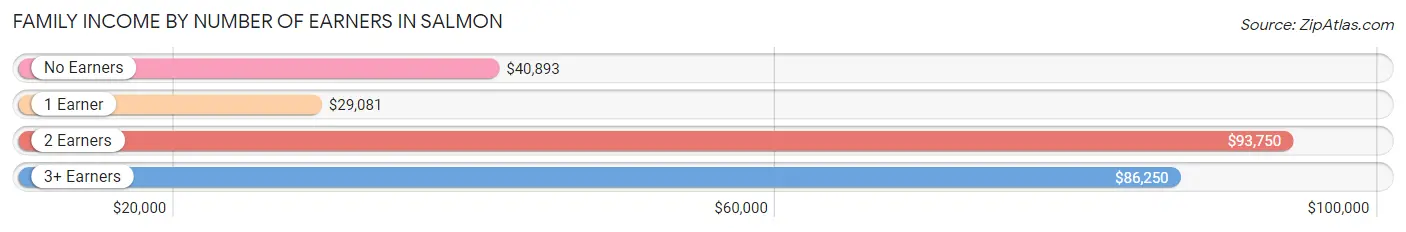
Family Income by Number of Earners in Salmon
The median family income in Salmon is $62,417, with families comprising 2 earners (240) having the highest median family income of $93,750, while families with 1 earner (255) have the lowest median family income of $29,081, accounting for 36.0% and 38.2% of families, respectively.
| Number of Earners | # Families | Median Income |
| No Earners | 82 (12.3%) | $40,893 |
| 1 Earner | 255 (38.2%) | $29,081 |
| 2 Earners | 240 (36.0%) | $93,750 |
| 3+ Earners | 90 (13.5%) | $86,250 |
| Total | 667 (100.0%) | $62,417 |
Household Income in Salmon
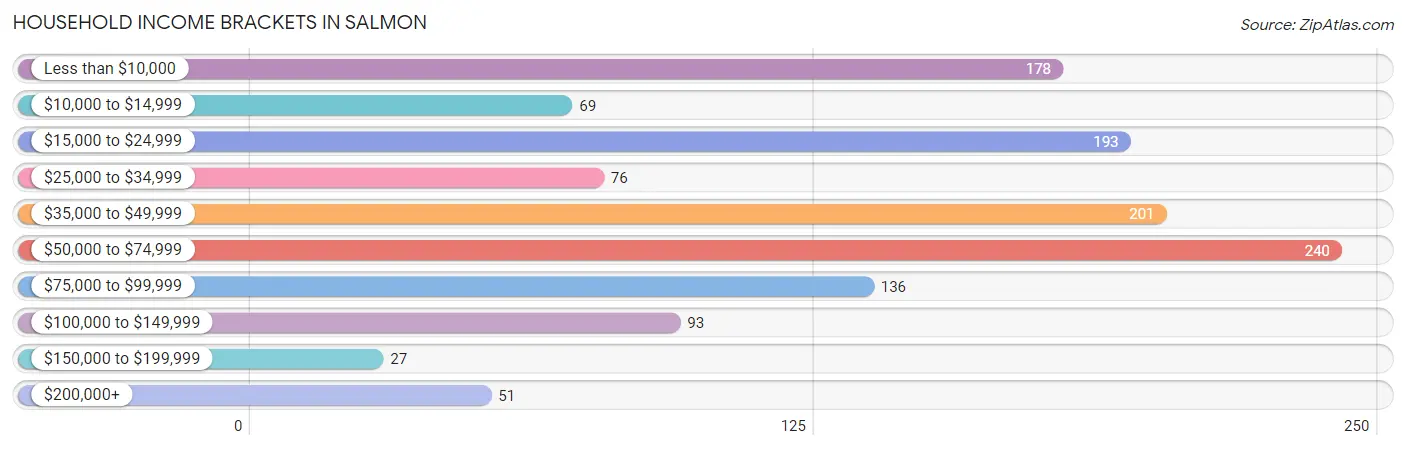
Household Income Brackets in Salmon
With 240 households falling in the category, the $50,000 to $74,999 income range is the most frequent in Salmon, accounting for 19.0% of all households. In contrast, only 27 households (2.1%) fall into the $150,000 to $199,999 income bracket, making it the least populous group.
| Income Bracket | # Households | % Households |
| Less than $10,000 | 178 | 14.1% |
| $10,000 to $14,999 | 69 | 5.5% |
| $15,000 to $24,999 | 193 | 15.3% |
| $25,000 to $34,999 | 76 | 6.0% |
| $35,000 to $49,999 | 201 | 15.9% |
| $50,000 to $74,999 | 240 | 19.0% |
| $75,000 to $99,999 | 136 | 10.8% |
| $100,000 to $149,999 | 93 | 7.4% |
| $150,000 to $199,999 | 27 | 2.1% |
| $200,000+ | 51 | 4.0% |
Household Income by Householder Age in Salmon
The median household income in Salmon is $45,130, with the highest median household income of $60,139 found in the 25 to 44 years age bracket for the primary householder. A total of 365 households (28.9%) fall into this category. Meanwhile, the 15 to 24 years age bracket for the primary householder has the lowest median household income of $0, with 16 households (1.3%) in this group.
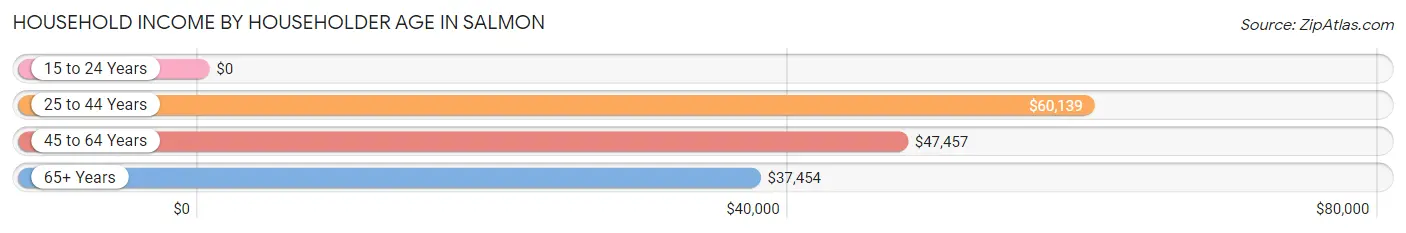
| Income Bracket | # Households | Median Income |
| 15 to 24 Years | 16 (1.3%) | $0 |
| 25 to 44 Years | 365 (28.9%) | $60,139 |
| 45 to 64 Years | 439 (34.8%) | $47,457 |
| 65+ Years | 443 (35.1%) | $37,454 |
| Total | 1,263 (100.0%) | $45,130 |
Poverty in Salmon
Income Below Poverty by Sex and Age in Salmon
With 12.5% poverty level for males and 20.7% for females among the residents of Salmon, 6 to 11 year old males and 55 to 64 year old females are the most vulnerable to poverty, with 58 males (50.0%) and 115 females (48.9%) in their respective age groups living below the poverty level.
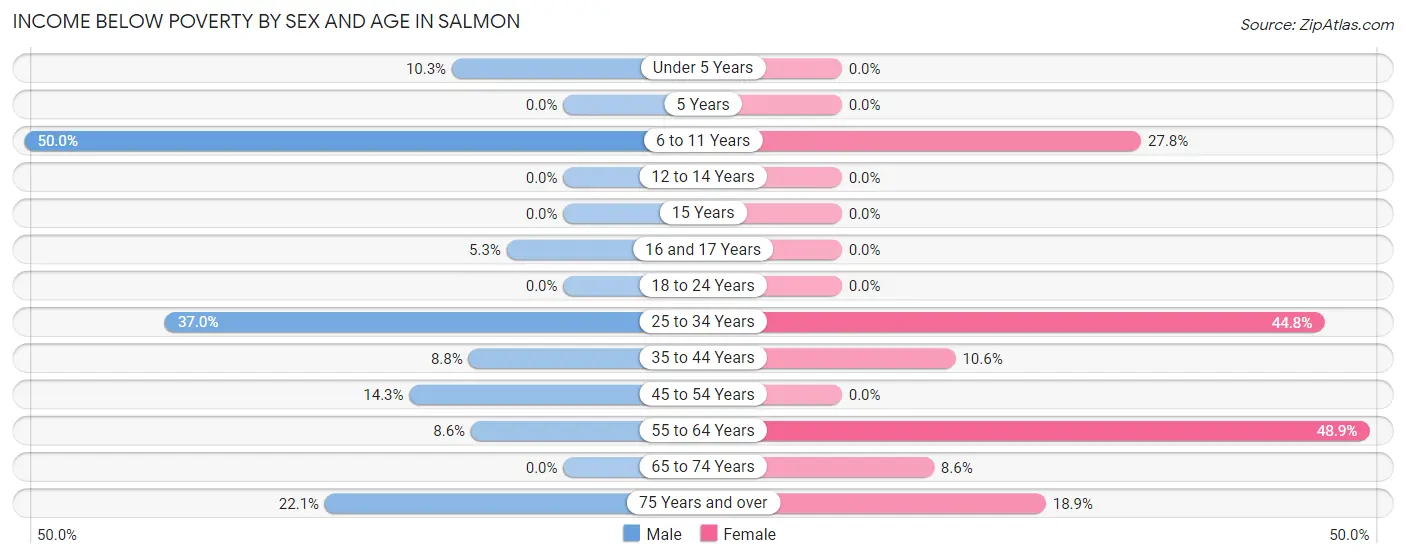
| Age Bracket | Male | Female |
| Under 5 Years | 15 (10.3%) | 0 (0.0%) |
| 5 Years | 0 (0.0%) | 0 (0.0%) |
| 6 to 11 Years | 58 (50.0%) | 15 (27.8%) |
| 12 to 14 Years | 0 (0.0%) | 0 (0.0%) |
| 15 Years | 0 (0.0%) | 0 (0.0%) |
| 16 and 17 Years | 2 (5.3%) | 0 (0.0%) |
| 18 to 24 Years | 0 (0.0%) | 0 (0.0%) |
| 25 to 34 Years | 44 (37.0%) | 81 (44.8%) |
| 35 to 44 Years | 11 (8.8%) | 25 (10.5%) |
| 45 to 54 Years | 27 (14.3%) | 0 (0.0%) |
| 55 to 64 Years | 23 (8.6%) | 115 (48.9%) |
| 65 to 74 Years | 0 (0.0%) | 13 (8.6%) |
| 75 Years and over | 27 (22.1%) | 46 (18.9%) |
| Total | 207 (12.5%) | 295 (20.7%) |
Income Above Poverty by Sex and Age in Salmon
According to the poverty statistics in Salmon, males aged 12 to 14 years and females aged under 5 years are the age groups that are most secure financially, with 100.0% of males and 100.0% of females in these age groups living above the poverty line.
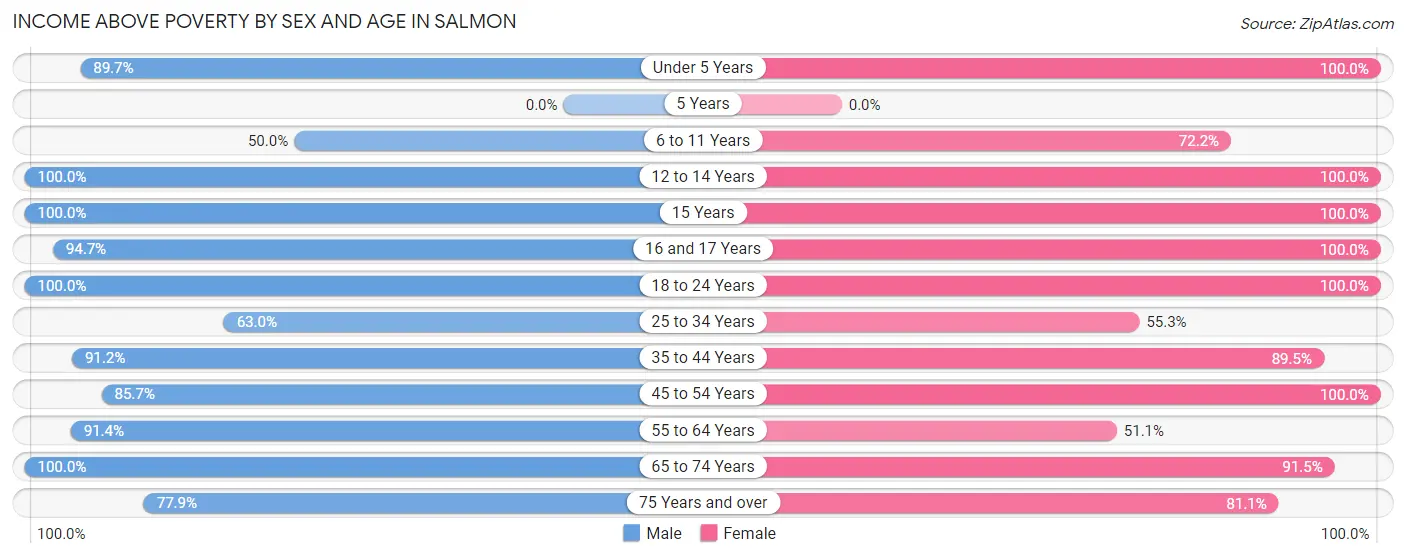
| Age Bracket | Male | Female |
| Under 5 Years | 130 (89.7%) | 39 (100.0%) |
| 5 Years | 0 (0.0%) | 0 (0.0%) |
| 6 to 11 Years | 58 (50.0%) | 39 (72.2%) |
| 12 to 14 Years | 61 (100.0%) | 37 (100.0%) |
| 15 Years | 46 (100.0%) | 22 (100.0%) |
| 16 and 17 Years | 36 (94.7%) | 14 (100.0%) |
| 18 to 24 Years | 283 (100.0%) | 109 (100.0%) |
| 25 to 34 Years | 75 (63.0%) | 100 (55.2%) |
| 35 to 44 Years | 114 (91.2%) | 212 (89.4%) |
| 45 to 54 Years | 162 (85.7%) | 99 (100.0%) |
| 55 to 64 Years | 245 (91.4%) | 120 (51.1%) |
| 65 to 74 Years | 145 (100.0%) | 139 (91.4%) |
| 75 Years and over | 95 (77.9%) | 197 (81.1%) |
| Total | 1,450 (87.5%) | 1,127 (79.2%) |
Income Below Poverty Among Married-Couple Families in Salmon
The poverty statistics for married-couple families in Salmon show that 19.1% or 93 of the total 486 families live below the poverty line. Families with 1 or 2 children have the highest poverty rate of 34.7%, comprising of 49 families. On the other hand, families with no children have the lowest poverty rate of 7.5%, which includes 19 families.
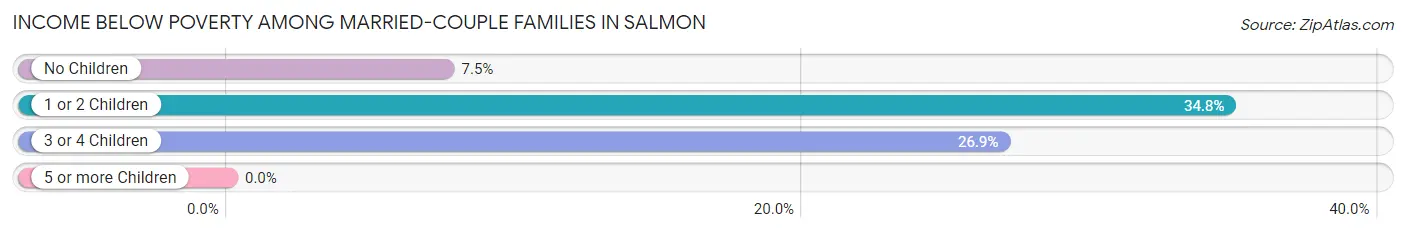
| Children | Above Poverty | Below Poverty |
| No Children | 233 (92.5%) | 19 (7.5%) |
| 1 or 2 Children | 92 (65.2%) | 49 (34.7%) |
| 3 or 4 Children | 68 (73.1%) | 25 (26.9%) |
| 5 or more Children | 0 (0.0%) | 0 (0.0%) |
| Total | 393 (80.9%) | 93 (19.1%) |
Income Below Poverty Among Single-Parent Households in Salmon
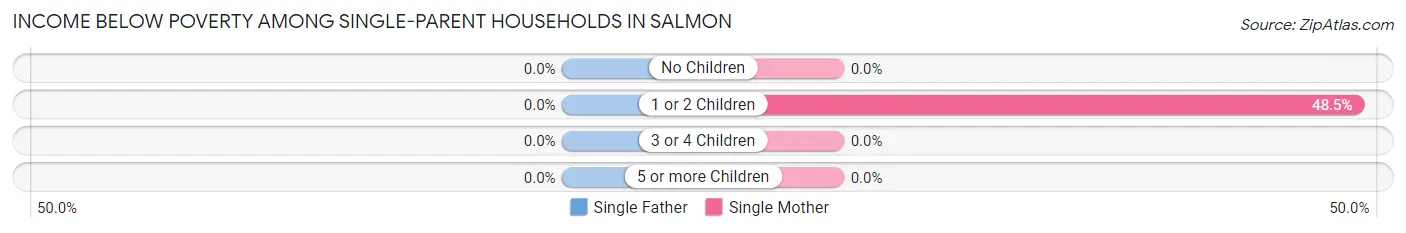
| Children | Single Father | Single Mother |
| No Children | 0 (0.0%) | 0 (0.0%) |
| 1 or 2 Children | 0 (0.0%) | 32 (48.5%) |
| 3 or 4 Children | 0 (0.0%) | 0 (0.0%) |
| 5 or more Children | 0 (0.0%) | 0 (0.0%) |
| Total | 0 (0.0%) | 32 (24.6%) |
Income Below Poverty Among Married-Couple vs Single-Parent Households in Salmon
The poverty data for Salmon shows that 93 of the married-couple family households (19.1%) and 32 of the single-parent households (17.7%) are living below the poverty level. Within the married-couple family households, those with 1 or 2 children have the highest poverty rate, with 49 households (34.7%) falling below the poverty line. Among the single-parent households, those with 1 or 2 children have the highest poverty rate, with 32 household (33.7%) living below poverty.
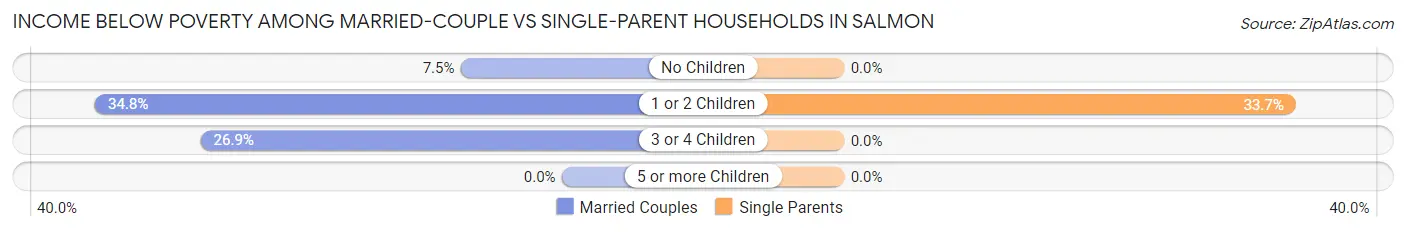
| Children | Married-Couple Families | Single-Parent Households |
| No Children | 19 (7.5%) | 0 (0.0%) |
| 1 or 2 Children | 49 (34.7%) | 32 (33.7%) |
| 3 or 4 Children | 25 (26.9%) | 0 (0.0%) |
| 5 or more Children | 0 (0.0%) | 0 (0.0%) |
| Total | 93 (19.1%) | 32 (17.7%) |
Race in Salmon
The most populous races in Salmon are White / Caucasian (2,863 | 91.0%), Two or more Races (231 | 7.3%), and Hispanic or Latino (136 | 4.3%).
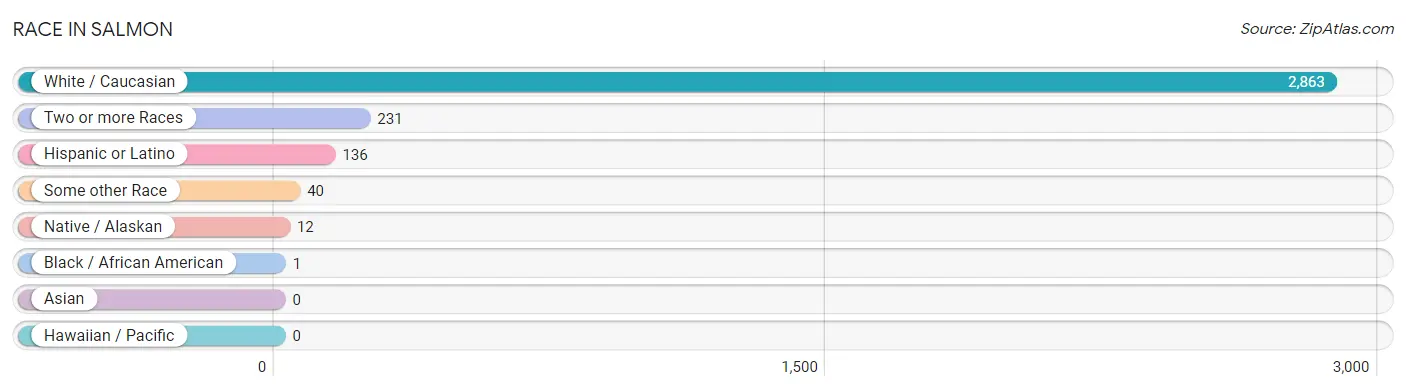
| Race | # Population | % Population |
| Asian | 0 | 0.0% |
| Black / African American | 1 | 0.0% |
| Hawaiian / Pacific | 0 | 0.0% |
| Hispanic or Latino | 136 | 4.3% |
| Native / Alaskan | 12 | 0.4% |
| White / Caucasian | 2,863 | 91.0% |
| Two or more Races | 231 | 7.3% |
| Some other Race | 40 | 1.3% |
| Total | 3,147 | 100.0% |
Ancestry in Salmon
The most populous ancestries reported in Salmon are German (601 | 19.1%), Irish (591 | 18.8%), English (492 | 15.6%), American (121 | 3.8%), and French (111 | 3.5%), together accounting for 60.9% of all Salmon residents.
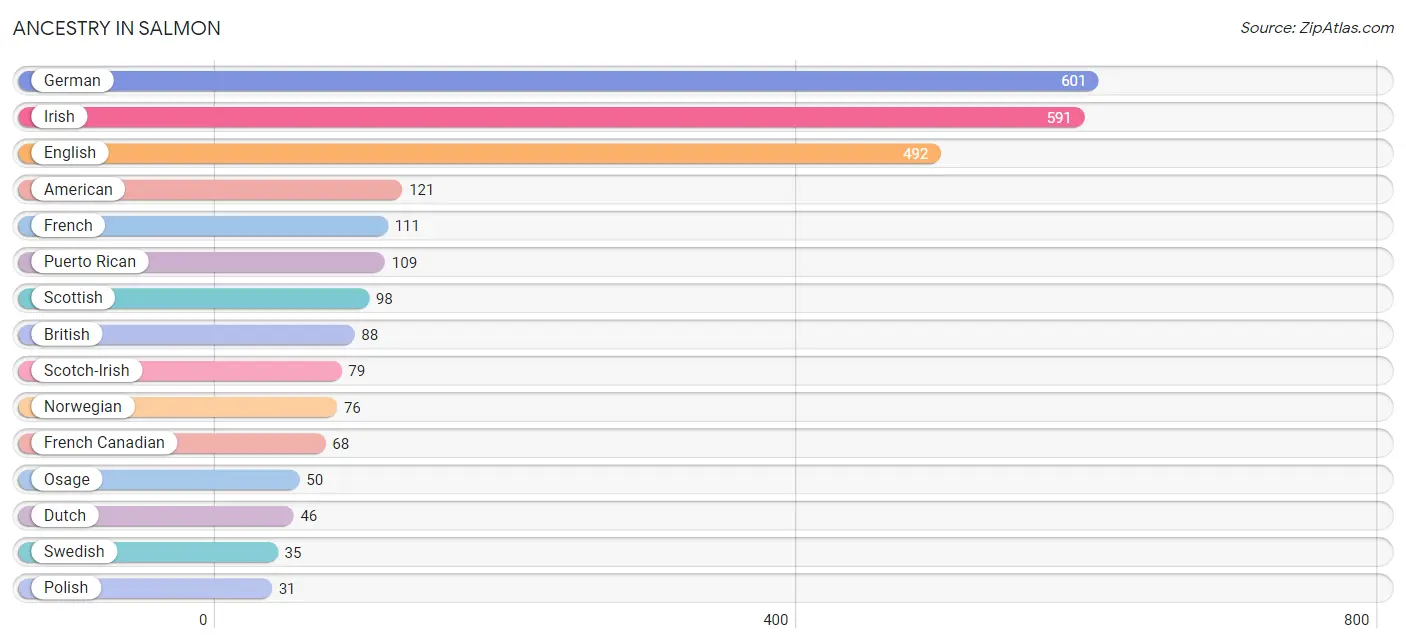
| Ancestry | # Population | % Population |
| American | 121 | 3.8% |
| Bhutanese | 8 | 0.3% |
| Blackfeet | 1 | 0.0% |
| British | 88 | 2.8% |
| Cherokee | 3 | 0.1% |
| Danish | 27 | 0.9% |
| Dutch | 46 | 1.5% |
| Eastern European | 14 | 0.4% |
| English | 492 | 15.6% |
| Finnish | 1 | 0.0% |
| French | 111 | 3.5% |
| French Canadian | 68 | 2.2% |
| German | 601 | 19.1% |
| German Russian | 13 | 0.4% |
| Irish | 591 | 18.8% |
| Italian | 28 | 0.9% |
| Laotian | 2 | 0.1% |
| Lithuanian | 10 | 0.3% |
| Mexican | 27 | 0.9% |
| Navajo | 11 | 0.4% |
| New Zealander | 10 | 0.3% |
| Norwegian | 76 | 2.4% |
| Osage | 50 | 1.6% |
| Polish | 31 | 1.0% |
| Portuguese | 5 | 0.2% |
| Puerto Rican | 109 | 3.5% |
| Scotch-Irish | 79 | 2.5% |
| Scottish | 98 | 3.1% |
| Serbian | 8 | 0.3% |
| Swedish | 35 | 1.1% |
| Swiss | 9 | 0.3% |
| Welsh | 28 | 0.9% |
| Yugoslavian | 8 | 0.3% | View All 33 Rows |
Immigrants in Salmon
The most numerous immigrant groups reported in Salmon came from , and Oceania (10 | 0.3%), together accounting for 0.3% of all Salmon residents.

| Immigration Origin | # Population | % Population |
| Oceania | 10 | 0.3% | View All 1 Rows |
Sex and Age in Salmon
Sex and Age in Salmon
The most populous age groups in Salmon are 60 to 64 Years (213 | 12.6%) for men and 40 to 44 Years (182 | 12.5%) for women.
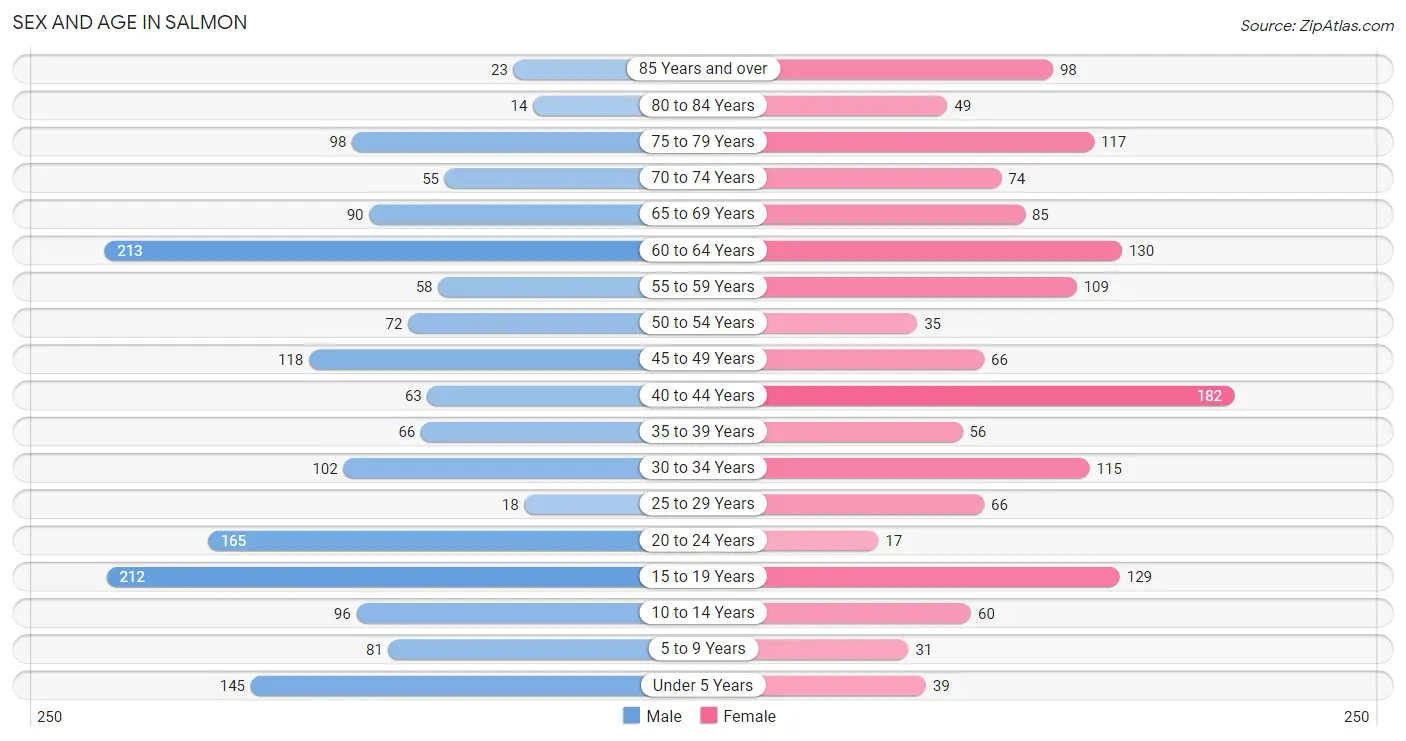
| Age Bracket | Male | Female |
| Under 5 Years | 145 (8.6%) | 39 (2.7%) |
| 5 to 9 Years | 81 (4.8%) | 31 (2.1%) |
| 10 to 14 Years | 96 (5.7%) | 60 (4.1%) |
| 15 to 19 Years | 212 (12.6%) | 129 (8.8%) |
| 20 to 24 Years | 165 (9.8%) | 17 (1.2%) |
| 25 to 29 Years | 18 (1.1%) | 66 (4.5%) |
| 30 to 34 Years | 102 (6.0%) | 115 (7.9%) |
| 35 to 39 Years | 66 (3.9%) | 56 (3.8%) |
| 40 to 44 Years | 63 (3.7%) | 182 (12.5%) |
| 45 to 49 Years | 118 (7.0%) | 66 (4.5%) |
| 50 to 54 Years | 72 (4.3%) | 35 (2.4%) |
| 55 to 59 Years | 58 (3.4%) | 109 (7.5%) |
| 60 to 64 Years | 213 (12.6%) | 130 (8.9%) |
| 65 to 69 Years | 90 (5.3%) | 85 (5.8%) |
| 70 to 74 Years | 55 (3.3%) | 74 (5.1%) |
| 75 to 79 Years | 98 (5.8%) | 117 (8.0%) |
| 80 to 84 Years | 14 (0.8%) | 49 (3.4%) |
| 85 Years and over | 23 (1.4%) | 98 (6.7%) |
| Total | 1,689 (100.0%) | 1,458 (100.0%) |
Families and Households in Salmon
Median Family Size in Salmon
The median family size in Salmon is 3.63 persons per family, with single female/mother families (130 | 19.5%) accounting for the largest median family size of 4.07 persons per family. On the other hand, married-couple families (486 | 72.9%) represent the smallest median family size with 3.52 persons per family.
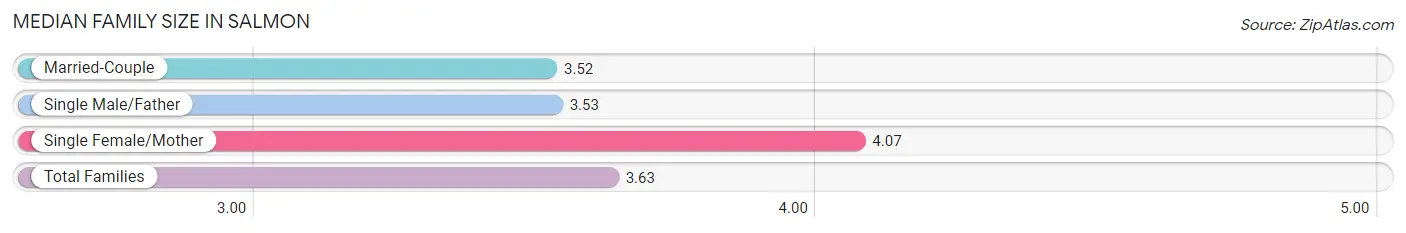
| Family Type | # Families | Family Size |
| Married-Couple | 486 (72.9%) | 3.52 |
| Single Male/Father | 51 (7.6%) | 3.53 |
| Single Female/Mother | 130 (19.5%) | 4.07 |
| Total Families | 667 (100.0%) | 3.63 |
Median Household Size in Salmon
The median household size in Salmon is 2.42 persons per household, with single female/mother households (130 | 10.3%) accounting for the largest median household size of 4.07 persons per household. non-family households (596 | 47.2%) represent the smallest median household size with 1.01 persons per household.
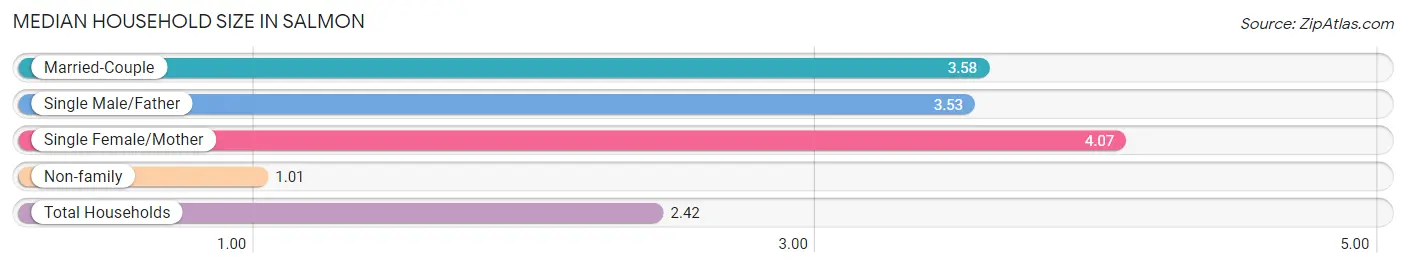
| Household Type | # Households | Household Size |
| Married-Couple | 486 (38.5%) | 3.58 |
| Single Male/Father | 51 (4.0%) | 3.53 |
| Single Female/Mother | 130 (10.3%) | 4.07 |
| Non-family | 596 (47.2%) | 1.01 |
| Total Households | 1,263 (100.0%) | 2.42 |
Household Size by Marriage Status in Salmon
Out of a total of 1,263 households in Salmon, 667 (52.8%) are family households, while 596 (47.2%) are nonfamily households. The most numerous type of family households are 2-person households, comprising 361, and the most common type of nonfamily households are 1-person households, comprising 589.
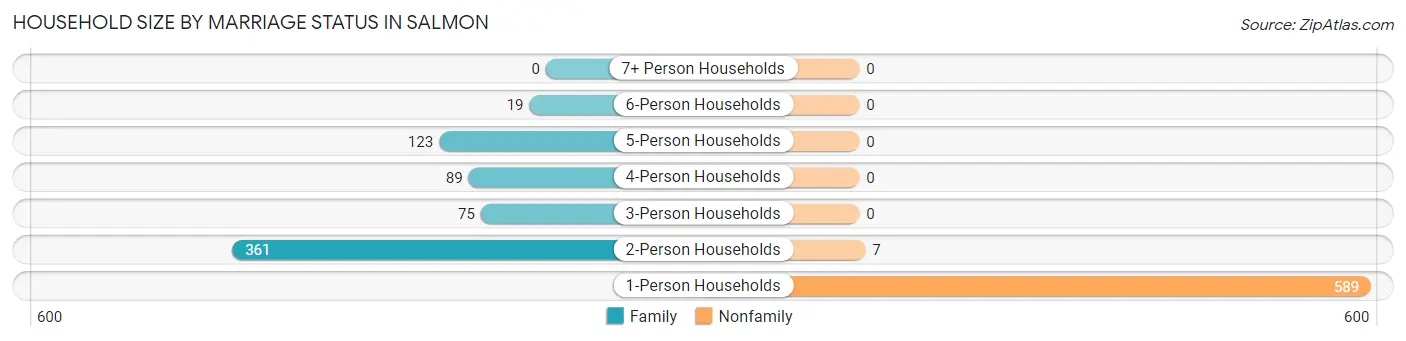
| Household Size | Family Households | Nonfamily Households |
| 1-Person Households | - | 589 (46.6%) |
| 2-Person Households | 361 (28.6%) | 7 (0.5%) |
| 3-Person Households | 75 (5.9%) | 0 (0.0%) |
| 4-Person Households | 89 (7.0%) | 0 (0.0%) |
| 5-Person Households | 123 (9.7%) | 0 (0.0%) |
| 6-Person Households | 19 (1.5%) | 0 (0.0%) |
| 7+ Person Households | 0 (0.0%) | 0 (0.0%) |
| Total | 667 (52.8%) | 596 (47.2%) |
Female Fertility in Salmon
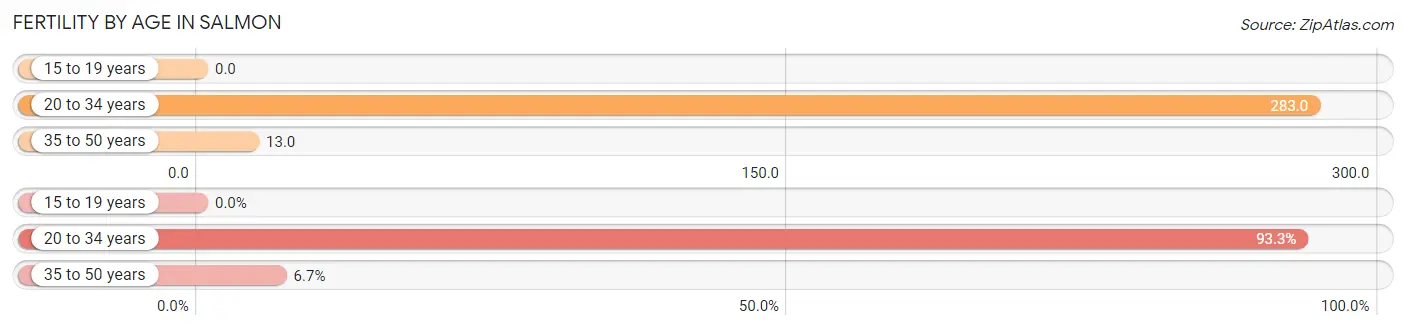
Fertility by Age in Salmon
Average fertility rate in Salmon is 94.0 births per 1,000 women. Women in the age bracket of 20 to 34 years have the highest fertility rate with 283.0 births per 1,000 women. Women in the age bracket of 20 to 34 years acount for 93.3% of all women with births.
| Age Bracket | Women with Births | Births / 1,000 Women |
| 15 to 19 years | 0 (0.0%) | 0.0 |
| 20 to 34 years | 56 (93.3%) | 283.0 |
| 35 to 50 years | 4 (6.7%) | 13.0 |
| Total | 60 (100.0%) | 94.0 |
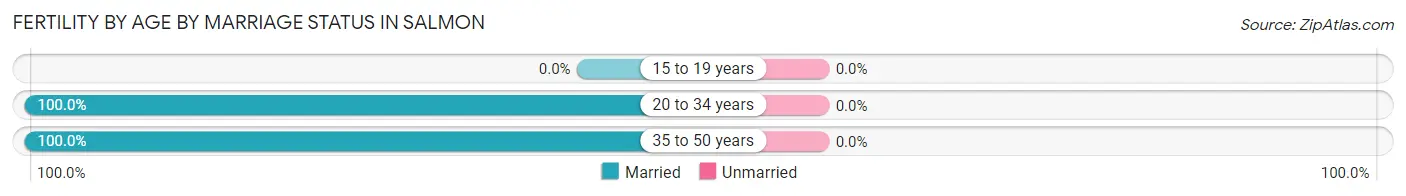
Fertility by Age by Marriage Status in Salmon
| Age Bracket | Married | Unmarried |
| 15 to 19 years | 0 (0.0%) | 0 (0.0%) |
| 20 to 34 years | 56 (100.0%) | 0 (0.0%) |
| 35 to 50 years | 4 (100.0%) | 0 (0.0%) |
| Total | 60 (100.0%) | 0 (0.0%) |
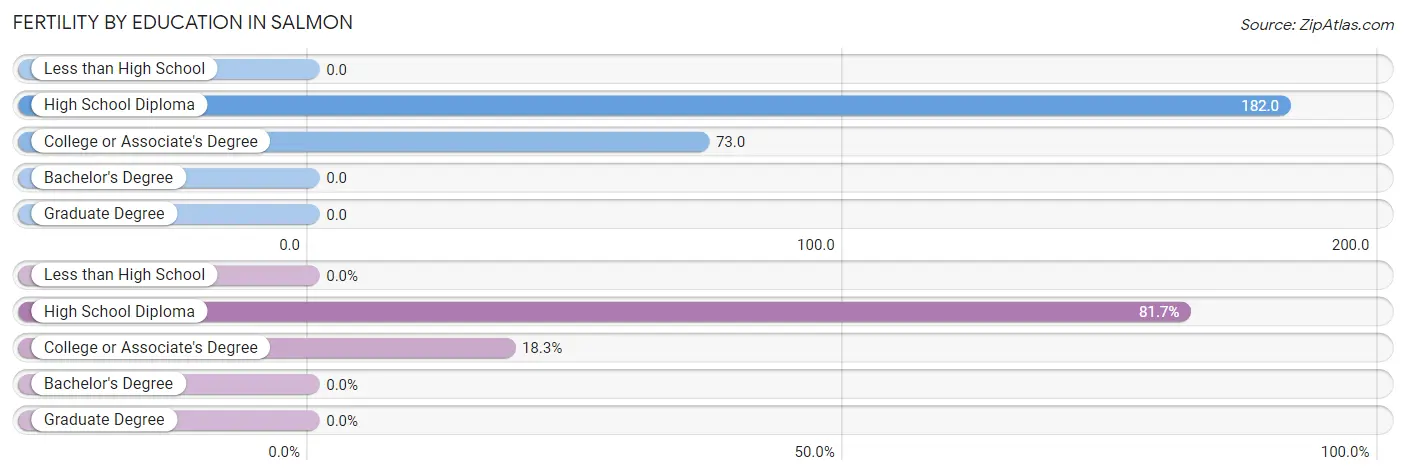
Fertility by Education in Salmon
| Educational Attainment | Women with Births | Births / 1,000 Women |
| Less than High School | 0 (0.0%) | 0.0 |
| High School Diploma | 49 (81.7%) | 182.0 |
| College or Associate's Degree | 11 (18.3%) | 73.0 |
| Bachelor's Degree | 0 (0.0%) | 0.0 |
| Graduate Degree | 0 (0.0%) | 0.0 |
| Total | 60 (100.0%) | 94.0 |
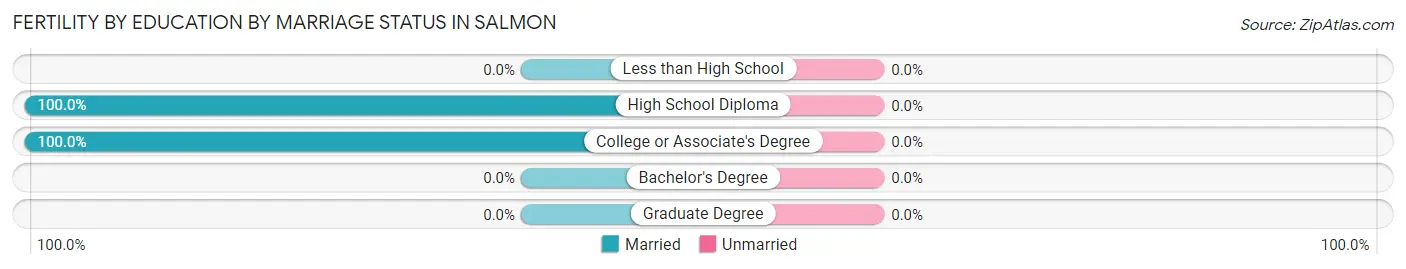
Fertility by Education by Marriage Status in Salmon
| Educational Attainment | Married | Unmarried |
| Less than High School | 0 (0.0%) | 0 (0.0%) |
| High School Diploma | 49 (100.0%) | 0 (0.0%) |
| College or Associate's Degree | 11 (100.0%) | 0 (0.0%) |
| Bachelor's Degree | 0 (0.0%) | 0 (0.0%) |
| Graduate Degree | 0 (0.0%) | 0 (0.0%) |
| Total | 60 (100.0%) | 0 (0.0%) |
Employment Characteristics in Salmon
Employment by Class of Employer in Salmon
Among the 1,229 employed individuals in Salmon, private company employees (842 | 68.5%), not-for-profit organizations (93 | 7.6%), and self-employed (not incorporated) (83 | 6.8%) make up the most common classes of employment.
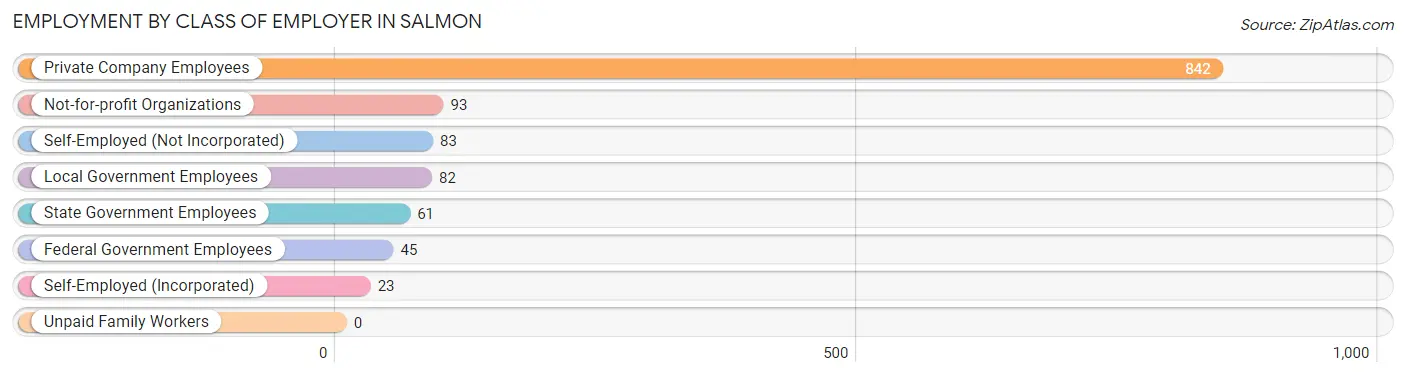
| Employer Class | # Employees | % Employees |
| Private Company Employees | 842 | 68.5% |
| Self-Employed (Incorporated) | 23 | 1.9% |
| Self-Employed (Not Incorporated) | 83 | 6.8% |
| Not-for-profit Organizations | 93 | 7.6% |
| Local Government Employees | 82 | 6.7% |
| State Government Employees | 61 | 5.0% |
| Federal Government Employees | 45 | 3.7% |
| Unpaid Family Workers | 0 | 0.0% |
| Total | 1,229 | 100.0% |
Employment Status by Age in Salmon
According to the labor force statistics for Salmon, out of the total population over 16 years of age (2,627), 56.4% or 1,482 individuals are in the labor force, with 6.2% or 92 of them unemployed. The age group with the highest labor force participation rate is 20 to 24 years, with 87.9% or 160 individuals in the labor force. Within the labor force, the 20 to 24 years age range has the highest percentage of unemployed individuals, with 24.4% or 39 of them being unemployed.
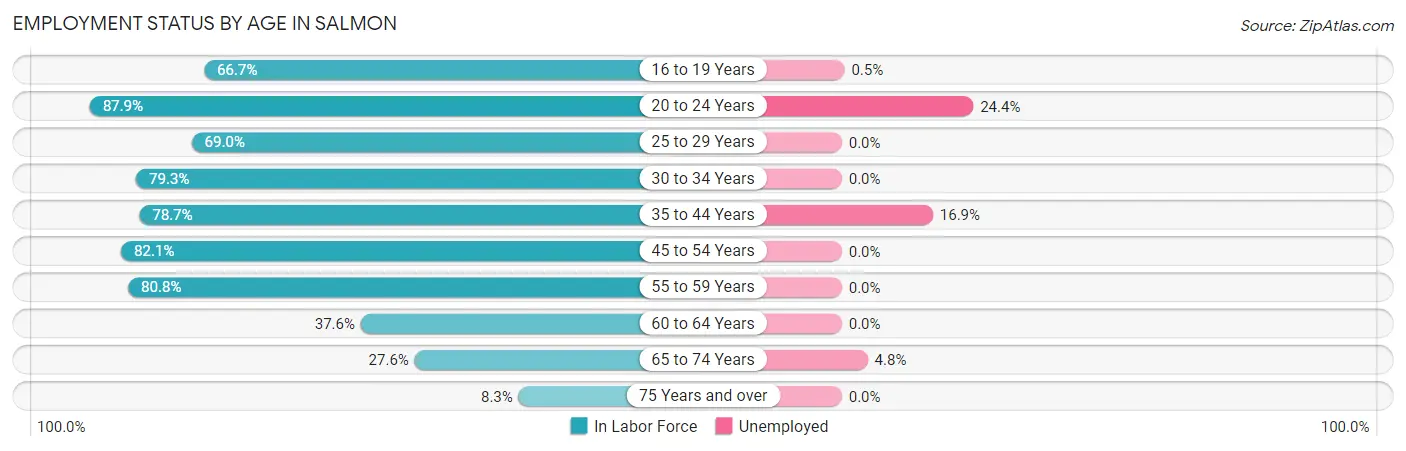
| Age Bracket | In Labor Force | Unemployed |
| 16 to 19 Years | 182 (66.7%) | 1 (0.5%) |
| 20 to 24 Years | 160 (87.9%) | 39 (24.4%) |
| 25 to 29 Years | 58 (69.0%) | 0 (0.0%) |
| 30 to 34 Years | 172 (79.3%) | 0 (0.0%) |
| 35 to 44 Years | 289 (78.7%) | 49 (16.9%) |
| 45 to 54 Years | 239 (82.1%) | 0 (0.0%) |
| 55 to 59 Years | 135 (80.8%) | 0 (0.0%) |
| 60 to 64 Years | 129 (37.6%) | 0 (0.0%) |
| 65 to 74 Years | 84 (27.6%) | 4 (4.8%) |
| 75 Years and over | 33 (8.3%) | 0 (0.0%) |
| Total | 1,482 (56.4%) | 92 (6.2%) |
Employment Status by Educational Attainment in Salmon
According to labor force statistics for Salmon, 69.6% of individuals (1,022) out of the total population between 25 and 64 years of age (1,469) are in the labor force, with 4.6% or 47 of them being unemployed. The group with the highest labor force participation rate are those with the educational attainment of bachelor's degree or higher, with 93.7% or 254 individuals in the labor force. Within the labor force, individuals with bachelor's degree or higher education have the highest percentage of unemployment, with 10.6% or 27 of them being unemployed.
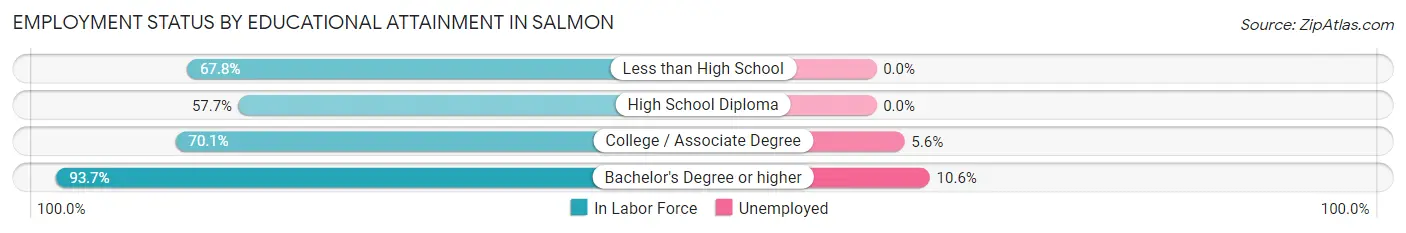
| Educational Attainment | In Labor Force | Unemployed |
| Less than High School | 118 (67.8%) | 0 (0.0%) |
| High School Diploma | 317 (57.7%) | 0 (0.0%) |
| College / Associate Degree | 333 (70.1%) | 27 (5.6%) |
| Bachelor's Degree or higher | 254 (93.7%) | 29 (10.6%) |
| Total | 1,022 (69.6%) | 68 (4.6%) |
Employment Occupations by Sex in Salmon
Management, Business, Science and Arts Occupations
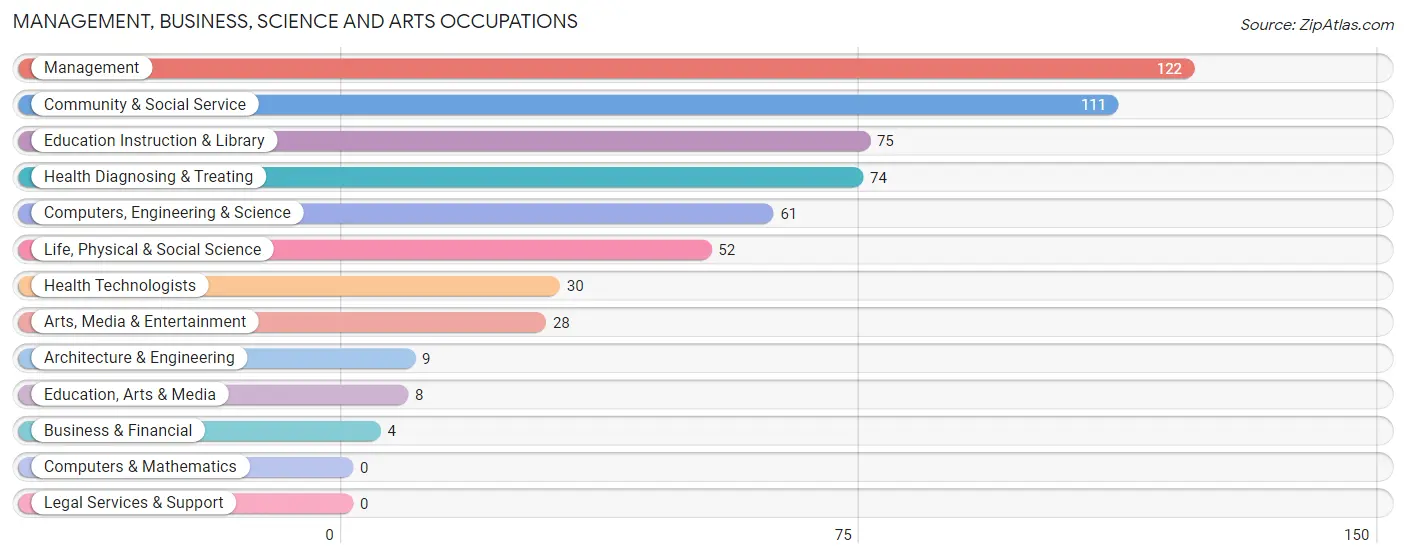
The most common Management, Business, Science and Arts occupations in Salmon are Management (122 | 9.0%), Community & Social Service (111 | 8.2%), Education Instruction & Library (75 | 5.5%), Health Diagnosing & Treating (74 | 5.5%), and Computers, Engineering & Science (61 | 4.5%).
Management, Business, Science and Arts Occupations by Sex
Within the Management, Business, Science and Arts occupations in Salmon, the most male-oriented occupations are Architecture & Engineering (100.0%), Arts, Media & Entertainment (100.0%), and Management (48.4%), while the most female-oriented occupations are Business & Financial (100.0%), Education, Arts & Media (100.0%), and Health Diagnosing & Treating (85.1%).
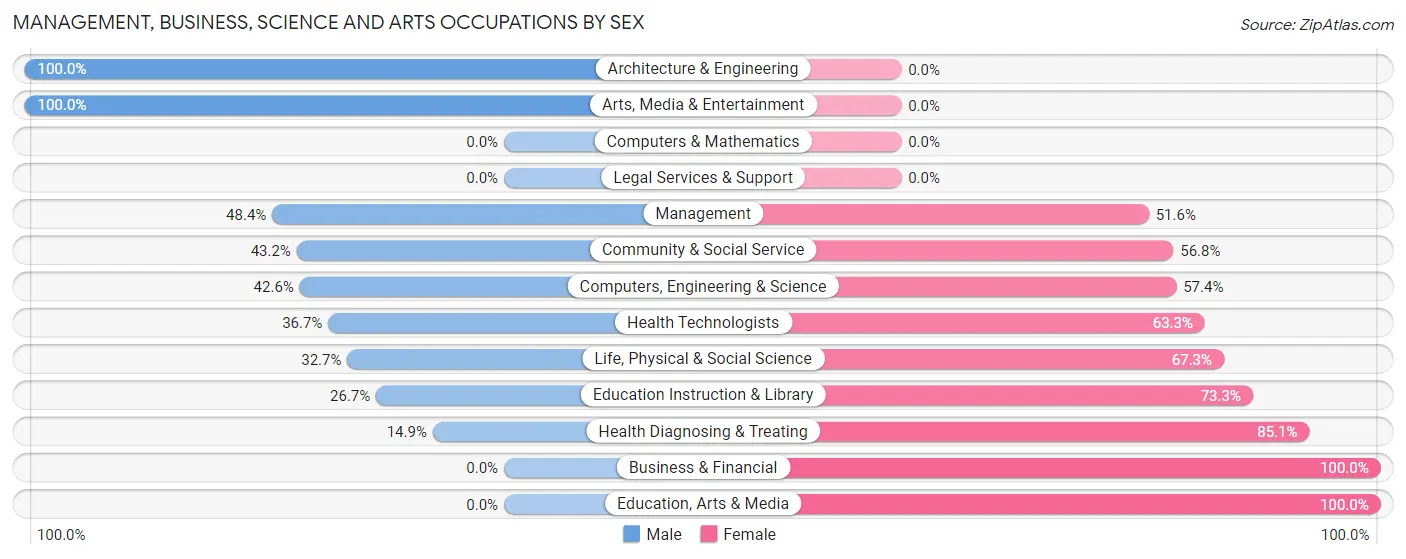
| Occupation | Male | Female |
| Management | 59 (48.4%) | 63 (51.6%) |
| Business & Financial | 0 (0.0%) | 4 (100.0%) |
| Computers, Engineering & Science | 26 (42.6%) | 35 (57.4%) |
| Computers & Mathematics | 0 (0.0%) | 0 (0.0%) |
| Architecture & Engineering | 9 (100.0%) | 0 (0.0%) |
| Life, Physical & Social Science | 17 (32.7%) | 35 (67.3%) |
| Community & Social Service | 48 (43.2%) | 63 (56.8%) |
| Education, Arts & Media | 0 (0.0%) | 8 (100.0%) |
| Legal Services & Support | 0 (0.0%) | 0 (0.0%) |
| Education Instruction & Library | 20 (26.7%) | 55 (73.3%) |
| Arts, Media & Entertainment | 28 (100.0%) | 0 (0.0%) |
| Health Diagnosing & Treating | 11 (14.9%) | 63 (85.1%) |
| Health Technologists | 11 (36.7%) | 19 (63.3%) |
| Total (Category) | 144 (38.7%) | 228 (61.3%) |
| Total (Overall) | 657 (48.4%) | 699 (51.5%) |
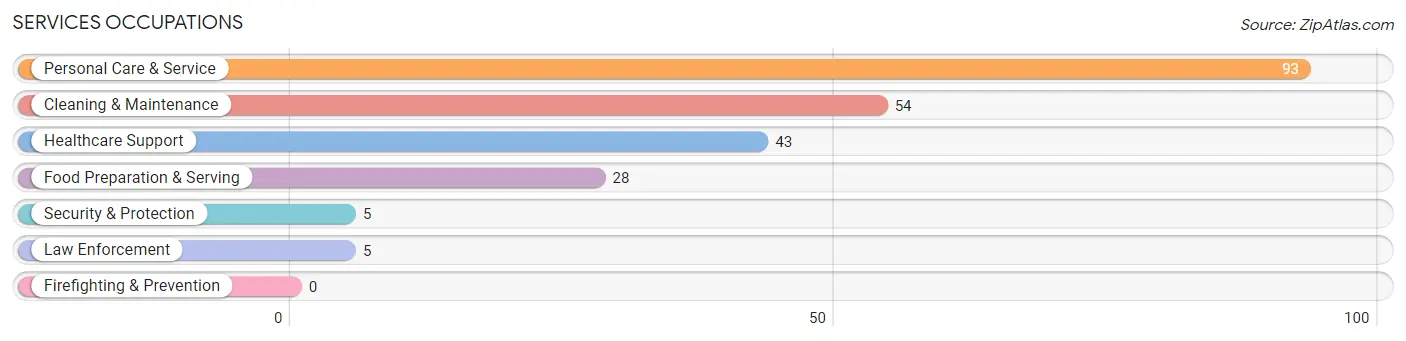
Services Occupations
The most common Services occupations in Salmon are Personal Care & Service (93 | 6.9%), Cleaning & Maintenance (54 | 4.0%), Healthcare Support (43 | 3.2%), Food Preparation & Serving (28 | 2.1%), and Security & Protection (5 | 0.4%).
Services Occupations by Sex
Within the Services occupations in Salmon, the most male-oriented occupations are Security & Protection (100.0%), Law Enforcement (100.0%), and Cleaning & Maintenance (25.9%), while the most female-oriented occupations are Healthcare Support (100.0%), Food Preparation & Serving (100.0%), and Personal Care & Service (100.0%).
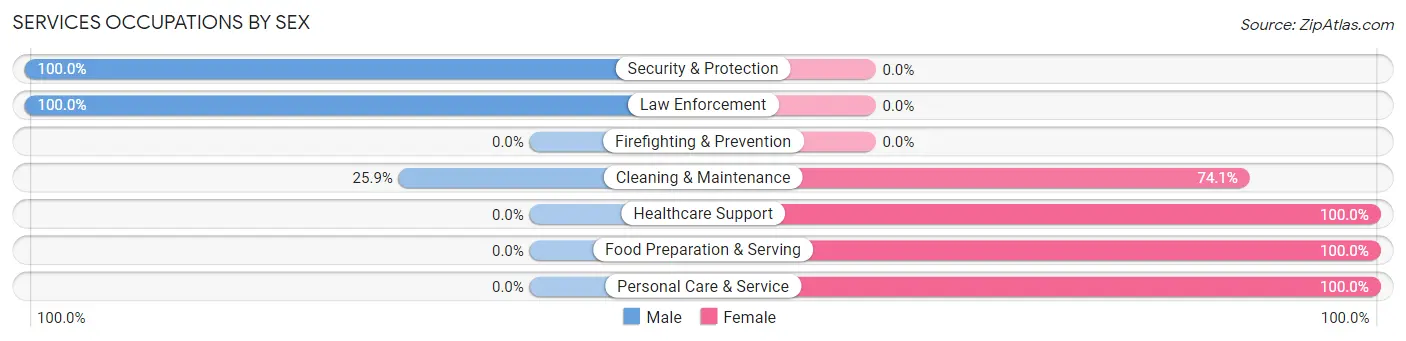
| Occupation | Male | Female |
| Healthcare Support | 0 (0.0%) | 43 (100.0%) |
| Security & Protection | 5 (100.0%) | 0 (0.0%) |
| Firefighting & Prevention | 0 (0.0%) | 0 (0.0%) |
| Law Enforcement | 5 (100.0%) | 0 (0.0%) |
| Food Preparation & Serving | 0 (0.0%) | 28 (100.0%) |
| Cleaning & Maintenance | 14 (25.9%) | 40 (74.1%) |
| Personal Care & Service | 0 (0.0%) | 93 (100.0%) |
| Total (Category) | 19 (8.5%) | 204 (91.5%) |
| Total (Overall) | 657 (48.4%) | 699 (51.5%) |
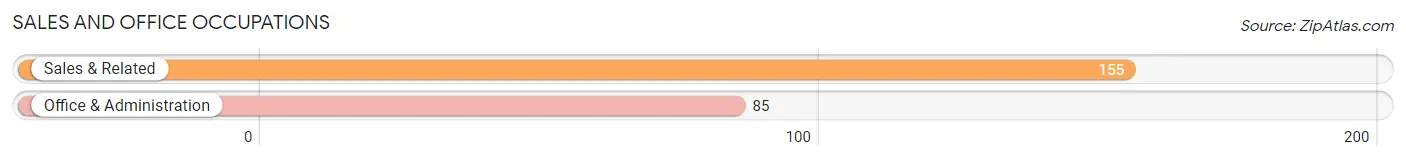
Sales and Office Occupations
The most common Sales and Office occupations in Salmon are Sales & Related (155 | 11.4%), and Office & Administration (85 | 6.3%).
Sales and Office Occupations by Sex
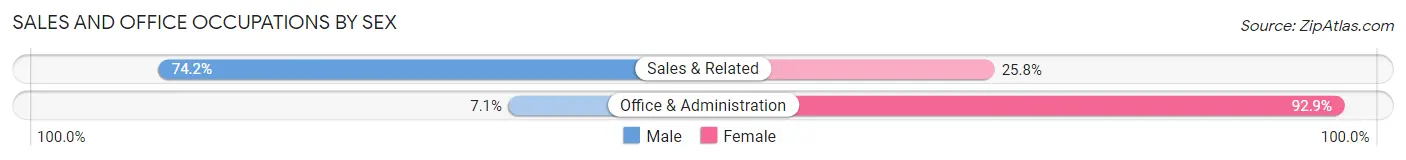
| Occupation | Male | Female |
| Sales & Related | 115 (74.2%) | 40 (25.8%) |
| Office & Administration | 6 (7.1%) | 79 (92.9%) |
| Total (Category) | 121 (50.4%) | 119 (49.6%) |
| Total (Overall) | 657 (48.4%) | 699 (51.5%) |
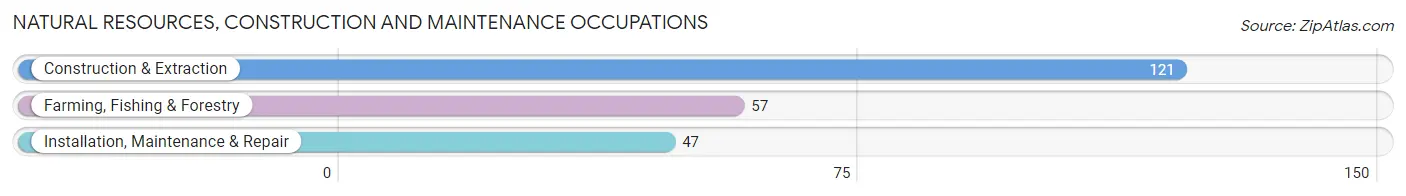
Natural Resources, Construction and Maintenance Occupations
The most common Natural Resources, Construction and Maintenance occupations in Salmon are Construction & Extraction (121 | 8.9%), Farming, Fishing & Forestry (57 | 4.2%), and Installation, Maintenance & Repair (47 | 3.5%).
Natural Resources, Construction and Maintenance Occupations by Sex
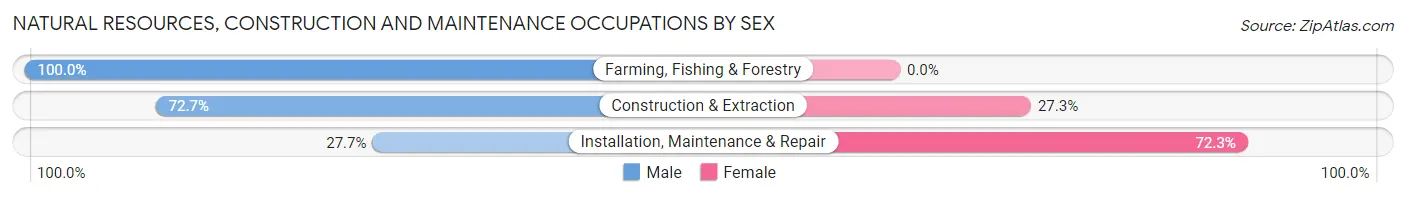
| Occupation | Male | Female |
| Farming, Fishing & Forestry | 57 (100.0%) | 0 (0.0%) |
| Construction & Extraction | 88 (72.7%) | 33 (27.3%) |
| Installation, Maintenance & Repair | 13 (27.7%) | 34 (72.3%) |
| Total (Category) | 158 (70.2%) | 67 (29.8%) |
| Total (Overall) | 657 (48.4%) | 699 (51.5%) |
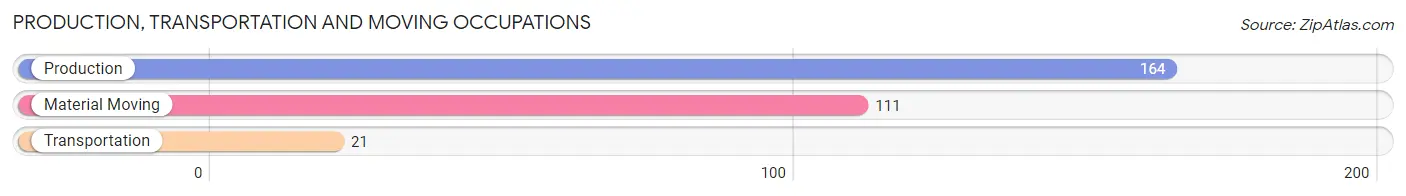
Production, Transportation and Moving Occupations
The most common Production, Transportation and Moving occupations in Salmon are Production (164 | 12.1%), Material Moving (111 | 8.2%), and Transportation (21 | 1.5%).
Production, Transportation and Moving Occupations by Sex
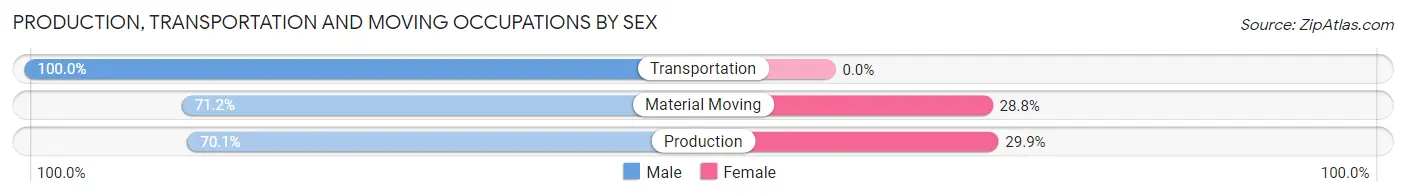
| Occupation | Male | Female |
| Production | 115 (70.1%) | 49 (29.9%) |
| Transportation | 21 (100.0%) | 0 (0.0%) |
| Material Moving | 79 (71.2%) | 32 (28.8%) |
| Total (Category) | 215 (72.6%) | 81 (27.4%) |
| Total (Overall) | 657 (48.4%) | 699 (51.5%) |
Employment Industries by Sex in Salmon
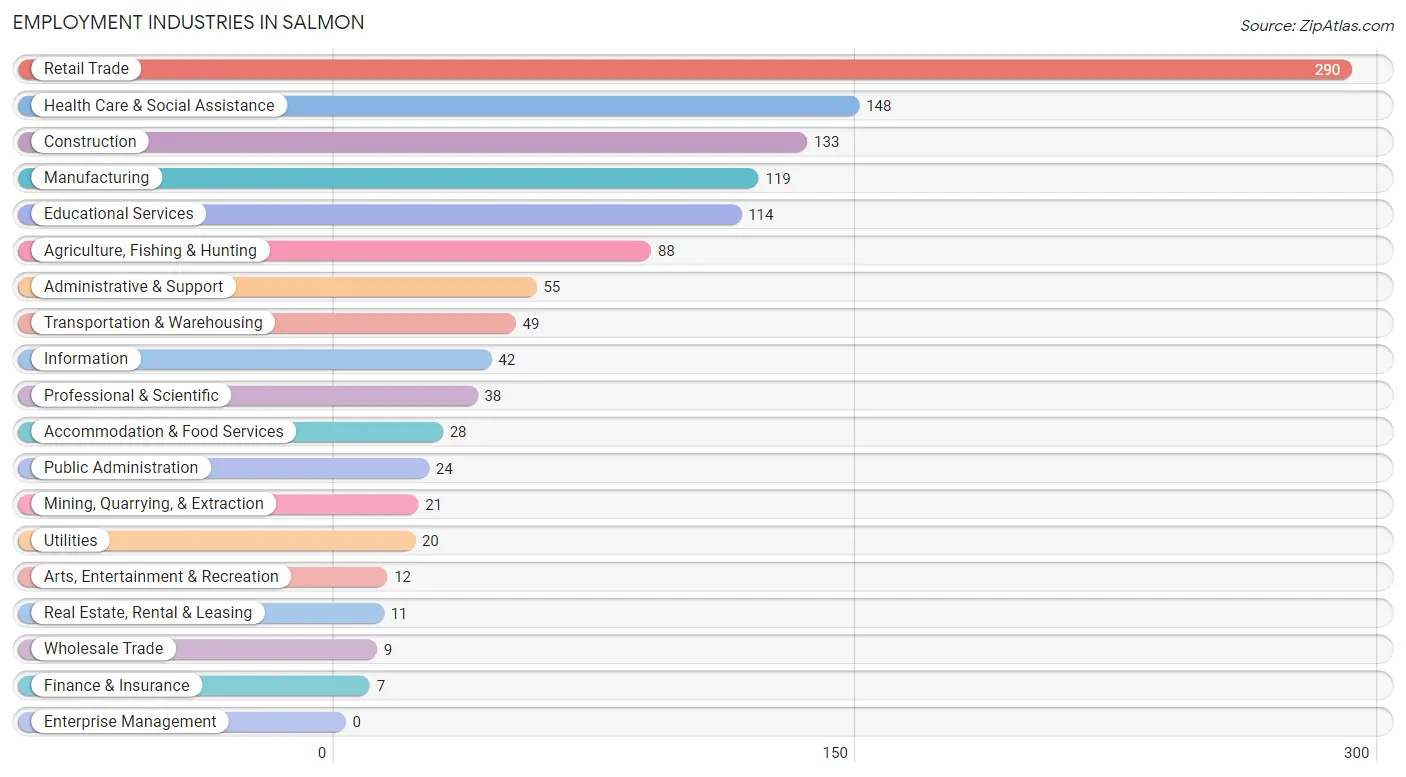
Employment Industries in Salmon
The major employment industries in Salmon include Retail Trade (290 | 21.4%), Health Care & Social Assistance (148 | 10.9%), Construction (133 | 9.8%), Manufacturing (119 | 8.8%), and Educational Services (114 | 8.4%).
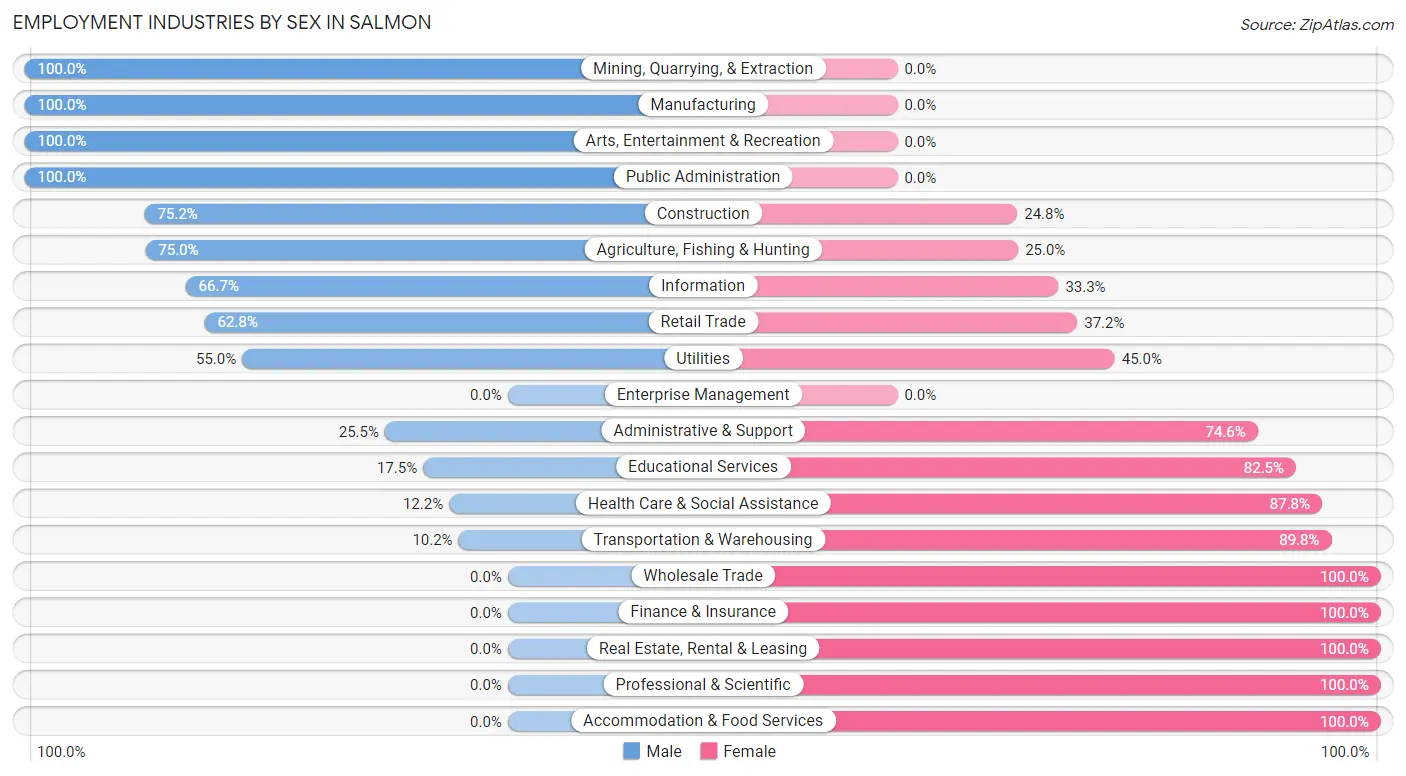
Employment Industries by Sex in Salmon
The Salmon industries that see more men than women are Mining, Quarrying, & Extraction (100.0%), Manufacturing (100.0%), and Arts, Entertainment & Recreation (100.0%), whereas the industries that tend to have a higher number of women are Wholesale Trade (100.0%), Finance & Insurance (100.0%), and Real Estate, Rental & Leasing (100.0%).
| Industry | Male | Female |
| Agriculture, Fishing & Hunting | 66 (75.0%) | 22 (25.0%) |
| Mining, Quarrying, & Extraction | 21 (100.0%) | 0 (0.0%) |
| Construction | 100 (75.2%) | 33 (24.8%) |
| Manufacturing | 119 (100.0%) | 0 (0.0%) |
| Wholesale Trade | 0 (0.0%) | 9 (100.0%) |
| Retail Trade | 182 (62.8%) | 108 (37.2%) |
| Transportation & Warehousing | 5 (10.2%) | 44 (89.8%) |
| Utilities | 11 (55.0%) | 9 (45.0%) |
| Information | 28 (66.7%) | 14 (33.3%) |
| Finance & Insurance | 0 (0.0%) | 7 (100.0%) |
| Real Estate, Rental & Leasing | 0 (0.0%) | 11 (100.0%) |
| Professional & Scientific | 0 (0.0%) | 38 (100.0%) |
| Enterprise Management | 0 (0.0%) | 0 (0.0%) |
| Administrative & Support | 14 (25.5%) | 41 (74.6%) |
| Educational Services | 20 (17.5%) | 94 (82.5%) |
| Health Care & Social Assistance | 18 (12.2%) | 130 (87.8%) |
| Arts, Entertainment & Recreation | 12 (100.0%) | 0 (0.0%) |
| Accommodation & Food Services | 0 (0.0%) | 28 (100.0%) |
| Public Administration | 24 (100.0%) | 0 (0.0%) |
| Total | 657 (48.4%) | 699 (51.5%) |
Education in Salmon
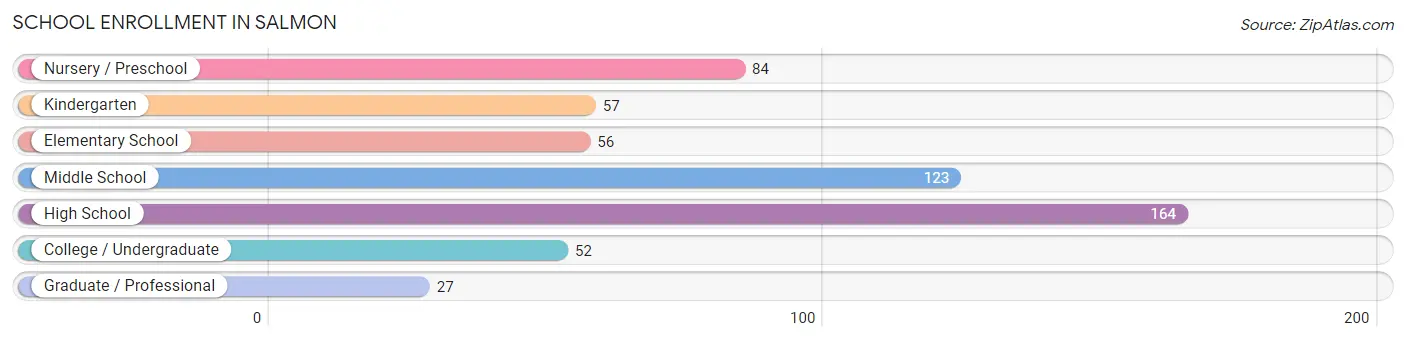
School Enrollment in Salmon
The most common levels of schooling among the 563 students in Salmon are high school (164 | 29.1%), middle school (123 | 21.8%), and nursery / preschool (84 | 14.9%).
| School Level | # Students | % Students |
| Nursery / Preschool | 84 | 14.9% |
| Kindergarten | 57 | 10.1% |
| Elementary School | 56 | 10.0% |
| Middle School | 123 | 21.8% |
| High School | 164 | 29.1% |
| College / Undergraduate | 52 | 9.2% |
| Graduate / Professional | 27 | 4.8% |
| Total | 563 | 100.0% |
School Enrollment by Age by Funding Source in Salmon
Out of a total of 563 students who are enrolled in schools in Salmon, 84 (14.9%) attend a private institution, while the remaining 479 (85.1%) are enrolled in public schools. The age group of 35 years and over has the highest likelihood of being enrolled in private schools, with 27 (100.0% in the age bracket) enrolled. Conversely, the age group of 3 to 4 year olds has the lowest likelihood of being enrolled in a private school, with 84 (100.0% in the age bracket) attending a public institution.
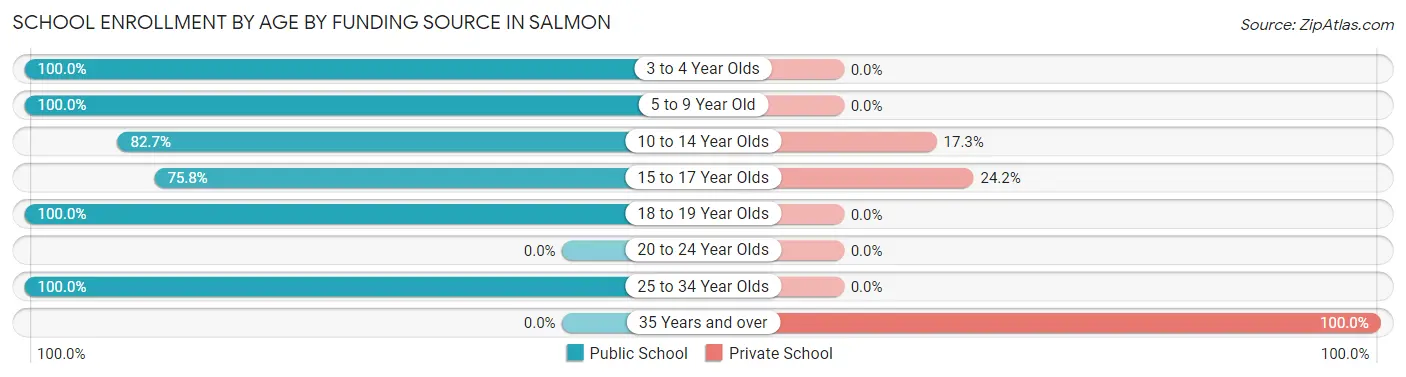
| Age Bracket | Public School | Private School |
| 3 to 4 Year Olds | 84 (100.0%) | 0 (0.0%) |
| 5 to 9 Year Old | 74 (100.0%) | 0 (0.0%) |
| 10 to 14 Year Olds | 129 (82.7%) | 27 (17.3%) |
| 15 to 17 Year Olds | 94 (75.8%) | 30 (24.2%) |
| 18 to 19 Year Olds | 47 (100.0%) | 0 (0.0%) |
| 20 to 24 Year Olds | 0 (0.0%) | 0 (0.0%) |
| 25 to 34 Year Olds | 51 (100.0%) | 0 (0.0%) |
| 35 Years and over | 0 (0.0%) | 27 (100.0%) |
| Total | 479 (85.1%) | 84 (14.9%) |
Educational Attainment by Field of Study in Salmon
Education (146 | 30.5%), bio, nature & agricultural (50 | 10.4%), science & technology (48 | 10.0%), arts & humanities (41 | 8.6%), and business (40 | 8.4%) are the most common fields of study among 479 individuals in Salmon who have obtained a bachelor's degree or higher.
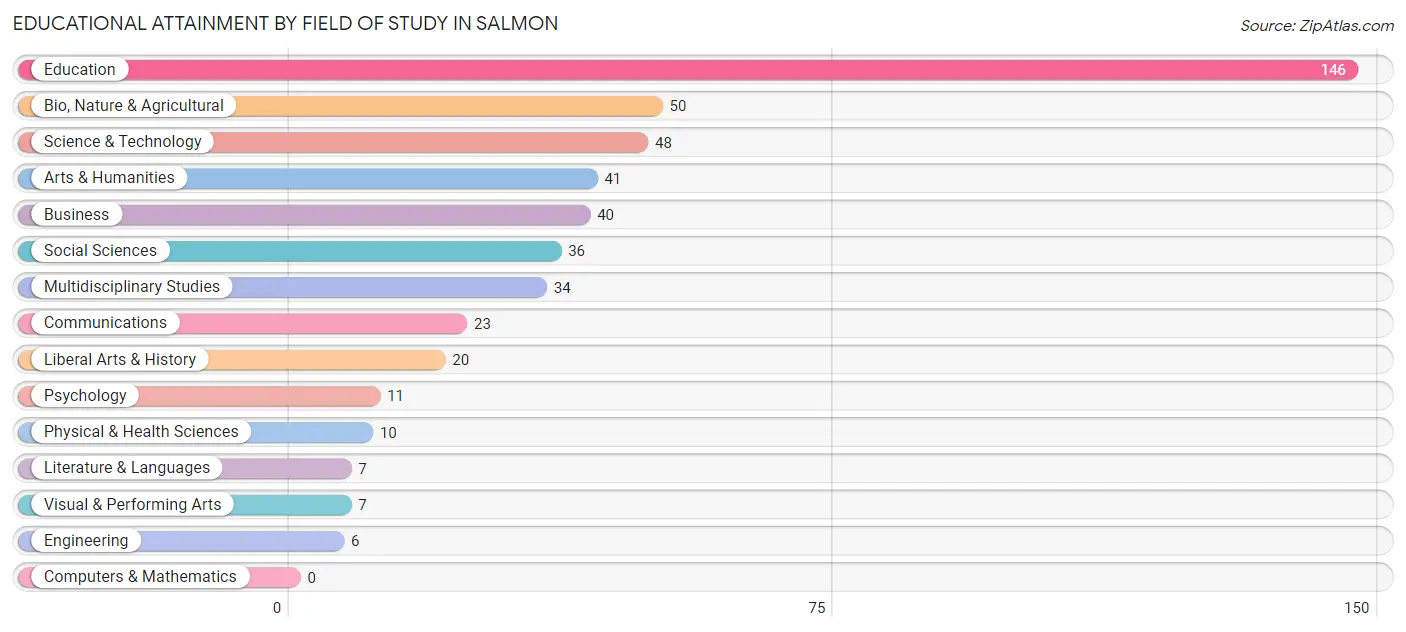
| Field of Study | # Graduates | % Graduates |
| Computers & Mathematics | 0 | 0.0% |
| Bio, Nature & Agricultural | 50 | 10.4% |
| Physical & Health Sciences | 10 | 2.1% |
| Psychology | 11 | 2.3% |
| Social Sciences | 36 | 7.5% |
| Engineering | 6 | 1.3% |
| Multidisciplinary Studies | 34 | 7.1% |
| Science & Technology | 48 | 10.0% |
| Business | 40 | 8.4% |
| Education | 146 | 30.5% |
| Literature & Languages | 7 | 1.5% |
| Liberal Arts & History | 20 | 4.2% |
| Visual & Performing Arts | 7 | 1.5% |
| Communications | 23 | 4.8% |
| Arts & Humanities | 41 | 8.6% |
| Total | 479 | 100.0% |
Transportation & Commute in Salmon
Vehicle Availability by Sex in Salmon
The most prevalent vehicle ownership categories in Salmon are males with 3 vehicles (215, accounting for 40.1%) and females with 3 vehicles (195, making up 32.1%).
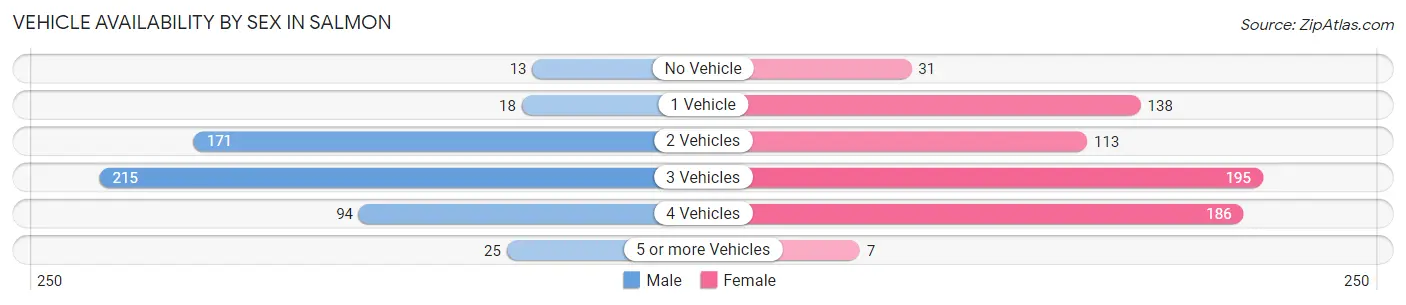
| Vehicles Available | Male | Female |
| No Vehicle | 13 (2.4%) | 31 (4.6%) |
| 1 Vehicle | 18 (3.4%) | 138 (20.6%) |
| 2 Vehicles | 171 (31.9%) | 113 (16.9%) |
| 3 Vehicles | 215 (40.1%) | 195 (29.1%) |
| 4 Vehicles | 94 (17.5%) | 186 (27.8%) |
| 5 or more Vehicles | 25 (4.7%) | 7 (1.0%) |
| Total | 536 (100.0%) | 670 (100.0%) |
Commute Time in Salmon
The most frequently occuring commute durations in Salmon are 5 to 9 minutes (657 commuters, 55.2%), less than 5 minutes (155 commuters, 13.0%), and 10 to 14 minutes (117 commuters, 9.8%).
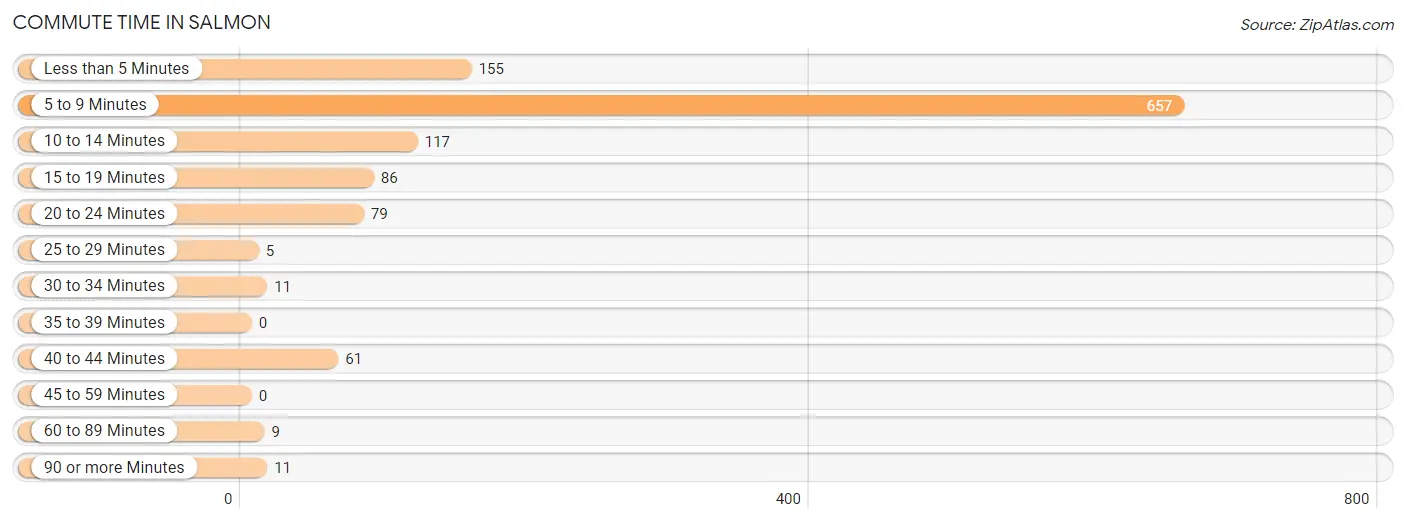
| Commute Time | # Commuters | % Commuters |
| Less than 5 Minutes | 155 | 13.0% |
| 5 to 9 Minutes | 657 | 55.2% |
| 10 to 14 Minutes | 117 | 9.8% |
| 15 to 19 Minutes | 86 | 7.2% |
| 20 to 24 Minutes | 79 | 6.6% |
| 25 to 29 Minutes | 5 | 0.4% |
| 30 to 34 Minutes | 11 | 0.9% |
| 35 to 39 Minutes | 0 | 0.0% |
| 40 to 44 Minutes | 61 | 5.1% |
| 45 to 59 Minutes | 0 | 0.0% |
| 60 to 89 Minutes | 9 | 0.8% |
| 90 or more Minutes | 11 | 0.9% |
Commute Time by Sex in Salmon
The most common commute times in Salmon are 5 to 9 minutes (240 commuters, 42.9%) for males and 5 to 9 minutes (417 commuters, 66.0%) for females.
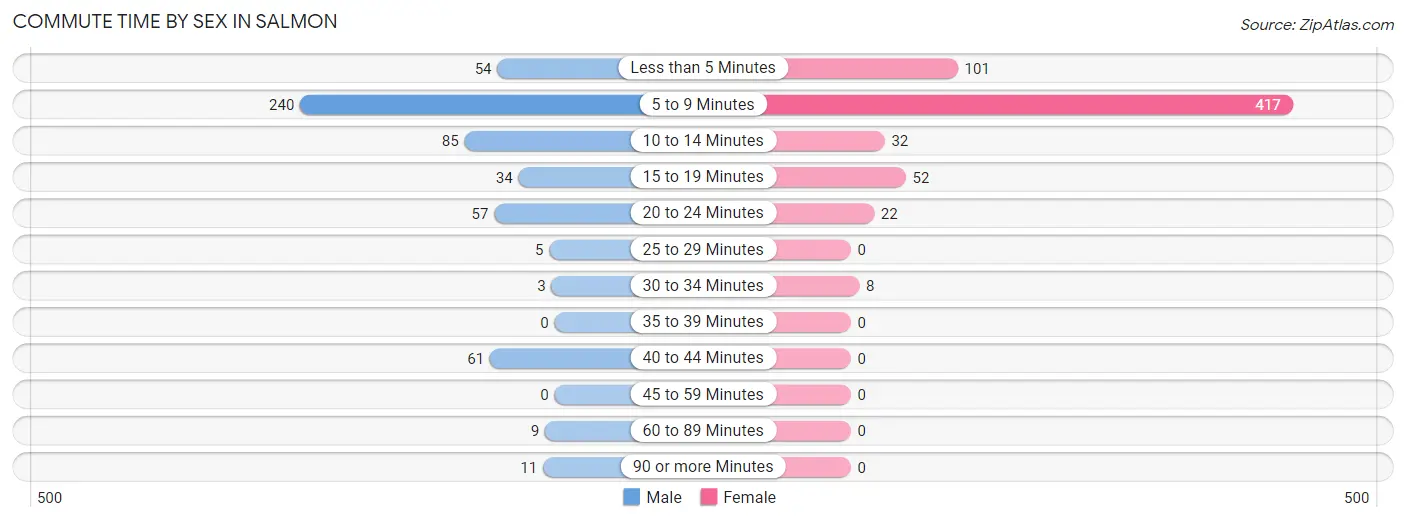
| Commute Time | Male | Female |
| Less than 5 Minutes | 54 (9.7%) | 101 (16.0%) |
| 5 to 9 Minutes | 240 (42.9%) | 417 (66.0%) |
| 10 to 14 Minutes | 85 (15.2%) | 32 (5.1%) |
| 15 to 19 Minutes | 34 (6.1%) | 52 (8.2%) |
| 20 to 24 Minutes | 57 (10.2%) | 22 (3.5%) |
| 25 to 29 Minutes | 5 (0.9%) | 0 (0.0%) |
| 30 to 34 Minutes | 3 (0.5%) | 8 (1.3%) |
| 35 to 39 Minutes | 0 (0.0%) | 0 (0.0%) |
| 40 to 44 Minutes | 61 (10.9%) | 0 (0.0%) |
| 45 to 59 Minutes | 0 (0.0%) | 0 (0.0%) |
| 60 to 89 Minutes | 9 (1.6%) | 0 (0.0%) |
| 90 or more Minutes | 11 (2.0%) | 0 (0.0%) |
Time of Departure to Work by Sex in Salmon
The most frequent times of departure to work in Salmon are 5:00 AM to 5:29 AM (97, 17.3%) for males and 7:30 AM to 7:59 AM (198, 31.3%) for females.
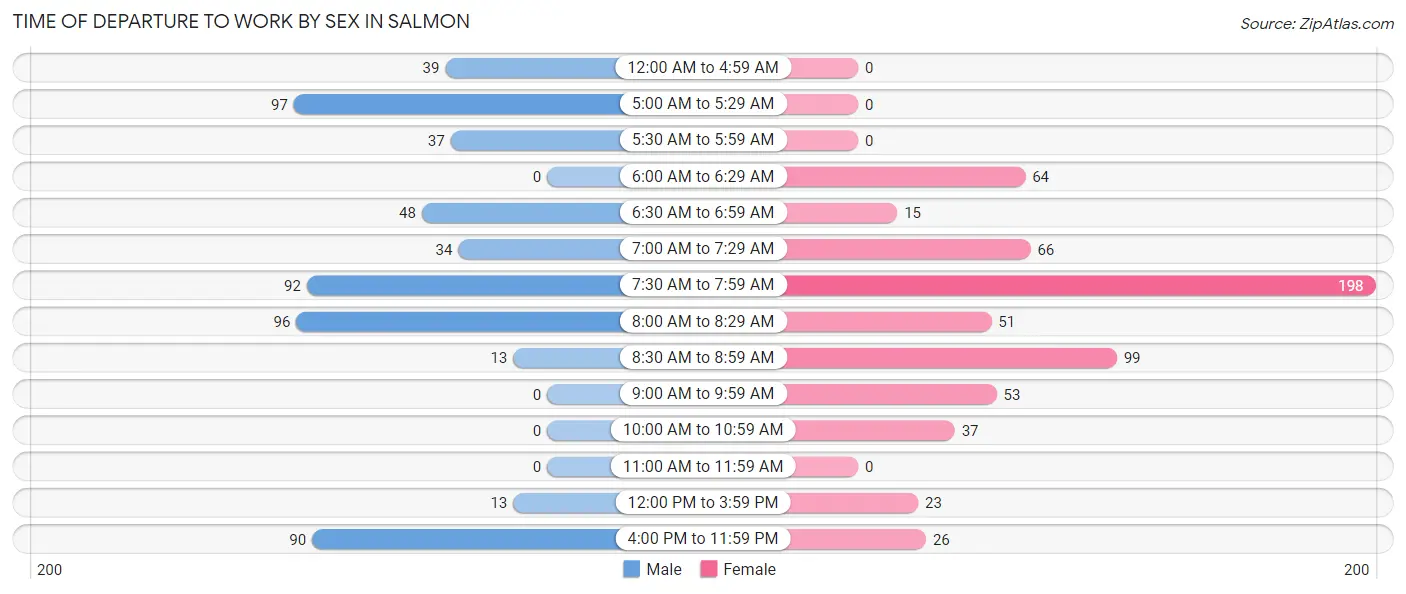
| Time of Departure | Male | Female |
| 12:00 AM to 4:59 AM | 39 (7.0%) | 0 (0.0%) |
| 5:00 AM to 5:29 AM | 97 (17.3%) | 0 (0.0%) |
| 5:30 AM to 5:59 AM | 37 (6.6%) | 0 (0.0%) |
| 6:00 AM to 6:29 AM | 0 (0.0%) | 64 (10.1%) |
| 6:30 AM to 6:59 AM | 48 (8.6%) | 15 (2.4%) |
| 7:00 AM to 7:29 AM | 34 (6.1%) | 66 (10.4%) |
| 7:30 AM to 7:59 AM | 92 (16.5%) | 198 (31.3%) |
| 8:00 AM to 8:29 AM | 96 (17.2%) | 51 (8.1%) |
| 8:30 AM to 8:59 AM | 13 (2.3%) | 99 (15.7%) |
| 9:00 AM to 9:59 AM | 0 (0.0%) | 53 (8.4%) |
| 10:00 AM to 10:59 AM | 0 (0.0%) | 37 (5.9%) |
| 11:00 AM to 11:59 AM | 0 (0.0%) | 0 (0.0%) |
| 12:00 PM to 3:59 PM | 13 (2.3%) | 23 (3.6%) |
| 4:00 PM to 11:59 PM | 90 (16.1%) | 26 (4.1%) |
| Total | 559 (100.0%) | 632 (100.0%) |
Housing Occupancy in Salmon
Occupancy by Ownership in Salmon
Of the total 1,263 dwellings in Salmon, owner-occupied units account for 888 (70.3%), while renter-occupied units make up 375 (29.7%).
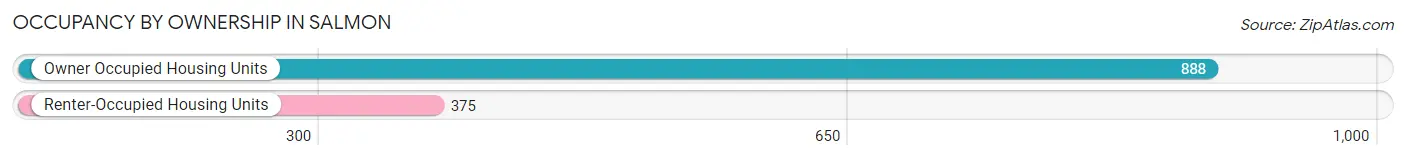
| Occupancy | # Housing Units | % Housing Units |
| Owner Occupied Housing Units | 888 | 70.3% |
| Renter-Occupied Housing Units | 375 | 29.7% |
| Total Occupied Housing Units | 1,263 | 100.0% |
Occupancy by Household Size in Salmon
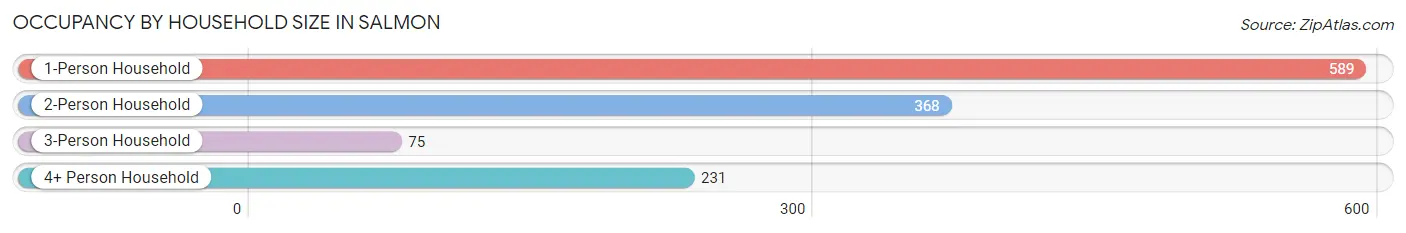
| Household Size | # Housing Units | % Housing Units |
| 1-Person Household | 589 | 46.6% |
| 2-Person Household | 368 | 29.1% |
| 3-Person Household | 75 | 5.9% |
| 4+ Person Household | 231 | 18.3% |
| Total Housing Units | 1,263 | 100.0% |
Occupancy by Ownership by Household Size in Salmon
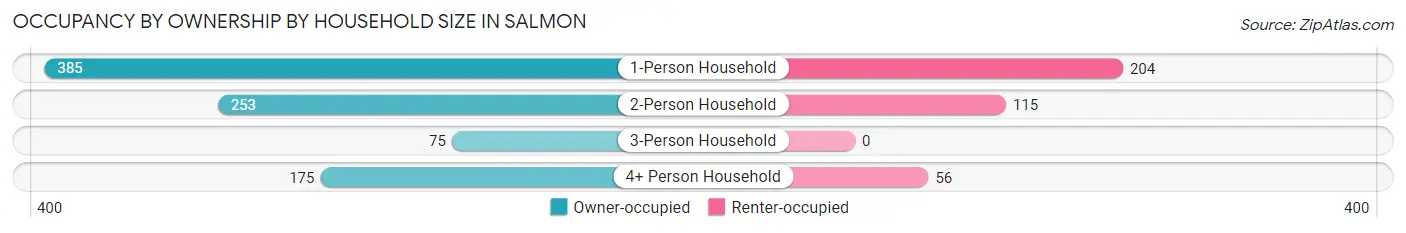
| Household Size | Owner-occupied | Renter-occupied |
| 1-Person Household | 385 (65.4%) | 204 (34.6%) |
| 2-Person Household | 253 (68.8%) | 115 (31.2%) |
| 3-Person Household | 75 (100.0%) | 0 (0.0%) |
| 4+ Person Household | 175 (75.8%) | 56 (24.2%) |
| Total Housing Units | 888 (70.3%) | 375 (29.7%) |
Occupancy by Educational Attainment in Salmon
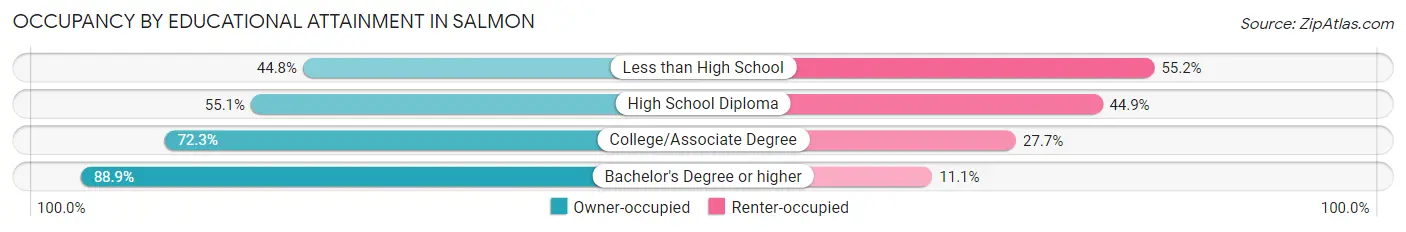
| Household Size | Owner-occupied | Renter-occupied |
| Less than High School | 39 (44.8%) | 48 (55.2%) |
| High School Diploma | 204 (55.1%) | 166 (44.9%) |
| College/Associate Degree | 310 (72.3%) | 119 (27.7%) |
| Bachelor's Degree or higher | 335 (88.9%) | 42 (11.1%) |
Occupancy by Age of Householder in Salmon
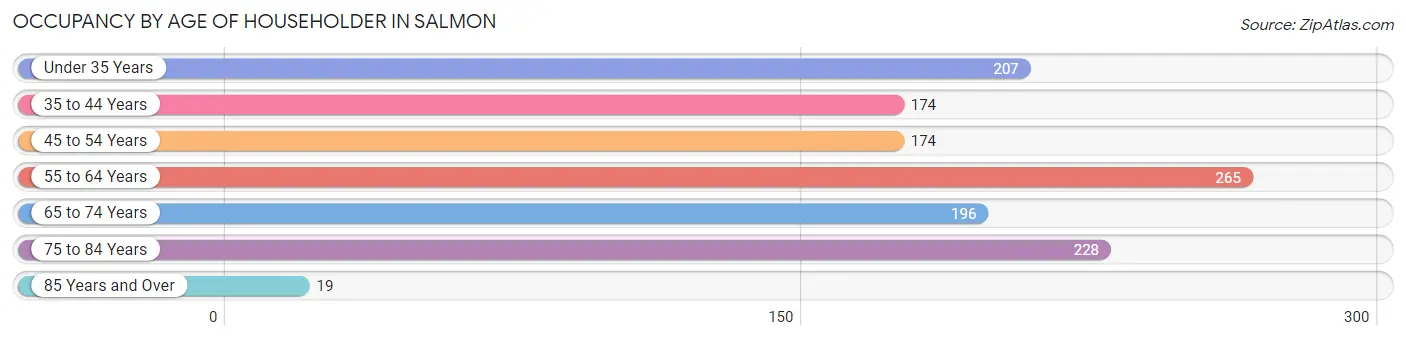
| Age Bracket | # Households | % Households |
| Under 35 Years | 207 | 16.4% |
| 35 to 44 Years | 174 | 13.8% |
| 45 to 54 Years | 174 | 13.8% |
| 55 to 64 Years | 265 | 21.0% |
| 65 to 74 Years | 196 | 15.5% |
| 75 to 84 Years | 228 | 18.0% |
| 85 Years and Over | 19 | 1.5% |
| Total | 1,263 | 100.0% |
Housing Finances in Salmon
Median Income by Occupancy in Salmon
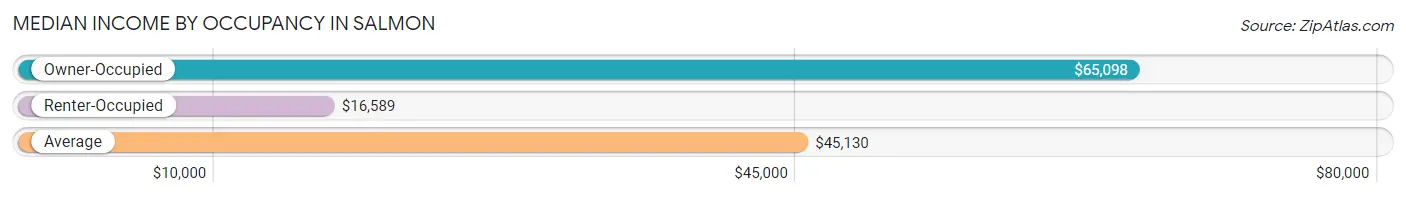
| Occupancy Type | # Households | Median Income |
| Owner-Occupied | 888 (70.3%) | $65,098 |
| Renter-Occupied | 375 (29.7%) | $16,589 |
| Average | 1,263 (100.0%) | $45,130 |
Occupancy by Householder Income Bracket in Salmon
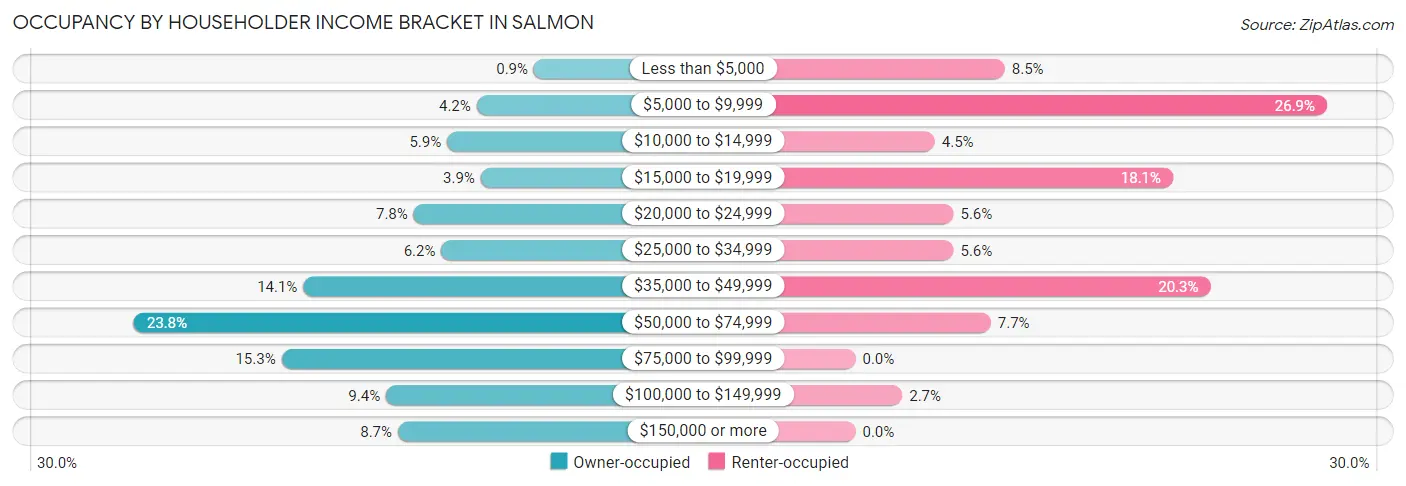
| Income Bracket | Owner-occupied | Renter-occupied |
| Less than $5,000 | 8 (0.9%) | 32 (8.5%) |
| $5,000 to $9,999 | 37 (4.2%) | 101 (26.9%) |
| $10,000 to $14,999 | 52 (5.9%) | 17 (4.5%) |
| $15,000 to $19,999 | 35 (3.9%) | 68 (18.1%) |
| $20,000 to $24,999 | 69 (7.8%) | 21 (5.6%) |
| $25,000 to $34,999 | 55 (6.2%) | 21 (5.6%) |
| $35,000 to $49,999 | 125 (14.1%) | 76 (20.3%) |
| $50,000 to $74,999 | 211 (23.8%) | 29 (7.7%) |
| $75,000 to $99,999 | 136 (15.3%) | 0 (0.0%) |
| $100,000 to $149,999 | 83 (9.3%) | 10 (2.7%) |
| $150,000 or more | 77 (8.7%) | 0 (0.0%) |
| Total | 888 (100.0%) | 375 (100.0%) |
Monthly Housing Cost Tiers in Salmon
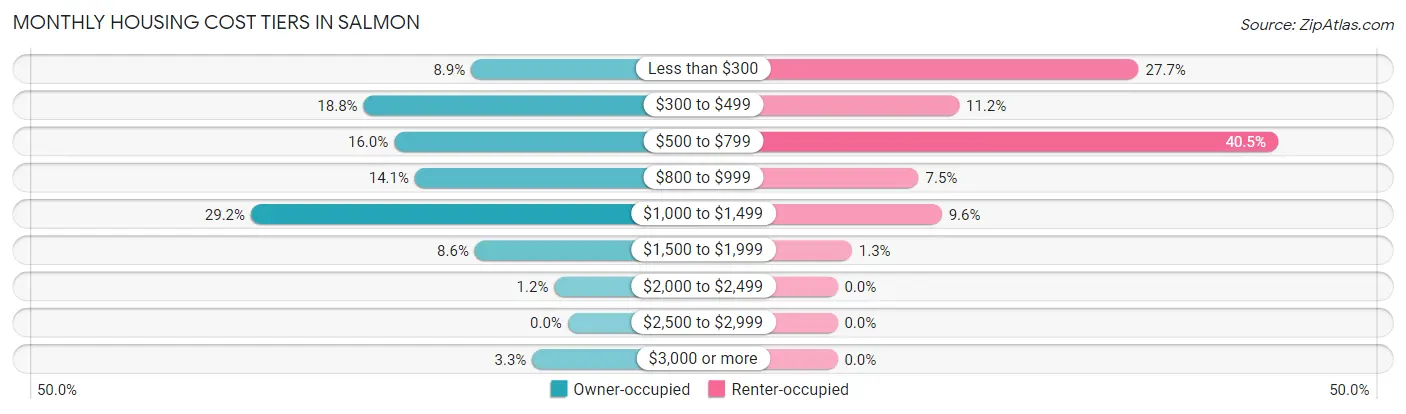
| Monthly Cost | Owner-occupied | Renter-occupied |
| Less than $300 | 79 (8.9%) | 104 (27.7%) |
| $300 to $499 | 167 (18.8%) | 42 (11.2%) |
| $500 to $799 | 142 (16.0%) | 152 (40.5%) |
| $800 to $999 | 125 (14.1%) | 28 (7.5%) |
| $1,000 to $1,499 | 259 (29.2%) | 36 (9.6%) |
| $1,500 to $1,999 | 76 (8.6%) | 5 (1.3%) |
| $2,000 to $2,499 | 11 (1.2%) | 0 (0.0%) |
| $2,500 to $2,999 | 0 (0.0%) | 0 (0.0%) |
| $3,000 or more | 29 (3.3%) | 0 (0.0%) |
| Total | 888 (100.0%) | 375 (100.0%) |
Physical Housing Characteristics in Salmon
Housing Structures in Salmon
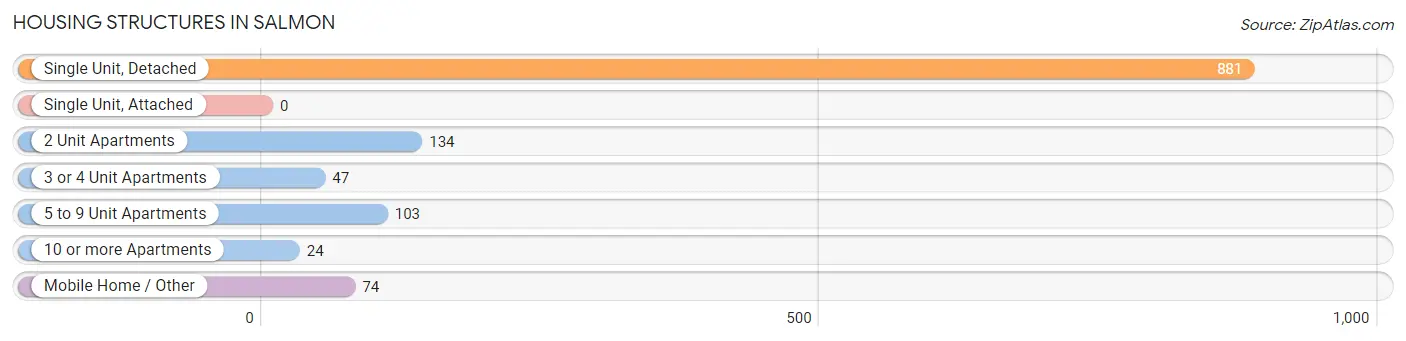
| Structure Type | # Housing Units | % Housing Units |
| Single Unit, Detached | 881 | 69.8% |
| Single Unit, Attached | 0 | 0.0% |
| 2 Unit Apartments | 134 | 10.6% |
| 3 or 4 Unit Apartments | 47 | 3.7% |
| 5 to 9 Unit Apartments | 103 | 8.2% |
| 10 or more Apartments | 24 | 1.9% |
| Mobile Home / Other | 74 | 5.9% |
| Total | 1,263 | 100.0% |
Housing Structures by Occupancy in Salmon
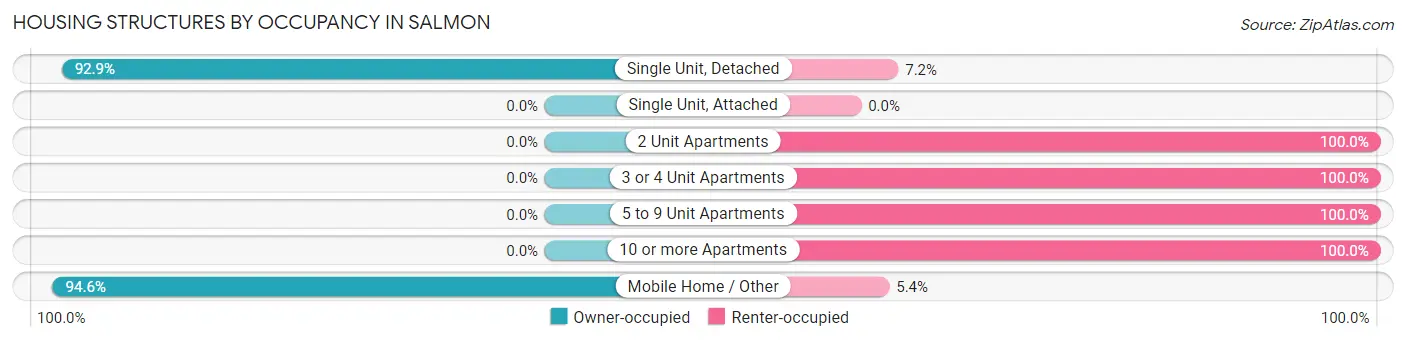
| Structure Type | Owner-occupied | Renter-occupied |
| Single Unit, Detached | 818 (92.8%) | 63 (7.1%) |
| Single Unit, Attached | 0 (0.0%) | 0 (0.0%) |
| 2 Unit Apartments | 0 (0.0%) | 134 (100.0%) |
| 3 or 4 Unit Apartments | 0 (0.0%) | 47 (100.0%) |
| 5 to 9 Unit Apartments | 0 (0.0%) | 103 (100.0%) |
| 10 or more Apartments | 0 (0.0%) | 24 (100.0%) |
| Mobile Home / Other | 70 (94.6%) | 4 (5.4%) |
| Total | 888 (70.3%) | 375 (29.7%) |
Housing Structures by Number of Rooms in Salmon
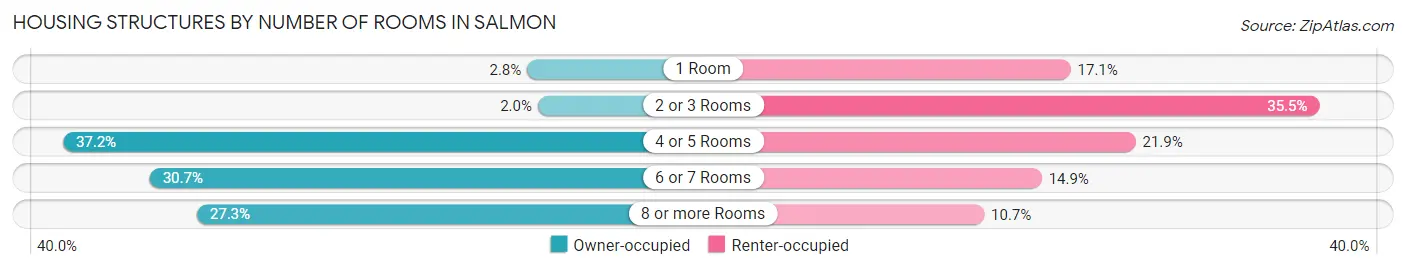
| Number of Rooms | Owner-occupied | Renter-occupied |
| 1 Room | 25 (2.8%) | 64 (17.1%) |
| 2 or 3 Rooms | 18 (2.0%) | 133 (35.5%) |
| 4 or 5 Rooms | 330 (37.2%) | 82 (21.9%) |
| 6 or 7 Rooms | 273 (30.7%) | 56 (14.9%) |
| 8 or more Rooms | 242 (27.3%) | 40 (10.7%) |
| Total | 888 (100.0%) | 375 (100.0%) |
Housing Structure by Heating Type in Salmon
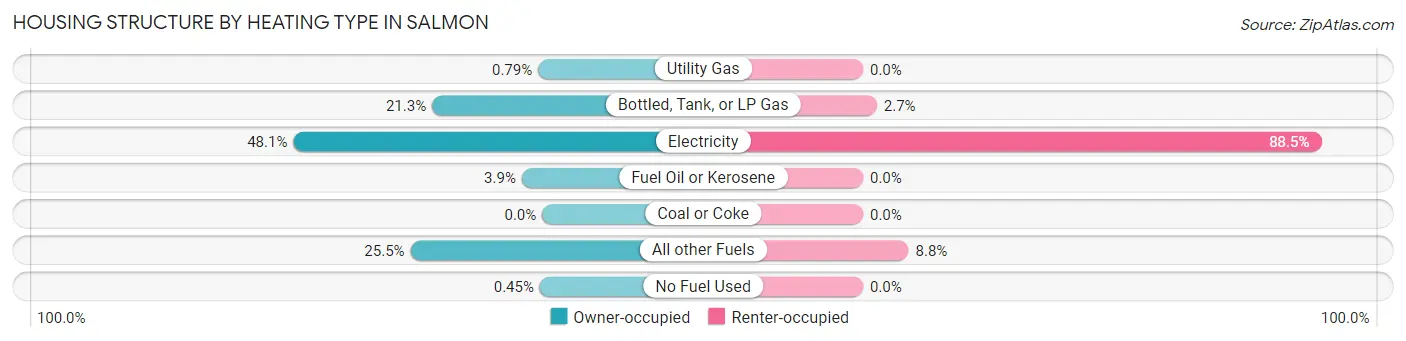
| Heating Type | Owner-occupied | Renter-occupied |
| Utility Gas | 7 (0.8%) | 0 (0.0%) |
| Bottled, Tank, or LP Gas | 189 (21.3%) | 10 (2.7%) |
| Electricity | 427 (48.1%) | 332 (88.5%) |
| Fuel Oil or Kerosene | 35 (3.9%) | 0 (0.0%) |
| Coal or Coke | 0 (0.0%) | 0 (0.0%) |
| All other Fuels | 226 (25.5%) | 33 (8.8%) |
| No Fuel Used | 4 (0.4%) | 0 (0.0%) |
| Total | 888 (100.0%) | 375 (100.0%) |
Household Vehicle Usage in Salmon
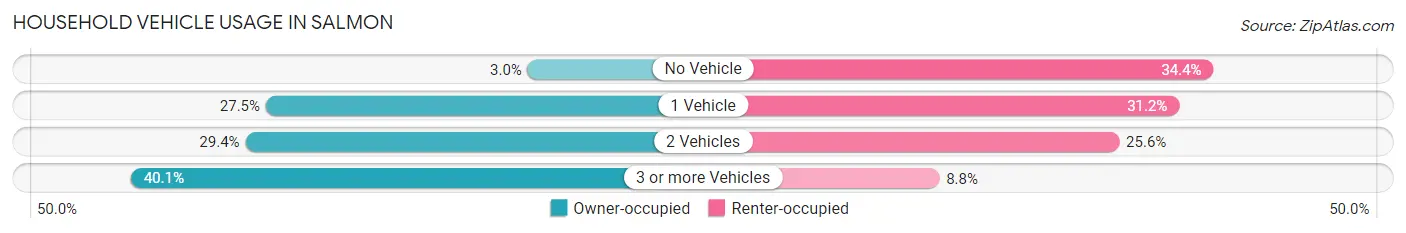
| Vehicles per Household | Owner-occupied | Renter-occupied |
| No Vehicle | 27 (3.0%) | 129 (34.4%) |
| 1 Vehicle | 244 (27.5%) | 117 (31.2%) |
| 2 Vehicles | 261 (29.4%) | 96 (25.6%) |
| 3 or more Vehicles | 356 (40.1%) | 33 (8.8%) |
| Total | 888 (100.0%) | 375 (100.0%) |
Real Estate & Mortgages in Salmon
Real Estate and Mortgage Overview in Salmon
| Characteristic | Without Mortgage | With Mortgage |
| Housing Units | 314 | 574 |
| Median Property Value | $152,200 | $178,900 |
| Median Household Income | $59,375 | $77 |
| Monthly Housing Costs | $340 | $29 |
| Real Estate Taxes | $731 | $30 |
Property Value by Mortgage Status in Salmon
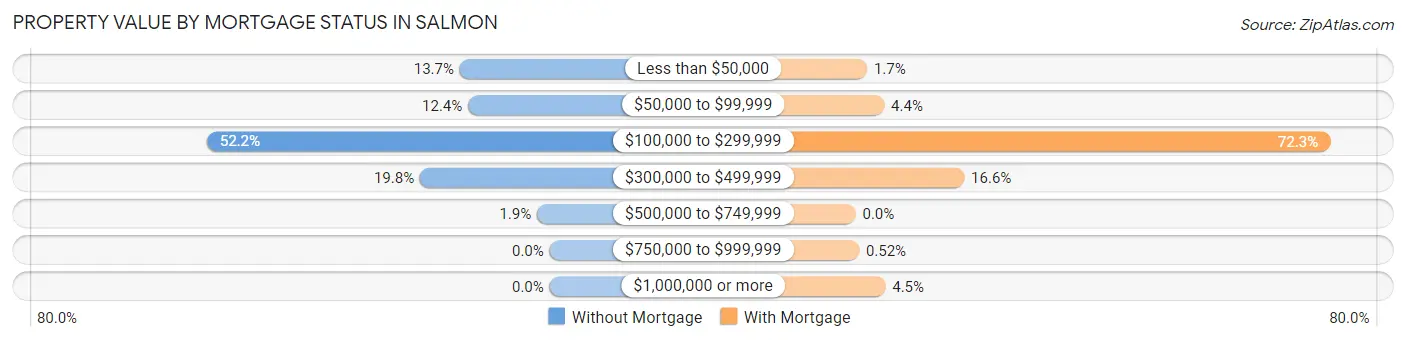
| Property Value | Without Mortgage | With Mortgage |
| Less than $50,000 | 43 (13.7%) | 10 (1.7%) |
| $50,000 to $99,999 | 39 (12.4%) | 25 (4.4%) |
| $100,000 to $299,999 | 164 (52.2%) | 415 (72.3%) |
| $300,000 to $499,999 | 62 (19.8%) | 95 (16.6%) |
| $500,000 to $749,999 | 6 (1.9%) | 0 (0.0%) |
| $750,000 to $999,999 | 0 (0.0%) | 3 (0.5%) |
| $1,000,000 or more | 0 (0.0%) | 26 (4.5%) |
| Total | 314 (100.0%) | 574 (100.0%) |
Household Income by Mortgage Status in Salmon
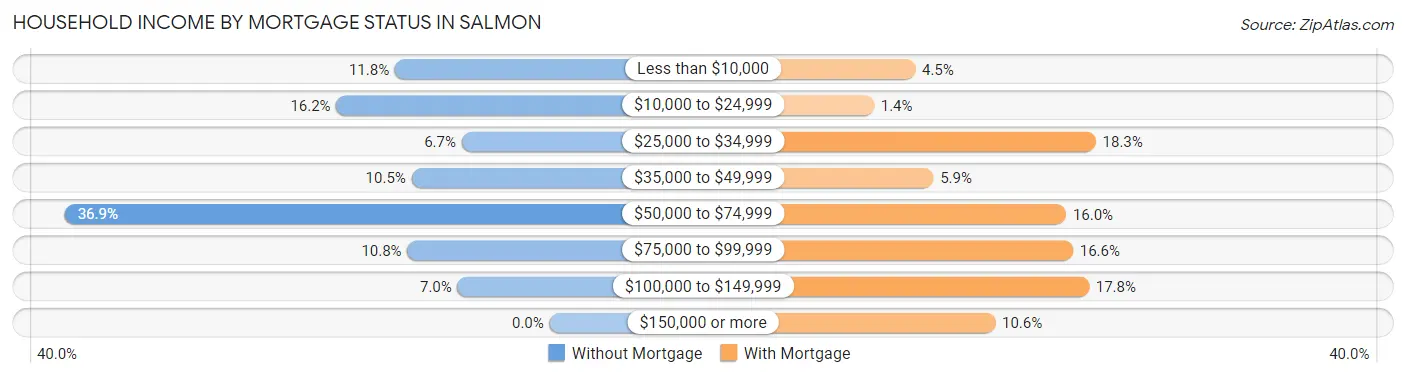
| Household Income | Without Mortgage | With Mortgage |
| Less than $10,000 | 37 (11.8%) | 26 (4.5%) |
| $10,000 to $24,999 | 51 (16.2%) | 8 (1.4%) |
| $25,000 to $34,999 | 21 (6.7%) | 105 (18.3%) |
| $35,000 to $49,999 | 33 (10.5%) | 34 (5.9%) |
| $50,000 to $74,999 | 116 (36.9%) | 92 (16.0%) |
| $75,000 to $99,999 | 34 (10.8%) | 95 (16.6%) |
| $100,000 to $149,999 | 22 (7.0%) | 102 (17.8%) |
| $150,000 or more | 0 (0.0%) | 61 (10.6%) |
| Total | 314 (100.0%) | 574 (100.0%) |
Property Value to Household Income Ratio in Salmon
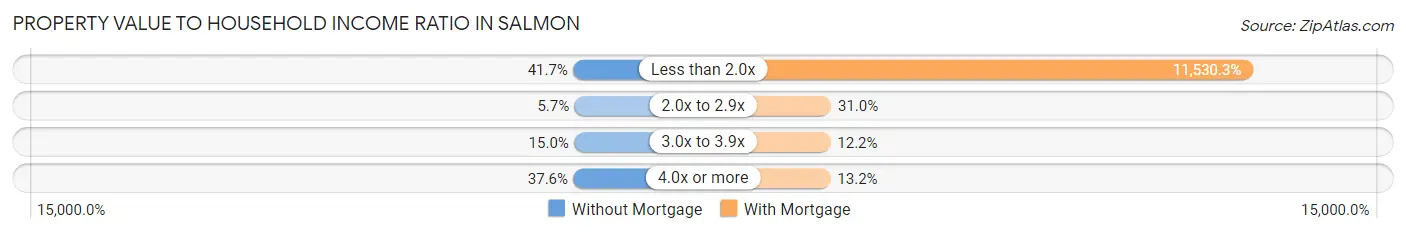
| Value-to-Income Ratio | Without Mortgage | With Mortgage |
| Less than 2.0x | 131 (41.7%) | 66,184 (11,530.3%) |
| 2.0x to 2.9x | 18 (5.7%) | 178 (31.0%) |
| 3.0x to 3.9x | 47 (15.0%) | 70 (12.2%) |
| 4.0x or more | 118 (37.6%) | 76 (13.2%) |
| Total | 314 (100.0%) | 574 (100.0%) |
Real Estate Taxes by Mortgage Status in Salmon
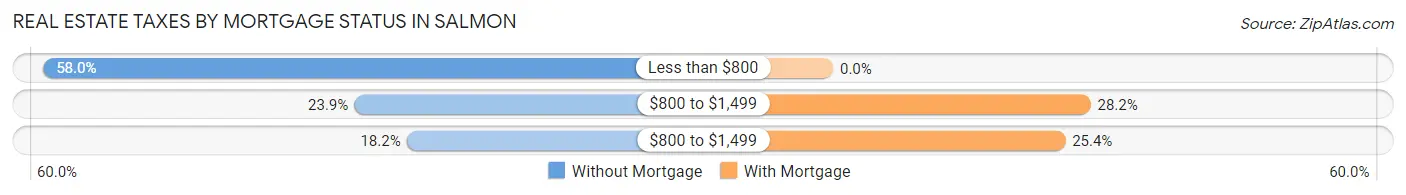
| Property Taxes | Without Mortgage | With Mortgage |
| Less than $800 | 182 (58.0%) | 0 (0.0%) |
| $800 to $1,499 | 75 (23.9%) | 162 (28.2%) |
| $800 to $1,499 | 57 (18.1%) | 146 (25.4%) |
| Total | 314 (100.0%) | 574 (100.0%) |
Health & Disability in Salmon
Health Insurance Coverage by Age in Salmon
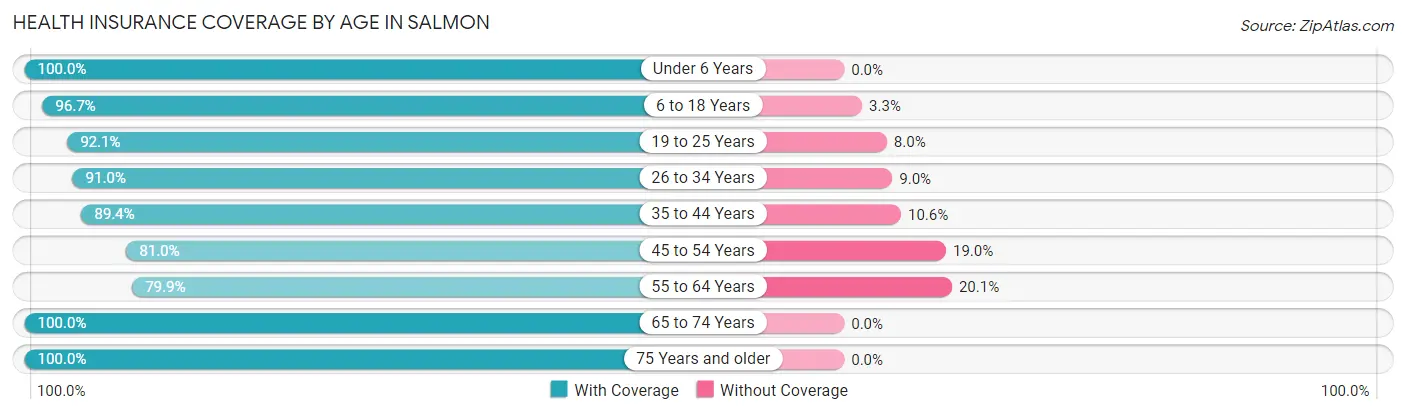
| Age Bracket | With Coverage | Without Coverage |
| Under 6 Years | 184 (100.0%) | 0 (0.0%) |
| 6 to 18 Years | 493 (96.7%) | 17 (3.3%) |
| 19 to 25 Years | 278 (92.0%) | 24 (8.0%) |
| 26 to 34 Years | 244 (91.0%) | 24 (9.0%) |
| 35 to 44 Years | 304 (89.4%) | 36 (10.6%) |
| 45 to 54 Years | 222 (81.0%) | 52 (19.0%) |
| 55 to 64 Years | 402 (79.9%) | 101 (20.1%) |
| 65 to 74 Years | 297 (100.0%) | 0 (0.0%) |
| 75 Years and older | 365 (100.0%) | 0 (0.0%) |
| Total | 2,789 (91.6%) | 254 (8.4%) |
Health Insurance Coverage by Citizenship Status in Salmon
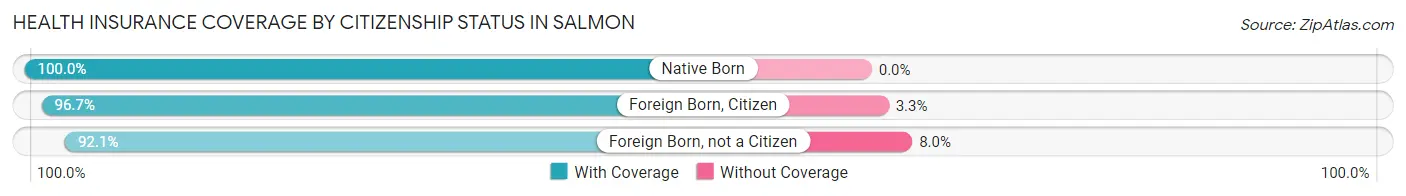
| Citizenship Status | With Coverage | Without Coverage |
| Native Born | 184 (100.0%) | 0 (0.0%) |
| Foreign Born, Citizen | 493 (96.7%) | 17 (3.3%) |
| Foreign Born, not a Citizen | 278 (92.0%) | 24 (8.0%) |
Health Insurance Coverage by Household Income in Salmon
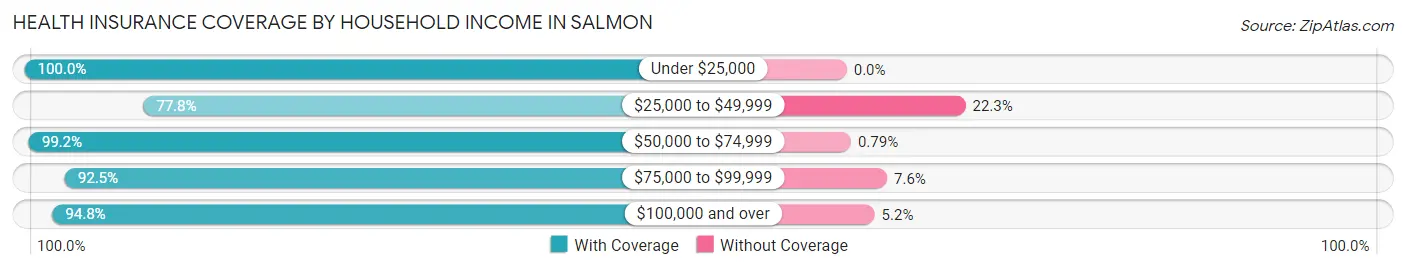
| Household Income | With Coverage | Without Coverage |
| Under $25,000 | 597 (100.0%) | 0 (0.0%) |
| $25,000 to $49,999 | 545 (77.7%) | 156 (22.3%) |
| $50,000 to $74,999 | 631 (99.2%) | 5 (0.8%) |
| $75,000 to $99,999 | 539 (92.4%) | 44 (7.5%) |
| $100,000 and over | 472 (94.8%) | 26 (5.2%) |
Public vs Private Health Insurance Coverage by Age in Salmon
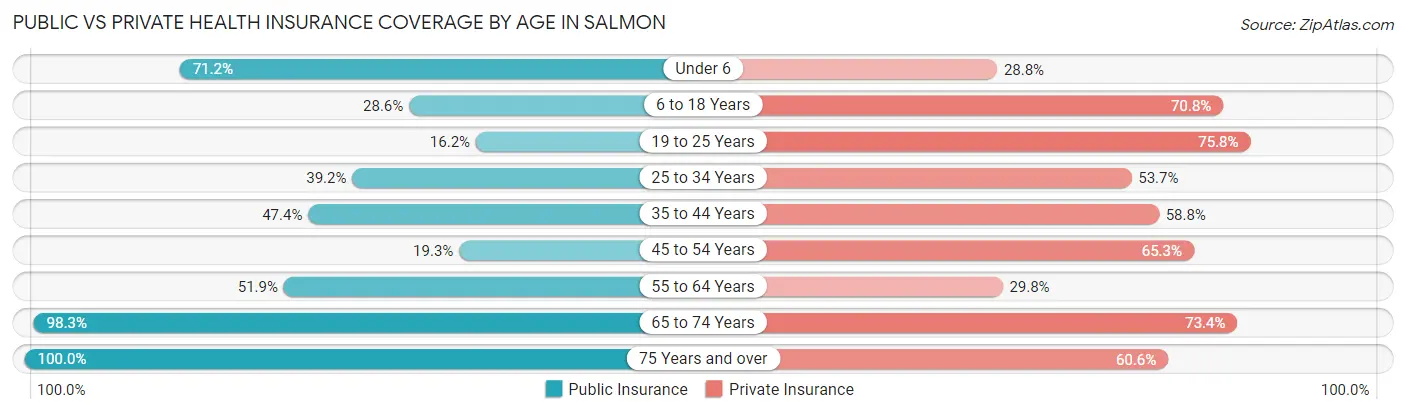
| Age Bracket | Public Insurance | Private Insurance |
| Under 6 | 131 (71.2%) | 53 (28.8%) |
| 6 to 18 Years | 146 (28.6%) | 361 (70.8%) |
| 19 to 25 Years | 49 (16.2%) | 229 (75.8%) |
| 25 to 34 Years | 105 (39.2%) | 144 (53.7%) |
| 35 to 44 Years | 161 (47.3%) | 200 (58.8%) |
| 45 to 54 Years | 53 (19.3%) | 179 (65.3%) |
| 55 to 64 Years | 261 (51.9%) | 150 (29.8%) |
| 65 to 74 Years | 292 (98.3%) | 218 (73.4%) |
| 75 Years and over | 365 (100.0%) | 221 (60.6%) |
| Total | 1,563 (51.4%) | 1,755 (57.7%) |
Disability Status by Sex by Age in Salmon
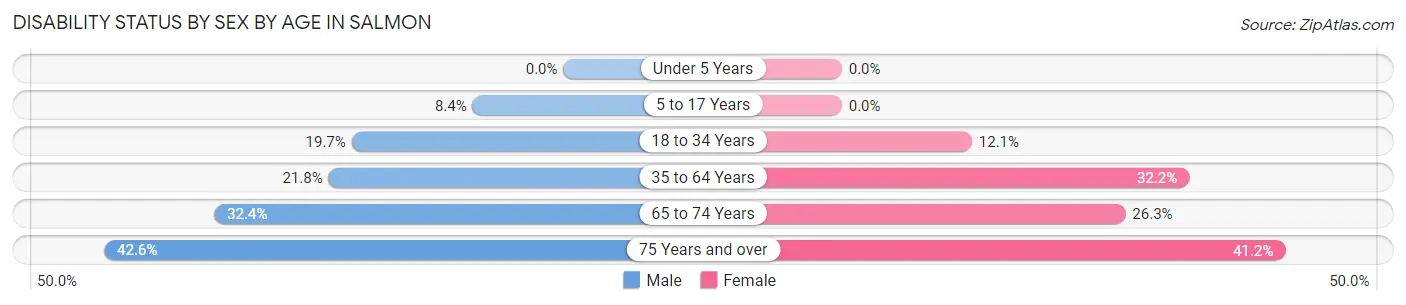
| Age Bracket | Male | Female |
| Under 5 Years | 0 (0.0%) | 0 (0.0%) |
| 5 to 17 Years | 22 (8.4%) | 0 (0.0%) |
| 18 to 34 Years | 79 (19.7%) | 35 (12.1%) |
| 35 to 64 Years | 119 (21.8%) | 184 (32.2%) |
| 65 to 74 Years | 47 (32.4%) | 40 (26.3%) |
| 75 Years and over | 52 (42.6%) | 100 (41.1%) |
Disability Class by Sex by Age in Salmon
Disability Class: Hearing Difficulty
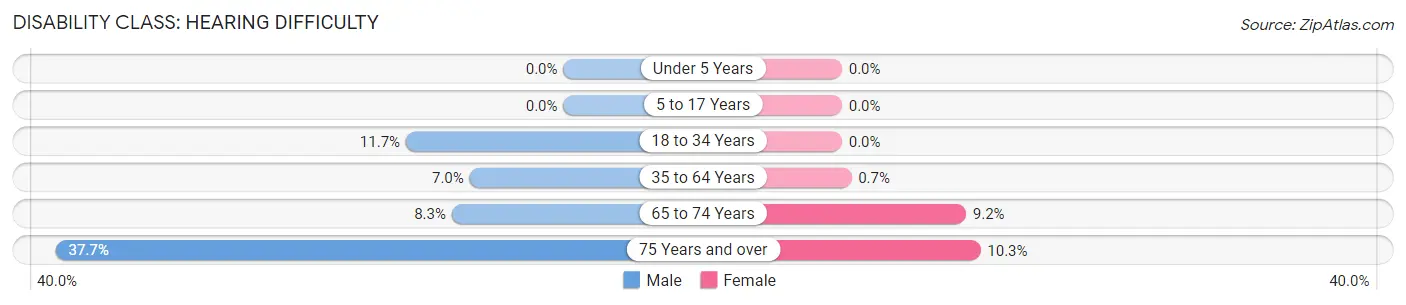
| Age Bracket | Male | Female |
| Under 5 Years | 0 (0.0%) | 0 (0.0%) |
| 5 to 17 Years | 0 (0.0%) | 0 (0.0%) |
| 18 to 34 Years | 47 (11.7%) | 0 (0.0%) |
| 35 to 64 Years | 38 (7.0%) | 4 (0.7%) |
| 65 to 74 Years | 12 (8.3%) | 14 (9.2%) |
| 75 Years and over | 46 (37.7%) | 25 (10.3%) |
Disability Class: Vision Difficulty
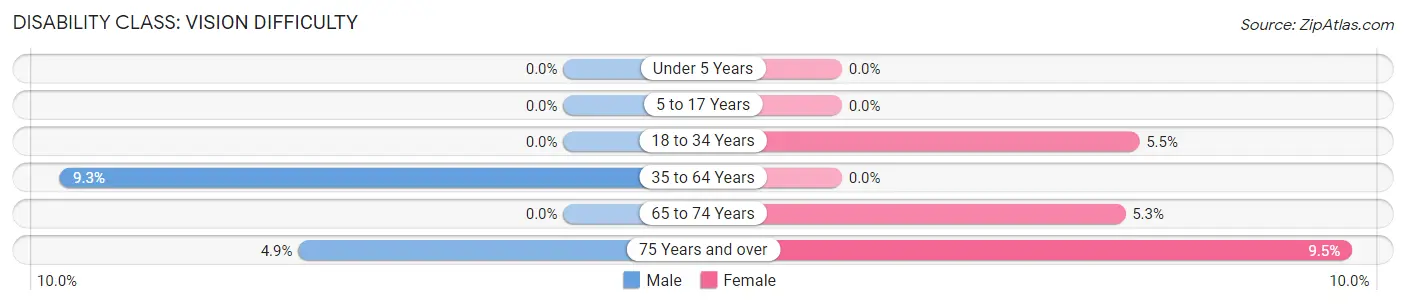
| Age Bracket | Male | Female |
| Under 5 Years | 0 (0.0%) | 0 (0.0%) |
| 5 to 17 Years | 0 (0.0%) | 0 (0.0%) |
| 18 to 34 Years | 0 (0.0%) | 16 (5.5%) |
| 35 to 64 Years | 51 (9.3%) | 0 (0.0%) |
| 65 to 74 Years | 0 (0.0%) | 8 (5.3%) |
| 75 Years and over | 6 (4.9%) | 23 (9.5%) |
Disability Class: Cognitive Difficulty
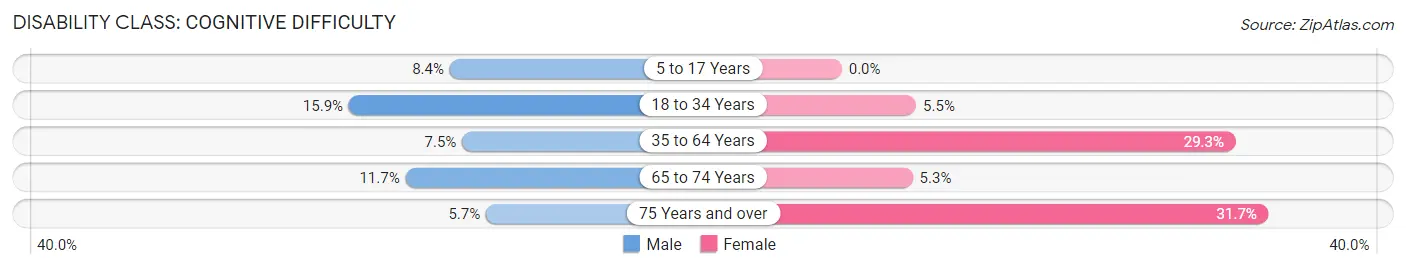
| Age Bracket | Male | Female |
| 5 to 17 Years | 22 (8.4%) | 0 (0.0%) |
| 18 to 34 Years | 64 (15.9%) | 16 (5.5%) |
| 35 to 64 Years | 41 (7.5%) | 167 (29.2%) |
| 65 to 74 Years | 17 (11.7%) | 8 (5.3%) |
| 75 Years and over | 7 (5.7%) | 77 (31.7%) |
Disability Class: Ambulatory Difficulty
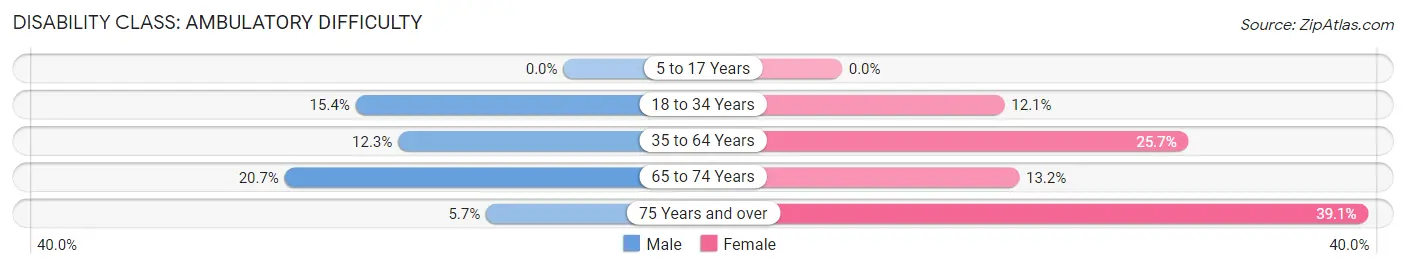
| Age Bracket | Male | Female |
| 5 to 17 Years | 0 (0.0%) | 0 (0.0%) |
| 18 to 34 Years | 62 (15.4%) | 35 (12.1%) |
| 35 to 64 Years | 67 (12.3%) | 147 (25.7%) |
| 65 to 74 Years | 30 (20.7%) | 20 (13.2%) |
| 75 Years and over | 7 (5.7%) | 95 (39.1%) |
Disability Class: Self-Care Difficulty
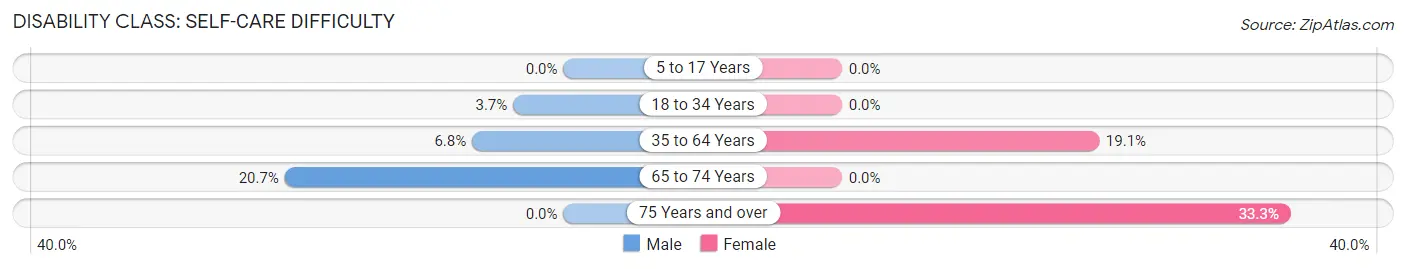
| Age Bracket | Male | Female |
| 5 to 17 Years | 0 (0.0%) | 0 (0.0%) |
| 18 to 34 Years | 15 (3.7%) | 0 (0.0%) |
| 35 to 64 Years | 37 (6.8%) | 109 (19.1%) |
| 65 to 74 Years | 30 (20.7%) | 0 (0.0%) |
| 75 Years and over | 0 (0.0%) | 81 (33.3%) |
Technology Access in Salmon
Computing Device Access in Salmon
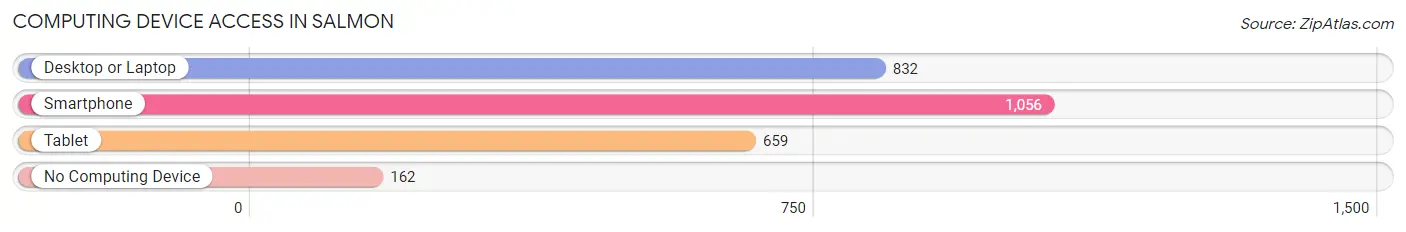
| Device Type | # Households | % Households |
| Desktop or Laptop | 832 | 65.9% |
| Smartphone | 1,056 | 83.6% |
| Tablet | 659 | 52.2% |
| No Computing Device | 162 | 12.8% |
| Total | 1,263 | 100.0% |
Internet Access in Salmon
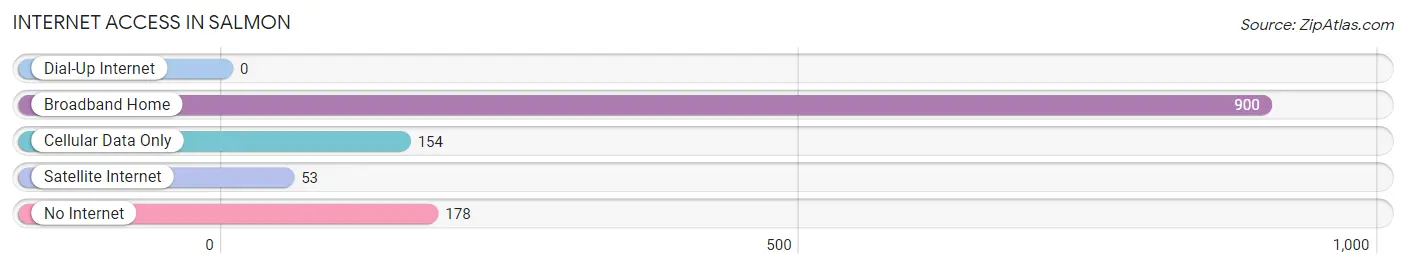
| Internet Type | # Households | % Households |
| Dial-Up Internet | 0 | 0.0% |
| Broadband Home | 900 | 71.3% |
| Cellular Data Only | 154 | 12.2% |
| Satellite Internet | 53 | 4.2% |
| No Internet | 178 | 14.1% |
| Total | 1,263 | 100.0% |
Salmon Summary
Salmon, Idaho is a small city located in the Lemhi Valley of Idaho, in the United States. It is the county seat of Lemhi County and is the largest city in the county. The city is located along the Salmon River, which is a major tributary of the Snake River. The city is known for its outdoor recreation opportunities, including fishing, hunting, camping, and hiking.
Geography
Salmon is located in the Lemhi Valley, which is a wide, flat valley surrounded by mountains. The city is situated at an elevation of 4,919 feet (1,499 m) above sea level. The Salmon River runs through the city, and the city is located at the confluence of the Lemhi and Salmon Rivers. The city is located in the Central Time Zone and is about 100 miles (160 km) northeast of Boise, the state capital.
The climate in Salmon is semi-arid, with hot summers and cold winters. The average high temperature in July is 87°F (31°C), and the average low temperature in January is 16°F (-9°C). The average annual precipitation is 11.5 inches (29 cm).
Economy
The economy of Salmon is largely based on agriculture and tourism. The city is home to several large agricultural operations, including cattle ranches, dairy farms, and potato farms. The city is also home to several tourist attractions, including the Salmon River, the Lemhi River, and the Salmon National Forest.
The city is also home to several manufacturing companies, including a wood products plant, a metal fabrication plant, and a food processing plant. The city is also home to several retail stores, restaurants, and other businesses.
Demographics
As of the 2010 census, the population of Salmon was 3,112. The racial makeup of the city was 95.3% White, 0.3% African American, 0.7% Native American, 0.3% Asian, 0.1% Pacific Islander, 1.2% from other races, and 2.3% from two or more races. Hispanic or Latino of any race were 3.3% of the population.
The median household income in Salmon was $35,938, and the median family income was $41,944. The per capita income for the city was $17,845. About 14.3% of families and 17.7% of the population were below the poverty line, including 22.3% of those under age 18 and 8.2% of those age 65 or over.
Salmon is served by the Salmon School District, which includes two elementary schools, a middle school, and a high school. The city is also home to a branch of the College of Southern Idaho.
Salmon is a small city with a rich history and a vibrant economy. The city is home to several agricultural operations, manufacturing companies, and tourist attractions. The city is also home to a diverse population, with a median household income that is slightly below the national average.
Common Questions
What is Per Capita Income in Salmon?
Per Capita income in Salmon is $30,796.
What is the Median Family Income in Salmon?
Median Family Income in Salmon is $62,417.
What is the Median Household income in Salmon?
Median Household Income in Salmon is $45,130.
What is Income or Wage Gap in Salmon?
Income or Wage Gap in Salmon is 8.9%.
Women in Salmon earn 91.1 cents for every dollar earned by a man.
What is Inequality or Gini Index in Salmon?
Inequality or Gini Index in Salmon is 0.55.
What is the Total Population of Salmon?
Total Population of Salmon is 3,147.
What is the Total Male Population of Salmon?
Total Male Population of Salmon is 1,689.
What is the Total Female Population of Salmon?
Total Female Population of Salmon is 1,458.
What is the Ratio of Males per 100 Females in Salmon?
There are 115.84 Males per 100 Females in Salmon.
What is the Ratio of Females per 100 Males in Salmon?
There are 86.32 Females per 100 Males in Salmon.
What is the Median Population Age in Salmon?
Median Population Age in Salmon is 43.3 Years.
What is the Average Family Size in Salmon
Average Family Size in Salmon is 3.6 People.
What is the Average Household Size in Salmon
Average Household Size in Salmon is 2.4 People.
How Large is the Labor Force in Salmon?
There are 1,482 People in the Labor Forcein in Salmon.
What is the Percentage of People in the Labor Force in Salmon?
56.4% of People are in the Labor Force in Salmon.
What is the Unemployment Rate in Salmon?
Unemployment Rate in Salmon is 6.2%.