Rockland, ID Map & Demographics
Rockland Map
Rockland Overview
$21,195
PER CAPITA INCOME
$49,500
AVG FAMILY INCOME
$49,000
AVG HOUSEHOLD INCOME
0.33
INEQUALITY / GINI INDEX
151
TOTAL POPULATION
63
MALE POPULATION
88
FEMALE POPULATION
71.59
MALES / 100 FEMALES
139.68
FEMALES / 100 MALES
57.1
MEDIAN AGE
2.7
AVG FAMILY SIZE
2.4
AVG HOUSEHOLD SIZE
57
LABOR FORCE [ PEOPLE ]
49.6%
PERCENT IN LABOR FORCE
Rockland Zip Codes
Rockland Area Codes
Income in Rockland
Income Overview in Rockland
Per Capita Income in Rockland is $21,195, while median incomes of families and households are $49,500 and $49,000 respectively.
| Characteristic | Number | Measure |
| Per Capita Income | 151 | $21,195 |
| Median Family Income | 52 | $49,500 |
| Mean Family Income | 52 | $61,527 |
| Median Household Income | 62 | $49,000 |
| Mean Household Income | 62 | $56,532 |
| Income Deficit | 52 | $0 |
| Wage / Income Gap (%) | 151 | 0.00% |
| Wage / Income Gap ($) | 151 | 100.00¢ per $1 |
| Gini / Inequality Index | 151 | 0.33 |
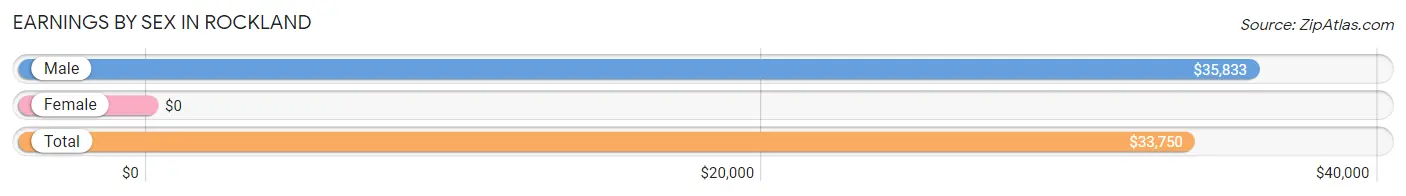
Earnings by Sex in Rockland
| Sex | Number | Average Earnings |
| Male | 30 (52.6%) | $35,833 |
| Female | 27 (47.4%) | $0 |
| Total | 57 (100.0%) | $33,750 |
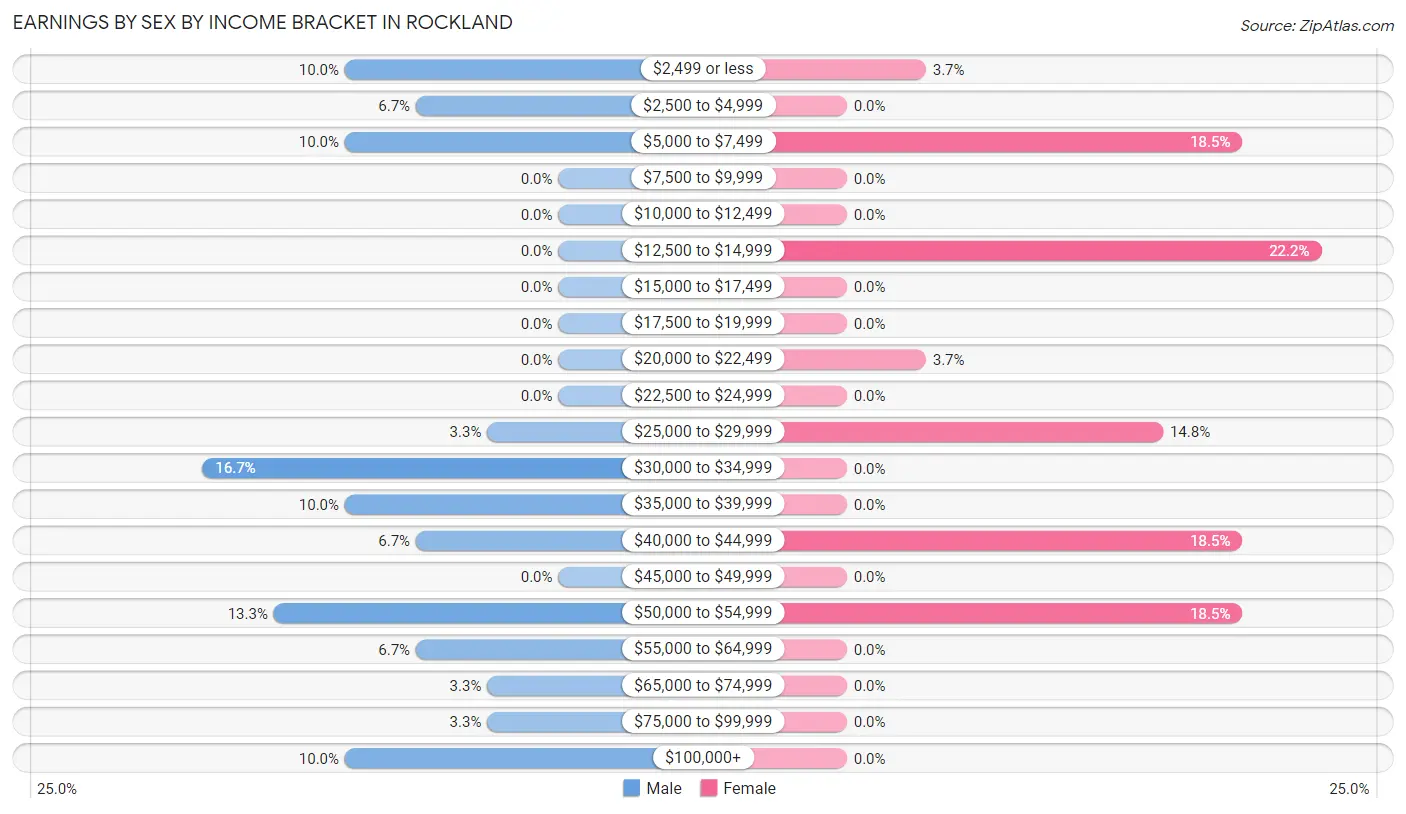
Earnings by Sex by Income Bracket in Rockland
The most common earnings brackets in Rockland are $30,000 to $34,999 for men (5 | 16.7%) and $12,500 to $14,999 for women (6 | 22.2%).
| Income | Male | Female |
| $2,499 or less | 3 (10.0%) | 1 (3.7%) |
| $2,500 to $4,999 | 2 (6.7%) | 0 (0.0%) |
| $5,000 to $7,499 | 3 (10.0%) | 5 (18.5%) |
| $7,500 to $9,999 | 0 (0.0%) | 0 (0.0%) |
| $10,000 to $12,499 | 0 (0.0%) | 0 (0.0%) |
| $12,500 to $14,999 | 0 (0.0%) | 6 (22.2%) |
| $15,000 to $17,499 | 0 (0.0%) | 0 (0.0%) |
| $17,500 to $19,999 | 0 (0.0%) | 0 (0.0%) |
| $20,000 to $22,499 | 0 (0.0%) | 1 (3.7%) |
| $22,500 to $24,999 | 0 (0.0%) | 0 (0.0%) |
| $25,000 to $29,999 | 1 (3.3%) | 4 (14.8%) |
| $30,000 to $34,999 | 5 (16.7%) | 0 (0.0%) |
| $35,000 to $39,999 | 3 (10.0%) | 0 (0.0%) |
| $40,000 to $44,999 | 2 (6.7%) | 5 (18.5%) |
| $45,000 to $49,999 | 0 (0.0%) | 0 (0.0%) |
| $50,000 to $54,999 | 4 (13.3%) | 5 (18.5%) |
| $55,000 to $64,999 | 2 (6.7%) | 0 (0.0%) |
| $65,000 to $74,999 | 1 (3.3%) | 0 (0.0%) |
| $75,000 to $99,999 | 1 (3.3%) | 0 (0.0%) |
| $100,000+ | 3 (10.0%) | 0 (0.0%) |
| Total | 30 (100.0%) | 27 (100.0%) |
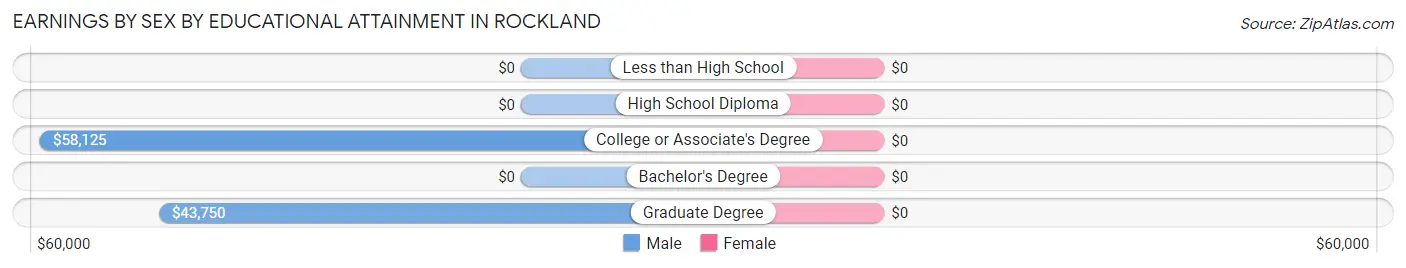
Earnings by Sex by Educational Attainment in Rockland
| Educational Attainment | Male Income | Female Income |
| Less than High School | - | - |
| High School Diploma | - | - |
| College or Associate's Degree | $58,125 | $0 |
| Bachelor's Degree | - | - |
| Graduate Degree | $43,750 | $0 |
| Total | $47,500 | $0 |
Family Income in Rockland
Family Income Brackets in Rockland
According to the Rockland family income data, there are 16 families falling into the $25,000 to $34,999 income range, which is the most common income bracket and makes up 30.8% of all families.
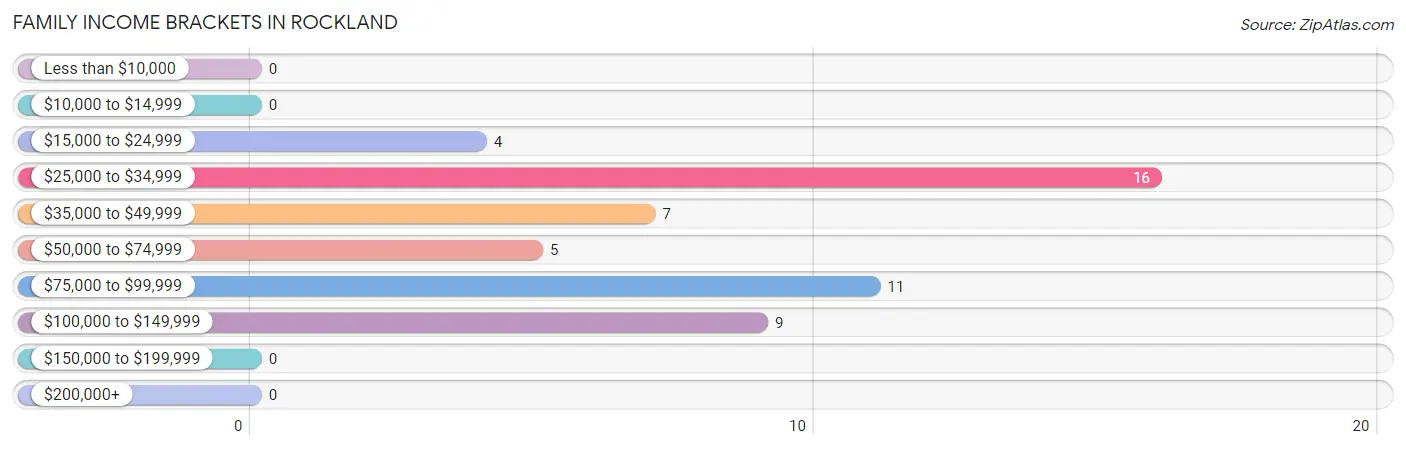
| Income Bracket | # Families | % Families |
| Less than $10,000 | 0 | 0.0% |
| $10,000 to $14,999 | 0 | 0.0% |
| $15,000 to $24,999 | 4 | 7.7% |
| $25,000 to $34,999 | 16 | 30.8% |
| $35,000 to $49,999 | 7 | 13.5% |
| $50,000 to $74,999 | 5 | 9.6% |
| $75,000 to $99,999 | 11 | 21.2% |
| $100,000 to $149,999 | 9 | 17.3% |
| $150,000 to $199,999 | 0 | 0.0% |
| $200,000+ | 0 | 0.0% |
Family Income by Famaliy Size in Rockland
2-person families (42 | 80.8%) account for the highest median family income in Rockland with $49,000 per family, while 2-person families (42 | 80.8%) have the highest median income of $24,500 per family member.
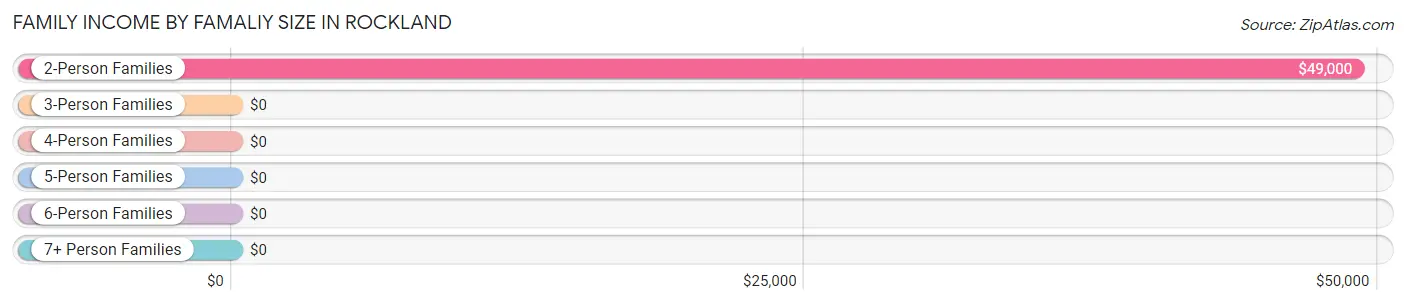
| Income Bracket | # Families | Median Income |
| 2-Person Families | 42 (80.8%) | $49,000 |
| 3-Person Families | 0 (0.0%) | $0 |
| 4-Person Families | 1 (1.9%) | $0 |
| 5-Person Families | 5 (9.6%) | $0 |
| 6-Person Families | 0 (0.0%) | $0 |
| 7+ Person Families | 4 (7.7%) | $0 |
| Total | 52 (100.0%) | $49,500 |
Family Income by Number of Earners in Rockland
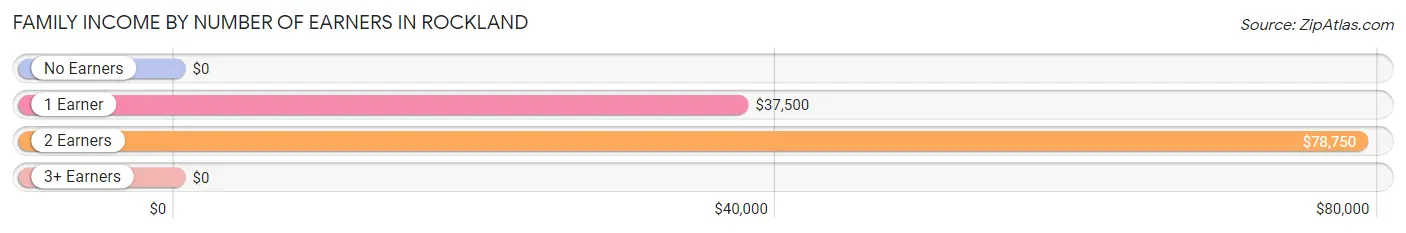
| Number of Earners | # Families | Median Income |
| No Earners | 21 (40.4%) | $0 |
| 1 Earner | 16 (30.8%) | $37,500 |
| 2 Earners | 10 (19.2%) | $78,750 |
| 3+ Earners | 5 (9.6%) | $0 |
| Total | 52 (100.0%) | $49,500 |
Household Income in Rockland
Household Income Brackets in Rockland
With 16 households falling in the category, the $25,000 to $34,999 income range is the most frequent in Rockland, accounting for 25.8% of all households.
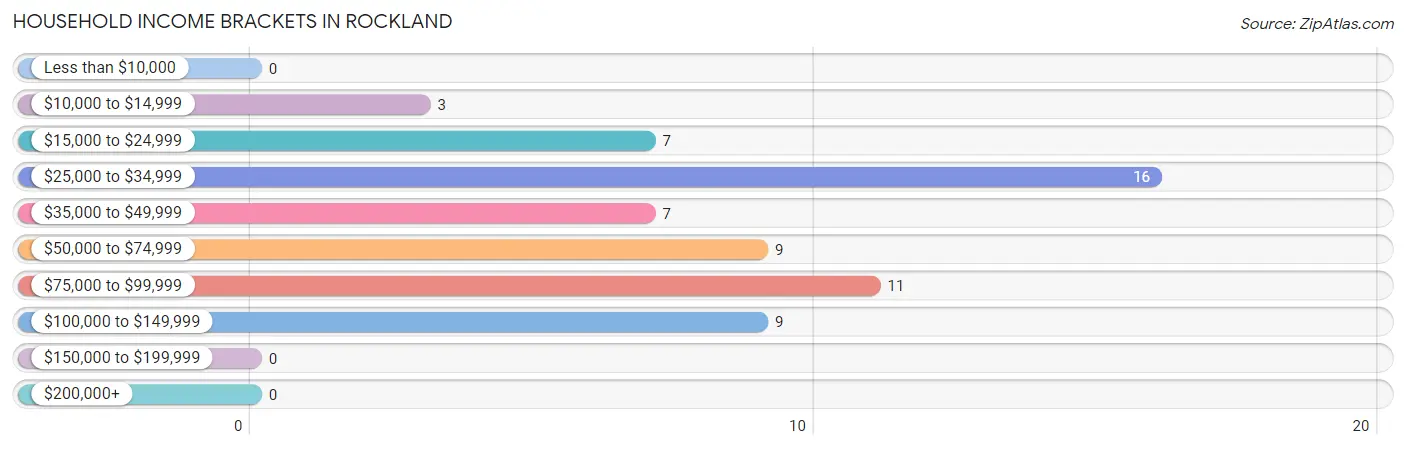
| Income Bracket | # Households | % Households |
| Less than $10,000 | 0 | 0.0% |
| $10,000 to $14,999 | 3 | 4.8% |
| $15,000 to $24,999 | 7 | 11.3% |
| $25,000 to $34,999 | 16 | 25.8% |
| $35,000 to $49,999 | 7 | 11.3% |
| $50,000 to $74,999 | 9 | 14.5% |
| $75,000 to $99,999 | 11 | 17.7% |
| $100,000 to $149,999 | 9 | 14.5% |
| $150,000 to $199,999 | 0 | 0.0% |
| $200,000+ | 0 | 0.0% |
Household Income by Householder Age in Rockland
The median household income in Rockland is $49,000, with the highest median household income of $65,313 found in the 65+ years age bracket for the primary householder. A total of 27 households (43.5%) fall into this category.
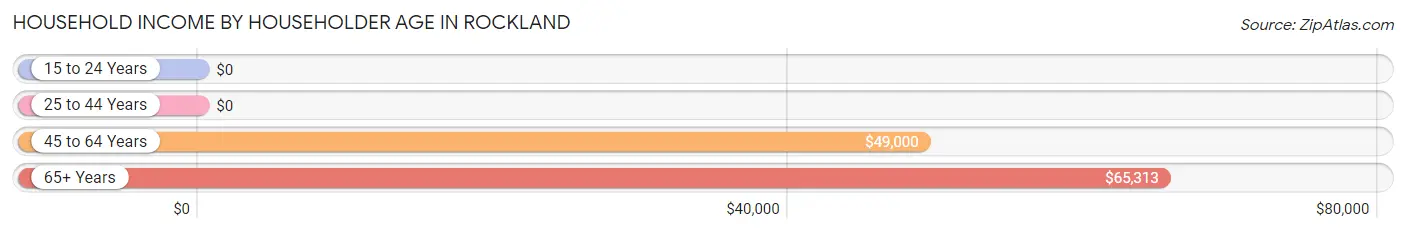
| Income Bracket | # Households | Median Income |
| 15 to 24 Years | 0 (0.0%) | $0 |
| 25 to 44 Years | 15 (24.2%) | $0 |
| 45 to 64 Years | 20 (32.3%) | $49,000 |
| 65+ Years | 27 (43.5%) | $65,313 |
| Total | 62 (100.0%) | $49,000 |
Poverty in Rockland
Income Below Poverty by Sex and Age in Rockland
With 15.9% poverty level for males and 25.0% for females among the residents of Rockland, 6 to 11 year old males and 5 year old females are the most vulnerable to poverty, with 5 males (100.0%) and 4 females (100.0%) in their respective age groups living below the poverty level.
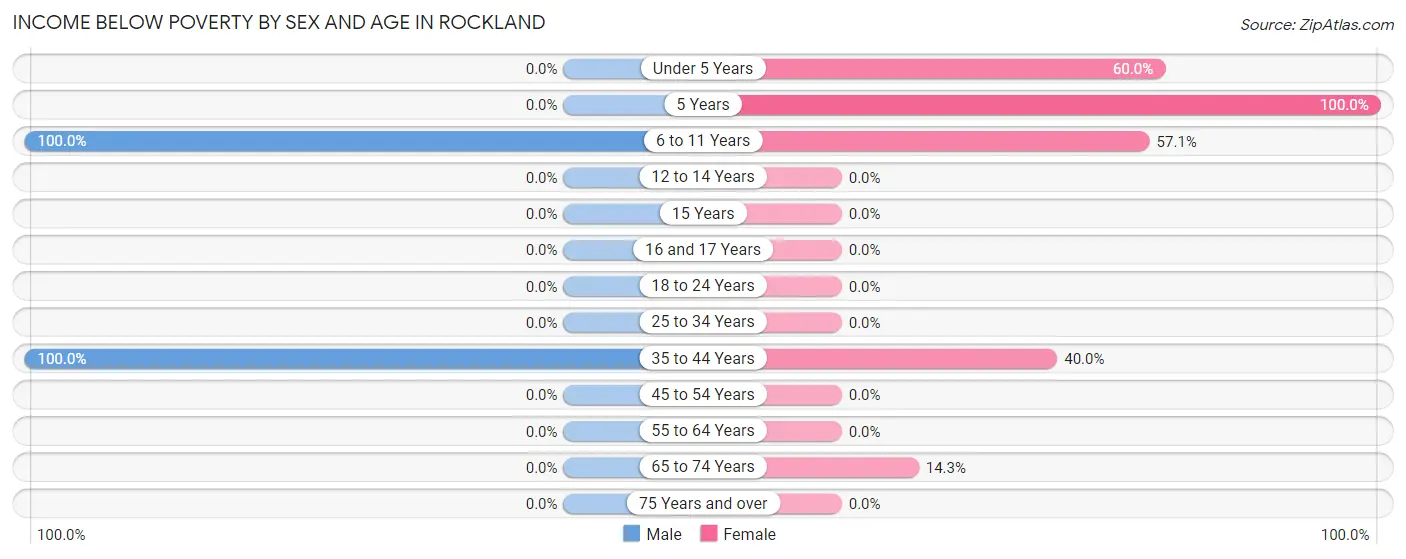
| Age Bracket | Male | Female |
| Under 5 Years | 0 (0.0%) | 3 (60.0%) |
| 5 Years | 0 (0.0%) | 4 (100.0%) |
| 6 to 11 Years | 5 (100.0%) | 8 (57.1%) |
| 12 to 14 Years | 0 (0.0%) | 0 (0.0%) |
| 15 Years | 0 (0.0%) | 0 (0.0%) |
| 16 and 17 Years | 0 (0.0%) | 0 (0.0%) |
| 18 to 24 Years | 0 (0.0%) | 0 (0.0%) |
| 25 to 34 Years | 0 (0.0%) | 0 (0.0%) |
| 35 to 44 Years | 5 (100.0%) | 4 (40.0%) |
| 45 to 54 Years | 0 (0.0%) | 0 (0.0%) |
| 55 to 64 Years | 0 (0.0%) | 0 (0.0%) |
| 65 to 74 Years | 0 (0.0%) | 3 (14.3%) |
| 75 Years and over | 0 (0.0%) | 0 (0.0%) |
| Total | 10 (15.9%) | 22 (25.0%) |
Income Above Poverty by Sex and Age in Rockland
According to the poverty statistics in Rockland, males aged 12 to 14 years and females aged 15 years are the age groups that are most secure financially, with 100.0% of males and 100.0% of females in these age groups living above the poverty line.
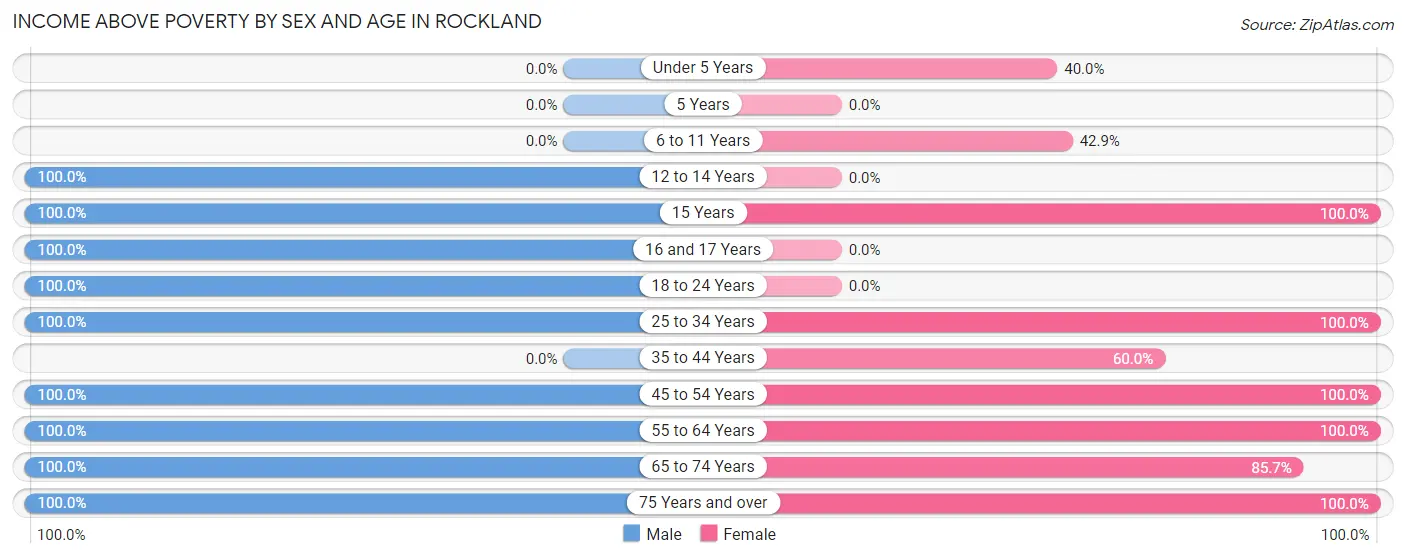
| Age Bracket | Male | Female |
| Under 5 Years | 0 (0.0%) | 2 (40.0%) |
| 5 Years | 0 (0.0%) | 0 (0.0%) |
| 6 to 11 Years | 0 (0.0%) | 6 (42.9%) |
| 12 to 14 Years | 3 (100.0%) | 0 (0.0%) |
| 15 Years | 2 (100.0%) | 3 (100.0%) |
| 16 and 17 Years | 2 (100.0%) | 0 (0.0%) |
| 18 to 24 Years | 6 (100.0%) | 0 (0.0%) |
| 25 to 34 Years | 3 (100.0%) | 7 (100.0%) |
| 35 to 44 Years | 0 (0.0%) | 6 (60.0%) |
| 45 to 54 Years | 5 (100.0%) | 1 (100.0%) |
| 55 to 64 Years | 7 (100.0%) | 22 (100.0%) |
| 65 to 74 Years | 21 (100.0%) | 18 (85.7%) |
| 75 Years and over | 4 (100.0%) | 1 (100.0%) |
| Total | 53 (84.1%) | 66 (75.0%) |
Income Below Poverty Among Married-Couple Families in Rockland
The poverty statistics for married-couple families in Rockland show that 8.7% or 4 of the total 46 families live below the poverty line. Families with 5 or more children have the highest poverty rate of 100.0%, comprising of 4 families. On the other hand, families with no children have the lowest poverty rate of 0.0%, which includes 0 families.
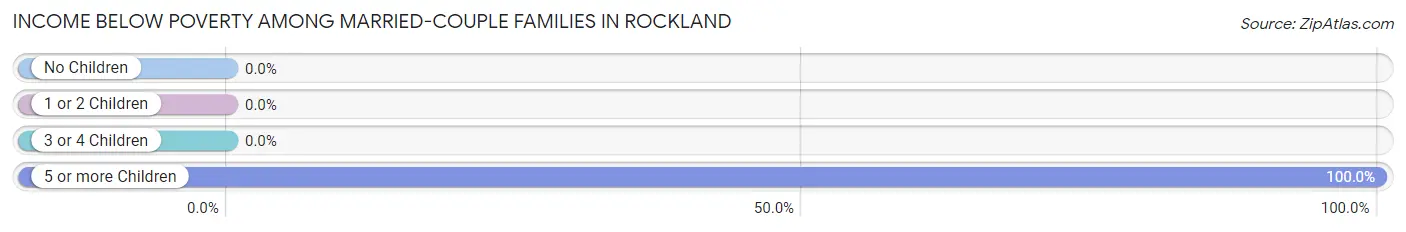
| Children | Above Poverty | Below Poverty |
| No Children | 36 (100.0%) | 0 (0.0%) |
| 1 or 2 Children | 3 (100.0%) | 0 (0.0%) |
| 3 or 4 Children | 3 (100.0%) | 0 (0.0%) |
| 5 or more Children | 0 (0.0%) | 4 (100.0%) |
| Total | 42 (91.3%) | 4 (8.7%) |
Income Below Poverty Among Single-Parent Households in Rockland
| Children | Single Father | Single Mother |
| No Children | 0 (0.0%) | 0 (0.0%) |
| 1 or 2 Children | 0 (0.0%) | 0 (0.0%) |
| 3 or 4 Children | 0 (0.0%) | 0 (0.0%) |
| 5 or more Children | 0 (0.0%) | 0 (0.0%) |
| Total | 0 (0.0%) | 0 (0.0%) |
Income Below Poverty Among Married-Couple vs Single-Parent Households in Rockland
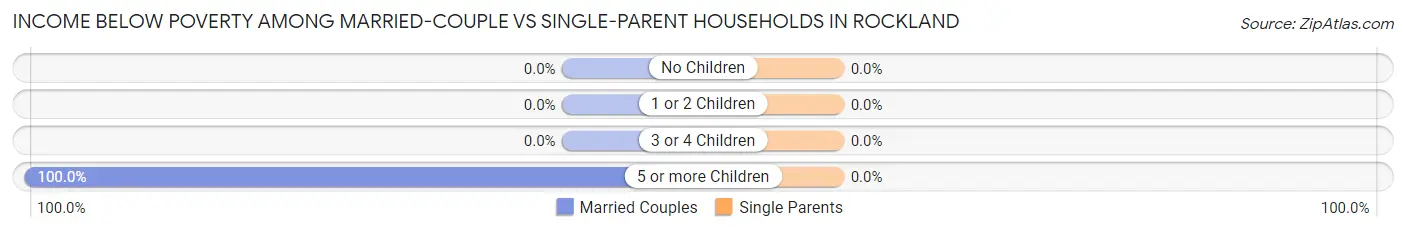
| Children | Married-Couple Families | Single-Parent Households |
| No Children | 0 (0.0%) | 0 (0.0%) |
| 1 or 2 Children | 0 (0.0%) | 0 (0.0%) |
| 3 or 4 Children | 0 (0.0%) | 0 (0.0%) |
| 5 or more Children | 4 (100.0%) | 0 (0.0%) |
| Total | 4 (8.7%) | 0 (0.0%) |
Race in Rockland
The most populous races in Rockland are White / Caucasian (148 | 98.0%), Hispanic or Latino (3 | 2.0%), and Two or more Races (3 | 2.0%).
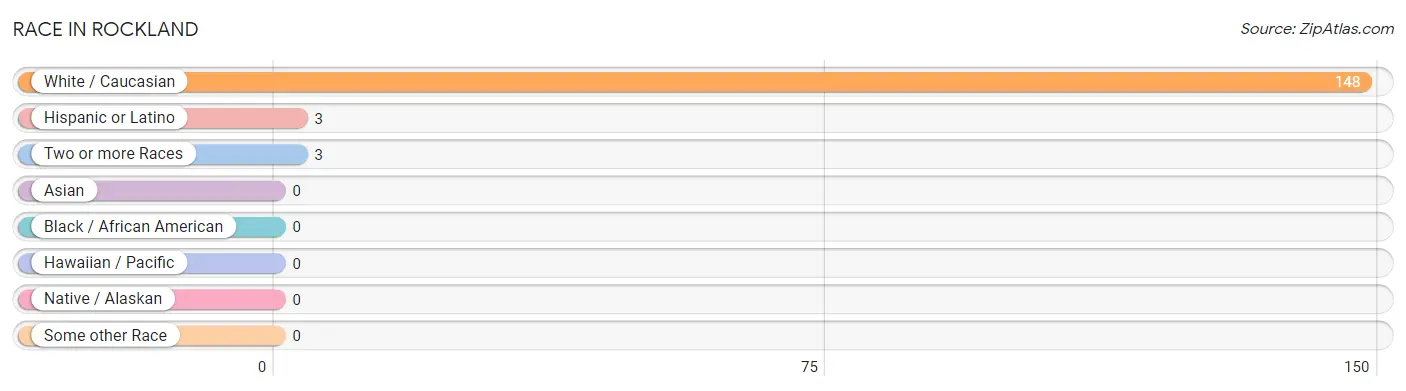
| Race | # Population | % Population |
| Asian | 0 | 0.0% |
| Black / African American | 0 | 0.0% |
| Hawaiian / Pacific | 0 | 0.0% |
| Hispanic or Latino | 3 | 2.0% |
| Native / Alaskan | 0 | 0.0% |
| White / Caucasian | 148 | 98.0% |
| Two or more Races | 3 | 2.0% |
| Some other Race | 0 | 0.0% |
| Total | 151 | 100.0% |
Ancestry in Rockland
The most populous ancestries reported in Rockland are English (61 | 40.4%), German (56 | 37.1%), Irish (19 | 12.6%), American (18 | 11.9%), and Swiss (17 | 11.3%), together accounting for 113.3% of all Rockland residents.
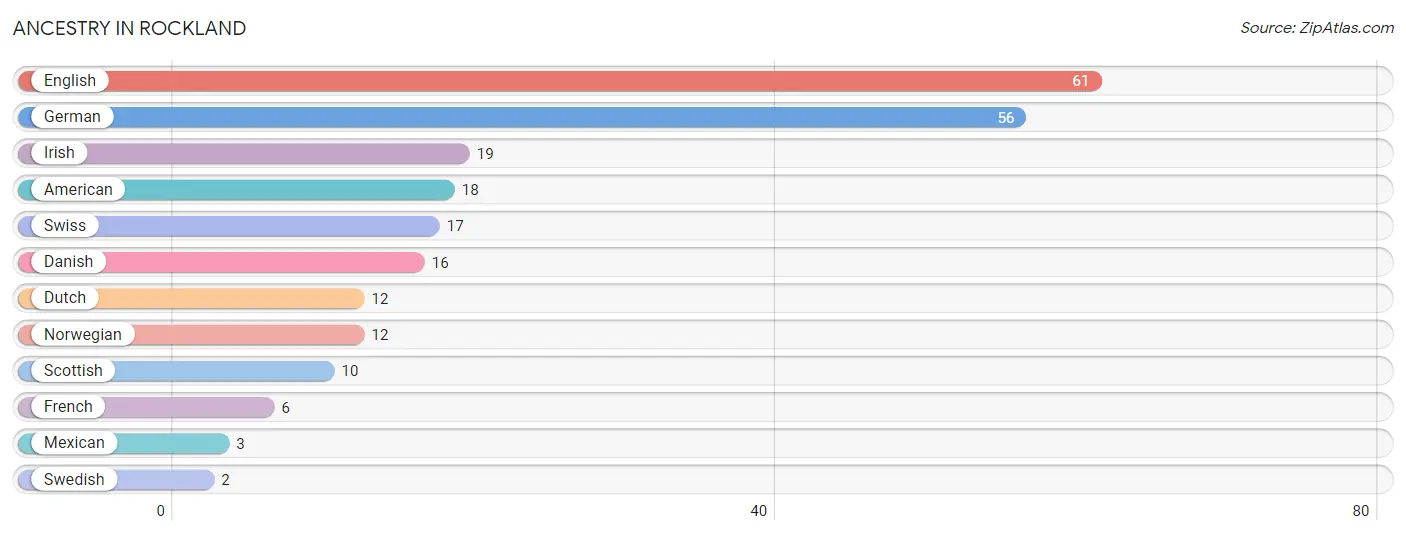
| Ancestry | # Population | % Population |
| American | 18 | 11.9% |
| Danish | 16 | 10.6% |
| Dutch | 12 | 8.0% |
| English | 61 | 40.4% |
| French | 6 | 4.0% |
| German | 56 | 37.1% |
| Irish | 19 | 12.6% |
| Mexican | 3 | 2.0% |
| Norwegian | 12 | 8.0% |
| Scottish | 10 | 6.6% |
| Swedish | 2 | 1.3% |
| Swiss | 17 | 11.3% | View All 12 Rows |
Immigrants in Rockland

| Immigration Origin | # Population | % Population | View All 0 Rows |
Sex and Age in Rockland
Sex and Age in Rockland
The most populous age groups in Rockland are 65 to 69 Years (12 | 19.1%) for men and 65 to 69 Years (16 | 18.2%) for women.
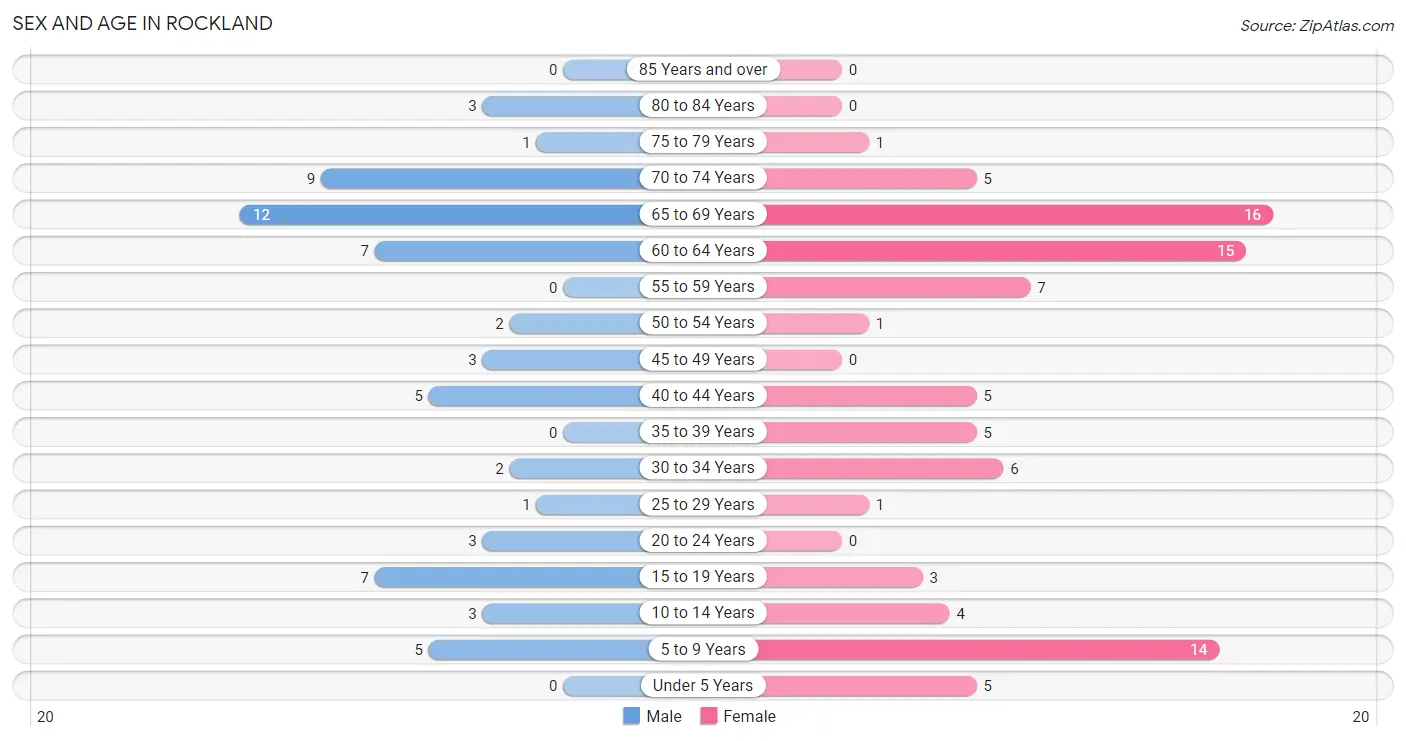
| Age Bracket | Male | Female |
| Under 5 Years | 0 (0.0%) | 5 (5.7%) |
| 5 to 9 Years | 5 (7.9%) | 14 (15.9%) |
| 10 to 14 Years | 3 (4.8%) | 4 (4.5%) |
| 15 to 19 Years | 7 (11.1%) | 3 (3.4%) |
| 20 to 24 Years | 3 (4.8%) | 0 (0.0%) |
| 25 to 29 Years | 1 (1.6%) | 1 (1.1%) |
| 30 to 34 Years | 2 (3.2%) | 6 (6.8%) |
| 35 to 39 Years | 0 (0.0%) | 5 (5.7%) |
| 40 to 44 Years | 5 (7.9%) | 5 (5.7%) |
| 45 to 49 Years | 3 (4.8%) | 0 (0.0%) |
| 50 to 54 Years | 2 (3.2%) | 1 (1.1%) |
| 55 to 59 Years | 0 (0.0%) | 7 (8.0%) |
| 60 to 64 Years | 7 (11.1%) | 15 (17.1%) |
| 65 to 69 Years | 12 (19.1%) | 16 (18.2%) |
| 70 to 74 Years | 9 (14.3%) | 5 (5.7%) |
| 75 to 79 Years | 1 (1.6%) | 1 (1.1%) |
| 80 to 84 Years | 3 (4.8%) | 0 (0.0%) |
| 85 Years and over | 0 (0.0%) | 0 (0.0%) |
| Total | 63 (100.0%) | 88 (100.0%) |
Families and Households in Rockland
Median Family Size in Rockland
The median family size in Rockland is 2.71 persons per family, with married-couple families (46 | 88.5%) accounting for the largest median family size of 2.8 persons per family. On the other hand, single female/mother families (4 | 7.7%) represent the smallest median family size with 1.75 persons per family.
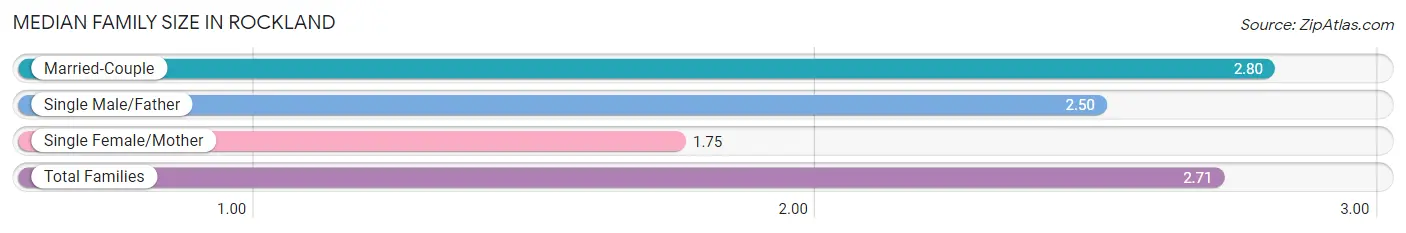
| Family Type | # Families | Family Size |
| Married-Couple | 46 (88.5%) | 2.80 |
| Single Male/Father | 2 (3.8%) | 2.50 |
| Single Female/Mother | 4 (7.7%) | 1.75 |
| Total Families | 52 (100.0%) | 2.71 |
Median Household Size in Rockland
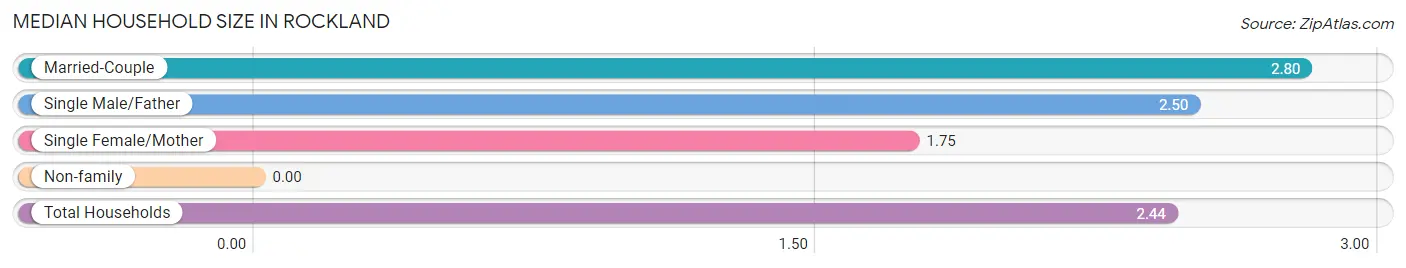
| Household Type | # Households | Household Size |
| Married-Couple | 46 (74.2%) | 2.80 |
| Single Male/Father | 2 (3.2%) | 2.50 |
| Single Female/Mother | 4 (6.5%) | 1.75 |
| Non-family | 10 (16.1%) | - |
| Total Households | 62 (100.0%) | 2.44 |
Household Size by Marriage Status in Rockland
Out of a total of 62 households in Rockland, 52 (83.9%) are family households, while 10 (16.1%) are nonfamily households. The most numerous type of family households are 2-person households, comprising 42, and the most common type of nonfamily households are 1-person households, comprising 10.
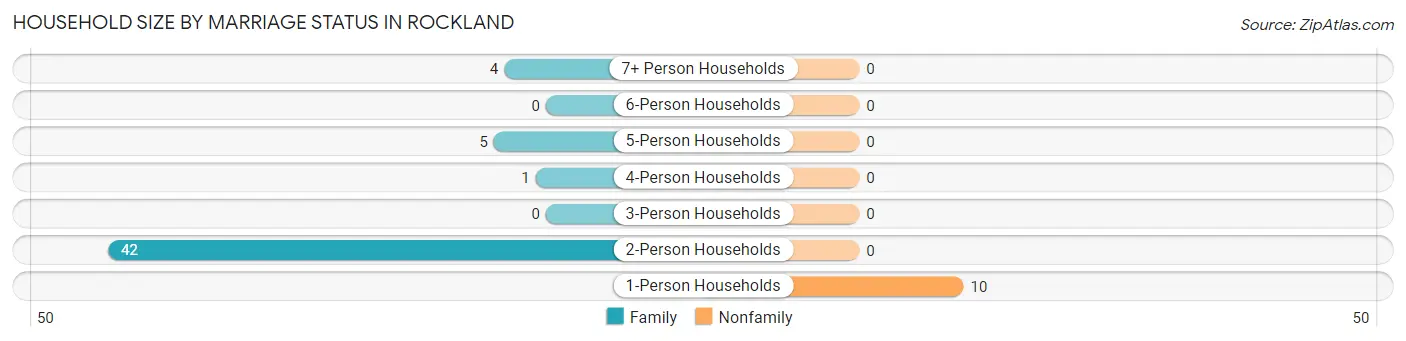
| Household Size | Family Households | Nonfamily Households |
| 1-Person Households | - | 10 (16.1%) |
| 2-Person Households | 42 (67.7%) | 0 (0.0%) |
| 3-Person Households | 0 (0.0%) | 0 (0.0%) |
| 4-Person Households | 1 (1.6%) | 0 (0.0%) |
| 5-Person Households | 5 (8.1%) | 0 (0.0%) |
| 6-Person Households | 0 (0.0%) | 0 (0.0%) |
| 7+ Person Households | 4 (6.5%) | 0 (0.0%) |
| Total | 52 (83.9%) | 10 (16.1%) |
Female Fertility in Rockland
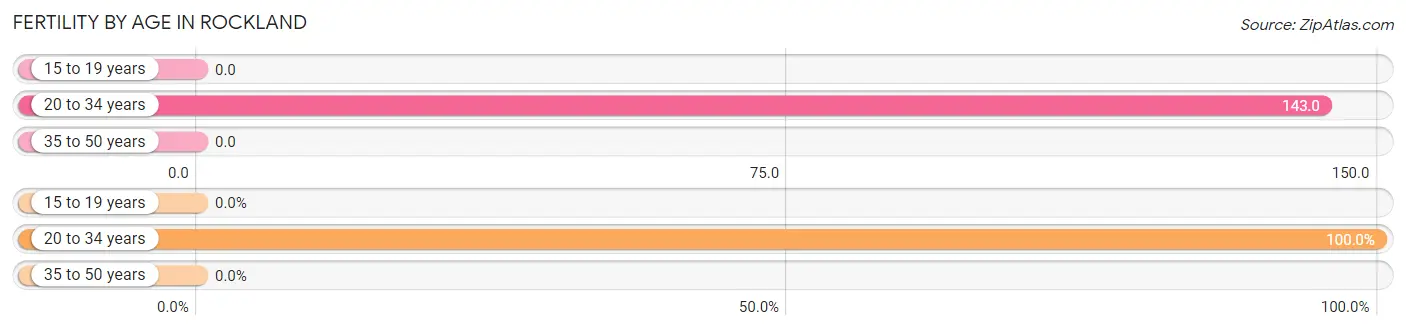
Fertility by Age in Rockland
Average fertility rate in Rockland is 50.0 births per 1,000 women. Women in the age bracket of 20 to 34 years have the highest fertility rate with 143.0 births per 1,000 women. Women in the age bracket of 20 to 34 years acount for 100.0% of all women with births.
| Age Bracket | Women with Births | Births / 1,000 Women |
| 15 to 19 years | 0 (0.0%) | 0.0 |
| 20 to 34 years | 1 (100.0%) | 143.0 |
| 35 to 50 years | 0 (0.0%) | 0.0 |
| Total | 1 (100.0%) | 50.0 |
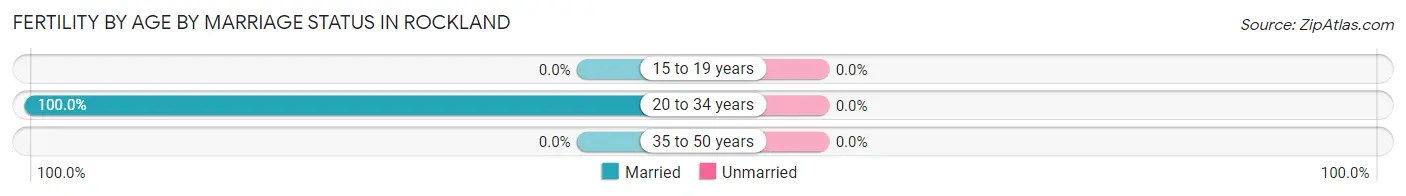
Fertility by Age by Marriage Status in Rockland
| Age Bracket | Married | Unmarried |
| 15 to 19 years | 0 (0.0%) | 0 (0.0%) |
| 20 to 34 years | 1 (100.0%) | 0 (0.0%) |
| 35 to 50 years | 0 (0.0%) | 0 (0.0%) |
| Total | 1 (100.0%) | 0 (0.0%) |
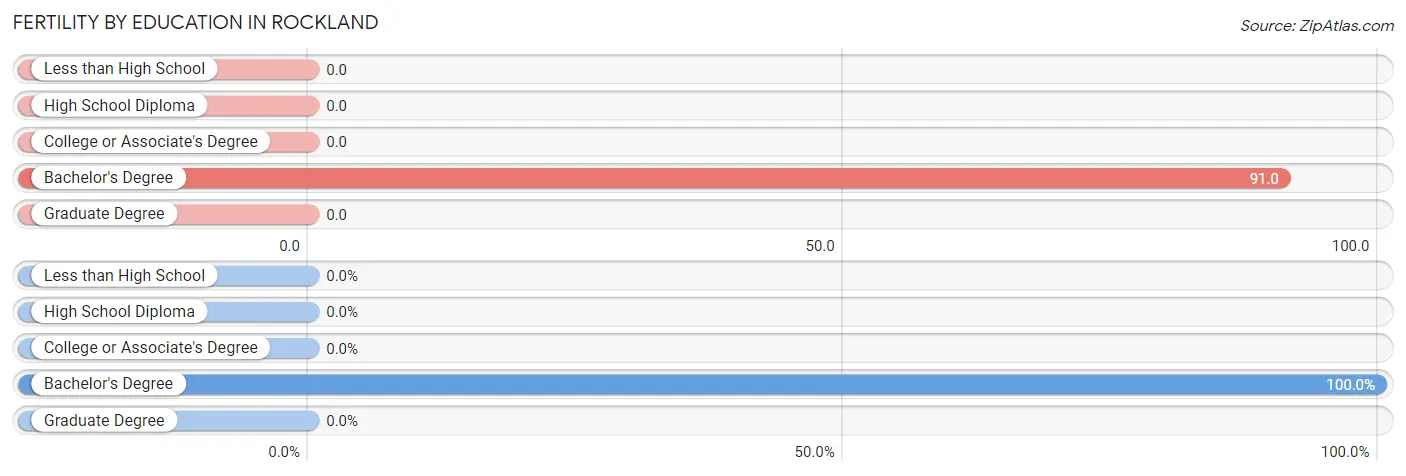
Fertility by Education in Rockland
| Educational Attainment | Women with Births | Births / 1,000 Women |
| Less than High School | 0 (0.0%) | 0.0 |
| High School Diploma | 0 (0.0%) | 0.0 |
| College or Associate's Degree | 0 (0.0%) | 0.0 |
| Bachelor's Degree | 1 (100.0%) | 91.0 |
| Graduate Degree | 0 (0.0%) | 0.0 |
| Total | 1 (100.0%) | 50.0 |
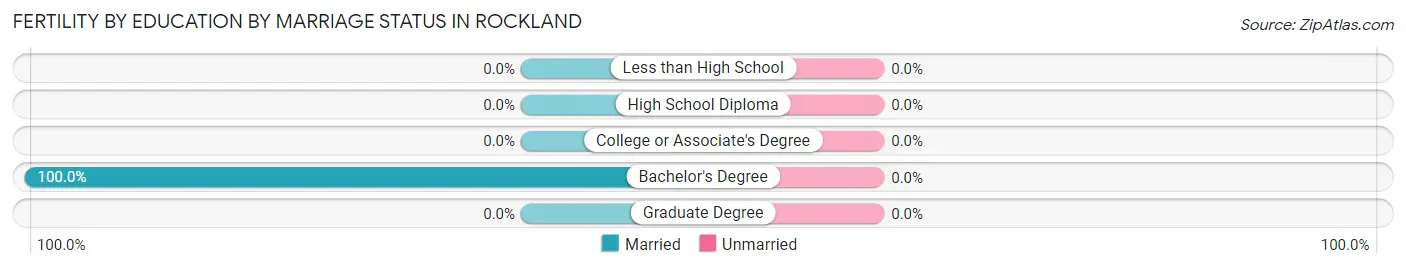
Fertility by Education by Marriage Status in Rockland
| Educational Attainment | Married | Unmarried |
| Less than High School | 0 (0.0%) | 0 (0.0%) |
| High School Diploma | 0 (0.0%) | 0 (0.0%) |
| College or Associate's Degree | 0 (0.0%) | 0 (0.0%) |
| Bachelor's Degree | 1 (100.0%) | 0 (0.0%) |
| Graduate Degree | 0 (0.0%) | 0 (0.0%) |
| Total | 1 (100.0%) | 0 (0.0%) |
Employment Characteristics in Rockland
Employment by Class of Employer in Rockland
Among the 57 employed individuals in Rockland, private company employees (24 | 42.1%), local government employees (16 | 28.1%), and self-employed (not incorporated) (6 | 10.5%) make up the most common classes of employment.
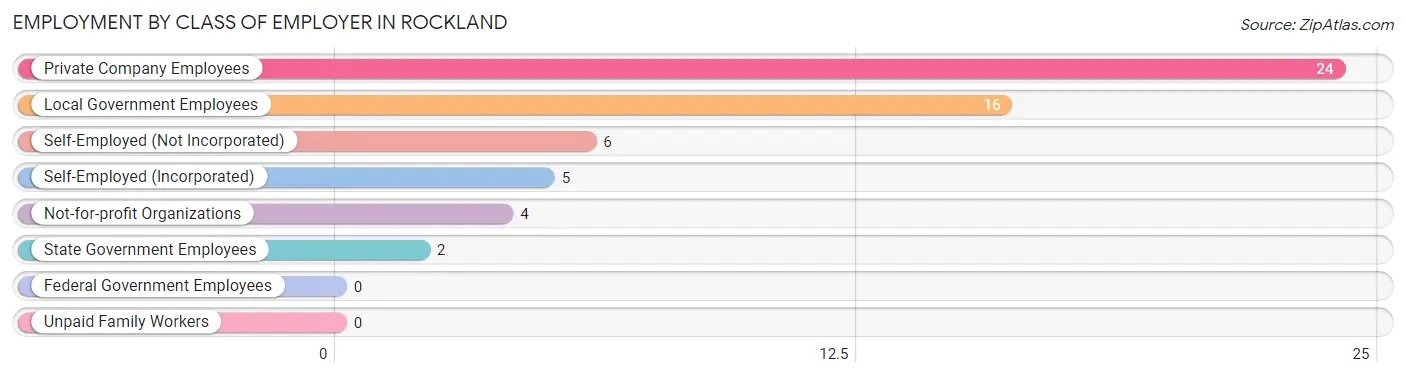
| Employer Class | # Employees | % Employees |
| Private Company Employees | 24 | 42.1% |
| Self-Employed (Incorporated) | 5 | 8.8% |
| Self-Employed (Not Incorporated) | 6 | 10.5% |
| Not-for-profit Organizations | 4 | 7.0% |
| Local Government Employees | 16 | 28.1% |
| State Government Employees | 2 | 3.5% |
| Federal Government Employees | 0 | 0.0% |
| Unpaid Family Workers | 0 | 0.0% |
| Total | 57 | 100.0% |
Employment Status by Age in Rockland
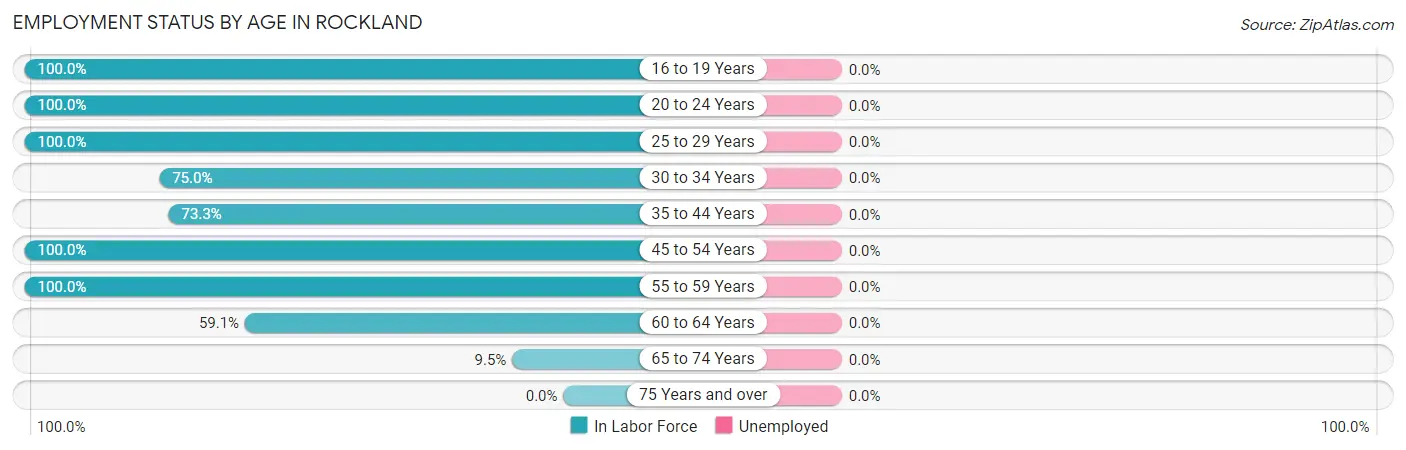
| Age Bracket | In Labor Force | Unemployed |
| 16 to 19 Years | 5 (100.0%) | 0 (0.0%) |
| 20 to 24 Years | 3 (100.0%) | 0 (0.0%) |
| 25 to 29 Years | 2 (100.0%) | 0 (0.0%) |
| 30 to 34 Years | 6 (75.0%) | 0 (0.0%) |
| 35 to 44 Years | 11 (73.3%) | 0 (0.0%) |
| 45 to 54 Years | 6 (100.0%) | 0 (0.0%) |
| 55 to 59 Years | 7 (100.0%) | 0 (0.0%) |
| 60 to 64 Years | 13 (59.1%) | 0 (0.0%) |
| 65 to 74 Years | 4 (9.5%) | 0 (0.0%) |
| 75 Years and over | 0 (0.0%) | 0 (0.0%) |
| Total | 57 (49.6%) | 0 (0.0%) |
Employment Status by Educational Attainment in Rockland
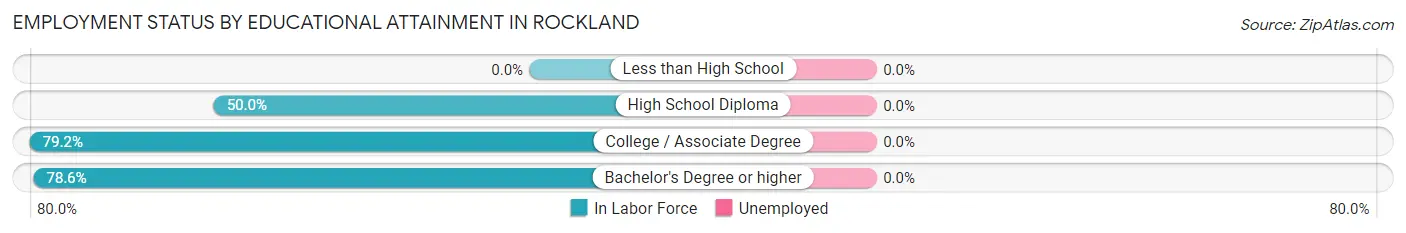
| Educational Attainment | In Labor Force | Unemployed |
| Less than High School | 0 (0.0%) | 0 (0.0%) |
| High School Diploma | 4 (50.0%) | 0 (0.0%) |
| College / Associate Degree | 19 (79.2%) | 0 (0.0%) |
| Bachelor's Degree or higher | 22 (78.6%) | 0 (0.0%) |
| Total | 45 (75.0%) | 0 (0.0%) |
Employment Occupations by Sex in Rockland
Management, Business, Science and Arts Occupations
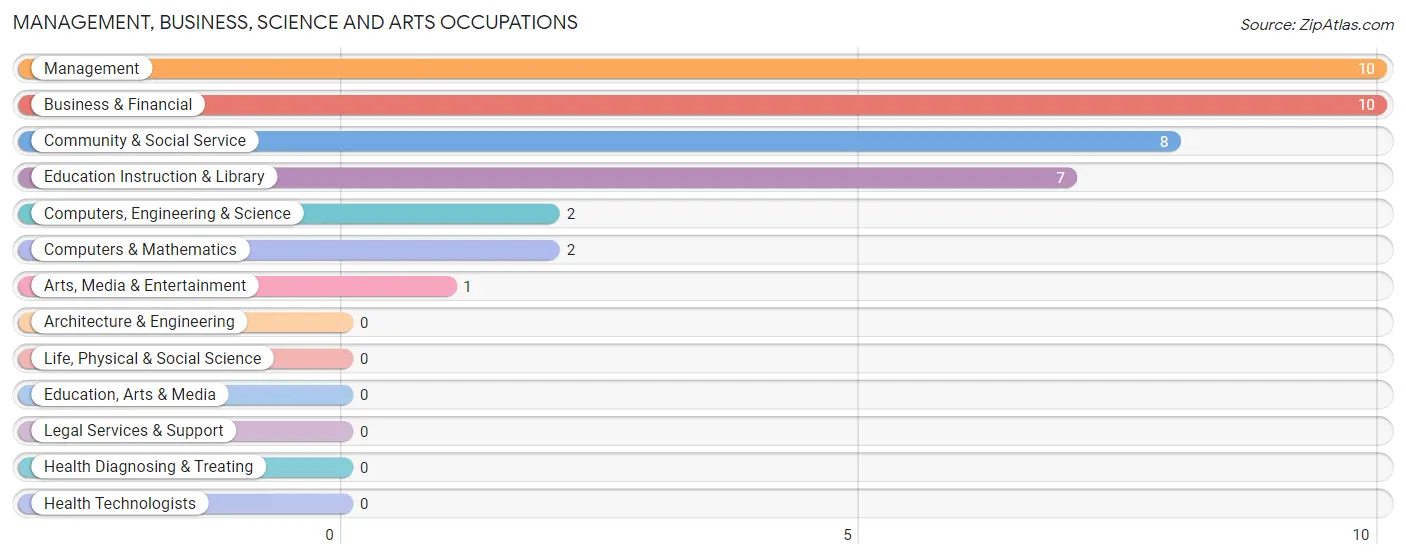
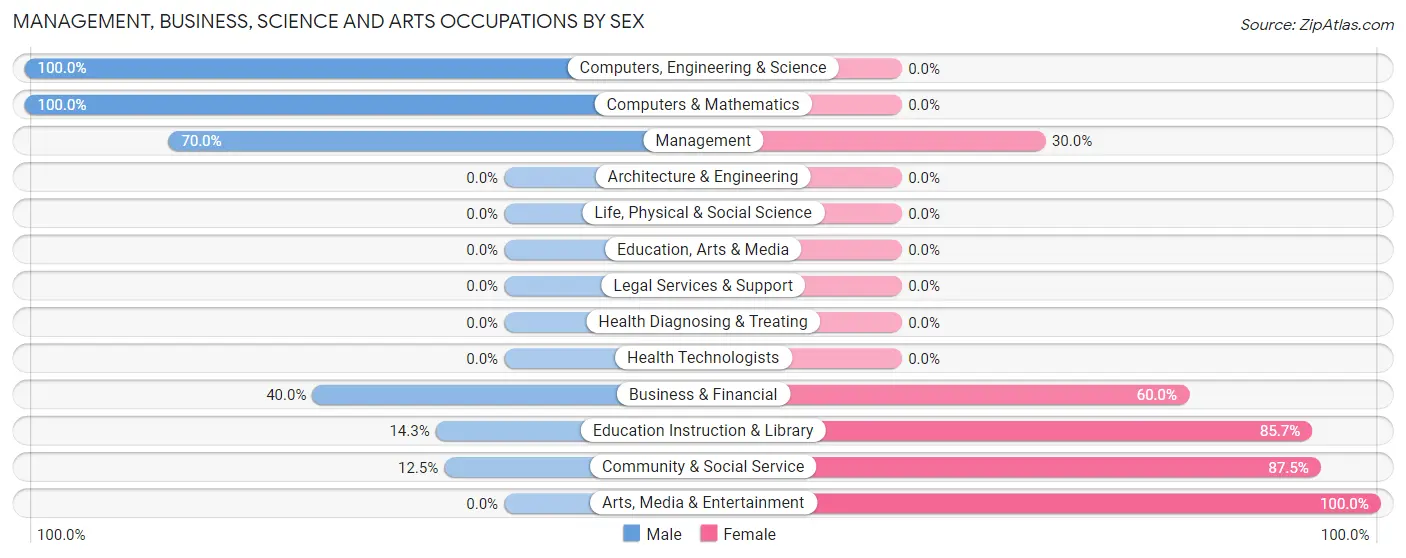
The most common Management, Business, Science and Arts occupations in Rockland are Management (10 | 17.5%), Business & Financial (10 | 17.5%), Community & Social Service (8 | 14.0%), Education Instruction & Library (7 | 12.3%), and Computers, Engineering & Science (2 | 3.5%).
Management, Business, Science and Arts Occupations by Sex
Within the Management, Business, Science and Arts occupations in Rockland, the most male-oriented occupations are Computers, Engineering & Science (100.0%), Computers & Mathematics (100.0%), and Management (70.0%), while the most female-oriented occupations are Arts, Media & Entertainment (100.0%), Community & Social Service (87.5%), and Education Instruction & Library (85.7%).
| Occupation | Male | Female |
| Management | 7 (70.0%) | 3 (30.0%) |
| Business & Financial | 4 (40.0%) | 6 (60.0%) |
| Computers, Engineering & Science | 2 (100.0%) | 0 (0.0%) |
| Computers & Mathematics | 2 (100.0%) | 0 (0.0%) |
| Architecture & Engineering | 0 (0.0%) | 0 (0.0%) |
| Life, Physical & Social Science | 0 (0.0%) | 0 (0.0%) |
| Community & Social Service | 1 (12.5%) | 7 (87.5%) |
| Education, Arts & Media | 0 (0.0%) | 0 (0.0%) |
| Legal Services & Support | 0 (0.0%) | 0 (0.0%) |
| Education Instruction & Library | 1 (14.3%) | 6 (85.7%) |
| Arts, Media & Entertainment | 0 (0.0%) | 1 (100.0%) |
| Health Diagnosing & Treating | 0 (0.0%) | 0 (0.0%) |
| Health Technologists | 0 (0.0%) | 0 (0.0%) |
| Total (Category) | 14 (46.7%) | 16 (53.3%) |
| Total (Overall) | 30 (52.6%) | 27 (47.4%) |
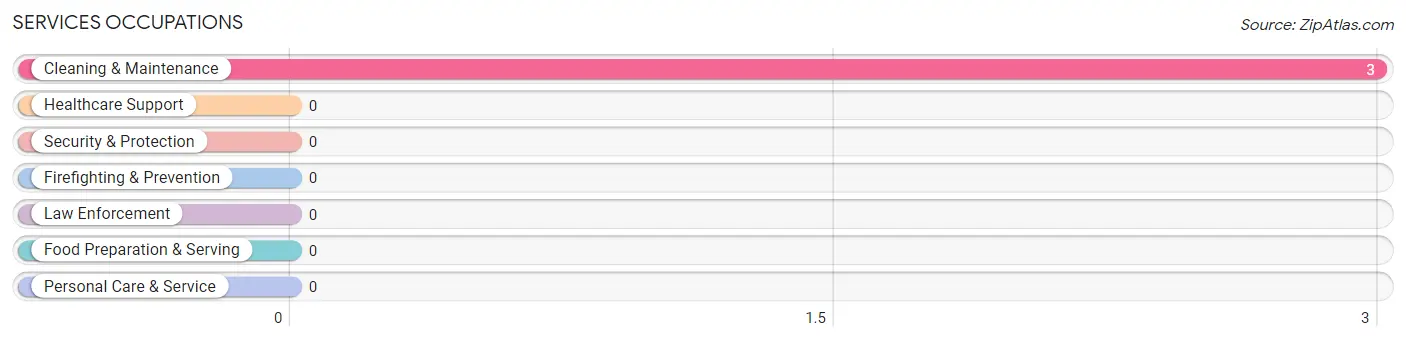
Services Occupations
The most common Services occupations in Rockland are , and Cleaning & Maintenance (3 | 5.3%).
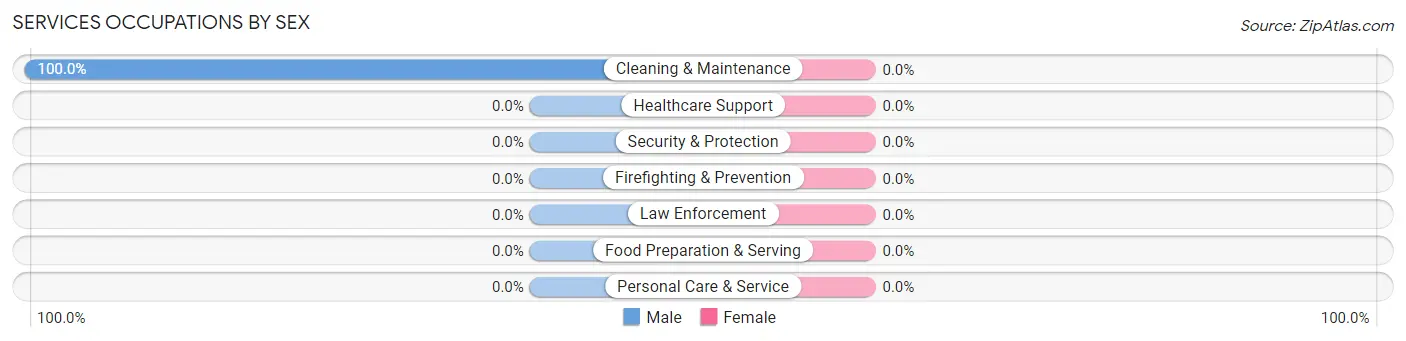
Services Occupations by Sex
| Occupation | Male | Female |
| Healthcare Support | 0 (0.0%) | 0 (0.0%) |
| Security & Protection | 0 (0.0%) | 0 (0.0%) |
| Firefighting & Prevention | 0 (0.0%) | 0 (0.0%) |
| Law Enforcement | 0 (0.0%) | 0 (0.0%) |
| Food Preparation & Serving | 0 (0.0%) | 0 (0.0%) |
| Cleaning & Maintenance | 3 (100.0%) | 0 (0.0%) |
| Personal Care & Service | 0 (0.0%) | 0 (0.0%) |
| Total (Category) | 3 (100.0%) | 0 (0.0%) |
| Total (Overall) | 30 (52.6%) | 27 (47.4%) |
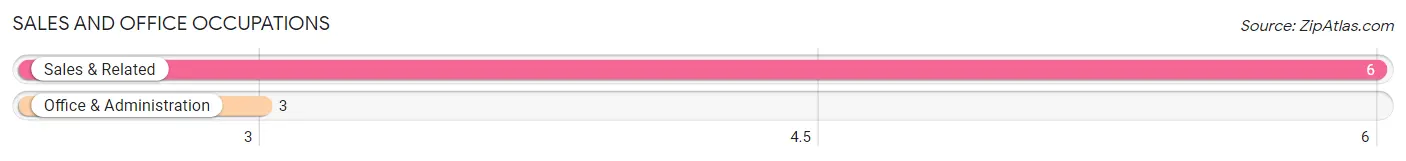
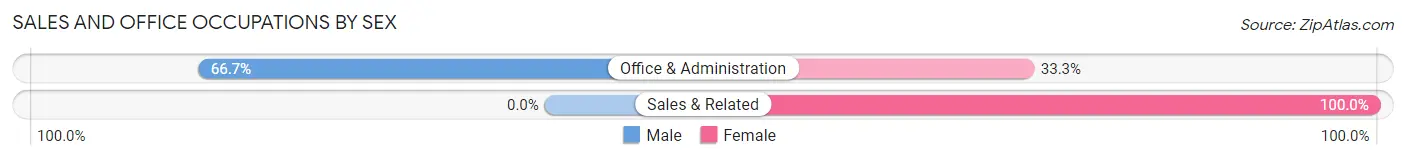
Sales and Office Occupations
The most common Sales and Office occupations in Rockland are Sales & Related (6 | 10.5%), and Office & Administration (3 | 5.3%).
Sales and Office Occupations by Sex
| Occupation | Male | Female |
| Sales & Related | 0 (0.0%) | 6 (100.0%) |
| Office & Administration | 2 (66.7%) | 1 (33.3%) |
| Total (Category) | 2 (22.2%) | 7 (77.8%) |
| Total (Overall) | 30 (52.6%) | 27 (47.4%) |
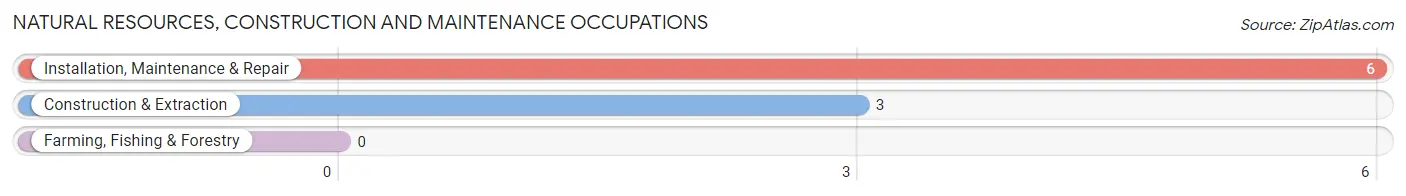
Natural Resources, Construction and Maintenance Occupations
The most common Natural Resources, Construction and Maintenance occupations in Rockland are Installation, Maintenance & Repair (6 | 10.5%), and Construction & Extraction (3 | 5.3%).
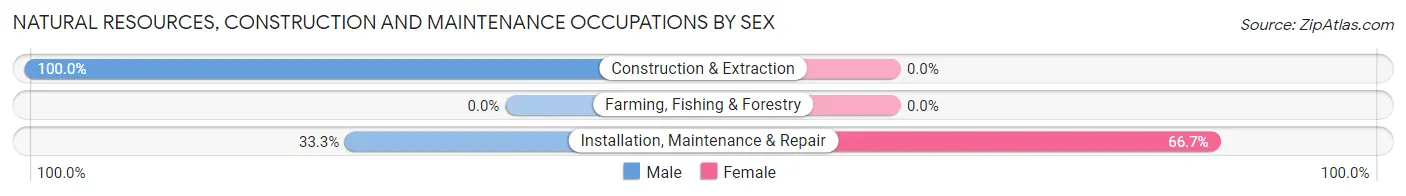
Natural Resources, Construction and Maintenance Occupations by Sex
| Occupation | Male | Female |
| Farming, Fishing & Forestry | 0 (0.0%) | 0 (0.0%) |
| Construction & Extraction | 3 (100.0%) | 0 (0.0%) |
| Installation, Maintenance & Repair | 2 (33.3%) | 4 (66.7%) |
| Total (Category) | 5 (55.6%) | 4 (44.4%) |
| Total (Overall) | 30 (52.6%) | 27 (47.4%) |
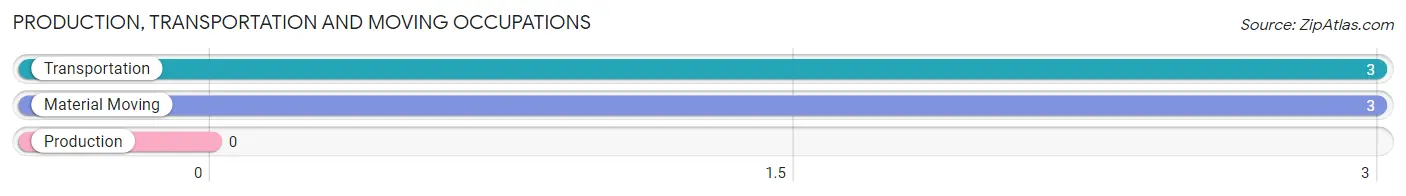
Production, Transportation and Moving Occupations
The most common Production, Transportation and Moving occupations in Rockland are Transportation (3 | 5.3%), and Material Moving (3 | 5.3%).
Production, Transportation and Moving Occupations by Sex
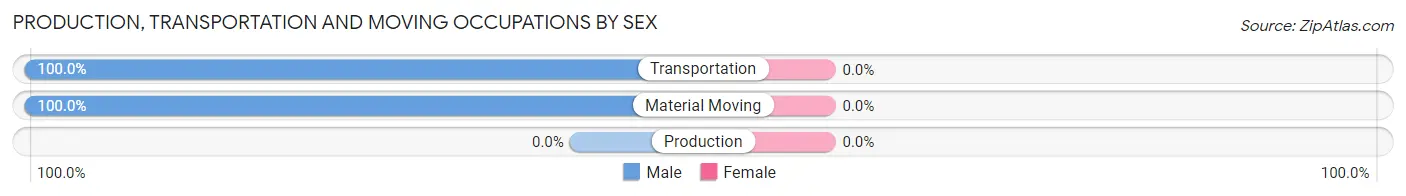
| Occupation | Male | Female |
| Production | 0 (0.0%) | 0 (0.0%) |
| Transportation | 3 (100.0%) | 0 (0.0%) |
| Material Moving | 3 (100.0%) | 0 (0.0%) |
| Total (Category) | 6 (100.0%) | 0 (0.0%) |
| Total (Overall) | 30 (52.6%) | 27 (47.4%) |
Employment Industries by Sex in Rockland
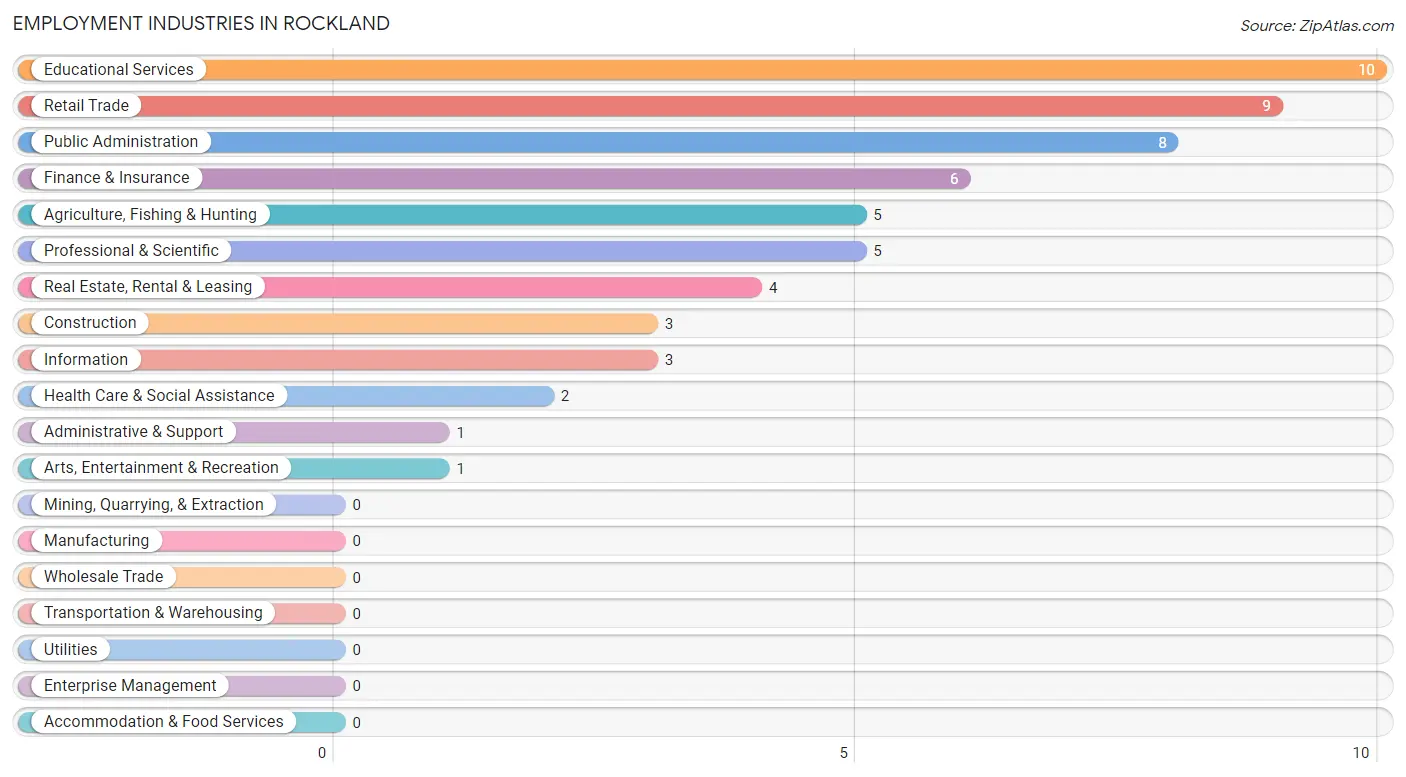
Employment Industries in Rockland
The major employment industries in Rockland include Educational Services (10 | 17.5%), Retail Trade (9 | 15.8%), Public Administration (8 | 14.0%), Finance & Insurance (6 | 10.5%), and Agriculture, Fishing & Hunting (5 | 8.8%).
Employment Industries by Sex in Rockland
The Rockland industries that see more men than women are Agriculture, Fishing & Hunting (100.0%), Construction (100.0%), and Information (100.0%), whereas the industries that tend to have a higher number of women are Finance & Insurance (100.0%), Arts, Entertainment & Recreation (100.0%), and Professional & Scientific (80.0%).
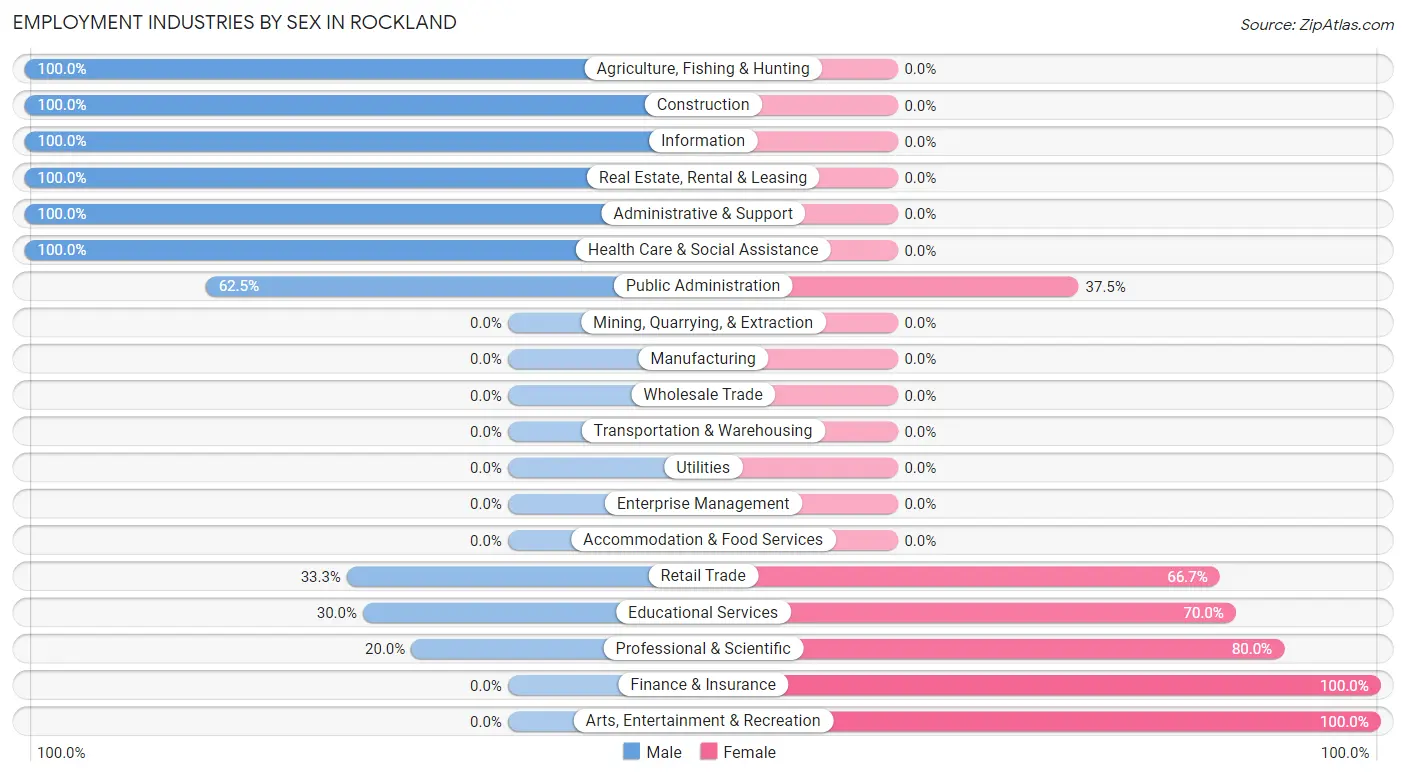
| Industry | Male | Female |
| Agriculture, Fishing & Hunting | 5 (100.0%) | 0 (0.0%) |
| Mining, Quarrying, & Extraction | 0 (0.0%) | 0 (0.0%) |
| Construction | 3 (100.0%) | 0 (0.0%) |
| Manufacturing | 0 (0.0%) | 0 (0.0%) |
| Wholesale Trade | 0 (0.0%) | 0 (0.0%) |
| Retail Trade | 3 (33.3%) | 6 (66.7%) |
| Transportation & Warehousing | 0 (0.0%) | 0 (0.0%) |
| Utilities | 0 (0.0%) | 0 (0.0%) |
| Information | 3 (100.0%) | 0 (0.0%) |
| Finance & Insurance | 0 (0.0%) | 6 (100.0%) |
| Real Estate, Rental & Leasing | 4 (100.0%) | 0 (0.0%) |
| Professional & Scientific | 1 (20.0%) | 4 (80.0%) |
| Enterprise Management | 0 (0.0%) | 0 (0.0%) |
| Administrative & Support | 1 (100.0%) | 0 (0.0%) |
| Educational Services | 3 (30.0%) | 7 (70.0%) |
| Health Care & Social Assistance | 2 (100.0%) | 0 (0.0%) |
| Arts, Entertainment & Recreation | 0 (0.0%) | 1 (100.0%) |
| Accommodation & Food Services | 0 (0.0%) | 0 (0.0%) |
| Public Administration | 5 (62.5%) | 3 (37.5%) |
| Total | 30 (52.6%) | 27 (47.4%) |
Education in Rockland
School Enrollment in Rockland
The most common levels of schooling among the 33 students in Rockland are elementary school (12 | 36.4%), high school (10 | 30.3%), and middle school (7 | 21.2%).
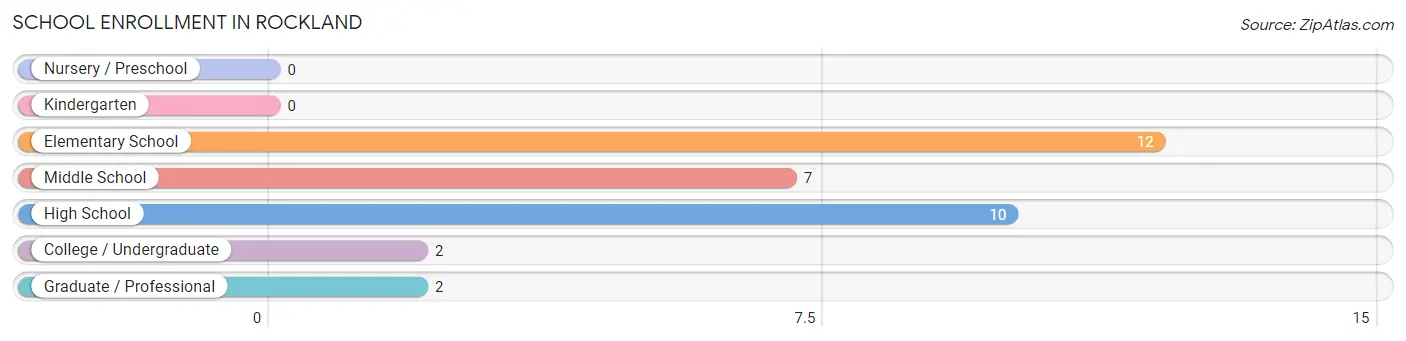
| School Level | # Students | % Students |
| Nursery / Preschool | 0 | 0.0% |
| Kindergarten | 0 | 0.0% |
| Elementary School | 12 | 36.4% |
| Middle School | 7 | 21.2% |
| High School | 10 | 30.3% |
| College / Undergraduate | 2 | 6.1% |
| Graduate / Professional | 2 | 6.1% |
| Total | 33 | 100.0% |
School Enrollment by Age by Funding Source in Rockland
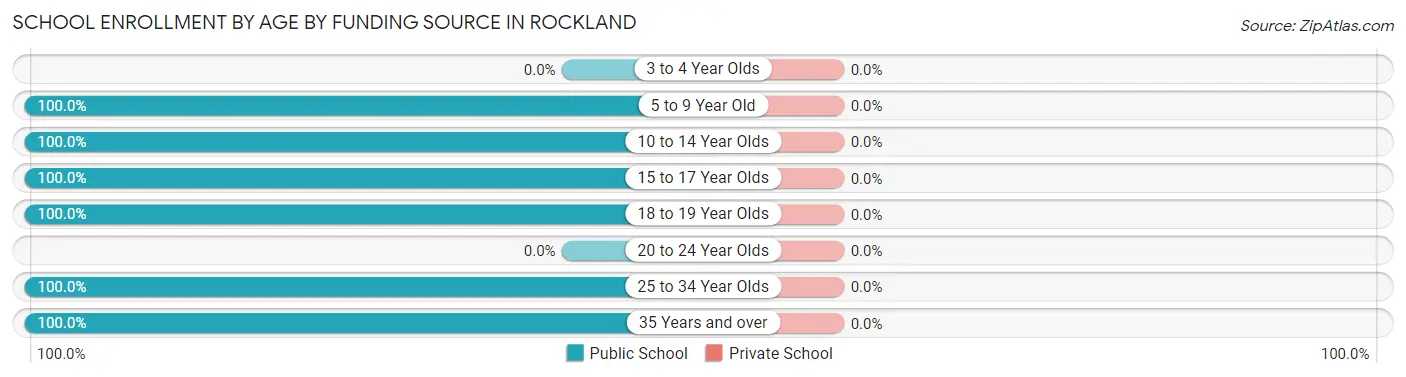
| Age Bracket | Public School | Private School |
| 3 to 4 Year Olds | 0 (0.0%) | 0 (0.0%) |
| 5 to 9 Year Old | 12 (100.0%) | 0 (0.0%) |
| 10 to 14 Year Olds | 7 (100.0%) | 0 (0.0%) |
| 15 to 17 Year Olds | 7 (100.0%) | 0 (0.0%) |
| 18 to 19 Year Olds | 3 (100.0%) | 0 (0.0%) |
| 20 to 24 Year Olds | 0 (0.0%) | 0 (0.0%) |
| 25 to 34 Year Olds | 2 (100.0%) | 0 (0.0%) |
| 35 Years and over | 2 (100.0%) | 0 (0.0%) |
| Total | 33 (100.0%) | 0 (0.0%) |
Educational Attainment by Field of Study in Rockland
Education (17 | 37.0%), business (11 | 23.9%), bio, nature & agricultural (7 | 15.2%), arts & humanities (7 | 15.2%), and science & technology (3 | 6.5%) are the most common fields of study among 46 individuals in Rockland who have obtained a bachelor's degree or higher.
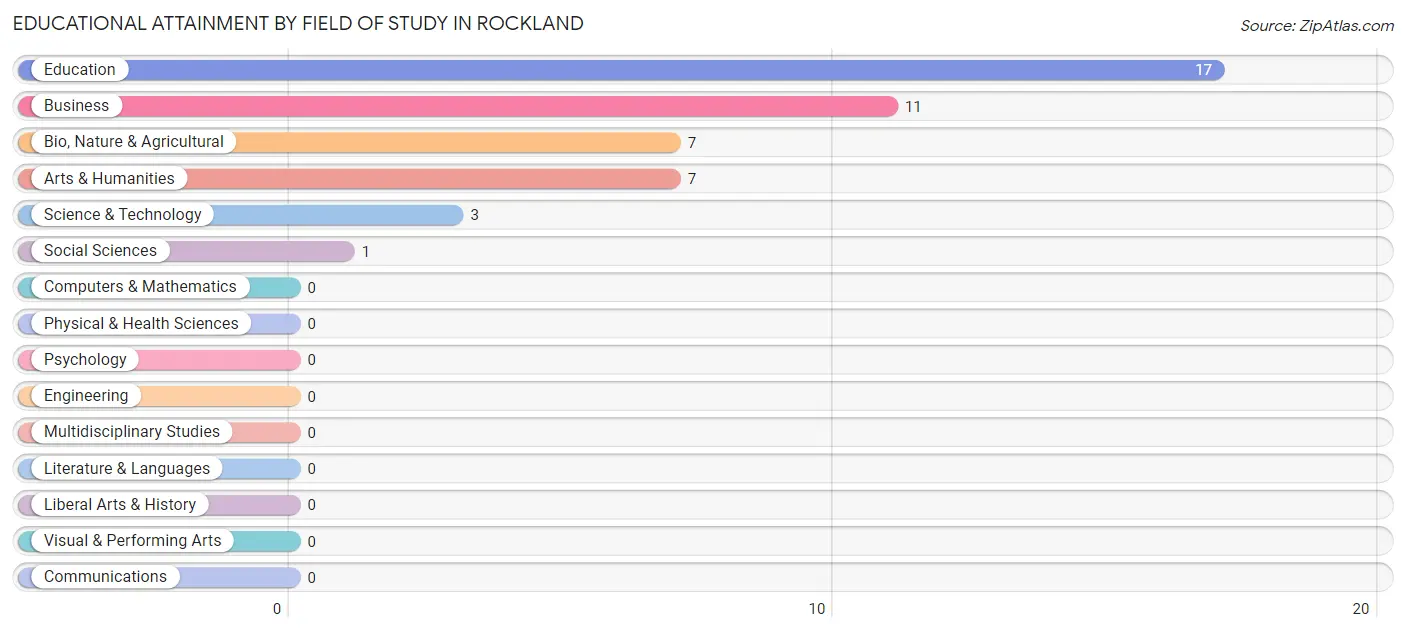
| Field of Study | # Graduates | % Graduates |
| Computers & Mathematics | 0 | 0.0% |
| Bio, Nature & Agricultural | 7 | 15.2% |
| Physical & Health Sciences | 0 | 0.0% |
| Psychology | 0 | 0.0% |
| Social Sciences | 1 | 2.2% |
| Engineering | 0 | 0.0% |
| Multidisciplinary Studies | 0 | 0.0% |
| Science & Technology | 3 | 6.5% |
| Business | 11 | 23.9% |
| Education | 17 | 37.0% |
| Literature & Languages | 0 | 0.0% |
| Liberal Arts & History | 0 | 0.0% |
| Visual & Performing Arts | 0 | 0.0% |
| Communications | 0 | 0.0% |
| Arts & Humanities | 7 | 15.2% |
| Total | 46 | 100.0% |
Transportation & Commute in Rockland
Vehicle Availability by Sex in Rockland
The most prevalent vehicle ownership categories in Rockland are males with 2 vehicles (15, accounting for 50.0%) and females with 2 vehicles (12, making up 55.6%).
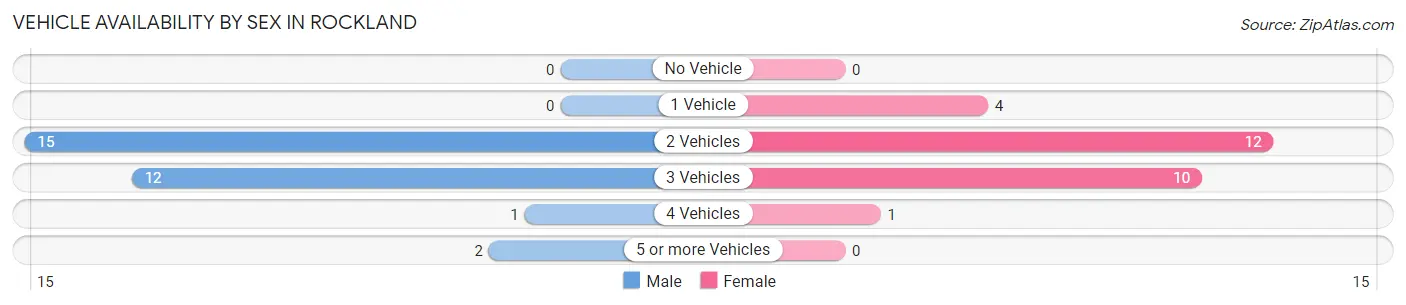
| Vehicles Available | Male | Female |
| No Vehicle | 0 (0.0%) | 0 (0.0%) |
| 1 Vehicle | 0 (0.0%) | 4 (14.8%) |
| 2 Vehicles | 15 (50.0%) | 12 (44.4%) |
| 3 Vehicles | 12 (40.0%) | 10 (37.0%) |
| 4 Vehicles | 1 (3.3%) | 1 (3.7%) |
| 5 or more Vehicles | 2 (6.7%) | 0 (0.0%) |
| Total | 30 (100.0%) | 27 (100.0%) |
Commute Time in Rockland
The most frequently occuring commute durations in Rockland are 5 to 9 minutes (17 commuters, 38.6%), less than 5 minutes (9 commuters, 20.4%), and 45 to 59 minutes (7 commuters, 15.9%).
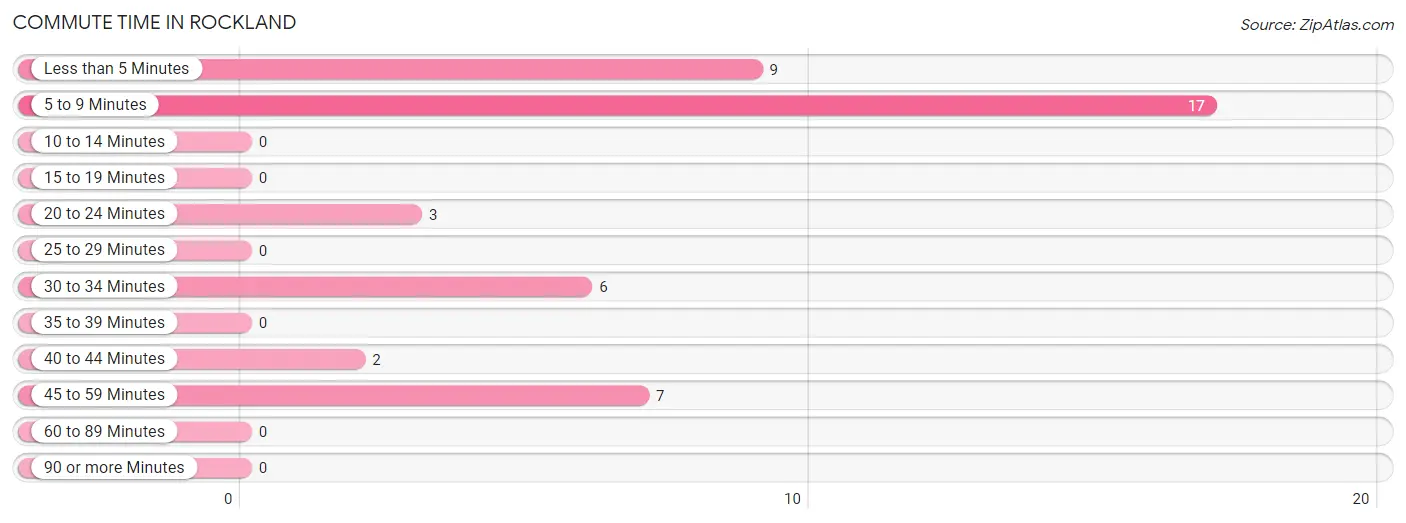
| Commute Time | # Commuters | % Commuters |
| Less than 5 Minutes | 9 | 20.4% |
| 5 to 9 Minutes | 17 | 38.6% |
| 10 to 14 Minutes | 0 | 0.0% |
| 15 to 19 Minutes | 0 | 0.0% |
| 20 to 24 Minutes | 3 | 6.8% |
| 25 to 29 Minutes | 0 | 0.0% |
| 30 to 34 Minutes | 6 | 13.6% |
| 35 to 39 Minutes | 0 | 0.0% |
| 40 to 44 Minutes | 2 | 4.5% |
| 45 to 59 Minutes | 7 | 15.9% |
| 60 to 89 Minutes | 0 | 0.0% |
| 90 or more Minutes | 0 | 0.0% |
Commute Time by Sex in Rockland
The most common commute times in Rockland are 5 to 9 minutes (14 commuters, 58.3%) for males and 45 to 59 minutes (7 commuters, 35.0%) for females.
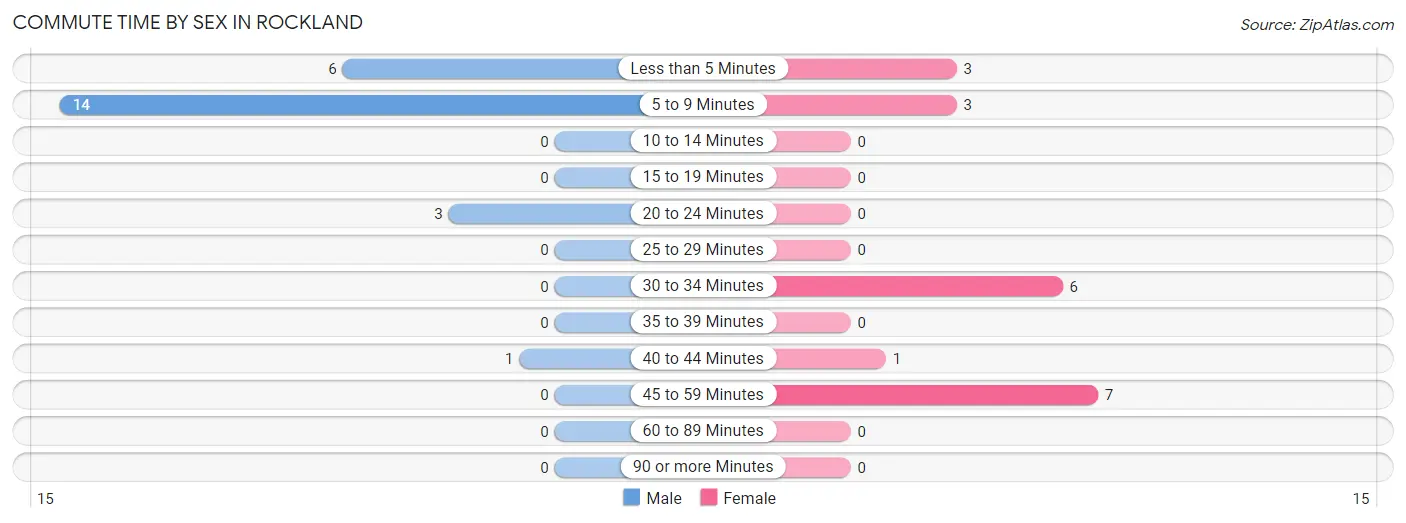
| Commute Time | Male | Female |
| Less than 5 Minutes | 6 (25.0%) | 3 (15.0%) |
| 5 to 9 Minutes | 14 (58.3%) | 3 (15.0%) |
| 10 to 14 Minutes | 0 (0.0%) | 0 (0.0%) |
| 15 to 19 Minutes | 0 (0.0%) | 0 (0.0%) |
| 20 to 24 Minutes | 3 (12.5%) | 0 (0.0%) |
| 25 to 29 Minutes | 0 (0.0%) | 0 (0.0%) |
| 30 to 34 Minutes | 0 (0.0%) | 6 (30.0%) |
| 35 to 39 Minutes | 0 (0.0%) | 0 (0.0%) |
| 40 to 44 Minutes | 1 (4.2%) | 1 (5.0%) |
| 45 to 59 Minutes | 0 (0.0%) | 7 (35.0%) |
| 60 to 89 Minutes | 0 (0.0%) | 0 (0.0%) |
| 90 or more Minutes | 0 (0.0%) | 0 (0.0%) |
Time of Departure to Work by Sex in Rockland
The most frequent times of departure to work in Rockland are 6:00 AM to 6:29 AM (5, 20.8%) for males and 7:00 AM to 7:29 AM (8, 40.0%) for females.
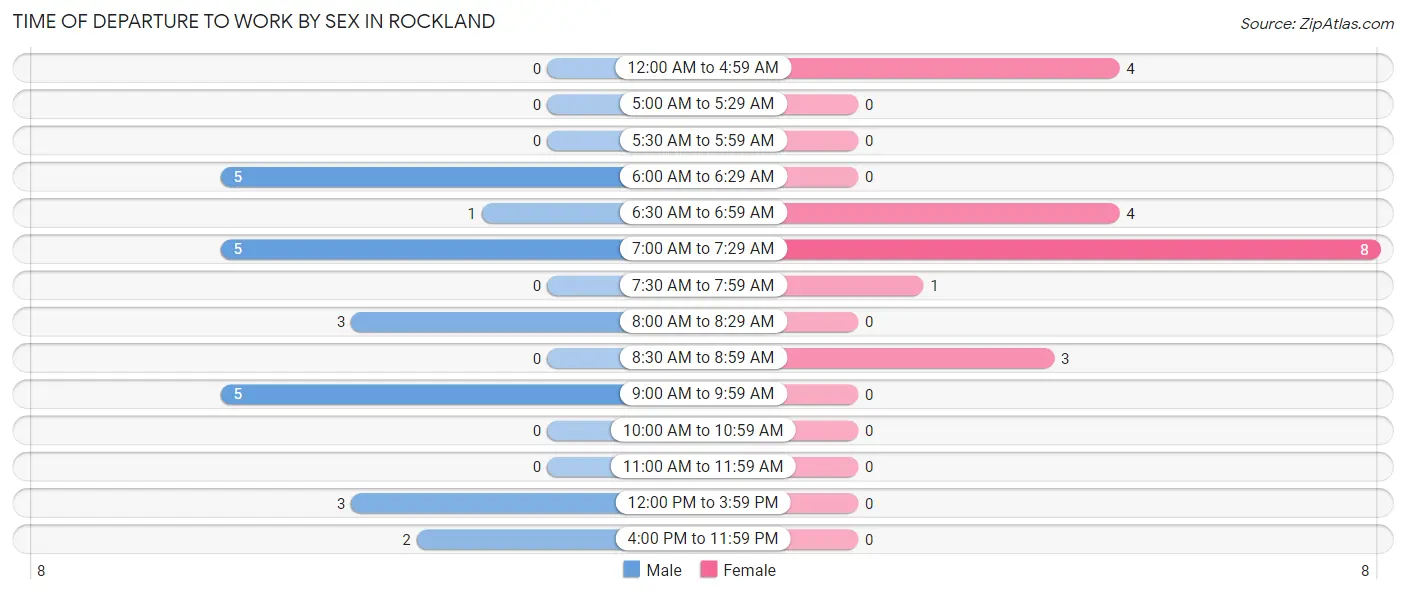
| Time of Departure | Male | Female |
| 12:00 AM to 4:59 AM | 0 (0.0%) | 4 (20.0%) |
| 5:00 AM to 5:29 AM | 0 (0.0%) | 0 (0.0%) |
| 5:30 AM to 5:59 AM | 0 (0.0%) | 0 (0.0%) |
| 6:00 AM to 6:29 AM | 5 (20.8%) | 0 (0.0%) |
| 6:30 AM to 6:59 AM | 1 (4.2%) | 4 (20.0%) |
| 7:00 AM to 7:29 AM | 5 (20.8%) | 8 (40.0%) |
| 7:30 AM to 7:59 AM | 0 (0.0%) | 1 (5.0%) |
| 8:00 AM to 8:29 AM | 3 (12.5%) | 0 (0.0%) |
| 8:30 AM to 8:59 AM | 0 (0.0%) | 3 (15.0%) |
| 9:00 AM to 9:59 AM | 5 (20.8%) | 0 (0.0%) |
| 10:00 AM to 10:59 AM | 0 (0.0%) | 0 (0.0%) |
| 11:00 AM to 11:59 AM | 0 (0.0%) | 0 (0.0%) |
| 12:00 PM to 3:59 PM | 3 (12.5%) | 0 (0.0%) |
| 4:00 PM to 11:59 PM | 2 (8.3%) | 0 (0.0%) |
| Total | 24 (100.0%) | 20 (100.0%) |
Housing Occupancy in Rockland
Occupancy by Ownership in Rockland
Of the total 62 dwellings in Rockland, owner-occupied units account for 60 (96.8%), while renter-occupied units make up 2 (3.2%).
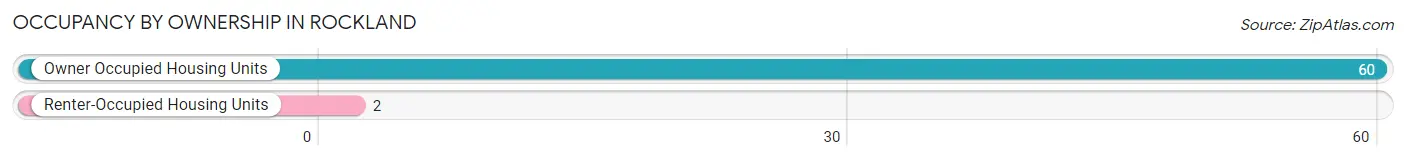
| Occupancy | # Housing Units | % Housing Units |
| Owner Occupied Housing Units | 60 | 96.8% |
| Renter-Occupied Housing Units | 2 | 3.2% |
| Total Occupied Housing Units | 62 | 100.0% |
Occupancy by Household Size in Rockland
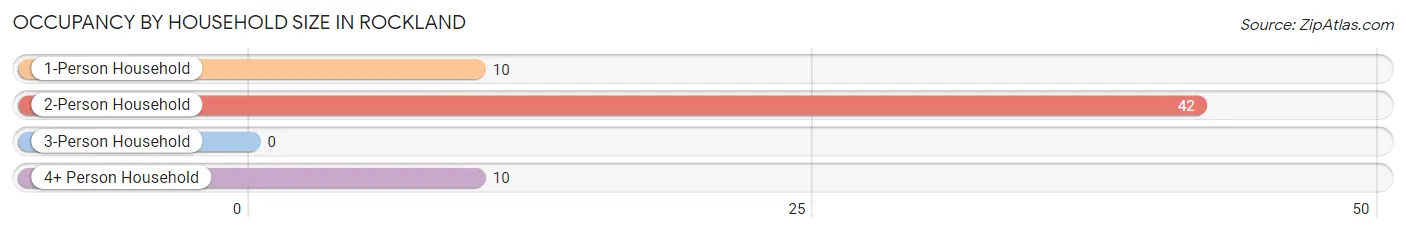
| Household Size | # Housing Units | % Housing Units |
| 1-Person Household | 10 | 16.1% |
| 2-Person Household | 42 | 67.7% |
| 3-Person Household | 0 | 0.0% |
| 4+ Person Household | 10 | 16.1% |
| Total Housing Units | 62 | 100.0% |
Occupancy by Ownership by Household Size in Rockland
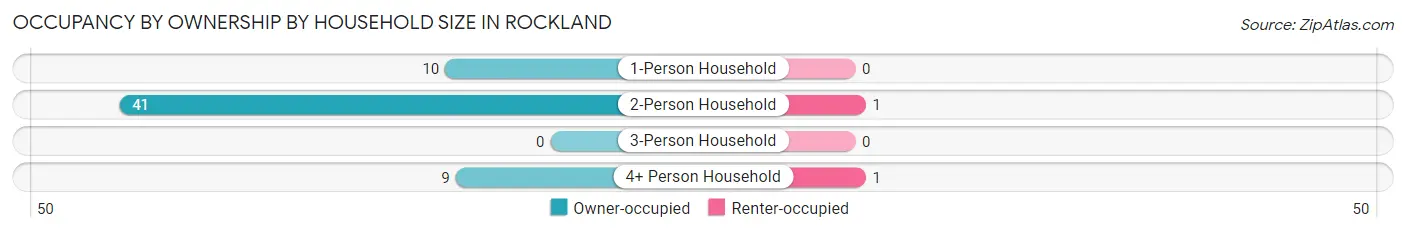
| Household Size | Owner-occupied | Renter-occupied |
| 1-Person Household | 10 (100.0%) | 0 (0.0%) |
| 2-Person Household | 41 (97.6%) | 1 (2.4%) |
| 3-Person Household | 0 (0.0%) | 0 (0.0%) |
| 4+ Person Household | 9 (90.0%) | 1 (10.0%) |
| Total Housing Units | 60 (96.8%) | 2 (3.2%) |
Occupancy by Educational Attainment in Rockland
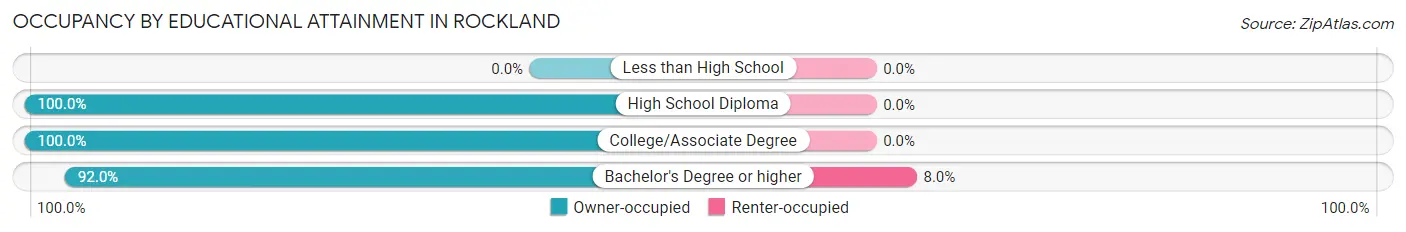
| Household Size | Owner-occupied | Renter-occupied |
| Less than High School | 0 (0.0%) | 0 (0.0%) |
| High School Diploma | 13 (100.0%) | 0 (0.0%) |
| College/Associate Degree | 24 (100.0%) | 0 (0.0%) |
| Bachelor's Degree or higher | 23 (92.0%) | 2 (8.0%) |
Occupancy by Age of Householder in Rockland
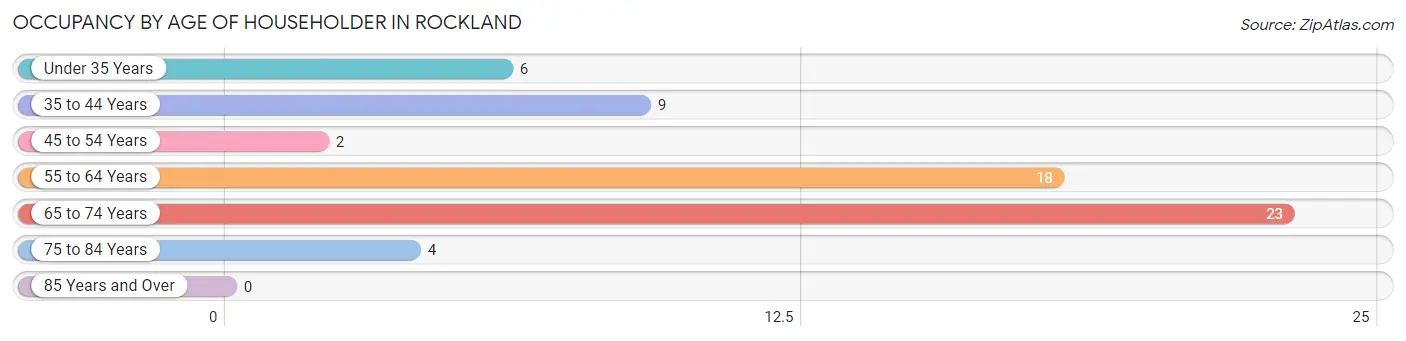
| Age Bracket | # Households | % Households |
| Under 35 Years | 6 | 9.7% |
| 35 to 44 Years | 9 | 14.5% |
| 45 to 54 Years | 2 | 3.2% |
| 55 to 64 Years | 18 | 29.0% |
| 65 to 74 Years | 23 | 37.1% |
| 75 to 84 Years | 4 | 6.5% |
| 85 Years and Over | 0 | 0.0% |
| Total | 62 | 100.0% |
Housing Finances in Rockland
Median Income by Occupancy in Rockland
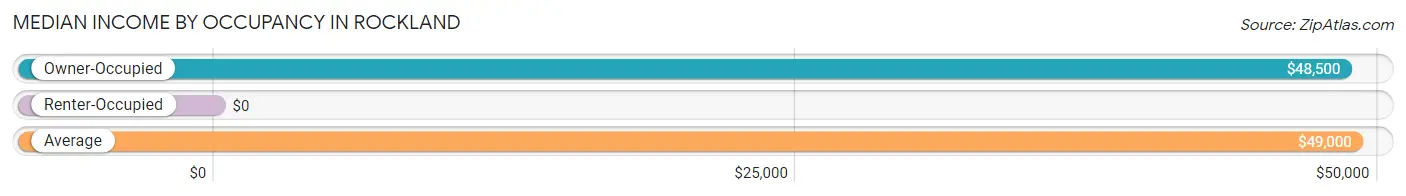
| Occupancy Type | # Households | Median Income |
| Owner-Occupied | 60 (96.8%) | $48,500 |
| Renter-Occupied | 2 (3.2%) | $0 |
| Average | 62 (100.0%) | $49,000 |
Occupancy by Householder Income Bracket in Rockland
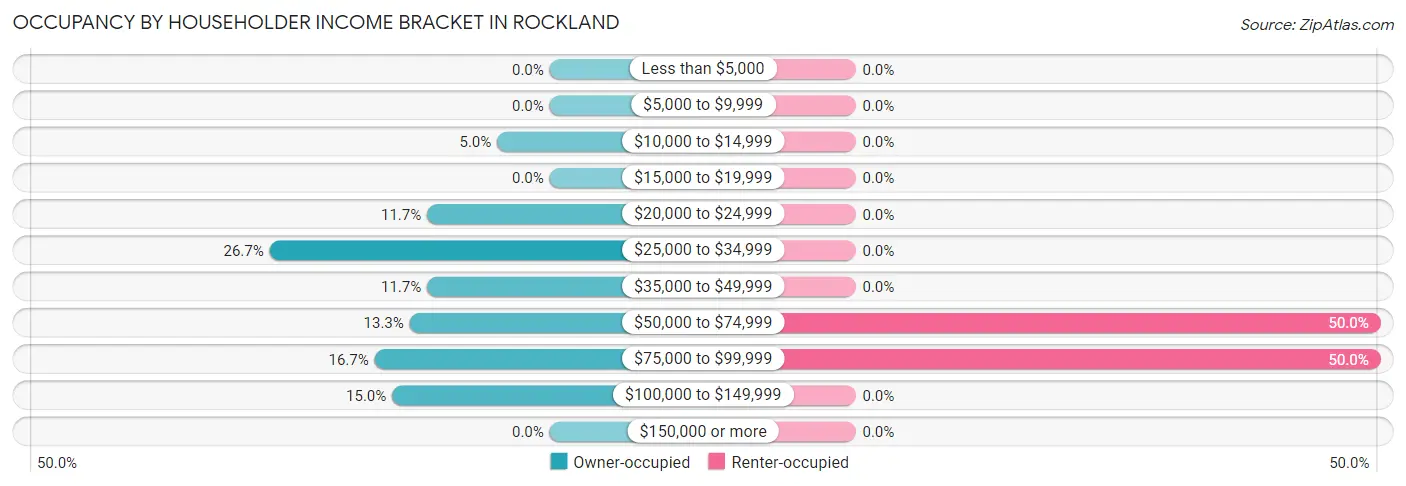
| Income Bracket | Owner-occupied | Renter-occupied |
| Less than $5,000 | 0 (0.0%) | 0 (0.0%) |
| $5,000 to $9,999 | 0 (0.0%) | 0 (0.0%) |
| $10,000 to $14,999 | 3 (5.0%) | 0 (0.0%) |
| $15,000 to $19,999 | 0 (0.0%) | 0 (0.0%) |
| $20,000 to $24,999 | 7 (11.7%) | 0 (0.0%) |
| $25,000 to $34,999 | 16 (26.7%) | 0 (0.0%) |
| $35,000 to $49,999 | 7 (11.7%) | 0 (0.0%) |
| $50,000 to $74,999 | 8 (13.3%) | 1 (50.0%) |
| $75,000 to $99,999 | 10 (16.7%) | 1 (50.0%) |
| $100,000 to $149,999 | 9 (15.0%) | 0 (0.0%) |
| $150,000 or more | 0 (0.0%) | 0 (0.0%) |
| Total | 60 (100.0%) | 2 (100.0%) |
Monthly Housing Cost Tiers in Rockland
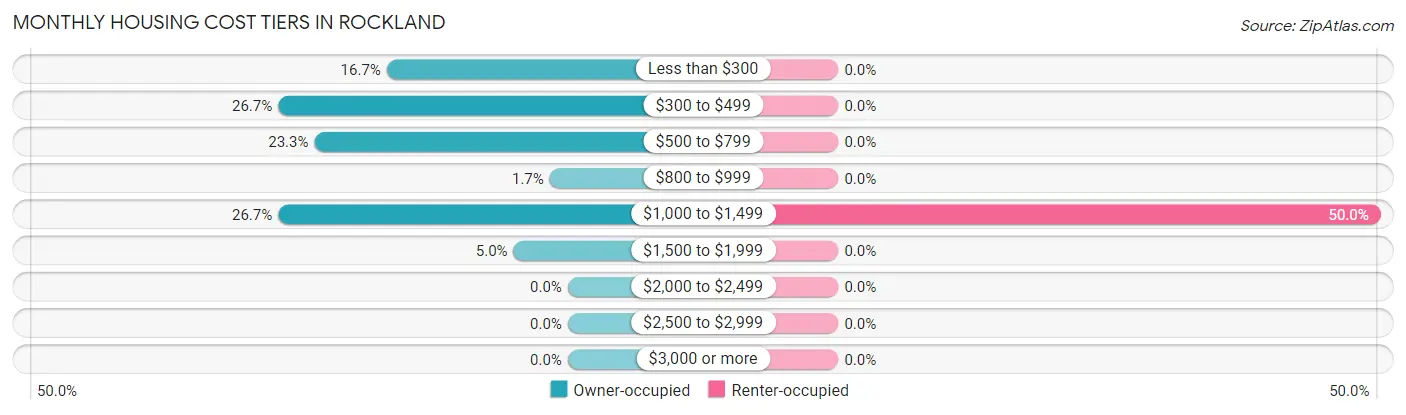
| Monthly Cost | Owner-occupied | Renter-occupied |
| Less than $300 | 10 (16.7%) | 0 (0.0%) |
| $300 to $499 | 16 (26.7%) | 0 (0.0%) |
| $500 to $799 | 14 (23.3%) | 0 (0.0%) |
| $800 to $999 | 1 (1.7%) | 0 (0.0%) |
| $1,000 to $1,499 | 16 (26.7%) | 1 (50.0%) |
| $1,500 to $1,999 | 3 (5.0%) | 0 (0.0%) |
| $2,000 to $2,499 | 0 (0.0%) | 0 (0.0%) |
| $2,500 to $2,999 | 0 (0.0%) | 0 (0.0%) |
| $3,000 or more | 0 (0.0%) | 0 (0.0%) |
| Total | 60 (100.0%) | 2 (100.0%) |
Physical Housing Characteristics in Rockland
Housing Structures in Rockland
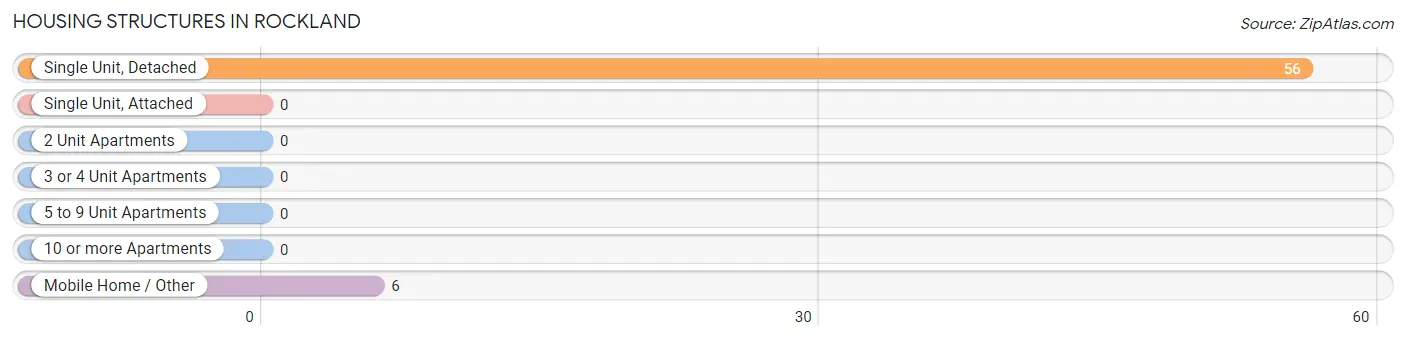
| Structure Type | # Housing Units | % Housing Units |
| Single Unit, Detached | 56 | 90.3% |
| Single Unit, Attached | 0 | 0.0% |
| 2 Unit Apartments | 0 | 0.0% |
| 3 or 4 Unit Apartments | 0 | 0.0% |
| 5 to 9 Unit Apartments | 0 | 0.0% |
| 10 or more Apartments | 0 | 0.0% |
| Mobile Home / Other | 6 | 9.7% |
| Total | 62 | 100.0% |
Housing Structures by Occupancy in Rockland
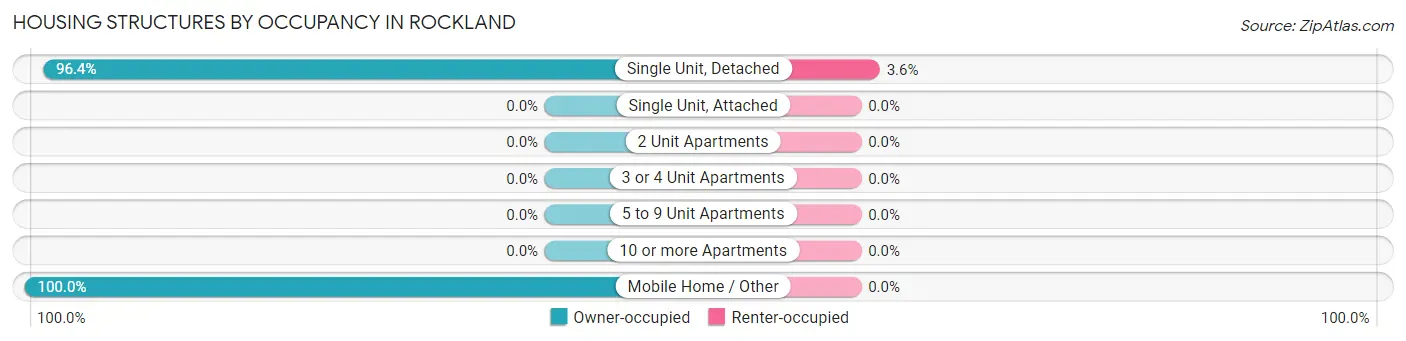
| Structure Type | Owner-occupied | Renter-occupied |
| Single Unit, Detached | 54 (96.4%) | 2 (3.6%) |
| Single Unit, Attached | 0 (0.0%) | 0 (0.0%) |
| 2 Unit Apartments | 0 (0.0%) | 0 (0.0%) |
| 3 or 4 Unit Apartments | 0 (0.0%) | 0 (0.0%) |
| 5 to 9 Unit Apartments | 0 (0.0%) | 0 (0.0%) |
| 10 or more Apartments | 0 (0.0%) | 0 (0.0%) |
| Mobile Home / Other | 6 (100.0%) | 0 (0.0%) |
| Total | 60 (96.8%) | 2 (3.2%) |
Housing Structures by Number of Rooms in Rockland
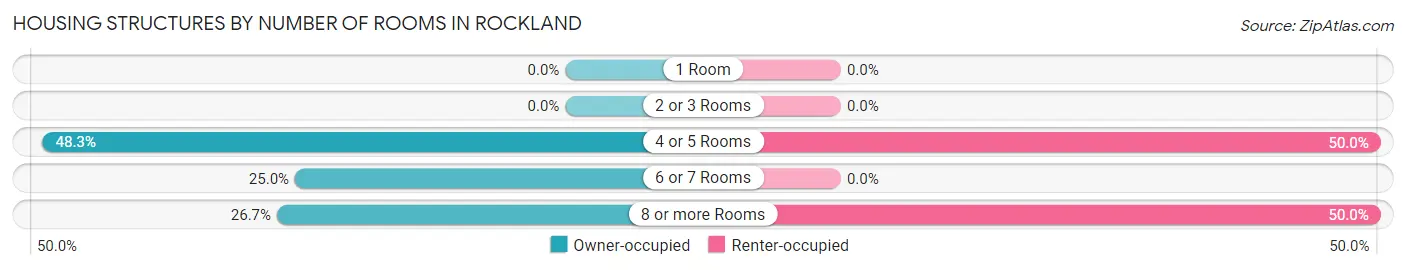
| Number of Rooms | Owner-occupied | Renter-occupied |
| 1 Room | 0 (0.0%) | 0 (0.0%) |
| 2 or 3 Rooms | 0 (0.0%) | 0 (0.0%) |
| 4 or 5 Rooms | 29 (48.3%) | 1 (50.0%) |
| 6 or 7 Rooms | 15 (25.0%) | 0 (0.0%) |
| 8 or more Rooms | 16 (26.7%) | 1 (50.0%) |
| Total | 60 (100.0%) | 2 (100.0%) |
Housing Structure by Heating Type in Rockland
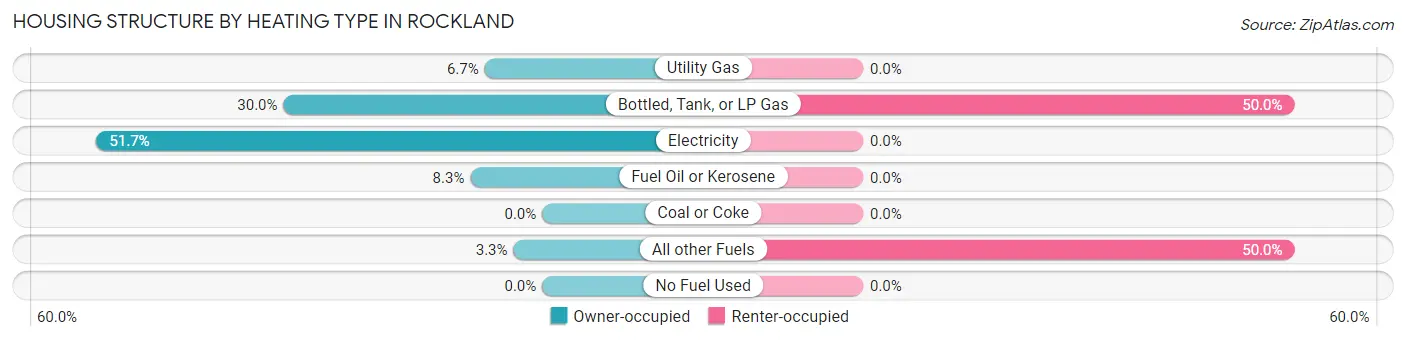
| Heating Type | Owner-occupied | Renter-occupied |
| Utility Gas | 4 (6.7%) | 0 (0.0%) |
| Bottled, Tank, or LP Gas | 18 (30.0%) | 1 (50.0%) |
| Electricity | 31 (51.7%) | 0 (0.0%) |
| Fuel Oil or Kerosene | 5 (8.3%) | 0 (0.0%) |
| Coal or Coke | 0 (0.0%) | 0 (0.0%) |
| All other Fuels | 2 (3.3%) | 1 (50.0%) |
| No Fuel Used | 0 (0.0%) | 0 (0.0%) |
| Total | 60 (100.0%) | 2 (100.0%) |
Household Vehicle Usage in Rockland
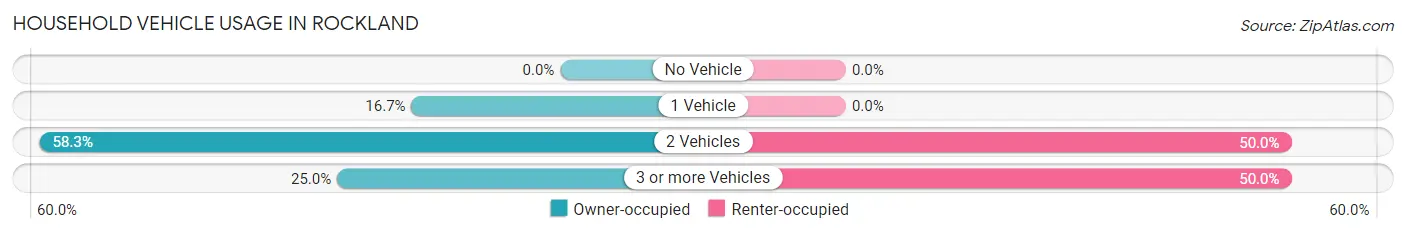
| Vehicles per Household | Owner-occupied | Renter-occupied |
| No Vehicle | 0 (0.0%) | 0 (0.0%) |
| 1 Vehicle | 10 (16.7%) | 0 (0.0%) |
| 2 Vehicles | 35 (58.3%) | 1 (50.0%) |
| 3 or more Vehicles | 15 (25.0%) | 1 (50.0%) |
| Total | 60 (100.0%) | 2 (100.0%) |
Real Estate & Mortgages in Rockland
Real Estate and Mortgage Overview in Rockland
| Characteristic | Without Mortgage | With Mortgage |
| Housing Units | 35 | 25 |
| Median Property Value | $123,400 | $203,100 |
| Median Household Income | $32,813 | $0 |
| Monthly Housing Costs | $397 | $0 |
| Real Estate Taxes | $1,066 | $0 |
Property Value by Mortgage Status in Rockland
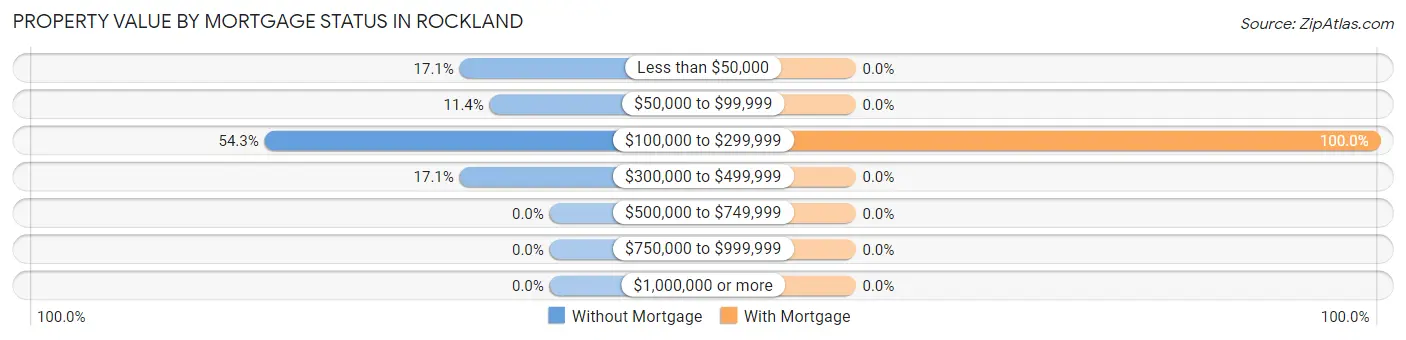
| Property Value | Without Mortgage | With Mortgage |
| Less than $50,000 | 6 (17.1%) | 0 (0.0%) |
| $50,000 to $99,999 | 4 (11.4%) | 0 (0.0%) |
| $100,000 to $299,999 | 19 (54.3%) | 25 (100.0%) |
| $300,000 to $499,999 | 6 (17.1%) | 0 (0.0%) |
| $500,000 to $749,999 | 0 (0.0%) | 0 (0.0%) |
| $750,000 to $999,999 | 0 (0.0%) | 0 (0.0%) |
| $1,000,000 or more | 0 (0.0%) | 0 (0.0%) |
| Total | 35 (100.0%) | 25 (100.0%) |
Household Income by Mortgage Status in Rockland
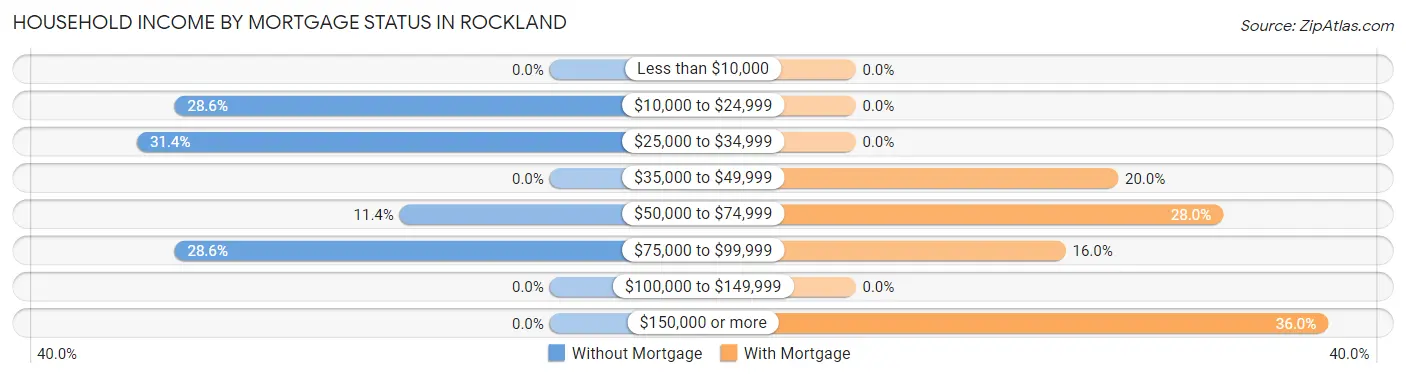
| Household Income | Without Mortgage | With Mortgage |
| Less than $10,000 | 0 (0.0%) | 0 (0.0%) |
| $10,000 to $24,999 | 10 (28.6%) | 0 (0.0%) |
| $25,000 to $34,999 | 11 (31.4%) | 0 (0.0%) |
| $35,000 to $49,999 | 0 (0.0%) | 5 (20.0%) |
| $50,000 to $74,999 | 4 (11.4%) | 7 (28.0%) |
| $75,000 to $99,999 | 10 (28.6%) | 4 (16.0%) |
| $100,000 to $149,999 | 0 (0.0%) | 0 (0.0%) |
| $150,000 or more | 0 (0.0%) | 9 (36.0%) |
| Total | 35 (100.0%) | 25 (100.0%) |
Property Value to Household Income Ratio in Rockland
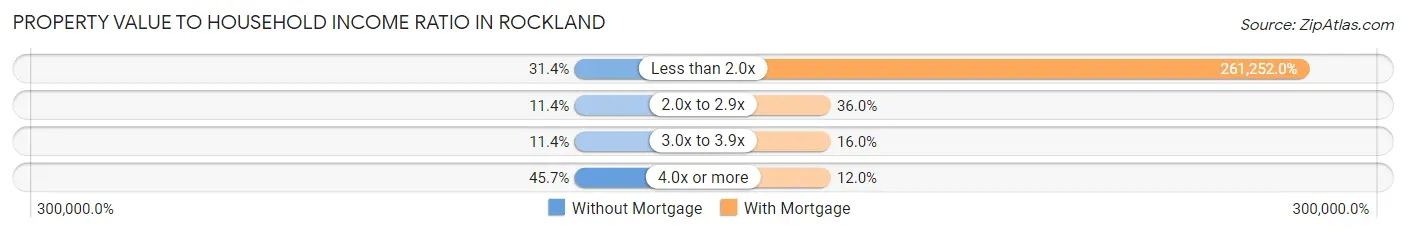
| Value-to-Income Ratio | Without Mortgage | With Mortgage |
| Less than 2.0x | 11 (31.4%) | 65,313 (261,252.0%) |
| 2.0x to 2.9x | 4 (11.4%) | 9 (36.0%) |
| 3.0x to 3.9x | 4 (11.4%) | 4 (16.0%) |
| 4.0x or more | 16 (45.7%) | 3 (12.0%) |
| Total | 35 (100.0%) | 25 (100.0%) |
Real Estate Taxes by Mortgage Status in Rockland
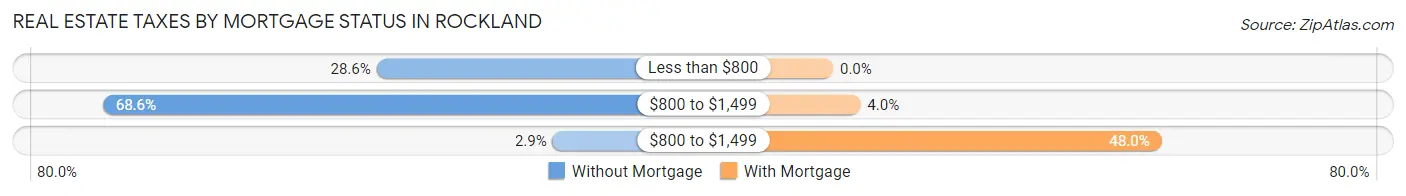
| Property Taxes | Without Mortgage | With Mortgage |
| Less than $800 | 10 (28.6%) | 0 (0.0%) |
| $800 to $1,499 | 24 (68.6%) | 1 (4.0%) |
| $800 to $1,499 | 1 (2.9%) | 12 (48.0%) |
| Total | 35 (100.0%) | 25 (100.0%) |
Health & Disability in Rockland
Health Insurance Coverage by Age in Rockland
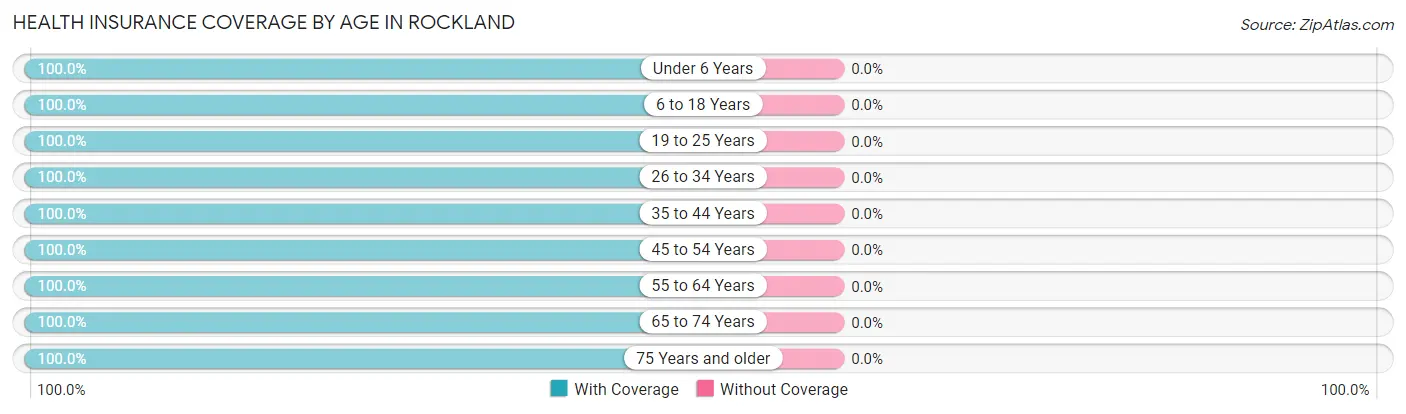
| Age Bracket | With Coverage | Without Coverage |
| Under 6 Years | 9 (100.0%) | 0 (0.0%) |
| 6 to 18 Years | 32 (100.0%) | 0 (0.0%) |
| 19 to 25 Years | 3 (100.0%) | 0 (0.0%) |
| 26 to 34 Years | 10 (100.0%) | 0 (0.0%) |
| 35 to 44 Years | 15 (100.0%) | 0 (0.0%) |
| 45 to 54 Years | 6 (100.0%) | 0 (0.0%) |
| 55 to 64 Years | 29 (100.0%) | 0 (0.0%) |
| 65 to 74 Years | 42 (100.0%) | 0 (0.0%) |
| 75 Years and older | 5 (100.0%) | 0 (0.0%) |
| Total | 151 (100.0%) | 0 (0.0%) |
Health Insurance Coverage by Citizenship Status in Rockland
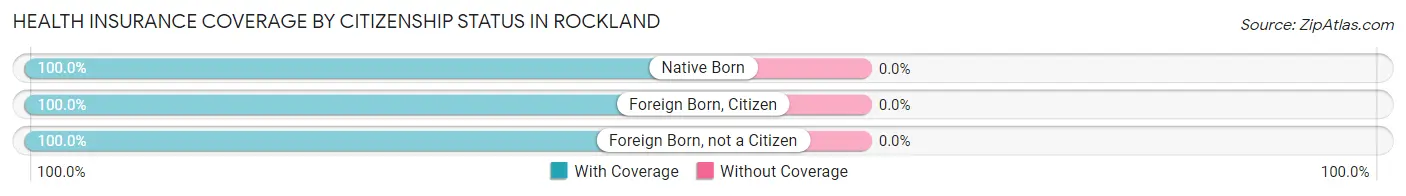
| Citizenship Status | With Coverage | Without Coverage |
| Native Born | 9 (100.0%) | 0 (0.0%) |
| Foreign Born, Citizen | 32 (100.0%) | 0 (0.0%) |
| Foreign Born, not a Citizen | 3 (100.0%) | 0 (0.0%) |
Health Insurance Coverage by Household Income in Rockland
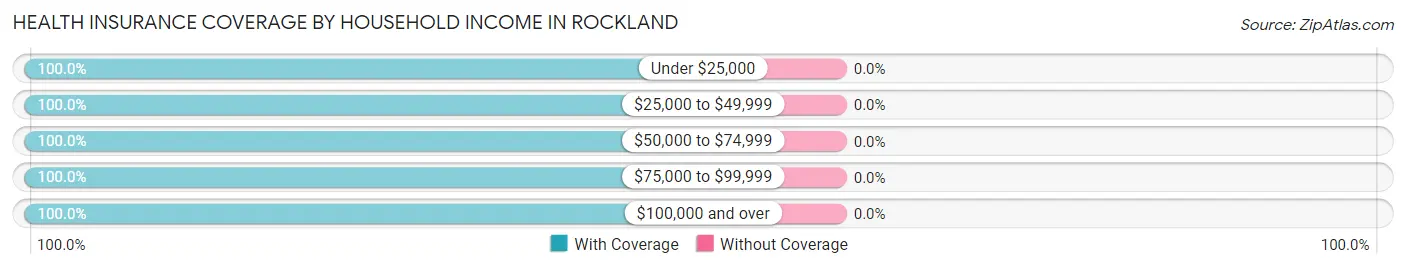
| Household Income | With Coverage | Without Coverage |
| Under $25,000 | 13 (100.0%) | 0 (0.0%) |
| $25,000 to $49,999 | 66 (100.0%) | 0 (0.0%) |
| $50,000 to $74,999 | 19 (100.0%) | 0 (0.0%) |
| $75,000 to $99,999 | 21 (100.0%) | 0 (0.0%) |
| $100,000 and over | 32 (100.0%) | 0 (0.0%) |
Public vs Private Health Insurance Coverage by Age in Rockland
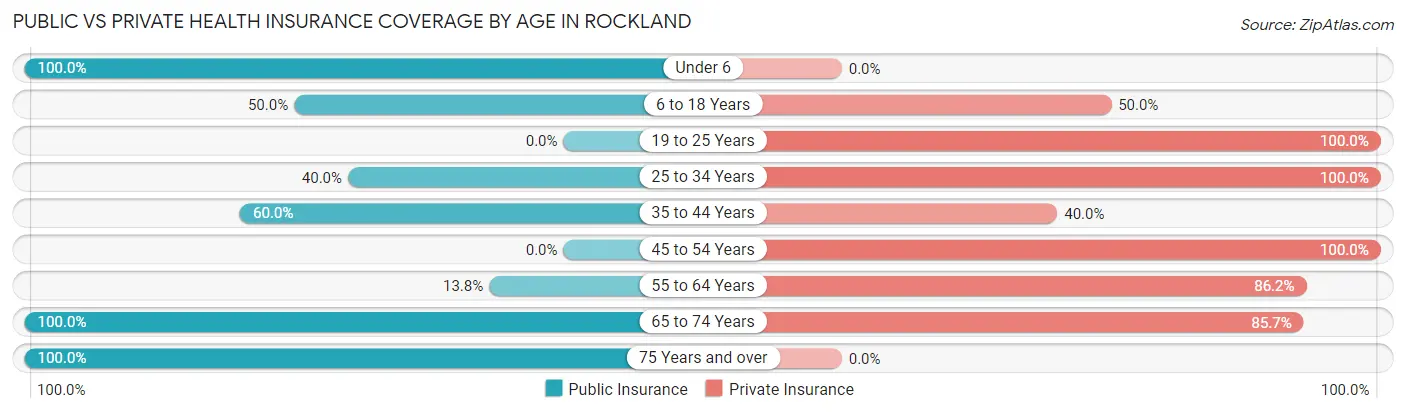
| Age Bracket | Public Insurance | Private Insurance |
| Under 6 | 9 (100.0%) | 0 (0.0%) |
| 6 to 18 Years | 16 (50.0%) | 16 (50.0%) |
| 19 to 25 Years | 0 (0.0%) | 3 (100.0%) |
| 25 to 34 Years | 4 (40.0%) | 10 (100.0%) |
| 35 to 44 Years | 9 (60.0%) | 6 (40.0%) |
| 45 to 54 Years | 0 (0.0%) | 6 (100.0%) |
| 55 to 64 Years | 4 (13.8%) | 25 (86.2%) |
| 65 to 74 Years | 42 (100.0%) | 36 (85.7%) |
| 75 Years and over | 5 (100.0%) | 0 (0.0%) |
| Total | 89 (58.9%) | 102 (67.5%) |
Disability Status by Sex by Age in Rockland
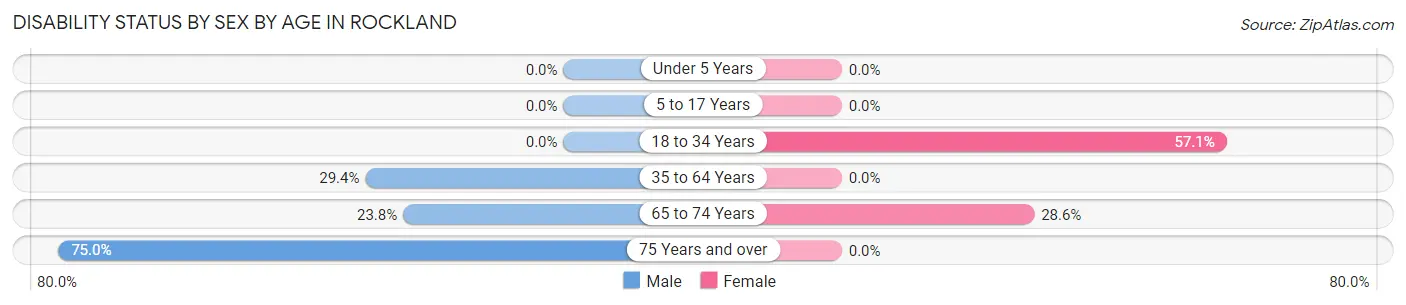
| Age Bracket | Male | Female |
| Under 5 Years | 0 (0.0%) | 0 (0.0%) |
| 5 to 17 Years | 0 (0.0%) | 0 (0.0%) |
| 18 to 34 Years | 0 (0.0%) | 4 (57.1%) |
| 35 to 64 Years | 5 (29.4%) | 0 (0.0%) |
| 65 to 74 Years | 5 (23.8%) | 6 (28.6%) |
| 75 Years and over | 3 (75.0%) | 0 (0.0%) |
Disability Class by Sex by Age in Rockland
Disability Class: Hearing Difficulty
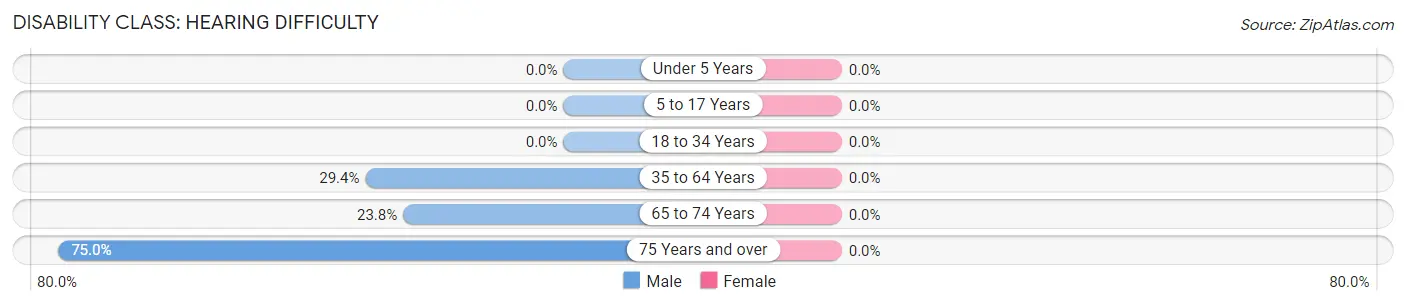
| Age Bracket | Male | Female |
| Under 5 Years | 0 (0.0%) | 0 (0.0%) |
| 5 to 17 Years | 0 (0.0%) | 0 (0.0%) |
| 18 to 34 Years | 0 (0.0%) | 0 (0.0%) |
| 35 to 64 Years | 5 (29.4%) | 0 (0.0%) |
| 65 to 74 Years | 5 (23.8%) | 0 (0.0%) |
| 75 Years and over | 3 (75.0%) | 0 (0.0%) |
Disability Class: Vision Difficulty
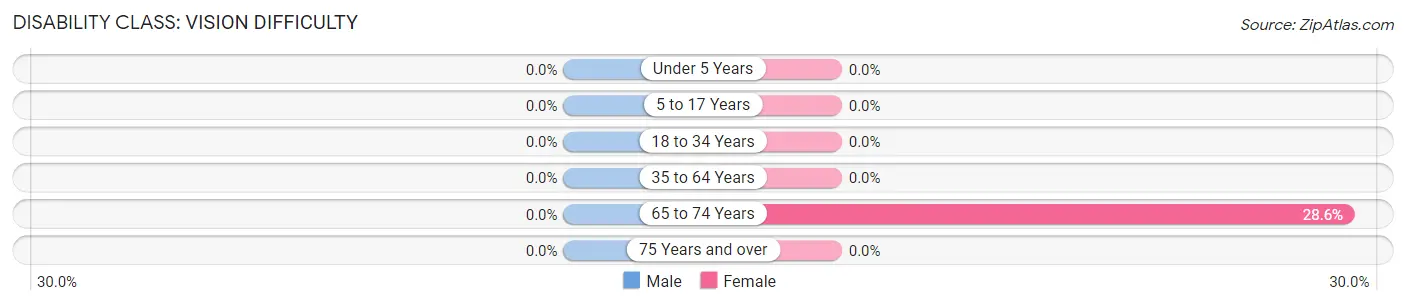
| Age Bracket | Male | Female |
| Under 5 Years | 0 (0.0%) | 0 (0.0%) |
| 5 to 17 Years | 0 (0.0%) | 0 (0.0%) |
| 18 to 34 Years | 0 (0.0%) | 0 (0.0%) |
| 35 to 64 Years | 0 (0.0%) | 0 (0.0%) |
| 65 to 74 Years | 0 (0.0%) | 6 (28.6%) |
| 75 Years and over | 0 (0.0%) | 0 (0.0%) |
Disability Class: Cognitive Difficulty
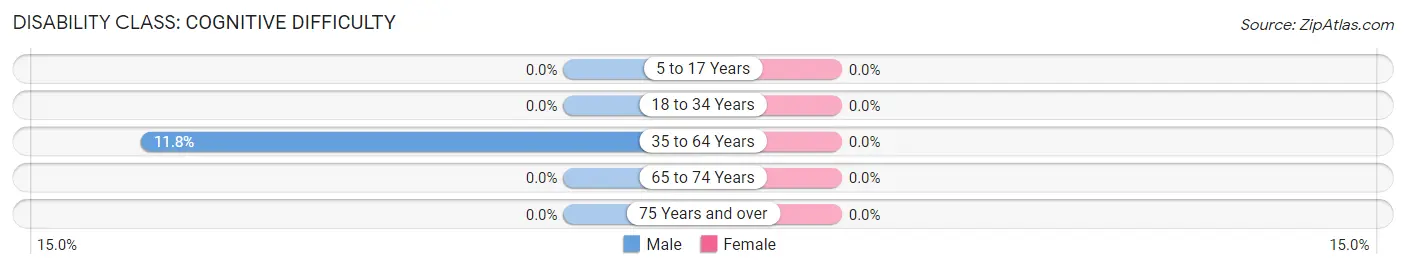
| Age Bracket | Male | Female |
| 5 to 17 Years | 0 (0.0%) | 0 (0.0%) |
| 18 to 34 Years | 0 (0.0%) | 0 (0.0%) |
| 35 to 64 Years | 2 (11.8%) | 0 (0.0%) |
| 65 to 74 Years | 0 (0.0%) | 0 (0.0%) |
| 75 Years and over | 0 (0.0%) | 0 (0.0%) |
Disability Class: Ambulatory Difficulty
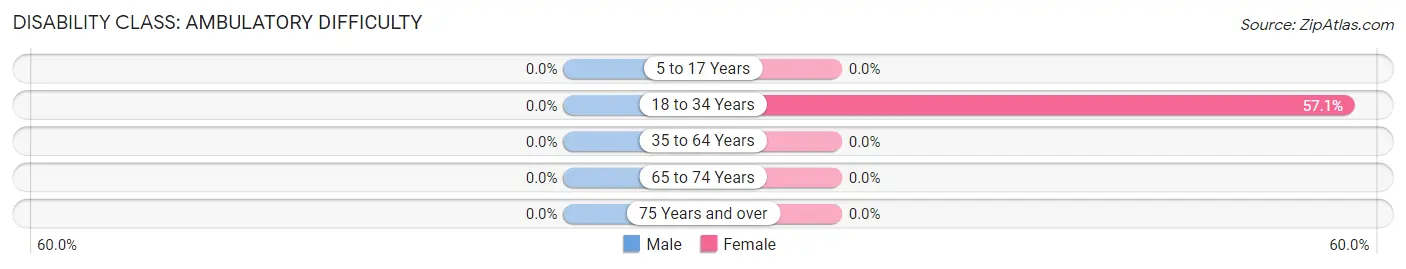
| Age Bracket | Male | Female |
| 5 to 17 Years | 0 (0.0%) | 0 (0.0%) |
| 18 to 34 Years | 0 (0.0%) | 4 (57.1%) |
| 35 to 64 Years | 0 (0.0%) | 0 (0.0%) |
| 65 to 74 Years | 0 (0.0%) | 0 (0.0%) |
| 75 Years and over | 0 (0.0%) | 0 (0.0%) |
Disability Class: Self-Care Difficulty
| Age Bracket | Male | Female |
| 5 to 17 Years | 0 (0.0%) | 0 (0.0%) |
| 18 to 34 Years | 0 (0.0%) | 0 (0.0%) |
| 35 to 64 Years | 0 (0.0%) | 0 (0.0%) |
| 65 to 74 Years | 0 (0.0%) | 0 (0.0%) |
| 75 Years and over | 0 (0.0%) | 0 (0.0%) |
Technology Access in Rockland
Computing Device Access in Rockland
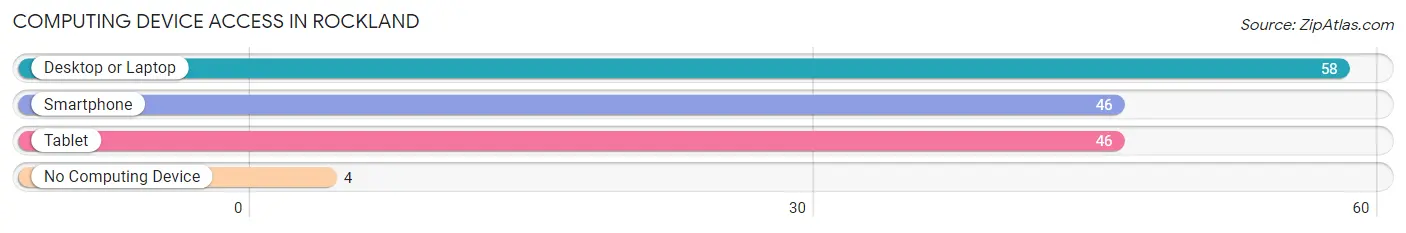
| Device Type | # Households | % Households |
| Desktop or Laptop | 58 | 93.5% |
| Smartphone | 46 | 74.2% |
| Tablet | 46 | 74.2% |
| No Computing Device | 4 | 6.5% |
| Total | 62 | 100.0% |
Internet Access in Rockland
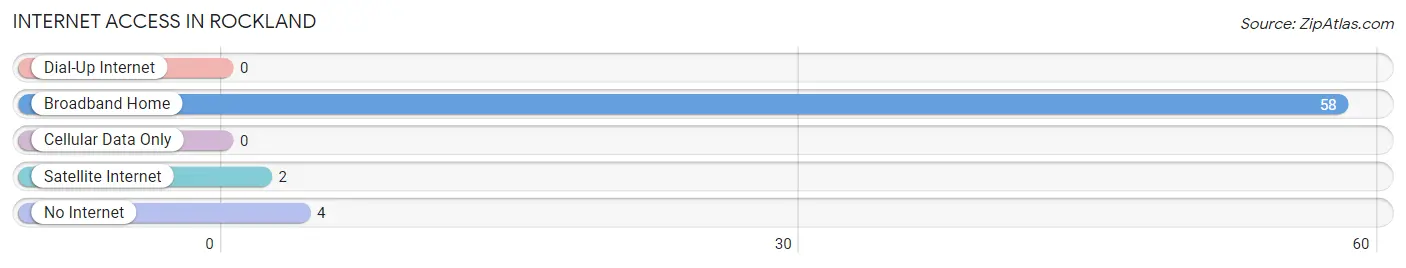
| Internet Type | # Households | % Households |
| Dial-Up Internet | 0 | 0.0% |
| Broadband Home | 58 | 93.5% |
| Cellular Data Only | 0 | 0.0% |
| Satellite Internet | 2 | 3.2% |
| No Internet | 4 | 6.5% |
| Total | 62 | 100.0% |
Rockland Summary
Rockland, Idaho is a small town located in the southeastern corner of the state, near the Utah border. It is part of the larger Bear Lake Valley, which is known for its beautiful scenery and recreational opportunities. The town has a population of just over 500 people, and is the county seat of Bear Lake County.
History
Rockland was first settled in 1864 by a group of Mormon pioneers led by William H. Smart. The town was originally named Smartsville, but was later changed to Rockland in 1871. The name was chosen to reflect the rocky terrain of the area.
The town was incorporated in 1883, and the first post office was established in 1884. The town grew slowly, but steadily, and by the early 1900s, it had become a thriving agricultural community. The town was also home to a number of businesses, including a hotel, a bank, a newspaper, and a general store.
Geography
Rockland is located in the southeastern corner of Idaho, near the Utah border. It is part of the larger Bear Lake Valley, which is known for its beautiful scenery and recreational opportunities. The town is situated at an elevation of 5,400 feet, and is surrounded by mountains and hills. The Bear River flows through the town, and the nearby Bear Lake is a popular destination for fishing and boating.
Economy
The economy of Rockland is largely based on agriculture and tourism. The town is home to a number of farms, which produce a variety of crops, including potatoes, hay, and alfalfa. The nearby Bear Lake is a popular destination for fishing and boating, and the town is also home to a number of restaurants and other businesses that cater to tourists.
Demographics
As of the 2010 census, the population of Rockland was 514. The racial makeup of the town was 95.3% White, 0.2% African American, 0.4% Native American, 0.4% Asian, 0.2% Pacific Islander, and 3.5% from other races. The median household income was $37,500, and the median age was 37.
Rockland is a small, rural town with a rich history and a strong sense of community. The town is home to a number of farms and businesses, and is a popular destination for tourists looking to enjoy the beautiful scenery and recreational opportunities of the Bear Lake Valley.
Common Questions
What is Per Capita Income in Rockland?
Per Capita income in Rockland is $21,195.
What is the Median Family Income in Rockland?
Median Family Income in Rockland is $49,500.
What is the Median Household income in Rockland?
Median Household Income in Rockland is $49,000.
What is Inequality or Gini Index in Rockland?
Inequality or Gini Index in Rockland is 0.33.
What is the Total Population of Rockland?
Total Population of Rockland is 151.
What is the Total Male Population of Rockland?
Total Male Population of Rockland is 63.
What is the Total Female Population of Rockland?
Total Female Population of Rockland is 88.
What is the Ratio of Males per 100 Females in Rockland?
There are 71.59 Males per 100 Females in Rockland.
What is the Ratio of Females per 100 Males in Rockland?
There are 139.68 Females per 100 Males in Rockland.
What is the Median Population Age in Rockland?
Median Population Age in Rockland is 57.1 Years.
What is the Average Family Size in Rockland
Average Family Size in Rockland is 2.7 People.
What is the Average Household Size in Rockland
Average Household Size in Rockland is 2.4 People.
How Large is the Labor Force in Rockland?
There are 57 People in the Labor Forcein in Rockland.
What is the Percentage of People in the Labor Force in Rockland?
49.6% of People are in the Labor Force in Rockland.