Rexburg, ID Map & Demographics
Rexburg Map
Rexburg Overview
$20,092
PER CAPITA INCOME
$48,234
AVG FAMILY INCOME
$46,286
AVG HOUSEHOLD INCOME
41.5%
WAGE / INCOME GAP [ % ]
58.5¢/ $1
WAGE / INCOME GAP [ $ ]
0.56
INEQUALITY / GINI INDEX
38,803
TOTAL POPULATION
17,039
MALE POPULATION
21,764
FEMALE POPULATION
78.29
MALES / 100 FEMALES
127.73
FEMALES / 100 MALES
21.4
MEDIAN AGE
3.4
AVG FAMILY SIZE
3.7
AVG HOUSEHOLD SIZE
22,697
LABOR FORCE [ PEOPLE ]
67.6%
PERCENT IN LABOR FORCE
7.8%
UNEMPLOYMENT RATE
Rexburg Area Codes
Income in Rexburg
Income Overview in Rexburg
Per Capita Income in Rexburg is $20,092, while median incomes of families and households are $48,234 and $46,286 respectively.
| Characteristic | Number | Measure |
| Per Capita Income | 38,803 | $20,092 |
| Median Family Income | 6,229 | $48,234 |
| Mean Family Income | 6,229 | $93,956 |
| Median Household Income | 8,802 | $46,286 |
| Mean Household Income | 8,802 | $79,383 |
| Income Deficit | 6,229 | $0 |
| Wage / Income Gap (%) | 38,803 | 41.51% |
| Wage / Income Gap ($) | 38,803 | 58.49¢ per $1 |
| Gini / Inequality Index | 38,803 | 0.56 |
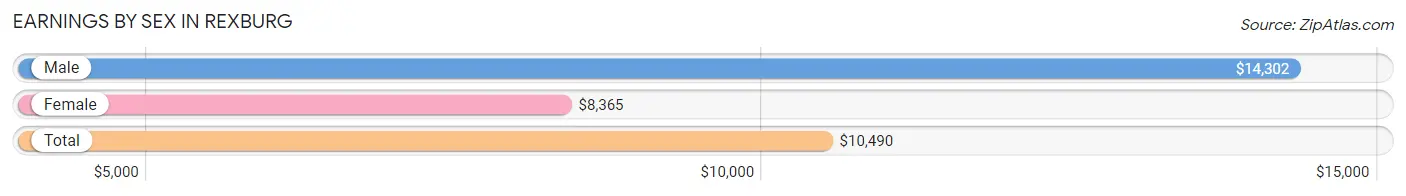
Earnings by Sex in Rexburg
Average Earnings in Rexburg are $10,490, $14,302 for men and $8,365 for women, a difference of 41.5%.
| Sex | Number | Average Earnings |
| Male | 12,163 (45.0%) | $14,302 |
| Female | 14,894 (55.0%) | $8,365 |
| Total | 27,057 (100.0%) | $10,490 |
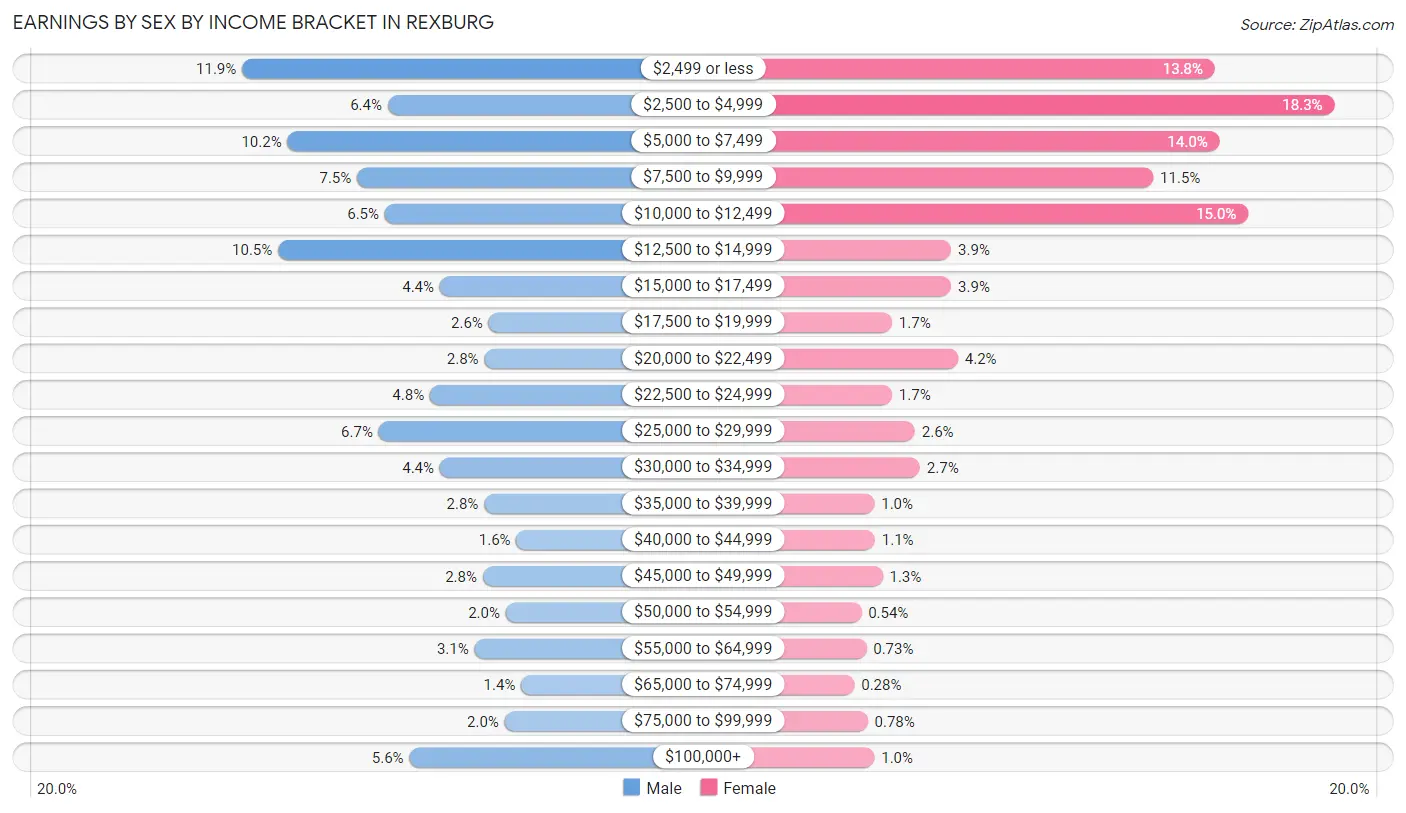
Earnings by Sex by Income Bracket in Rexburg
The most common earnings brackets in Rexburg are $2,499 or less for men (1,441 | 11.8%) and $2,500 to $4,999 for women (2,721 | 18.3%).
| Income | Male | Female |
| $2,499 or less | 1,441 (11.8%) | 2,054 (13.8%) |
| $2,500 to $4,999 | 777 (6.4%) | 2,721 (18.3%) |
| $5,000 to $7,499 | 1,235 (10.2%) | 2,080 (14.0%) |
| $7,500 to $9,999 | 917 (7.5%) | 1,710 (11.5%) |
| $10,000 to $12,499 | 791 (6.5%) | 2,240 (15.0%) |
| $12,500 to $14,999 | 1,277 (10.5%) | 583 (3.9%) |
| $15,000 to $17,499 | 540 (4.4%) | 583 (3.9%) |
| $17,500 to $19,999 | 317 (2.6%) | 252 (1.7%) |
| $20,000 to $22,499 | 337 (2.8%) | 620 (4.2%) |
| $22,500 to $24,999 | 585 (4.8%) | 252 (1.7%) |
| $25,000 to $29,999 | 819 (6.7%) | 380 (2.5%) |
| $30,000 to $34,999 | 540 (4.4%) | 408 (2.7%) |
| $35,000 to $39,999 | 338 (2.8%) | 154 (1.0%) |
| $40,000 to $44,999 | 191 (1.6%) | 156 (1.1%) |
| $45,000 to $49,999 | 344 (2.8%) | 200 (1.3%) |
| $50,000 to $54,999 | 240 (2.0%) | 80 (0.5%) |
| $55,000 to $64,999 | 382 (3.1%) | 109 (0.7%) |
| $65,000 to $74,999 | 169 (1.4%) | 42 (0.3%) |
| $75,000 to $99,999 | 244 (2.0%) | 116 (0.8%) |
| $100,000+ | 679 (5.6%) | 154 (1.0%) |
| Total | 12,163 (100.0%) | 14,894 (100.0%) |
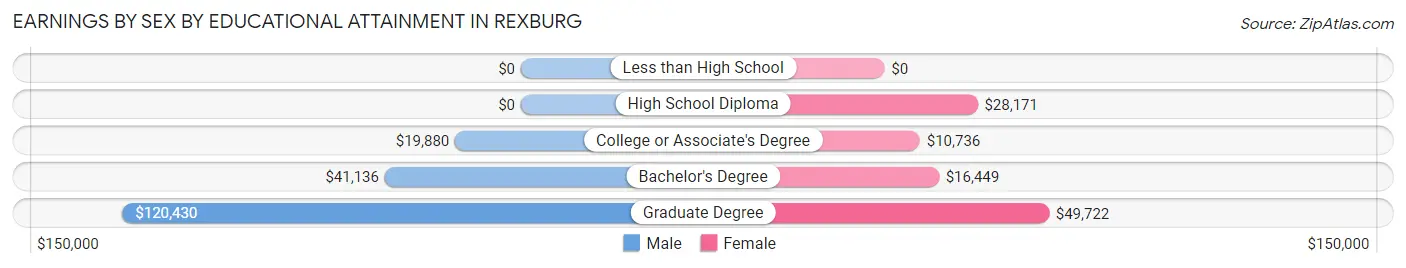
Earnings by Sex by Educational Attainment in Rexburg
Average earnings in Rexburg are $32,968 for men and $18,721 for women, a difference of 43.2%. Men with an educational attainment of graduate degree enjoy the highest average annual earnings of $120,430, while those with college or associate's degree education earn the least with $19,880. Women with an educational attainment of graduate degree earn the most with the average annual earnings of $49,722, while those with college or associate's degree education have the smallest earnings of $10,736.
| Educational Attainment | Male Income | Female Income |
| Less than High School | - | - |
| High School Diploma | - | - |
| College or Associate's Degree | $19,880 | $10,736 |
| Bachelor's Degree | $41,136 | $16,449 |
| Graduate Degree | $120,430 | $49,722 |
| Total | $32,968 | $18,721 |
Family Income in Rexburg
Family Income Brackets in Rexburg
According to the Rexburg family income data, there are 1,115 families falling into the $25,000 to $34,999 income range, which is the most common income bracket and makes up 17.9% of all families. Conversely, the $150,000 to $199,999 income bracket is the least frequent group with only 168 families (2.7%) belonging to this category.
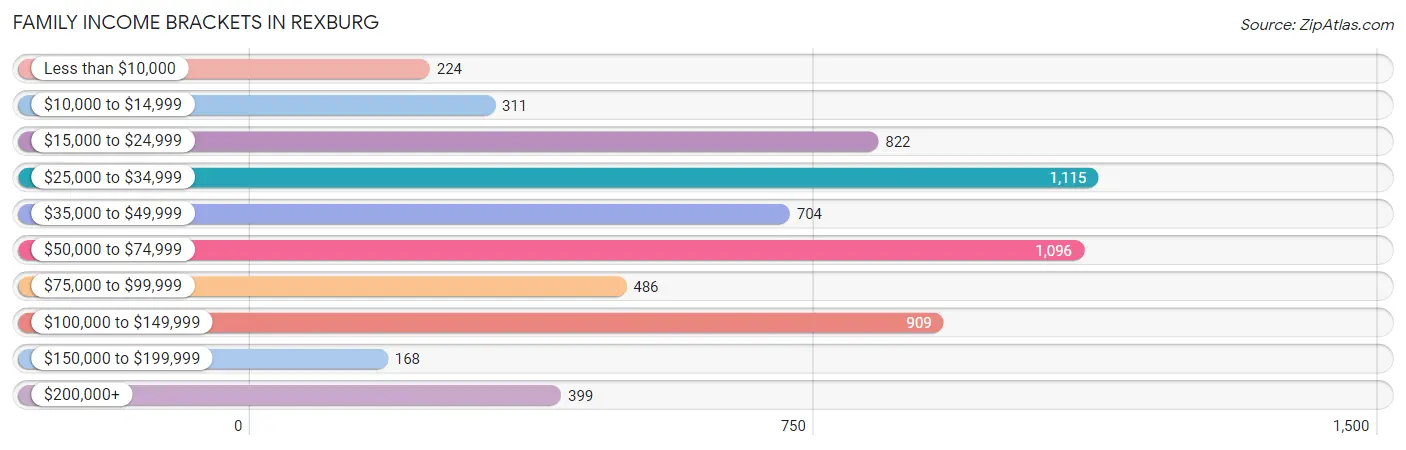
| Income Bracket | # Families | % Families |
| Less than $10,000 | 224 | 3.6% |
| $10,000 to $14,999 | 311 | 5.0% |
| $15,000 to $24,999 | 822 | 13.2% |
| $25,000 to $34,999 | 1,115 | 17.9% |
| $35,000 to $49,999 | 704 | 11.3% |
| $50,000 to $74,999 | 1,096 | 17.6% |
| $75,000 to $99,999 | 486 | 7.8% |
| $100,000 to $149,999 | 909 | 14.6% |
| $150,000 to $199,999 | 168 | 2.7% |
| $200,000+ | 399 | 6.4% |
Family Income by Famaliy Size in Rexburg
7+ person families (185 | 3.0%) account for the highest median family income in Rexburg with $136,007 per family, while 5-person families (270 | 4.3%) have the highest median income of $22,917 per family member.
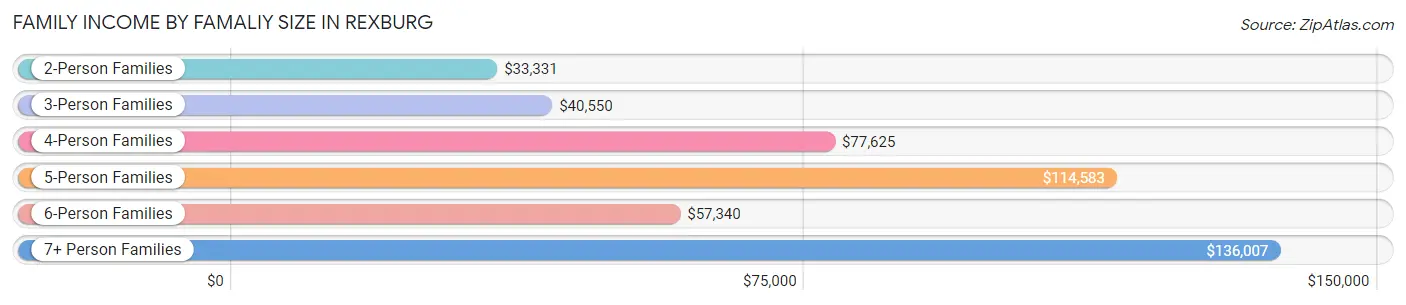
| Income Bracket | # Families | Median Income |
| 2-Person Families | 3,599 (57.8%) | $33,331 |
| 3-Person Families | 773 (12.4%) | $40,550 |
| 4-Person Families | 856 (13.7%) | $77,625 |
| 5-Person Families | 270 (4.3%) | $114,583 |
| 6-Person Families | 546 (8.8%) | $57,340 |
| 7+ Person Families | 185 (3.0%) | $136,007 |
| Total | 6,229 (100.0%) | $48,234 |
Family Income by Number of Earners in Rexburg
The median family income in Rexburg is $48,234, with families comprising 3+ earners (606) having the highest median family income of $137,400, while families with 1 earner (1,294) have the lowest median family income of $36,721, accounting for 9.7% and 20.8% of families, respectively.
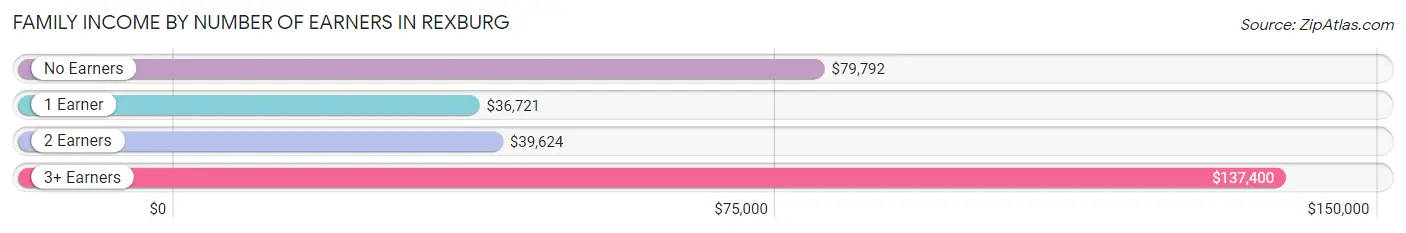
| Number of Earners | # Families | Median Income |
| No Earners | 355 (5.7%) | $79,792 |
| 1 Earner | 1,294 (20.8%) | $36,721 |
| 2 Earners | 3,974 (63.8%) | $39,624 |
| 3+ Earners | 606 (9.7%) | $137,400 |
| Total | 6,229 (100.0%) | $48,234 |
Household Income in Rexburg
Household Income Brackets in Rexburg
With 1,628 households falling in the category, the $50,000 to $74,999 income range is the most frequent in Rexburg, accounting for 18.5% of all households. In contrast, only 176 households (2.0%) fall into the $150,000 to $199,999 income bracket, making it the least populous group.
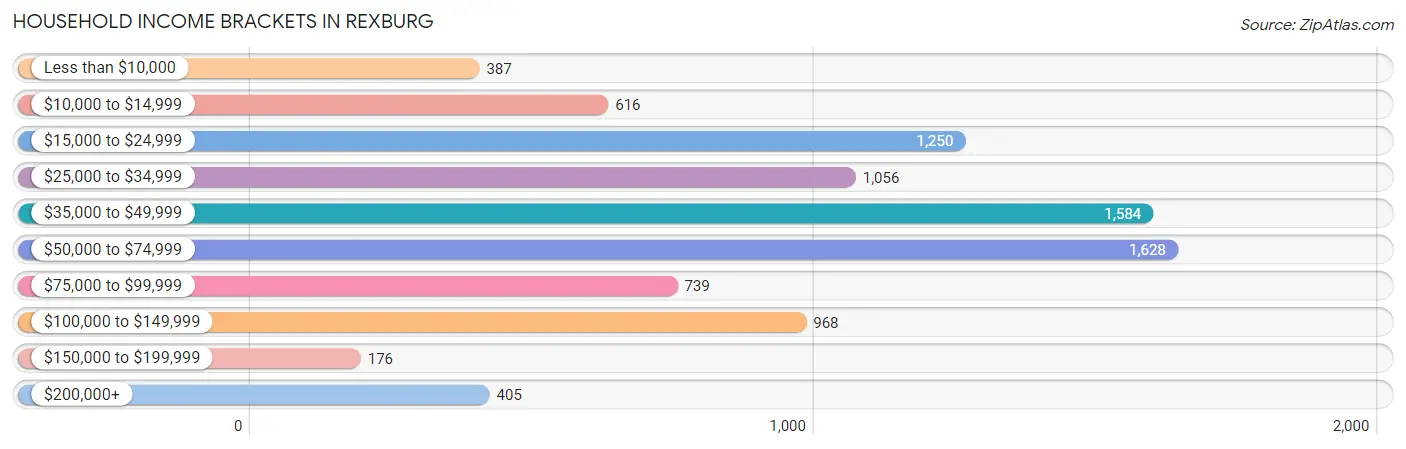
| Income Bracket | # Households | % Households |
| Less than $10,000 | 387 | 4.4% |
| $10,000 to $14,999 | 616 | 7.0% |
| $15,000 to $24,999 | 1,250 | 14.2% |
| $25,000 to $34,999 | 1,056 | 12.0% |
| $35,000 to $49,999 | 1,584 | 18.0% |
| $50,000 to $74,999 | 1,628 | 18.5% |
| $75,000 to $99,999 | 739 | 8.4% |
| $100,000 to $149,999 | 968 | 11.0% |
| $150,000 to $199,999 | 176 | 2.0% |
| $200,000+ | 405 | 4.6% |
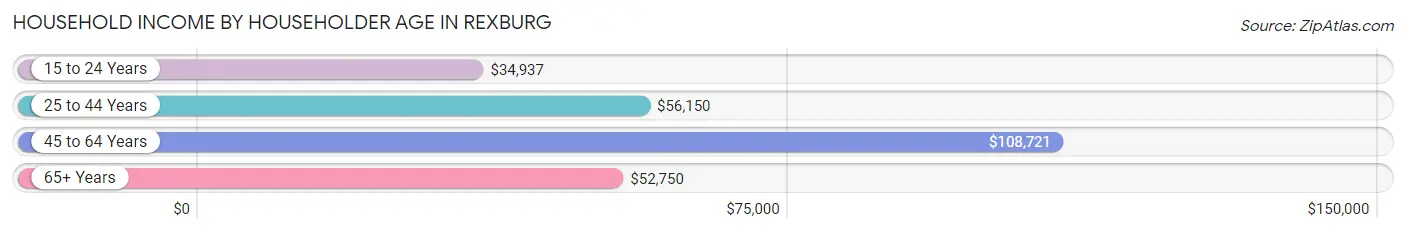
Household Income by Householder Age in Rexburg
The median household income in Rexburg is $46,286, with the highest median household income of $108,721 found in the 45 to 64 years age bracket for the primary householder. A total of 1,289 households (14.6%) fall into this category. Meanwhile, the 15 to 24 years age bracket for the primary householder has the lowest median household income of $34,937, with 4,205 households (47.8%) in this group.
| Income Bracket | # Households | Median Income |
| 15 to 24 Years | 4,205 (47.8%) | $34,937 |
| 25 to 44 Years | 2,623 (29.8%) | $56,150 |
| 45 to 64 Years | 1,289 (14.6%) | $108,721 |
| 65+ Years | 685 (7.8%) | $52,750 |
| Total | 8,802 (100.0%) | $46,286 |
Poverty in Rexburg
Income Below Poverty by Sex and Age in Rexburg
With 25.7% poverty level for males and 49.9% for females among the residents of Rexburg, 18 to 24 year old males and 18 to 24 year old females are the most vulnerable to poverty, with 2,099 males (34.1%) and 7,761 females (70.4%) in their respective age groups living below the poverty level.
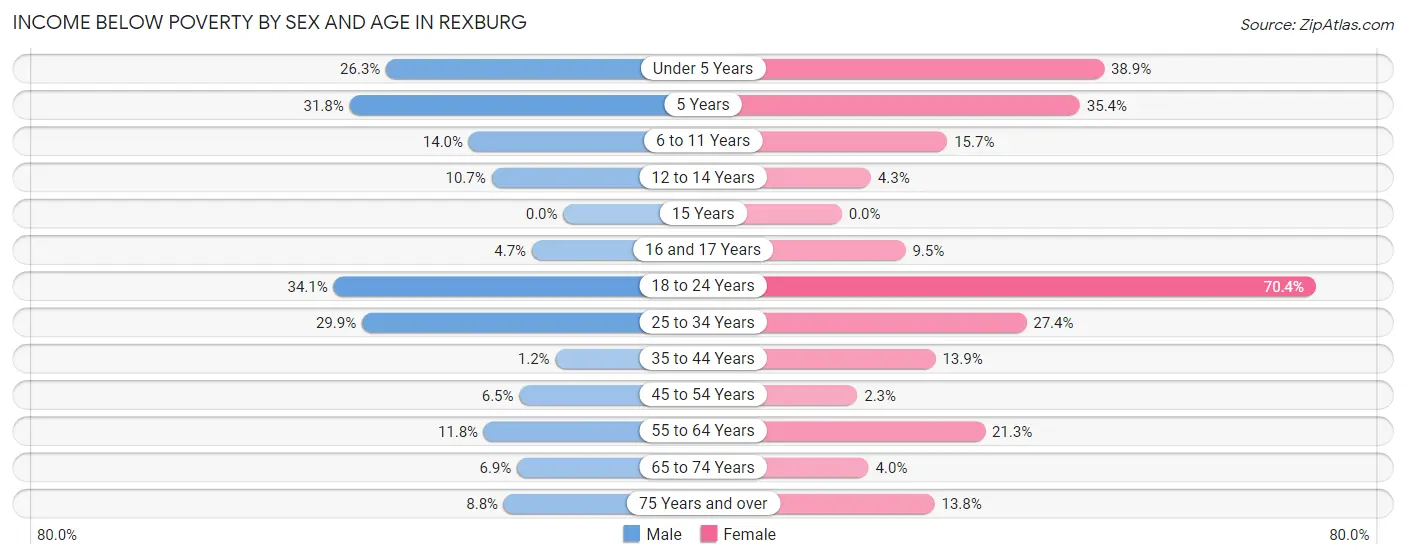
| Age Bracket | Male | Female |
| Under 5 Years | 356 (26.3%) | 443 (38.9%) |
| 5 Years | 60 (31.8%) | 76 (35.3%) |
| 6 to 11 Years | 86 (14.0%) | 109 (15.7%) |
| 12 to 14 Years | 50 (10.7%) | 15 (4.3%) |
| 15 Years | 0 (0.0%) | 0 (0.0%) |
| 16 and 17 Years | 22 (4.7%) | 33 (9.5%) |
| 18 to 24 Years | 2,099 (34.1%) | 7,761 (70.4%) |
| 25 to 34 Years | 855 (29.9%) | 535 (27.4%) |
| 35 to 44 Years | 7 (1.2%) | 106 (13.9%) |
| 45 to 54 Years | 36 (6.5%) | 16 (2.3%) |
| 55 to 64 Years | 58 (11.8%) | 115 (21.3%) |
| 65 to 74 Years | 16 (6.9%) | 12 (4.0%) |
| 75 Years and over | 27 (8.8%) | 53 (13.8%) |
| Total | 3,672 (25.7%) | 9,274 (49.9%) |
Income Above Poverty by Sex and Age in Rexburg
According to the poverty statistics in Rexburg, males aged 15 years and females aged 15 years are the age groups that are most secure financially, with 100.0% of males and 100.0% of females in these age groups living above the poverty line.
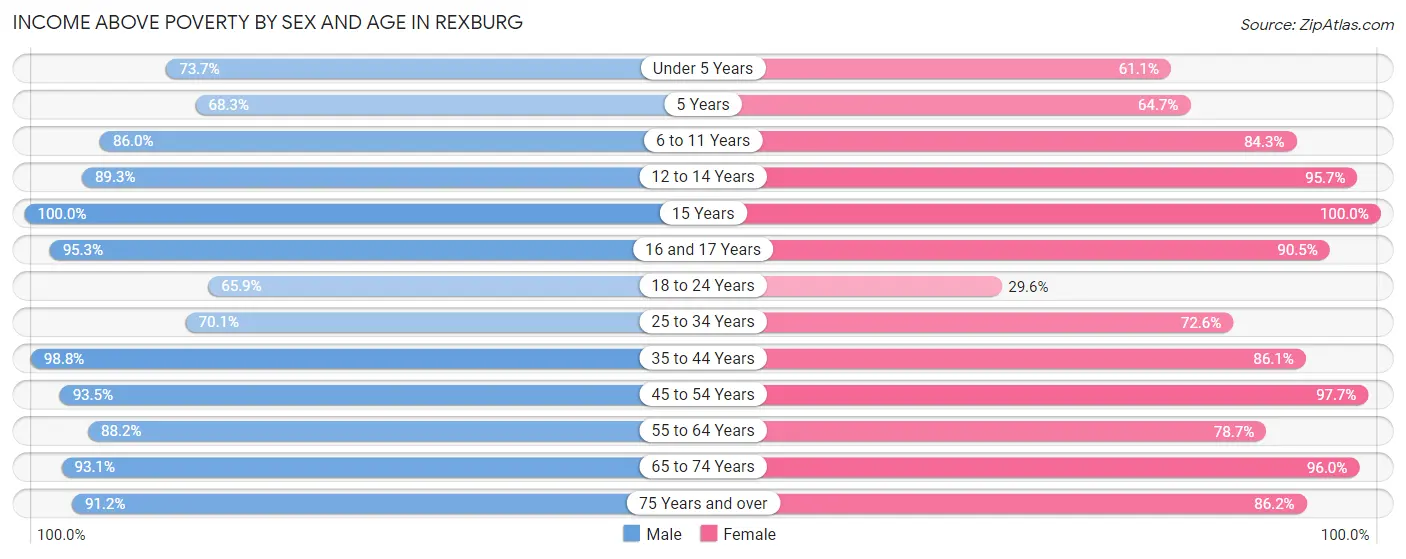
| Age Bracket | Male | Female |
| Under 5 Years | 997 (73.7%) | 695 (61.1%) |
| 5 Years | 129 (68.2%) | 139 (64.6%) |
| 6 to 11 Years | 527 (86.0%) | 587 (84.3%) |
| 12 to 14 Years | 419 (89.3%) | 332 (95.7%) |
| 15 Years | 28 (100.0%) | 158 (100.0%) |
| 16 and 17 Years | 449 (95.3%) | 316 (90.5%) |
| 18 to 24 Years | 4,052 (65.9%) | 3,264 (29.6%) |
| 25 to 34 Years | 2,005 (70.1%) | 1,418 (72.6%) |
| 35 to 44 Years | 584 (98.8%) | 656 (86.1%) |
| 45 to 54 Years | 515 (93.5%) | 680 (97.7%) |
| 55 to 64 Years | 434 (88.2%) | 426 (78.7%) |
| 65 to 74 Years | 217 (93.1%) | 289 (96.0%) |
| 75 Years and over | 279 (91.2%) | 332 (86.2%) |
| Total | 10,635 (74.3%) | 9,292 (50.0%) |
Income Below Poverty Among Married-Couple Families in Rexburg
The poverty statistics for married-couple families in Rexburg show that 18.5% or 1,061 of the total 5,732 families live below the poverty line. Families with 1 or 2 children have the highest poverty rate of 24.9%, comprising of 363 families. On the other hand, families with 3 or 4 children have the lowest poverty rate of 13.6%, which includes 98 families.
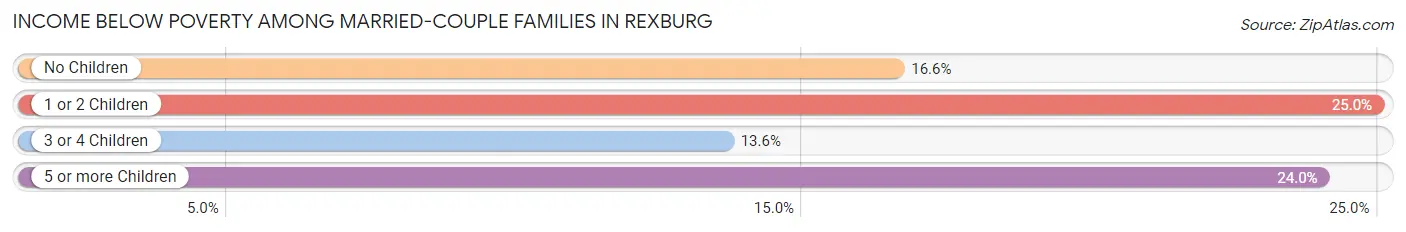
| Children | Above Poverty | Below Poverty |
| No Children | 2,863 (83.4%) | 570 (16.6%) |
| 1 or 2 Children | 1,092 (75.0%) | 363 (24.9%) |
| 3 or 4 Children | 621 (86.4%) | 98 (13.6%) |
| 5 or more Children | 95 (76.0%) | 30 (24.0%) |
| Total | 4,671 (81.5%) | 1,061 (18.5%) |
Income Below Poverty Among Single-Parent Households in Rexburg
According to the poverty data in Rexburg, 10.9% or 7 single-father households and 8.3% or 36 single-mother households are living below the poverty line. Among single-father households, those with no children have the highest poverty rate, with 7 households (46.7%) experiencing poverty. Likewise, among single-mother households, those with 3 or 4 children have the highest poverty rate, with 28 households (73.7%) falling below the poverty line.
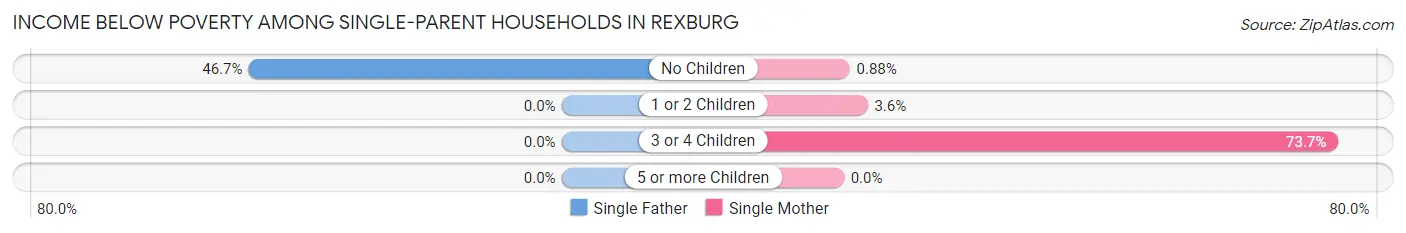
| Children | Single Father | Single Mother |
| No Children | 7 (46.7%) | 2 (0.9%) |
| 1 or 2 Children | 0 (0.0%) | 6 (3.5%) |
| 3 or 4 Children | 0 (0.0%) | 28 (73.7%) |
| 5 or more Children | 0 (0.0%) | 0 (0.0%) |
| Total | 7 (10.9%) | 36 (8.3%) |
Income Below Poverty Among Married-Couple vs Single-Parent Households in Rexburg
The poverty data for Rexburg shows that 1,061 of the married-couple family households (18.5%) and 43 of the single-parent households (8.6%) are living below the poverty level. Within the married-couple family households, those with 1 or 2 children have the highest poverty rate, with 363 households (24.9%) falling below the poverty line. Among the single-parent households, those with 3 or 4 children have the highest poverty rate, with 28 household (65.1%) living below poverty.
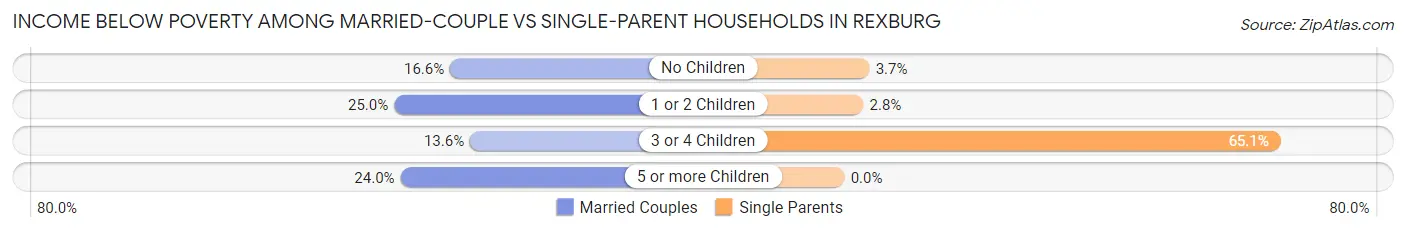
| Children | Married-Couple Families | Single-Parent Households |
| No Children | 570 (16.6%) | 9 (3.7%) |
| 1 or 2 Children | 363 (24.9%) | 6 (2.8%) |
| 3 or 4 Children | 98 (13.6%) | 28 (65.1%) |
| 5 or more Children | 30 (24.0%) | 0 (0.0%) |
| Total | 1,061 (18.5%) | 43 (8.6%) |
Race in Rexburg
The most populous races in Rexburg are White / Caucasian (34,015 | 87.7%), Hispanic or Latino (3,667 | 9.5%), and Two or more Races (2,242 | 5.8%).
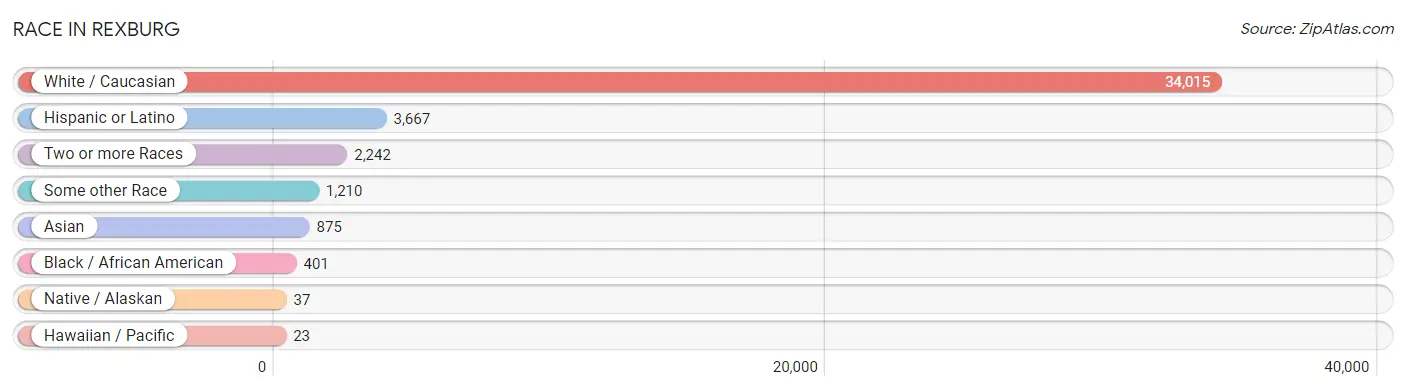
| Race | # Population | % Population |
| Asian | 875 | 2.2% |
| Black / African American | 401 | 1.0% |
| Hawaiian / Pacific | 23 | 0.1% |
| Hispanic or Latino | 3,667 | 9.5% |
| Native / Alaskan | 37 | 0.1% |
| White / Caucasian | 34,015 | 87.7% |
| Two or more Races | 2,242 | 5.8% |
| Some other Race | 1,210 | 3.1% |
| Total | 38,803 | 100.0% |
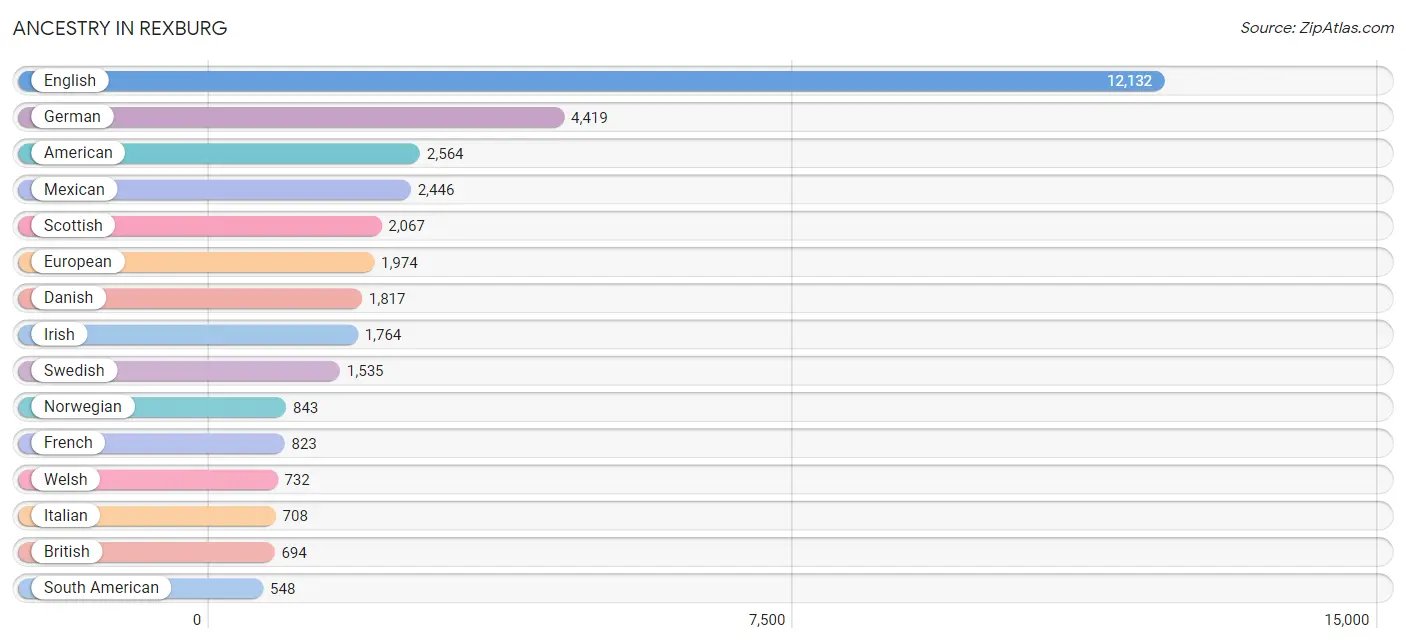
Ancestry in Rexburg
The most populous ancestries reported in Rexburg are English (12,132 | 31.3%), German (4,419 | 11.4%), American (2,564 | 6.6%), Mexican (2,446 | 6.3%), and Scottish (2,067 | 5.3%), together accounting for 60.9% of all Rexburg residents.
| Ancestry | # Population | % Population |
| African | 169 | 0.4% |
| Albanian | 10 | 0.0% |
| American | 2,564 | 6.6% |
| Arab | 28 | 0.1% |
| Argentinean | 36 | 0.1% |
| Armenian | 79 | 0.2% |
| Austrian | 54 | 0.1% |
| Bangladeshi | 197 | 0.5% |
| Belgian | 9 | 0.0% |
| Bhutanese | 91 | 0.2% |
| Brazilian | 175 | 0.4% |
| British | 694 | 1.8% |
| Burmese | 43 | 0.1% |
| Canadian | 113 | 0.3% |
| Central American | 176 | 0.4% |
| Cherokee | 71 | 0.2% |
| Chilean | 27 | 0.1% |
| Choctaw | 98 | 0.3% |
| Colombian | 152 | 0.4% |
| Czech | 430 | 1.1% |
| Czechoslovakian | 116 | 0.3% |
| Danish | 1,817 | 4.7% |
| Dominican | 82 | 0.2% |
| Dutch | 351 | 0.9% |
| Eastern European | 13 | 0.0% |
| Ecuadorian | 208 | 0.5% |
| English | 12,132 | 31.3% |
| European | 1,974 | 5.1% |
| Filipino | 99 | 0.3% |
| Finnish | 26 | 0.1% |
| French | 823 | 2.1% |
| French Canadian | 18 | 0.1% |
| German | 4,419 | 11.4% |
| Ghanaian | 2 | 0.0% |
| Greek | 18 | 0.1% |
| Guatemalan | 54 | 0.1% |
| Haitian | 67 | 0.2% |
| Honduran | 13 | 0.0% |
| Hungarian | 17 | 0.0% |
| Indian (Asian) | 467 | 1.2% |
| Irish | 1,764 | 4.5% |
| Italian | 708 | 1.8% |
| Korean | 345 | 0.9% |
| Laotian | 37 | 0.1% |
| Lebanese | 28 | 0.1% |
| Lithuanian | 28 | 0.1% |
| Mexican | 2,446 | 6.3% |
| Native Hawaiian | 152 | 0.4% |
| Nicaraguan | 31 | 0.1% |
| Northern European | 14 | 0.0% |
| Norwegian | 843 | 2.2% |
| Paiute | 12 | 0.0% |
| Peruvian | 24 | 0.1% |
| Polish | 321 | 0.8% |
| Portuguese | 152 | 0.4% |
| Puerto Rican | 104 | 0.3% |
| Romanian | 26 | 0.1% |
| Russian | 97 | 0.3% |
| Salvadoran | 78 | 0.2% |
| Samoan | 36 | 0.1% |
| Scandinavian | 366 | 0.9% |
| Scotch-Irish | 216 | 0.6% |
| Scottish | 2,067 | 5.3% |
| Sierra Leonean | 15 | 0.0% |
| Slovak | 23 | 0.1% |
| South American | 548 | 1.4% |
| Spaniard | 32 | 0.1% |
| Subsaharan African | 186 | 0.5% |
| Swedish | 1,535 | 4.0% |
| Swiss | 310 | 0.8% |
| Tongan | 69 | 0.2% |
| Ukrainian | 28 | 0.1% |
| Venezuelan | 59 | 0.2% |
| Welsh | 732 | 1.9% | View All 74 Rows |
Immigrants in Rexburg
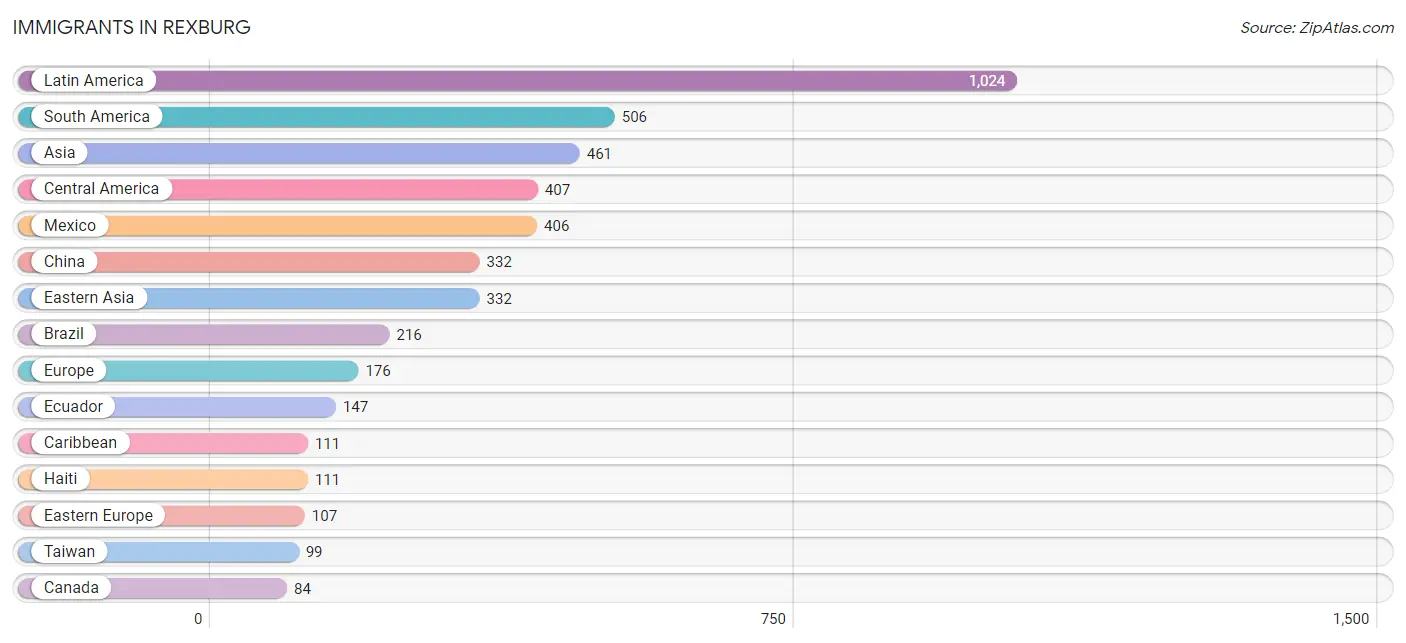
The most numerous immigrant groups reported in Rexburg came from Latin America (1,024 | 2.6%), South America (506 | 1.3%), Asia (461 | 1.2%), Central America (407 | 1.1%), and Mexico (406 | 1.1%), together accounting for 7.2% of all Rexburg residents.
| Immigration Origin | # Population | % Population |
| Africa | 69 | 0.2% |
| Asia | 461 | 1.2% |
| Brazil | 216 | 0.6% |
| Canada | 84 | 0.2% |
| Caribbean | 111 | 0.3% |
| Central America | 407 | 1.1% |
| Chile | 17 | 0.0% |
| China | 332 | 0.9% |
| Colombia | 78 | 0.2% |
| Eastern Asia | 332 | 0.9% |
| Eastern Europe | 107 | 0.3% |
| Ecuador | 147 | 0.4% |
| El Salvador | 1 | 0.0% |
| England | 16 | 0.0% |
| Europe | 176 | 0.4% |
| France | 21 | 0.1% |
| Germany | 8 | 0.0% |
| Ghana | 47 | 0.1% |
| Haiti | 111 | 0.3% |
| Hong Kong | 61 | 0.2% |
| Italy | 14 | 0.0% |
| Kuwait | 49 | 0.1% |
| Latin America | 1,024 | 2.6% |
| Mexico | 406 | 1.1% |
| Moldova | 12 | 0.0% |
| Northern Europe | 26 | 0.1% |
| Peru | 14 | 0.0% |
| Philippines | 33 | 0.1% |
| Russia | 67 | 0.2% |
| Sierra Leone | 15 | 0.0% |
| South Africa | 7 | 0.0% |
| South America | 506 | 1.3% |
| South Eastern Asia | 65 | 0.2% |
| Southern Europe | 14 | 0.0% |
| Syria | 15 | 0.0% |
| Taiwan | 99 | 0.3% |
| Thailand | 32 | 0.1% |
| Ukraine | 28 | 0.1% |
| Venezuela | 34 | 0.1% |
| Western Africa | 62 | 0.2% |
| Western Asia | 64 | 0.2% |
| Western Europe | 29 | 0.1% | View All 42 Rows |
Sex and Age in Rexburg
Sex and Age in Rexburg
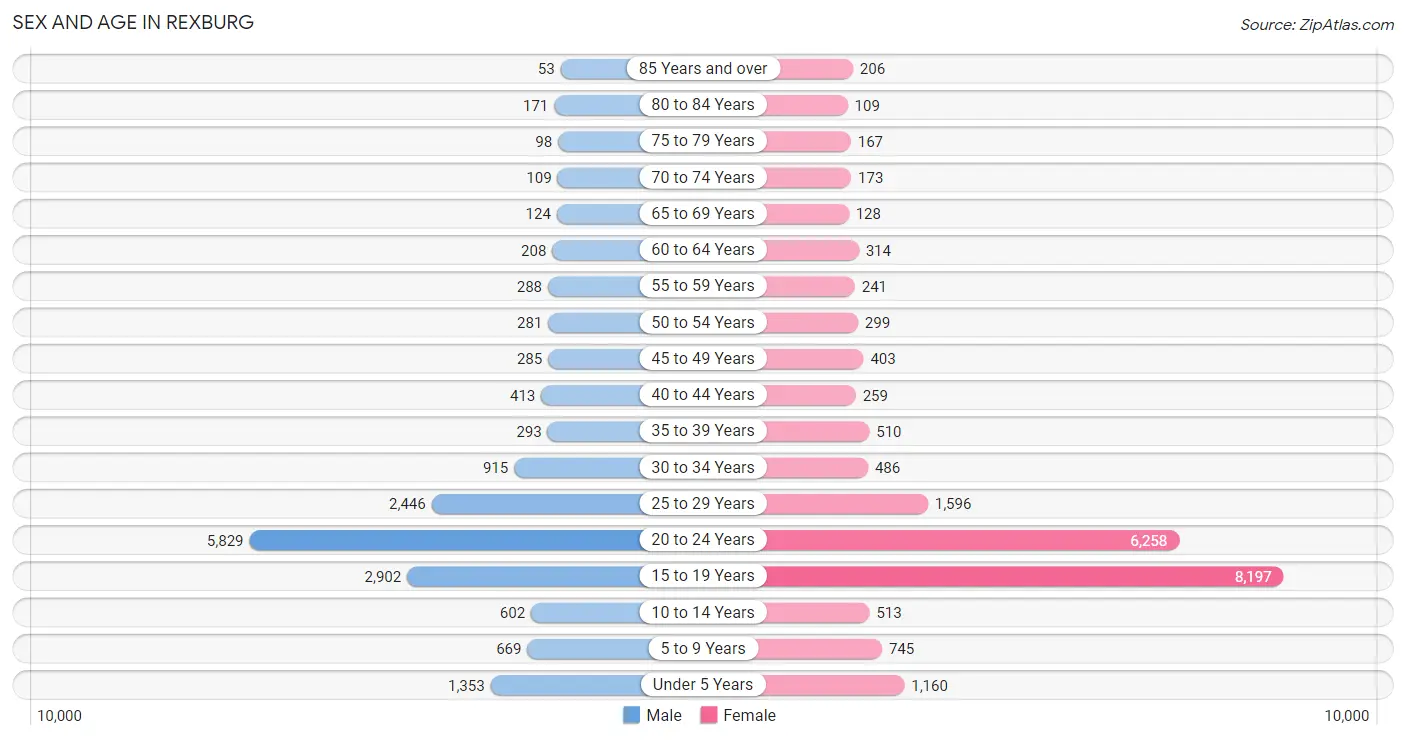
The most populous age groups in Rexburg are 20 to 24 Years (5,829 | 34.2%) for men and 15 to 19 Years (8,197 | 37.7%) for women.
| Age Bracket | Male | Female |
| Under 5 Years | 1,353 (7.9%) | 1,160 (5.3%) |
| 5 to 9 Years | 669 (3.9%) | 745 (3.4%) |
| 10 to 14 Years | 602 (3.5%) | 513 (2.4%) |
| 15 to 19 Years | 2,902 (17.0%) | 8,197 (37.7%) |
| 20 to 24 Years | 5,829 (34.2%) | 6,258 (28.7%) |
| 25 to 29 Years | 2,446 (14.4%) | 1,596 (7.3%) |
| 30 to 34 Years | 915 (5.4%) | 486 (2.2%) |
| 35 to 39 Years | 293 (1.7%) | 510 (2.3%) |
| 40 to 44 Years | 413 (2.4%) | 259 (1.2%) |
| 45 to 49 Years | 285 (1.7%) | 403 (1.8%) |
| 50 to 54 Years | 281 (1.7%) | 299 (1.4%) |
| 55 to 59 Years | 288 (1.7%) | 241 (1.1%) |
| 60 to 64 Years | 208 (1.2%) | 314 (1.4%) |
| 65 to 69 Years | 124 (0.7%) | 128 (0.6%) |
| 70 to 74 Years | 109 (0.6%) | 173 (0.8%) |
| 75 to 79 Years | 98 (0.6%) | 167 (0.8%) |
| 80 to 84 Years | 171 (1.0%) | 109 (0.5%) |
| 85 Years and over | 53 (0.3%) | 206 (0.9%) |
| Total | 17,039 (100.0%) | 21,764 (100.0%) |
Families and Households in Rexburg
Median Family Size in Rexburg
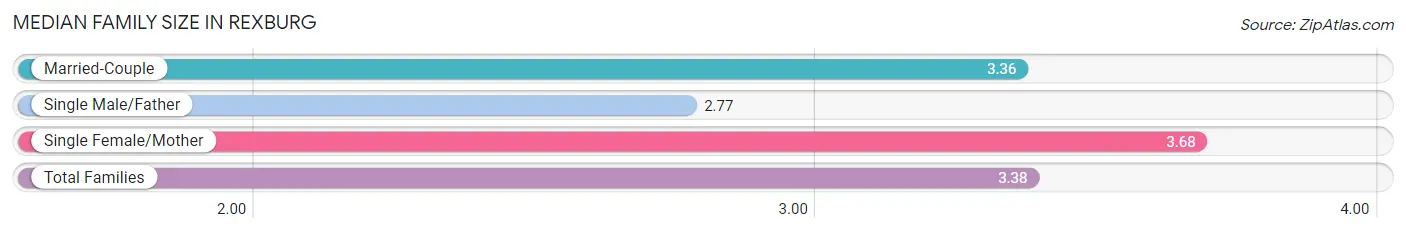
The median family size in Rexburg is 3.38 persons per family, with single female/mother families (433 | 7.0%) accounting for the largest median family size of 3.68 persons per family. On the other hand, single male/father families (64 | 1.0%) represent the smallest median family size with 2.77 persons per family.
| Family Type | # Families | Family Size |
| Married-Couple | 5,732 (92.0%) | 3.36 |
| Single Male/Father | 64 (1.0%) | 2.77 |
| Single Female/Mother | 433 (7.0%) | 3.68 |
| Total Families | 6,229 (100.0%) | 3.38 |
Median Household Size in Rexburg
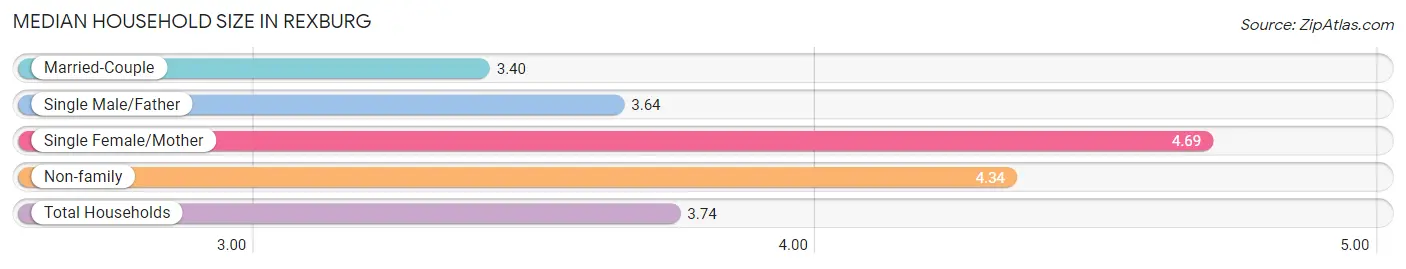
The median household size in Rexburg is 3.74 persons per household, with single female/mother households (433 | 4.9%) accounting for the largest median household size of 4.69 persons per household. married-couple households (5,732 | 65.1%) represent the smallest median household size with 3.40 persons per household.
| Household Type | # Households | Household Size |
| Married-Couple | 5,732 (65.1%) | 3.40 |
| Single Male/Father | 64 (0.7%) | 3.64 |
| Single Female/Mother | 433 (4.9%) | 4.69 |
| Non-family | 2,573 (29.2%) | 4.34 |
| Total Households | 8,802 (100.0%) | 3.74 |
Household Size by Marriage Status in Rexburg
Out of a total of 8,802 households in Rexburg, 6,229 (70.8%) are family households, while 2,573 (29.2%) are nonfamily households. The most numerous type of family households are 2-person households, comprising 3,287, and the most common type of nonfamily households are 1-person households, comprising 954.
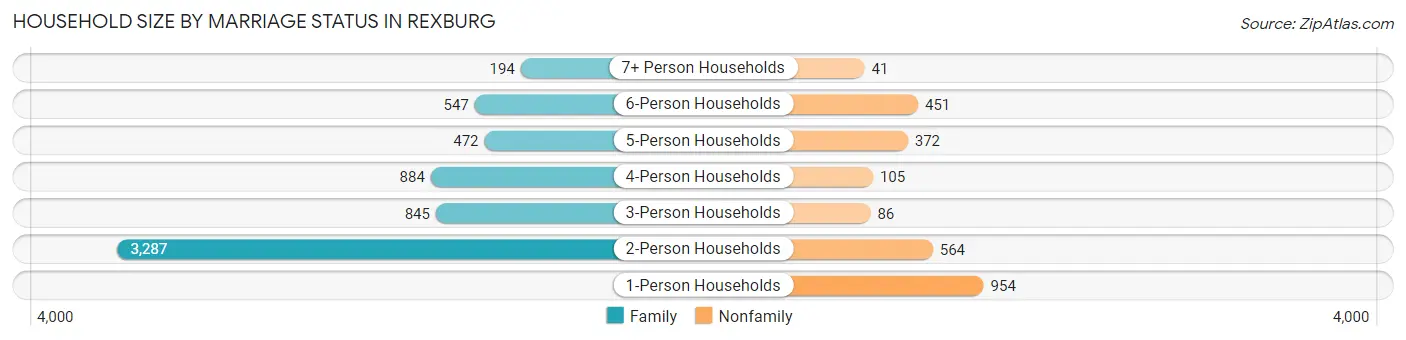
| Household Size | Family Households | Nonfamily Households |
| 1-Person Households | - | 954 (10.8%) |
| 2-Person Households | 3,287 (37.3%) | 564 (6.4%) |
| 3-Person Households | 845 (9.6%) | 86 (1.0%) |
| 4-Person Households | 884 (10.0%) | 105 (1.2%) |
| 5-Person Households | 472 (5.4%) | 372 (4.2%) |
| 6-Person Households | 547 (6.2%) | 451 (5.1%) |
| 7+ Person Households | 194 (2.2%) | 41 (0.5%) |
| Total | 6,229 (70.8%) | 2,573 (29.2%) |
Female Fertility in Rexburg
Fertility by Age in Rexburg
Average fertility rate in Rexburg is 40.0 births per 1,000 women. Women in the age bracket of 35 to 50 years have the highest fertility rate with 124.0 births per 1,000 women. Women in the age bracket of 20 to 34 years acount for 77.7% of all women with births.
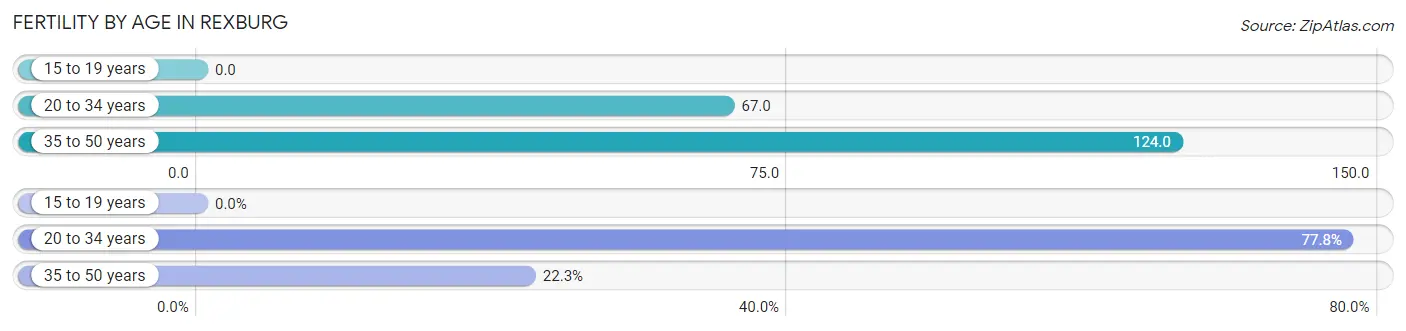
| Age Bracket | Women with Births | Births / 1,000 Women |
| 15 to 19 years | 0 (0.0%) | 0.0 |
| 20 to 34 years | 559 (77.7%) | 67.0 |
| 35 to 50 years | 160 (22.3%) | 124.0 |
| Total | 719 (100.0%) | 40.0 |
Fertility by Age by Marriage Status in Rexburg
97.2% of women with births (719) in Rexburg are married. The highest percentage of unmarried women with births falls into 35 to 50 years age bracket with 7.5% of them unmarried at the time of birth, while the lowest percentage of unmarried women with births belong to 20 to 34 years age bracket with 1.4% of them unmarried.
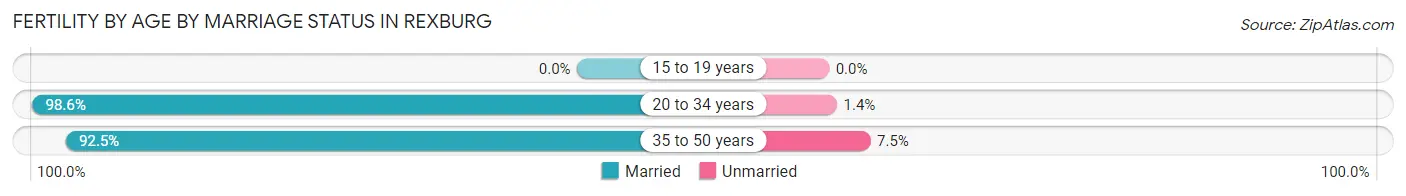
| Age Bracket | Married | Unmarried |
| 15 to 19 years | 0 (0.0%) | 0 (0.0%) |
| 20 to 34 years | 551 (98.6%) | 8 (1.4%) |
| 35 to 50 years | 148 (92.5%) | 12 (7.5%) |
| Total | 699 (97.2%) | 20 (2.8%) |
Fertility by Education in Rexburg
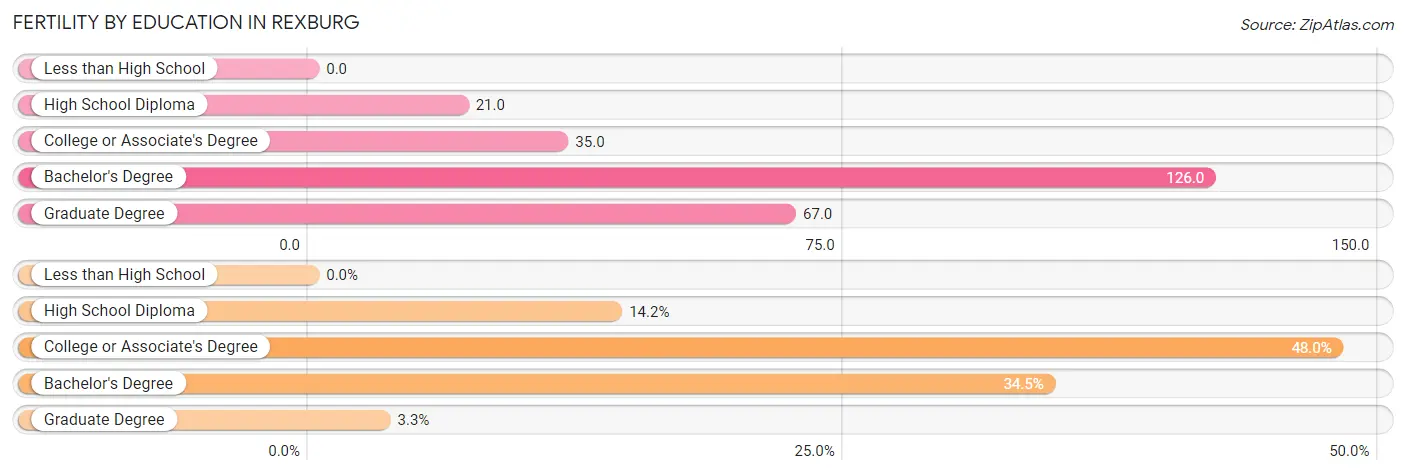
| Educational Attainment | Women with Births | Births / 1,000 Women |
| Less than High School | 0 (0.0%) | 0.0 |
| High School Diploma | 102 (14.2%) | 21.0 |
| College or Associate's Degree | 345 (48.0%) | 35.0 |
| Bachelor's Degree | 248 (34.5%) | 126.0 |
| Graduate Degree | 24 (3.3%) | 67.0 |
| Total | 719 (100.0%) | 40.0 |
Fertility by Education by Marriage Status in Rexburg
2.8% of women with births in Rexburg are unmarried. Women with the educational attainment of bachelor's degree are most likely to be married with 100.0% of them married at childbirth, while women with the educational attainment of high school diploma are least likely to be married with 7.8% of them unmarried at childbirth.
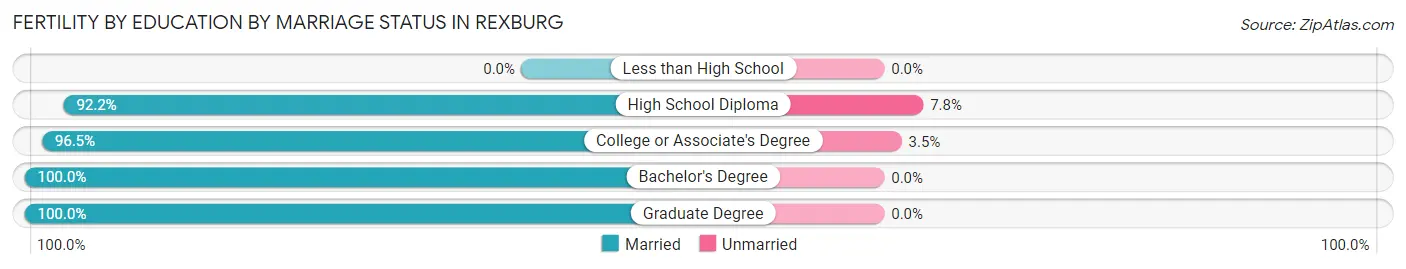
| Educational Attainment | Married | Unmarried |
| Less than High School | 0 (0.0%) | 0 (0.0%) |
| High School Diploma | 94 (92.2%) | 8 (7.8%) |
| College or Associate's Degree | 333 (96.5%) | 12 (3.5%) |
| Bachelor's Degree | 248 (100.0%) | 0 (0.0%) |
| Graduate Degree | 24 (100.0%) | 0 (0.0%) |
| Total | 699 (97.2%) | 20 (2.8%) |
Employment Characteristics in Rexburg
Employment by Class of Employer in Rexburg
Among the 20,607 employed individuals in Rexburg, private company employees (13,659 | 66.3%), not-for-profit organizations (2,681 | 13.0%), and local government employees (1,762 | 8.6%) make up the most common classes of employment.
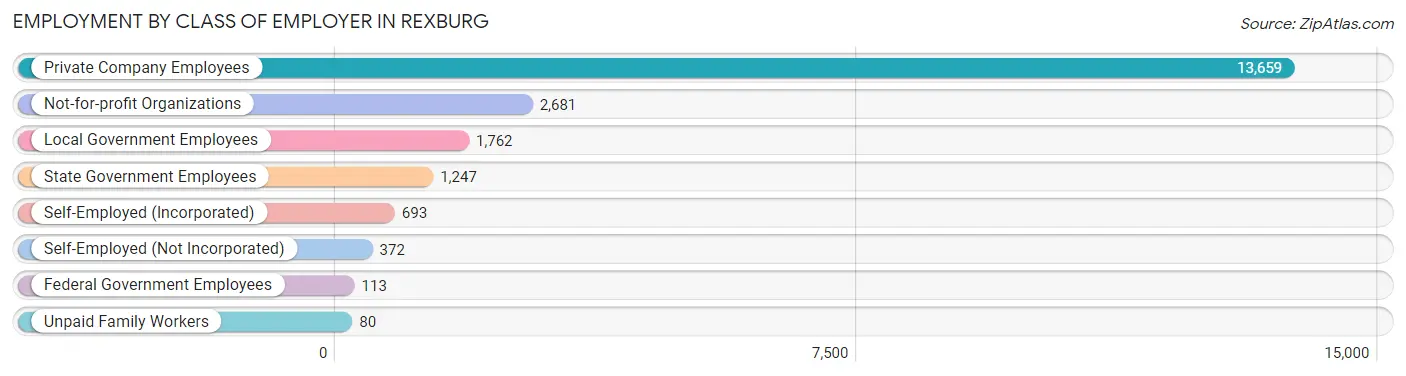
| Employer Class | # Employees | % Employees |
| Private Company Employees | 13,659 | 66.3% |
| Self-Employed (Incorporated) | 693 | 3.4% |
| Self-Employed (Not Incorporated) | 372 | 1.8% |
| Not-for-profit Organizations | 2,681 | 13.0% |
| Local Government Employees | 1,762 | 8.6% |
| State Government Employees | 1,247 | 6.0% |
| Federal Government Employees | 113 | 0.5% |
| Unpaid Family Workers | 80 | 0.4% |
| Total | 20,607 | 100.0% |
Employment Status by Age in Rexburg
According to the labor force statistics for Rexburg, out of the total population over 16 years of age (33,575), 67.6% or 22,697 individuals are in the labor force, with 7.8% or 1,770 of them unemployed. The age group with the highest labor force participation rate is 45 to 54 years, with 83.9% or 1,064 individuals in the labor force. Within the labor force, the 30 to 34 years age range has the highest percentage of unemployed individuals, with 10.3% or 102 of them being unemployed.
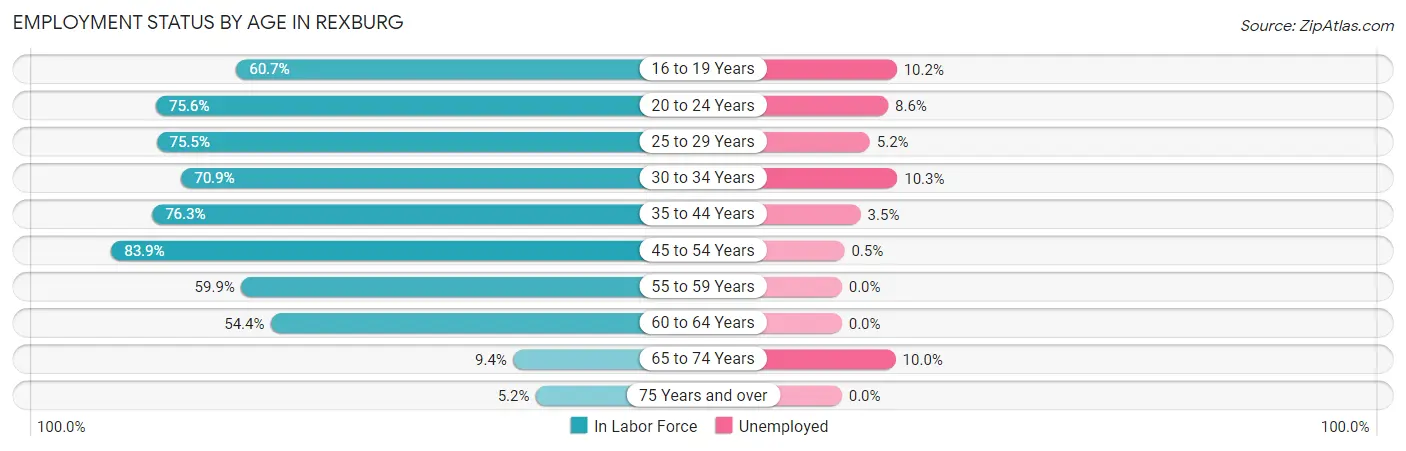
| Age Bracket | In Labor Force | Unemployed |
| 16 to 19 Years | 6,624 (60.7%) | 676 (10.2%) |
| 20 to 24 Years | 9,138 (75.6%) | 786 (8.6%) |
| 25 to 29 Years | 3,052 (75.5%) | 159 (5.2%) |
| 30 to 34 Years | 993 (70.9%) | 102 (10.3%) |
| 35 to 44 Years | 1,125 (76.3%) | 39 (3.5%) |
| 45 to 54 Years | 1,064 (83.9%) | 5 (0.5%) |
| 55 to 59 Years | 317 (59.9%) | 0 (0.0%) |
| 60 to 64 Years | 284 (54.4%) | 0 (0.0%) |
| 65 to 74 Years | 50 (9.4%) | 5 (10.0%) |
| 75 Years and over | 42 (5.2%) | 0 (0.0%) |
| Total | 22,697 (67.6%) | 1,770 (7.8%) |
Employment Status by Educational Attainment in Rexburg
According to labor force statistics for Rexburg, 74.0% of individuals (6,835) out of the total population between 25 and 64 years of age (9,237) are in the labor force, with 4.5% or 308 of them being unemployed. The group with the highest labor force participation rate are those with the educational attainment of less than high school, with 93.6% or 103 individuals in the labor force. Within the labor force, individuals with less than high school education have the highest percentage of unemployment, with 12.6% or 13 of them being unemployed.
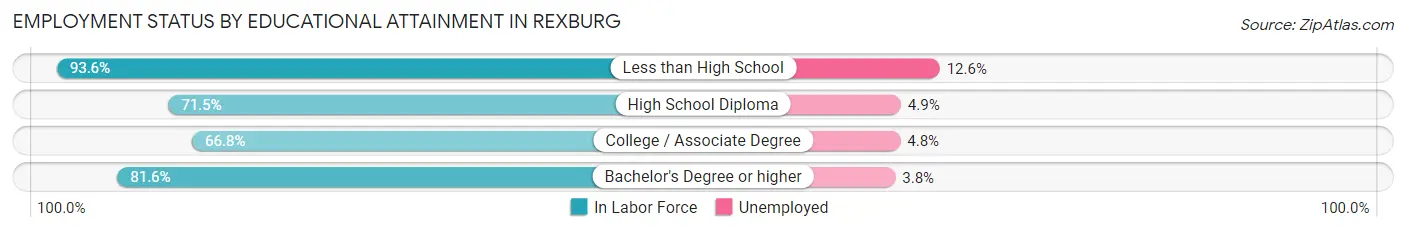
| Educational Attainment | In Labor Force | Unemployed |
| Less than High School | 103 (93.6%) | 14 (12.6%) |
| High School Diploma | 969 (71.5%) | 66 (4.9%) |
| College / Associate Degree | 2,589 (66.8%) | 186 (4.8%) |
| Bachelor's Degree or higher | 3,179 (81.6%) | 148 (3.8%) |
| Total | 6,835 (74.0%) | 416 (4.5%) |
Employment Occupations by Sex in Rexburg
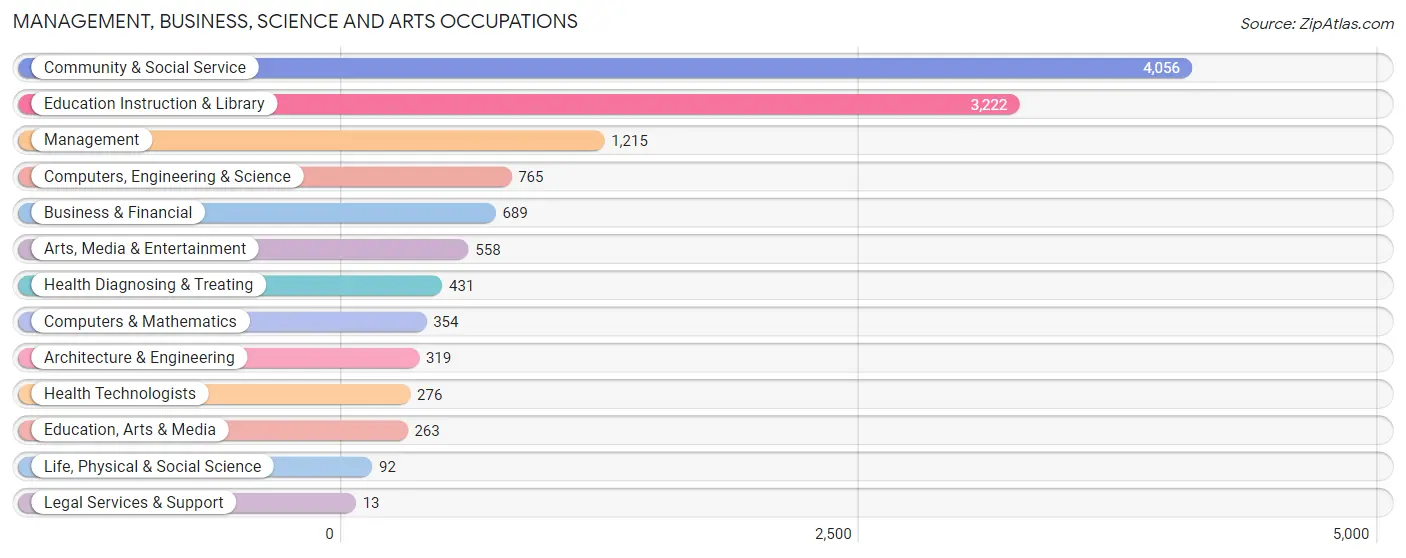
Management, Business, Science and Arts Occupations
The most common Management, Business, Science and Arts occupations in Rexburg are Community & Social Service (4,056 | 19.4%), Education Instruction & Library (3,222 | 15.4%), Management (1,215 | 5.8%), Computers, Engineering & Science (765 | 3.7%), and Business & Financial (689 | 3.3%).
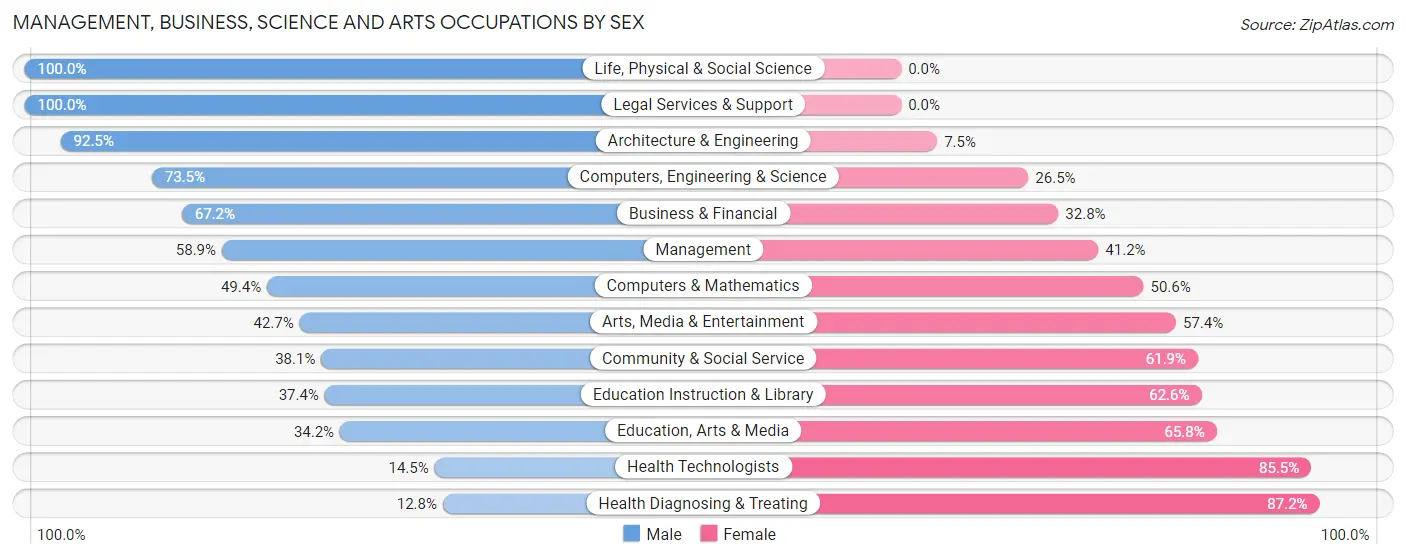
Management, Business, Science and Arts Occupations by Sex
Within the Management, Business, Science and Arts occupations in Rexburg, the most male-oriented occupations are Life, Physical & Social Science (100.0%), Legal Services & Support (100.0%), and Architecture & Engineering (92.5%), while the most female-oriented occupations are Health Diagnosing & Treating (87.2%), Health Technologists (85.5%), and Education, Arts & Media (65.8%).
| Occupation | Male | Female |
| Management | 715 (58.9%) | 500 (41.1%) |
| Business & Financial | 463 (67.2%) | 226 (32.8%) |
| Computers, Engineering & Science | 562 (73.5%) | 203 (26.5%) |
| Computers & Mathematics | 175 (49.4%) | 179 (50.6%) |
| Architecture & Engineering | 295 (92.5%) | 24 (7.5%) |
| Life, Physical & Social Science | 92 (100.0%) | 0 (0.0%) |
| Community & Social Service | 1,546 (38.1%) | 2,510 (61.9%) |
| Education, Arts & Media | 90 (34.2%) | 173 (65.8%) |
| Legal Services & Support | 13 (100.0%) | 0 (0.0%) |
| Education Instruction & Library | 1,205 (37.4%) | 2,017 (62.6%) |
| Arts, Media & Entertainment | 238 (42.6%) | 320 (57.4%) |
| Health Diagnosing & Treating | 55 (12.8%) | 376 (87.2%) |
| Health Technologists | 40 (14.5%) | 236 (85.5%) |
| Total (Category) | 3,341 (46.7%) | 3,815 (53.3%) |
| Total (Overall) | 9,956 (47.6%) | 10,966 (52.4%) |
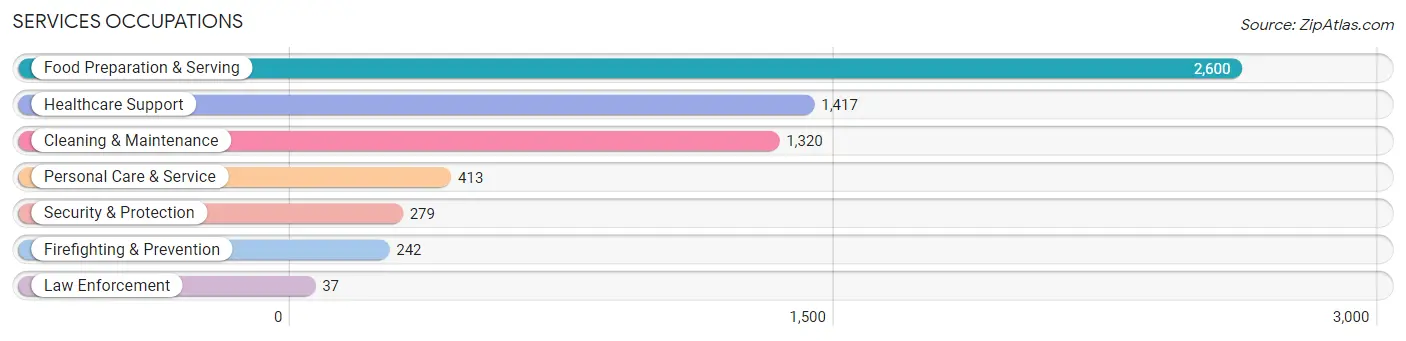
Services Occupations
The most common Services occupations in Rexburg are Food Preparation & Serving (2,600 | 12.4%), Healthcare Support (1,417 | 6.8%), Cleaning & Maintenance (1,320 | 6.3%), Personal Care & Service (413 | 2.0%), and Security & Protection (279 | 1.3%).
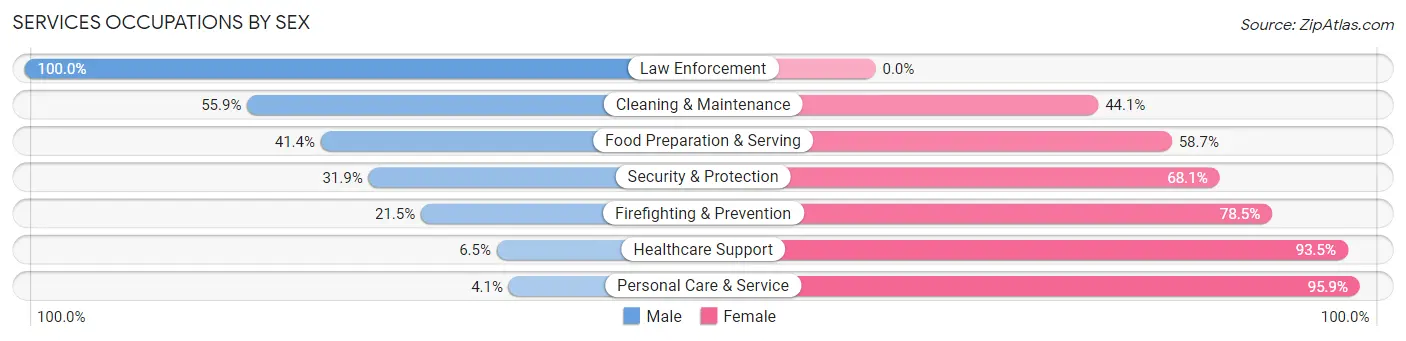
Services Occupations by Sex
Within the Services occupations in Rexburg, the most male-oriented occupations are Law Enforcement (100.0%), Cleaning & Maintenance (55.9%), and Food Preparation & Serving (41.3%), while the most female-oriented occupations are Personal Care & Service (95.9%), Healthcare Support (93.5%), and Firefighting & Prevention (78.5%).
| Occupation | Male | Female |
| Healthcare Support | 92 (6.5%) | 1,325 (93.5%) |
| Security & Protection | 89 (31.9%) | 190 (68.1%) |
| Firefighting & Prevention | 52 (21.5%) | 190 (78.5%) |
| Law Enforcement | 37 (100.0%) | 0 (0.0%) |
| Food Preparation & Serving | 1,075 (41.3%) | 1,525 (58.7%) |
| Cleaning & Maintenance | 738 (55.9%) | 582 (44.1%) |
| Personal Care & Service | 17 (4.1%) | 396 (95.9%) |
| Total (Category) | 2,011 (33.4%) | 4,018 (66.6%) |
| Total (Overall) | 9,956 (47.6%) | 10,966 (52.4%) |
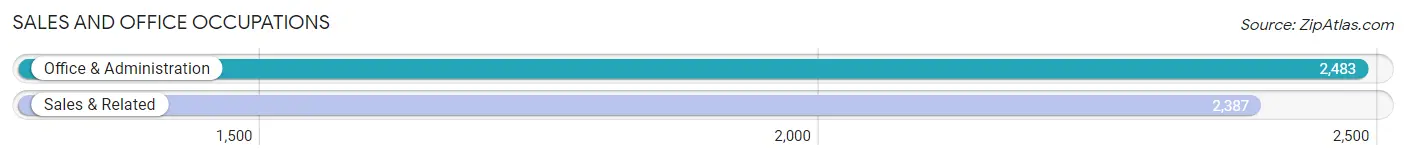
Sales and Office Occupations
The most common Sales and Office occupations in Rexburg are Office & Administration (2,483 | 11.9%), and Sales & Related (2,387 | 11.4%).
Sales and Office Occupations by Sex
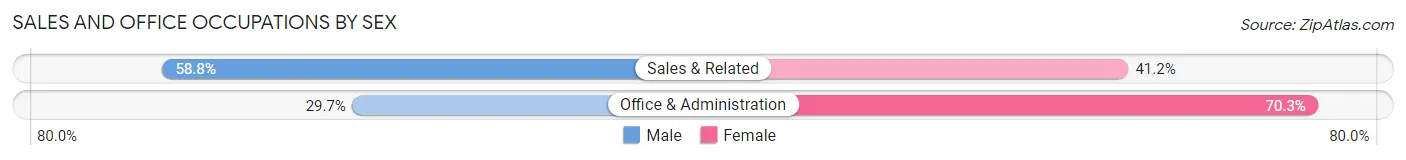
| Occupation | Male | Female |
| Sales & Related | 1,403 (58.8%) | 984 (41.2%) |
| Office & Administration | 737 (29.7%) | 1,746 (70.3%) |
| Total (Category) | 2,140 (43.9%) | 2,730 (56.1%) |
| Total (Overall) | 9,956 (47.6%) | 10,966 (52.4%) |
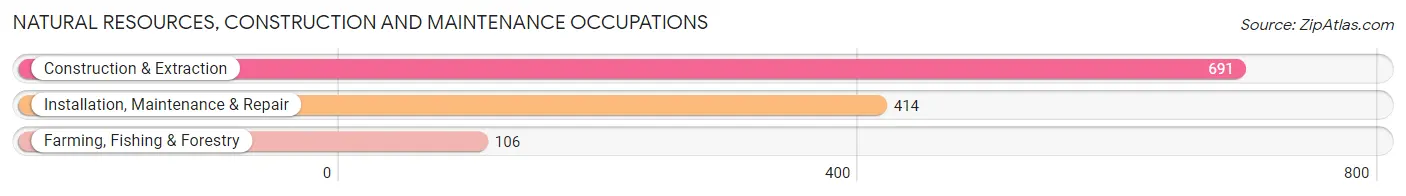
Natural Resources, Construction and Maintenance Occupations
The most common Natural Resources, Construction and Maintenance occupations in Rexburg are Construction & Extraction (691 | 3.3%), Installation, Maintenance & Repair (414 | 2.0%), and Farming, Fishing & Forestry (106 | 0.5%).
Natural Resources, Construction and Maintenance Occupations by Sex
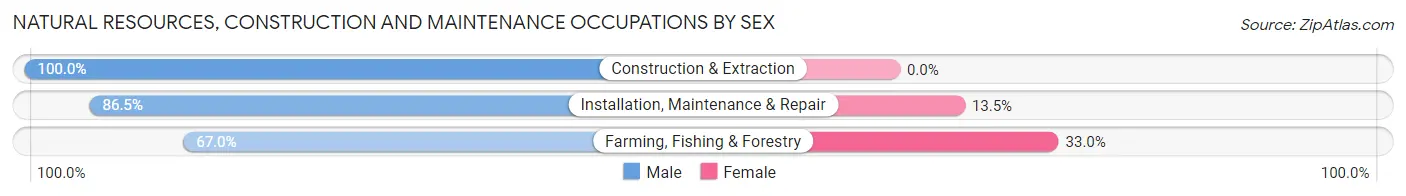
| Occupation | Male | Female |
| Farming, Fishing & Forestry | 71 (67.0%) | 35 (33.0%) |
| Construction & Extraction | 691 (100.0%) | 0 (0.0%) |
| Installation, Maintenance & Repair | 358 (86.5%) | 56 (13.5%) |
| Total (Category) | 1,120 (92.5%) | 91 (7.5%) |
| Total (Overall) | 9,956 (47.6%) | 10,966 (52.4%) |
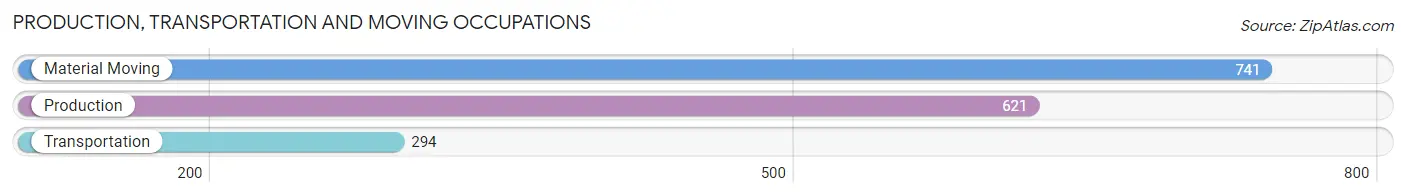
Production, Transportation and Moving Occupations
The most common Production, Transportation and Moving occupations in Rexburg are Material Moving (741 | 3.5%), Production (621 | 3.0%), and Transportation (294 | 1.4%).
Production, Transportation and Moving Occupations by Sex
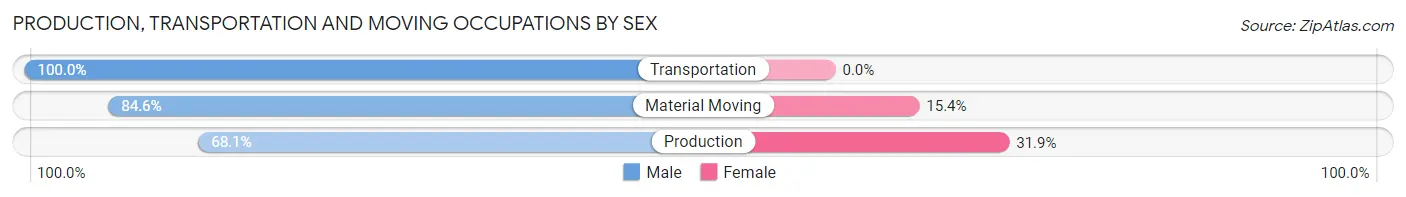
| Occupation | Male | Female |
| Production | 423 (68.1%) | 198 (31.9%) |
| Transportation | 294 (100.0%) | 0 (0.0%) |
| Material Moving | 627 (84.6%) | 114 (15.4%) |
| Total (Category) | 1,344 (81.2%) | 312 (18.8%) |
| Total (Overall) | 9,956 (47.6%) | 10,966 (52.4%) |
Employment Industries by Sex in Rexburg
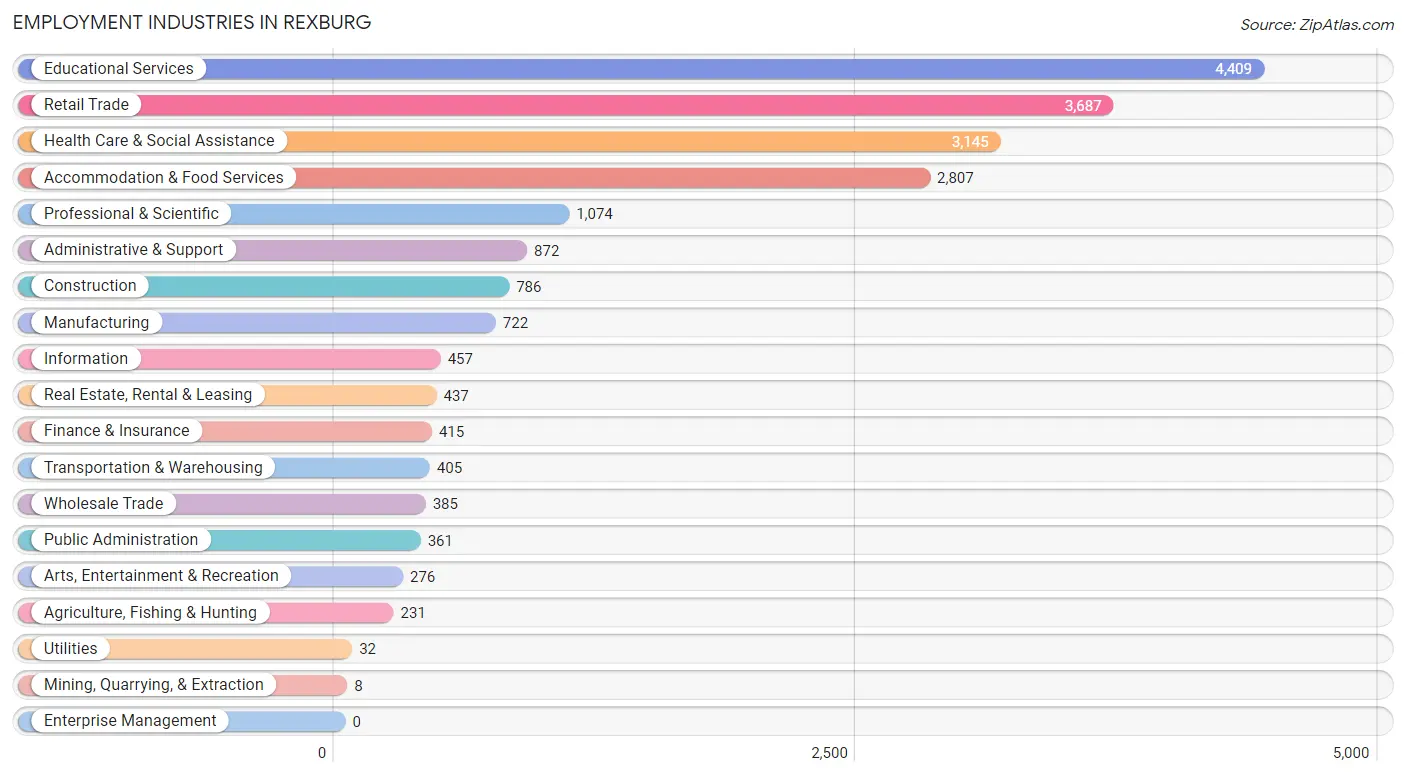
Employment Industries in Rexburg
The major employment industries in Rexburg include Educational Services (4,409 | 21.1%), Retail Trade (3,687 | 17.6%), Health Care & Social Assistance (3,145 | 15.0%), Accommodation & Food Services (2,807 | 13.4%), and Professional & Scientific (1,074 | 5.1%).
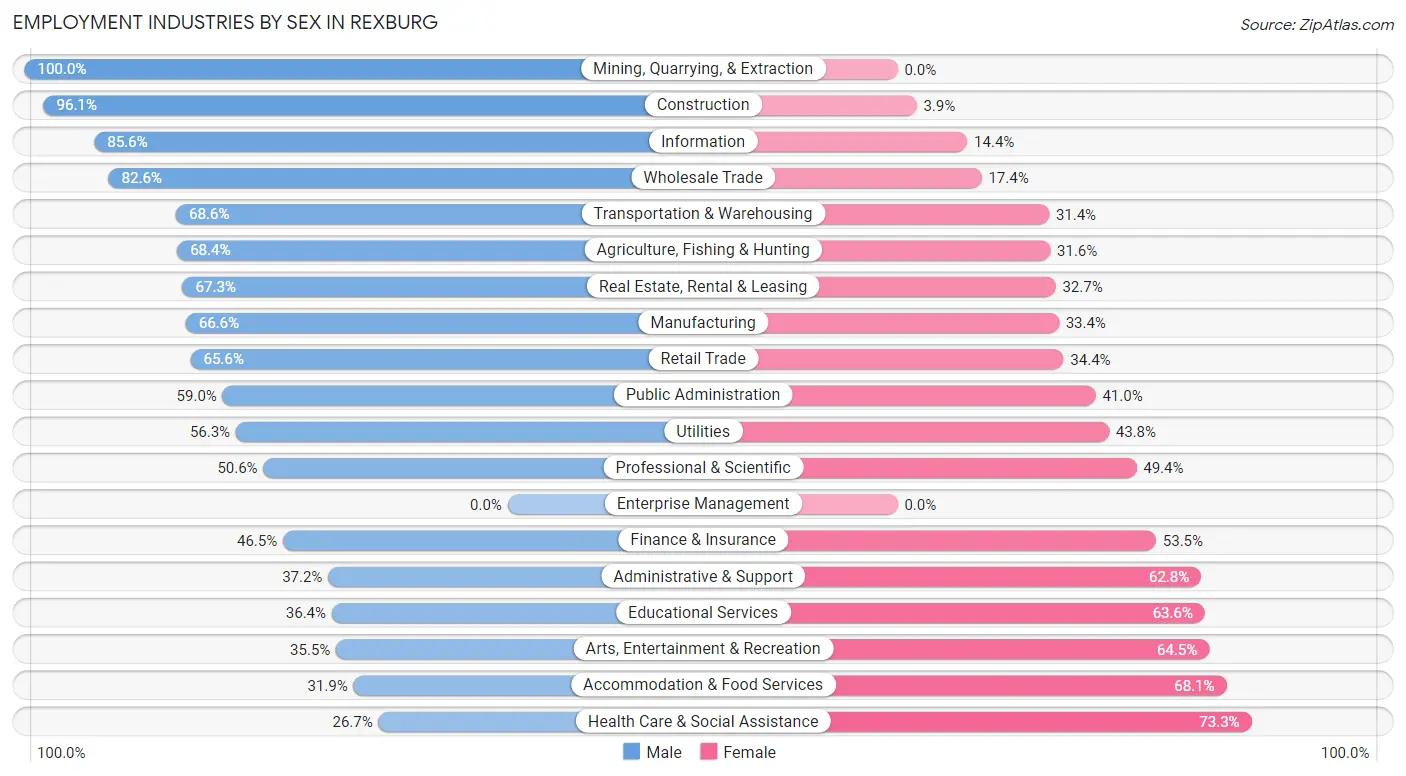
Employment Industries by Sex in Rexburg
The Rexburg industries that see more men than women are Mining, Quarrying, & Extraction (100.0%), Construction (96.1%), and Information (85.6%), whereas the industries that tend to have a higher number of women are Health Care & Social Assistance (73.3%), Accommodation & Food Services (68.1%), and Arts, Entertainment & Recreation (64.5%).
| Industry | Male | Female |
| Agriculture, Fishing & Hunting | 158 (68.4%) | 73 (31.6%) |
| Mining, Quarrying, & Extraction | 8 (100.0%) | 0 (0.0%) |
| Construction | 755 (96.1%) | 31 (3.9%) |
| Manufacturing | 481 (66.6%) | 241 (33.4%) |
| Wholesale Trade | 318 (82.6%) | 67 (17.4%) |
| Retail Trade | 2,420 (65.6%) | 1,267 (34.4%) |
| Transportation & Warehousing | 278 (68.6%) | 127 (31.4%) |
| Utilities | 18 (56.2%) | 14 (43.8%) |
| Information | 391 (85.6%) | 66 (14.4%) |
| Finance & Insurance | 193 (46.5%) | 222 (53.5%) |
| Real Estate, Rental & Leasing | 294 (67.3%) | 143 (32.7%) |
| Professional & Scientific | 543 (50.6%) | 531 (49.4%) |
| Enterprise Management | 0 (0.0%) | 0 (0.0%) |
| Administrative & Support | 324 (37.2%) | 548 (62.8%) |
| Educational Services | 1,605 (36.4%) | 2,804 (63.6%) |
| Health Care & Social Assistance | 841 (26.7%) | 2,304 (73.3%) |
| Arts, Entertainment & Recreation | 98 (35.5%) | 178 (64.5%) |
| Accommodation & Food Services | 896 (31.9%) | 1,911 (68.1%) |
| Public Administration | 213 (59.0%) | 148 (41.0%) |
| Total | 9,956 (47.6%) | 10,966 (52.4%) |
Education in Rexburg
School Enrollment in Rexburg
The most common levels of schooling among the 24,910 students in Rexburg are college / undergraduate (20,525 | 82.4%), high school (1,704 | 6.8%), and elementary school (984 | 4.0%).
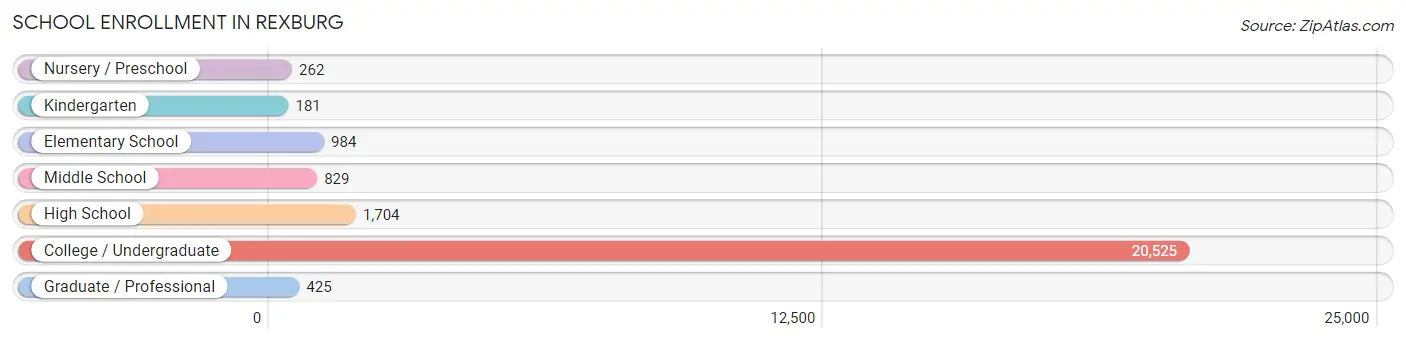
| School Level | # Students | % Students |
| Nursery / Preschool | 262 | 1.1% |
| Kindergarten | 181 | 0.7% |
| Elementary School | 984 | 4.0% |
| Middle School | 829 | 3.3% |
| High School | 1,704 | 6.8% |
| College / Undergraduate | 20,525 | 82.4% |
| Graduate / Professional | 425 | 1.7% |
| Total | 24,910 | 100.0% |
School Enrollment by Age by Funding Source in Rexburg
Out of a total of 24,910 students who are enrolled in schools in Rexburg, 17,014 (68.3%) attend a private institution, while the remaining 7,896 (31.7%) are enrolled in public schools. The age group of 20 to 24 year olds has the highest likelihood of being enrolled in private schools, with 8,192 (81.2% in the age bracket) enrolled. Conversely, the age group of 15 to 17 year olds has the lowest likelihood of being enrolled in a private school, with 961 (95.4% in the age bracket) attending a public institution.
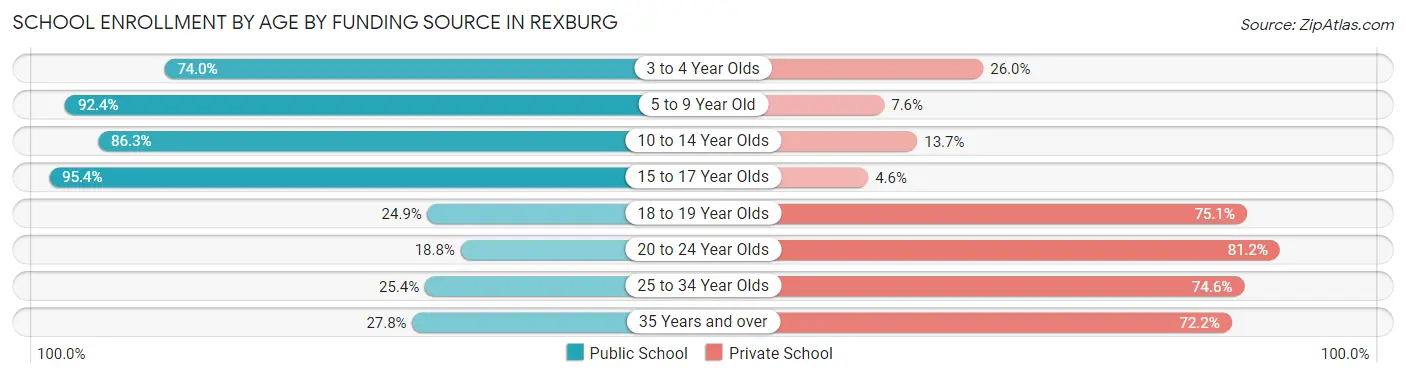
| Age Bracket | Public School | Private School |
| 3 to 4 Year Olds | 128 (74.0%) | 45 (26.0%) |
| 5 to 9 Year Old | 1,101 (92.4%) | 90 (7.6%) |
| 10 to 14 Year Olds | 957 (86.3%) | 152 (13.7%) |
| 15 to 17 Year Olds | 961 (95.4%) | 46 (4.6%) |
| 18 to 19 Year Olds | 2,172 (24.9%) | 6,541 (75.1%) |
| 20 to 24 Year Olds | 1,893 (18.8%) | 8,192 (81.2%) |
| 25 to 34 Year Olds | 579 (25.4%) | 1,700 (74.6%) |
| 35 Years and over | 98 (27.8%) | 255 (72.2%) |
| Total | 7,896 (31.7%) | 17,014 (68.3%) |
Educational Attainment by Field of Study in Rexburg
Education (850 | 18.4%), business (728 | 15.7%), arts & humanities (576 | 12.4%), science & technology (575 | 12.4%), and bio, nature & agricultural (315 | 6.8%) are the most common fields of study among 4,629 individuals in Rexburg who have obtained a bachelor's degree or higher.
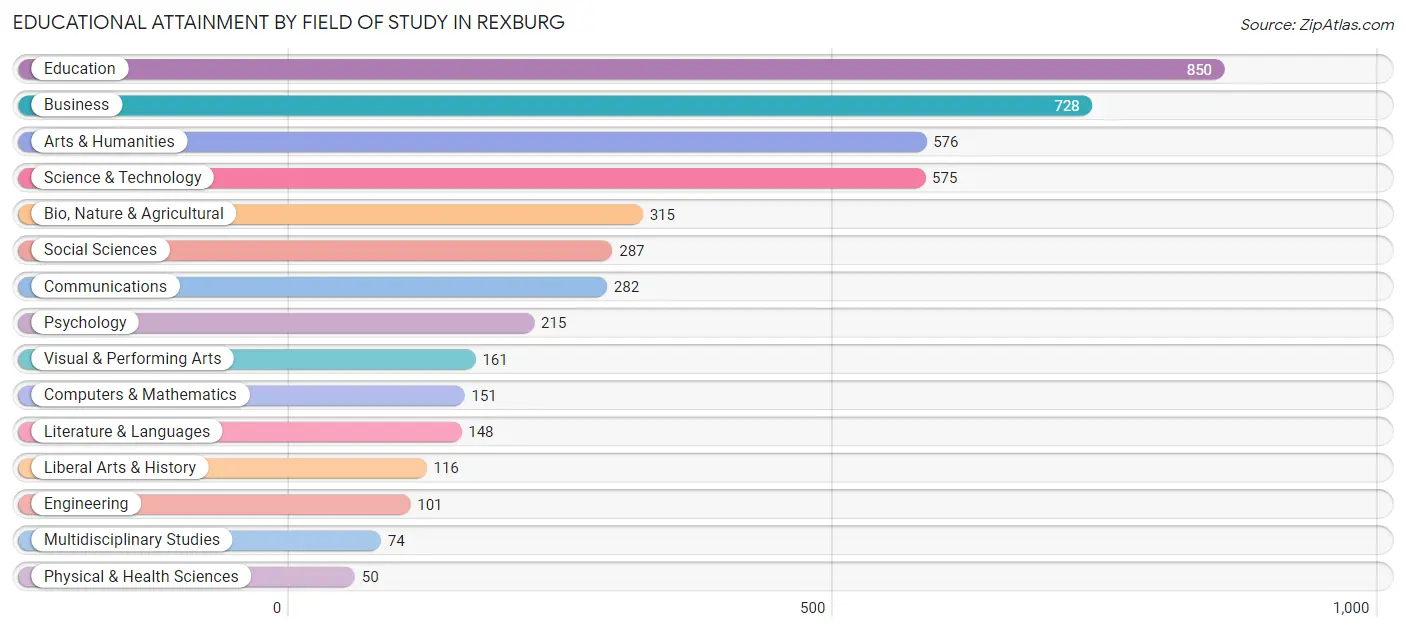
| Field of Study | # Graduates | % Graduates |
| Computers & Mathematics | 151 | 3.3% |
| Bio, Nature & Agricultural | 315 | 6.8% |
| Physical & Health Sciences | 50 | 1.1% |
| Psychology | 215 | 4.6% |
| Social Sciences | 287 | 6.2% |
| Engineering | 101 | 2.2% |
| Multidisciplinary Studies | 74 | 1.6% |
| Science & Technology | 575 | 12.4% |
| Business | 728 | 15.7% |
| Education | 850 | 18.4% |
| Literature & Languages | 148 | 3.2% |
| Liberal Arts & History | 116 | 2.5% |
| Visual & Performing Arts | 161 | 3.5% |
| Communications | 282 | 6.1% |
| Arts & Humanities | 576 | 12.4% |
| Total | 4,629 | 100.0% |
Transportation & Commute in Rexburg
Vehicle Availability by Sex in Rexburg
The most prevalent vehicle ownership categories in Rexburg are males with 2 vehicles (3,395, accounting for 39.8%) and females with 2 vehicles (2,912, making up 38.5%).
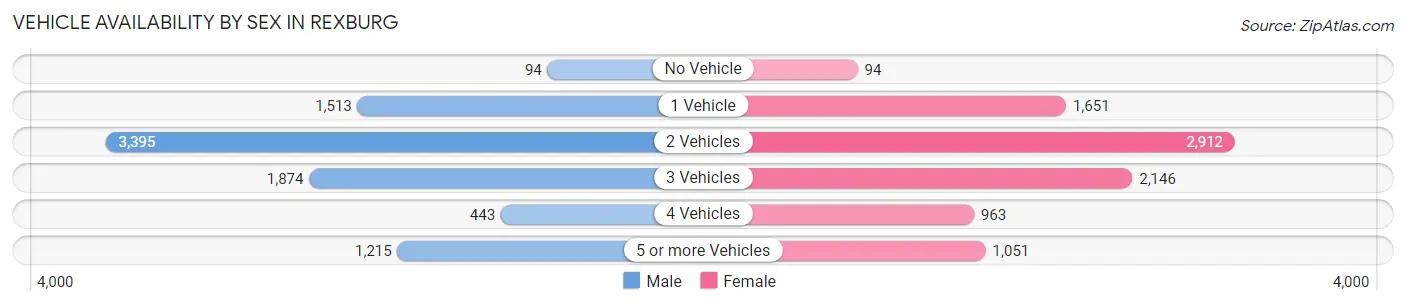
| Vehicles Available | Male | Female |
| No Vehicle | 94 (1.1%) | 94 (1.1%) |
| 1 Vehicle | 1,513 (17.7%) | 1,651 (18.7%) |
| 2 Vehicles | 3,395 (39.8%) | 2,912 (33.0%) |
| 3 Vehicles | 1,874 (22.0%) | 2,146 (24.3%) |
| 4 Vehicles | 443 (5.2%) | 963 (10.9%) |
| 5 or more Vehicles | 1,215 (14.2%) | 1,051 (11.9%) |
| Total | 8,534 (100.0%) | 8,817 (100.0%) |
Commute Time in Rexburg
The most frequently occuring commute durations in Rexburg are 5 to 9 minutes (5,895 commuters, 32.9%), 10 to 14 minutes (4,211 commuters, 23.5%), and less than 5 minutes (2,697 commuters, 15.1%).
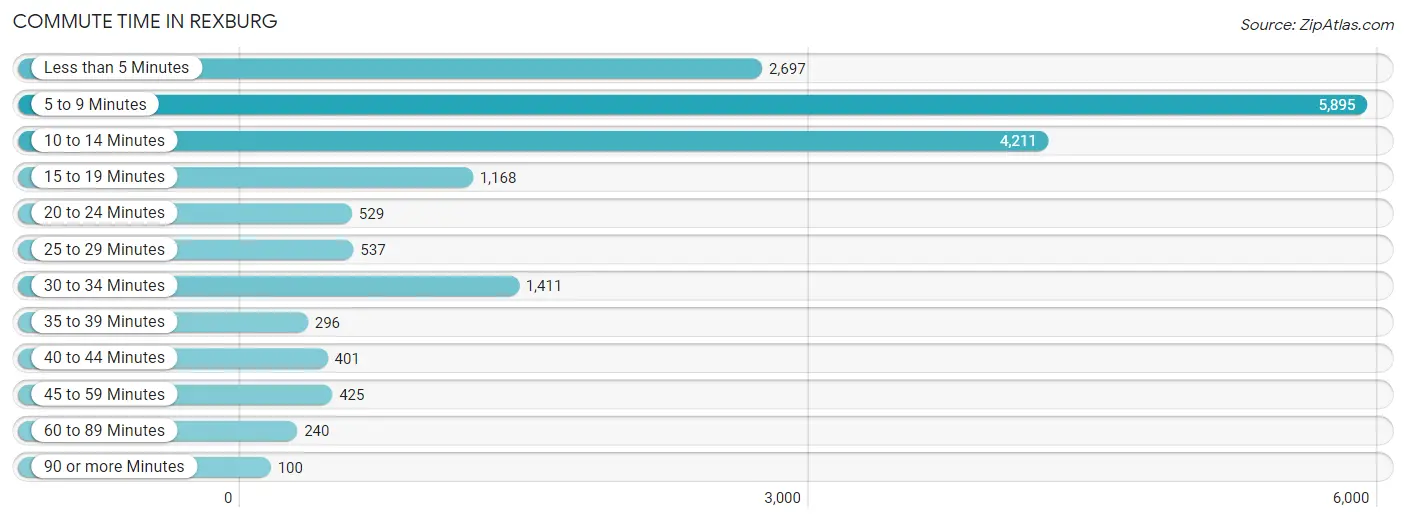
| Commute Time | # Commuters | % Commuters |
| Less than 5 Minutes | 2,697 | 15.1% |
| 5 to 9 Minutes | 5,895 | 32.9% |
| 10 to 14 Minutes | 4,211 | 23.5% |
| 15 to 19 Minutes | 1,168 | 6.5% |
| 20 to 24 Minutes | 529 | 2.9% |
| 25 to 29 Minutes | 537 | 3.0% |
| 30 to 34 Minutes | 1,411 | 7.9% |
| 35 to 39 Minutes | 296 | 1.7% |
| 40 to 44 Minutes | 401 | 2.2% |
| 45 to 59 Minutes | 425 | 2.4% |
| 60 to 89 Minutes | 240 | 1.3% |
| 90 or more Minutes | 100 | 0.6% |
Commute Time by Sex in Rexburg
The most common commute times in Rexburg are 5 to 9 minutes (2,961 commuters, 36.2%) for males and 5 to 9 minutes (2,934 commuters, 30.2%) for females.
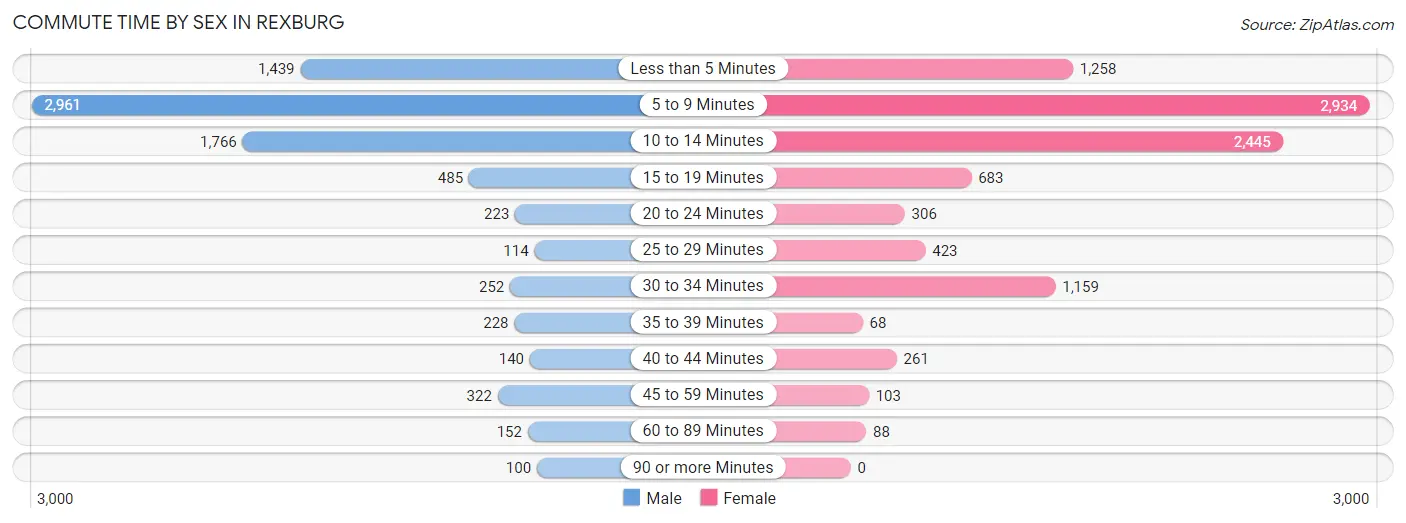
| Commute Time | Male | Female |
| Less than 5 Minutes | 1,439 (17.6%) | 1,258 (12.9%) |
| 5 to 9 Minutes | 2,961 (36.2%) | 2,934 (30.2%) |
| 10 to 14 Minutes | 1,766 (21.6%) | 2,445 (25.1%) |
| 15 to 19 Minutes | 485 (5.9%) | 683 (7.0%) |
| 20 to 24 Minutes | 223 (2.7%) | 306 (3.2%) |
| 25 to 29 Minutes | 114 (1.4%) | 423 (4.3%) |
| 30 to 34 Minutes | 252 (3.1%) | 1,159 (11.9%) |
| 35 to 39 Minutes | 228 (2.8%) | 68 (0.7%) |
| 40 to 44 Minutes | 140 (1.7%) | 261 (2.7%) |
| 45 to 59 Minutes | 322 (3.9%) | 103 (1.1%) |
| 60 to 89 Minutes | 152 (1.9%) | 88 (0.9%) |
| 90 or more Minutes | 100 (1.2%) | 0 (0.0%) |
Time of Departure to Work by Sex in Rexburg
The most frequent times of departure to work in Rexburg are 7:30 AM to 7:59 AM (1,389, 17.0%) for males and 4:00 PM to 11:59 PM (1,663, 17.1%) for females.
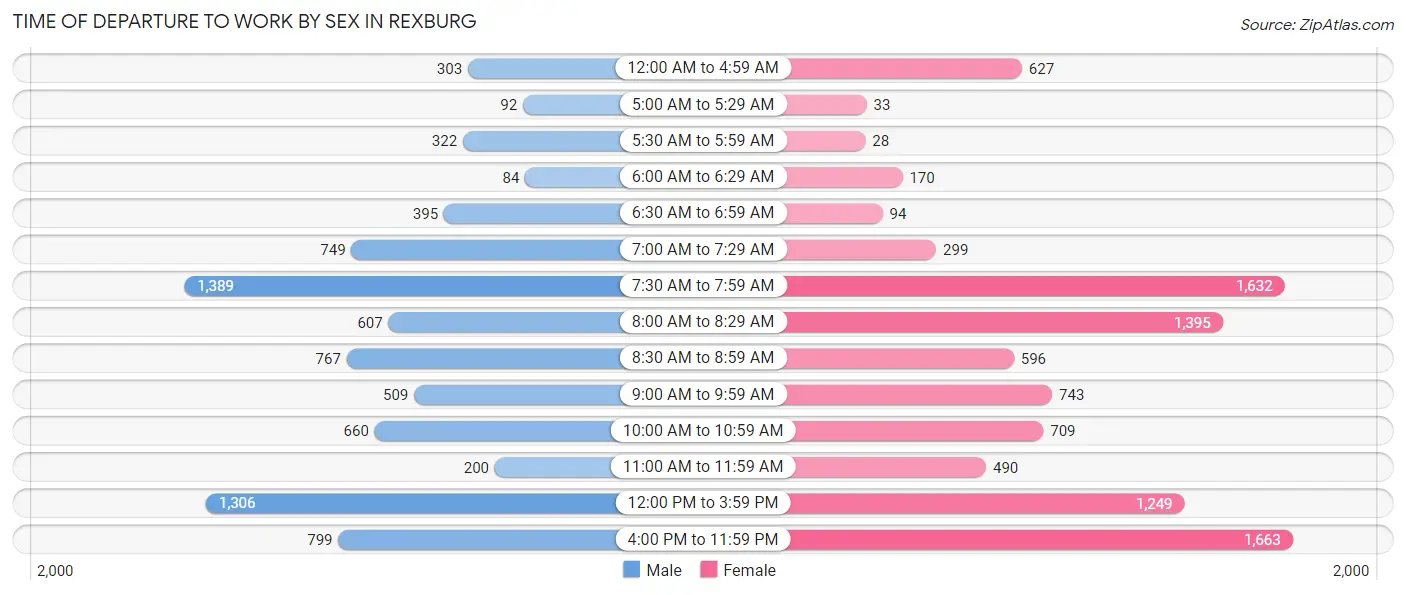
| Time of Departure | Male | Female |
| 12:00 AM to 4:59 AM | 303 (3.7%) | 627 (6.5%) |
| 5:00 AM to 5:29 AM | 92 (1.1%) | 33 (0.3%) |
| 5:30 AM to 5:59 AM | 322 (3.9%) | 28 (0.3%) |
| 6:00 AM to 6:29 AM | 84 (1.0%) | 170 (1.8%) |
| 6:30 AM to 6:59 AM | 395 (4.8%) | 94 (1.0%) |
| 7:00 AM to 7:29 AM | 749 (9.1%) | 299 (3.1%) |
| 7:30 AM to 7:59 AM | 1,389 (17.0%) | 1,632 (16.8%) |
| 8:00 AM to 8:29 AM | 607 (7.4%) | 1,395 (14.3%) |
| 8:30 AM to 8:59 AM | 767 (9.4%) | 596 (6.1%) |
| 9:00 AM to 9:59 AM | 509 (6.2%) | 743 (7.6%) |
| 10:00 AM to 10:59 AM | 660 (8.1%) | 709 (7.3%) |
| 11:00 AM to 11:59 AM | 200 (2.4%) | 490 (5.0%) |
| 12:00 PM to 3:59 PM | 1,306 (16.0%) | 1,249 (12.8%) |
| 4:00 PM to 11:59 PM | 799 (9.8%) | 1,663 (17.1%) |
| Total | 8,182 (100.0%) | 9,728 (100.0%) |
Housing Occupancy in Rexburg
Occupancy by Ownership in Rexburg
Of the total 8,802 dwellings in Rexburg, owner-occupied units account for 2,195 (24.9%), while renter-occupied units make up 6,607 (75.1%).
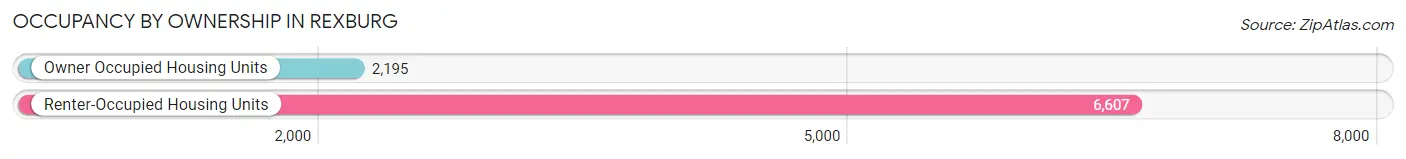
| Occupancy | # Housing Units | % Housing Units |
| Owner Occupied Housing Units | 2,195 | 24.9% |
| Renter-Occupied Housing Units | 6,607 | 75.1% |
| Total Occupied Housing Units | 8,802 | 100.0% |
Occupancy by Household Size in Rexburg
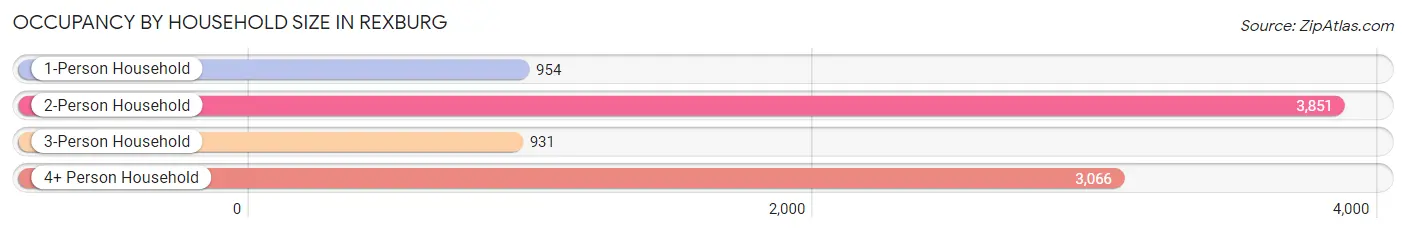
| Household Size | # Housing Units | % Housing Units |
| 1-Person Household | 954 | 10.8% |
| 2-Person Household | 3,851 | 43.8% |
| 3-Person Household | 931 | 10.6% |
| 4+ Person Household | 3,066 | 34.8% |
| Total Housing Units | 8,802 | 100.0% |
Occupancy by Ownership by Household Size in Rexburg
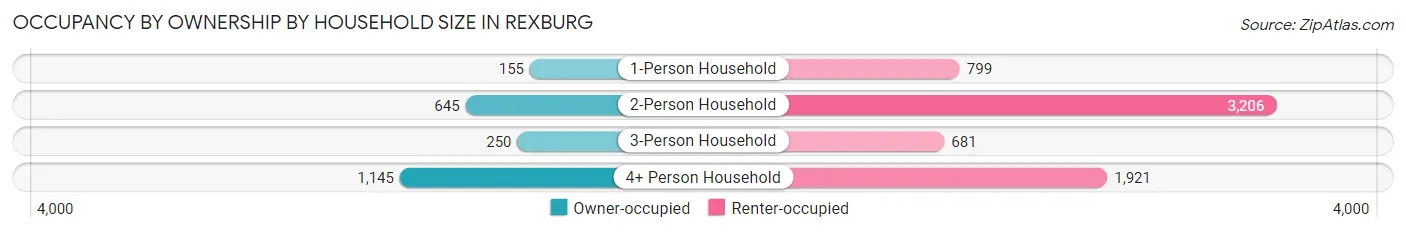
| Household Size | Owner-occupied | Renter-occupied |
| 1-Person Household | 155 (16.3%) | 799 (83.8%) |
| 2-Person Household | 645 (16.8%) | 3,206 (83.3%) |
| 3-Person Household | 250 (26.9%) | 681 (73.2%) |
| 4+ Person Household | 1,145 (37.3%) | 1,921 (62.6%) |
| Total Housing Units | 2,195 (24.9%) | 6,607 (75.1%) |
Occupancy by Educational Attainment in Rexburg
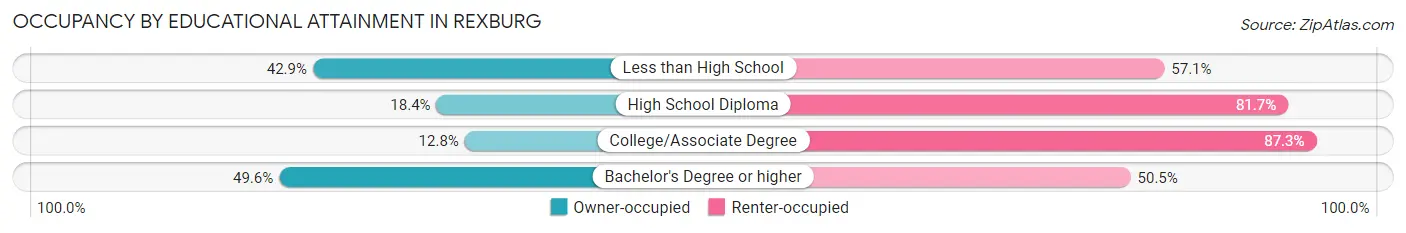
| Household Size | Owner-occupied | Renter-occupied |
| Less than High School | 9 (42.9%) | 12 (57.1%) |
| High School Diploma | 245 (18.3%) | 1,090 (81.7%) |
| College/Associate Degree | 606 (12.8%) | 4,146 (87.3%) |
| Bachelor's Degree or higher | 1,335 (49.5%) | 1,359 (50.4%) |
Occupancy by Age of Householder in Rexburg
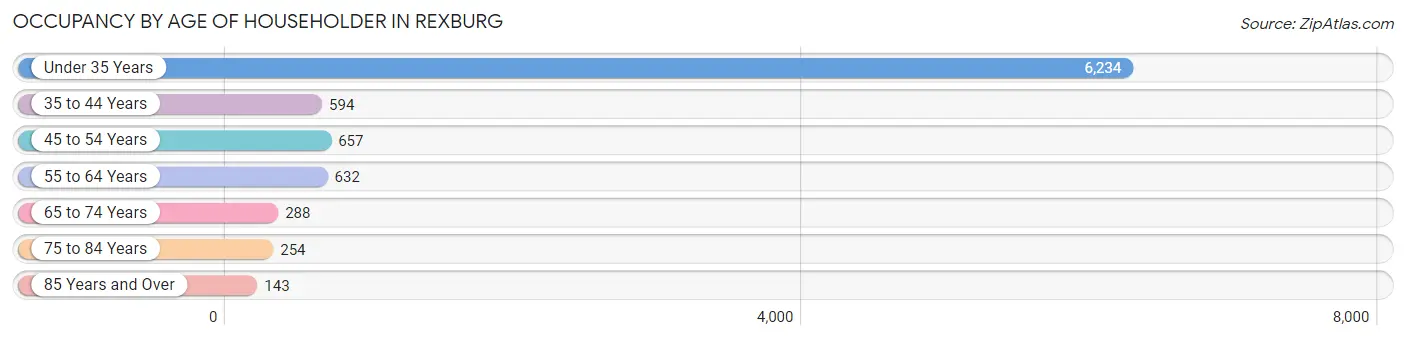
| Age Bracket | # Households | % Households |
| Under 35 Years | 6,234 | 70.8% |
| 35 to 44 Years | 594 | 6.8% |
| 45 to 54 Years | 657 | 7.5% |
| 55 to 64 Years | 632 | 7.2% |
| 65 to 74 Years | 288 | 3.3% |
| 75 to 84 Years | 254 | 2.9% |
| 85 Years and Over | 143 | 1.6% |
| Total | 8,802 | 100.0% |
Housing Finances in Rexburg
Median Income by Occupancy in Rexburg
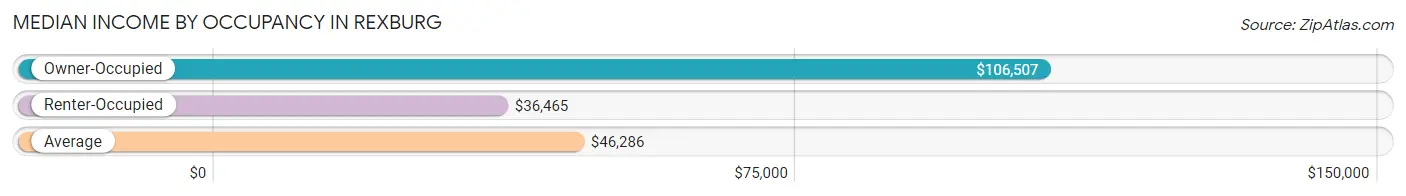
| Occupancy Type | # Households | Median Income |
| Owner-Occupied | 2,195 (24.9%) | $106,507 |
| Renter-Occupied | 6,607 (75.1%) | $36,465 |
| Average | 8,802 (100.0%) | $46,286 |
Occupancy by Householder Income Bracket in Rexburg
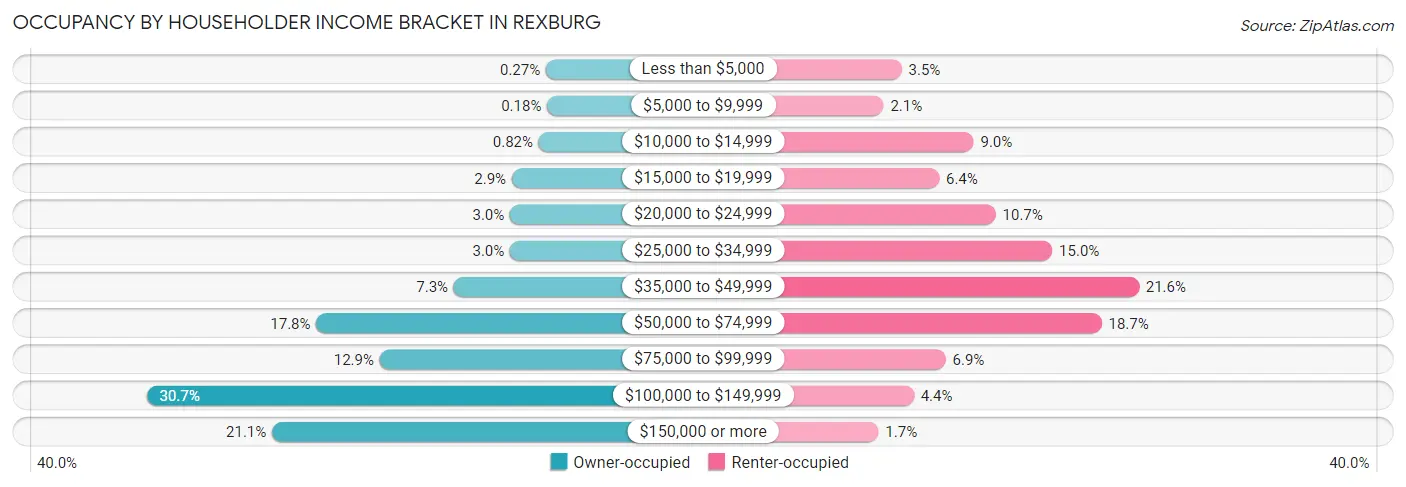
| Income Bracket | Owner-occupied | Renter-occupied |
| Less than $5,000 | 6 (0.3%) | 232 (3.5%) |
| $5,000 to $9,999 | 4 (0.2%) | 141 (2.1%) |
| $10,000 to $14,999 | 18 (0.8%) | 594 (9.0%) |
| $15,000 to $19,999 | 63 (2.9%) | 420 (6.4%) |
| $20,000 to $24,999 | 66 (3.0%) | 705 (10.7%) |
| $25,000 to $34,999 | 66 (3.0%) | 990 (15.0%) |
| $35,000 to $49,999 | 160 (7.3%) | 1,426 (21.6%) |
| $50,000 to $74,999 | 390 (17.8%) | 1,238 (18.7%) |
| $75,000 to $99,999 | 284 (12.9%) | 453 (6.9%) |
| $100,000 to $149,999 | 674 (30.7%) | 293 (4.4%) |
| $150,000 or more | 464 (21.1%) | 115 (1.7%) |
| Total | 2,195 (100.0%) | 6,607 (100.0%) |
Monthly Housing Cost Tiers in Rexburg
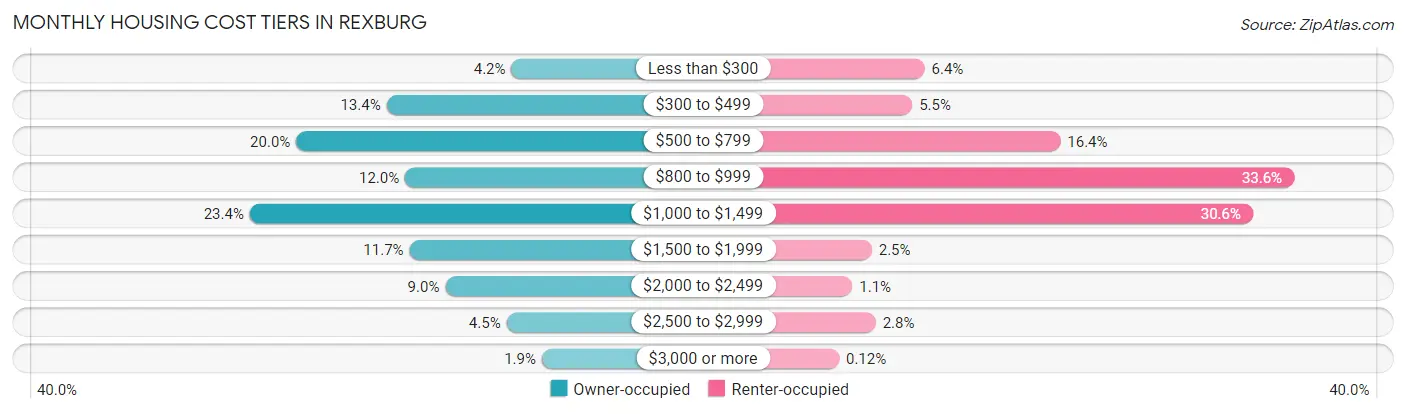
| Monthly Cost | Owner-occupied | Renter-occupied |
| Less than $300 | 91 (4.2%) | 424 (6.4%) |
| $300 to $499 | 293 (13.4%) | 364 (5.5%) |
| $500 to $799 | 439 (20.0%) | 1,085 (16.4%) |
| $800 to $999 | 263 (12.0%) | 2,221 (33.6%) |
| $1,000 to $1,499 | 514 (23.4%) | 2,021 (30.6%) |
| $1,500 to $1,999 | 256 (11.7%) | 167 (2.5%) |
| $2,000 to $2,499 | 198 (9.0%) | 73 (1.1%) |
| $2,500 to $2,999 | 99 (4.5%) | 186 (2.8%) |
| $3,000 or more | 42 (1.9%) | 8 (0.1%) |
| Total | 2,195 (100.0%) | 6,607 (100.0%) |
Physical Housing Characteristics in Rexburg
Housing Structures in Rexburg
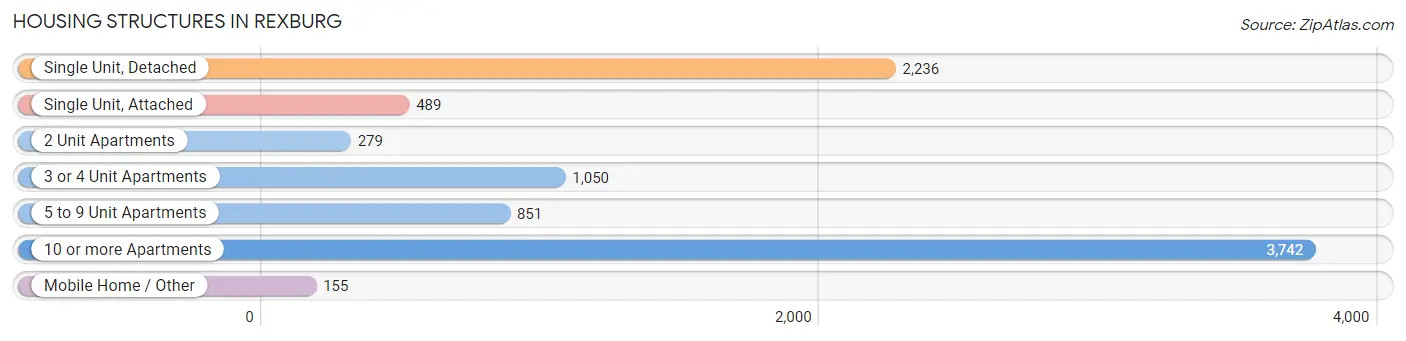
| Structure Type | # Housing Units | % Housing Units |
| Single Unit, Detached | 2,236 | 25.4% |
| Single Unit, Attached | 489 | 5.6% |
| 2 Unit Apartments | 279 | 3.2% |
| 3 or 4 Unit Apartments | 1,050 | 11.9% |
| 5 to 9 Unit Apartments | 851 | 9.7% |
| 10 or more Apartments | 3,742 | 42.5% |
| Mobile Home / Other | 155 | 1.8% |
| Total | 8,802 | 100.0% |
Housing Structures by Occupancy in Rexburg
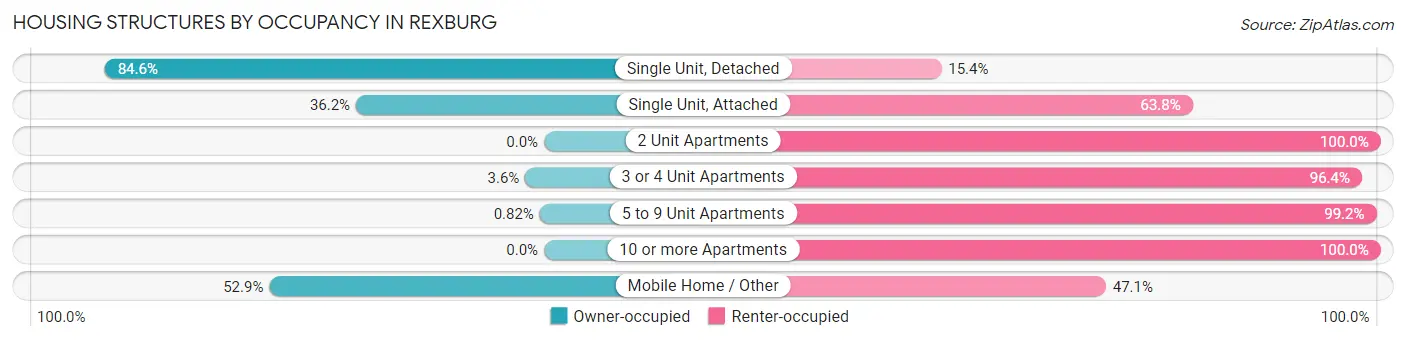
| Structure Type | Owner-occupied | Renter-occupied |
| Single Unit, Detached | 1,891 (84.6%) | 345 (15.4%) |
| Single Unit, Attached | 177 (36.2%) | 312 (63.8%) |
| 2 Unit Apartments | 0 (0.0%) | 279 (100.0%) |
| 3 or 4 Unit Apartments | 38 (3.6%) | 1,012 (96.4%) |
| 5 to 9 Unit Apartments | 7 (0.8%) | 844 (99.2%) |
| 10 or more Apartments | 0 (0.0%) | 3,742 (100.0%) |
| Mobile Home / Other | 82 (52.9%) | 73 (47.1%) |
| Total | 2,195 (24.9%) | 6,607 (75.1%) |
Housing Structures by Number of Rooms in Rexburg
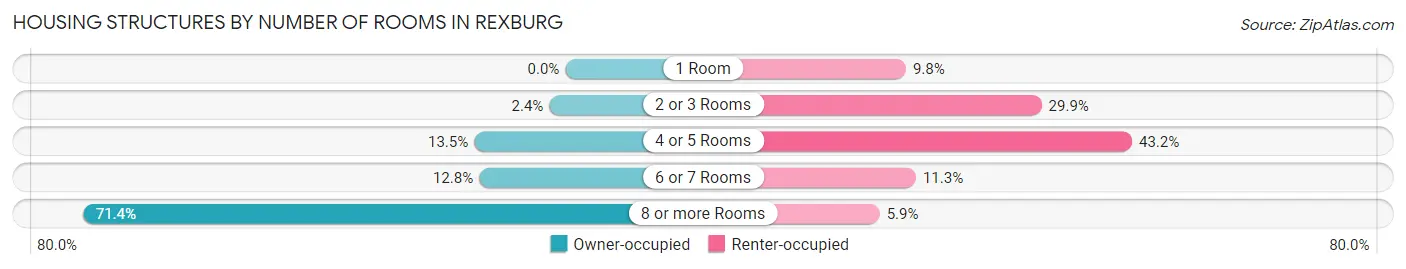
| Number of Rooms | Owner-occupied | Renter-occupied |
| 1 Room | 0 (0.0%) | 646 (9.8%) |
| 2 or 3 Rooms | 52 (2.4%) | 1,972 (29.8%) |
| 4 or 5 Rooms | 296 (13.5%) | 2,856 (43.2%) |
| 6 or 7 Rooms | 280 (12.8%) | 744 (11.3%) |
| 8 or more Rooms | 1,567 (71.4%) | 389 (5.9%) |
| Total | 2,195 (100.0%) | 6,607 (100.0%) |
Housing Structure by Heating Type in Rexburg
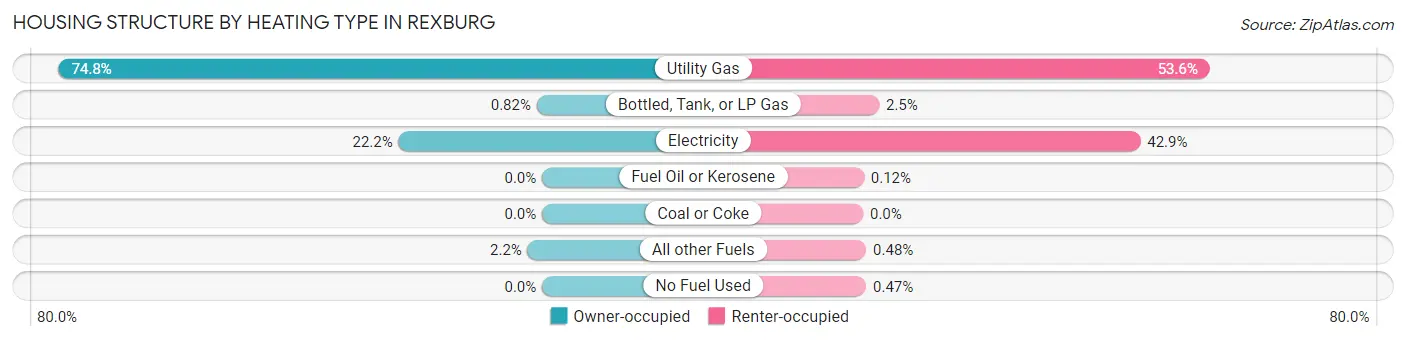
| Heating Type | Owner-occupied | Renter-occupied |
| Utility Gas | 1,641 (74.8%) | 3,541 (53.6%) |
| Bottled, Tank, or LP Gas | 18 (0.8%) | 163 (2.5%) |
| Electricity | 487 (22.2%) | 2,832 (42.9%) |
| Fuel Oil or Kerosene | 0 (0.0%) | 8 (0.1%) |
| Coal or Coke | 0 (0.0%) | 0 (0.0%) |
| All other Fuels | 49 (2.2%) | 32 (0.5%) |
| No Fuel Used | 0 (0.0%) | 31 (0.5%) |
| Total | 2,195 (100.0%) | 6,607 (100.0%) |
Household Vehicle Usage in Rexburg
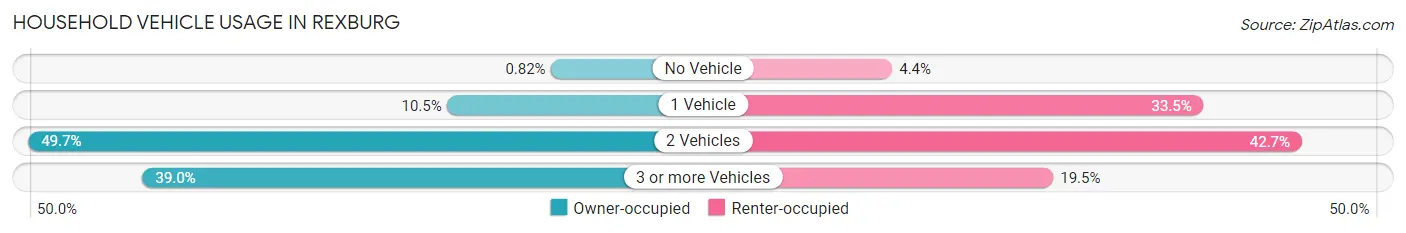
| Vehicles per Household | Owner-occupied | Renter-occupied |
| No Vehicle | 18 (0.8%) | 292 (4.4%) |
| 1 Vehicle | 231 (10.5%) | 2,212 (33.5%) |
| 2 Vehicles | 1,090 (49.7%) | 2,818 (42.6%) |
| 3 or more Vehicles | 856 (39.0%) | 1,285 (19.5%) |
| Total | 2,195 (100.0%) | 6,607 (100.0%) |
Real Estate & Mortgages in Rexburg
Real Estate and Mortgage Overview in Rexburg
| Characteristic | Without Mortgage | With Mortgage |
| Housing Units | 896 | 1,299 |
| Median Property Value | $331,000 | $335,300 |
| Median Household Income | $96,413 | $268 |
| Monthly Housing Costs | $532 | $42 |
| Real Estate Taxes | $2,055 | $24 |
Property Value by Mortgage Status in Rexburg
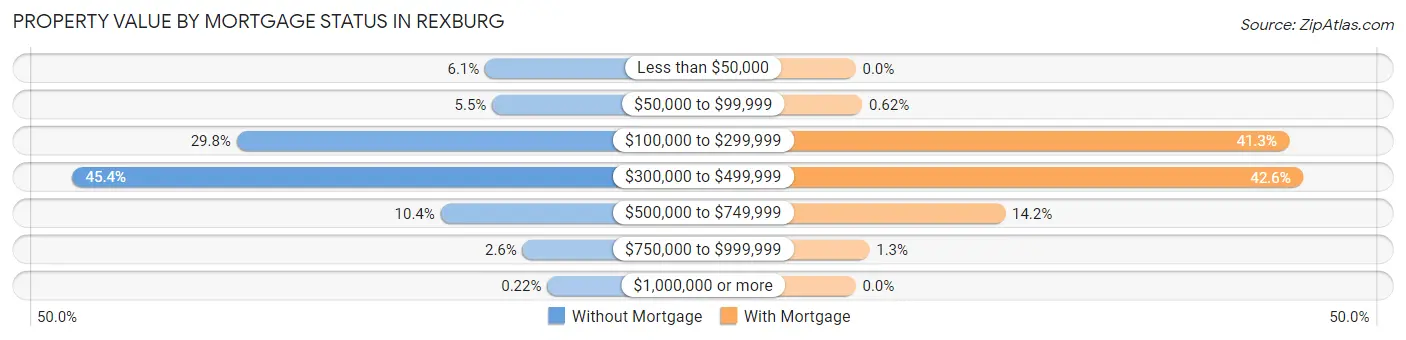
| Property Value | Without Mortgage | With Mortgage |
| Less than $50,000 | 55 (6.1%) | 0 (0.0%) |
| $50,000 to $99,999 | 49 (5.5%) | 8 (0.6%) |
| $100,000 to $299,999 | 267 (29.8%) | 536 (41.3%) |
| $300,000 to $499,999 | 407 (45.4%) | 553 (42.6%) |
| $500,000 to $749,999 | 93 (10.4%) | 185 (14.2%) |
| $750,000 to $999,999 | 23 (2.6%) | 17 (1.3%) |
| $1,000,000 or more | 2 (0.2%) | 0 (0.0%) |
| Total | 896 (100.0%) | 1,299 (100.0%) |
Household Income by Mortgage Status in Rexburg
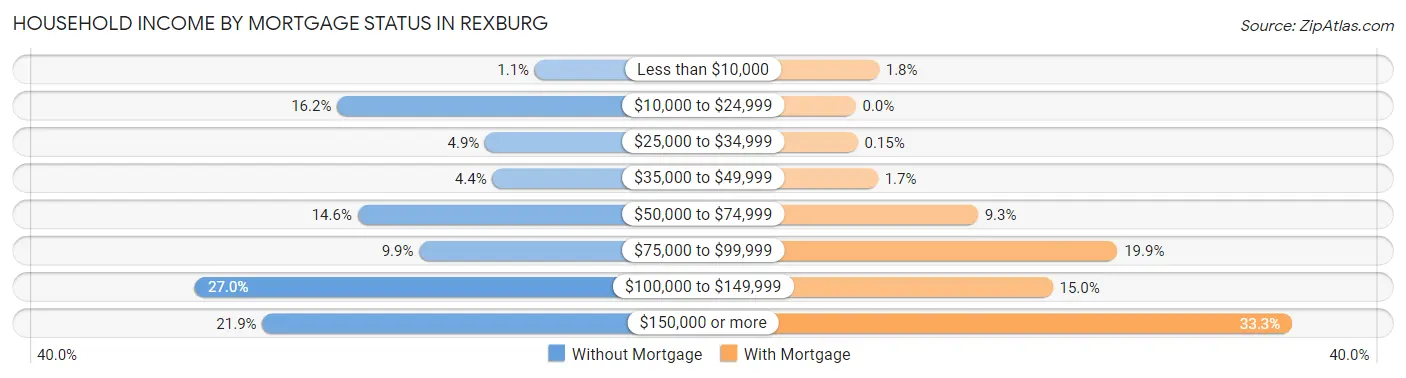
| Household Income | Without Mortgage | With Mortgage |
| Less than $10,000 | 10 (1.1%) | 23 (1.8%) |
| $10,000 to $24,999 | 145 (16.2%) | 0 (0.0%) |
| $25,000 to $34,999 | 44 (4.9%) | 2 (0.2%) |
| $35,000 to $49,999 | 39 (4.3%) | 22 (1.7%) |
| $50,000 to $74,999 | 131 (14.6%) | 121 (9.3%) |
| $75,000 to $99,999 | 89 (9.9%) | 259 (19.9%) |
| $100,000 to $149,999 | 242 (27.0%) | 195 (15.0%) |
| $150,000 or more | 196 (21.9%) | 432 (33.3%) |
| Total | 896 (100.0%) | 1,299 (100.0%) |
Property Value to Household Income Ratio in Rexburg
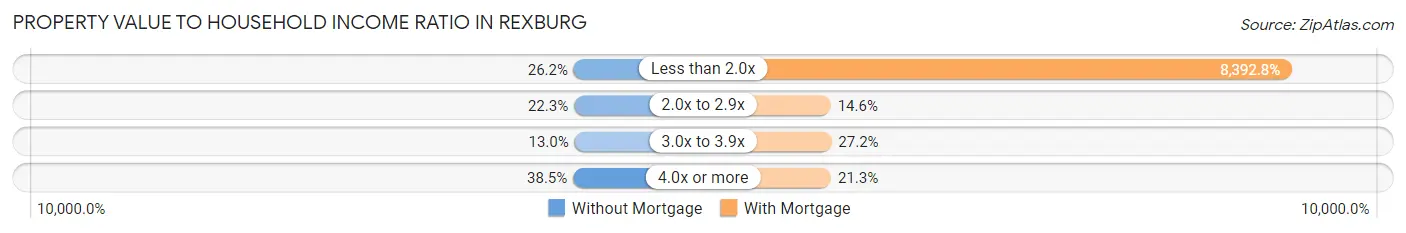
| Value-to-Income Ratio | Without Mortgage | With Mortgage |
| Less than 2.0x | 235 (26.2%) | 109,023 (8,392.8%) |
| 2.0x to 2.9x | 200 (22.3%) | 190 (14.6%) |
| 3.0x to 3.9x | 116 (13.0%) | 353 (27.2%) |
| 4.0x or more | 345 (38.5%) | 276 (21.2%) |
| Total | 896 (100.0%) | 1,299 (100.0%) |
Real Estate Taxes by Mortgage Status in Rexburg
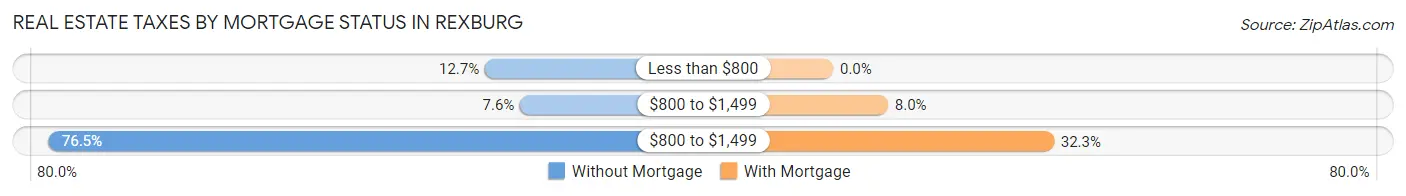
| Property Taxes | Without Mortgage | With Mortgage |
| Less than $800 | 114 (12.7%) | 0 (0.0%) |
| $800 to $1,499 | 68 (7.6%) | 104 (8.0%) |
| $800 to $1,499 | 685 (76.4%) | 419 (32.3%) |
| Total | 896 (100.0%) | 1,299 (100.0%) |
Health & Disability in Rexburg
Health Insurance Coverage by Age in Rexburg
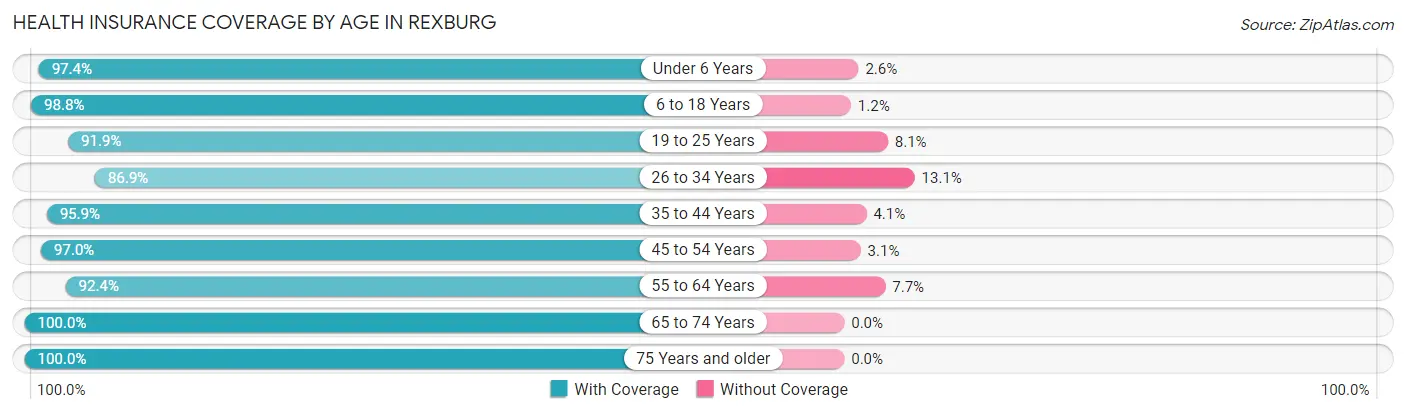
| Age Bracket | With Coverage | Without Coverage |
| Under 6 Years | 2,840 (97.4%) | 77 (2.6%) |
| 6 to 18 Years | 7,692 (98.8%) | 96 (1.2%) |
| 19 to 25 Years | 17,428 (91.9%) | 1,540 (8.1%) |
| 26 to 34 Years | 3,458 (86.9%) | 522 (13.1%) |
| 35 to 44 Years | 1,392 (95.9%) | 60 (4.1%) |
| 45 to 54 Years | 1,209 (97.0%) | 38 (3.0%) |
| 55 to 64 Years | 954 (92.3%) | 79 (7.6%) |
| 65 to 74 Years | 534 (100.0%) | 0 (0.0%) |
| 75 Years and older | 691 (100.0%) | 0 (0.0%) |
| Total | 36,198 (93.8%) | 2,412 (6.2%) |
Health Insurance Coverage by Citizenship Status in Rexburg
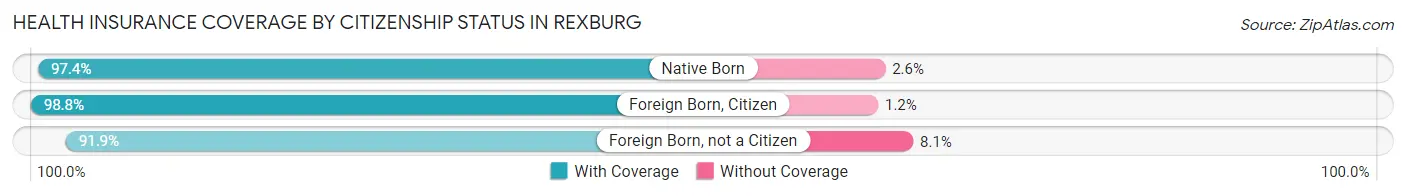
| Citizenship Status | With Coverage | Without Coverage |
| Native Born | 2,840 (97.4%) | 77 (2.6%) |
| Foreign Born, Citizen | 7,692 (98.8%) | 96 (1.2%) |
| Foreign Born, not a Citizen | 17,428 (91.9%) | 1,540 (8.1%) |
Health Insurance Coverage by Household Income in Rexburg
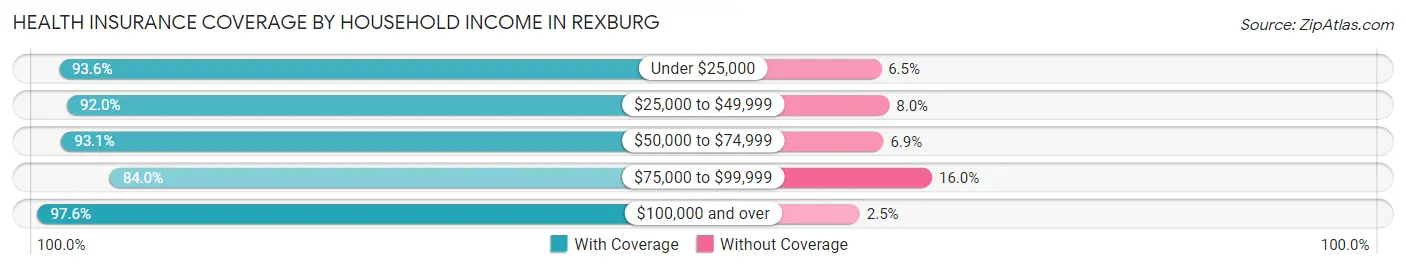
| Household Income | With Coverage | Without Coverage |
| Under $25,000 | 7,109 (93.5%) | 490 (6.5%) |
| $25,000 to $49,999 | 7,310 (92.0%) | 634 (8.0%) |
| $50,000 to $74,999 | 6,931 (93.1%) | 512 (6.9%) |
| $75,000 to $99,999 | 2,257 (84.0%) | 429 (16.0%) |
| $100,000 and over | 7,044 (97.6%) | 177 (2.5%) |
Public vs Private Health Insurance Coverage by Age in Rexburg
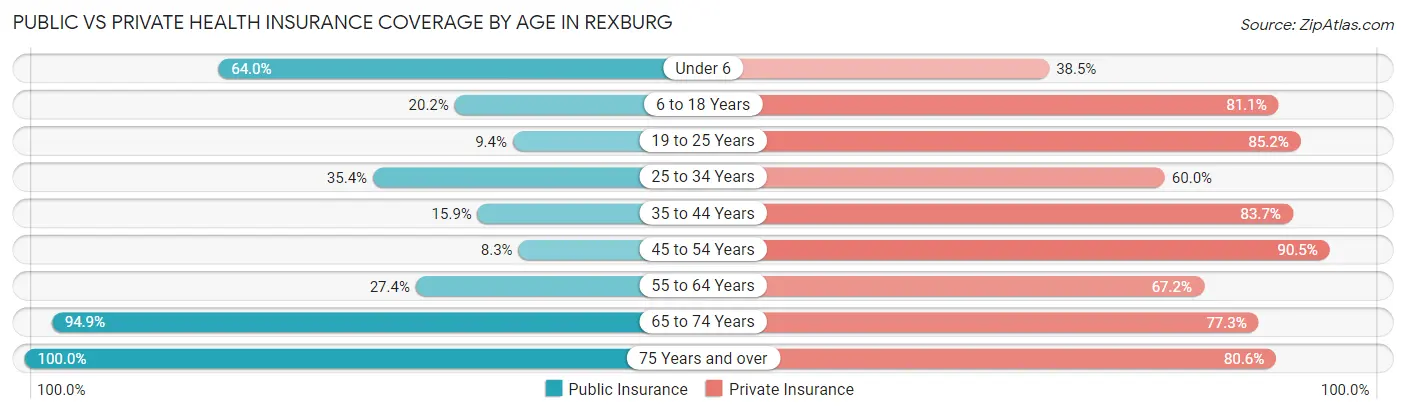
| Age Bracket | Public Insurance | Private Insurance |
| Under 6 | 1,868 (64.0%) | 1,123 (38.5%) |
| 6 to 18 Years | 1,572 (20.2%) | 6,313 (81.1%) |
| 19 to 25 Years | 1,780 (9.4%) | 16,153 (85.2%) |
| 25 to 34 Years | 1,407 (35.3%) | 2,387 (60.0%) |
| 35 to 44 Years | 231 (15.9%) | 1,215 (83.7%) |
| 45 to 54 Years | 104 (8.3%) | 1,129 (90.5%) |
| 55 to 64 Years | 283 (27.4%) | 694 (67.2%) |
| 65 to 74 Years | 507 (94.9%) | 413 (77.3%) |
| 75 Years and over | 691 (100.0%) | 557 (80.6%) |
| Total | 8,443 (21.9%) | 29,984 (77.7%) |
Disability Status by Sex by Age in Rexburg
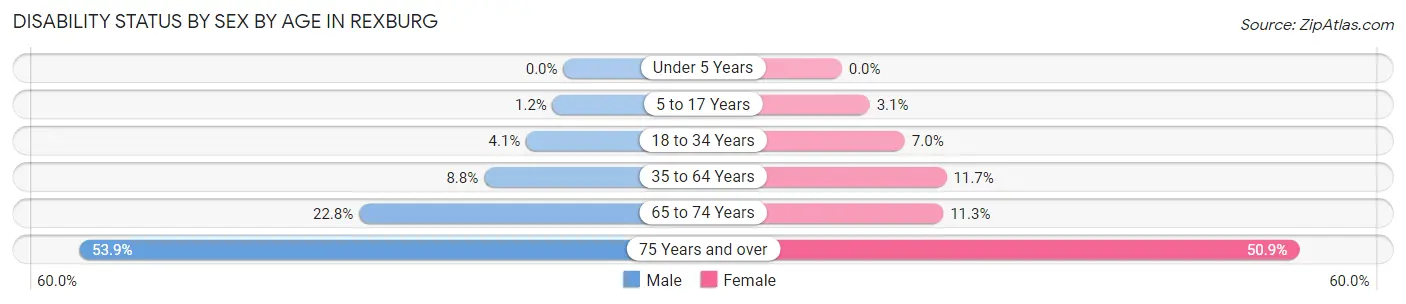
| Age Bracket | Male | Female |
| Under 5 Years | 0 (0.0%) | 0 (0.0%) |
| 5 to 17 Years | 21 (1.2%) | 55 (3.1%) |
| 18 to 34 Years | 479 (4.1%) | 1,127 (7.0%) |
| 35 to 64 Years | 153 (8.8%) | 233 (11.7%) |
| 65 to 74 Years | 53 (22.8%) | 34 (11.3%) |
| 75 Years and over | 165 (53.9%) | 196 (50.9%) |
Disability Class by Sex by Age in Rexburg
Disability Class: Hearing Difficulty
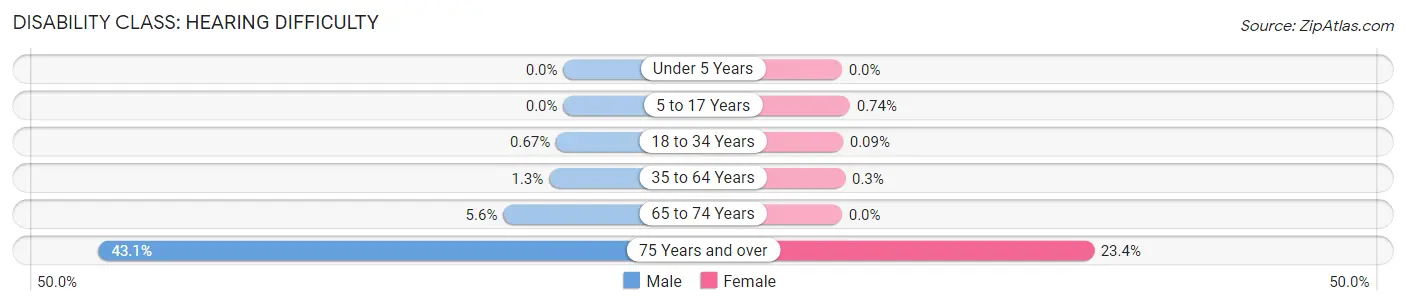
| Age Bracket | Male | Female |
| Under 5 Years | 0 (0.0%) | 0 (0.0%) |
| 5 to 17 Years | 0 (0.0%) | 13 (0.7%) |
| 18 to 34 Years | 78 (0.7%) | 14 (0.1%) |
| 35 to 64 Years | 23 (1.3%) | 6 (0.3%) |
| 65 to 74 Years | 13 (5.6%) | 0 (0.0%) |
| 75 Years and over | 132 (43.1%) | 90 (23.4%) |
Disability Class: Vision Difficulty
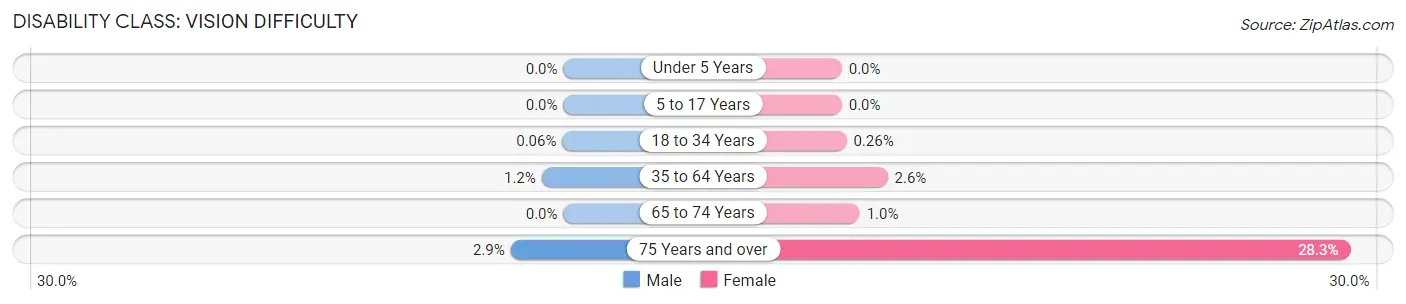
| Age Bracket | Male | Female |
| Under 5 Years | 0 (0.0%) | 0 (0.0%) |
| 5 to 17 Years | 0 (0.0%) | 0 (0.0%) |
| 18 to 34 Years | 7 (0.1%) | 42 (0.3%) |
| 35 to 64 Years | 21 (1.2%) | 51 (2.5%) |
| 65 to 74 Years | 0 (0.0%) | 3 (1.0%) |
| 75 Years and over | 9 (2.9%) | 109 (28.3%) |
Disability Class: Cognitive Difficulty
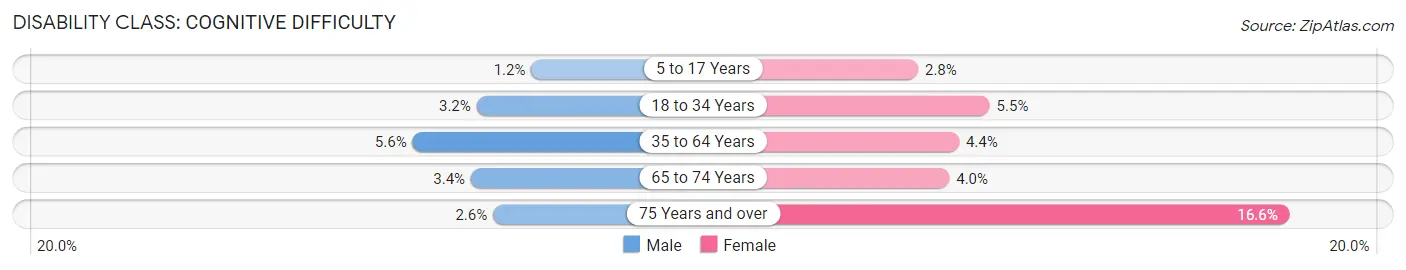
| Age Bracket | Male | Female |
| 5 to 17 Years | 21 (1.2%) | 50 (2.8%) |
| 18 to 34 Years | 373 (3.2%) | 879 (5.5%) |
| 35 to 64 Years | 97 (5.6%) | 87 (4.3%) |
| 65 to 74 Years | 8 (3.4%) | 12 (4.0%) |
| 75 Years and over | 8 (2.6%) | 64 (16.6%) |
Disability Class: Ambulatory Difficulty
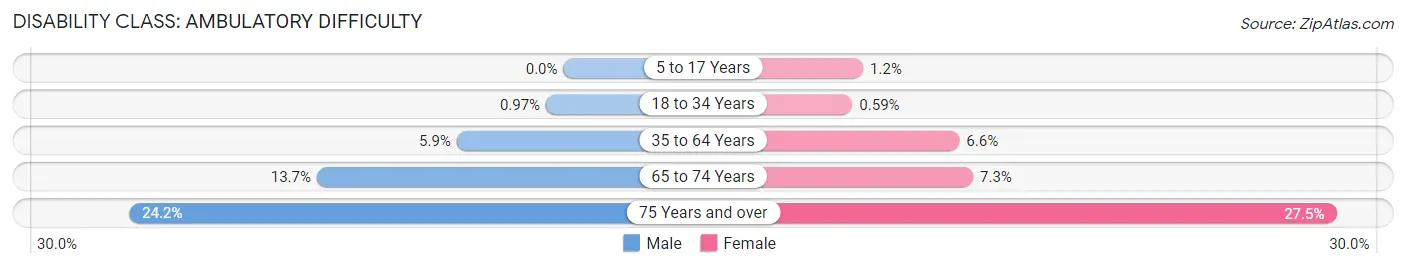
| Age Bracket | Male | Female |
| 5 to 17 Years | 0 (0.0%) | 21 (1.2%) |
| 18 to 34 Years | 112 (1.0%) | 94 (0.6%) |
| 35 to 64 Years | 103 (5.9%) | 131 (6.6%) |
| 65 to 74 Years | 32 (13.7%) | 22 (7.3%) |
| 75 Years and over | 74 (24.2%) | 106 (27.5%) |
Disability Class: Self-Care Difficulty
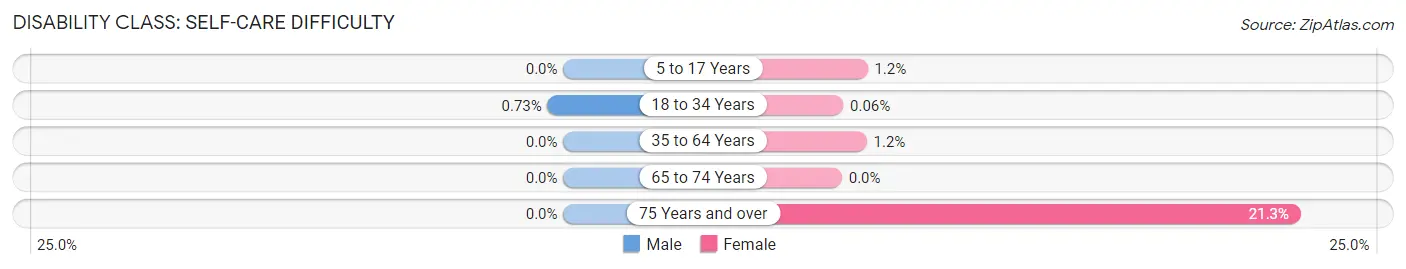
| Age Bracket | Male | Female |
| 5 to 17 Years | 0 (0.0%) | 21 (1.2%) |
| 18 to 34 Years | 84 (0.7%) | 9 (0.1%) |
| 35 to 64 Years | 0 (0.0%) | 23 (1.1%) |
| 65 to 74 Years | 0 (0.0%) | 0 (0.0%) |
| 75 Years and over | 0 (0.0%) | 82 (21.3%) |
Technology Access in Rexburg
Computing Device Access in Rexburg
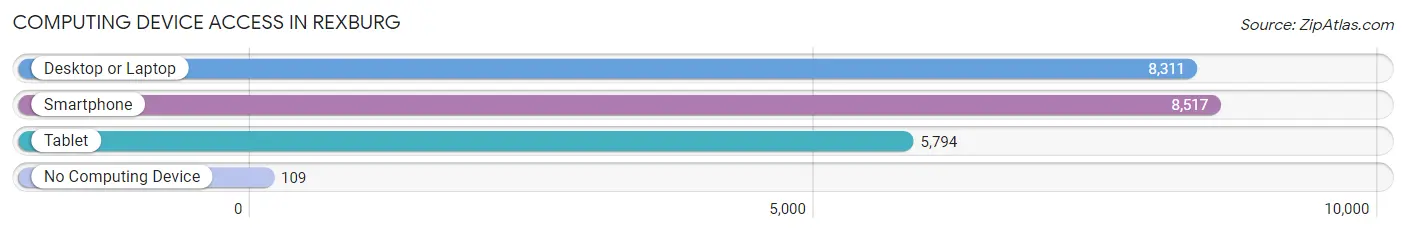
| Device Type | # Households | % Households |
| Desktop or Laptop | 8,311 | 94.4% |
| Smartphone | 8,517 | 96.8% |
| Tablet | 5,794 | 65.8% |
| No Computing Device | 109 | 1.2% |
| Total | 8,802 | 100.0% |
Internet Access in Rexburg
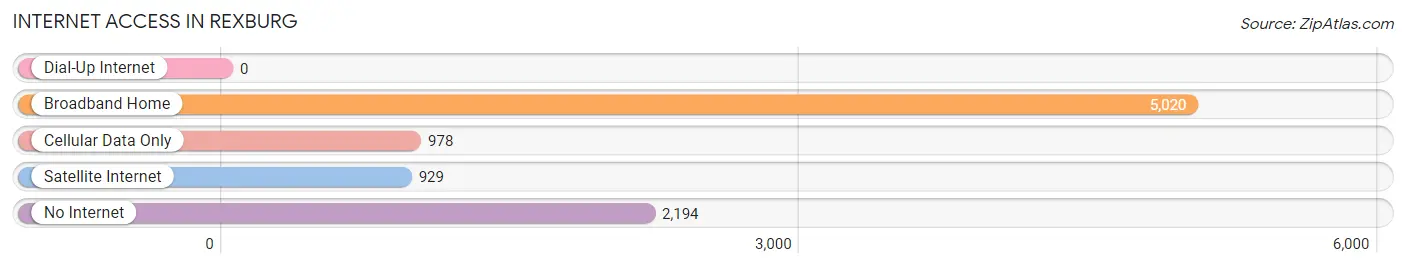
| Internet Type | # Households | % Households |
| Dial-Up Internet | 0 | 0.0% |
| Broadband Home | 5,020 | 57.0% |
| Cellular Data Only | 978 | 11.1% |
| Satellite Internet | 929 | 10.5% |
| No Internet | 2,194 | 24.9% |
| Total | 8,802 | 100.0% |
Rexburg Summary
Located in the southeastern corner of Idaho, the city of Rexburg is a small, rural community with a population of approximately 25,000 people. It is the county seat of Madison County and is part of the Upper Snake River Valley. The city is situated in a valley surrounded by the Teton Mountains to the east and the Big Hole Mountains to the west.
History
The area that is now Rexburg was first settled in 1883 by a group of Mormon pioneers led by Thomas E. Ricks. The settlers named the area Rexburg after Ricks’ son, Rex. The city was officially incorporated in 1902 and has since grown to become the largest city in Madison County.
Geography
Rexburg is located in the Upper Snake River Valley, which is part of the larger Snake River Plain. The city is situated in a valley surrounded by the Teton Mountains to the east and the Big Hole Mountains to the west. The city is located at an elevation of 4,845 feet above sea level. The climate in Rexburg is semi-arid, with hot summers and cold winters.
Economy
The economy of Rexburg is largely based on agriculture and education. The city is home to Brigham Young University-Idaho, which is the largest employer in the area. Other major employers include the Madison Memorial Hospital, the Madison School District, and the Madison County government. Agriculture is also an important part of the local economy, with the area producing a variety of crops, including potatoes, wheat, and sugar beets.
Demographics
As of the 2010 census, the population of Rexburg was 25,484. The racial makeup of the city was 91.3% White, 0.7% African American, 0.4% Native American, 0.9% Asian, 0.1% Pacific Islander, 4.3% from other races, and 2.3% from two or more races. Hispanic or Latino of any race were 8.2% of the population.
The median household income in Rexburg was $37,945, and the median family income was $45,945. The per capita income for the city was $17,845. About 11.2% of families and 16.2% of the population were below the poverty line, including 19.2% of those under age 18 and 8.2% of those age 65 or over.
Overall, Rexburg is a small, rural community with a strong agricultural and educational base. The city has a diverse population and a strong economy, making it an attractive place to live and work.
Common Questions
What is Per Capita Income in Rexburg?
Per Capita income in Rexburg is $20,092.
What is the Median Family Income in Rexburg?
Median Family Income in Rexburg is $48,234.
What is the Median Household income in Rexburg?
Median Household Income in Rexburg is $46,286.
What is Income or Wage Gap in Rexburg?
Income or Wage Gap in Rexburg is 41.5%.
Women in Rexburg earn 58.5 cents for every dollar earned by a man.
What is Inequality or Gini Index in Rexburg?
Inequality or Gini Index in Rexburg is 0.56.
What is the Total Population of Rexburg?
Total Population of Rexburg is 38,803.
What is the Total Male Population of Rexburg?
Total Male Population of Rexburg is 17,039.
What is the Total Female Population of Rexburg?
Total Female Population of Rexburg is 21,764.
What is the Ratio of Males per 100 Females in Rexburg?
There are 78.29 Males per 100 Females in Rexburg.
What is the Ratio of Females per 100 Males in Rexburg?
There are 127.73 Females per 100 Males in Rexburg.
What is the Median Population Age in Rexburg?
Median Population Age in Rexburg is 21.4 Years.
What is the Average Family Size in Rexburg
Average Family Size in Rexburg is 3.4 People.
What is the Average Household Size in Rexburg
Average Household Size in Rexburg is 3.7 People.
How Large is the Labor Force in Rexburg?
There are 22,697 People in the Labor Forcein in Rexburg.
What is the Percentage of People in the Labor Force in Rexburg?
67.6% of People are in the Labor Force in Rexburg.
What is the Unemployment Rate in Rexburg?
Unemployment Rate in Rexburg is 7.8%.