Post Falls, ID Map & Demographics
Post Falls Map
Post Falls Overview
$30,524
PER CAPITA INCOME
$82,390
AVG FAMILY INCOME
$71,042
AVG HOUSEHOLD INCOME
34.4%
WAGE / INCOME GAP [ % ]
65.6¢/ $1
WAGE / INCOME GAP [ $ ]
$10,491
FAMILY INCOME DEFICIT
0.39
INEQUALITY / GINI INDEX
40,002
TOTAL POPULATION
19,281
MALE POPULATION
20,721
FEMALE POPULATION
93.05
MALES / 100 FEMALES
107.47
FEMALES / 100 MALES
34.5
MEDIAN AGE
3.2
AVG FAMILY SIZE
2.8
AVG HOUSEHOLD SIZE
19,115
LABOR FORCE [ PEOPLE ]
63.5%
PERCENT IN LABOR FORCE
3.3%
UNEMPLOYMENT RATE
Post Falls Zip Codes
Post Falls Area Codes
Income in Post Falls
Income Overview in Post Falls
Per Capita Income in Post Falls is $30,524, while median incomes of families and households are $82,390 and $71,042 respectively.
| Characteristic | Number | Measure |
| Per Capita Income | 40,002 | $30,524 |
| Median Family Income | 9,977 | $82,390 |
| Mean Family Income | 9,977 | $93,807 |
| Median Household Income | 14,430 | $71,042 |
| Mean Household Income | 14,430 | $81,730 |
| Income Deficit | 9,977 | $10,491 |
| Wage / Income Gap (%) | 40,002 | 34.44% |
| Wage / Income Gap ($) | 40,002 | 65.56¢ per $1 |
| Gini / Inequality Index | 40,002 | 0.39 |
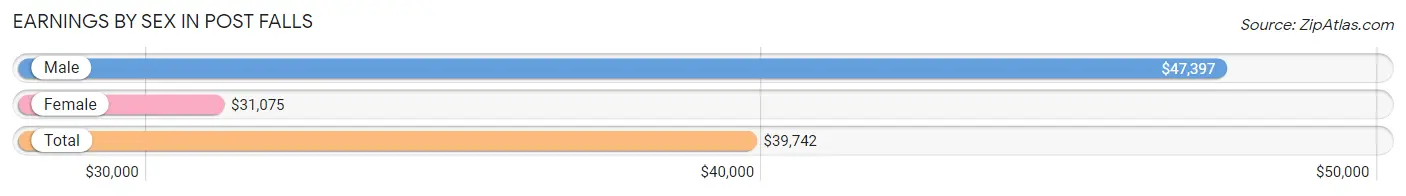
Earnings by Sex in Post Falls
Average Earnings in Post Falls are $39,742, $47,397 for men and $31,075 for women, a difference of 34.4%.
| Sex | Number | Average Earnings |
| Male | 10,500 (52.5%) | $47,397 |
| Female | 9,485 (47.5%) | $31,075 |
| Total | 19,985 (100.0%) | $39,742 |
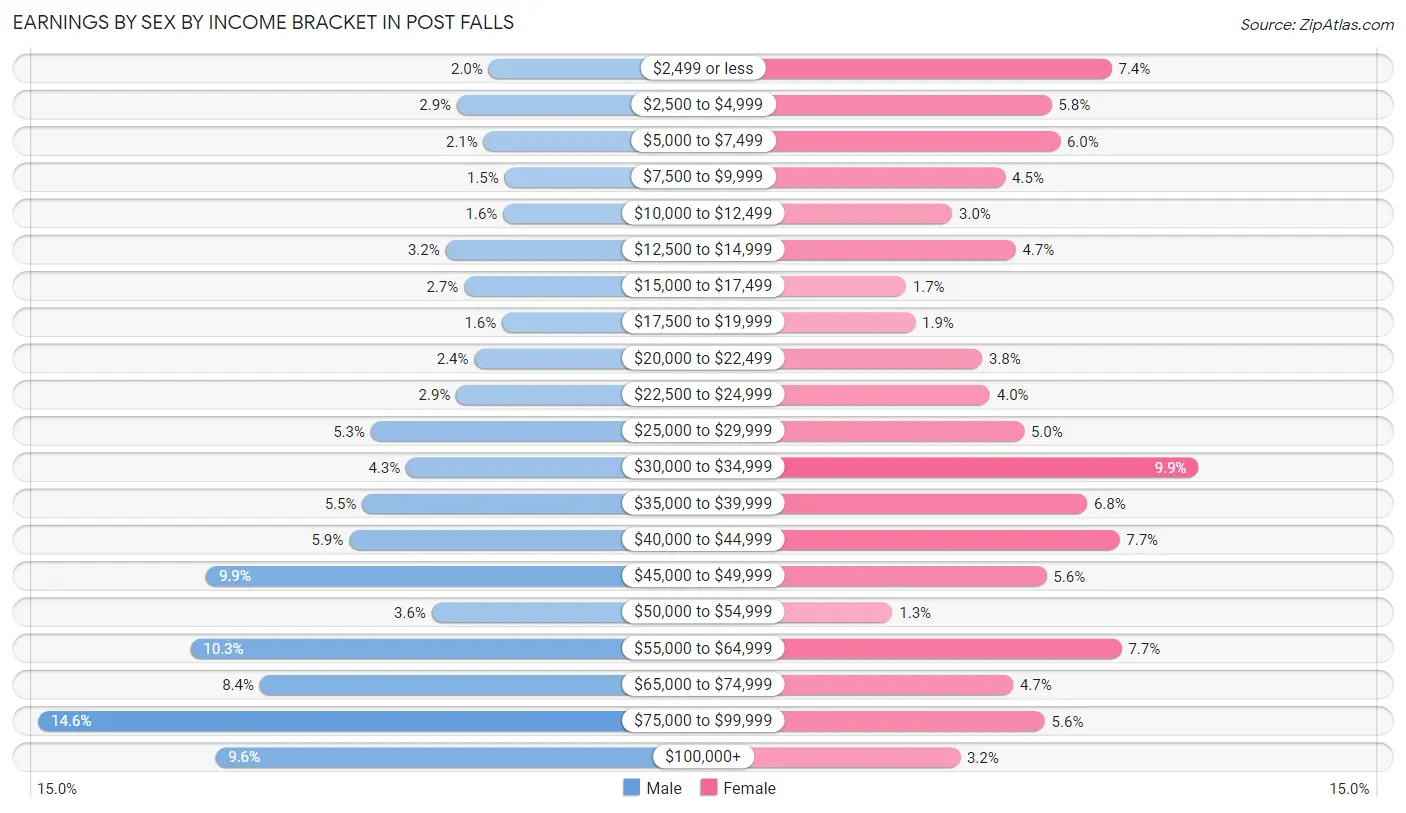
Earnings by Sex by Income Bracket in Post Falls
The most common earnings brackets in Post Falls are $75,000 to $99,999 for men (1,535 | 14.6%) and $30,000 to $34,999 for women (937 | 9.9%).
| Income | Male | Female |
| $2,499 or less | 206 (2.0%) | 706 (7.4%) |
| $2,500 to $4,999 | 299 (2.9%) | 545 (5.8%) |
| $5,000 to $7,499 | 221 (2.1%) | 568 (6.0%) |
| $7,500 to $9,999 | 159 (1.5%) | 422 (4.4%) |
| $10,000 to $12,499 | 163 (1.5%) | 281 (3.0%) |
| $12,500 to $14,999 | 333 (3.2%) | 450 (4.7%) |
| $15,000 to $17,499 | 278 (2.6%) | 157 (1.7%) |
| $17,500 to $19,999 | 166 (1.6%) | 182 (1.9%) |
| $20,000 to $22,499 | 248 (2.4%) | 360 (3.8%) |
| $22,500 to $24,999 | 301 (2.9%) | 381 (4.0%) |
| $25,000 to $29,999 | 553 (5.3%) | 472 (5.0%) |
| $30,000 to $34,999 | 449 (4.3%) | 937 (9.9%) |
| $35,000 to $39,999 | 579 (5.5%) | 640 (6.8%) |
| $40,000 to $44,999 | 617 (5.9%) | 727 (7.7%) |
| $45,000 to $49,999 | 1,040 (9.9%) | 532 (5.6%) |
| $50,000 to $54,999 | 374 (3.6%) | 121 (1.3%) |
| $55,000 to $64,999 | 1,086 (10.3%) | 732 (7.7%) |
| $65,000 to $74,999 | 881 (8.4%) | 443 (4.7%) |
| $75,000 to $99,999 | 1,535 (14.6%) | 527 (5.6%) |
| $100,000+ | 1,012 (9.6%) | 302 (3.2%) |
| Total | 10,500 (100.0%) | 9,485 (100.0%) |
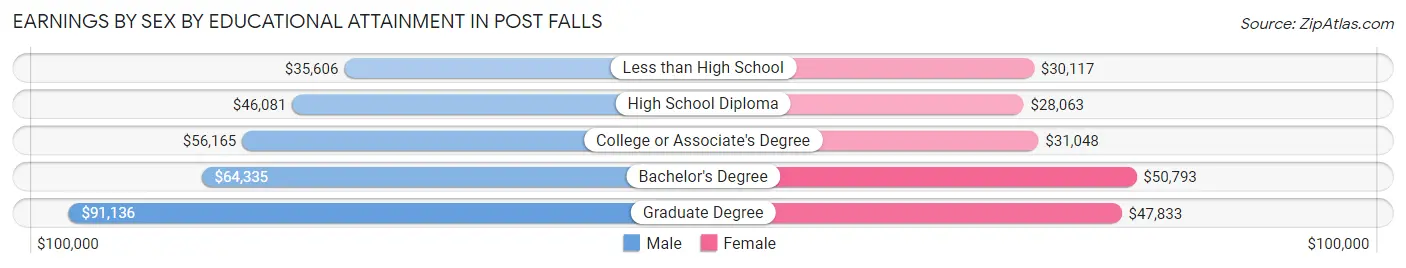
Earnings by Sex by Educational Attainment in Post Falls
Average earnings in Post Falls are $53,916 for men and $33,096 for women, a difference of 38.6%. Men with an educational attainment of graduate degree enjoy the highest average annual earnings of $91,136, while those with less than high school education earn the least with $35,606. Women with an educational attainment of bachelor's degree earn the most with the average annual earnings of $50,793, while those with high school diploma education have the smallest earnings of $28,063.
| Educational Attainment | Male Income | Female Income |
| Less than High School | $35,606 | $30,117 |
| High School Diploma | $46,081 | $28,063 |
| College or Associate's Degree | $56,165 | $31,048 |
| Bachelor's Degree | $64,335 | $50,793 |
| Graduate Degree | $91,136 | $47,833 |
| Total | $53,916 | $33,096 |
Family Income in Post Falls
Family Income Brackets in Post Falls
According to the Post Falls family income data, there are 2,684 families falling into the $100,000 to $149,999 income range, which is the most common income bracket and makes up 26.9% of all families. Conversely, the $10,000 to $14,999 income bracket is the least frequent group with only 219 families (2.2%) belonging to this category.
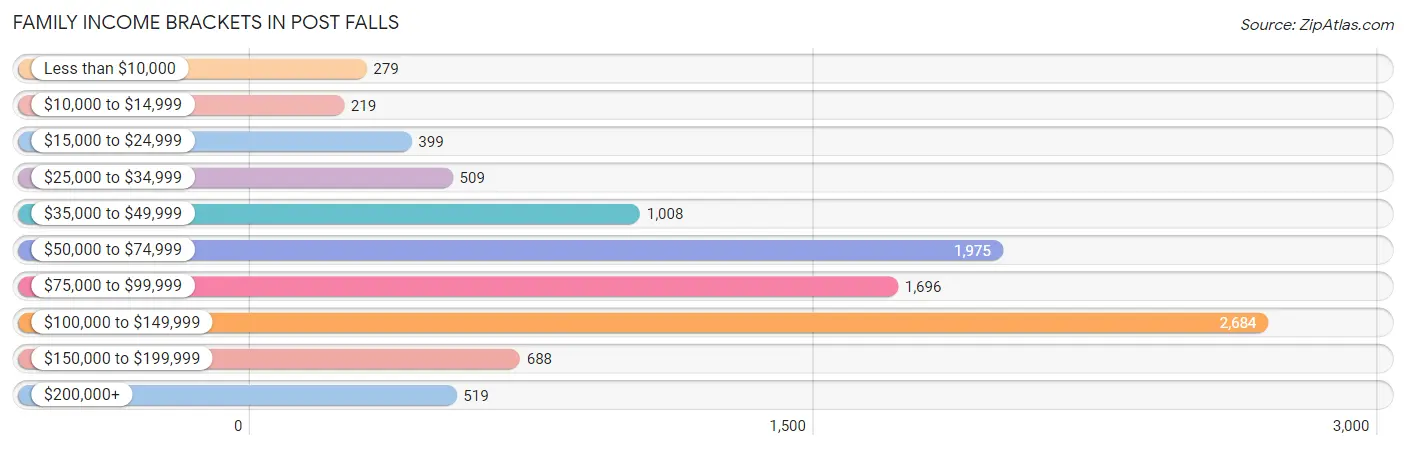
| Income Bracket | # Families | % Families |
| Less than $10,000 | 279 | 2.8% |
| $10,000 to $14,999 | 219 | 2.2% |
| $15,000 to $24,999 | 399 | 4.0% |
| $25,000 to $34,999 | 509 | 5.1% |
| $35,000 to $49,999 | 1,008 | 10.1% |
| $50,000 to $74,999 | 1,975 | 19.8% |
| $75,000 to $99,999 | 1,696 | 17.0% |
| $100,000 to $149,999 | 2,684 | 26.9% |
| $150,000 to $199,999 | 688 | 6.9% |
| $200,000+ | 519 | 5.2% |
Family Income by Famaliy Size in Post Falls
5-person families (727 | 7.3%) account for the highest median family income in Post Falls with $95,625 per family, while 2-person families (4,515 | 45.3%) have the highest median income of $40,014 per family member.
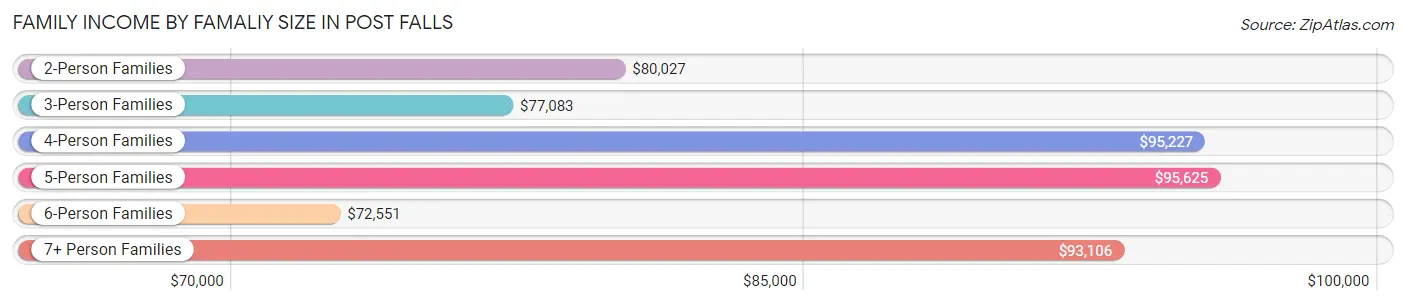
| Income Bracket | # Families | Median Income |
| 2-Person Families | 4,515 (45.3%) | $80,027 |
| 3-Person Families | 2,237 (22.4%) | $77,083 |
| 4-Person Families | 1,830 (18.3%) | $95,227 |
| 5-Person Families | 727 (7.3%) | $95,625 |
| 6-Person Families | 484 (4.9%) | $72,551 |
| 7+ Person Families | 184 (1.8%) | $93,106 |
| Total | 9,977 (100.0%) | $82,390 |
Family Income by Number of Earners in Post Falls
The median family income in Post Falls is $82,390, with families comprising 3+ earners (618) having the highest median family income of $116,711, while families with no earners (1,314) have the lowest median family income of $55,698, accounting for 6.2% and 13.2% of families, respectively.
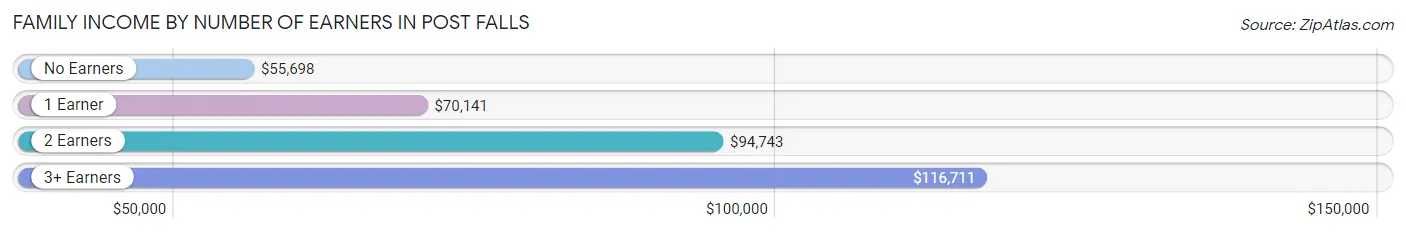
| Number of Earners | # Families | Median Income |
| No Earners | 1,314 (13.2%) | $55,698 |
| 1 Earner | 3,428 (34.4%) | $70,141 |
| 2 Earners | 4,617 (46.3%) | $94,743 |
| 3+ Earners | 618 (6.2%) | $116,711 |
| Total | 9,977 (100.0%) | $82,390 |
Household Income in Post Falls
Household Income Brackets in Post Falls
With 2,987 households falling in the category, the $100,000 to $149,999 income range is the most frequent in Post Falls, accounting for 20.7% of all households. In contrast, only 476 households (3.3%) fall into the $10,000 to $14,999 income bracket, making it the least populous group.
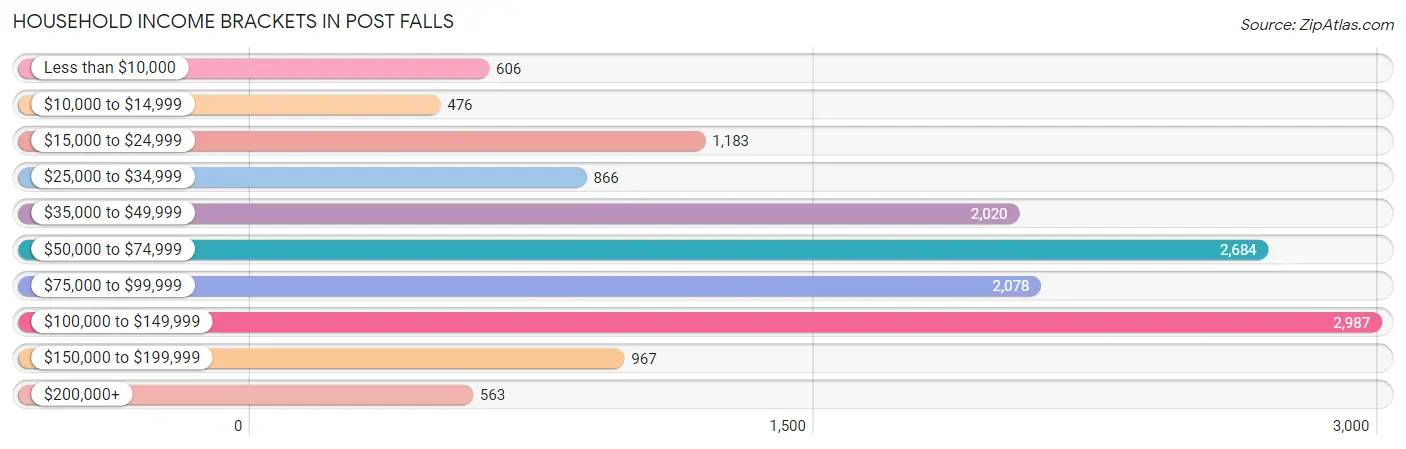
| Income Bracket | # Households | % Households |
| Less than $10,000 | 606 | 4.2% |
| $10,000 to $14,999 | 476 | 3.3% |
| $15,000 to $24,999 | 1,183 | 8.2% |
| $25,000 to $34,999 | 866 | 6.0% |
| $35,000 to $49,999 | 2,020 | 14.0% |
| $50,000 to $74,999 | 2,684 | 18.6% |
| $75,000 to $99,999 | 2,078 | 14.4% |
| $100,000 to $149,999 | 2,987 | 20.7% |
| $150,000 to $199,999 | 967 | 6.7% |
| $200,000+ | 563 | 3.9% |
Household Income by Householder Age in Post Falls
The median household income in Post Falls is $71,042, with the highest median household income of $79,523 found in the 25 to 44 years age bracket for the primary householder. A total of 5,666 households (39.3%) fall into this category. Meanwhile, the 65+ years age bracket for the primary householder has the lowest median household income of $55,664, with 3,558 households (24.7%) in this group.
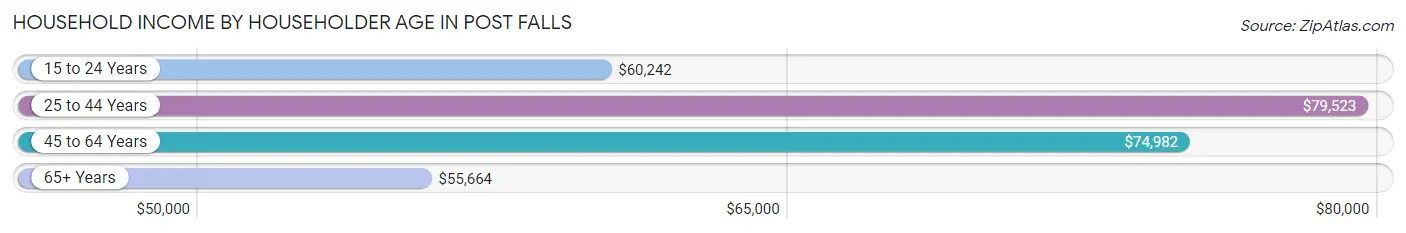
| Income Bracket | # Households | Median Income |
| 15 to 24 Years | 538 (3.7%) | $60,242 |
| 25 to 44 Years | 5,666 (39.3%) | $79,523 |
| 45 to 64 Years | 4,668 (32.4%) | $74,982 |
| 65+ Years | 3,558 (24.7%) | $55,664 |
| Total | 14,430 (100.0%) | $71,042 |
Poverty in Post Falls
Income Below Poverty by Sex and Age in Post Falls
With 11.0% poverty level for males and 14.8% for females among the residents of Post Falls, 5 year old males and under 5 year old females are the most vulnerable to poverty, with 70 males (31.0%) and 396 females (24.8%) in their respective age groups living below the poverty level.
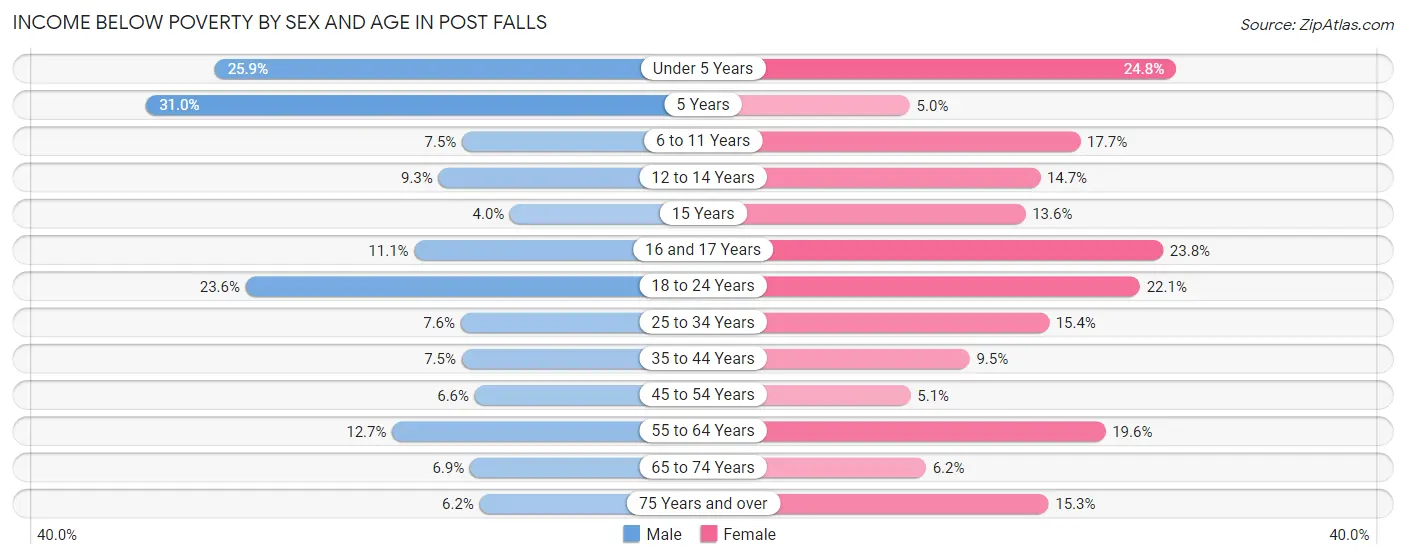
| Age Bracket | Male | Female |
| Under 5 Years | 406 (25.9%) | 396 (24.8%) |
| 5 Years | 70 (31.0%) | 14 (5.0%) |
| 6 to 11 Years | 120 (7.5%) | 262 (17.7%) |
| 12 to 14 Years | 73 (9.3%) | 150 (14.7%) |
| 15 Years | 24 (4.0%) | 64 (13.6%) |
| 16 and 17 Years | 49 (11.1%) | 133 (23.8%) |
| 18 to 24 Years | 344 (23.6%) | 330 (22.1%) |
| 25 to 34 Years | 212 (7.6%) | 561 (15.4%) |
| 35 to 44 Years | 218 (7.5%) | 251 (9.5%) |
| 45 to 54 Years | 151 (6.6%) | 86 (5.1%) |
| 55 to 64 Years | 275 (12.7%) | 452 (19.6%) |
| 65 to 74 Years | 110 (6.9%) | 122 (6.2%) |
| 75 Years and over | 45 (6.2%) | 185 (15.3%) |
| Total | 2,097 (11.0%) | 3,006 (14.8%) |
Income Above Poverty by Sex and Age in Post Falls
According to the poverty statistics in Post Falls, males aged 15 years and females aged 5 years are the age groups that are most secure financially, with 96.1% of males and 95.0% of females in these age groups living above the poverty line.
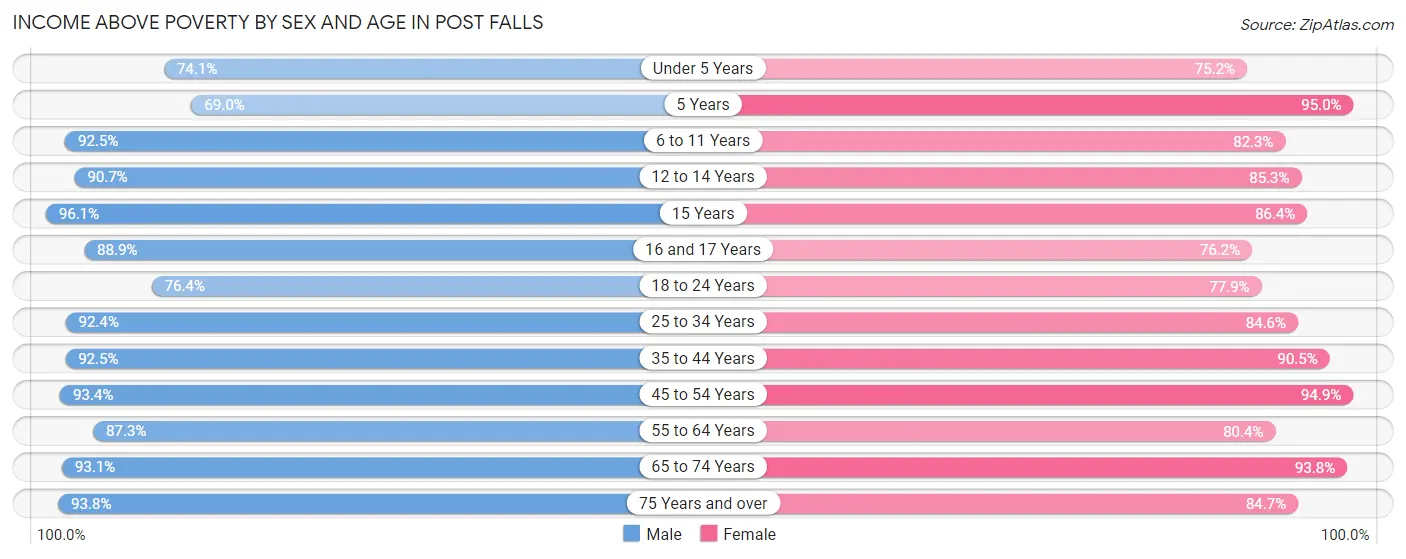
| Age Bracket | Male | Female |
| Under 5 Years | 1,163 (74.1%) | 1,200 (75.2%) |
| 5 Years | 156 (69.0%) | 264 (95.0%) |
| 6 to 11 Years | 1,478 (92.5%) | 1,219 (82.3%) |
| 12 to 14 Years | 715 (90.7%) | 870 (85.3%) |
| 15 Years | 583 (96.1%) | 406 (86.4%) |
| 16 and 17 Years | 394 (88.9%) | 425 (76.2%) |
| 18 to 24 Years | 1,115 (76.4%) | 1,162 (77.9%) |
| 25 to 34 Years | 2,572 (92.4%) | 3,092 (84.6%) |
| 35 to 44 Years | 2,675 (92.5%) | 2,397 (90.5%) |
| 45 to 54 Years | 2,146 (93.4%) | 1,604 (94.9%) |
| 55 to 64 Years | 1,891 (87.3%) | 1,859 (80.4%) |
| 65 to 74 Years | 1,477 (93.1%) | 1,836 (93.8%) |
| 75 Years and over | 680 (93.8%) | 1,022 (84.7%) |
| Total | 17,045 (89.0%) | 17,356 (85.2%) |
Income Below Poverty Among Married-Couple Families in Post Falls
The poverty statistics for married-couple families in Post Falls show that 4.4% or 315 of the total 7,212 families live below the poverty line. Families with 1 or 2 children have the highest poverty rate of 7.0%, comprising of 175 families. On the other hand, families with 5 or more children have the lowest poverty rate of 0.0%, which includes 0 families.
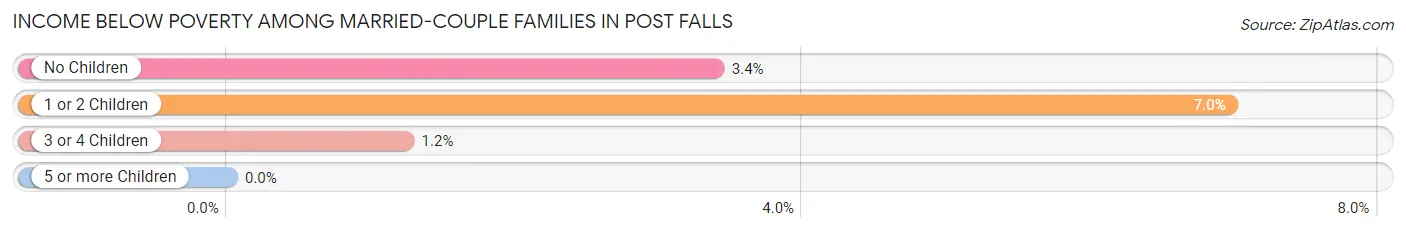
| Children | Above Poverty | Below Poverty |
| No Children | 3,728 (96.6%) | 131 (3.4%) |
| 1 or 2 Children | 2,338 (93.0%) | 175 (7.0%) |
| 3 or 4 Children | 725 (98.8%) | 9 (1.2%) |
| 5 or more Children | 106 (100.0%) | 0 (0.0%) |
| Total | 6,897 (95.6%) | 315 (4.4%) |
Income Below Poverty Among Single-Parent Households in Post Falls
According to the poverty data in Post Falls, 12.5% or 125 single-father households and 24.8% or 438 single-mother households are living below the poverty line. Among single-father households, those with 3 or 4 children have the highest poverty rate, with 32 households (18.4%) experiencing poverty. Likewise, among single-mother households, those with 5 or more children have the highest poverty rate, with 27 households (100.0%) falling below the poverty line.
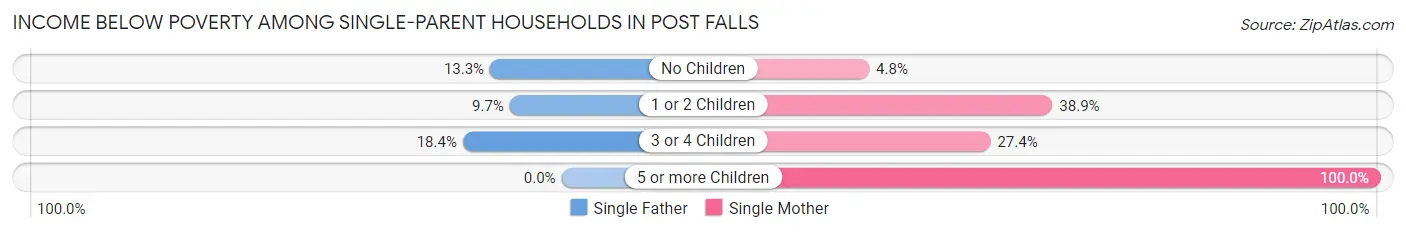
| Children | Single Father | Single Mother |
| No Children | 49 (13.3%) | 33 (4.8%) |
| 1 or 2 Children | 44 (9.7%) | 311 (38.9%) |
| 3 or 4 Children | 32 (18.4%) | 67 (27.4%) |
| 5 or more Children | 0 (0.0%) | 27 (100.0%) |
| Total | 125 (12.5%) | 438 (24.8%) |
Income Below Poverty Among Married-Couple vs Single-Parent Households in Post Falls
The poverty data for Post Falls shows that 315 of the married-couple family households (4.4%) and 563 of the single-parent households (20.4%) are living below the poverty level. Within the married-couple family households, those with 1 or 2 children have the highest poverty rate, with 175 households (7.0%) falling below the poverty line. Among the single-parent households, those with 5 or more children have the highest poverty rate, with 27 household (100.0%) living below poverty.
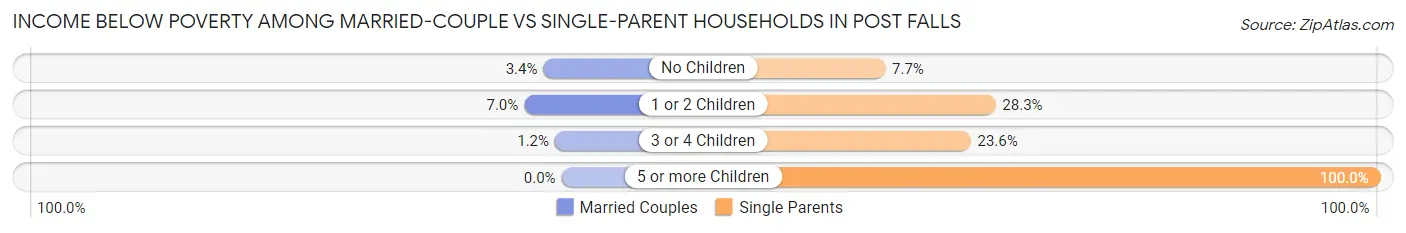
| Children | Married-Couple Families | Single-Parent Households |
| No Children | 131 (3.4%) | 82 (7.7%) |
| 1 or 2 Children | 175 (7.0%) | 355 (28.3%) |
| 3 or 4 Children | 9 (1.2%) | 99 (23.6%) |
| 5 or more Children | 0 (0.0%) | 27 (100.0%) |
| Total | 315 (4.4%) | 563 (20.4%) |
Race in Post Falls
The most populous races in Post Falls are White / Caucasian (35,933 | 89.8%), Two or more Races (3,172 | 7.9%), and Hispanic or Latino (2,304 | 5.8%).
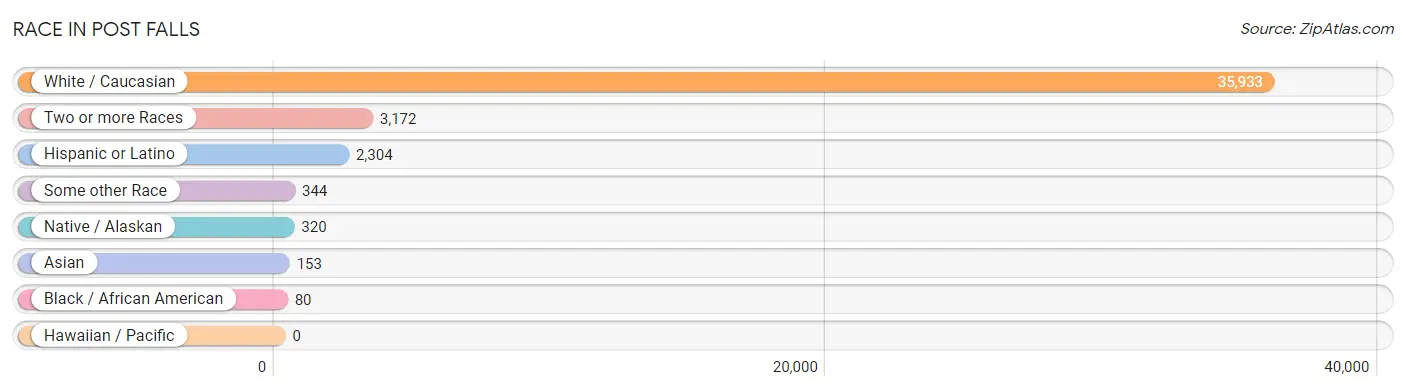
| Race | # Population | % Population |
| Asian | 153 | 0.4% |
| Black / African American | 80 | 0.2% |
| Hawaiian / Pacific | 0 | 0.0% |
| Hispanic or Latino | 2,304 | 5.8% |
| Native / Alaskan | 320 | 0.8% |
| White / Caucasian | 35,933 | 89.8% |
| Two or more Races | 3,172 | 7.9% |
| Some other Race | 344 | 0.9% |
| Total | 40,002 | 100.0% |
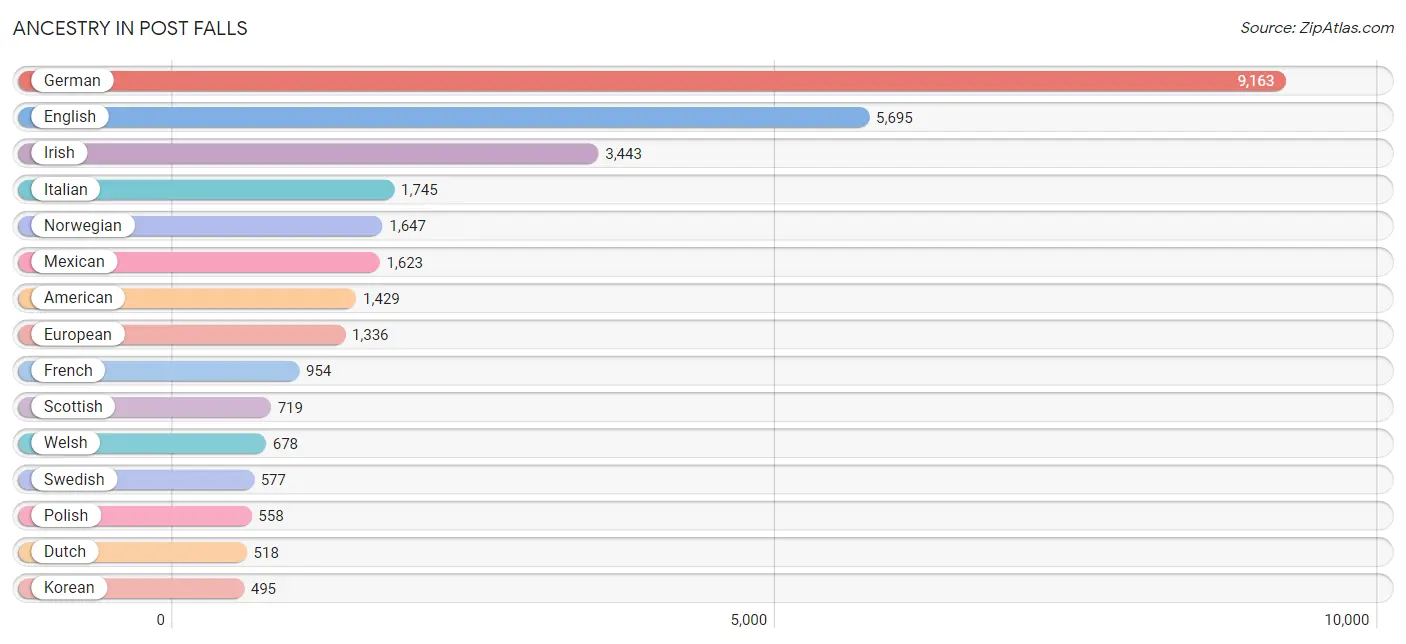
Ancestry in Post Falls
The most populous ancestries reported in Post Falls are German (9,163 | 22.9%), English (5,695 | 14.2%), Irish (3,443 | 8.6%), Italian (1,745 | 4.4%), and Norwegian (1,647 | 4.1%), together accounting for 54.2% of all Post Falls residents.
| Ancestry | # Population | % Population |
| Albanian | 28 | 0.1% |
| American | 1,429 | 3.6% |
| Arab | 113 | 0.3% |
| Australian | 60 | 0.2% |
| Austrian | 99 | 0.3% |
| Belgian | 54 | 0.1% |
| Bhutanese | 31 | 0.1% |
| Blackfeet | 50 | 0.1% |
| Brazilian | 28 | 0.1% |
| British | 245 | 0.6% |
| Bulgarian | 45 | 0.1% |
| Burmese | 30 | 0.1% |
| Canadian | 162 | 0.4% |
| Central American | 82 | 0.2% |
| Cherokee | 230 | 0.6% |
| Chilean | 38 | 0.1% |
| Chippewa | 8 | 0.0% |
| Colombian | 124 | 0.3% |
| Colville | 7 | 0.0% |
| Czech | 67 | 0.2% |
| Czechoslovakian | 19 | 0.1% |
| Danish | 89 | 0.2% |
| Delaware | 25 | 0.1% |
| Dominican | 22 | 0.1% |
| Dutch | 518 | 1.3% |
| Eastern European | 18 | 0.0% |
| English | 5,695 | 14.2% |
| European | 1,336 | 3.3% |
| Finnish | 55 | 0.1% |
| French | 954 | 2.4% |
| French Canadian | 208 | 0.5% |
| German | 9,163 | 22.9% |
| Greek | 133 | 0.3% |
| Honduran | 29 | 0.1% |
| Hungarian | 113 | 0.3% |
| Indian (Asian) | 3 | 0.0% |
| Inupiat | 93 | 0.2% |
| Iraqi | 3 | 0.0% |
| Irish | 3,443 | 8.6% |
| Italian | 1,745 | 4.4% |
| Korean | 495 | 1.2% |
| Lebanese | 49 | 0.1% |
| Lithuanian | 27 | 0.1% |
| Luxembourger | 15 | 0.0% |
| Maltese | 31 | 0.1% |
| Mexican | 1,623 | 4.1% |
| Native Hawaiian | 17 | 0.0% |
| Northern European | 28 | 0.1% |
| Norwegian | 1,647 | 4.1% |
| Panamanian | 53 | 0.1% |
| Peruvian | 17 | 0.0% |
| Polish | 558 | 1.4% |
| Portuguese | 100 | 0.3% |
| Puerto Rican | 196 | 0.5% |
| Romanian | 24 | 0.1% |
| Russian | 204 | 0.5% |
| Samoan | 103 | 0.3% |
| Scandinavian | 350 | 0.9% |
| Scotch-Irish | 223 | 0.6% |
| Scottish | 719 | 1.8% |
| Sioux | 10 | 0.0% |
| Slavic | 16 | 0.0% |
| South American | 179 | 0.4% |
| Spaniard | 95 | 0.2% |
| Spanish | 70 | 0.2% |
| Swedish | 577 | 1.4% |
| Swiss | 121 | 0.3% |
| Thai | 27 | 0.1% |
| Tlingit-Haida | 14 | 0.0% |
| Ukrainian | 29 | 0.1% |
| Welsh | 678 | 1.7% |
| Yugoslavian | 30 | 0.1% | View All 72 Rows |
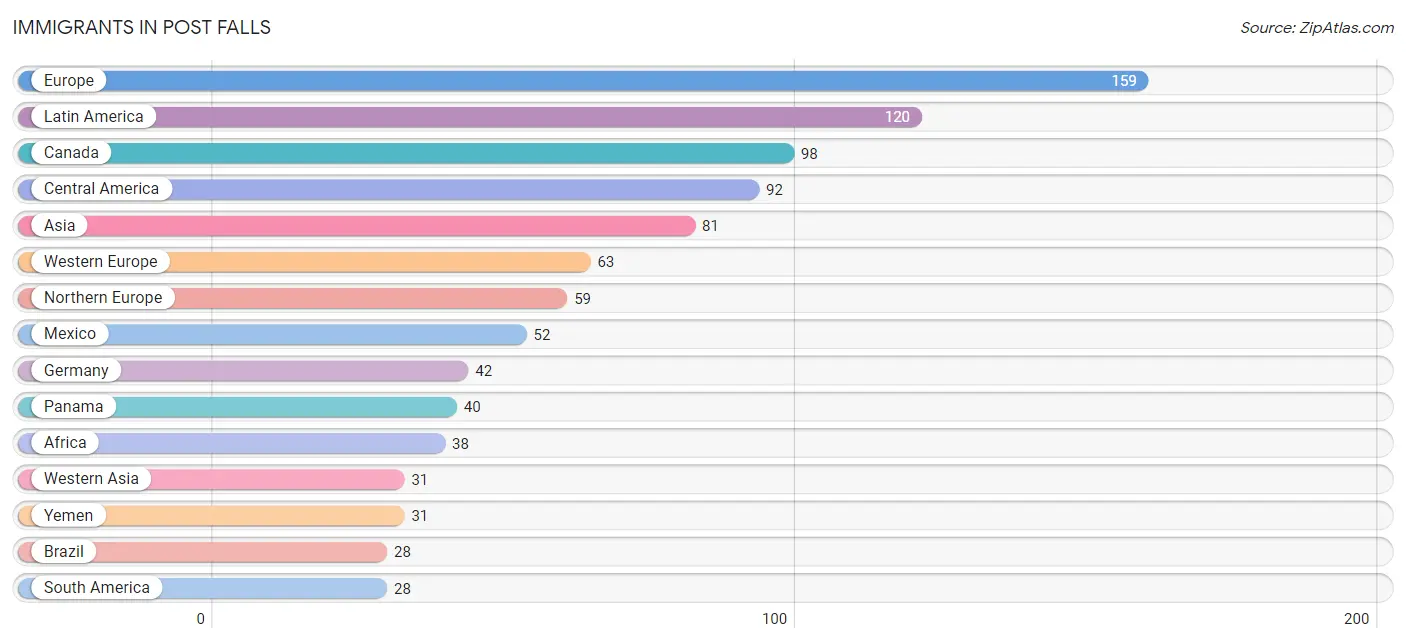
Immigrants in Post Falls
The most numerous immigrant groups reported in Post Falls came from Europe (159 | 0.4%), Latin America (120 | 0.3%), Canada (98 | 0.2%), Central America (92 | 0.2%), and Asia (81 | 0.2%), together accounting for 1.4% of all Post Falls residents.
| Immigration Origin | # Population | % Population |
| Africa | 38 | 0.1% |
| Asia | 81 | 0.2% |
| Australia | 27 | 0.1% |
| Belgium | 13 | 0.0% |
| Brazil | 28 | 0.1% |
| Canada | 98 | 0.2% |
| Central America | 92 | 0.2% |
| Eastern Africa | 26 | 0.1% |
| Eastern Asia | 4 | 0.0% |
| Eastern Europe | 26 | 0.1% |
| England | 19 | 0.1% |
| Europe | 159 | 0.4% |
| France | 8 | 0.0% |
| Germany | 42 | 0.1% |
| India | 7 | 0.0% |
| Korea | 4 | 0.0% |
| Latin America | 120 | 0.3% |
| Mexico | 52 | 0.1% |
| Northern Europe | 59 | 0.2% |
| Oceania | 27 | 0.1% |
| Panama | 40 | 0.1% |
| Philippines | 25 | 0.1% |
| South Africa | 12 | 0.0% |
| South America | 28 | 0.1% |
| South Central Asia | 21 | 0.1% |
| South Eastern Asia | 25 | 0.1% |
| Southern Europe | 11 | 0.0% |
| Spain | 11 | 0.0% |
| Ukraine | 26 | 0.1% |
| Western Asia | 31 | 0.1% |
| Western Europe | 63 | 0.2% |
| Yemen | 31 | 0.1% |
| Zimbabwe | 26 | 0.1% | View All 33 Rows |
Sex and Age in Post Falls
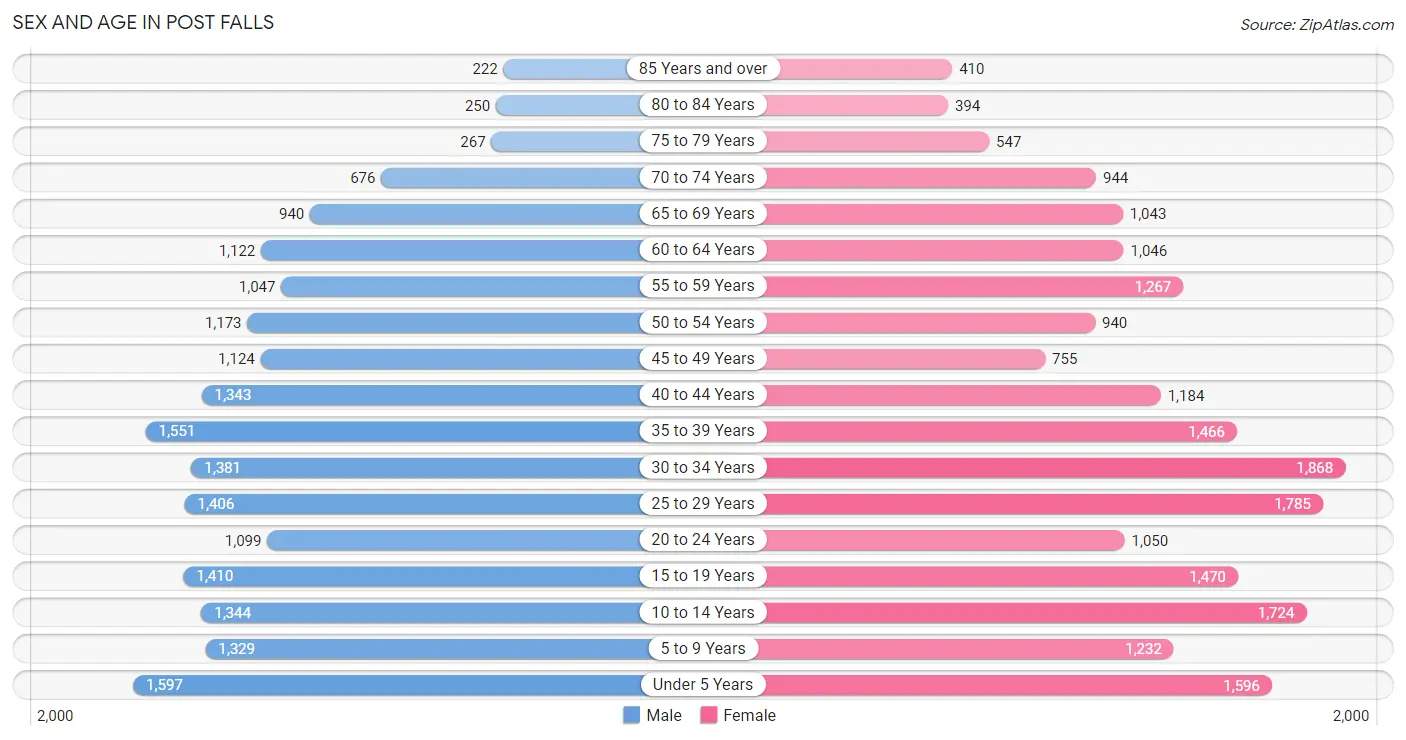
Sex and Age in Post Falls
The most populous age groups in Post Falls are Under 5 Years (1,597 | 8.3%) for men and 30 to 34 Years (1,868 | 9.0%) for women.
| Age Bracket | Male | Female |
| Under 5 Years | 1,597 (8.3%) | 1,596 (7.7%) |
| 5 to 9 Years | 1,329 (6.9%) | 1,232 (5.9%) |
| 10 to 14 Years | 1,344 (7.0%) | 1,724 (8.3%) |
| 15 to 19 Years | 1,410 (7.3%) | 1,470 (7.1%) |
| 20 to 24 Years | 1,099 (5.7%) | 1,050 (5.1%) |
| 25 to 29 Years | 1,406 (7.3%) | 1,785 (8.6%) |
| 30 to 34 Years | 1,381 (7.2%) | 1,868 (9.0%) |
| 35 to 39 Years | 1,551 (8.0%) | 1,466 (7.1%) |
| 40 to 44 Years | 1,343 (7.0%) | 1,184 (5.7%) |
| 45 to 49 Years | 1,124 (5.8%) | 755 (3.6%) |
| 50 to 54 Years | 1,173 (6.1%) | 940 (4.5%) |
| 55 to 59 Years | 1,047 (5.4%) | 1,267 (6.1%) |
| 60 to 64 Years | 1,122 (5.8%) | 1,046 (5.1%) |
| 65 to 69 Years | 940 (4.9%) | 1,043 (5.0%) |
| 70 to 74 Years | 676 (3.5%) | 944 (4.6%) |
| 75 to 79 Years | 267 (1.4%) | 547 (2.6%) |
| 80 to 84 Years | 250 (1.3%) | 394 (1.9%) |
| 85 Years and over | 222 (1.1%) | 410 (2.0%) |
| Total | 19,281 (100.0%) | 20,721 (100.0%) |
Families and Households in Post Falls
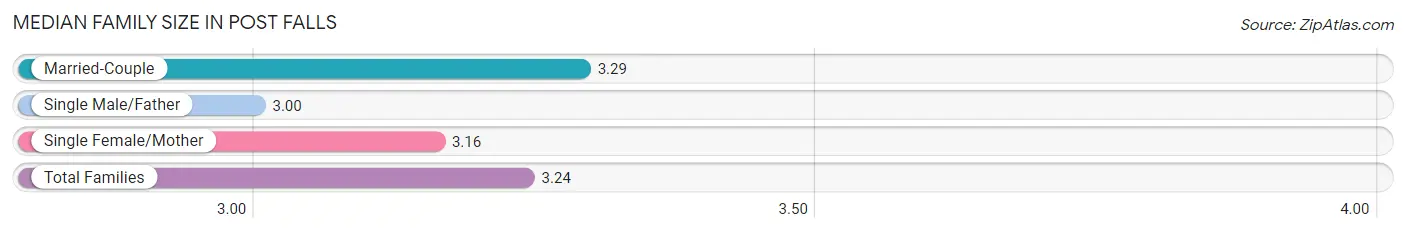
Median Family Size in Post Falls
The median family size in Post Falls is 3.24 persons per family, with married-couple families (7,212 | 72.3%) accounting for the largest median family size of 3.29 persons per family. On the other hand, single male/father families (998 | 10.0%) represent the smallest median family size with 3.00 persons per family.
| Family Type | # Families | Family Size |
| Married-Couple | 7,212 (72.3%) | 3.29 |
| Single Male/Father | 998 (10.0%) | 3.00 |
| Single Female/Mother | 1,767 (17.7%) | 3.16 |
| Total Families | 9,977 (100.0%) | 3.24 |
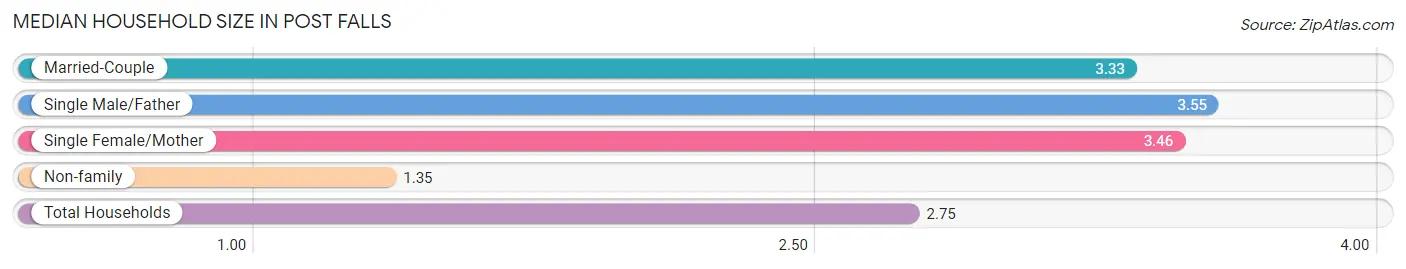
Median Household Size in Post Falls
The median household size in Post Falls is 2.75 persons per household, with single male/father households (998 | 6.9%) accounting for the largest median household size of 3.55 persons per household. non-family households (4,453 | 30.9%) represent the smallest median household size with 1.35 persons per household.
| Household Type | # Households | Household Size |
| Married-Couple | 7,212 (50.0%) | 3.33 |
| Single Male/Father | 998 (6.9%) | 3.55 |
| Single Female/Mother | 1,767 (12.2%) | 3.46 |
| Non-family | 4,453 (30.9%) | 1.35 |
| Total Households | 14,430 (100.0%) | 2.75 |
Household Size by Marriage Status in Post Falls
Out of a total of 14,430 households in Post Falls, 9,977 (69.1%) are family households, while 4,453 (30.9%) are nonfamily households. The most numerous type of family households are 2-person households, comprising 4,090, and the most common type of nonfamily households are 1-person households, comprising 3,622.
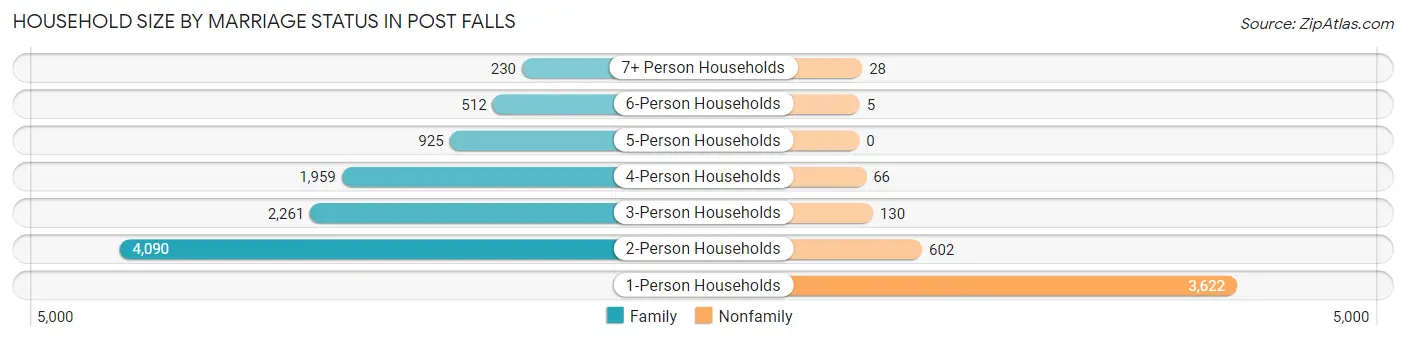
| Household Size | Family Households | Nonfamily Households |
| 1-Person Households | - | 3,622 (25.1%) |
| 2-Person Households | 4,090 (28.3%) | 602 (4.2%) |
| 3-Person Households | 2,261 (15.7%) | 130 (0.9%) |
| 4-Person Households | 1,959 (13.6%) | 66 (0.5%) |
| 5-Person Households | 925 (6.4%) | 0 (0.0%) |
| 6-Person Households | 512 (3.5%) | 5 (0.0%) |
| 7+ Person Households | 230 (1.6%) | 28 (0.2%) |
| Total | 9,977 (69.1%) | 4,453 (30.9%) |
Female Fertility in Post Falls
Fertility by Age in Post Falls
Average fertility rate in Post Falls is 76.0 births per 1,000 women. Women in the age bracket of 20 to 34 years have the highest fertility rate with 137.0 births per 1,000 women. Women in the age bracket of 20 to 34 years acount for 85.7% of all women with births.
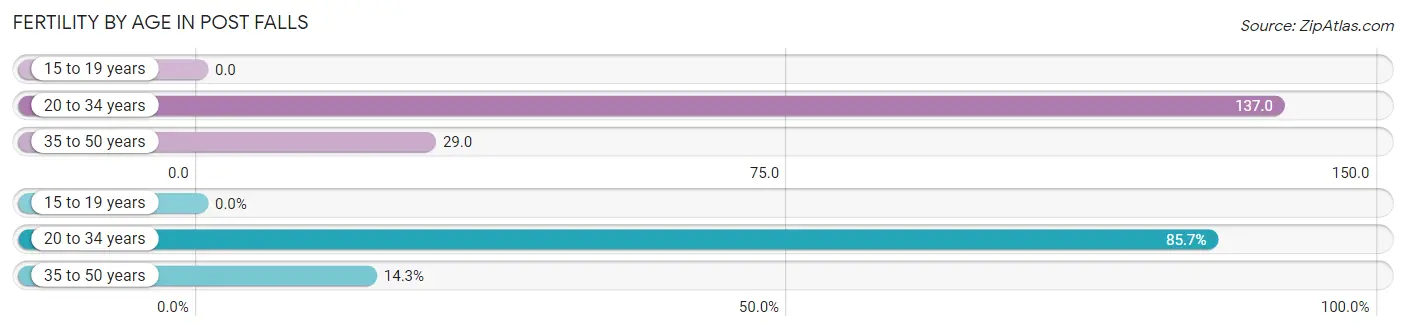
| Age Bracket | Women with Births | Births / 1,000 Women |
| 15 to 19 years | 0 (0.0%) | 0.0 |
| 20 to 34 years | 646 (85.7%) | 137.0 |
| 35 to 50 years | 108 (14.3%) | 29.0 |
| Total | 754 (100.0%) | 76.0 |
Fertility by Age by Marriage Status in Post Falls
71.8% of women with births (754) in Post Falls are married. The highest percentage of unmarried women with births falls into 35 to 50 years age bracket with 54.6% of them unmarried at the time of birth, while the lowest percentage of unmarried women with births belong to 20 to 34 years age bracket with 23.8% of them unmarried.
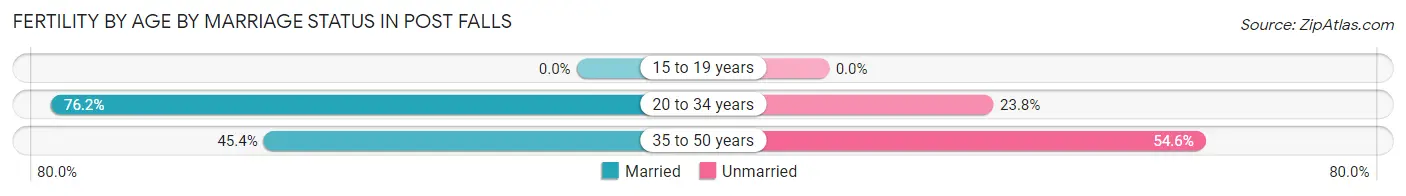
| Age Bracket | Married | Unmarried |
| 15 to 19 years | 0 (0.0%) | 0 (0.0%) |
| 20 to 34 years | 492 (76.2%) | 154 (23.8%) |
| 35 to 50 years | 49 (45.4%) | 59 (54.6%) |
| Total | 541 (71.8%) | 213 (28.2%) |
Fertility by Education in Post Falls
Average fertility rate in Post Falls is 76.0 births per 1,000 women. Women with the education attainment of bachelor's degree have the highest fertility rate of 94.0 births per 1,000 women, while women with the education attainment of less than high school have the lowest fertility at 17.0 births per 1,000 women. Women with the education attainment of college or associate's degree represent 38.6% of all women with births.
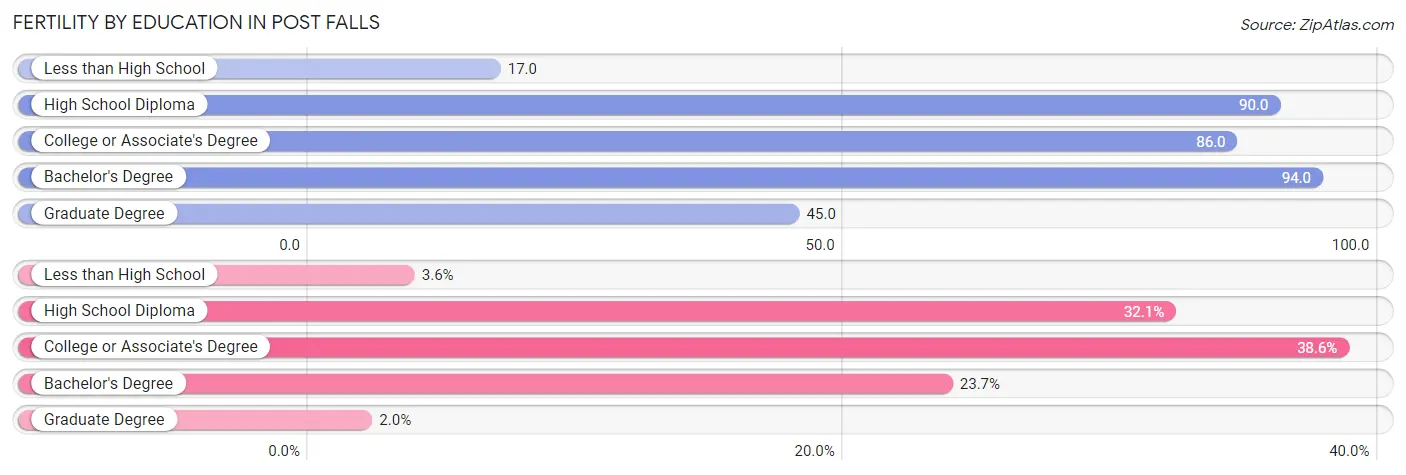
| Educational Attainment | Women with Births | Births / 1,000 Women |
| Less than High School | 27 (3.6%) | 17.0 |
| High School Diploma | 242 (32.1%) | 90.0 |
| College or Associate's Degree | 291 (38.6%) | 86.0 |
| Bachelor's Degree | 179 (23.7%) | 94.0 |
| Graduate Degree | 15 (2.0%) | 45.0 |
| Total | 754 (100.0%) | 76.0 |
Fertility by Education by Marriage Status in Post Falls
28.2% of women with births in Post Falls are unmarried. Women with the educational attainment of less than high school are most likely to be married with 100.0% of them married at childbirth, while women with the educational attainment of college or associate's degree are least likely to be married with 56.7% of them unmarried at childbirth.
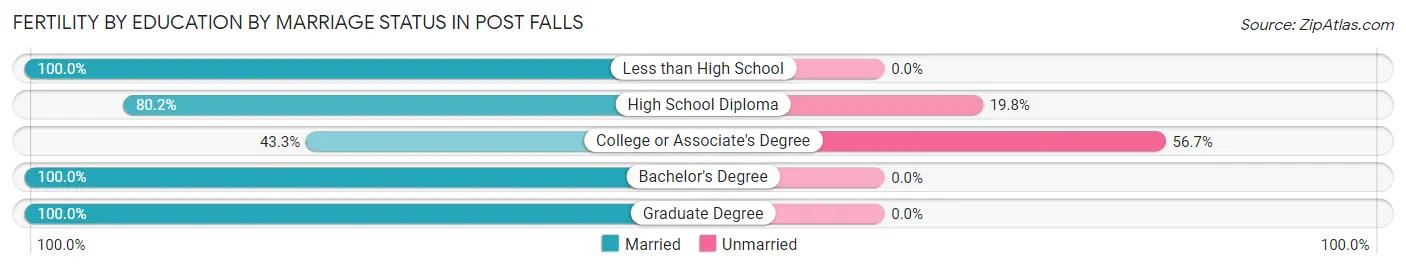
| Educational Attainment | Married | Unmarried |
| Less than High School | 27 (100.0%) | 0 (0.0%) |
| High School Diploma | 194 (80.2%) | 48 (19.8%) |
| College or Associate's Degree | 126 (43.3%) | 165 (56.7%) |
| Bachelor's Degree | 179 (100.0%) | 0 (0.0%) |
| Graduate Degree | 15 (100.0%) | 0 (0.0%) |
| Total | 541 (71.8%) | 213 (28.2%) |
Employment Characteristics in Post Falls
Employment by Class of Employer in Post Falls
Among the 18,074 employed individuals in Post Falls, private company employees (13,526 | 74.8%), not-for-profit organizations (1,536 | 8.5%), and local government employees (1,128 | 6.2%) make up the most common classes of employment.
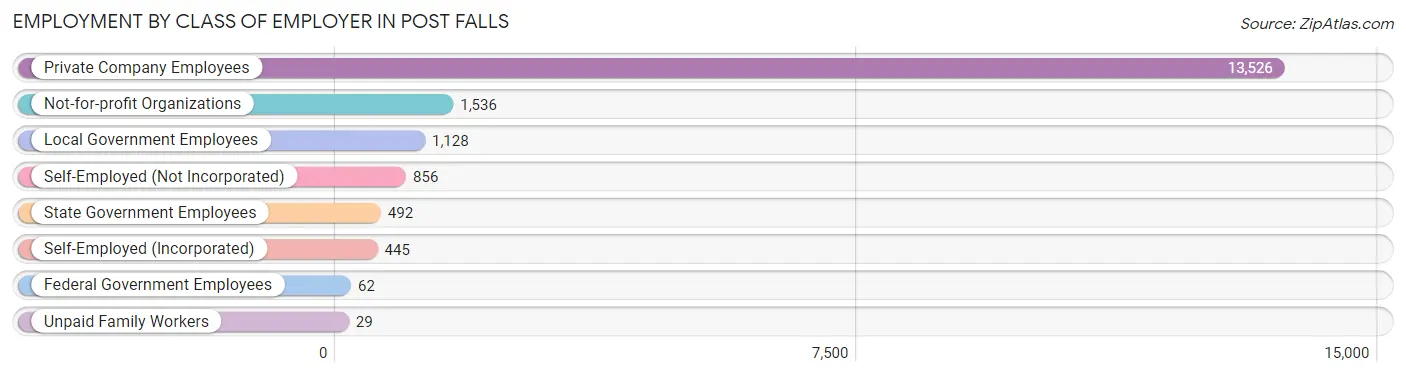
| Employer Class | # Employees | % Employees |
| Private Company Employees | 13,526 | 74.8% |
| Self-Employed (Incorporated) | 445 | 2.5% |
| Self-Employed (Not Incorporated) | 856 | 4.7% |
| Not-for-profit Organizations | 1,536 | 8.5% |
| Local Government Employees | 1,128 | 6.2% |
| State Government Employees | 492 | 2.7% |
| Federal Government Employees | 62 | 0.3% |
| Unpaid Family Workers | 29 | 0.2% |
| Total | 18,074 | 100.0% |
Employment Status by Age in Post Falls
According to the labor force statistics for Post Falls, out of the total population over 16 years of age (30,103), 63.5% or 19,115 individuals are in the labor force, with 3.3% or 631 of them unemployed. The age group with the highest labor force participation rate is 20 to 24 years, with 85.0% or 1,827 individuals in the labor force. Within the labor force, the 30 to 34 years age range has the highest percentage of unemployed individuals, with 6.2% or 169 of them being unemployed.
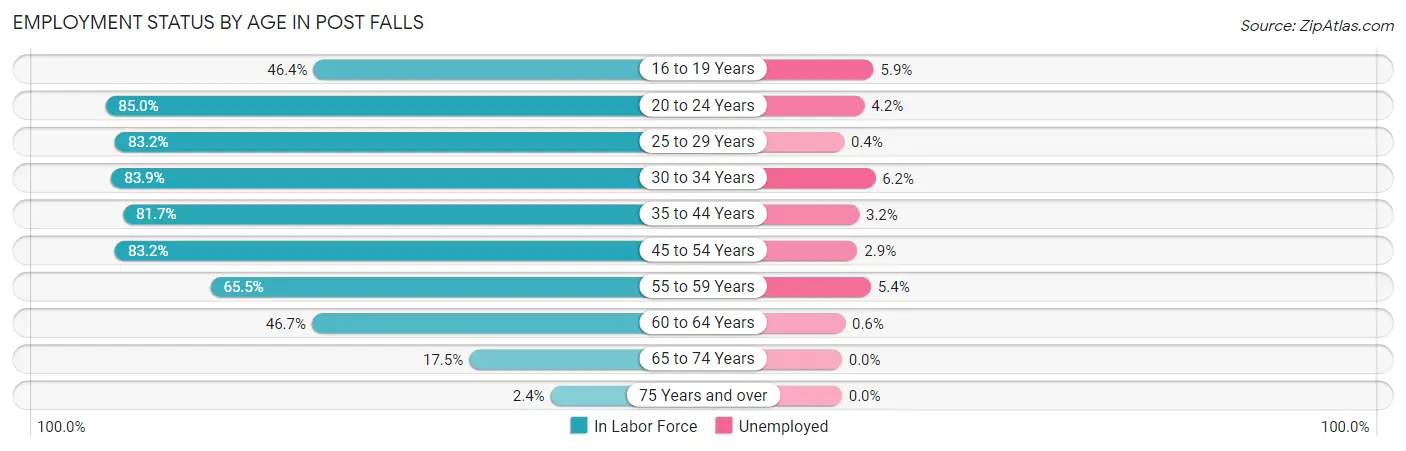
| Age Bracket | In Labor Force | Unemployed |
| 16 to 19 Years | 837 (46.4%) | 49 (5.9%) |
| 20 to 24 Years | 1,827 (85.0%) | 77 (4.2%) |
| 25 to 29 Years | 2,655 (83.2%) | 11 (0.4%) |
| 30 to 34 Years | 2,726 (83.9%) | 169 (6.2%) |
| 35 to 44 Years | 4,529 (81.7%) | 145 (3.2%) |
| 45 to 54 Years | 3,321 (83.2%) | 96 (2.9%) |
| 55 to 59 Years | 1,516 (65.5%) | 82 (5.4%) |
| 60 to 64 Years | 1,012 (46.7%) | 6 (0.6%) |
| 65 to 74 Years | 631 (17.5%) | 0 (0.0%) |
| 75 Years and over | 50 (2.4%) | 0 (0.0%) |
| Total | 19,115 (63.5%) | 631 (3.3%) |
Employment Status by Educational Attainment in Post Falls
According to labor force statistics for Post Falls, 77.0% of individuals (15,753) out of the total population between 25 and 64 years of age (20,458) are in the labor force, with 3.2% or 504 of them being unemployed. The group with the highest labor force participation rate are those with the educational attainment of bachelor's degree or higher, with 81.1% or 3,700 individuals in the labor force. Within the labor force, individuals with high school diploma education have the highest percentage of unemployment, with 6.9% or 345 of them being unemployed.
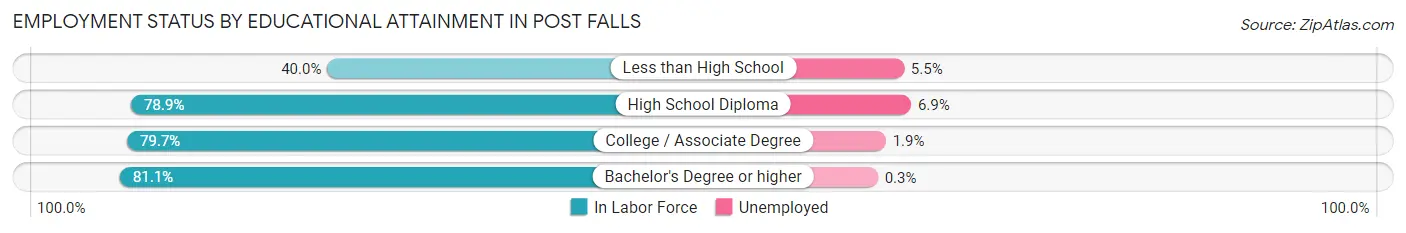
| Educational Attainment | In Labor Force | Unemployed |
| Less than High School | 564 (40.0%) | 78 (5.5%) |
| High School Diploma | 4,998 (78.9%) | 437 (6.9%) |
| College / Associate Degree | 6,496 (79.7%) | 155 (1.9%) |
| Bachelor's Degree or higher | 3,700 (81.1%) | 14 (0.3%) |
| Total | 15,753 (77.0%) | 655 (3.2%) |
Employment Occupations by Sex in Post Falls
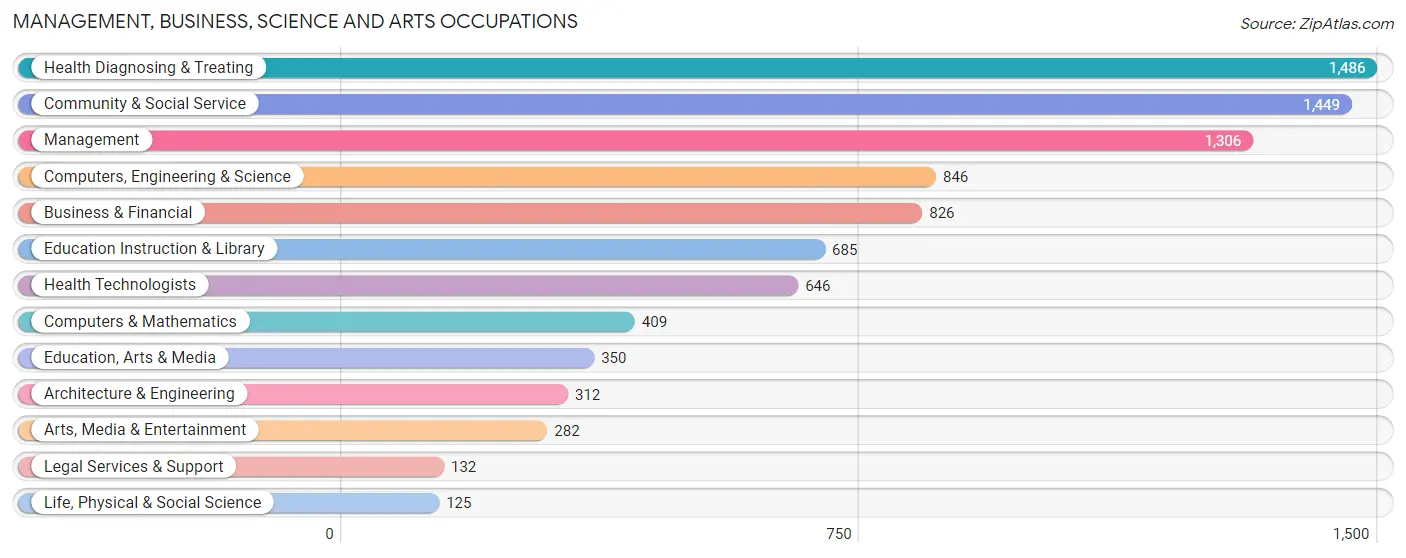
Management, Business, Science and Arts Occupations
The most common Management, Business, Science and Arts occupations in Post Falls are Health Diagnosing & Treating (1,486 | 8.1%), Community & Social Service (1,449 | 7.8%), Management (1,306 | 7.1%), Computers, Engineering & Science (846 | 4.6%), and Business & Financial (826 | 4.5%).
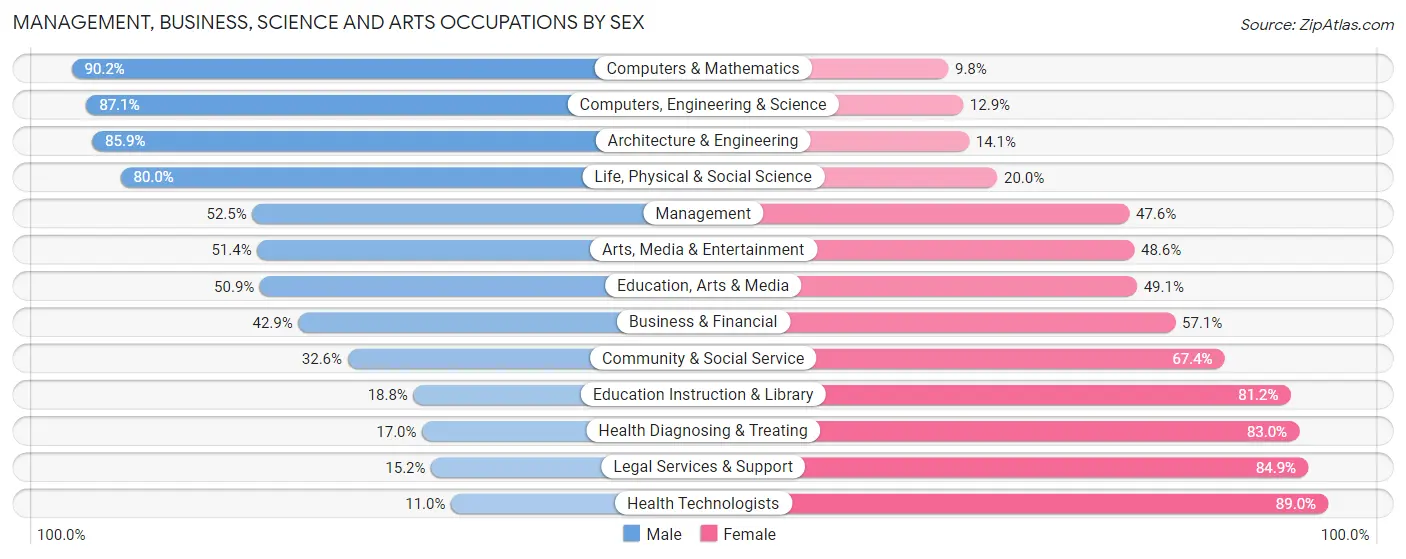
Management, Business, Science and Arts Occupations by Sex
Within the Management, Business, Science and Arts occupations in Post Falls, the most male-oriented occupations are Computers & Mathematics (90.2%), Computers, Engineering & Science (87.1%), and Architecture & Engineering (85.9%), while the most female-oriented occupations are Health Technologists (89.0%), Legal Services & Support (84.9%), and Health Diagnosing & Treating (83.0%).
| Occupation | Male | Female |
| Management | 685 (52.4%) | 621 (47.5%) |
| Business & Financial | 354 (42.9%) | 472 (57.1%) |
| Computers, Engineering & Science | 737 (87.1%) | 109 (12.9%) |
| Computers & Mathematics | 369 (90.2%) | 40 (9.8%) |
| Architecture & Engineering | 268 (85.9%) | 44 (14.1%) |
| Life, Physical & Social Science | 100 (80.0%) | 25 (20.0%) |
| Community & Social Service | 472 (32.6%) | 977 (67.4%) |
| Education, Arts & Media | 178 (50.9%) | 172 (49.1%) |
| Legal Services & Support | 20 (15.1%) | 112 (84.9%) |
| Education Instruction & Library | 129 (18.8%) | 556 (81.2%) |
| Arts, Media & Entertainment | 145 (51.4%) | 137 (48.6%) |
| Health Diagnosing & Treating | 253 (17.0%) | 1,233 (83.0%) |
| Health Technologists | 71 (11.0%) | 575 (89.0%) |
| Total (Category) | 2,501 (42.3%) | 3,412 (57.7%) |
| Total (Overall) | 9,677 (52.4%) | 8,794 (47.6%) |
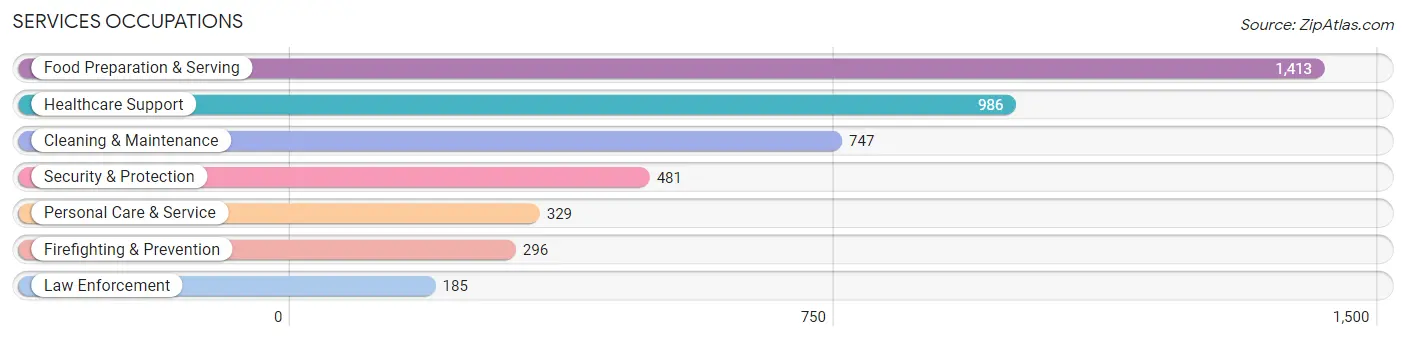
Services Occupations
The most common Services occupations in Post Falls are Food Preparation & Serving (1,413 | 7.6%), Healthcare Support (986 | 5.3%), Cleaning & Maintenance (747 | 4.0%), Security & Protection (481 | 2.6%), and Personal Care & Service (329 | 1.8%).
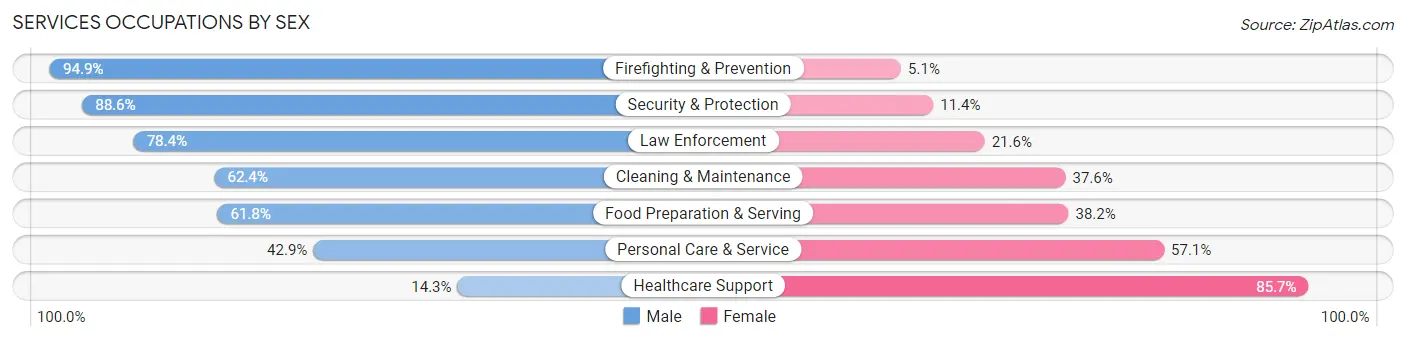
Services Occupations by Sex
Within the Services occupations in Post Falls, the most male-oriented occupations are Firefighting & Prevention (94.9%), Security & Protection (88.6%), and Law Enforcement (78.4%), while the most female-oriented occupations are Healthcare Support (85.7%), Personal Care & Service (57.1%), and Food Preparation & Serving (38.2%).
| Occupation | Male | Female |
| Healthcare Support | 141 (14.3%) | 845 (85.7%) |
| Security & Protection | 426 (88.6%) | 55 (11.4%) |
| Firefighting & Prevention | 281 (94.9%) | 15 (5.1%) |
| Law Enforcement | 145 (78.4%) | 40 (21.6%) |
| Food Preparation & Serving | 873 (61.8%) | 540 (38.2%) |
| Cleaning & Maintenance | 466 (62.4%) | 281 (37.6%) |
| Personal Care & Service | 141 (42.9%) | 188 (57.1%) |
| Total (Category) | 2,047 (51.7%) | 1,909 (48.3%) |
| Total (Overall) | 9,677 (52.4%) | 8,794 (47.6%) |
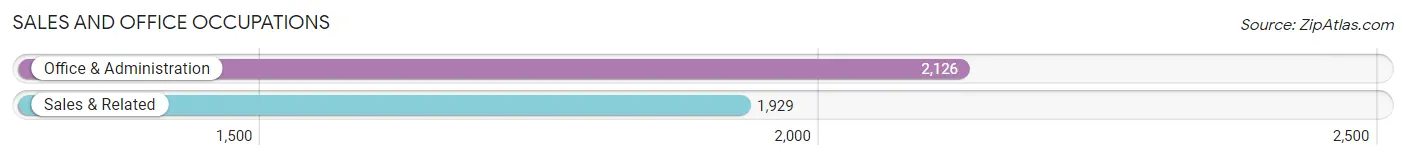
Sales and Office Occupations
The most common Sales and Office occupations in Post Falls are Office & Administration (2,126 | 11.5%), and Sales & Related (1,929 | 10.4%).
Sales and Office Occupations by Sex

| Occupation | Male | Female |
| Sales & Related | 936 (48.5%) | 993 (51.5%) |
| Office & Administration | 393 (18.5%) | 1,733 (81.5%) |
| Total (Category) | 1,329 (32.8%) | 2,726 (67.2%) |
| Total (Overall) | 9,677 (52.4%) | 8,794 (47.6%) |
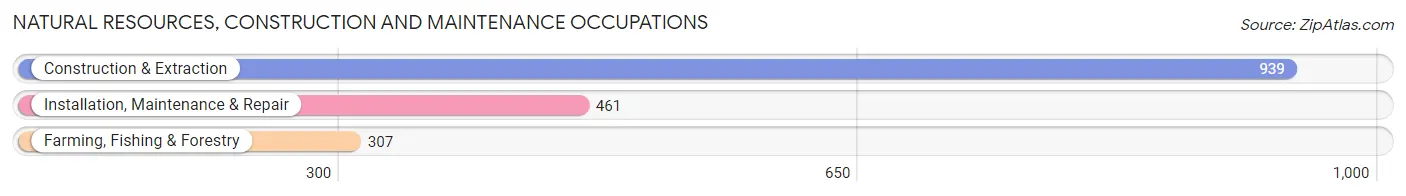
Natural Resources, Construction and Maintenance Occupations
The most common Natural Resources, Construction and Maintenance occupations in Post Falls are Construction & Extraction (939 | 5.1%), Installation, Maintenance & Repair (461 | 2.5%), and Farming, Fishing & Forestry (307 | 1.7%).
Natural Resources, Construction and Maintenance Occupations by Sex

| Occupation | Male | Female |
| Farming, Fishing & Forestry | 307 (100.0%) | 0 (0.0%) |
| Construction & Extraction | 939 (100.0%) | 0 (0.0%) |
| Installation, Maintenance & Repair | 445 (96.5%) | 16 (3.5%) |
| Total (Category) | 1,691 (99.1%) | 16 (0.9%) |
| Total (Overall) | 9,677 (52.4%) | 8,794 (47.6%) |
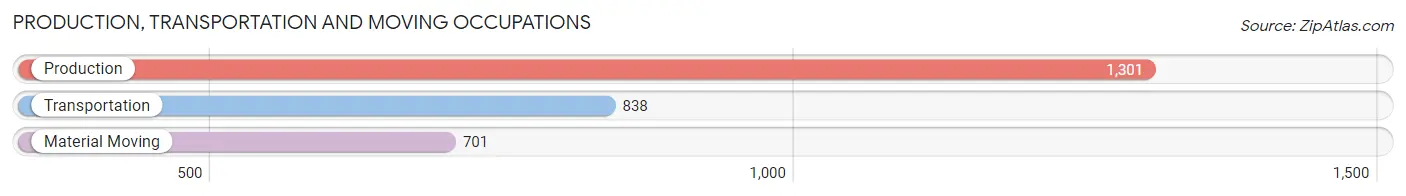
Production, Transportation and Moving Occupations
The most common Production, Transportation and Moving occupations in Post Falls are Production (1,301 | 7.0%), Transportation (838 | 4.5%), and Material Moving (701 | 3.8%).
Production, Transportation and Moving Occupations by Sex
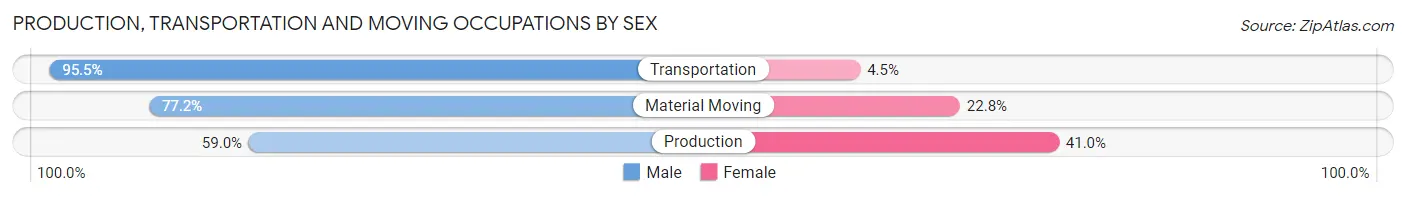
| Occupation | Male | Female |
| Production | 768 (59.0%) | 533 (41.0%) |
| Transportation | 800 (95.5%) | 38 (4.5%) |
| Material Moving | 541 (77.2%) | 160 (22.8%) |
| Total (Category) | 2,109 (74.3%) | 731 (25.7%) |
| Total (Overall) | 9,677 (52.4%) | 8,794 (47.6%) |
Employment Industries by Sex in Post Falls
Employment Industries in Post Falls
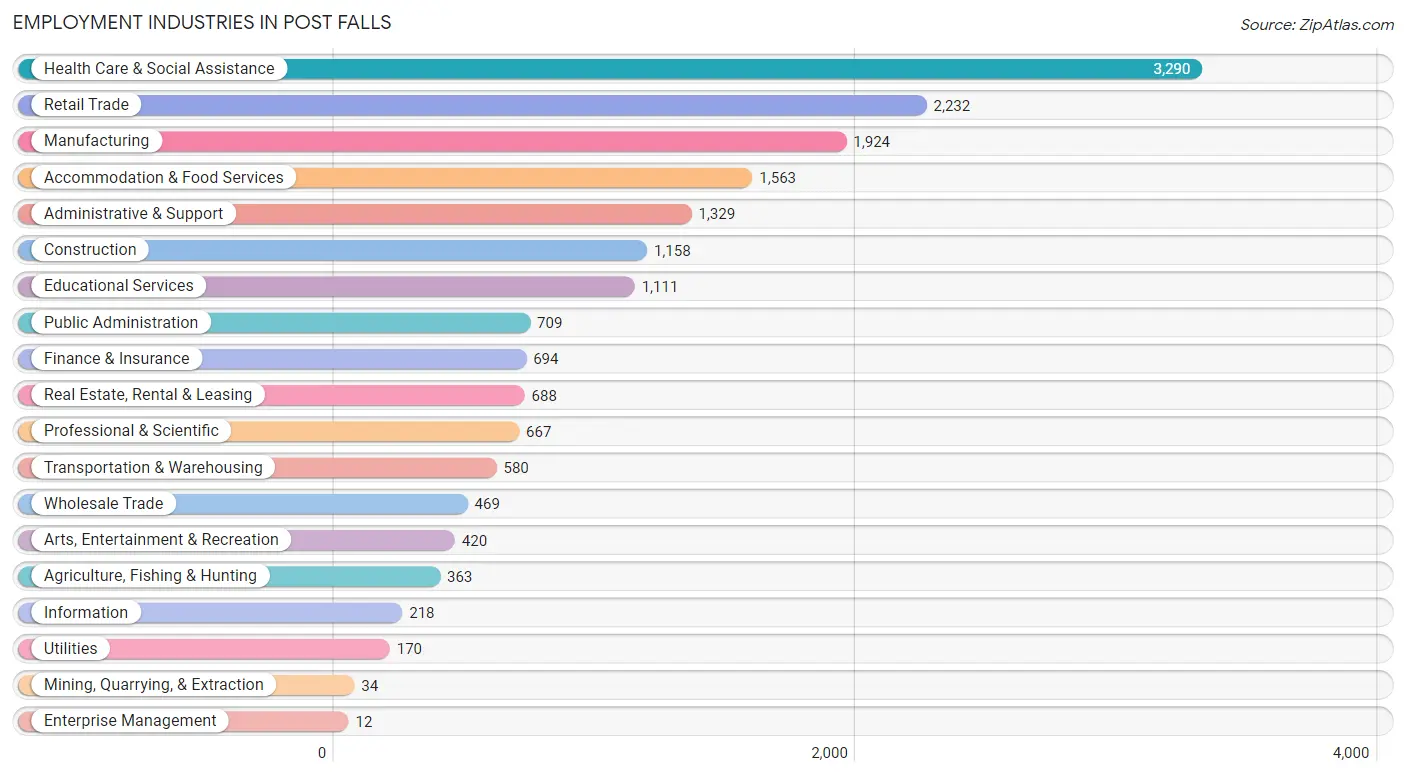
The major employment industries in Post Falls include Health Care & Social Assistance (3,290 | 17.8%), Retail Trade (2,232 | 12.1%), Manufacturing (1,924 | 10.4%), Accommodation & Food Services (1,563 | 8.5%), and Administrative & Support (1,329 | 7.2%).
Employment Industries by Sex in Post Falls
The Post Falls industries that see more men than women are Mining, Quarrying, & Extraction (100.0%), Construction (99.7%), and Agriculture, Fishing & Hunting (95.3%), whereas the industries that tend to have a higher number of women are Enterprise Management (100.0%), Health Care & Social Assistance (80.9%), and Educational Services (67.2%).
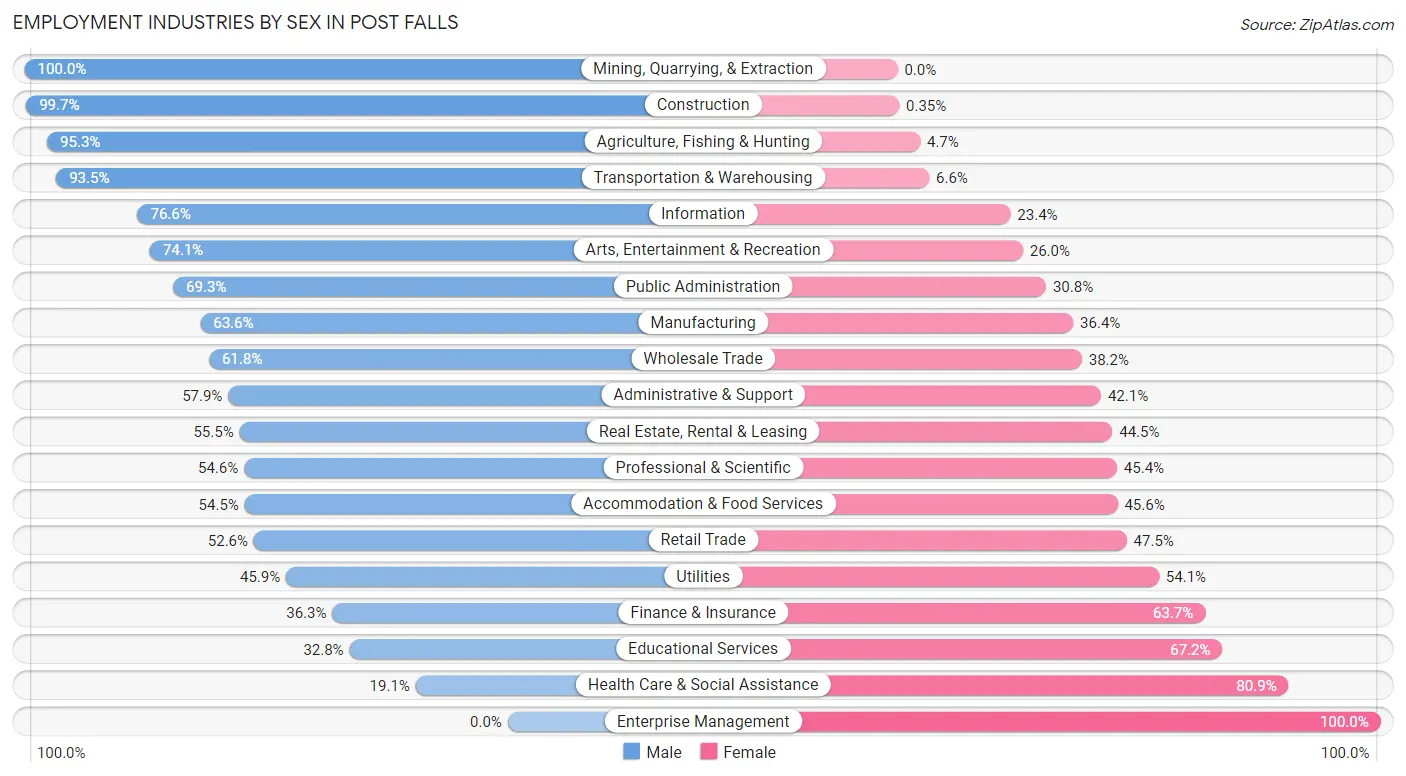
| Industry | Male | Female |
| Agriculture, Fishing & Hunting | 346 (95.3%) | 17 (4.7%) |
| Mining, Quarrying, & Extraction | 34 (100.0%) | 0 (0.0%) |
| Construction | 1,154 (99.7%) | 4 (0.4%) |
| Manufacturing | 1,224 (63.6%) | 700 (36.4%) |
| Wholesale Trade | 290 (61.8%) | 179 (38.2%) |
| Retail Trade | 1,173 (52.5%) | 1,059 (47.4%) |
| Transportation & Warehousing | 542 (93.4%) | 38 (6.6%) |
| Utilities | 78 (45.9%) | 92 (54.1%) |
| Information | 167 (76.6%) | 51 (23.4%) |
| Finance & Insurance | 252 (36.3%) | 442 (63.7%) |
| Real Estate, Rental & Leasing | 382 (55.5%) | 306 (44.5%) |
| Professional & Scientific | 364 (54.6%) | 303 (45.4%) |
| Enterprise Management | 0 (0.0%) | 12 (100.0%) |
| Administrative & Support | 769 (57.9%) | 560 (42.1%) |
| Educational Services | 364 (32.8%) | 747 (67.2%) |
| Health Care & Social Assistance | 627 (19.1%) | 2,663 (80.9%) |
| Arts, Entertainment & Recreation | 311 (74.1%) | 109 (26.0%) |
| Accommodation & Food Services | 851 (54.4%) | 712 (45.6%) |
| Public Administration | 491 (69.3%) | 218 (30.7%) |
| Total | 9,677 (52.4%) | 8,794 (47.6%) |
Education in Post Falls
School Enrollment in Post Falls
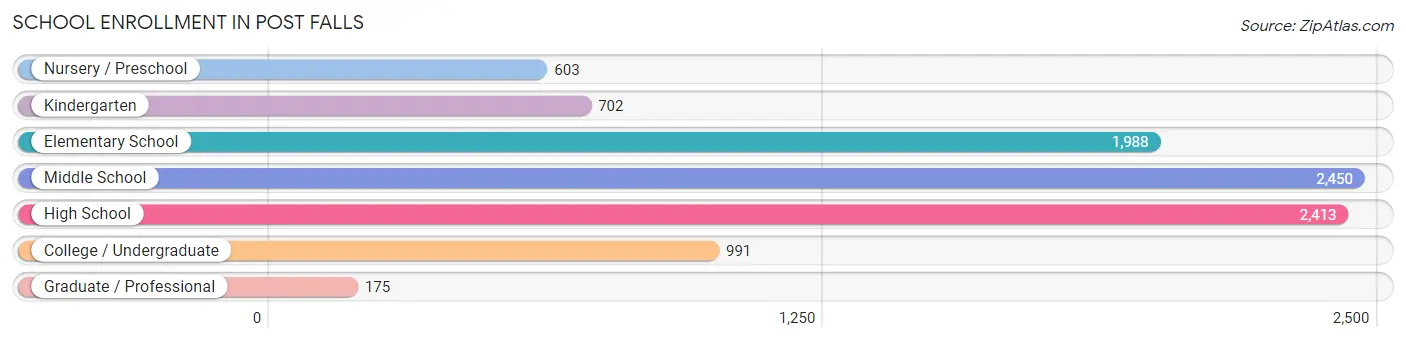
The most common levels of schooling among the 9,322 students in Post Falls are middle school (2,450 | 26.3%), high school (2,413 | 25.9%), and elementary school (1,988 | 21.3%).
| School Level | # Students | % Students |
| Nursery / Preschool | 603 | 6.5% |
| Kindergarten | 702 | 7.5% |
| Elementary School | 1,988 | 21.3% |
| Middle School | 2,450 | 26.3% |
| High School | 2,413 | 25.9% |
| College / Undergraduate | 991 | 10.6% |
| Graduate / Professional | 175 | 1.9% |
| Total | 9,322 | 100.0% |
School Enrollment by Age by Funding Source in Post Falls
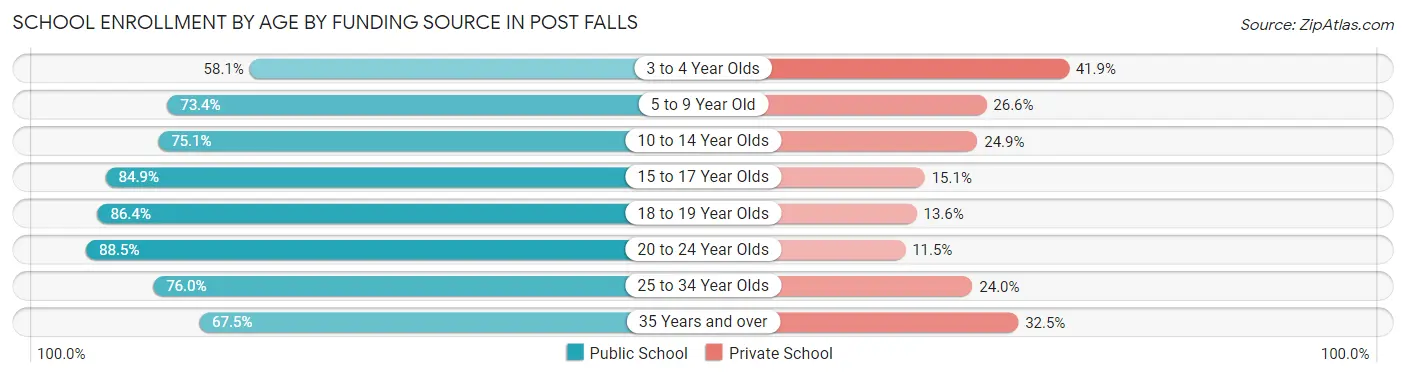
Out of a total of 9,322 students who are enrolled in schools in Post Falls, 2,200 (23.6%) attend a private institution, while the remaining 7,122 (76.4%) are enrolled in public schools. The age group of 3 to 4 year olds has the highest likelihood of being enrolled in private schools, with 262 (41.9% in the age bracket) enrolled. Conversely, the age group of 20 to 24 year olds has the lowest likelihood of being enrolled in a private school, with 340 (88.5% in the age bracket) attending a public institution.
| Age Bracket | Public School | Private School |
| 3 to 4 Year Olds | 363 (58.1%) | 262 (41.9%) |
| 5 to 9 Year Old | 1,765 (73.4%) | 639 (26.6%) |
| 10 to 14 Year Olds | 2,212 (75.1%) | 733 (24.9%) |
| 15 to 17 Year Olds | 1,653 (84.9%) | 294 (15.1%) |
| 18 to 19 Year Olds | 299 (86.4%) | 47 (13.6%) |
| 20 to 24 Year Olds | 340 (88.5%) | 44 (11.5%) |
| 25 to 34 Year Olds | 295 (76.0%) | 93 (24.0%) |
| 35 Years and over | 191 (67.5%) | 92 (32.5%) |
| Total | 7,122 (76.4%) | 2,200 (23.6%) |
Educational Attainment by Field of Study in Post Falls
Arts & humanities (896 | 14.4%), business (890 | 14.3%), science & technology (736 | 11.8%), education (686 | 11.0%), and bio, nature & agricultural (473 | 7.6%) are the most common fields of study among 6,234 individuals in Post Falls who have obtained a bachelor's degree or higher.
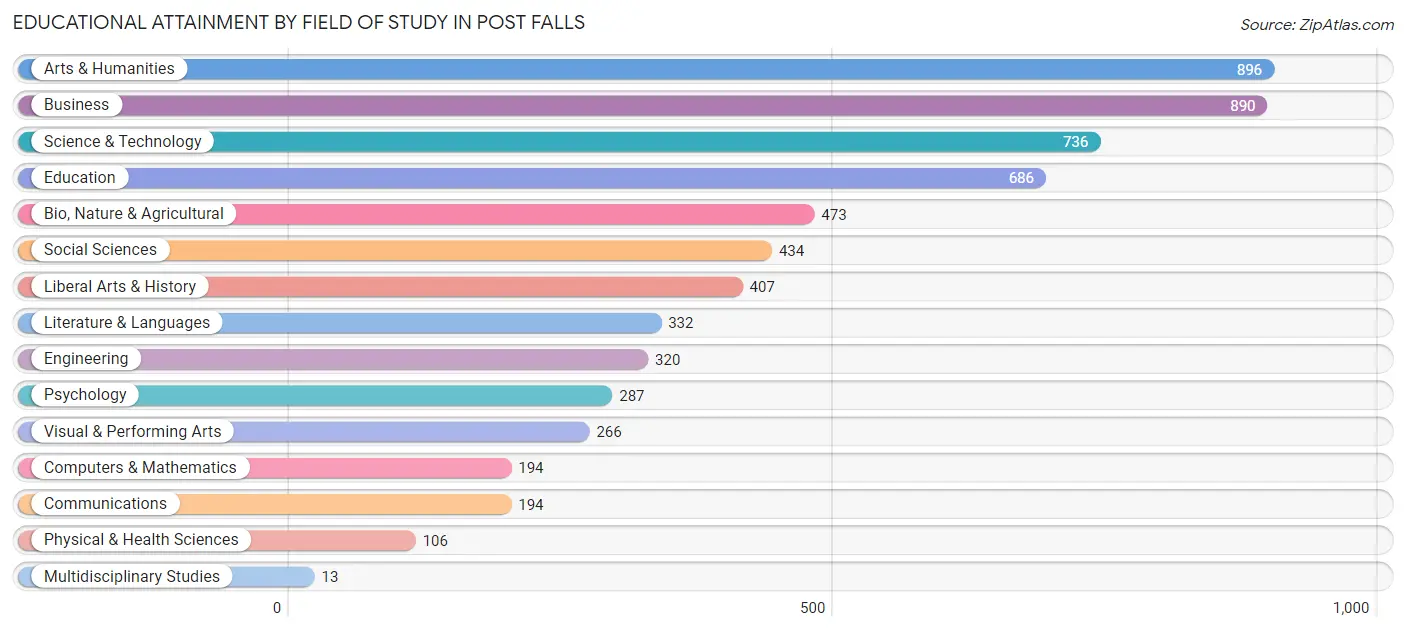
| Field of Study | # Graduates | % Graduates |
| Computers & Mathematics | 194 | 3.1% |
| Bio, Nature & Agricultural | 473 | 7.6% |
| Physical & Health Sciences | 106 | 1.7% |
| Psychology | 287 | 4.6% |
| Social Sciences | 434 | 7.0% |
| Engineering | 320 | 5.1% |
| Multidisciplinary Studies | 13 | 0.2% |
| Science & Technology | 736 | 11.8% |
| Business | 890 | 14.3% |
| Education | 686 | 11.0% |
| Literature & Languages | 332 | 5.3% |
| Liberal Arts & History | 407 | 6.5% |
| Visual & Performing Arts | 266 | 4.3% |
| Communications | 194 | 3.1% |
| Arts & Humanities | 896 | 14.4% |
| Total | 6,234 | 100.0% |
Transportation & Commute in Post Falls
Vehicle Availability by Sex in Post Falls
The most prevalent vehicle ownership categories in Post Falls are males with 2 vehicles (3,969, accounting for 41.6%) and females with 2 vehicles (3,808, making up 46.8%).
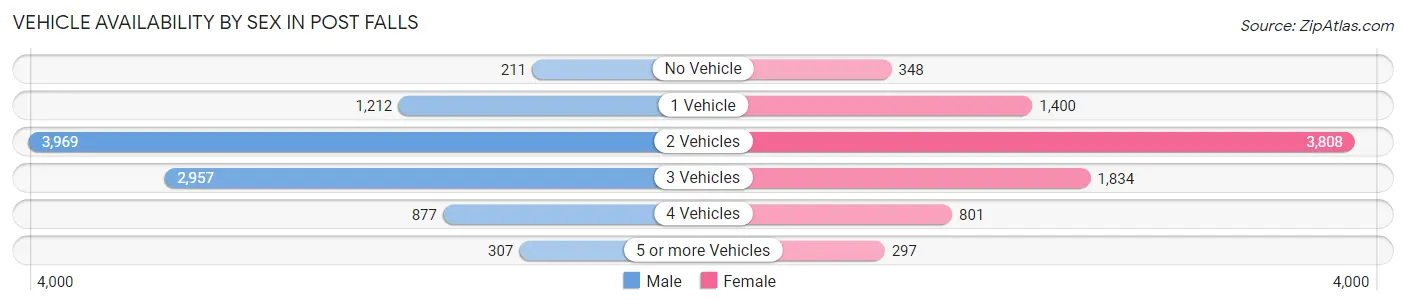
| Vehicles Available | Male | Female |
| No Vehicle | 211 (2.2%) | 348 (4.1%) |
| 1 Vehicle | 1,212 (12.7%) | 1,400 (16.5%) |
| 2 Vehicles | 3,969 (41.6%) | 3,808 (44.9%) |
| 3 Vehicles | 2,957 (31.0%) | 1,834 (21.6%) |
| 4 Vehicles | 877 (9.2%) | 801 (9.4%) |
| 5 or more Vehicles | 307 (3.2%) | 297 (3.5%) |
| Total | 9,533 (100.0%) | 8,488 (100.0%) |
Commute Time in Post Falls
The most frequently occuring commute durations in Post Falls are 15 to 19 minutes (3,518 commuters, 21.4%), 20 to 24 minutes (3,159 commuters, 19.2%), and 5 to 9 minutes (2,415 commuters, 14.7%).
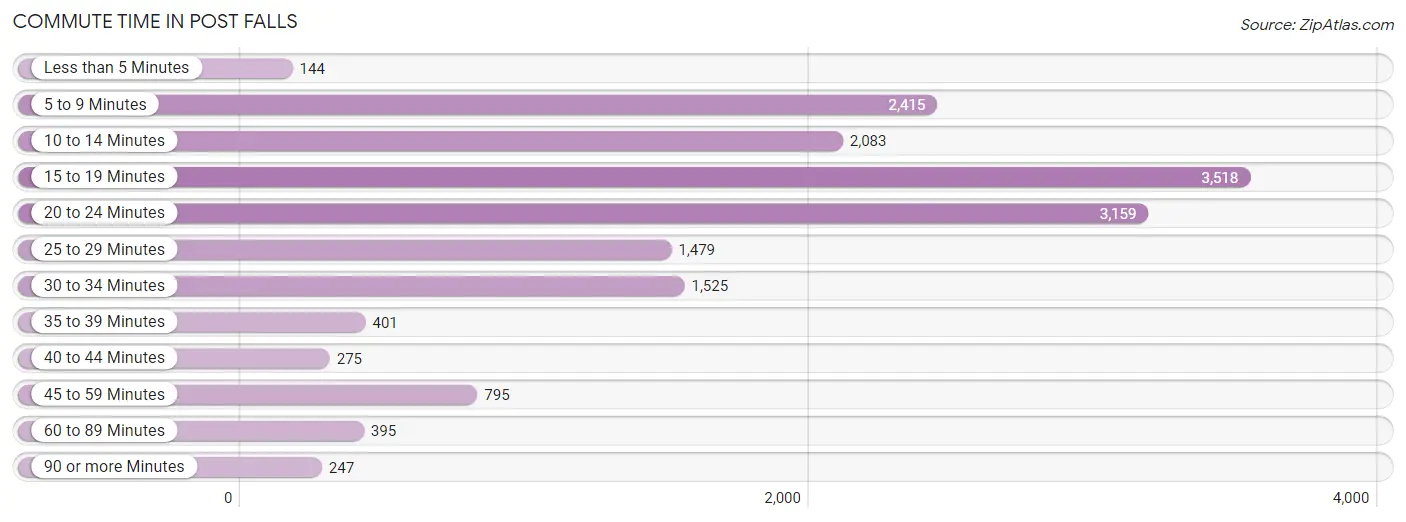
| Commute Time | # Commuters | % Commuters |
| Less than 5 Minutes | 144 | 0.9% |
| 5 to 9 Minutes | 2,415 | 14.7% |
| 10 to 14 Minutes | 2,083 | 12.7% |
| 15 to 19 Minutes | 3,518 | 21.4% |
| 20 to 24 Minutes | 3,159 | 19.2% |
| 25 to 29 Minutes | 1,479 | 9.0% |
| 30 to 34 Minutes | 1,525 | 9.3% |
| 35 to 39 Minutes | 401 | 2.4% |
| 40 to 44 Minutes | 275 | 1.7% |
| 45 to 59 Minutes | 795 | 4.8% |
| 60 to 89 Minutes | 395 | 2.4% |
| 90 or more Minutes | 247 | 1.5% |
Commute Time by Sex in Post Falls
The most common commute times in Post Falls are 20 to 24 minutes (1,611 commuters, 18.6%) for males and 15 to 19 minutes (2,183 commuters, 28.1%) for females.
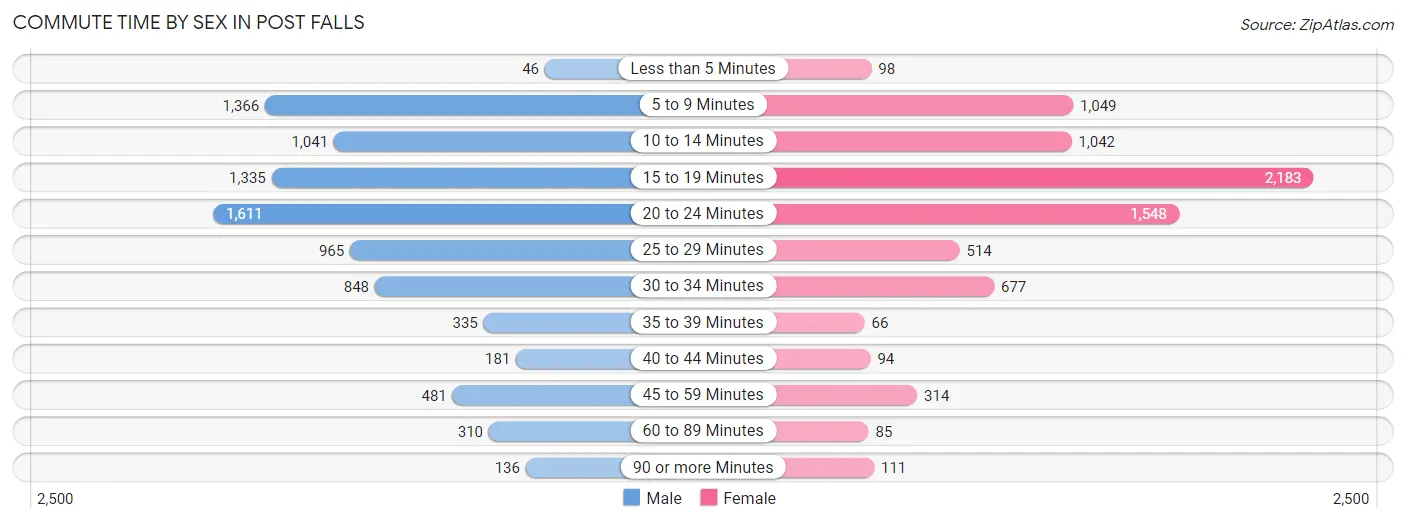
| Commute Time | Male | Female |
| Less than 5 Minutes | 46 (0.5%) | 98 (1.3%) |
| 5 to 9 Minutes | 1,366 (15.8%) | 1,049 (13.5%) |
| 10 to 14 Minutes | 1,041 (12.0%) | 1,042 (13.4%) |
| 15 to 19 Minutes | 1,335 (15.4%) | 2,183 (28.1%) |
| 20 to 24 Minutes | 1,611 (18.6%) | 1,548 (19.9%) |
| 25 to 29 Minutes | 965 (11.2%) | 514 (6.6%) |
| 30 to 34 Minutes | 848 (9.8%) | 677 (8.7%) |
| 35 to 39 Minutes | 335 (3.9%) | 66 (0.9%) |
| 40 to 44 Minutes | 181 (2.1%) | 94 (1.2%) |
| 45 to 59 Minutes | 481 (5.6%) | 314 (4.0%) |
| 60 to 89 Minutes | 310 (3.6%) | 85 (1.1%) |
| 90 or more Minutes | 136 (1.6%) | 111 (1.4%) |
Time of Departure to Work by Sex in Post Falls
The most frequent times of departure to work in Post Falls are 7:00 AM to 7:29 AM (1,243, 14.4%) for males and 7:00 AM to 7:29 AM (1,283, 16.5%) for females.
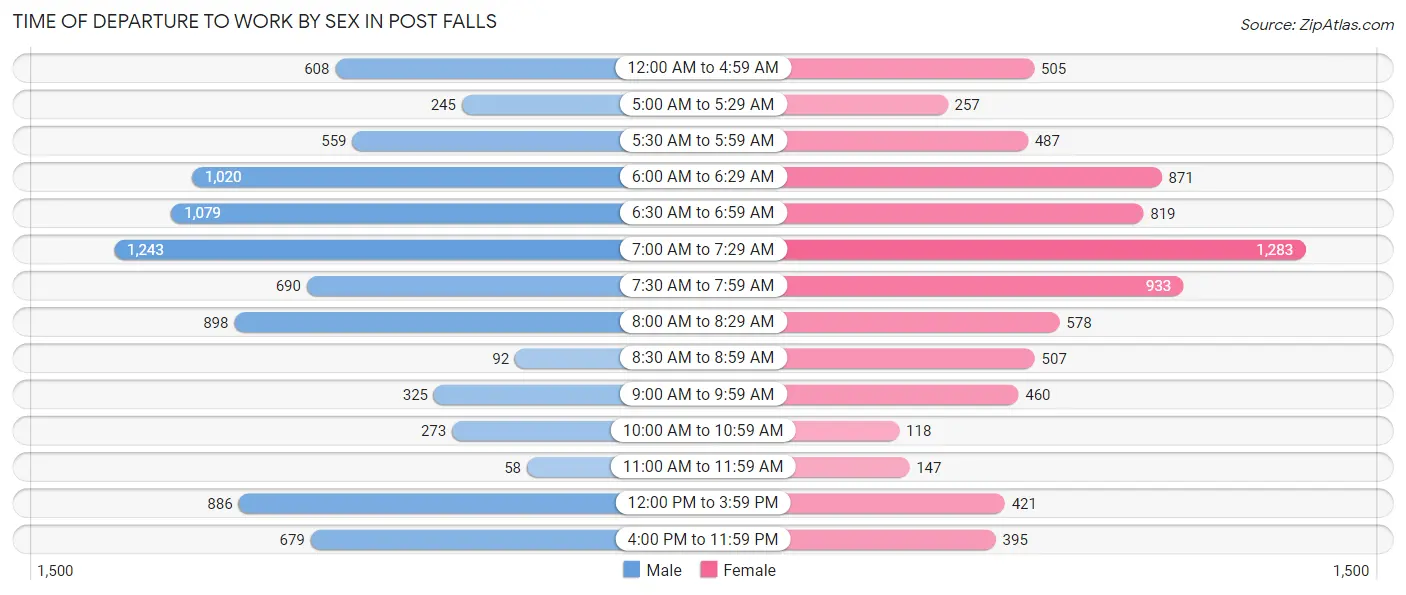
| Time of Departure | Male | Female |
| 12:00 AM to 4:59 AM | 608 (7.0%) | 505 (6.5%) |
| 5:00 AM to 5:29 AM | 245 (2.8%) | 257 (3.3%) |
| 5:30 AM to 5:59 AM | 559 (6.5%) | 487 (6.3%) |
| 6:00 AM to 6:29 AM | 1,020 (11.8%) | 871 (11.2%) |
| 6:30 AM to 6:59 AM | 1,079 (12.5%) | 819 (10.5%) |
| 7:00 AM to 7:29 AM | 1,243 (14.4%) | 1,283 (16.5%) |
| 7:30 AM to 7:59 AM | 690 (8.0%) | 933 (12.0%) |
| 8:00 AM to 8:29 AM | 898 (10.4%) | 578 (7.4%) |
| 8:30 AM to 8:59 AM | 92 (1.1%) | 507 (6.5%) |
| 9:00 AM to 9:59 AM | 325 (3.8%) | 460 (5.9%) |
| 10:00 AM to 10:59 AM | 273 (3.2%) | 118 (1.5%) |
| 11:00 AM to 11:59 AM | 58 (0.7%) | 147 (1.9%) |
| 12:00 PM to 3:59 PM | 886 (10.2%) | 421 (5.4%) |
| 4:00 PM to 11:59 PM | 679 (7.9%) | 395 (5.1%) |
| Total | 8,655 (100.0%) | 7,781 (100.0%) |
Housing Occupancy in Post Falls
Occupancy by Ownership in Post Falls
Of the total 14,430 dwellings in Post Falls, owner-occupied units account for 9,806 (68.0%), while renter-occupied units make up 4,624 (32.0%).
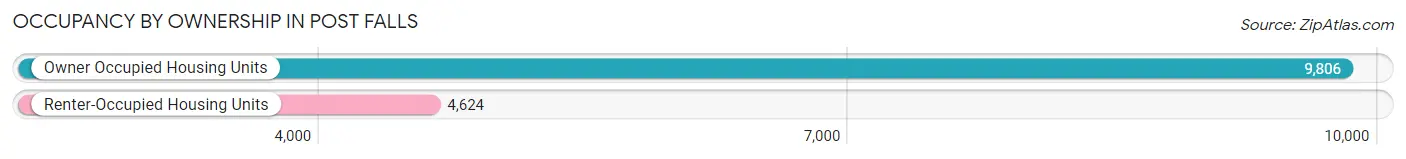
| Occupancy | # Housing Units | % Housing Units |
| Owner Occupied Housing Units | 9,806 | 68.0% |
| Renter-Occupied Housing Units | 4,624 | 32.0% |
| Total Occupied Housing Units | 14,430 | 100.0% |
Occupancy by Household Size in Post Falls
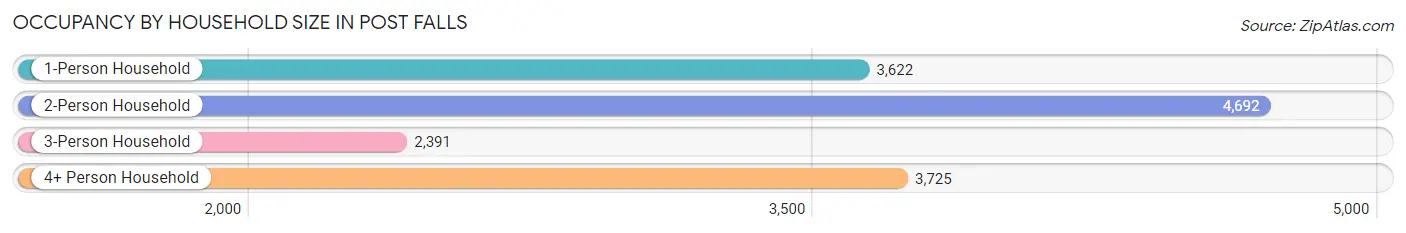
| Household Size | # Housing Units | % Housing Units |
| 1-Person Household | 3,622 | 25.1% |
| 2-Person Household | 4,692 | 32.5% |
| 3-Person Household | 2,391 | 16.6% |
| 4+ Person Household | 3,725 | 25.8% |
| Total Housing Units | 14,430 | 100.0% |
Occupancy by Ownership by Household Size in Post Falls
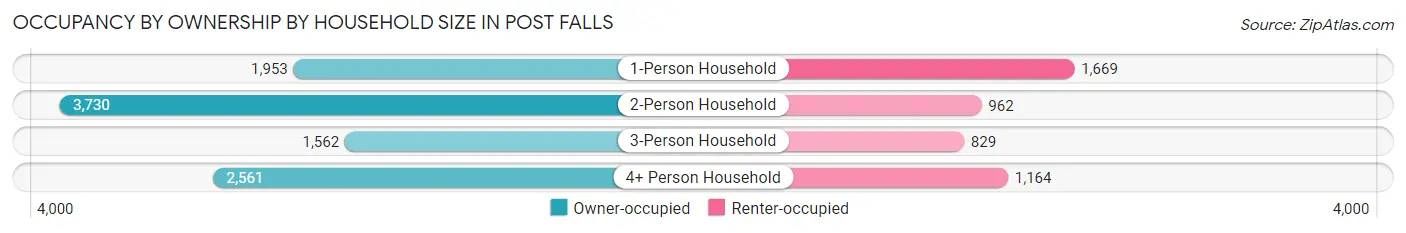
| Household Size | Owner-occupied | Renter-occupied |
| 1-Person Household | 1,953 (53.9%) | 1,669 (46.1%) |
| 2-Person Household | 3,730 (79.5%) | 962 (20.5%) |
| 3-Person Household | 1,562 (65.3%) | 829 (34.7%) |
| 4+ Person Household | 2,561 (68.8%) | 1,164 (31.2%) |
| Total Housing Units | 9,806 (68.0%) | 4,624 (32.0%) |
Occupancy by Educational Attainment in Post Falls
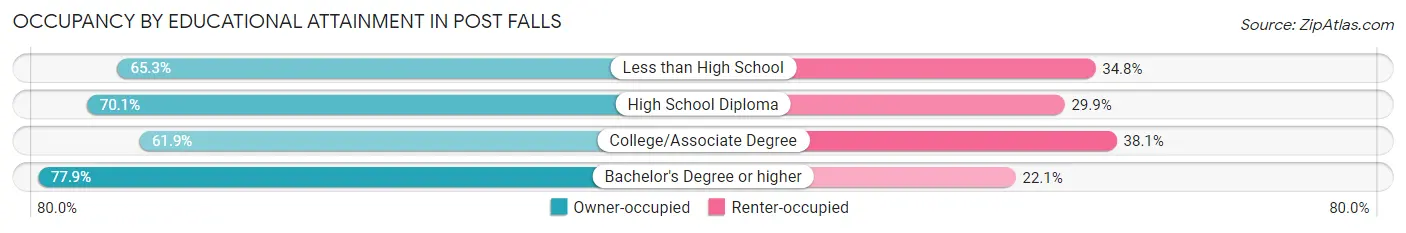
| Household Size | Owner-occupied | Renter-occupied |
| Less than High School | 693 (65.2%) | 369 (34.7%) |
| High School Diploma | 2,425 (70.1%) | 1,033 (29.9%) |
| College/Associate Degree | 3,979 (61.9%) | 2,453 (38.1%) |
| Bachelor's Degree or higher | 2,709 (77.9%) | 769 (22.1%) |
Occupancy by Age of Householder in Post Falls
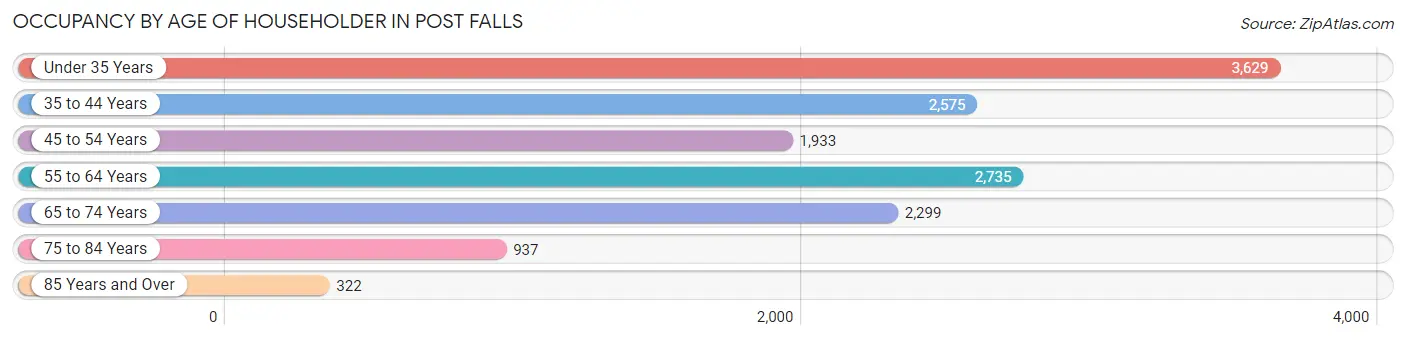
| Age Bracket | # Households | % Households |
| Under 35 Years | 3,629 | 25.2% |
| 35 to 44 Years | 2,575 | 17.8% |
| 45 to 54 Years | 1,933 | 13.4% |
| 55 to 64 Years | 2,735 | 19.0% |
| 65 to 74 Years | 2,299 | 15.9% |
| 75 to 84 Years | 937 | 6.5% |
| 85 Years and Over | 322 | 2.2% |
| Total | 14,430 | 100.0% |
Housing Finances in Post Falls
Median Income by Occupancy in Post Falls
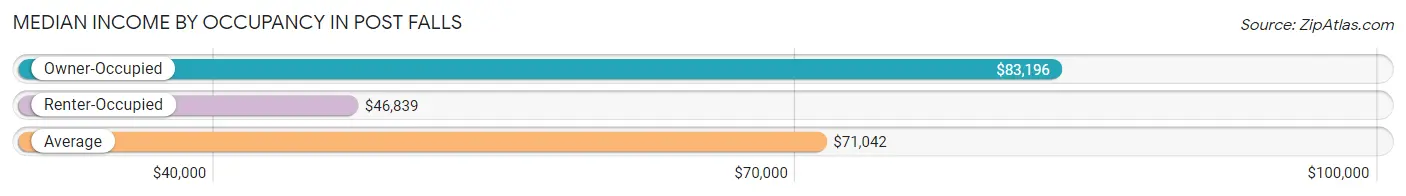
| Occupancy Type | # Households | Median Income |
| Owner-Occupied | 9,806 (68.0%) | $83,196 |
| Renter-Occupied | 4,624 (32.0%) | $46,839 |
| Average | 14,430 (100.0%) | $71,042 |
Occupancy by Householder Income Bracket in Post Falls
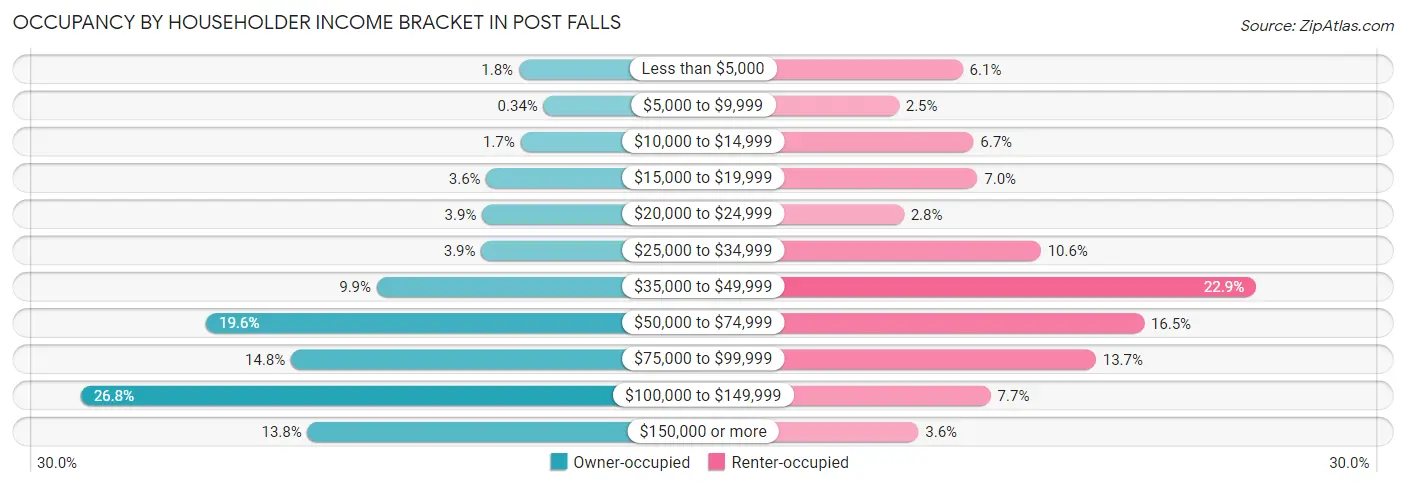
| Income Bracket | Owner-occupied | Renter-occupied |
| Less than $5,000 | 172 (1.8%) | 283 (6.1%) |
| $5,000 to $9,999 | 33 (0.3%) | 114 (2.5%) |
| $10,000 to $14,999 | 163 (1.7%) | 311 (6.7%) |
| $15,000 to $19,999 | 354 (3.6%) | 322 (7.0%) |
| $20,000 to $24,999 | 378 (3.8%) | 127 (2.8%) |
| $25,000 to $34,999 | 382 (3.9%) | 489 (10.6%) |
| $35,000 to $49,999 | 968 (9.9%) | 1,058 (22.9%) |
| $50,000 to $74,999 | 1,925 (19.6%) | 762 (16.5%) |
| $75,000 to $99,999 | 1,448 (14.8%) | 635 (13.7%) |
| $100,000 to $149,999 | 2,627 (26.8%) | 357 (7.7%) |
| $150,000 or more | 1,356 (13.8%) | 166 (3.6%) |
| Total | 9,806 (100.0%) | 4,624 (100.0%) |
Monthly Housing Cost Tiers in Post Falls
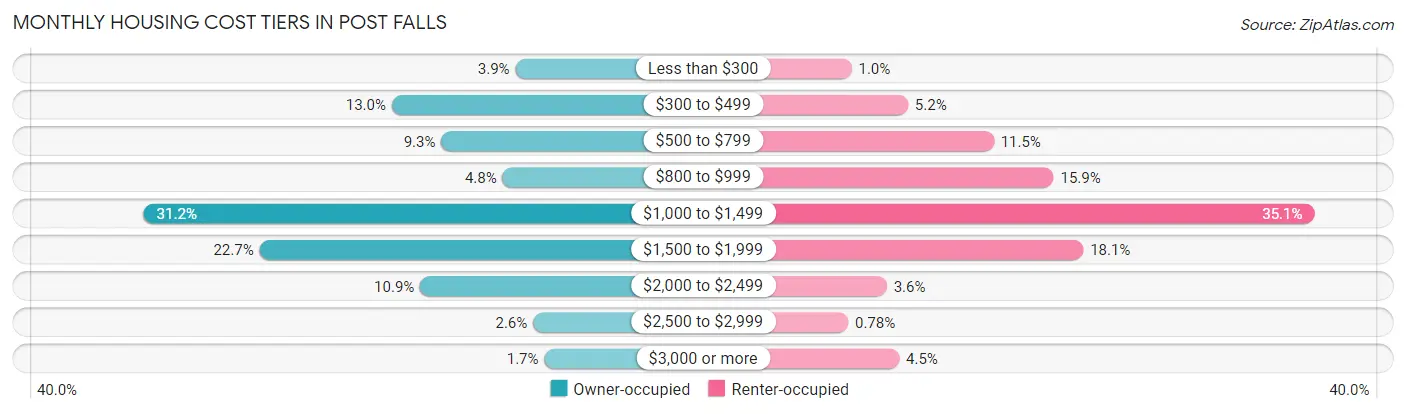
| Monthly Cost | Owner-occupied | Renter-occupied |
| Less than $300 | 378 (3.8%) | 48 (1.0%) |
| $300 to $499 | 1,271 (13.0%) | 240 (5.2%) |
| $500 to $799 | 913 (9.3%) | 532 (11.5%) |
| $800 to $999 | 471 (4.8%) | 736 (15.9%) |
| $1,000 to $1,499 | 3,062 (31.2%) | 1,624 (35.1%) |
| $1,500 to $1,999 | 2,226 (22.7%) | 837 (18.1%) |
| $2,000 to $2,499 | 1,066 (10.9%) | 168 (3.6%) |
| $2,500 to $2,999 | 250 (2.5%) | 36 (0.8%) |
| $3,000 or more | 169 (1.7%) | 210 (4.5%) |
| Total | 9,806 (100.0%) | 4,624 (100.0%) |
Physical Housing Characteristics in Post Falls
Housing Structures in Post Falls
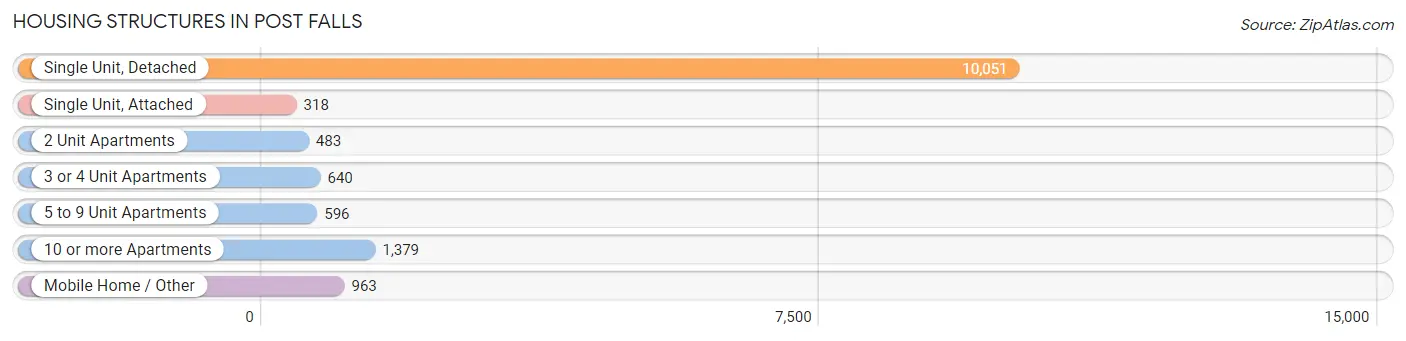
| Structure Type | # Housing Units | % Housing Units |
| Single Unit, Detached | 10,051 | 69.7% |
| Single Unit, Attached | 318 | 2.2% |
| 2 Unit Apartments | 483 | 3.4% |
| 3 or 4 Unit Apartments | 640 | 4.4% |
| 5 to 9 Unit Apartments | 596 | 4.1% |
| 10 or more Apartments | 1,379 | 9.6% |
| Mobile Home / Other | 963 | 6.7% |
| Total | 14,430 | 100.0% |
Housing Structures by Occupancy in Post Falls
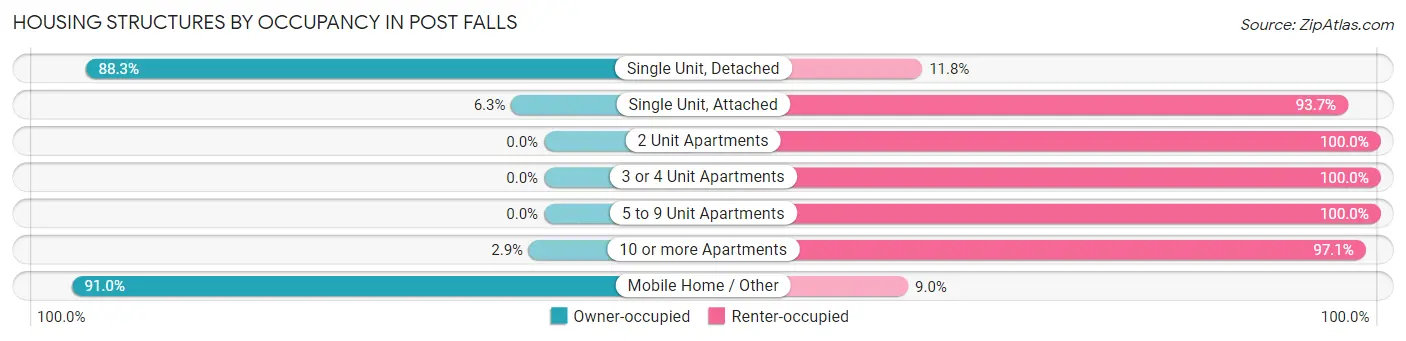
| Structure Type | Owner-occupied | Renter-occupied |
| Single Unit, Detached | 8,870 (88.2%) | 1,181 (11.7%) |
| Single Unit, Attached | 20 (6.3%) | 298 (93.7%) |
| 2 Unit Apartments | 0 (0.0%) | 483 (100.0%) |
| 3 or 4 Unit Apartments | 0 (0.0%) | 640 (100.0%) |
| 5 to 9 Unit Apartments | 0 (0.0%) | 596 (100.0%) |
| 10 or more Apartments | 40 (2.9%) | 1,339 (97.1%) |
| Mobile Home / Other | 876 (91.0%) | 87 (9.0%) |
| Total | 9,806 (68.0%) | 4,624 (32.0%) |
Housing Structures by Number of Rooms in Post Falls
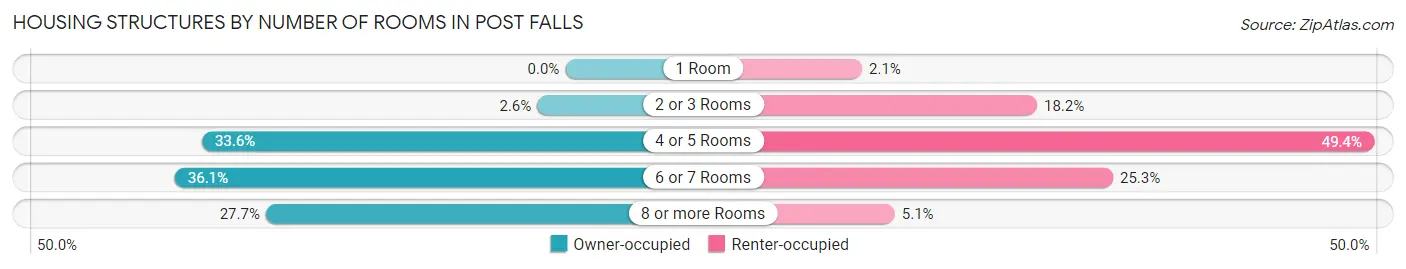
| Number of Rooms | Owner-occupied | Renter-occupied |
| 1 Room | 0 (0.0%) | 95 (2.1%) |
| 2 or 3 Rooms | 255 (2.6%) | 843 (18.2%) |
| 4 or 5 Rooms | 3,295 (33.6%) | 2,283 (49.4%) |
| 6 or 7 Rooms | 3,540 (36.1%) | 1,168 (25.3%) |
| 8 or more Rooms | 2,716 (27.7%) | 235 (5.1%) |
| Total | 9,806 (100.0%) | 4,624 (100.0%) |
Housing Structure by Heating Type in Post Falls
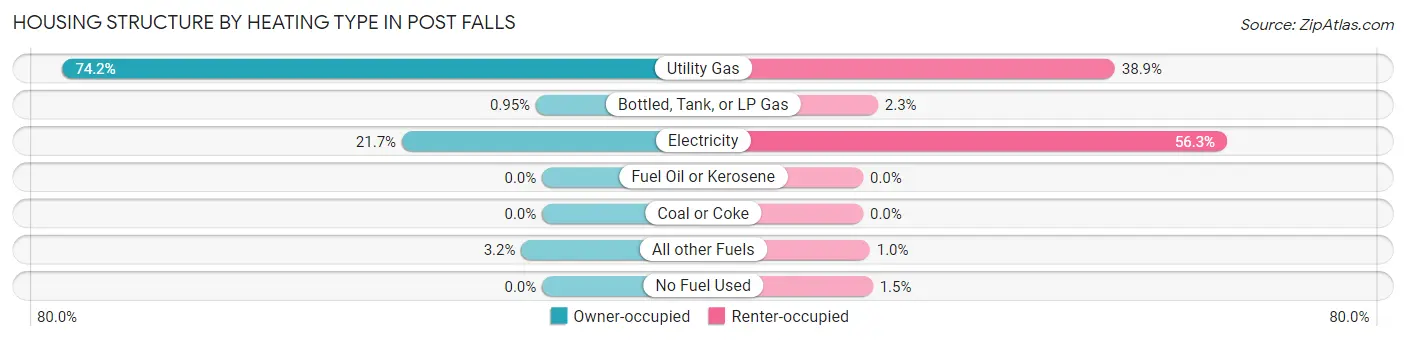
| Heating Type | Owner-occupied | Renter-occupied |
| Utility Gas | 7,272 (74.2%) | 1,800 (38.9%) |
| Bottled, Tank, or LP Gas | 93 (0.9%) | 106 (2.3%) |
| Electricity | 2,125 (21.7%) | 2,601 (56.2%) |
| Fuel Oil or Kerosene | 0 (0.0%) | 0 (0.0%) |
| Coal or Coke | 0 (0.0%) | 0 (0.0%) |
| All other Fuels | 316 (3.2%) | 48 (1.0%) |
| No Fuel Used | 0 (0.0%) | 69 (1.5%) |
| Total | 9,806 (100.0%) | 4,624 (100.0%) |
Household Vehicle Usage in Post Falls
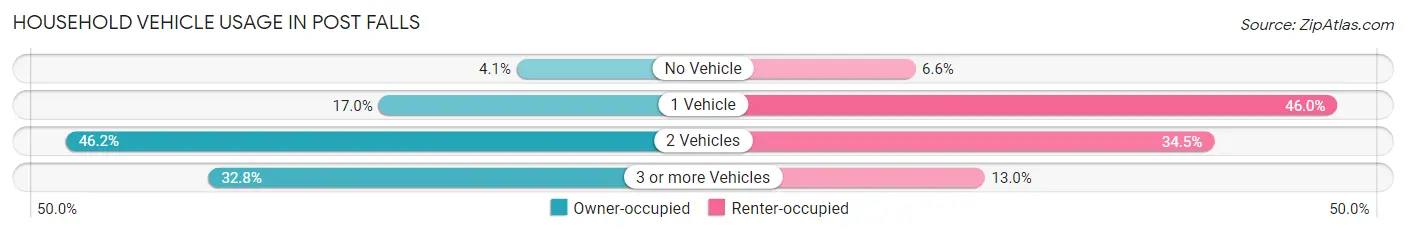
| Vehicles per Household | Owner-occupied | Renter-occupied |
| No Vehicle | 398 (4.1%) | 303 (6.6%) |
| 1 Vehicle | 1,663 (17.0%) | 2,125 (46.0%) |
| 2 Vehicles | 4,526 (46.2%) | 1,593 (34.4%) |
| 3 or more Vehicles | 3,219 (32.8%) | 603 (13.0%) |
| Total | 9,806 (100.0%) | 4,624 (100.0%) |
Real Estate & Mortgages in Post Falls
Real Estate and Mortgage Overview in Post Falls
| Characteristic | Without Mortgage | With Mortgage |
| Housing Units | 2,581 | 7,225 |
| Median Property Value | $284,300 | $385,800 |
| Median Household Income | $65,737 | $1,169 |
| Monthly Housing Costs | $445 | $169 |
| Real Estate Taxes | $1,624 | $98 |
Property Value by Mortgage Status in Post Falls
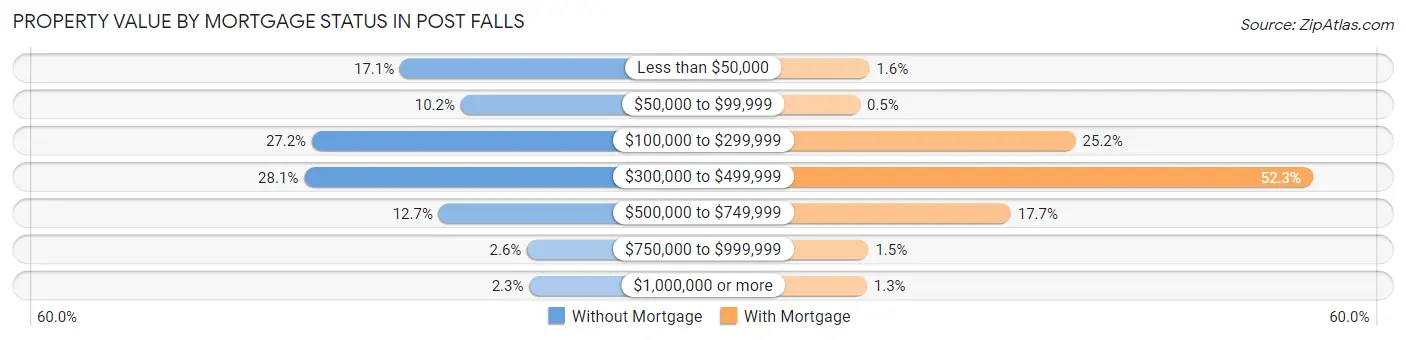
| Property Value | Without Mortgage | With Mortgage |
| Less than $50,000 | 441 (17.1%) | 115 (1.6%) |
| $50,000 to $99,999 | 262 (10.2%) | 36 (0.5%) |
| $100,000 to $299,999 | 701 (27.2%) | 1,817 (25.2%) |
| $300,000 to $499,999 | 724 (28.1%) | 3,775 (52.2%) |
| $500,000 to $749,999 | 327 (12.7%) | 1,282 (17.7%) |
| $750,000 to $999,999 | 66 (2.6%) | 107 (1.5%) |
| $1,000,000 or more | 60 (2.3%) | 93 (1.3%) |
| Total | 2,581 (100.0%) | 7,225 (100.0%) |
Household Income by Mortgage Status in Post Falls
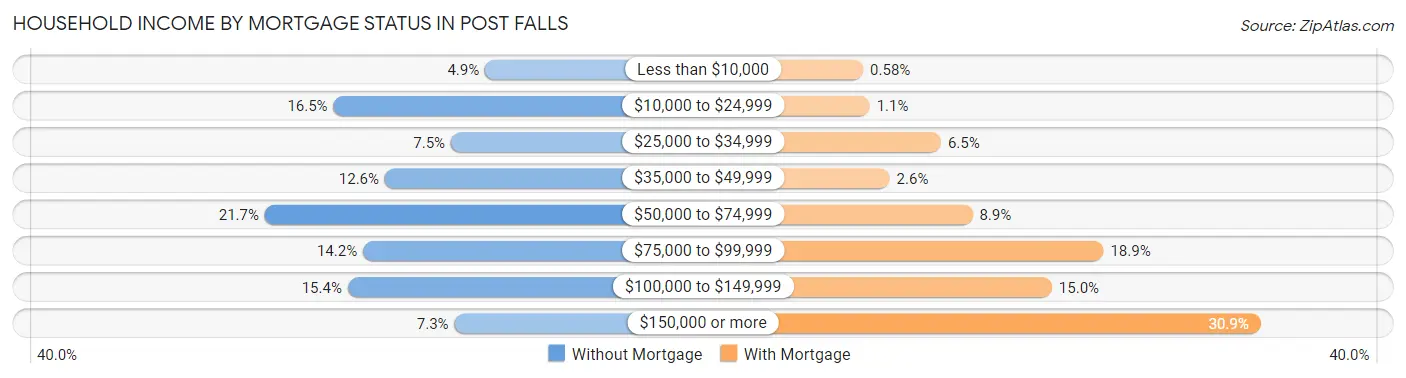
| Household Income | Without Mortgage | With Mortgage |
| Less than $10,000 | 127 (4.9%) | 42 (0.6%) |
| $10,000 to $24,999 | 425 (16.5%) | 78 (1.1%) |
| $25,000 to $34,999 | 194 (7.5%) | 470 (6.5%) |
| $35,000 to $49,999 | 324 (12.6%) | 188 (2.6%) |
| $50,000 to $74,999 | 560 (21.7%) | 644 (8.9%) |
| $75,000 to $99,999 | 367 (14.2%) | 1,365 (18.9%) |
| $100,000 to $149,999 | 397 (15.4%) | 1,081 (15.0%) |
| $150,000 or more | 187 (7.2%) | 2,230 (30.9%) |
| Total | 2,581 (100.0%) | 7,225 (100.0%) |
Property Value to Household Income Ratio in Post Falls
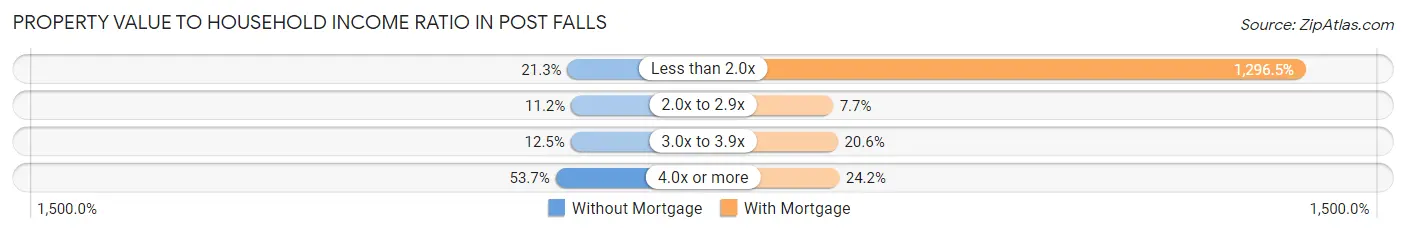
| Value-to-Income Ratio | Without Mortgage | With Mortgage |
| Less than 2.0x | 550 (21.3%) | 93,675 (1,296.5%) |
| 2.0x to 2.9x | 290 (11.2%) | 555 (7.7%) |
| 3.0x to 3.9x | 323 (12.5%) | 1,489 (20.6%) |
| 4.0x or more | 1,385 (53.7%) | 1,748 (24.2%) |
| Total | 2,581 (100.0%) | 7,225 (100.0%) |
Real Estate Taxes by Mortgage Status in Post Falls
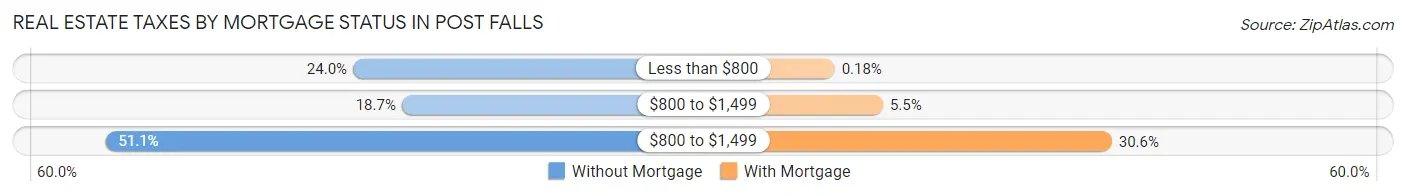
| Property Taxes | Without Mortgage | With Mortgage |
| Less than $800 | 620 (24.0%) | 13 (0.2%) |
| $800 to $1,499 | 482 (18.7%) | 395 (5.5%) |
| $800 to $1,499 | 1,320 (51.1%) | 2,207 (30.5%) |
| Total | 2,581 (100.0%) | 7,225 (100.0%) |
Health & Disability in Post Falls
Health Insurance Coverage by Age in Post Falls
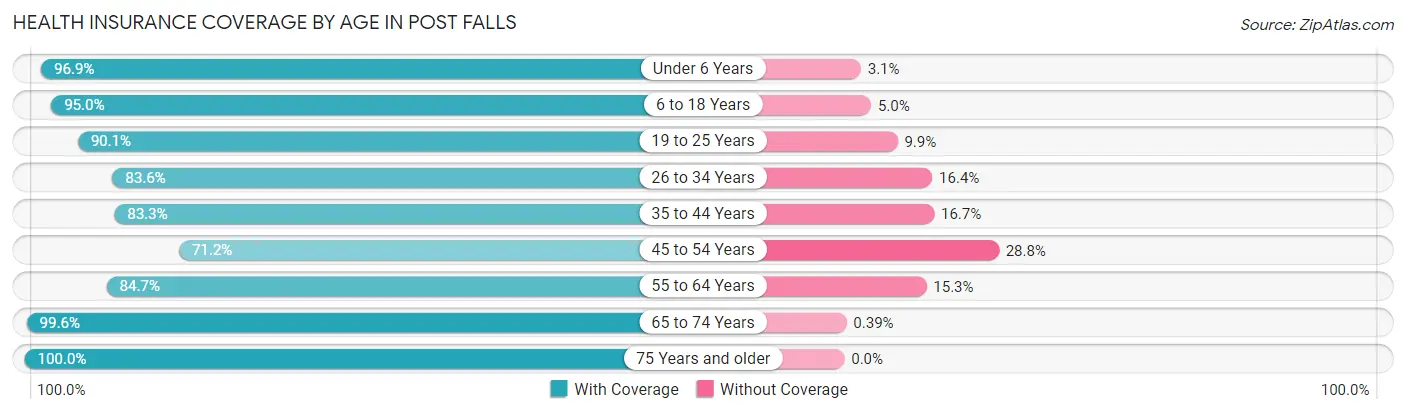
| Age Bracket | With Coverage | Without Coverage |
| Under 6 Years | 3,583 (96.9%) | 114 (3.1%) |
| 6 to 18 Years | 7,311 (95.0%) | 382 (5.0%) |
| 19 to 25 Years | 2,636 (90.1%) | 290 (9.9%) |
| 26 to 34 Years | 4,994 (83.6%) | 978 (16.4%) |
| 35 to 44 Years | 4,614 (83.3%) | 927 (16.7%) |
| 45 to 54 Years | 2,839 (71.2%) | 1,148 (28.8%) |
| 55 to 64 Years | 3,792 (84.7%) | 685 (15.3%) |
| 65 to 74 Years | 3,531 (99.6%) | 14 (0.4%) |
| 75 Years and older | 1,932 (100.0%) | 0 (0.0%) |
| Total | 35,232 (88.6%) | 4,538 (11.4%) |
Health Insurance Coverage by Citizenship Status in Post Falls

| Citizenship Status | With Coverage | Without Coverage |
| Native Born | 3,583 (96.9%) | 114 (3.1%) |
| Foreign Born, Citizen | 7,311 (95.0%) | 382 (5.0%) |
| Foreign Born, not a Citizen | 2,636 (90.1%) | 290 (9.9%) |
Health Insurance Coverage by Household Income in Post Falls
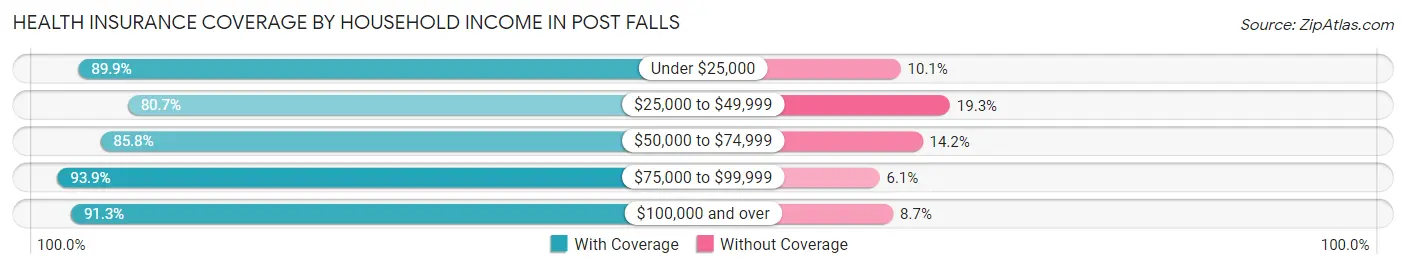
| Household Income | With Coverage | Without Coverage |
| Under $25,000 | 3,192 (89.9%) | 358 (10.1%) |
| $25,000 to $49,999 | 5,670 (80.7%) | 1,358 (19.3%) |
| $50,000 to $74,999 | 6,983 (85.8%) | 1,155 (14.2%) |
| $75,000 to $99,999 | 6,352 (93.9%) | 415 (6.1%) |
| $100,000 and over | 12,947 (91.3%) | 1,232 (8.7%) |
Public vs Private Health Insurance Coverage by Age in Post Falls
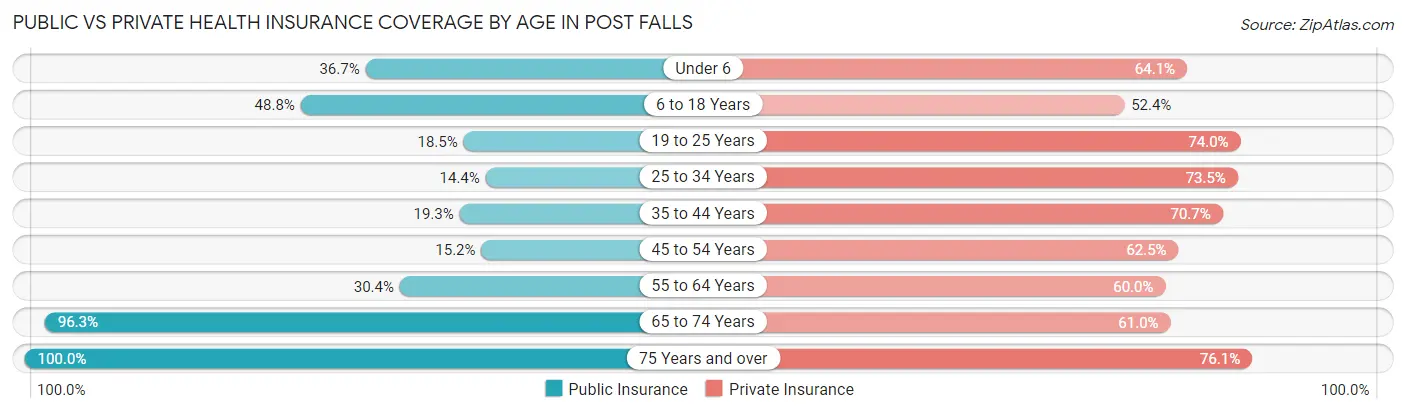
| Age Bracket | Public Insurance | Private Insurance |
| Under 6 | 1,358 (36.7%) | 2,368 (64.0%) |
| 6 to 18 Years | 3,751 (48.8%) | 4,033 (52.4%) |
| 19 to 25 Years | 542 (18.5%) | 2,165 (74.0%) |
| 25 to 34 Years | 862 (14.4%) | 4,388 (73.5%) |
| 35 to 44 Years | 1,068 (19.3%) | 3,916 (70.7%) |
| 45 to 54 Years | 607 (15.2%) | 2,491 (62.5%) |
| 55 to 64 Years | 1,359 (30.4%) | 2,688 (60.0%) |
| 65 to 74 Years | 3,412 (96.3%) | 2,162 (61.0%) |
| 75 Years and over | 1,932 (100.0%) | 1,471 (76.1%) |
| Total | 14,891 (37.4%) | 25,682 (64.6%) |
Disability Status by Sex by Age in Post Falls
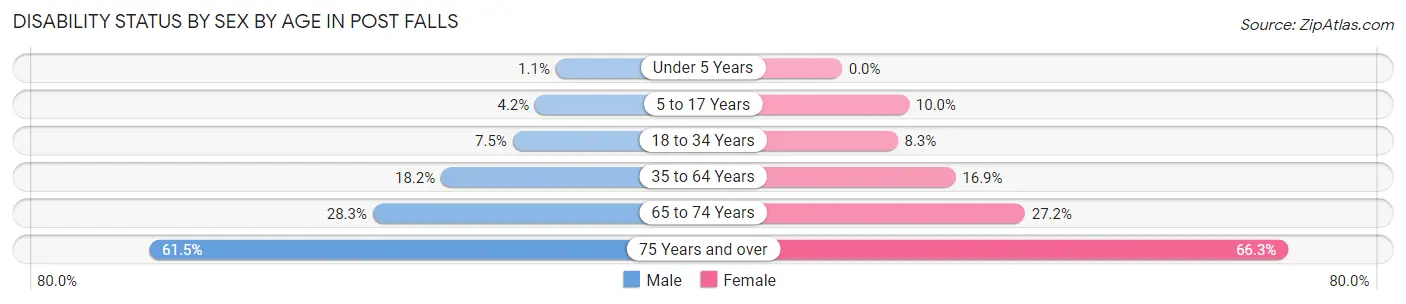
| Age Bracket | Male | Female |
| Under 5 Years | 18 (1.1%) | 0 (0.0%) |
| 5 to 17 Years | 156 (4.2%) | 397 (10.0%) |
| 18 to 34 Years | 319 (7.5%) | 426 (8.3%) |
| 35 to 64 Years | 1,336 (18.2%) | 1,121 (16.9%) |
| 65 to 74 Years | 449 (28.3%) | 532 (27.2%) |
| 75 Years and over | 446 (61.5%) | 800 (66.3%) |
Disability Class by Sex by Age in Post Falls
Disability Class: Hearing Difficulty
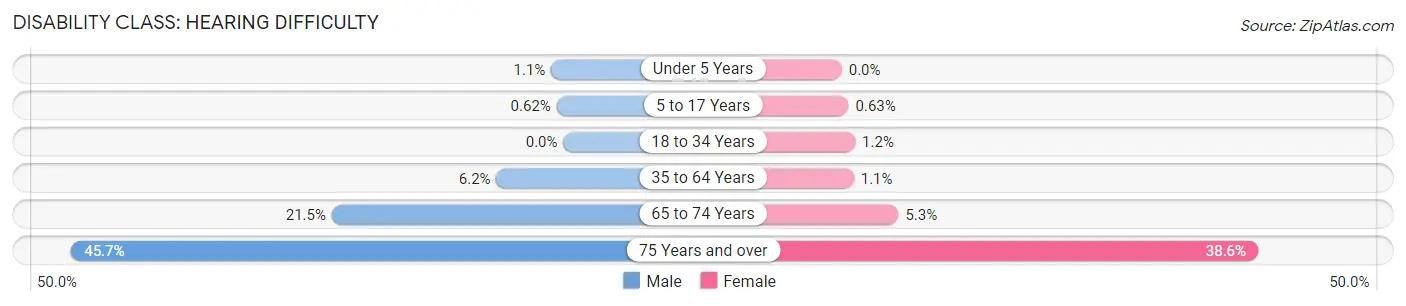
| Age Bracket | Male | Female |
| Under 5 Years | 18 (1.1%) | 0 (0.0%) |
| 5 to 17 Years | 23 (0.6%) | 25 (0.6%) |
| 18 to 34 Years | 0 (0.0%) | 64 (1.2%) |
| 35 to 64 Years | 457 (6.2%) | 74 (1.1%) |
| 65 to 74 Years | 341 (21.5%) | 103 (5.3%) |
| 75 Years and over | 331 (45.7%) | 466 (38.6%) |
Disability Class: Vision Difficulty
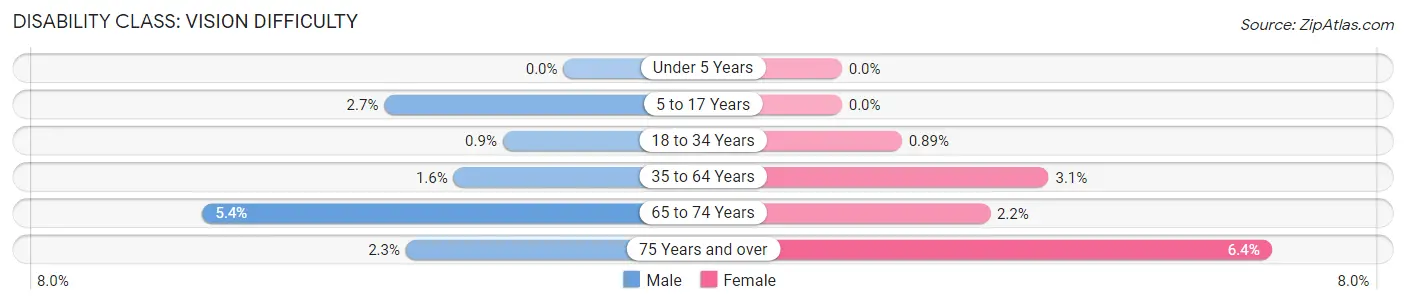
| Age Bracket | Male | Female |
| Under 5 Years | 0 (0.0%) | 0 (0.0%) |
| 5 to 17 Years | 99 (2.7%) | 0 (0.0%) |
| 18 to 34 Years | 38 (0.9%) | 46 (0.9%) |
| 35 to 64 Years | 120 (1.6%) | 204 (3.1%) |
| 65 to 74 Years | 85 (5.4%) | 43 (2.2%) |
| 75 Years and over | 17 (2.3%) | 77 (6.4%) |
Disability Class: Cognitive Difficulty
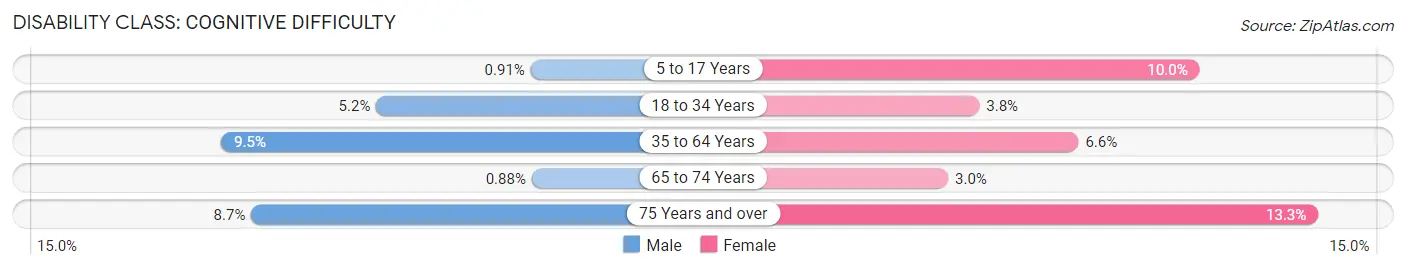
| Age Bracket | Male | Female |
| 5 to 17 Years | 34 (0.9%) | 397 (10.0%) |
| 18 to 34 Years | 221 (5.2%) | 197 (3.8%) |
| 35 to 64 Years | 701 (9.5%) | 438 (6.6%) |
| 65 to 74 Years | 14 (0.9%) | 58 (3.0%) |
| 75 Years and over | 63 (8.7%) | 160 (13.3%) |
Disability Class: Ambulatory Difficulty
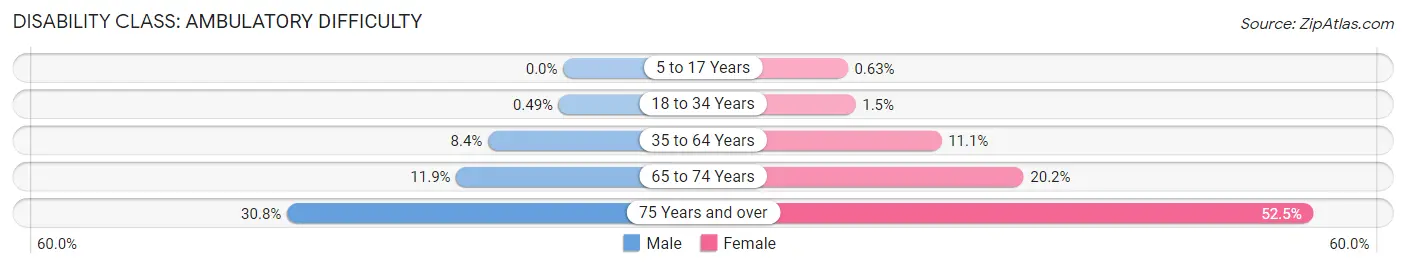
| Age Bracket | Male | Female |
| 5 to 17 Years | 0 (0.0%) | 25 (0.6%) |
| 18 to 34 Years | 21 (0.5%) | 77 (1.5%) |
| 35 to 64 Years | 616 (8.4%) | 736 (11.1%) |
| 65 to 74 Years | 189 (11.9%) | 396 (20.2%) |
| 75 Years and over | 223 (30.8%) | 634 (52.5%) |
Disability Class: Self-Care Difficulty
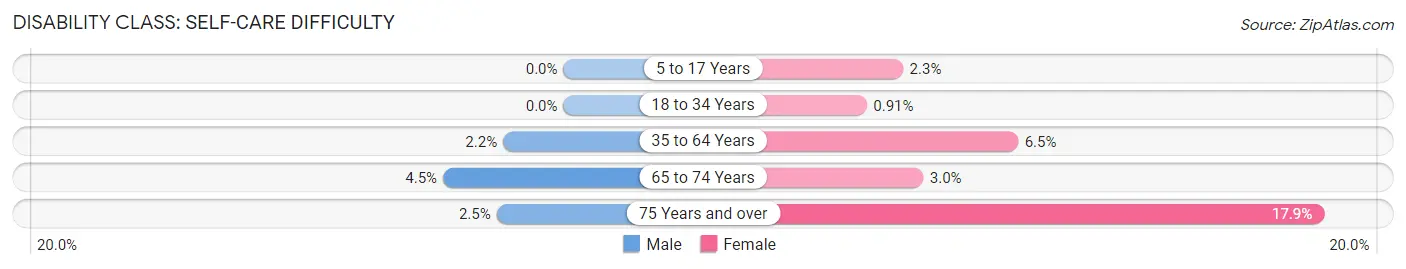
| Age Bracket | Male | Female |
| 5 to 17 Years | 0 (0.0%) | 90 (2.3%) |
| 18 to 34 Years | 0 (0.0%) | 47 (0.9%) |
| 35 to 64 Years | 165 (2.2%) | 434 (6.5%) |
| 65 to 74 Years | 71 (4.5%) | 59 (3.0%) |
| 75 Years and over | 18 (2.5%) | 216 (17.9%) |
Technology Access in Post Falls
Computing Device Access in Post Falls
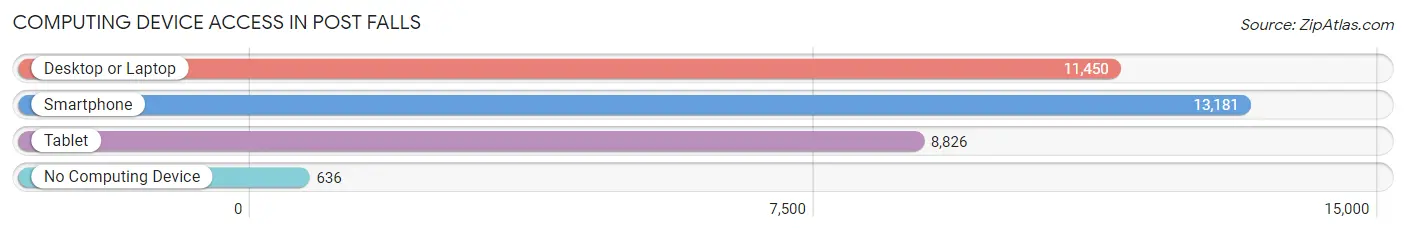
| Device Type | # Households | % Households |
| Desktop or Laptop | 11,450 | 79.3% |
| Smartphone | 13,181 | 91.3% |
| Tablet | 8,826 | 61.2% |
| No Computing Device | 636 | 4.4% |
| Total | 14,430 | 100.0% |
Internet Access in Post Falls
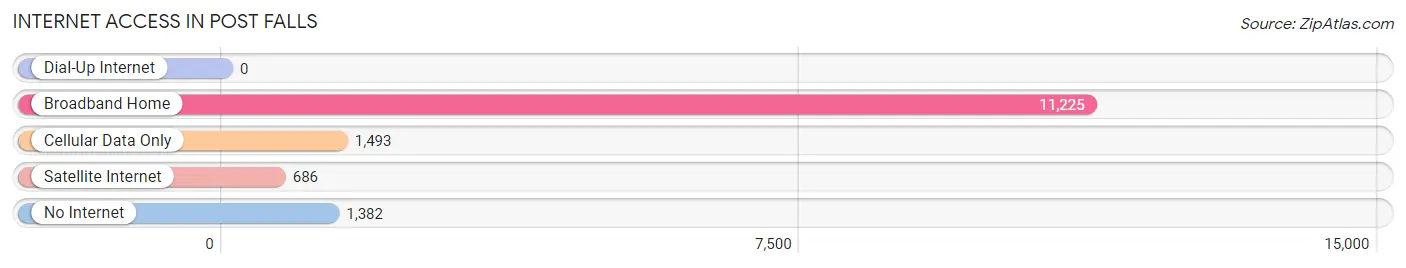
| Internet Type | # Households | % Households |
| Dial-Up Internet | 0 | 0.0% |
| Broadband Home | 11,225 | 77.8% |
| Cellular Data Only | 1,493 | 10.3% |
| Satellite Internet | 686 | 4.8% |
| No Internet | 1,382 | 9.6% |
| Total | 14,430 | 100.0% |
Post Falls Summary
History
Post Falls is a city located in Kootenai County, Idaho, United States. It is situated on the Spokane River, approximately 25 miles east of Spokane, Washington. The city was named after Frederick Post, a German immigrant who settled in the area in the late 19th century. Post Falls was officially incorporated in 1899, making it one of the oldest cities in the state of Idaho.
The area around Post Falls has been inhabited by Native Americans for thousands of years. The Coeur d'Alene Tribe, a federally recognized tribe, has lived in the area since time immemorial. The tribe has a reservation located just north of Post Falls.
The first European settlers in the area were fur traders and missionaries who arrived in the early 19th century. The first permanent settlement was established in 1871 by Frederick Post, who built a sawmill and a gristmill on the Spokane River. The settlement was initially called "Post's Mill," but was later renamed "Post Falls" in honor of its founder.
Geography
Post Falls is located in northern Idaho, in Kootenai County. It is situated on the Spokane River, approximately 25 miles east of Spokane, Washington. The city has a total area of 8.3 square miles, of which 8.2 square miles is land and 0.1 square miles is water.
The city is located in the foothills of the Rocky Mountains, and is surrounded by forests and lakes. The nearby Coeur d'Alene National Forest provides a variety of outdoor recreational opportunities, including camping, hiking, fishing, and hunting.
Economy
Post Falls is a small city with a population of just over 30,000 people. The city's economy is largely based on tourism, manufacturing, and retail.
The city is home to several large manufacturing companies, including the world's largest manufacturer of wood pellets, Pacific BioEnergy. Other major employers in the city include the Kootenai Medical Center, the Coeur d'Alene Casino, and the Post Falls School District.
The city is also home to several retail stores, including Walmart, Lowe's, and Home Depot. The city also has a variety of restaurants, bars, and other entertainment venues.
Demographics
As of the 2010 census, Post Falls had a population of 27,574 people. The racial makeup of the city was 90.2% White, 0.7% African American, 1.2% Native American, 1.3% Asian, 0.2% Pacific Islander, 3.2% from other races, and 3.2% from two or more races. Hispanic or Latino of any race were 8.2% of the population.
The median household income in Post Falls was $45,945, and the median family income was $51,945. The per capita income for the city was $22,845. About 11.2% of families and 14.2% of the population were below the poverty line, including 19.2% of those under age 18 and 8.2% of those age 65 or over.
Common Questions
What is Per Capita Income in Post Falls?
Per Capita income in Post Falls is $30,524.
What is the Median Family Income in Post Falls?
Median Family Income in Post Falls is $82,390.
What is the Median Household income in Post Falls?
Median Household Income in Post Falls is $71,042.
What is Income or Wage Gap in Post Falls?
Income or Wage Gap in Post Falls is 34.4%.
Women in Post Falls earn 65.6 cents for every dollar earned by a man.
What is Family Income Deficit in Post Falls?
Family Income Deficit in Post Falls is $10,491.
Families that are below poverty line in Post Falls earn $10,491 less on average than the poverty threshold level.
What is Inequality or Gini Index in Post Falls?
Inequality or Gini Index in Post Falls is 0.39.
What is the Total Population of Post Falls?
Total Population of Post Falls is 40,002.
What is the Total Male Population of Post Falls?
Total Male Population of Post Falls is 19,281.
What is the Total Female Population of Post Falls?
Total Female Population of Post Falls is 20,721.
What is the Ratio of Males per 100 Females in Post Falls?
There are 93.05 Males per 100 Females in Post Falls.
What is the Ratio of Females per 100 Males in Post Falls?
There are 107.47 Females per 100 Males in Post Falls.
What is the Median Population Age in Post Falls?
Median Population Age in Post Falls is 34.5 Years.
What is the Average Family Size in Post Falls
Average Family Size in Post Falls is 3.2 People.
What is the Average Household Size in Post Falls
Average Household Size in Post Falls is 2.8 People.
How Large is the Labor Force in Post Falls?
There are 19,115 People in the Labor Forcein in Post Falls.
What is the Percentage of People in the Labor Force in Post Falls?
63.5% of People are in the Labor Force in Post Falls.
What is the Unemployment Rate in Post Falls?
Unemployment Rate in Post Falls is 3.3%.