Pocatello, ID Map & Demographics
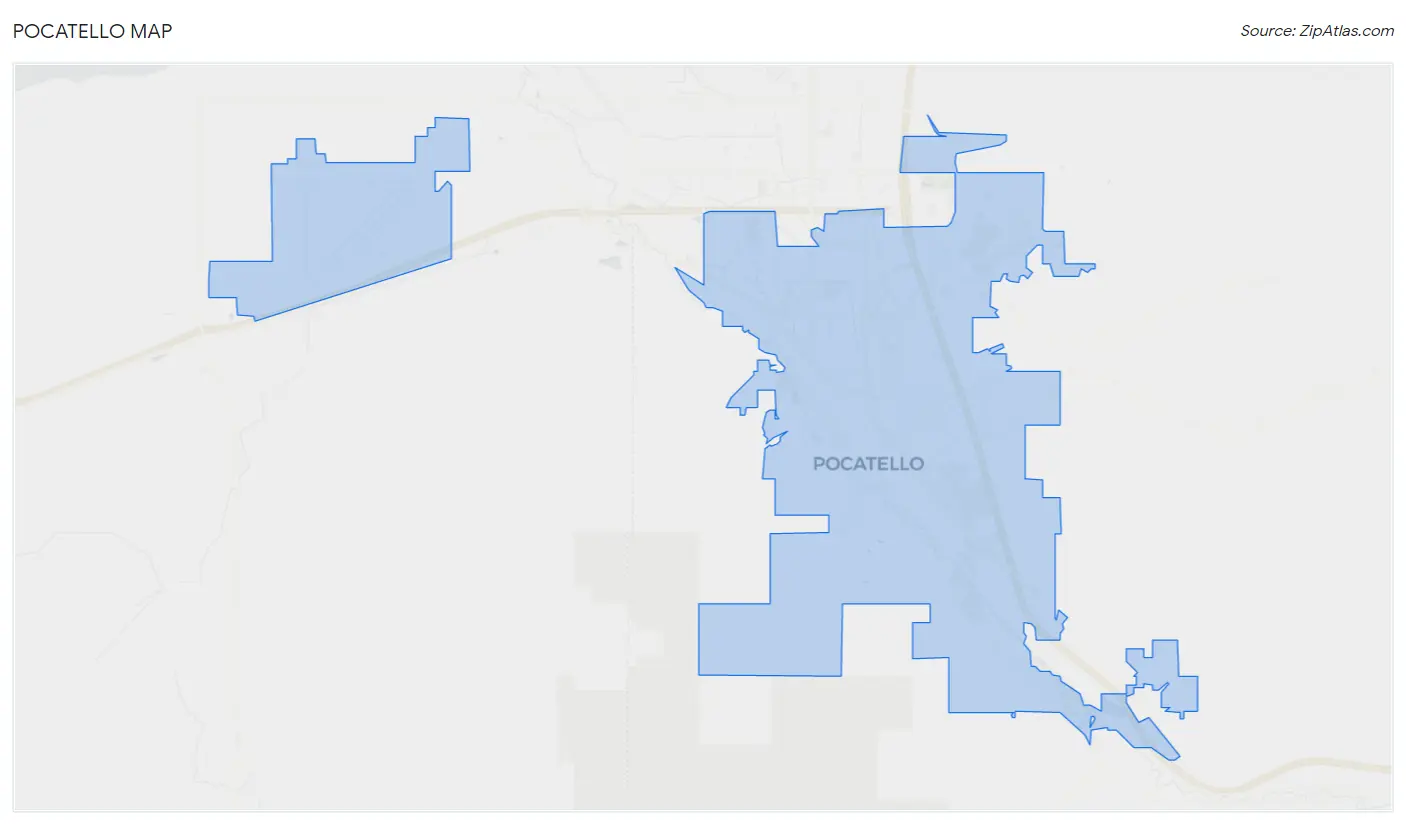
Pocatello Map
Pocatello Overview
$28,922
PER CAPITA INCOME
$76,299
AVG FAMILY INCOME
$56,115
AVG HOUSEHOLD INCOME
34.4%
WAGE / INCOME GAP [ % ]
65.6¢/ $1
WAGE / INCOME GAP [ $ ]
$11,209
FAMILY INCOME DEFICIT
0.44
INEQUALITY / GINI INDEX
56,582
TOTAL POPULATION
28,663
MALE POPULATION
27,919
FEMALE POPULATION
102.66
MALES / 100 FEMALES
97.40
FEMALES / 100 MALES
32.9
MEDIAN AGE
3.3
AVG FAMILY SIZE
2.5
AVG HOUSEHOLD SIZE
27,415
LABOR FORCE [ PEOPLE ]
62.3%
PERCENT IN LABOR FORCE
5.4%
UNEMPLOYMENT RATE
Pocatello Area Codes
Income in Pocatello
Income Overview in Pocatello
Per Capita Income in Pocatello is $28,922, while median incomes of families and households are $76,299 and $56,115 respectively.
| Characteristic | Number | Measure |
| Per Capita Income | 56,582 | $28,922 |
| Median Family Income | 12,308 | $76,299 |
| Mean Family Income | 12,308 | $91,257 |
| Median Household Income | 21,657 | $56,115 |
| Mean Household Income | 21,657 | $72,933 |
| Income Deficit | 12,308 | $11,209 |
| Wage / Income Gap (%) | 56,582 | 34.36% |
| Wage / Income Gap ($) | 56,582 | 65.64¢ per $1 |
| Gini / Inequality Index | 56,582 | 0.44 |
Earnings by Sex in Pocatello
Average Earnings in Pocatello are $30,923, $37,377 for men and $24,533 for women, a difference of 34.4%.
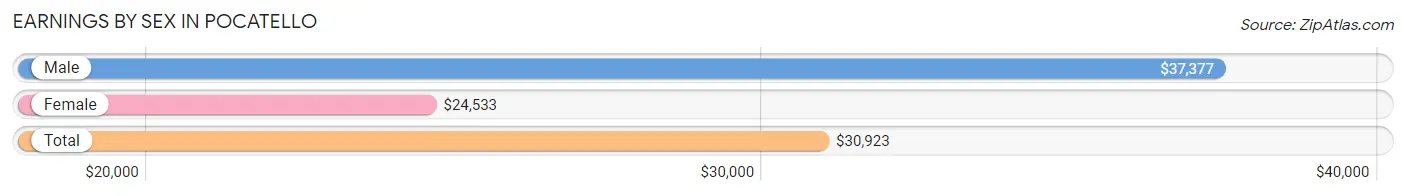
| Sex | Number | Average Earnings |
| Male | 15,991 (52.8%) | $37,377 |
| Female | 14,298 (47.2%) | $24,533 |
| Total | 30,289 (100.0%) | $30,923 |
Earnings by Sex by Income Bracket in Pocatello
The most common earnings brackets in Pocatello are $100,000+ for men (1,649 | 10.3%) and $2,499 or less for women (1,429 | 10.0%).
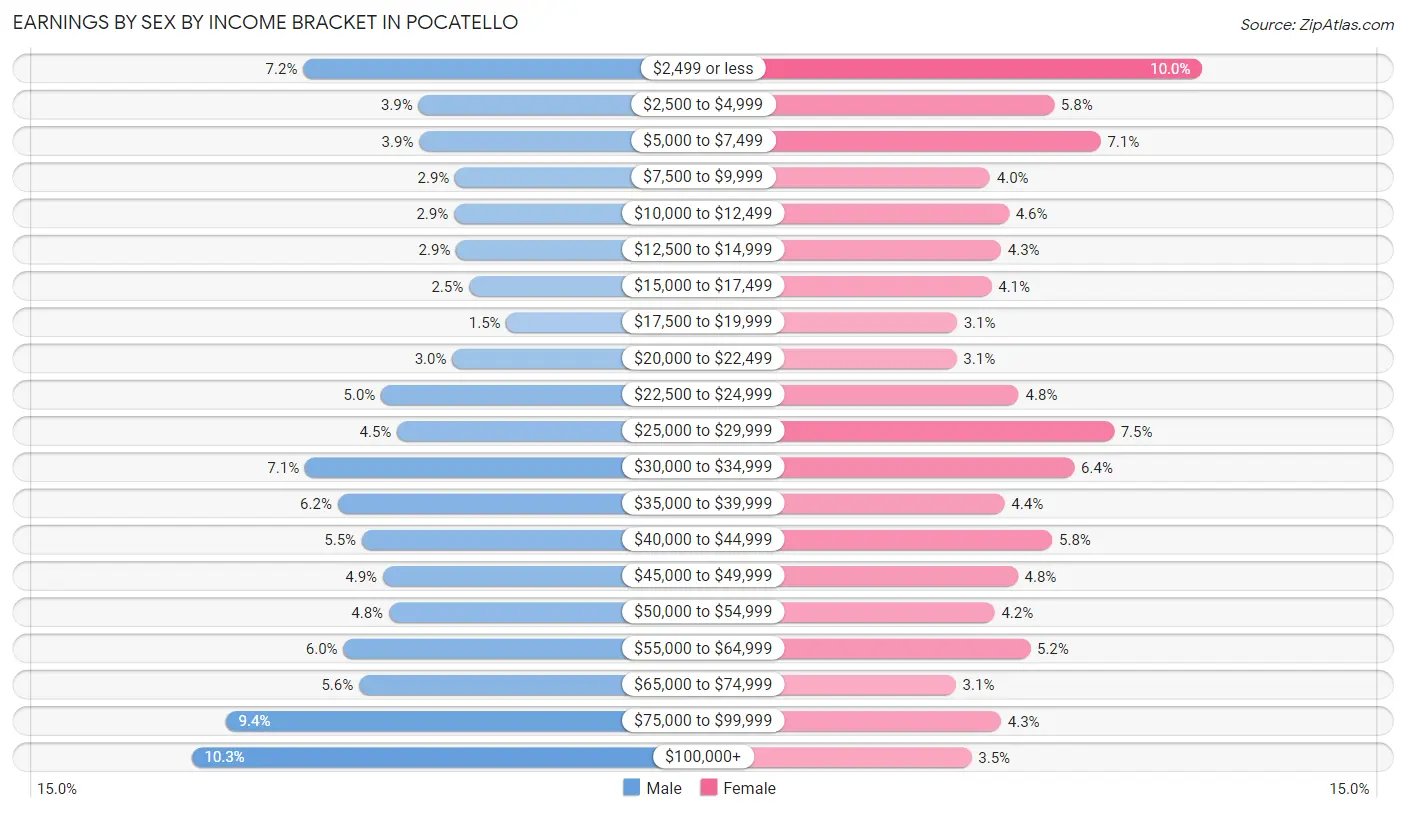
| Income | Male | Female |
| $2,499 or less | 1,146 (7.2%) | 1,429 (10.0%) |
| $2,500 to $4,999 | 629 (3.9%) | 832 (5.8%) |
| $5,000 to $7,499 | 626 (3.9%) | 1,019 (7.1%) |
| $7,500 to $9,999 | 463 (2.9%) | 575 (4.0%) |
| $10,000 to $12,499 | 468 (2.9%) | 651 (4.5%) |
| $12,500 to $14,999 | 459 (2.9%) | 619 (4.3%) |
| $15,000 to $17,499 | 401 (2.5%) | 580 (4.1%) |
| $17,500 to $19,999 | 233 (1.5%) | 442 (3.1%) |
| $20,000 to $22,499 | 476 (3.0%) | 441 (3.1%) |
| $22,500 to $24,999 | 797 (5.0%) | 690 (4.8%) |
| $25,000 to $29,999 | 725 (4.5%) | 1,073 (7.5%) |
| $30,000 to $34,999 | 1,138 (7.1%) | 914 (6.4%) |
| $35,000 to $39,999 | 992 (6.2%) | 634 (4.4%) |
| $40,000 to $44,999 | 883 (5.5%) | 825 (5.8%) |
| $45,000 to $49,999 | 788 (4.9%) | 687 (4.8%) |
| $50,000 to $54,999 | 761 (4.8%) | 594 (4.2%) |
| $55,000 to $64,999 | 966 (6.0%) | 737 (5.1%) |
| $65,000 to $74,999 | 896 (5.6%) | 437 (3.1%) |
| $75,000 to $99,999 | 1,495 (9.3%) | 619 (4.3%) |
| $100,000+ | 1,649 (10.3%) | 500 (3.5%) |
| Total | 15,991 (100.0%) | 14,298 (100.0%) |
Earnings by Sex by Educational Attainment in Pocatello
Average earnings in Pocatello are $45,734 for men and $31,615 for women, a difference of 30.9%. Men with an educational attainment of graduate degree enjoy the highest average annual earnings of $77,679, while those with high school diploma education earn the least with $37,031. Women with an educational attainment of graduate degree earn the most with the average annual earnings of $58,953, while those with high school diploma education have the smallest earnings of $24,387.
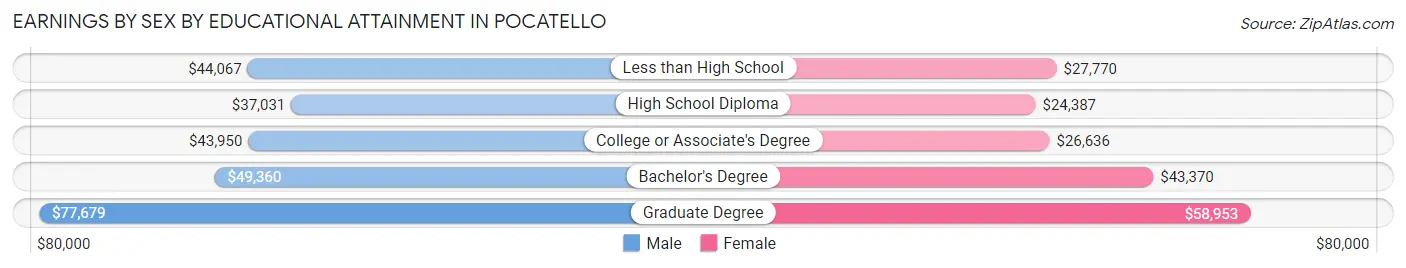
| Educational Attainment | Male Income | Female Income |
| Less than High School | $44,067 | $27,770 |
| High School Diploma | $37,031 | $24,387 |
| College or Associate's Degree | $43,950 | $26,636 |
| Bachelor's Degree | $49,360 | $43,370 |
| Graduate Degree | $77,679 | $58,953 |
| Total | $45,734 | $31,615 |
Family Income in Pocatello
Family Income Brackets in Pocatello
According to the Pocatello family income data, there are 2,363 families falling into the $100,000 to $149,999 income range, which is the most common income bracket and makes up 19.2% of all families. Conversely, the $10,000 to $14,999 income bracket is the least frequent group with only 258 families (2.1%) belonging to this category.
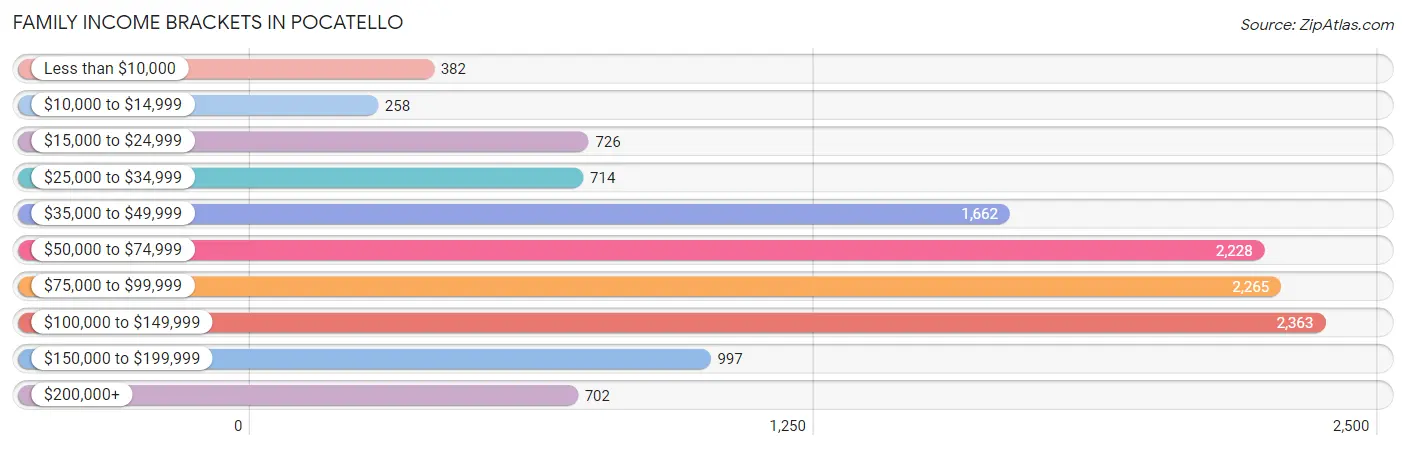
| Income Bracket | # Families | % Families |
| Less than $10,000 | 382 | 3.1% |
| $10,000 to $14,999 | 258 | 2.1% |
| $15,000 to $24,999 | 726 | 5.9% |
| $25,000 to $34,999 | 714 | 5.8% |
| $35,000 to $49,999 | 1,662 | 13.5% |
| $50,000 to $74,999 | 2,228 | 18.1% |
| $75,000 to $99,999 | 2,265 | 18.4% |
| $100,000 to $149,999 | 2,363 | 19.2% |
| $150,000 to $199,999 | 997 | 8.1% |
| $200,000+ | 702 | 5.7% |
Family Income by Famaliy Size in Pocatello
6-person families (615 | 5.0%) account for the highest median family income in Pocatello with $103,910 per family, while 2-person families (5,442 | 44.2%) have the highest median income of $35,316 per family member.
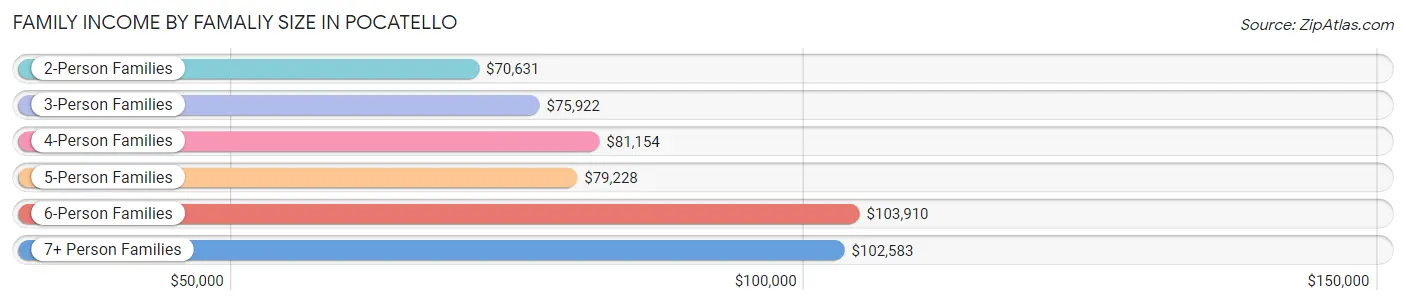
| Income Bracket | # Families | Median Income |
| 2-Person Families | 5,442 (44.2%) | $70,631 |
| 3-Person Families | 2,791 (22.7%) | $75,922 |
| 4-Person Families | 1,836 (14.9%) | $81,154 |
| 5-Person Families | 1,319 (10.7%) | $79,228 |
| 6-Person Families | 615 (5.0%) | $103,910 |
| 7+ Person Families | 305 (2.5%) | $102,583 |
| Total | 12,308 (100.0%) | $76,299 |
Family Income by Number of Earners in Pocatello
The median family income in Pocatello is $76,299, with families comprising 3+ earners (1,371) having the highest median family income of $125,760, while families with no earners (1,955) have the lowest median family income of $45,647, accounting for 11.1% and 15.9% of families, respectively.
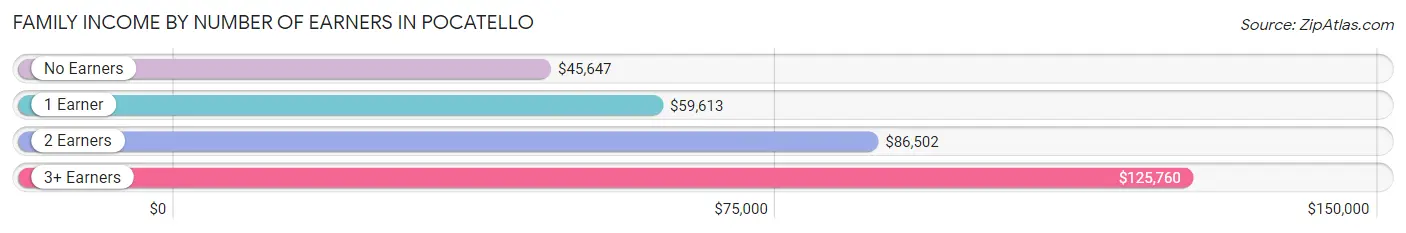
| Number of Earners | # Families | Median Income |
| No Earners | 1,955 (15.9%) | $45,647 |
| 1 Earner | 3,437 (27.9%) | $59,613 |
| 2 Earners | 5,545 (45.1%) | $86,502 |
| 3+ Earners | 1,371 (11.1%) | $125,760 |
| Total | 12,308 (100.0%) | $76,299 |
Household Income in Pocatello
Household Income Brackets in Pocatello
With 3,812 households falling in the category, the $50,000 to $74,999 income range is the most frequent in Pocatello, accounting for 17.6% of all households. In contrast, only 823 households (3.8%) fall into the $200,000+ income bracket, making it the least populous group.
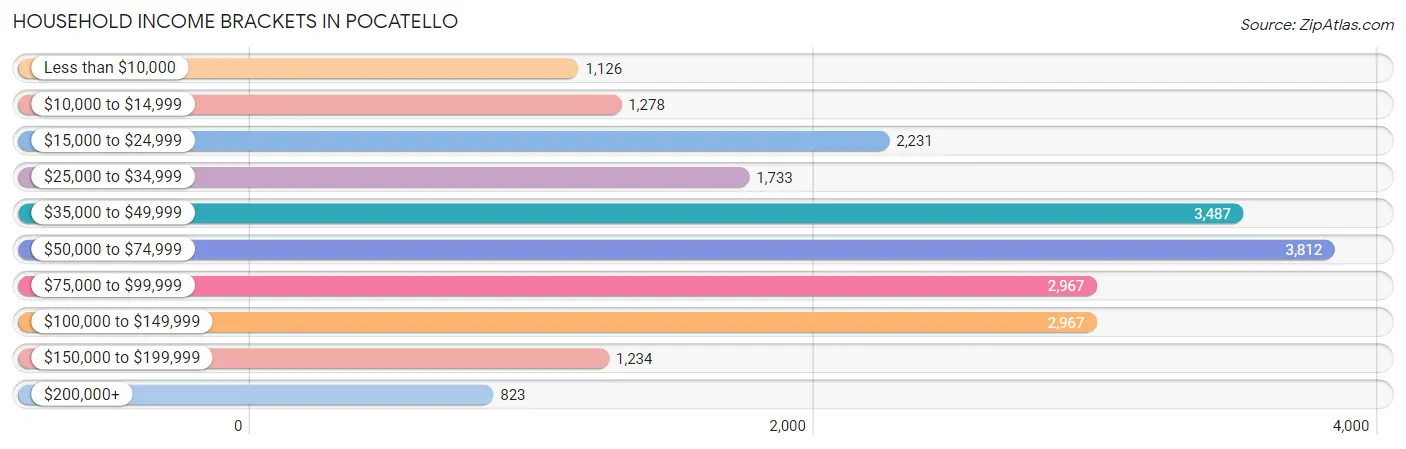
| Income Bracket | # Households | % Households |
| Less than $10,000 | 1,126 | 5.2% |
| $10,000 to $14,999 | 1,278 | 5.9% |
| $15,000 to $24,999 | 2,231 | 10.3% |
| $25,000 to $34,999 | 1,733 | 8.0% |
| $35,000 to $49,999 | 3,487 | 16.1% |
| $50,000 to $74,999 | 3,812 | 17.6% |
| $75,000 to $99,999 | 2,967 | 13.7% |
| $100,000 to $149,999 | 2,967 | 13.7% |
| $150,000 to $199,999 | 1,234 | 5.7% |
| $200,000+ | 823 | 3.8% |
Household Income by Householder Age in Pocatello
The median household income in Pocatello is $56,115, with the highest median household income of $65,916 found in the 45 to 64 years age bracket for the primary householder. A total of 6,761 households (31.2%) fall into this category. Meanwhile, the 15 to 24 years age bracket for the primary householder has the lowest median household income of $28,269, with 1,720 households (7.9%) in this group.
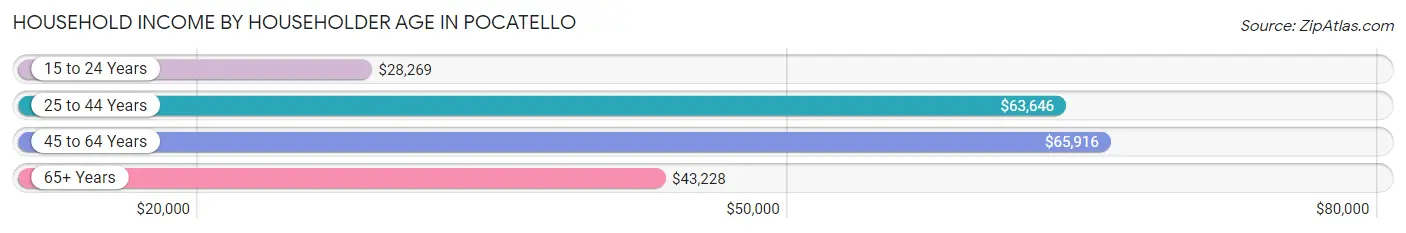
| Income Bracket | # Households | Median Income |
| 15 to 24 Years | 1,720 (7.9%) | $28,269 |
| 25 to 44 Years | 8,275 (38.2%) | $63,646 |
| 45 to 64 Years | 6,761 (31.2%) | $65,916 |
| 65+ Years | 4,901 (22.6%) | $43,228 |
| Total | 21,657 (100.0%) | $56,115 |
Poverty in Pocatello
Income Below Poverty by Sex and Age in Pocatello
With 13.5% poverty level for males and 15.3% for females among the residents of Pocatello, 16 and 17 year old males and 18 to 24 year old females are the most vulnerable to poverty, with 205 males (25.3%) and 747 females (31.5%) in their respective age groups living below the poverty level.
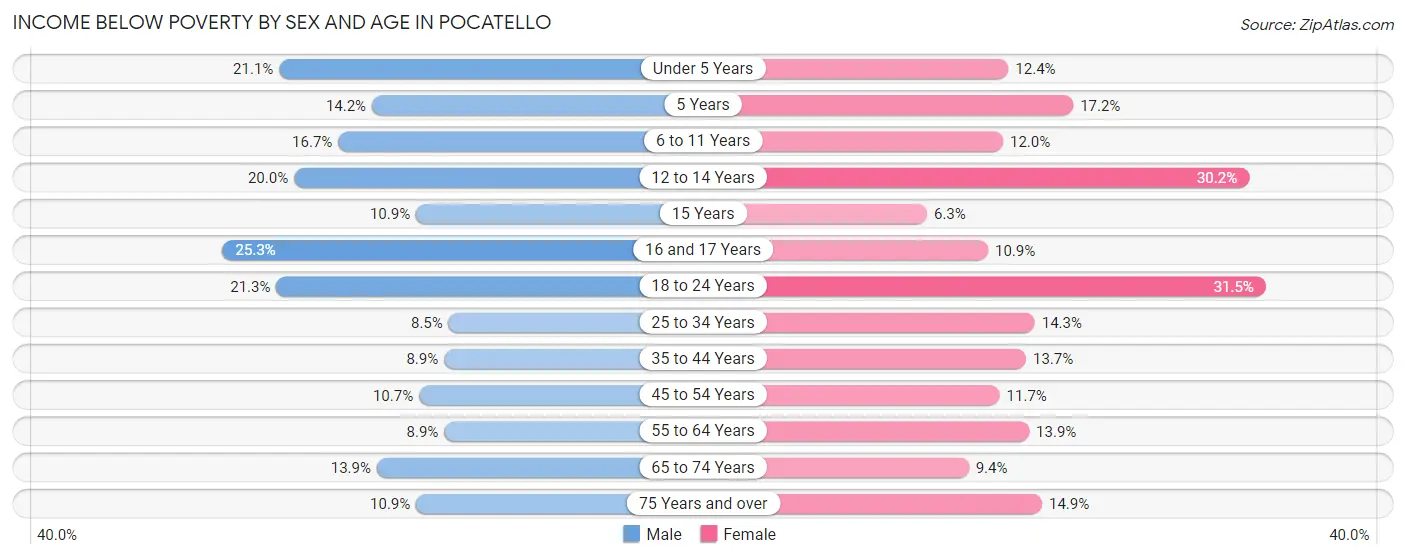
| Age Bracket | Male | Female |
| Under 5 Years | 413 (21.1%) | 209 (12.4%) |
| 5 Years | 57 (14.2%) | 67 (17.2%) |
| 6 to 11 Years | 418 (16.7%) | 264 (12.0%) |
| 12 to 14 Years | 224 (20.0%) | 334 (30.2%) |
| 15 Years | 42 (10.9%) | 33 (6.3%) |
| 16 and 17 Years | 205 (25.3%) | 67 (10.9%) |
| 18 to 24 Years | 643 (21.3%) | 747 (31.5%) |
| 25 to 34 Years | 367 (8.5%) | 620 (14.3%) |
| 35 to 44 Years | 331 (8.9%) | 519 (13.7%) |
| 45 to 54 Years | 313 (10.7%) | 298 (11.7%) |
| 55 to 64 Years | 242 (8.8%) | 397 (13.9%) |
| 65 to 74 Years | 346 (13.9%) | 207 (9.4%) |
| 75 Years and over | 113 (10.9%) | 244 (14.9%) |
| Total | 3,714 (13.5%) | 4,006 (15.3%) |
Income Above Poverty by Sex and Age in Pocatello
According to the poverty statistics in Pocatello, males aged 25 to 34 years and females aged 15 years are the age groups that are most secure financially, with 91.5% of males and 93.7% of females in these age groups living above the poverty line.
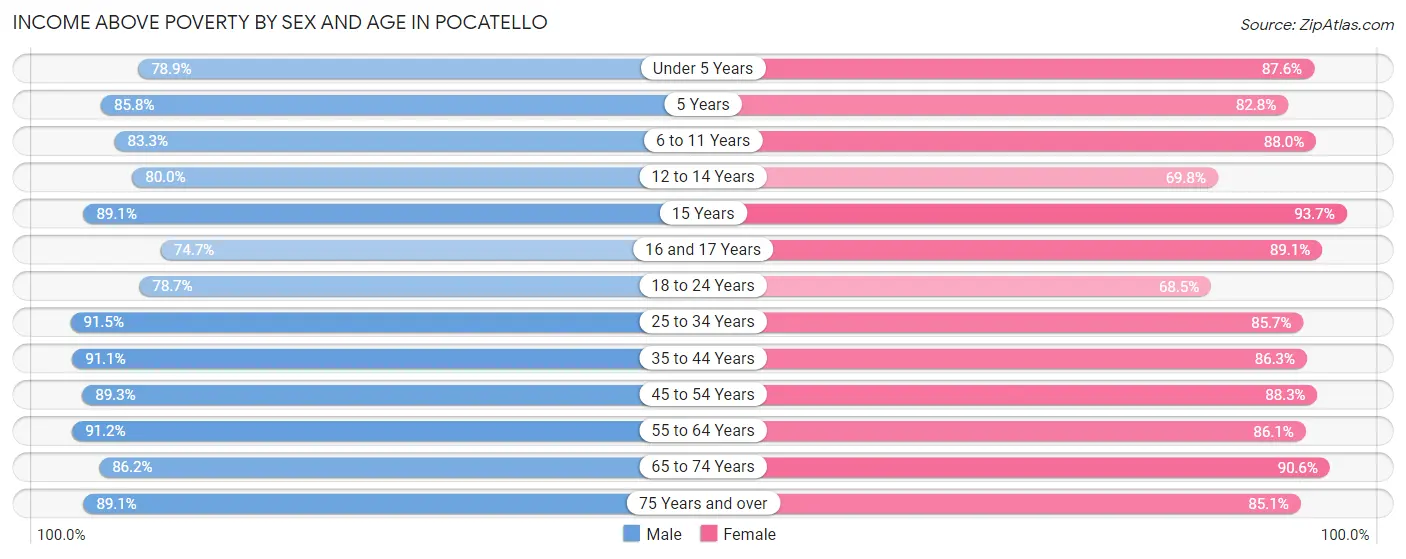
| Age Bracket | Male | Female |
| Under 5 Years | 1,544 (78.9%) | 1,480 (87.6%) |
| 5 Years | 344 (85.8%) | 323 (82.8%) |
| 6 to 11 Years | 2,082 (83.3%) | 1,941 (88.0%) |
| 12 to 14 Years | 896 (80.0%) | 771 (69.8%) |
| 15 Years | 342 (89.1%) | 488 (93.7%) |
| 16 and 17 Years | 605 (74.7%) | 550 (89.1%) |
| 18 to 24 Years | 2,374 (78.7%) | 1,627 (68.5%) |
| 25 to 34 Years | 3,943 (91.5%) | 3,708 (85.7%) |
| 35 to 44 Years | 3,405 (91.1%) | 3,275 (86.3%) |
| 45 to 54 Years | 2,606 (89.3%) | 2,245 (88.3%) |
| 55 to 64 Years | 2,492 (91.1%) | 2,457 (86.1%) |
| 65 to 74 Years | 2,153 (86.2%) | 1,991 (90.6%) |
| 75 Years and over | 921 (89.1%) | 1,397 (85.1%) |
| Total | 23,707 (86.5%) | 22,253 (84.7%) |
Income Below Poverty Among Married-Couple Families in Pocatello
The poverty statistics for married-couple families in Pocatello show that 5.0% or 478 of the total 9,588 families live below the poverty line. Families with 5 or more children have the highest poverty rate of 38.2%, comprising of 71 families. On the other hand, families with 1 or 2 children have the lowest poverty rate of 3.8%, which includes 109 families.
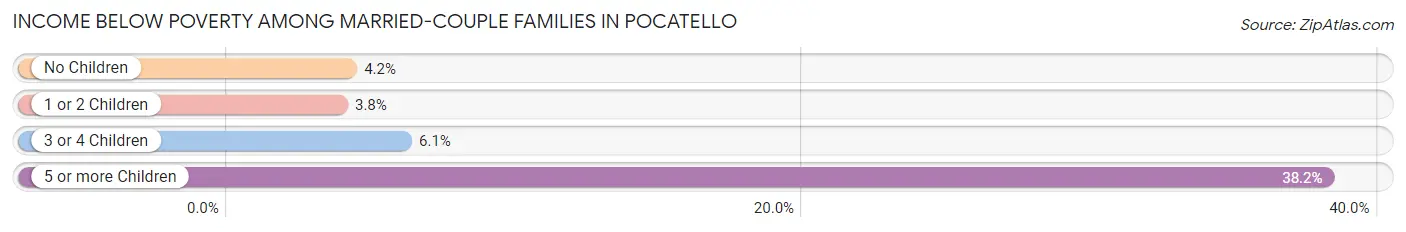
| Children | Above Poverty | Below Poverty |
| No Children | 4,984 (95.9%) | 216 (4.2%) |
| 1 or 2 Children | 2,740 (96.2%) | 109 (3.8%) |
| 3 or 4 Children | 1,271 (93.9%) | 82 (6.1%) |
| 5 or more Children | 115 (61.8%) | 71 (38.2%) |
| Total | 9,110 (95.0%) | 478 (5.0%) |
Income Below Poverty Among Single-Parent Households in Pocatello
According to the poverty data in Pocatello, 17.8% or 149 single-father households and 30.1% or 566 single-mother households are living below the poverty line. Among single-father households, those with 1 or 2 children have the highest poverty rate, with 93 households (18.8%) experiencing poverty. Likewise, among single-mother households, those with 5 or more children have the highest poverty rate, with 40 households (100.0%) falling below the poverty line.
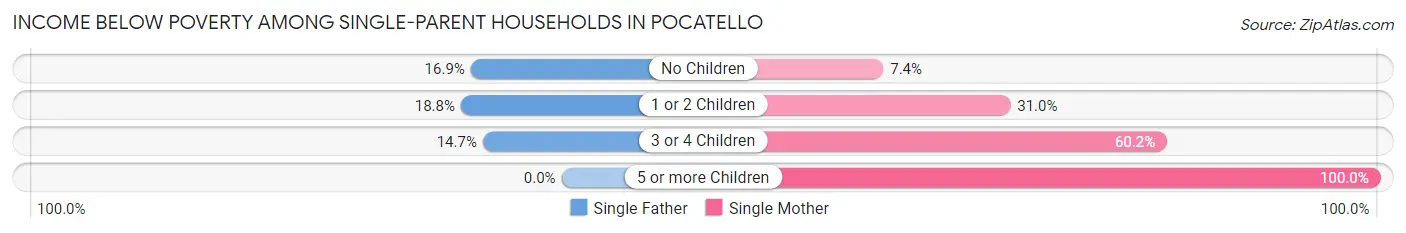
| Children | Single Father | Single Mother |
| No Children | 45 (16.9%) | 45 (7.4%) |
| 1 or 2 Children | 93 (18.8%) | 278 (31.0%) |
| 3 or 4 Children | 11 (14.7%) | 203 (60.2%) |
| 5 or more Children | 0 (0.0%) | 40 (100.0%) |
| Total | 149 (17.8%) | 566 (30.1%) |
Income Below Poverty Among Married-Couple vs Single-Parent Households in Pocatello
The poverty data for Pocatello shows that 478 of the married-couple family households (5.0%) and 715 of the single-parent households (26.3%) are living below the poverty level. Within the married-couple family households, those with 5 or more children have the highest poverty rate, with 71 households (38.2%) falling below the poverty line. Among the single-parent households, those with 5 or more children have the highest poverty rate, with 40 household (100.0%) living below poverty.
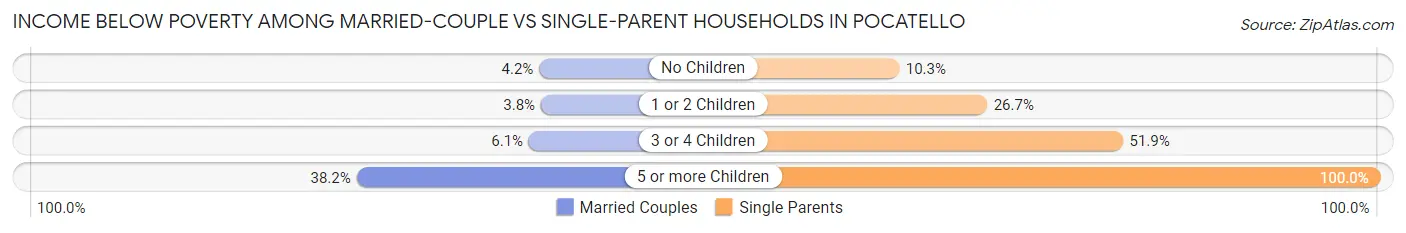
| Children | Married-Couple Families | Single-Parent Households |
| No Children | 216 (4.2%) | 90 (10.3%) |
| 1 or 2 Children | 109 (3.8%) | 371 (26.7%) |
| 3 or 4 Children | 82 (6.1%) | 214 (51.9%) |
| 5 or more Children | 71 (38.2%) | 40 (100.0%) |
| Total | 478 (5.0%) | 715 (26.3%) |
Race in Pocatello
The most populous races in Pocatello are White / Caucasian (48,748 | 86.2%), Hispanic or Latino (5,420 | 9.6%), and Two or more Races (3,412 | 6.0%).
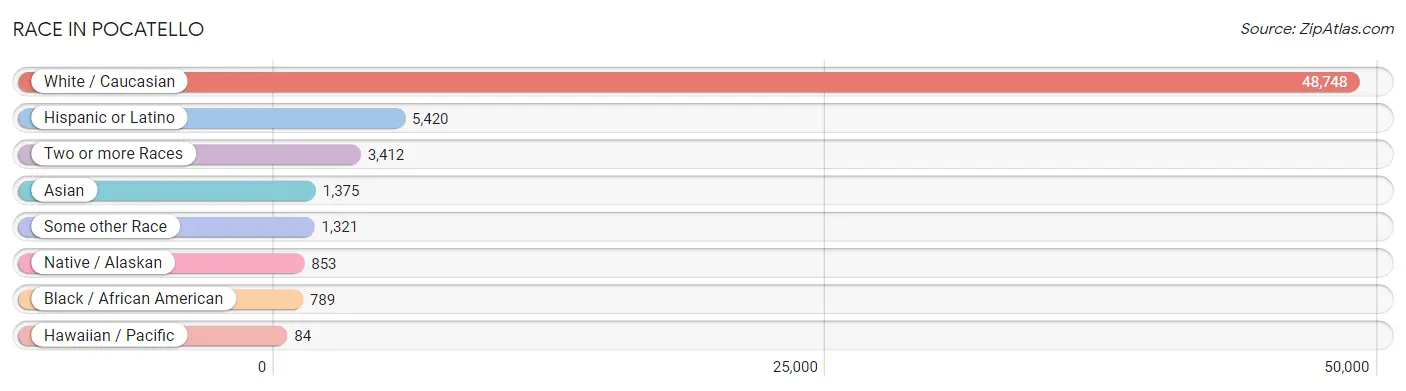
| Race | # Population | % Population |
| Asian | 1,375 | 2.4% |
| Black / African American | 789 | 1.4% |
| Hawaiian / Pacific | 84 | 0.2% |
| Hispanic or Latino | 5,420 | 9.6% |
| Native / Alaskan | 853 | 1.5% |
| White / Caucasian | 48,748 | 86.2% |
| Two or more Races | 3,412 | 6.0% |
| Some other Race | 1,321 | 2.3% |
| Total | 56,582 | 100.0% |
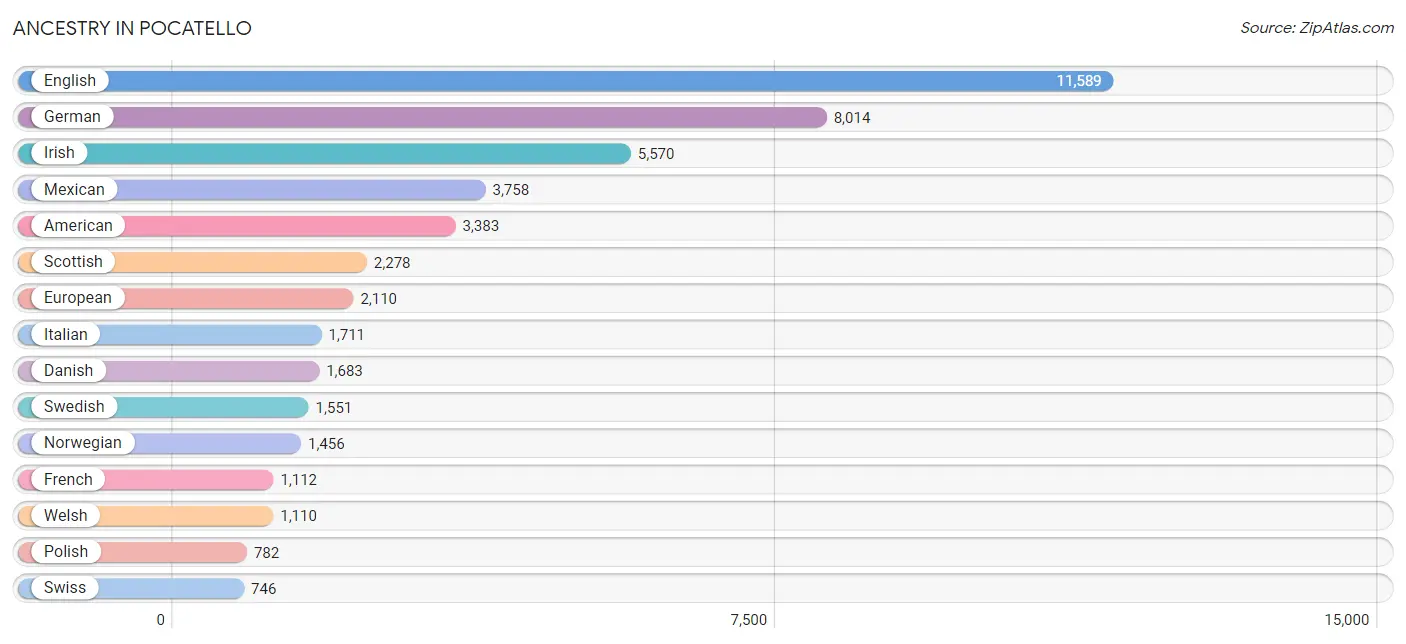
Ancestry in Pocatello
The most populous ancestries reported in Pocatello are English (11,589 | 20.5%), German (8,014 | 14.2%), Irish (5,570 | 9.8%), Mexican (3,758 | 6.6%), and American (3,383 | 6.0%), together accounting for 57.1% of all Pocatello residents.
| Ancestry | # Population | % Population |
| Afghan | 27 | 0.1% |
| African | 14 | 0.0% |
| American | 3,383 | 6.0% |
| Apache | 7 | 0.0% |
| Arab | 139 | 0.3% |
| Arapaho | 9 | 0.0% |
| Argentinean | 31 | 0.1% |
| Armenian | 36 | 0.1% |
| Assyrian / Chaldean / Syriac | 14 | 0.0% |
| Australian | 6 | 0.0% |
| Austrian | 35 | 0.1% |
| Basque | 216 | 0.4% |
| Belgian | 159 | 0.3% |
| Bhutanese | 551 | 1.0% |
| Blackfeet | 6 | 0.0% |
| Brazilian | 47 | 0.1% |
| British | 447 | 0.8% |
| Bulgarian | 9 | 0.0% |
| Burmese | 71 | 0.1% |
| Canadian | 144 | 0.3% |
| Central American | 72 | 0.1% |
| Cherokee | 322 | 0.6% |
| Chilean | 18 | 0.0% |
| Chippewa | 41 | 0.1% |
| Choctaw | 15 | 0.0% |
| Colombian | 154 | 0.3% |
| Comanche | 12 | 0.0% |
| Creek | 25 | 0.0% |
| Croatian | 28 | 0.1% |
| Cuban | 84 | 0.2% |
| Czech | 81 | 0.1% |
| Czechoslovakian | 9 | 0.0% |
| Danish | 1,683 | 3.0% |
| Dutch | 557 | 1.0% |
| Eastern European | 53 | 0.1% |
| Ecuadorian | 26 | 0.1% |
| Egyptian | 9 | 0.0% |
| English | 11,589 | 20.5% |
| Ethiopian | 50 | 0.1% |
| European | 2,110 | 3.7% |
| Fijian | 24 | 0.0% |
| Filipino | 5 | 0.0% |
| Finnish | 91 | 0.2% |
| French | 1,112 | 2.0% |
| French Canadian | 94 | 0.2% |
| German | 8,014 | 14.2% |
| German Russian | 3 | 0.0% |
| Ghanaian | 20 | 0.0% |
| Greek | 145 | 0.3% |
| Guatemalan | 25 | 0.0% |
| Honduran | 41 | 0.1% |
| Hungarian | 35 | 0.1% |
| Icelander | 11 | 0.0% |
| Indian (Asian) | 253 | 0.4% |
| Indonesian | 47 | 0.1% |
| Iranian | 116 | 0.2% |
| Irish | 5,570 | 9.8% |
| Italian | 1,711 | 3.0% |
| Jamaican | 4 | 0.0% |
| Korean | 269 | 0.5% |
| Laotian | 203 | 0.4% |
| Lebanese | 13 | 0.0% |
| Lithuanian | 19 | 0.0% |
| Luxembourger | 10 | 0.0% |
| Mexican | 3,758 | 6.6% |
| Native Hawaiian | 101 | 0.2% |
| Navajo | 84 | 0.2% |
| New Zealander | 20 | 0.0% |
| Nigerian | 23 | 0.0% |
| Northern European | 159 | 0.3% |
| Norwegian | 1,456 | 2.6% |
| Paiute | 4 | 0.0% |
| Pakistani | 98 | 0.2% |
| Pennsylvania German | 23 | 0.0% |
| Pima | 12 | 0.0% |
| Polish | 782 | 1.4% |
| Portuguese | 52 | 0.1% |
| Pueblo | 9 | 0.0% |
| Puerto Rican | 491 | 0.9% |
| Romanian | 132 | 0.2% |
| Russian | 157 | 0.3% |
| Salvadoran | 6 | 0.0% |
| Samoan | 55 | 0.1% |
| Scandinavian | 352 | 0.6% |
| Scotch-Irish | 682 | 1.2% |
| Scottish | 2,278 | 4.0% |
| Seminole | 13 | 0.0% |
| Shoshone | 160 | 0.3% |
| Sierra Leonean | 45 | 0.1% |
| Sioux | 73 | 0.1% |
| Slovak | 9 | 0.0% |
| Slovene | 9 | 0.0% |
| South American | 297 | 0.5% |
| Spaniard | 243 | 0.4% |
| Spanish | 240 | 0.4% |
| Sri Lankan | 144 | 0.3% |
| Subsaharan African | 163 | 0.3% |
| Swedish | 1,551 | 2.7% |
| Swiss | 746 | 1.3% |
| Thai | 228 | 0.4% |
| Tlingit-Haida | 15 | 0.0% |
| Turkish | 29 | 0.1% |
| Ukrainian | 48 | 0.1% |
| Venezuelan | 68 | 0.1% |
| Welsh | 1,110 | 2.0% |
| Yaqui | 5 | 0.0% | View All 106 Rows |
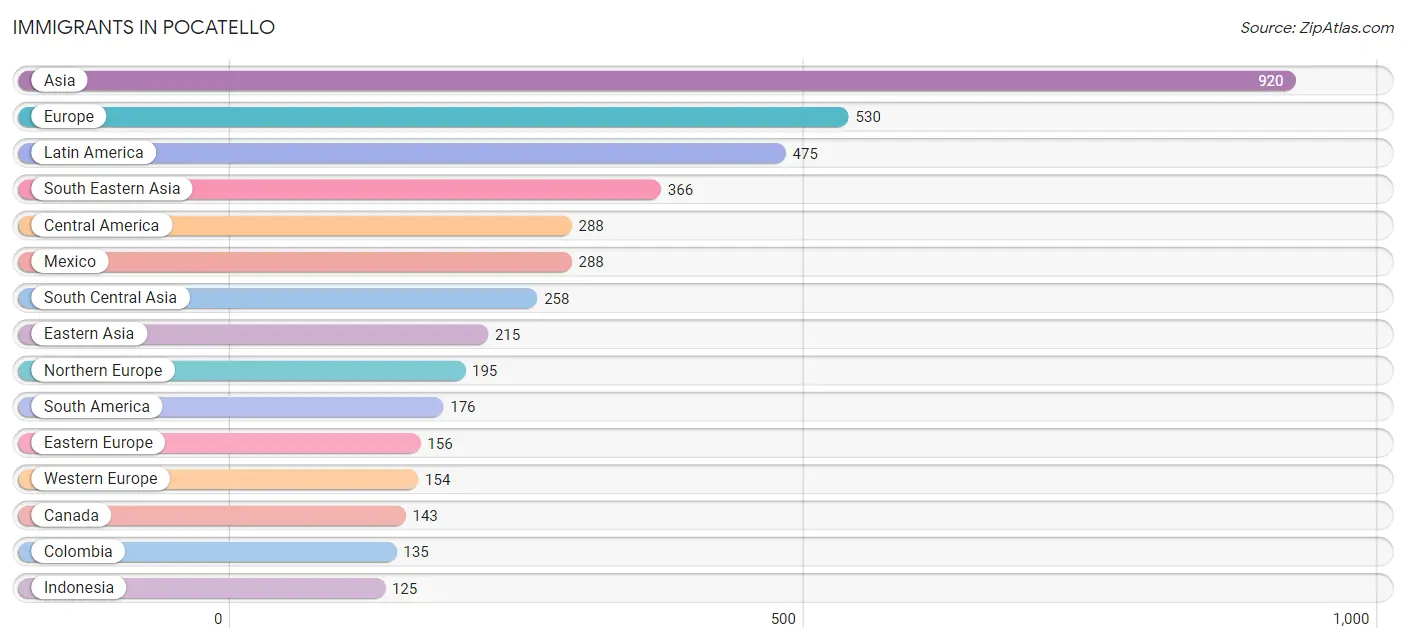
Immigrants in Pocatello
The most numerous immigrant groups reported in Pocatello came from Asia (920 | 1.6%), Europe (530 | 0.9%), Latin America (475 | 0.8%), South Eastern Asia (366 | 0.6%), and Central America (288 | 0.5%), together accounting for 4.6% of all Pocatello residents.
| Immigration Origin | # Population | % Population |
| Afghanistan | 45 | 0.1% |
| Africa | 100 | 0.2% |
| Asia | 920 | 1.6% |
| Australia | 6 | 0.0% |
| Austria | 21 | 0.0% |
| Bangladesh | 21 | 0.0% |
| Belgium | 14 | 0.0% |
| Brazil | 26 | 0.1% |
| Canada | 143 | 0.3% |
| Caribbean | 11 | 0.0% |
| Central America | 288 | 0.5% |
| Chile | 6 | 0.0% |
| China | 67 | 0.1% |
| Colombia | 135 | 0.2% |
| Croatia | 8 | 0.0% |
| Denmark | 10 | 0.0% |
| Eastern Africa | 13 | 0.0% |
| Eastern Asia | 215 | 0.4% |
| Eastern Europe | 156 | 0.3% |
| Ecuador | 9 | 0.0% |
| Egypt | 9 | 0.0% |
| England | 100 | 0.2% |
| Europe | 530 | 0.9% |
| France | 23 | 0.0% |
| Germany | 70 | 0.1% |
| Ghana | 20 | 0.0% |
| Haiti | 11 | 0.0% |
| India | 88 | 0.2% |
| Indonesia | 125 | 0.2% |
| Iran | 42 | 0.1% |
| Iraq | 6 | 0.0% |
| Japan | 100 | 0.2% |
| Korea | 48 | 0.1% |
| Kuwait | 13 | 0.0% |
| Latin America | 475 | 0.8% |
| Mexico | 288 | 0.5% |
| Nepal | 47 | 0.1% |
| Netherlands | 16 | 0.0% |
| Nigeria | 58 | 0.1% |
| Northern Africa | 9 | 0.0% |
| Northern Europe | 195 | 0.3% |
| Norway | 20 | 0.0% |
| Oceania | 42 | 0.1% |
| Philippines | 85 | 0.2% |
| Romania | 44 | 0.1% |
| Russia | 34 | 0.1% |
| Saudi Arabia | 62 | 0.1% |
| Scotland | 23 | 0.0% |
| South America | 176 | 0.3% |
| South Central Asia | 258 | 0.5% |
| South Eastern Asia | 366 | 0.6% |
| Southern Europe | 25 | 0.0% |
| Spain | 14 | 0.0% |
| Sri Lanka | 15 | 0.0% |
| Switzerland | 10 | 0.0% |
| Thailand | 85 | 0.2% |
| Vietnam | 45 | 0.1% |
| Western Africa | 78 | 0.1% |
| Western Asia | 81 | 0.1% |
| Western Europe | 154 | 0.3% | View All 60 Rows |
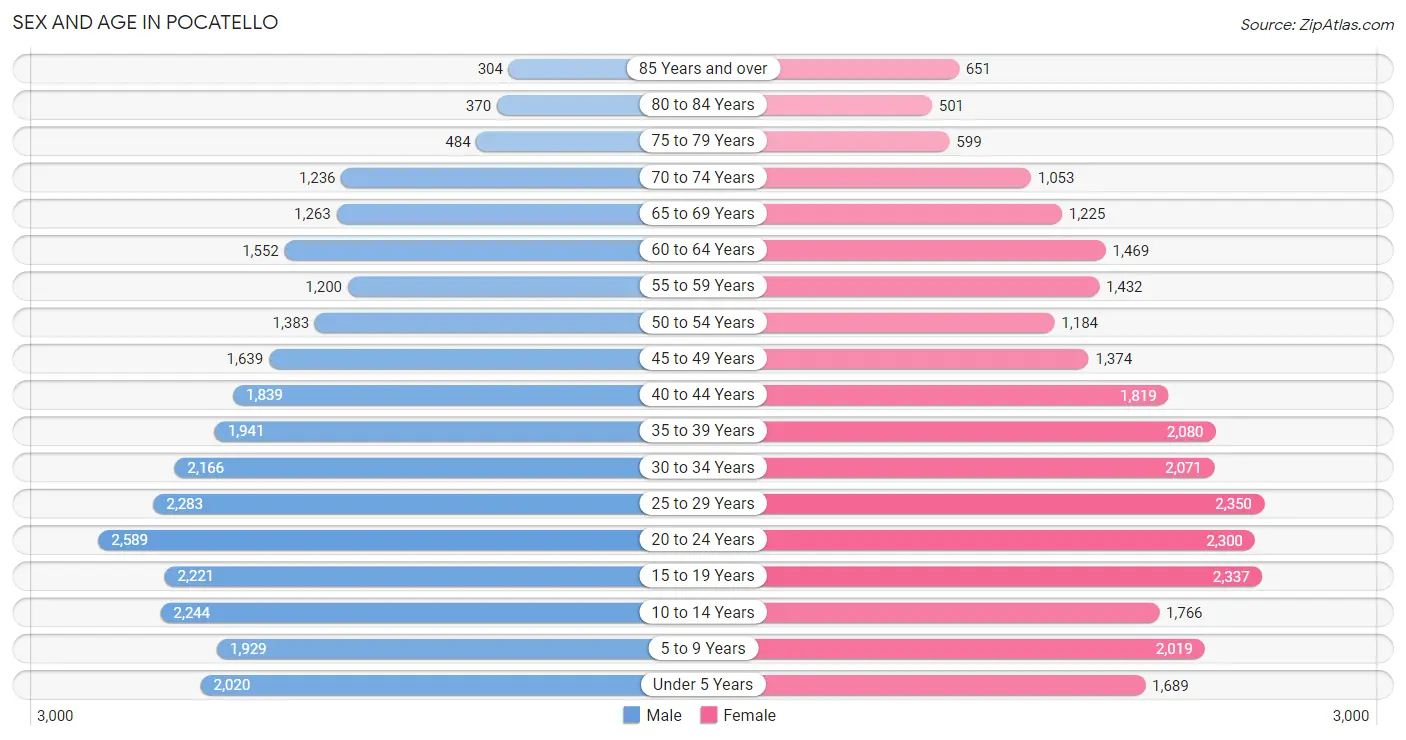
Sex and Age in Pocatello
Sex and Age in Pocatello
The most populous age groups in Pocatello are 20 to 24 Years (2,589 | 9.0%) for men and 25 to 29 Years (2,350 | 8.4%) for women.
| Age Bracket | Male | Female |
| Under 5 Years | 2,020 (7.0%) | 1,689 (6.0%) |
| 5 to 9 Years | 1,929 (6.7%) | 2,019 (7.2%) |
| 10 to 14 Years | 2,244 (7.8%) | 1,766 (6.3%) |
| 15 to 19 Years | 2,221 (7.7%) | 2,337 (8.4%) |
| 20 to 24 Years | 2,589 (9.0%) | 2,300 (8.2%) |
| 25 to 29 Years | 2,283 (8.0%) | 2,350 (8.4%) |
| 30 to 34 Years | 2,166 (7.6%) | 2,071 (7.4%) |
| 35 to 39 Years | 1,941 (6.8%) | 2,080 (7.4%) |
| 40 to 44 Years | 1,839 (6.4%) | 1,819 (6.5%) |
| 45 to 49 Years | 1,639 (5.7%) | 1,374 (4.9%) |
| 50 to 54 Years | 1,383 (4.8%) | 1,184 (4.2%) |
| 55 to 59 Years | 1,200 (4.2%) | 1,432 (5.1%) |
| 60 to 64 Years | 1,552 (5.4%) | 1,469 (5.3%) |
| 65 to 69 Years | 1,263 (4.4%) | 1,225 (4.4%) |
| 70 to 74 Years | 1,236 (4.3%) | 1,053 (3.8%) |
| 75 to 79 Years | 484 (1.7%) | 599 (2.1%) |
| 80 to 84 Years | 370 (1.3%) | 501 (1.8%) |
| 85 Years and over | 304 (1.1%) | 651 (2.3%) |
| Total | 28,663 (100.0%) | 27,919 (100.0%) |
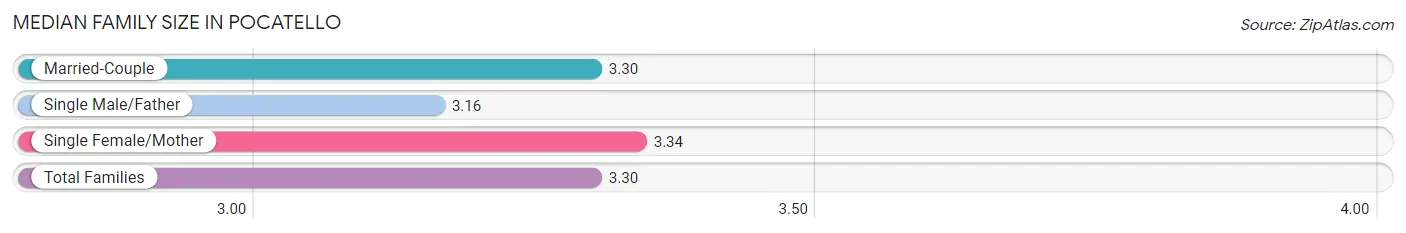
Families and Households in Pocatello
Median Family Size in Pocatello
The median family size in Pocatello is 3.30 persons per family, with single female/mother families (1,883 | 15.3%) accounting for the largest median family size of 3.34 persons per family. On the other hand, single male/father families (837 | 6.8%) represent the smallest median family size with 3.16 persons per family.
| Family Type | # Families | Family Size |
| Married-Couple | 9,588 (77.9%) | 3.30 |
| Single Male/Father | 837 (6.8%) | 3.16 |
| Single Female/Mother | 1,883 (15.3%) | 3.34 |
| Total Families | 12,308 (100.0%) | 3.30 |
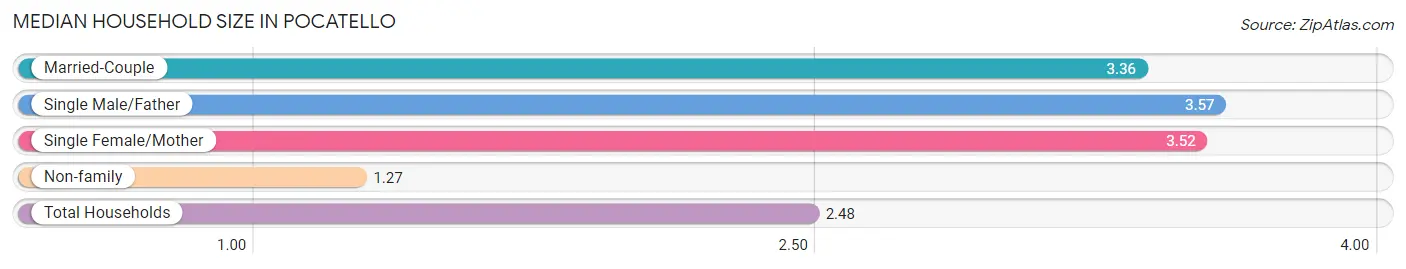
Median Household Size in Pocatello
The median household size in Pocatello is 2.48 persons per household, with single male/father households (837 | 3.9%) accounting for the largest median household size of 3.57 persons per household. non-family households (9,349 | 43.2%) represent the smallest median household size with 1.27 persons per household.
| Household Type | # Households | Household Size |
| Married-Couple | 9,588 (44.3%) | 3.36 |
| Single Male/Father | 837 (3.9%) | 3.57 |
| Single Female/Mother | 1,883 (8.7%) | 3.52 |
| Non-family | 9,349 (43.2%) | 1.27 |
| Total Households | 21,657 (100.0%) | 2.48 |
Household Size by Marriage Status in Pocatello
Out of a total of 21,657 households in Pocatello, 12,308 (56.8%) are family households, while 9,349 (43.2%) are nonfamily households. The most numerous type of family households are 2-person households, comprising 5,114, and the most common type of nonfamily households are 1-person households, comprising 7,525.
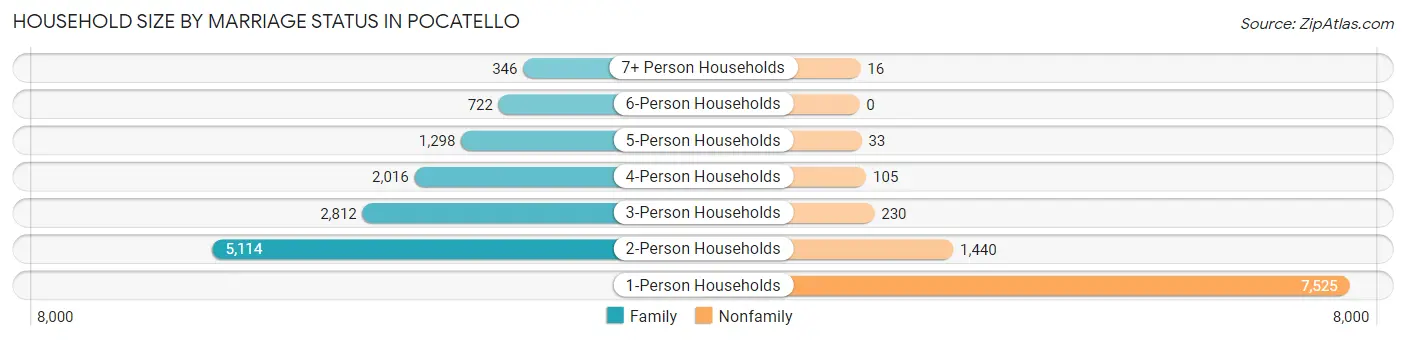
| Household Size | Family Households | Nonfamily Households |
| 1-Person Households | - | 7,525 (34.7%) |
| 2-Person Households | 5,114 (23.6%) | 1,440 (6.7%) |
| 3-Person Households | 2,812 (13.0%) | 230 (1.1%) |
| 4-Person Households | 2,016 (9.3%) | 105 (0.5%) |
| 5-Person Households | 1,298 (6.0%) | 33 (0.2%) |
| 6-Person Households | 722 (3.3%) | 0 (0.0%) |
| 7+ Person Households | 346 (1.6%) | 16 (0.1%) |
| Total | 12,308 (56.8%) | 9,349 (43.2%) |
Female Fertility in Pocatello
Fertility by Age in Pocatello
Average fertility rate in Pocatello is 42.0 births per 1,000 women. Women in the age bracket of 20 to 34 years have the highest fertility rate with 71.0 births per 1,000 women. Women in the age bracket of 20 to 34 years acount for 77.3% of all women with births.
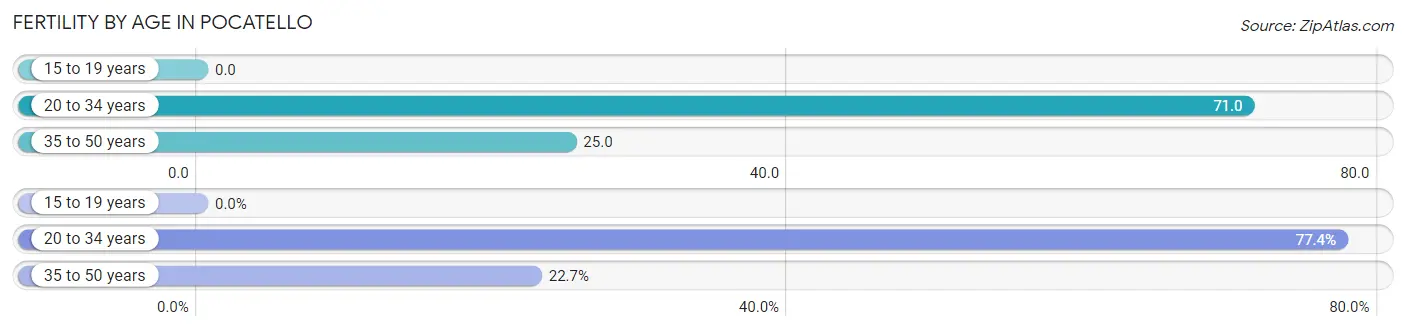
| Age Bracket | Women with Births | Births / 1,000 Women |
| 15 to 19 years | 0 (0.0%) | 0.0 |
| 20 to 34 years | 478 (77.3%) | 71.0 |
| 35 to 50 years | 140 (22.7%) | 25.0 |
| Total | 618 (100.0%) | 42.0 |
Fertility by Age by Marriage Status in Pocatello
90.6% of women with births (618) in Pocatello are married. The highest percentage of unmarried women with births falls into 20 to 34 years age bracket with 10.9% of them unmarried at the time of birth, while the lowest percentage of unmarried women with births belong to 35 to 50 years age bracket with 4.3% of them unmarried.
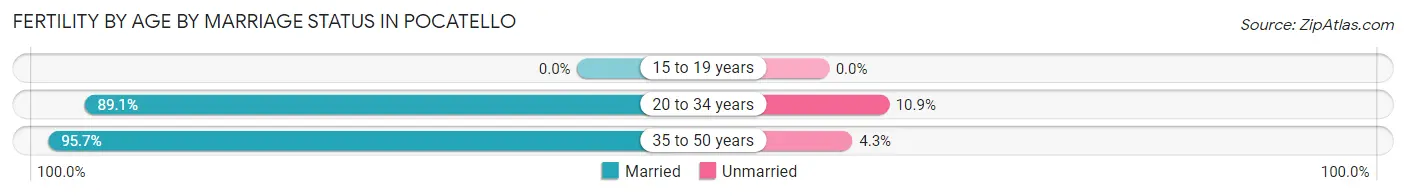
| Age Bracket | Married | Unmarried |
| 15 to 19 years | 0 (0.0%) | 0 (0.0%) |
| 20 to 34 years | 426 (89.1%) | 52 (10.9%) |
| 35 to 50 years | 134 (95.7%) | 6 (4.3%) |
| Total | 560 (90.6%) | 58 (9.4%) |
Fertility by Education in Pocatello
Average fertility rate in Pocatello is 42.0 births per 1,000 women. Women with the education attainment of graduate degree have the highest fertility rate of 63.0 births per 1,000 women, while women with the education attainment of less than high school have the lowest fertility at 21.0 births per 1,000 women. Women with the education attainment of college or associate's degree represent 44.5% of all women with births.
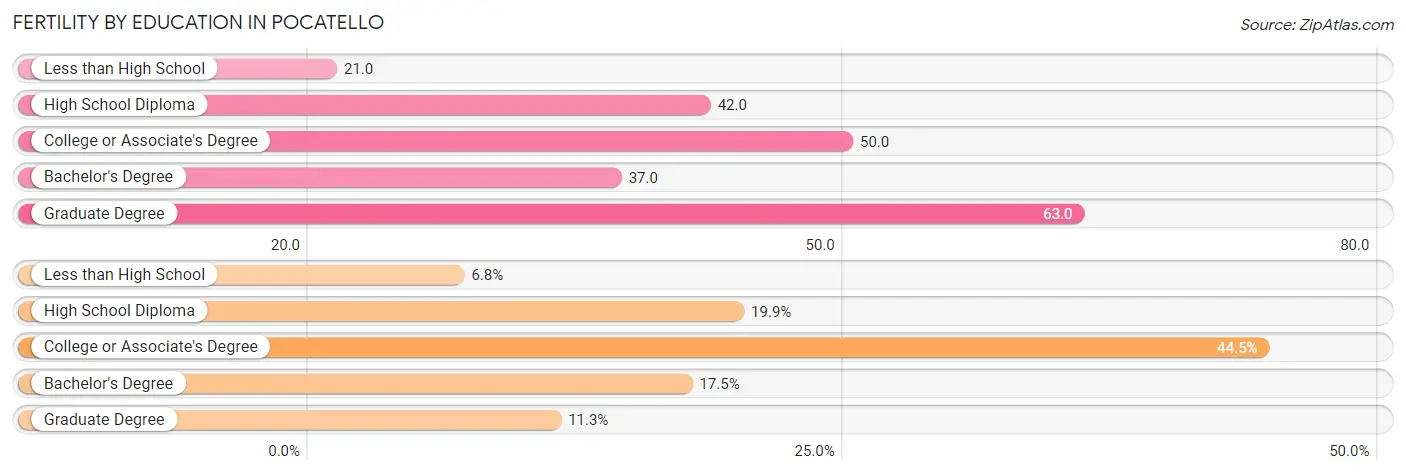
| Educational Attainment | Women with Births | Births / 1,000 Women |
| Less than High School | 42 (6.8%) | 21.0 |
| High School Diploma | 123 (19.9%) | 42.0 |
| College or Associate's Degree | 275 (44.5%) | 50.0 |
| Bachelor's Degree | 108 (17.5%) | 37.0 |
| Graduate Degree | 70 (11.3%) | 63.0 |
| Total | 618 (100.0%) | 42.0 |
Fertility by Education by Marriage Status in Pocatello
9.4% of women with births in Pocatello are unmarried. Women with the educational attainment of less than high school are most likely to be married with 100.0% of them married at childbirth, while women with the educational attainment of college or associate's degree are least likely to be married with 17.4% of them unmarried at childbirth.
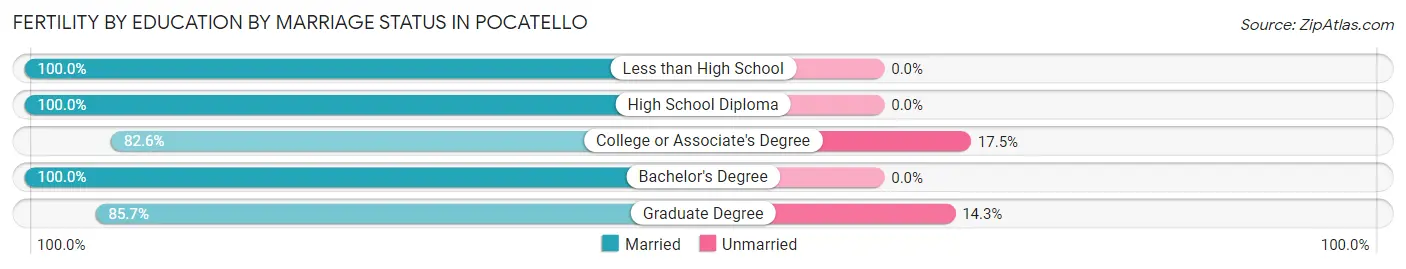
| Educational Attainment | Married | Unmarried |
| Less than High School | 42 (100.0%) | 0 (0.0%) |
| High School Diploma | 123 (100.0%) | 0 (0.0%) |
| College or Associate's Degree | 227 (82.6%) | 48 (17.4%) |
| Bachelor's Degree | 108 (100.0%) | 0 (0.0%) |
| Graduate Degree | 60 (85.7%) | 10 (14.3%) |
| Total | 560 (90.6%) | 58 (9.4%) |
Employment Characteristics in Pocatello
Employment by Class of Employer in Pocatello
Among the 25,440 employed individuals in Pocatello, private company employees (16,741 | 65.8%), state government employees (2,664 | 10.5%), and not-for-profit organizations (1,770 | 7.0%) make up the most common classes of employment.
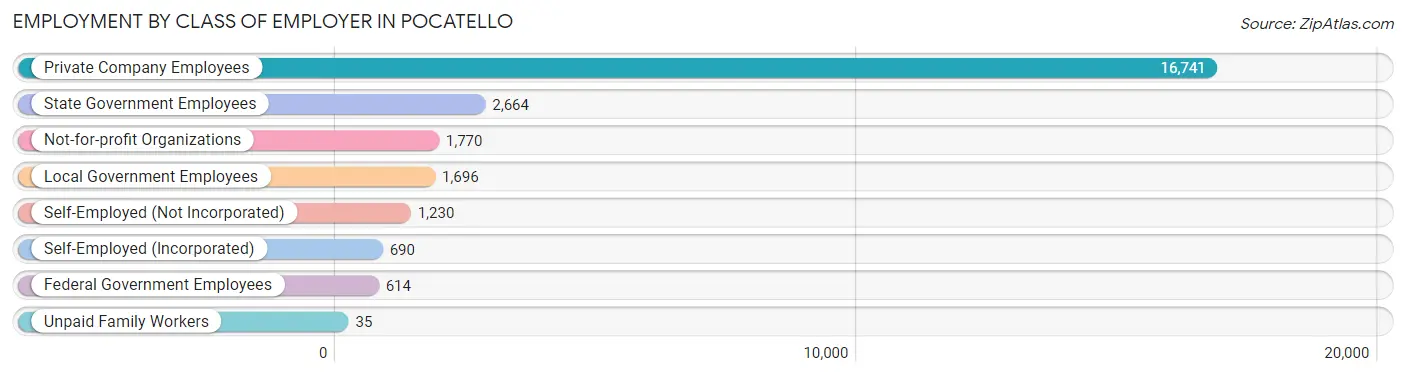
| Employer Class | # Employees | % Employees |
| Private Company Employees | 16,741 | 65.8% |
| Self-Employed (Incorporated) | 690 | 2.7% |
| Self-Employed (Not Incorporated) | 1,230 | 4.8% |
| Not-for-profit Organizations | 1,770 | 7.0% |
| Local Government Employees | 1,696 | 6.7% |
| State Government Employees | 2,664 | 10.5% |
| Federal Government Employees | 614 | 2.4% |
| Unpaid Family Workers | 35 | 0.1% |
| Total | 25,440 | 100.0% |
Employment Status by Age in Pocatello
According to the labor force statistics for Pocatello, out of the total population over 16 years of age (44,005), 62.3% or 27,415 individuals are in the labor force, with 5.4% or 1,480 of them unemployed. The age group with the highest labor force participation rate is 30 to 34 years, with 85.8% or 3,635 individuals in the labor force. Within the labor force, the 16 to 19 years age range has the highest percentage of unemployed individuals, with 16.0% or 291 of them being unemployed.
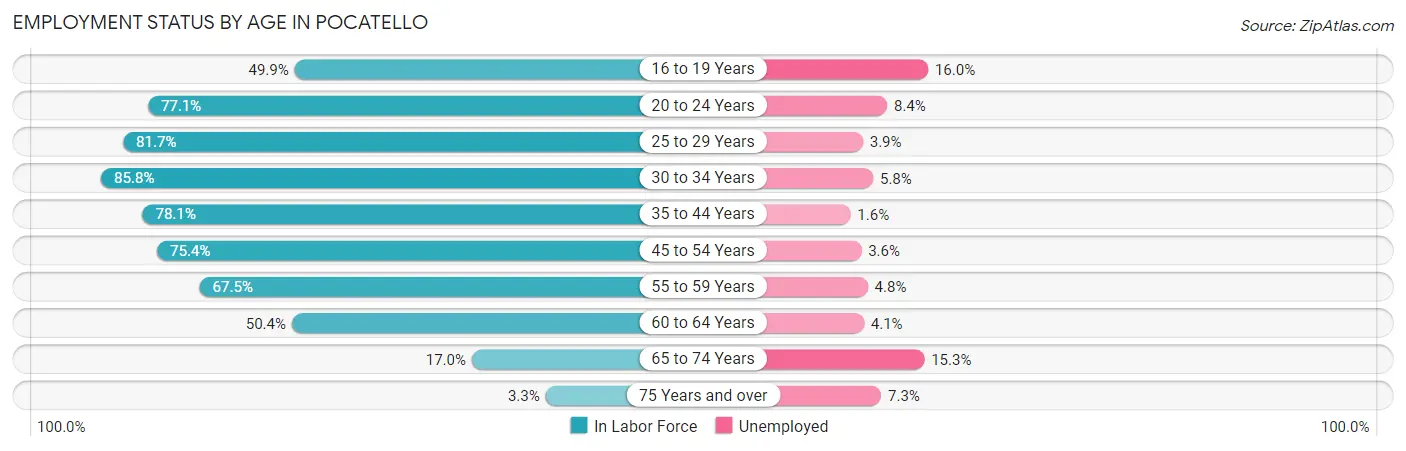
| Age Bracket | In Labor Force | Unemployed |
| 16 to 19 Years | 1,820 (49.9%) | 291 (16.0%) |
| 20 to 24 Years | 3,769 (77.1%) | 317 (8.4%) |
| 25 to 29 Years | 3,785 (81.7%) | 148 (3.9%) |
| 30 to 34 Years | 3,635 (85.8%) | 211 (5.8%) |
| 35 to 44 Years | 5,997 (78.1%) | 96 (1.6%) |
| 45 to 54 Years | 4,207 (75.4%) | 151 (3.6%) |
| 55 to 59 Years | 1,777 (67.5%) | 85 (4.8%) |
| 60 to 64 Years | 1,523 (50.4%) | 62 (4.1%) |
| 65 to 74 Years | 812 (17.0%) | 124 (15.3%) |
| 75 Years and over | 96 (3.3%) | 7 (7.3%) |
| Total | 27,415 (62.3%) | 1,480 (5.4%) |
Employment Status by Educational Attainment in Pocatello
According to labor force statistics for Pocatello, 75.3% of individuals (20,920) out of the total population between 25 and 64 years of age (27,782) are in the labor force, with 3.6% or 753 of them being unemployed. The group with the highest labor force participation rate are those with the educational attainment of bachelor's degree or higher, with 89.5% or 7,941 individuals in the labor force. Within the labor force, individuals with less than high school education have the highest percentage of unemployment, with 9.5% or 81 of them being unemployed.
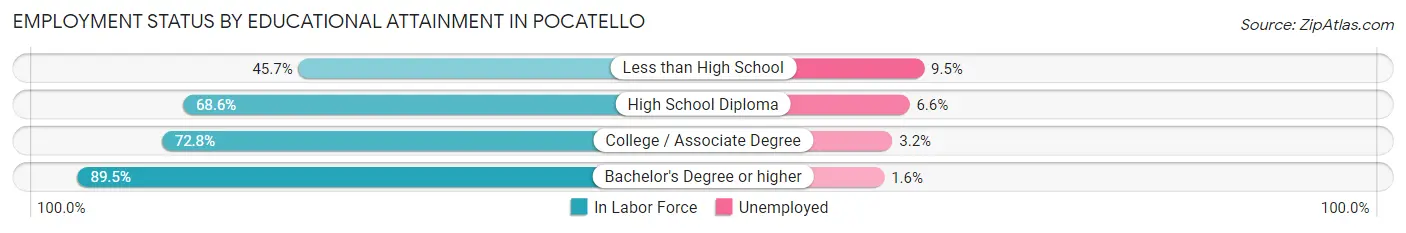
| Educational Attainment | In Labor Force | Unemployed |
| Less than High School | 850 (45.7%) | 177 (9.5%) |
| High School Diploma | 4,433 (68.6%) | 426 (6.6%) |
| College / Associate Degree | 7,707 (72.8%) | 339 (3.2%) |
| Bachelor's Degree or higher | 7,941 (89.5%) | 142 (1.6%) |
| Total | 20,920 (75.3%) | 1,000 (3.6%) |
Employment Occupations by Sex in Pocatello
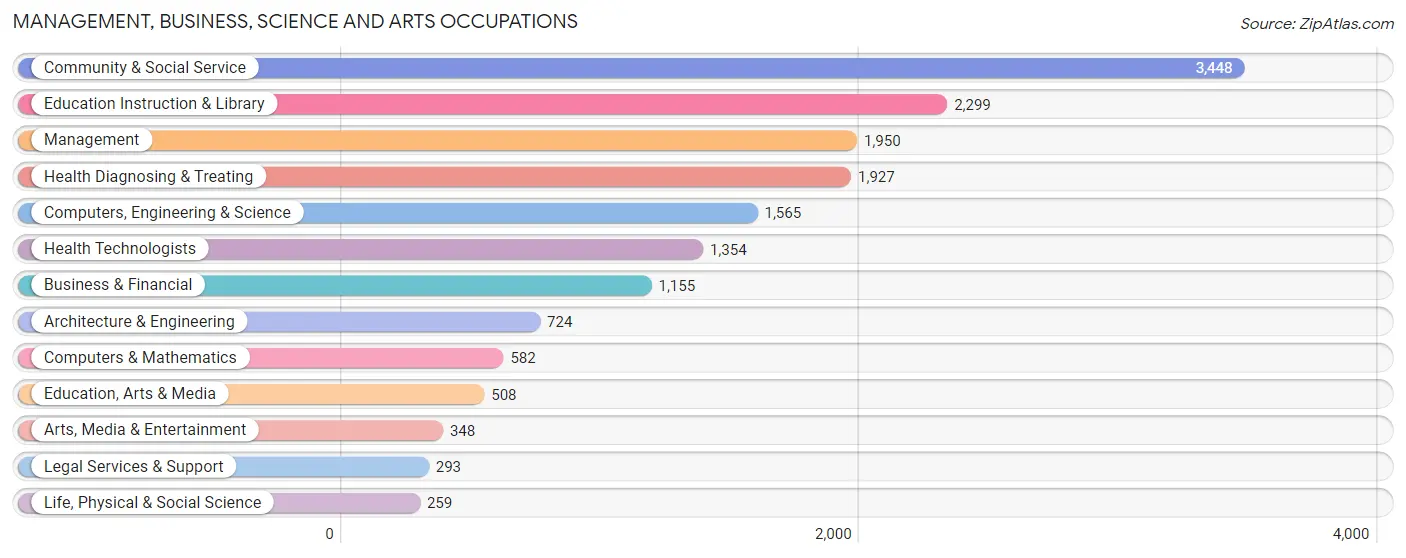
Management, Business, Science and Arts Occupations
The most common Management, Business, Science and Arts occupations in Pocatello are Community & Social Service (3,448 | 13.3%), Education Instruction & Library (2,299 | 8.9%), Management (1,950 | 7.5%), Health Diagnosing & Treating (1,927 | 7.4%), and Computers, Engineering & Science (1,565 | 6.0%).
Management, Business, Science and Arts Occupations by Sex
Within the Management, Business, Science and Arts occupations in Pocatello, the most male-oriented occupations are Computers & Mathematics (80.1%), Computers, Engineering & Science (70.0%), and Architecture & Engineering (67.5%), while the most female-oriented occupations are Education Instruction & Library (63.8%), Education, Arts & Media (62.6%), and Health Diagnosing & Treating (61.5%).
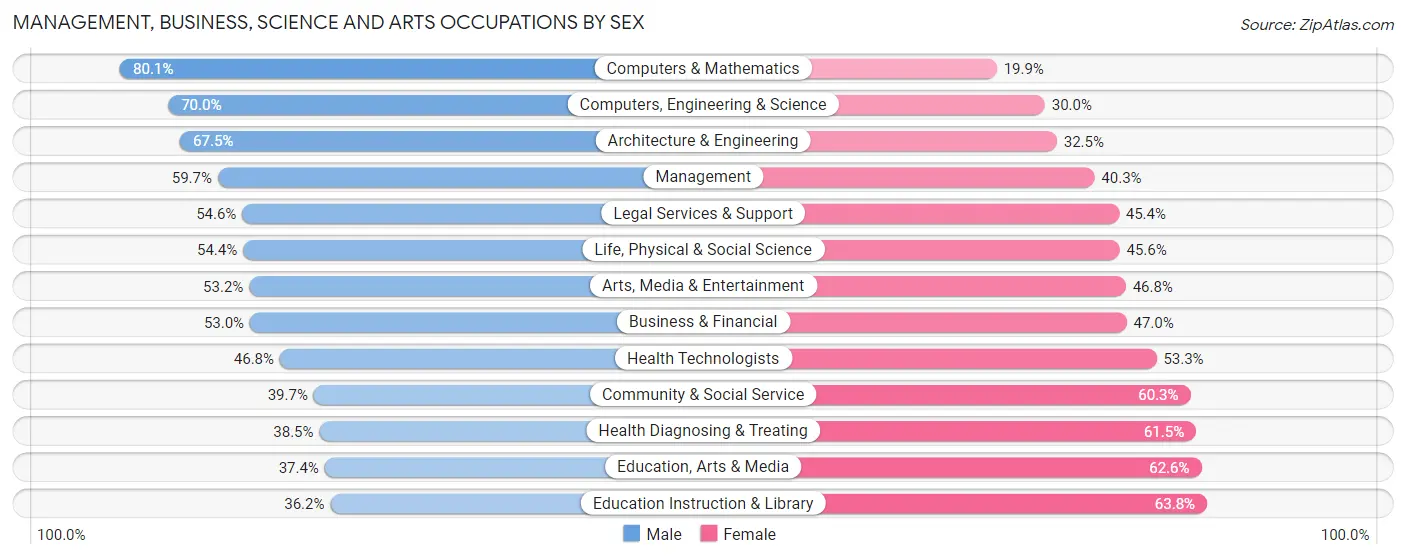
| Occupation | Male | Female |
| Management | 1,164 (59.7%) | 786 (40.3%) |
| Business & Financial | 612 (53.0%) | 543 (47.0%) |
| Computers, Engineering & Science | 1,096 (70.0%) | 469 (30.0%) |
| Computers & Mathematics | 466 (80.1%) | 116 (19.9%) |
| Architecture & Engineering | 489 (67.5%) | 235 (32.5%) |
| Life, Physical & Social Science | 141 (54.4%) | 118 (45.6%) |
| Community & Social Service | 1,368 (39.7%) | 2,080 (60.3%) |
| Education, Arts & Media | 190 (37.4%) | 318 (62.6%) |
| Legal Services & Support | 160 (54.6%) | 133 (45.4%) |
| Education Instruction & Library | 833 (36.2%) | 1,466 (63.8%) |
| Arts, Media & Entertainment | 185 (53.2%) | 163 (46.8%) |
| Health Diagnosing & Treating | 742 (38.5%) | 1,185 (61.5%) |
| Health Technologists | 633 (46.8%) | 721 (53.2%) |
| Total (Category) | 4,982 (49.6%) | 5,063 (50.4%) |
| Total (Overall) | 13,578 (52.4%) | 12,338 (47.6%) |
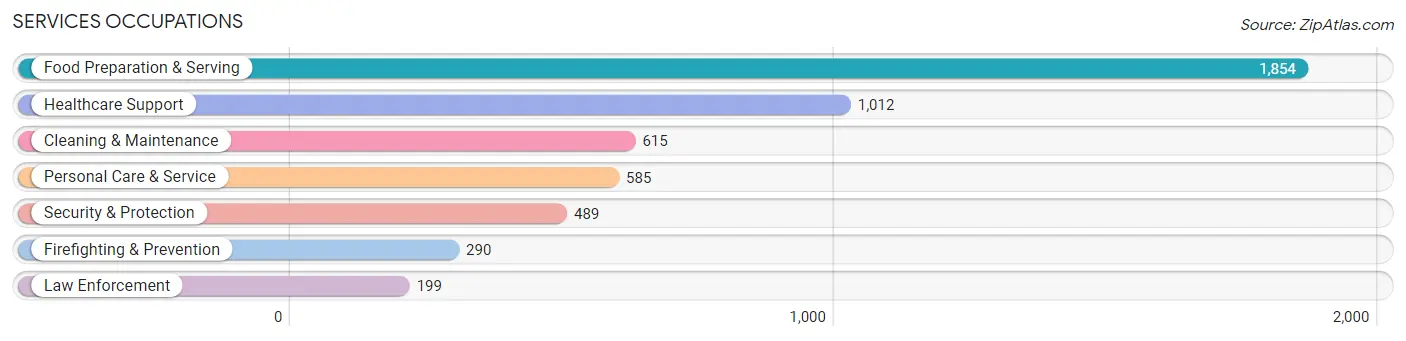
Services Occupations
The most common Services occupations in Pocatello are Food Preparation & Serving (1,854 | 7.1%), Healthcare Support (1,012 | 3.9%), Cleaning & Maintenance (615 | 2.4%), Personal Care & Service (585 | 2.3%), and Security & Protection (489 | 1.9%).
Services Occupations by Sex
Within the Services occupations in Pocatello, the most male-oriented occupations are Law Enforcement (87.9%), Security & Protection (76.1%), and Firefighting & Prevention (67.9%), while the most female-oriented occupations are Personal Care & Service (79.0%), Healthcare Support (70.1%), and Food Preparation & Serving (60.8%).
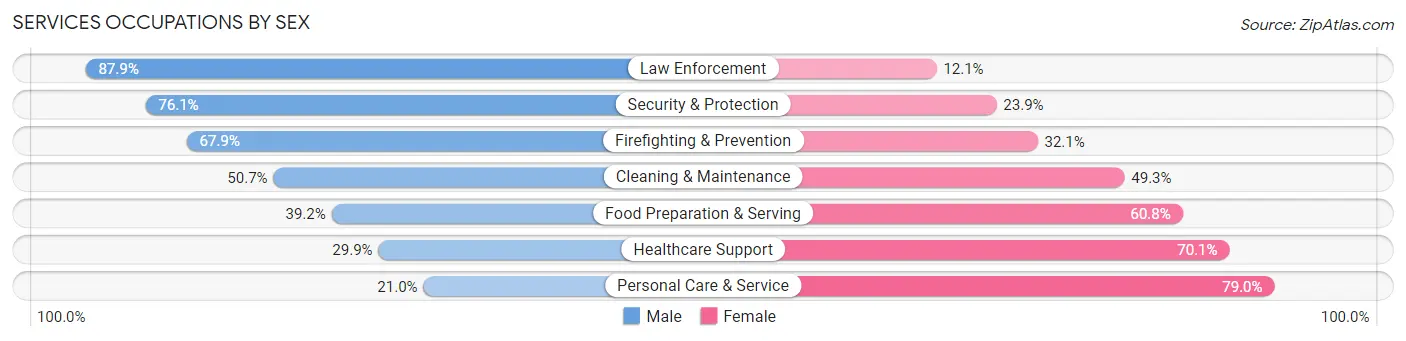
| Occupation | Male | Female |
| Healthcare Support | 303 (29.9%) | 709 (70.1%) |
| Security & Protection | 372 (76.1%) | 117 (23.9%) |
| Firefighting & Prevention | 197 (67.9%) | 93 (32.1%) |
| Law Enforcement | 175 (87.9%) | 24 (12.1%) |
| Food Preparation & Serving | 727 (39.2%) | 1,127 (60.8%) |
| Cleaning & Maintenance | 312 (50.7%) | 303 (49.3%) |
| Personal Care & Service | 123 (21.0%) | 462 (79.0%) |
| Total (Category) | 1,837 (40.3%) | 2,718 (59.7%) |
| Total (Overall) | 13,578 (52.4%) | 12,338 (47.6%) |
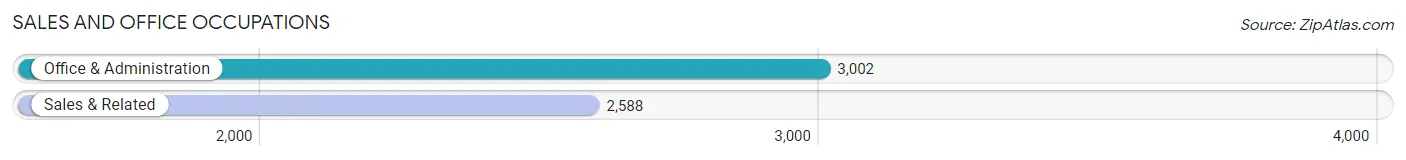
Sales and Office Occupations
The most common Sales and Office occupations in Pocatello are Office & Administration (3,002 | 11.6%), and Sales & Related (2,588 | 10.0%).
Sales and Office Occupations by Sex
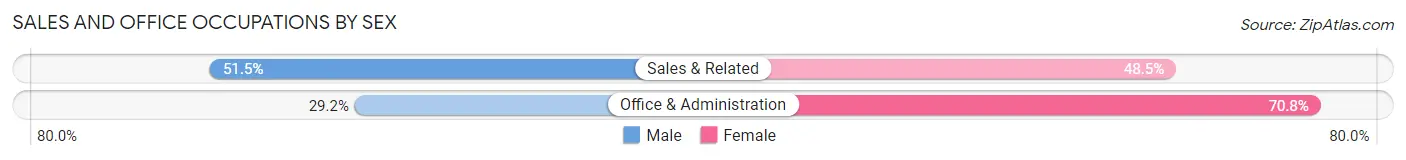
| Occupation | Male | Female |
| Sales & Related | 1,332 (51.5%) | 1,256 (48.5%) |
| Office & Administration | 877 (29.2%) | 2,125 (70.8%) |
| Total (Category) | 2,209 (39.5%) | 3,381 (60.5%) |
| Total (Overall) | 13,578 (52.4%) | 12,338 (47.6%) |
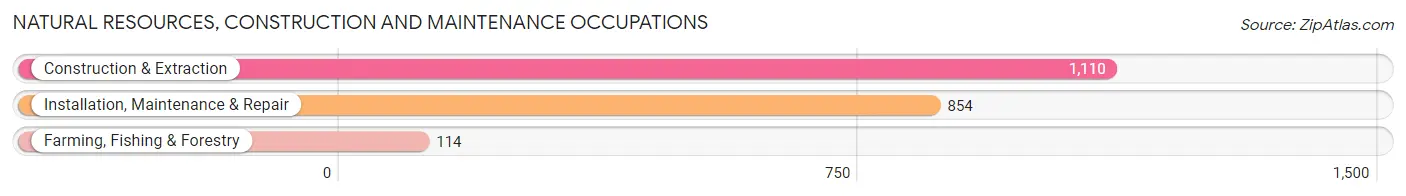
Natural Resources, Construction and Maintenance Occupations
The most common Natural Resources, Construction and Maintenance occupations in Pocatello are Construction & Extraction (1,110 | 4.3%), Installation, Maintenance & Repair (854 | 3.3%), and Farming, Fishing & Forestry (114 | 0.4%).
Natural Resources, Construction and Maintenance Occupations by Sex
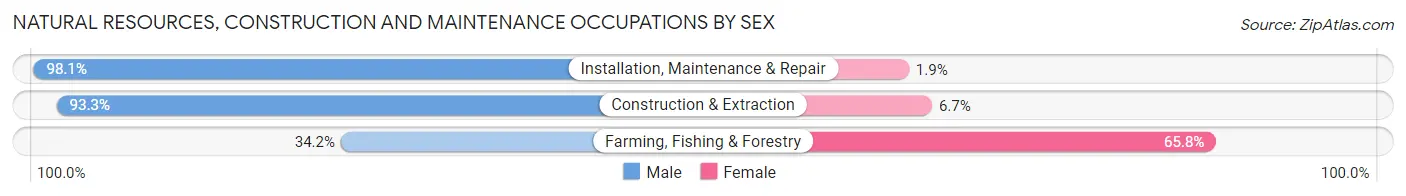
| Occupation | Male | Female |
| Farming, Fishing & Forestry | 39 (34.2%) | 75 (65.8%) |
| Construction & Extraction | 1,036 (93.3%) | 74 (6.7%) |
| Installation, Maintenance & Repair | 838 (98.1%) | 16 (1.9%) |
| Total (Category) | 1,913 (92.1%) | 165 (7.9%) |
| Total (Overall) | 13,578 (52.4%) | 12,338 (47.6%) |
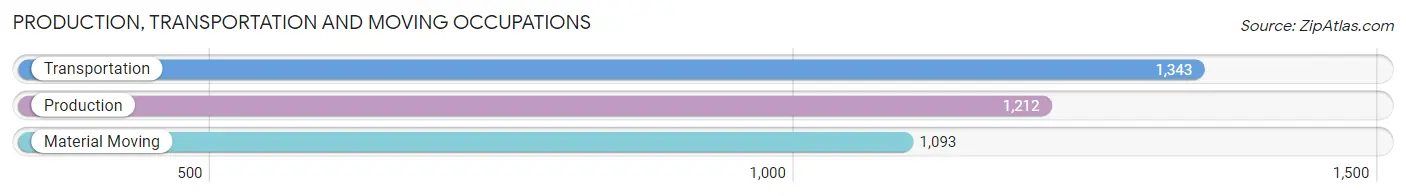
Production, Transportation and Moving Occupations
The most common Production, Transportation and Moving occupations in Pocatello are Transportation (1,343 | 5.2%), Production (1,212 | 4.7%), and Material Moving (1,093 | 4.2%).
Production, Transportation and Moving Occupations by Sex
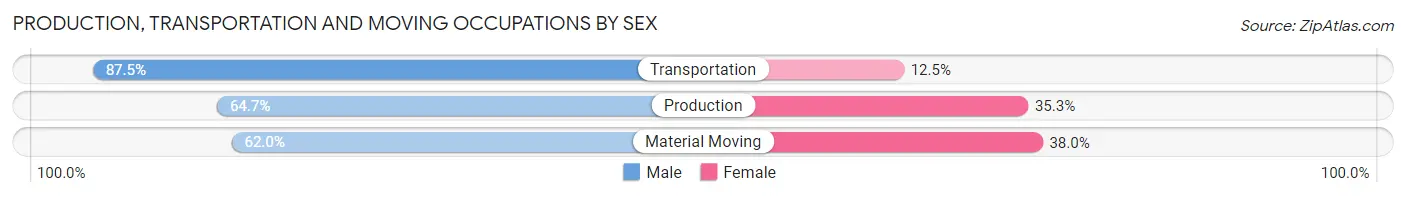
| Occupation | Male | Female |
| Production | 784 (64.7%) | 428 (35.3%) |
| Transportation | 1,175 (87.5%) | 168 (12.5%) |
| Material Moving | 678 (62.0%) | 415 (38.0%) |
| Total (Category) | 2,637 (72.3%) | 1,011 (27.7%) |
| Total (Overall) | 13,578 (52.4%) | 12,338 (47.6%) |
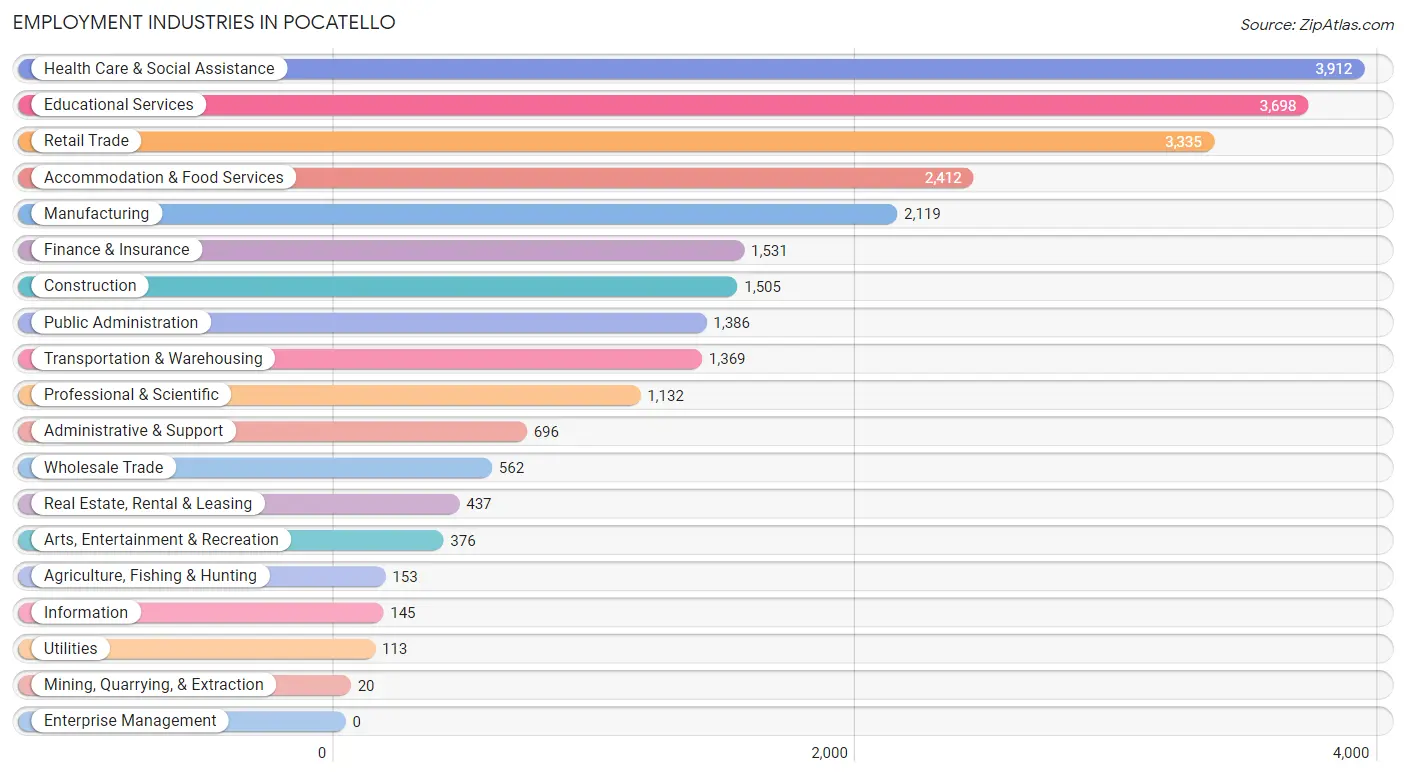
Employment Industries by Sex in Pocatello
Employment Industries in Pocatello
The major employment industries in Pocatello include Health Care & Social Assistance (3,912 | 15.1%), Educational Services (3,698 | 14.3%), Retail Trade (3,335 | 12.9%), Accommodation & Food Services (2,412 | 9.3%), and Manufacturing (2,119 | 8.2%).
Employment Industries by Sex in Pocatello
The Pocatello industries that see more men than women are Utilities (100.0%), Construction (86.8%), and Transportation & Warehousing (80.6%), whereas the industries that tend to have a higher number of women are Health Care & Social Assistance (69.0%), Educational Services (63.5%), and Arts, Entertainment & Recreation (58.5%).
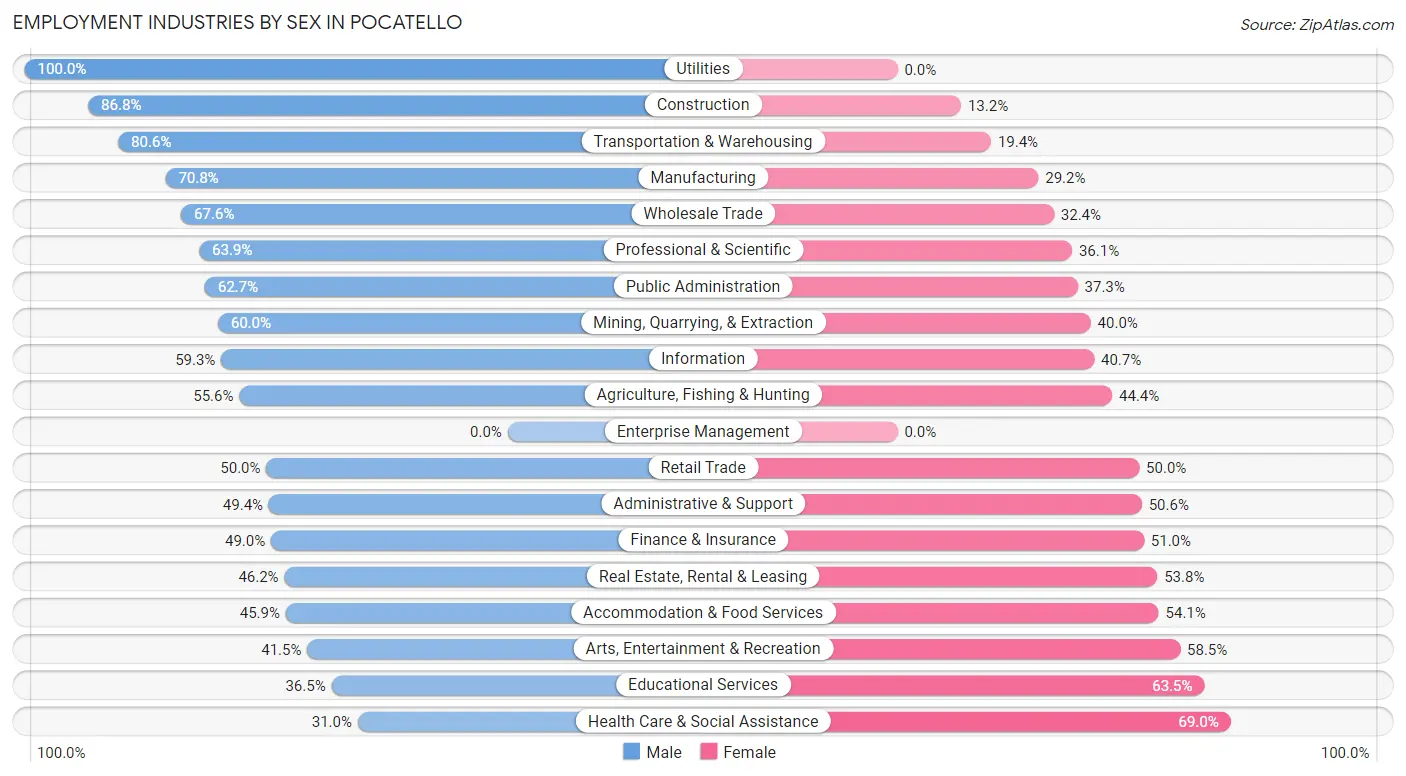
| Industry | Male | Female |
| Agriculture, Fishing & Hunting | 85 (55.6%) | 68 (44.4%) |
| Mining, Quarrying, & Extraction | 12 (60.0%) | 8 (40.0%) |
| Construction | 1,307 (86.8%) | 198 (13.2%) |
| Manufacturing | 1,501 (70.8%) | 618 (29.2%) |
| Wholesale Trade | 380 (67.6%) | 182 (32.4%) |
| Retail Trade | 1,666 (50.0%) | 1,669 (50.0%) |
| Transportation & Warehousing | 1,104 (80.6%) | 265 (19.4%) |
| Utilities | 113 (100.0%) | 0 (0.0%) |
| Information | 86 (59.3%) | 59 (40.7%) |
| Finance & Insurance | 750 (49.0%) | 781 (51.0%) |
| Real Estate, Rental & Leasing | 202 (46.2%) | 235 (53.8%) |
| Professional & Scientific | 723 (63.9%) | 409 (36.1%) |
| Enterprise Management | 0 (0.0%) | 0 (0.0%) |
| Administrative & Support | 344 (49.4%) | 352 (50.6%) |
| Educational Services | 1,349 (36.5%) | 2,349 (63.5%) |
| Health Care & Social Assistance | 1,214 (31.0%) | 2,698 (69.0%) |
| Arts, Entertainment & Recreation | 156 (41.5%) | 220 (58.5%) |
| Accommodation & Food Services | 1,108 (45.9%) | 1,304 (54.1%) |
| Public Administration | 869 (62.7%) | 517 (37.3%) |
| Total | 13,578 (52.4%) | 12,338 (47.6%) |
Education in Pocatello
School Enrollment in Pocatello
The most common levels of schooling among the 17,169 students in Pocatello are college / undergraduate (5,176 | 30.1%), middle school (3,356 | 19.6%), and elementary school (3,029 | 17.6%).
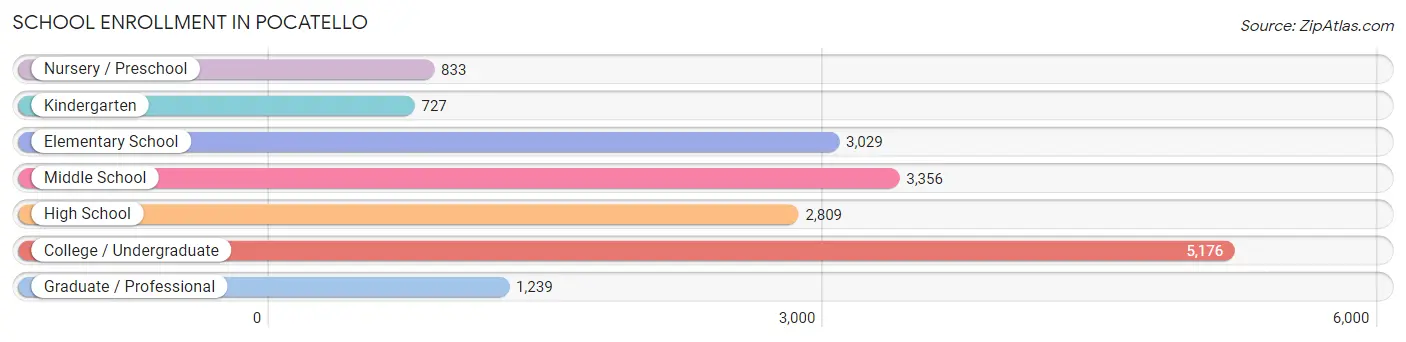
| School Level | # Students | % Students |
| Nursery / Preschool | 833 | 4.9% |
| Kindergarten | 727 | 4.2% |
| Elementary School | 3,029 | 17.6% |
| Middle School | 3,356 | 19.6% |
| High School | 2,809 | 16.4% |
| College / Undergraduate | 5,176 | 30.1% |
| Graduate / Professional | 1,239 | 7.2% |
| Total | 17,169 | 100.0% |
School Enrollment by Age by Funding Source in Pocatello
Out of a total of 17,169 students who are enrolled in schools in Pocatello, 1,408 (8.2%) attend a private institution, while the remaining 15,761 (91.8%) are enrolled in public schools. The age group of 3 to 4 year olds has the highest likelihood of being enrolled in private schools, with 214 (43.3% in the age bracket) enrolled. Conversely, the age group of 20 to 24 year olds has the lowest likelihood of being enrolled in a private school, with 2,623 (97.4% in the age bracket) attending a public institution.
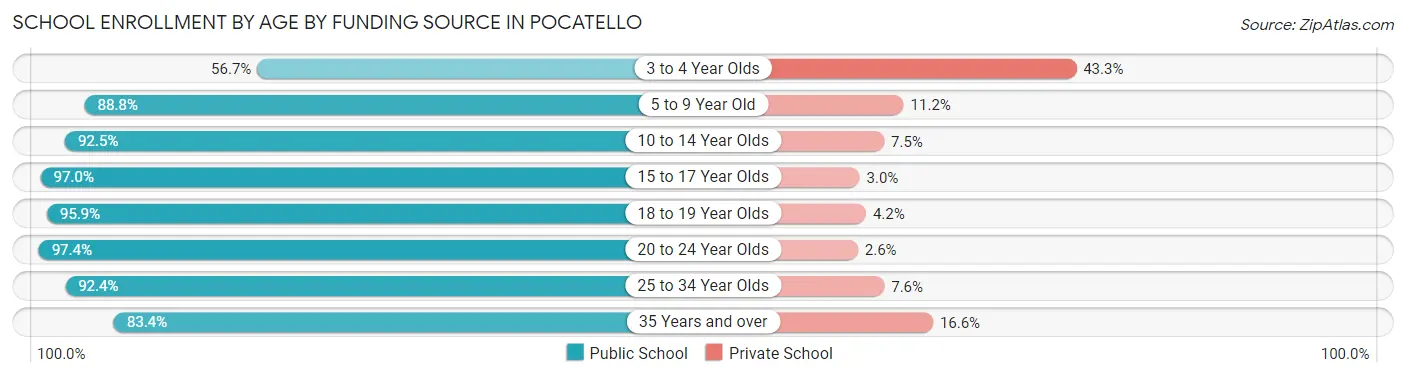
| Age Bracket | Public School | Private School |
| 3 to 4 Year Olds | 280 (56.7%) | 214 (43.3%) |
| 5 to 9 Year Old | 3,325 (88.8%) | 418 (11.2%) |
| 10 to 14 Year Olds | 3,695 (92.5%) | 301 (7.5%) |
| 15 to 17 Year Olds | 2,120 (97.0%) | 65 (3.0%) |
| 18 to 19 Year Olds | 1,477 (95.9%) | 64 (4.2%) |
| 20 to 24 Year Olds | 2,623 (97.4%) | 71 (2.6%) |
| 25 to 34 Year Olds | 1,514 (92.4%) | 124 (7.6%) |
| 35 Years and over | 732 (83.4%) | 146 (16.6%) |
| Total | 15,761 (91.8%) | 1,408 (8.2%) |
Educational Attainment by Field of Study in Pocatello
Education (1,771 | 14.7%), science & technology (1,727 | 14.4%), business (1,528 | 12.7%), bio, nature & agricultural (950 | 7.9%), and arts & humanities (884 | 7.4%) are the most common fields of study among 12,011 individuals in Pocatello who have obtained a bachelor's degree or higher.
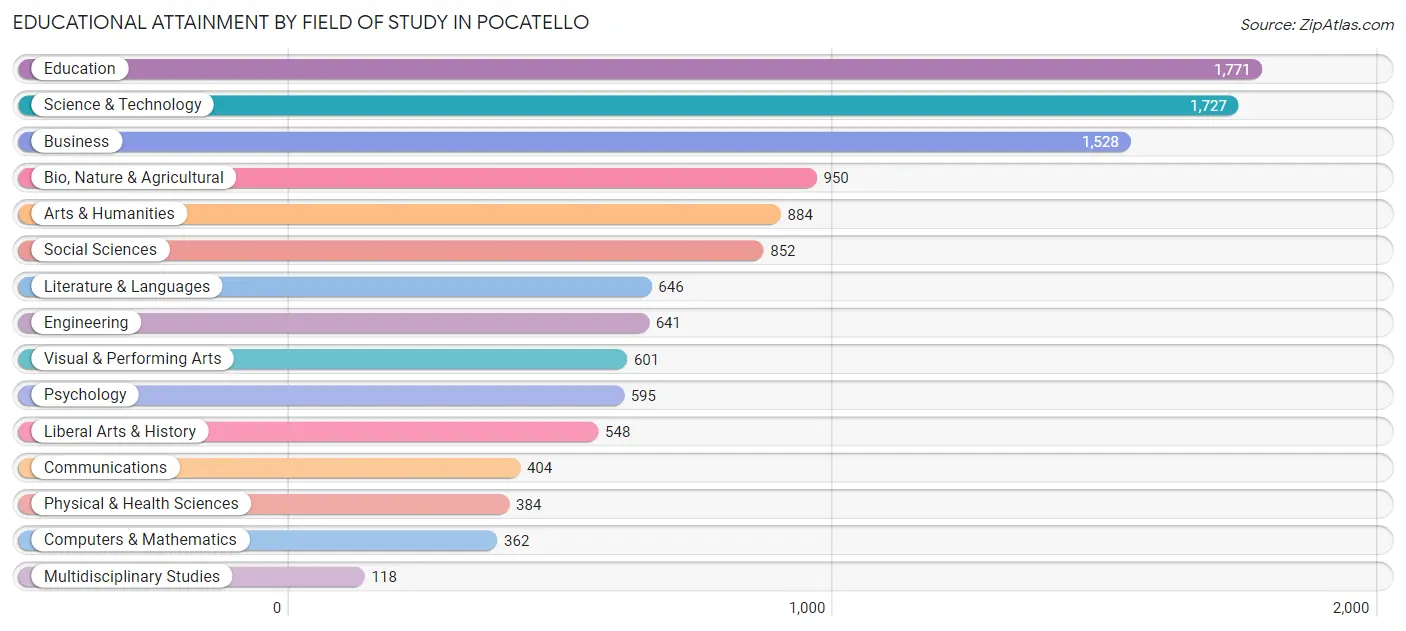
| Field of Study | # Graduates | % Graduates |
| Computers & Mathematics | 362 | 3.0% |
| Bio, Nature & Agricultural | 950 | 7.9% |
| Physical & Health Sciences | 384 | 3.2% |
| Psychology | 595 | 5.0% |
| Social Sciences | 852 | 7.1% |
| Engineering | 641 | 5.3% |
| Multidisciplinary Studies | 118 | 1.0% |
| Science & Technology | 1,727 | 14.4% |
| Business | 1,528 | 12.7% |
| Education | 1,771 | 14.7% |
| Literature & Languages | 646 | 5.4% |
| Liberal Arts & History | 548 | 4.6% |
| Visual & Performing Arts | 601 | 5.0% |
| Communications | 404 | 3.4% |
| Arts & Humanities | 884 | 7.4% |
| Total | 12,011 | 100.0% |
Transportation & Commute in Pocatello
Vehicle Availability by Sex in Pocatello
The most prevalent vehicle ownership categories in Pocatello are males with 2 vehicles (5,341, accounting for 40.7%) and females with 2 vehicles (4,783, making up 46.3%).
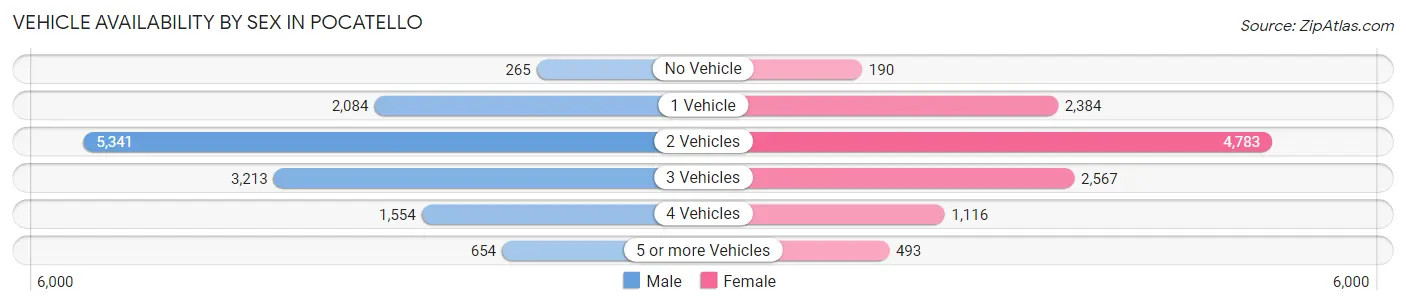
| Vehicles Available | Male | Female |
| No Vehicle | 265 (2.0%) | 190 (1.7%) |
| 1 Vehicle | 2,084 (15.9%) | 2,384 (20.7%) |
| 2 Vehicles | 5,341 (40.7%) | 4,783 (41.5%) |
| 3 Vehicles | 3,213 (24.5%) | 2,567 (22.3%) |
| 4 Vehicles | 1,554 (11.8%) | 1,116 (9.7%) |
| 5 or more Vehicles | 654 (5.0%) | 493 (4.3%) |
| Total | 13,111 (100.0%) | 11,533 (100.0%) |
Commute Time in Pocatello
The most frequently occuring commute durations in Pocatello are 10 to 14 minutes (6,907 commuters, 29.7%), 5 to 9 minutes (5,780 commuters, 24.8%), and 15 to 19 minutes (4,657 commuters, 20.0%).
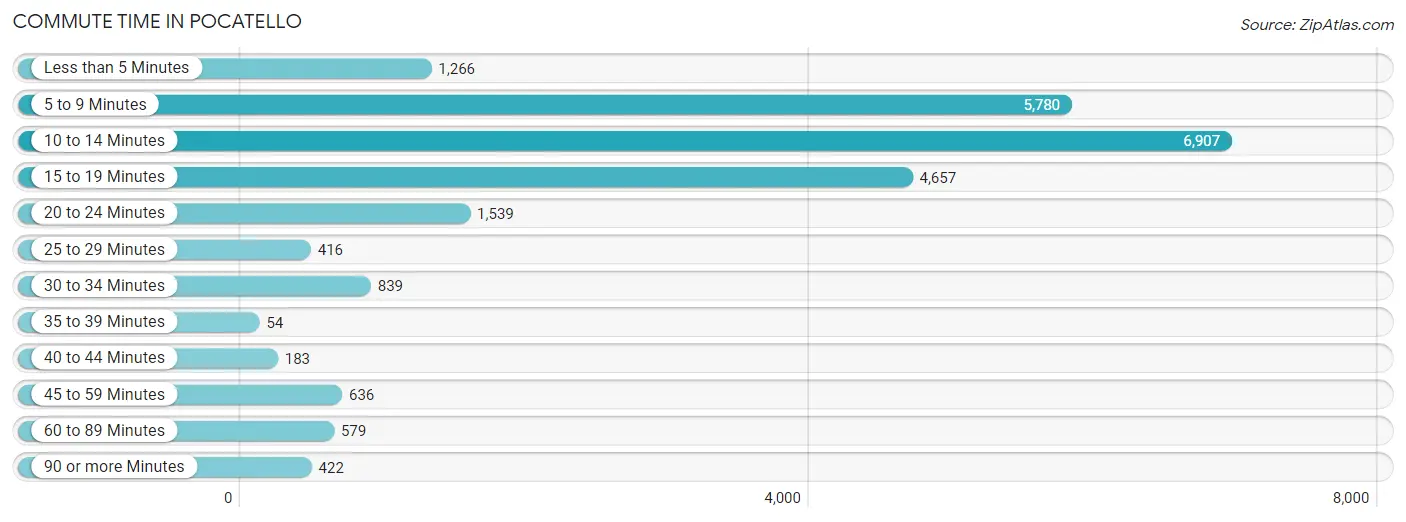
| Commute Time | # Commuters | % Commuters |
| Less than 5 Minutes | 1,266 | 5.4% |
| 5 to 9 Minutes | 5,780 | 24.8% |
| 10 to 14 Minutes | 6,907 | 29.7% |
| 15 to 19 Minutes | 4,657 | 20.0% |
| 20 to 24 Minutes | 1,539 | 6.6% |
| 25 to 29 Minutes | 416 | 1.8% |
| 30 to 34 Minutes | 839 | 3.6% |
| 35 to 39 Minutes | 54 | 0.2% |
| 40 to 44 Minutes | 183 | 0.8% |
| 45 to 59 Minutes | 636 | 2.7% |
| 60 to 89 Minutes | 579 | 2.5% |
| 90 or more Minutes | 422 | 1.8% |
Commute Time by Sex in Pocatello
The most common commute times in Pocatello are 10 to 14 minutes (3,457 commuters, 28.0%) for males and 10 to 14 minutes (3,450 commuters, 31.5%) for females.
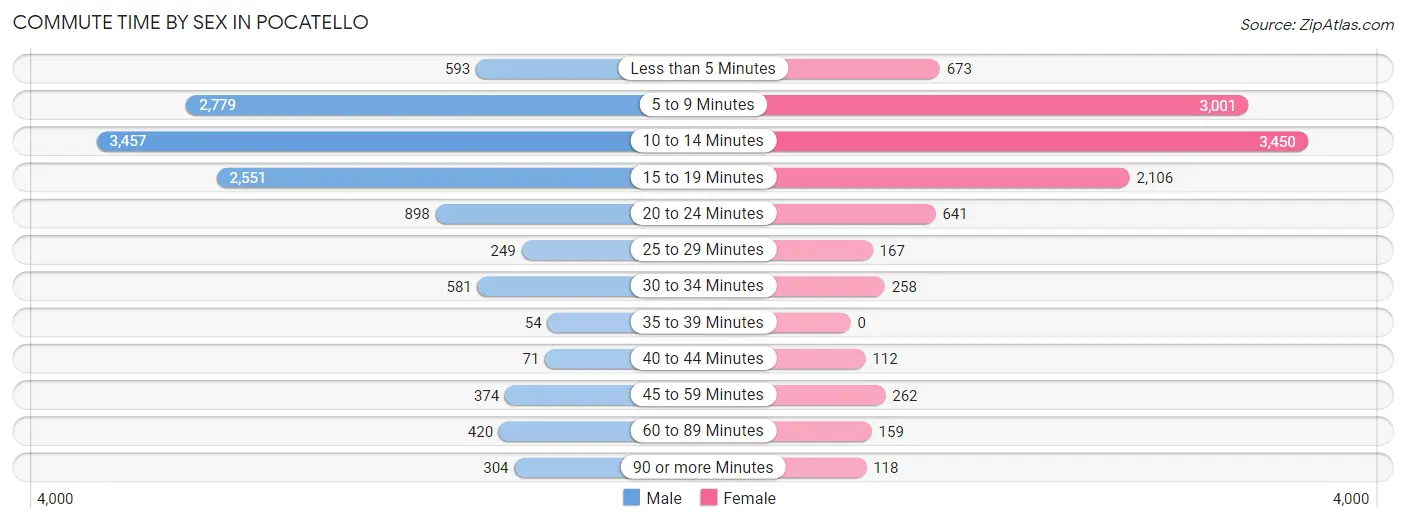
| Commute Time | Male | Female |
| Less than 5 Minutes | 593 (4.8%) | 673 (6.1%) |
| 5 to 9 Minutes | 2,779 (22.5%) | 3,001 (27.4%) |
| 10 to 14 Minutes | 3,457 (28.0%) | 3,450 (31.5%) |
| 15 to 19 Minutes | 2,551 (20.7%) | 2,106 (19.2%) |
| 20 to 24 Minutes | 898 (7.3%) | 641 (5.9%) |
| 25 to 29 Minutes | 249 (2.0%) | 167 (1.5%) |
| 30 to 34 Minutes | 581 (4.7%) | 258 (2.4%) |
| 35 to 39 Minutes | 54 (0.4%) | 0 (0.0%) |
| 40 to 44 Minutes | 71 (0.6%) | 112 (1.0%) |
| 45 to 59 Minutes | 374 (3.0%) | 262 (2.4%) |
| 60 to 89 Minutes | 420 (3.4%) | 159 (1.5%) |
| 90 or more Minutes | 304 (2.5%) | 118 (1.1%) |
Time of Departure to Work by Sex in Pocatello
The most frequent times of departure to work in Pocatello are 7:30 AM to 7:59 AM (2,008, 16.3%) for males and 7:30 AM to 7:59 AM (1,868, 17.1%) for females.
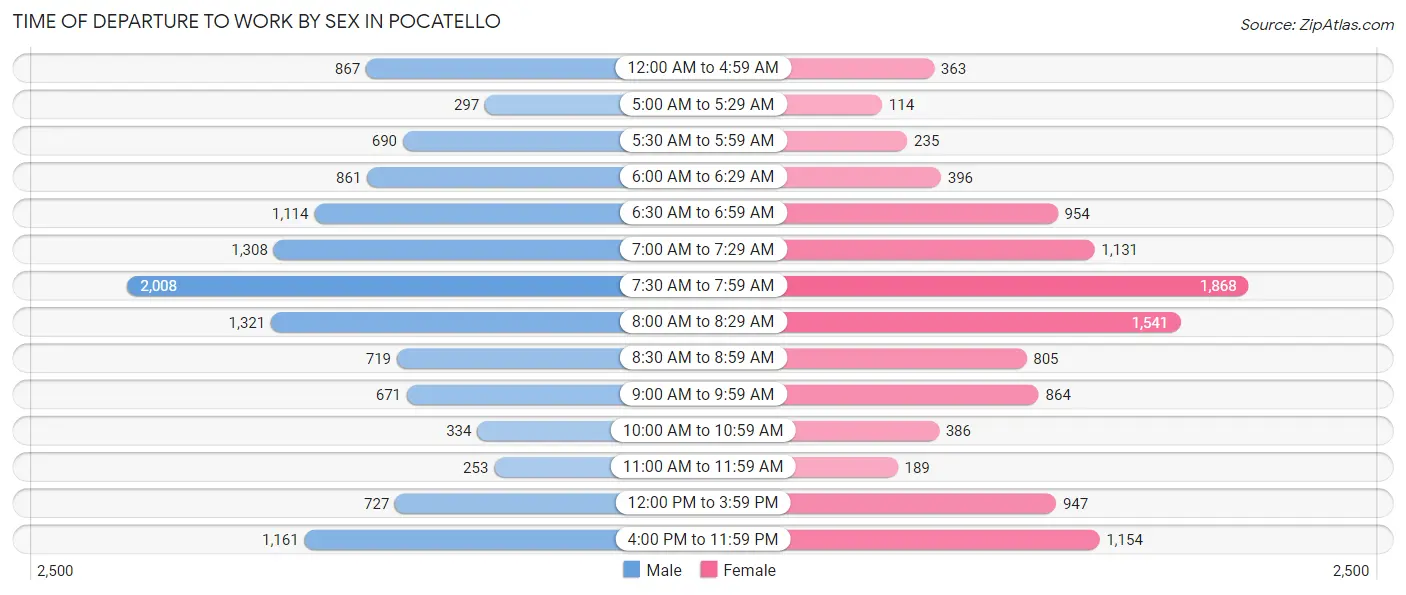
| Time of Departure | Male | Female |
| 12:00 AM to 4:59 AM | 867 (7.0%) | 363 (3.3%) |
| 5:00 AM to 5:29 AM | 297 (2.4%) | 114 (1.0%) |
| 5:30 AM to 5:59 AM | 690 (5.6%) | 235 (2.1%) |
| 6:00 AM to 6:29 AM | 861 (7.0%) | 396 (3.6%) |
| 6:30 AM to 6:59 AM | 1,114 (9.0%) | 954 (8.7%) |
| 7:00 AM to 7:29 AM | 1,308 (10.6%) | 1,131 (10.3%) |
| 7:30 AM to 7:59 AM | 2,008 (16.3%) | 1,868 (17.1%) |
| 8:00 AM to 8:29 AM | 1,321 (10.7%) | 1,541 (14.1%) |
| 8:30 AM to 8:59 AM | 719 (5.8%) | 805 (7.3%) |
| 9:00 AM to 9:59 AM | 671 (5.4%) | 864 (7.9%) |
| 10:00 AM to 10:59 AM | 334 (2.7%) | 386 (3.5%) |
| 11:00 AM to 11:59 AM | 253 (2.1%) | 189 (1.7%) |
| 12:00 PM to 3:59 PM | 727 (5.9%) | 947 (8.6%) |
| 4:00 PM to 11:59 PM | 1,161 (9.4%) | 1,154 (10.5%) |
| Total | 12,331 (100.0%) | 10,947 (100.0%) |
Housing Occupancy in Pocatello
Occupancy by Ownership in Pocatello
Of the total 21,657 dwellings in Pocatello, owner-occupied units account for 13,772 (63.6%), while renter-occupied units make up 7,885 (36.4%).
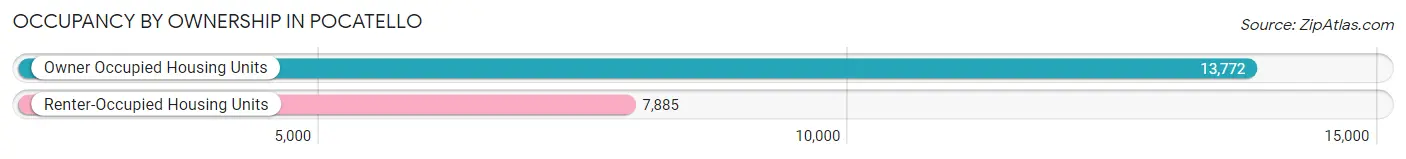
| Occupancy | # Housing Units | % Housing Units |
| Owner Occupied Housing Units | 13,772 | 63.6% |
| Renter-Occupied Housing Units | 7,885 | 36.4% |
| Total Occupied Housing Units | 21,657 | 100.0% |
Occupancy by Household Size in Pocatello
| Household Size | # Housing Units | % Housing Units |
| 1-Person Household | 7,525 | 34.7% |
| 2-Person Household | 6,554 | 30.3% |
| 3-Person Household | 3,042 | 14.1% |
| 4+ Person Household | 4,536 | 20.9% |
| Total Housing Units | 21,657 | 100.0% |
Occupancy by Ownership by Household Size in Pocatello
| Household Size | Owner-occupied | Renter-occupied |
| 1-Person Household | 4,034 (53.6%) | 3,491 (46.4%) |
| 2-Person Household | 4,331 (66.1%) | 2,223 (33.9%) |
| 3-Person Household | 2,165 (71.2%) | 877 (28.8%) |
| 4+ Person Household | 3,242 (71.5%) | 1,294 (28.5%) |
| Total Housing Units | 13,772 (63.6%) | 7,885 (36.4%) |
Occupancy by Educational Attainment in Pocatello
| Household Size | Owner-occupied | Renter-occupied |
| Less than High School | 660 (49.7%) | 668 (50.3%) |
| High School Diploma | 2,778 (57.7%) | 2,033 (42.3%) |
| College/Associate Degree | 5,285 (61.4%) | 3,324 (38.6%) |
| Bachelor's Degree or higher | 5,049 (73.1%) | 1,860 (26.9%) |
Occupancy by Age of Householder in Pocatello
| Age Bracket | # Households | % Households |
| Under 35 Years | 5,750 | 26.6% |
| 35 to 44 Years | 4,245 | 19.6% |
| 45 to 54 Years | 3,345 | 15.4% |
| 55 to 64 Years | 3,416 | 15.8% |
| 65 to 74 Years | 3,023 | 14.0% |
| 75 to 84 Years | 1,276 | 5.9% |
| 85 Years and Over | 602 | 2.8% |
| Total | 21,657 | 100.0% |
Housing Finances in Pocatello
Median Income by Occupancy in Pocatello
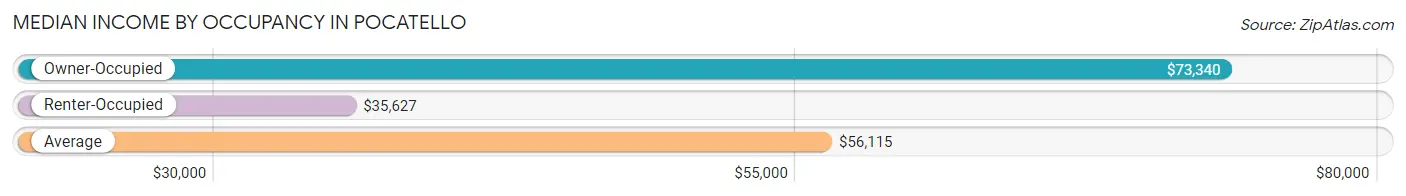
| Occupancy Type | # Households | Median Income |
| Owner-Occupied | 13,772 (63.6%) | $73,340 |
| Renter-Occupied | 7,885 (36.4%) | $35,627 |
| Average | 21,657 (100.0%) | $56,115 |
Occupancy by Householder Income Bracket in Pocatello
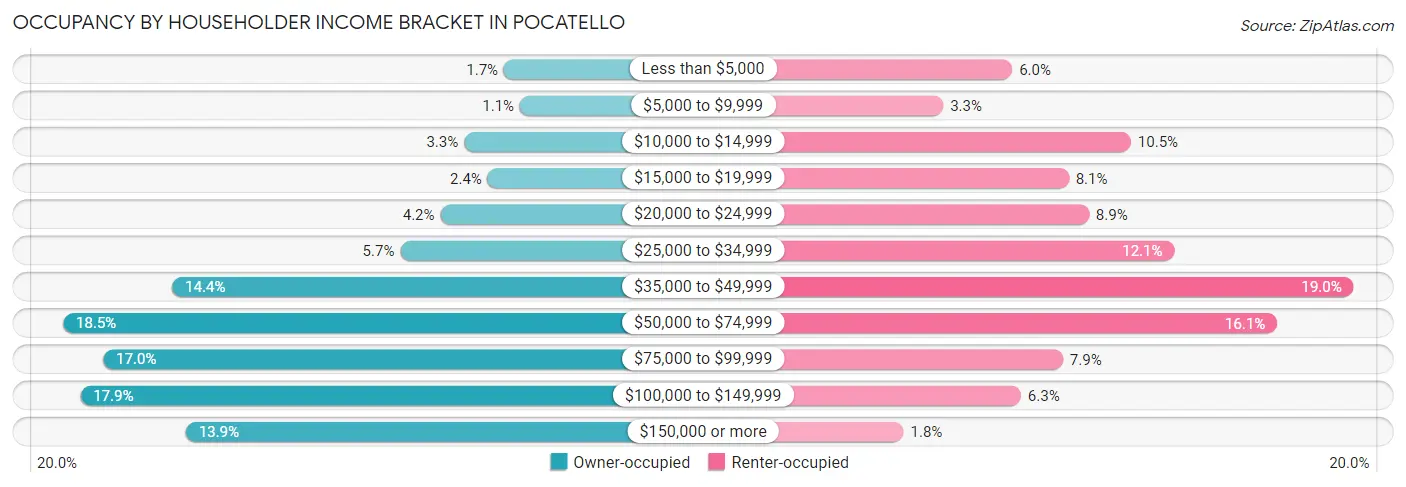
| Income Bracket | Owner-occupied | Renter-occupied |
| Less than $5,000 | 239 (1.7%) | 471 (6.0%) |
| $5,000 to $9,999 | 155 (1.1%) | 263 (3.3%) |
| $10,000 to $14,999 | 449 (3.3%) | 827 (10.5%) |
| $15,000 to $19,999 | 325 (2.4%) | 640 (8.1%) |
| $20,000 to $24,999 | 573 (4.2%) | 701 (8.9%) |
| $25,000 to $34,999 | 783 (5.7%) | 957 (12.1%) |
| $35,000 to $49,999 | 1,981 (14.4%) | 1,496 (19.0%) |
| $50,000 to $74,999 | 2,553 (18.5%) | 1,266 (16.1%) |
| $75,000 to $99,999 | 2,342 (17.0%) | 623 (7.9%) |
| $100,000 to $149,999 | 2,463 (17.9%) | 497 (6.3%) |
| $150,000 or more | 1,909 (13.9%) | 144 (1.8%) |
| Total | 13,772 (100.0%) | 7,885 (100.0%) |
Monthly Housing Cost Tiers in Pocatello
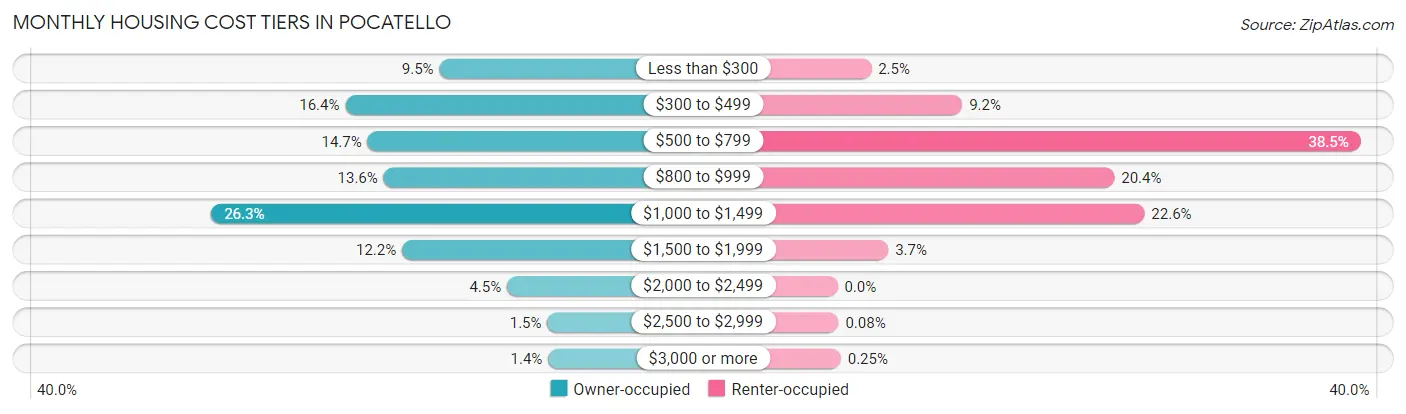
| Monthly Cost | Owner-occupied | Renter-occupied |
| Less than $300 | 1,302 (9.5%) | 196 (2.5%) |
| $300 to $499 | 2,256 (16.4%) | 725 (9.2%) |
| $500 to $799 | 2,030 (14.7%) | 3,038 (38.5%) |
| $800 to $999 | 1,868 (13.6%) | 1,608 (20.4%) |
| $1,000 to $1,499 | 3,615 (26.3%) | 1,783 (22.6%) |
| $1,500 to $1,999 | 1,680 (12.2%) | 295 (3.7%) |
| $2,000 to $2,499 | 616 (4.5%) | 0 (0.0%) |
| $2,500 to $2,999 | 206 (1.5%) | 6 (0.1%) |
| $3,000 or more | 199 (1.4%) | 20 (0.3%) |
| Total | 13,772 (100.0%) | 7,885 (100.0%) |
Physical Housing Characteristics in Pocatello
Housing Structures in Pocatello
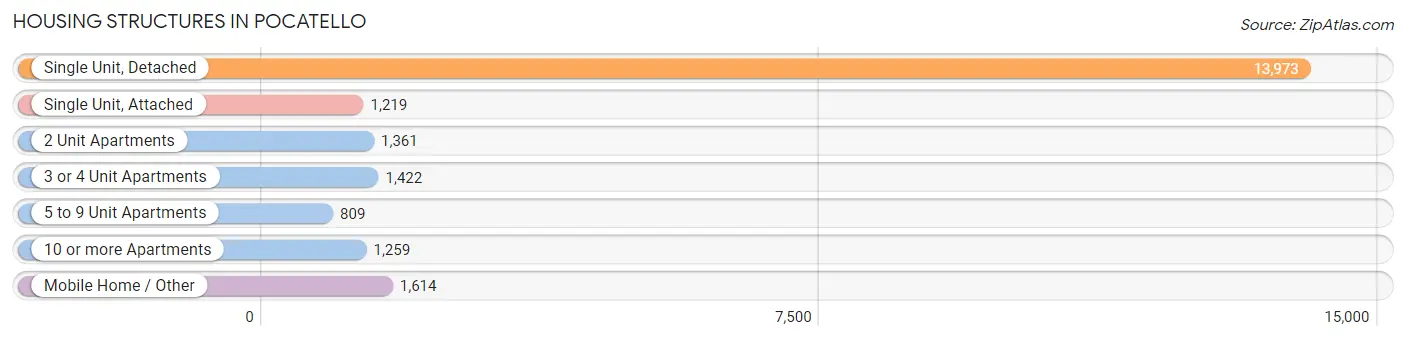
| Structure Type | # Housing Units | % Housing Units |
| Single Unit, Detached | 13,973 | 64.5% |
| Single Unit, Attached | 1,219 | 5.6% |
| 2 Unit Apartments | 1,361 | 6.3% |
| 3 or 4 Unit Apartments | 1,422 | 6.6% |
| 5 to 9 Unit Apartments | 809 | 3.7% |
| 10 or more Apartments | 1,259 | 5.8% |
| Mobile Home / Other | 1,614 | 7.4% |
| Total | 21,657 | 100.0% |
Housing Structures by Occupancy in Pocatello
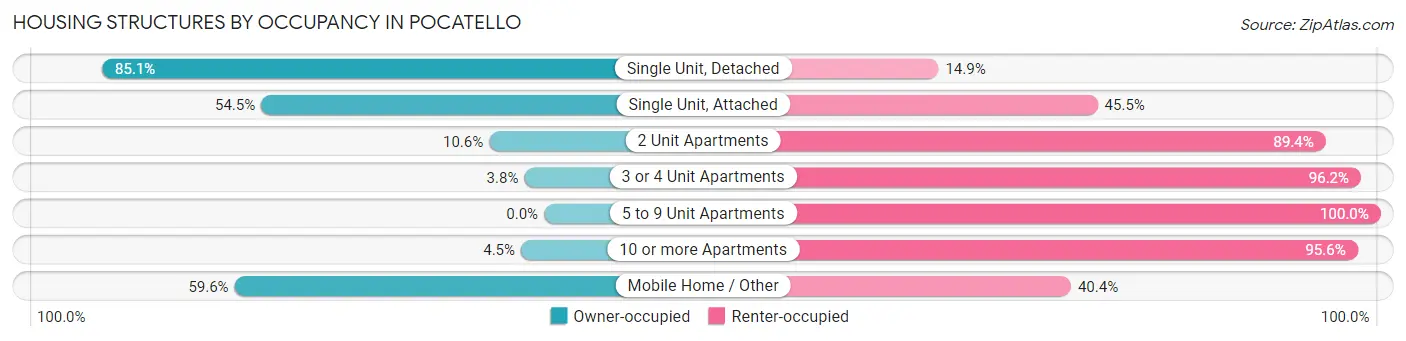
| Structure Type | Owner-occupied | Renter-occupied |
| Single Unit, Detached | 11,892 (85.1%) | 2,081 (14.9%) |
| Single Unit, Attached | 664 (54.5%) | 555 (45.5%) |
| 2 Unit Apartments | 144 (10.6%) | 1,217 (89.4%) |
| 3 or 4 Unit Apartments | 54 (3.8%) | 1,368 (96.2%) |
| 5 to 9 Unit Apartments | 0 (0.0%) | 809 (100.0%) |
| 10 or more Apartments | 56 (4.4%) | 1,203 (95.6%) |
| Mobile Home / Other | 962 (59.6%) | 652 (40.4%) |
| Total | 13,772 (63.6%) | 7,885 (36.4%) |
Housing Structures by Number of Rooms in Pocatello
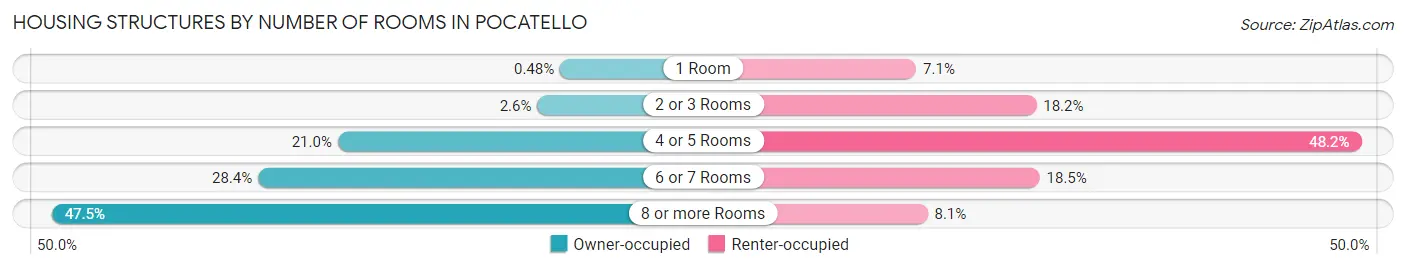
| Number of Rooms | Owner-occupied | Renter-occupied |
| 1 Room | 66 (0.5%) | 556 (7.0%) |
| 2 or 3 Rooms | 355 (2.6%) | 1,432 (18.2%) |
| 4 or 5 Rooms | 2,897 (21.0%) | 3,802 (48.2%) |
| 6 or 7 Rooms | 3,913 (28.4%) | 1,456 (18.5%) |
| 8 or more Rooms | 6,541 (47.5%) | 639 (8.1%) |
| Total | 13,772 (100.0%) | 7,885 (100.0%) |
Housing Structure by Heating Type in Pocatello
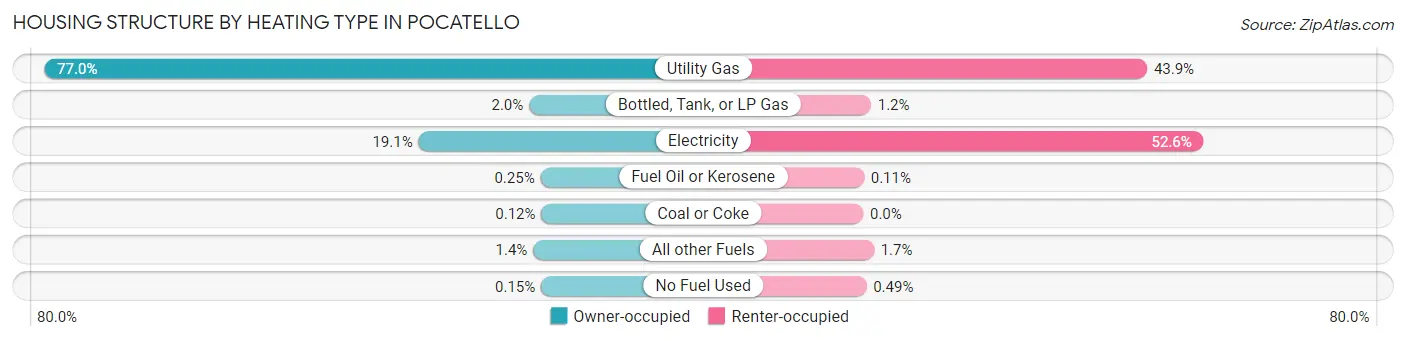
| Heating Type | Owner-occupied | Renter-occupied |
| Utility Gas | 10,602 (77.0%) | 3,461 (43.9%) |
| Bottled, Tank, or LP Gas | 277 (2.0%) | 95 (1.2%) |
| Electricity | 2,632 (19.1%) | 4,151 (52.6%) |
| Fuel Oil or Kerosene | 34 (0.3%) | 9 (0.1%) |
| Coal or Coke | 16 (0.1%) | 0 (0.0%) |
| All other Fuels | 190 (1.4%) | 130 (1.7%) |
| No Fuel Used | 21 (0.2%) | 39 (0.5%) |
| Total | 13,772 (100.0%) | 7,885 (100.0%) |
Household Vehicle Usage in Pocatello
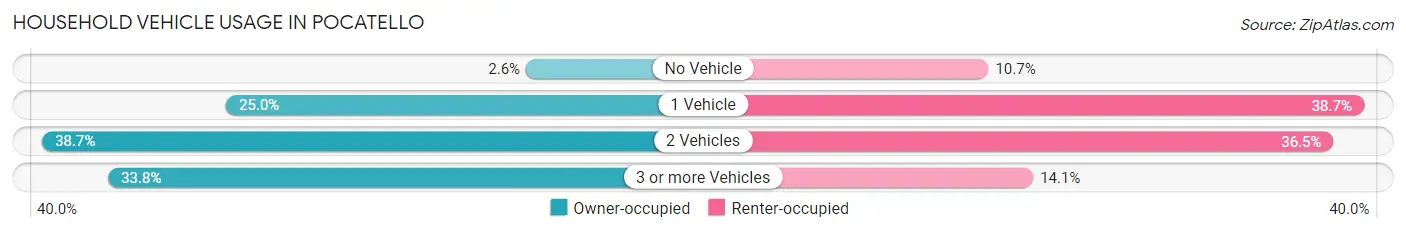
| Vehicles per Household | Owner-occupied | Renter-occupied |
| No Vehicle | 353 (2.6%) | 845 (10.7%) |
| 1 Vehicle | 3,438 (25.0%) | 3,055 (38.7%) |
| 2 Vehicles | 5,330 (38.7%) | 2,876 (36.5%) |
| 3 or more Vehicles | 4,651 (33.8%) | 1,109 (14.1%) |
| Total | 13,772 (100.0%) | 7,885 (100.0%) |
Real Estate & Mortgages in Pocatello
Real Estate and Mortgage Overview in Pocatello
| Characteristic | Without Mortgage | With Mortgage |
| Housing Units | 5,214 | 8,558 |
| Median Property Value | $185,600 | $221,200 |
| Median Household Income | $51,925 | $1,462 |
| Monthly Housing Costs | $425 | $199 |
| Real Estate Taxes | $1,594 | $173 |
Property Value by Mortgage Status in Pocatello
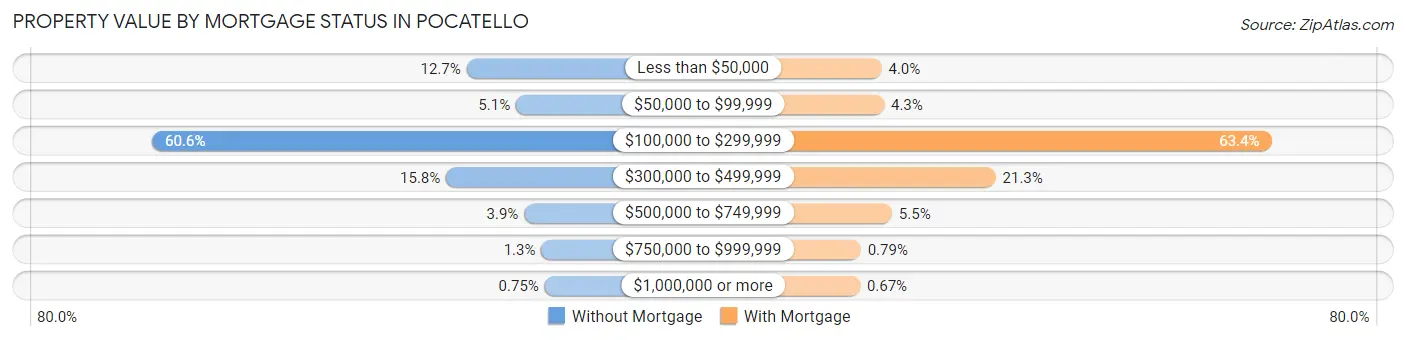
| Property Value | Without Mortgage | With Mortgage |
| Less than $50,000 | 660 (12.7%) | 339 (4.0%) |
| $50,000 to $99,999 | 267 (5.1%) | 371 (4.3%) |
| $100,000 to $299,999 | 3,158 (60.6%) | 5,423 (63.4%) |
| $300,000 to $499,999 | 822 (15.8%) | 1,826 (21.3%) |
| $500,000 to $749,999 | 202 (3.9%) | 474 (5.5%) |
| $750,000 to $999,999 | 66 (1.3%) | 68 (0.8%) |
| $1,000,000 or more | 39 (0.7%) | 57 (0.7%) |
| Total | 5,214 (100.0%) | 8,558 (100.0%) |
Household Income by Mortgage Status in Pocatello
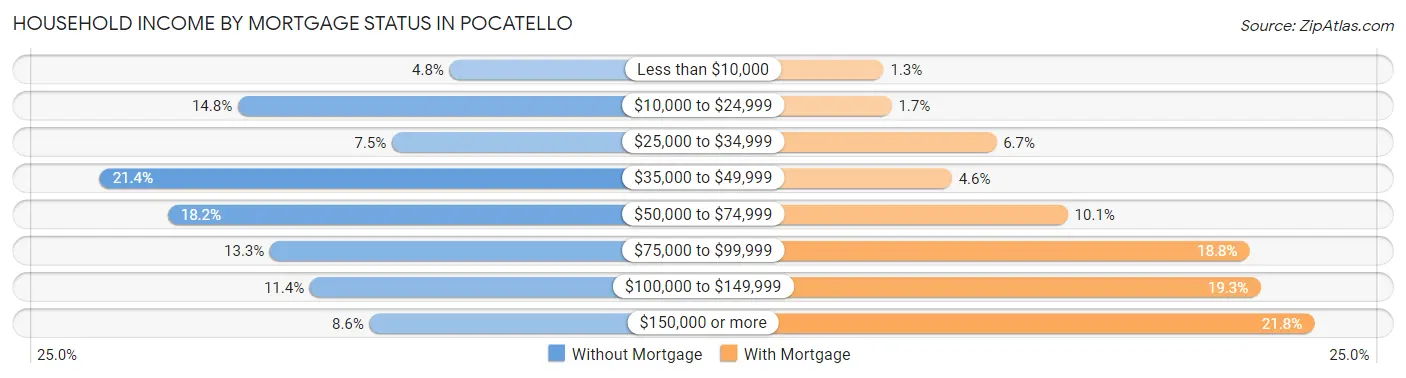
| Household Income | Without Mortgage | With Mortgage |
| Less than $10,000 | 248 (4.8%) | 114 (1.3%) |
| $10,000 to $24,999 | 774 (14.8%) | 146 (1.7%) |
| $25,000 to $34,999 | 391 (7.5%) | 573 (6.7%) |
| $35,000 to $49,999 | 1,117 (21.4%) | 392 (4.6%) |
| $50,000 to $74,999 | 948 (18.2%) | 864 (10.1%) |
| $75,000 to $99,999 | 694 (13.3%) | 1,605 (18.8%) |
| $100,000 to $149,999 | 595 (11.4%) | 1,648 (19.3%) |
| $150,000 or more | 447 (8.6%) | 1,868 (21.8%) |
| Total | 5,214 (100.0%) | 8,558 (100.0%) |
Property Value to Household Income Ratio in Pocatello
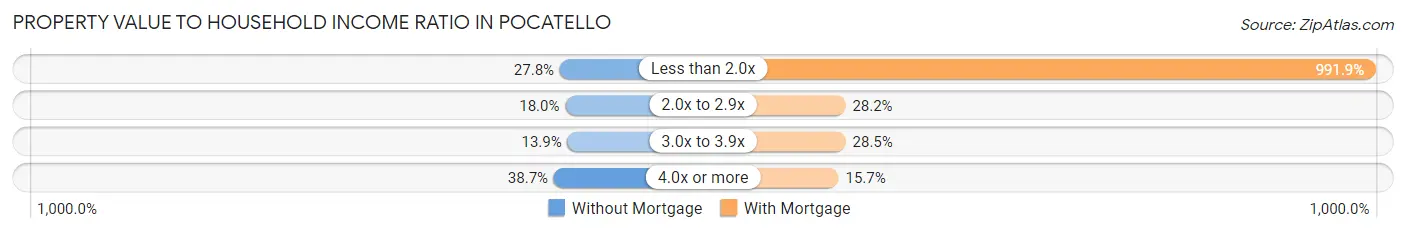
| Value-to-Income Ratio | Without Mortgage | With Mortgage |
| Less than 2.0x | 1,451 (27.8%) | 84,887 (991.9%) |
| 2.0x to 2.9x | 939 (18.0%) | 2,411 (28.2%) |
| 3.0x to 3.9x | 725 (13.9%) | 2,438 (28.5%) |
| 4.0x or more | 2,020 (38.7%) | 1,346 (15.7%) |
| Total | 5,214 (100.0%) | 8,558 (100.0%) |
Real Estate Taxes by Mortgage Status in Pocatello
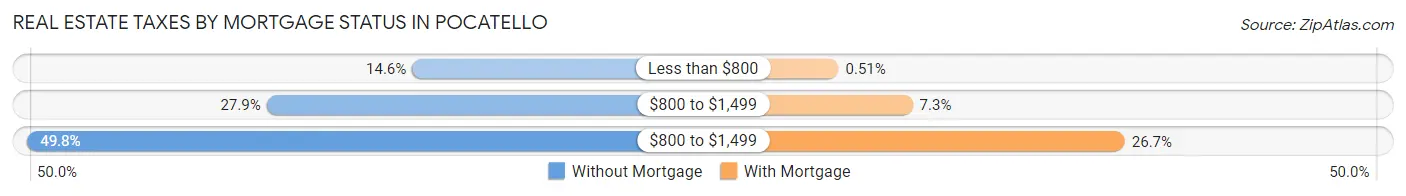
| Property Taxes | Without Mortgage | With Mortgage |
| Less than $800 | 762 (14.6%) | 44 (0.5%) |
| $800 to $1,499 | 1,455 (27.9%) | 622 (7.3%) |
| $800 to $1,499 | 2,594 (49.7%) | 2,281 (26.7%) |
| Total | 5,214 (100.0%) | 8,558 (100.0%) |
Health & Disability in Pocatello
Health Insurance Coverage by Age in Pocatello
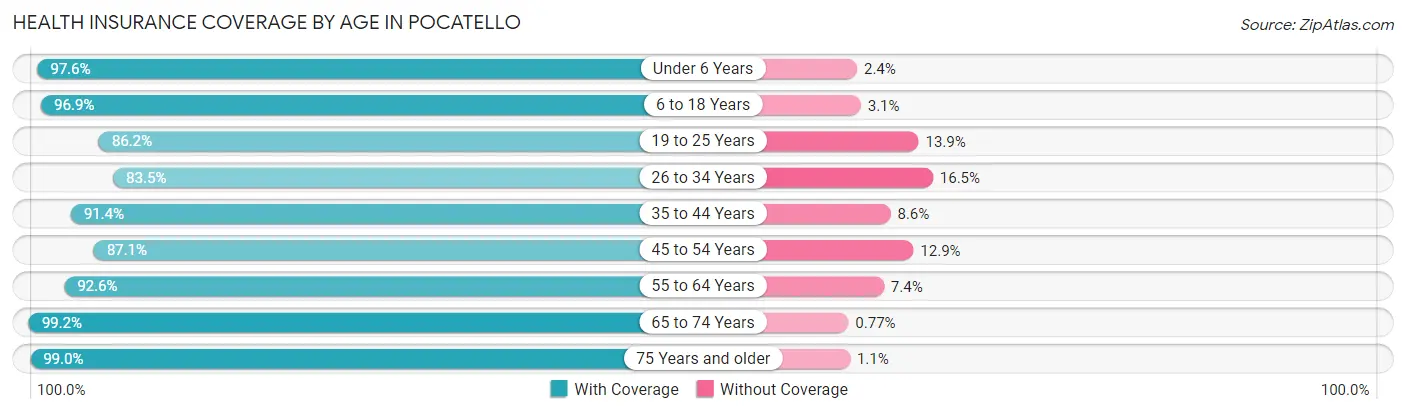
| Age Bracket | With Coverage | Without Coverage |
| Under 6 Years | 4,393 (97.6%) | 107 (2.4%) |
| 6 to 18 Years | 10,450 (96.9%) | 332 (3.1%) |
| 19 to 25 Years | 5,914 (86.2%) | 951 (13.9%) |
| 26 to 34 Years | 6,429 (83.5%) | 1,272 (16.5%) |
| 35 to 44 Years | 6,879 (91.4%) | 649 (8.6%) |
| 45 to 54 Years | 4,758 (87.1%) | 704 (12.9%) |
| 55 to 64 Years | 5,175 (92.6%) | 413 (7.4%) |
| 65 to 74 Years | 4,661 (99.2%) | 36 (0.8%) |
| 75 Years and older | 2,647 (99.0%) | 28 (1.1%) |
| Total | 51,306 (91.9%) | 4,492 (8.1%) |
Health Insurance Coverage by Citizenship Status in Pocatello
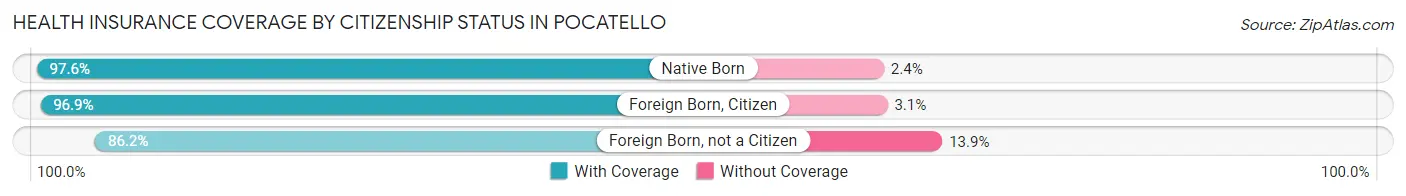
| Citizenship Status | With Coverage | Without Coverage |
| Native Born | 4,393 (97.6%) | 107 (2.4%) |
| Foreign Born, Citizen | 10,450 (96.9%) | 332 (3.1%) |
| Foreign Born, not a Citizen | 5,914 (86.2%) | 951 (13.9%) |
Health Insurance Coverage by Household Income in Pocatello
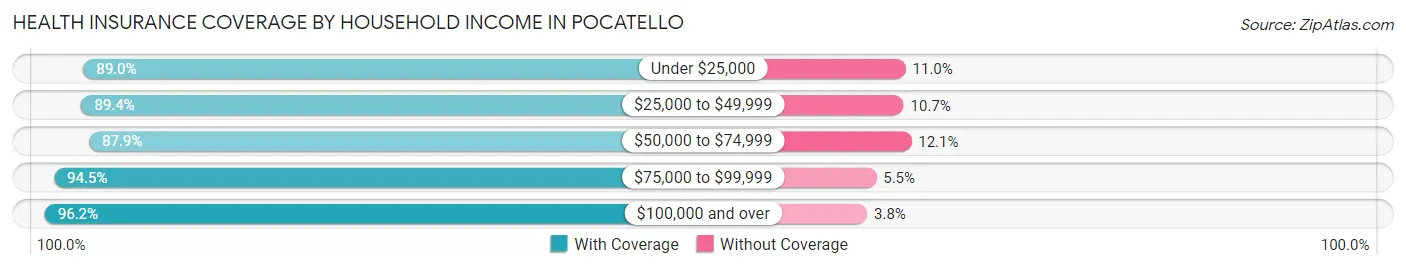
| Household Income | With Coverage | Without Coverage |
| Under $25,000 | 6,730 (89.0%) | 833 (11.0%) |
| $25,000 to $49,999 | 9,711 (89.3%) | 1,157 (10.6%) |
| $50,000 to $74,999 | 8,563 (87.9%) | 1,177 (12.1%) |
| $75,000 to $99,999 | 8,589 (94.5%) | 502 (5.5%) |
| $100,000 and over | 15,737 (96.2%) | 622 (3.8%) |
Public vs Private Health Insurance Coverage by Age in Pocatello
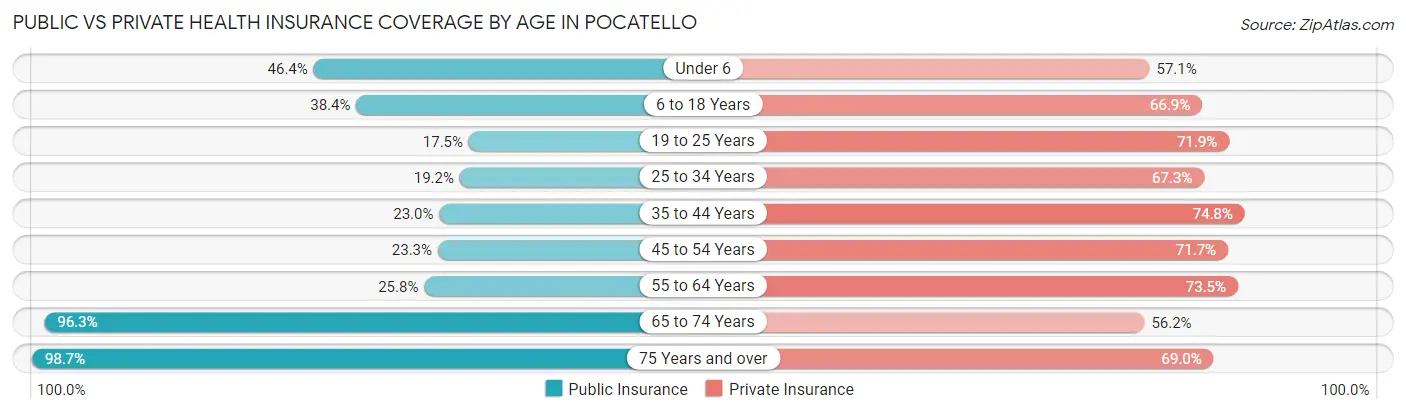
| Age Bracket | Public Insurance | Private Insurance |
| Under 6 | 2,086 (46.4%) | 2,571 (57.1%) |
| 6 to 18 Years | 4,143 (38.4%) | 7,210 (66.9%) |
| 19 to 25 Years | 1,204 (17.5%) | 4,936 (71.9%) |
| 25 to 34 Years | 1,480 (19.2%) | 5,179 (67.2%) |
| 35 to 44 Years | 1,734 (23.0%) | 5,632 (74.8%) |
| 45 to 54 Years | 1,272 (23.3%) | 3,914 (71.7%) |
| 55 to 64 Years | 1,443 (25.8%) | 4,108 (73.5%) |
| 65 to 74 Years | 4,525 (96.3%) | 2,639 (56.2%) |
| 75 Years and over | 2,639 (98.7%) | 1,846 (69.0%) |
| Total | 20,526 (36.8%) | 38,035 (68.2%) |
Disability Status by Sex by Age in Pocatello
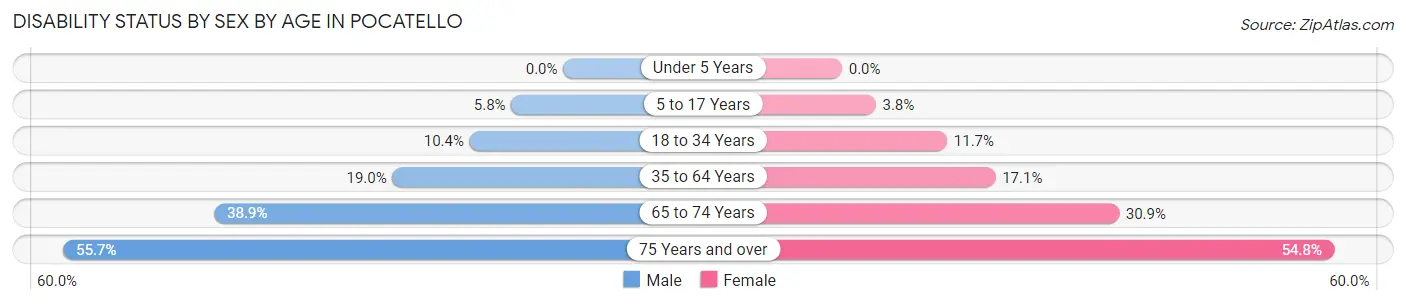
| Age Bracket | Male | Female |
| Under 5 Years | 0 (0.0%) | 0 (0.0%) |
| 5 to 17 Years | 310 (5.8%) | 186 (3.8%) |
| 18 to 34 Years | 836 (10.4%) | 913 (11.7%) |
| 35 to 64 Years | 1,785 (19.0%) | 1,571 (17.1%) |
| 65 to 74 Years | 972 (38.9%) | 678 (30.8%) |
| 75 Years and over | 576 (55.7%) | 899 (54.8%) |
Disability Class by Sex by Age in Pocatello
Disability Class: Hearing Difficulty
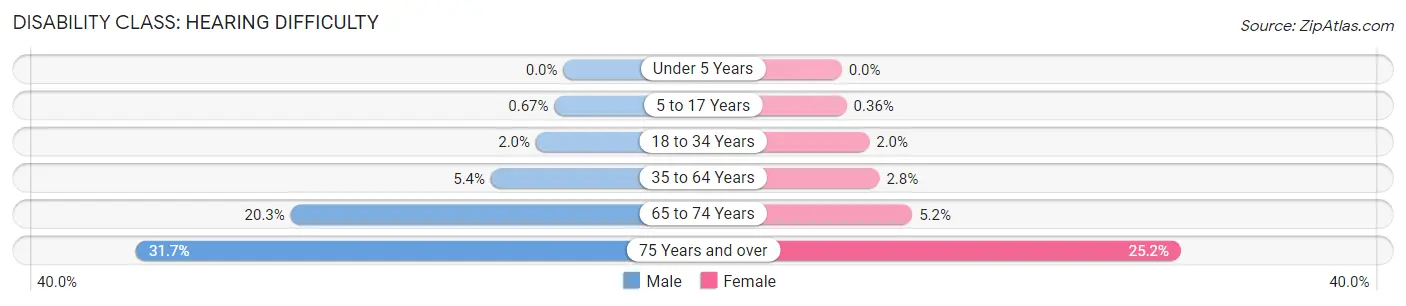
| Age Bracket | Male | Female |
| Under 5 Years | 0 (0.0%) | 0 (0.0%) |
| 5 to 17 Years | 36 (0.7%) | 18 (0.4%) |
| 18 to 34 Years | 164 (2.0%) | 159 (2.0%) |
| 35 to 64 Years | 505 (5.4%) | 257 (2.8%) |
| 65 to 74 Years | 506 (20.3%) | 115 (5.2%) |
| 75 Years and over | 328 (31.7%) | 413 (25.2%) |
Disability Class: Vision Difficulty
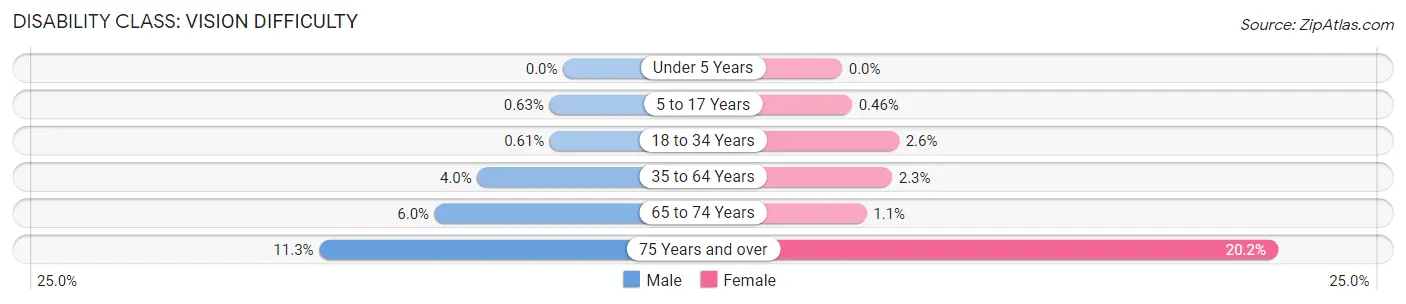
| Age Bracket | Male | Female |
| Under 5 Years | 0 (0.0%) | 0 (0.0%) |
| 5 to 17 Years | 34 (0.6%) | 23 (0.5%) |
| 18 to 34 Years | 49 (0.6%) | 206 (2.6%) |
| 35 to 64 Years | 374 (4.0%) | 213 (2.3%) |
| 65 to 74 Years | 149 (6.0%) | 25 (1.1%) |
| 75 Years and over | 117 (11.3%) | 332 (20.2%) |
Disability Class: Cognitive Difficulty
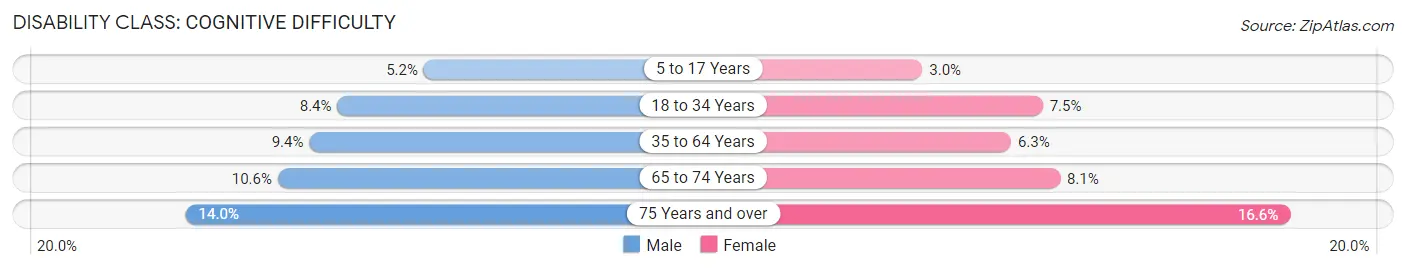
| Age Bracket | Male | Female |
| 5 to 17 Years | 278 (5.2%) | 148 (3.0%) |
| 18 to 34 Years | 673 (8.4%) | 582 (7.5%) |
| 35 to 64 Years | 885 (9.4%) | 577 (6.3%) |
| 65 to 74 Years | 265 (10.6%) | 178 (8.1%) |
| 75 Years and over | 145 (14.0%) | 273 (16.6%) |
Disability Class: Ambulatory Difficulty
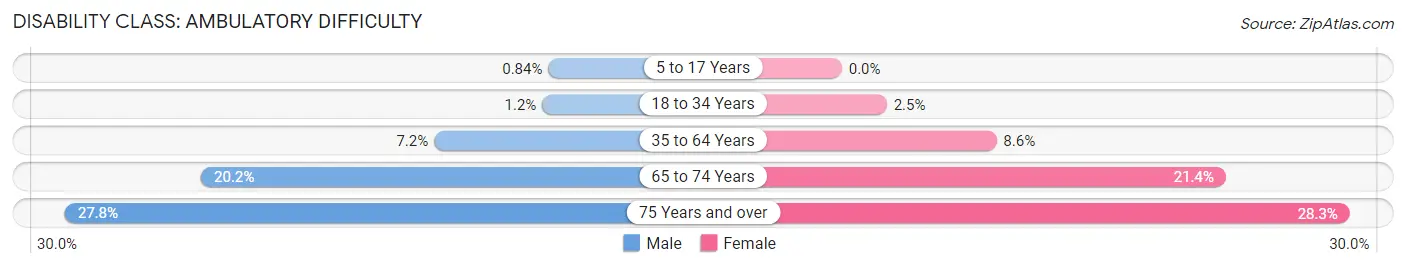
| Age Bracket | Male | Female |
| 5 to 17 Years | 45 (0.8%) | 0 (0.0%) |
| 18 to 34 Years | 95 (1.2%) | 195 (2.5%) |
| 35 to 64 Years | 676 (7.2%) | 791 (8.6%) |
| 65 to 74 Years | 504 (20.2%) | 470 (21.4%) |
| 75 Years and over | 287 (27.8%) | 464 (28.3%) |
Disability Class: Self-Care Difficulty
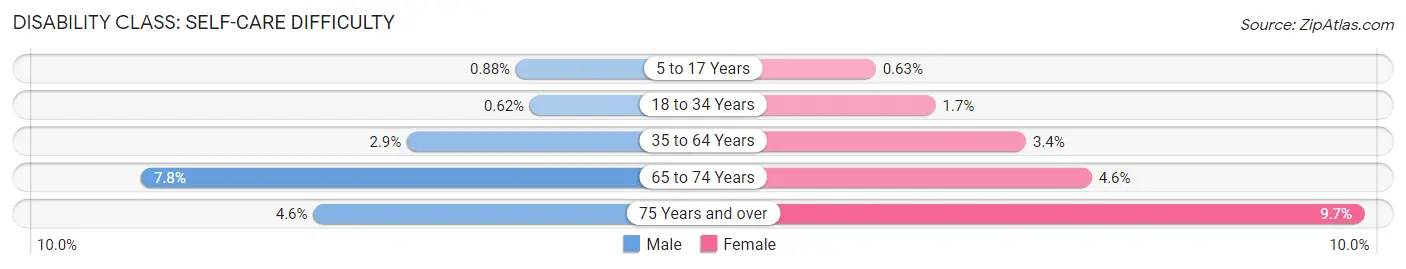
| Age Bracket | Male | Female |
| 5 to 17 Years | 47 (0.9%) | 31 (0.6%) |
| 18 to 34 Years | 50 (0.6%) | 136 (1.7%) |
| 35 to 64 Years | 272 (2.9%) | 314 (3.4%) |
| 65 to 74 Years | 196 (7.8%) | 102 (4.6%) |
| 75 Years and over | 48 (4.6%) | 159 (9.7%) |
Technology Access in Pocatello
Computing Device Access in Pocatello
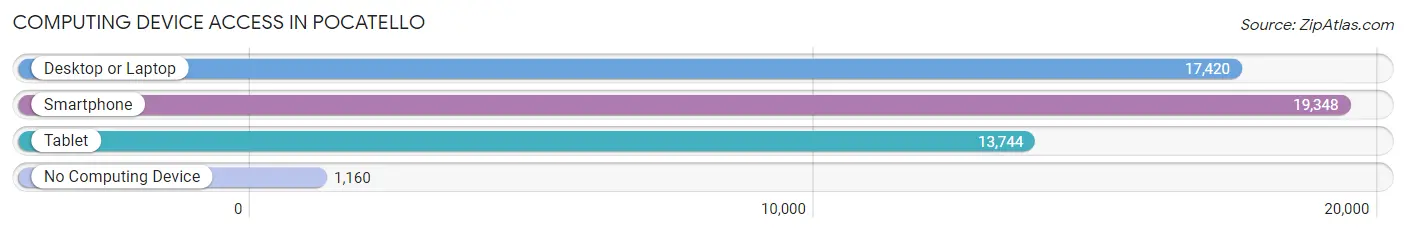
| Device Type | # Households | % Households |
| Desktop or Laptop | 17,420 | 80.4% |
| Smartphone | 19,348 | 89.3% |
| Tablet | 13,744 | 63.5% |
| No Computing Device | 1,160 | 5.4% |
| Total | 21,657 | 100.0% |
Internet Access in Pocatello
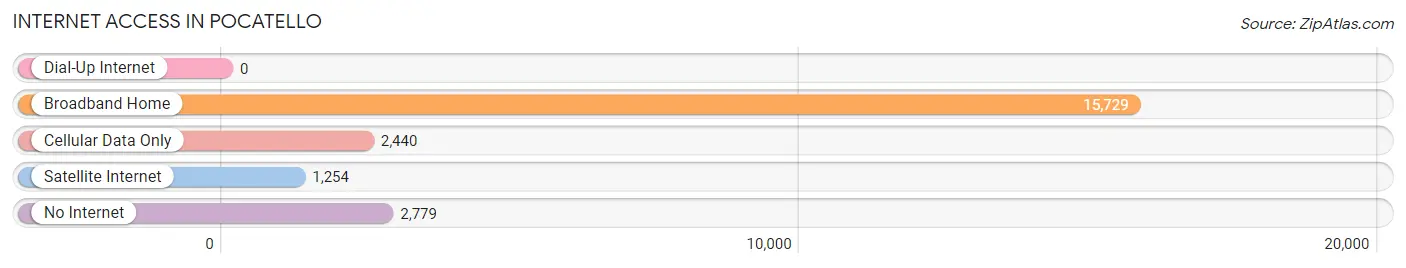
| Internet Type | # Households | % Households |
| Dial-Up Internet | 0 | 0.0% |
| Broadband Home | 15,729 | 72.6% |
| Cellular Data Only | 2,440 | 11.3% |
| Satellite Internet | 1,254 | 5.8% |
| No Internet | 2,779 | 12.8% |
| Total | 21,657 | 100.0% |
Pocatello Summary
Pocatello is a city located in southeastern Idaho, United States. It is the county seat of Bannock County and the principal city of the Pocatello metropolitan area, which encompasses all of Bannock County. The population of Pocatello was 54,255 as of the 2010 census, making it the fifth-largest city in the state.
History
Pocatello was first settled in the early 1860s by a group of Mormon pioneers led by Thomas E. Ricks. The city was named after Chief Pocatello, a Shoshone leader who had signed a treaty with the United States in 1868. The city was incorporated in 1882 and became the county seat of Bannock County in 1893.
Pocatello experienced rapid growth in the late 19th and early 20th centuries, due in part to the construction of the Oregon Short Line Railroad in 1883. The railroad connected the city to the transcontinental railroad network, allowing for the shipment of goods and services to and from the city. The city also became a major hub for the Union Pacific Railroad, which operated a large rail yard in the city.
Geography
Pocatello is located in southeastern Idaho, in the Portneuf River Valley. The city is situated at an elevation of 4,462 feet (1,360 m) above sea level. The city is surrounded by the Caribou-Targhee National Forest to the east and the Portneuf Range to the west.
The city covers an area of 24.3 square miles (62.9 km2), of which 24.2 square miles (62.6 km2) is land and 0.1 square miles (0.3 km2) is water.
Economy
Pocatello is the economic and cultural center of southeastern Idaho. The city is home to a variety of industries, including manufacturing, healthcare, education, and retail.
The city is home to several major employers, including Idaho State University, Simplot, J.R. Simplot Company, and the Idaho National Laboratory. The city is also home to several smaller businesses, including a variety of restaurants, shops, and other services.
Demographics
As of the 2010 census, there were 54,255 people, 20,832 households, and 12,848 families residing in the city. The population density was 2,241.3 people per square mile (865.7/km2). There were 22,404 housing units at an average density of 919.2 per square mile (354.3/km2). The racial makeup of the city was 90.2% White, 0.7% African American, 1.3% Native American, 1.2% Asian, 0.2% Pacific Islander, 4.0% from other races, and 2.5% from two or more races. Hispanic or Latino of any race were 8.9% of the population.
There were 20,832 households, out of which 28.2% had children under the age of 18 living with them, 44.2% were married couples living together, 11.7% had a female householder with no husband present, and 39.3% were non-families. 32.2% of all households were made up of individuals, and 11.5% had someone living alone who was 65 years of age or older. The average household size was 2.37 and the average family size was 3.02.
In the city, the population was spread out, with 22.9% under the age of 18, 19.2% from 18 to 24, 24.6% from 25 to 44, 20.3% from 45 to 64, and 13.0% who were 65 years of age or older. The median age was 30.7 years. For every 100 females, there were 95.2 males. For every 100 females age 18 and over, there were 92.5 males.
The median income for a household in the city was $35,856, and the median income for a family was $45,919. Males had a median income of $35,919 versus $25,836 for females. The per capita income for the city was $18,845. About 11.2% of families and 16.2% of the population were below the poverty line, including 20.2% of those under age 18 and 8.2% of those age 65 or over.
Common Questions
What is Per Capita Income in Pocatello?
Per Capita income in Pocatello is $28,922.
What is the Median Family Income in Pocatello?
Median Family Income in Pocatello is $76,299.
What is the Median Household income in Pocatello?
Median Household Income in Pocatello is $56,115.
What is Income or Wage Gap in Pocatello?
Income or Wage Gap in Pocatello is 34.4%.
Women in Pocatello earn 65.6 cents for every dollar earned by a man.
What is Family Income Deficit in Pocatello?
Family Income Deficit in Pocatello is $11,209.
Families that are below poverty line in Pocatello earn $11,209 less on average than the poverty threshold level.
What is Inequality or Gini Index in Pocatello?
Inequality or Gini Index in Pocatello is 0.44.
What is the Total Population of Pocatello?
Total Population of Pocatello is 56,582.
What is the Total Male Population of Pocatello?
Total Male Population of Pocatello is 28,663.
What is the Total Female Population of Pocatello?
Total Female Population of Pocatello is 27,919.
What is the Ratio of Males per 100 Females in Pocatello?
There are 102.66 Males per 100 Females in Pocatello.
What is the Ratio of Females per 100 Males in Pocatello?
There are 97.40 Females per 100 Males in Pocatello.
What is the Median Population Age in Pocatello?
Median Population Age in Pocatello is 32.9 Years.
What is the Average Family Size in Pocatello
Average Family Size in Pocatello is 3.3 People.
What is the Average Household Size in Pocatello
Average Household Size in Pocatello is 2.5 People.
How Large is the Labor Force in Pocatello?
There are 27,415 People in the Labor Forcein in Pocatello.
What is the Percentage of People in the Labor Force in Pocatello?
62.3% of People are in the Labor Force in Pocatello.
What is the Unemployment Rate in Pocatello?
Unemployment Rate in Pocatello is 5.4%.