Paul, ID Map & Demographics
Paul Map
Paul Overview
$27,568
PER CAPITA INCOME
$64,338
AVG FAMILY INCOME
$59,853
AVG HOUSEHOLD INCOME
57.9%
WAGE / INCOME GAP [ % ]
42.1¢/ $1
WAGE / INCOME GAP [ $ ]
0.36
INEQUALITY / GINI INDEX
1,334
TOTAL POPULATION
629
MALE POPULATION
705
FEMALE POPULATION
89.22
MALES / 100 FEMALES
112.08
FEMALES / 100 MALES
41.8
MEDIAN AGE
3.1
AVG FAMILY SIZE
2.5
AVG HOUSEHOLD SIZE
638
LABOR FORCE [ PEOPLE ]
62.6%
PERCENT IN LABOR FORCE
1.6%
UNEMPLOYMENT RATE
Paul Zip Codes
Paul Area Codes
Income in Paul
Income Overview in Paul
Per Capita Income in Paul is $27,568, while median incomes of families and households are $64,338 and $59,853 respectively.
| Characteristic | Number | Measure |
| Per Capita Income | 1,334 | $27,568 |
| Median Family Income | 327 | $64,338 |
| Mean Family Income | 327 | $75,623 |
| Median Household Income | 528 | $59,853 |
| Mean Household Income | 528 | $62,943 |
| Income Deficit | 327 | $0 |
| Wage / Income Gap (%) | 1,334 | 57.88% |
| Wage / Income Gap ($) | 1,334 | 42.12¢ per $1 |
| Gini / Inequality Index | 1,334 | 0.36 |
Earnings by Sex in Paul
Average Earnings in Paul are $34,375, $49,323 for men and $20,776 for women, a difference of 57.9%.
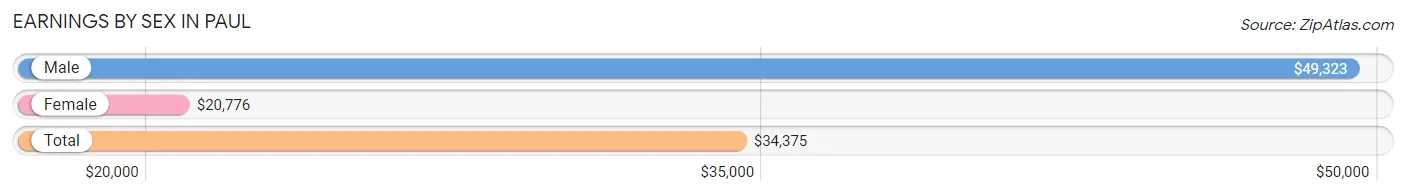
| Sex | Number | Average Earnings |
| Male | 416 (57.3%) | $49,323 |
| Female | 310 (42.7%) | $20,776 |
| Total | 726 (100.0%) | $34,375 |
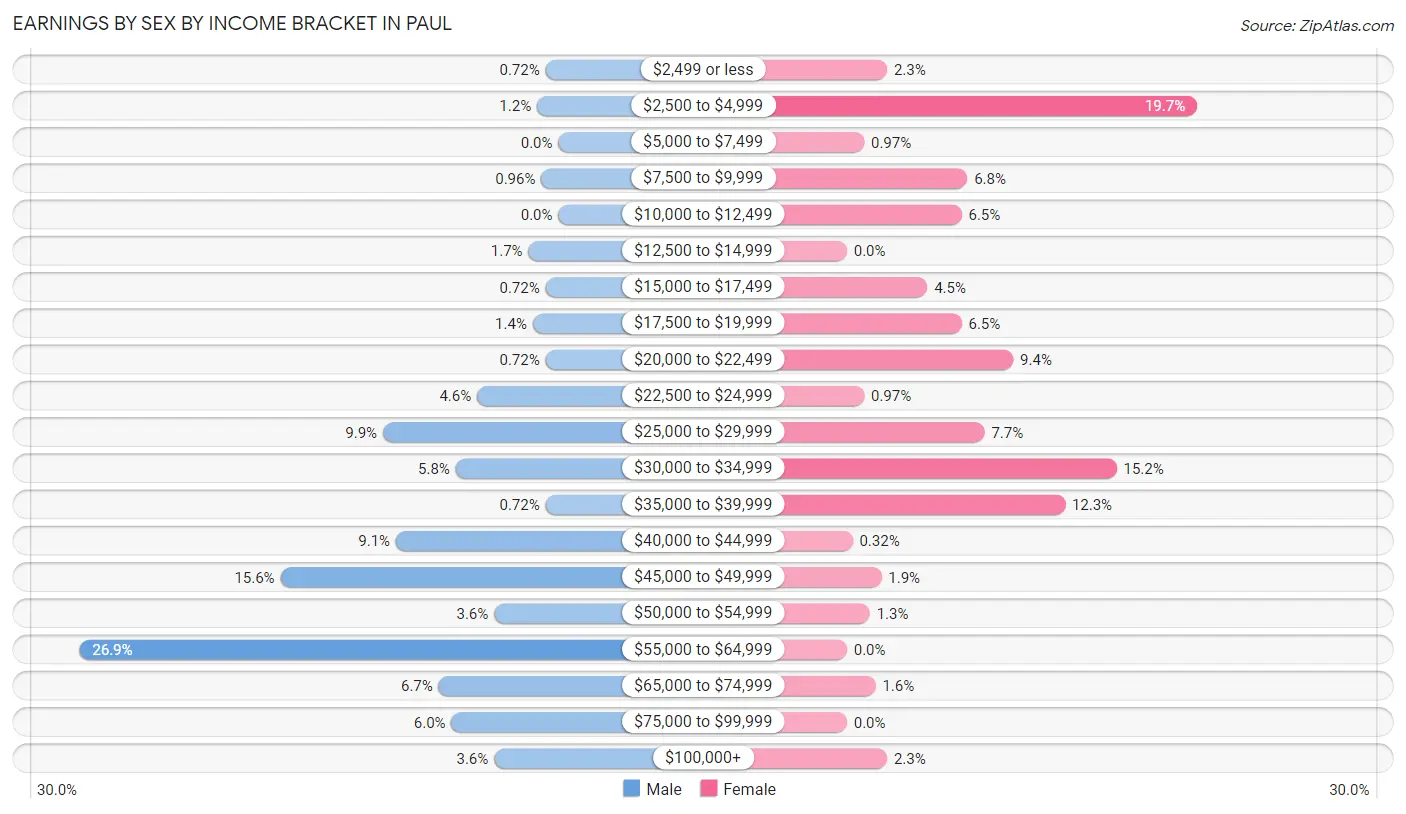
Earnings by Sex by Income Bracket in Paul
The most common earnings brackets in Paul are $55,000 to $64,999 for men (112 | 26.9%) and $2,500 to $4,999 for women (61 | 19.7%).
| Income | Male | Female |
| $2,499 or less | 3 (0.7%) | 7 (2.3%) |
| $2,500 to $4,999 | 5 (1.2%) | 61 (19.7%) |
| $5,000 to $7,499 | 0 (0.0%) | 3 (1.0%) |
| $7,500 to $9,999 | 4 (1.0%) | 21 (6.8%) |
| $10,000 to $12,499 | 0 (0.0%) | 20 (6.5%) |
| $12,500 to $14,999 | 7 (1.7%) | 0 (0.0%) |
| $15,000 to $17,499 | 3 (0.7%) | 14 (4.5%) |
| $17,500 to $19,999 | 6 (1.4%) | 20 (6.5%) |
| $20,000 to $22,499 | 3 (0.7%) | 29 (9.3%) |
| $22,500 to $24,999 | 19 (4.6%) | 3 (1.0%) |
| $25,000 to $29,999 | 41 (9.9%) | 24 (7.7%) |
| $30,000 to $34,999 | 24 (5.8%) | 47 (15.2%) |
| $35,000 to $39,999 | 3 (0.7%) | 38 (12.3%) |
| $40,000 to $44,999 | 38 (9.1%) | 1 (0.3%) |
| $45,000 to $49,999 | 65 (15.6%) | 6 (1.9%) |
| $50,000 to $54,999 | 15 (3.6%) | 4 (1.3%) |
| $55,000 to $64,999 | 112 (26.9%) | 0 (0.0%) |
| $65,000 to $74,999 | 28 (6.7%) | 5 (1.6%) |
| $75,000 to $99,999 | 25 (6.0%) | 0 (0.0%) |
| $100,000+ | 15 (3.6%) | 7 (2.3%) |
| Total | 416 (100.0%) | 310 (100.0%) |
Earnings by Sex by Educational Attainment in Paul
Average earnings in Paul are $48,816 for men and $27,969 for women, a difference of 42.7%. Men with an educational attainment of college or associate's degree enjoy the highest average annual earnings of $50,667, while those with less than high school education earn the least with $43,333. Women with an educational attainment of college or associate's degree earn the most with the average annual earnings of $31,011, while those with less than high school education have the smallest earnings of $18,672.
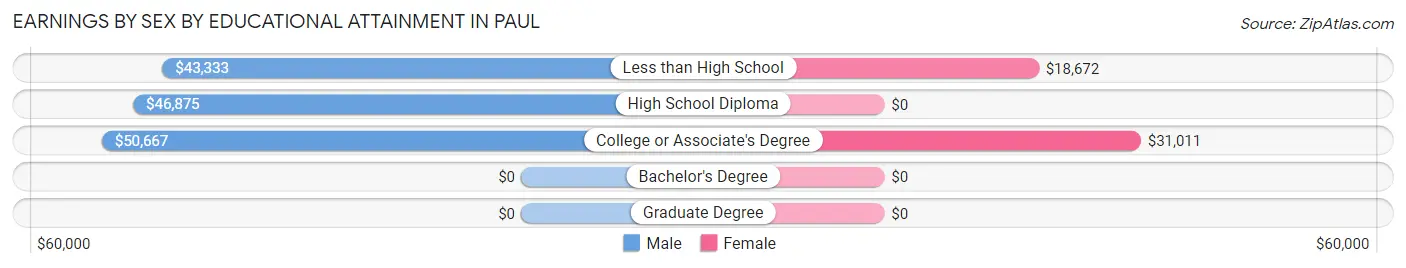
| Educational Attainment | Male Income | Female Income |
| Less than High School | $43,333 | $18,672 |
| High School Diploma | $46,875 | $0 |
| College or Associate's Degree | $50,667 | $31,011 |
| Bachelor's Degree | - | - |
| Graduate Degree | - | - |
| Total | $48,816 | $27,969 |
Family Income in Paul
Family Income Brackets in Paul
According to the Paul family income data, there are 102 families falling into the $50,000 to $74,999 income range, which is the most common income bracket and makes up 31.2% of all families.
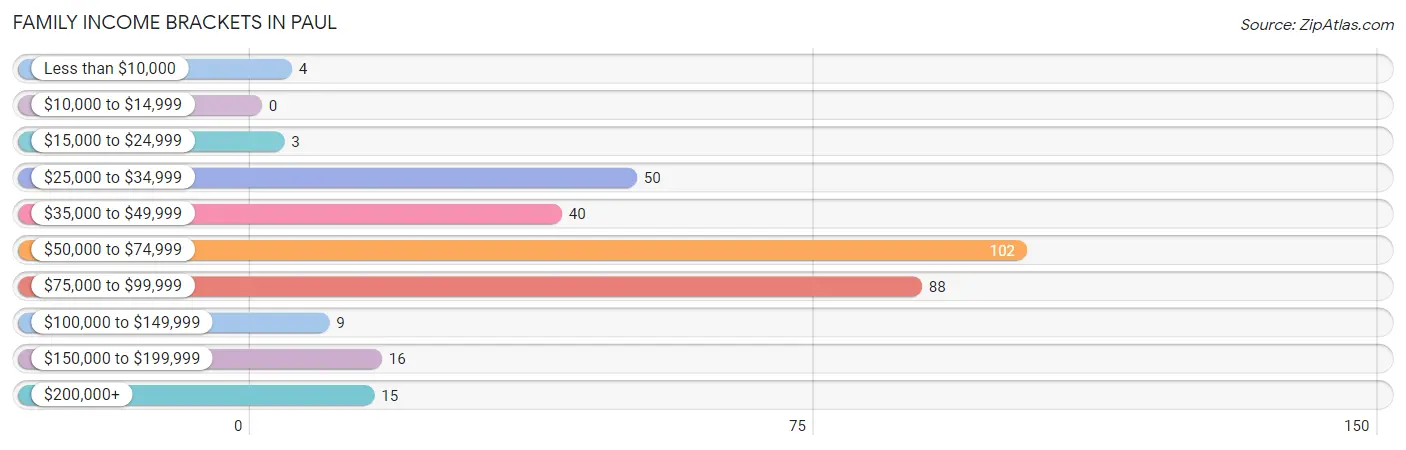
| Income Bracket | # Families | % Families |
| Less than $10,000 | 4 | 1.2% |
| $10,000 to $14,999 | 0 | 0.0% |
| $15,000 to $24,999 | 3 | 0.9% |
| $25,000 to $34,999 | 50 | 15.3% |
| $35,000 to $49,999 | 40 | 12.2% |
| $50,000 to $74,999 | 102 | 31.2% |
| $75,000 to $99,999 | 88 | 26.9% |
| $100,000 to $149,999 | 9 | 2.8% |
| $150,000 to $199,999 | 16 | 4.9% |
| $200,000+ | 15 | 4.6% |
Family Income by Famaliy Size in Paul
5-person families (50 | 15.3%) account for the highest median family income in Paul with $88,583 per family, while 2-person families (204 | 62.4%) have the highest median income of $28,084 per family member.
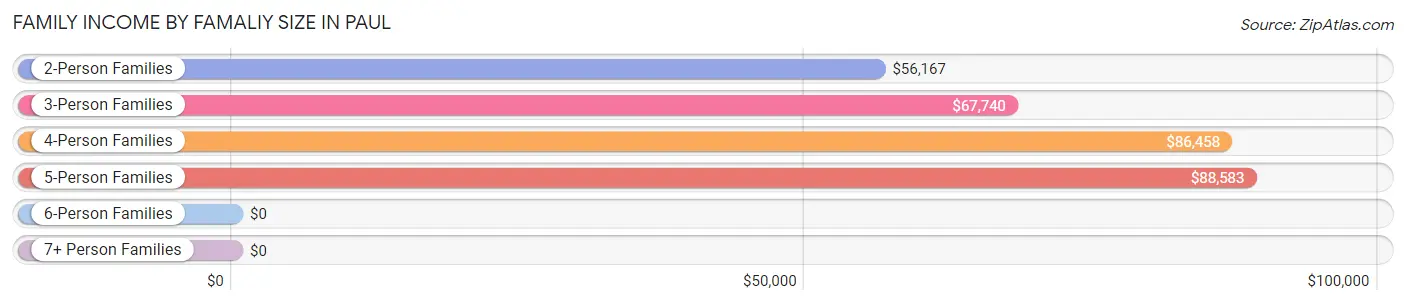
| Income Bracket | # Families | Median Income |
| 2-Person Families | 204 (62.4%) | $56,167 |
| 3-Person Families | 55 (16.8%) | $67,740 |
| 4-Person Families | 11 (3.4%) | $86,458 |
| 5-Person Families | 50 (15.3%) | $88,583 |
| 6-Person Families | 0 (0.0%) | $0 |
| 7+ Person Families | 7 (2.1%) | $0 |
| Total | 327 (100.0%) | $64,338 |
Family Income by Number of Earners in Paul
The median family income in Paul is $64,338, with families comprising 3+ earners (18) having the highest median family income of $182,500, while families with no earners (39) have the lowest median family income of $45,521, accounting for 5.5% and 11.9% of families, respectively.
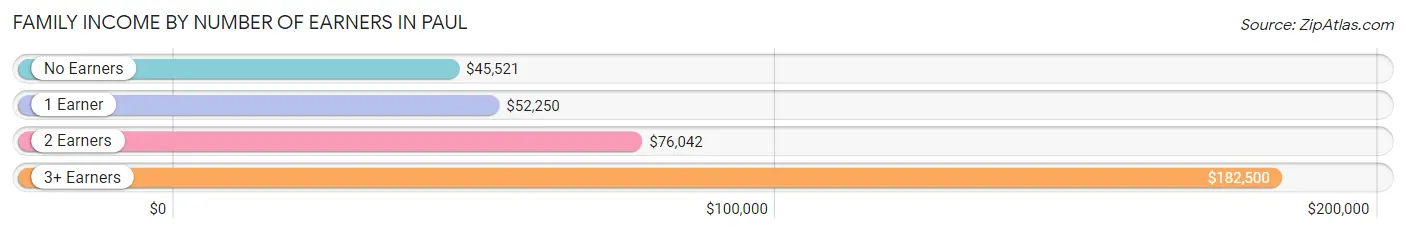
| Number of Earners | # Families | Median Income |
| No Earners | 39 (11.9%) | $45,521 |
| 1 Earner | 123 (37.6%) | $52,250 |
| 2 Earners | 147 (45.0%) | $76,042 |
| 3+ Earners | 18 (5.5%) | $182,500 |
| Total | 327 (100.0%) | $64,338 |
Household Income in Paul
Household Income Brackets in Paul
With 185 households falling in the category, the $50,000 to $74,999 income range is the most frequent in Paul, accounting for 35.0% of all households. In contrast, only 11 households (2.1%) fall into the $10,000 to $14,999 income bracket, making it the least populous group.
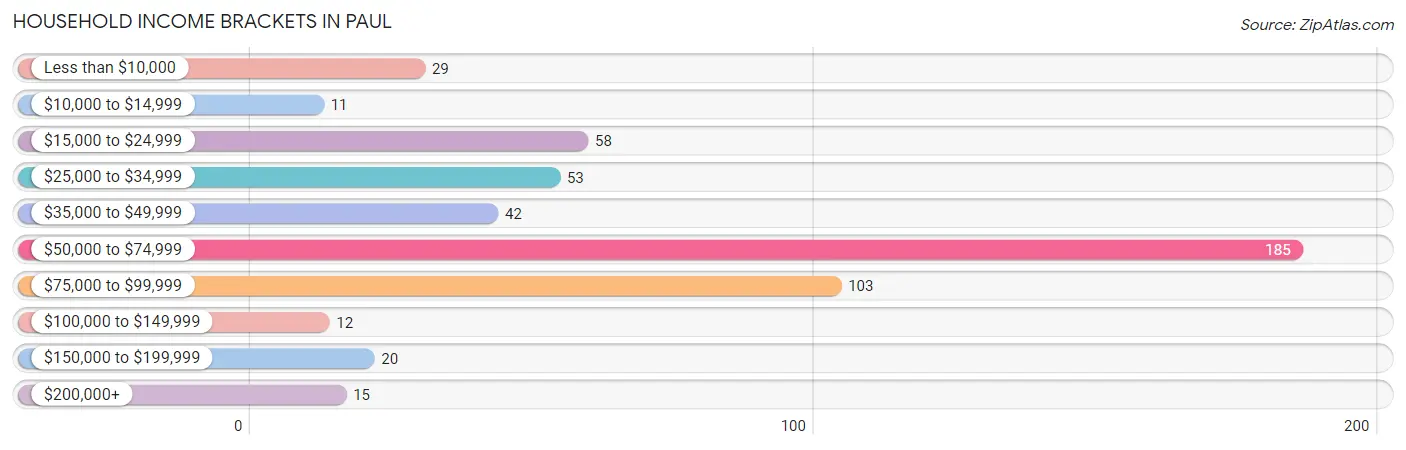
| Income Bracket | # Households | % Households |
| Less than $10,000 | 29 | 5.5% |
| $10,000 to $14,999 | 11 | 2.1% |
| $15,000 to $24,999 | 58 | 11.0% |
| $25,000 to $34,999 | 53 | 10.0% |
| $35,000 to $49,999 | 42 | 8.0% |
| $50,000 to $74,999 | 185 | 35.0% |
| $75,000 to $99,999 | 103 | 19.5% |
| $100,000 to $149,999 | 12 | 2.3% |
| $150,000 to $199,999 | 20 | 3.8% |
| $200,000+ | 15 | 2.8% |
Household Income by Householder Age in Paul
The median household income in Paul is $59,853, with the highest median household income of $76,806 found in the 45 to 64 years age bracket for the primary householder. A total of 158 households (29.9%) fall into this category. Meanwhile, the 15 to 24 years age bracket for the primary householder has the lowest median household income of $0, with 42 households (8.0%) in this group.
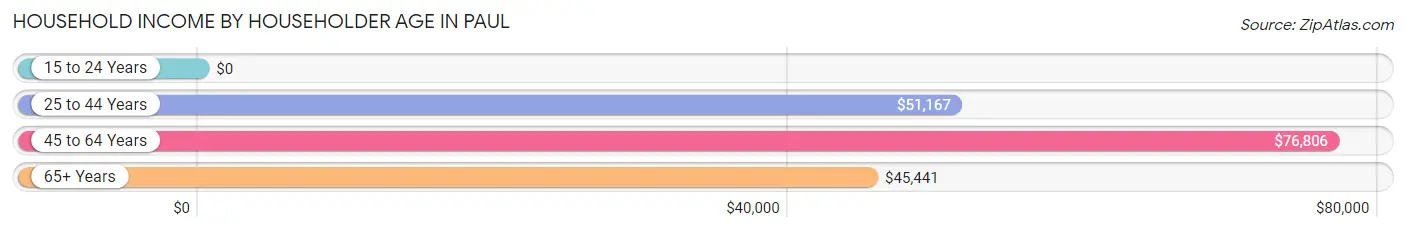
| Income Bracket | # Households | Median Income |
| 15 to 24 Years | 42 (8.0%) | $0 |
| 25 to 44 Years | 128 (24.2%) | $51,167 |
| 45 to 64 Years | 158 (29.9%) | $76,806 |
| 65+ Years | 200 (37.9%) | $45,441 |
| Total | 528 (100.0%) | $59,853 |
Poverty in Paul
Income Below Poverty by Sex and Age in Paul
With 1.3% poverty level for males and 16.6% for females among the residents of Paul, 12 to 14 year old males and 18 to 24 year old females are the most vulnerable to poverty, with 3 males (100.0%) and 59 females (73.8%) in their respective age groups living below the poverty level.
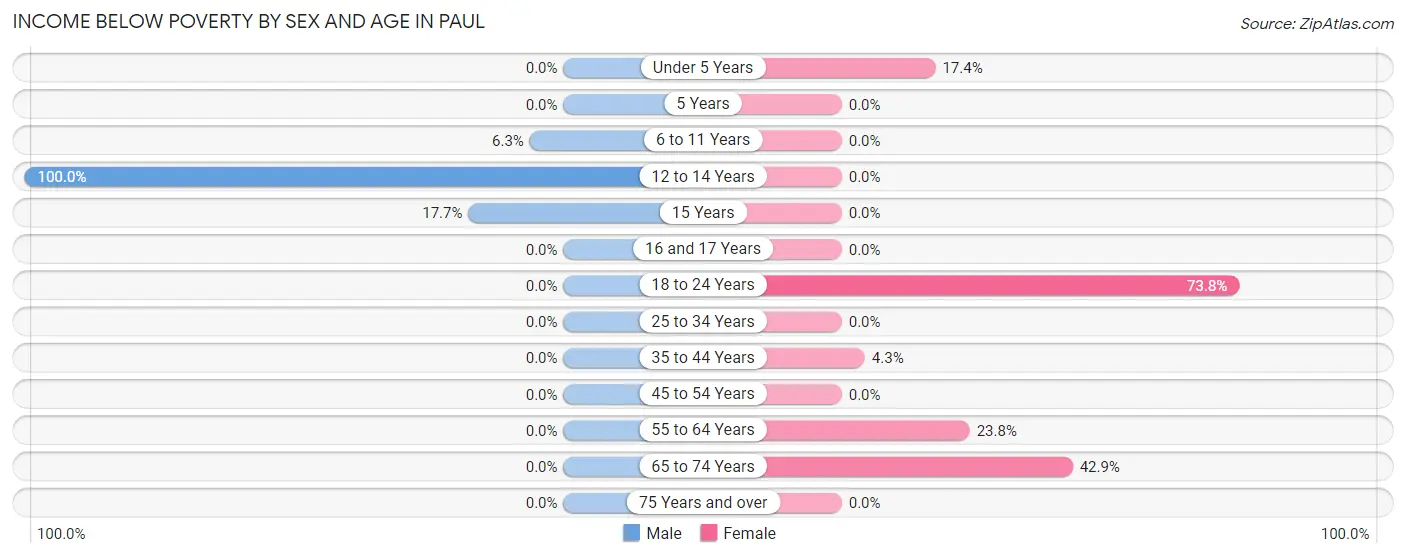
| Age Bracket | Male | Female |
| Under 5 Years | 0 (0.0%) | 12 (17.4%) |
| 5 Years | 0 (0.0%) | 0 (0.0%) |
| 6 to 11 Years | 2 (6.2%) | 0 (0.0%) |
| 12 to 14 Years | 3 (100.0%) | 0 (0.0%) |
| 15 Years | 3 (17.6%) | 0 (0.0%) |
| 16 and 17 Years | 0 (0.0%) | 0 (0.0%) |
| 18 to 24 Years | 0 (0.0%) | 59 (73.8%) |
| 25 to 34 Years | 0 (0.0%) | 0 (0.0%) |
| 35 to 44 Years | 0 (0.0%) | 3 (4.3%) |
| 45 to 54 Years | 0 (0.0%) | 0 (0.0%) |
| 55 to 64 Years | 0 (0.0%) | 19 (23.7%) |
| 65 to 74 Years | 0 (0.0%) | 21 (42.9%) |
| 75 Years and over | 0 (0.0%) | 0 (0.0%) |
| Total | 8 (1.3%) | 114 (16.6%) |
Income Above Poverty by Sex and Age in Paul
According to the poverty statistics in Paul, males aged under 5 years and females aged 6 to 11 years are the age groups that are most secure financially, with 100.0% of males and 100.0% of females in these age groups living above the poverty line.
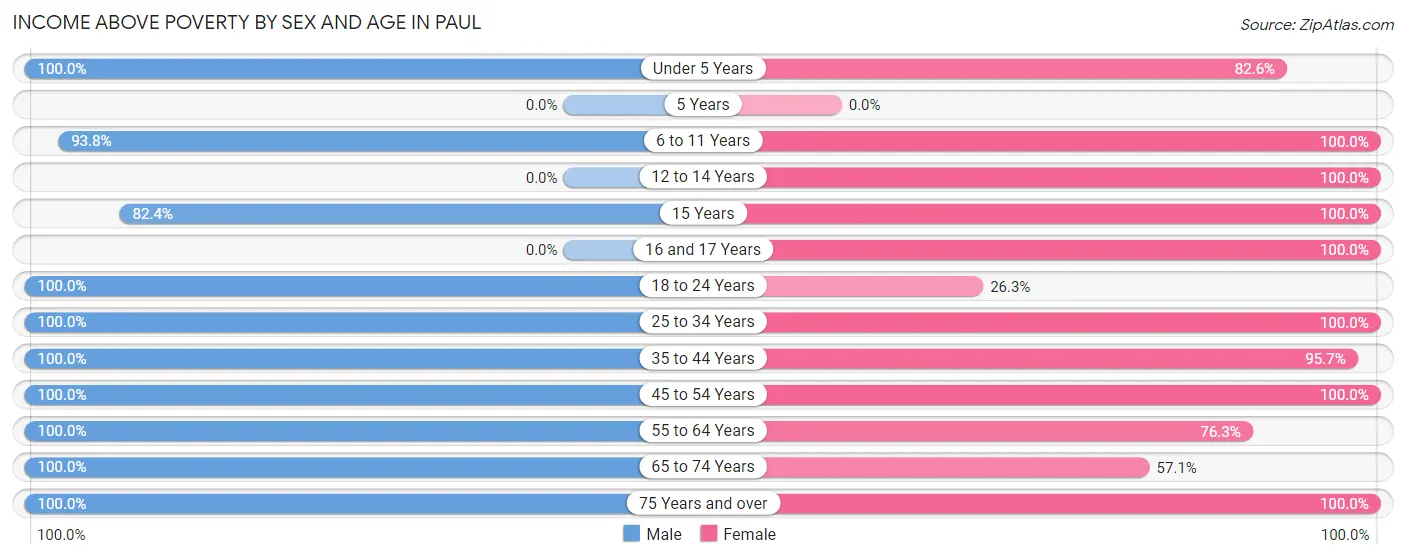
| Age Bracket | Male | Female |
| Under 5 Years | 75 (100.0%) | 57 (82.6%) |
| 5 Years | 0 (0.0%) | 0 (0.0%) |
| 6 to 11 Years | 30 (93.8%) | 19 (100.0%) |
| 12 to 14 Years | 0 (0.0%) | 54 (100.0%) |
| 15 Years | 14 (82.4%) | 11 (100.0%) |
| 16 and 17 Years | 0 (0.0%) | 7 (100.0%) |
| 18 to 24 Years | 99 (100.0%) | 21 (26.3%) |
| 25 to 34 Years | 62 (100.0%) | 38 (100.0%) |
| 35 to 44 Years | 45 (100.0%) | 67 (95.7%) |
| 45 to 54 Years | 113 (100.0%) | 76 (100.0%) |
| 55 to 64 Years | 73 (100.0%) | 61 (76.2%) |
| 65 to 74 Years | 44 (100.0%) | 28 (57.1%) |
| 75 Years and over | 49 (100.0%) | 134 (100.0%) |
| Total | 604 (98.7%) | 573 (83.4%) |
Income Below Poverty Among Married-Couple Families in Paul
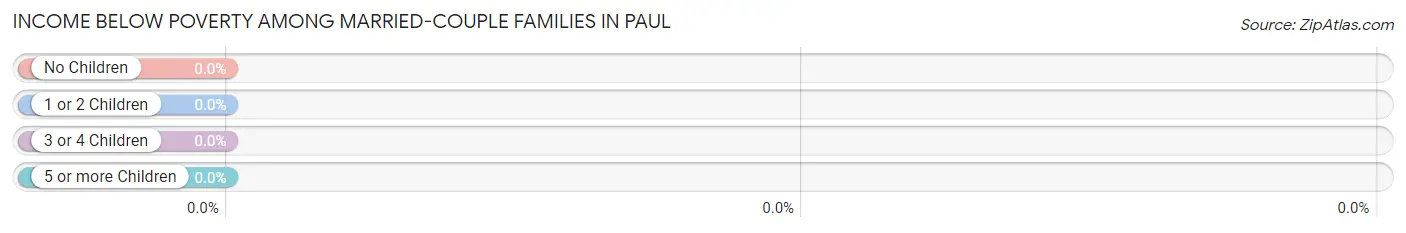
| Children | Above Poverty | Below Poverty |
| No Children | 172 (100.0%) | 0 (0.0%) |
| 1 or 2 Children | 28 (100.0%) | 0 (0.0%) |
| 3 or 4 Children | 39 (100.0%) | 0 (0.0%) |
| 5 or more Children | 0 (0.0%) | 0 (0.0%) |
| Total | 239 (100.0%) | 0 (0.0%) |
Income Below Poverty Among Single-Parent Households in Paul
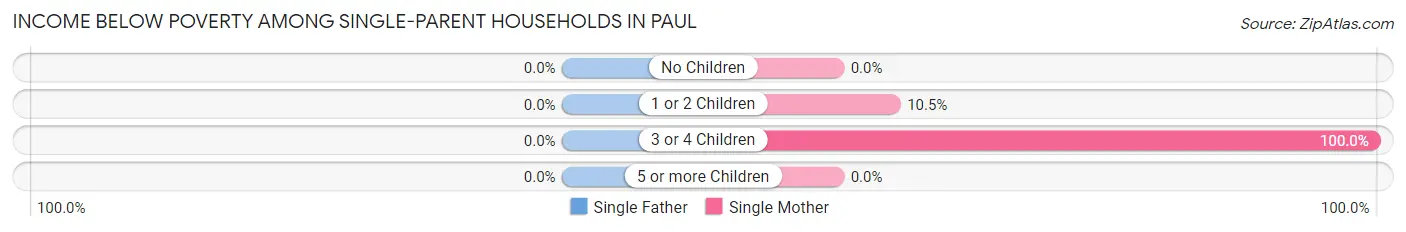
| Children | Single Father | Single Mother |
| No Children | 0 (0.0%) | 0 (0.0%) |
| 1 or 2 Children | 0 (0.0%) | 4 (10.5%) |
| 3 or 4 Children | 0 (0.0%) | 3 (100.0%) |
| 5 or more Children | 0 (0.0%) | 0 (0.0%) |
| Total | 0 (0.0%) | 7 (15.9%) |
Income Below Poverty Among Married-Couple vs Single-Parent Households in Paul
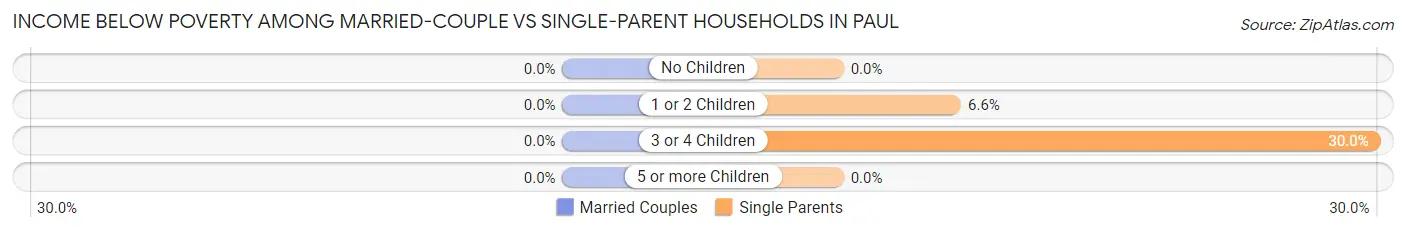
| Children | Married-Couple Families | Single-Parent Households |
| No Children | 0 (0.0%) | 0 (0.0%) |
| 1 or 2 Children | 0 (0.0%) | 4 (6.6%) |
| 3 or 4 Children | 0 (0.0%) | 3 (30.0%) |
| 5 or more Children | 0 (0.0%) | 0 (0.0%) |
| Total | 0 (0.0%) | 7 (8.0%) |
Race in Paul
The most populous races in Paul are White / Caucasian (947 | 71.0%), Hispanic or Latino (444 | 33.3%), and Some other Race (207 | 15.5%).
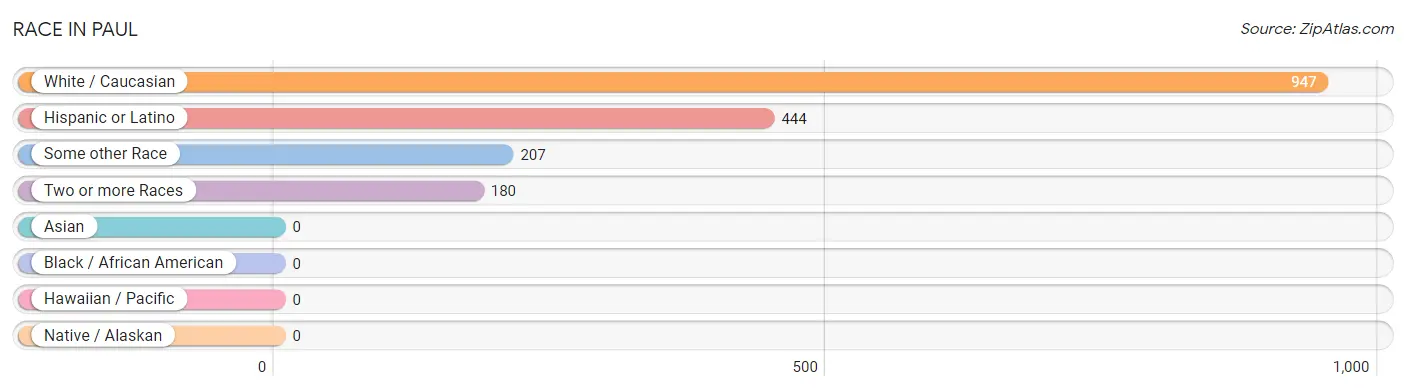
| Race | # Population | % Population |
| Asian | 0 | 0.0% |
| Black / African American | 0 | 0.0% |
| Hawaiian / Pacific | 0 | 0.0% |
| Hispanic or Latino | 444 | 33.3% |
| Native / Alaskan | 0 | 0.0% |
| White / Caucasian | 947 | 71.0% |
| Two or more Races | 180 | 13.5% |
| Some other Race | 207 | 15.5% |
| Total | 1,334 | 100.0% |
Ancestry in Paul
The most populous ancestries reported in Paul are Mexican (383 | 28.7%), English (290 | 21.7%), German (279 | 20.9%), Irish (125 | 9.4%), and American (122 | 9.1%), together accounting for 89.9% of all Paul residents.
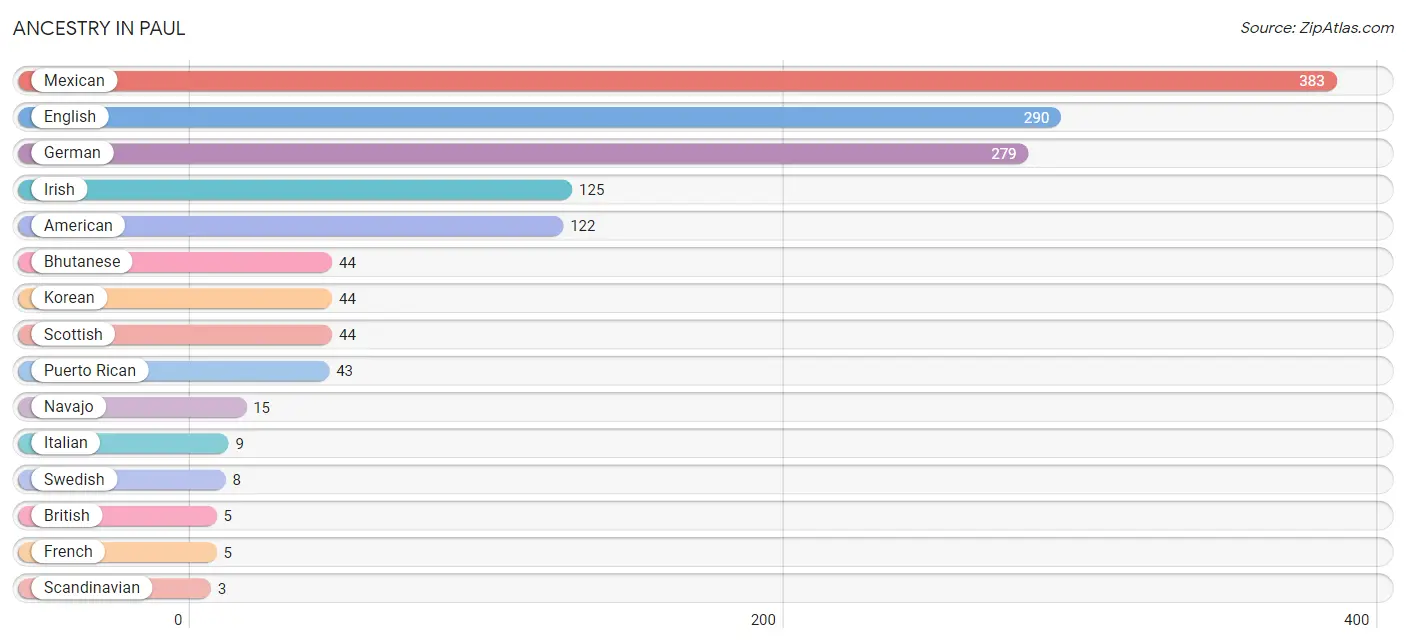
| Ancestry | # Population | % Population |
| American | 122 | 9.1% |
| Bhutanese | 44 | 3.3% |
| British | 5 | 0.4% |
| Danish | 2 | 0.2% |
| English | 290 | 21.7% |
| French | 5 | 0.4% |
| German | 279 | 20.9% |
| Irish | 125 | 9.4% |
| Italian | 9 | 0.7% |
| Korean | 44 | 3.3% |
| Mexican | 383 | 28.7% |
| Navajo | 15 | 1.1% |
| Norwegian | 2 | 0.2% |
| Puerto Rican | 43 | 3.2% |
| Scandinavian | 3 | 0.2% |
| Scottish | 44 | 3.3% |
| Swedish | 8 | 0.6% | View All 17 Rows |
Immigrants in Paul
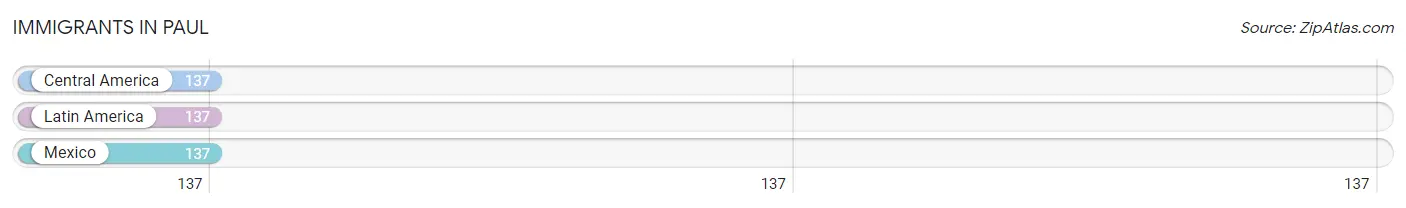
The most numerous immigrant groups reported in Paul came from Central America (137 | 10.3%), Latin America (137 | 10.3%), and Mexico (137 | 10.3%), together accounting for 30.8% of all Paul residents.
| Immigration Origin | # Population | % Population |
| Central America | 137 | 10.3% |
| Latin America | 137 | 10.3% |
| Mexico | 137 | 10.3% | View All 3 Rows |
Sex and Age in Paul
Sex and Age in Paul
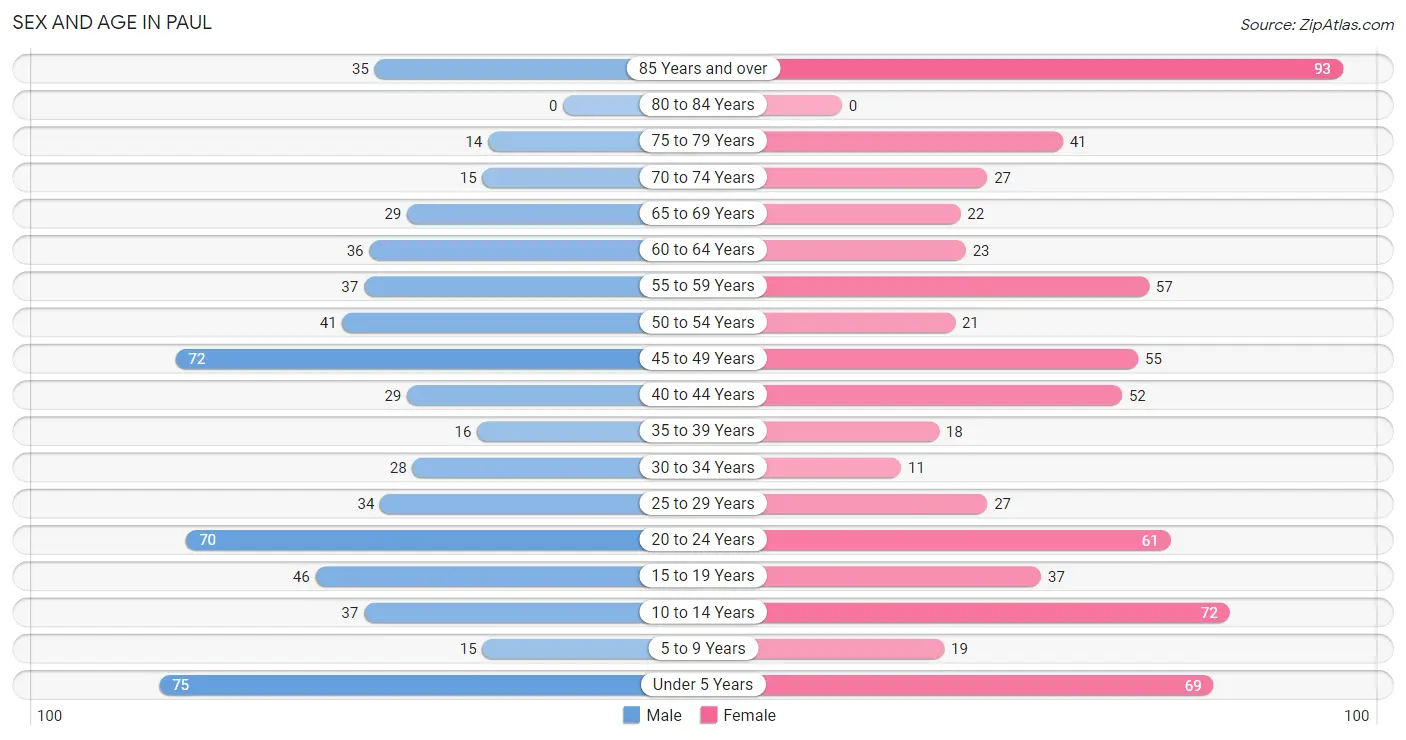
The most populous age groups in Paul are Under 5 Years (75 | 11.9%) for men and 85 Years and over (93 | 13.2%) for women.
| Age Bracket | Male | Female |
| Under 5 Years | 75 (11.9%) | 69 (9.8%) |
| 5 to 9 Years | 15 (2.4%) | 19 (2.7%) |
| 10 to 14 Years | 37 (5.9%) | 72 (10.2%) |
| 15 to 19 Years | 46 (7.3%) | 37 (5.2%) |
| 20 to 24 Years | 70 (11.1%) | 61 (8.6%) |
| 25 to 29 Years | 34 (5.4%) | 27 (3.8%) |
| 30 to 34 Years | 28 (4.4%) | 11 (1.6%) |
| 35 to 39 Years | 16 (2.5%) | 18 (2.5%) |
| 40 to 44 Years | 29 (4.6%) | 52 (7.4%) |
| 45 to 49 Years | 72 (11.5%) | 55 (7.8%) |
| 50 to 54 Years | 41 (6.5%) | 21 (3.0%) |
| 55 to 59 Years | 37 (5.9%) | 57 (8.1%) |
| 60 to 64 Years | 36 (5.7%) | 23 (3.3%) |
| 65 to 69 Years | 29 (4.6%) | 22 (3.1%) |
| 70 to 74 Years | 15 (2.4%) | 27 (3.8%) |
| 75 to 79 Years | 14 (2.2%) | 41 (5.8%) |
| 80 to 84 Years | 0 (0.0%) | 0 (0.0%) |
| 85 Years and over | 35 (5.6%) | 93 (13.2%) |
| Total | 629 (100.0%) | 705 (100.0%) |
Families and Households in Paul
Median Family Size in Paul
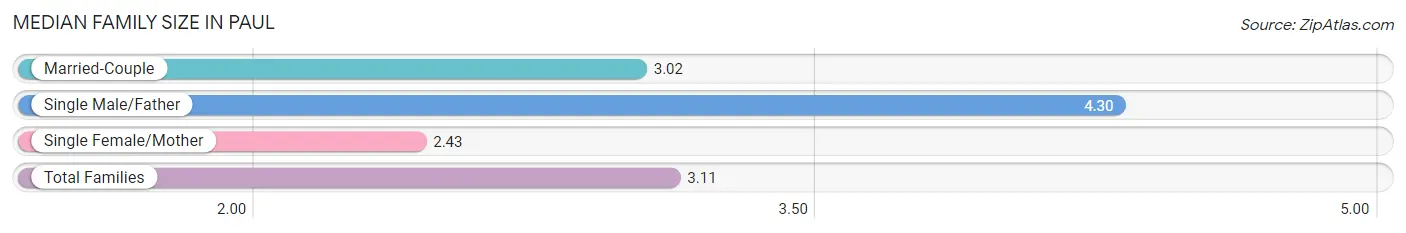
The median family size in Paul is 3.11 persons per family, with single male/father families (44 | 13.5%) accounting for the largest median family size of 4.3 persons per family. On the other hand, single female/mother families (44 | 13.5%) represent the smallest median family size with 2.43 persons per family.
| Family Type | # Families | Family Size |
| Married-Couple | 239 (73.1%) | 3.02 |
| Single Male/Father | 44 (13.5%) | 4.30 |
| Single Female/Mother | 44 (13.5%) | 2.43 |
| Total Families | 327 (100.0%) | 3.11 |
Median Household Size in Paul
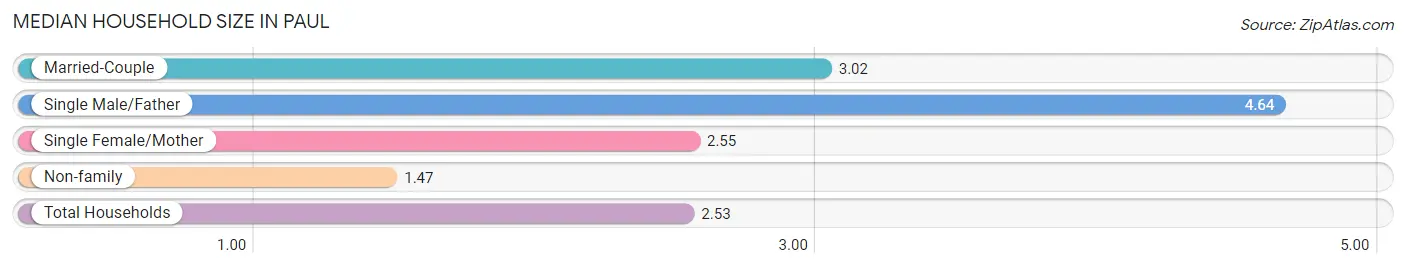
The median household size in Paul is 2.53 persons per household, with single male/father households (44 | 8.3%) accounting for the largest median household size of 4.64 persons per household. non-family households (201 | 38.1%) represent the smallest median household size with 1.47 persons per household.
| Household Type | # Households | Household Size |
| Married-Couple | 239 (45.3%) | 3.02 |
| Single Male/Father | 44 (8.3%) | 4.64 |
| Single Female/Mother | 44 (8.3%) | 2.55 |
| Non-family | 201 (38.1%) | 1.47 |
| Total Households | 528 (100.0%) | 2.53 |
Household Size by Marriage Status in Paul
Out of a total of 528 households in Paul, 327 (61.9%) are family households, while 201 (38.1%) are nonfamily households. The most numerous type of family households are 2-person households, comprising 183, and the most common type of nonfamily households are 1-person households, comprising 154.
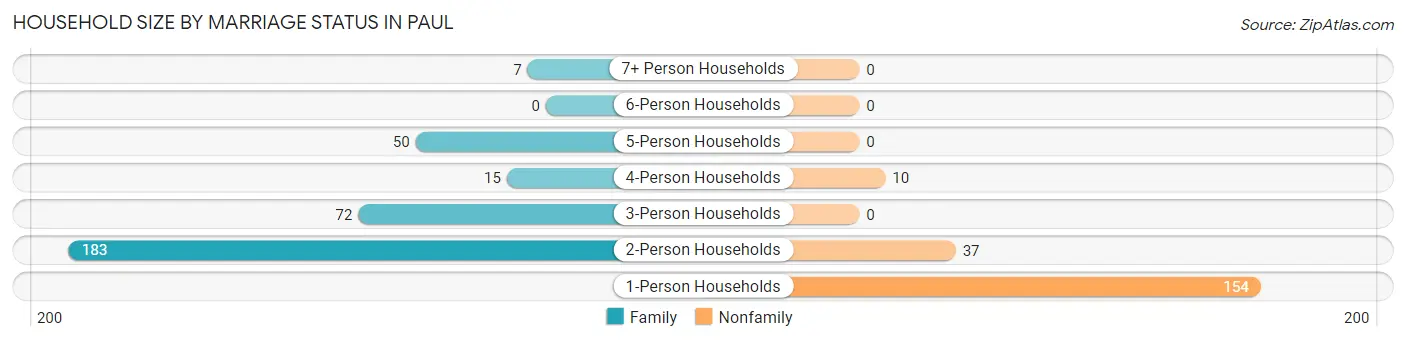
| Household Size | Family Households | Nonfamily Households |
| 1-Person Households | - | 154 (29.2%) |
| 2-Person Households | 183 (34.7%) | 37 (7.0%) |
| 3-Person Households | 72 (13.6%) | 0 (0.0%) |
| 4-Person Households | 15 (2.8%) | 10 (1.9%) |
| 5-Person Households | 50 (9.5%) | 0 (0.0%) |
| 6-Person Households | 0 (0.0%) | 0 (0.0%) |
| 7+ Person Households | 7 (1.3%) | 0 (0.0%) |
| Total | 327 (61.9%) | 201 (38.1%) |
Female Fertility in Paul
Fertility by Age in Paul
Average fertility rate in Paul is 88.0 births per 1,000 women. Women in the age bracket of 20 to 34 years have the highest fertility rate with 242.0 births per 1,000 women. Women in the age bracket of 20 to 34 years acount for 100.0% of all women with births.
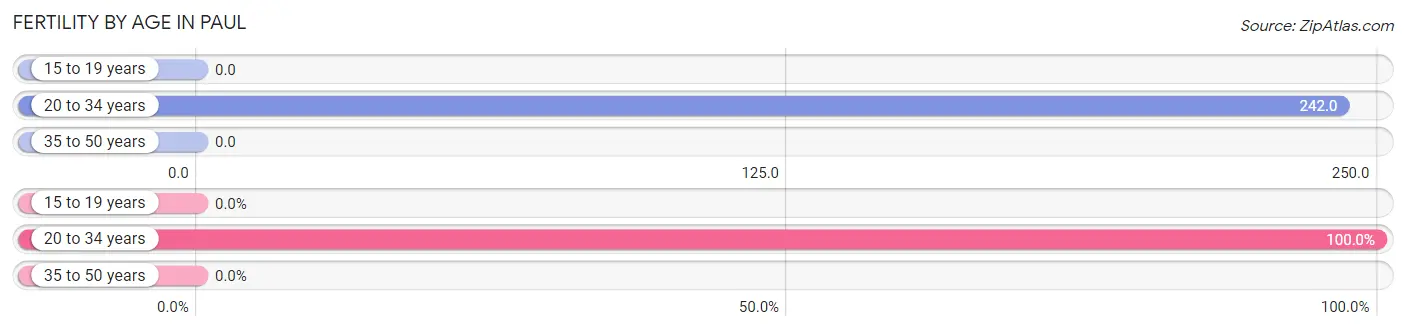
| Age Bracket | Women with Births | Births / 1,000 Women |
| 15 to 19 years | 0 (0.0%) | 0.0 |
| 20 to 34 years | 24 (100.0%) | 242.0 |
| 35 to 50 years | 0 (0.0%) | 0.0 |
| Total | 24 (100.0%) | 88.0 |
Fertility by Age by Marriage Status in Paul
25.0% of women with births (24) in Paul are married. The highest percentage of unmarried women with births falls into 20 to 34 years age bracket with 75.0% of them unmarried at the time of birth, while the lowest percentage of unmarried women with births belong to 20 to 34 years age bracket with 75.0% of them unmarried.
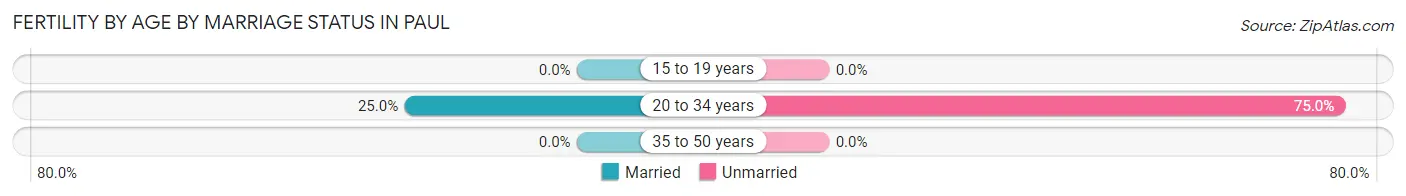
| Age Bracket | Married | Unmarried |
| 15 to 19 years | 0 (0.0%) | 0 (0.0%) |
| 20 to 34 years | 6 (25.0%) | 18 (75.0%) |
| 35 to 50 years | 0 (0.0%) | 0 (0.0%) |
| Total | 6 (25.0%) | 18 (75.0%) |
Fertility by Education in Paul
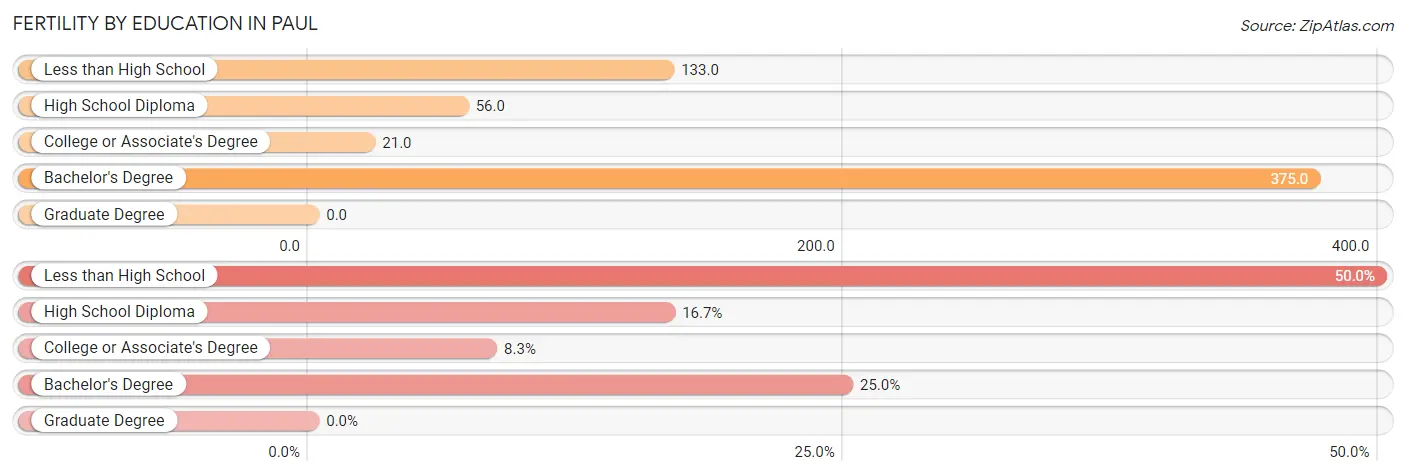
| Educational Attainment | Women with Births | Births / 1,000 Women |
| Less than High School | 12 (50.0%) | 133.0 |
| High School Diploma | 4 (16.7%) | 56.0 |
| College or Associate's Degree | 2 (8.3%) | 21.0 |
| Bachelor's Degree | 6 (25.0%) | 375.0 |
| Graduate Degree | 0 (0.0%) | 0.0 |
| Total | 24 (100.0%) | 88.0 |
Fertility by Education by Marriage Status in Paul
75.0% of women with births in Paul are unmarried. Women with the educational attainment of bachelor's degree are most likely to be married with 100.0% of them married at childbirth, while women with the educational attainment of less than high school are least likely to be married with 100.0% of them unmarried at childbirth.
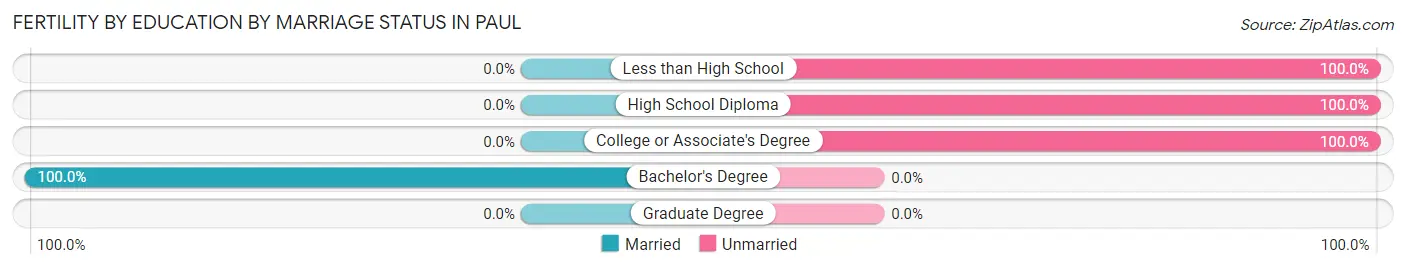
| Educational Attainment | Married | Unmarried |
| Less than High School | 0 (0.0%) | 12 (100.0%) |
| High School Diploma | 0 (0.0%) | 4 (100.0%) |
| College or Associate's Degree | 0 (0.0%) | 2 (100.0%) |
| Bachelor's Degree | 6 (100.0%) | 0 (0.0%) |
| Graduate Degree | 0 (0.0%) | 0 (0.0%) |
| Total | 6 (25.0%) | 18 (75.0%) |
Employment Characteristics in Paul
Employment by Class of Employer in Paul
Among the 615 employed individuals in Paul, private company employees (383 | 62.3%), self-employed (not incorporated) (78 | 12.7%), and local government employees (67 | 10.9%) make up the most common classes of employment.
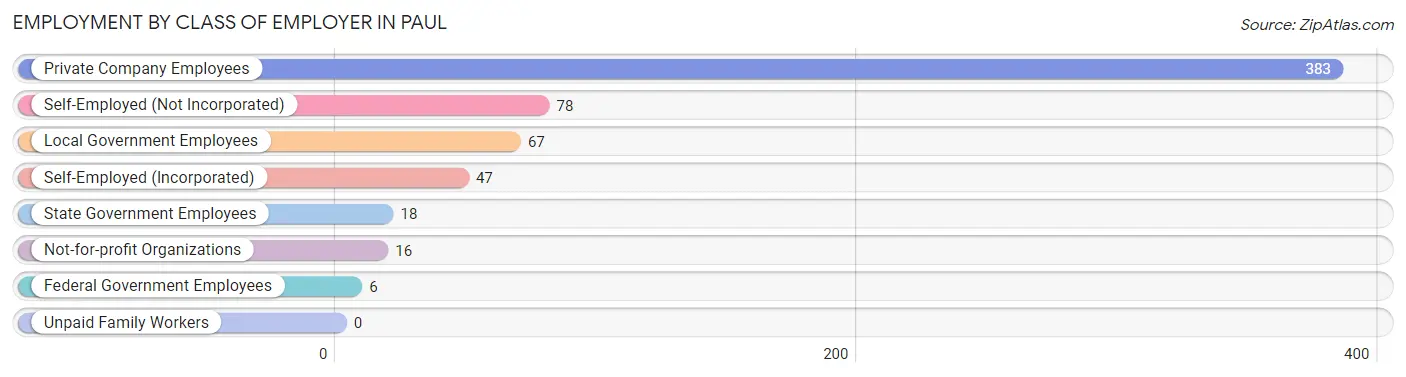
| Employer Class | # Employees | % Employees |
| Private Company Employees | 383 | 62.3% |
| Self-Employed (Incorporated) | 47 | 7.6% |
| Self-Employed (Not Incorporated) | 78 | 12.7% |
| Not-for-profit Organizations | 16 | 2.6% |
| Local Government Employees | 67 | 10.9% |
| State Government Employees | 18 | 2.9% |
| Federal Government Employees | 6 | 1.0% |
| Unpaid Family Workers | 0 | 0.0% |
| Total | 615 | 100.0% |
Employment Status by Age in Paul
According to the labor force statistics for Paul, out of the total population over 16 years of age (1,019), 62.6% or 638 individuals are in the labor force, with 1.6% or 10 of them unemployed. The age group with the highest labor force participation rate is 25 to 29 years, with 100.0% or 61 individuals in the labor force. Within the labor force, the 16 to 19 years age range has the highest percentage of unemployed individuals, with 7.0% or 3 of them being unemployed.
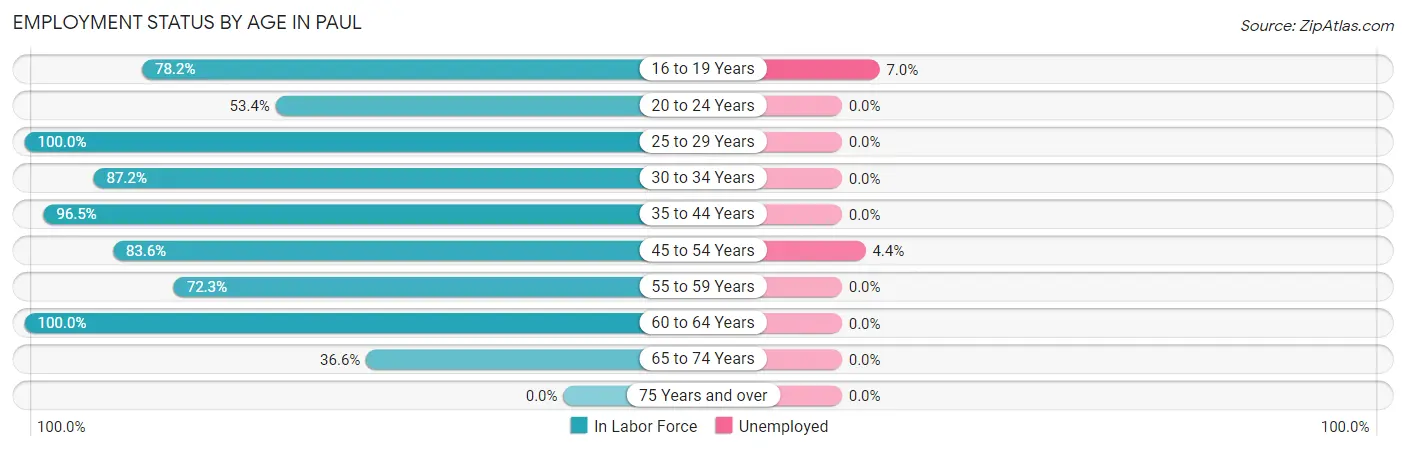
| Age Bracket | In Labor Force | Unemployed |
| 16 to 19 Years | 43 (78.2%) | 3 (7.0%) |
| 20 to 24 Years | 70 (53.4%) | 0 (0.0%) |
| 25 to 29 Years | 61 (100.0%) | 0 (0.0%) |
| 30 to 34 Years | 34 (87.2%) | 0 (0.0%) |
| 35 to 44 Years | 111 (96.5%) | 0 (0.0%) |
| 45 to 54 Years | 158 (83.6%) | 7 (4.4%) |
| 55 to 59 Years | 68 (72.3%) | 0 (0.0%) |
| 60 to 64 Years | 59 (100.0%) | 0 (0.0%) |
| 65 to 74 Years | 34 (36.6%) | 0 (0.0%) |
| 75 Years and over | 0 (0.0%) | 0 (0.0%) |
| Total | 638 (62.6%) | 10 (1.6%) |
Employment Status by Educational Attainment in Paul
According to labor force statistics for Paul, 88.2% of individuals (491) out of the total population between 25 and 64 years of age (557) are in the labor force, with 1.4% or 7 of them being unemployed. The group with the highest labor force participation rate are those with the educational attainment of bachelor's degree or higher, with 100.0% or 92 individuals in the labor force. Within the labor force, individuals with college / associate degree education have the highest percentage of unemployment, with 3.8% or 7 of them being unemployed.
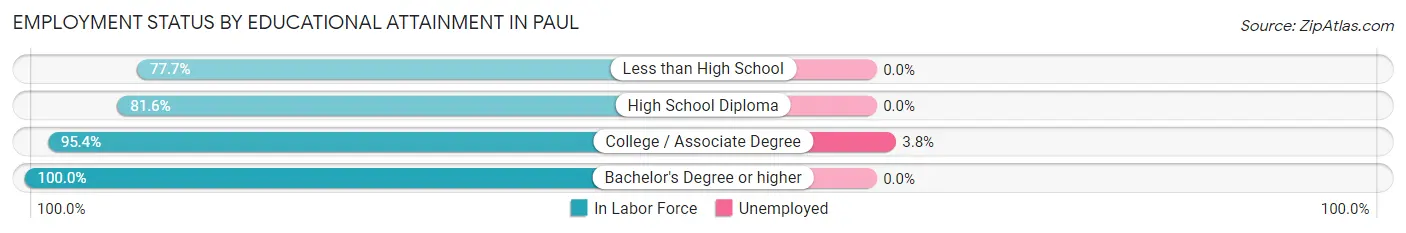
| Educational Attainment | In Labor Force | Unemployed |
| Less than High School | 143 (77.7%) | 0 (0.0%) |
| High School Diploma | 71 (81.6%) | 0 (0.0%) |
| College / Associate Degree | 185 (95.4%) | 7 (3.8%) |
| Bachelor's Degree or higher | 92 (100.0%) | 0 (0.0%) |
| Total | 491 (88.2%) | 8 (1.4%) |
Employment Occupations by Sex in Paul
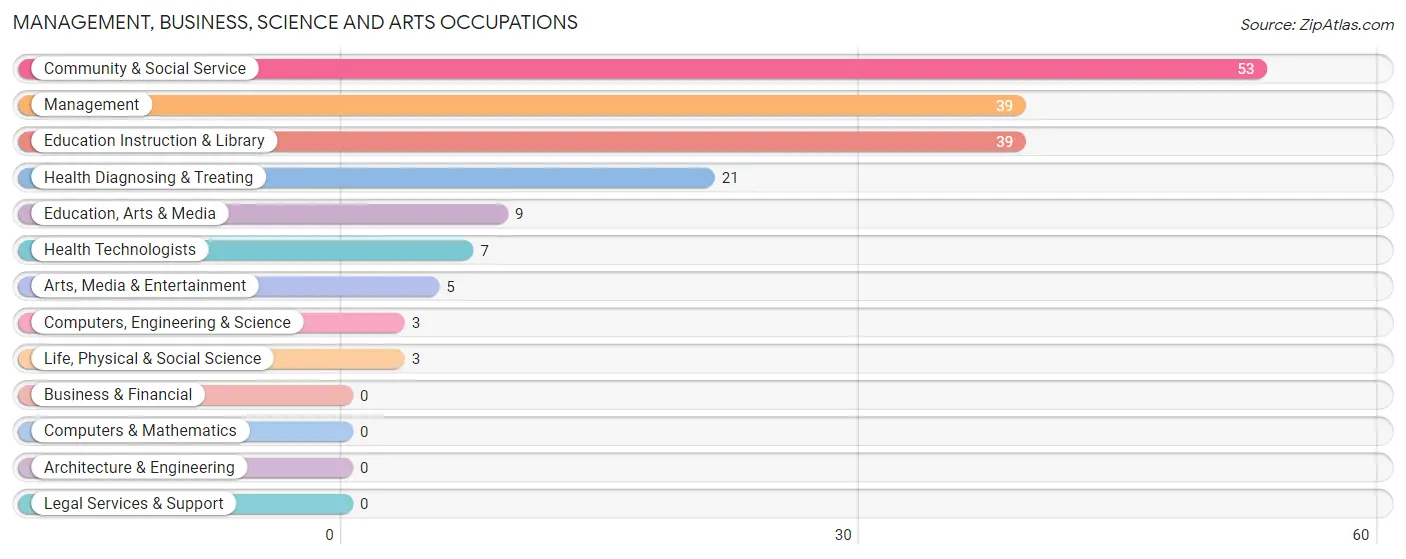
Management, Business, Science and Arts Occupations
The most common Management, Business, Science and Arts occupations in Paul are Community & Social Service (53 | 8.4%), Management (39 | 6.2%), Education Instruction & Library (39 | 6.2%), Health Diagnosing & Treating (21 | 3.3%), and Education, Arts & Media (9 | 1.4%).
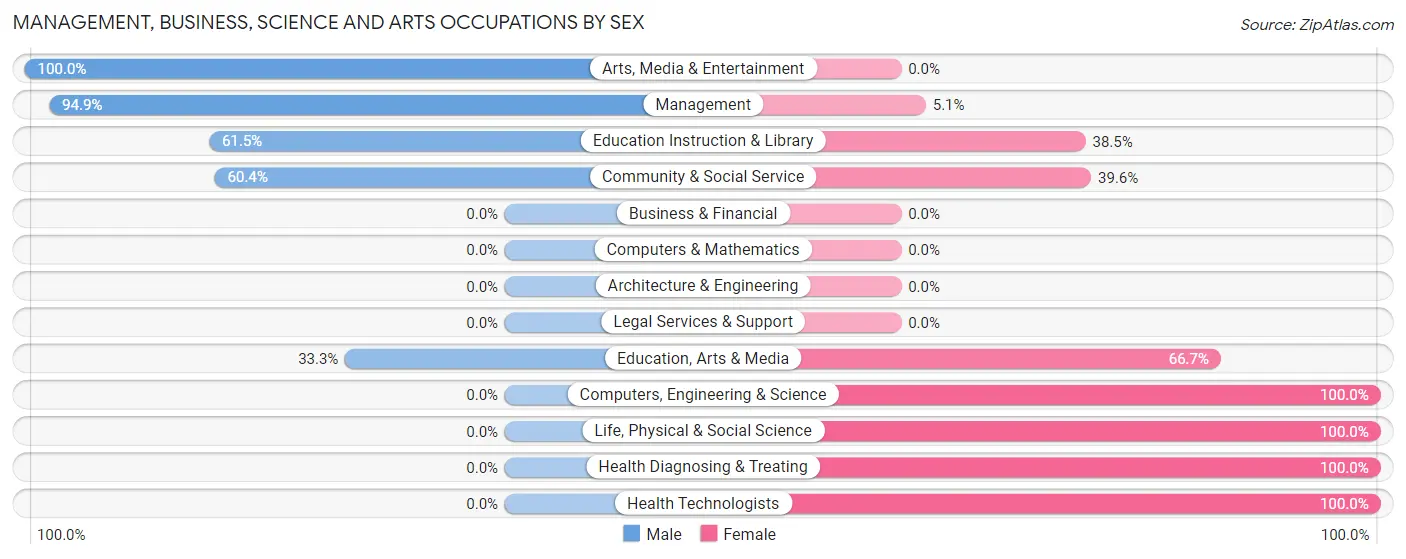
Management, Business, Science and Arts Occupations by Sex
Within the Management, Business, Science and Arts occupations in Paul, the most male-oriented occupations are Arts, Media & Entertainment (100.0%), Management (94.9%), and Education Instruction & Library (61.5%), while the most female-oriented occupations are Computers, Engineering & Science (100.0%), Life, Physical & Social Science (100.0%), and Health Diagnosing & Treating (100.0%).
| Occupation | Male | Female |
| Management | 37 (94.9%) | 2 (5.1%) |
| Business & Financial | 0 (0.0%) | 0 (0.0%) |
| Computers, Engineering & Science | 0 (0.0%) | 3 (100.0%) |
| Computers & Mathematics | 0 (0.0%) | 0 (0.0%) |
| Architecture & Engineering | 0 (0.0%) | 0 (0.0%) |
| Life, Physical & Social Science | 0 (0.0%) | 3 (100.0%) |
| Community & Social Service | 32 (60.4%) | 21 (39.6%) |
| Education, Arts & Media | 3 (33.3%) | 6 (66.7%) |
| Legal Services & Support | 0 (0.0%) | 0 (0.0%) |
| Education Instruction & Library | 24 (61.5%) | 15 (38.5%) |
| Arts, Media & Entertainment | 5 (100.0%) | 0 (0.0%) |
| Health Diagnosing & Treating | 0 (0.0%) | 21 (100.0%) |
| Health Technologists | 0 (0.0%) | 7 (100.0%) |
| Total (Category) | 69 (59.5%) | 47 (40.5%) |
| Total (Overall) | 405 (64.5%) | 223 (35.5%) |
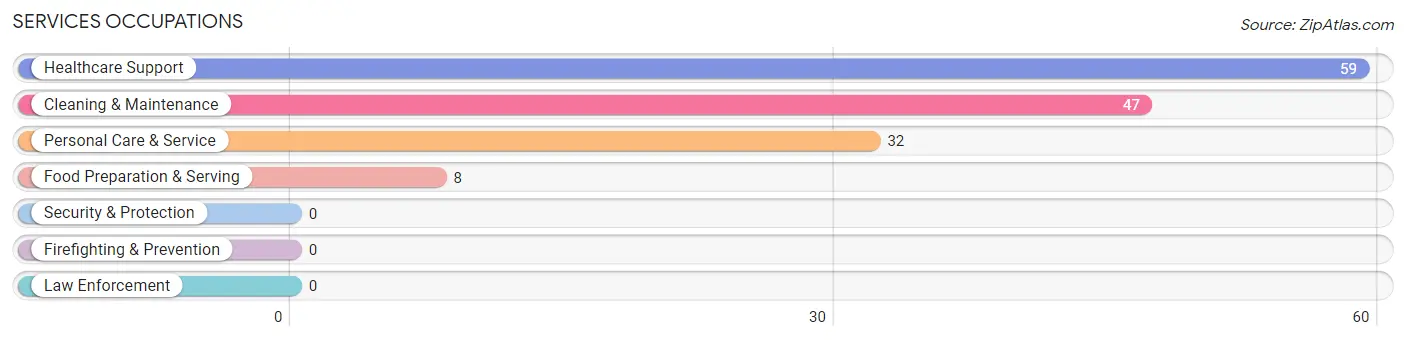
Services Occupations
The most common Services occupations in Paul are Healthcare Support (59 | 9.4%), Cleaning & Maintenance (47 | 7.5%), Personal Care & Service (32 | 5.1%), and Food Preparation & Serving (8 | 1.3%).
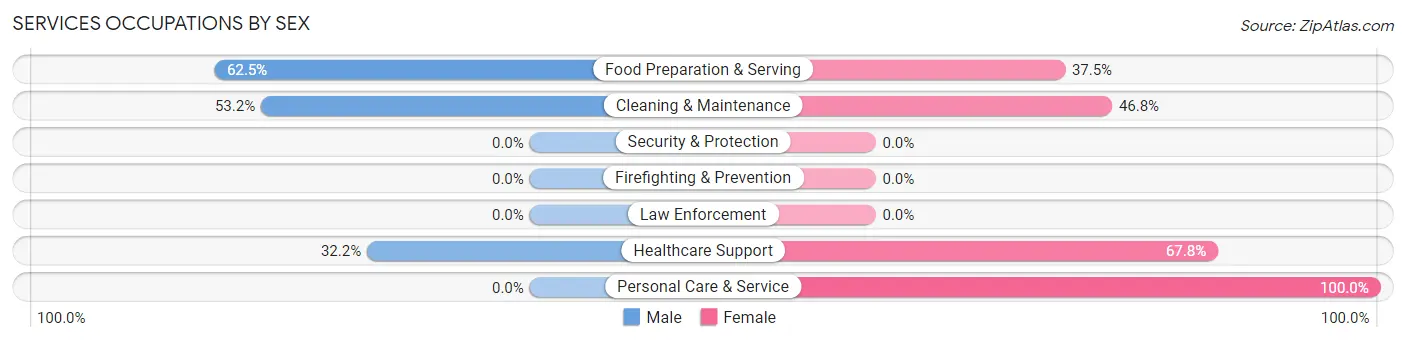
Services Occupations by Sex
Within the Services occupations in Paul, the most male-oriented occupations are Food Preparation & Serving (62.5%), Cleaning & Maintenance (53.2%), and Healthcare Support (32.2%), while the most female-oriented occupations are Personal Care & Service (100.0%), Healthcare Support (67.8%), and Cleaning & Maintenance (46.8%).
| Occupation | Male | Female |
| Healthcare Support | 19 (32.2%) | 40 (67.8%) |
| Security & Protection | 0 (0.0%) | 0 (0.0%) |
| Firefighting & Prevention | 0 (0.0%) | 0 (0.0%) |
| Law Enforcement | 0 (0.0%) | 0 (0.0%) |
| Food Preparation & Serving | 5 (62.5%) | 3 (37.5%) |
| Cleaning & Maintenance | 25 (53.2%) | 22 (46.8%) |
| Personal Care & Service | 0 (0.0%) | 32 (100.0%) |
| Total (Category) | 49 (33.6%) | 97 (66.4%) |
| Total (Overall) | 405 (64.5%) | 223 (35.5%) |
Sales and Office Occupations
The most common Sales and Office occupations in Paul are Sales & Related (29 | 4.6%), and Office & Administration (12 | 1.9%).
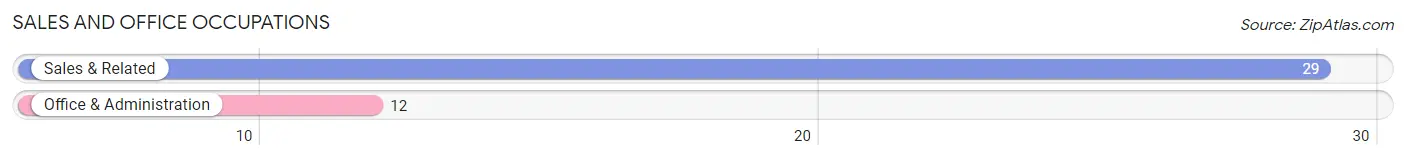
Sales and Office Occupations by Sex
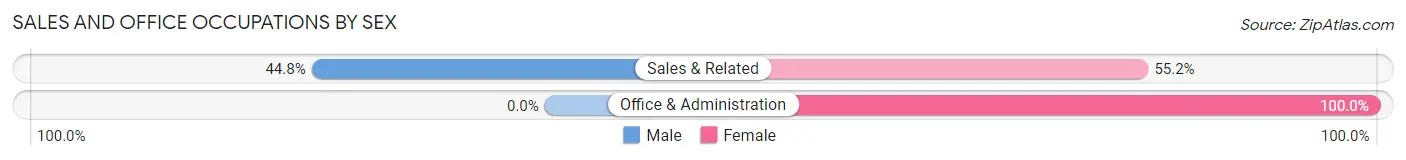
| Occupation | Male | Female |
| Sales & Related | 13 (44.8%) | 16 (55.2%) |
| Office & Administration | 0 (0.0%) | 12 (100.0%) |
| Total (Category) | 13 (31.7%) | 28 (68.3%) |
| Total (Overall) | 405 (64.5%) | 223 (35.5%) |
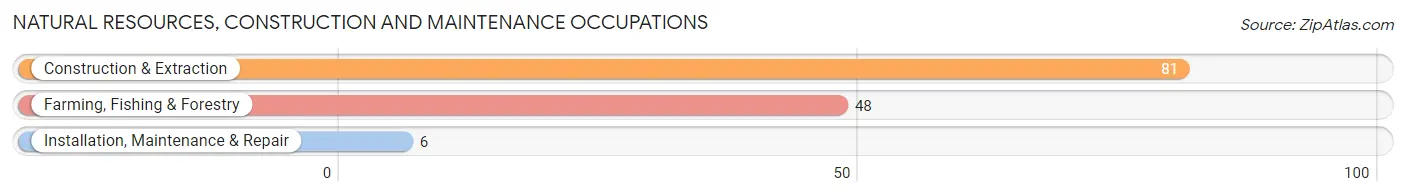
Natural Resources, Construction and Maintenance Occupations
The most common Natural Resources, Construction and Maintenance occupations in Paul are Construction & Extraction (81 | 12.9%), Farming, Fishing & Forestry (48 | 7.6%), and Installation, Maintenance & Repair (6 | 1.0%).
Natural Resources, Construction and Maintenance Occupations by Sex
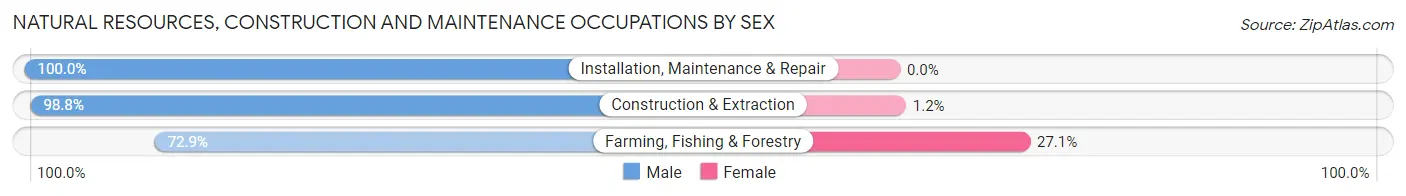
| Occupation | Male | Female |
| Farming, Fishing & Forestry | 35 (72.9%) | 13 (27.1%) |
| Construction & Extraction | 80 (98.8%) | 1 (1.2%) |
| Installation, Maintenance & Repair | 6 (100.0%) | 0 (0.0%) |
| Total (Category) | 121 (89.6%) | 14 (10.4%) |
| Total (Overall) | 405 (64.5%) | 223 (35.5%) |
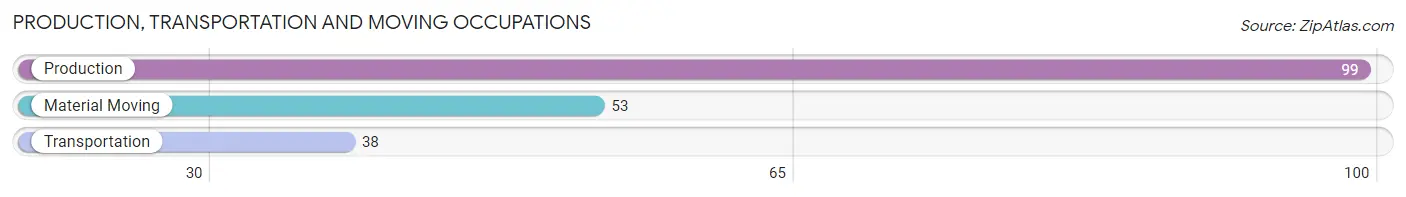
Production, Transportation and Moving Occupations
The most common Production, Transportation and Moving occupations in Paul are Production (99 | 15.8%), Material Moving (53 | 8.4%), and Transportation (38 | 6.0%).
Production, Transportation and Moving Occupations by Sex
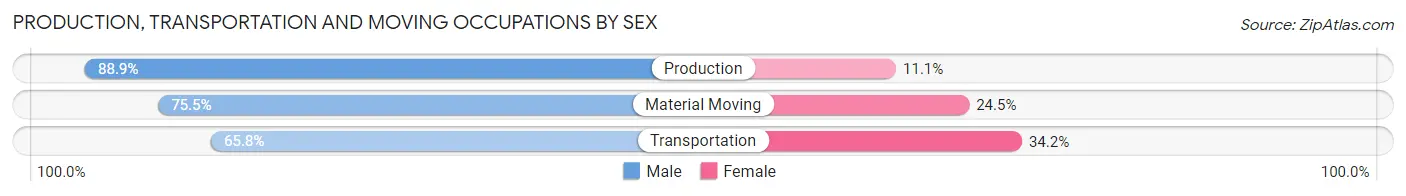
| Occupation | Male | Female |
| Production | 88 (88.9%) | 11 (11.1%) |
| Transportation | 25 (65.8%) | 13 (34.2%) |
| Material Moving | 40 (75.5%) | 13 (24.5%) |
| Total (Category) | 153 (80.5%) | 37 (19.5%) |
| Total (Overall) | 405 (64.5%) | 223 (35.5%) |
Employment Industries by Sex in Paul
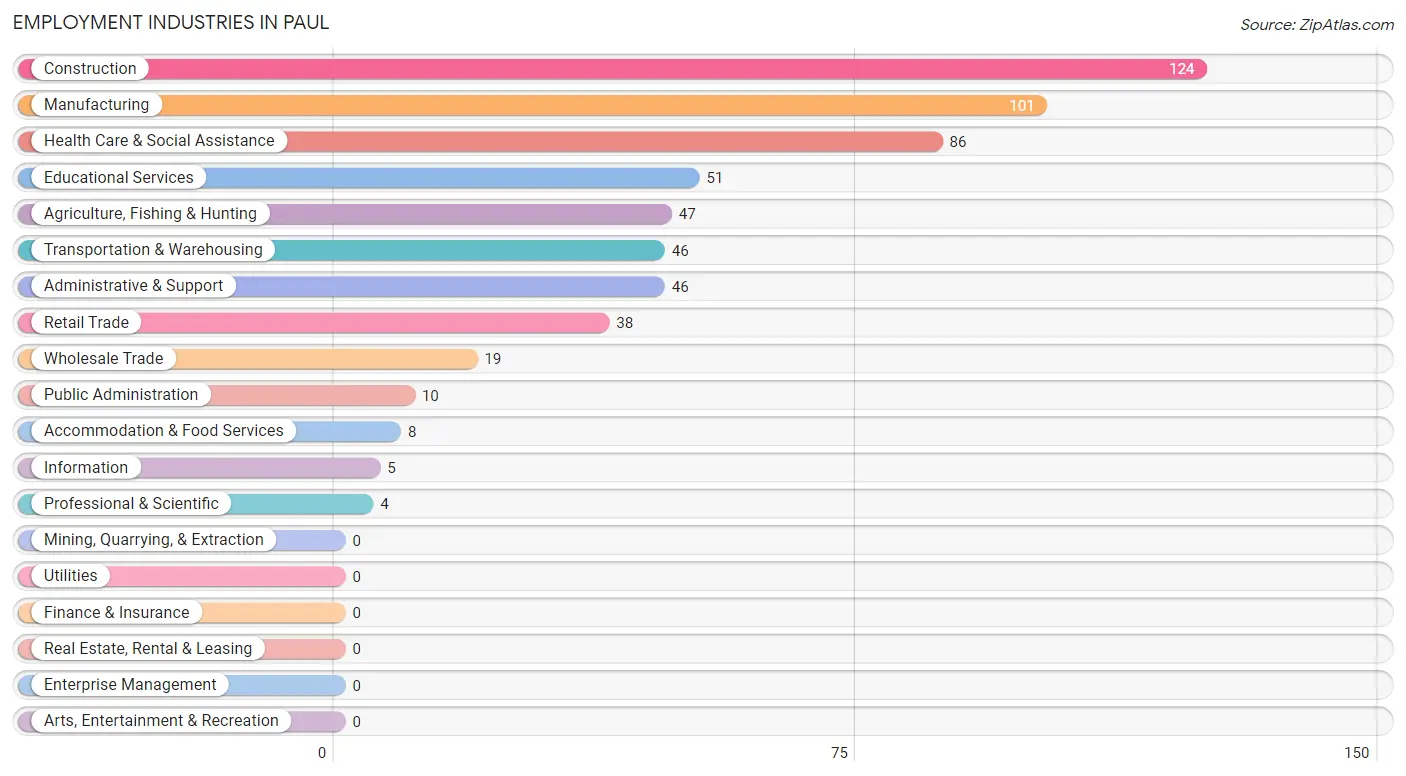
Employment Industries in Paul
The major employment industries in Paul include Construction (124 | 19.8%), Manufacturing (101 | 16.1%), Health Care & Social Assistance (86 | 13.7%), Educational Services (51 | 8.1%), and Agriculture, Fishing & Hunting (47 | 7.5%).
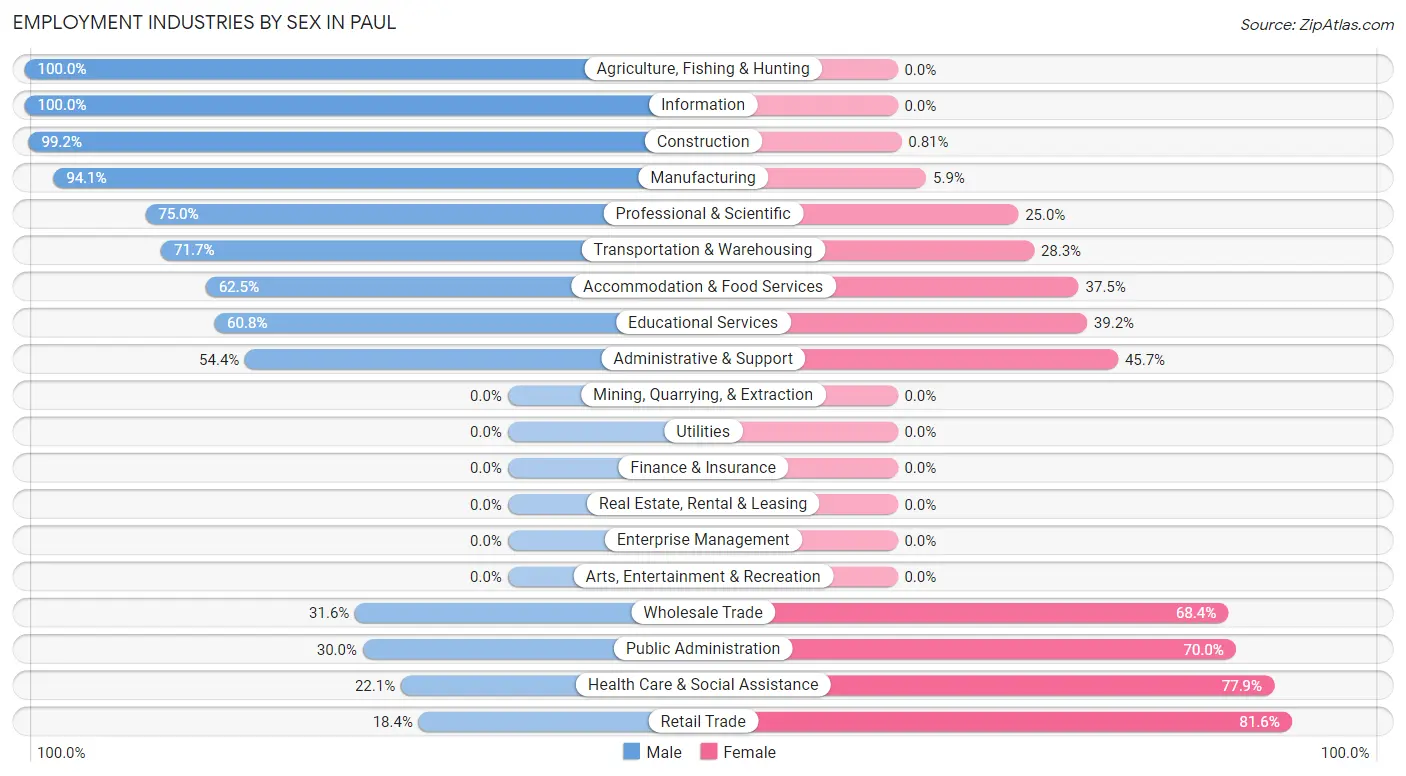
Employment Industries by Sex in Paul
The Paul industries that see more men than women are Agriculture, Fishing & Hunting (100.0%), Information (100.0%), and Construction (99.2%), whereas the industries that tend to have a higher number of women are Retail Trade (81.6%), Health Care & Social Assistance (77.9%), and Public Administration (70.0%).
| Industry | Male | Female |
| Agriculture, Fishing & Hunting | 47 (100.0%) | 0 (0.0%) |
| Mining, Quarrying, & Extraction | 0 (0.0%) | 0 (0.0%) |
| Construction | 123 (99.2%) | 1 (0.8%) |
| Manufacturing | 95 (94.1%) | 6 (5.9%) |
| Wholesale Trade | 6 (31.6%) | 13 (68.4%) |
| Retail Trade | 7 (18.4%) | 31 (81.6%) |
| Transportation & Warehousing | 33 (71.7%) | 13 (28.3%) |
| Utilities | 0 (0.0%) | 0 (0.0%) |
| Information | 5 (100.0%) | 0 (0.0%) |
| Finance & Insurance | 0 (0.0%) | 0 (0.0%) |
| Real Estate, Rental & Leasing | 0 (0.0%) | 0 (0.0%) |
| Professional & Scientific | 3 (75.0%) | 1 (25.0%) |
| Enterprise Management | 0 (0.0%) | 0 (0.0%) |
| Administrative & Support | 25 (54.3%) | 21 (45.7%) |
| Educational Services | 31 (60.8%) | 20 (39.2%) |
| Health Care & Social Assistance | 19 (22.1%) | 67 (77.9%) |
| Arts, Entertainment & Recreation | 0 (0.0%) | 0 (0.0%) |
| Accommodation & Food Services | 5 (62.5%) | 3 (37.5%) |
| Public Administration | 3 (30.0%) | 7 (70.0%) |
| Total | 405 (64.5%) | 223 (35.5%) |
Education in Paul
School Enrollment in Paul
The most common levels of schooling among the 246 students in Paul are middle school (98 | 39.8%), high school (58 | 23.6%), and college / undergraduate (48 | 19.5%).
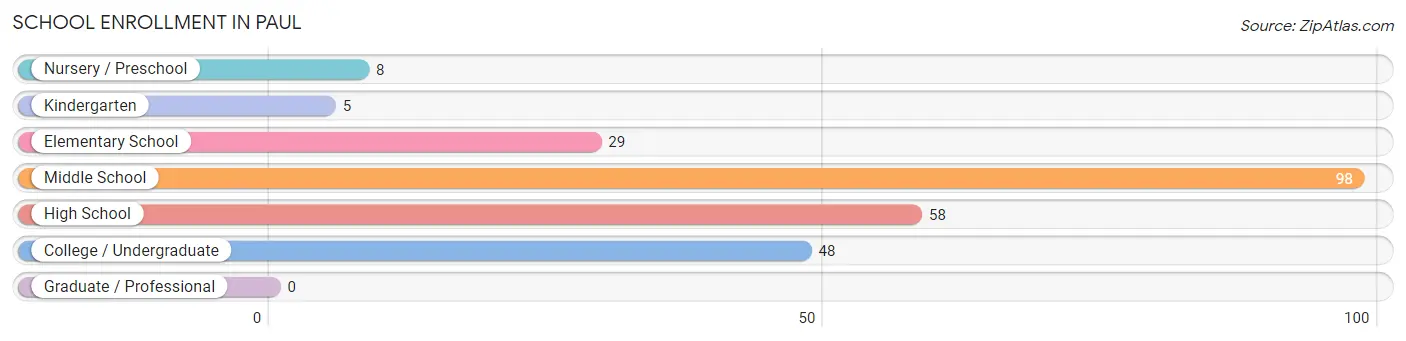
| School Level | # Students | % Students |
| Nursery / Preschool | 8 | 3.3% |
| Kindergarten | 5 | 2.0% |
| Elementary School | 29 | 11.8% |
| Middle School | 98 | 39.8% |
| High School | 58 | 23.6% |
| College / Undergraduate | 48 | 19.5% |
| Graduate / Professional | 0 | 0.0% |
| Total | 246 | 100.0% |
School Enrollment by Age by Funding Source in Paul
Out of a total of 246 students who are enrolled in schools in Paul, 16 (6.5%) attend a private institution, while the remaining 230 (93.5%) are enrolled in public schools. The age group of 3 to 4 year olds has the highest likelihood of being enrolled in private schools, with 8 (100.0% in the age bracket) enrolled. Conversely, the age group of 10 to 14 year olds has the lowest likelihood of being enrolled in a private school, with 109 (100.0% in the age bracket) attending a public institution.
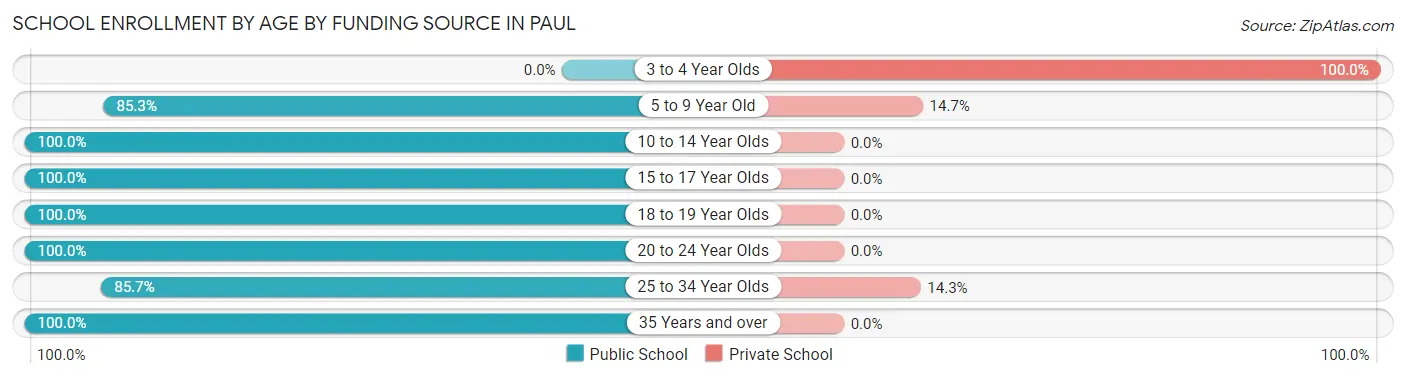
| Age Bracket | Public School | Private School |
| 3 to 4 Year Olds | 0 (0.0%) | 8 (100.0%) |
| 5 to 9 Year Old | 29 (85.3%) | 5 (14.7%) |
| 10 to 14 Year Olds | 109 (100.0%) | 0 (0.0%) |
| 15 to 17 Year Olds | 35 (100.0%) | 0 (0.0%) |
| 18 to 19 Year Olds | 12 (100.0%) | 0 (0.0%) |
| 20 to 24 Year Olds | 8 (100.0%) | 0 (0.0%) |
| 25 to 34 Year Olds | 18 (85.7%) | 3 (14.3%) |
| 35 Years and over | 19 (100.0%) | 0 (0.0%) |
| Total | 230 (93.5%) | 16 (6.5%) |
Educational Attainment by Field of Study in Paul
Business (32 | 22.7%), education (28 | 19.9%), physical & health sciences (24 | 17.0%), science & technology (18 | 12.8%), and social sciences (13 | 9.2%) are the most common fields of study among 141 individuals in Paul who have obtained a bachelor's degree or higher.
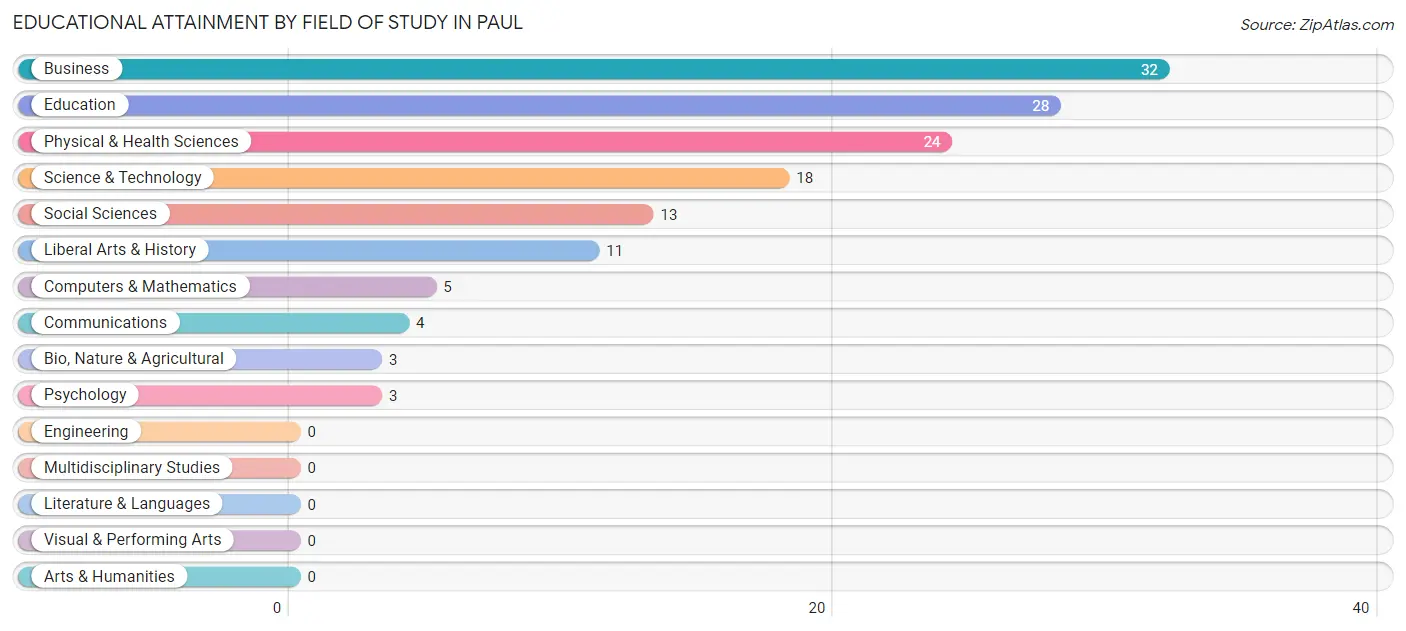
| Field of Study | # Graduates | % Graduates |
| Computers & Mathematics | 5 | 3.5% |
| Bio, Nature & Agricultural | 3 | 2.1% |
| Physical & Health Sciences | 24 | 17.0% |
| Psychology | 3 | 2.1% |
| Social Sciences | 13 | 9.2% |
| Engineering | 0 | 0.0% |
| Multidisciplinary Studies | 0 | 0.0% |
| Science & Technology | 18 | 12.8% |
| Business | 32 | 22.7% |
| Education | 28 | 19.9% |
| Literature & Languages | 0 | 0.0% |
| Liberal Arts & History | 11 | 7.8% |
| Visual & Performing Arts | 0 | 0.0% |
| Communications | 4 | 2.8% |
| Arts & Humanities | 0 | 0.0% |
| Total | 141 | 100.0% |
Transportation & Commute in Paul
Vehicle Availability by Sex in Paul
The most prevalent vehicle ownership categories in Paul are males with 2 vehicles (171, accounting for 42.2%) and females with 2 vehicles (108, making up 81.4%).
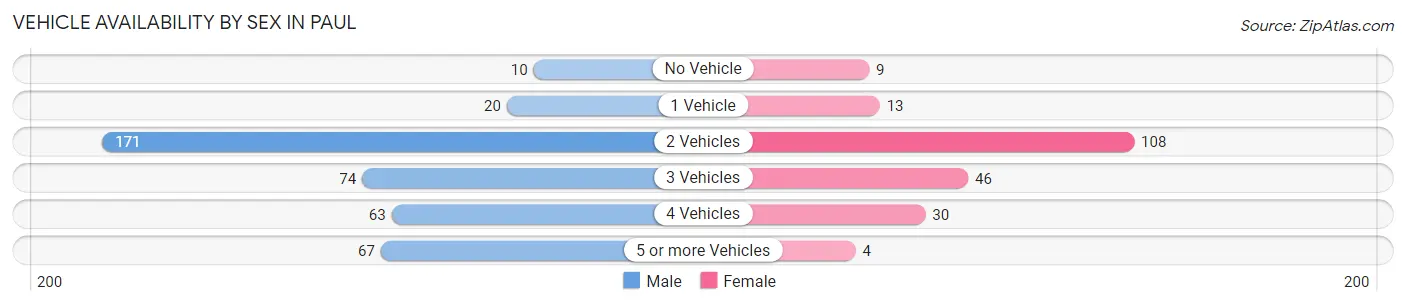
| Vehicles Available | Male | Female |
| No Vehicle | 10 (2.5%) | 9 (4.3%) |
| 1 Vehicle | 20 (4.9%) | 13 (6.2%) |
| 2 Vehicles | 171 (42.2%) | 108 (51.4%) |
| 3 Vehicles | 74 (18.3%) | 46 (21.9%) |
| 4 Vehicles | 63 (15.6%) | 30 (14.3%) |
| 5 or more Vehicles | 67 (16.5%) | 4 (1.9%) |
| Total | 405 (100.0%) | 210 (100.0%) |
Commute Time in Paul
The most frequently occuring commute durations in Paul are 10 to 14 minutes (157 commuters, 28.4%), 15 to 19 minutes (115 commuters, 20.8%), and 5 to 9 minutes (107 commuters, 19.4%).
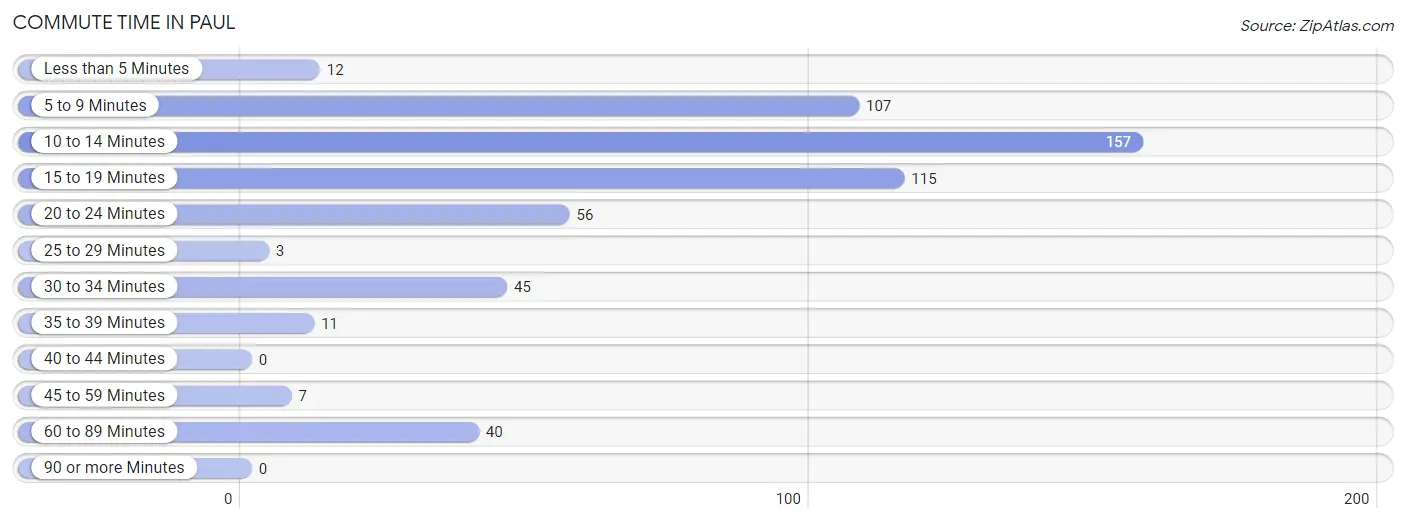
| Commute Time | # Commuters | % Commuters |
| Less than 5 Minutes | 12 | 2.2% |
| 5 to 9 Minutes | 107 | 19.4% |
| 10 to 14 Minutes | 157 | 28.4% |
| 15 to 19 Minutes | 115 | 20.8% |
| 20 to 24 Minutes | 56 | 10.1% |
| 25 to 29 Minutes | 3 | 0.5% |
| 30 to 34 Minutes | 45 | 8.1% |
| 35 to 39 Minutes | 11 | 2.0% |
| 40 to 44 Minutes | 0 | 0.0% |
| 45 to 59 Minutes | 7 | 1.3% |
| 60 to 89 Minutes | 40 | 7.2% |
| 90 or more Minutes | 0 | 0.0% |
Commute Time by Sex in Paul
The most common commute times in Paul are 5 to 9 minutes (78 commuters, 21.6%) for males and 10 to 14 minutes (81 commuters, 42.2%) for females.
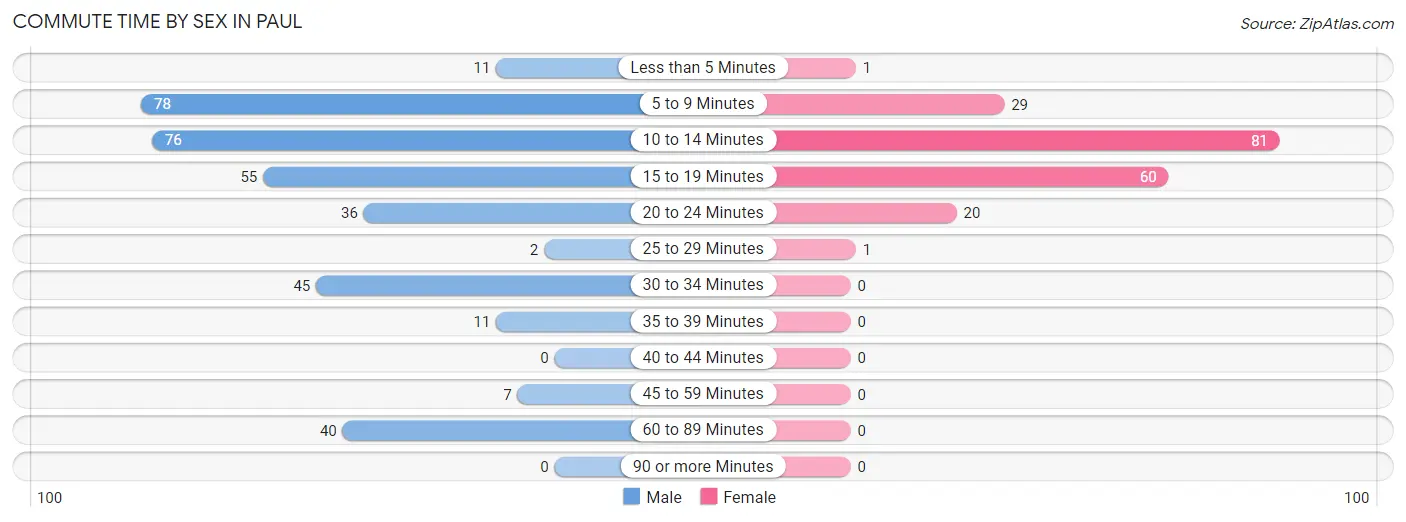
| Commute Time | Male | Female |
| Less than 5 Minutes | 11 (3.0%) | 1 (0.5%) |
| 5 to 9 Minutes | 78 (21.6%) | 29 (15.1%) |
| 10 to 14 Minutes | 76 (21.0%) | 81 (42.2%) |
| 15 to 19 Minutes | 55 (15.2%) | 60 (31.2%) |
| 20 to 24 Minutes | 36 (10.0%) | 20 (10.4%) |
| 25 to 29 Minutes | 2 (0.5%) | 1 (0.5%) |
| 30 to 34 Minutes | 45 (12.5%) | 0 (0.0%) |
| 35 to 39 Minutes | 11 (3.0%) | 0 (0.0%) |
| 40 to 44 Minutes | 0 (0.0%) | 0 (0.0%) |
| 45 to 59 Minutes | 7 (1.9%) | 0 (0.0%) |
| 60 to 89 Minutes | 40 (11.1%) | 0 (0.0%) |
| 90 or more Minutes | 0 (0.0%) | 0 (0.0%) |
Time of Departure to Work by Sex in Paul
The most frequent times of departure to work in Paul are 5:00 AM to 5:29 AM (79, 21.9%) for males and 7:30 AM to 7:59 AM (44, 22.9%) for females.
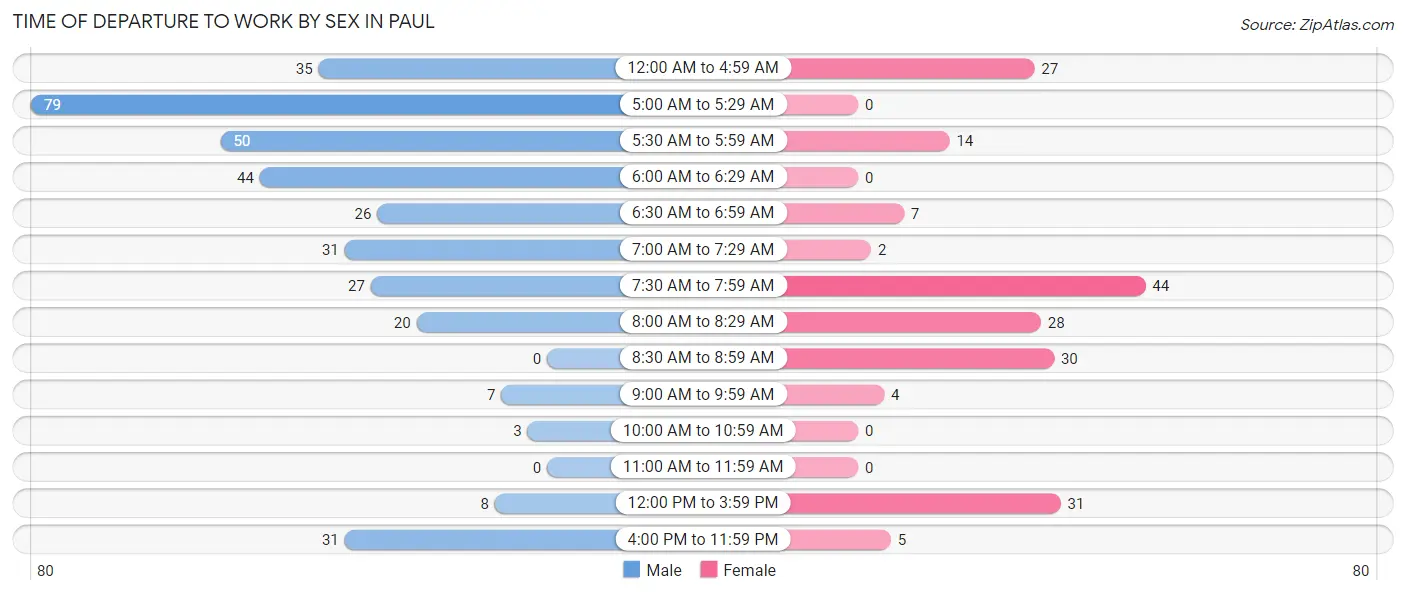
| Time of Departure | Male | Female |
| 12:00 AM to 4:59 AM | 35 (9.7%) | 27 (14.1%) |
| 5:00 AM to 5:29 AM | 79 (21.9%) | 0 (0.0%) |
| 5:30 AM to 5:59 AM | 50 (13.9%) | 14 (7.3%) |
| 6:00 AM to 6:29 AM | 44 (12.2%) | 0 (0.0%) |
| 6:30 AM to 6:59 AM | 26 (7.2%) | 7 (3.6%) |
| 7:00 AM to 7:29 AM | 31 (8.6%) | 2 (1.0%) |
| 7:30 AM to 7:59 AM | 27 (7.5%) | 44 (22.9%) |
| 8:00 AM to 8:29 AM | 20 (5.5%) | 28 (14.6%) |
| 8:30 AM to 8:59 AM | 0 (0.0%) | 30 (15.6%) |
| 9:00 AM to 9:59 AM | 7 (1.9%) | 4 (2.1%) |
| 10:00 AM to 10:59 AM | 3 (0.8%) | 0 (0.0%) |
| 11:00 AM to 11:59 AM | 0 (0.0%) | 0 (0.0%) |
| 12:00 PM to 3:59 PM | 8 (2.2%) | 31 (16.2%) |
| 4:00 PM to 11:59 PM | 31 (8.6%) | 5 (2.6%) |
| Total | 361 (100.0%) | 192 (100.0%) |
Housing Occupancy in Paul
Occupancy by Ownership in Paul
Of the total 528 dwellings in Paul, owner-occupied units account for 384 (72.7%), while renter-occupied units make up 144 (27.3%).
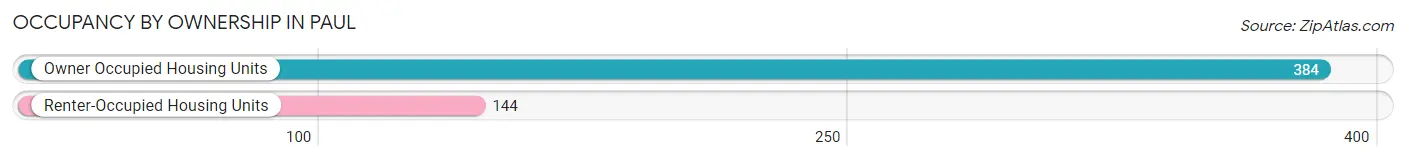
| Occupancy | # Housing Units | % Housing Units |
| Owner Occupied Housing Units | 384 | 72.7% |
| Renter-Occupied Housing Units | 144 | 27.3% |
| Total Occupied Housing Units | 528 | 100.0% |
Occupancy by Household Size in Paul
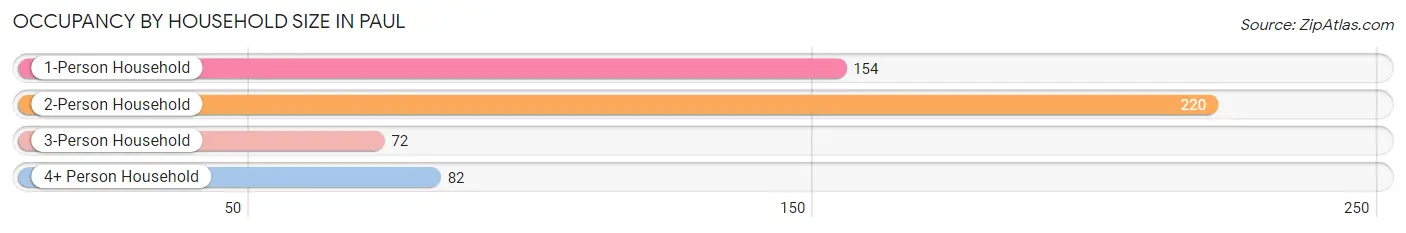
| Household Size | # Housing Units | % Housing Units |
| 1-Person Household | 154 | 29.2% |
| 2-Person Household | 220 | 41.7% |
| 3-Person Household | 72 | 13.6% |
| 4+ Person Household | 82 | 15.5% |
| Total Housing Units | 528 | 100.0% |
Occupancy by Ownership by Household Size in Paul
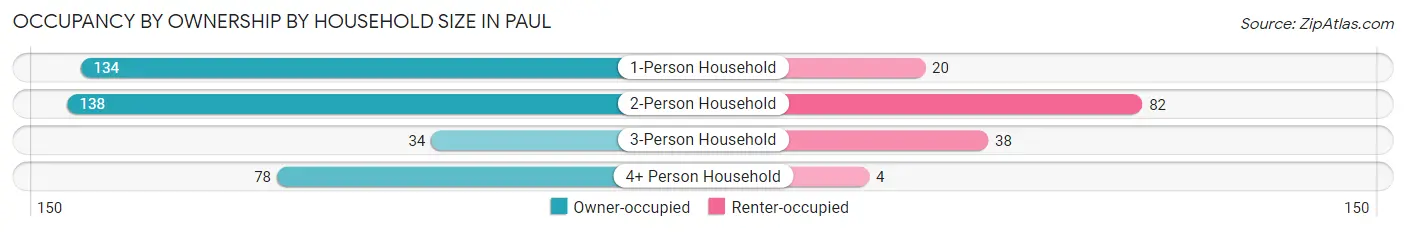
| Household Size | Owner-occupied | Renter-occupied |
| 1-Person Household | 134 (87.0%) | 20 (13.0%) |
| 2-Person Household | 138 (62.7%) | 82 (37.3%) |
| 3-Person Household | 34 (47.2%) | 38 (52.8%) |
| 4+ Person Household | 78 (95.1%) | 4 (4.9%) |
| Total Housing Units | 384 (72.7%) | 144 (27.3%) |
Occupancy by Educational Attainment in Paul
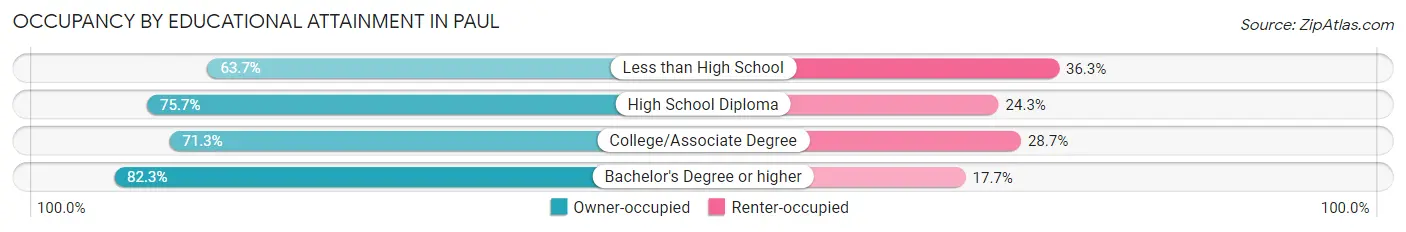
| Household Size | Owner-occupied | Renter-occupied |
| Less than High School | 58 (63.7%) | 33 (36.3%) |
| High School Diploma | 131 (75.7%) | 42 (24.3%) |
| College/Associate Degree | 144 (71.3%) | 58 (28.7%) |
| Bachelor's Degree or higher | 51 (82.3%) | 11 (17.7%) |
Occupancy by Age of Householder in Paul
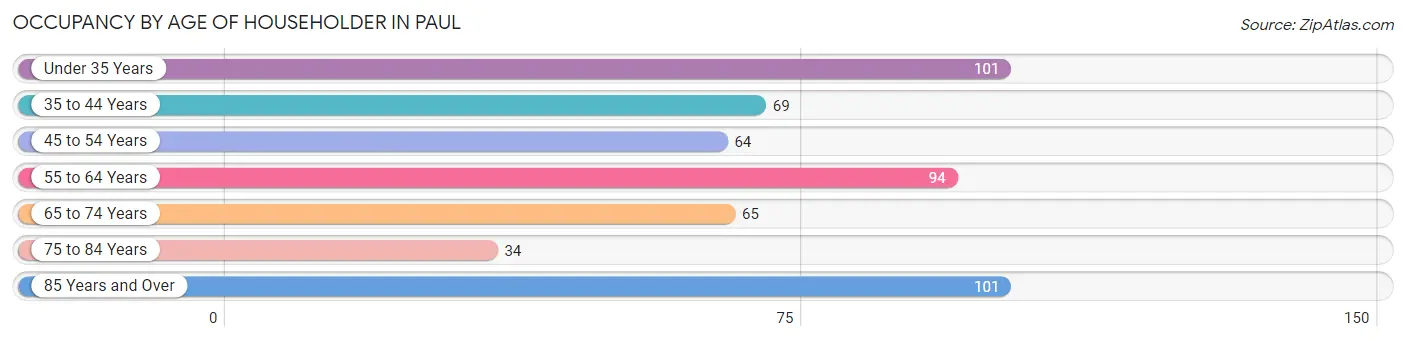
| Age Bracket | # Households | % Households |
| Under 35 Years | 101 | 19.1% |
| 35 to 44 Years | 69 | 13.1% |
| 45 to 54 Years | 64 | 12.1% |
| 55 to 64 Years | 94 | 17.8% |
| 65 to 74 Years | 65 | 12.3% |
| 75 to 84 Years | 34 | 6.4% |
| 85 Years and Over | 101 | 19.1% |
| Total | 528 | 100.0% |
Housing Finances in Paul
Median Income by Occupancy in Paul
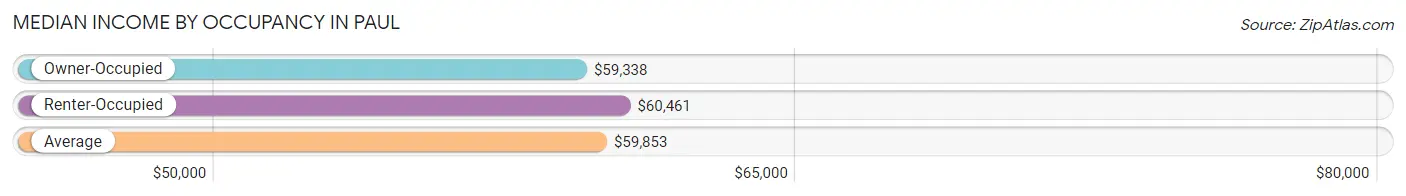
| Occupancy Type | # Households | Median Income |
| Owner-Occupied | 384 (72.7%) | $59,338 |
| Renter-Occupied | 144 (27.3%) | $60,461 |
| Average | 528 (100.0%) | $59,853 |
Occupancy by Householder Income Bracket in Paul
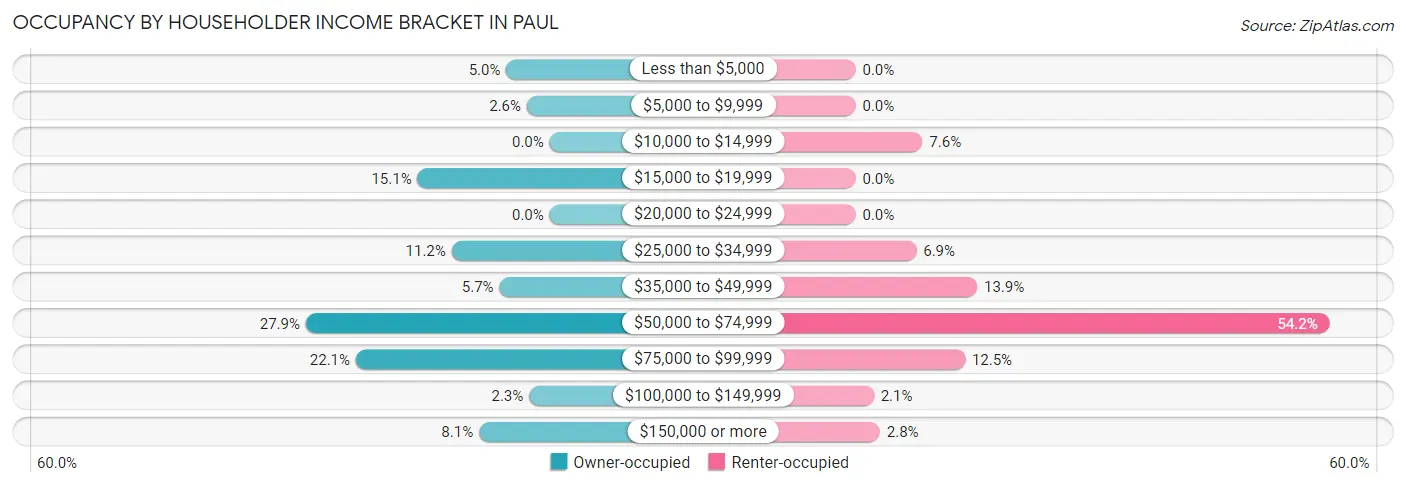
| Income Bracket | Owner-occupied | Renter-occupied |
| Less than $5,000 | 19 (5.0%) | 0 (0.0%) |
| $5,000 to $9,999 | 10 (2.6%) | 0 (0.0%) |
| $10,000 to $14,999 | 0 (0.0%) | 11 (7.6%) |
| $15,000 to $19,999 | 58 (15.1%) | 0 (0.0%) |
| $20,000 to $24,999 | 0 (0.0%) | 0 (0.0%) |
| $25,000 to $34,999 | 43 (11.2%) | 10 (6.9%) |
| $35,000 to $49,999 | 22 (5.7%) | 20 (13.9%) |
| $50,000 to $74,999 | 107 (27.9%) | 78 (54.2%) |
| $75,000 to $99,999 | 85 (22.1%) | 18 (12.5%) |
| $100,000 to $149,999 | 9 (2.3%) | 3 (2.1%) |
| $150,000 or more | 31 (8.1%) | 4 (2.8%) |
| Total | 384 (100.0%) | 144 (100.0%) |
Monthly Housing Cost Tiers in Paul
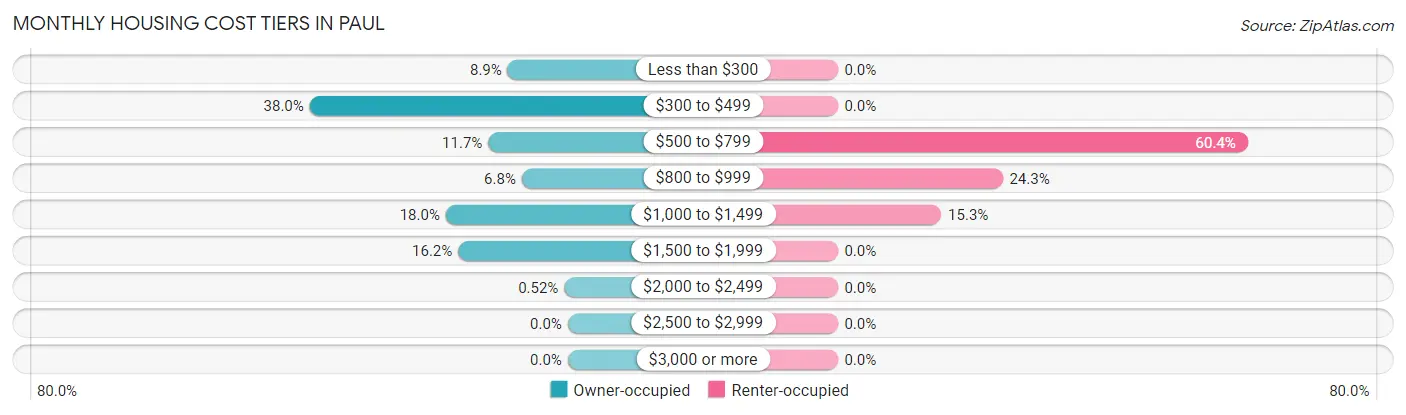
| Monthly Cost | Owner-occupied | Renter-occupied |
| Less than $300 | 34 (8.8%) | 0 (0.0%) |
| $300 to $499 | 146 (38.0%) | 0 (0.0%) |
| $500 to $799 | 45 (11.7%) | 87 (60.4%) |
| $800 to $999 | 26 (6.8%) | 35 (24.3%) |
| $1,000 to $1,499 | 69 (18.0%) | 22 (15.3%) |
| $1,500 to $1,999 | 62 (16.2%) | 0 (0.0%) |
| $2,000 to $2,499 | 2 (0.5%) | 0 (0.0%) |
| $2,500 to $2,999 | 0 (0.0%) | 0 (0.0%) |
| $3,000 or more | 0 (0.0%) | 0 (0.0%) |
| Total | 384 (100.0%) | 144 (100.0%) |
Physical Housing Characteristics in Paul
Housing Structures in Paul
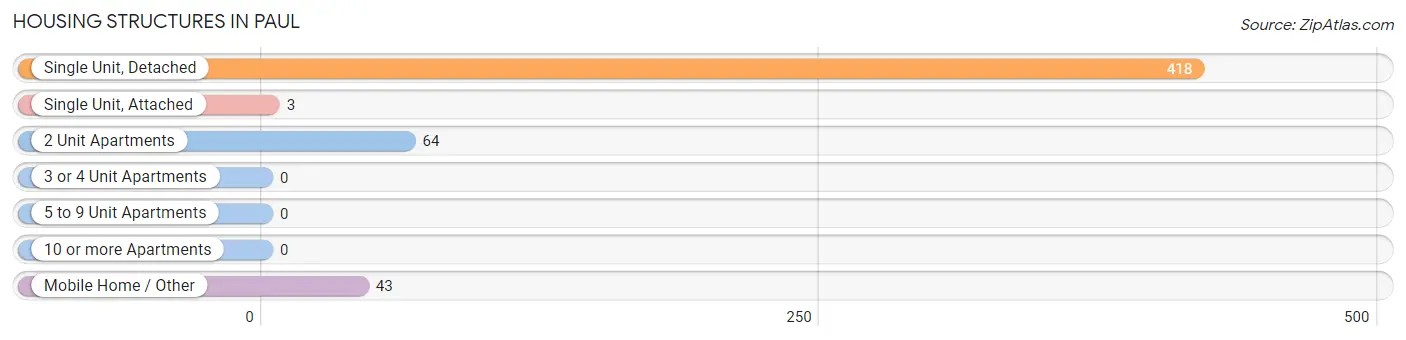
| Structure Type | # Housing Units | % Housing Units |
| Single Unit, Detached | 418 | 79.2% |
| Single Unit, Attached | 3 | 0.6% |
| 2 Unit Apartments | 64 | 12.1% |
| 3 or 4 Unit Apartments | 0 | 0.0% |
| 5 to 9 Unit Apartments | 0 | 0.0% |
| 10 or more Apartments | 0 | 0.0% |
| Mobile Home / Other | 43 | 8.1% |
| Total | 528 | 100.0% |
Housing Structures by Occupancy in Paul
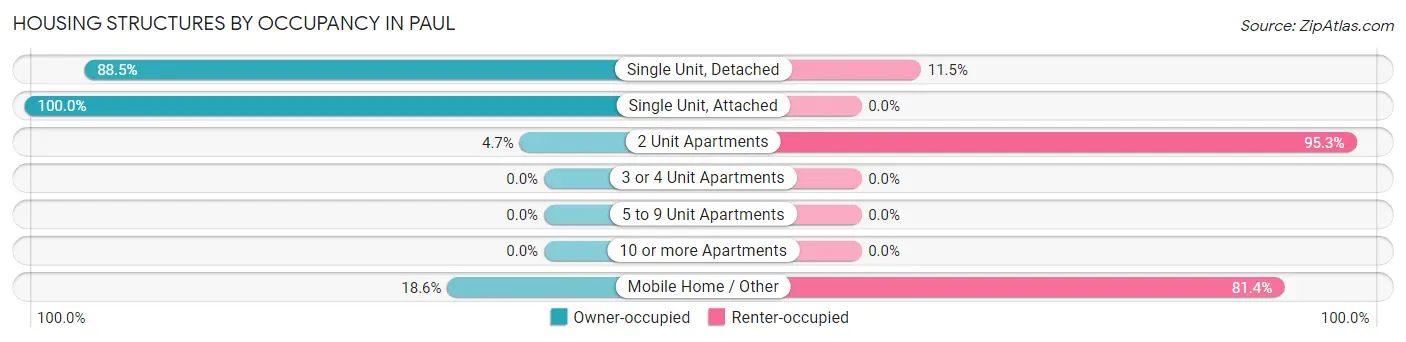
| Structure Type | Owner-occupied | Renter-occupied |
| Single Unit, Detached | 370 (88.5%) | 48 (11.5%) |
| Single Unit, Attached | 3 (100.0%) | 0 (0.0%) |
| 2 Unit Apartments | 3 (4.7%) | 61 (95.3%) |
| 3 or 4 Unit Apartments | 0 (0.0%) | 0 (0.0%) |
| 5 to 9 Unit Apartments | 0 (0.0%) | 0 (0.0%) |
| 10 or more Apartments | 0 (0.0%) | 0 (0.0%) |
| Mobile Home / Other | 8 (18.6%) | 35 (81.4%) |
| Total | 384 (72.7%) | 144 (27.3%) |
Housing Structures by Number of Rooms in Paul
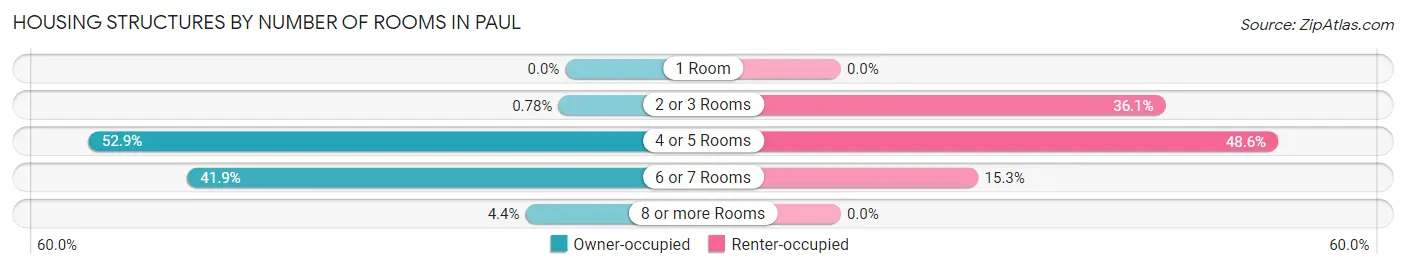
| Number of Rooms | Owner-occupied | Renter-occupied |
| 1 Room | 0 (0.0%) | 0 (0.0%) |
| 2 or 3 Rooms | 3 (0.8%) | 52 (36.1%) |
| 4 or 5 Rooms | 203 (52.9%) | 70 (48.6%) |
| 6 or 7 Rooms | 161 (41.9%) | 22 (15.3%) |
| 8 or more Rooms | 17 (4.4%) | 0 (0.0%) |
| Total | 384 (100.0%) | 144 (100.0%) |
Housing Structure by Heating Type in Paul
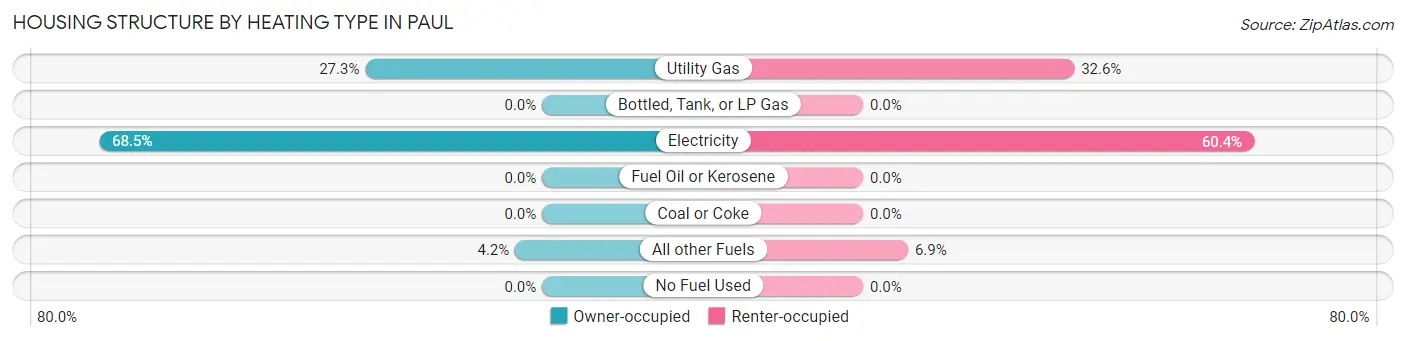
| Heating Type | Owner-occupied | Renter-occupied |
| Utility Gas | 105 (27.3%) | 47 (32.6%) |
| Bottled, Tank, or LP Gas | 0 (0.0%) | 0 (0.0%) |
| Electricity | 263 (68.5%) | 87 (60.4%) |
| Fuel Oil or Kerosene | 0 (0.0%) | 0 (0.0%) |
| Coal or Coke | 0 (0.0%) | 0 (0.0%) |
| All other Fuels | 16 (4.2%) | 10 (6.9%) |
| No Fuel Used | 0 (0.0%) | 0 (0.0%) |
| Total | 384 (100.0%) | 144 (100.0%) |
Household Vehicle Usage in Paul
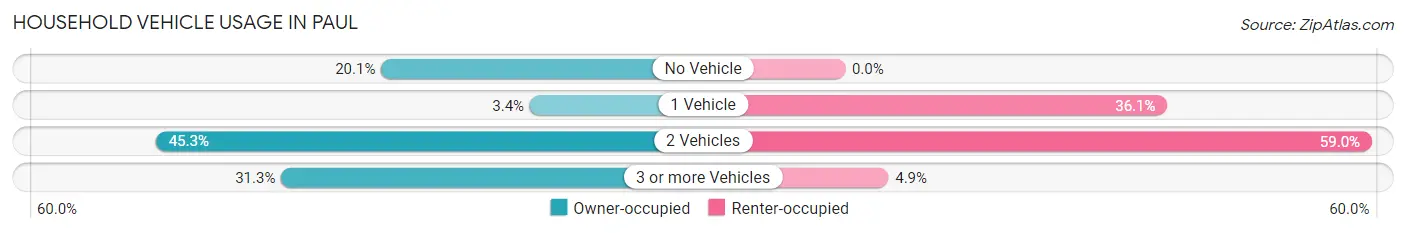
| Vehicles per Household | Owner-occupied | Renter-occupied |
| No Vehicle | 77 (20.1%) | 0 (0.0%) |
| 1 Vehicle | 13 (3.4%) | 52 (36.1%) |
| 2 Vehicles | 174 (45.3%) | 85 (59.0%) |
| 3 or more Vehicles | 120 (31.2%) | 7 (4.9%) |
| Total | 384 (100.0%) | 144 (100.0%) |
Real Estate & Mortgages in Paul
Real Estate and Mortgage Overview in Paul
| Characteristic | Without Mortgage | With Mortgage |
| Housing Units | 206 | 178 |
| Median Property Value | $228,100 | $195,600 |
| Median Household Income | $56,500 | $17 |
| Monthly Housing Costs | $398 | $0 |
| Real Estate Taxes | $987 | $12 |
Property Value by Mortgage Status in Paul
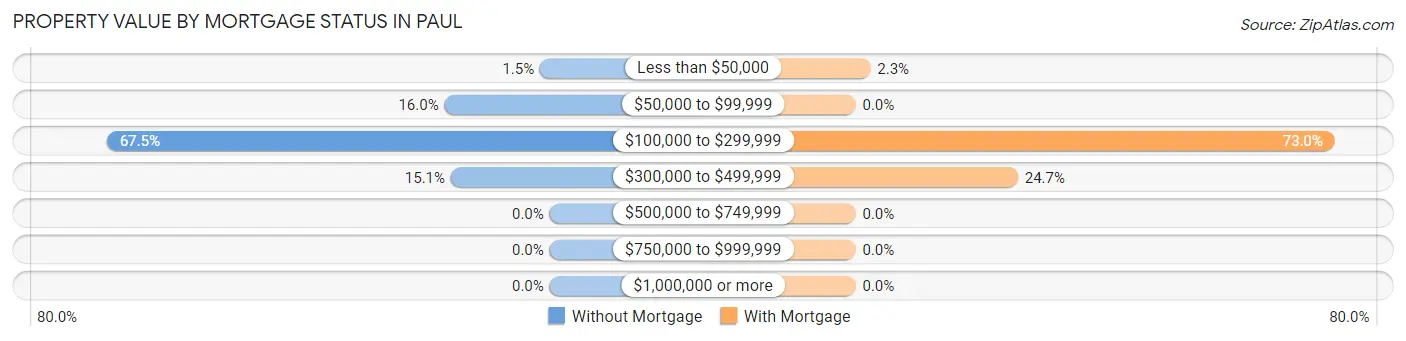
| Property Value | Without Mortgage | With Mortgage |
| Less than $50,000 | 3 (1.5%) | 4 (2.2%) |
| $50,000 to $99,999 | 33 (16.0%) | 0 (0.0%) |
| $100,000 to $299,999 | 139 (67.5%) | 130 (73.0%) |
| $300,000 to $499,999 | 31 (15.0%) | 44 (24.7%) |
| $500,000 to $749,999 | 0 (0.0%) | 0 (0.0%) |
| $750,000 to $999,999 | 0 (0.0%) | 0 (0.0%) |
| $1,000,000 or more | 0 (0.0%) | 0 (0.0%) |
| Total | 206 (100.0%) | 178 (100.0%) |
Household Income by Mortgage Status in Paul
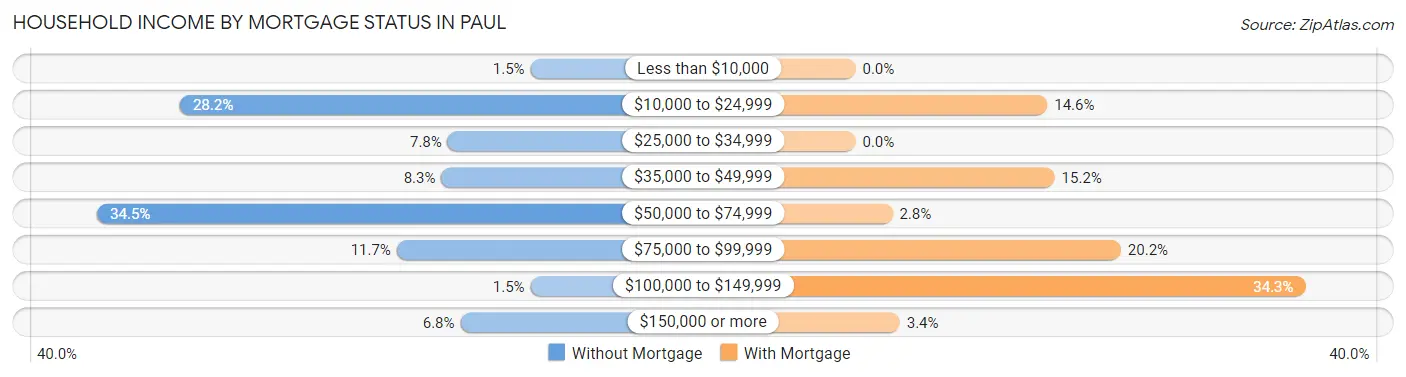
| Household Income | Without Mortgage | With Mortgage |
| Less than $10,000 | 3 (1.5%) | 0 (0.0%) |
| $10,000 to $24,999 | 58 (28.2%) | 26 (14.6%) |
| $25,000 to $34,999 | 16 (7.8%) | 0 (0.0%) |
| $35,000 to $49,999 | 17 (8.3%) | 27 (15.2%) |
| $50,000 to $74,999 | 71 (34.5%) | 5 (2.8%) |
| $75,000 to $99,999 | 24 (11.7%) | 36 (20.2%) |
| $100,000 to $149,999 | 3 (1.5%) | 61 (34.3%) |
| $150,000 or more | 14 (6.8%) | 6 (3.4%) |
| Total | 206 (100.0%) | 178 (100.0%) |
Property Value to Household Income Ratio in Paul
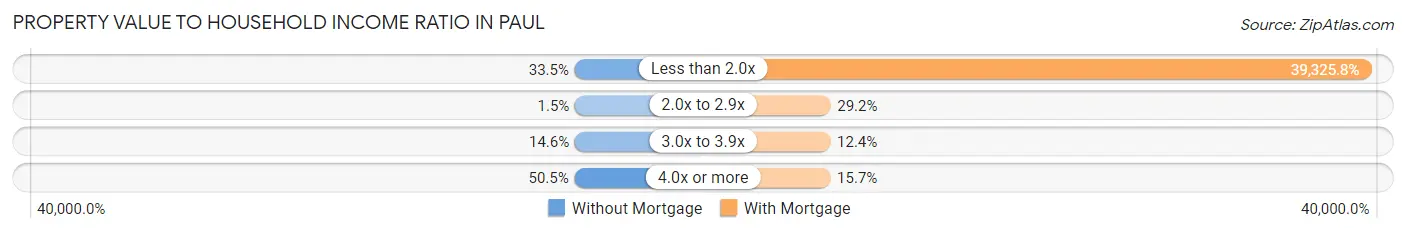
| Value-to-Income Ratio | Without Mortgage | With Mortgage |
| Less than 2.0x | 69 (33.5%) | 70,000 (39,325.8%) |
| 2.0x to 2.9x | 3 (1.5%) | 52 (29.2%) |
| 3.0x to 3.9x | 30 (14.6%) | 22 (12.4%) |
| 4.0x or more | 104 (50.5%) | 28 (15.7%) |
| Total | 206 (100.0%) | 178 (100.0%) |
Real Estate Taxes by Mortgage Status in Paul
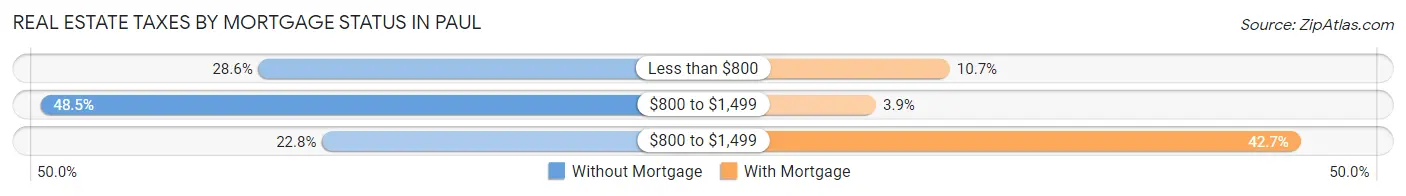
| Property Taxes | Without Mortgage | With Mortgage |
| Less than $800 | 59 (28.6%) | 19 (10.7%) |
| $800 to $1,499 | 100 (48.5%) | 7 (3.9%) |
| $800 to $1,499 | 47 (22.8%) | 76 (42.7%) |
| Total | 206 (100.0%) | 178 (100.0%) |
Health & Disability in Paul
Health Insurance Coverage by Age in Paul
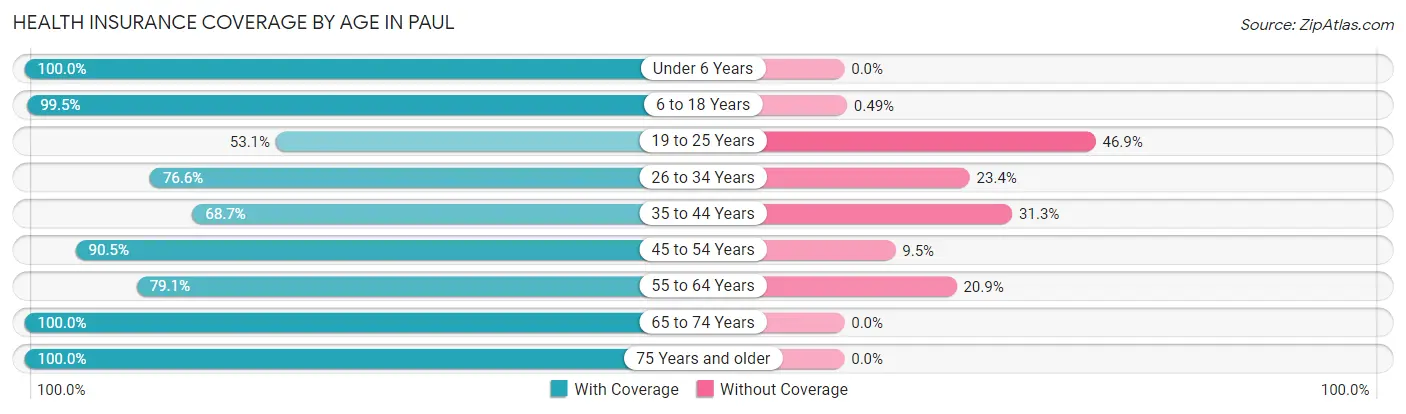
| Age Bracket | With Coverage | Without Coverage |
| Under 6 Years | 144 (100.0%) | 0 (0.0%) |
| 6 to 18 Years | 204 (99.5%) | 1 (0.5%) |
| 19 to 25 Years | 93 (53.1%) | 82 (46.9%) |
| 26 to 34 Years | 59 (76.6%) | 18 (23.4%) |
| 35 to 44 Years | 79 (68.7%) | 36 (31.3%) |
| 45 to 54 Years | 171 (90.5%) | 18 (9.5%) |
| 55 to 64 Years | 121 (79.1%) | 32 (20.9%) |
| 65 to 74 Years | 93 (100.0%) | 0 (0.0%) |
| 75 Years and older | 183 (100.0%) | 0 (0.0%) |
| Total | 1,147 (86.0%) | 187 (14.0%) |
Health Insurance Coverage by Citizenship Status in Paul
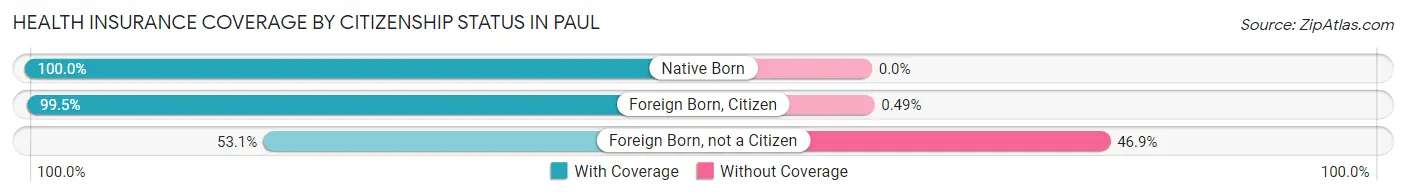
| Citizenship Status | With Coverage | Without Coverage |
| Native Born | 144 (100.0%) | 0 (0.0%) |
| Foreign Born, Citizen | 204 (99.5%) | 1 (0.5%) |
| Foreign Born, not a Citizen | 93 (53.1%) | 82 (46.9%) |
Health Insurance Coverage by Household Income in Paul
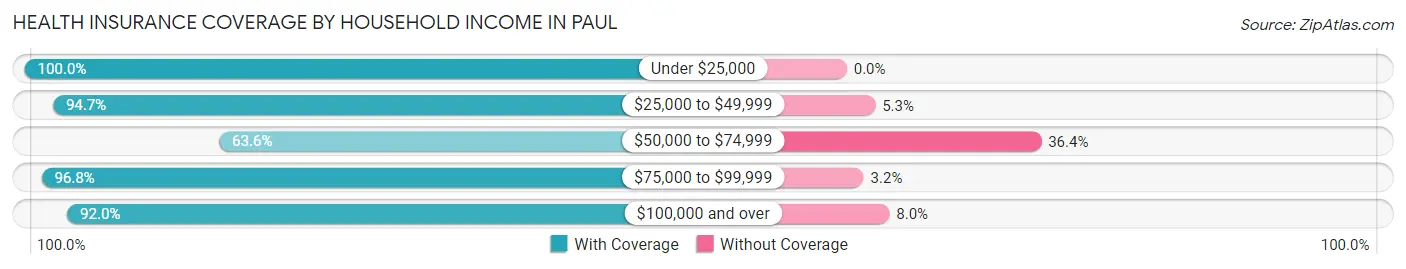
| Household Income | With Coverage | Without Coverage |
| Under $25,000 | 98 (100.0%) | 0 (0.0%) |
| $25,000 to $49,999 | 178 (94.7%) | 10 (5.3%) |
| $50,000 to $74,999 | 253 (63.6%) | 145 (36.4%) |
| $75,000 to $99,999 | 399 (96.8%) | 13 (3.2%) |
| $100,000 and over | 219 (92.0%) | 19 (8.0%) |
Public vs Private Health Insurance Coverage by Age in Paul
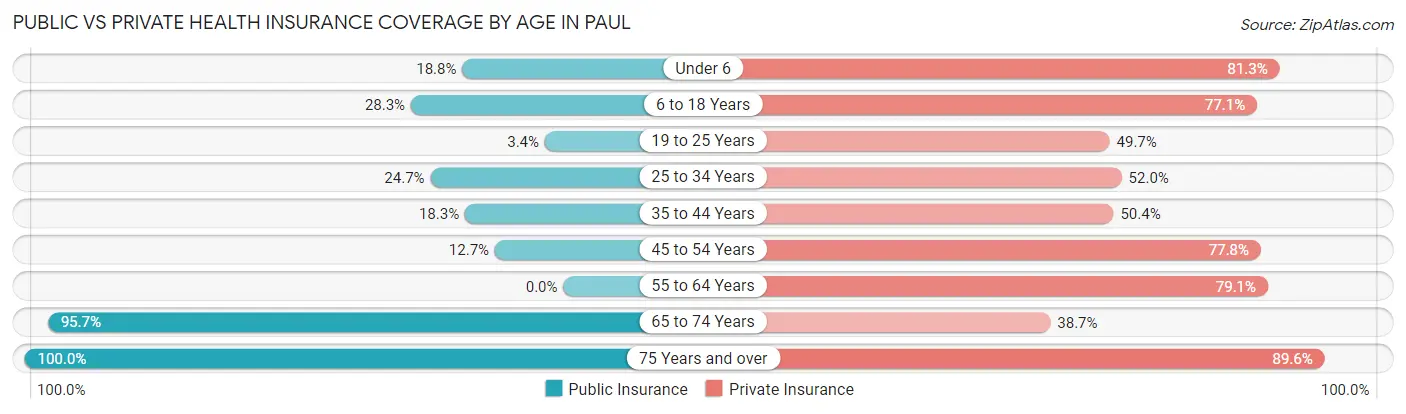
| Age Bracket | Public Insurance | Private Insurance |
| Under 6 | 27 (18.8%) | 117 (81.2%) |
| 6 to 18 Years | 58 (28.3%) | 158 (77.1%) |
| 19 to 25 Years | 6 (3.4%) | 87 (49.7%) |
| 25 to 34 Years | 19 (24.7%) | 40 (51.9%) |
| 35 to 44 Years | 21 (18.3%) | 58 (50.4%) |
| 45 to 54 Years | 24 (12.7%) | 147 (77.8%) |
| 55 to 64 Years | 0 (0.0%) | 121 (79.1%) |
| 65 to 74 Years | 89 (95.7%) | 36 (38.7%) |
| 75 Years and over | 183 (100.0%) | 164 (89.6%) |
| Total | 427 (32.0%) | 928 (69.6%) |
Disability Status by Sex by Age in Paul
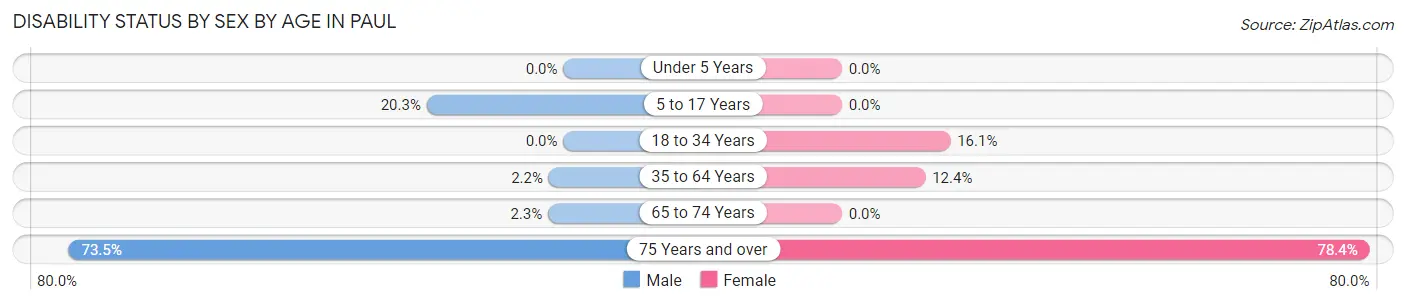
| Age Bracket | Male | Female |
| Under 5 Years | 0 (0.0%) | 0 (0.0%) |
| 5 to 17 Years | 14 (20.3%) | 0 (0.0%) |
| 18 to 34 Years | 0 (0.0%) | 19 (16.1%) |
| 35 to 64 Years | 5 (2.2%) | 28 (12.4%) |
| 65 to 74 Years | 1 (2.3%) | 0 (0.0%) |
| 75 Years and over | 36 (73.5%) | 105 (78.4%) |
Disability Class by Sex by Age in Paul
Disability Class: Hearing Difficulty
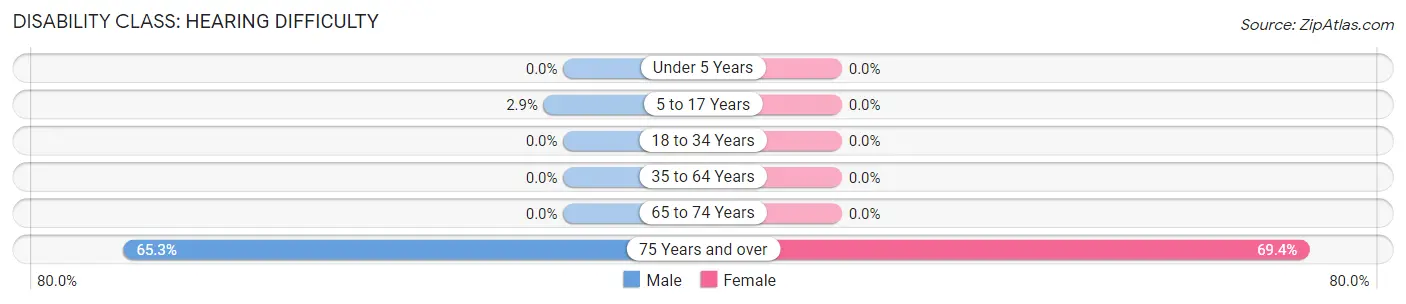
| Age Bracket | Male | Female |
| Under 5 Years | 0 (0.0%) | 0 (0.0%) |
| 5 to 17 Years | 2 (2.9%) | 0 (0.0%) |
| 18 to 34 Years | 0 (0.0%) | 0 (0.0%) |
| 35 to 64 Years | 0 (0.0%) | 0 (0.0%) |
| 65 to 74 Years | 0 (0.0%) | 0 (0.0%) |
| 75 Years and over | 32 (65.3%) | 93 (69.4%) |
Disability Class: Vision Difficulty
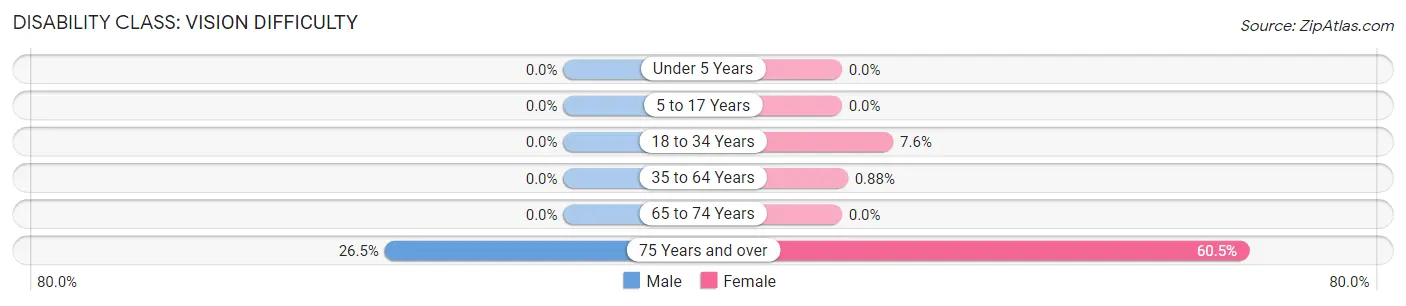
| Age Bracket | Male | Female |
| Under 5 Years | 0 (0.0%) | 0 (0.0%) |
| 5 to 17 Years | 0 (0.0%) | 0 (0.0%) |
| 18 to 34 Years | 0 (0.0%) | 9 (7.6%) |
| 35 to 64 Years | 0 (0.0%) | 2 (0.9%) |
| 65 to 74 Years | 0 (0.0%) | 0 (0.0%) |
| 75 Years and over | 13 (26.5%) | 81 (60.5%) |
Disability Class: Cognitive Difficulty
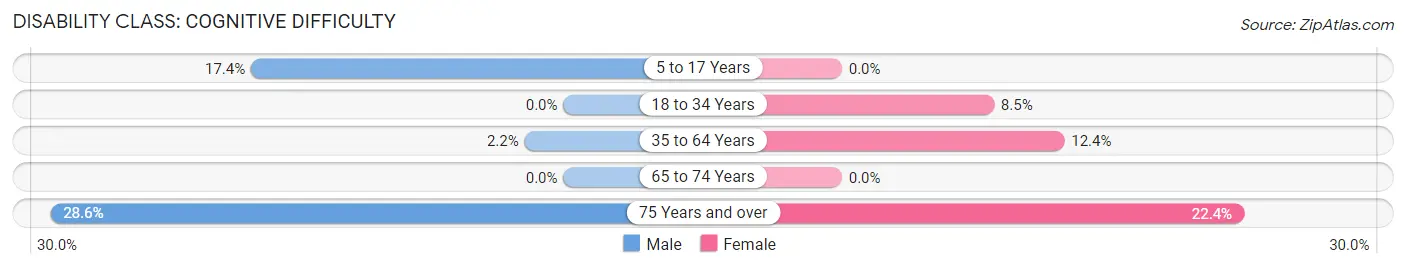
| Age Bracket | Male | Female |
| 5 to 17 Years | 12 (17.4%) | 0 (0.0%) |
| 18 to 34 Years | 0 (0.0%) | 10 (8.5%) |
| 35 to 64 Years | 5 (2.2%) | 28 (12.4%) |
| 65 to 74 Years | 0 (0.0%) | 0 (0.0%) |
| 75 Years and over | 14 (28.6%) | 30 (22.4%) |
Disability Class: Ambulatory Difficulty
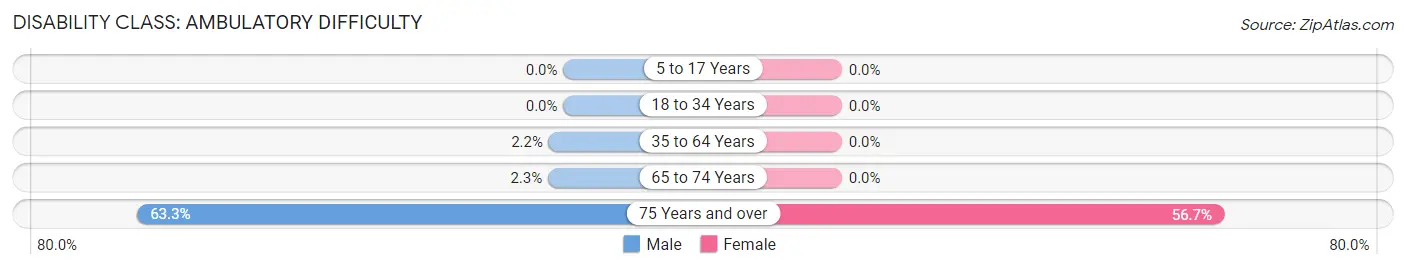
| Age Bracket | Male | Female |
| 5 to 17 Years | 0 (0.0%) | 0 (0.0%) |
| 18 to 34 Years | 0 (0.0%) | 0 (0.0%) |
| 35 to 64 Years | 5 (2.2%) | 0 (0.0%) |
| 65 to 74 Years | 1 (2.3%) | 0 (0.0%) |
| 75 Years and over | 31 (63.3%) | 76 (56.7%) |
Disability Class: Self-Care Difficulty
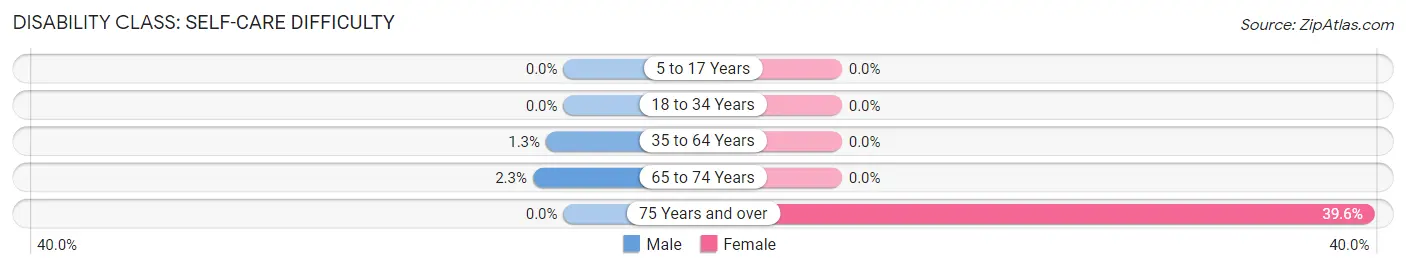
| Age Bracket | Male | Female |
| 5 to 17 Years | 0 (0.0%) | 0 (0.0%) |
| 18 to 34 Years | 0 (0.0%) | 0 (0.0%) |
| 35 to 64 Years | 3 (1.3%) | 0 (0.0%) |
| 65 to 74 Years | 1 (2.3%) | 0 (0.0%) |
| 75 Years and over | 0 (0.0%) | 53 (39.6%) |
Technology Access in Paul
Computing Device Access in Paul
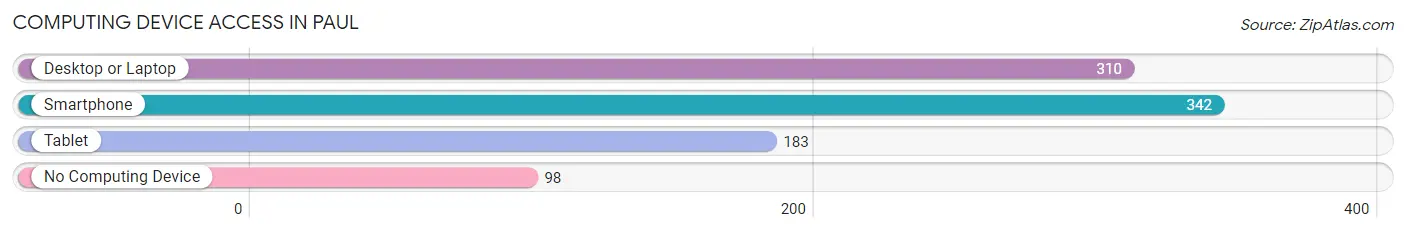
| Device Type | # Households | % Households |
| Desktop or Laptop | 310 | 58.7% |
| Smartphone | 342 | 64.8% |
| Tablet | 183 | 34.7% |
| No Computing Device | 98 | 18.6% |
| Total | 528 | 100.0% |
Internet Access in Paul
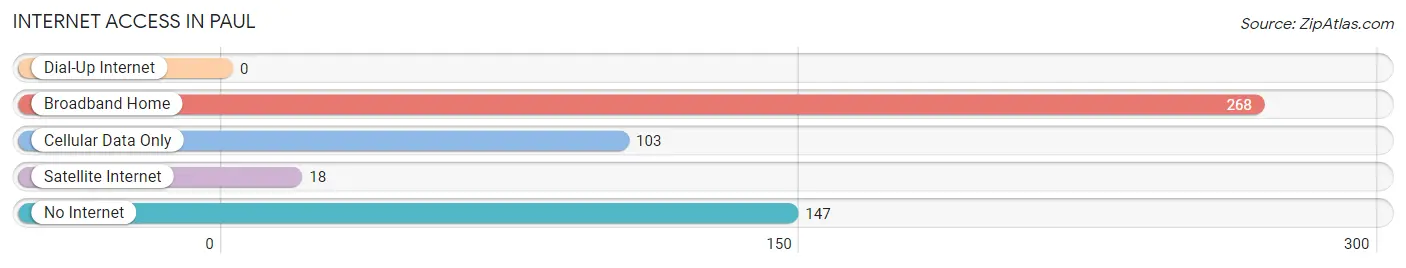
| Internet Type | # Households | % Households |
| Dial-Up Internet | 0 | 0.0% |
| Broadband Home | 268 | 50.8% |
| Cellular Data Only | 103 | 19.5% |
| Satellite Internet | 18 | 3.4% |
| No Internet | 147 | 27.8% |
| Total | 528 | 100.0% |
Paul Summary
Idaho is a state located in the northwestern region of the United States. It is bordered by Montana to the east, Wyoming to the east, Nevada and Utah to the south, and Washington and Oregon to the west. Idaho is the 14th largest state in the United States, with an area of 83,574 square miles, and the 11th most populous, with a population of 1.7 million as of 2019. Idaho is known for its rugged terrain, diverse wildlife, and abundant natural resources.
History
The area that is now Idaho has been inhabited by Native American tribes for thousands of years. The first Europeans to explore the region were members of the Lewis and Clark Expedition, who arrived in 1805. The area was part of the Oregon Territory until 1863, when it became part of the Idaho Territory. Idaho became the 43rd state in the Union on July 3, 1890.
Geography
Idaho is located in the northwestern region of the United States. It is bordered by Montana to the east, Wyoming to the east, Nevada and Utah to the south, and Washington and Oregon to the west. Idaho is the 14th largest state in the United States, with an area of 83,574 square miles.
The state is divided into two distinct regions: the Rocky Mountains in the north and the Great Plains in the south. The Rocky Mountains are home to some of the highest peaks in the country, including Mount Borah, which is the highest point in the state at 12,662 feet. The Great Plains are characterized by rolling hills and wide open spaces.
The Snake River is the longest river in the state, running for 1,078 miles from its source in Yellowstone National Park in Wyoming to its mouth in the Columbia River in Washington. Other major rivers in the state include the Clearwater, Salmon, and Payette.
Economy
Idaho’s economy is largely based on agriculture, forestry, and mining. The state is the largest producer of potatoes in the United States, and is also a major producer of wheat, barley, and other grains. Idaho is also a major producer of timber, and is home to several large lumber mills.
Mining is also an important part of the state’s economy, with gold, silver, and other minerals being mined in the state. Tourism is also an important part of the economy, with visitors coming to the state to enjoy its natural beauty and outdoor recreation opportunities.
Demographics
As of 2019, the population of Idaho was estimated to be 1.7 million. The state has a population density of 20.3 people per square mile, making it the 11th most populous state in the United States.
The largest city in Idaho is Boise, with a population of 228,790. Other major cities in the state include Idaho Falls, Pocatello, and Coeur d’Alene.
The racial makeup of Idaho is 87.2% White, 1.2% Black or African American, 1.3% Native American, 1.7% Asian, 0.2% Pacific Islander, and 8.4% from other races. The state also has a large Hispanic or Latino population, making up 13.2% of the population.
The median household income in Idaho is $50,943, and the median home value is $219,400. The state has a poverty rate of 14.2%, and the unemployment rate is 3.2%.
Common Questions
What is Per Capita Income in Paul?
Per Capita income in Paul is $27,568.
What is the Median Family Income in Paul?
Median Family Income in Paul is $64,338.
What is the Median Household income in Paul?
Median Household Income in Paul is $59,853.
What is Income or Wage Gap in Paul?
Income or Wage Gap in Paul is 57.9%.
Women in Paul earn 42.1 cents for every dollar earned by a man.
What is Inequality or Gini Index in Paul?
Inequality or Gini Index in Paul is 0.36.
What is the Total Population of Paul?
Total Population of Paul is 1,334.
What is the Total Male Population of Paul?
Total Male Population of Paul is 629.
What is the Total Female Population of Paul?
Total Female Population of Paul is 705.
What is the Ratio of Males per 100 Females in Paul?
There are 89.22 Males per 100 Females in Paul.
What is the Ratio of Females per 100 Males in Paul?
There are 112.08 Females per 100 Males in Paul.
What is the Median Population Age in Paul?
Median Population Age in Paul is 41.8 Years.
What is the Average Family Size in Paul
Average Family Size in Paul is 3.1 People.
What is the Average Household Size in Paul
Average Household Size in Paul is 2.5 People.
How Large is the Labor Force in Paul?
There are 638 People in the Labor Forcein in Paul.
What is the Percentage of People in the Labor Force in Paul?
62.6% of People are in the Labor Force in Paul.
What is the Unemployment Rate in Paul?
Unemployment Rate in Paul is 1.6%.