Nezperce, ID Map & Demographics
Nezperce Map
Nezperce Overview
$25,713
PER CAPITA INCOME
$64,375
AVG FAMILY INCOME
$55,625
AVG HOUSEHOLD INCOME
57.1%
WAGE / INCOME GAP [ % ]
42.9¢/ $1
WAGE / INCOME GAP [ $ ]
0.43
INEQUALITY / GINI INDEX
518
TOTAL POPULATION
249
MALE POPULATION
269
FEMALE POPULATION
92.57
MALES / 100 FEMALES
108.03
FEMALES / 100 MALES
41.9
MEDIAN AGE
3.0
AVG FAMILY SIZE
2.6
AVG HOUSEHOLD SIZE
165
LABOR FORCE [ PEOPLE ]
43.0%
PERCENT IN LABOR FORCE
4.2%
UNEMPLOYMENT RATE
Nezperce Zip Codes
Nezperce Area Codes
Income in Nezperce
Income Overview in Nezperce
Per Capita Income in Nezperce is $25,713, while median incomes of families and households are $64,375 and $55,625 respectively.
| Characteristic | Number | Measure |
| Per Capita Income | 518 | $25,713 |
| Median Family Income | 133 | $64,375 |
| Mean Family Income | 133 | $72,065 |
| Median Household Income | 192 | $55,625 |
| Mean Household Income | 192 | $66,117 |
| Income Deficit | 133 | $0 |
| Wage / Income Gap (%) | 518 | 57.09% |
| Wage / Income Gap ($) | 518 | 42.91¢ per $1 |
| Gini / Inequality Index | 518 | 0.43 |
Earnings by Sex in Nezperce
Average Earnings in Nezperce are $31,250, $45,156 for men and $19,375 for women, a difference of 57.1%.
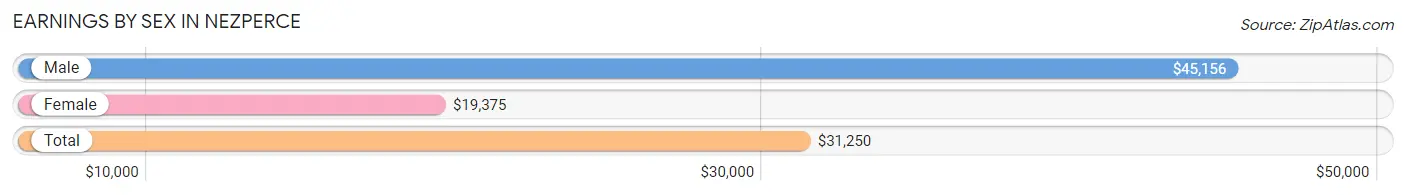
| Sex | Number | Average Earnings |
| Male | 123 (60.6%) | $45,156 |
| Female | 80 (39.4%) | $19,375 |
| Total | 203 (100.0%) | $31,250 |
Earnings by Sex by Income Bracket in Nezperce
The most common earnings brackets in Nezperce are $65,000 to $74,999 for men (18 | 14.6%) and $2,499 or less for women (25 | 31.2%).
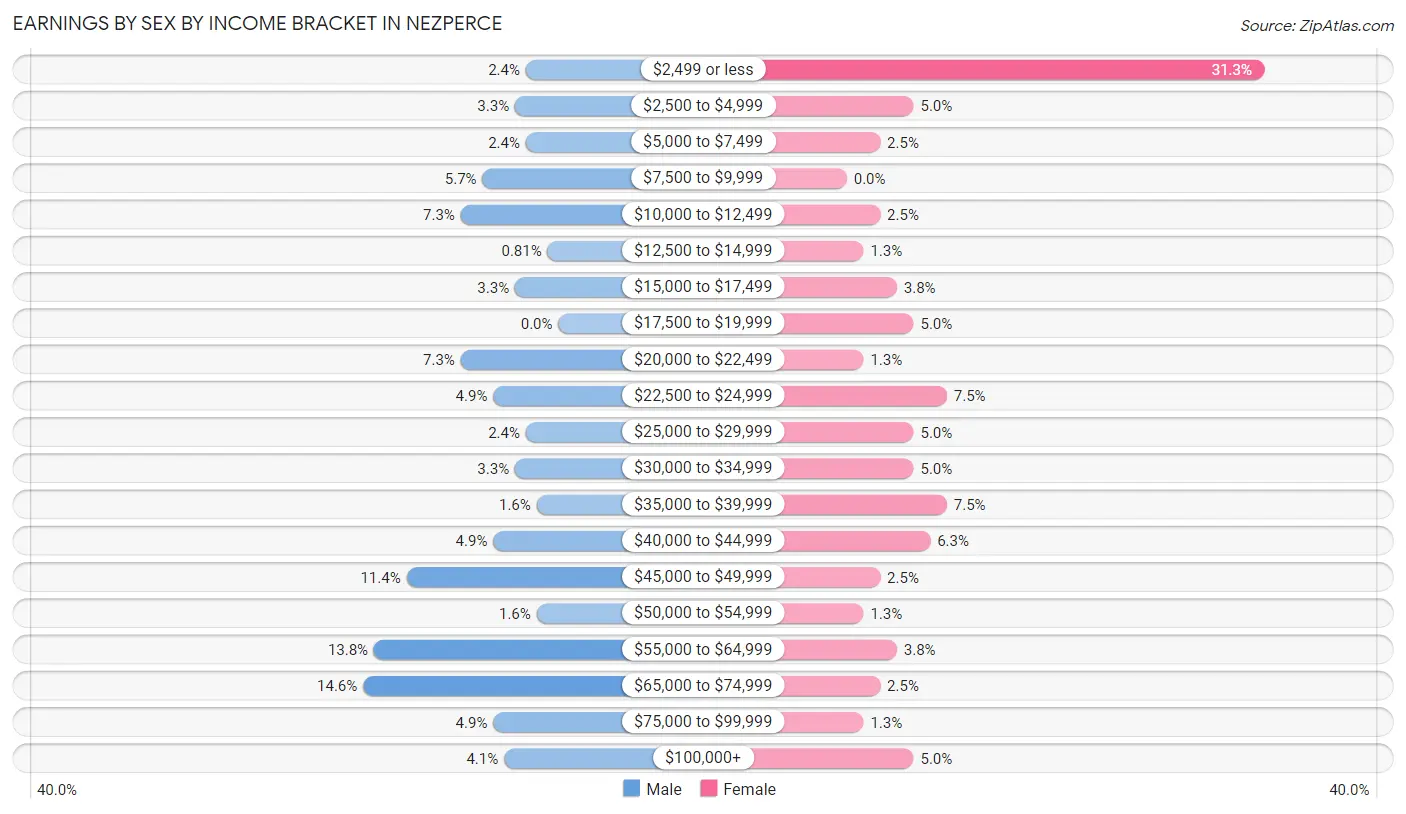
| Income | Male | Female |
| $2,499 or less | 3 (2.4%) | 25 (31.2%) |
| $2,500 to $4,999 | 4 (3.3%) | 4 (5.0%) |
| $5,000 to $7,499 | 3 (2.4%) | 2 (2.5%) |
| $7,500 to $9,999 | 7 (5.7%) | 0 (0.0%) |
| $10,000 to $12,499 | 9 (7.3%) | 2 (2.5%) |
| $12,500 to $14,999 | 1 (0.8%) | 1 (1.3%) |
| $15,000 to $17,499 | 4 (3.3%) | 3 (3.7%) |
| $17,500 to $19,999 | 0 (0.0%) | 4 (5.0%) |
| $20,000 to $22,499 | 9 (7.3%) | 1 (1.3%) |
| $22,500 to $24,999 | 6 (4.9%) | 6 (7.5%) |
| $25,000 to $29,999 | 3 (2.4%) | 4 (5.0%) |
| $30,000 to $34,999 | 4 (3.3%) | 4 (5.0%) |
| $35,000 to $39,999 | 2 (1.6%) | 6 (7.5%) |
| $40,000 to $44,999 | 6 (4.9%) | 5 (6.2%) |
| $45,000 to $49,999 | 14 (11.4%) | 2 (2.5%) |
| $50,000 to $54,999 | 2 (1.6%) | 1 (1.3%) |
| $55,000 to $64,999 | 17 (13.8%) | 3 (3.7%) |
| $65,000 to $74,999 | 18 (14.6%) | 2 (2.5%) |
| $75,000 to $99,999 | 6 (4.9%) | 1 (1.3%) |
| $100,000+ | 5 (4.1%) | 4 (5.0%) |
| Total | 123 (100.0%) | 80 (100.0%) |
Earnings by Sex by Educational Attainment in Nezperce
Average earnings in Nezperce are $46,250 for men and $23,542 for women, a difference of 49.1%. Men with an educational attainment of bachelor's degree enjoy the highest average annual earnings of $60,000, while those with high school diploma education earn the least with $40,833. Women with an educational attainment of bachelor's degree earn the most with the average annual earnings of $40,625, while those with high school diploma education have the smallest earnings of $2,499.
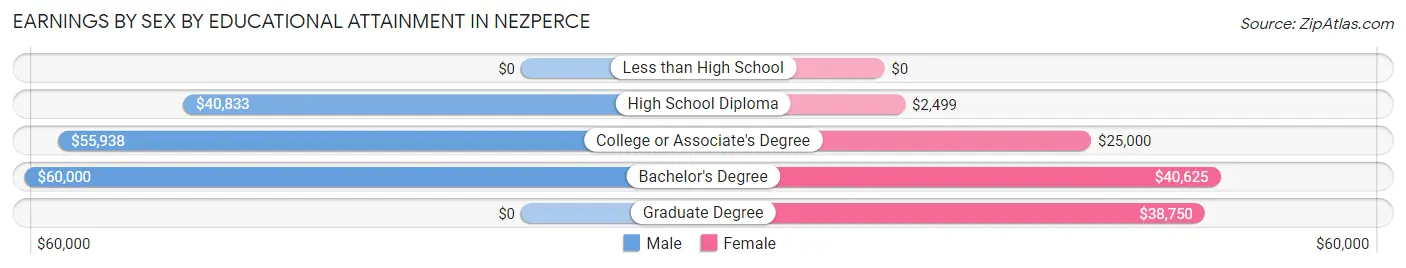
| Educational Attainment | Male Income | Female Income |
| Less than High School | - | - |
| High School Diploma | $40,833 | $2,499 |
| College or Associate's Degree | $55,938 | $25,000 |
| Bachelor's Degree | $60,000 | $40,625 |
| Graduate Degree | - | - |
| Total | $46,250 | $23,542 |
Family Income in Nezperce
Family Income Brackets in Nezperce
According to the Nezperce family income data, there are 30 families falling into the $50,000 to $74,999 income range, which is the most common income bracket and makes up 22.6% of all families.
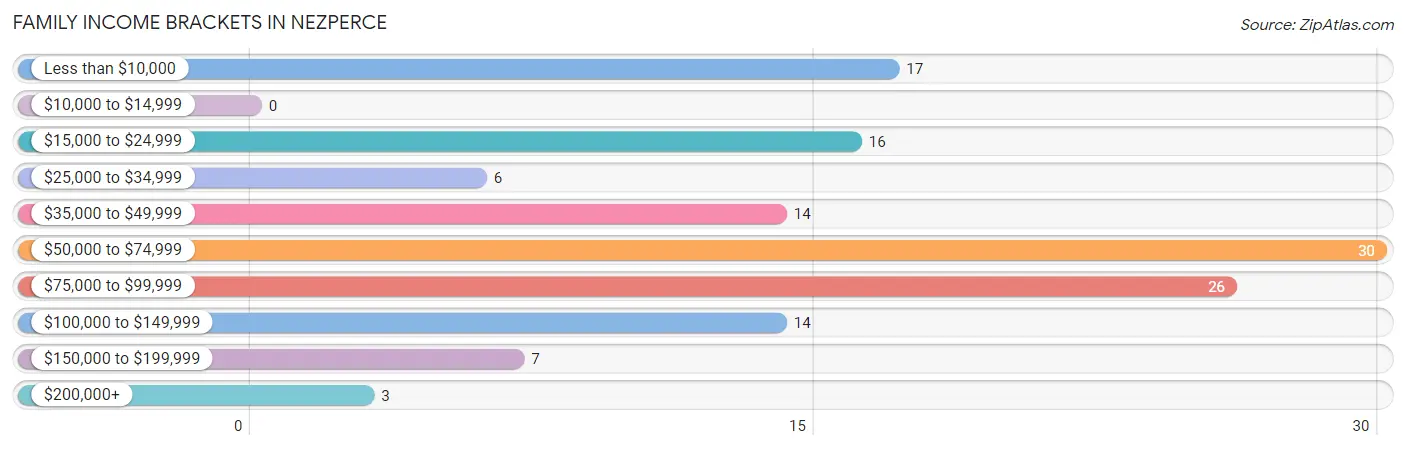
| Income Bracket | # Families | % Families |
| Less than $10,000 | 17 | 12.8% |
| $10,000 to $14,999 | 0 | 0.0% |
| $15,000 to $24,999 | 16 | 12.0% |
| $25,000 to $34,999 | 6 | 4.5% |
| $35,000 to $49,999 | 14 | 10.5% |
| $50,000 to $74,999 | 30 | 22.6% |
| $75,000 to $99,999 | 26 | 19.5% |
| $100,000 to $149,999 | 14 | 10.5% |
| $150,000 to $199,999 | 7 | 5.3% |
| $200,000+ | 3 | 2.3% |
Family Income by Famaliy Size in Nezperce
5-person families (7 | 5.3%) account for the highest median family income in Nezperce with $140,625 per family, while 2-person families (83 | 62.4%) have the highest median income of $31,458 per family member.
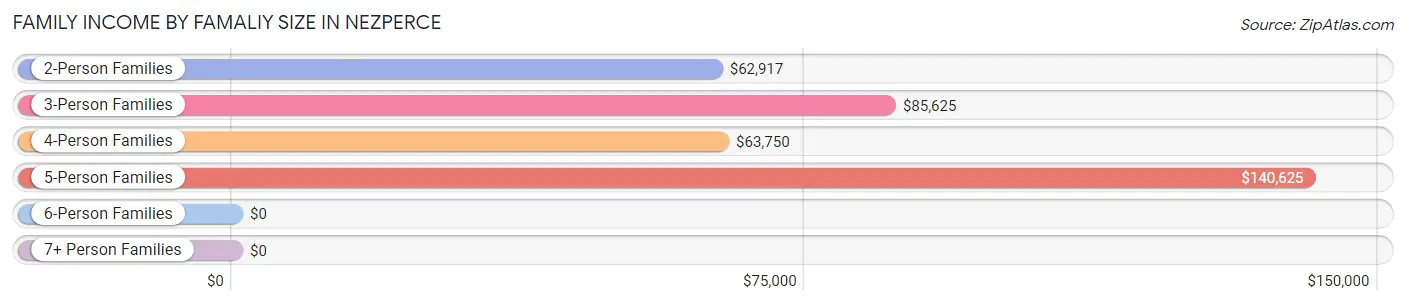
| Income Bracket | # Families | Median Income |
| 2-Person Families | 83 (62.4%) | $62,917 |
| 3-Person Families | 7 (5.3%) | $85,625 |
| 4-Person Families | 31 (23.3%) | $63,750 |
| 5-Person Families | 7 (5.3%) | $140,625 |
| 6-Person Families | 4 (3.0%) | $0 |
| 7+ Person Families | 1 (0.7%) | $0 |
| Total | 133 (100.0%) | $64,375 |
Family Income by Number of Earners in Nezperce
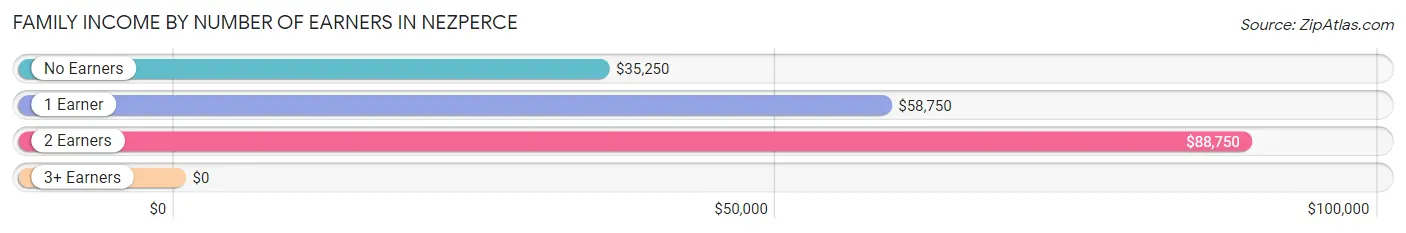
| Number of Earners | # Families | Median Income |
| No Earners | 45 (33.8%) | $35,250 |
| 1 Earner | 47 (35.3%) | $58,750 |
| 2 Earners | 32 (24.1%) | $88,750 |
| 3+ Earners | 9 (6.8%) | $0 |
| Total | 133 (100.0%) | $64,375 |
Household Income in Nezperce
Household Income Brackets in Nezperce
With 40 households falling in the category, the $50,000 to $74,999 income range is the most frequent in Nezperce, accounting for 20.8% of all households. In contrast, only 4 households (2.1%) fall into the $200,000+ income bracket, making it the least populous group.
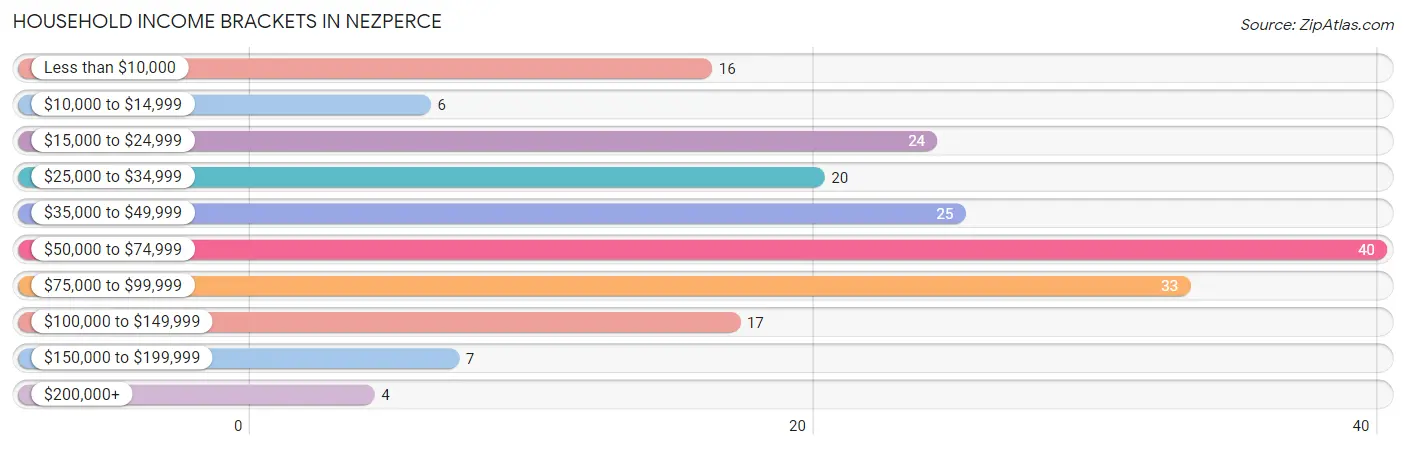
| Income Bracket | # Households | % Households |
| Less than $10,000 | 16 | 8.3% |
| $10,000 to $14,999 | 6 | 3.1% |
| $15,000 to $24,999 | 24 | 12.5% |
| $25,000 to $34,999 | 20 | 10.4% |
| $35,000 to $49,999 | 25 | 13.0% |
| $50,000 to $74,999 | 40 | 20.8% |
| $75,000 to $99,999 | 33 | 17.2% |
| $100,000 to $149,999 | 17 | 8.9% |
| $150,000 to $199,999 | 7 | 3.6% |
| $200,000+ | 4 | 2.1% |
Household Income by Householder Age in Nezperce
The median household income in Nezperce is $55,625, with the highest median household income of $69,250 found in the 25 to 44 years age bracket for the primary householder. A total of 51 households (26.6%) fall into this category. Meanwhile, the 15 to 24 years age bracket for the primary householder has the lowest median household income of $0, with 4 households (2.1%) in this group.
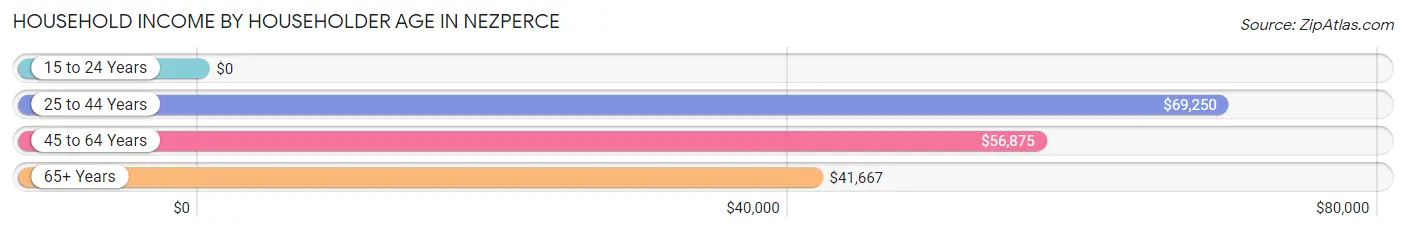
| Income Bracket | # Households | Median Income |
| 15 to 24 Years | 4 (2.1%) | $0 |
| 25 to 44 Years | 51 (26.6%) | $69,250 |
| 45 to 64 Years | 53 (27.6%) | $56,875 |
| 65+ Years | 84 (43.8%) | $41,667 |
| Total | 192 (100.0%) | $55,625 |
Poverty in Nezperce
Income Below Poverty by Sex and Age in Nezperce
With 20.7% poverty level for males and 22.8% for females among the residents of Nezperce, 6 to 11 year old males and 18 to 24 year old females are the most vulnerable to poverty, with 28 males (70.0%) and 4 females (57.1%) in their respective age groups living below the poverty level.
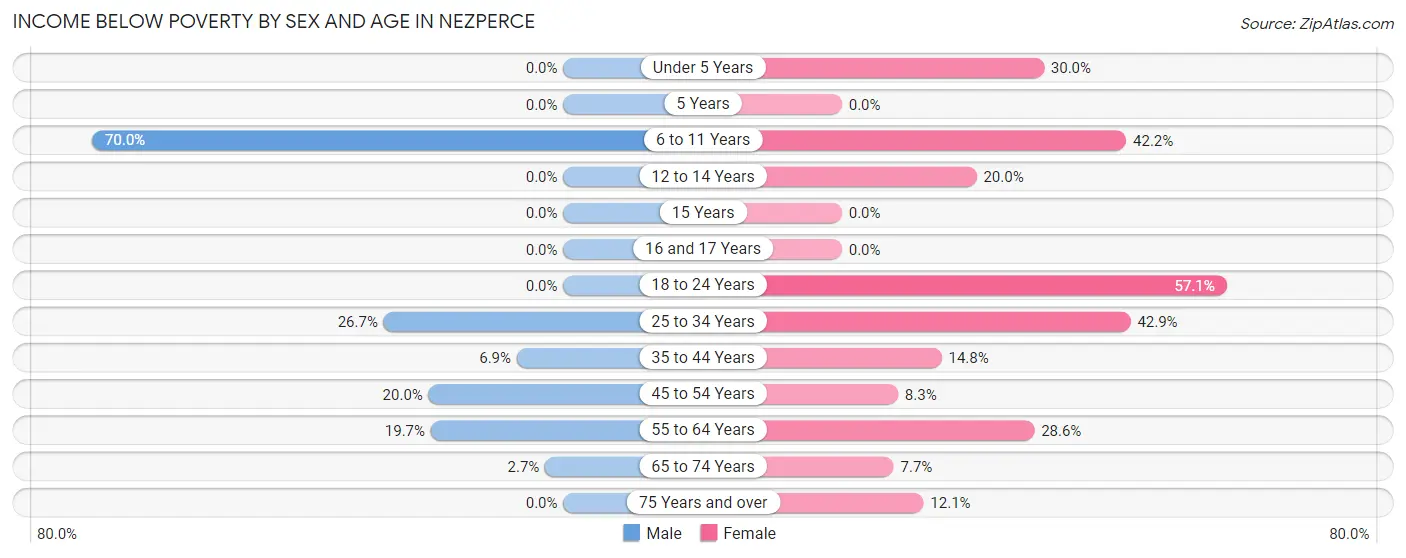
| Age Bracket | Male | Female |
| Under 5 Years | 0 (0.0%) | 6 (30.0%) |
| 5 Years | 0 (0.0%) | 0 (0.0%) |
| 6 to 11 Years | 28 (70.0%) | 19 (42.2%) |
| 12 to 14 Years | 0 (0.0%) | 2 (20.0%) |
| 15 Years | 0 (0.0%) | 0 (0.0%) |
| 16 and 17 Years | 0 (0.0%) | 0 (0.0%) |
| 18 to 24 Years | 0 (0.0%) | 4 (57.1%) |
| 25 to 34 Years | 4 (26.7%) | 9 (42.9%) |
| 35 to 44 Years | 2 (6.9%) | 4 (14.8%) |
| 45 to 54 Years | 2 (20.0%) | 1 (8.3%) |
| 55 to 64 Years | 12 (19.7%) | 6 (28.6%) |
| 65 to 74 Years | 1 (2.7%) | 3 (7.7%) |
| 75 Years and over | 0 (0.0%) | 4 (12.1%) |
| Total | 49 (20.7%) | 58 (22.8%) |
Income Above Poverty by Sex and Age in Nezperce
According to the poverty statistics in Nezperce, males aged under 5 years and females aged 15 years are the age groups that are most secure financially, with 100.0% of males and 100.0% of females in these age groups living above the poverty line.
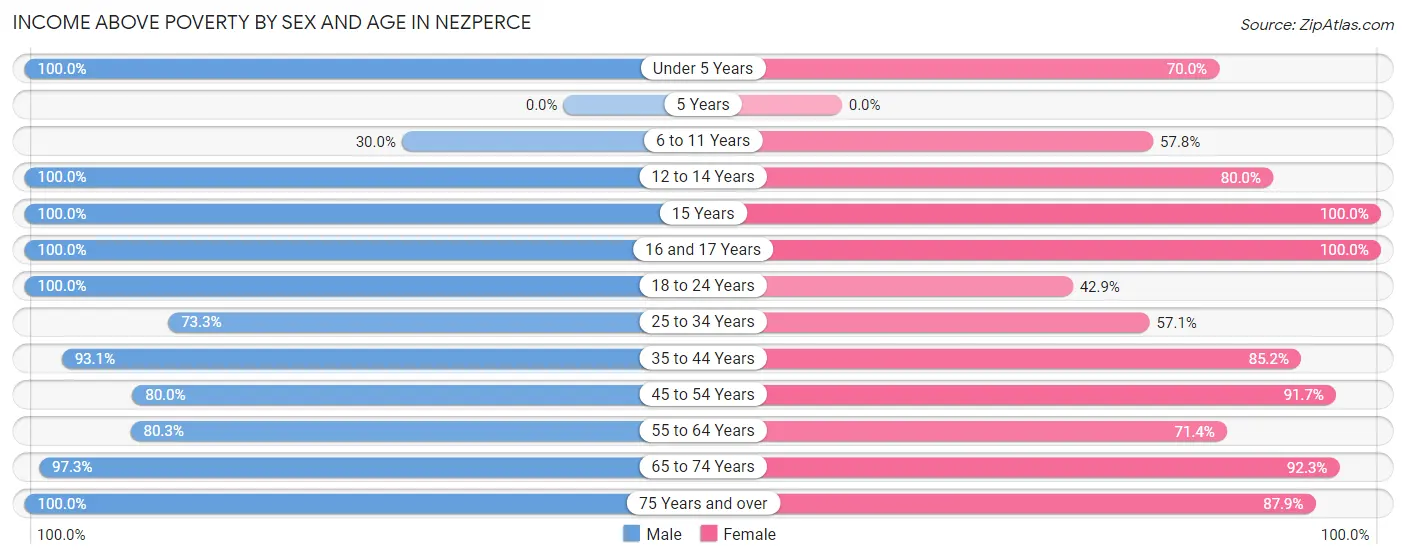
| Age Bracket | Male | Female |
| Under 5 Years | 8 (100.0%) | 14 (70.0%) |
| 5 Years | 0 (0.0%) | 0 (0.0%) |
| 6 to 11 Years | 12 (30.0%) | 26 (57.8%) |
| 12 to 14 Years | 1 (100.0%) | 8 (80.0%) |
| 15 Years | 2 (100.0%) | 8 (100.0%) |
| 16 and 17 Years | 3 (100.0%) | 11 (100.0%) |
| 18 to 24 Years | 7 (100.0%) | 3 (42.9%) |
| 25 to 34 Years | 11 (73.3%) | 12 (57.1%) |
| 35 to 44 Years | 27 (93.1%) | 23 (85.2%) |
| 45 to 54 Years | 8 (80.0%) | 11 (91.7%) |
| 55 to 64 Years | 49 (80.3%) | 15 (71.4%) |
| 65 to 74 Years | 36 (97.3%) | 36 (92.3%) |
| 75 Years and over | 24 (100.0%) | 29 (87.9%) |
| Total | 188 (79.3%) | 196 (77.2%) |
Income Below Poverty Among Married-Couple Families in Nezperce
The poverty statistics for married-couple families in Nezperce show that 7.9% or 8 of the total 101 families live below the poverty line. Families with no children have the highest poverty rate of 8.8%, comprising of 6 families. On the other hand, families with 3 or 4 children have the lowest poverty rate of 0.0%, which includes 0 families.
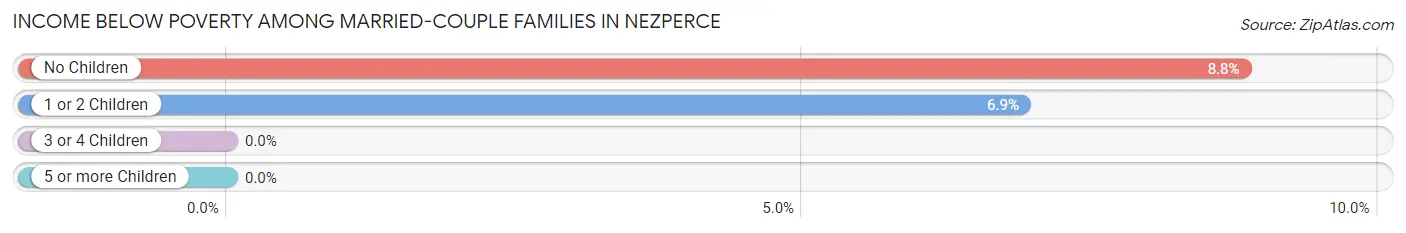
| Children | Above Poverty | Below Poverty |
| No Children | 62 (91.2%) | 6 (8.8%) |
| 1 or 2 Children | 27 (93.1%) | 2 (6.9%) |
| 3 or 4 Children | 3 (100.0%) | 0 (0.0%) |
| 5 or more Children | 1 (100.0%) | 0 (0.0%) |
| Total | 93 (92.1%) | 8 (7.9%) |
Income Below Poverty Among Single-Parent Households in Nezperce
According to the poverty data in Nezperce, 36.4% or 4 single-father households and 61.9% or 13 single-mother households are living below the poverty line. Among single-father households, those with 3 or 4 children have the highest poverty rate, with 4 households (100.0%) experiencing poverty. Likewise, among single-mother households, those with 3 or 4 children have the highest poverty rate, with 8 households (100.0%) falling below the poverty line.
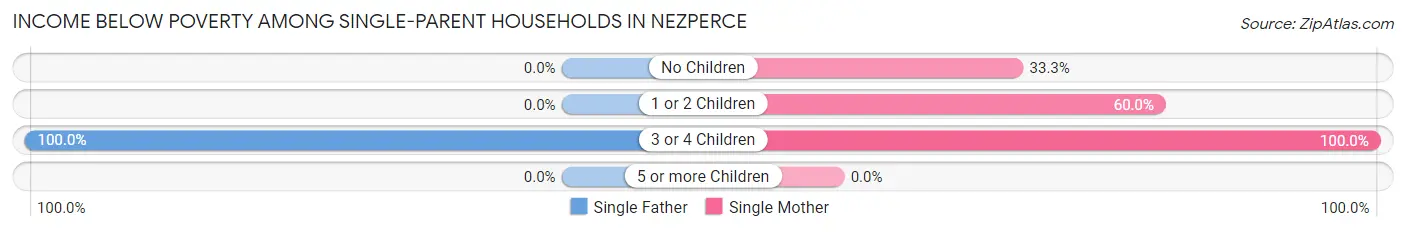
| Children | Single Father | Single Mother |
| No Children | 0 (0.0%) | 2 (33.3%) |
| 1 or 2 Children | 0 (0.0%) | 3 (60.0%) |
| 3 or 4 Children | 4 (100.0%) | 8 (100.0%) |
| 5 or more Children | 0 (0.0%) | 0 (0.0%) |
| Total | 4 (36.4%) | 13 (61.9%) |
Income Below Poverty Among Married-Couple vs Single-Parent Households in Nezperce
The poverty data for Nezperce shows that 8 of the married-couple family households (7.9%) and 17 of the single-parent households (53.1%) are living below the poverty level. Within the married-couple family households, those with no children have the highest poverty rate, with 6 households (8.8%) falling below the poverty line. Among the single-parent households, those with 3 or 4 children have the highest poverty rate, with 12 household (100.0%) living below poverty.
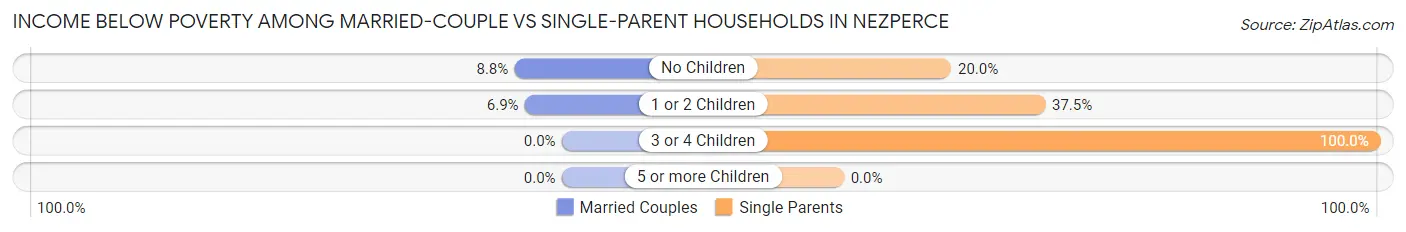
| Children | Married-Couple Families | Single-Parent Households |
| No Children | 6 (8.8%) | 2 (20.0%) |
| 1 or 2 Children | 2 (6.9%) | 3 (37.5%) |
| 3 or 4 Children | 0 (0.0%) | 12 (100.0%) |
| 5 or more Children | 0 (0.0%) | 0 (0.0%) |
| Total | 8 (7.9%) | 17 (53.1%) |
Race in Nezperce
The most populous races in Nezperce are White / Caucasian (419 | 80.9%), Black / African American (45 | 8.7%), and Two or more Races (36 | 7.0%).
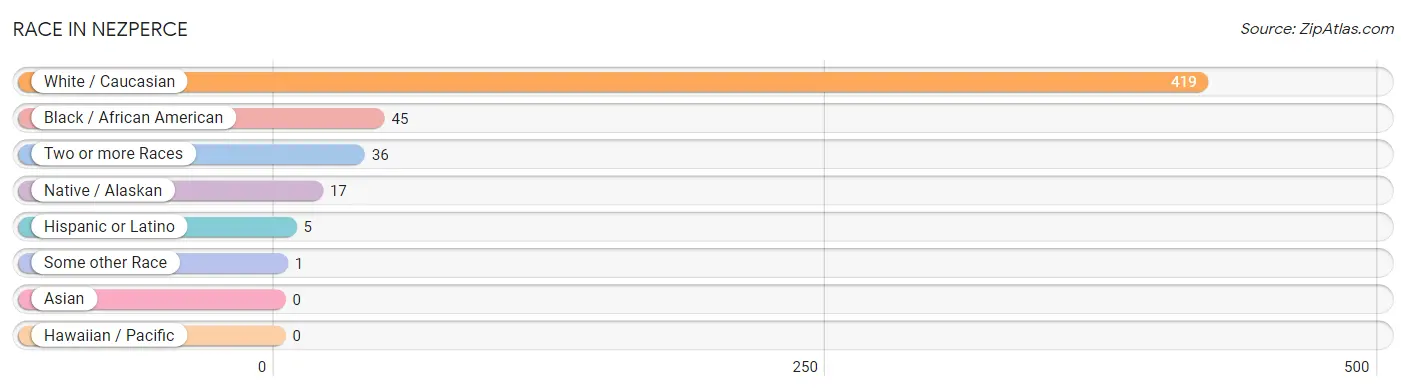
| Race | # Population | % Population |
| Asian | 0 | 0.0% |
| Black / African American | 45 | 8.7% |
| Hawaiian / Pacific | 0 | 0.0% |
| Hispanic or Latino | 5 | 1.0% |
| Native / Alaskan | 17 | 3.3% |
| White / Caucasian | 419 | 80.9% |
| Two or more Races | 36 | 7.0% |
| Some other Race | 1 | 0.2% |
| Total | 518 | 100.0% |
Ancestry in Nezperce
The most populous ancestries reported in Nezperce are German (125 | 24.1%), English (43 | 8.3%), Irish (43 | 8.3%), Italian (36 | 7.0%), and American (20 | 3.9%), together accounting for 51.5% of all Nezperce residents.
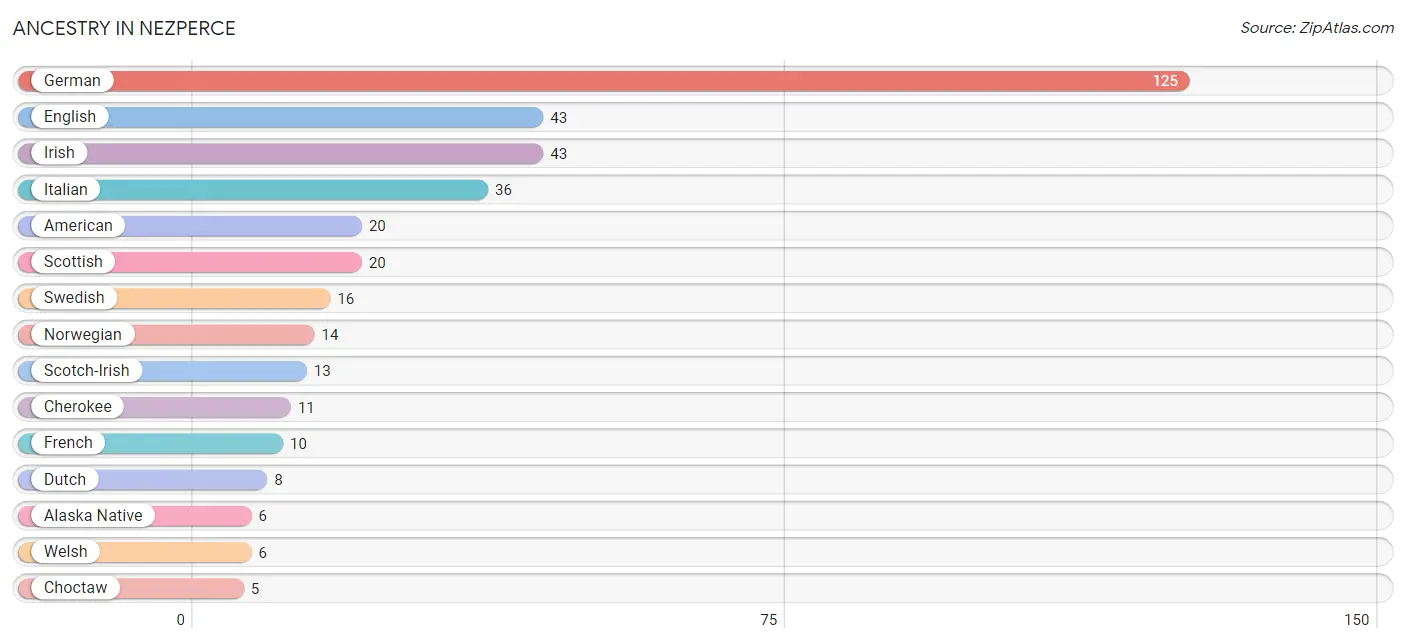
| Ancestry | # Population | % Population |
| Alaska Native | 6 | 1.2% |
| Aleut | 4 | 0.8% |
| American | 20 | 3.9% |
| Australian | 2 | 0.4% |
| Burmese | 2 | 0.4% |
| Canadian | 1 | 0.2% |
| Cherokee | 11 | 2.1% |
| Choctaw | 5 | 1.0% |
| Danish | 3 | 0.6% |
| Dutch | 8 | 1.5% |
| English | 43 | 8.3% |
| European | 1 | 0.2% |
| French | 10 | 1.9% |
| French Canadian | 2 | 0.4% |
| German | 125 | 24.1% |
| Haitian | 4 | 0.8% |
| Hungarian | 1 | 0.2% |
| Icelander | 2 | 0.4% |
| Irish | 43 | 8.3% |
| Italian | 36 | 7.0% |
| Lithuanian | 2 | 0.4% |
| Luxembourger | 1 | 0.2% |
| Mexican | 1 | 0.2% |
| Northern European | 2 | 0.4% |
| Norwegian | 14 | 2.7% |
| Polish | 2 | 0.4% |
| Portuguese | 2 | 0.4% |
| Scandinavian | 4 | 0.8% |
| Scotch-Irish | 13 | 2.5% |
| Scottish | 20 | 3.9% |
| Spanish | 4 | 0.8% |
| Swedish | 16 | 3.1% |
| Swiss | 1 | 0.2% |
| Welsh | 6 | 1.2% | View All 34 Rows |
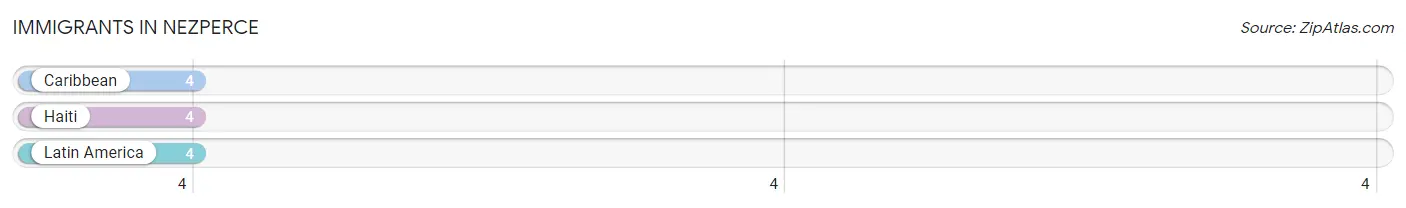
Immigrants in Nezperce
The most numerous immigrant groups reported in Nezperce came from Caribbean (4 | 0.8%), Haiti (4 | 0.8%), and Latin America (4 | 0.8%), together accounting for 2.3% of all Nezperce residents.
| Immigration Origin | # Population | % Population |
| Caribbean | 4 | 0.8% |
| Haiti | 4 | 0.8% |
| Latin America | 4 | 0.8% | View All 3 Rows |
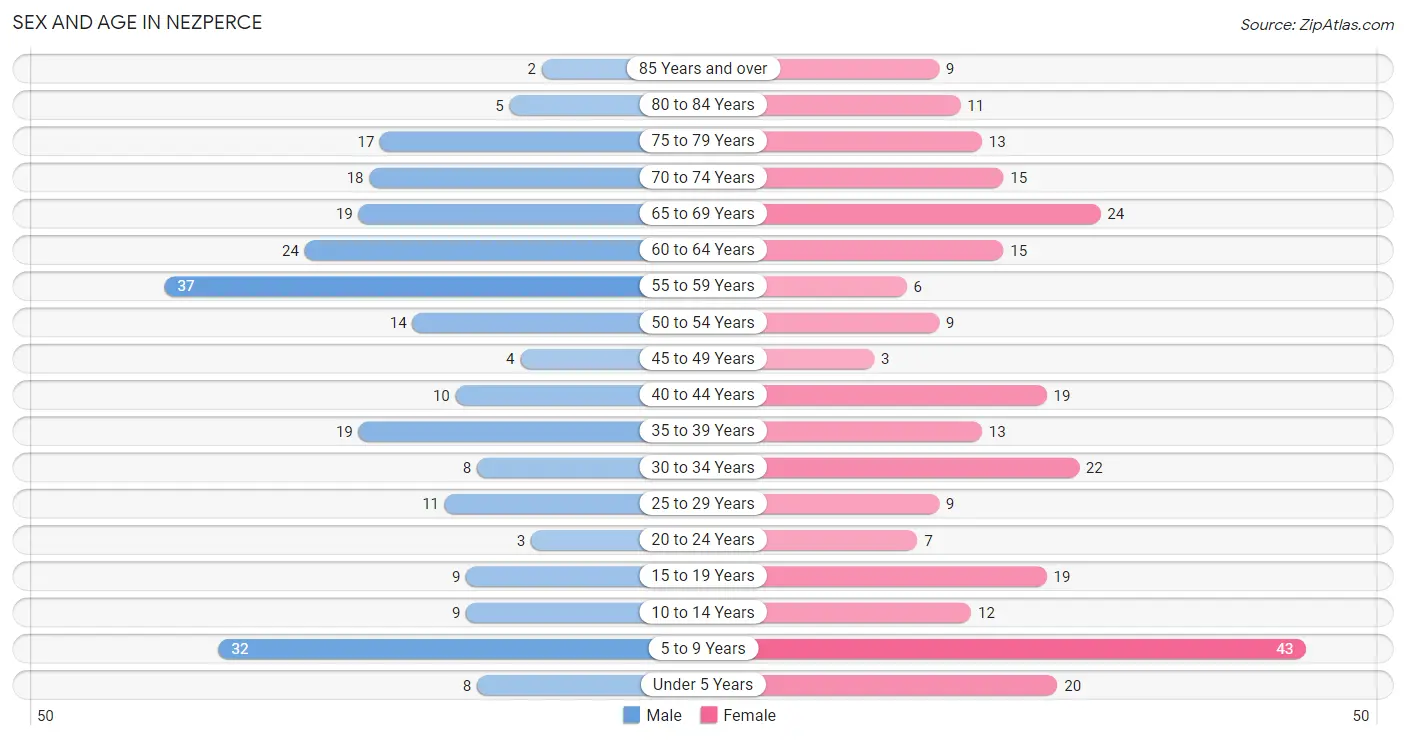
Sex and Age in Nezperce
Sex and Age in Nezperce
The most populous age groups in Nezperce are 55 to 59 Years (37 | 14.9%) for men and 5 to 9 Years (43 | 16.0%) for women.
| Age Bracket | Male | Female |
| Under 5 Years | 8 (3.2%) | 20 (7.4%) |
| 5 to 9 Years | 32 (12.9%) | 43 (16.0%) |
| 10 to 14 Years | 9 (3.6%) | 12 (4.5%) |
| 15 to 19 Years | 9 (3.6%) | 19 (7.1%) |
| 20 to 24 Years | 3 (1.2%) | 7 (2.6%) |
| 25 to 29 Years | 11 (4.4%) | 9 (3.4%) |
| 30 to 34 Years | 8 (3.2%) | 22 (8.2%) |
| 35 to 39 Years | 19 (7.6%) | 13 (4.8%) |
| 40 to 44 Years | 10 (4.0%) | 19 (7.1%) |
| 45 to 49 Years | 4 (1.6%) | 3 (1.1%) |
| 50 to 54 Years | 14 (5.6%) | 9 (3.4%) |
| 55 to 59 Years | 37 (14.9%) | 6 (2.2%) |
| 60 to 64 Years | 24 (9.6%) | 15 (5.6%) |
| 65 to 69 Years | 19 (7.6%) | 24 (8.9%) |
| 70 to 74 Years | 18 (7.2%) | 15 (5.6%) |
| 75 to 79 Years | 17 (6.8%) | 13 (4.8%) |
| 80 to 84 Years | 5 (2.0%) | 11 (4.1%) |
| 85 Years and over | 2 (0.8%) | 9 (3.4%) |
| Total | 249 (100.0%) | 269 (100.0%) |
Families and Households in Nezperce
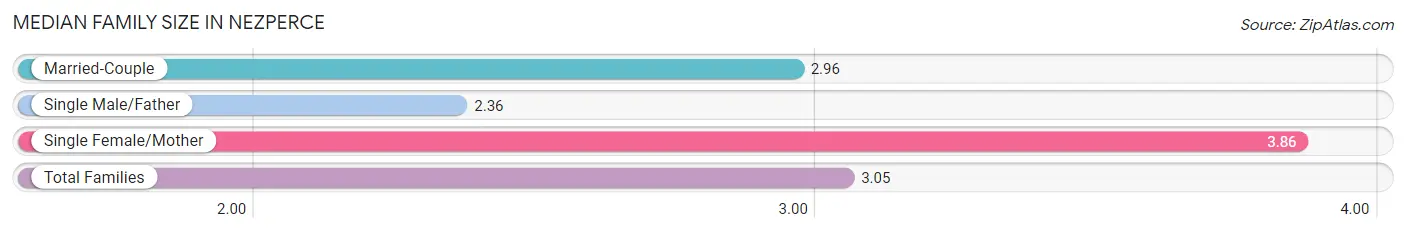
Median Family Size in Nezperce
The median family size in Nezperce is 3.05 persons per family, with single female/mother families (21 | 15.8%) accounting for the largest median family size of 3.86 persons per family. On the other hand, single male/father families (11 | 8.3%) represent the smallest median family size with 2.36 persons per family.
| Family Type | # Families | Family Size |
| Married-Couple | 101 (75.9%) | 2.96 |
| Single Male/Father | 11 (8.3%) | 2.36 |
| Single Female/Mother | 21 (15.8%) | 3.86 |
| Total Families | 133 (100.0%) | 3.05 |
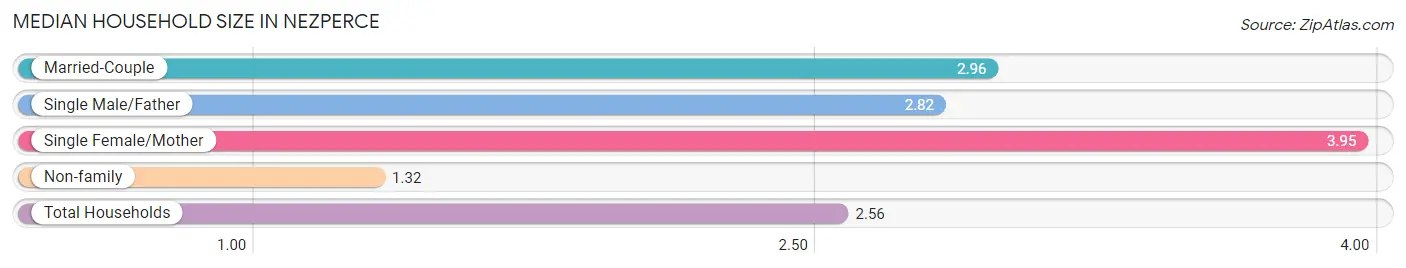
Median Household Size in Nezperce
The median household size in Nezperce is 2.56 persons per household, with single female/mother households (21 | 10.9%) accounting for the largest median household size of 3.95 persons per household. non-family households (59 | 30.7%) represent the smallest median household size with 1.32 persons per household.
| Household Type | # Households | Household Size |
| Married-Couple | 101 (52.6%) | 2.96 |
| Single Male/Father | 11 (5.7%) | 2.82 |
| Single Female/Mother | 21 (10.9%) | 3.95 |
| Non-family | 59 (30.7%) | 1.32 |
| Total Households | 192 (100.0%) | 2.56 |
Household Size by Marriage Status in Nezperce
Out of a total of 192 households in Nezperce, 133 (69.3%) are family households, while 59 (30.7%) are nonfamily households. The most numerous type of family households are 2-person households, comprising 78, and the most common type of nonfamily households are 1-person households, comprising 42.
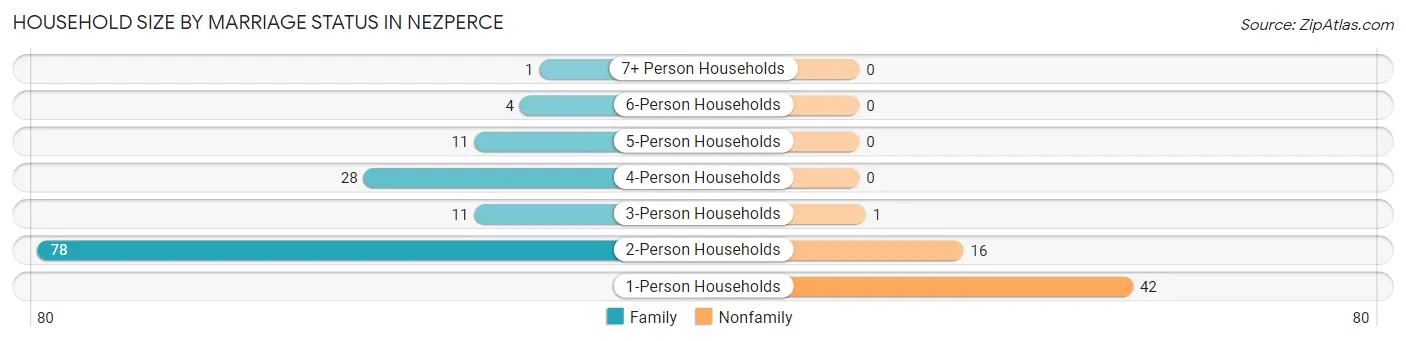
| Household Size | Family Households | Nonfamily Households |
| 1-Person Households | - | 42 (21.9%) |
| 2-Person Households | 78 (40.6%) | 16 (8.3%) |
| 3-Person Households | 11 (5.7%) | 1 (0.5%) |
| 4-Person Households | 28 (14.6%) | 0 (0.0%) |
| 5-Person Households | 11 (5.7%) | 0 (0.0%) |
| 6-Person Households | 4 (2.1%) | 0 (0.0%) |
| 7+ Person Households | 1 (0.5%) | 0 (0.0%) |
| Total | 133 (69.3%) | 59 (30.7%) |
Female Fertility in Nezperce
Fertility by Age in Nezperce
Average fertility rate in Nezperce is 54.0 births per 1,000 women. Women in the age bracket of 20 to 34 years have the highest fertility rate with 132.0 births per 1,000 women. Women in the age bracket of 20 to 34 years acount for 100.0% of all women with births.
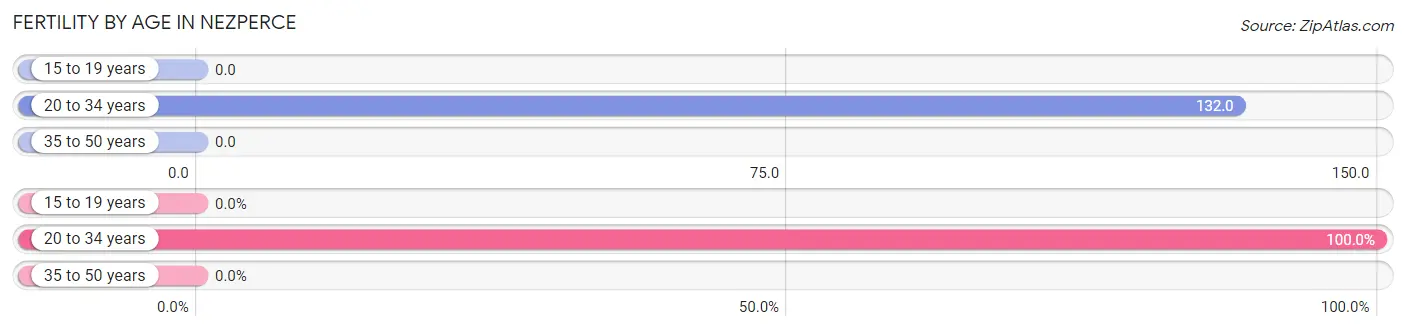
| Age Bracket | Women with Births | Births / 1,000 Women |
| 15 to 19 years | 0 (0.0%) | 0.0 |
| 20 to 34 years | 5 (100.0%) | 132.0 |
| 35 to 50 years | 0 (0.0%) | 0.0 |
| Total | 5 (100.0%) | 54.0 |
Fertility by Age by Marriage Status in Nezperce
40.0% of women with births (5) in Nezperce are married. The highest percentage of unmarried women with births falls into 20 to 34 years age bracket with 60.0% of them unmarried at the time of birth, while the lowest percentage of unmarried women with births belong to 20 to 34 years age bracket with 60.0% of them unmarried.
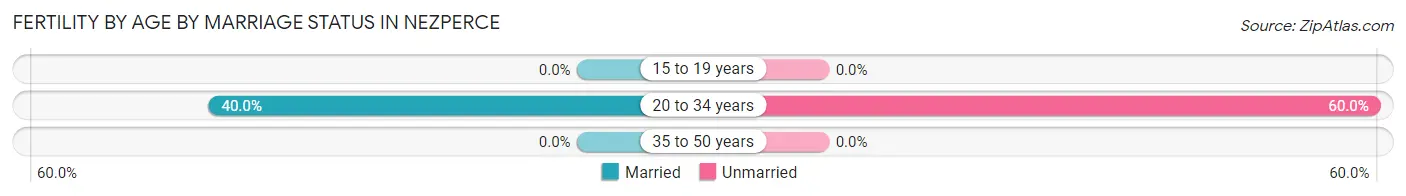
| Age Bracket | Married | Unmarried |
| 15 to 19 years | 0 (0.0%) | 0 (0.0%) |
| 20 to 34 years | 2 (40.0%) | 3 (60.0%) |
| 35 to 50 years | 0 (0.0%) | 0 (0.0%) |
| Total | 2 (40.0%) | 3 (60.0%) |
Fertility by Education in Nezperce
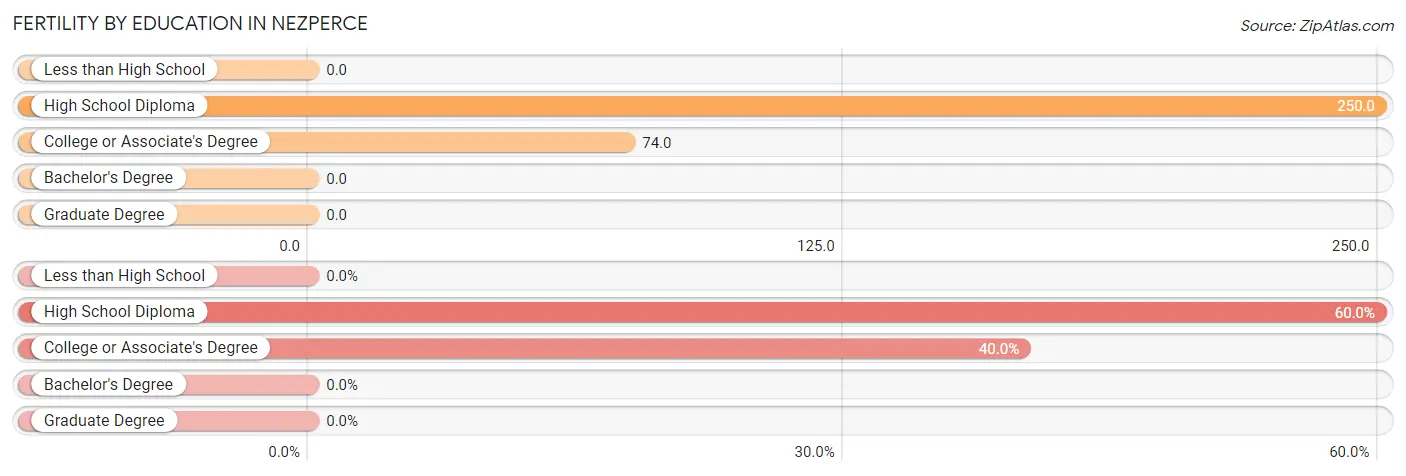
| Educational Attainment | Women with Births | Births / 1,000 Women |
| Less than High School | 0 (0.0%) | 0.0 |
| High School Diploma | 3 (60.0%) | 250.0 |
| College or Associate's Degree | 2 (40.0%) | 74.0 |
| Bachelor's Degree | 0 (0.0%) | 0.0 |
| Graduate Degree | 0 (0.0%) | 0.0 |
| Total | 5 (100.0%) | 54.0 |
Fertility by Education by Marriage Status in Nezperce
60.0% of women with births in Nezperce are unmarried. Women with the educational attainment of college or associate's degree are most likely to be married with 100.0% of them married at childbirth, while women with the educational attainment of high school diploma are least likely to be married with 100.0% of them unmarried at childbirth.
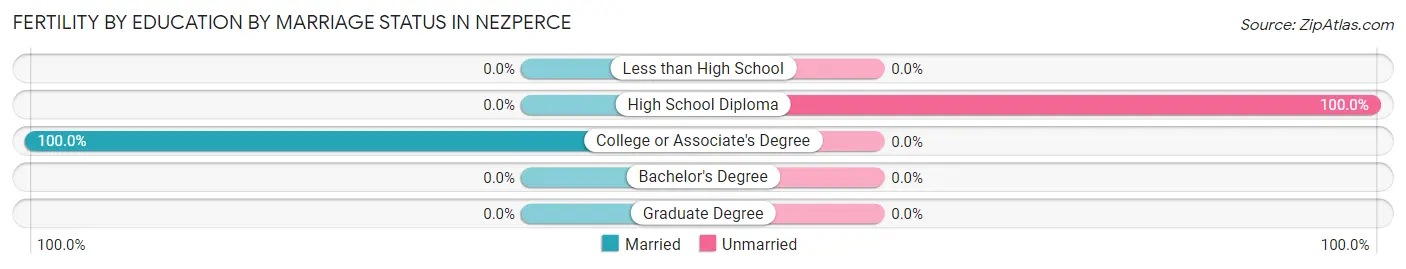
| Educational Attainment | Married | Unmarried |
| Less than High School | 0 (0.0%) | 0 (0.0%) |
| High School Diploma | 0 (0.0%) | 3 (100.0%) |
| College or Associate's Degree | 2 (100.0%) | 0 (0.0%) |
| Bachelor's Degree | 0 (0.0%) | 0 (0.0%) |
| Graduate Degree | 0 (0.0%) | 0 (0.0%) |
| Total | 2 (40.0%) | 3 (60.0%) |
Employment Characteristics in Nezperce
Employment by Class of Employer in Nezperce
Among the 150 employed individuals in Nezperce, private company employees (99 | 66.0%), local government employees (18 | 12.0%), and not-for-profit organizations (10 | 6.7%) make up the most common classes of employment.
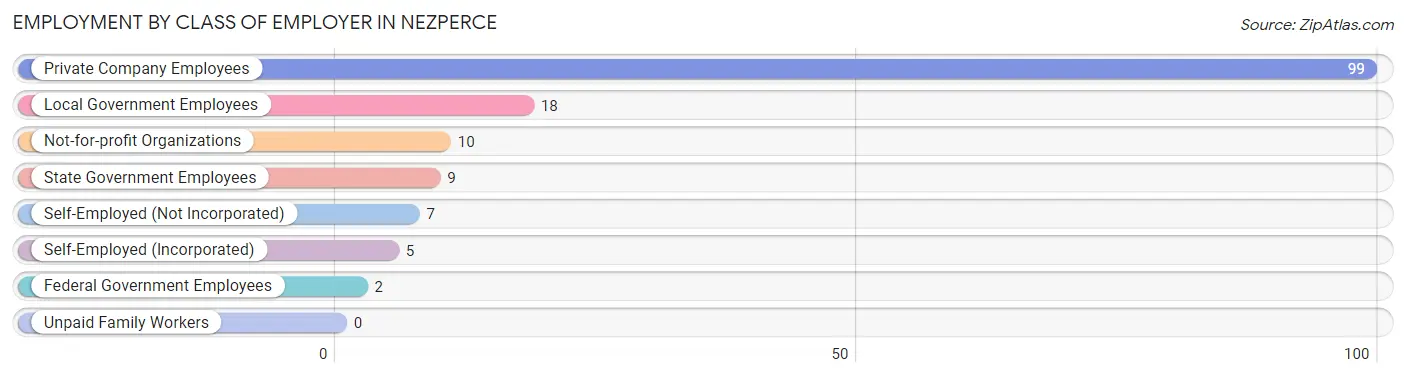
| Employer Class | # Employees | % Employees |
| Private Company Employees | 99 | 66.0% |
| Self-Employed (Incorporated) | 5 | 3.3% |
| Self-Employed (Not Incorporated) | 7 | 4.7% |
| Not-for-profit Organizations | 10 | 6.7% |
| Local Government Employees | 18 | 12.0% |
| State Government Employees | 9 | 6.0% |
| Federal Government Employees | 2 | 1.3% |
| Unpaid Family Workers | 0 | 0.0% |
| Total | 150 | 100.0% |
Employment Status by Age in Nezperce
According to the labor force statistics for Nezperce, out of the total population over 16 years of age (384), 43.0% or 165 individuals are in the labor force, with 4.2% or 7 of them unemployed. The age group with the highest labor force participation rate is 35 to 44 years, with 78.7% or 48 individuals in the labor force. Within the labor force, the 25 to 29 years age range has the highest percentage of unemployed individuals, with 15.4% or 2 of them being unemployed.
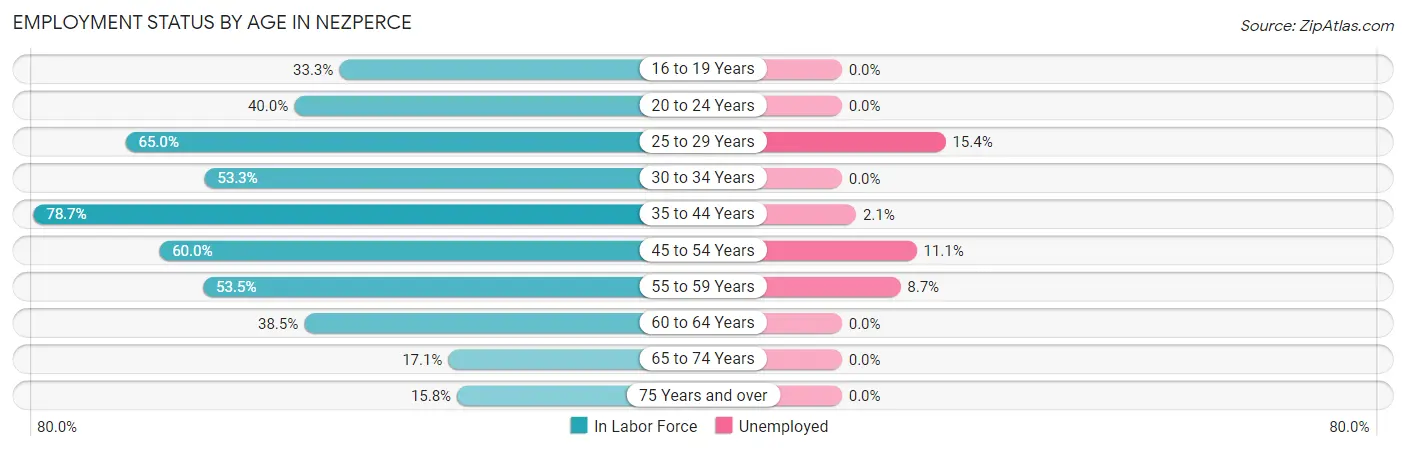
| Age Bracket | In Labor Force | Unemployed |
| 16 to 19 Years | 6 (33.3%) | 0 (0.0%) |
| 20 to 24 Years | 4 (40.0%) | 0 (0.0%) |
| 25 to 29 Years | 13 (65.0%) | 2 (15.4%) |
| 30 to 34 Years | 16 (53.3%) | 0 (0.0%) |
| 35 to 44 Years | 48 (78.7%) | 1 (2.1%) |
| 45 to 54 Years | 18 (60.0%) | 2 (11.1%) |
| 55 to 59 Years | 23 (53.5%) | 2 (8.7%) |
| 60 to 64 Years | 15 (38.5%) | 0 (0.0%) |
| 65 to 74 Years | 13 (17.1%) | 0 (0.0%) |
| 75 Years and over | 9 (15.8%) | 0 (0.0%) |
| Total | 165 (43.0%) | 7 (4.2%) |
Employment Status by Educational Attainment in Nezperce
According to labor force statistics for Nezperce, 59.6% of individuals (133) out of the total population between 25 and 64 years of age (223) are in the labor force, with 5.3% or 7 of them being unemployed. The group with the highest labor force participation rate are those with the educational attainment of bachelor's degree or higher, with 82.1% or 32 individuals in the labor force. Within the labor force, individuals with less than high school education have the highest percentage of unemployment, with 50.0% or 2 of them being unemployed.
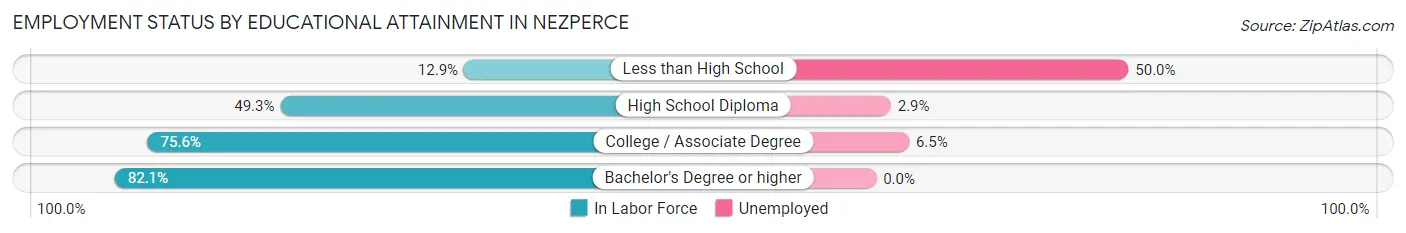
| Educational Attainment | In Labor Force | Unemployed |
| Less than High School | 4 (12.9%) | 16 (50.0%) |
| High School Diploma | 35 (49.3%) | 2 (2.9%) |
| College / Associate Degree | 62 (75.6%) | 5 (6.5%) |
| Bachelor's Degree or higher | 32 (82.1%) | 0 (0.0%) |
| Total | 133 (59.6%) | 12 (5.3%) |
Employment Occupations by Sex in Nezperce
Management, Business, Science and Arts Occupations
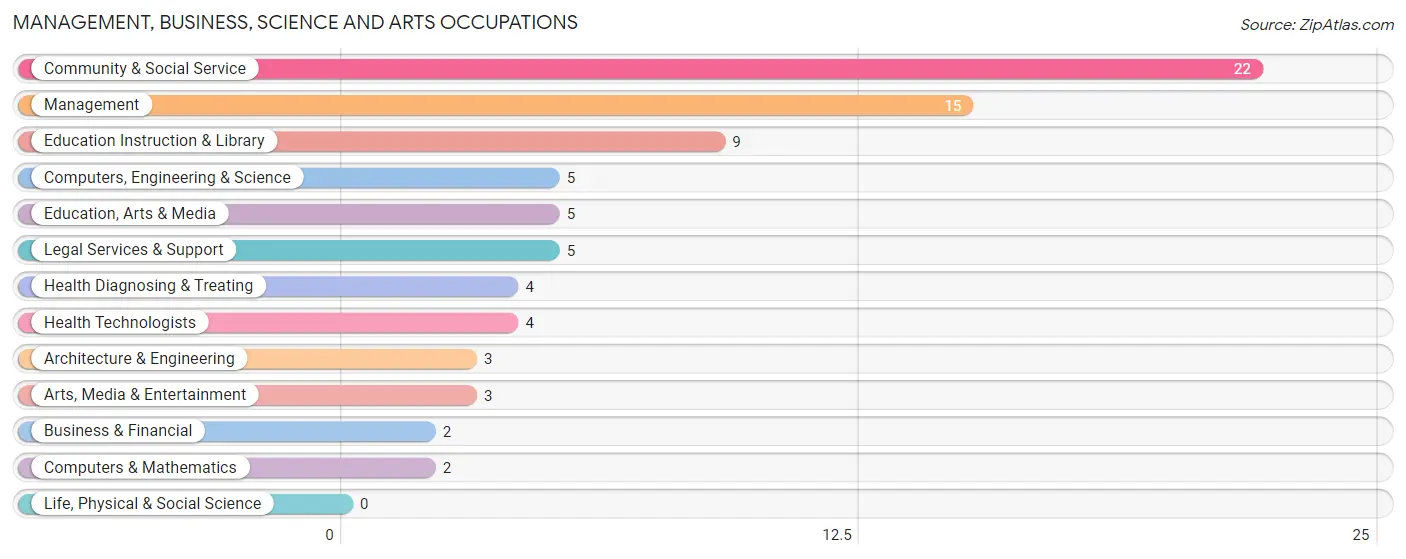
The most common Management, Business, Science and Arts occupations in Nezperce are Community & Social Service (22 | 13.9%), Management (15 | 9.5%), Education Instruction & Library (9 | 5.7%), Computers, Engineering & Science (5 | 3.2%), and Education, Arts & Media (5 | 3.2%).
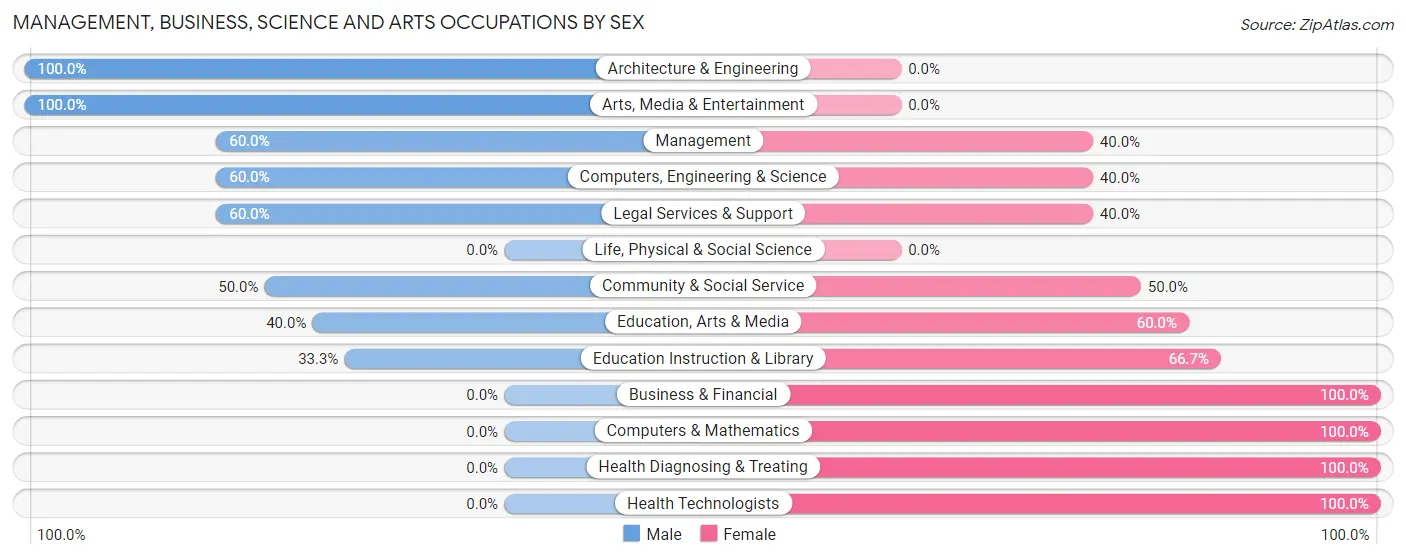
Management, Business, Science and Arts Occupations by Sex
Within the Management, Business, Science and Arts occupations in Nezperce, the most male-oriented occupations are Architecture & Engineering (100.0%), Arts, Media & Entertainment (100.0%), and Management (60.0%), while the most female-oriented occupations are Business & Financial (100.0%), Computers & Mathematics (100.0%), and Health Diagnosing & Treating (100.0%).
| Occupation | Male | Female |
| Management | 9 (60.0%) | 6 (40.0%) |
| Business & Financial | 0 (0.0%) | 2 (100.0%) |
| Computers, Engineering & Science | 3 (60.0%) | 2 (40.0%) |
| Computers & Mathematics | 0 (0.0%) | 2 (100.0%) |
| Architecture & Engineering | 3 (100.0%) | 0 (0.0%) |
| Life, Physical & Social Science | 0 (0.0%) | 0 (0.0%) |
| Community & Social Service | 11 (50.0%) | 11 (50.0%) |
| Education, Arts & Media | 2 (40.0%) | 3 (60.0%) |
| Legal Services & Support | 3 (60.0%) | 2 (40.0%) |
| Education Instruction & Library | 3 (33.3%) | 6 (66.7%) |
| Arts, Media & Entertainment | 3 (100.0%) | 0 (0.0%) |
| Health Diagnosing & Treating | 0 (0.0%) | 4 (100.0%) |
| Health Technologists | 0 (0.0%) | 4 (100.0%) |
| Total (Category) | 23 (47.9%) | 25 (52.1%) |
| Total (Overall) | 97 (61.4%) | 61 (38.6%) |
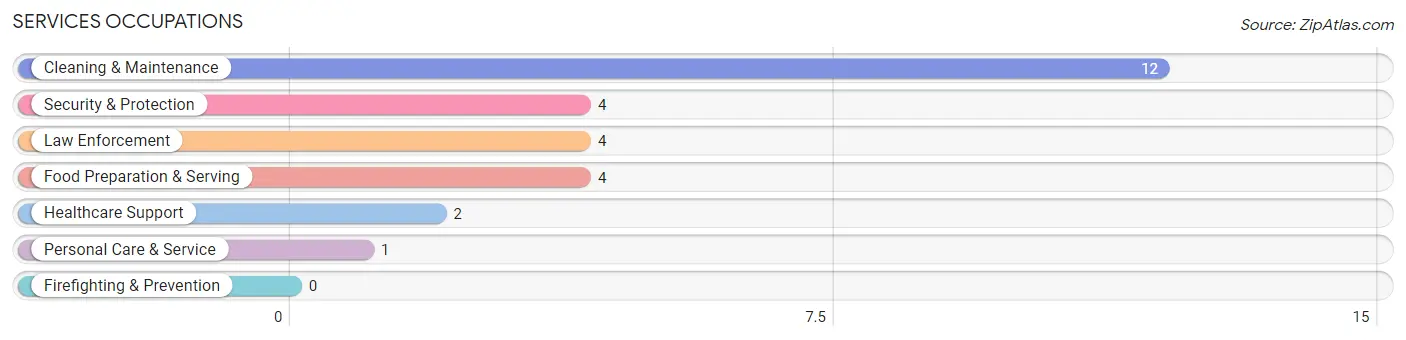
Services Occupations
The most common Services occupations in Nezperce are Cleaning & Maintenance (12 | 7.6%), Security & Protection (4 | 2.5%), Law Enforcement (4 | 2.5%), Food Preparation & Serving (4 | 2.5%), and Healthcare Support (2 | 1.3%).
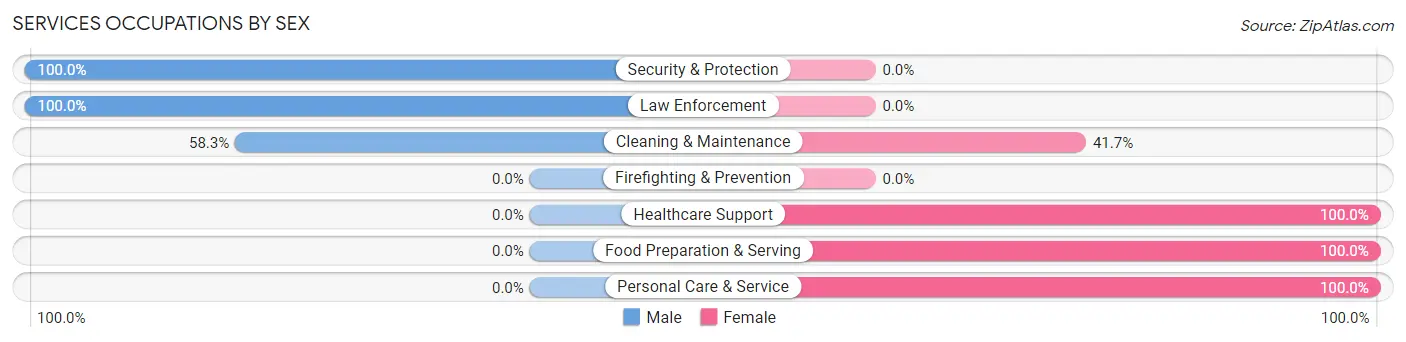
Services Occupations by Sex
Within the Services occupations in Nezperce, the most male-oriented occupations are Security & Protection (100.0%), Law Enforcement (100.0%), and Cleaning & Maintenance (58.3%), while the most female-oriented occupations are Healthcare Support (100.0%), Food Preparation & Serving (100.0%), and Personal Care & Service (100.0%).
| Occupation | Male | Female |
| Healthcare Support | 0 (0.0%) | 2 (100.0%) |
| Security & Protection | 4 (100.0%) | 0 (0.0%) |
| Firefighting & Prevention | 0 (0.0%) | 0 (0.0%) |
| Law Enforcement | 4 (100.0%) | 0 (0.0%) |
| Food Preparation & Serving | 0 (0.0%) | 4 (100.0%) |
| Cleaning & Maintenance | 7 (58.3%) | 5 (41.7%) |
| Personal Care & Service | 0 (0.0%) | 1 (100.0%) |
| Total (Category) | 11 (47.8%) | 12 (52.2%) |
| Total (Overall) | 97 (61.4%) | 61 (38.6%) |
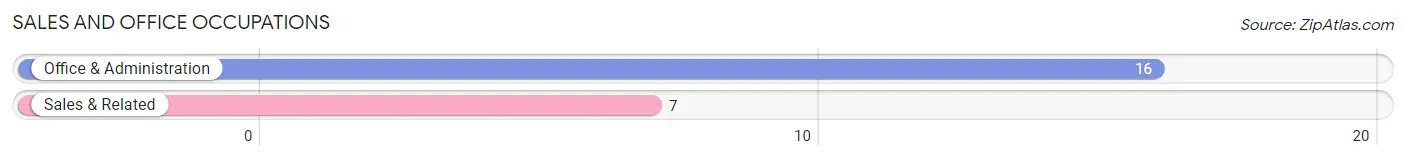
Sales and Office Occupations
The most common Sales and Office occupations in Nezperce are Office & Administration (16 | 10.1%), and Sales & Related (7 | 4.4%).
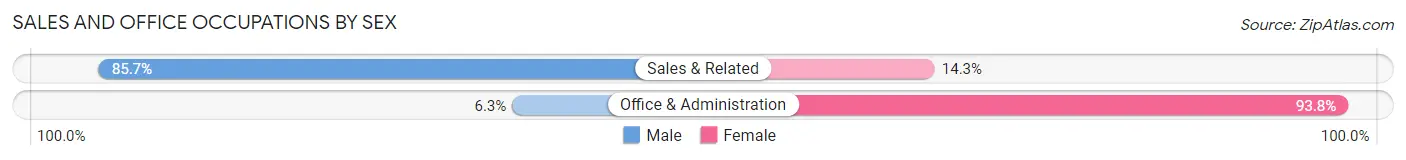
Sales and Office Occupations by Sex
| Occupation | Male | Female |
| Sales & Related | 6 (85.7%) | 1 (14.3%) |
| Office & Administration | 1 (6.2%) | 15 (93.8%) |
| Total (Category) | 7 (30.4%) | 16 (69.6%) |
| Total (Overall) | 97 (61.4%) | 61 (38.6%) |
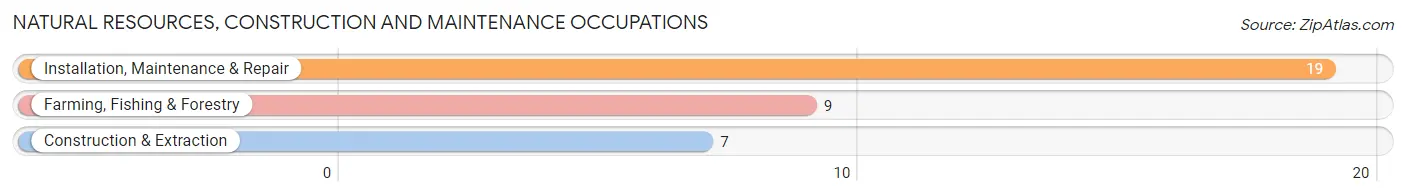
Natural Resources, Construction and Maintenance Occupations
The most common Natural Resources, Construction and Maintenance occupations in Nezperce are Installation, Maintenance & Repair (19 | 12.0%), Farming, Fishing & Forestry (9 | 5.7%), and Construction & Extraction (7 | 4.4%).
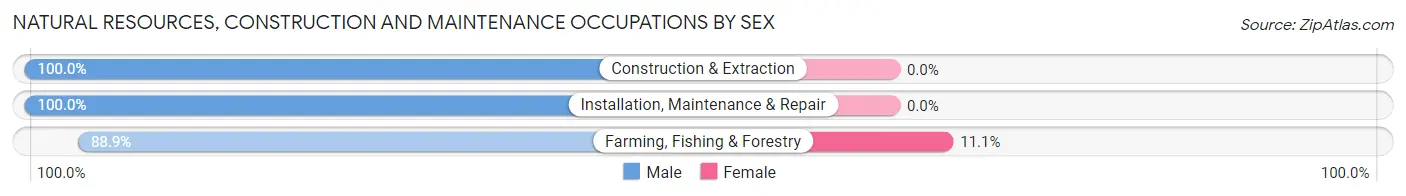
Natural Resources, Construction and Maintenance Occupations by Sex
| Occupation | Male | Female |
| Farming, Fishing & Forestry | 8 (88.9%) | 1 (11.1%) |
| Construction & Extraction | 7 (100.0%) | 0 (0.0%) |
| Installation, Maintenance & Repair | 19 (100.0%) | 0 (0.0%) |
| Total (Category) | 34 (97.1%) | 1 (2.9%) |
| Total (Overall) | 97 (61.4%) | 61 (38.6%) |
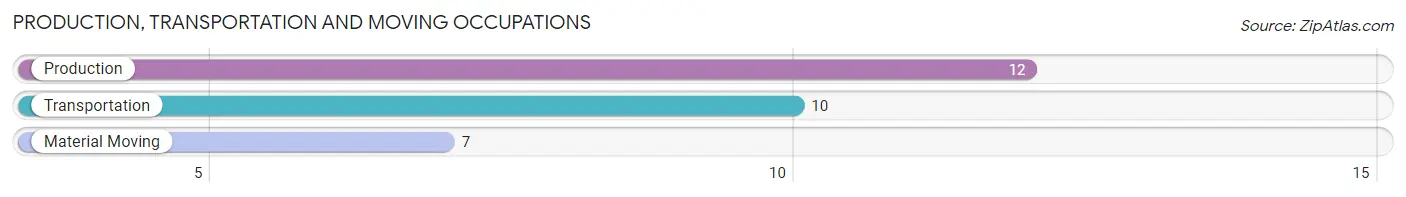
Production, Transportation and Moving Occupations
The most common Production, Transportation and Moving occupations in Nezperce are Production (12 | 7.6%), Transportation (10 | 6.3%), and Material Moving (7 | 4.4%).
Production, Transportation and Moving Occupations by Sex
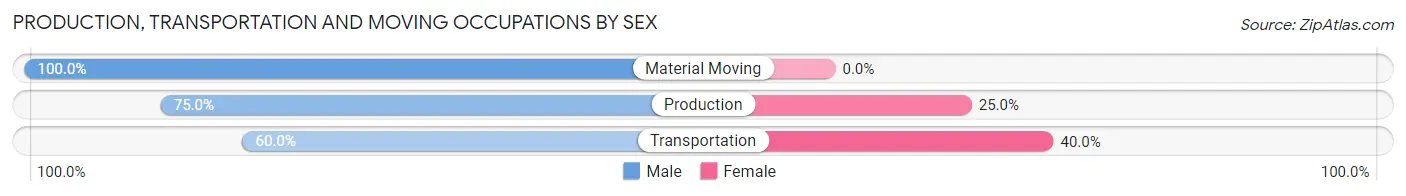
| Occupation | Male | Female |
| Production | 9 (75.0%) | 3 (25.0%) |
| Transportation | 6 (60.0%) | 4 (40.0%) |
| Material Moving | 7 (100.0%) | 0 (0.0%) |
| Total (Category) | 22 (75.9%) | 7 (24.1%) |
| Total (Overall) | 97 (61.4%) | 61 (38.6%) |
Employment Industries by Sex in Nezperce
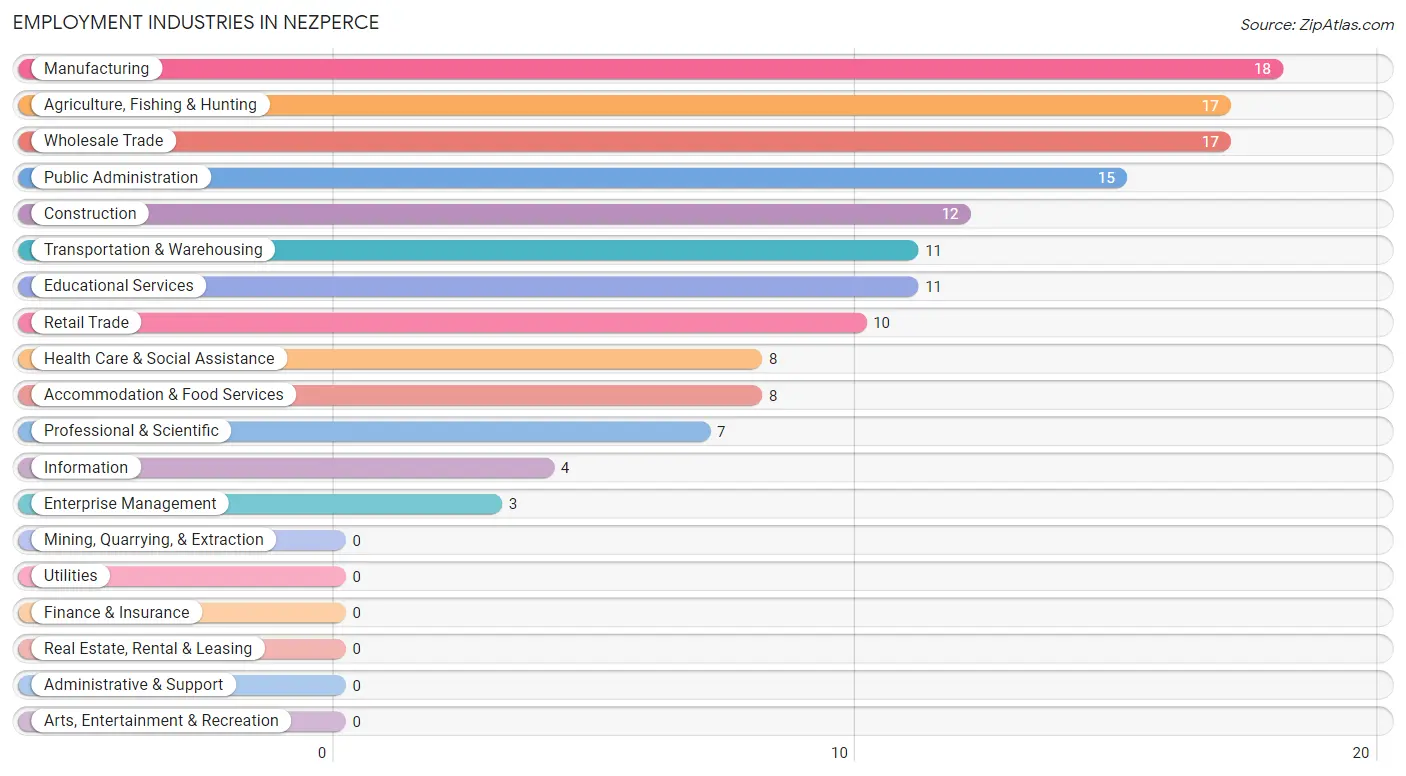
Employment Industries in Nezperce
The major employment industries in Nezperce include Manufacturing (18 | 11.4%), Agriculture, Fishing & Hunting (17 | 10.8%), Wholesale Trade (17 | 10.8%), Public Administration (15 | 9.5%), and Construction (12 | 7.6%).
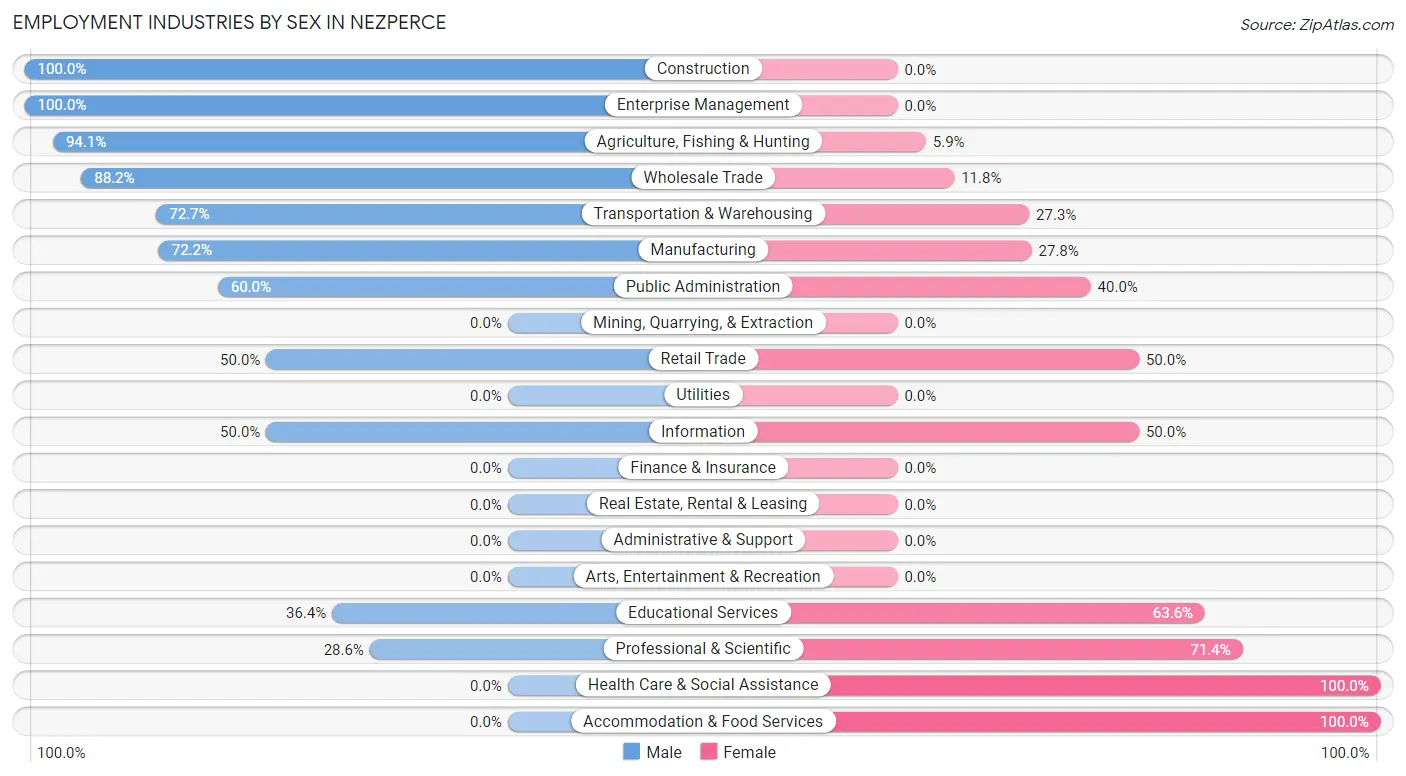
Employment Industries by Sex in Nezperce
The Nezperce industries that see more men than women are Construction (100.0%), Enterprise Management (100.0%), and Agriculture, Fishing & Hunting (94.1%), whereas the industries that tend to have a higher number of women are Health Care & Social Assistance (100.0%), Accommodation & Food Services (100.0%), and Professional & Scientific (71.4%).
| Industry | Male | Female |
| Agriculture, Fishing & Hunting | 16 (94.1%) | 1 (5.9%) |
| Mining, Quarrying, & Extraction | 0 (0.0%) | 0 (0.0%) |
| Construction | 12 (100.0%) | 0 (0.0%) |
| Manufacturing | 13 (72.2%) | 5 (27.8%) |
| Wholesale Trade | 15 (88.2%) | 2 (11.8%) |
| Retail Trade | 5 (50.0%) | 5 (50.0%) |
| Transportation & Warehousing | 8 (72.7%) | 3 (27.3%) |
| Utilities | 0 (0.0%) | 0 (0.0%) |
| Information | 2 (50.0%) | 2 (50.0%) |
| Finance & Insurance | 0 (0.0%) | 0 (0.0%) |
| Real Estate, Rental & Leasing | 0 (0.0%) | 0 (0.0%) |
| Professional & Scientific | 2 (28.6%) | 5 (71.4%) |
| Enterprise Management | 3 (100.0%) | 0 (0.0%) |
| Administrative & Support | 0 (0.0%) | 0 (0.0%) |
| Educational Services | 4 (36.4%) | 7 (63.6%) |
| Health Care & Social Assistance | 0 (0.0%) | 8 (100.0%) |
| Arts, Entertainment & Recreation | 0 (0.0%) | 0 (0.0%) |
| Accommodation & Food Services | 0 (0.0%) | 8 (100.0%) |
| Public Administration | 9 (60.0%) | 6 (40.0%) |
| Total | 97 (61.4%) | 61 (38.6%) |
Education in Nezperce
School Enrollment in Nezperce
The most common levels of schooling among the 124 students in Nezperce are elementary school (69 | 55.6%), high school (26 | 21.0%), and middle school (17 | 13.7%).
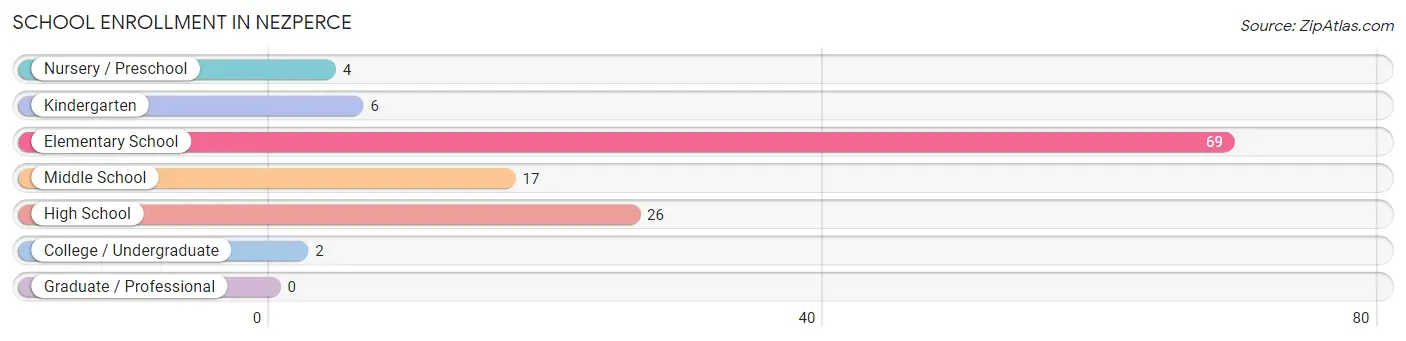
| School Level | # Students | % Students |
| Nursery / Preschool | 4 | 3.2% |
| Kindergarten | 6 | 4.8% |
| Elementary School | 69 | 55.6% |
| Middle School | 17 | 13.7% |
| High School | 26 | 21.0% |
| College / Undergraduate | 2 | 1.6% |
| Graduate / Professional | 0 | 0.0% |
| Total | 124 | 100.0% |
School Enrollment by Age by Funding Source in Nezperce
Out of a total of 124 students who are enrolled in schools in Nezperce, 8 (6.5%) attend a private institution, while the remaining 116 (93.5%) are enrolled in public schools. The age group of 10 to 14 year olds has the highest likelihood of being enrolled in private schools, with 2 (9.5% in the age bracket) enrolled. Conversely, the age group of 3 to 4 year olds has the lowest likelihood of being enrolled in a private school, with 2 (100.0% in the age bracket) attending a public institution.
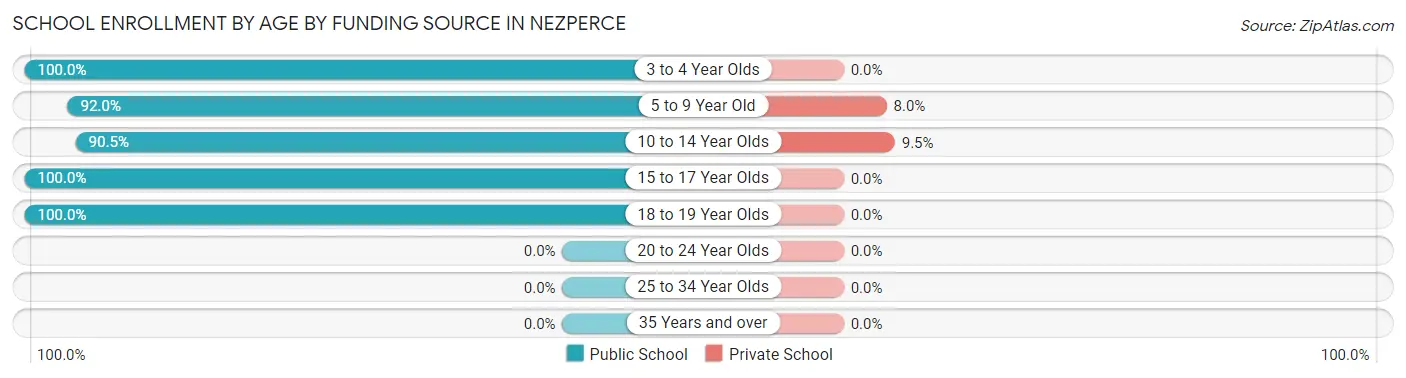
| Age Bracket | Public School | Private School |
| 3 to 4 Year Olds | 2 (100.0%) | 0 (0.0%) |
| 5 to 9 Year Old | 69 (92.0%) | 6 (8.0%) |
| 10 to 14 Year Olds | 19 (90.5%) | 2 (9.5%) |
| 15 to 17 Year Olds | 24 (100.0%) | 0 (0.0%) |
| 18 to 19 Year Olds | 2 (100.0%) | 0 (0.0%) |
| 20 to 24 Year Olds | 0 (0.0%) | 0 (0.0%) |
| 25 to 34 Year Olds | 0 (0.0%) | 0 (0.0%) |
| 35 Years and over | 0 (0.0%) | 0 (0.0%) |
| Total | 116 (93.5%) | 8 (6.5%) |
Educational Attainment by Field of Study in Nezperce
Bio, nature & agricultural (16 | 21.0%), education (15 | 19.7%), arts & humanities (10 | 13.2%), business (8 | 10.5%), and social sciences (7 | 9.2%) are the most common fields of study among 76 individuals in Nezperce who have obtained a bachelor's degree or higher.
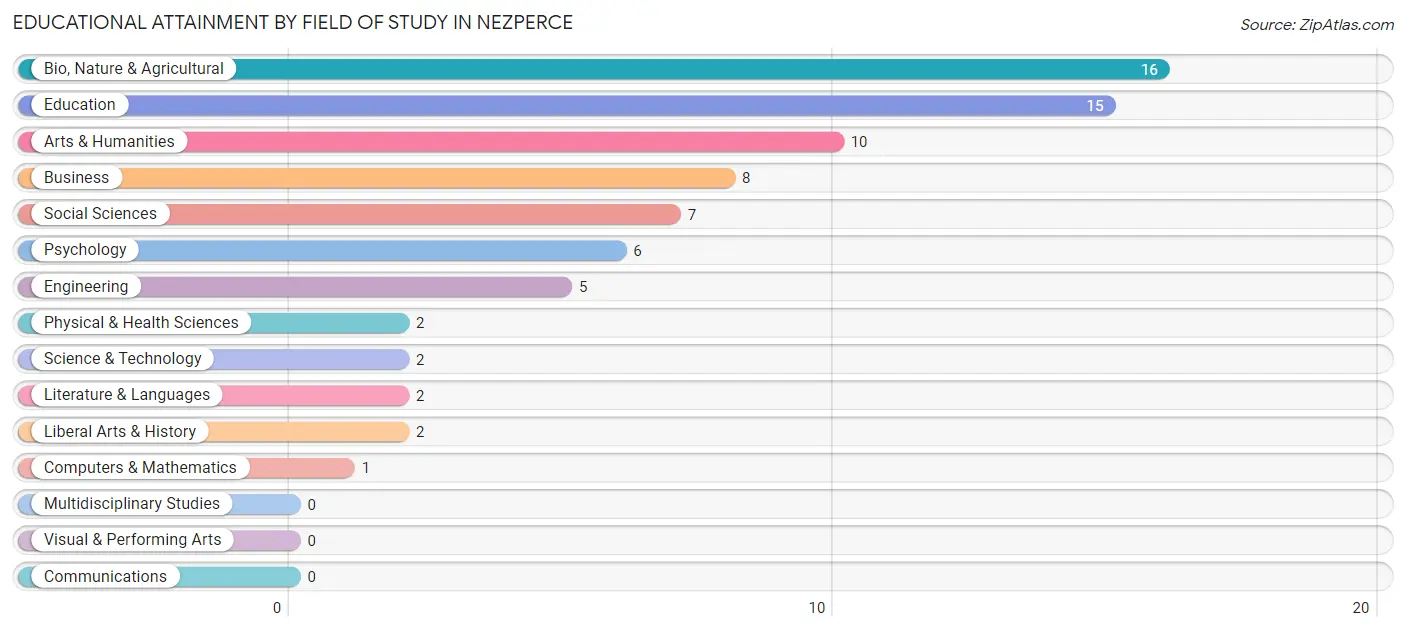
| Field of Study | # Graduates | % Graduates |
| Computers & Mathematics | 1 | 1.3% |
| Bio, Nature & Agricultural | 16 | 21.0% |
| Physical & Health Sciences | 2 | 2.6% |
| Psychology | 6 | 7.9% |
| Social Sciences | 7 | 9.2% |
| Engineering | 5 | 6.6% |
| Multidisciplinary Studies | 0 | 0.0% |
| Science & Technology | 2 | 2.6% |
| Business | 8 | 10.5% |
| Education | 15 | 19.7% |
| Literature & Languages | 2 | 2.6% |
| Liberal Arts & History | 2 | 2.6% |
| Visual & Performing Arts | 0 | 0.0% |
| Communications | 0 | 0.0% |
| Arts & Humanities | 10 | 13.2% |
| Total | 76 | 100.0% |
Transportation & Commute in Nezperce
Vehicle Availability by Sex in Nezperce
The most prevalent vehicle ownership categories in Nezperce are males with 3 vehicles (37, accounting for 40.7%) and females with 3 vehicles (23, making up 62.7%).
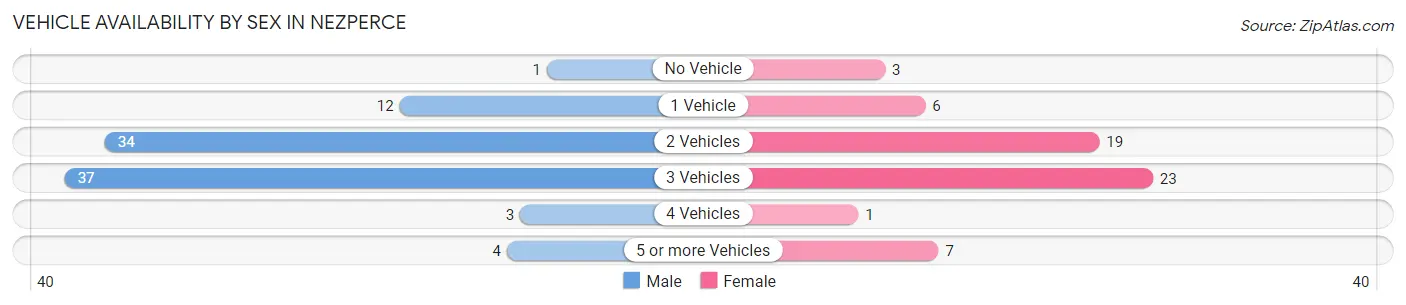
| Vehicles Available | Male | Female |
| No Vehicle | 1 (1.1%) | 3 (5.1%) |
| 1 Vehicle | 12 (13.2%) | 6 (10.2%) |
| 2 Vehicles | 34 (37.4%) | 19 (32.2%) |
| 3 Vehicles | 37 (40.7%) | 23 (39.0%) |
| 4 Vehicles | 3 (3.3%) | 1 (1.7%) |
| 5 or more Vehicles | 4 (4.4%) | 7 (11.9%) |
| Total | 91 (100.0%) | 59 (100.0%) |
Commute Time in Nezperce
The most frequently occuring commute durations in Nezperce are less than 5 minutes (48 commuters, 33.6%), 5 to 9 minutes (42 commuters, 29.4%), and 20 to 24 minutes (12 commuters, 8.4%).
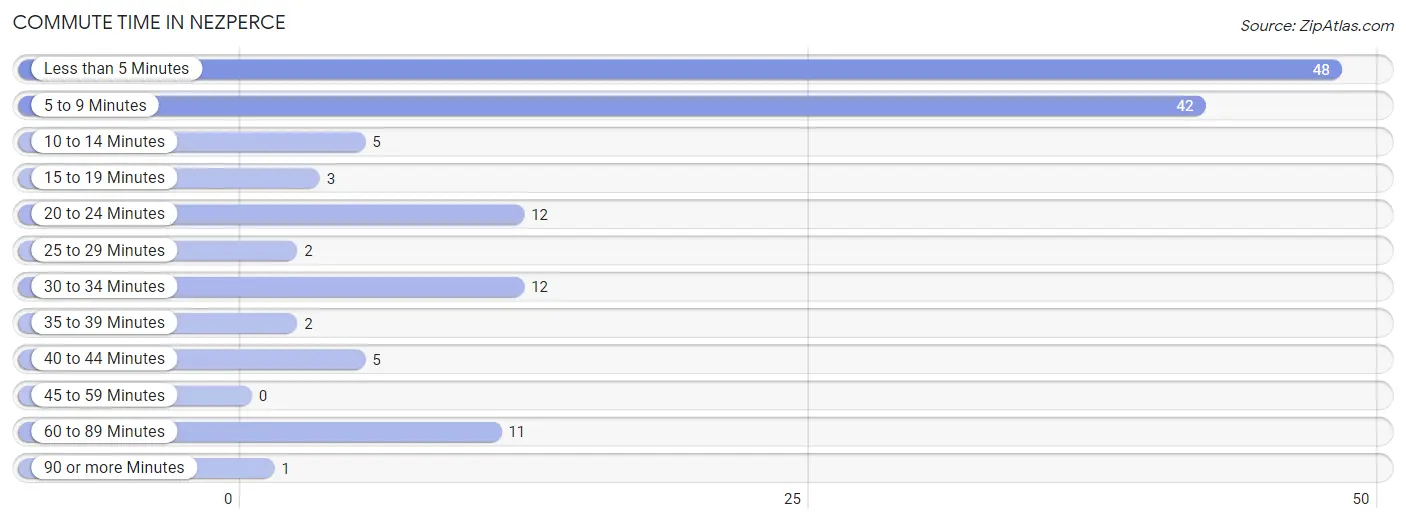
| Commute Time | # Commuters | % Commuters |
| Less than 5 Minutes | 48 | 33.6% |
| 5 to 9 Minutes | 42 | 29.4% |
| 10 to 14 Minutes | 5 | 3.5% |
| 15 to 19 Minutes | 3 | 2.1% |
| 20 to 24 Minutes | 12 | 8.4% |
| 25 to 29 Minutes | 2 | 1.4% |
| 30 to 34 Minutes | 12 | 8.4% |
| 35 to 39 Minutes | 2 | 1.4% |
| 40 to 44 Minutes | 5 | 3.5% |
| 45 to 59 Minutes | 0 | 0.0% |
| 60 to 89 Minutes | 11 | 7.7% |
| 90 or more Minutes | 1 | 0.7% |
Commute Time by Sex in Nezperce
The most common commute times in Nezperce are 5 to 9 minutes (32 commuters, 36.0%) for males and less than 5 minutes (19 commuters, 35.2%) for females.

| Commute Time | Male | Female |
| Less than 5 Minutes | 29 (32.6%) | 19 (35.2%) |
| 5 to 9 Minutes | 32 (36.0%) | 10 (18.5%) |
| 10 to 14 Minutes | 4 (4.5%) | 1 (1.8%) |
| 15 to 19 Minutes | 2 (2.2%) | 1 (1.8%) |
| 20 to 24 Minutes | 5 (5.6%) | 7 (13.0%) |
| 25 to 29 Minutes | 0 (0.0%) | 2 (3.7%) |
| 30 to 34 Minutes | 5 (5.6%) | 7 (13.0%) |
| 35 to 39 Minutes | 2 (2.2%) | 0 (0.0%) |
| 40 to 44 Minutes | 1 (1.1%) | 4 (7.4%) |
| 45 to 59 Minutes | 0 (0.0%) | 0 (0.0%) |
| 60 to 89 Minutes | 9 (10.1%) | 2 (3.7%) |
| 90 or more Minutes | 0 (0.0%) | 1 (1.8%) |
Time of Departure to Work by Sex in Nezperce
The most frequent times of departure to work in Nezperce are 7:30 AM to 7:59 AM (24, 27.0%) for males and 9:00 AM to 9:59 AM (16, 29.6%) for females.
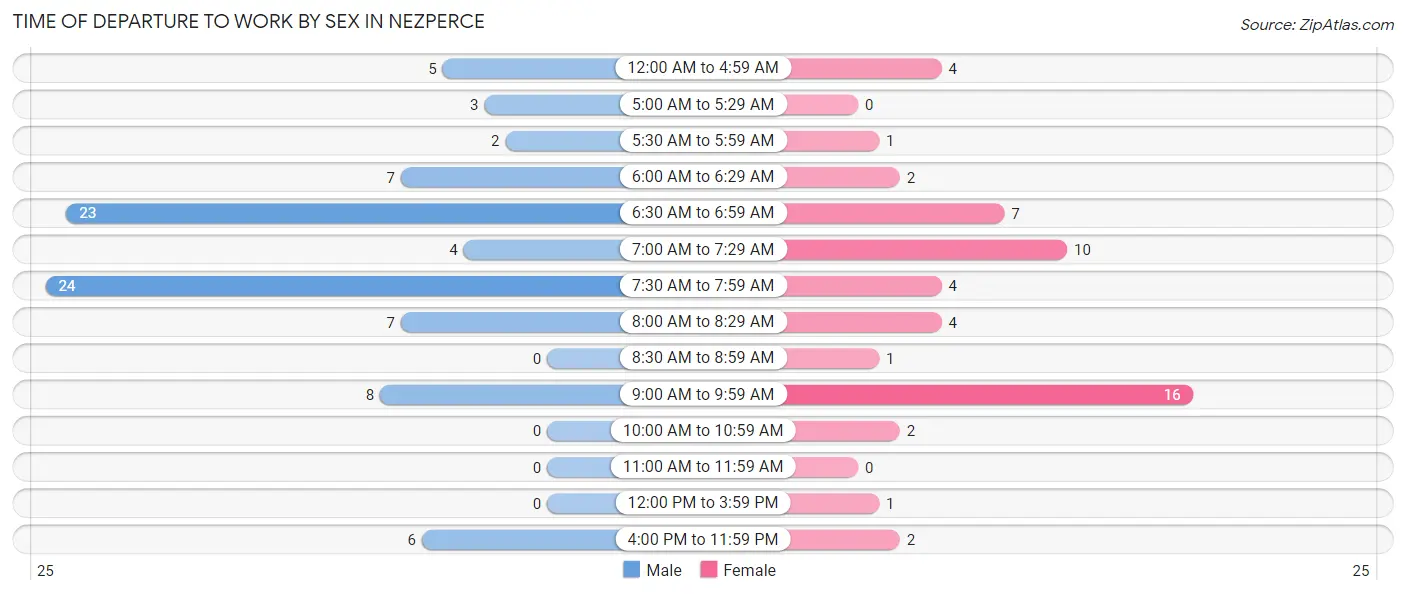
| Time of Departure | Male | Female |
| 12:00 AM to 4:59 AM | 5 (5.6%) | 4 (7.4%) |
| 5:00 AM to 5:29 AM | 3 (3.4%) | 0 (0.0%) |
| 5:30 AM to 5:59 AM | 2 (2.2%) | 1 (1.8%) |
| 6:00 AM to 6:29 AM | 7 (7.9%) | 2 (3.7%) |
| 6:30 AM to 6:59 AM | 23 (25.8%) | 7 (13.0%) |
| 7:00 AM to 7:29 AM | 4 (4.5%) | 10 (18.5%) |
| 7:30 AM to 7:59 AM | 24 (27.0%) | 4 (7.4%) |
| 8:00 AM to 8:29 AM | 7 (7.9%) | 4 (7.4%) |
| 8:30 AM to 8:59 AM | 0 (0.0%) | 1 (1.8%) |
| 9:00 AM to 9:59 AM | 8 (9.0%) | 16 (29.6%) |
| 10:00 AM to 10:59 AM | 0 (0.0%) | 2 (3.7%) |
| 11:00 AM to 11:59 AM | 0 (0.0%) | 0 (0.0%) |
| 12:00 PM to 3:59 PM | 0 (0.0%) | 1 (1.8%) |
| 4:00 PM to 11:59 PM | 6 (6.7%) | 2 (3.7%) |
| Total | 89 (100.0%) | 54 (100.0%) |
Housing Occupancy in Nezperce
Occupancy by Ownership in Nezperce
Of the total 192 dwellings in Nezperce, owner-occupied units account for 161 (83.9%), while renter-occupied units make up 31 (16.2%).
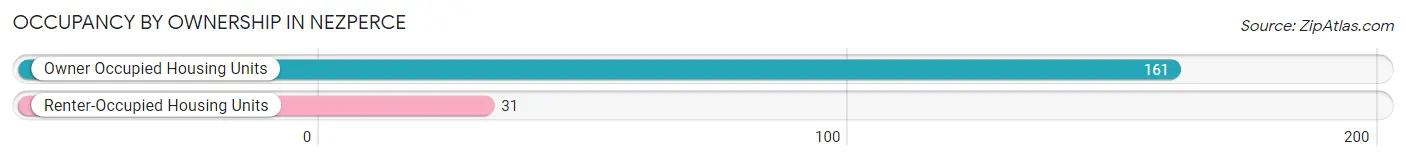
| Occupancy | # Housing Units | % Housing Units |
| Owner Occupied Housing Units | 161 | 83.9% |
| Renter-Occupied Housing Units | 31 | 16.2% |
| Total Occupied Housing Units | 192 | 100.0% |
Occupancy by Household Size in Nezperce
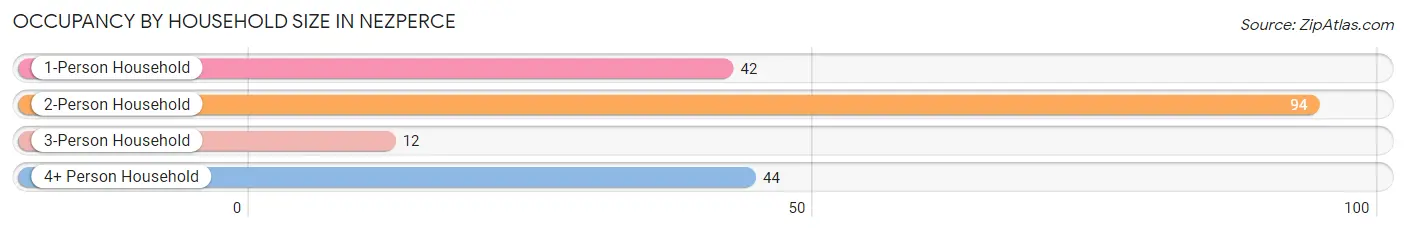
| Household Size | # Housing Units | % Housing Units |
| 1-Person Household | 42 | 21.9% |
| 2-Person Household | 94 | 49.0% |
| 3-Person Household | 12 | 6.2% |
| 4+ Person Household | 44 | 22.9% |
| Total Housing Units | 192 | 100.0% |
Occupancy by Ownership by Household Size in Nezperce
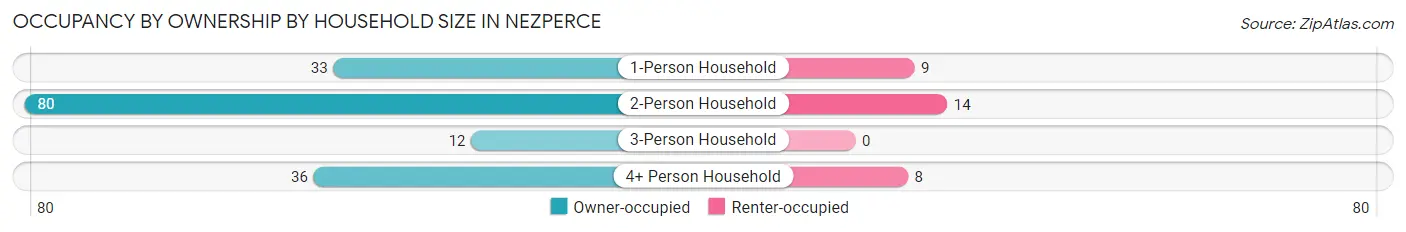
| Household Size | Owner-occupied | Renter-occupied |
| 1-Person Household | 33 (78.6%) | 9 (21.4%) |
| 2-Person Household | 80 (85.1%) | 14 (14.9%) |
| 3-Person Household | 12 (100.0%) | 0 (0.0%) |
| 4+ Person Household | 36 (81.8%) | 8 (18.2%) |
| Total Housing Units | 161 (83.9%) | 31 (16.2%) |
Occupancy by Educational Attainment in Nezperce
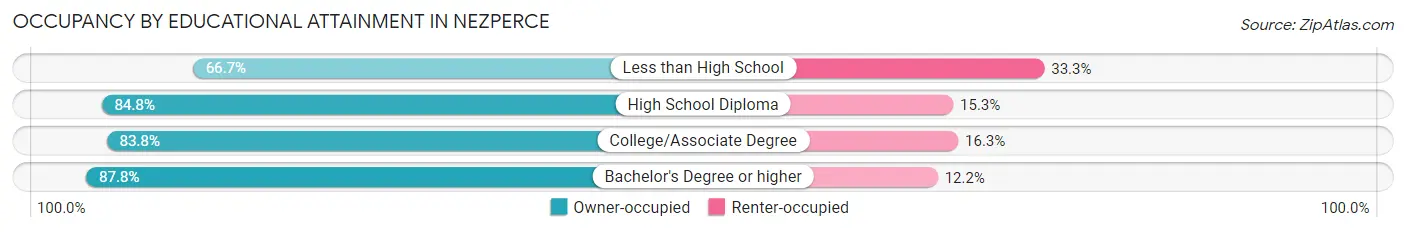
| Household Size | Owner-occupied | Renter-occupied |
| Less than High School | 8 (66.7%) | 4 (33.3%) |
| High School Diploma | 50 (84.8%) | 9 (15.2%) |
| College/Associate Degree | 67 (83.8%) | 13 (16.3%) |
| Bachelor's Degree or higher | 36 (87.8%) | 5 (12.2%) |
Occupancy by Age of Householder in Nezperce
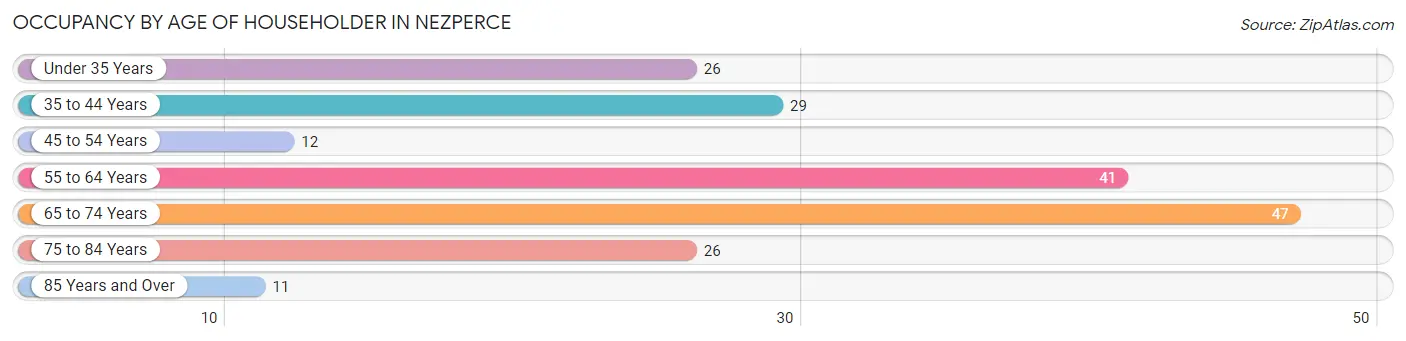
| Age Bracket | # Households | % Households |
| Under 35 Years | 26 | 13.5% |
| 35 to 44 Years | 29 | 15.1% |
| 45 to 54 Years | 12 | 6.2% |
| 55 to 64 Years | 41 | 21.3% |
| 65 to 74 Years | 47 | 24.5% |
| 75 to 84 Years | 26 | 13.5% |
| 85 Years and Over | 11 | 5.7% |
| Total | 192 | 100.0% |
Housing Finances in Nezperce
Median Income by Occupancy in Nezperce
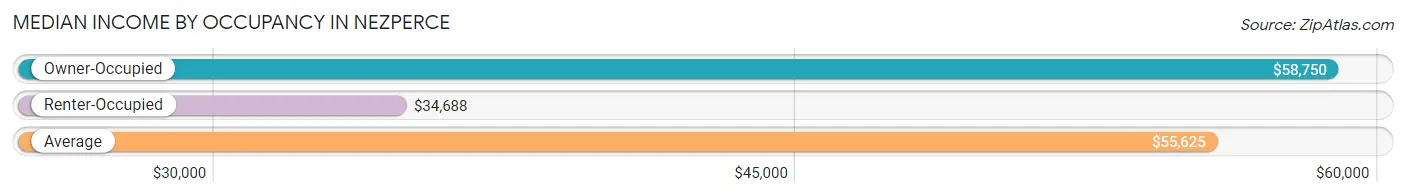
| Occupancy Type | # Households | Median Income |
| Owner-Occupied | 161 (83.9%) | $58,750 |
| Renter-Occupied | 31 (16.2%) | $34,688 |
| Average | 192 (100.0%) | $55,625 |
Occupancy by Householder Income Bracket in Nezperce
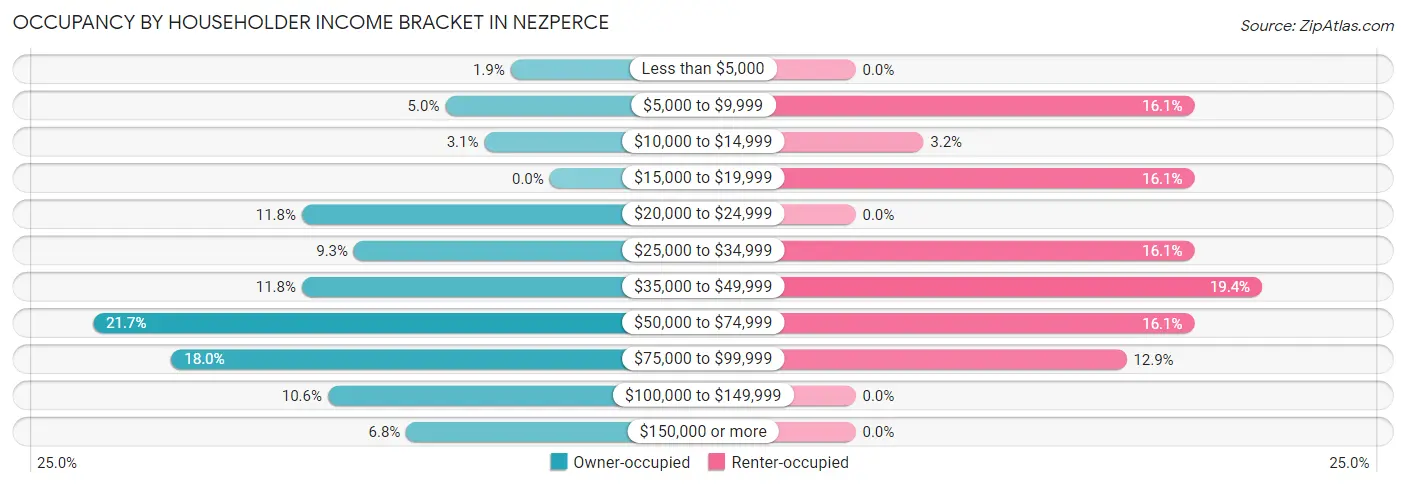
| Income Bracket | Owner-occupied | Renter-occupied |
| Less than $5,000 | 3 (1.9%) | 0 (0.0%) |
| $5,000 to $9,999 | 8 (5.0%) | 5 (16.1%) |
| $10,000 to $14,999 | 5 (3.1%) | 1 (3.2%) |
| $15,000 to $19,999 | 0 (0.0%) | 5 (16.1%) |
| $20,000 to $24,999 | 19 (11.8%) | 0 (0.0%) |
| $25,000 to $34,999 | 15 (9.3%) | 5 (16.1%) |
| $35,000 to $49,999 | 19 (11.8%) | 6 (19.4%) |
| $50,000 to $74,999 | 35 (21.7%) | 5 (16.1%) |
| $75,000 to $99,999 | 29 (18.0%) | 4 (12.9%) |
| $100,000 to $149,999 | 17 (10.6%) | 0 (0.0%) |
| $150,000 or more | 11 (6.8%) | 0 (0.0%) |
| Total | 161 (100.0%) | 31 (100.0%) |
Monthly Housing Cost Tiers in Nezperce
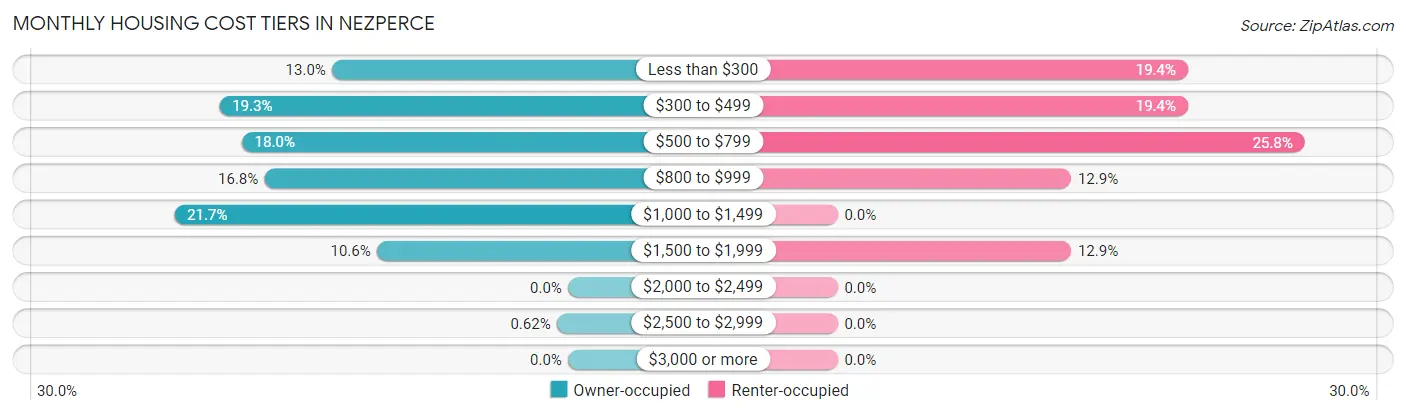
| Monthly Cost | Owner-occupied | Renter-occupied |
| Less than $300 | 21 (13.0%) | 6 (19.4%) |
| $300 to $499 | 31 (19.3%) | 6 (19.4%) |
| $500 to $799 | 29 (18.0%) | 8 (25.8%) |
| $800 to $999 | 27 (16.8%) | 4 (12.9%) |
| $1,000 to $1,499 | 35 (21.7%) | 0 (0.0%) |
| $1,500 to $1,999 | 17 (10.6%) | 4 (12.9%) |
| $2,000 to $2,499 | 0 (0.0%) | 0 (0.0%) |
| $2,500 to $2,999 | 1 (0.6%) | 0 (0.0%) |
| $3,000 or more | 0 (0.0%) | 0 (0.0%) |
| Total | 161 (100.0%) | 31 (100.0%) |
Physical Housing Characteristics in Nezperce
Housing Structures in Nezperce
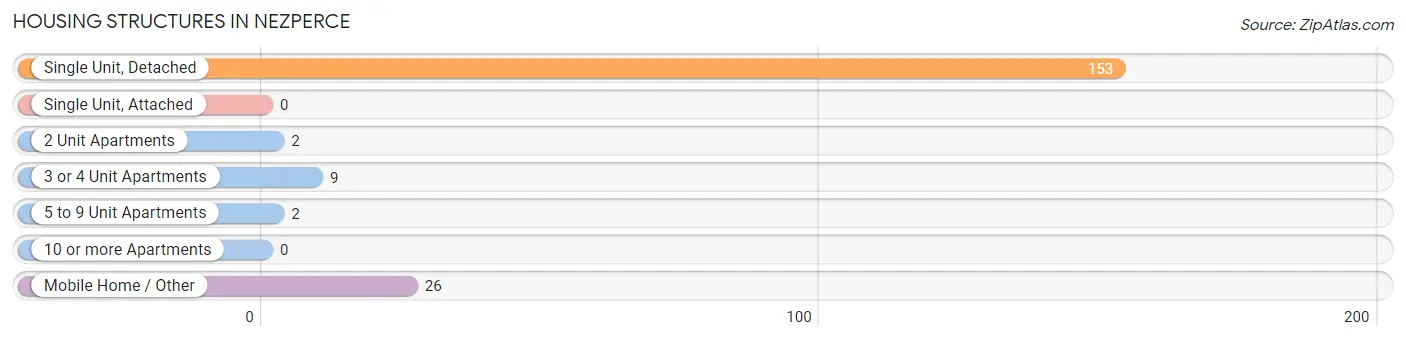
| Structure Type | # Housing Units | % Housing Units |
| Single Unit, Detached | 153 | 79.7% |
| Single Unit, Attached | 0 | 0.0% |
| 2 Unit Apartments | 2 | 1.0% |
| 3 or 4 Unit Apartments | 9 | 4.7% |
| 5 to 9 Unit Apartments | 2 | 1.0% |
| 10 or more Apartments | 0 | 0.0% |
| Mobile Home / Other | 26 | 13.5% |
| Total | 192 | 100.0% |
Housing Structures by Occupancy in Nezperce
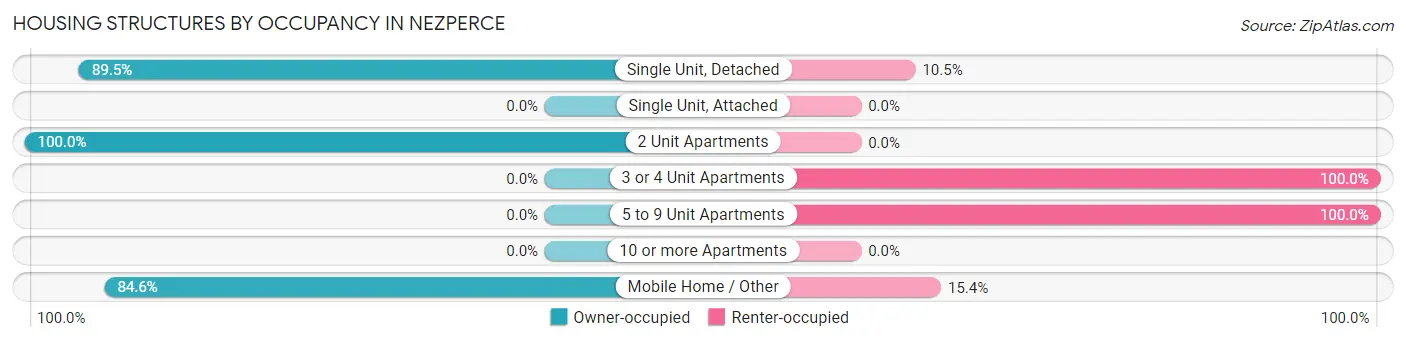
| Structure Type | Owner-occupied | Renter-occupied |
| Single Unit, Detached | 137 (89.5%) | 16 (10.5%) |
| Single Unit, Attached | 0 (0.0%) | 0 (0.0%) |
| 2 Unit Apartments | 2 (100.0%) | 0 (0.0%) |
| 3 or 4 Unit Apartments | 0 (0.0%) | 9 (100.0%) |
| 5 to 9 Unit Apartments | 0 (0.0%) | 2 (100.0%) |
| 10 or more Apartments | 0 (0.0%) | 0 (0.0%) |
| Mobile Home / Other | 22 (84.6%) | 4 (15.4%) |
| Total | 161 (83.9%) | 31 (16.2%) |
Housing Structures by Number of Rooms in Nezperce
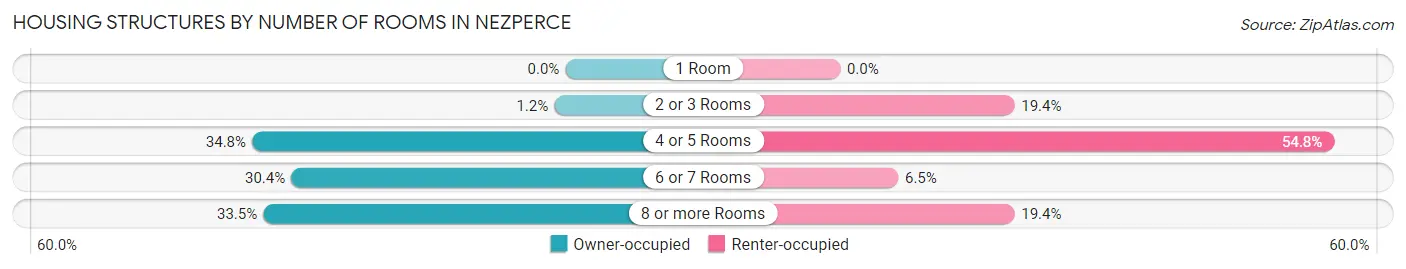
| Number of Rooms | Owner-occupied | Renter-occupied |
| 1 Room | 0 (0.0%) | 0 (0.0%) |
| 2 or 3 Rooms | 2 (1.2%) | 6 (19.4%) |
| 4 or 5 Rooms | 56 (34.8%) | 17 (54.8%) |
| 6 or 7 Rooms | 49 (30.4%) | 2 (6.5%) |
| 8 or more Rooms | 54 (33.5%) | 6 (19.4%) |
| Total | 161 (100.0%) | 31 (100.0%) |
Housing Structure by Heating Type in Nezperce
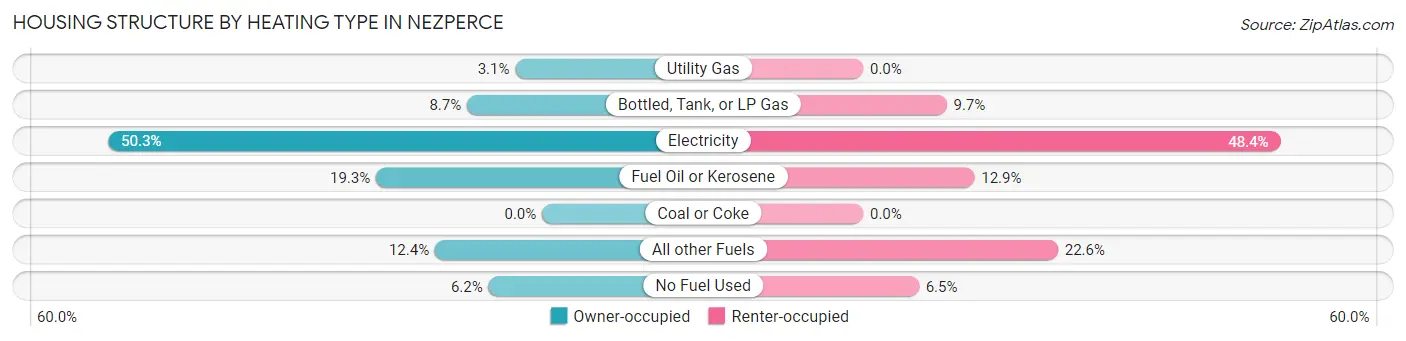
| Heating Type | Owner-occupied | Renter-occupied |
| Utility Gas | 5 (3.1%) | 0 (0.0%) |
| Bottled, Tank, or LP Gas | 14 (8.7%) | 3 (9.7%) |
| Electricity | 81 (50.3%) | 15 (48.4%) |
| Fuel Oil or Kerosene | 31 (19.3%) | 4 (12.9%) |
| Coal or Coke | 0 (0.0%) | 0 (0.0%) |
| All other Fuels | 20 (12.4%) | 7 (22.6%) |
| No Fuel Used | 10 (6.2%) | 2 (6.5%) |
| Total | 161 (100.0%) | 31 (100.0%) |
Household Vehicle Usage in Nezperce
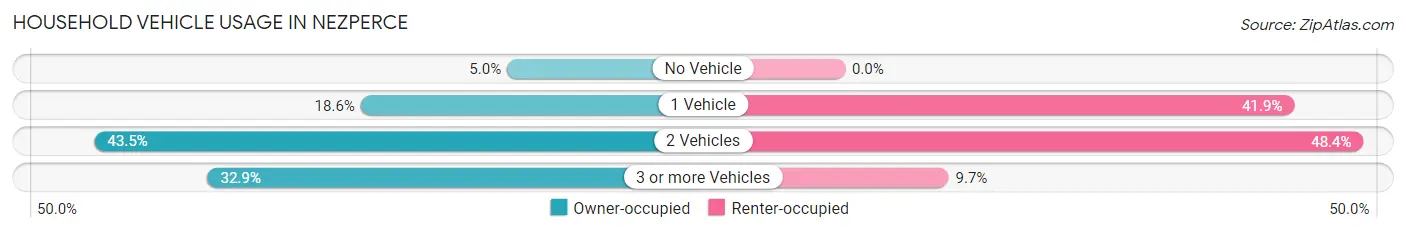
| Vehicles per Household | Owner-occupied | Renter-occupied |
| No Vehicle | 8 (5.0%) | 0 (0.0%) |
| 1 Vehicle | 30 (18.6%) | 13 (41.9%) |
| 2 Vehicles | 70 (43.5%) | 15 (48.4%) |
| 3 or more Vehicles | 53 (32.9%) | 3 (9.7%) |
| Total | 161 (100.0%) | 31 (100.0%) |
Real Estate & Mortgages in Nezperce
Real Estate and Mortgage Overview in Nezperce
| Characteristic | Without Mortgage | With Mortgage |
| Housing Units | 74 | 87 |
| Median Property Value | $127,800 | $155,400 |
| Median Household Income | $53,333 | $4 |
| Monthly Housing Costs | $394 | $0 |
| Real Estate Taxes | $1,188 | $1 |
Property Value by Mortgage Status in Nezperce
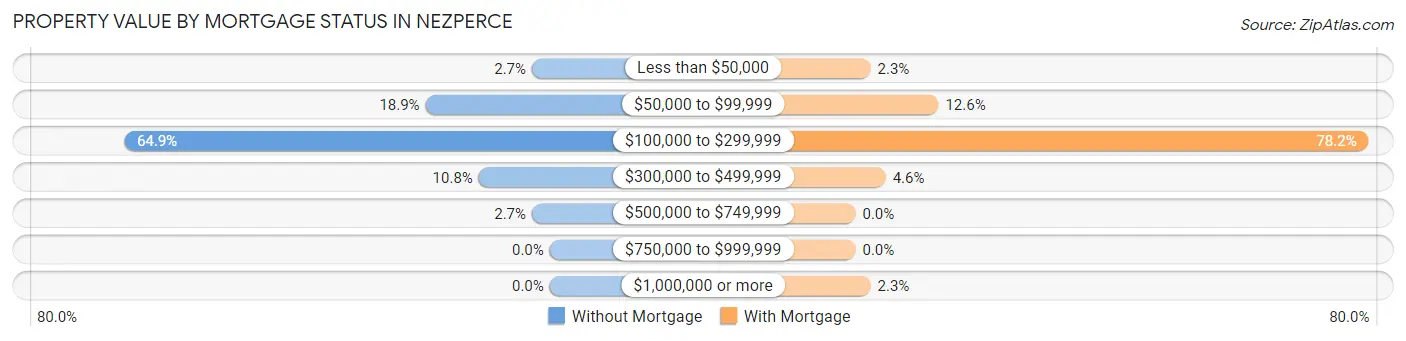
| Property Value | Without Mortgage | With Mortgage |
| Less than $50,000 | 2 (2.7%) | 2 (2.3%) |
| $50,000 to $99,999 | 14 (18.9%) | 11 (12.6%) |
| $100,000 to $299,999 | 48 (64.9%) | 68 (78.2%) |
| $300,000 to $499,999 | 8 (10.8%) | 4 (4.6%) |
| $500,000 to $749,999 | 2 (2.7%) | 0 (0.0%) |
| $750,000 to $999,999 | 0 (0.0%) | 0 (0.0%) |
| $1,000,000 or more | 0 (0.0%) | 2 (2.3%) |
| Total | 74 (100.0%) | 87 (100.0%) |
Household Income by Mortgage Status in Nezperce
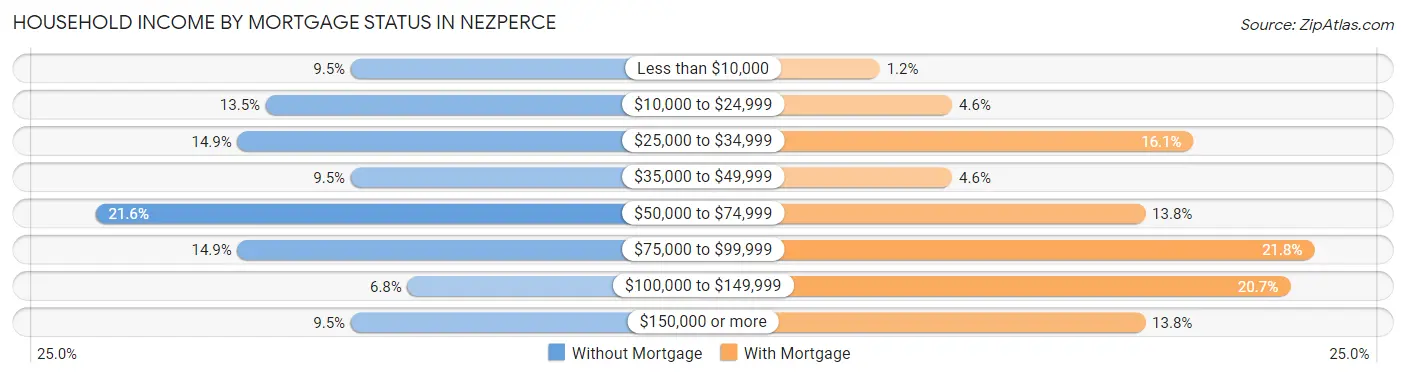
| Household Income | Without Mortgage | With Mortgage |
| Less than $10,000 | 7 (9.5%) | 1 (1.1%) |
| $10,000 to $24,999 | 10 (13.5%) | 4 (4.6%) |
| $25,000 to $34,999 | 11 (14.9%) | 14 (16.1%) |
| $35,000 to $49,999 | 7 (9.5%) | 4 (4.6%) |
| $50,000 to $74,999 | 16 (21.6%) | 12 (13.8%) |
| $75,000 to $99,999 | 11 (14.9%) | 19 (21.8%) |
| $100,000 to $149,999 | 5 (6.8%) | 18 (20.7%) |
| $150,000 or more | 7 (9.5%) | 12 (13.8%) |
| Total | 74 (100.0%) | 87 (100.0%) |
Property Value to Household Income Ratio in Nezperce
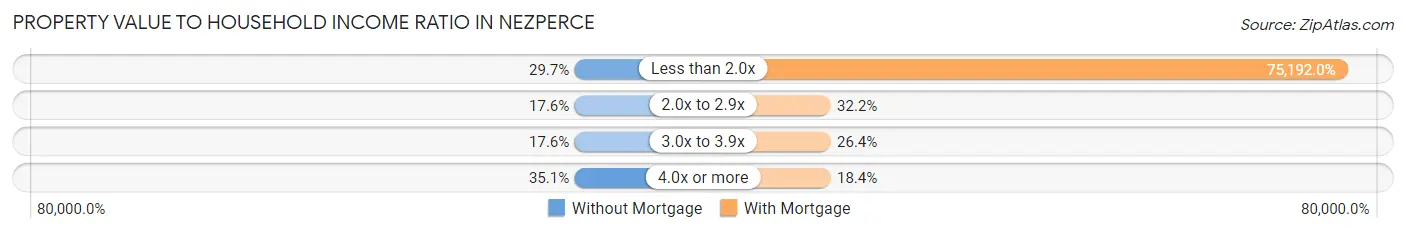
| Value-to-Income Ratio | Without Mortgage | With Mortgage |
| Less than 2.0x | 22 (29.7%) | 65,417 (75,191.9%) |
| 2.0x to 2.9x | 13 (17.6%) | 28 (32.2%) |
| 3.0x to 3.9x | 13 (17.6%) | 23 (26.4%) |
| 4.0x or more | 26 (35.1%) | 16 (18.4%) |
| Total | 74 (100.0%) | 87 (100.0%) |
Real Estate Taxes by Mortgage Status in Nezperce
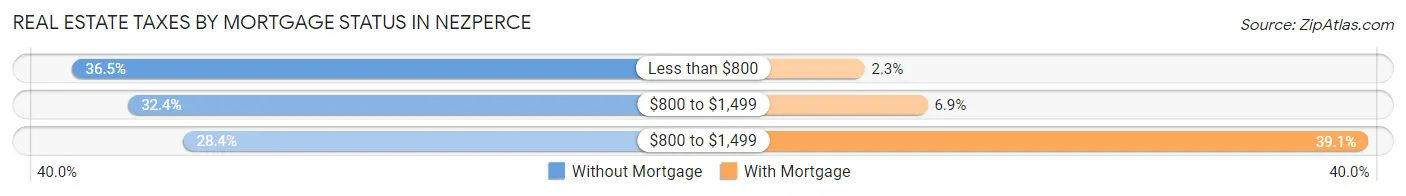
| Property Taxes | Without Mortgage | With Mortgage |
| Less than $800 | 27 (36.5%) | 2 (2.3%) |
| $800 to $1,499 | 24 (32.4%) | 6 (6.9%) |
| $800 to $1,499 | 21 (28.4%) | 34 (39.1%) |
| Total | 74 (100.0%) | 87 (100.0%) |
Health & Disability in Nezperce
Health Insurance Coverage by Age in Nezperce
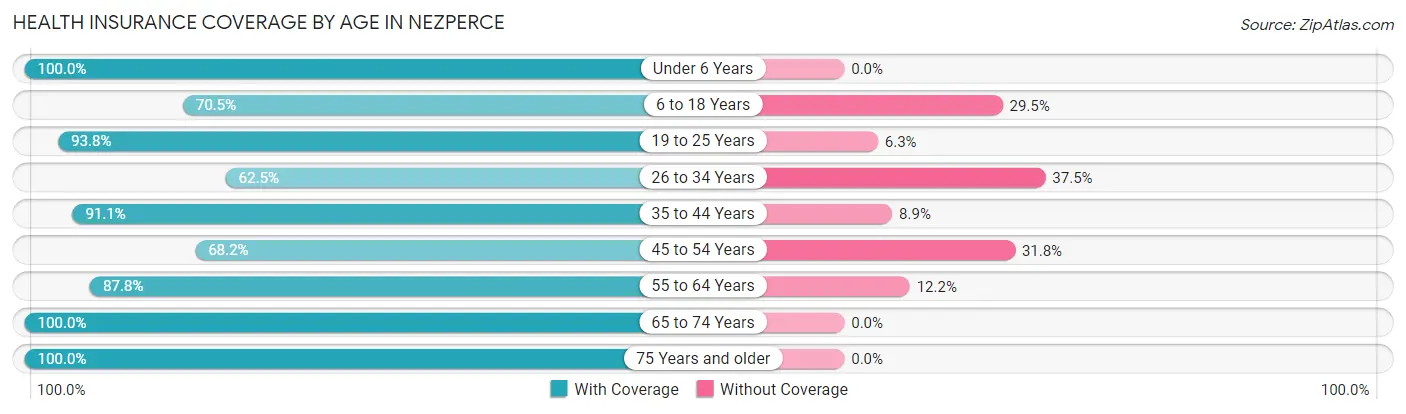
| Age Bracket | With Coverage | Without Coverage |
| Under 6 Years | 28 (100.0%) | 0 (0.0%) |
| 6 to 18 Years | 86 (70.5%) | 36 (29.5%) |
| 19 to 25 Years | 15 (93.8%) | 1 (6.2%) |
| 26 to 34 Years | 20 (62.5%) | 12 (37.5%) |
| 35 to 44 Years | 51 (91.1%) | 5 (8.9%) |
| 45 to 54 Years | 15 (68.2%) | 7 (31.8%) |
| 55 to 64 Years | 72 (87.8%) | 10 (12.2%) |
| 65 to 74 Years | 76 (100.0%) | 0 (0.0%) |
| 75 Years and older | 57 (100.0%) | 0 (0.0%) |
| Total | 420 (85.5%) | 71 (14.5%) |
Health Insurance Coverage by Citizenship Status in Nezperce
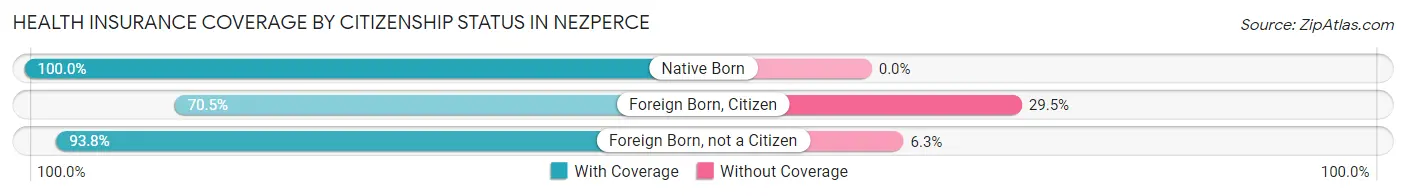
| Citizenship Status | With Coverage | Without Coverage |
| Native Born | 28 (100.0%) | 0 (0.0%) |
| Foreign Born, Citizen | 86 (70.5%) | 36 (29.5%) |
| Foreign Born, not a Citizen | 15 (93.8%) | 1 (6.2%) |
Health Insurance Coverage by Household Income in Nezperce
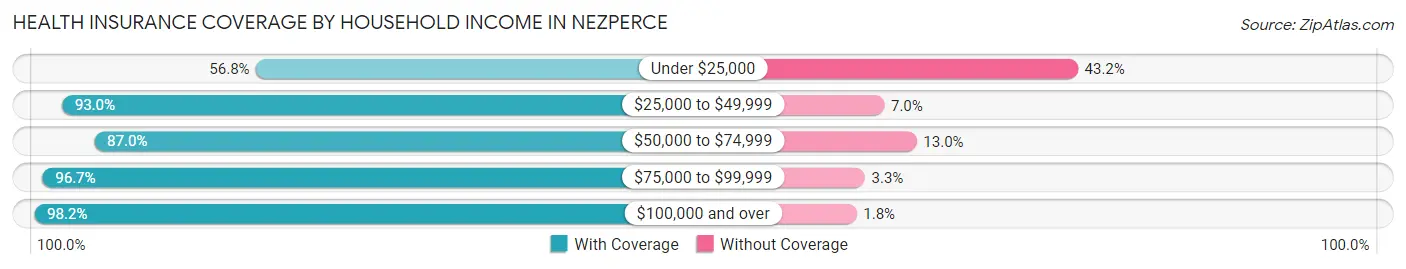
| Household Income | With Coverage | Without Coverage |
| Under $25,000 | 63 (56.8%) | 48 (43.2%) |
| $25,000 to $49,999 | 80 (93.0%) | 6 (7.0%) |
| $50,000 to $74,999 | 80 (87.0%) | 12 (13.0%) |
| $75,000 to $99,999 | 87 (96.7%) | 3 (3.3%) |
| $100,000 and over | 110 (98.2%) | 2 (1.8%) |
Public vs Private Health Insurance Coverage by Age in Nezperce
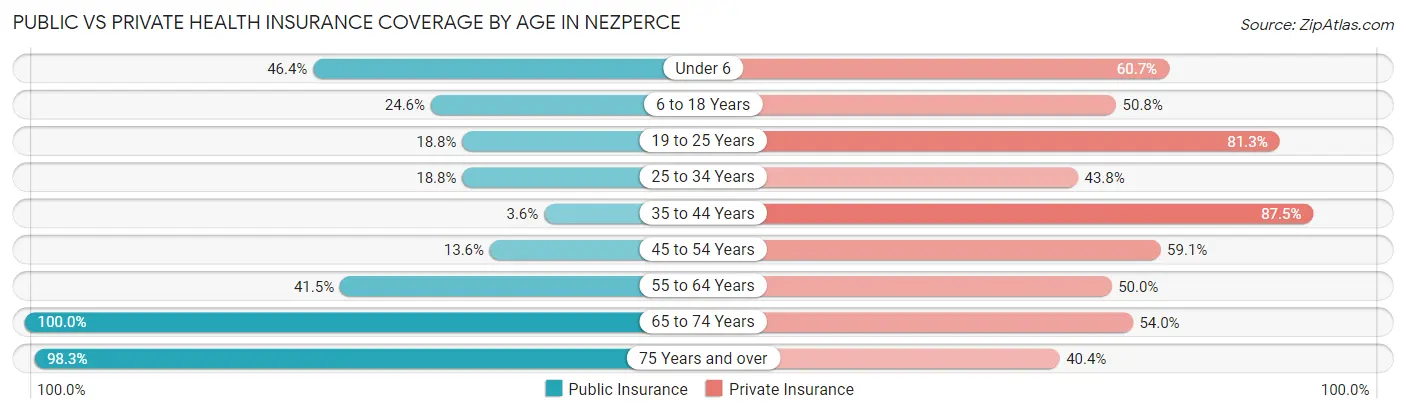
| Age Bracket | Public Insurance | Private Insurance |
| Under 6 | 13 (46.4%) | 17 (60.7%) |
| 6 to 18 Years | 30 (24.6%) | 62 (50.8%) |
| 19 to 25 Years | 3 (18.8%) | 13 (81.2%) |
| 25 to 34 Years | 6 (18.8%) | 14 (43.8%) |
| 35 to 44 Years | 2 (3.6%) | 49 (87.5%) |
| 45 to 54 Years | 3 (13.6%) | 13 (59.1%) |
| 55 to 64 Years | 34 (41.5%) | 41 (50.0%) |
| 65 to 74 Years | 76 (100.0%) | 41 (53.9%) |
| 75 Years and over | 56 (98.3%) | 23 (40.4%) |
| Total | 223 (45.4%) | 273 (55.6%) |
Disability Status by Sex by Age in Nezperce
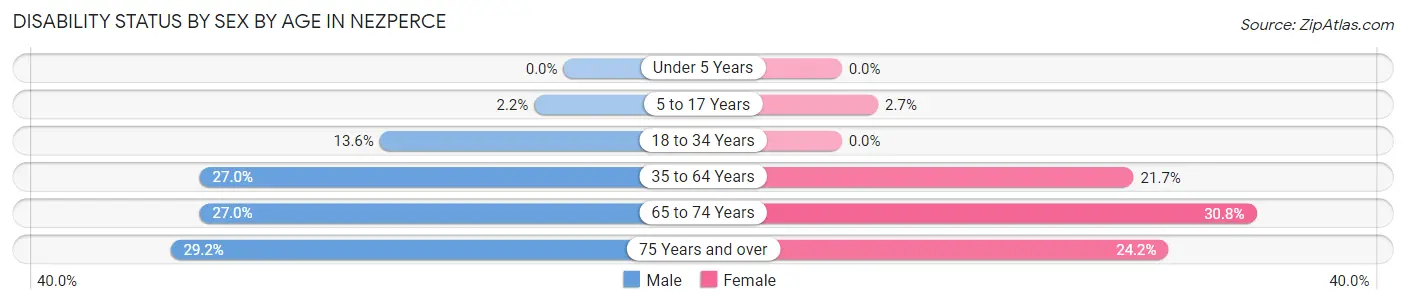
| Age Bracket | Male | Female |
| Under 5 Years | 0 (0.0%) | 0 (0.0%) |
| 5 to 17 Years | 1 (2.2%) | 2 (2.7%) |
| 18 to 34 Years | 3 (13.6%) | 0 (0.0%) |
| 35 to 64 Years | 27 (27.0%) | 13 (21.7%) |
| 65 to 74 Years | 10 (27.0%) | 12 (30.8%) |
| 75 Years and over | 7 (29.2%) | 8 (24.2%) |
Disability Class by Sex by Age in Nezperce
Disability Class: Hearing Difficulty
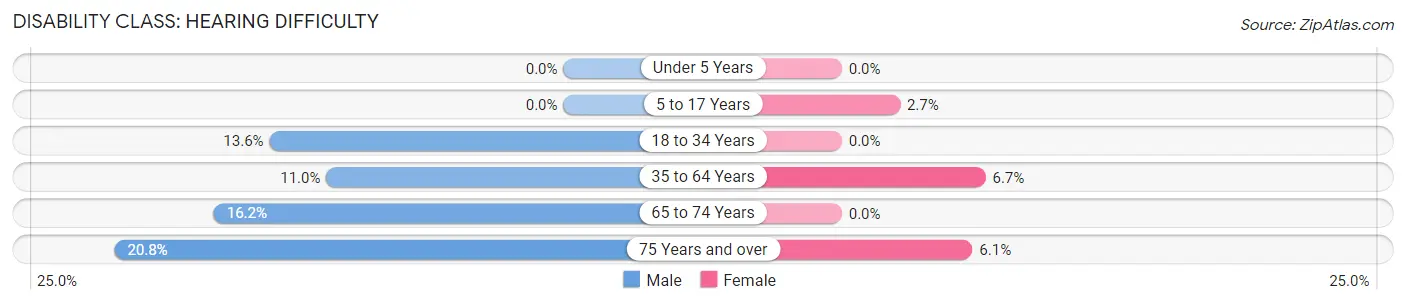
| Age Bracket | Male | Female |
| Under 5 Years | 0 (0.0%) | 0 (0.0%) |
| 5 to 17 Years | 0 (0.0%) | 2 (2.7%) |
| 18 to 34 Years | 3 (13.6%) | 0 (0.0%) |
| 35 to 64 Years | 11 (11.0%) | 4 (6.7%) |
| 65 to 74 Years | 6 (16.2%) | 0 (0.0%) |
| 75 Years and over | 5 (20.8%) | 2 (6.1%) |
Disability Class: Vision Difficulty
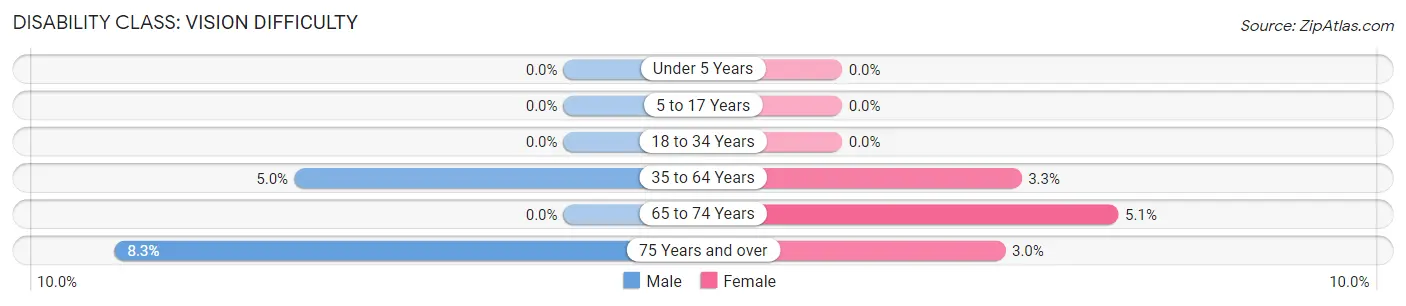
| Age Bracket | Male | Female |
| Under 5 Years | 0 (0.0%) | 0 (0.0%) |
| 5 to 17 Years | 0 (0.0%) | 0 (0.0%) |
| 18 to 34 Years | 0 (0.0%) | 0 (0.0%) |
| 35 to 64 Years | 5 (5.0%) | 2 (3.3%) |
| 65 to 74 Years | 0 (0.0%) | 2 (5.1%) |
| 75 Years and over | 2 (8.3%) | 1 (3.0%) |
Disability Class: Cognitive Difficulty
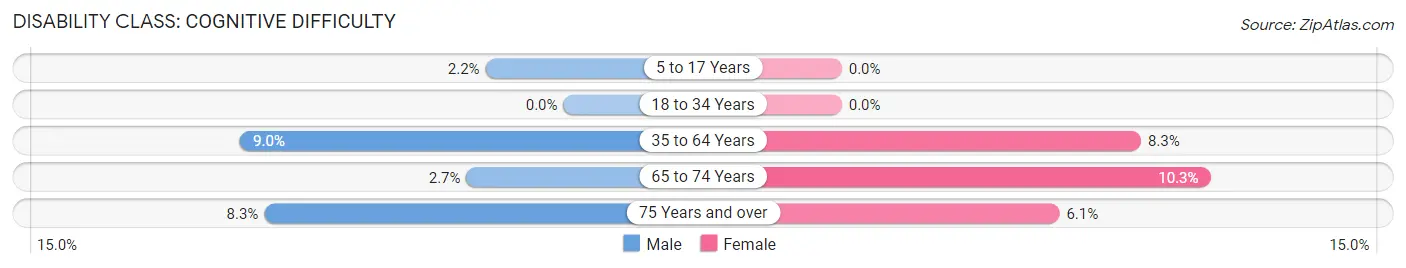
| Age Bracket | Male | Female |
| 5 to 17 Years | 1 (2.2%) | 0 (0.0%) |
| 18 to 34 Years | 0 (0.0%) | 0 (0.0%) |
| 35 to 64 Years | 9 (9.0%) | 5 (8.3%) |
| 65 to 74 Years | 1 (2.7%) | 4 (10.3%) |
| 75 Years and over | 2 (8.3%) | 2 (6.1%) |
Disability Class: Ambulatory Difficulty
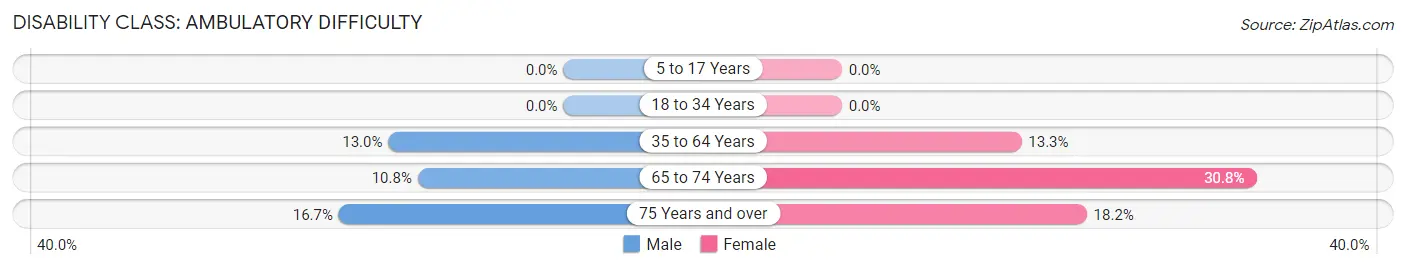
| Age Bracket | Male | Female |
| 5 to 17 Years | 0 (0.0%) | 0 (0.0%) |
| 18 to 34 Years | 0 (0.0%) | 0 (0.0%) |
| 35 to 64 Years | 13 (13.0%) | 8 (13.3%) |
| 65 to 74 Years | 4 (10.8%) | 12 (30.8%) |
| 75 Years and over | 4 (16.7%) | 6 (18.2%) |
Disability Class: Self-Care Difficulty
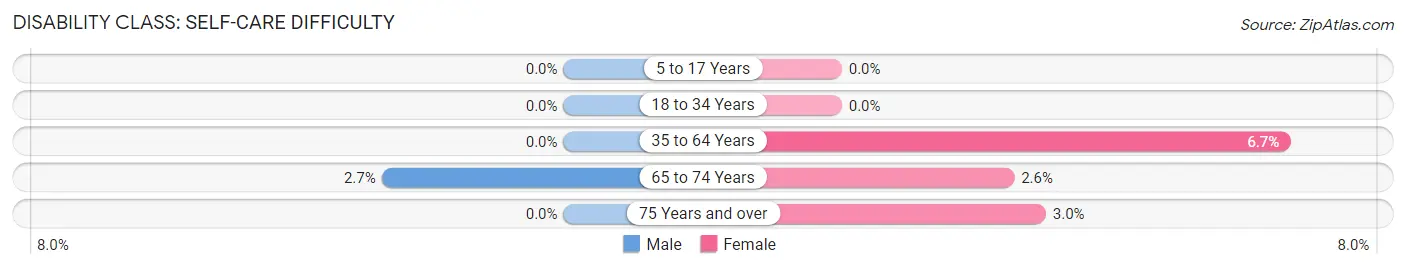
| Age Bracket | Male | Female |
| 5 to 17 Years | 0 (0.0%) | 0 (0.0%) |
| 18 to 34 Years | 0 (0.0%) | 0 (0.0%) |
| 35 to 64 Years | 0 (0.0%) | 4 (6.7%) |
| 65 to 74 Years | 1 (2.7%) | 1 (2.6%) |
| 75 Years and over | 0 (0.0%) | 1 (3.0%) |
Technology Access in Nezperce
Computing Device Access in Nezperce
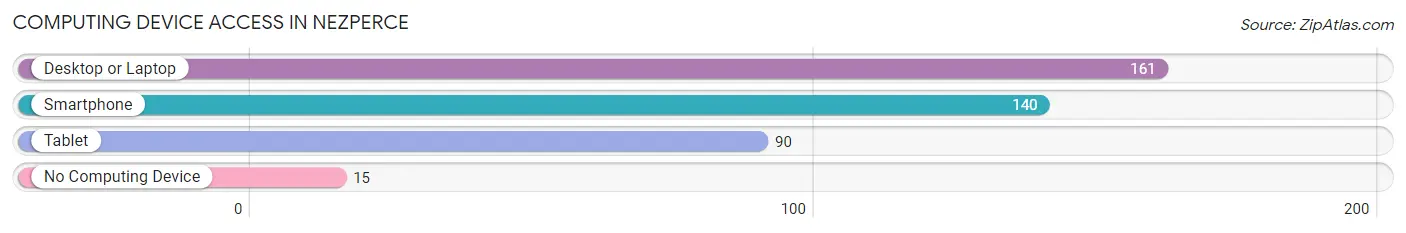
| Device Type | # Households | % Households |
| Desktop or Laptop | 161 | 83.9% |
| Smartphone | 140 | 72.9% |
| Tablet | 90 | 46.9% |
| No Computing Device | 15 | 7.8% |
| Total | 192 | 100.0% |
Internet Access in Nezperce
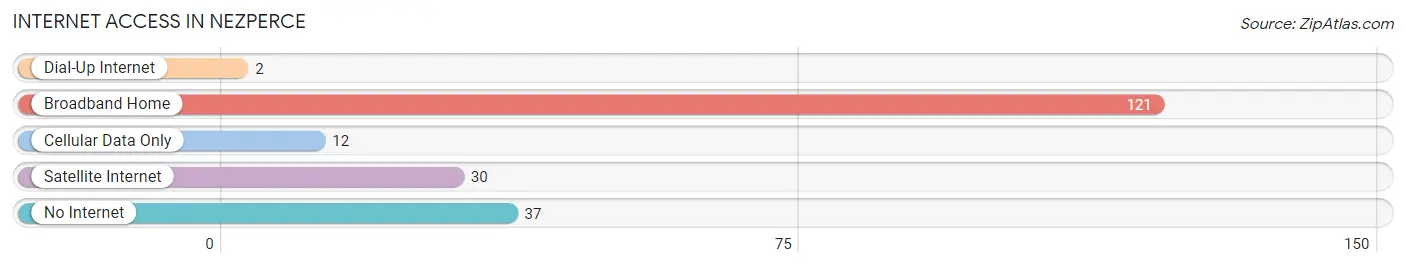
| Internet Type | # Households | % Households |
| Dial-Up Internet | 2 | 1.0% |
| Broadband Home | 121 | 63.0% |
| Cellular Data Only | 12 | 6.2% |
| Satellite Internet | 30 | 15.6% |
| No Internet | 37 | 19.3% |
| Total | 192 | 100.0% |
Nezperce Summary
Nez Perce, Idaho is a small city located in the northern part of the state, in the Clearwater River Valley. It is the county seat of Nez Perce County and is part of the Lewiston-Clarkston metropolitan area. The city has a population of just over 3,000 people and is the largest city in the county.
History
The area that is now Nez Perce was originally inhabited by the Nez Perce tribe, who were part of the larger Plateau culture. The tribe had lived in the area for centuries before the arrival of European settlers. The first Europeans to explore the area were members of the Lewis and Clark Expedition, who arrived in 1805. The expedition was followed by fur traders and missionaries, who established trading posts and missions in the area.
In 1877, the Nez Perce tribe was forced to relocate to a reservation in Idaho. The relocation of the tribe opened up the area for settlement by non-Native Americans. The first settlers arrived in the area in the late 1870s and established a small community. The community was initially called "Lapwai", after the nearby Nez Perce village. In 1883, the name was changed to Nez Perce, after the tribe.
Geography
Nez Perce is located in the northern part of Idaho, in the Clearwater River Valley. The city is situated at an elevation of 1,890 feet (576 m) above sea level. The city is surrounded by rolling hills and is located near the confluence of the Clearwater and Snake Rivers. The city is located about 30 miles (48 km) south of Lewiston and about 50 miles (80 km) east of Moscow.
The climate in Nez Perce is generally mild, with warm summers and cold winters. The average high temperature in July is 86°F (30°C), while the average low temperature in January is 22°F (-6°C). The area receives an average of 16 inches (41 cm) of precipitation per year.
Economy
The economy of Nez Perce is largely based on agriculture and tourism. The city is home to several farms and ranches, which produce a variety of crops, including wheat, barley, oats, and hay. The city is also home to several wineries, which produce a variety of wines.
Tourism is an important part of the local economy. The city is home to several attractions, including the Nez Perce National Historical Park, which preserves the history and culture of the Nez Perce tribe. The city is also home to several museums, including the Nez Perce County Historical Museum and the Nez Perce National Historic Trail Interpretive Center.
Demographics
As of the 2010 census, the population of Nez Perce was 3,077. The racial makeup of the city was 92.3% White, 0.3% African American, 0.7% Native American, 0.3% Asian, 0.1% Pacific Islander, 4.2% from other races, and 2.3% from two or more races. Hispanic or Latino of any race were 8.2% of the population.
The median household income in Nez Perce was $37,917, and the median family income was $45,938. The per capita income for the city was $18,945. About 11.3% of families and 14.2% of the population were below the poverty line, including 19.2% of those under age 18 and 8.2% of those age 65 or over.
Common Questions
What is Per Capita Income in Nezperce?
Per Capita income in Nezperce is $25,713.
What is the Median Family Income in Nezperce?
Median Family Income in Nezperce is $64,375.
What is the Median Household income in Nezperce?
Median Household Income in Nezperce is $55,625.
What is Income or Wage Gap in Nezperce?
Income or Wage Gap in Nezperce is 57.1%.
Women in Nezperce earn 42.9 cents for every dollar earned by a man.
What is Inequality or Gini Index in Nezperce?
Inequality or Gini Index in Nezperce is 0.43.
What is the Total Population of Nezperce?
Total Population of Nezperce is 518.
What is the Total Male Population of Nezperce?
Total Male Population of Nezperce is 249.
What is the Total Female Population of Nezperce?
Total Female Population of Nezperce is 269.
What is the Ratio of Males per 100 Females in Nezperce?
There are 92.57 Males per 100 Females in Nezperce.
What is the Ratio of Females per 100 Males in Nezperce?
There are 108.03 Females per 100 Males in Nezperce.
What is the Median Population Age in Nezperce?
Median Population Age in Nezperce is 41.9 Years.
What is the Average Family Size in Nezperce
Average Family Size in Nezperce is 3.0 People.
What is the Average Household Size in Nezperce
Average Household Size in Nezperce is 2.6 People.
How Large is the Labor Force in Nezperce?
There are 165 People in the Labor Forcein in Nezperce.
What is the Percentage of People in the Labor Force in Nezperce?
43.0% of People are in the Labor Force in Nezperce.
What is the Unemployment Rate in Nezperce?
Unemployment Rate in Nezperce is 4.2%.