Mullan, ID Map & Demographics
Mullan Map
Mullan Overview
$32,978
PER CAPITA INCOME
$81,250
AVG FAMILY INCOME
$56,250
AVG HOUSEHOLD INCOME
39.7%
WAGE / INCOME GAP [ % ]
60.3¢/ $1
WAGE / INCOME GAP [ $ ]
0.45
INEQUALITY / GINI INDEX
692
TOTAL POPULATION
326
MALE POPULATION
366
FEMALE POPULATION
89.07
MALES / 100 FEMALES
112.27
FEMALES / 100 MALES
47.7
MEDIAN AGE
3.1
AVG FAMILY SIZE
2.3
AVG HOUSEHOLD SIZE
259
LABOR FORCE [ PEOPLE ]
47.2%
PERCENT IN LABOR FORCE
3.9%
UNEMPLOYMENT RATE
Mullan Zip Codes
Mullan Area Codes
Income in Mullan
Income Overview in Mullan
Per Capita Income in Mullan is $32,978, while median incomes of families and households are $81,250 and $56,250 respectively.
| Characteristic | Number | Measure |
| Per Capita Income | 692 | $32,978 |
| Median Family Income | 179 | $81,250 |
| Mean Family Income | 179 | $93,951 |
| Median Household Income | 302 | $56,250 |
| Mean Household Income | 302 | $71,658 |
| Income Deficit | 179 | $0 |
| Wage / Income Gap (%) | 692 | 39.67% |
| Wage / Income Gap ($) | 692 | 60.33¢ per $1 |
| Gini / Inequality Index | 692 | 0.45 |
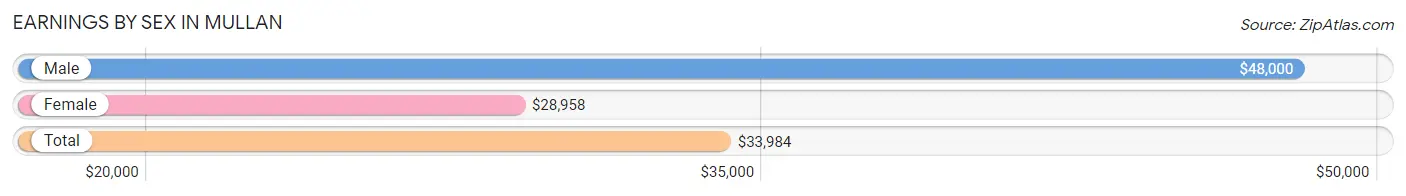
Earnings by Sex in Mullan
Average Earnings in Mullan are $33,984, $48,000 for men and $28,958 for women, a difference of 39.7%.
| Sex | Number | Average Earnings |
| Male | 162 (55.3%) | $48,000 |
| Female | 131 (44.7%) | $28,958 |
| Total | 293 (100.0%) | $33,984 |
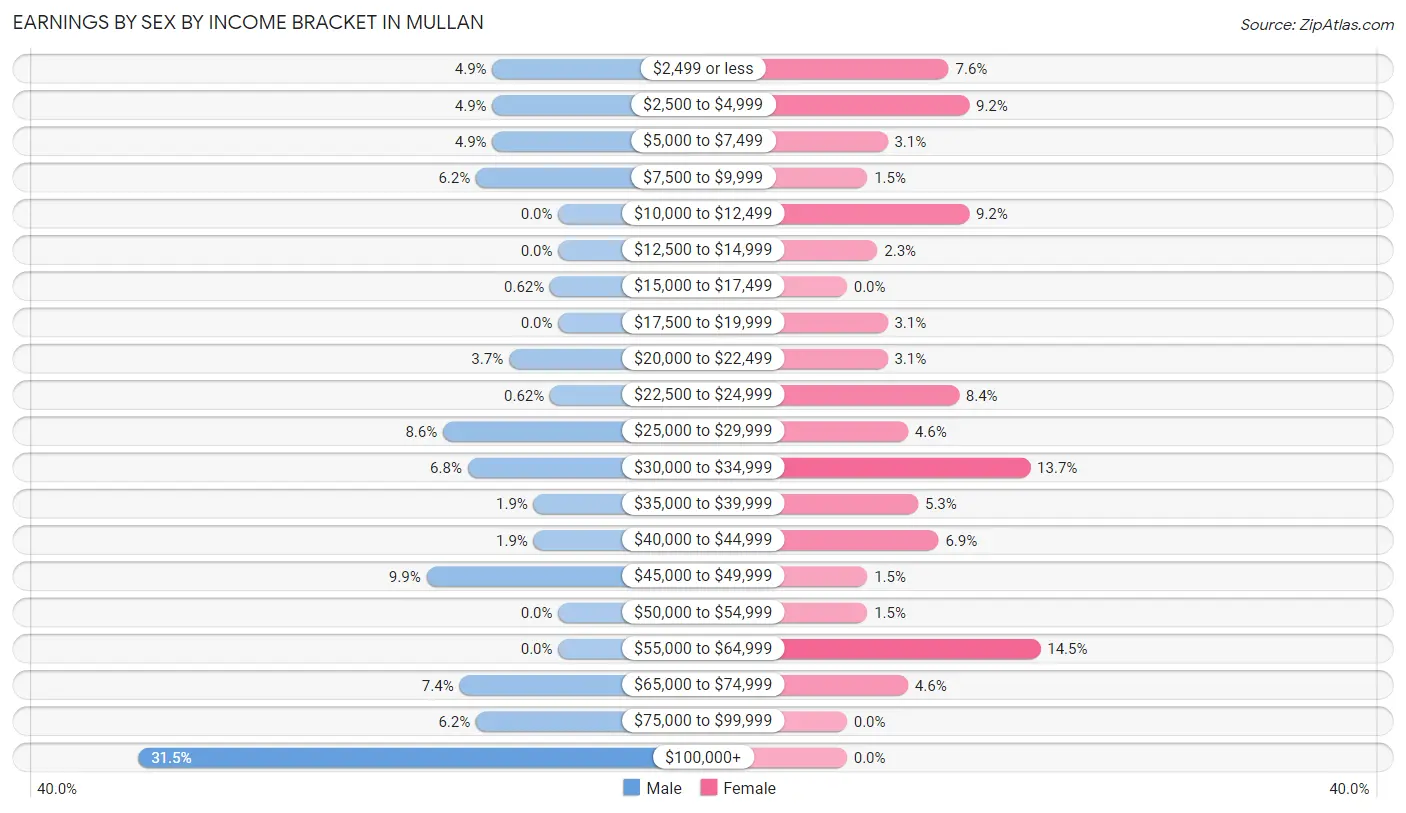
Earnings by Sex by Income Bracket in Mullan
The most common earnings brackets in Mullan are $100,000+ for men (51 | 31.5%) and $55,000 to $64,999 for women (19 | 14.5%).
| Income | Male | Female |
| $2,499 or less | 8 (4.9%) | 10 (7.6%) |
| $2,500 to $4,999 | 8 (4.9%) | 12 (9.2%) |
| $5,000 to $7,499 | 8 (4.9%) | 4 (3.0%) |
| $7,500 to $9,999 | 10 (6.2%) | 2 (1.5%) |
| $10,000 to $12,499 | 0 (0.0%) | 12 (9.2%) |
| $12,500 to $14,999 | 0 (0.0%) | 3 (2.3%) |
| $15,000 to $17,499 | 1 (0.6%) | 0 (0.0%) |
| $17,500 to $19,999 | 0 (0.0%) | 4 (3.0%) |
| $20,000 to $22,499 | 6 (3.7%) | 4 (3.0%) |
| $22,500 to $24,999 | 1 (0.6%) | 11 (8.4%) |
| $25,000 to $29,999 | 14 (8.6%) | 6 (4.6%) |
| $30,000 to $34,999 | 11 (6.8%) | 18 (13.7%) |
| $35,000 to $39,999 | 3 (1.8%) | 7 (5.3%) |
| $40,000 to $44,999 | 3 (1.8%) | 9 (6.9%) |
| $45,000 to $49,999 | 16 (9.9%) | 2 (1.5%) |
| $50,000 to $54,999 | 0 (0.0%) | 2 (1.5%) |
| $55,000 to $64,999 | 0 (0.0%) | 19 (14.5%) |
| $65,000 to $74,999 | 12 (7.4%) | 6 (4.6%) |
| $75,000 to $99,999 | 10 (6.2%) | 0 (0.0%) |
| $100,000+ | 51 (31.5%) | 0 (0.0%) |
| Total | 162 (100.0%) | 131 (100.0%) |
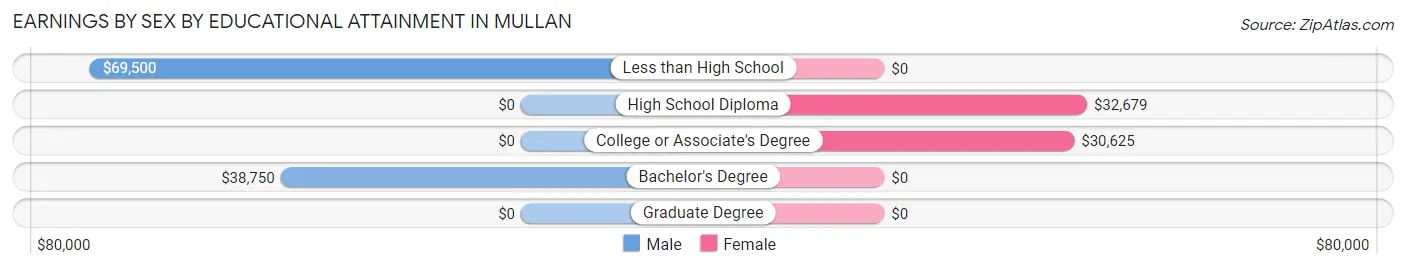
Earnings by Sex by Educational Attainment in Mullan
Average earnings in Mullan are $58,750 for men and $28,958 for women, a difference of 50.7%. Men with an educational attainment of less than high school enjoy the highest average annual earnings of $69,500, while those with bachelor's degree education earn the least with $38,750. Women with an educational attainment of high school diploma earn the most with the average annual earnings of $32,679, while those with college or associate's degree education have the smallest earnings of $30,625.
| Educational Attainment | Male Income | Female Income |
| Less than High School | $69,500 | $0 |
| High School Diploma | - | - |
| College or Associate's Degree | - | - |
| Bachelor's Degree | $38,750 | $0 |
| Graduate Degree | - | - |
| Total | $58,750 | $28,958 |
Family Income in Mullan
Family Income Brackets in Mullan
According to the Mullan family income data, there are 48 families falling into the $150,000 to $199,999 income range, which is the most common income bracket and makes up 26.8% of all families. Conversely, the $200,000+ income bracket is the least frequent group with only 1 families (0.6%) belonging to this category.
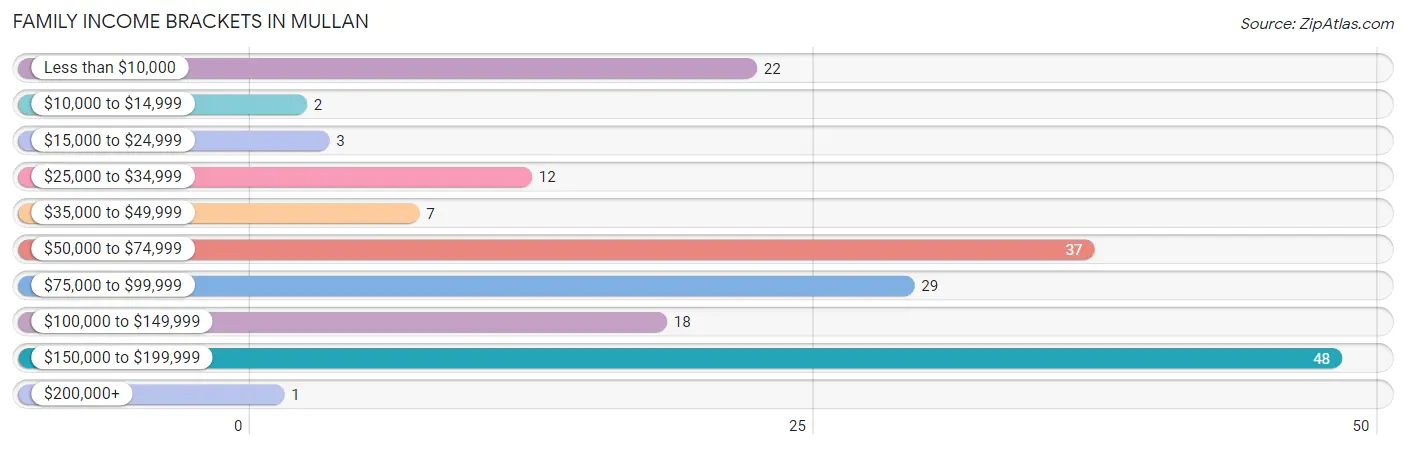
| Income Bracket | # Families | % Families |
| Less than $10,000 | 22 | 12.3% |
| $10,000 to $14,999 | 2 | 1.1% |
| $15,000 to $24,999 | 3 | 1.7% |
| $25,000 to $34,999 | 12 | 6.7% |
| $35,000 to $49,999 | 7 | 3.9% |
| $50,000 to $74,999 | 37 | 20.7% |
| $75,000 to $99,999 | 29 | 16.2% |
| $100,000 to $149,999 | 18 | 10.1% |
| $150,000 to $199,999 | 48 | 26.8% |
| $200,000+ | 1 | 0.6% |
Family Income by Famaliy Size in Mullan
3-person families (43 | 24.0%) account for the highest median family income in Mullan with $156,806 per family, while 3-person families (43 | 24.0%) have the highest median income of $52,269 per family member.
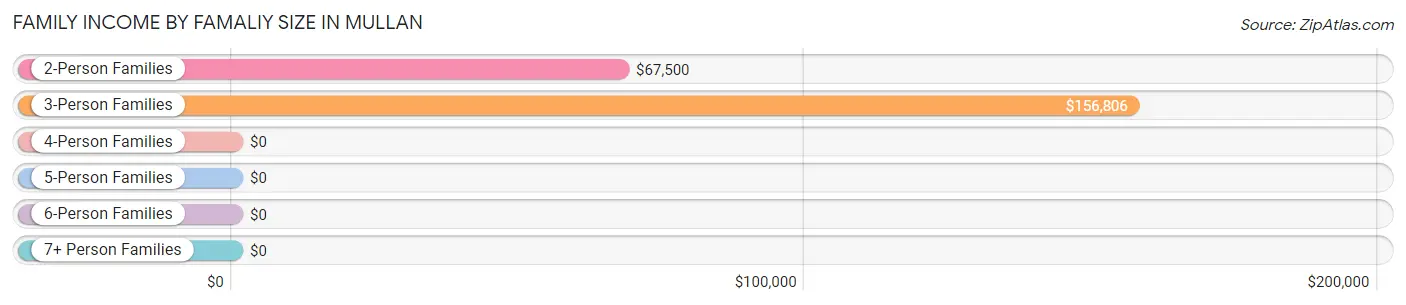
| Income Bracket | # Families | Median Income |
| 2-Person Families | 98 (54.7%) | $67,500 |
| 3-Person Families | 43 (24.0%) | $156,806 |
| 4-Person Families | 34 (19.0%) | $0 |
| 5-Person Families | 4 (2.2%) | $0 |
| 6-Person Families | 0 (0.0%) | $0 |
| 7+ Person Families | 0 (0.0%) | $0 |
| Total | 179 (100.0%) | $81,250 |
Family Income by Number of Earners in Mullan
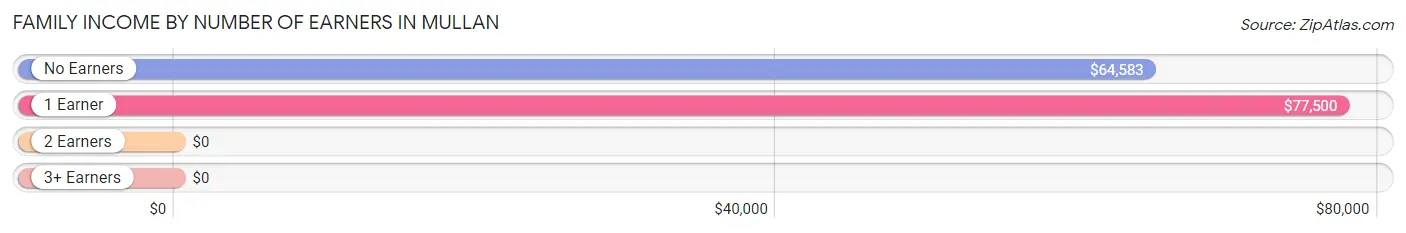
| Number of Earners | # Families | Median Income |
| No Earners | 43 (24.0%) | $64,583 |
| 1 Earner | 72 (40.2%) | $77,500 |
| 2 Earners | 60 (33.5%) | $0 |
| 3+ Earners | 4 (2.2%) | $0 |
| Total | 179 (100.0%) | $81,250 |
Household Income in Mullan
Household Income Brackets in Mullan
With 48 households falling in the category, the $150,000 to $199,999 income range is the most frequent in Mullan, accounting for 15.9% of all households. In contrast, only 1 households (0.3%) fall into the $200,000+ income bracket, making it the least populous group.
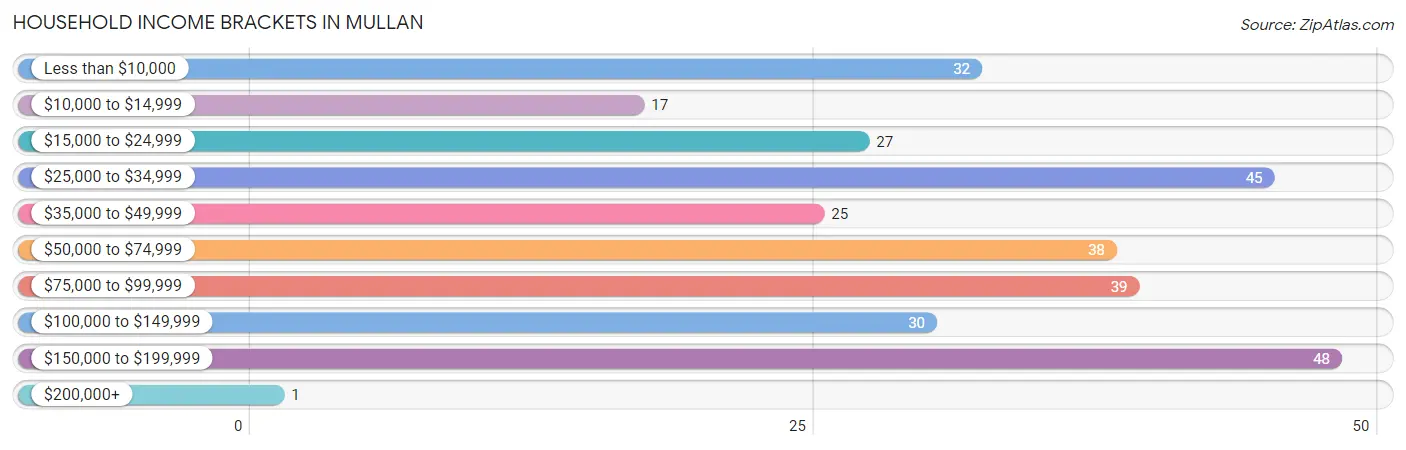
| Income Bracket | # Households | % Households |
| Less than $10,000 | 32 | 10.6% |
| $10,000 to $14,999 | 17 | 5.6% |
| $15,000 to $24,999 | 27 | 8.9% |
| $25,000 to $34,999 | 45 | 14.9% |
| $35,000 to $49,999 | 25 | 8.3% |
| $50,000 to $74,999 | 38 | 12.6% |
| $75,000 to $99,999 | 39 | 12.9% |
| $100,000 to $149,999 | 30 | 9.9% |
| $150,000 to $199,999 | 48 | 15.9% |
| $200,000+ | 1 | 0.3% |
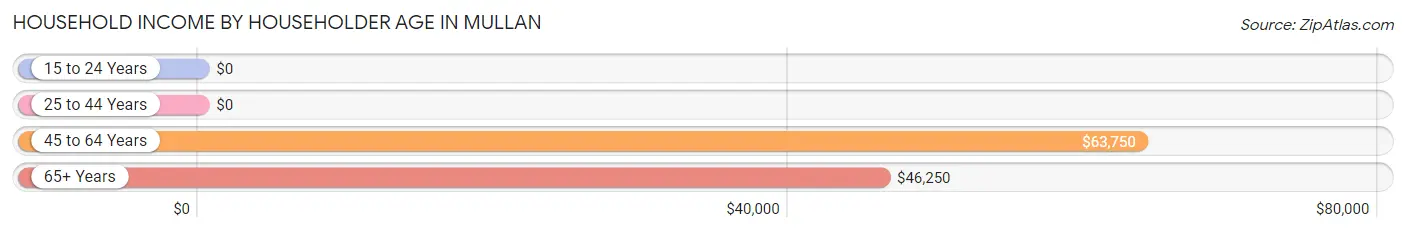
Household Income by Householder Age in Mullan
The median household income in Mullan is $56,250, with the highest median household income of $63,750 found in the 45 to 64 years age bracket for the primary householder. A total of 120 households (39.7%) fall into this category. Meanwhile, the 15 to 24 years age bracket for the primary householder has the lowest median household income of $0, with 2 households (0.7%) in this group.
| Income Bracket | # Households | Median Income |
| 15 to 24 Years | 2 (0.7%) | $0 |
| 25 to 44 Years | 58 (19.2%) | $0 |
| 45 to 64 Years | 120 (39.7%) | $63,750 |
| 65+ Years | 122 (40.4%) | $46,250 |
| Total | 302 (100.0%) | $56,250 |
Poverty in Mullan
Income Below Poverty by Sex and Age in Mullan
With 14.4% poverty level for males and 18.9% for females among the residents of Mullan, 6 to 11 year old males and 5 year old females are the most vulnerable to poverty, with 12 males (66.7%) and 7 females (70.0%) in their respective age groups living below the poverty level.
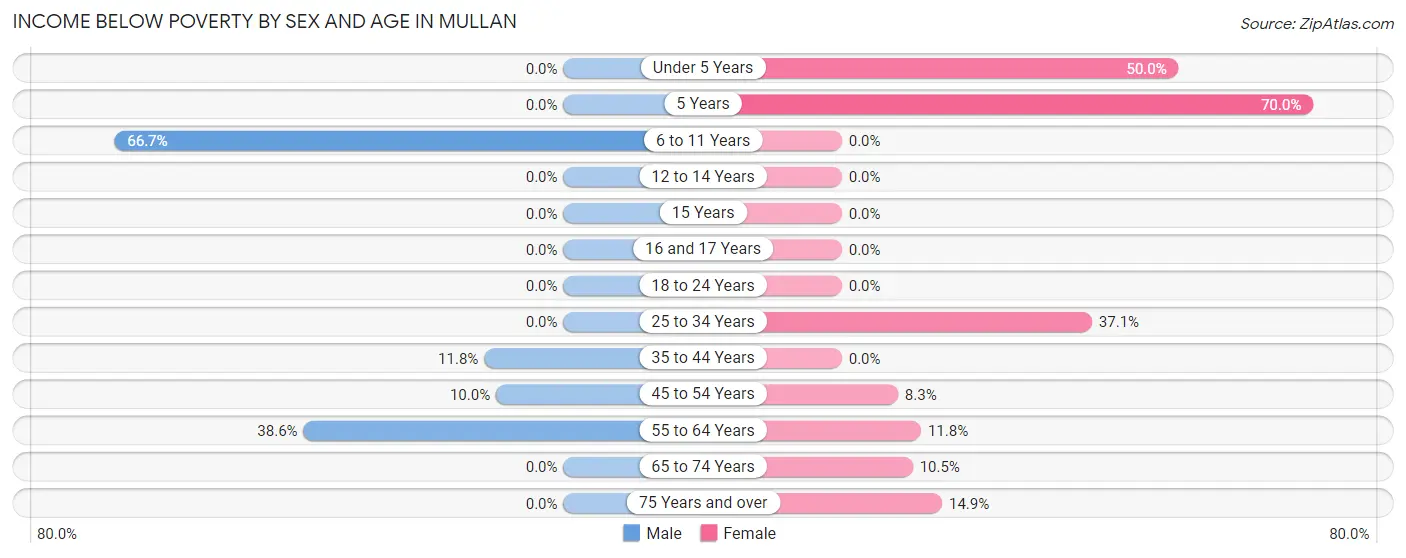
| Age Bracket | Male | Female |
| Under 5 Years | 0 (0.0%) | 27 (50.0%) |
| 5 Years | 0 (0.0%) | 7 (70.0%) |
| 6 to 11 Years | 12 (66.7%) | 0 (0.0%) |
| 12 to 14 Years | 0 (0.0%) | 0 (0.0%) |
| 15 Years | 0 (0.0%) | 0 (0.0%) |
| 16 and 17 Years | 0 (0.0%) | 0 (0.0%) |
| 18 to 24 Years | 0 (0.0%) | 0 (0.0%) |
| 25 to 34 Years | 0 (0.0%) | 13 (37.1%) |
| 35 to 44 Years | 8 (11.8%) | 0 (0.0%) |
| 45 to 54 Years | 5 (10.0%) | 3 (8.3%) |
| 55 to 64 Years | 22 (38.6%) | 6 (11.8%) |
| 65 to 74 Years | 0 (0.0%) | 6 (10.5%) |
| 75 Years and over | 0 (0.0%) | 7 (14.9%) |
| Total | 47 (14.4%) | 69 (18.9%) |
Income Above Poverty by Sex and Age in Mullan
According to the poverty statistics in Mullan, males aged under 5 years and females aged 6 to 11 years are the age groups that are most secure financially, with 100.0% of males and 100.0% of females in these age groups living above the poverty line.
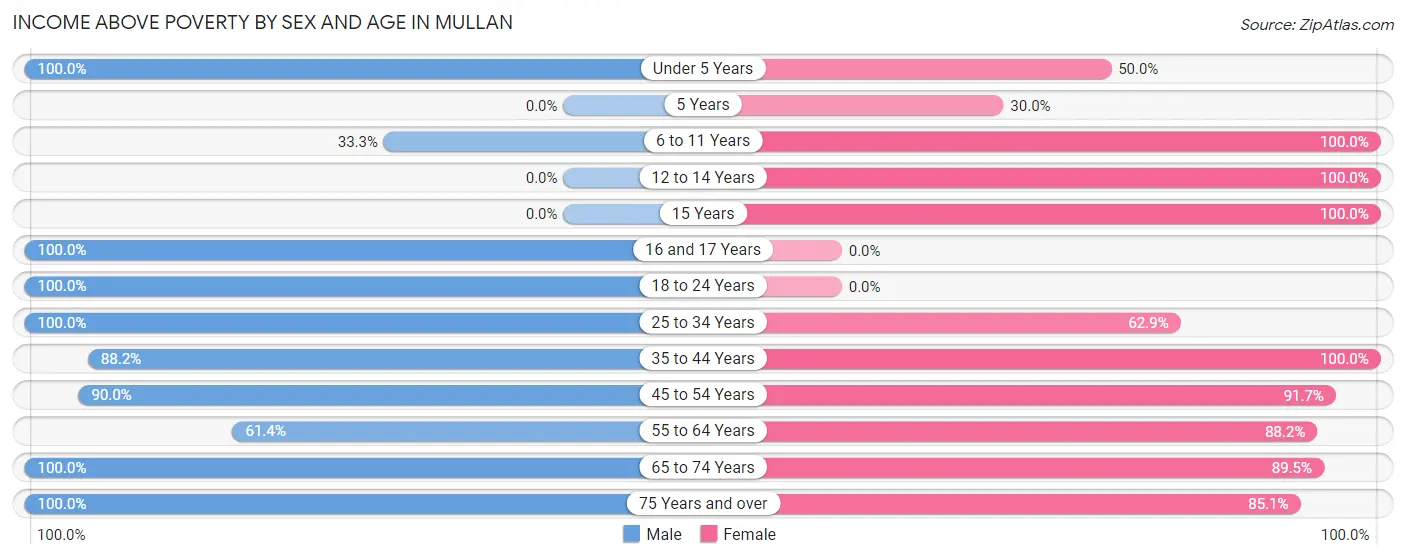
| Age Bracket | Male | Female |
| Under 5 Years | 8 (100.0%) | 27 (50.0%) |
| 5 Years | 0 (0.0%) | 3 (30.0%) |
| 6 to 11 Years | 6 (33.3%) | 14 (100.0%) |
| 12 to 14 Years | 0 (0.0%) | 9 (100.0%) |
| 15 Years | 0 (0.0%) | 30 (100.0%) |
| 16 and 17 Years | 2 (100.0%) | 0 (0.0%) |
| 18 to 24 Years | 16 (100.0%) | 0 (0.0%) |
| 25 to 34 Years | 15 (100.0%) | 22 (62.9%) |
| 35 to 44 Years | 60 (88.2%) | 23 (100.0%) |
| 45 to 54 Years | 45 (90.0%) | 33 (91.7%) |
| 55 to 64 Years | 35 (61.4%) | 45 (88.2%) |
| 65 to 74 Years | 60 (100.0%) | 51 (89.5%) |
| 75 Years and over | 32 (100.0%) | 40 (85.1%) |
| Total | 279 (85.6%) | 297 (81.1%) |
Income Below Poverty Among Married-Couple Families in Mullan
The poverty statistics for married-couple families in Mullan show that 5.4% or 8 of the total 149 families live below the poverty line. Families with no children have the highest poverty rate of 7.5%, comprising of 8 families. On the other hand, families with 1 or 2 children have the lowest poverty rate of 0.0%, which includes 0 families.
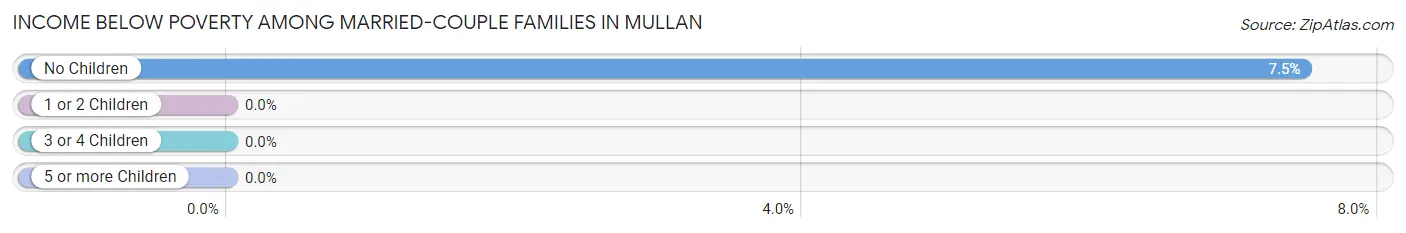
| Children | Above Poverty | Below Poverty |
| No Children | 99 (92.5%) | 8 (7.5%) |
| 1 or 2 Children | 38 (100.0%) | 0 (0.0%) |
| 3 or 4 Children | 4 (100.0%) | 0 (0.0%) |
| 5 or more Children | 0 (0.0%) | 0 (0.0%) |
| Total | 141 (94.6%) | 8 (5.4%) |
Income Below Poverty Among Single-Parent Households in Mullan
According to the poverty data in Mullan, 100.0% or 8 single-father households and 36.4% or 8 single-mother households are living below the poverty line. Among single-father households, those with 3 or 4 children have the highest poverty rate, with 8 households (100.0%) experiencing poverty. Likewise, among single-mother households, those with 3 or 4 children have the highest poverty rate, with 6 households (100.0%) falling below the poverty line.
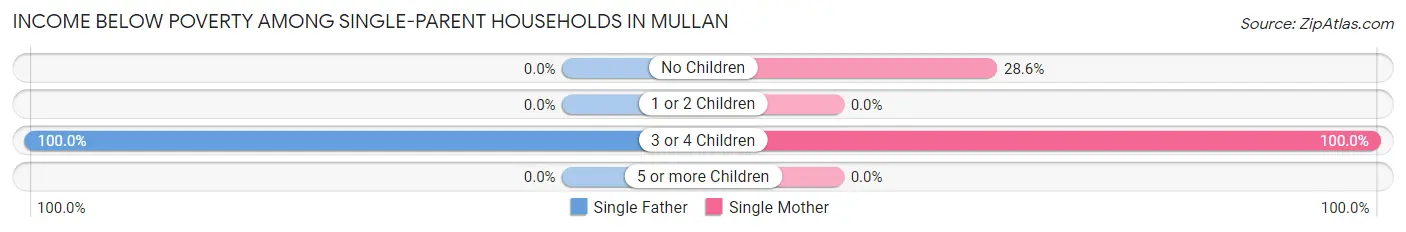
| Children | Single Father | Single Mother |
| No Children | 0 (0.0%) | 2 (28.6%) |
| 1 or 2 Children | 0 (0.0%) | 0 (0.0%) |
| 3 or 4 Children | 8 (100.0%) | 6 (100.0%) |
| 5 or more Children | 0 (0.0%) | 0 (0.0%) |
| Total | 8 (100.0%) | 8 (36.4%) |
Income Below Poverty Among Married-Couple vs Single-Parent Households in Mullan
The poverty data for Mullan shows that 8 of the married-couple family households (5.4%) and 16 of the single-parent households (53.3%) are living below the poverty level. Within the married-couple family households, those with no children have the highest poverty rate, with 8 households (7.5%) falling below the poverty line. Among the single-parent households, those with 3 or 4 children have the highest poverty rate, with 14 household (100.0%) living below poverty.
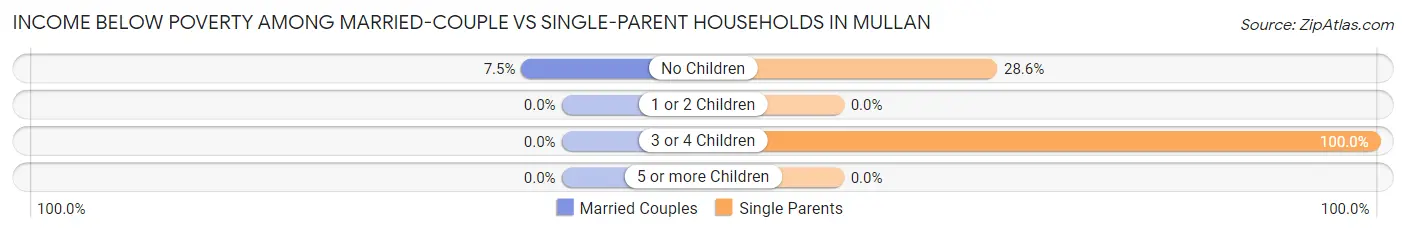
| Children | Married-Couple Families | Single-Parent Households |
| No Children | 8 (7.5%) | 2 (28.6%) |
| 1 or 2 Children | 0 (0.0%) | 0 (0.0%) |
| 3 or 4 Children | 0 (0.0%) | 14 (100.0%) |
| 5 or more Children | 0 (0.0%) | 0 (0.0%) |
| Total | 8 (5.4%) | 16 (53.3%) |
Race in Mullan
The most populous races in Mullan are White / Caucasian (634 | 91.6%), Two or more Races (48 | 6.9%), and Hispanic or Latino (23 | 3.3%).
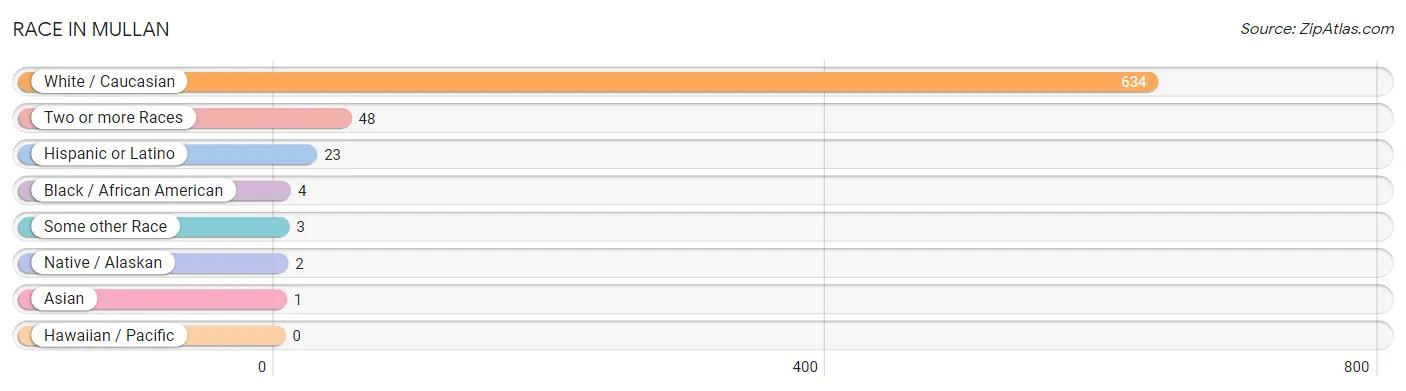
| Race | # Population | % Population |
| Asian | 1 | 0.1% |
| Black / African American | 4 | 0.6% |
| Hawaiian / Pacific | 0 | 0.0% |
| Hispanic or Latino | 23 | 3.3% |
| Native / Alaskan | 2 | 0.3% |
| White / Caucasian | 634 | 91.6% |
| Two or more Races | 48 | 6.9% |
| Some other Race | 3 | 0.4% |
| Total | 692 | 100.0% |
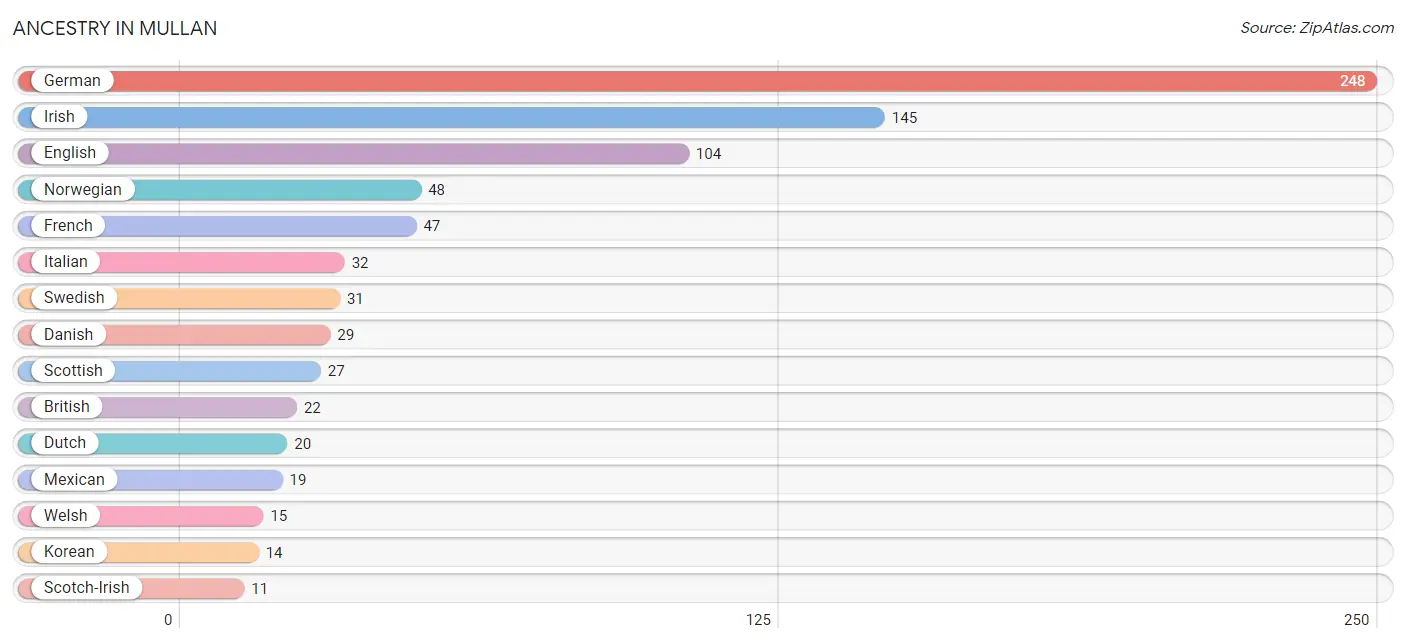
Ancestry in Mullan
The most populous ancestries reported in Mullan are German (248 | 35.8%), Irish (145 | 20.9%), English (104 | 15.0%), Norwegian (48 | 6.9%), and French (47 | 6.8%), together accounting for 85.5% of all Mullan residents.
| Ancestry | # Population | % Population |
| Alaska Native | 2 | 0.3% |
| American | 3 | 0.4% |
| Arab | 1 | 0.1% |
| Austrian | 5 | 0.7% |
| British | 22 | 3.2% |
| Creek | 3 | 0.4% |
| Croatian | 4 | 0.6% |
| Danish | 29 | 4.2% |
| Dutch | 20 | 2.9% |
| English | 104 | 15.0% |
| Finnish | 10 | 1.5% |
| French | 47 | 6.8% |
| French Canadian | 4 | 0.6% |
| German | 248 | 35.8% |
| Ghanaian | 4 | 0.6% |
| Irish | 145 | 20.9% |
| Italian | 32 | 4.6% |
| Korean | 14 | 2.0% |
| Lebanese | 1 | 0.1% |
| Mexican | 19 | 2.8% |
| Norwegian | 48 | 6.9% |
| Polish | 7 | 1.0% |
| Puerto Rican | 4 | 0.6% |
| Scandinavian | 3 | 0.4% |
| Scotch-Irish | 11 | 1.6% |
| Scottish | 27 | 3.9% |
| Sri Lankan | 1 | 0.1% |
| Subsaharan African | 4 | 0.6% |
| Swedish | 31 | 4.5% |
| Welsh | 15 | 2.2% | View All 30 Rows |
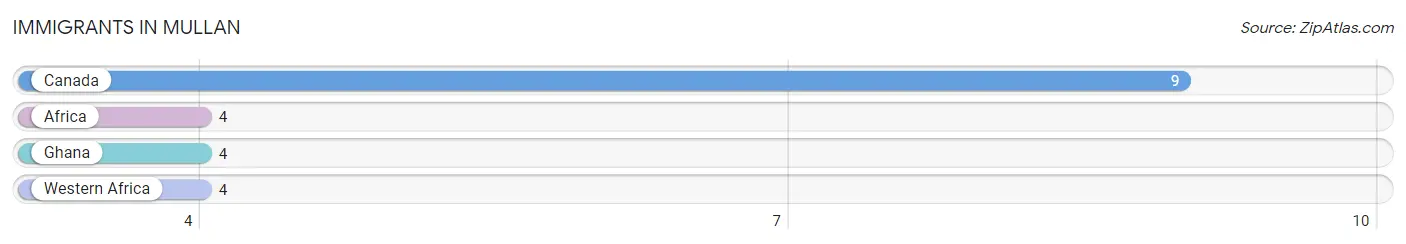
Immigrants in Mullan
The most numerous immigrant groups reported in Mullan came from Canada (9 | 1.3%), Africa (4 | 0.6%), Ghana (4 | 0.6%), and Western Africa (4 | 0.6%), together accounting for 3.0% of all Mullan residents.
| Immigration Origin | # Population | % Population |
| Africa | 4 | 0.6% |
| Canada | 9 | 1.3% |
| Ghana | 4 | 0.6% |
| Western Africa | 4 | 0.6% | View All 4 Rows |
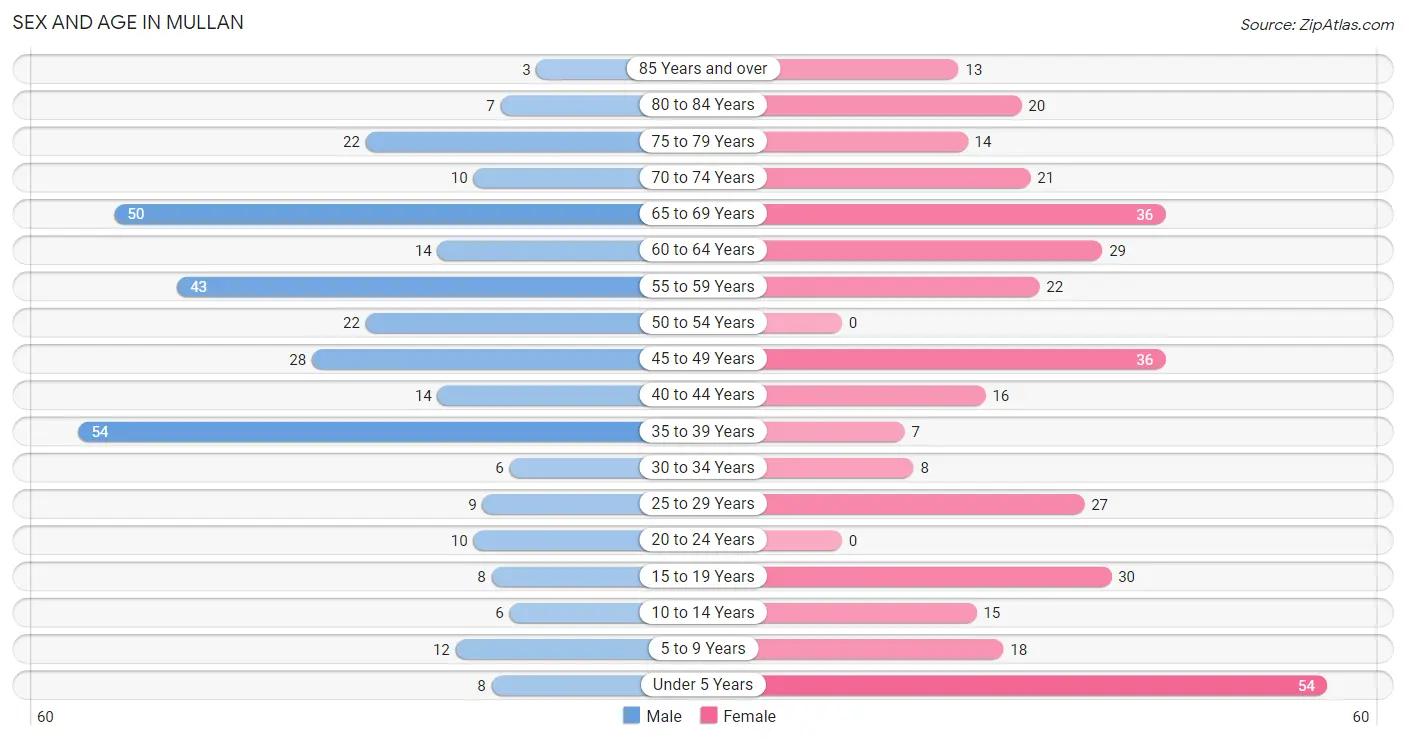
Sex and Age in Mullan
Sex and Age in Mullan
The most populous age groups in Mullan are 35 to 39 Years (54 | 16.6%) for men and Under 5 Years (54 | 14.7%) for women.
| Age Bracket | Male | Female |
| Under 5 Years | 8 (2.5%) | 54 (14.7%) |
| 5 to 9 Years | 12 (3.7%) | 18 (4.9%) |
| 10 to 14 Years | 6 (1.8%) | 15 (4.1%) |
| 15 to 19 Years | 8 (2.5%) | 30 (8.2%) |
| 20 to 24 Years | 10 (3.1%) | 0 (0.0%) |
| 25 to 29 Years | 9 (2.8%) | 27 (7.4%) |
| 30 to 34 Years | 6 (1.8%) | 8 (2.2%) |
| 35 to 39 Years | 54 (16.6%) | 7 (1.9%) |
| 40 to 44 Years | 14 (4.3%) | 16 (4.4%) |
| 45 to 49 Years | 28 (8.6%) | 36 (9.8%) |
| 50 to 54 Years | 22 (6.8%) | 0 (0.0%) |
| 55 to 59 Years | 43 (13.2%) | 22 (6.0%) |
| 60 to 64 Years | 14 (4.3%) | 29 (7.9%) |
| 65 to 69 Years | 50 (15.3%) | 36 (9.8%) |
| 70 to 74 Years | 10 (3.1%) | 21 (5.7%) |
| 75 to 79 Years | 22 (6.8%) | 14 (3.8%) |
| 80 to 84 Years | 7 (2.1%) | 20 (5.5%) |
| 85 Years and over | 3 (0.9%) | 13 (3.5%) |
| Total | 326 (100.0%) | 366 (100.0%) |
Families and Households in Mullan
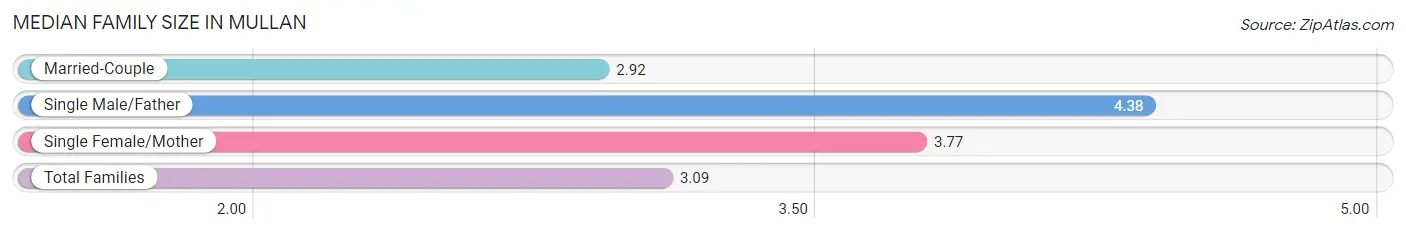
Median Family Size in Mullan
The median family size in Mullan is 3.09 persons per family, with single male/father families (8 | 4.5%) accounting for the largest median family size of 4.38 persons per family. On the other hand, married-couple families (149 | 83.2%) represent the smallest median family size with 2.92 persons per family.
| Family Type | # Families | Family Size |
| Married-Couple | 149 (83.2%) | 2.92 |
| Single Male/Father | 8 (4.5%) | 4.38 |
| Single Female/Mother | 22 (12.3%) | 3.77 |
| Total Families | 179 (100.0%) | 3.09 |
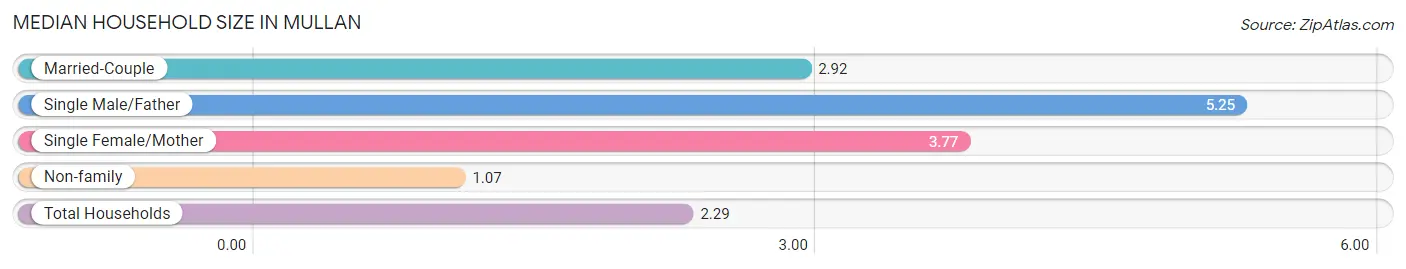
Median Household Size in Mullan
The median household size in Mullan is 2.29 persons per household, with single male/father households (8 | 2.6%) accounting for the largest median household size of 5.25 persons per household. non-family households (123 | 40.7%) represent the smallest median household size with 1.07 persons per household.
| Household Type | # Households | Household Size |
| Married-Couple | 149 (49.3%) | 2.92 |
| Single Male/Father | 8 (2.6%) | 5.25 |
| Single Female/Mother | 22 (7.3%) | 3.77 |
| Non-family | 123 (40.7%) | 1.07 |
| Total Households | 302 (100.0%) | 2.29 |
Household Size by Marriage Status in Mullan
Out of a total of 302 households in Mullan, 179 (59.3%) are family households, while 123 (40.7%) are nonfamily households. The most numerous type of family households are 2-person households, comprising 98, and the most common type of nonfamily households are 1-person households, comprising 113.
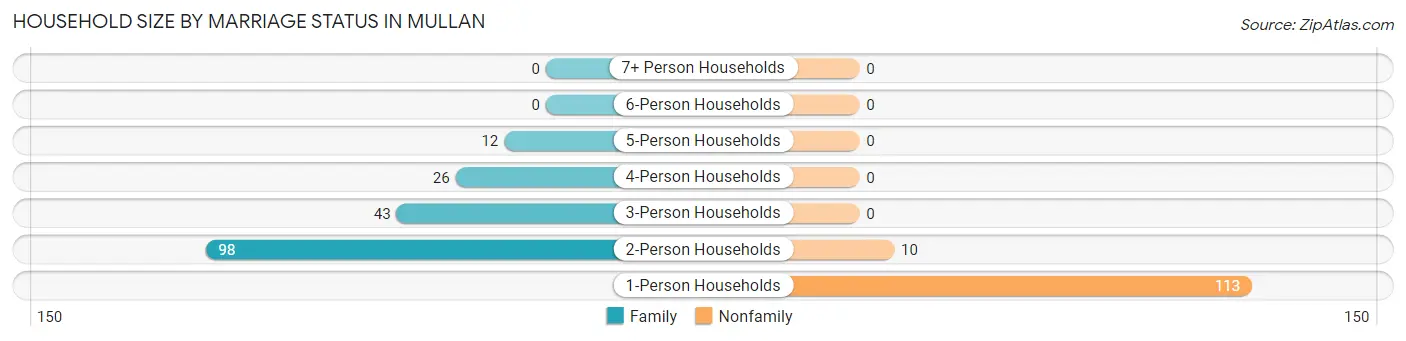
| Household Size | Family Households | Nonfamily Households |
| 1-Person Households | - | 113 (37.4%) |
| 2-Person Households | 98 (32.5%) | 10 (3.3%) |
| 3-Person Households | 43 (14.2%) | 0 (0.0%) |
| 4-Person Households | 26 (8.6%) | 0 (0.0%) |
| 5-Person Households | 12 (4.0%) | 0 (0.0%) |
| 6-Person Households | 0 (0.0%) | 0 (0.0%) |
| 7+ Person Households | 0 (0.0%) | 0 (0.0%) |
| Total | 179 (59.3%) | 123 (40.7%) |
Female Fertility in Mullan
Fertility by Age in Mullan
| Age Bracket | Women with Births | Births / 1,000 Women |
| 15 to 19 years | 0 (0.0%) | 0.0 |
| 20 to 34 years | 0 (0.0%) | 0.0 |
| 35 to 50 years | 0 (0.0%) | 0.0 |
| Total | 0 (0.0%) | 0.0 |
Fertility by Age by Marriage Status in Mullan
| Age Bracket | Married | Unmarried |
| 15 to 19 years | 0 (0.0%) | 0 (0.0%) |
| 20 to 34 years | 0 (0.0%) | 0 (0.0%) |
| 35 to 50 years | 0 (0.0%) | 0 (0.0%) |
| Total | 0 (0.0%) | 0 (0.0%) |
Fertility by Education in Mullan
| Educational Attainment | Women with Births | Births / 1,000 Women |
| Less than High School | 0 (0.0%) | 0.0 |
| High School Diploma | 0 (0.0%) | 0.0 |
| College or Associate's Degree | 0 (0.0%) | 0.0 |
| Bachelor's Degree | 0 (0.0%) | 0.0 |
| Graduate Degree | 0 (0.0%) | 0.0 |
| Total | 0 (0.0%) | 0.0 |
Fertility by Education by Marriage Status in Mullan
| Educational Attainment | Married | Unmarried |
| Less than High School | 0 (0.0%) | 0 (0.0%) |
| High School Diploma | 0 (0.0%) | 0 (0.0%) |
| College or Associate's Degree | 0 (0.0%) | 0 (0.0%) |
| Bachelor's Degree | 0 (0.0%) | 0 (0.0%) |
| Graduate Degree | 0 (0.0%) | 0 (0.0%) |
| Total | 0 (0.0%) | 0 (0.0%) |
Employment Characteristics in Mullan
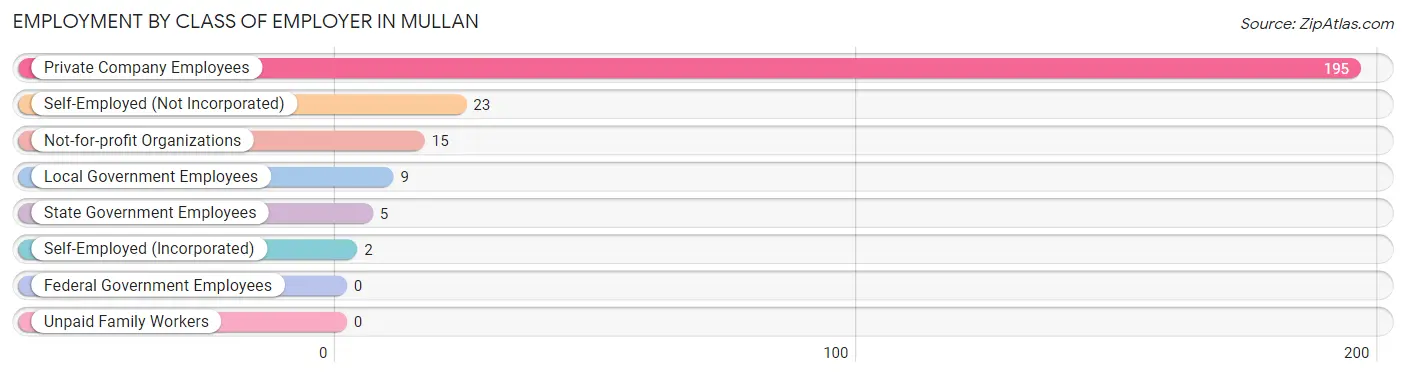
Employment by Class of Employer in Mullan
Among the 249 employed individuals in Mullan, private company employees (195 | 78.3%), self-employed (not incorporated) (23 | 9.2%), and not-for-profit organizations (15 | 6.0%) make up the most common classes of employment.
| Employer Class | # Employees | % Employees |
| Private Company Employees | 195 | 78.3% |
| Self-Employed (Incorporated) | 2 | 0.8% |
| Self-Employed (Not Incorporated) | 23 | 9.2% |
| Not-for-profit Organizations | 15 | 6.0% |
| Local Government Employees | 9 | 3.6% |
| State Government Employees | 5 | 2.0% |
| Federal Government Employees | 0 | 0.0% |
| Unpaid Family Workers | 0 | 0.0% |
| Total | 249 | 100.0% |
Employment Status by Age in Mullan
According to the labor force statistics for Mullan, out of the total population over 16 years of age (549), 47.2% or 259 individuals are in the labor force, with 3.9% or 10 of them unemployed. The age group with the highest labor force participation rate is 20 to 24 years, with 100.0% or 10 individuals in the labor force. Within the labor force, the 55 to 59 years age range has the highest percentage of unemployed individuals, with 20.6% or 7 of them being unemployed.
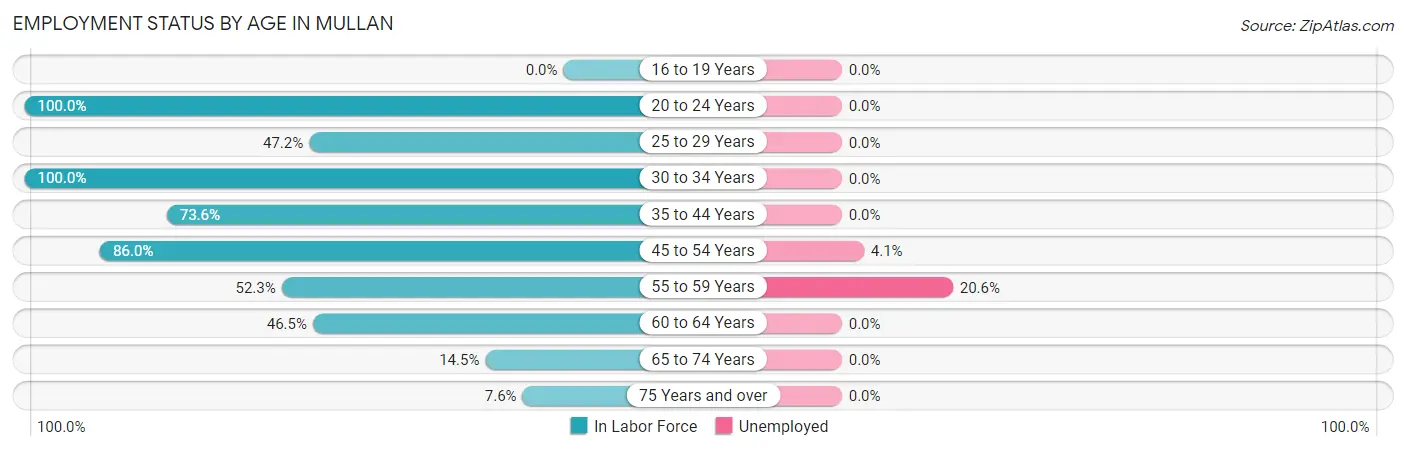
| Age Bracket | In Labor Force | Unemployed |
| 16 to 19 Years | 0 (0.0%) | 0 (0.0%) |
| 20 to 24 Years | 10 (100.0%) | 0 (0.0%) |
| 25 to 29 Years | 17 (47.2%) | 0 (0.0%) |
| 30 to 34 Years | 14 (100.0%) | 0 (0.0%) |
| 35 to 44 Years | 67 (73.6%) | 0 (0.0%) |
| 45 to 54 Years | 74 (86.0%) | 3 (4.1%) |
| 55 to 59 Years | 34 (52.3%) | 7 (20.6%) |
| 60 to 64 Years | 20 (46.5%) | 0 (0.0%) |
| 65 to 74 Years | 17 (14.5%) | 0 (0.0%) |
| 75 Years and over | 6 (7.6%) | 0 (0.0%) |
| Total | 259 (47.2%) | 10 (3.9%) |
Employment Status by Educational Attainment in Mullan
According to labor force statistics for Mullan, 67.5% of individuals (226) out of the total population between 25 and 64 years of age (335) are in the labor force, with 4.4% or 10 of them being unemployed. The group with the highest labor force participation rate are those with the educational attainment of college / associate degree, with 86.3% or 101 individuals in the labor force. Within the labor force, individuals with bachelor's degree or higher education have the highest percentage of unemployment, with 17.9% or 7 of them being unemployed.
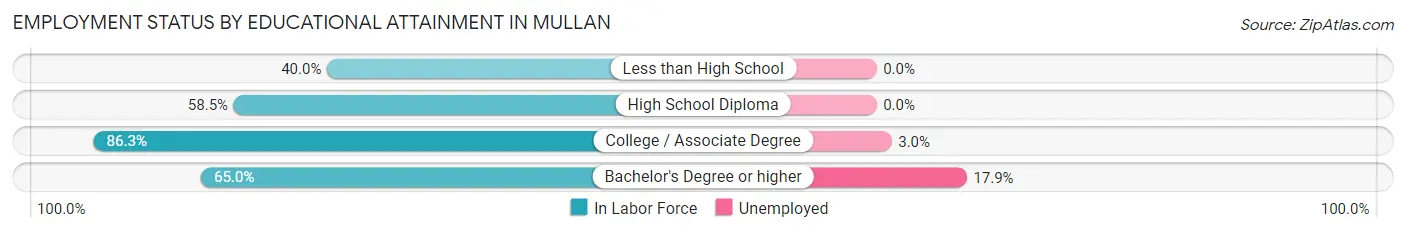
| Educational Attainment | In Labor Force | Unemployed |
| Less than High School | 14 (40.0%) | 0 (0.0%) |
| High School Diploma | 72 (58.5%) | 0 (0.0%) |
| College / Associate Degree | 101 (86.3%) | 4 (3.0%) |
| Bachelor's Degree or higher | 39 (65.0%) | 11 (17.9%) |
| Total | 226 (67.5%) | 15 (4.4%) |
Employment Occupations by Sex in Mullan
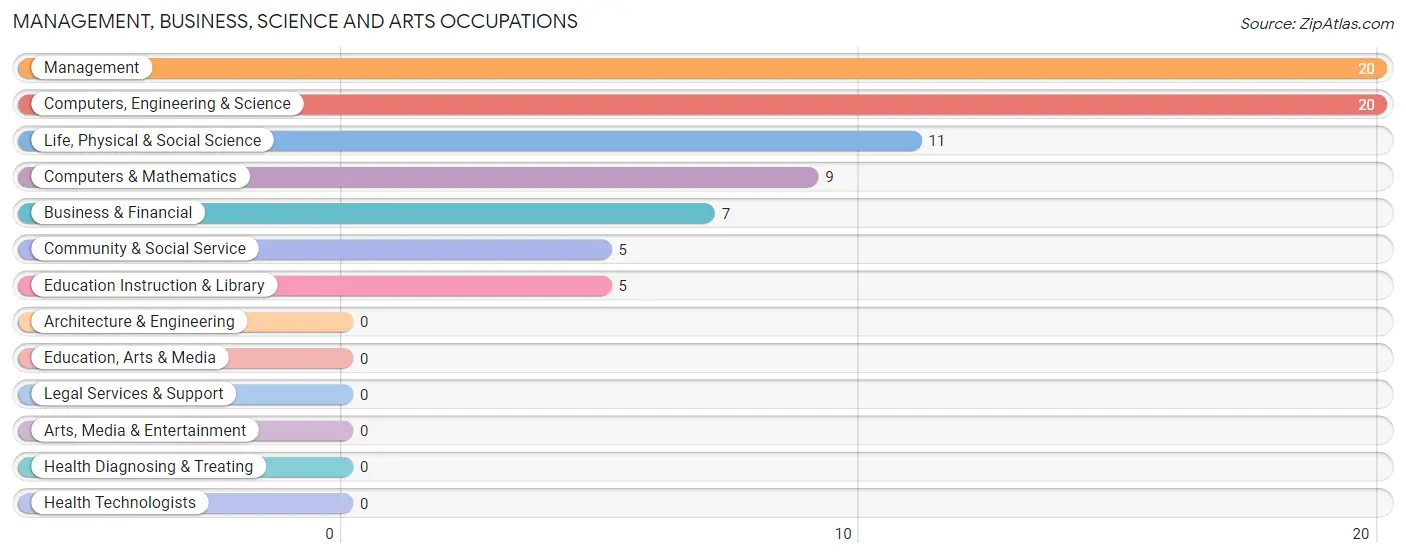
Management, Business, Science and Arts Occupations
The most common Management, Business, Science and Arts occupations in Mullan are Management (20 | 8.0%), Computers, Engineering & Science (20 | 8.0%), Life, Physical & Social Science (11 | 4.4%), Computers & Mathematics (9 | 3.6%), and Business & Financial (7 | 2.8%).
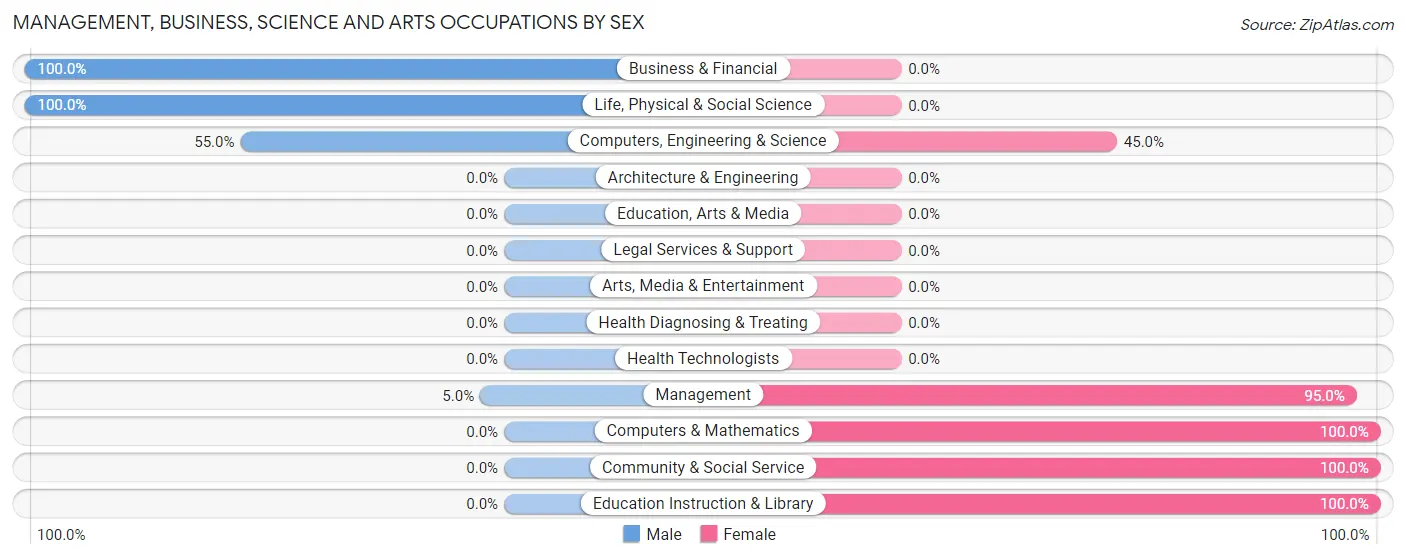
Management, Business, Science and Arts Occupations by Sex
Within the Management, Business, Science and Arts occupations in Mullan, the most male-oriented occupations are Business & Financial (100.0%), Life, Physical & Social Science (100.0%), and Computers, Engineering & Science (55.0%), while the most female-oriented occupations are Computers & Mathematics (100.0%), Community & Social Service (100.0%), and Education Instruction & Library (100.0%).
| Occupation | Male | Female |
| Management | 1 (5.0%) | 19 (95.0%) |
| Business & Financial | 7 (100.0%) | 0 (0.0%) |
| Computers, Engineering & Science | 11 (55.0%) | 9 (45.0%) |
| Computers & Mathematics | 0 (0.0%) | 9 (100.0%) |
| Architecture & Engineering | 0 (0.0%) | 0 (0.0%) |
| Life, Physical & Social Science | 11 (100.0%) | 0 (0.0%) |
| Community & Social Service | 0 (0.0%) | 5 (100.0%) |
| Education, Arts & Media | 0 (0.0%) | 0 (0.0%) |
| Legal Services & Support | 0 (0.0%) | 0 (0.0%) |
| Education Instruction & Library | 0 (0.0%) | 5 (100.0%) |
| Arts, Media & Entertainment | 0 (0.0%) | 0 (0.0%) |
| Health Diagnosing & Treating | 0 (0.0%) | 0 (0.0%) |
| Health Technologists | 0 (0.0%) | 0 (0.0%) |
| Total (Category) | 19 (36.5%) | 33 (63.5%) |
| Total (Overall) | 136 (54.6%) | 113 (45.4%) |
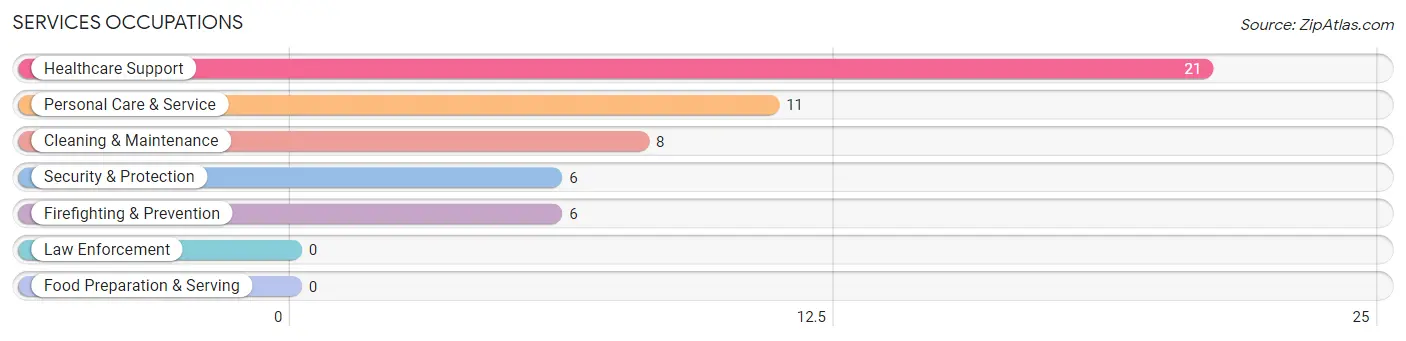
Services Occupations
The most common Services occupations in Mullan are Healthcare Support (21 | 8.4%), Personal Care & Service (11 | 4.4%), Cleaning & Maintenance (8 | 3.2%), Security & Protection (6 | 2.4%), and Firefighting & Prevention (6 | 2.4%).
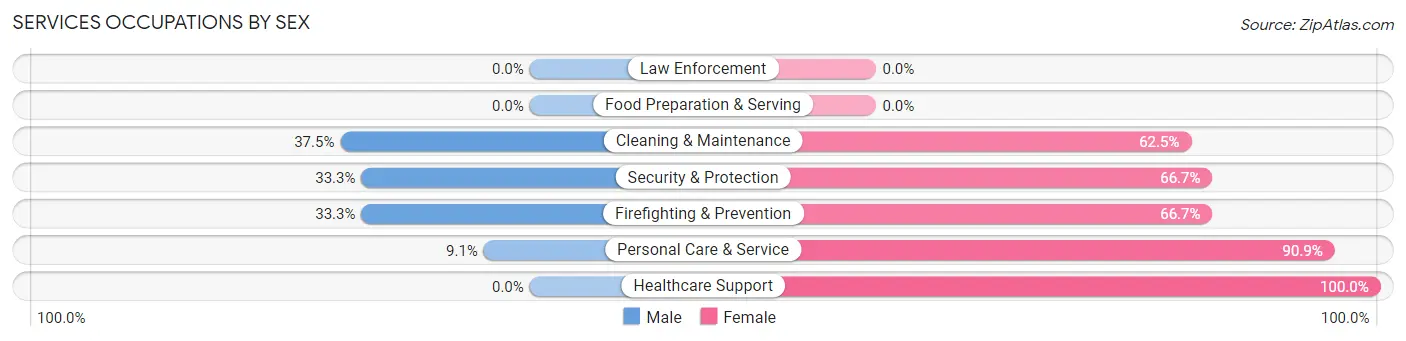
Services Occupations by Sex
Within the Services occupations in Mullan, the most male-oriented occupations are Cleaning & Maintenance (37.5%), Security & Protection (33.3%), and Firefighting & Prevention (33.3%), while the most female-oriented occupations are Healthcare Support (100.0%), Personal Care & Service (90.9%), and Security & Protection (66.7%).
| Occupation | Male | Female |
| Healthcare Support | 0 (0.0%) | 21 (100.0%) |
| Security & Protection | 2 (33.3%) | 4 (66.7%) |
| Firefighting & Prevention | 2 (33.3%) | 4 (66.7%) |
| Law Enforcement | 0 (0.0%) | 0 (0.0%) |
| Food Preparation & Serving | 0 (0.0%) | 0 (0.0%) |
| Cleaning & Maintenance | 3 (37.5%) | 5 (62.5%) |
| Personal Care & Service | 1 (9.1%) | 10 (90.9%) |
| Total (Category) | 6 (13.0%) | 40 (87.0%) |
| Total (Overall) | 136 (54.6%) | 113 (45.4%) |
Sales and Office Occupations
The most common Sales and Office occupations in Mullan are Office & Administration (36 | 14.5%), and Sales & Related (13 | 5.2%).
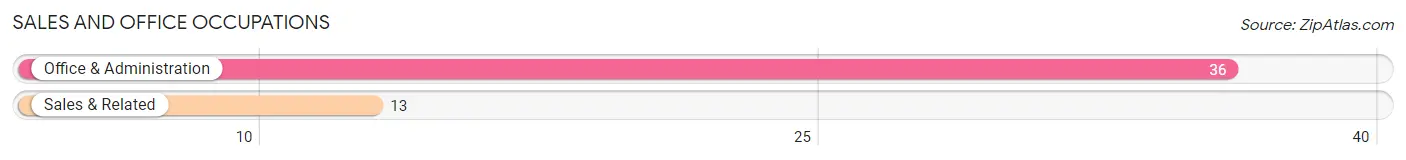
Sales and Office Occupations by Sex
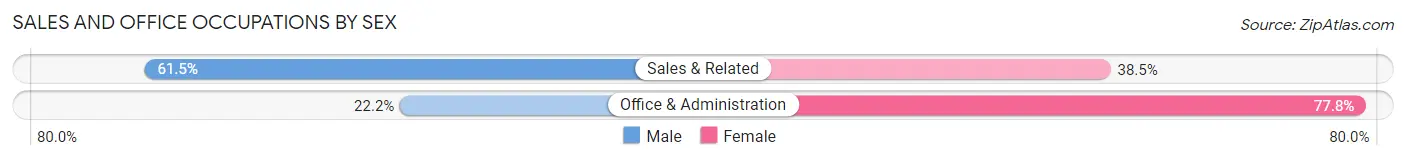
| Occupation | Male | Female |
| Sales & Related | 8 (61.5%) | 5 (38.5%) |
| Office & Administration | 8 (22.2%) | 28 (77.8%) |
| Total (Category) | 16 (32.7%) | 33 (67.3%) |
| Total (Overall) | 136 (54.6%) | 113 (45.4%) |
Natural Resources, Construction and Maintenance Occupations
The most common Natural Resources, Construction and Maintenance occupations in Mullan are Construction & Extraction (68 | 27.3%), and Installation, Maintenance & Repair (19 | 7.6%).
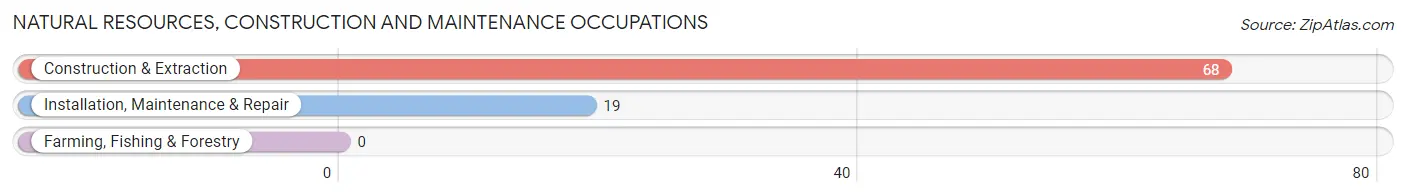
Natural Resources, Construction and Maintenance Occupations by Sex
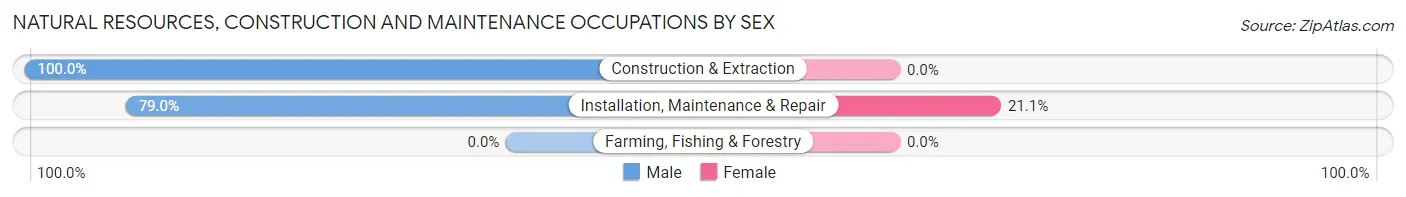
| Occupation | Male | Female |
| Farming, Fishing & Forestry | 0 (0.0%) | 0 (0.0%) |
| Construction & Extraction | 68 (100.0%) | 0 (0.0%) |
| Installation, Maintenance & Repair | 15 (78.9%) | 4 (21.0%) |
| Total (Category) | 83 (95.4%) | 4 (4.6%) |
| Total (Overall) | 136 (54.6%) | 113 (45.4%) |
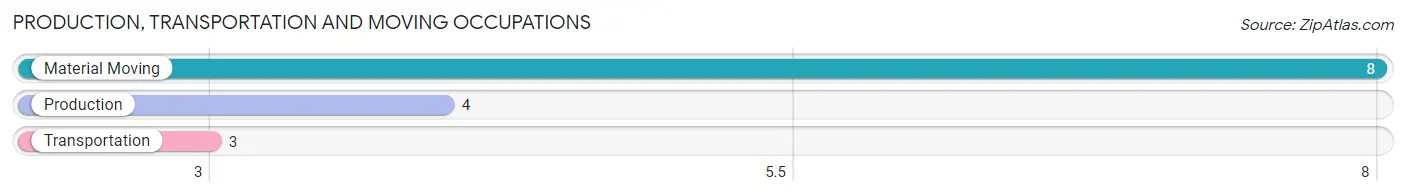
Production, Transportation and Moving Occupations
The most common Production, Transportation and Moving occupations in Mullan are Material Moving (8 | 3.2%), Production (4 | 1.6%), and Transportation (3 | 1.2%).
Production, Transportation and Moving Occupations by Sex
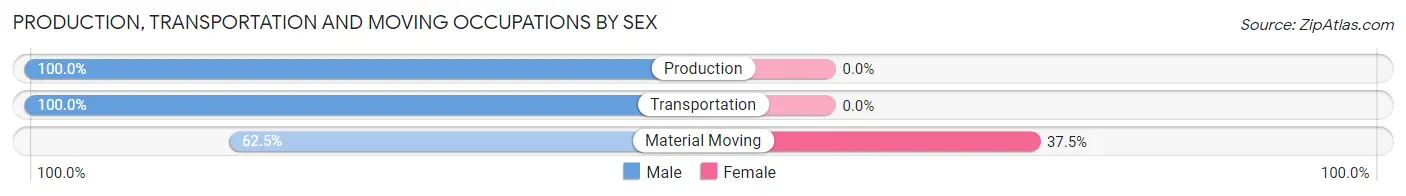
| Occupation | Male | Female |
| Production | 4 (100.0%) | 0 (0.0%) |
| Transportation | 3 (100.0%) | 0 (0.0%) |
| Material Moving | 5 (62.5%) | 3 (37.5%) |
| Total (Category) | 12 (80.0%) | 3 (20.0%) |
| Total (Overall) | 136 (54.6%) | 113 (45.4%) |
Employment Industries by Sex in Mullan
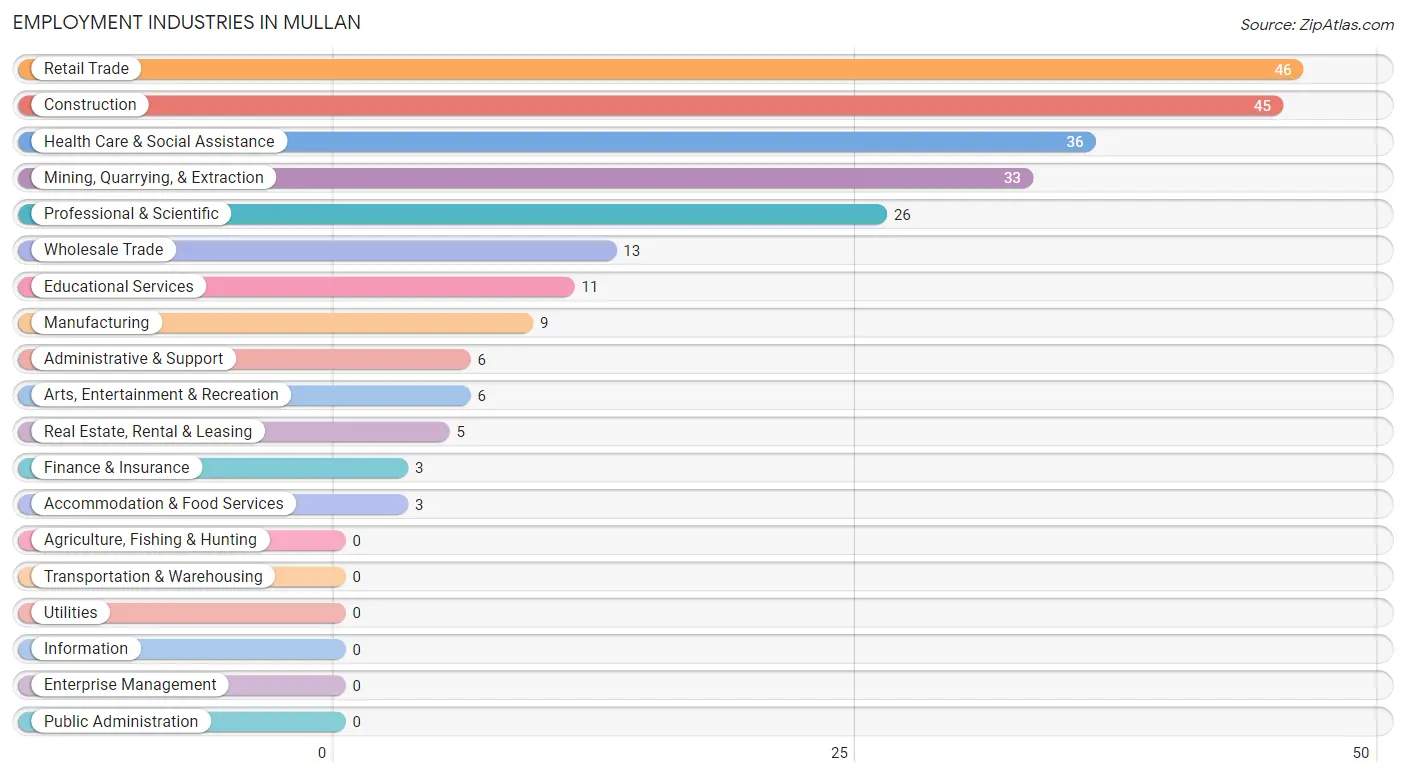
Employment Industries in Mullan
The major employment industries in Mullan include Retail Trade (46 | 18.5%), Construction (45 | 18.1%), Health Care & Social Assistance (36 | 14.5%), Mining, Quarrying, & Extraction (33 | 13.3%), and Professional & Scientific (26 | 10.4%).
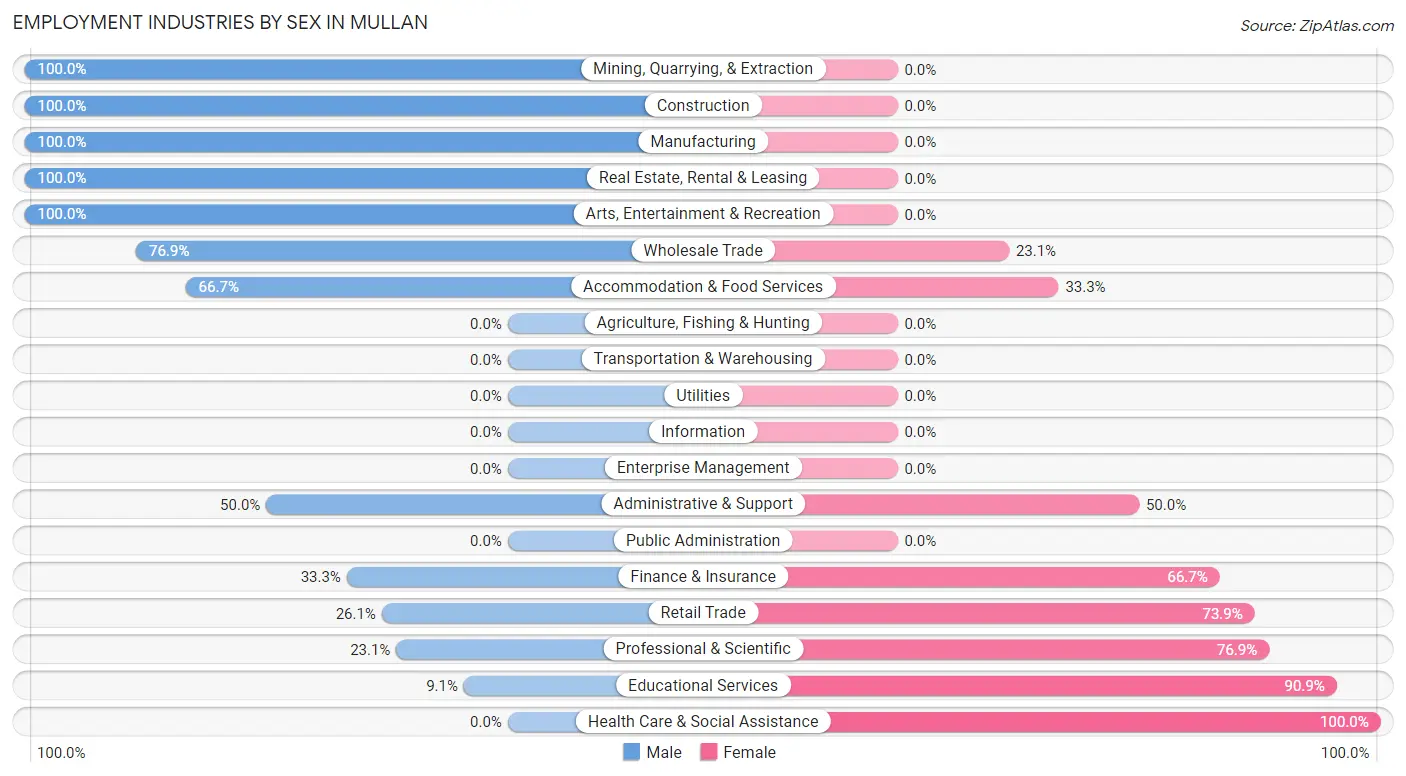
Employment Industries by Sex in Mullan
The Mullan industries that see more men than women are Mining, Quarrying, & Extraction (100.0%), Construction (100.0%), and Manufacturing (100.0%), whereas the industries that tend to have a higher number of women are Health Care & Social Assistance (100.0%), Educational Services (90.9%), and Professional & Scientific (76.9%).
| Industry | Male | Female |
| Agriculture, Fishing & Hunting | 0 (0.0%) | 0 (0.0%) |
| Mining, Quarrying, & Extraction | 33 (100.0%) | 0 (0.0%) |
| Construction | 45 (100.0%) | 0 (0.0%) |
| Manufacturing | 9 (100.0%) | 0 (0.0%) |
| Wholesale Trade | 10 (76.9%) | 3 (23.1%) |
| Retail Trade | 12 (26.1%) | 34 (73.9%) |
| Transportation & Warehousing | 0 (0.0%) | 0 (0.0%) |
| Utilities | 0 (0.0%) | 0 (0.0%) |
| Information | 0 (0.0%) | 0 (0.0%) |
| Finance & Insurance | 1 (33.3%) | 2 (66.7%) |
| Real Estate, Rental & Leasing | 5 (100.0%) | 0 (0.0%) |
| Professional & Scientific | 6 (23.1%) | 20 (76.9%) |
| Enterprise Management | 0 (0.0%) | 0 (0.0%) |
| Administrative & Support | 3 (50.0%) | 3 (50.0%) |
| Educational Services | 1 (9.1%) | 10 (90.9%) |
| Health Care & Social Assistance | 0 (0.0%) | 36 (100.0%) |
| Arts, Entertainment & Recreation | 6 (100.0%) | 0 (0.0%) |
| Accommodation & Food Services | 2 (66.7%) | 1 (33.3%) |
| Public Administration | 0 (0.0%) | 0 (0.0%) |
| Total | 136 (54.6%) | 113 (45.4%) |
Education in Mullan
School Enrollment in Mullan
The most common levels of schooling among the 83 students in Mullan are high school (39 | 47.0%), elementary school (20 | 24.1%), and middle school (12 | 14.5%).
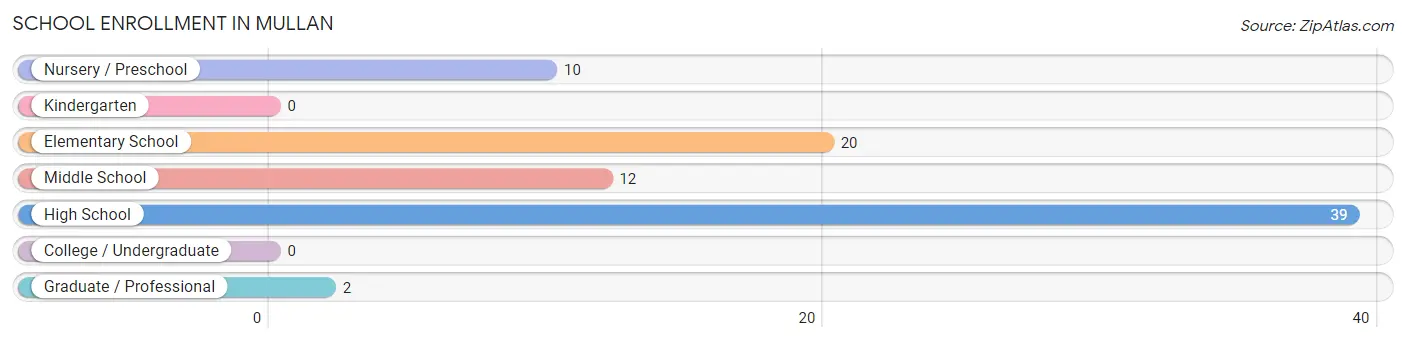
| School Level | # Students | % Students |
| Nursery / Preschool | 10 | 12.0% |
| Kindergarten | 0 | 0.0% |
| Elementary School | 20 | 24.1% |
| Middle School | 12 | 14.5% |
| High School | 39 | 47.0% |
| College / Undergraduate | 0 | 0.0% |
| Graduate / Professional | 2 | 2.4% |
| Total | 83 | 100.0% |
School Enrollment by Age by Funding Source in Mullan
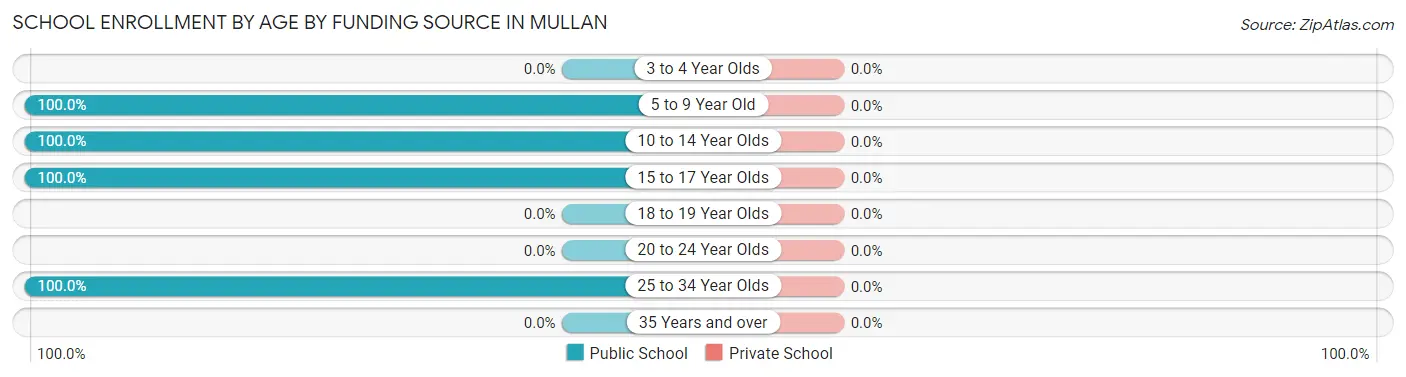
| Age Bracket | Public School | Private School |
| 3 to 4 Year Olds | 0 (0.0%) | 0 (0.0%) |
| 5 to 9 Year Old | 30 (100.0%) | 0 (0.0%) |
| 10 to 14 Year Olds | 21 (100.0%) | 0 (0.0%) |
| 15 to 17 Year Olds | 30 (100.0%) | 0 (0.0%) |
| 18 to 19 Year Olds | 0 (0.0%) | 0 (0.0%) |
| 20 to 24 Year Olds | 0 (0.0%) | 0 (0.0%) |
| 25 to 34 Year Olds | 2 (100.0%) | 0 (0.0%) |
| 35 Years and over | 0 (0.0%) | 0 (0.0%) |
| Total | 83 (100.0%) | 0 (0.0%) |
Educational Attainment by Field of Study in Mullan
Science & technology (22 | 30.1%), business (15 | 20.5%), bio, nature & agricultural (9 | 12.3%), education (8 | 11.0%), and physical & health sciences (5 | 6.9%) are the most common fields of study among 73 individuals in Mullan who have obtained a bachelor's degree or higher.
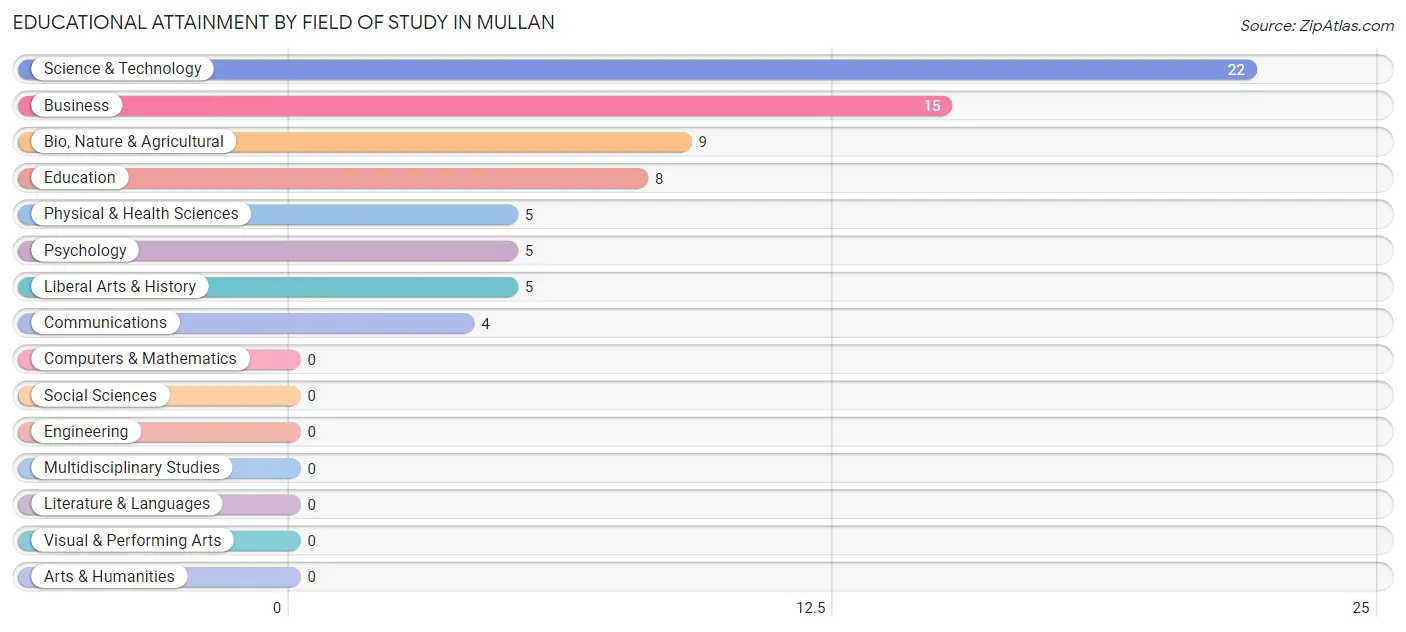
| Field of Study | # Graduates | % Graduates |
| Computers & Mathematics | 0 | 0.0% |
| Bio, Nature & Agricultural | 9 | 12.3% |
| Physical & Health Sciences | 5 | 6.9% |
| Psychology | 5 | 6.9% |
| Social Sciences | 0 | 0.0% |
| Engineering | 0 | 0.0% |
| Multidisciplinary Studies | 0 | 0.0% |
| Science & Technology | 22 | 30.1% |
| Business | 15 | 20.5% |
| Education | 8 | 11.0% |
| Literature & Languages | 0 | 0.0% |
| Liberal Arts & History | 5 | 6.9% |
| Visual & Performing Arts | 0 | 0.0% |
| Communications | 4 | 5.5% |
| Arts & Humanities | 0 | 0.0% |
| Total | 73 | 100.0% |
Transportation & Commute in Mullan
Vehicle Availability by Sex in Mullan
The most prevalent vehicle ownership categories in Mullan are males with 2 vehicles (44, accounting for 32.4%) and females with 2 vehicles (34, making up 38.9%).
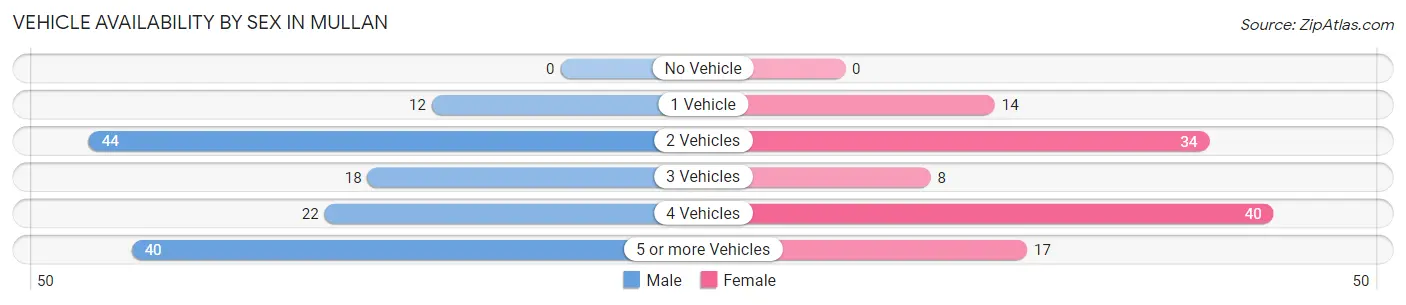
| Vehicles Available | Male | Female |
| No Vehicle | 0 (0.0%) | 0 (0.0%) |
| 1 Vehicle | 12 (8.8%) | 14 (12.4%) |
| 2 Vehicles | 44 (32.4%) | 34 (30.1%) |
| 3 Vehicles | 18 (13.2%) | 8 (7.1%) |
| 4 Vehicles | 22 (16.2%) | 40 (35.4%) |
| 5 or more Vehicles | 40 (29.4%) | 17 (15.0%) |
| Total | 136 (100.0%) | 113 (100.0%) |
Commute Time in Mullan
The most frequently occuring commute durations in Mullan are 90 or more minutes (47 commuters, 21.0%), 10 to 14 minutes (34 commuters, 15.2%), and 20 to 24 minutes (30 commuters, 13.4%).
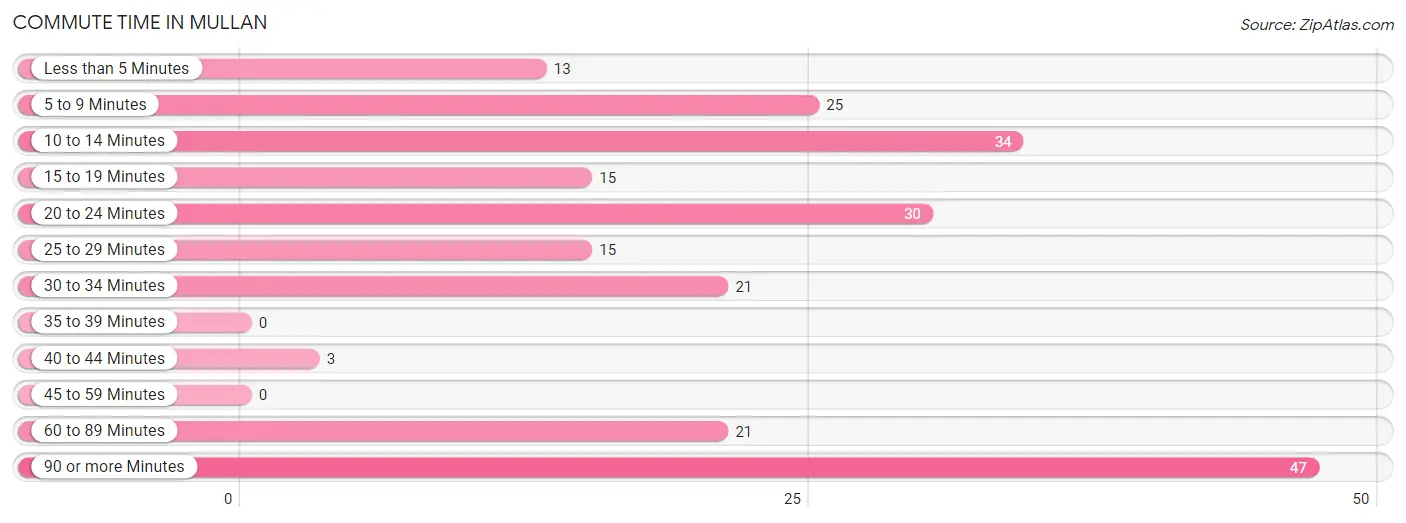
| Commute Time | # Commuters | % Commuters |
| Less than 5 Minutes | 13 | 5.8% |
| 5 to 9 Minutes | 25 | 11.2% |
| 10 to 14 Minutes | 34 | 15.2% |
| 15 to 19 Minutes | 15 | 6.7% |
| 20 to 24 Minutes | 30 | 13.4% |
| 25 to 29 Minutes | 15 | 6.7% |
| 30 to 34 Minutes | 21 | 9.4% |
| 35 to 39 Minutes | 0 | 0.0% |
| 40 to 44 Minutes | 3 | 1.3% |
| 45 to 59 Minutes | 0 | 0.0% |
| 60 to 89 Minutes | 21 | 9.4% |
| 90 or more Minutes | 47 | 21.0% |
Commute Time by Sex in Mullan
The most common commute times in Mullan are 90 or more minutes (47 commuters, 34.6%) for males and 10 to 14 minutes (30 commuters, 34.1%) for females.
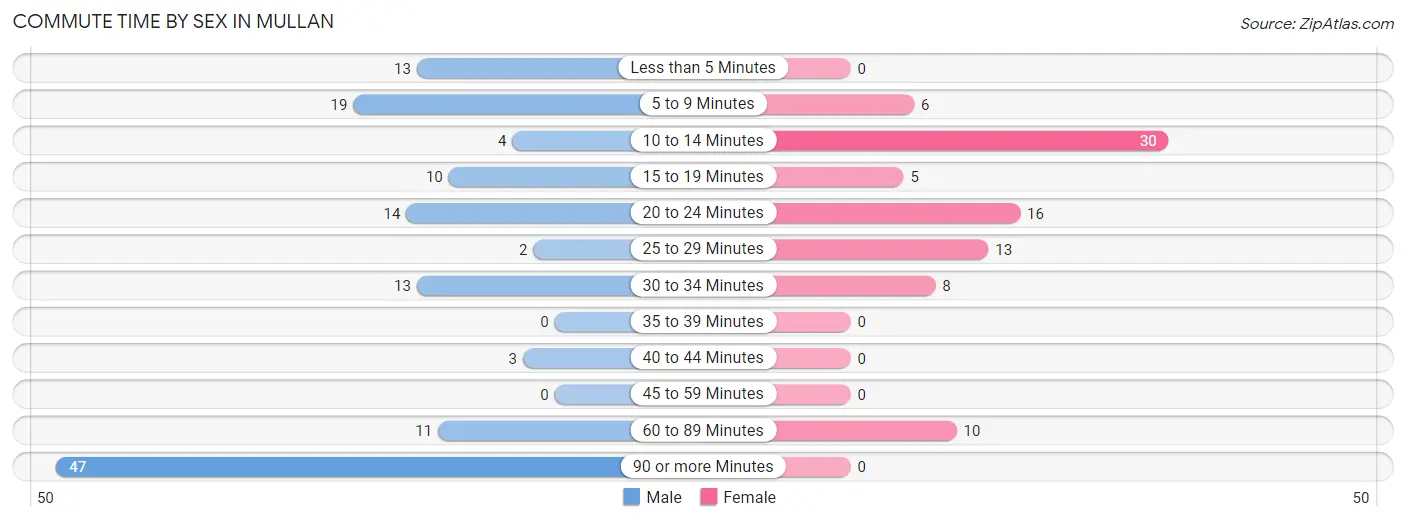
| Commute Time | Male | Female |
| Less than 5 Minutes | 13 (9.6%) | 0 (0.0%) |
| 5 to 9 Minutes | 19 (14.0%) | 6 (6.8%) |
| 10 to 14 Minutes | 4 (2.9%) | 30 (34.1%) |
| 15 to 19 Minutes | 10 (7.3%) | 5 (5.7%) |
| 20 to 24 Minutes | 14 (10.3%) | 16 (18.2%) |
| 25 to 29 Minutes | 2 (1.5%) | 13 (14.8%) |
| 30 to 34 Minutes | 13 (9.6%) | 8 (9.1%) |
| 35 to 39 Minutes | 0 (0.0%) | 0 (0.0%) |
| 40 to 44 Minutes | 3 (2.2%) | 0 (0.0%) |
| 45 to 59 Minutes | 0 (0.0%) | 0 (0.0%) |
| 60 to 89 Minutes | 11 (8.1%) | 10 (11.4%) |
| 90 or more Minutes | 47 (34.6%) | 0 (0.0%) |
Time of Departure to Work by Sex in Mullan
The most frequent times of departure to work in Mullan are 12:00 AM to 4:59 AM (45, 33.1%) for males and 7:00 AM to 7:29 AM (26, 29.5%) for females.
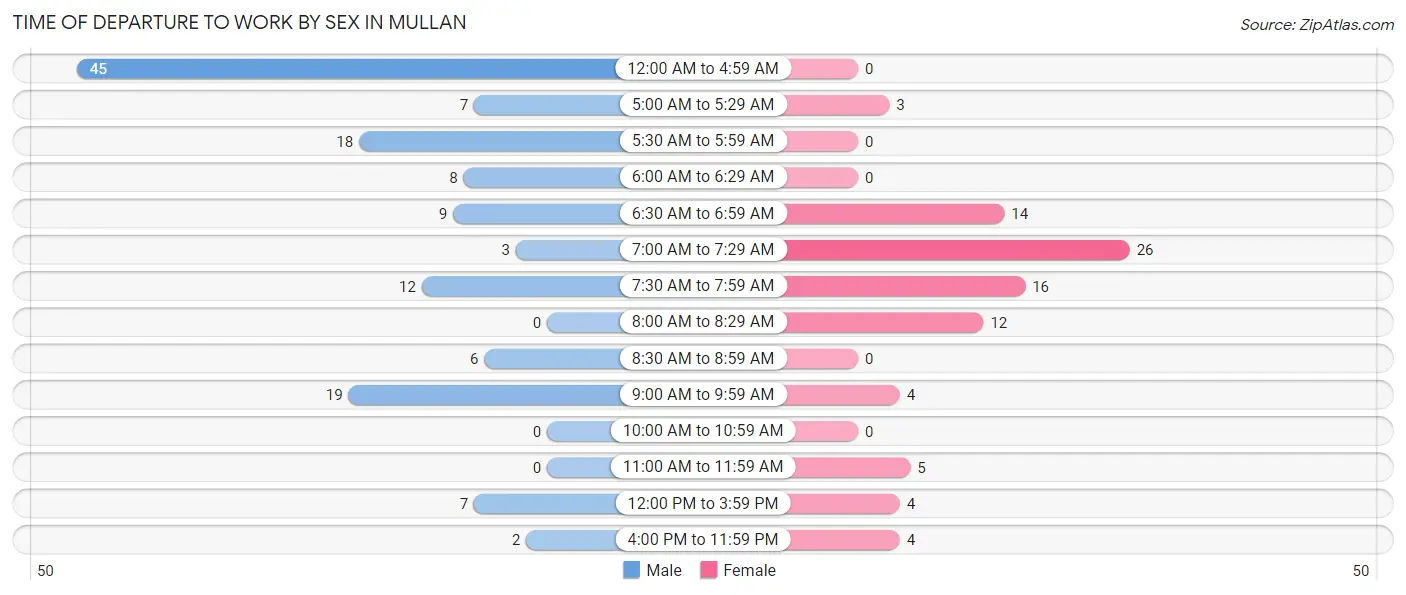
| Time of Departure | Male | Female |
| 12:00 AM to 4:59 AM | 45 (33.1%) | 0 (0.0%) |
| 5:00 AM to 5:29 AM | 7 (5.1%) | 3 (3.4%) |
| 5:30 AM to 5:59 AM | 18 (13.2%) | 0 (0.0%) |
| 6:00 AM to 6:29 AM | 8 (5.9%) | 0 (0.0%) |
| 6:30 AM to 6:59 AM | 9 (6.6%) | 14 (15.9%) |
| 7:00 AM to 7:29 AM | 3 (2.2%) | 26 (29.5%) |
| 7:30 AM to 7:59 AM | 12 (8.8%) | 16 (18.2%) |
| 8:00 AM to 8:29 AM | 0 (0.0%) | 12 (13.6%) |
| 8:30 AM to 8:59 AM | 6 (4.4%) | 0 (0.0%) |
| 9:00 AM to 9:59 AM | 19 (14.0%) | 4 (4.5%) |
| 10:00 AM to 10:59 AM | 0 (0.0%) | 0 (0.0%) |
| 11:00 AM to 11:59 AM | 0 (0.0%) | 5 (5.7%) |
| 12:00 PM to 3:59 PM | 7 (5.1%) | 4 (4.5%) |
| 4:00 PM to 11:59 PM | 2 (1.5%) | 4 (4.5%) |
| Total | 136 (100.0%) | 88 (100.0%) |
Housing Occupancy in Mullan
Occupancy by Ownership in Mullan
Of the total 302 dwellings in Mullan, owner-occupied units account for 242 (80.1%), while renter-occupied units make up 60 (19.9%).
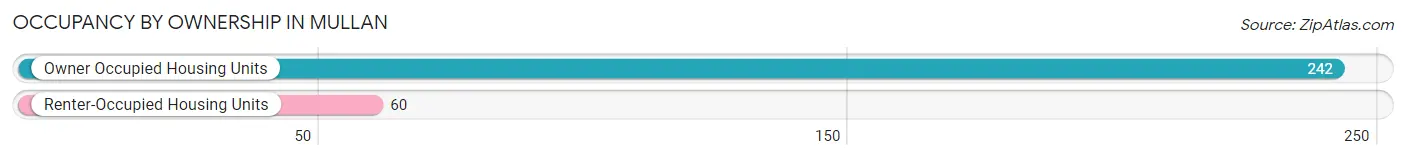
| Occupancy | # Housing Units | % Housing Units |
| Owner Occupied Housing Units | 242 | 80.1% |
| Renter-Occupied Housing Units | 60 | 19.9% |
| Total Occupied Housing Units | 302 | 100.0% |
Occupancy by Household Size in Mullan
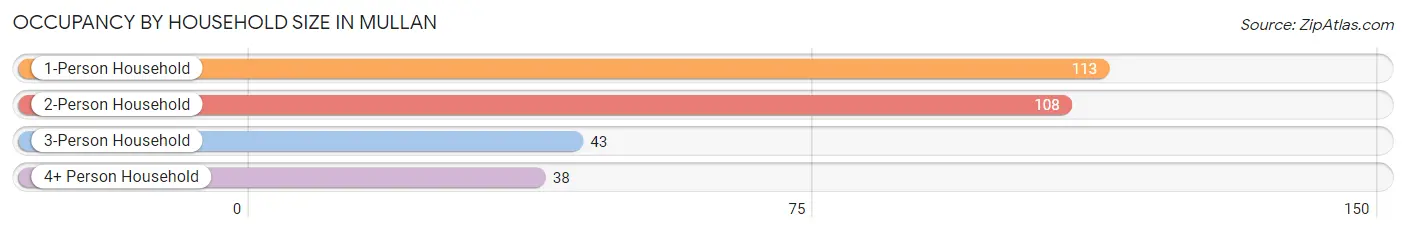
| Household Size | # Housing Units | % Housing Units |
| 1-Person Household | 113 | 37.4% |
| 2-Person Household | 108 | 35.8% |
| 3-Person Household | 43 | 14.2% |
| 4+ Person Household | 38 | 12.6% |
| Total Housing Units | 302 | 100.0% |
Occupancy by Ownership by Household Size in Mullan
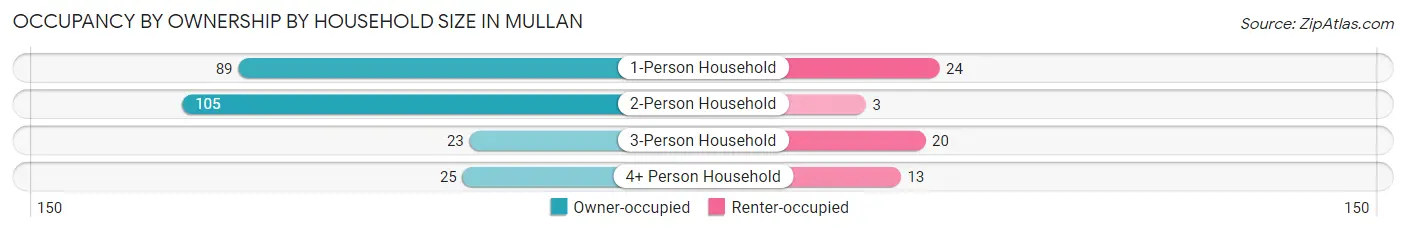
| Household Size | Owner-occupied | Renter-occupied |
| 1-Person Household | 89 (78.8%) | 24 (21.2%) |
| 2-Person Household | 105 (97.2%) | 3 (2.8%) |
| 3-Person Household | 23 (53.5%) | 20 (46.5%) |
| 4+ Person Household | 25 (65.8%) | 13 (34.2%) |
| Total Housing Units | 242 (80.1%) | 60 (19.9%) |
Occupancy by Educational Attainment in Mullan
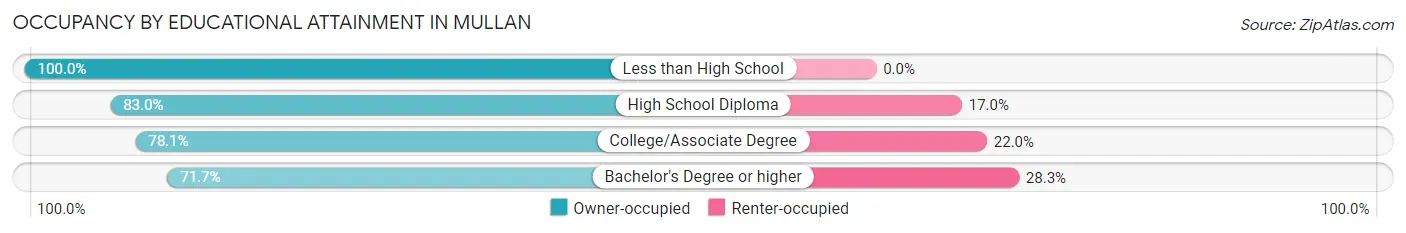
| Household Size | Owner-occupied | Renter-occupied |
| Less than High School | 20 (100.0%) | 0 (0.0%) |
| High School Diploma | 88 (83.0%) | 18 (17.0%) |
| College/Associate Degree | 96 (78.0%) | 27 (22.0%) |
| Bachelor's Degree or higher | 38 (71.7%) | 15 (28.3%) |
Occupancy by Age of Householder in Mullan
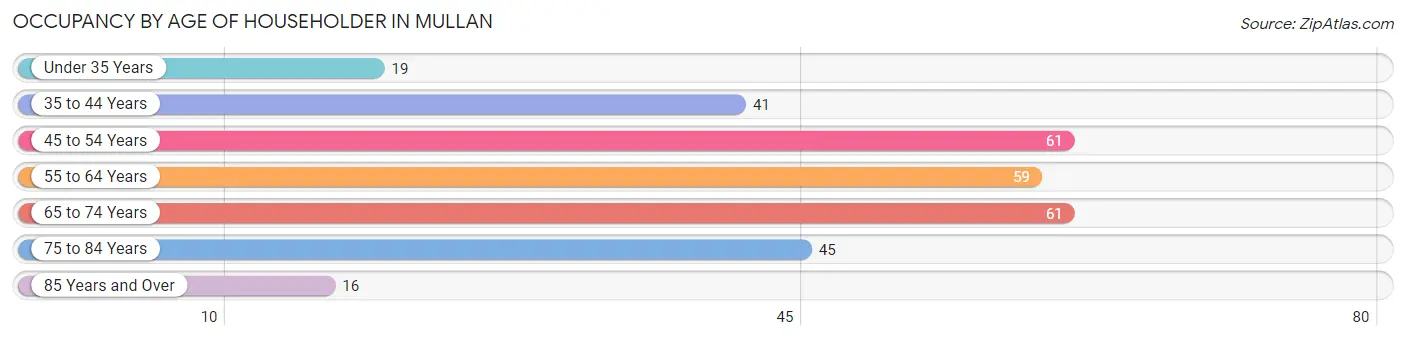
| Age Bracket | # Households | % Households |
| Under 35 Years | 19 | 6.3% |
| 35 to 44 Years | 41 | 13.6% |
| 45 to 54 Years | 61 | 20.2% |
| 55 to 64 Years | 59 | 19.5% |
| 65 to 74 Years | 61 | 20.2% |
| 75 to 84 Years | 45 | 14.9% |
| 85 Years and Over | 16 | 5.3% |
| Total | 302 | 100.0% |
Housing Finances in Mullan
Median Income by Occupancy in Mullan
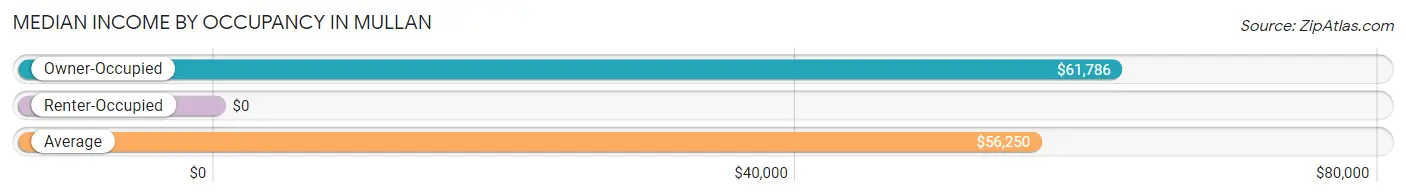
| Occupancy Type | # Households | Median Income |
| Owner-Occupied | 242 (80.1%) | $61,786 |
| Renter-Occupied | 60 (19.9%) | $0 |
| Average | 302 (100.0%) | $56,250 |
Occupancy by Householder Income Bracket in Mullan
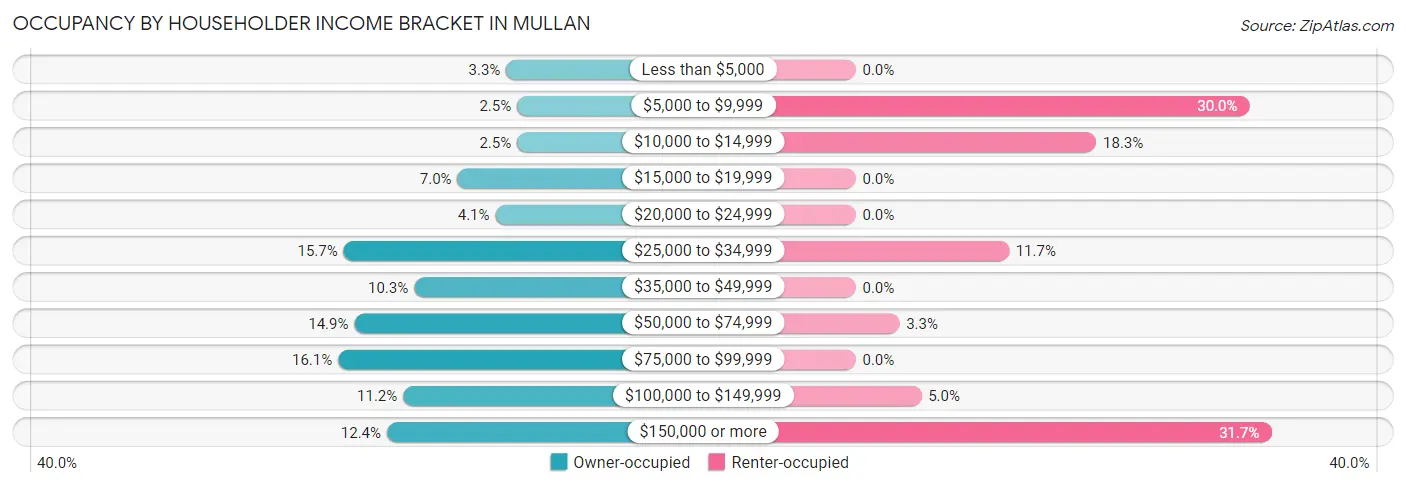
| Income Bracket | Owner-occupied | Renter-occupied |
| Less than $5,000 | 8 (3.3%) | 0 (0.0%) |
| $5,000 to $9,999 | 6 (2.5%) | 18 (30.0%) |
| $10,000 to $14,999 | 6 (2.5%) | 11 (18.3%) |
| $15,000 to $19,999 | 17 (7.0%) | 0 (0.0%) |
| $20,000 to $24,999 | 10 (4.1%) | 0 (0.0%) |
| $25,000 to $34,999 | 38 (15.7%) | 7 (11.7%) |
| $35,000 to $49,999 | 25 (10.3%) | 0 (0.0%) |
| $50,000 to $74,999 | 36 (14.9%) | 2 (3.3%) |
| $75,000 to $99,999 | 39 (16.1%) | 0 (0.0%) |
| $100,000 to $149,999 | 27 (11.2%) | 3 (5.0%) |
| $150,000 or more | 30 (12.4%) | 19 (31.7%) |
| Total | 242 (100.0%) | 60 (100.0%) |
Monthly Housing Cost Tiers in Mullan
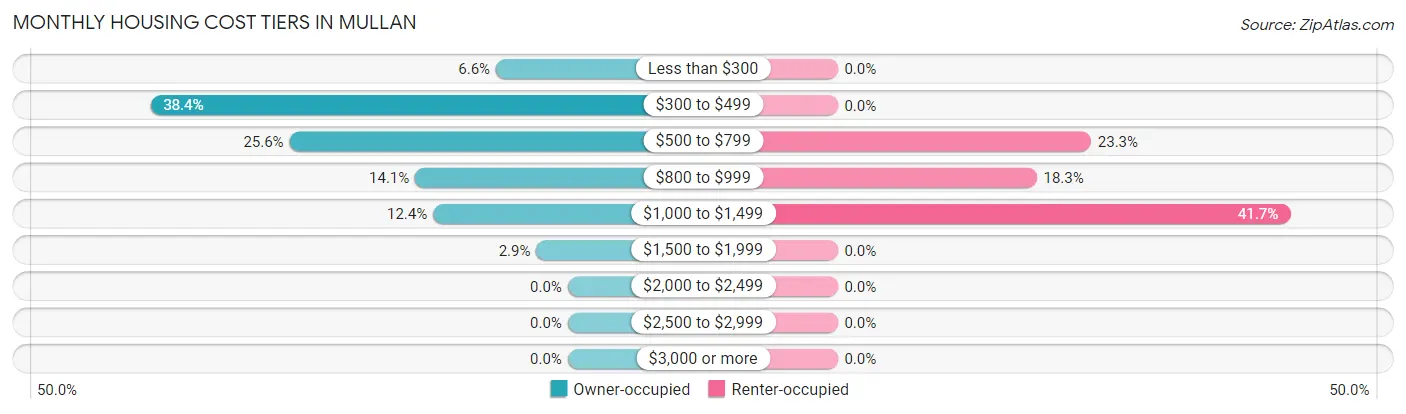
| Monthly Cost | Owner-occupied | Renter-occupied |
| Less than $300 | 16 (6.6%) | 0 (0.0%) |
| $300 to $499 | 93 (38.4%) | 0 (0.0%) |
| $500 to $799 | 62 (25.6%) | 14 (23.3%) |
| $800 to $999 | 34 (14.1%) | 11 (18.3%) |
| $1,000 to $1,499 | 30 (12.4%) | 25 (41.7%) |
| $1,500 to $1,999 | 7 (2.9%) | 0 (0.0%) |
| $2,000 to $2,499 | 0 (0.0%) | 0 (0.0%) |
| $2,500 to $2,999 | 0 (0.0%) | 0 (0.0%) |
| $3,000 or more | 0 (0.0%) | 0 (0.0%) |
| Total | 242 (100.0%) | 60 (100.0%) |
Physical Housing Characteristics in Mullan
Housing Structures in Mullan
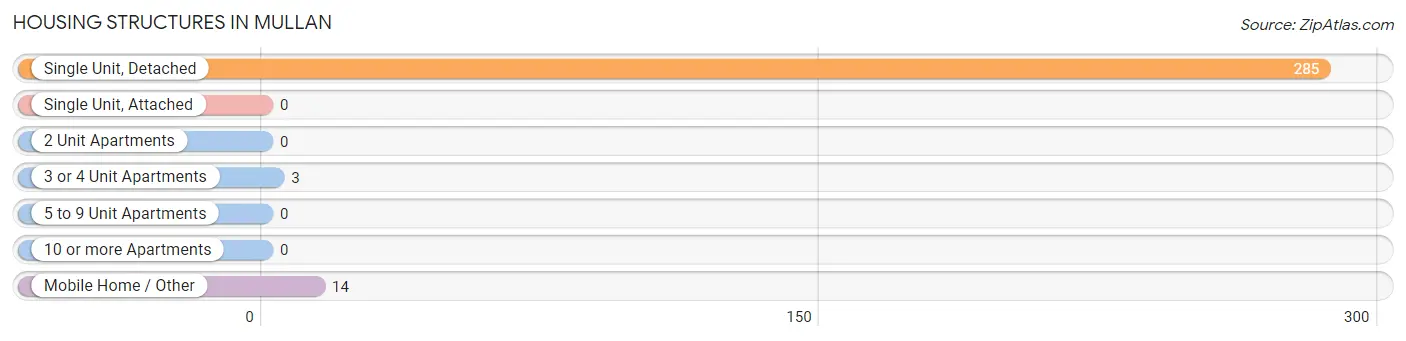
| Structure Type | # Housing Units | % Housing Units |
| Single Unit, Detached | 285 | 94.4% |
| Single Unit, Attached | 0 | 0.0% |
| 2 Unit Apartments | 0 | 0.0% |
| 3 or 4 Unit Apartments | 3 | 1.0% |
| 5 to 9 Unit Apartments | 0 | 0.0% |
| 10 or more Apartments | 0 | 0.0% |
| Mobile Home / Other | 14 | 4.6% |
| Total | 302 | 100.0% |
Housing Structures by Occupancy in Mullan
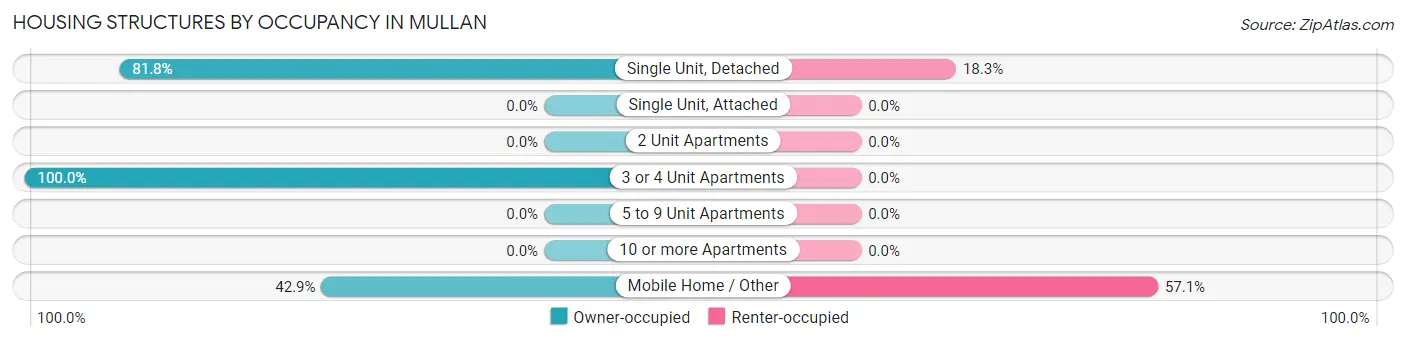
| Structure Type | Owner-occupied | Renter-occupied |
| Single Unit, Detached | 233 (81.8%) | 52 (18.2%) |
| Single Unit, Attached | 0 (0.0%) | 0 (0.0%) |
| 2 Unit Apartments | 0 (0.0%) | 0 (0.0%) |
| 3 or 4 Unit Apartments | 3 (100.0%) | 0 (0.0%) |
| 5 to 9 Unit Apartments | 0 (0.0%) | 0 (0.0%) |
| 10 or more Apartments | 0 (0.0%) | 0 (0.0%) |
| Mobile Home / Other | 6 (42.9%) | 8 (57.1%) |
| Total | 242 (80.1%) | 60 (19.9%) |
Housing Structures by Number of Rooms in Mullan
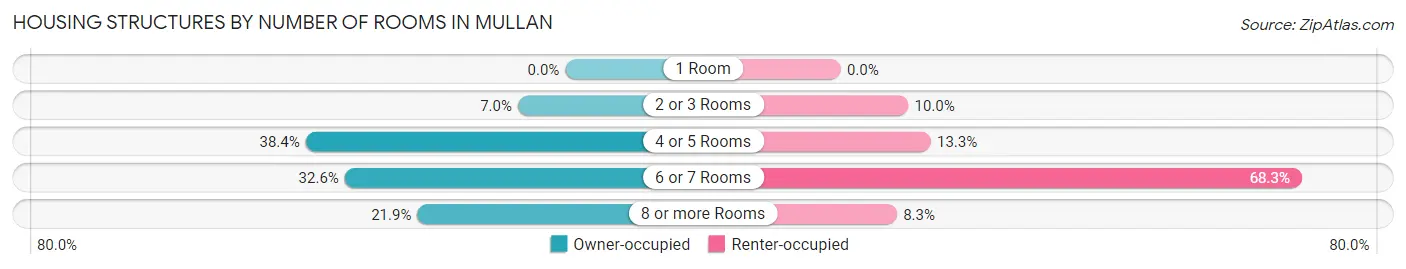
| Number of Rooms | Owner-occupied | Renter-occupied |
| 1 Room | 0 (0.0%) | 0 (0.0%) |
| 2 or 3 Rooms | 17 (7.0%) | 6 (10.0%) |
| 4 or 5 Rooms | 93 (38.4%) | 8 (13.3%) |
| 6 or 7 Rooms | 79 (32.6%) | 41 (68.3%) |
| 8 or more Rooms | 53 (21.9%) | 5 (8.3%) |
| Total | 242 (100.0%) | 60 (100.0%) |
Housing Structure by Heating Type in Mullan
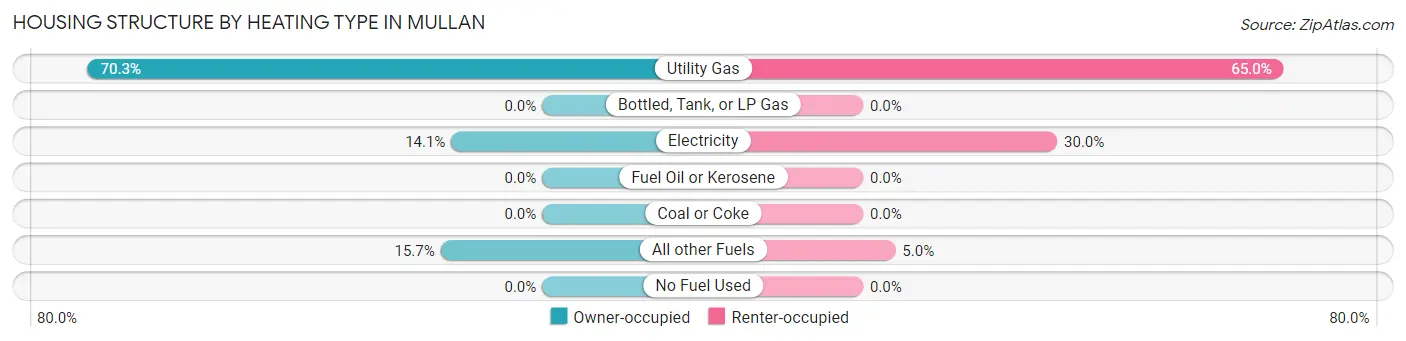
| Heating Type | Owner-occupied | Renter-occupied |
| Utility Gas | 170 (70.3%) | 39 (65.0%) |
| Bottled, Tank, or LP Gas | 0 (0.0%) | 0 (0.0%) |
| Electricity | 34 (14.1%) | 18 (30.0%) |
| Fuel Oil or Kerosene | 0 (0.0%) | 0 (0.0%) |
| Coal or Coke | 0 (0.0%) | 0 (0.0%) |
| All other Fuels | 38 (15.7%) | 3 (5.0%) |
| No Fuel Used | 0 (0.0%) | 0 (0.0%) |
| Total | 242 (100.0%) | 60 (100.0%) |
Household Vehicle Usage in Mullan
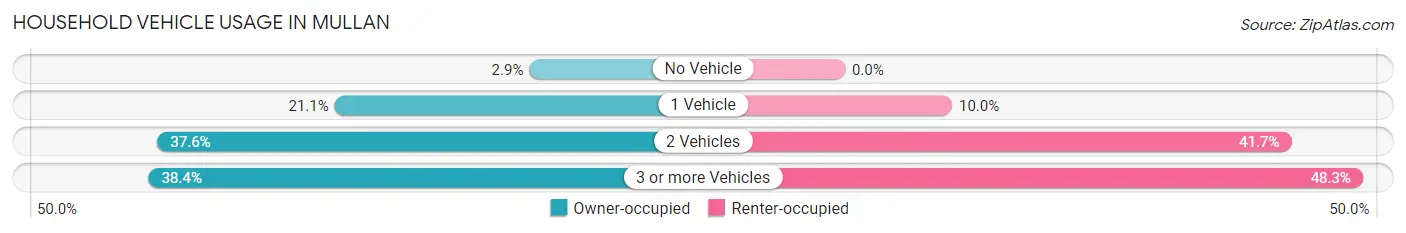
| Vehicles per Household | Owner-occupied | Renter-occupied |
| No Vehicle | 7 (2.9%) | 0 (0.0%) |
| 1 Vehicle | 51 (21.1%) | 6 (10.0%) |
| 2 Vehicles | 91 (37.6%) | 25 (41.7%) |
| 3 or more Vehicles | 93 (38.4%) | 29 (48.3%) |
| Total | 242 (100.0%) | 60 (100.0%) |
Real Estate & Mortgages in Mullan
Real Estate and Mortgage Overview in Mullan
| Characteristic | Without Mortgage | With Mortgage |
| Housing Units | 148 | 94 |
| Median Property Value | $142,900 | $178,600 |
| Median Household Income | $67,500 | $20 |
| Monthly Housing Costs | $424 | $0 |
| Real Estate Taxes | $1,279 | $4 |
Property Value by Mortgage Status in Mullan
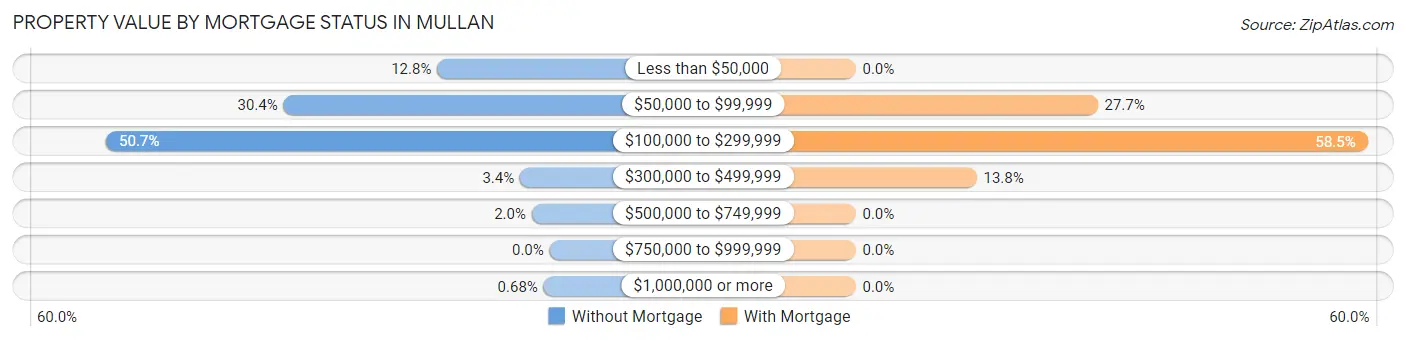
| Property Value | Without Mortgage | With Mortgage |
| Less than $50,000 | 19 (12.8%) | 0 (0.0%) |
| $50,000 to $99,999 | 45 (30.4%) | 26 (27.7%) |
| $100,000 to $299,999 | 75 (50.7%) | 55 (58.5%) |
| $300,000 to $499,999 | 5 (3.4%) | 13 (13.8%) |
| $500,000 to $749,999 | 3 (2.0%) | 0 (0.0%) |
| $750,000 to $999,999 | 0 (0.0%) | 0 (0.0%) |
| $1,000,000 or more | 1 (0.7%) | 0 (0.0%) |
| Total | 148 (100.0%) | 94 (100.0%) |
Household Income by Mortgage Status in Mullan
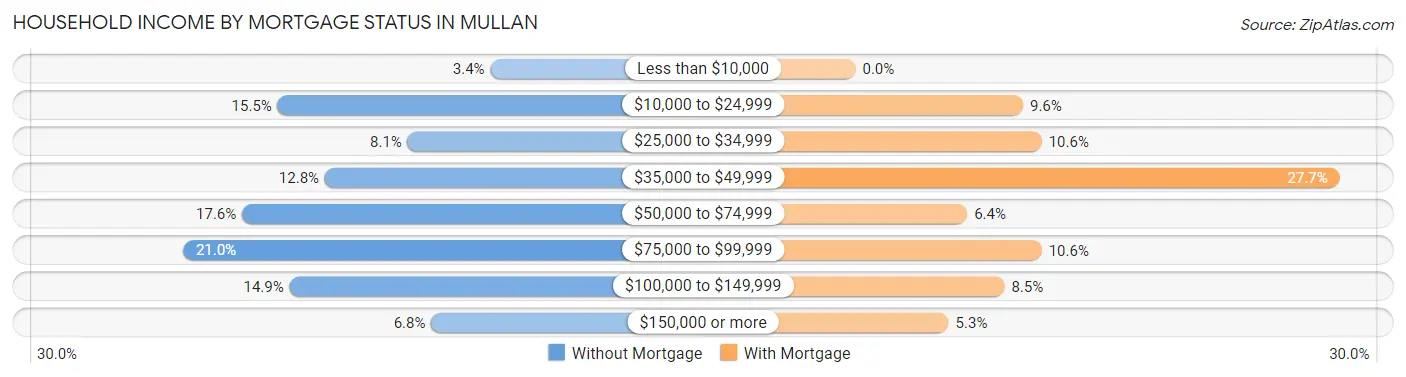
| Household Income | Without Mortgage | With Mortgage |
| Less than $10,000 | 5 (3.4%) | 0 (0.0%) |
| $10,000 to $24,999 | 23 (15.5%) | 9 (9.6%) |
| $25,000 to $34,999 | 12 (8.1%) | 10 (10.6%) |
| $35,000 to $49,999 | 19 (12.8%) | 26 (27.7%) |
| $50,000 to $74,999 | 26 (17.6%) | 6 (6.4%) |
| $75,000 to $99,999 | 31 (20.9%) | 10 (10.6%) |
| $100,000 to $149,999 | 22 (14.9%) | 8 (8.5%) |
| $150,000 or more | 10 (6.8%) | 5 (5.3%) |
| Total | 148 (100.0%) | 94 (100.0%) |
Property Value to Household Income Ratio in Mullan
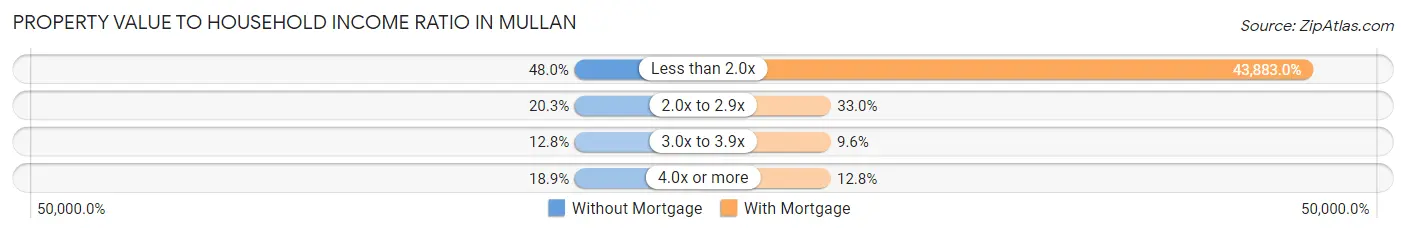
| Value-to-Income Ratio | Without Mortgage | With Mortgage |
| Less than 2.0x | 71 (48.0%) | 41,250 (43,883.0%) |
| 2.0x to 2.9x | 30 (20.3%) | 31 (33.0%) |
| 3.0x to 3.9x | 19 (12.8%) | 9 (9.6%) |
| 4.0x or more | 28 (18.9%) | 12 (12.8%) |
| Total | 148 (100.0%) | 94 (100.0%) |
Real Estate Taxes by Mortgage Status in Mullan
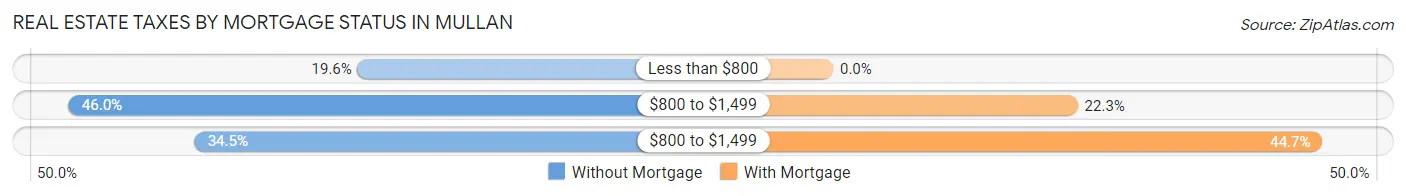
| Property Taxes | Without Mortgage | With Mortgage |
| Less than $800 | 29 (19.6%) | 0 (0.0%) |
| $800 to $1,499 | 68 (46.0%) | 21 (22.3%) |
| $800 to $1,499 | 51 (34.5%) | 42 (44.7%) |
| Total | 148 (100.0%) | 94 (100.0%) |
Health & Disability in Mullan
Health Insurance Coverage by Age in Mullan
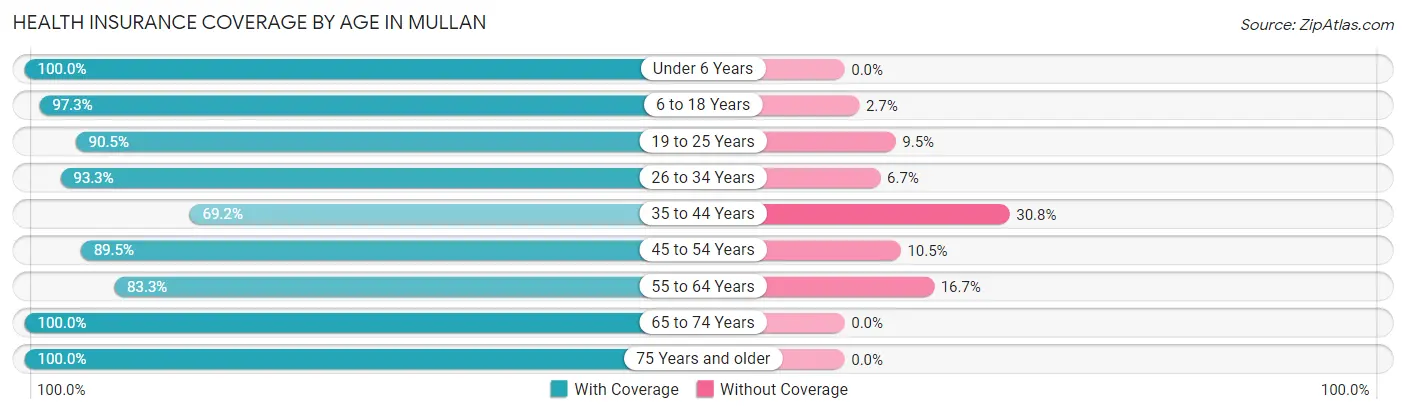
| Age Bracket | With Coverage | Without Coverage |
| Under 6 Years | 72 (100.0%) | 0 (0.0%) |
| 6 to 18 Years | 71 (97.3%) | 2 (2.7%) |
| 19 to 25 Years | 19 (90.5%) | 2 (9.5%) |
| 26 to 34 Years | 42 (93.3%) | 3 (6.7%) |
| 35 to 44 Years | 63 (69.2%) | 28 (30.8%) |
| 45 to 54 Years | 77 (89.5%) | 9 (10.5%) |
| 55 to 64 Years | 90 (83.3%) | 18 (16.7%) |
| 65 to 74 Years | 117 (100.0%) | 0 (0.0%) |
| 75 Years and older | 79 (100.0%) | 0 (0.0%) |
| Total | 630 (91.0%) | 62 (9.0%) |
Health Insurance Coverage by Citizenship Status in Mullan
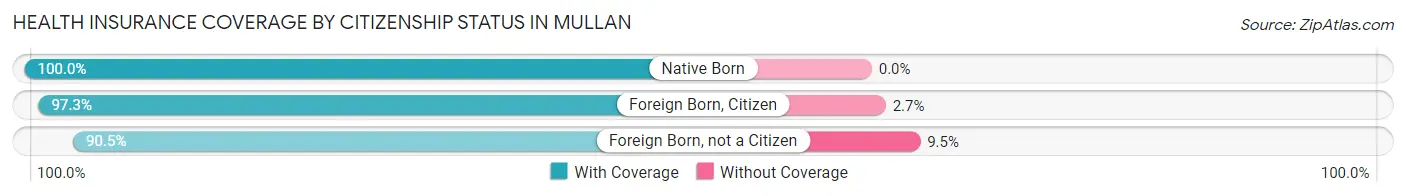
| Citizenship Status | With Coverage | Without Coverage |
| Native Born | 72 (100.0%) | 0 (0.0%) |
| Foreign Born, Citizen | 71 (97.3%) | 2 (2.7%) |
| Foreign Born, not a Citizen | 19 (90.5%) | 2 (9.5%) |
Health Insurance Coverage by Household Income in Mullan
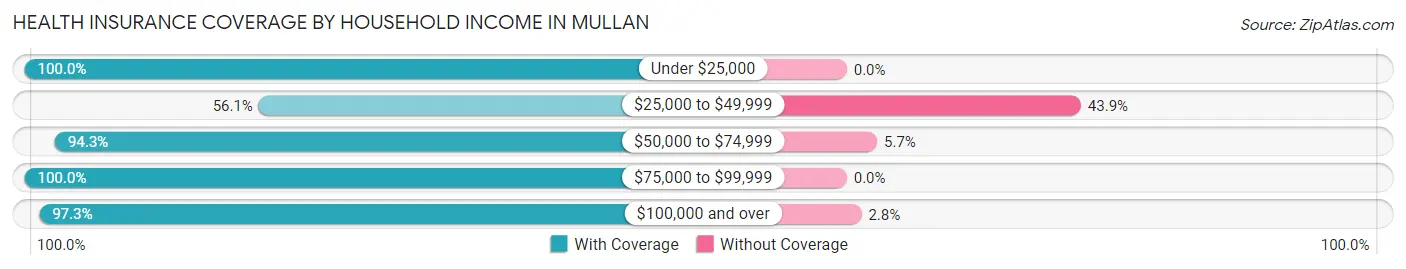
| Household Income | With Coverage | Without Coverage |
| Under $25,000 | 144 (100.0%) | 0 (0.0%) |
| $25,000 to $49,999 | 64 (56.1%) | 50 (43.9%) |
| $50,000 to $74,999 | 83 (94.3%) | 5 (5.7%) |
| $75,000 to $99,999 | 91 (100.0%) | 0 (0.0%) |
| $100,000 and over | 248 (97.3%) | 7 (2.8%) |
Public vs Private Health Insurance Coverage by Age in Mullan
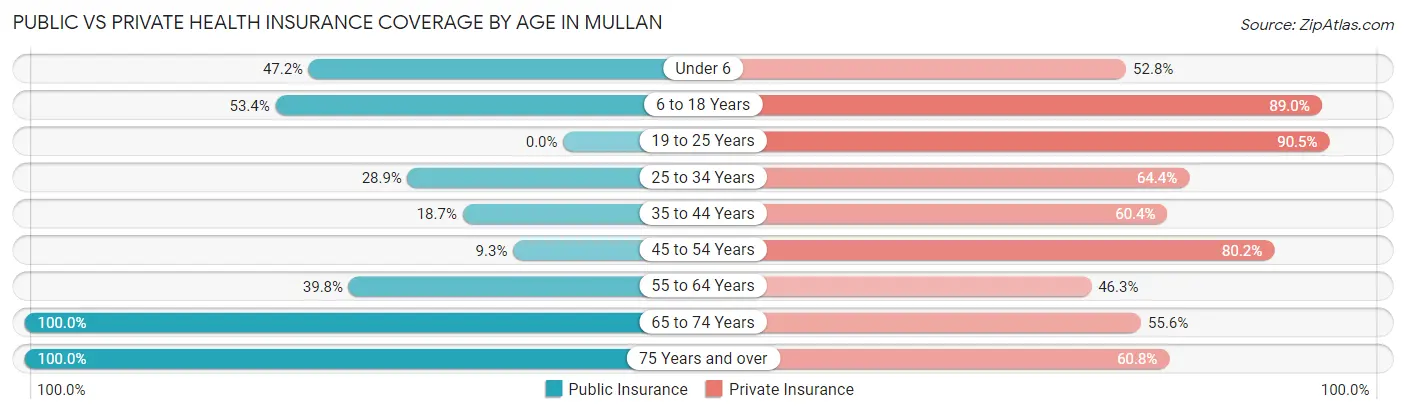
| Age Bracket | Public Insurance | Private Insurance |
| Under 6 | 34 (47.2%) | 38 (52.8%) |
| 6 to 18 Years | 39 (53.4%) | 65 (89.0%) |
| 19 to 25 Years | 0 (0.0%) | 19 (90.5%) |
| 25 to 34 Years | 13 (28.9%) | 29 (64.4%) |
| 35 to 44 Years | 17 (18.7%) | 55 (60.4%) |
| 45 to 54 Years | 8 (9.3%) | 69 (80.2%) |
| 55 to 64 Years | 43 (39.8%) | 50 (46.3%) |
| 65 to 74 Years | 117 (100.0%) | 65 (55.6%) |
| 75 Years and over | 79 (100.0%) | 48 (60.8%) |
| Total | 350 (50.6%) | 438 (63.3%) |
Disability Status by Sex by Age in Mullan
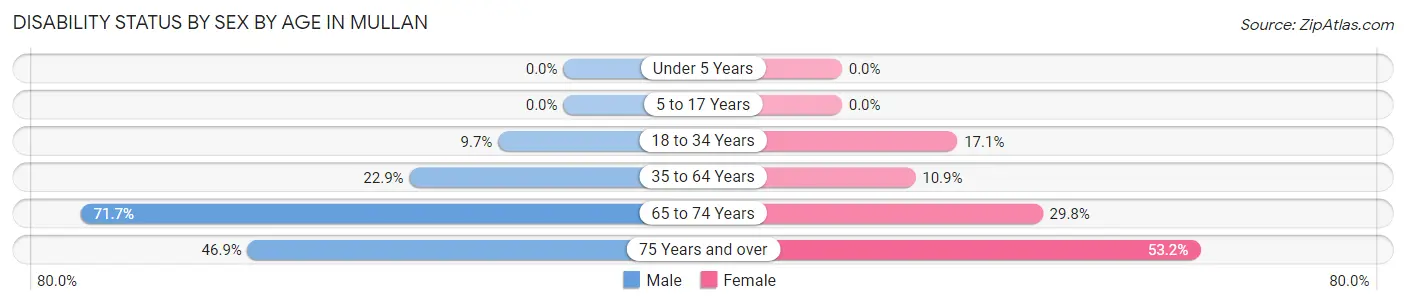
| Age Bracket | Male | Female |
| Under 5 Years | 0 (0.0%) | 0 (0.0%) |
| 5 to 17 Years | 0 (0.0%) | 0 (0.0%) |
| 18 to 34 Years | 3 (9.7%) | 6 (17.1%) |
| 35 to 64 Years | 40 (22.9%) | 12 (10.9%) |
| 65 to 74 Years | 43 (71.7%) | 17 (29.8%) |
| 75 Years and over | 15 (46.9%) | 25 (53.2%) |
Disability Class by Sex by Age in Mullan
Disability Class: Hearing Difficulty
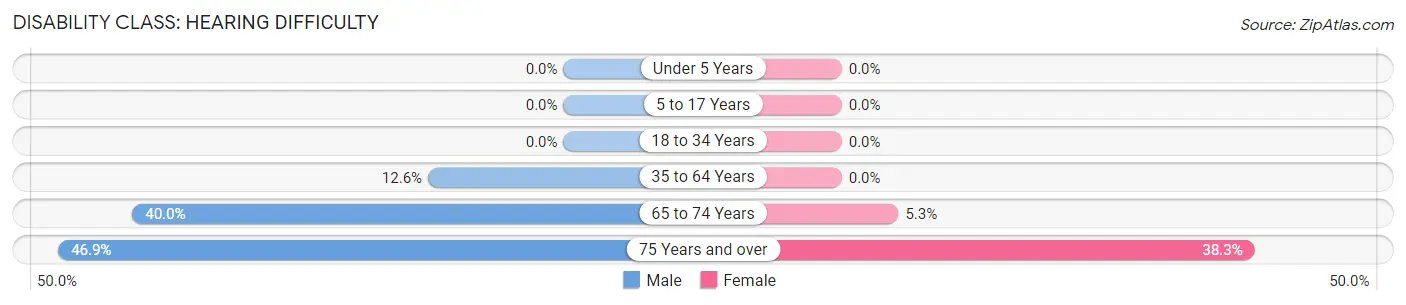
| Age Bracket | Male | Female |
| Under 5 Years | 0 (0.0%) | 0 (0.0%) |
| 5 to 17 Years | 0 (0.0%) | 0 (0.0%) |
| 18 to 34 Years | 0 (0.0%) | 0 (0.0%) |
| 35 to 64 Years | 22 (12.6%) | 0 (0.0%) |
| 65 to 74 Years | 24 (40.0%) | 3 (5.3%) |
| 75 Years and over | 15 (46.9%) | 18 (38.3%) |
Disability Class: Vision Difficulty
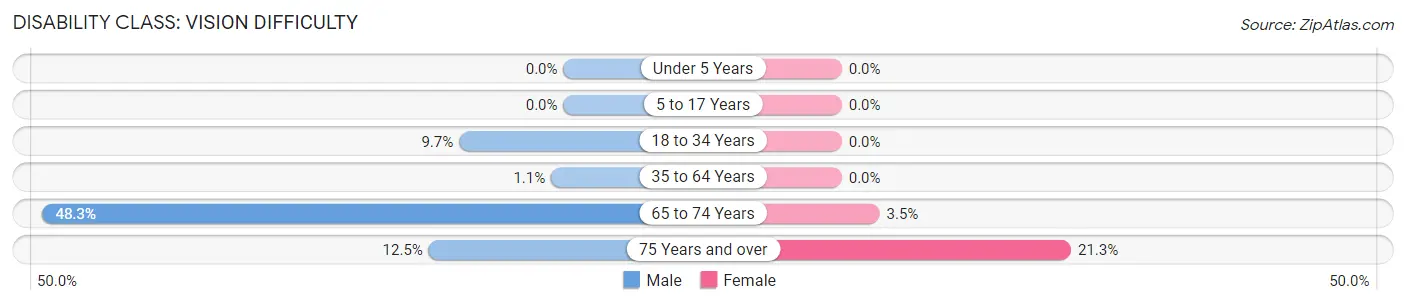
| Age Bracket | Male | Female |
| Under 5 Years | 0 (0.0%) | 0 (0.0%) |
| 5 to 17 Years | 0 (0.0%) | 0 (0.0%) |
| 18 to 34 Years | 3 (9.7%) | 0 (0.0%) |
| 35 to 64 Years | 2 (1.1%) | 0 (0.0%) |
| 65 to 74 Years | 29 (48.3%) | 2 (3.5%) |
| 75 Years and over | 4 (12.5%) | 10 (21.3%) |
Disability Class: Cognitive Difficulty
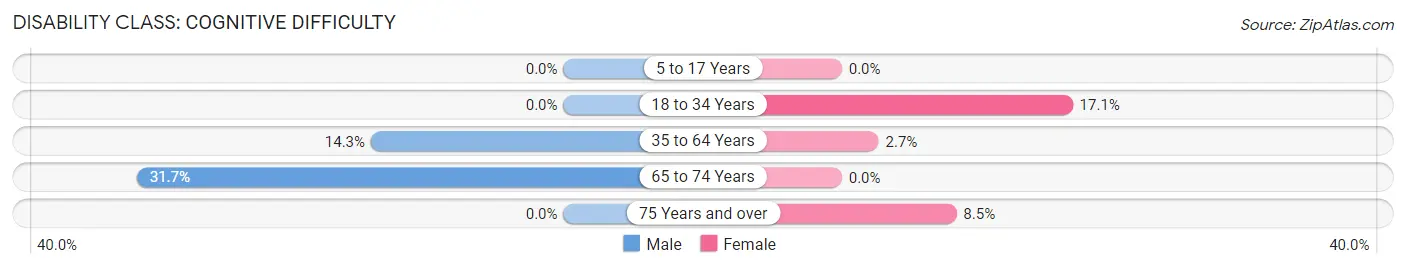
| Age Bracket | Male | Female |
| 5 to 17 Years | 0 (0.0%) | 0 (0.0%) |
| 18 to 34 Years | 0 (0.0%) | 6 (17.1%) |
| 35 to 64 Years | 25 (14.3%) | 3 (2.7%) |
| 65 to 74 Years | 19 (31.7%) | 0 (0.0%) |
| 75 Years and over | 0 (0.0%) | 4 (8.5%) |
Disability Class: Ambulatory Difficulty
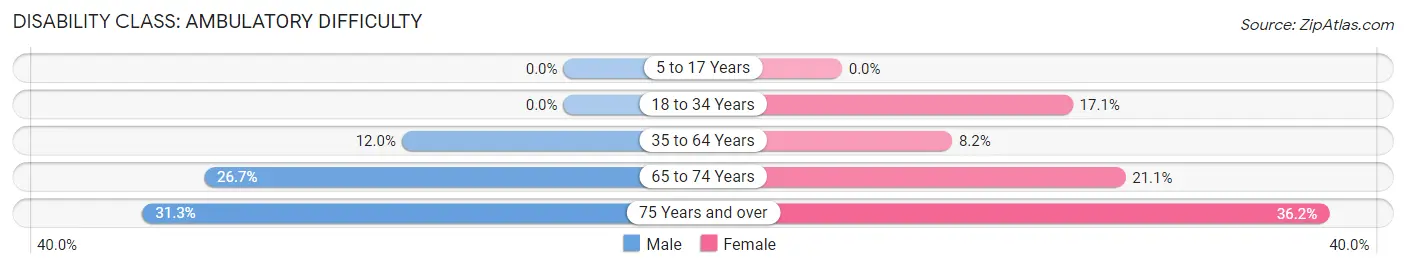
| Age Bracket | Male | Female |
| 5 to 17 Years | 0 (0.0%) | 0 (0.0%) |
| 18 to 34 Years | 0 (0.0%) | 6 (17.1%) |
| 35 to 64 Years | 21 (12.0%) | 9 (8.2%) |
| 65 to 74 Years | 16 (26.7%) | 12 (21.0%) |
| 75 Years and over | 10 (31.2%) | 17 (36.2%) |
Disability Class: Self-Care Difficulty
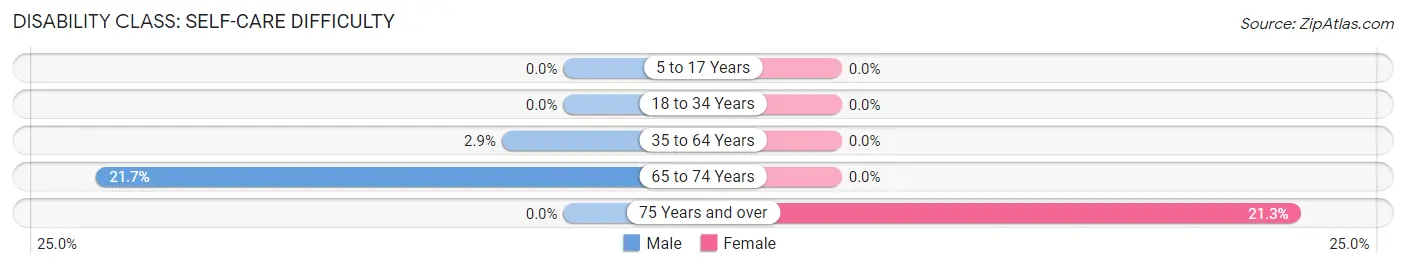
| Age Bracket | Male | Female |
| 5 to 17 Years | 0 (0.0%) | 0 (0.0%) |
| 18 to 34 Years | 0 (0.0%) | 0 (0.0%) |
| 35 to 64 Years | 5 (2.9%) | 0 (0.0%) |
| 65 to 74 Years | 13 (21.7%) | 0 (0.0%) |
| 75 Years and over | 0 (0.0%) | 10 (21.3%) |
Technology Access in Mullan
Computing Device Access in Mullan
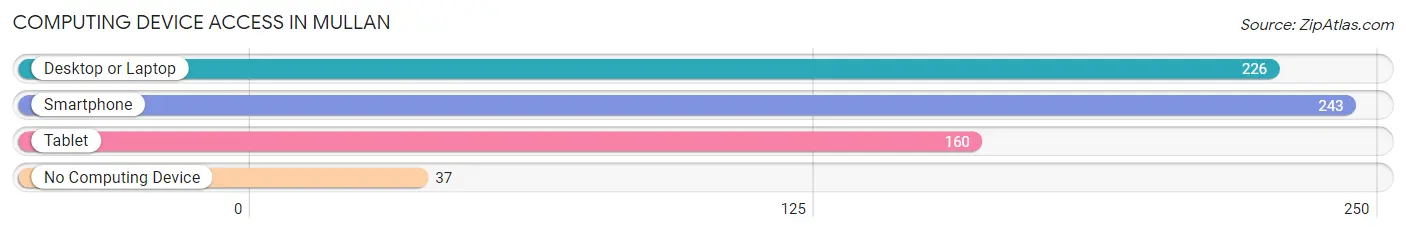
| Device Type | # Households | % Households |
| Desktop or Laptop | 226 | 74.8% |
| Smartphone | 243 | 80.5% |
| Tablet | 160 | 53.0% |
| No Computing Device | 37 | 12.2% |
| Total | 302 | 100.0% |
Internet Access in Mullan
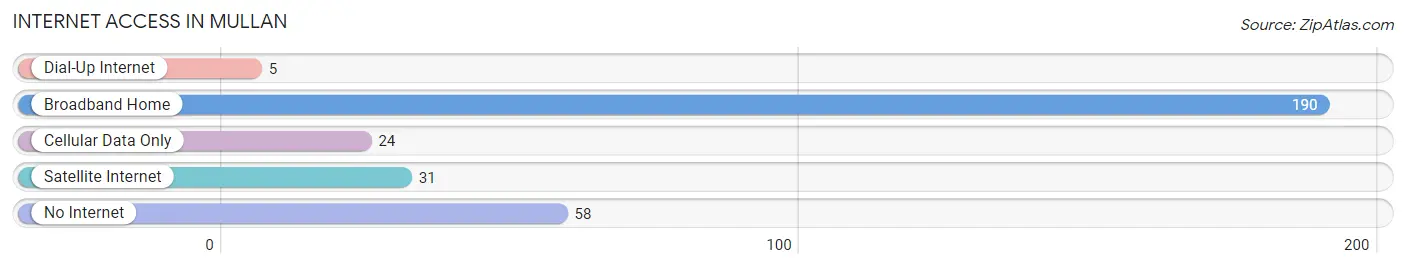
| Internet Type | # Households | % Households |
| Dial-Up Internet | 5 | 1.7% |
| Broadband Home | 190 | 62.9% |
| Cellular Data Only | 24 | 8.0% |
| Satellite Internet | 31 | 10.3% |
| No Internet | 58 | 19.2% |
| Total | 302 | 100.0% |
Mullan Summary
Mullan is a small city located in Shoshone County, Idaho, United States. It is situated in the Silver Valley region of the Rocky Mountains, and is the county seat of Shoshone County. The city has a population of 890, as of the 2010 census.
Geography
Mullan is located at an elevation of 4,945 feet (1,507 m) in the Silver Valley region of the Rocky Mountains. The city is situated in the Coeur d'Alene National Forest, and is surrounded by mountains and forests. The city is located on the banks of the North Fork of the Coeur d'Alene River, and is approximately 20 miles (32 km) south of the city of Coeur d'Alene.
History
Mullan was founded in 1884 by John Mullan, a U.S. Army engineer who was tasked with building a road from Fort Walla Walla, Washington to Fort Benton, Montana. The road, which was completed in 1862, was later named the Mullan Road in his honor. The city was officially incorporated in 1889, and was named after John Mullan.
Economy
Mullan's economy is largely based on mining and timber. The city is home to several large mining operations, including the Lucky Friday Mine, which is the largest silver mine in the United States. The city is also home to several timber companies, including the Potlatch Corporation, which is the largest private landowner in the state of Idaho.
Demographics
As of the 2010 census, there were 890 people, 393 households, and 233 families residing in the city. The population density was 1,092.3 people per square mile (421.7/km2). There were 441 housing units at an average density of 545.3 per square mile (210.7/km2). The racial makeup of the city was 95.3% White, 0.3% African American, 0.7% Native American, 0.3% Asian, 0.1% Pacific Islander, 0.7% from other races, and 2.6% from two or more races. Hispanic or Latino of any race were 2.2% of the population.
There were 393 households, out of which 24.3% had children under the age of 18 living with them, 44.2% were married couples living together, 10.7% had a female householder with no husband present, and 39.7% were non-families. 34.3% of all households were made up of individuals, and 14.2% had someone living alone who was 65 years of age or older. The average household size was 2.26 and the average family size was 2.90.
In the city, the population was spread out, with 22.7% under the age of 18, 7.2% from 18 to 24, 24.2% from 25 to 44, 28.2% from 45 to 64, and 17.7% who were 65 years of age or older. The median age was 42 years. For every 100 females, there were 97.2 males. For every 100 females age 18 and over, there were 94.2 males.
The median income for a household in the city was $30,000, and the median income for a family was $36,250. Males had a median income of $30,000 versus $20,000 for females. The per capita income for the city was $15,945. About 11.2% of families and 14.2% of the population were below the poverty line, including 19.2% of those under age 18 and 8.3% of those age 65 or over.
Common Questions
What is Per Capita Income in Mullan?
Per Capita income in Mullan is $32,978.
What is the Median Family Income in Mullan?
Median Family Income in Mullan is $81,250.
What is the Median Household income in Mullan?
Median Household Income in Mullan is $56,250.
What is Income or Wage Gap in Mullan?
Income or Wage Gap in Mullan is 39.7%.
Women in Mullan earn 60.3 cents for every dollar earned by a man.
What is Inequality or Gini Index in Mullan?
Inequality or Gini Index in Mullan is 0.45.
What is the Total Population of Mullan?
Total Population of Mullan is 692.
What is the Total Male Population of Mullan?
Total Male Population of Mullan is 326.
What is the Total Female Population of Mullan?
Total Female Population of Mullan is 366.
What is the Ratio of Males per 100 Females in Mullan?
There are 89.07 Males per 100 Females in Mullan.
What is the Ratio of Females per 100 Males in Mullan?
There are 112.27 Females per 100 Males in Mullan.
What is the Median Population Age in Mullan?
Median Population Age in Mullan is 47.7 Years.
What is the Average Family Size in Mullan
Average Family Size in Mullan is 3.1 People.
What is the Average Household Size in Mullan
Average Household Size in Mullan is 2.3 People.
How Large is the Labor Force in Mullan?
There are 259 People in the Labor Forcein in Mullan.
What is the Percentage of People in the Labor Force in Mullan?
47.2% of People are in the Labor Force in Mullan.
What is the Unemployment Rate in Mullan?
Unemployment Rate in Mullan is 3.9%.