Moyie Springs, ID Map & Demographics
Moyie Springs Map
Moyie Springs Overview
$26,705
PER CAPITA INCOME
$59,819
AVG FAMILY INCOME
$59,096
AVG HOUSEHOLD INCOME
63.7%
WAGE / INCOME GAP [ % ]
36.3¢/ $1
WAGE / INCOME GAP [ $ ]
0.47
INEQUALITY / GINI INDEX
1,293
TOTAL POPULATION
676
MALE POPULATION
617
FEMALE POPULATION
109.56
MALES / 100 FEMALES
91.27
FEMALES / 100 MALES
40.7
MEDIAN AGE
2.9
AVG FAMILY SIZE
2.7
AVG HOUSEHOLD SIZE
431
LABOR FORCE [ PEOPLE ]
43.9%
PERCENT IN LABOR FORCE
6.3%
UNEMPLOYMENT RATE
Moyie Springs Zip Codes
Moyie Springs Area Codes
Income in Moyie Springs
Income Overview in Moyie Springs
Per Capita Income in Moyie Springs is $26,705, while median incomes of families and households are $59,819 and $59,096 respectively.
| Characteristic | Number | Measure |
| Per Capita Income | 1,293 | $26,705 |
| Median Family Income | 404 | $59,819 |
| Mean Family Income | 404 | $82,932 |
| Median Household Income | 478 | $59,096 |
| Mean Household Income | 478 | $76,351 |
| Income Deficit | 404 | $0 |
| Wage / Income Gap (%) | 1,293 | 63.74% |
| Wage / Income Gap ($) | 1,293 | 36.26¢ per $1 |
| Gini / Inequality Index | 1,293 | 0.47 |
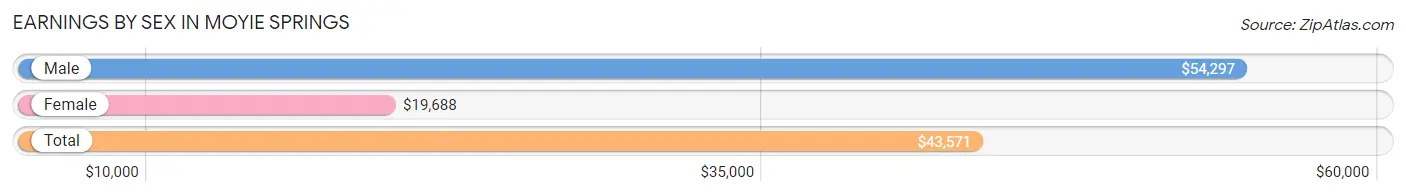
Earnings by Sex in Moyie Springs
Average Earnings in Moyie Springs are $43,571, $54,297 for men and $19,688 for women, a difference of 63.7%.
| Sex | Number | Average Earnings |
| Male | 293 (64.2%) | $54,297 |
| Female | 163 (35.7%) | $19,688 |
| Total | 456 (100.0%) | $43,571 |
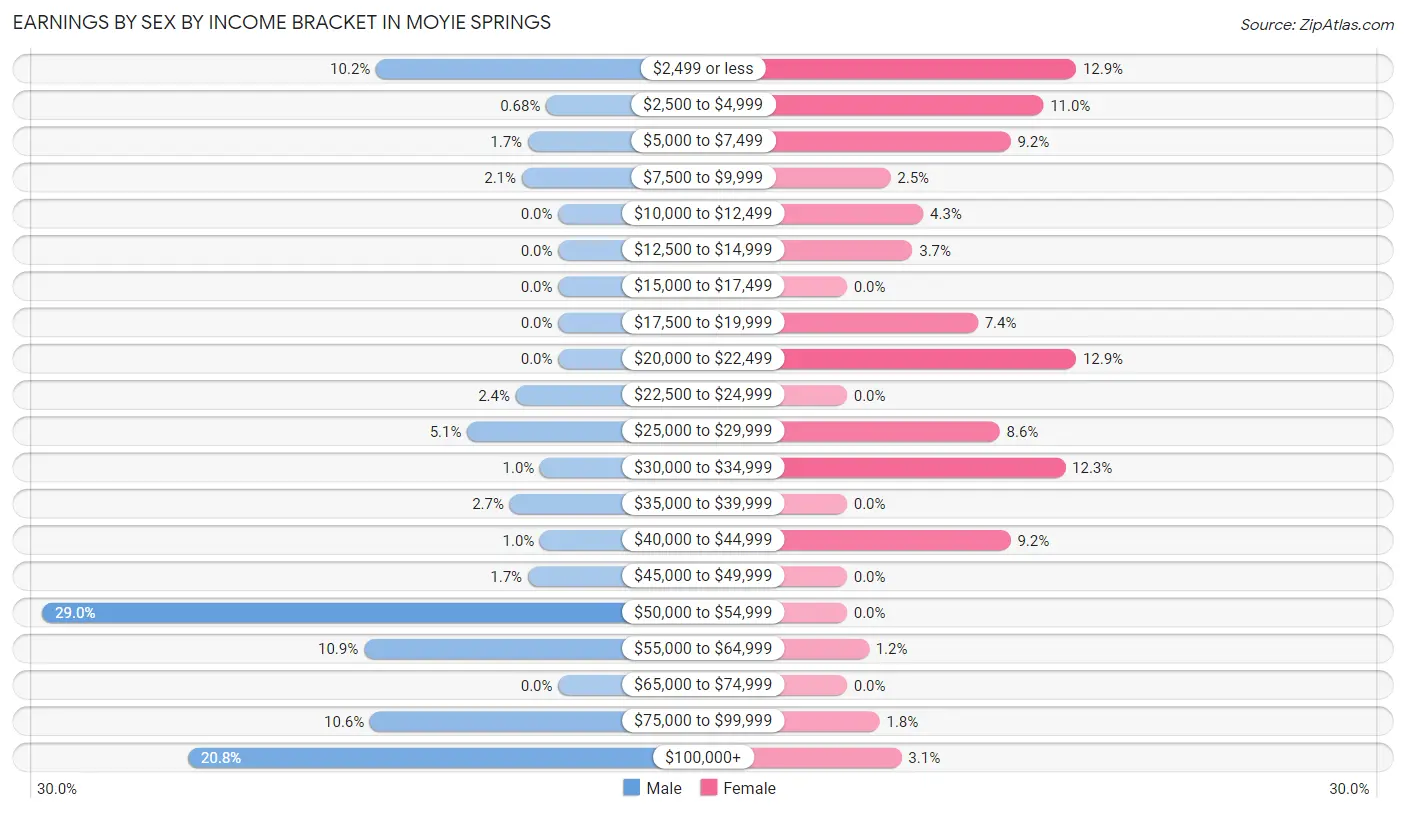
Earnings by Sex by Income Bracket in Moyie Springs
The most common earnings brackets in Moyie Springs are $50,000 to $54,999 for men (85 | 29.0%) and $2,499 or less for women (21 | 12.9%).
| Income | Male | Female |
| $2,499 or less | 30 (10.2%) | 21 (12.9%) |
| $2,500 to $4,999 | 2 (0.7%) | 18 (11.0%) |
| $5,000 to $7,499 | 5 (1.7%) | 15 (9.2%) |
| $7,500 to $9,999 | 6 (2.1%) | 4 (2.5%) |
| $10,000 to $12,499 | 0 (0.0%) | 7 (4.3%) |
| $12,500 to $14,999 | 0 (0.0%) | 6 (3.7%) |
| $15,000 to $17,499 | 0 (0.0%) | 0 (0.0%) |
| $17,500 to $19,999 | 0 (0.0%) | 12 (7.4%) |
| $20,000 to $22,499 | 0 (0.0%) | 21 (12.9%) |
| $22,500 to $24,999 | 7 (2.4%) | 0 (0.0%) |
| $25,000 to $29,999 | 15 (5.1%) | 14 (8.6%) |
| $30,000 to $34,999 | 3 (1.0%) | 20 (12.3%) |
| $35,000 to $39,999 | 8 (2.7%) | 0 (0.0%) |
| $40,000 to $44,999 | 3 (1.0%) | 15 (9.2%) |
| $45,000 to $49,999 | 5 (1.7%) | 0 (0.0%) |
| $50,000 to $54,999 | 85 (29.0%) | 0 (0.0%) |
| $55,000 to $64,999 | 32 (10.9%) | 2 (1.2%) |
| $65,000 to $74,999 | 0 (0.0%) | 0 (0.0%) |
| $75,000 to $99,999 | 31 (10.6%) | 3 (1.8%) |
| $100,000+ | 61 (20.8%) | 5 (3.1%) |
| Total | 293 (100.0%) | 163 (100.0%) |
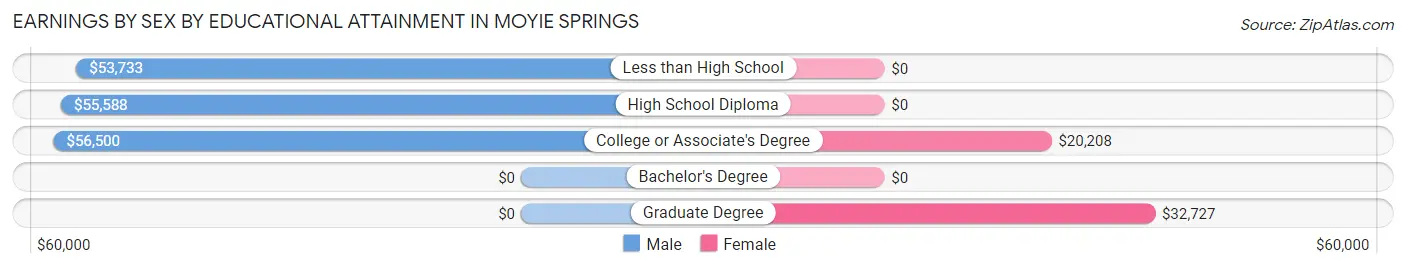
Earnings by Sex by Educational Attainment in Moyie Springs
Average earnings in Moyie Springs are $54,625 for men and $20,060 for women, a difference of 63.3%. Men with an educational attainment of college or associate's degree enjoy the highest average annual earnings of $56,500, while those with less than high school education earn the least with $53,733. Women with an educational attainment of graduate degree earn the most with the average annual earnings of $32,727, while those with college or associate's degree education have the smallest earnings of $20,208.
| Educational Attainment | Male Income | Female Income |
| Less than High School | $53,733 | $0 |
| High School Diploma | $55,588 | $0 |
| College or Associate's Degree | $56,500 | $20,208 |
| Bachelor's Degree | - | - |
| Graduate Degree | - | - |
| Total | $54,625 | $20,060 |
Family Income in Moyie Springs
Family Income Brackets in Moyie Springs
According to the Moyie Springs family income data, there are 135 families falling into the $50,000 to $74,999 income range, which is the most common income bracket and makes up 33.4% of all families. Conversely, the $15,000 to $24,999 income bracket is the least frequent group with only 3 families (0.7%) belonging to this category.
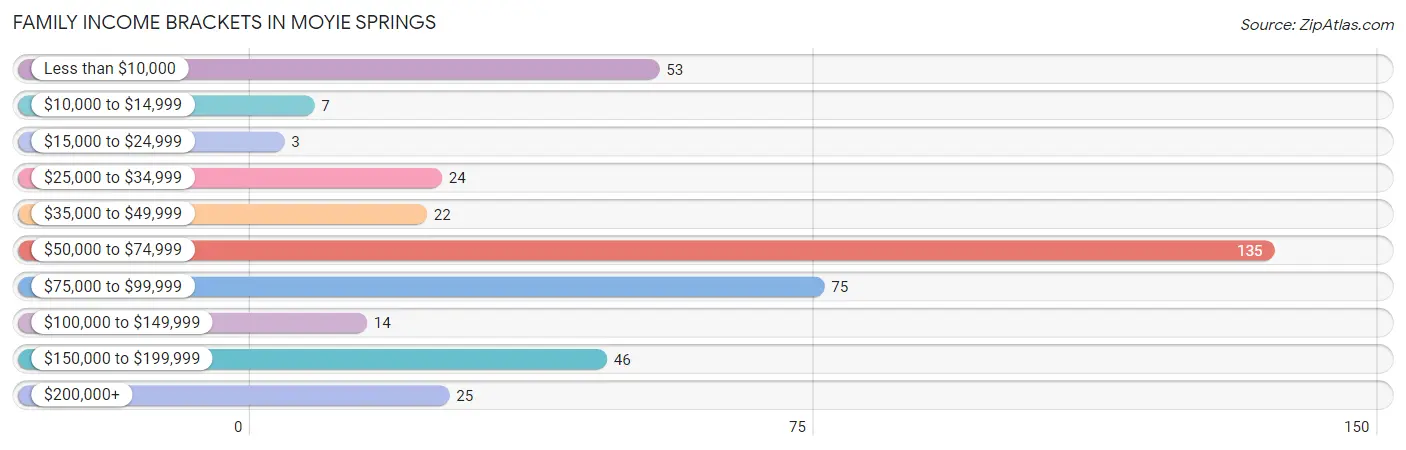
| Income Bracket | # Families | % Families |
| Less than $10,000 | 53 | 13.1% |
| $10,000 to $14,999 | 7 | 1.7% |
| $15,000 to $24,999 | 3 | 0.7% |
| $25,000 to $34,999 | 24 | 5.9% |
| $35,000 to $49,999 | 22 | 5.4% |
| $50,000 to $74,999 | 135 | 33.4% |
| $75,000 to $99,999 | 75 | 18.6% |
| $100,000 to $149,999 | 14 | 3.5% |
| $150,000 to $199,999 | 46 | 11.4% |
| $200,000+ | 25 | 6.2% |
Family Income by Famaliy Size in Moyie Springs
6-person families (28 | 6.9%) account for the highest median family income in Moyie Springs with $159,000 per family, while 2-person families (265 | 65.6%) have the highest median income of $29,725 per family member.
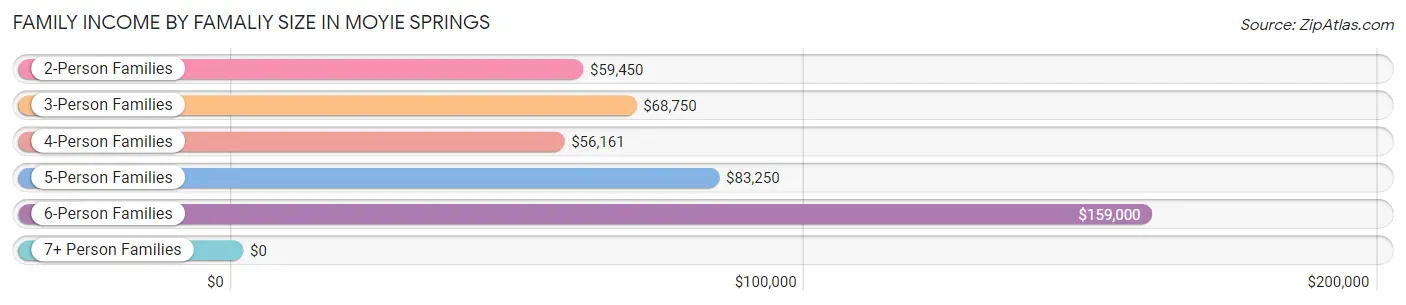
| Income Bracket | # Families | Median Income |
| 2-Person Families | 265 (65.6%) | $59,450 |
| 3-Person Families | 29 (7.2%) | $68,750 |
| 4-Person Families | 43 (10.6%) | $56,161 |
| 5-Person Families | 19 (4.7%) | $83,250 |
| 6-Person Families | 28 (6.9%) | $159,000 |
| 7+ Person Families | 20 (5.0%) | $0 |
| Total | 404 (100.0%) | $59,819 |
Family Income by Number of Earners in Moyie Springs
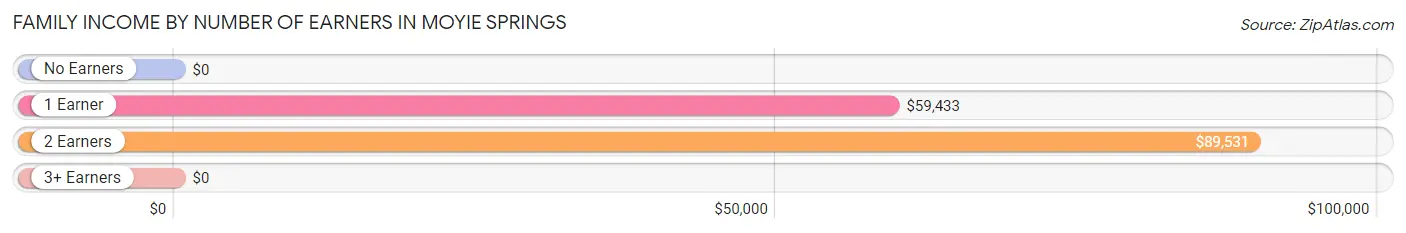
| Number of Earners | # Families | Median Income |
| No Earners | 117 (29.0%) | $0 |
| 1 Earner | 192 (47.5%) | $59,433 |
| 2 Earners | 71 (17.6%) | $89,531 |
| 3+ Earners | 24 (5.9%) | $0 |
| Total | 404 (100.0%) | $59,819 |
Household Income in Moyie Springs
Household Income Brackets in Moyie Springs
With 149 households falling in the category, the $50,000 to $74,999 income range is the most frequent in Moyie Springs, accounting for 31.2% of all households. In contrast, only 11 households (2.3%) fall into the $15,000 to $24,999 income bracket, making it the least populous group.
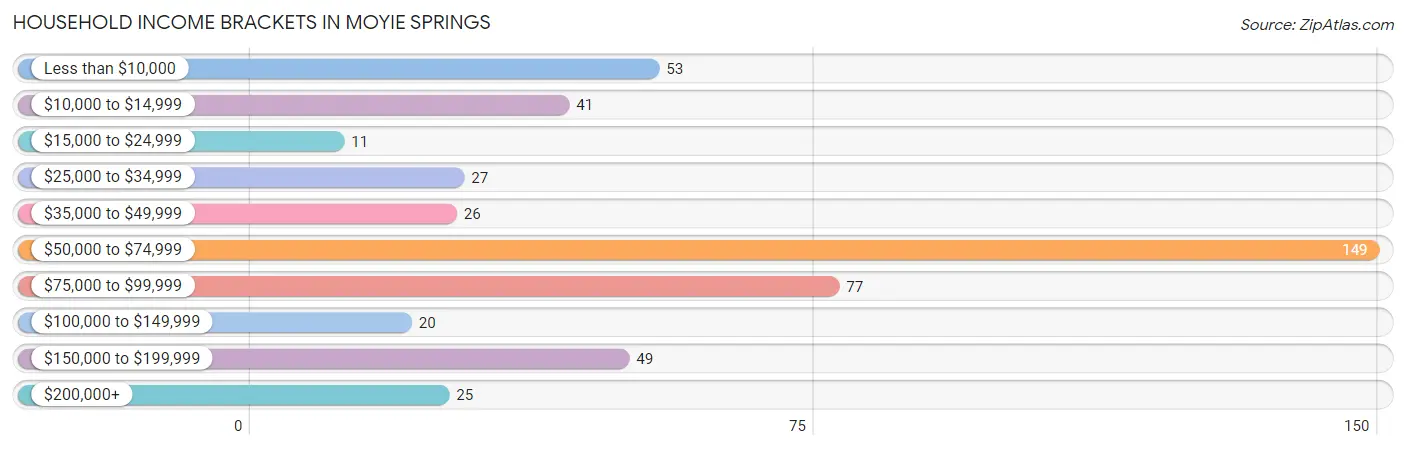
| Income Bracket | # Households | % Households |
| Less than $10,000 | 53 | 11.1% |
| $10,000 to $14,999 | 41 | 8.6% |
| $15,000 to $24,999 | 11 | 2.3% |
| $25,000 to $34,999 | 27 | 5.6% |
| $35,000 to $49,999 | 26 | 5.4% |
| $50,000 to $74,999 | 149 | 31.2% |
| $75,000 to $99,999 | 77 | 16.1% |
| $100,000 to $149,999 | 20 | 4.2% |
| $150,000 to $199,999 | 49 | 10.3% |
| $200,000+ | 25 | 5.2% |
Household Income by Householder Age in Moyie Springs
The median household income in Moyie Springs is $59,096, with the highest median household income of $59,417 found in the 45 to 64 years age bracket for the primary householder. A total of 167 households (34.9%) fall into this category.
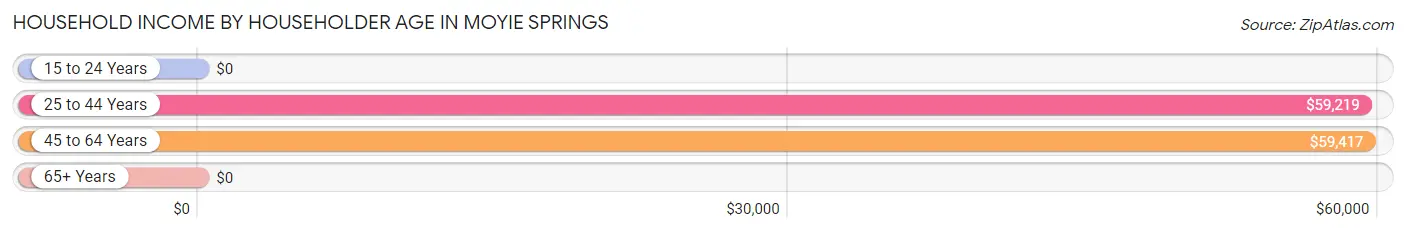
| Income Bracket | # Households | Median Income |
| 15 to 24 Years | 0 (0.0%) | $0 |
| 25 to 44 Years | 131 (27.4%) | $59,219 |
| 45 to 64 Years | 167 (34.9%) | $59,417 |
| 65+ Years | 180 (37.7%) | $0 |
| Total | 478 (100.0%) | $59,096 |
Poverty in Moyie Springs
Income Below Poverty by Sex and Age in Moyie Springs
With 18.8% poverty level for males and 19.3% for females among the residents of Moyie Springs, 75 year old and over males and 16 and 17 year old females are the most vulnerable to poverty, with 47 males (95.9%) and 7 females (100.0%) in their respective age groups living below the poverty level.
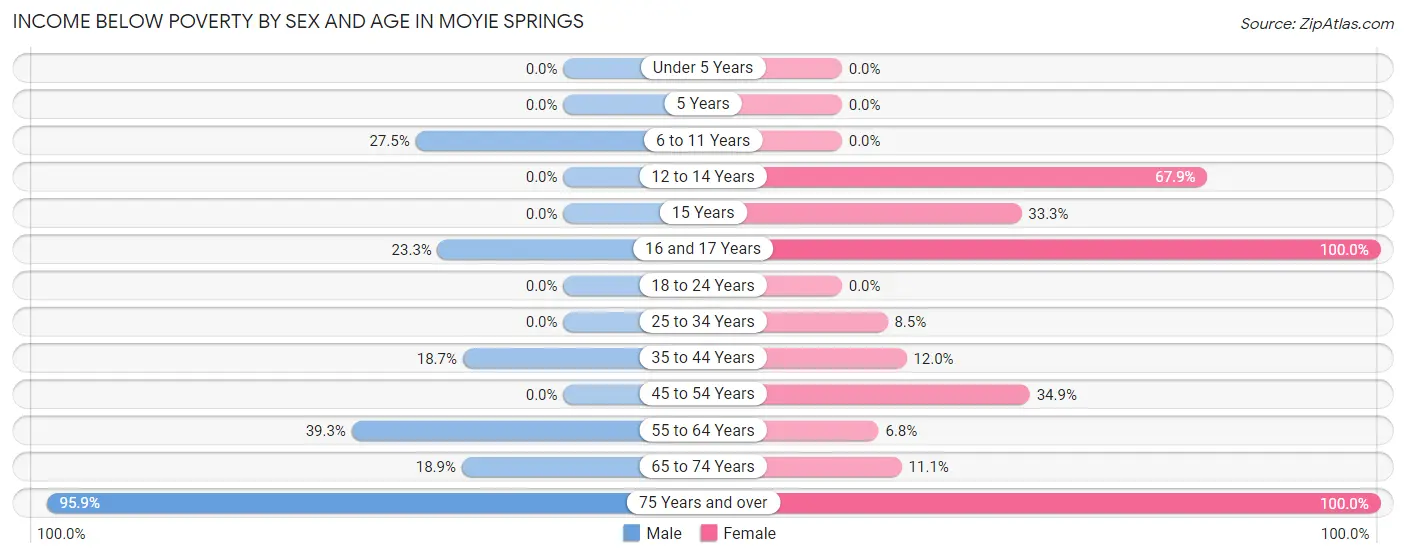
| Age Bracket | Male | Female |
| Under 5 Years | 0 (0.0%) | 0 (0.0%) |
| 5 Years | 0 (0.0%) | 0 (0.0%) |
| 6 to 11 Years | 14 (27.5%) | 0 (0.0%) |
| 12 to 14 Years | 0 (0.0%) | 19 (67.9%) |
| 15 Years | 0 (0.0%) | 5 (33.3%) |
| 16 and 17 Years | 7 (23.3%) | 7 (100.0%) |
| 18 to 24 Years | 0 (0.0%) | 0 (0.0%) |
| 25 to 34 Years | 0 (0.0%) | 5 (8.5%) |
| 35 to 44 Years | 14 (18.7%) | 9 (12.0%) |
| 45 to 54 Years | 0 (0.0%) | 15 (34.9%) |
| 55 to 64 Years | 22 (39.3%) | 6 (6.8%) |
| 65 to 74 Years | 23 (18.9%) | 7 (11.1%) |
| 75 Years and over | 47 (95.9%) | 46 (100.0%) |
| Total | 127 (18.8%) | 119 (19.3%) |
Income Above Poverty by Sex and Age in Moyie Springs
According to the poverty statistics in Moyie Springs, males aged under 5 years and females aged under 5 years are the age groups that are most secure financially, with 100.0% of males and 100.0% of females in these age groups living above the poverty line.
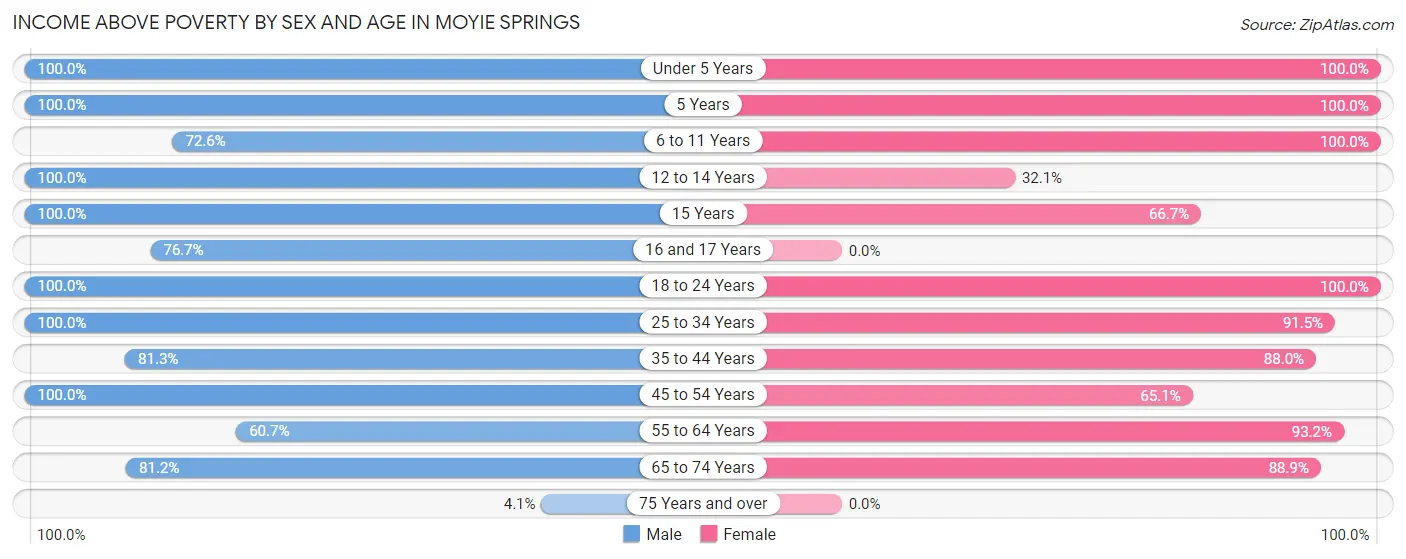
| Age Bracket | Male | Female |
| Under 5 Years | 63 (100.0%) | 39 (100.0%) |
| 5 Years | 14 (100.0%) | 10 (100.0%) |
| 6 to 11 Years | 37 (72.6%) | 57 (100.0%) |
| 12 to 14 Years | 24 (100.0%) | 9 (32.1%) |
| 15 Years | 11 (100.0%) | 10 (66.7%) |
| 16 and 17 Years | 23 (76.7%) | 0 (0.0%) |
| 18 to 24 Years | 30 (100.0%) | 87 (100.0%) |
| 25 to 34 Years | 44 (100.0%) | 54 (91.5%) |
| 35 to 44 Years | 61 (81.3%) | 66 (88.0%) |
| 45 to 54 Years | 107 (100.0%) | 28 (65.1%) |
| 55 to 64 Years | 34 (60.7%) | 82 (93.2%) |
| 65 to 74 Years | 99 (81.1%) | 56 (88.9%) |
| 75 Years and over | 2 (4.1%) | 0 (0.0%) |
| Total | 549 (81.2%) | 498 (80.7%) |
Income Below Poverty Among Married-Couple Families in Moyie Springs
The poverty statistics for married-couple families in Moyie Springs show that 21.9% or 67 of the total 306 families live below the poverty line. Families with no children have the highest poverty rate of 28.3%, comprising of 54 families. On the other hand, families with 5 or more children have the lowest poverty rate of 0.0%, which includes 0 families.
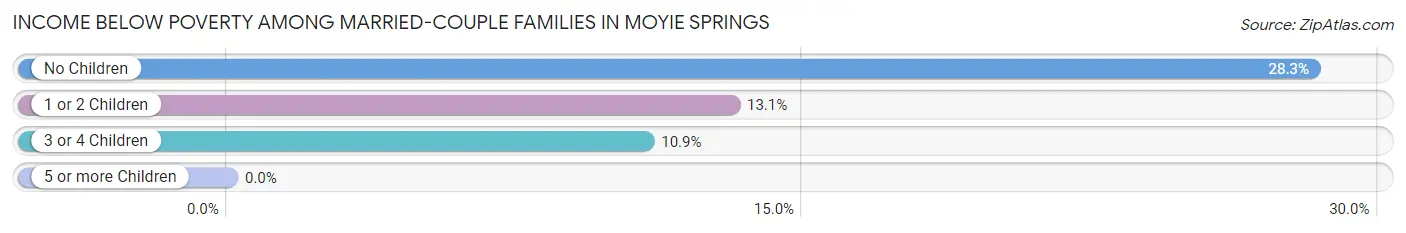
| Children | Above Poverty | Below Poverty |
| No Children | 137 (71.7%) | 54 (28.3%) |
| 1 or 2 Children | 53 (86.9%) | 8 (13.1%) |
| 3 or 4 Children | 41 (89.1%) | 5 (10.9%) |
| 5 or more Children | 8 (100.0%) | 0 (0.0%) |
| Total | 239 (78.1%) | 67 (21.9%) |
Income Below Poverty Among Single-Parent Households in Moyie Springs
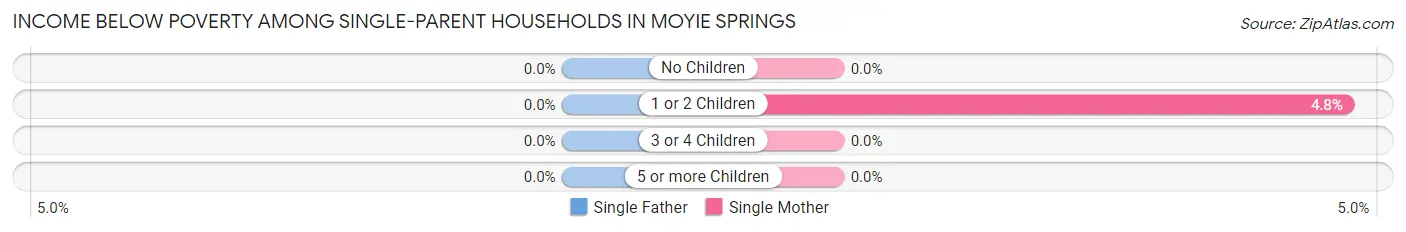
| Children | Single Father | Single Mother |
| No Children | 0 (0.0%) | 0 (0.0%) |
| 1 or 2 Children | 0 (0.0%) | 1 (4.8%) |
| 3 or 4 Children | 0 (0.0%) | 0 (0.0%) |
| 5 or more Children | 0 (0.0%) | 0 (0.0%) |
| Total | 0 (0.0%) | 1 (4.8%) |
Income Below Poverty Among Married-Couple vs Single-Parent Households in Moyie Springs
The poverty data for Moyie Springs shows that 67 of the married-couple family households (21.9%) and 1 of the single-parent households (1.0%) are living below the poverty level. Within the married-couple family households, those with no children have the highest poverty rate, with 54 households (28.3%) falling below the poverty line. Among the single-parent households, those with 1 or 2 children have the highest poverty rate, with 1 household (4.8%) living below poverty.
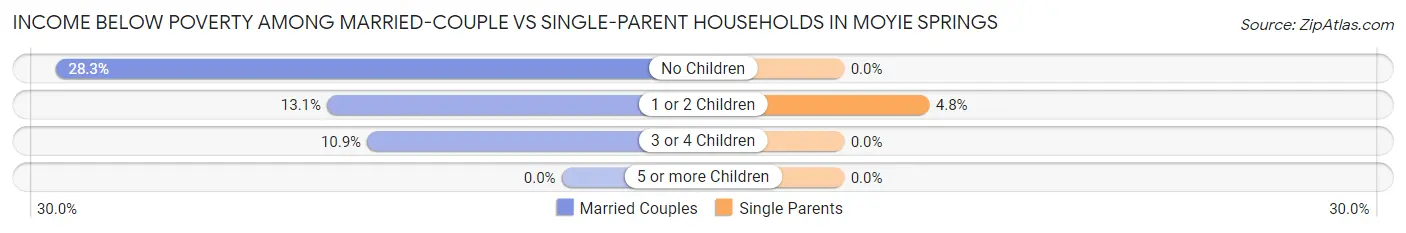
| Children | Married-Couple Families | Single-Parent Households |
| No Children | 54 (28.3%) | 0 (0.0%) |
| 1 or 2 Children | 8 (13.1%) | 1 (4.8%) |
| 3 or 4 Children | 5 (10.9%) | 0 (0.0%) |
| 5 or more Children | 0 (0.0%) | 0 (0.0%) |
| Total | 67 (21.9%) | 1 (1.0%) |
Race in Moyie Springs
The most populous races in Moyie Springs are White / Caucasian (1,221 | 94.4%), Two or more Races (56 | 4.3%), and Hispanic or Latino (21 | 1.6%).
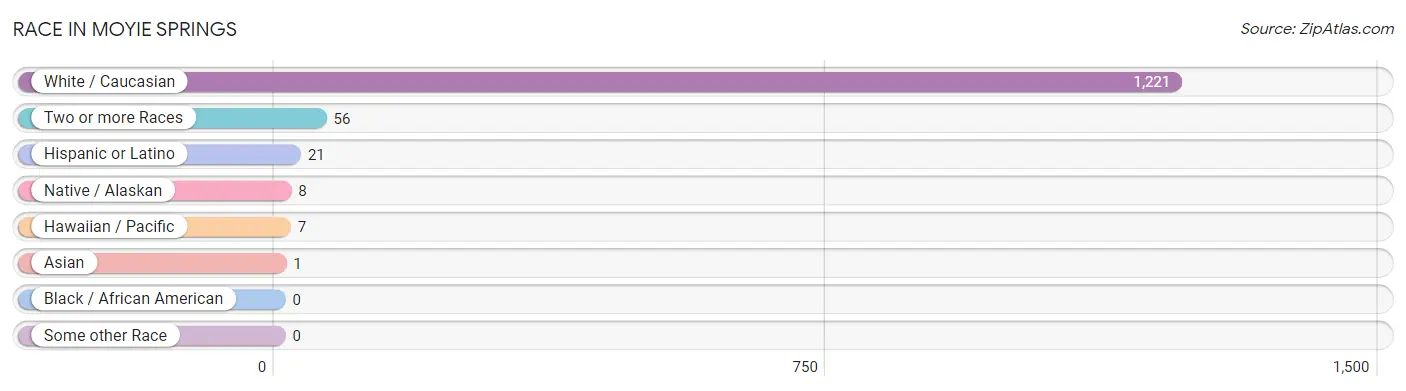
| Race | # Population | % Population |
| Asian | 1 | 0.1% |
| Black / African American | 0 | 0.0% |
| Hawaiian / Pacific | 7 | 0.5% |
| Hispanic or Latino | 21 | 1.6% |
| Native / Alaskan | 8 | 0.6% |
| White / Caucasian | 1,221 | 94.4% |
| Two or more Races | 56 | 4.3% |
| Some other Race | 0 | 0.0% |
| Total | 1,293 | 100.0% |
Ancestry in Moyie Springs
The most populous ancestries reported in Moyie Springs are English (219 | 16.9%), American (202 | 15.6%), German (189 | 14.6%), Irish (152 | 11.8%), and European (40 | 3.1%), together accounting for 62.0% of all Moyie Springs residents.
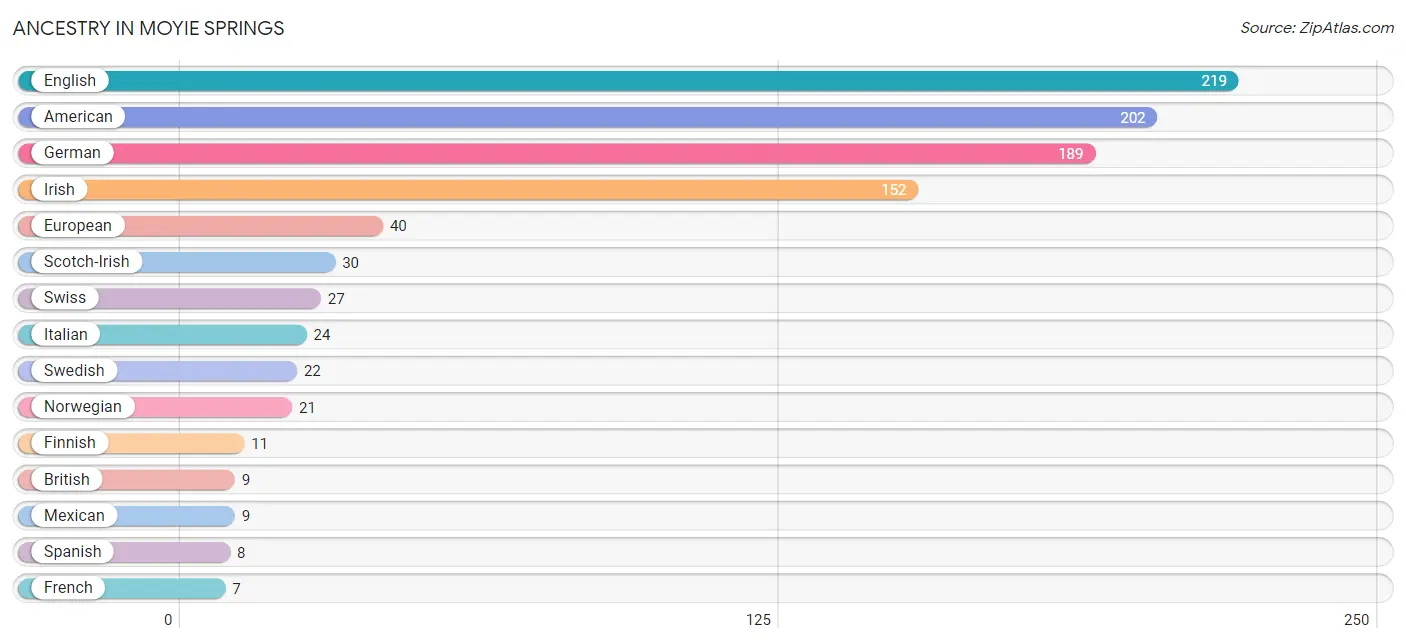
| Ancestry | # Population | % Population |
| American | 202 | 15.6% |
| Arab | 4 | 0.3% |
| Bhutanese | 4 | 0.3% |
| Bolivian | 3 | 0.2% |
| British | 9 | 0.7% |
| Dutch | 4 | 0.3% |
| English | 219 | 16.9% |
| European | 40 | 3.1% |
| Finnish | 11 | 0.9% |
| French | 7 | 0.5% |
| German | 189 | 14.6% |
| Irish | 152 | 11.8% |
| Italian | 24 | 1.9% |
| Korean | 1 | 0.1% |
| Lebanese | 4 | 0.3% |
| Mexican | 9 | 0.7% |
| Northern European | 2 | 0.2% |
| Norwegian | 21 | 1.6% |
| Scandinavian | 3 | 0.2% |
| Scotch-Irish | 30 | 2.3% |
| Scottish | 7 | 0.5% |
| South American | 3 | 0.2% |
| Spanish | 8 | 0.6% |
| Swedish | 22 | 1.7% |
| Swiss | 27 | 2.1% |
| Welsh | 2 | 0.2% | View All 26 Rows |
Immigrants in Moyie Springs
The most numerous immigrant groups reported in Moyie Springs came from Canada (8 | 0.6%), Europe (7 | 0.5%), Western Europe (7 | 0.5%), Switzerland (5 | 0.4%), and Netherlands (2 | 0.2%), together accounting for 2.2% of all Moyie Springs residents.
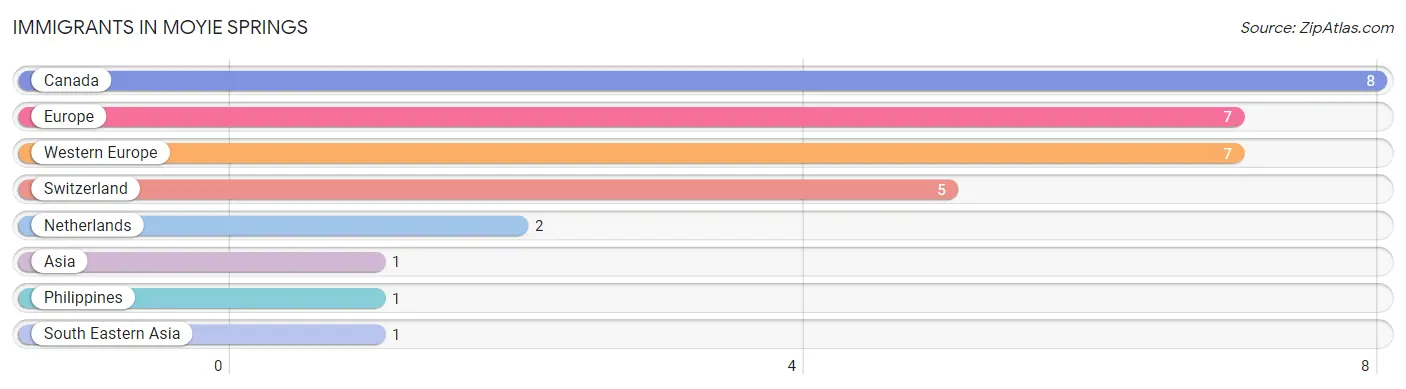
| Immigration Origin | # Population | % Population |
| Asia | 1 | 0.1% |
| Canada | 8 | 0.6% |
| Europe | 7 | 0.5% |
| Netherlands | 2 | 0.2% |
| Philippines | 1 | 0.1% |
| South Eastern Asia | 1 | 0.1% |
| Switzerland | 5 | 0.4% |
| Western Europe | 7 | 0.5% | View All 8 Rows |
Sex and Age in Moyie Springs
Sex and Age in Moyie Springs
The most populous age groups in Moyie Springs are 50 to 54 Years (78 | 11.5%) for men and 20 to 24 Years (80 | 13.0%) for women.
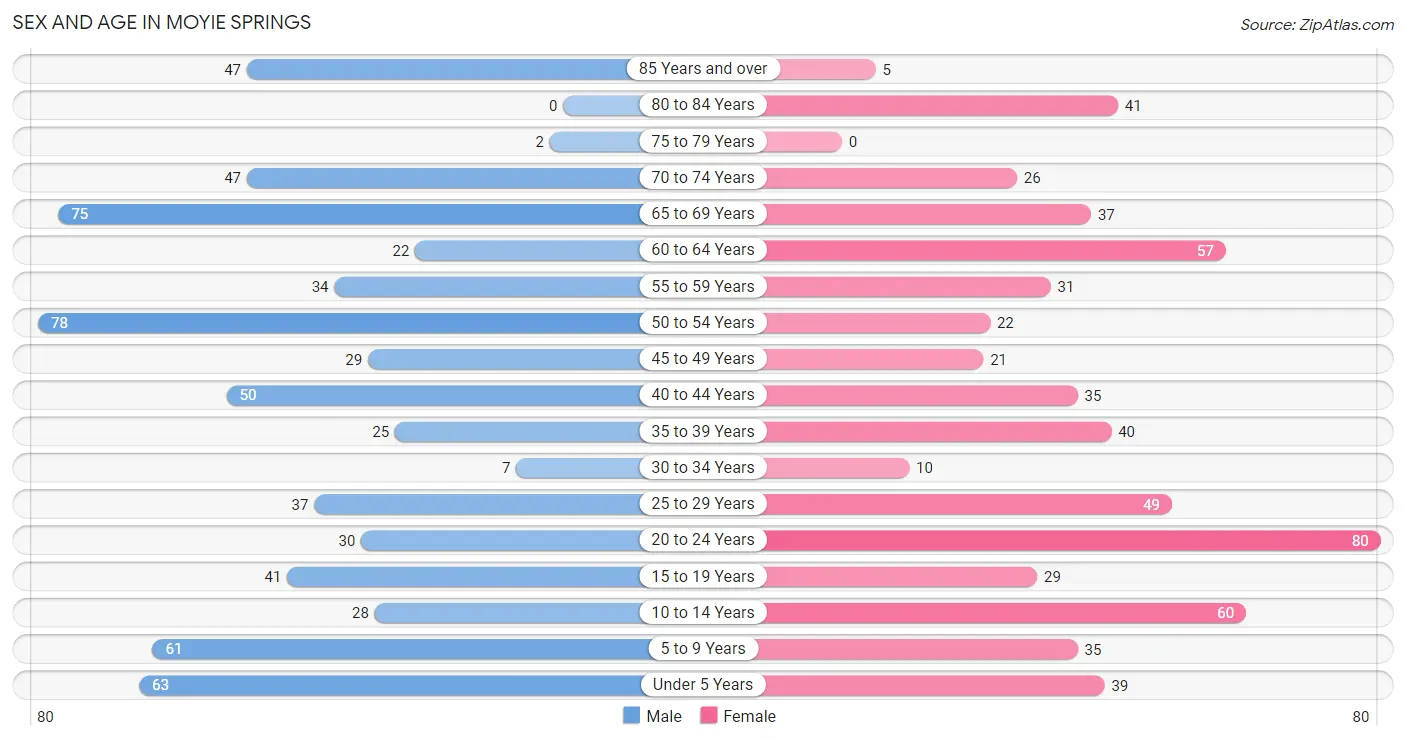
| Age Bracket | Male | Female |
| Under 5 Years | 63 (9.3%) | 39 (6.3%) |
| 5 to 9 Years | 61 (9.0%) | 35 (5.7%) |
| 10 to 14 Years | 28 (4.1%) | 60 (9.7%) |
| 15 to 19 Years | 41 (6.1%) | 29 (4.7%) |
| 20 to 24 Years | 30 (4.4%) | 80 (13.0%) |
| 25 to 29 Years | 37 (5.5%) | 49 (7.9%) |
| 30 to 34 Years | 7 (1.0%) | 10 (1.6%) |
| 35 to 39 Years | 25 (3.7%) | 40 (6.5%) |
| 40 to 44 Years | 50 (7.4%) | 35 (5.7%) |
| 45 to 49 Years | 29 (4.3%) | 21 (3.4%) |
| 50 to 54 Years | 78 (11.5%) | 22 (3.6%) |
| 55 to 59 Years | 34 (5.0%) | 31 (5.0%) |
| 60 to 64 Years | 22 (3.3%) | 57 (9.2%) |
| 65 to 69 Years | 75 (11.1%) | 37 (6.0%) |
| 70 to 74 Years | 47 (7.0%) | 26 (4.2%) |
| 75 to 79 Years | 2 (0.3%) | 0 (0.0%) |
| 80 to 84 Years | 0 (0.0%) | 41 (6.7%) |
| 85 Years and over | 47 (7.0%) | 5 (0.8%) |
| Total | 676 (100.0%) | 617 (100.0%) |
Families and Households in Moyie Springs
Median Family Size in Moyie Springs
The median family size in Moyie Springs is 2.94 persons per family, with married-couple families (306 | 75.7%) accounting for the largest median family size of 3.22 persons per family. On the other hand, single male/father families (77 | 19.1%) represent the smallest median family size with 1.92 persons per family.
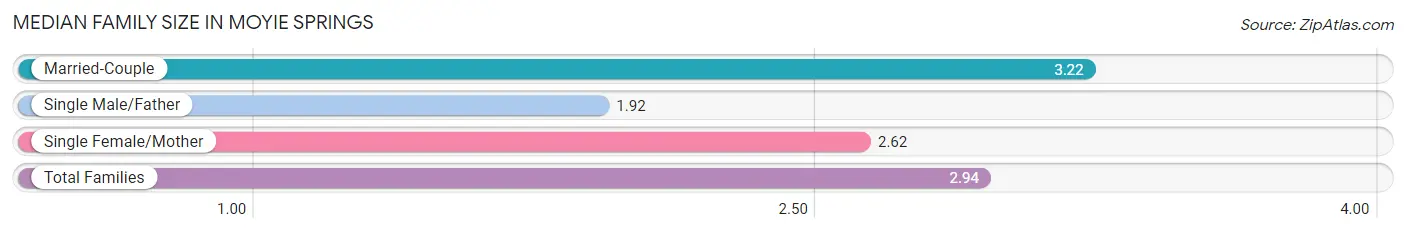
| Family Type | # Families | Family Size |
| Married-Couple | 306 (75.7%) | 3.22 |
| Single Male/Father | 77 (19.1%) | 1.92 |
| Single Female/Mother | 21 (5.2%) | 2.62 |
| Total Families | 404 (100.0%) | 2.94 |
Median Household Size in Moyie Springs
The median household size in Moyie Springs is 2.71 persons per household, with married-couple households (306 | 64.0%) accounting for the largest median household size of 3.22 persons per household. non-family households (74 | 15.5%) represent the smallest median household size with 1.34 persons per household.
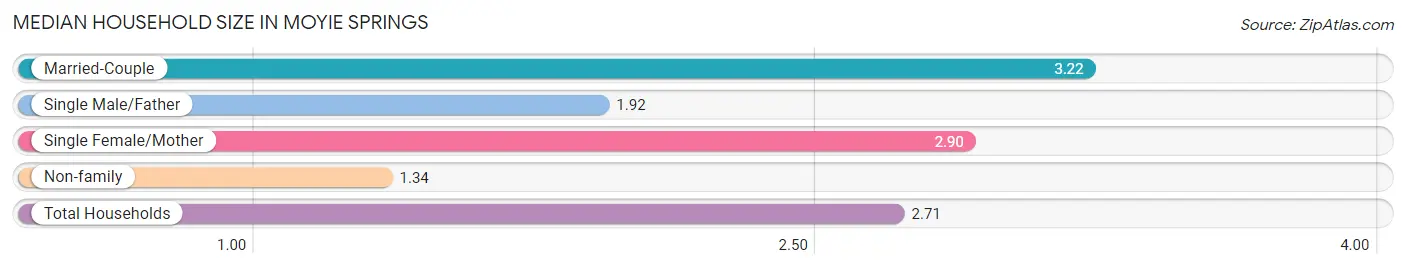
| Household Type | # Households | Household Size |
| Married-Couple | 306 (64.0%) | 3.22 |
| Single Male/Father | 77 (16.1%) | 1.92 |
| Single Female/Mother | 21 (4.4%) | 2.90 |
| Non-family | 74 (15.5%) | 1.34 |
| Total Households | 478 (100.0%) | 2.71 |
Household Size by Marriage Status in Moyie Springs
Out of a total of 478 households in Moyie Springs, 404 (84.5%) are family households, while 74 (15.5%) are nonfamily households. The most numerous type of family households are 2-person households, comprising 262, and the most common type of nonfamily households are 1-person households, comprising 59.
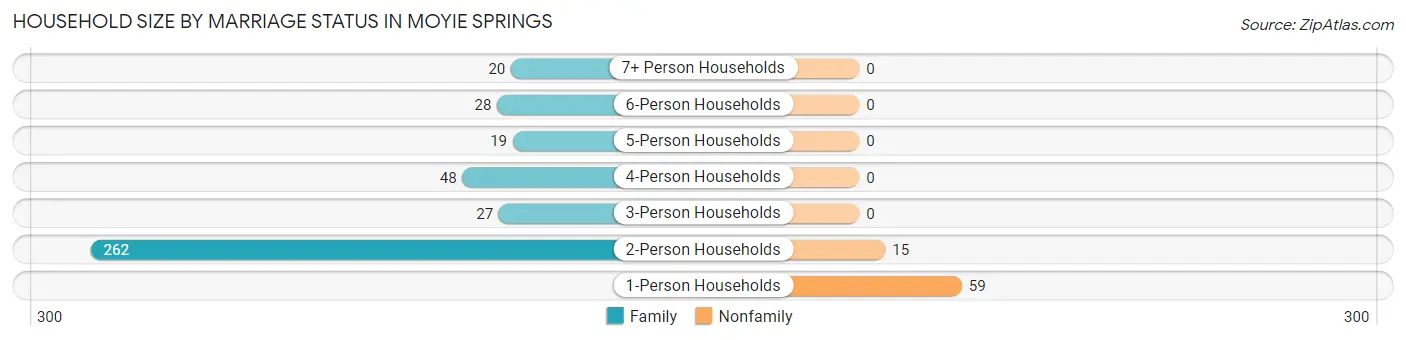
| Household Size | Family Households | Nonfamily Households |
| 1-Person Households | - | 59 (12.3%) |
| 2-Person Households | 262 (54.8%) | 15 (3.1%) |
| 3-Person Households | 27 (5.7%) | 0 (0.0%) |
| 4-Person Households | 48 (10.0%) | 0 (0.0%) |
| 5-Person Households | 19 (4.0%) | 0 (0.0%) |
| 6-Person Households | 28 (5.9%) | 0 (0.0%) |
| 7+ Person Households | 20 (4.2%) | 0 (0.0%) |
| Total | 404 (84.5%) | 74 (15.5%) |
Female Fertility in Moyie Springs
Fertility by Age in Moyie Springs
Average fertility rate in Moyie Springs is 49.0 births per 1,000 women. Women in the age bracket of 20 to 34 years have the highest fertility rate with 65.0 births per 1,000 women. Women in the age bracket of 20 to 34 years acount for 69.2% of all women with births.
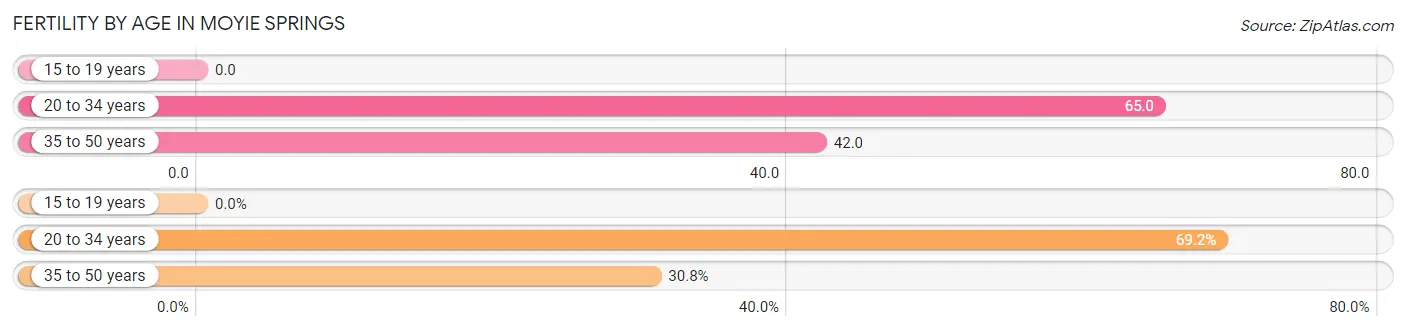
| Age Bracket | Women with Births | Births / 1,000 Women |
| 15 to 19 years | 0 (0.0%) | 0.0 |
| 20 to 34 years | 9 (69.2%) | 65.0 |
| 35 to 50 years | 4 (30.8%) | 42.0 |
| Total | 13 (100.0%) | 49.0 |
Fertility by Age by Marriage Status in Moyie Springs
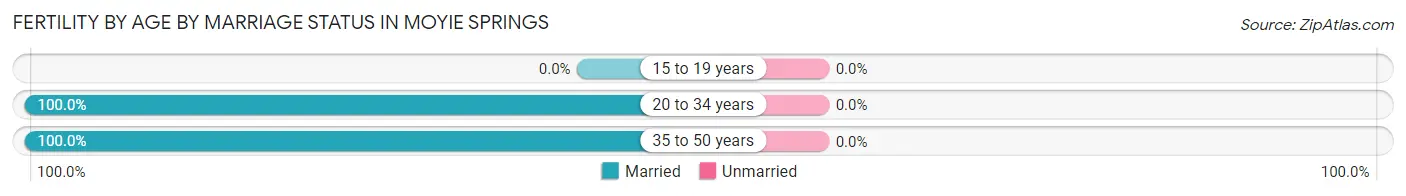
| Age Bracket | Married | Unmarried |
| 15 to 19 years | 0 (0.0%) | 0 (0.0%) |
| 20 to 34 years | 9 (100.0%) | 0 (0.0%) |
| 35 to 50 years | 4 (100.0%) | 0 (0.0%) |
| Total | 13 (100.0%) | 0 (0.0%) |
Fertility by Education in Moyie Springs
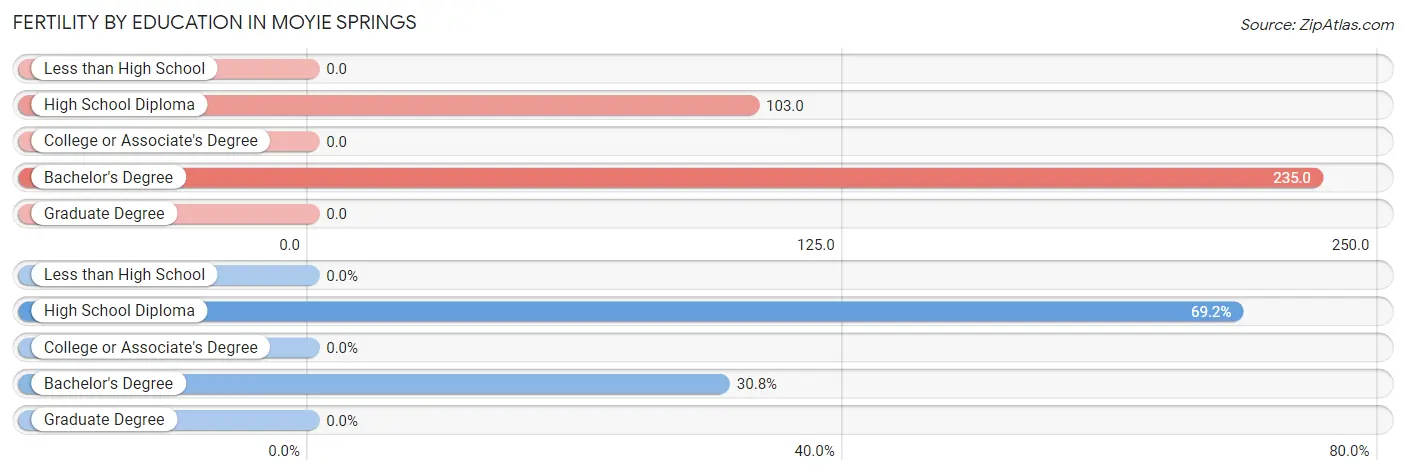
| Educational Attainment | Women with Births | Births / 1,000 Women |
| Less than High School | 0 (0.0%) | 0.0 |
| High School Diploma | 9 (69.2%) | 103.0 |
| College or Associate's Degree | 0 (0.0%) | 0.0 |
| Bachelor's Degree | 4 (30.8%) | 235.0 |
| Graduate Degree | 0 (0.0%) | 0.0 |
| Total | 13 (100.0%) | 49.0 |
Fertility by Education by Marriage Status in Moyie Springs
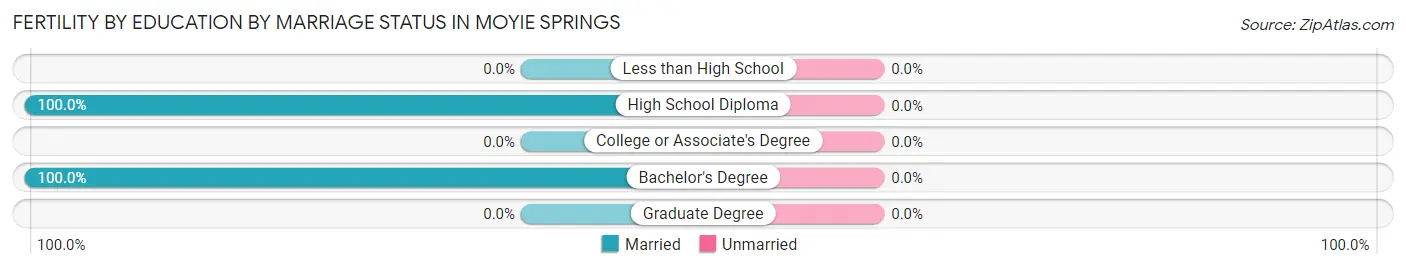
| Educational Attainment | Married | Unmarried |
| Less than High School | 0 (0.0%) | 0 (0.0%) |
| High School Diploma | 9 (100.0%) | 0 (0.0%) |
| College or Associate's Degree | 0 (0.0%) | 0 (0.0%) |
| Bachelor's Degree | 4 (100.0%) | 0 (0.0%) |
| Graduate Degree | 0 (0.0%) | 0 (0.0%) |
| Total | 13 (100.0%) | 0 (0.0%) |
Employment Characteristics in Moyie Springs
Employment by Class of Employer in Moyie Springs
Among the 397 employed individuals in Moyie Springs, private company employees (274 | 69.0%), federal government employees (44 | 11.1%), and self-employed (not incorporated) (35 | 8.8%) make up the most common classes of employment.
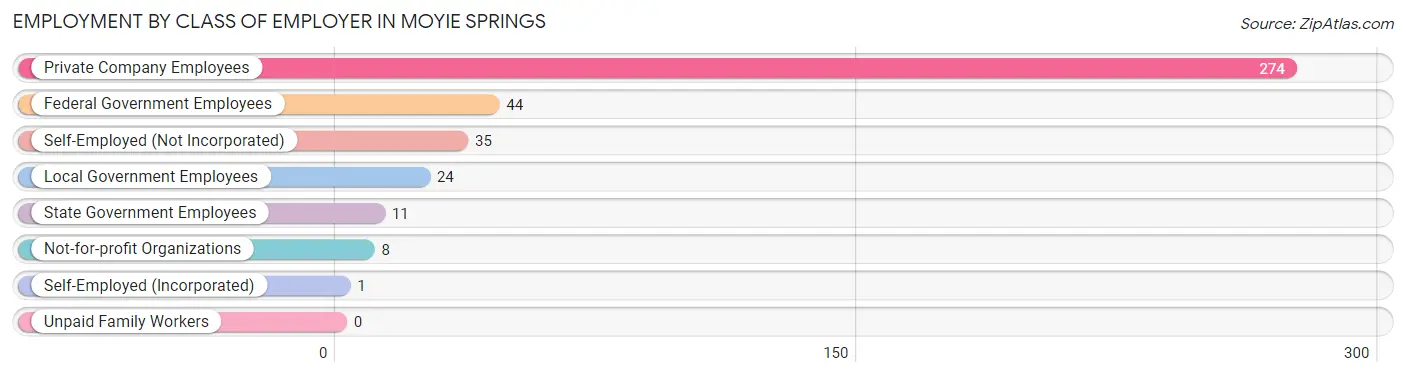
| Employer Class | # Employees | % Employees |
| Private Company Employees | 274 | 69.0% |
| Self-Employed (Incorporated) | 1 | 0.3% |
| Self-Employed (Not Incorporated) | 35 | 8.8% |
| Not-for-profit Organizations | 8 | 2.0% |
| Local Government Employees | 24 | 6.0% |
| State Government Employees | 11 | 2.8% |
| Federal Government Employees | 44 | 11.1% |
| Unpaid Family Workers | 0 | 0.0% |
| Total | 397 | 100.0% |
Employment Status by Age in Moyie Springs
According to the labor force statistics for Moyie Springs, out of the total population over 16 years of age (981), 43.9% or 431 individuals are in the labor force, with 6.3% or 27 of them unemployed. The age group with the highest labor force participation rate is 45 to 54 years, with 85.3% or 128 individuals in the labor force. Within the labor force, the 65 to 74 years age range has the highest percentage of unemployed individuals, with 43.2% or 16 of them being unemployed.
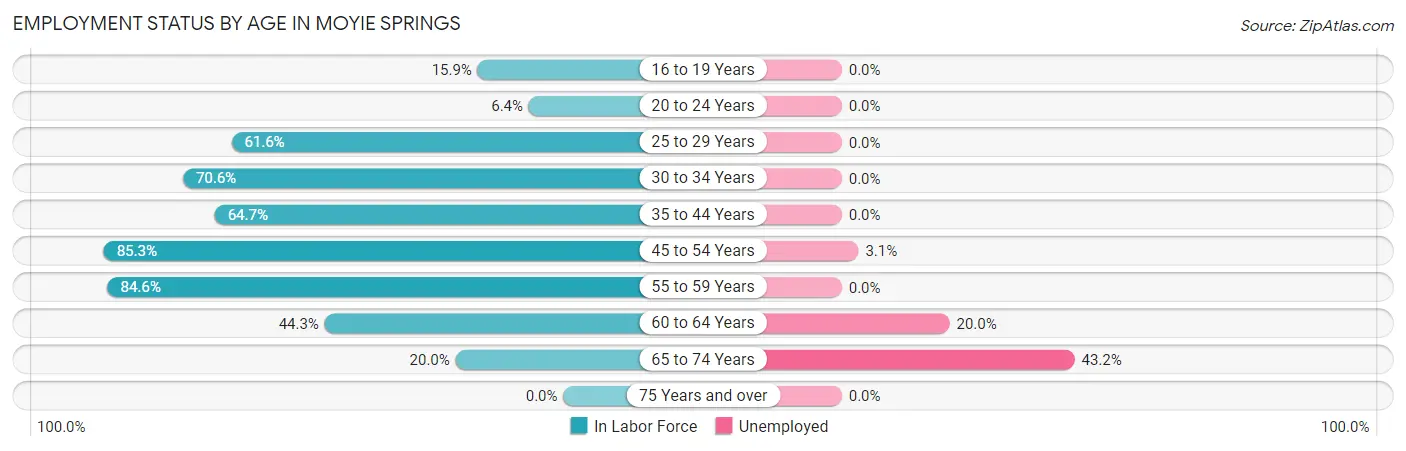
| Age Bracket | In Labor Force | Unemployed |
| 16 to 19 Years | 7 (15.9%) | 0 (0.0%) |
| 20 to 24 Years | 7 (6.4%) | 0 (0.0%) |
| 25 to 29 Years | 53 (61.6%) | 0 (0.0%) |
| 30 to 34 Years | 12 (70.6%) | 0 (0.0%) |
| 35 to 44 Years | 97 (64.7%) | 0 (0.0%) |
| 45 to 54 Years | 128 (85.3%) | 4 (3.1%) |
| 55 to 59 Years | 55 (84.6%) | 0 (0.0%) |
| 60 to 64 Years | 35 (44.3%) | 7 (20.0%) |
| 65 to 74 Years | 37 (20.0%) | 16 (43.2%) |
| 75 Years and over | 0 (0.0%) | 0 (0.0%) |
| Total | 431 (43.9%) | 27 (6.3%) |
Employment Status by Educational Attainment in Moyie Springs
According to labor force statistics for Moyie Springs, 69.5% of individuals (380) out of the total population between 25 and 64 years of age (547) are in the labor force, with 2.9% or 11 of them being unemployed. The group with the highest labor force participation rate are those with the educational attainment of bachelor's degree or higher, with 85.2% or 92 individuals in the labor force. Within the labor force, individuals with high school diploma education have the highest percentage of unemployment, with 9.3% or 11 of them being unemployed.
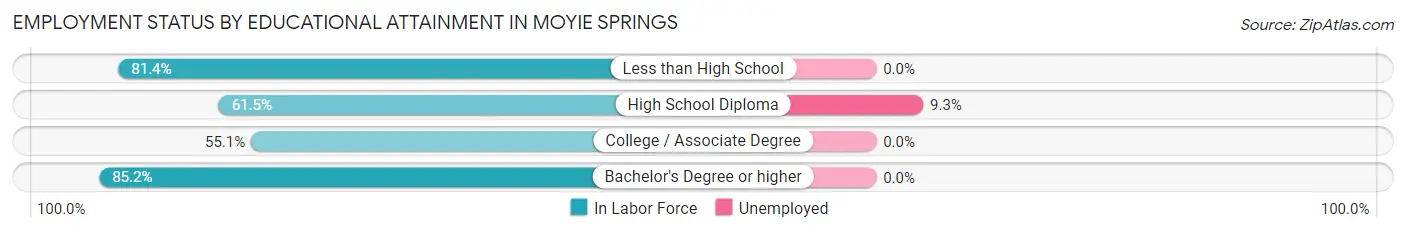
| Educational Attainment | In Labor Force | Unemployed |
| Less than High School | 105 (81.4%) | 0 (0.0%) |
| High School Diploma | 118 (61.5%) | 18 (9.3%) |
| College / Associate Degree | 65 (55.1%) | 0 (0.0%) |
| Bachelor's Degree or higher | 92 (85.2%) | 0 (0.0%) |
| Total | 380 (69.5%) | 16 (2.9%) |
Employment Occupations by Sex in Moyie Springs
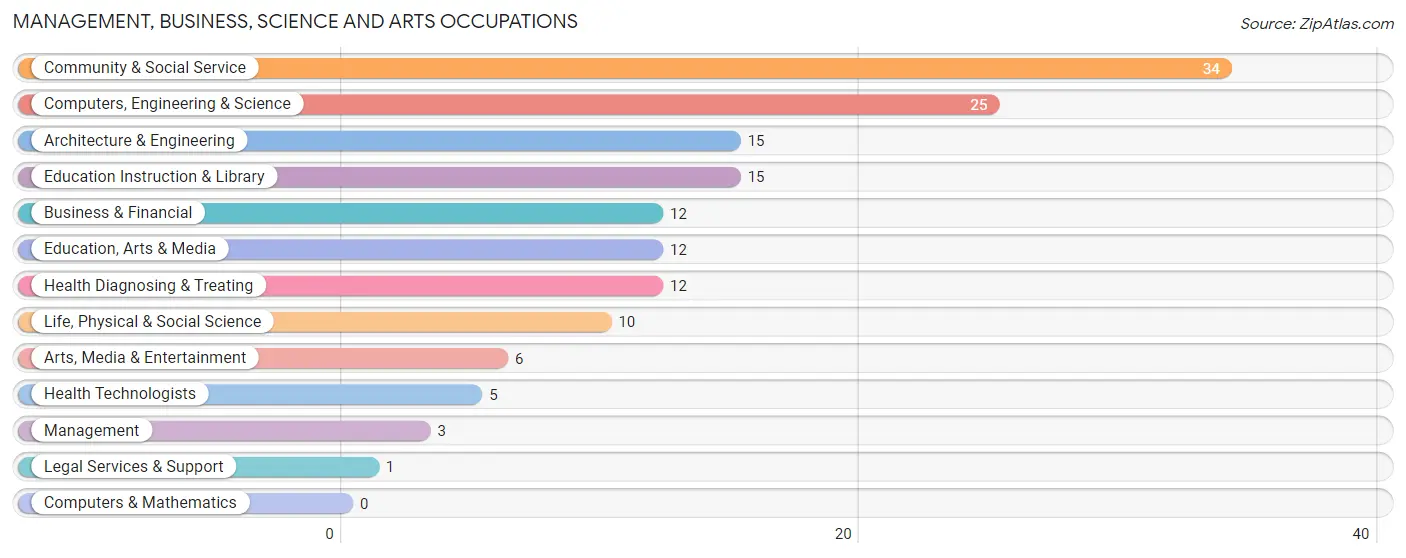
Management, Business, Science and Arts Occupations
The most common Management, Business, Science and Arts occupations in Moyie Springs are Community & Social Service (34 | 8.4%), Computers, Engineering & Science (25 | 6.2%), Architecture & Engineering (15 | 3.7%), Education Instruction & Library (15 | 3.7%), and Business & Financial (12 | 3.0%).
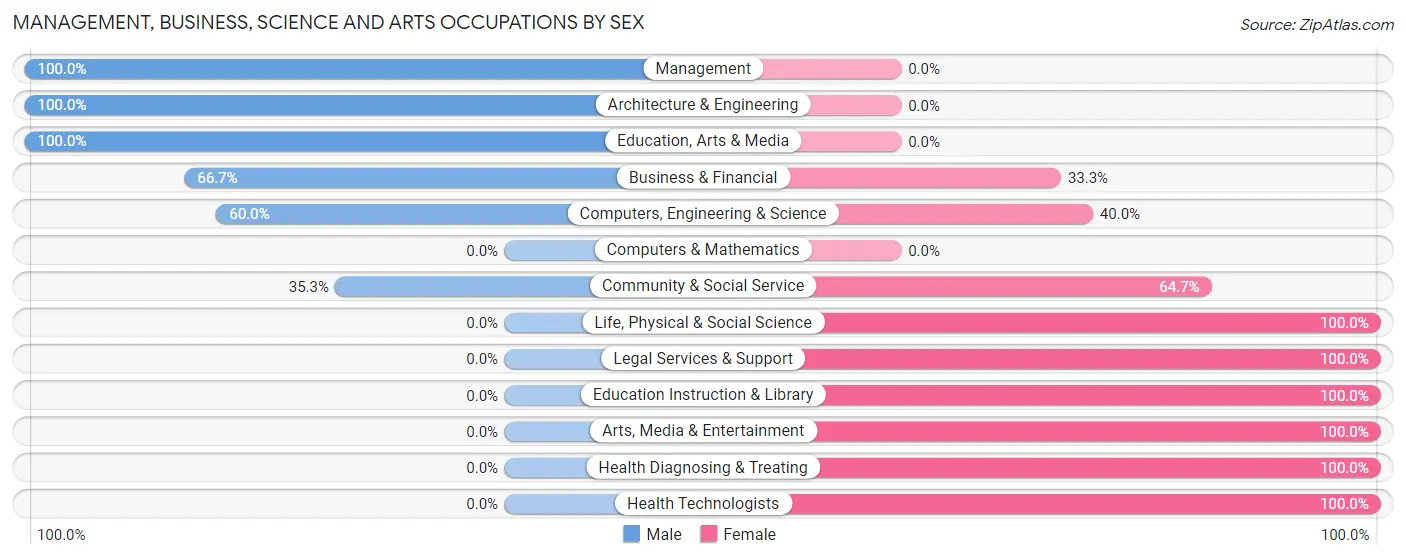
Management, Business, Science and Arts Occupations by Sex
Within the Management, Business, Science and Arts occupations in Moyie Springs, the most male-oriented occupations are Management (100.0%), Architecture & Engineering (100.0%), and Education, Arts & Media (100.0%), while the most female-oriented occupations are Life, Physical & Social Science (100.0%), Legal Services & Support (100.0%), and Education Instruction & Library (100.0%).
| Occupation | Male | Female |
| Management | 3 (100.0%) | 0 (0.0%) |
| Business & Financial | 8 (66.7%) | 4 (33.3%) |
| Computers, Engineering & Science | 15 (60.0%) | 10 (40.0%) |
| Computers & Mathematics | 0 (0.0%) | 0 (0.0%) |
| Architecture & Engineering | 15 (100.0%) | 0 (0.0%) |
| Life, Physical & Social Science | 0 (0.0%) | 10 (100.0%) |
| Community & Social Service | 12 (35.3%) | 22 (64.7%) |
| Education, Arts & Media | 12 (100.0%) | 0 (0.0%) |
| Legal Services & Support | 0 (0.0%) | 1 (100.0%) |
| Education Instruction & Library | 0 (0.0%) | 15 (100.0%) |
| Arts, Media & Entertainment | 0 (0.0%) | 6 (100.0%) |
| Health Diagnosing & Treating | 0 (0.0%) | 12 (100.0%) |
| Health Technologists | 0 (0.0%) | 5 (100.0%) |
| Total (Category) | 38 (44.2%) | 48 (55.8%) |
| Total (Overall) | 260 (64.4%) | 144 (35.6%) |
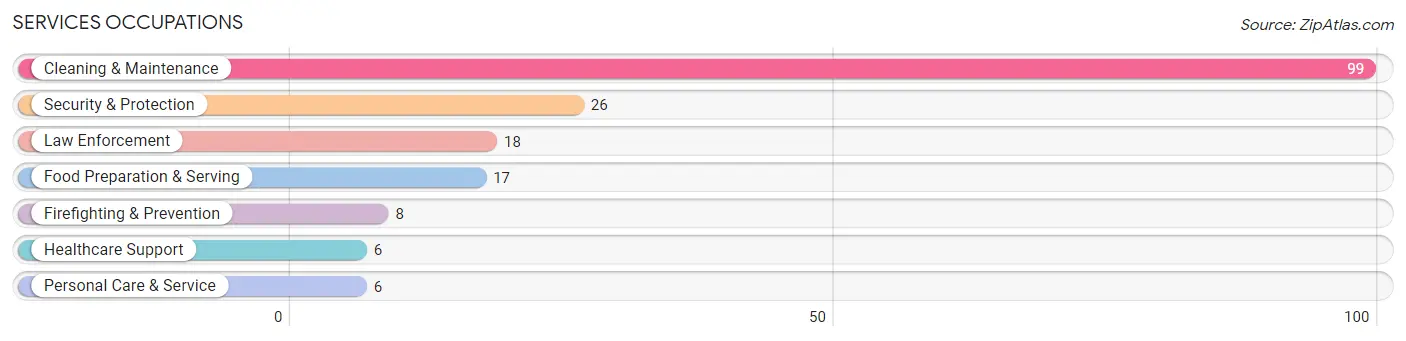
Services Occupations
The most common Services occupations in Moyie Springs are Cleaning & Maintenance (99 | 24.5%), Security & Protection (26 | 6.4%), Law Enforcement (18 | 4.5%), Food Preparation & Serving (17 | 4.2%), and Firefighting & Prevention (8 | 2.0%).
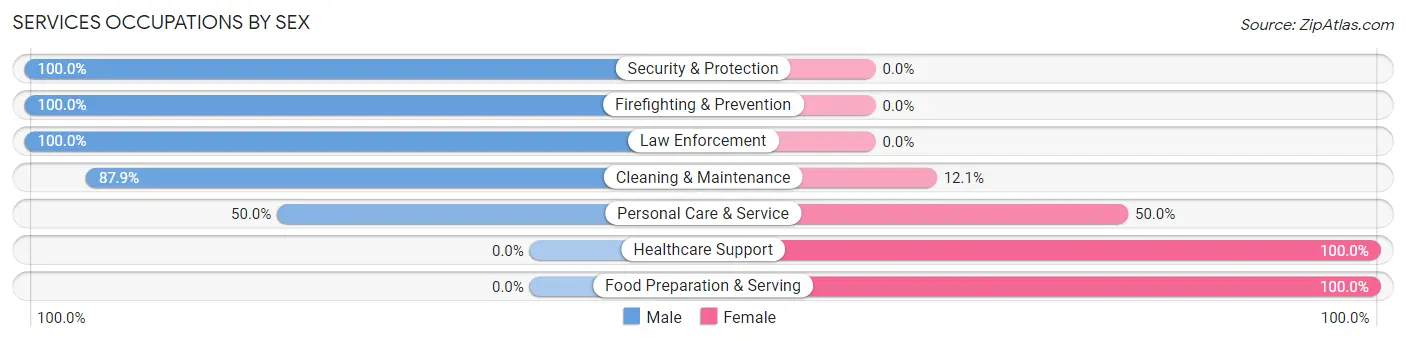
Services Occupations by Sex
Within the Services occupations in Moyie Springs, the most male-oriented occupations are Security & Protection (100.0%), Firefighting & Prevention (100.0%), and Law Enforcement (100.0%), while the most female-oriented occupations are Healthcare Support (100.0%), Food Preparation & Serving (100.0%), and Personal Care & Service (50.0%).
| Occupation | Male | Female |
| Healthcare Support | 0 (0.0%) | 6 (100.0%) |
| Security & Protection | 26 (100.0%) | 0 (0.0%) |
| Firefighting & Prevention | 8 (100.0%) | 0 (0.0%) |
| Law Enforcement | 18 (100.0%) | 0 (0.0%) |
| Food Preparation & Serving | 0 (0.0%) | 17 (100.0%) |
| Cleaning & Maintenance | 87 (87.9%) | 12 (12.1%) |
| Personal Care & Service | 3 (50.0%) | 3 (50.0%) |
| Total (Category) | 116 (75.3%) | 38 (24.7%) |
| Total (Overall) | 260 (64.4%) | 144 (35.6%) |
Sales and Office Occupations
The most common Sales and Office occupations in Moyie Springs are Sales & Related (35 | 8.7%), and Office & Administration (23 | 5.7%).
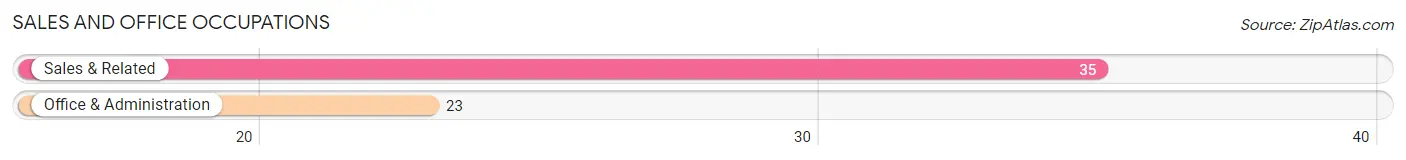
Sales and Office Occupations by Sex
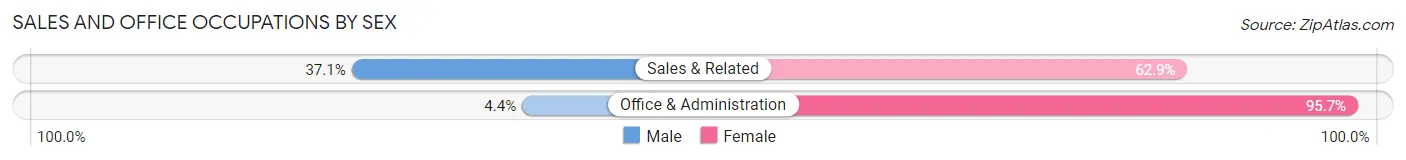
| Occupation | Male | Female |
| Sales & Related | 13 (37.1%) | 22 (62.9%) |
| Office & Administration | 1 (4.3%) | 22 (95.7%) |
| Total (Category) | 14 (24.1%) | 44 (75.9%) |
| Total (Overall) | 260 (64.4%) | 144 (35.6%) |
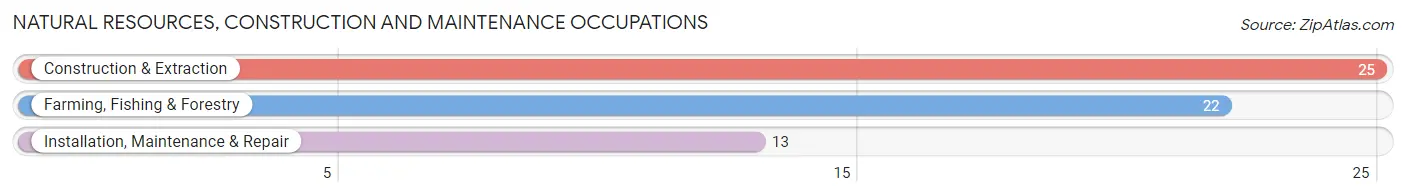
Natural Resources, Construction and Maintenance Occupations
The most common Natural Resources, Construction and Maintenance occupations in Moyie Springs are Construction & Extraction (25 | 6.2%), Farming, Fishing & Forestry (22 | 5.4%), and Installation, Maintenance & Repair (13 | 3.2%).
Natural Resources, Construction and Maintenance Occupations by Sex
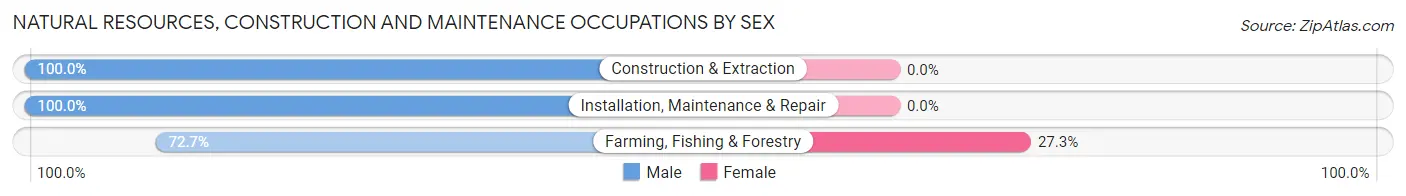
| Occupation | Male | Female |
| Farming, Fishing & Forestry | 16 (72.7%) | 6 (27.3%) |
| Construction & Extraction | 25 (100.0%) | 0 (0.0%) |
| Installation, Maintenance & Repair | 13 (100.0%) | 0 (0.0%) |
| Total (Category) | 54 (90.0%) | 6 (10.0%) |
| Total (Overall) | 260 (64.4%) | 144 (35.6%) |
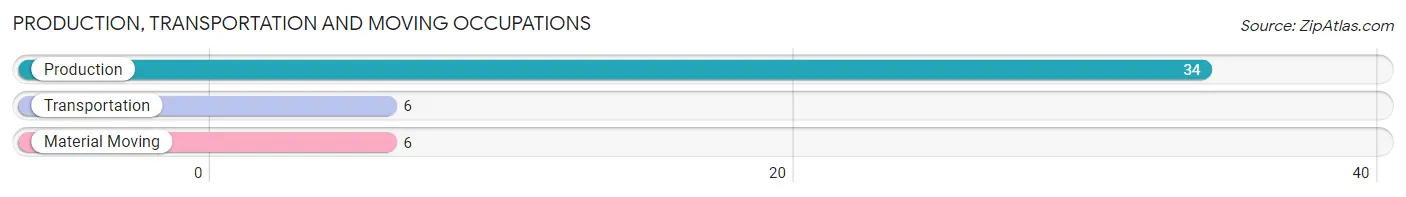
Production, Transportation and Moving Occupations
The most common Production, Transportation and Moving occupations in Moyie Springs are Production (34 | 8.4%), Transportation (6 | 1.5%), and Material Moving (6 | 1.5%).
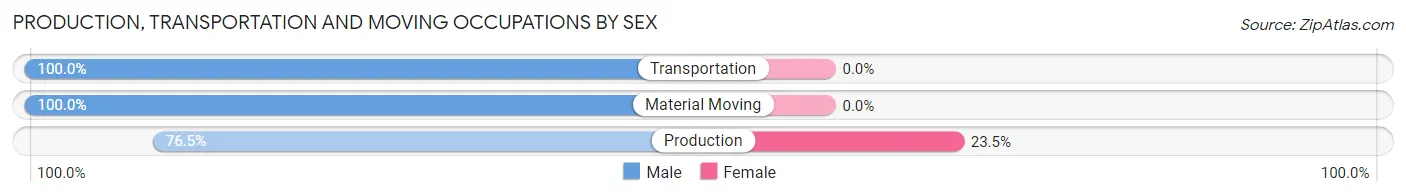
Production, Transportation and Moving Occupations by Sex
| Occupation | Male | Female |
| Production | 26 (76.5%) | 8 (23.5%) |
| Transportation | 6 (100.0%) | 0 (0.0%) |
| Material Moving | 6 (100.0%) | 0 (0.0%) |
| Total (Category) | 38 (82.6%) | 8 (17.4%) |
| Total (Overall) | 260 (64.4%) | 144 (35.6%) |
Employment Industries by Sex in Moyie Springs
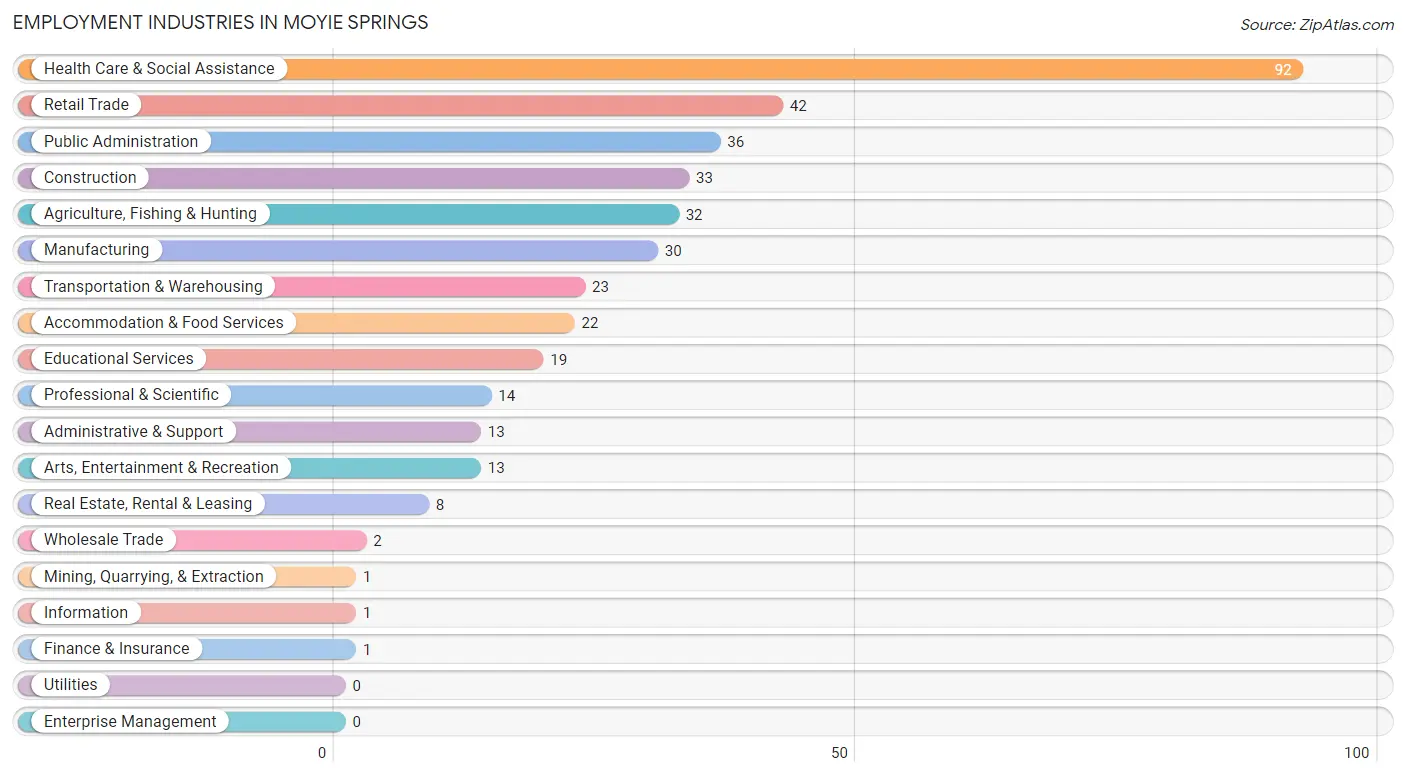
Employment Industries in Moyie Springs
The major employment industries in Moyie Springs include Health Care & Social Assistance (92 | 22.8%), Retail Trade (42 | 10.4%), Public Administration (36 | 8.9%), Construction (33 | 8.2%), and Agriculture, Fishing & Hunting (32 | 7.9%).
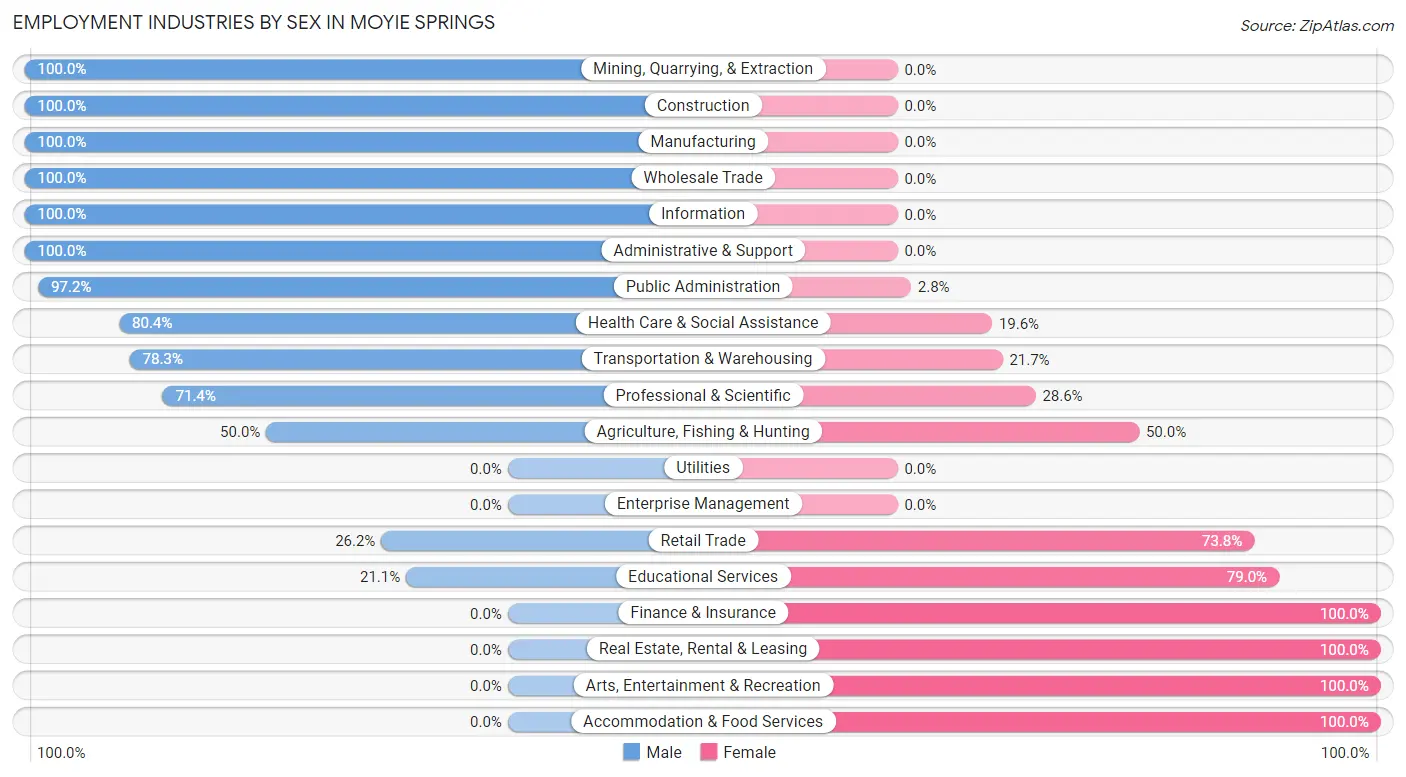
Employment Industries by Sex in Moyie Springs
The Moyie Springs industries that see more men than women are Mining, Quarrying, & Extraction (100.0%), Construction (100.0%), and Manufacturing (100.0%), whereas the industries that tend to have a higher number of women are Finance & Insurance (100.0%), Real Estate, Rental & Leasing (100.0%), and Arts, Entertainment & Recreation (100.0%).
| Industry | Male | Female |
| Agriculture, Fishing & Hunting | 16 (50.0%) | 16 (50.0%) |
| Mining, Quarrying, & Extraction | 1 (100.0%) | 0 (0.0%) |
| Construction | 33 (100.0%) | 0 (0.0%) |
| Manufacturing | 30 (100.0%) | 0 (0.0%) |
| Wholesale Trade | 2 (100.0%) | 0 (0.0%) |
| Retail Trade | 11 (26.2%) | 31 (73.8%) |
| Transportation & Warehousing | 18 (78.3%) | 5 (21.7%) |
| Utilities | 0 (0.0%) | 0 (0.0%) |
| Information | 1 (100.0%) | 0 (0.0%) |
| Finance & Insurance | 0 (0.0%) | 1 (100.0%) |
| Real Estate, Rental & Leasing | 0 (0.0%) | 8 (100.0%) |
| Professional & Scientific | 10 (71.4%) | 4 (28.6%) |
| Enterprise Management | 0 (0.0%) | 0 (0.0%) |
| Administrative & Support | 13 (100.0%) | 0 (0.0%) |
| Educational Services | 4 (21.0%) | 15 (78.9%) |
| Health Care & Social Assistance | 74 (80.4%) | 18 (19.6%) |
| Arts, Entertainment & Recreation | 0 (0.0%) | 13 (100.0%) |
| Accommodation & Food Services | 0 (0.0%) | 22 (100.0%) |
| Public Administration | 35 (97.2%) | 1 (2.8%) |
| Total | 260 (64.4%) | 144 (35.6%) |
Education in Moyie Springs
School Enrollment in Moyie Springs
The most common levels of schooling among the 326 students in Moyie Springs are college / undergraduate (99 | 30.4%), middle school (79 | 24.2%), and elementary school (63 | 19.3%).
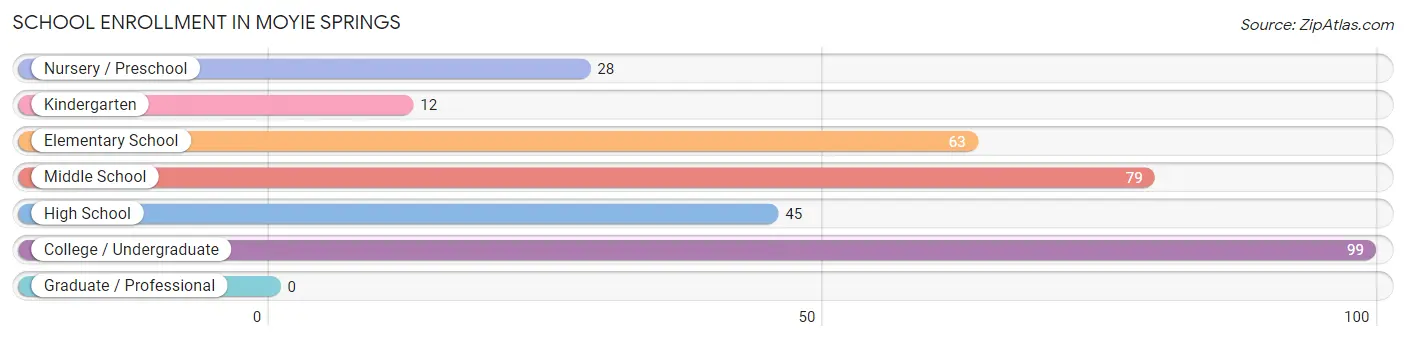
| School Level | # Students | % Students |
| Nursery / Preschool | 28 | 8.6% |
| Kindergarten | 12 | 3.7% |
| Elementary School | 63 | 19.3% |
| Middle School | 79 | 24.2% |
| High School | 45 | 13.8% |
| College / Undergraduate | 99 | 30.4% |
| Graduate / Professional | 0 | 0.0% |
| Total | 326 | 100.0% |
School Enrollment by Age by Funding Source in Moyie Springs
Out of a total of 326 students who are enrolled in schools in Moyie Springs, 176 (54.0%) attend a private institution, while the remaining 150 (46.0%) are enrolled in public schools. The age group of 35 years and over has the highest likelihood of being enrolled in private schools, with 7 (100.0% in the age bracket) enrolled. Conversely, the age group of 25 to 34 year olds has the lowest likelihood of being enrolled in a private school, with 8 (100.0% in the age bracket) attending a public institution.
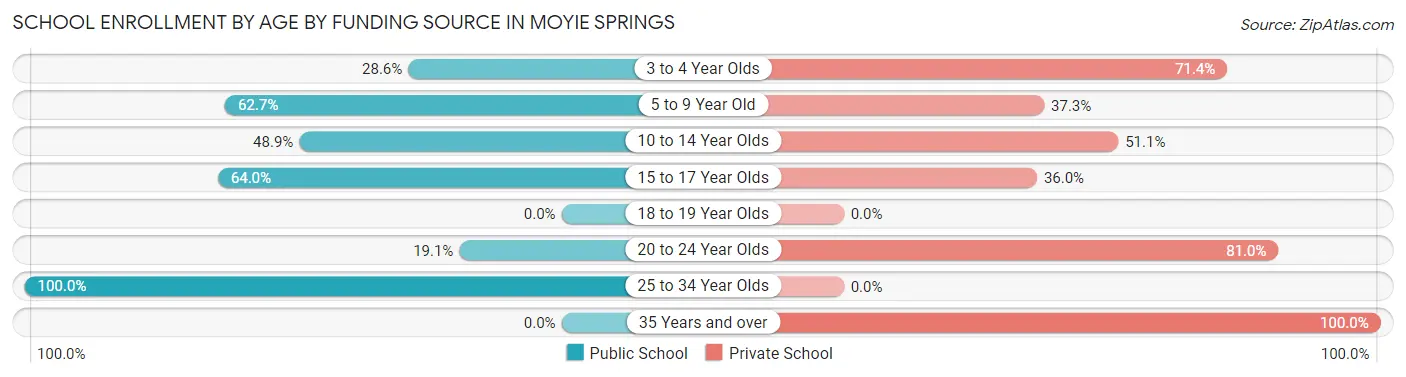
| Age Bracket | Public School | Private School |
| 3 to 4 Year Olds | 4 (28.6%) | 10 (71.4%) |
| 5 to 9 Year Old | 47 (62.7%) | 28 (37.3%) |
| 10 to 14 Year Olds | 43 (48.9%) | 45 (51.1%) |
| 15 to 17 Year Olds | 32 (64.0%) | 18 (36.0%) |
| 18 to 19 Year Olds | 0 (0.0%) | 0 (0.0%) |
| 20 to 24 Year Olds | 16 (19.1%) | 68 (80.9%) |
| 25 to 34 Year Olds | 8 (100.0%) | 0 (0.0%) |
| 35 Years and over | 0 (0.0%) | 7 (100.0%) |
| Total | 150 (46.0%) | 176 (54.0%) |
Educational Attainment by Field of Study in Moyie Springs
Education (64 | 28.3%), visual & performing arts (47 | 20.8%), bio, nature & agricultural (31 | 13.7%), science & technology (21 | 9.3%), and literature & languages (15 | 6.6%) are the most common fields of study among 226 individuals in Moyie Springs who have obtained a bachelor's degree or higher.
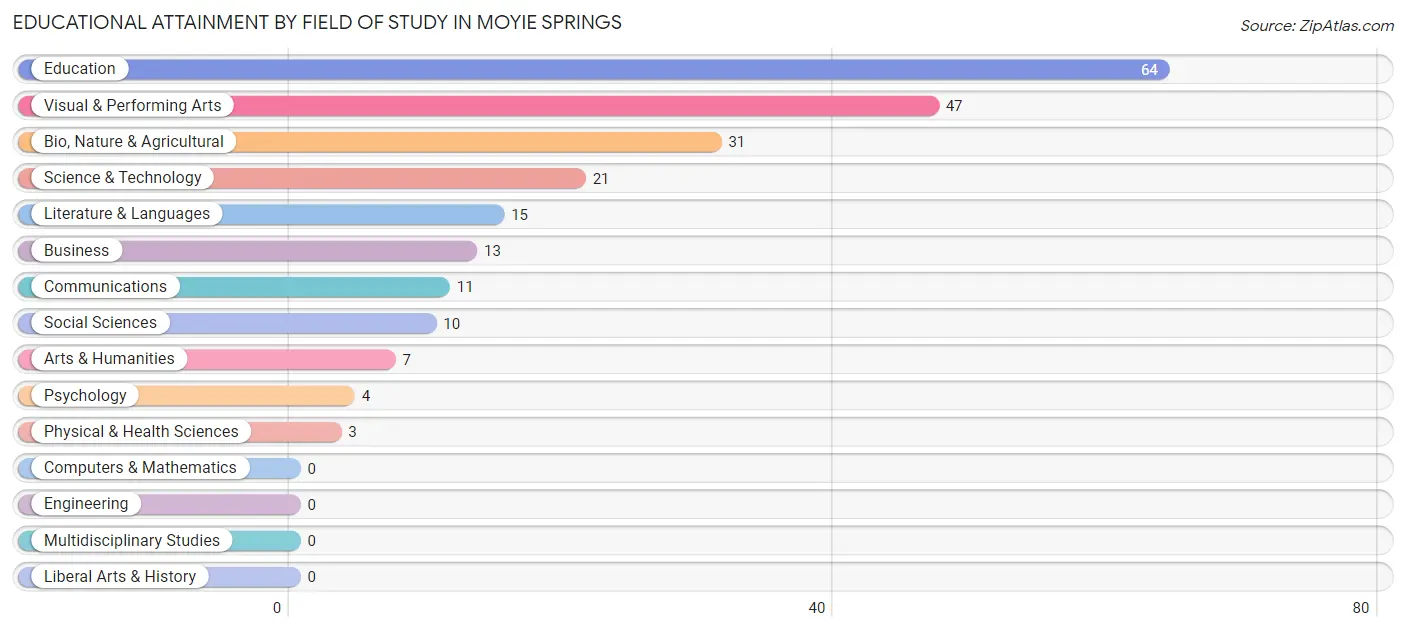
| Field of Study | # Graduates | % Graduates |
| Computers & Mathematics | 0 | 0.0% |
| Bio, Nature & Agricultural | 31 | 13.7% |
| Physical & Health Sciences | 3 | 1.3% |
| Psychology | 4 | 1.8% |
| Social Sciences | 10 | 4.4% |
| Engineering | 0 | 0.0% |
| Multidisciplinary Studies | 0 | 0.0% |
| Science & Technology | 21 | 9.3% |
| Business | 13 | 5.8% |
| Education | 64 | 28.3% |
| Literature & Languages | 15 | 6.6% |
| Liberal Arts & History | 0 | 0.0% |
| Visual & Performing Arts | 47 | 20.8% |
| Communications | 11 | 4.9% |
| Arts & Humanities | 7 | 3.1% |
| Total | 226 | 100.0% |
Transportation & Commute in Moyie Springs
Vehicle Availability by Sex in Moyie Springs
The most prevalent vehicle ownership categories in Moyie Springs are males with 4 vehicles (97, accounting for 37.3%) and females with 4 vehicles (15, making up 70.8%).
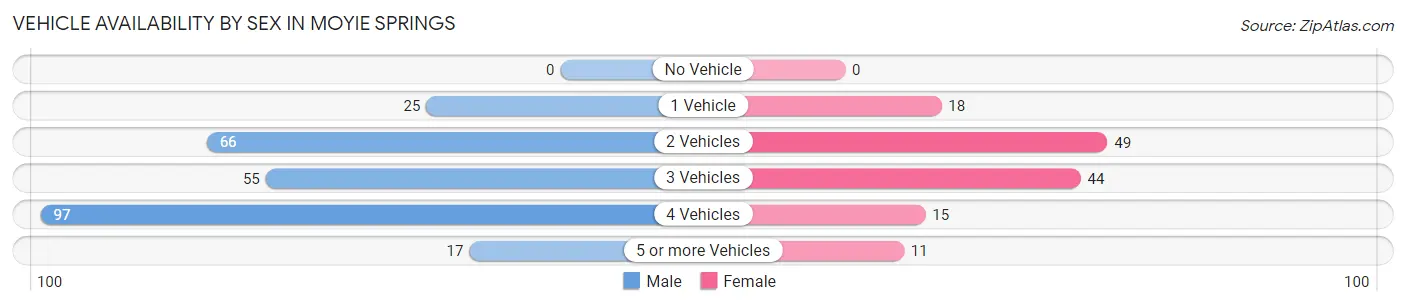
| Vehicles Available | Male | Female |
| No Vehicle | 0 (0.0%) | 0 (0.0%) |
| 1 Vehicle | 25 (9.6%) | 18 (13.1%) |
| 2 Vehicles | 66 (25.4%) | 49 (35.8%) |
| 3 Vehicles | 55 (21.1%) | 44 (32.1%) |
| 4 Vehicles | 97 (37.3%) | 15 (11.0%) |
| 5 or more Vehicles | 17 (6.5%) | 11 (8.0%) |
| Total | 260 (100.0%) | 137 (100.0%) |
Commute Time in Moyie Springs
The most frequently occuring commute durations in Moyie Springs are 20 to 24 minutes (117 commuters, 34.6%), 15 to 19 minutes (66 commuters, 19.5%), and 5 to 9 minutes (30 commuters, 8.9%).
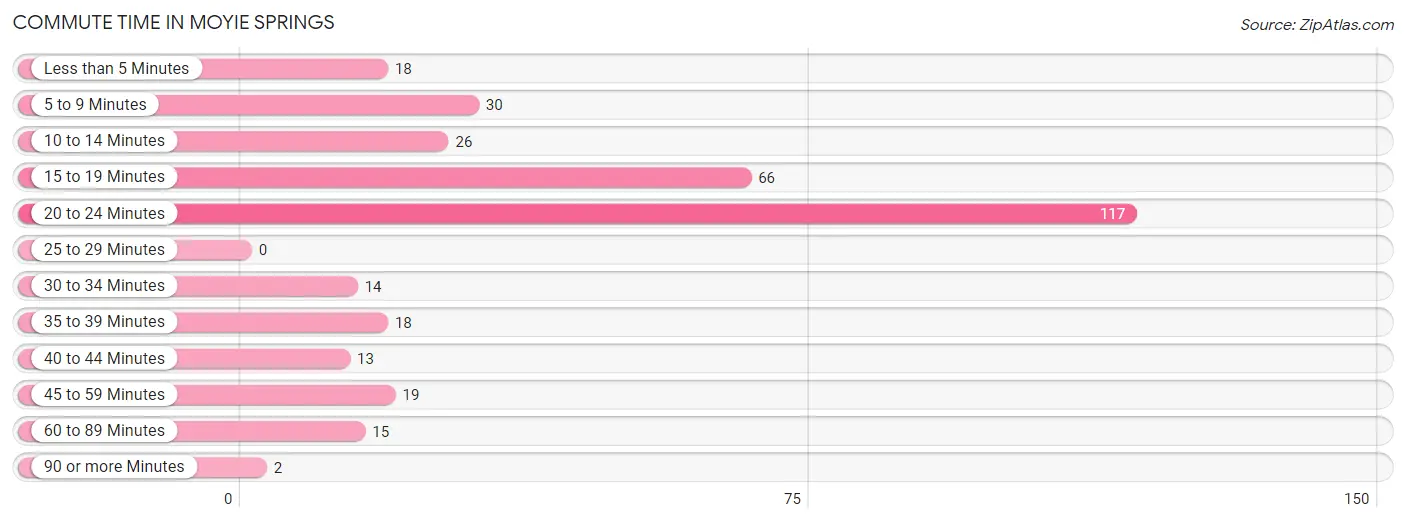
| Commute Time | # Commuters | % Commuters |
| Less than 5 Minutes | 18 | 5.3% |
| 5 to 9 Minutes | 30 | 8.9% |
| 10 to 14 Minutes | 26 | 7.7% |
| 15 to 19 Minutes | 66 | 19.5% |
| 20 to 24 Minutes | 117 | 34.6% |
| 25 to 29 Minutes | 0 | 0.0% |
| 30 to 34 Minutes | 14 | 4.1% |
| 35 to 39 Minutes | 18 | 5.3% |
| 40 to 44 Minutes | 13 | 3.8% |
| 45 to 59 Minutes | 19 | 5.6% |
| 60 to 89 Minutes | 15 | 4.4% |
| 90 or more Minutes | 2 | 0.6% |
Commute Time by Sex in Moyie Springs
The most common commute times in Moyie Springs are 20 to 24 minutes (117 commuters, 53.2%) for males and 15 to 19 minutes (44 commuters, 37.3%) for females.
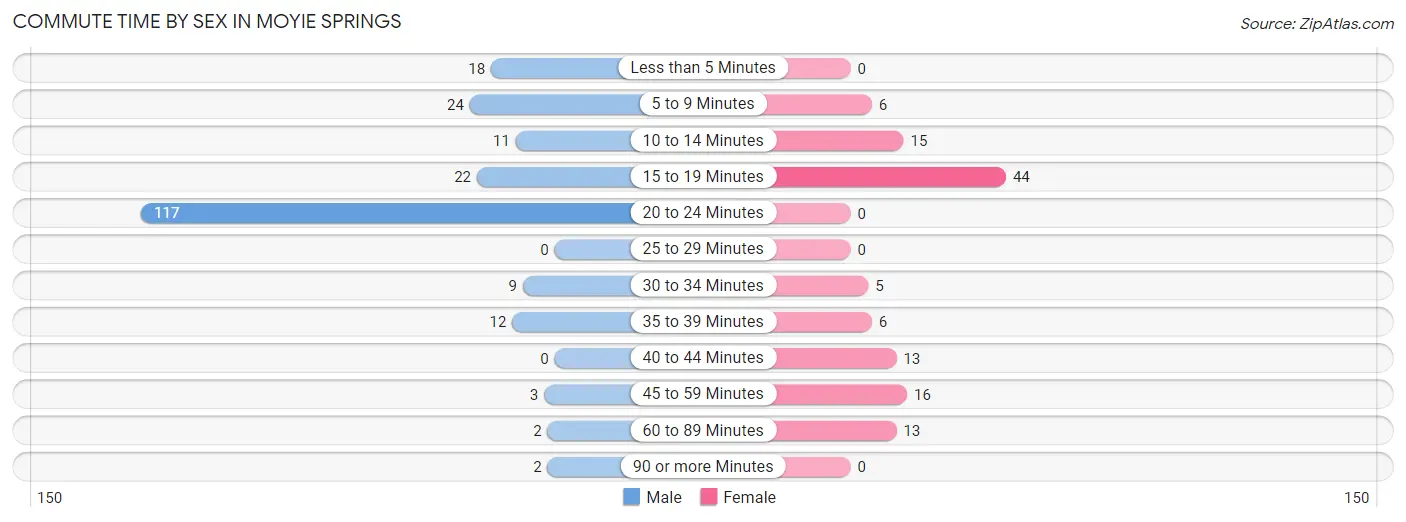
| Commute Time | Male | Female |
| Less than 5 Minutes | 18 (8.2%) | 0 (0.0%) |
| 5 to 9 Minutes | 24 (10.9%) | 6 (5.1%) |
| 10 to 14 Minutes | 11 (5.0%) | 15 (12.7%) |
| 15 to 19 Minutes | 22 (10.0%) | 44 (37.3%) |
| 20 to 24 Minutes | 117 (53.2%) | 0 (0.0%) |
| 25 to 29 Minutes | 0 (0.0%) | 0 (0.0%) |
| 30 to 34 Minutes | 9 (4.1%) | 5 (4.2%) |
| 35 to 39 Minutes | 12 (5.4%) | 6 (5.1%) |
| 40 to 44 Minutes | 0 (0.0%) | 13 (11.0%) |
| 45 to 59 Minutes | 3 (1.4%) | 16 (13.6%) |
| 60 to 89 Minutes | 2 (0.9%) | 13 (11.0%) |
| 90 or more Minutes | 2 (0.9%) | 0 (0.0%) |
Time of Departure to Work by Sex in Moyie Springs
The most frequent times of departure to work in Moyie Springs are 7:00 AM to 7:29 AM (109, 49.5%) for males and 9:00 AM to 9:59 AM (25, 21.2%) for females.
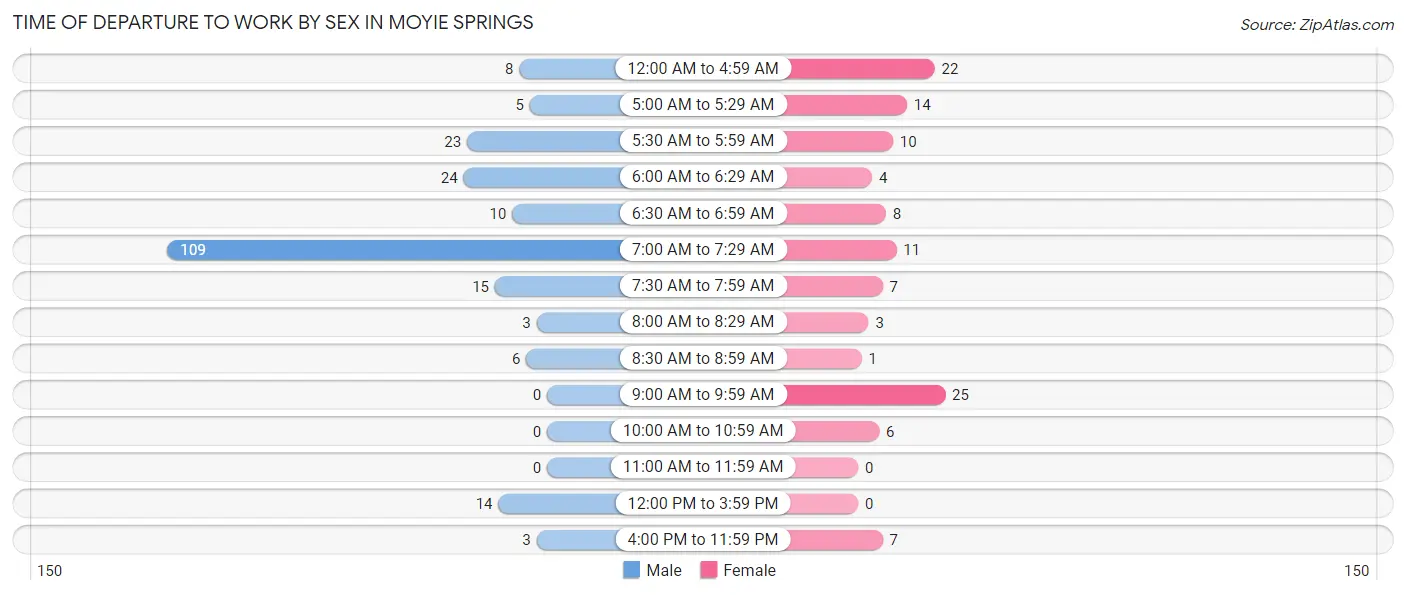
| Time of Departure | Male | Female |
| 12:00 AM to 4:59 AM | 8 (3.6%) | 22 (18.6%) |
| 5:00 AM to 5:29 AM | 5 (2.3%) | 14 (11.9%) |
| 5:30 AM to 5:59 AM | 23 (10.4%) | 10 (8.5%) |
| 6:00 AM to 6:29 AM | 24 (10.9%) | 4 (3.4%) |
| 6:30 AM to 6:59 AM | 10 (4.5%) | 8 (6.8%) |
| 7:00 AM to 7:29 AM | 109 (49.5%) | 11 (9.3%) |
| 7:30 AM to 7:59 AM | 15 (6.8%) | 7 (5.9%) |
| 8:00 AM to 8:29 AM | 3 (1.4%) | 3 (2.5%) |
| 8:30 AM to 8:59 AM | 6 (2.7%) | 1 (0.9%) |
| 9:00 AM to 9:59 AM | 0 (0.0%) | 25 (21.2%) |
| 10:00 AM to 10:59 AM | 0 (0.0%) | 6 (5.1%) |
| 11:00 AM to 11:59 AM | 0 (0.0%) | 0 (0.0%) |
| 12:00 PM to 3:59 PM | 14 (6.4%) | 0 (0.0%) |
| 4:00 PM to 11:59 PM | 3 (1.4%) | 7 (5.9%) |
| Total | 220 (100.0%) | 118 (100.0%) |
Housing Occupancy in Moyie Springs
Occupancy by Ownership in Moyie Springs
Of the total 478 dwellings in Moyie Springs, owner-occupied units account for 335 (70.1%), while renter-occupied units make up 143 (29.9%).
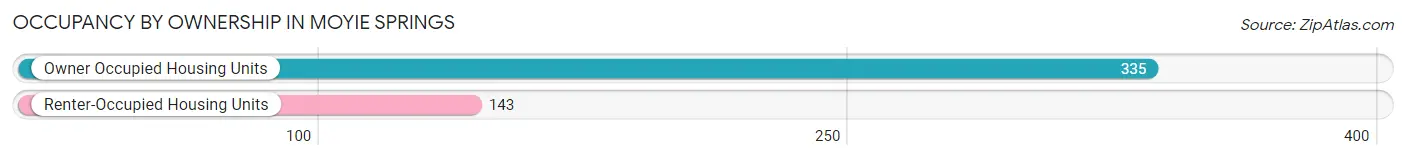
| Occupancy | # Housing Units | % Housing Units |
| Owner Occupied Housing Units | 335 | 70.1% |
| Renter-Occupied Housing Units | 143 | 29.9% |
| Total Occupied Housing Units | 478 | 100.0% |
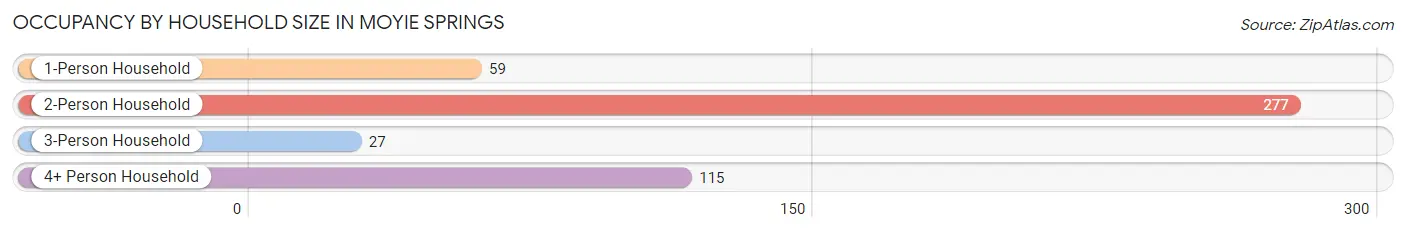
Occupancy by Household Size in Moyie Springs
| Household Size | # Housing Units | % Housing Units |
| 1-Person Household | 59 | 12.3% |
| 2-Person Household | 277 | 58.0% |
| 3-Person Household | 27 | 5.7% |
| 4+ Person Household | 115 | 24.1% |
| Total Housing Units | 478 | 100.0% |
Occupancy by Ownership by Household Size in Moyie Springs
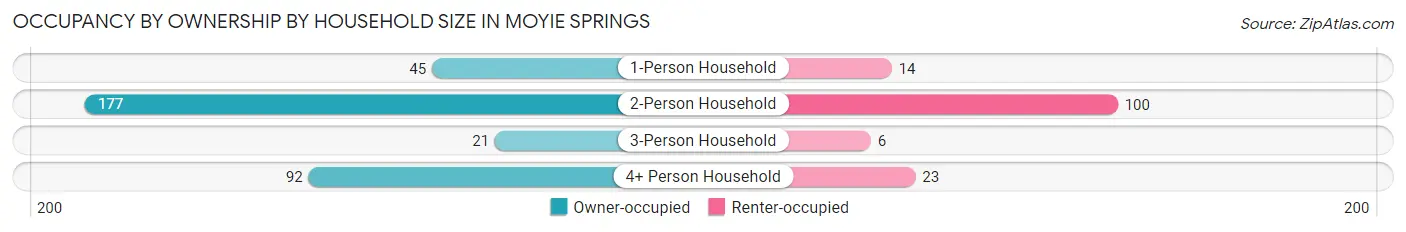
| Household Size | Owner-occupied | Renter-occupied |
| 1-Person Household | 45 (76.3%) | 14 (23.7%) |
| 2-Person Household | 177 (63.9%) | 100 (36.1%) |
| 3-Person Household | 21 (77.8%) | 6 (22.2%) |
| 4+ Person Household | 92 (80.0%) | 23 (20.0%) |
| Total Housing Units | 335 (70.1%) | 143 (29.9%) |
Occupancy by Educational Attainment in Moyie Springs
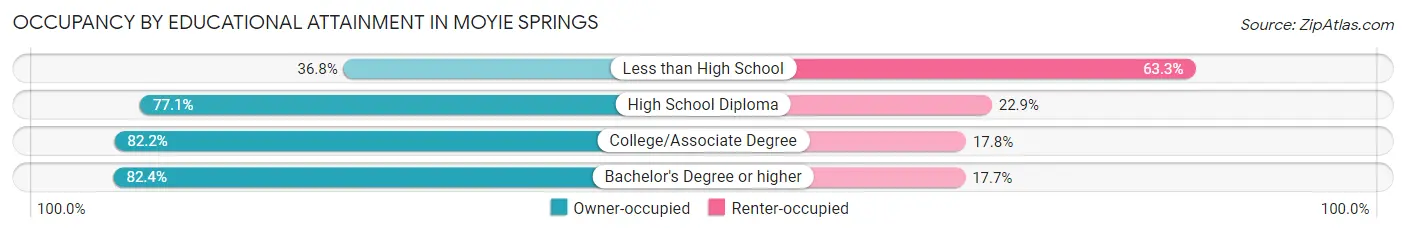
| Household Size | Owner-occupied | Renter-occupied |
| Less than High School | 43 (36.7%) | 74 (63.2%) |
| High School Diploma | 74 (77.1%) | 22 (22.9%) |
| College/Associate Degree | 120 (82.2%) | 26 (17.8%) |
| Bachelor's Degree or higher | 98 (82.4%) | 21 (17.6%) |
Occupancy by Age of Householder in Moyie Springs
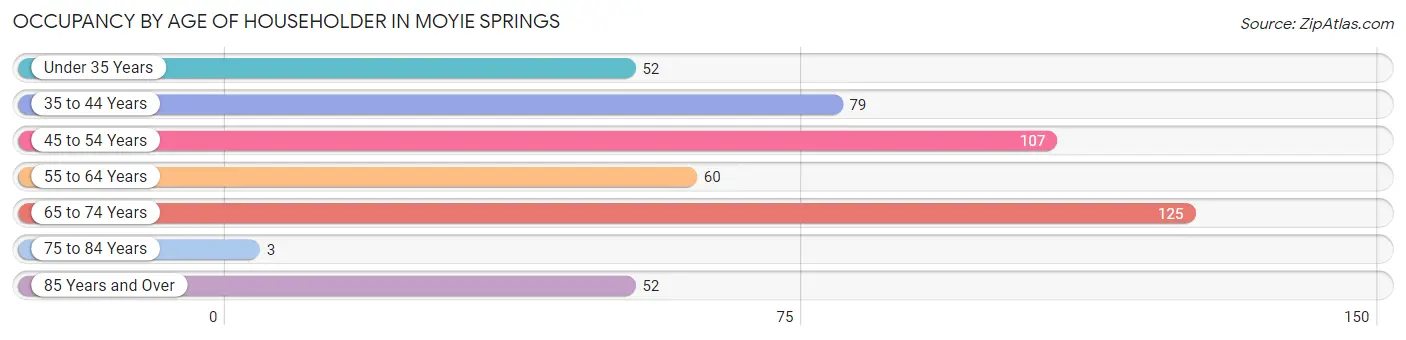
| Age Bracket | # Households | % Households |
| Under 35 Years | 52 | 10.9% |
| 35 to 44 Years | 79 | 16.5% |
| 45 to 54 Years | 107 | 22.4% |
| 55 to 64 Years | 60 | 12.6% |
| 65 to 74 Years | 125 | 26.2% |
| 75 to 84 Years | 3 | 0.6% |
| 85 Years and Over | 52 | 10.9% |
| Total | 478 | 100.0% |
Housing Finances in Moyie Springs
Median Income by Occupancy in Moyie Springs
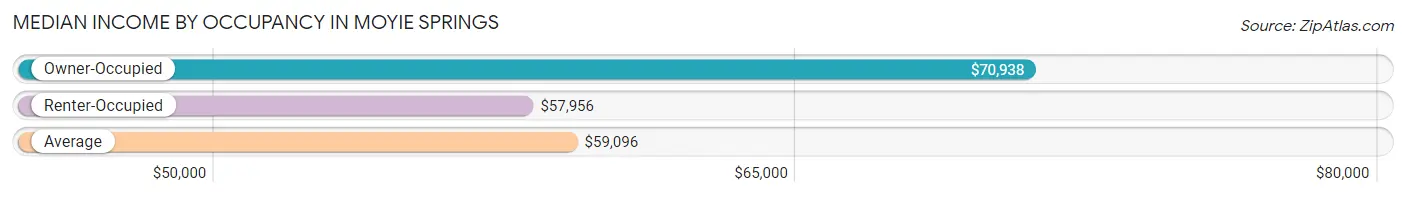
| Occupancy Type | # Households | Median Income |
| Owner-Occupied | 335 (70.1%) | $70,938 |
| Renter-Occupied | 143 (29.9%) | $57,956 |
| Average | 478 (100.0%) | $59,096 |
Occupancy by Householder Income Bracket in Moyie Springs
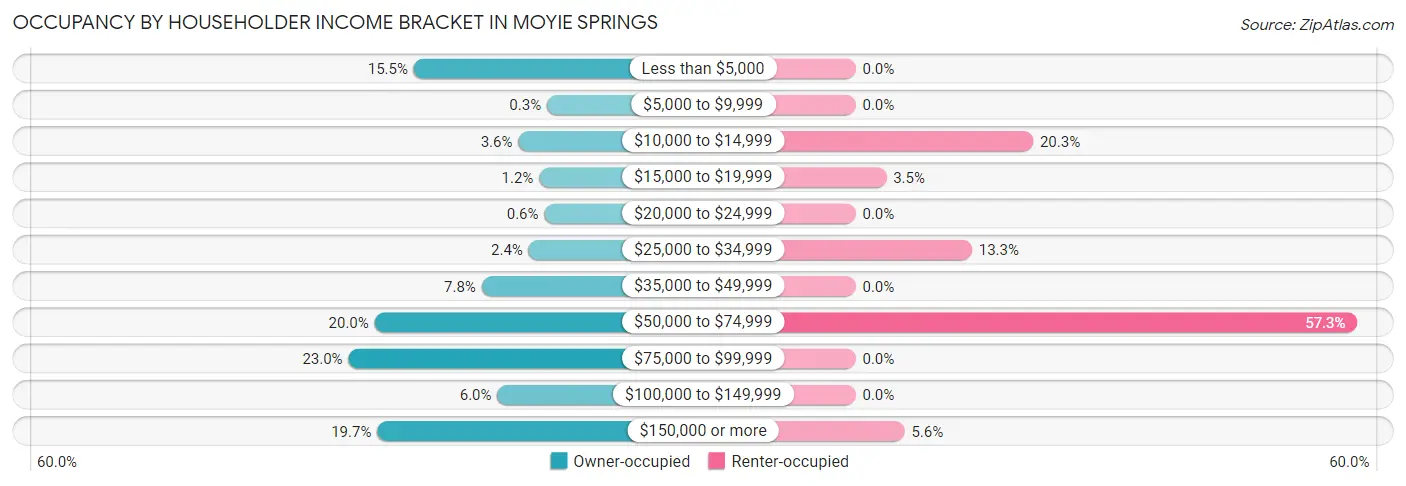
| Income Bracket | Owner-occupied | Renter-occupied |
| Less than $5,000 | 52 (15.5%) | 0 (0.0%) |
| $5,000 to $9,999 | 1 (0.3%) | 0 (0.0%) |
| $10,000 to $14,999 | 12 (3.6%) | 29 (20.3%) |
| $15,000 to $19,999 | 4 (1.2%) | 5 (3.5%) |
| $20,000 to $24,999 | 2 (0.6%) | 0 (0.0%) |
| $25,000 to $34,999 | 8 (2.4%) | 19 (13.3%) |
| $35,000 to $49,999 | 26 (7.8%) | 0 (0.0%) |
| $50,000 to $74,999 | 67 (20.0%) | 82 (57.3%) |
| $75,000 to $99,999 | 77 (23.0%) | 0 (0.0%) |
| $100,000 to $149,999 | 20 (6.0%) | 0 (0.0%) |
| $150,000 or more | 66 (19.7%) | 8 (5.6%) |
| Total | 335 (100.0%) | 143 (100.0%) |
Monthly Housing Cost Tiers in Moyie Springs
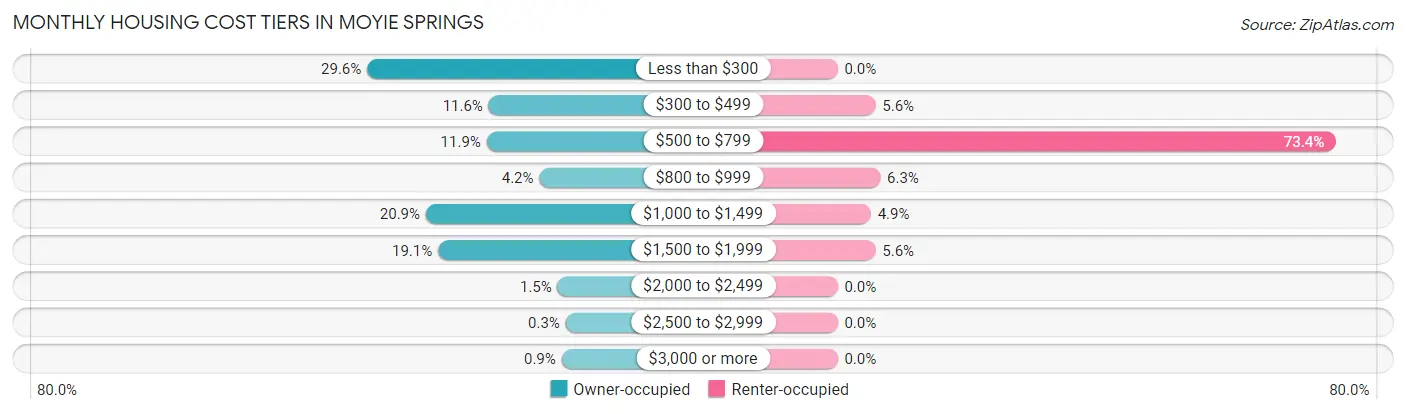
| Monthly Cost | Owner-occupied | Renter-occupied |
| Less than $300 | 99 (29.5%) | 0 (0.0%) |
| $300 to $499 | 39 (11.6%) | 8 (5.6%) |
| $500 to $799 | 40 (11.9%) | 105 (73.4%) |
| $800 to $999 | 14 (4.2%) | 9 (6.3%) |
| $1,000 to $1,499 | 70 (20.9%) | 7 (4.9%) |
| $1,500 to $1,999 | 64 (19.1%) | 8 (5.6%) |
| $2,000 to $2,499 | 5 (1.5%) | 0 (0.0%) |
| $2,500 to $2,999 | 1 (0.3%) | 0 (0.0%) |
| $3,000 or more | 3 (0.9%) | 0 (0.0%) |
| Total | 335 (100.0%) | 143 (100.0%) |
Physical Housing Characteristics in Moyie Springs
Housing Structures in Moyie Springs
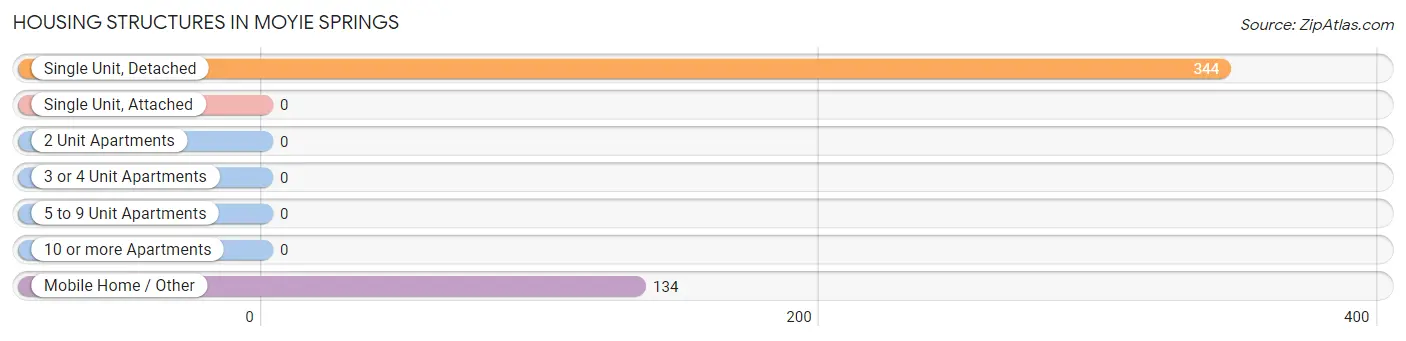
| Structure Type | # Housing Units | % Housing Units |
| Single Unit, Detached | 344 | 72.0% |
| Single Unit, Attached | 0 | 0.0% |
| 2 Unit Apartments | 0 | 0.0% |
| 3 or 4 Unit Apartments | 0 | 0.0% |
| 5 to 9 Unit Apartments | 0 | 0.0% |
| 10 or more Apartments | 0 | 0.0% |
| Mobile Home / Other | 134 | 28.0% |
| Total | 478 | 100.0% |
Housing Structures by Occupancy in Moyie Springs
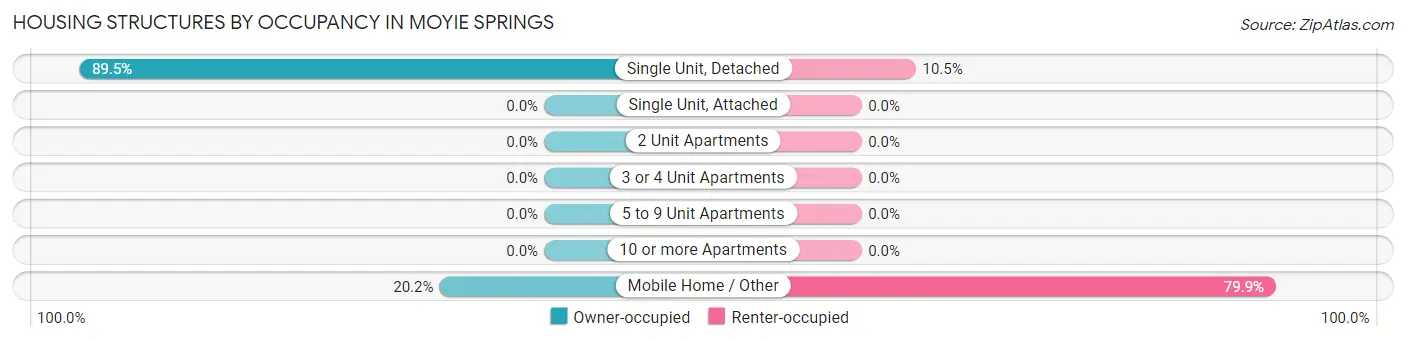
| Structure Type | Owner-occupied | Renter-occupied |
| Single Unit, Detached | 308 (89.5%) | 36 (10.5%) |
| Single Unit, Attached | 0 (0.0%) | 0 (0.0%) |
| 2 Unit Apartments | 0 (0.0%) | 0 (0.0%) |
| 3 or 4 Unit Apartments | 0 (0.0%) | 0 (0.0%) |
| 5 to 9 Unit Apartments | 0 (0.0%) | 0 (0.0%) |
| 10 or more Apartments | 0 (0.0%) | 0 (0.0%) |
| Mobile Home / Other | 27 (20.2%) | 107 (79.8%) |
| Total | 335 (70.1%) | 143 (29.9%) |
Housing Structures by Number of Rooms in Moyie Springs
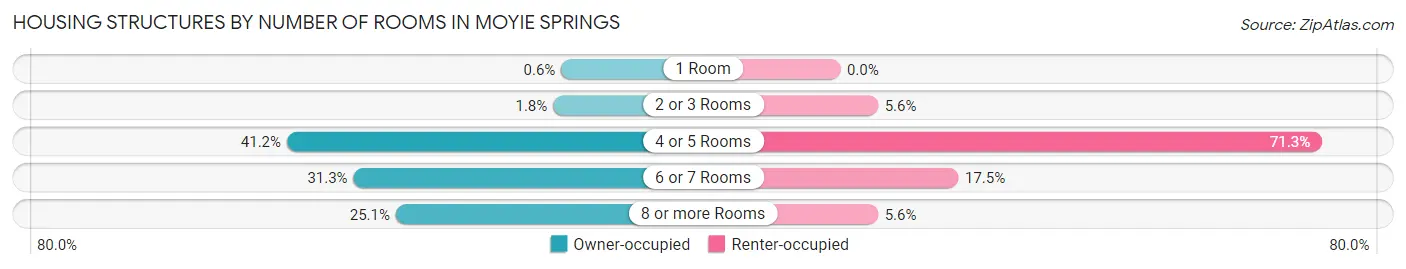
| Number of Rooms | Owner-occupied | Renter-occupied |
| 1 Room | 2 (0.6%) | 0 (0.0%) |
| 2 or 3 Rooms | 6 (1.8%) | 8 (5.6%) |
| 4 or 5 Rooms | 138 (41.2%) | 102 (71.3%) |
| 6 or 7 Rooms | 105 (31.3%) | 25 (17.5%) |
| 8 or more Rooms | 84 (25.1%) | 8 (5.6%) |
| Total | 335 (100.0%) | 143 (100.0%) |
Housing Structure by Heating Type in Moyie Springs
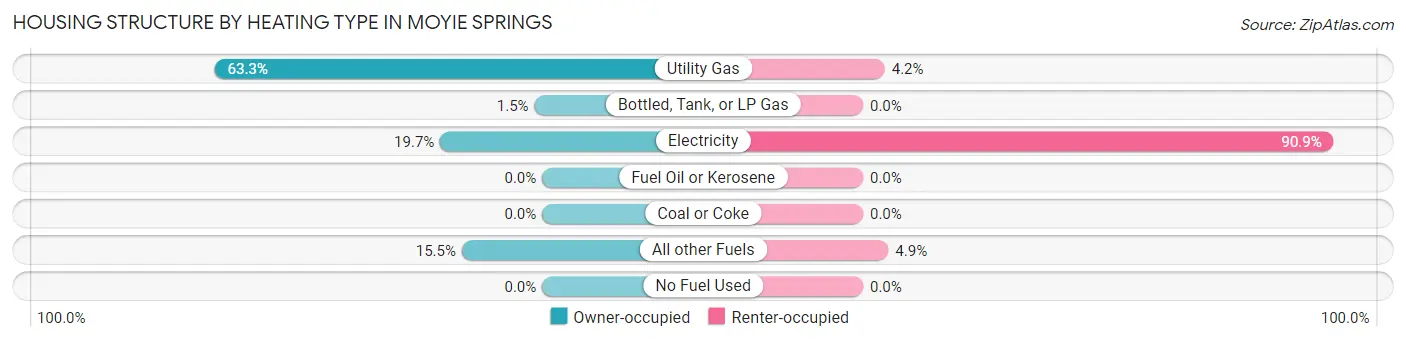
| Heating Type | Owner-occupied | Renter-occupied |
| Utility Gas | 212 (63.3%) | 6 (4.2%) |
| Bottled, Tank, or LP Gas | 5 (1.5%) | 0 (0.0%) |
| Electricity | 66 (19.7%) | 130 (90.9%) |
| Fuel Oil or Kerosene | 0 (0.0%) | 0 (0.0%) |
| Coal or Coke | 0 (0.0%) | 0 (0.0%) |
| All other Fuels | 52 (15.5%) | 7 (4.9%) |
| No Fuel Used | 0 (0.0%) | 0 (0.0%) |
| Total | 335 (100.0%) | 143 (100.0%) |
Household Vehicle Usage in Moyie Springs
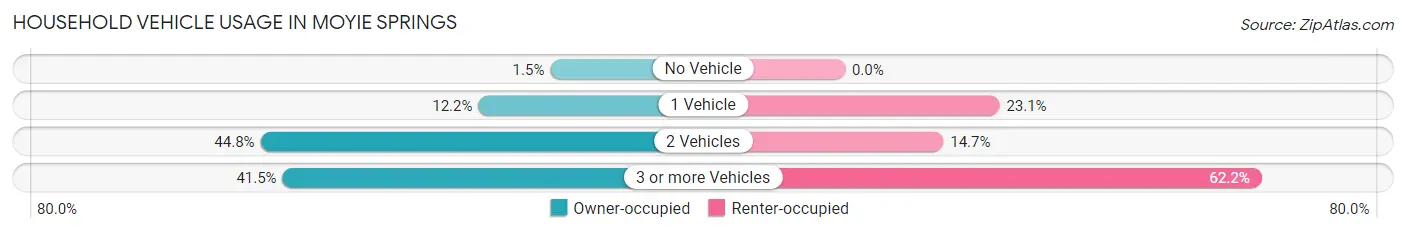
| Vehicles per Household | Owner-occupied | Renter-occupied |
| No Vehicle | 5 (1.5%) | 0 (0.0%) |
| 1 Vehicle | 41 (12.2%) | 33 (23.1%) |
| 2 Vehicles | 150 (44.8%) | 21 (14.7%) |
| 3 or more Vehicles | 139 (41.5%) | 89 (62.2%) |
| Total | 335 (100.0%) | 143 (100.0%) |
Real Estate & Mortgages in Moyie Springs
Real Estate and Mortgage Overview in Moyie Springs
| Characteristic | Without Mortgage | With Mortgage |
| Housing Units | 152 | 183 |
| Median Property Value | $372,400 | $303,400 |
| Median Household Income | $56,591 | $41 |
| Monthly Housing Costs | $286 | $3 |
| Real Estate Taxes | $1,382 | $0 |
Property Value by Mortgage Status in Moyie Springs
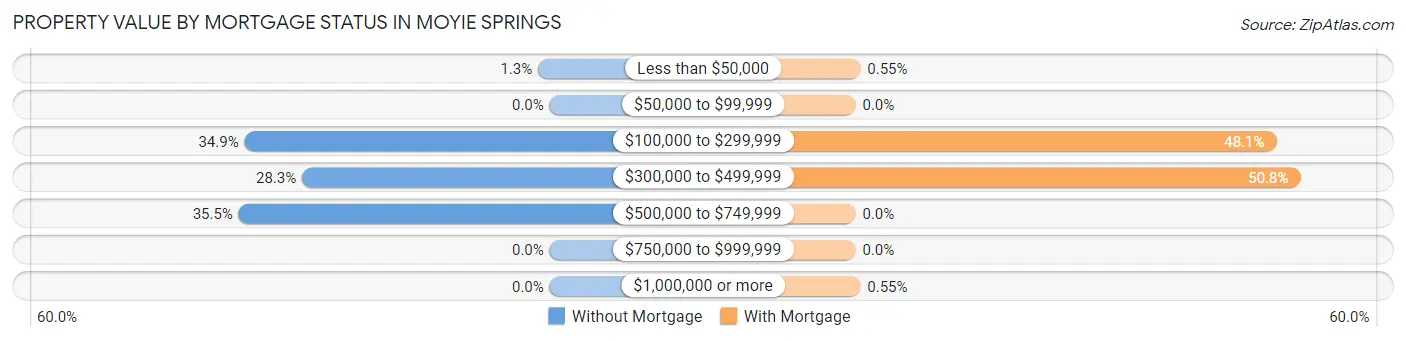
| Property Value | Without Mortgage | With Mortgage |
| Less than $50,000 | 2 (1.3%) | 1 (0.5%) |
| $50,000 to $99,999 | 0 (0.0%) | 0 (0.0%) |
| $100,000 to $299,999 | 53 (34.9%) | 88 (48.1%) |
| $300,000 to $499,999 | 43 (28.3%) | 93 (50.8%) |
| $500,000 to $749,999 | 54 (35.5%) | 0 (0.0%) |
| $750,000 to $999,999 | 0 (0.0%) | 0 (0.0%) |
| $1,000,000 or more | 0 (0.0%) | 1 (0.5%) |
| Total | 152 (100.0%) | 183 (100.0%) |
Household Income by Mortgage Status in Moyie Springs
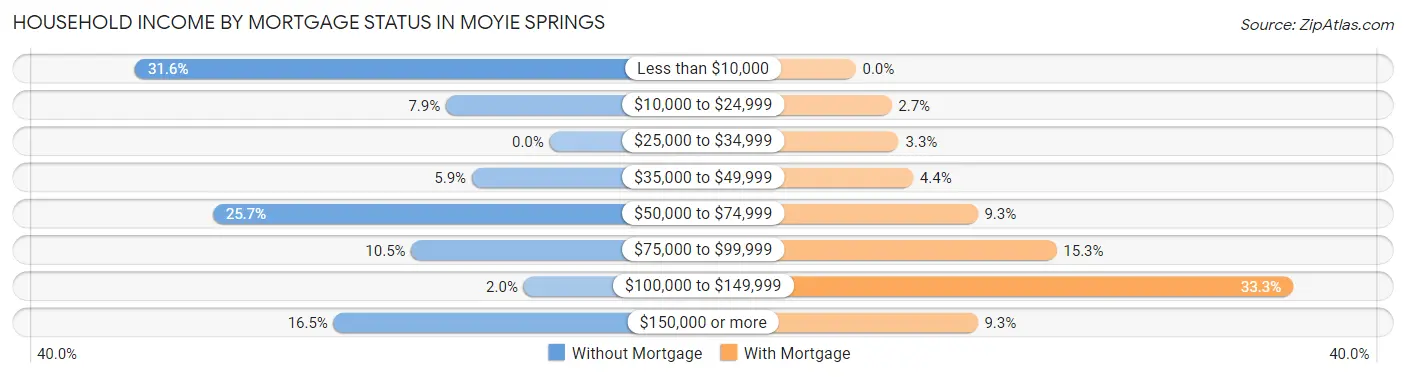
| Household Income | Without Mortgage | With Mortgage |
| Less than $10,000 | 48 (31.6%) | 0 (0.0%) |
| $10,000 to $24,999 | 12 (7.9%) | 5 (2.7%) |
| $25,000 to $34,999 | 0 (0.0%) | 6 (3.3%) |
| $35,000 to $49,999 | 9 (5.9%) | 8 (4.4%) |
| $50,000 to $74,999 | 39 (25.7%) | 17 (9.3%) |
| $75,000 to $99,999 | 16 (10.5%) | 28 (15.3%) |
| $100,000 to $149,999 | 3 (2.0%) | 61 (33.3%) |
| $150,000 or more | 25 (16.5%) | 17 (9.3%) |
| Total | 152 (100.0%) | 183 (100.0%) |
Property Value to Household Income Ratio in Moyie Springs
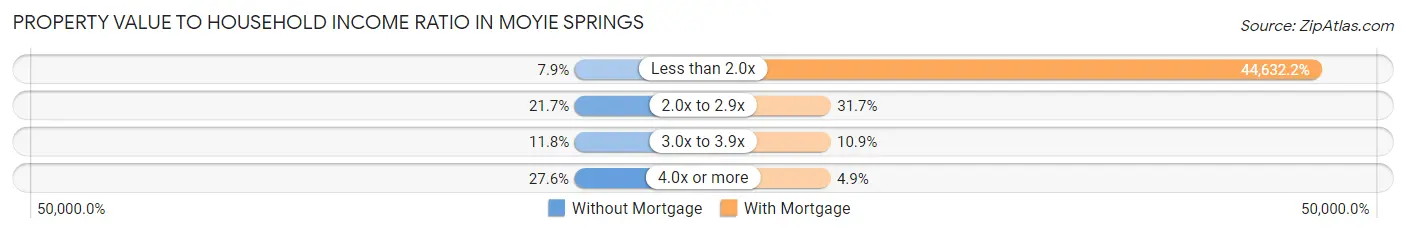
| Value-to-Income Ratio | Without Mortgage | With Mortgage |
| Less than 2.0x | 12 (7.9%) | 81,677 (44,632.2%) |
| 2.0x to 2.9x | 33 (21.7%) | 58 (31.7%) |
| 3.0x to 3.9x | 18 (11.8%) | 20 (10.9%) |
| 4.0x or more | 42 (27.6%) | 9 (4.9%) |
| Total | 152 (100.0%) | 183 (100.0%) |
Real Estate Taxes by Mortgage Status in Moyie Springs
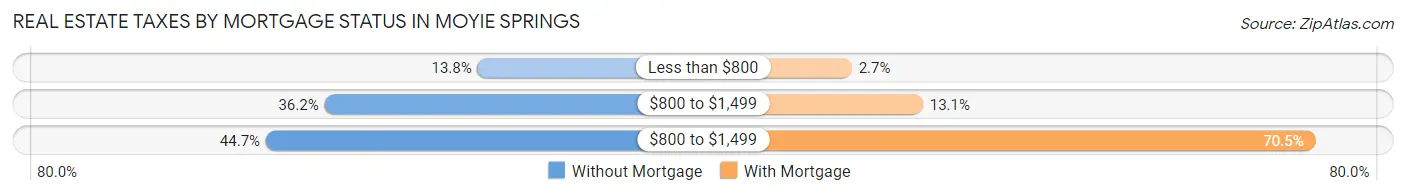
| Property Taxes | Without Mortgage | With Mortgage |
| Less than $800 | 21 (13.8%) | 5 (2.7%) |
| $800 to $1,499 | 55 (36.2%) | 24 (13.1%) |
| $800 to $1,499 | 68 (44.7%) | 129 (70.5%) |
| Total | 152 (100.0%) | 183 (100.0%) |
Health & Disability in Moyie Springs
Health Insurance Coverage by Age in Moyie Springs
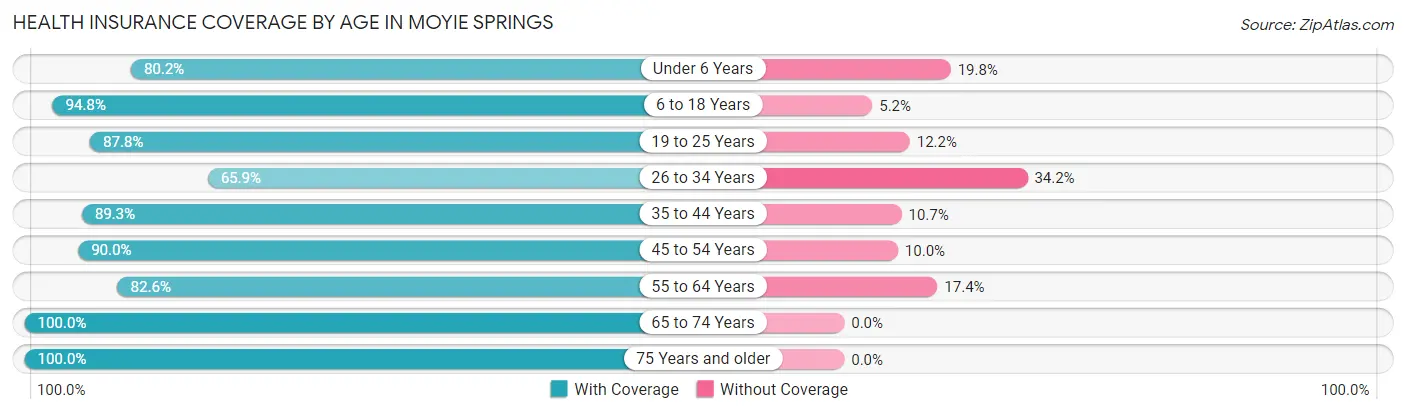
| Age Bracket | With Coverage | Without Coverage |
| Under 6 Years | 101 (80.2%) | 25 (19.8%) |
| 6 to 18 Years | 218 (94.8%) | 12 (5.2%) |
| 19 to 25 Years | 115 (87.8%) | 16 (12.2%) |
| 26 to 34 Years | 54 (65.8%) | 28 (34.2%) |
| 35 to 44 Years | 134 (89.3%) | 16 (10.7%) |
| 45 to 54 Years | 135 (90.0%) | 15 (10.0%) |
| 55 to 64 Years | 119 (82.6%) | 25 (17.4%) |
| 65 to 74 Years | 185 (100.0%) | 0 (0.0%) |
| 75 Years and older | 95 (100.0%) | 0 (0.0%) |
| Total | 1,156 (89.4%) | 137 (10.6%) |
Health Insurance Coverage by Citizenship Status in Moyie Springs
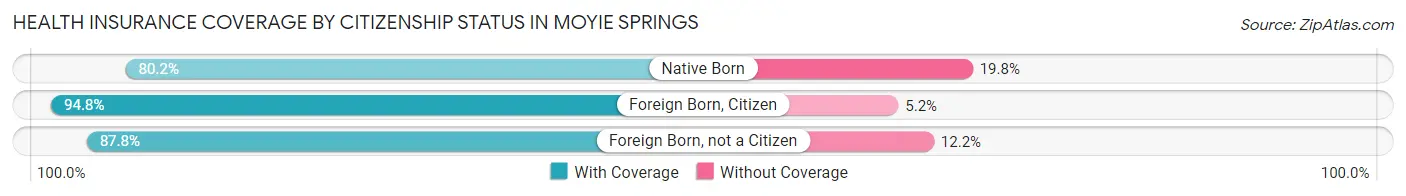
| Citizenship Status | With Coverage | Without Coverage |
| Native Born | 101 (80.2%) | 25 (19.8%) |
| Foreign Born, Citizen | 218 (94.8%) | 12 (5.2%) |
| Foreign Born, not a Citizen | 115 (87.8%) | 16 (12.2%) |
Health Insurance Coverage by Household Income in Moyie Springs
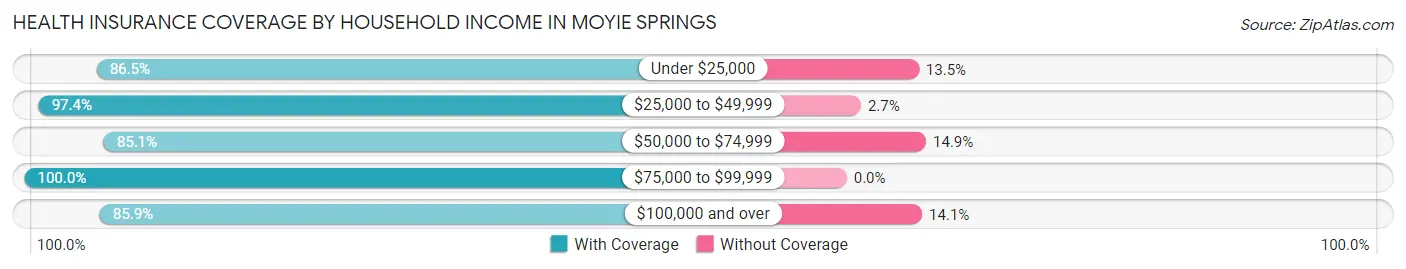
| Household Income | With Coverage | Without Coverage |
| Under $25,000 | 192 (86.5%) | 30 (13.5%) |
| $25,000 to $49,999 | 147 (97.4%) | 4 (2.6%) |
| $50,000 to $74,999 | 315 (85.1%) | 55 (14.9%) |
| $75,000 to $99,999 | 210 (100.0%) | 0 (0.0%) |
| $100,000 and over | 292 (85.9%) | 48 (14.1%) |
Public vs Private Health Insurance Coverage by Age in Moyie Springs
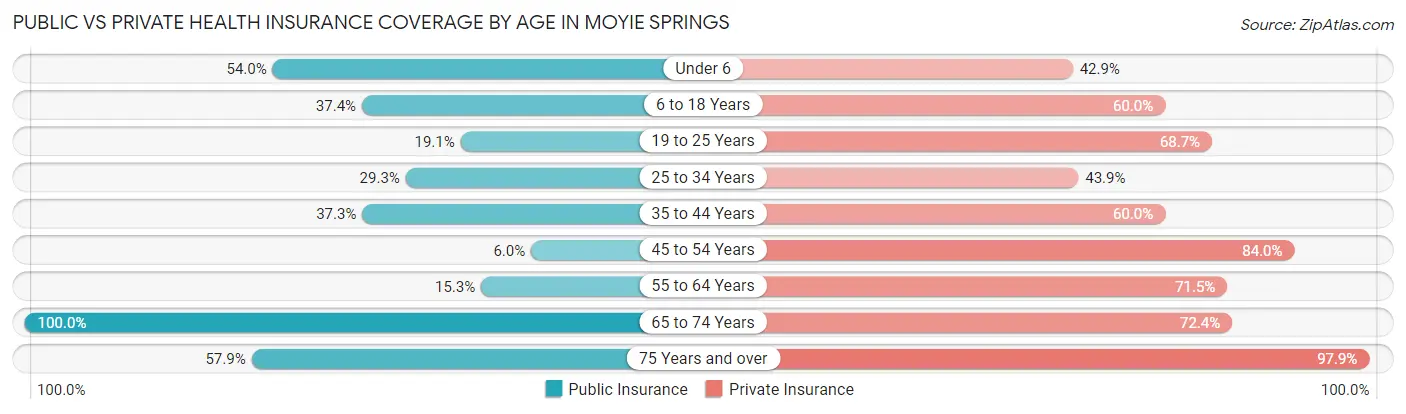
| Age Bracket | Public Insurance | Private Insurance |
| Under 6 | 68 (54.0%) | 54 (42.9%) |
| 6 to 18 Years | 86 (37.4%) | 138 (60.0%) |
| 19 to 25 Years | 25 (19.1%) | 90 (68.7%) |
| 25 to 34 Years | 24 (29.3%) | 36 (43.9%) |
| 35 to 44 Years | 56 (37.3%) | 90 (60.0%) |
| 45 to 54 Years | 9 (6.0%) | 126 (84.0%) |
| 55 to 64 Years | 22 (15.3%) | 103 (71.5%) |
| 65 to 74 Years | 185 (100.0%) | 134 (72.4%) |
| 75 Years and over | 55 (57.9%) | 93 (97.9%) |
| Total | 530 (41.0%) | 864 (66.8%) |
Disability Status by Sex by Age in Moyie Springs
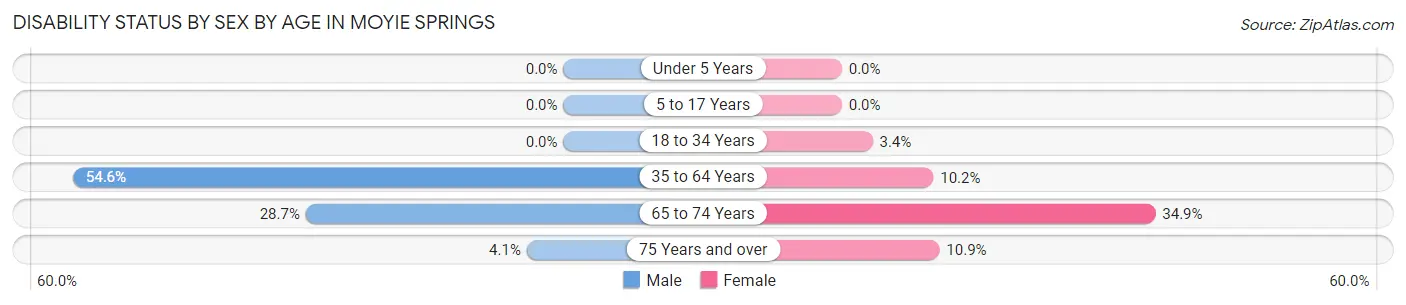
| Age Bracket | Male | Female |
| Under 5 Years | 0 (0.0%) | 0 (0.0%) |
| 5 to 17 Years | 0 (0.0%) | 0 (0.0%) |
| 18 to 34 Years | 0 (0.0%) | 5 (3.4%) |
| 35 to 64 Years | 130 (54.6%) | 21 (10.2%) |
| 65 to 74 Years | 35 (28.7%) | 22 (34.9%) |
| 75 Years and over | 2 (4.1%) | 5 (10.9%) |
Disability Class by Sex by Age in Moyie Springs
Disability Class: Hearing Difficulty
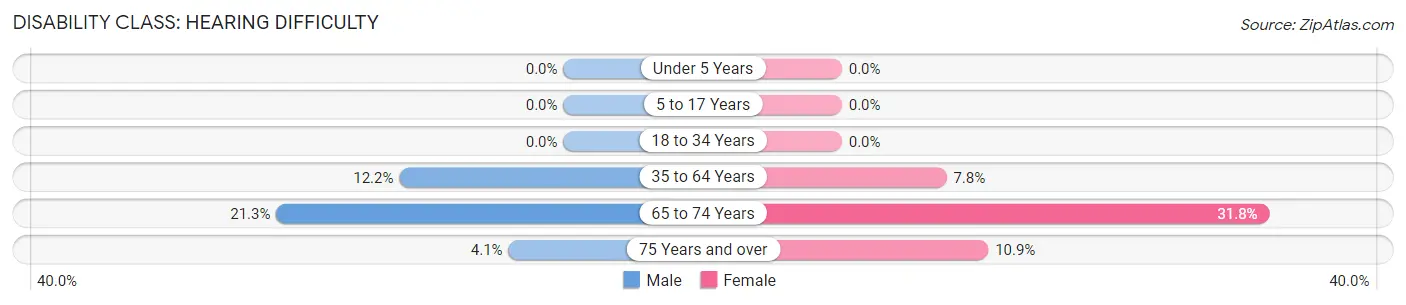
| Age Bracket | Male | Female |
| Under 5 Years | 0 (0.0%) | 0 (0.0%) |
| 5 to 17 Years | 0 (0.0%) | 0 (0.0%) |
| 18 to 34 Years | 0 (0.0%) | 0 (0.0%) |
| 35 to 64 Years | 29 (12.2%) | 16 (7.8%) |
| 65 to 74 Years | 26 (21.3%) | 20 (31.8%) |
| 75 Years and over | 2 (4.1%) | 5 (10.9%) |
Disability Class: Vision Difficulty
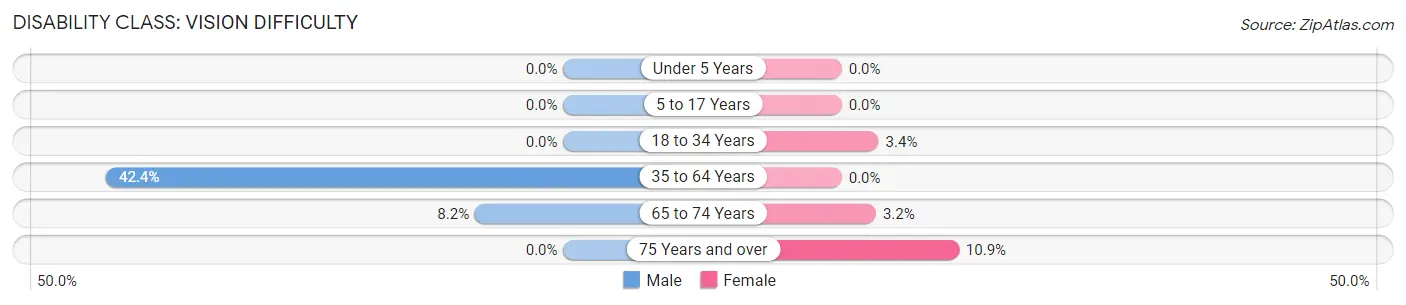
| Age Bracket | Male | Female |
| Under 5 Years | 0 (0.0%) | 0 (0.0%) |
| 5 to 17 Years | 0 (0.0%) | 0 (0.0%) |
| 18 to 34 Years | 0 (0.0%) | 5 (3.4%) |
| 35 to 64 Years | 101 (42.4%) | 0 (0.0%) |
| 65 to 74 Years | 10 (8.2%) | 2 (3.2%) |
| 75 Years and over | 0 (0.0%) | 5 (10.9%) |
Disability Class: Cognitive Difficulty
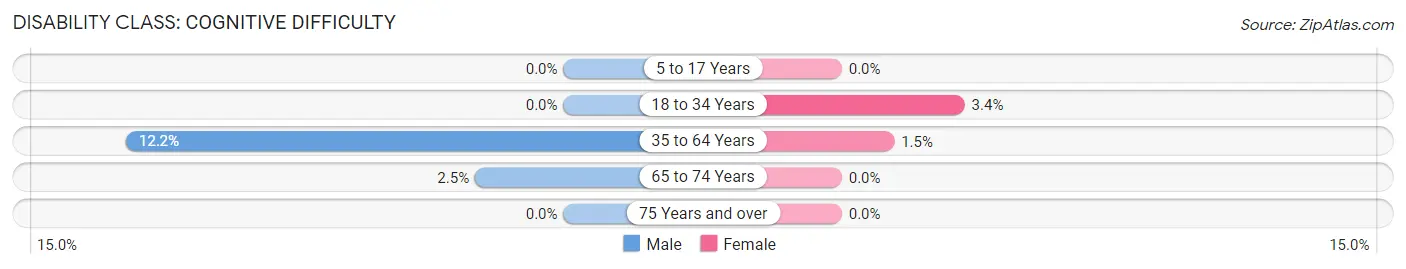
| Age Bracket | Male | Female |
| 5 to 17 Years | 0 (0.0%) | 0 (0.0%) |
| 18 to 34 Years | 0 (0.0%) | 5 (3.4%) |
| 35 to 64 Years | 29 (12.2%) | 3 (1.5%) |
| 65 to 74 Years | 3 (2.5%) | 0 (0.0%) |
| 75 Years and over | 0 (0.0%) | 0 (0.0%) |
Disability Class: Ambulatory Difficulty
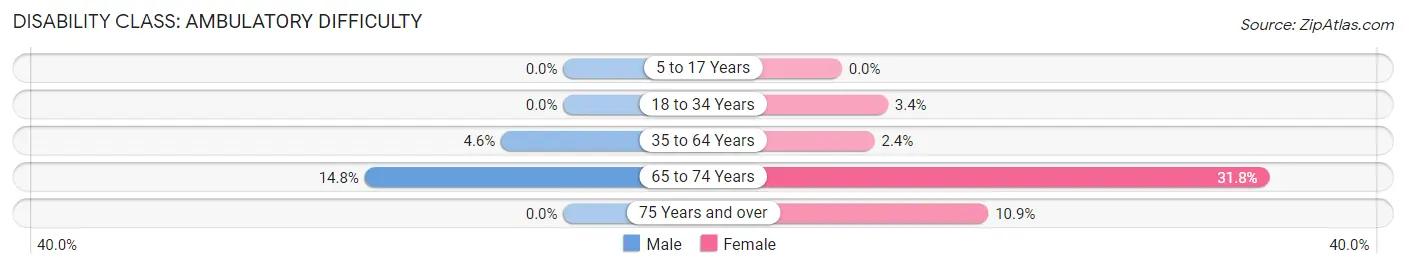
| Age Bracket | Male | Female |
| 5 to 17 Years | 0 (0.0%) | 0 (0.0%) |
| 18 to 34 Years | 0 (0.0%) | 5 (3.4%) |
| 35 to 64 Years | 11 (4.6%) | 5 (2.4%) |
| 65 to 74 Years | 18 (14.7%) | 20 (31.8%) |
| 75 Years and over | 0 (0.0%) | 5 (10.9%) |
Disability Class: Self-Care Difficulty
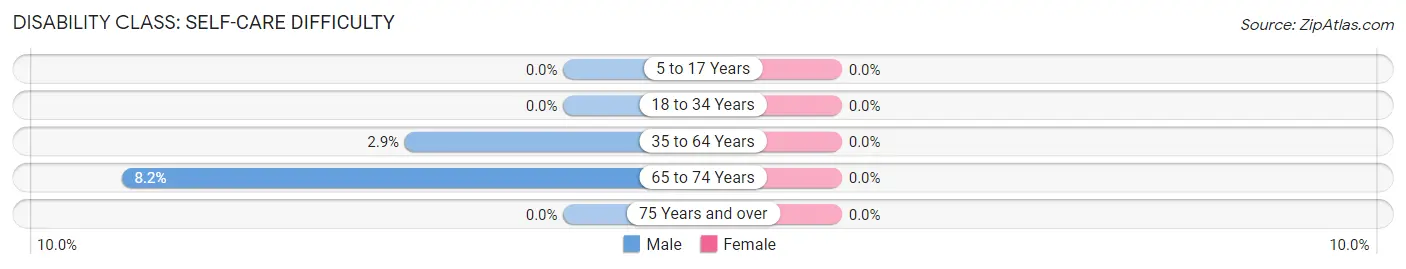
| Age Bracket | Male | Female |
| 5 to 17 Years | 0 (0.0%) | 0 (0.0%) |
| 18 to 34 Years | 0 (0.0%) | 0 (0.0%) |
| 35 to 64 Years | 7 (2.9%) | 0 (0.0%) |
| 65 to 74 Years | 10 (8.2%) | 0 (0.0%) |
| 75 Years and over | 0 (0.0%) | 0 (0.0%) |
Technology Access in Moyie Springs
Computing Device Access in Moyie Springs
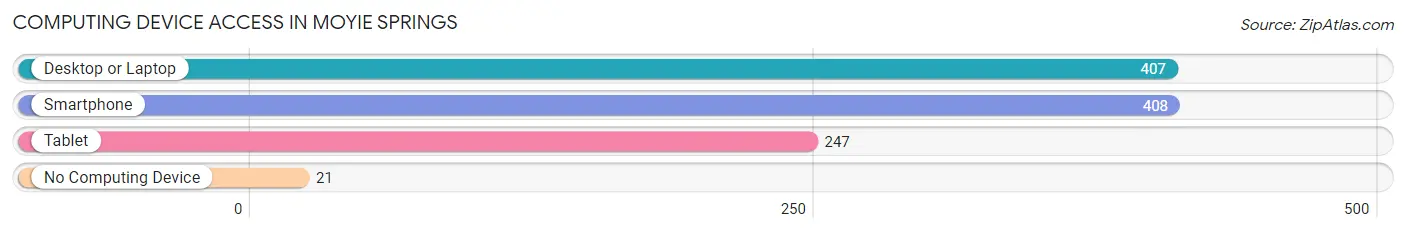
| Device Type | # Households | % Households |
| Desktop or Laptop | 407 | 85.2% |
| Smartphone | 408 | 85.4% |
| Tablet | 247 | 51.7% |
| No Computing Device | 21 | 4.4% |
| Total | 478 | 100.0% |
Internet Access in Moyie Springs
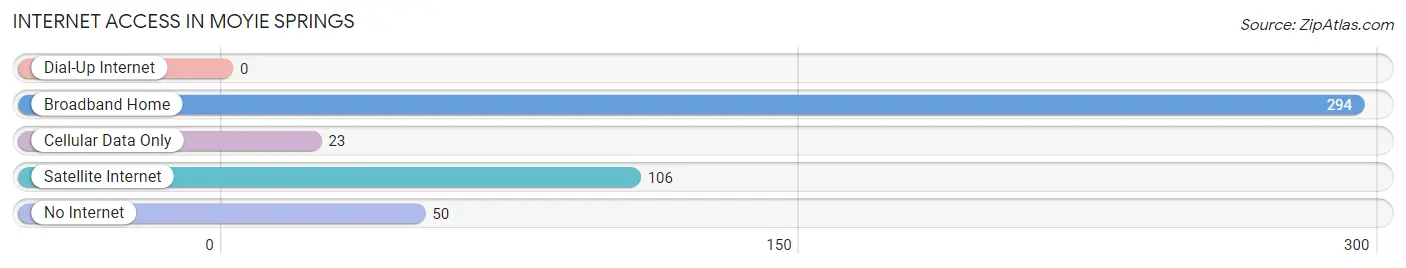
| Internet Type | # Households | % Households |
| Dial-Up Internet | 0 | 0.0% |
| Broadband Home | 294 | 61.5% |
| Cellular Data Only | 23 | 4.8% |
| Satellite Internet | 106 | 22.2% |
| No Internet | 50 | 10.5% |
| Total | 478 | 100.0% |
Moyie Springs Summary
Moyie Springs is a small city located in Boundary County, Idaho, United States. It is situated on the Moyie River, near the Canadian border. The city has a population of approximately 500 people and is the county seat of Boundary County.
History
Moyie Springs was founded in 1883 by a group of prospectors who were searching for gold in the area. The town was named after the Moyie River, which was named after a local Native American chief. The town quickly grew and became a major trading center for the region. In 1887, the town was incorporated and a post office was established.
In the early 1900s, the town was a major hub for the timber industry. The town was home to several sawmills and lumber companies. The timber industry was the main source of employment for the town until the 1950s, when the industry began to decline.
In the late 1950s, the town began to experience a population decline as people moved away to find work in other areas. The population of the town has remained relatively stable since then.
Geography
Moyie Springs is located in Boundary County, Idaho, United States. It is situated on the Moyie River, near the Canadian border. The city has a total area of 1.2 square miles, all of which is land. The city is located at an elevation of 2,743 feet above sea level.
The climate in Moyie Springs is classified as a humid continental climate, with cold winters and warm summers. The average annual temperature is 44.3°F, with an average high of 57.2°F and an average low of 31.4°F. The average annual precipitation is 17.3 inches.
Economy
Moyie Springs is a small town with a limited economy. The main sources of employment are in the timber industry, agriculture, and tourism. The timber industry is the largest employer in the area, with several sawmills and lumber companies located in the town. Agriculture is also an important part of the local economy, with several farms located in the area. Tourism is also an important part of the local economy, with several recreational activities available in the area.
Demographics
As of the 2010 census, the population of Moyie Springs was 498 people. The racial makeup of the town was 95.2% White, 0.2% African American, 0.4% Native American, 0.2% Asian, 0.2% Pacific Islander, 0.2% from other races, and 3.8% from two or more races. The median household income was $31,250, and the median family income was $37,500. The per capita income was $17,818. About 11.2% of the population was below the poverty line.
Common Questions
What is Per Capita Income in Moyie Springs?
Per Capita income in Moyie Springs is $26,705.
What is the Median Family Income in Moyie Springs?
Median Family Income in Moyie Springs is $59,819.
What is the Median Household income in Moyie Springs?
Median Household Income in Moyie Springs is $59,096.
What is Income or Wage Gap in Moyie Springs?
Income or Wage Gap in Moyie Springs is 63.7%.
Women in Moyie Springs earn 36.3 cents for every dollar earned by a man.
What is Inequality or Gini Index in Moyie Springs?
Inequality or Gini Index in Moyie Springs is 0.47.
What is the Total Population of Moyie Springs?
Total Population of Moyie Springs is 1,293.
What is the Total Male Population of Moyie Springs?
Total Male Population of Moyie Springs is 676.
What is the Total Female Population of Moyie Springs?
Total Female Population of Moyie Springs is 617.
What is the Ratio of Males per 100 Females in Moyie Springs?
There are 109.56 Males per 100 Females in Moyie Springs.
What is the Ratio of Females per 100 Males in Moyie Springs?
There are 91.27 Females per 100 Males in Moyie Springs.
What is the Median Population Age in Moyie Springs?
Median Population Age in Moyie Springs is 40.7 Years.
What is the Average Family Size in Moyie Springs
Average Family Size in Moyie Springs is 2.9 People.
What is the Average Household Size in Moyie Springs
Average Household Size in Moyie Springs is 2.7 People.
How Large is the Labor Force in Moyie Springs?
There are 431 People in the Labor Forcein in Moyie Springs.
What is the Percentage of People in the Labor Force in Moyie Springs?
43.9% of People are in the Labor Force in Moyie Springs.
What is the Unemployment Rate in Moyie Springs?
Unemployment Rate in Moyie Springs is 6.3%.