Montpelier, ID Map & Demographics
Montpelier Map
Montpelier Overview
$27,350
PER CAPITA INCOME
$70,625
AVG FAMILY INCOME
$50,668
AVG HOUSEHOLD INCOME
45.6%
WAGE / INCOME GAP [ % ]
54.4¢/ $1
WAGE / INCOME GAP [ $ ]
0.44
INEQUALITY / GINI INDEX
2,649
TOTAL POPULATION
1,331
MALE POPULATION
1,318
FEMALE POPULATION
100.99
MALES / 100 FEMALES
99.02
FEMALES / 100 MALES
37.4
MEDIAN AGE
3.2
AVG FAMILY SIZE
2.5
AVG HOUSEHOLD SIZE
1,211
LABOR FORCE [ PEOPLE ]
58.5%
PERCENT IN LABOR FORCE
7.3%
UNEMPLOYMENT RATE
Montpelier Zip Codes
Montpelier Area Codes
Income in Montpelier
Income Overview in Montpelier
Per Capita Income in Montpelier is $27,350, while median incomes of families and households are $70,625 and $50,668 respectively.
| Characteristic | Number | Measure |
| Per Capita Income | 2,649 | $27,350 |
| Median Family Income | 667 | $70,625 |
| Mean Family Income | 667 | $86,419 |
| Median Household Income | 1,037 | $50,668 |
| Mean Household Income | 1,037 | $66,549 |
| Income Deficit | 667 | $0 |
| Wage / Income Gap (%) | 2,649 | 45.56% |
| Wage / Income Gap ($) | 2,649 | 54.44¢ per $1 |
| Gini / Inequality Index | 2,649 | 0.44 |
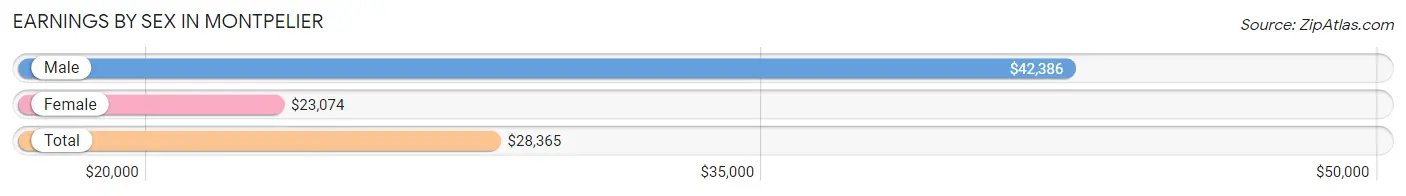
Earnings by Sex in Montpelier
Average Earnings in Montpelier are $28,365, $42,386 for men and $23,074 for women, a difference of 45.6%.
| Sex | Number | Average Earnings |
| Male | 675 (52.4%) | $42,386 |
| Female | 614 (47.6%) | $23,074 |
| Total | 1,289 (100.0%) | $28,365 |
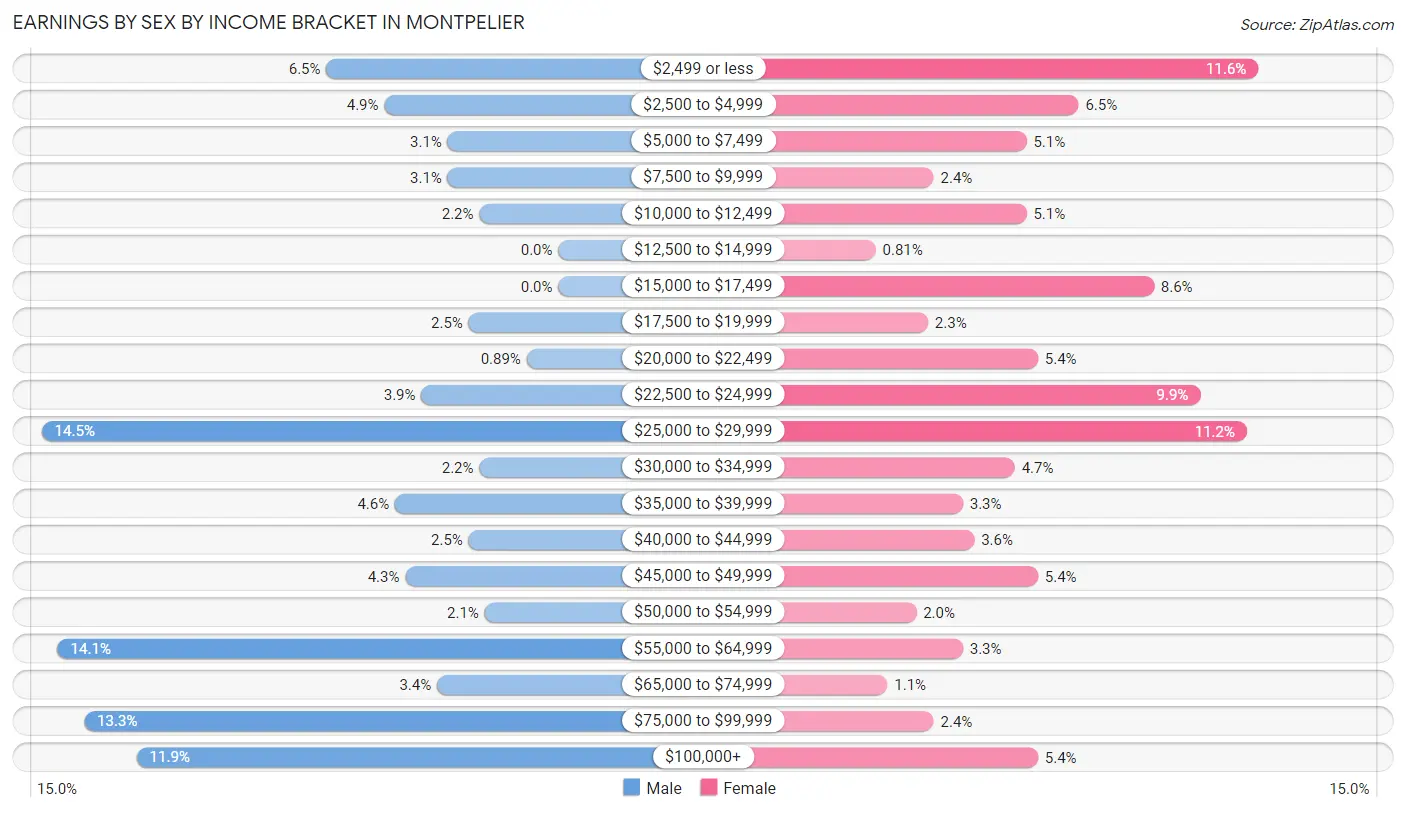
Earnings by Sex by Income Bracket in Montpelier
The most common earnings brackets in Montpelier are $25,000 to $29,999 for men (98 | 14.5%) and $2,499 or less for women (71 | 11.6%).
| Income | Male | Female |
| $2,499 or less | 44 (6.5%) | 71 (11.6%) |
| $2,500 to $4,999 | 33 (4.9%) | 40 (6.5%) |
| $5,000 to $7,499 | 21 (3.1%) | 31 (5.1%) |
| $7,500 to $9,999 | 21 (3.1%) | 15 (2.4%) |
| $10,000 to $12,499 | 15 (2.2%) | 31 (5.1%) |
| $12,500 to $14,999 | 0 (0.0%) | 5 (0.8%) |
| $15,000 to $17,499 | 0 (0.0%) | 53 (8.6%) |
| $17,500 to $19,999 | 17 (2.5%) | 14 (2.3%) |
| $20,000 to $22,499 | 6 (0.9%) | 33 (5.4%) |
| $22,500 to $24,999 | 26 (3.8%) | 61 (9.9%) |
| $25,000 to $29,999 | 98 (14.5%) | 69 (11.2%) |
| $30,000 to $34,999 | 15 (2.2%) | 29 (4.7%) |
| $35,000 to $39,999 | 31 (4.6%) | 20 (3.3%) |
| $40,000 to $44,999 | 17 (2.5%) | 22 (3.6%) |
| $45,000 to $49,999 | 29 (4.3%) | 33 (5.4%) |
| $50,000 to $54,999 | 14 (2.1%) | 12 (1.9%) |
| $55,000 to $64,999 | 95 (14.1%) | 20 (3.3%) |
| $65,000 to $74,999 | 23 (3.4%) | 7 (1.1%) |
| $75,000 to $99,999 | 90 (13.3%) | 15 (2.4%) |
| $100,000+ | 80 (11.8%) | 33 (5.4%) |
| Total | 675 (100.0%) | 614 (100.0%) |
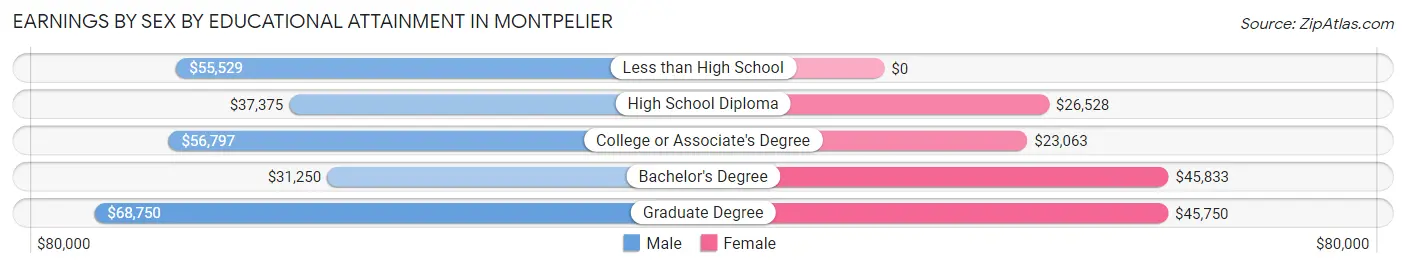
Earnings by Sex by Educational Attainment in Montpelier
Average earnings in Montpelier are $52,857 for men and $26,433 for women, a difference of 50.0%. Men with an educational attainment of graduate degree enjoy the highest average annual earnings of $68,750, while those with bachelor's degree education earn the least with $31,250. Women with an educational attainment of bachelor's degree earn the most with the average annual earnings of $45,833, while those with college or associate's degree education have the smallest earnings of $23,063.
| Educational Attainment | Male Income | Female Income |
| Less than High School | $55,529 | $0 |
| High School Diploma | $37,375 | $26,528 |
| College or Associate's Degree | $56,797 | $23,063 |
| Bachelor's Degree | $31,250 | $45,833 |
| Graduate Degree | $68,750 | $45,750 |
| Total | $52,857 | $26,433 |
Family Income in Montpelier
Family Income Brackets in Montpelier
According to the Montpelier family income data, there are 139 families falling into the $100,000 to $149,999 income range, which is the most common income bracket and makes up 20.8% of all families. Conversely, the $15,000 to $24,999 income bracket is the least frequent group with only 11 families (1.7%) belonging to this category.
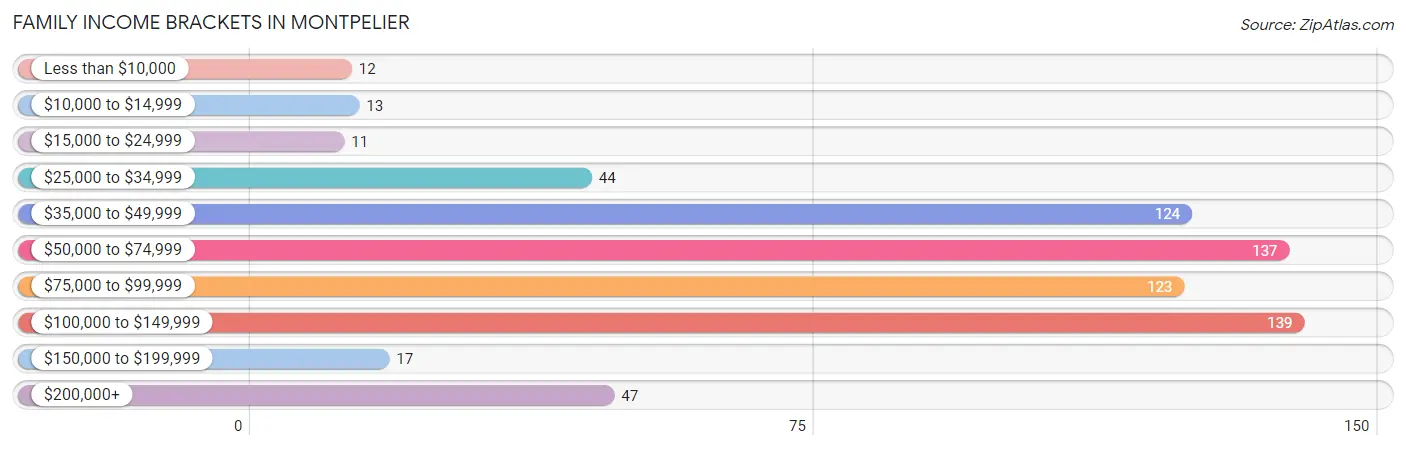
| Income Bracket | # Families | % Families |
| Less than $10,000 | 12 | 1.8% |
| $10,000 to $14,999 | 13 | 1.9% |
| $15,000 to $24,999 | 11 | 1.6% |
| $25,000 to $34,999 | 44 | 6.6% |
| $35,000 to $49,999 | 124 | 18.6% |
| $50,000 to $74,999 | 137 | 20.5% |
| $75,000 to $99,999 | 123 | 18.4% |
| $100,000 to $149,999 | 139 | 20.8% |
| $150,000 to $199,999 | 17 | 2.5% |
| $200,000+ | 47 | 7.0% |
Family Income by Famaliy Size in Montpelier
5-person families (35 | 5.2%) account for the highest median family income in Montpelier with $94,464 per family, while 2-person families (393 | 58.9%) have the highest median income of $31,836 per family member.
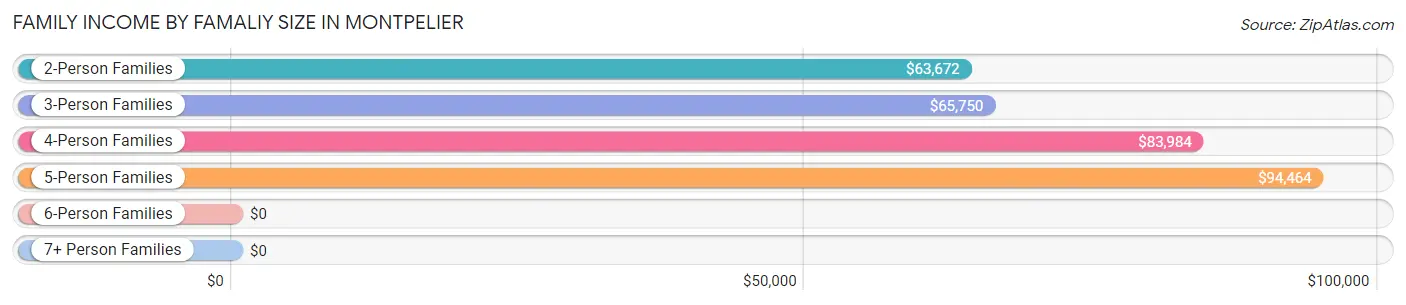
| Income Bracket | # Families | Median Income |
| 2-Person Families | 393 (58.9%) | $63,672 |
| 3-Person Families | 101 (15.1%) | $65,750 |
| 4-Person Families | 97 (14.5%) | $83,984 |
| 5-Person Families | 35 (5.2%) | $94,464 |
| 6-Person Families | 22 (3.3%) | $0 |
| 7+ Person Families | 19 (2.9%) | $0 |
| Total | 667 (100.0%) | $70,625 |
Family Income by Number of Earners in Montpelier
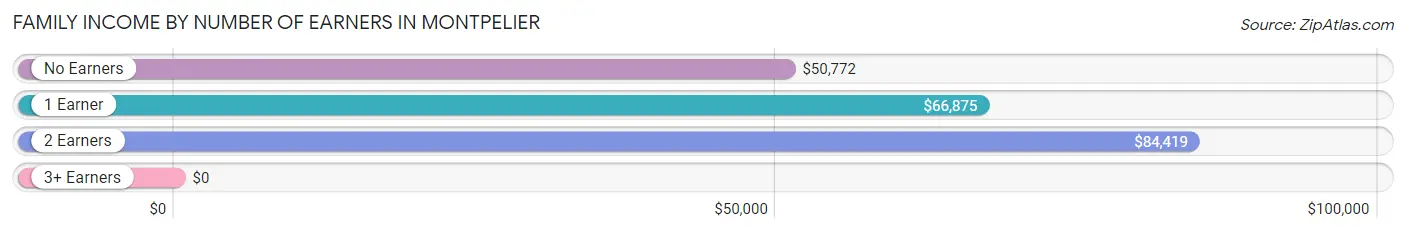
| Number of Earners | # Families | Median Income |
| No Earners | 117 (17.5%) | $50,772 |
| 1 Earner | 176 (26.4%) | $66,875 |
| 2 Earners | 342 (51.3%) | $84,419 |
| 3+ Earners | 32 (4.8%) | $0 |
| Total | 667 (100.0%) | $70,625 |
Household Income in Montpelier
Household Income Brackets in Montpelier
With 183 households falling in the category, the $50,000 to $74,999 income range is the most frequent in Montpelier, accounting for 17.6% of all households. In contrast, only 17 households (1.6%) fall into the $150,000 to $199,999 income bracket, making it the least populous group.
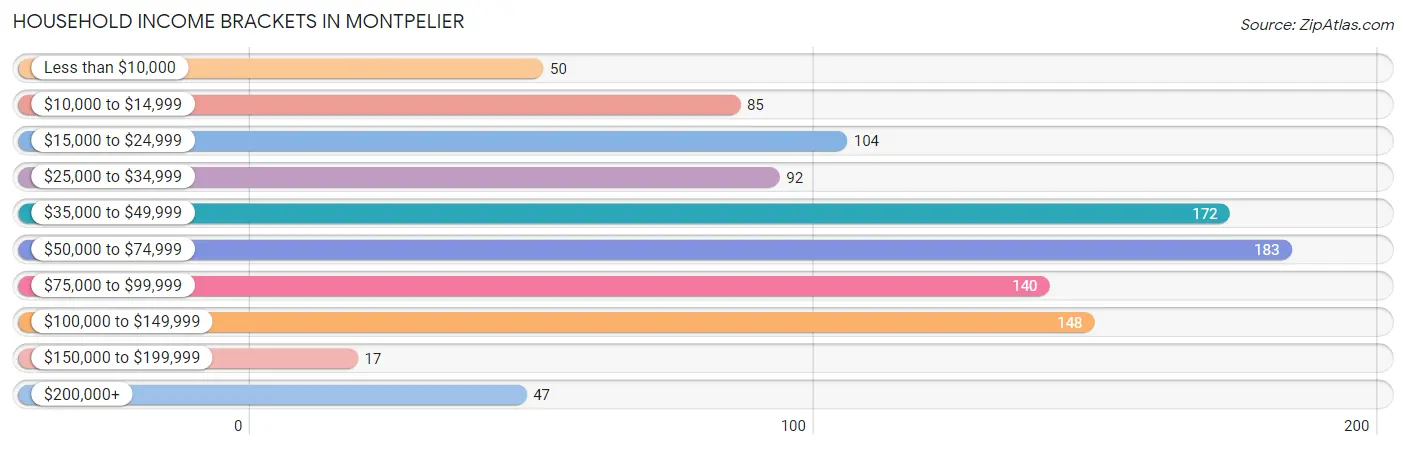
| Income Bracket | # Households | % Households |
| Less than $10,000 | 50 | 4.8% |
| $10,000 to $14,999 | 85 | 8.2% |
| $15,000 to $24,999 | 104 | 10.0% |
| $25,000 to $34,999 | 92 | 8.9% |
| $35,000 to $49,999 | 172 | 16.6% |
| $50,000 to $74,999 | 183 | 17.6% |
| $75,000 to $99,999 | 140 | 13.5% |
| $100,000 to $149,999 | 148 | 14.3% |
| $150,000 to $199,999 | 17 | 1.6% |
| $200,000+ | 47 | 4.5% |
Household Income by Householder Age in Montpelier
The median household income in Montpelier is $50,668, with the highest median household income of $66,696 found in the 25 to 44 years age bracket for the primary householder. A total of 305 households (29.4%) fall into this category. Meanwhile, the 65+ years age bracket for the primary householder has the lowest median household income of $35,481, with 337 households (32.5%) in this group.
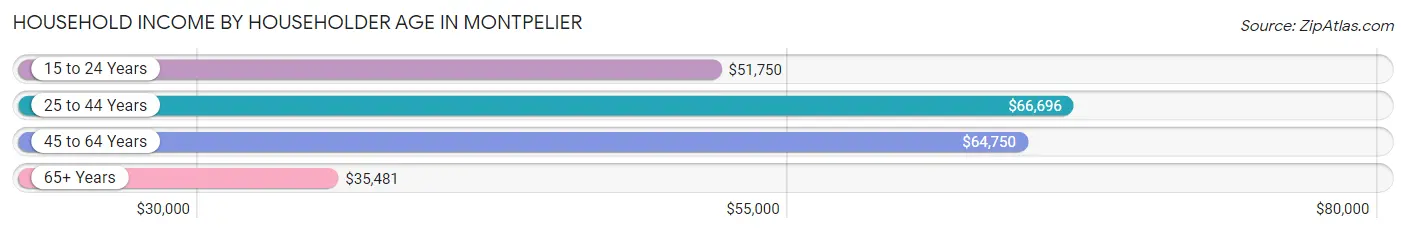
| Income Bracket | # Households | Median Income |
| 15 to 24 Years | 40 (3.9%) | $51,750 |
| 25 to 44 Years | 305 (29.4%) | $66,696 |
| 45 to 64 Years | 355 (34.2%) | $64,750 |
| 65+ Years | 337 (32.5%) | $35,481 |
| Total | 1,037 (100.0%) | $50,668 |
Poverty in Montpelier
Income Below Poverty by Sex and Age in Montpelier
With 13.2% poverty level for males and 12.2% for females among the residents of Montpelier, 75 year old and over males and 16 and 17 year old females are the most vulnerable to poverty, with 26 males (30.6%) and 52 females (82.5%) in their respective age groups living below the poverty level.
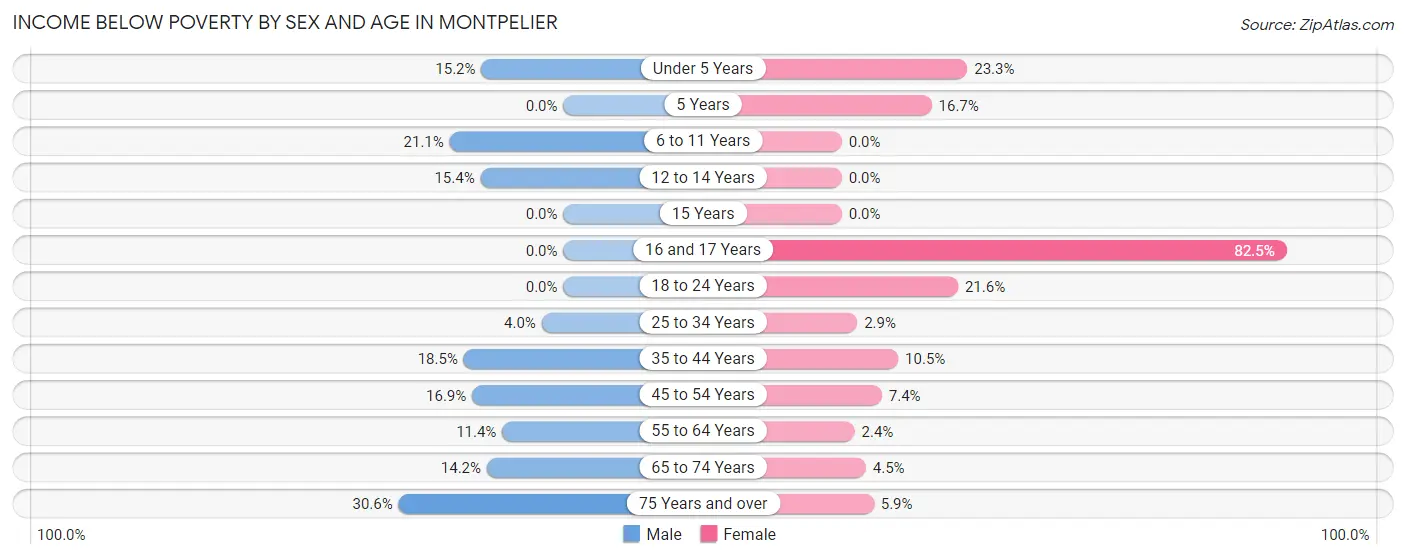
| Age Bracket | Male | Female |
| Under 5 Years | 21 (15.2%) | 17 (23.3%) |
| 5 Years | 0 (0.0%) | 8 (16.7%) |
| 6 to 11 Years | 19 (21.1%) | 0 (0.0%) |
| 12 to 14 Years | 6 (15.4%) | 0 (0.0%) |
| 15 Years | 0 (0.0%) | 0 (0.0%) |
| 16 and 17 Years | 0 (0.0%) | 52 (82.5%) |
| 18 to 24 Years | 0 (0.0%) | 33 (21.6%) |
| 25 to 34 Years | 8 (4.0%) | 4 (2.9%) |
| 35 to 44 Years | 22 (18.5%) | 16 (10.5%) |
| 45 to 54 Years | 31 (16.9%) | 11 (7.4%) |
| 55 to 64 Years | 16 (11.4%) | 3 (2.4%) |
| 65 to 74 Years | 25 (14.2%) | 5 (4.5%) |
| 75 Years and over | 26 (30.6%) | 6 (5.9%) |
| Total | 174 (13.2%) | 155 (12.2%) |
Income Above Poverty by Sex and Age in Montpelier
According to the poverty statistics in Montpelier, males aged 5 years and females aged 6 to 11 years are the age groups that are most secure financially, with 100.0% of males and 100.0% of females in these age groups living above the poverty line.
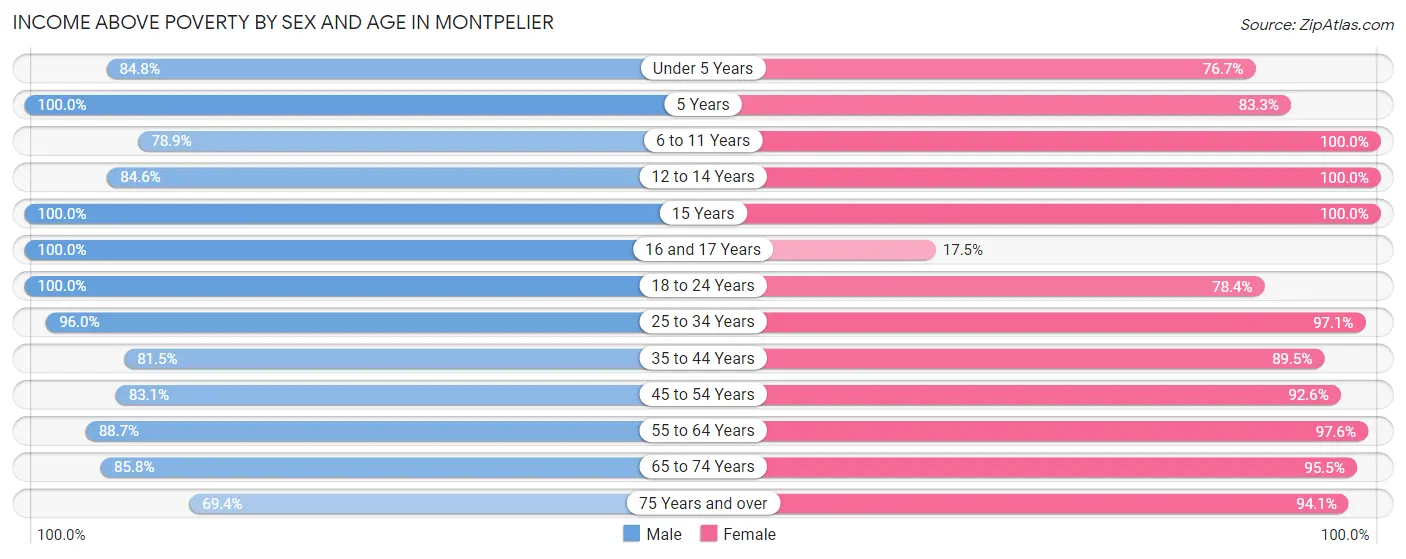
| Age Bracket | Male | Female |
| Under 5 Years | 117 (84.8%) | 56 (76.7%) |
| 5 Years | 22 (100.0%) | 40 (83.3%) |
| 6 to 11 Years | 71 (78.9%) | 88 (100.0%) |
| 12 to 14 Years | 33 (84.6%) | 40 (100.0%) |
| 15 Years | 19 (100.0%) | 22 (100.0%) |
| 16 and 17 Years | 7 (100.0%) | 11 (17.5%) |
| 18 to 24 Years | 102 (100.0%) | 120 (78.4%) |
| 25 to 34 Years | 191 (96.0%) | 136 (97.1%) |
| 35 to 44 Years | 97 (81.5%) | 137 (89.5%) |
| 45 to 54 Years | 152 (83.1%) | 137 (92.6%) |
| 55 to 64 Years | 125 (88.6%) | 123 (97.6%) |
| 65 to 74 Years | 151 (85.8%) | 107 (95.5%) |
| 75 Years and over | 59 (69.4%) | 95 (94.1%) |
| Total | 1,146 (86.8%) | 1,112 (87.8%) |
Income Below Poverty Among Married-Couple Families in Montpelier
The poverty statistics for married-couple families in Montpelier show that 1.4% or 8 of the total 588 families live below the poverty line. Families with 1 or 2 children have the highest poverty rate of 2.2%, comprising of 4 families. On the other hand, families with 3 or 4 children have the lowest poverty rate of 0.0%, which includes 0 families.
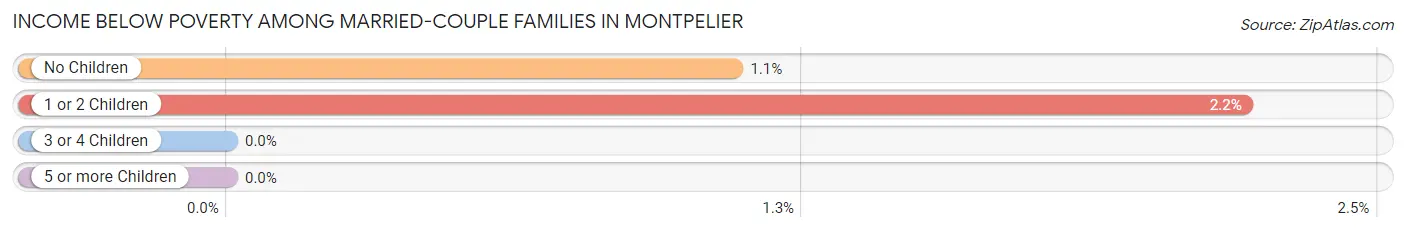
| Children | Above Poverty | Below Poverty |
| No Children | 361 (98.9%) | 4 (1.1%) |
| 1 or 2 Children | 177 (97.8%) | 4 (2.2%) |
| 3 or 4 Children | 29 (100.0%) | 0 (0.0%) |
| 5 or more Children | 13 (100.0%) | 0 (0.0%) |
| Total | 580 (98.6%) | 8 (1.4%) |
Income Below Poverty Among Single-Parent Households in Montpelier
According to the poverty data in Montpelier, 30.0% or 6 single-father households and 47.5% or 28 single-mother households are living below the poverty line. Among single-father households, those with 1 or 2 children have the highest poverty rate, with 6 households (42.9%) experiencing poverty. Likewise, among single-mother households, those with 3 or 4 children have the highest poverty rate, with 11 households (100.0%) falling below the poverty line.
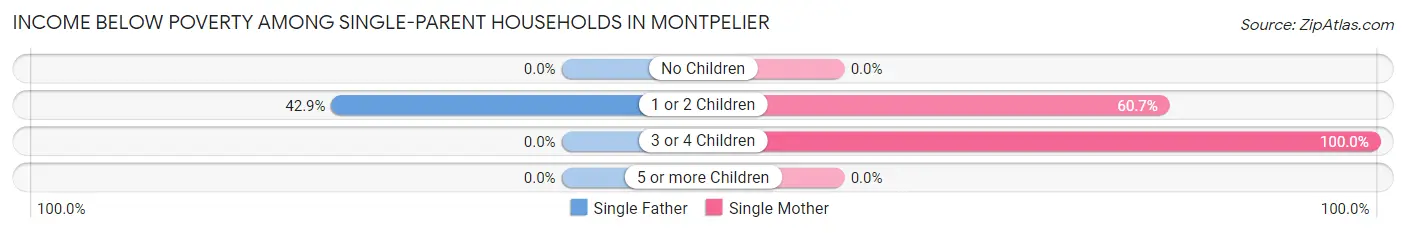
| Children | Single Father | Single Mother |
| No Children | 0 (0.0%) | 0 (0.0%) |
| 1 or 2 Children | 6 (42.9%) | 17 (60.7%) |
| 3 or 4 Children | 0 (0.0%) | 11 (100.0%) |
| 5 or more Children | 0 (0.0%) | 0 (0.0%) |
| Total | 6 (30.0%) | 28 (47.5%) |
Income Below Poverty Among Married-Couple vs Single-Parent Households in Montpelier
The poverty data for Montpelier shows that 8 of the married-couple family households (1.4%) and 34 of the single-parent households (43.0%) are living below the poverty level. Within the married-couple family households, those with 1 or 2 children have the highest poverty rate, with 4 households (2.2%) falling below the poverty line. Among the single-parent households, those with 3 or 4 children have the highest poverty rate, with 11 household (100.0%) living below poverty.
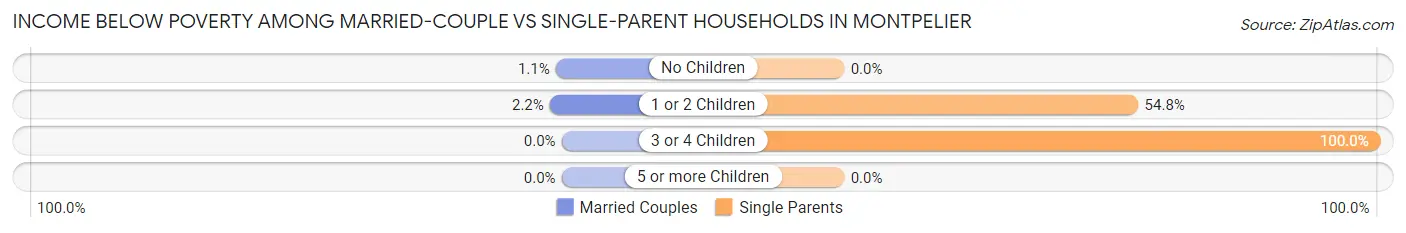
| Children | Married-Couple Families | Single-Parent Households |
| No Children | 4 (1.1%) | 0 (0.0%) |
| 1 or 2 Children | 4 (2.2%) | 23 (54.8%) |
| 3 or 4 Children | 0 (0.0%) | 11 (100.0%) |
| 5 or more Children | 0 (0.0%) | 0 (0.0%) |
| Total | 8 (1.4%) | 34 (43.0%) |
Race in Montpelier
The most populous races in Montpelier are White / Caucasian (2,586 | 97.6%), Hispanic or Latino (125 | 4.7%), and Asian (32 | 1.2%).
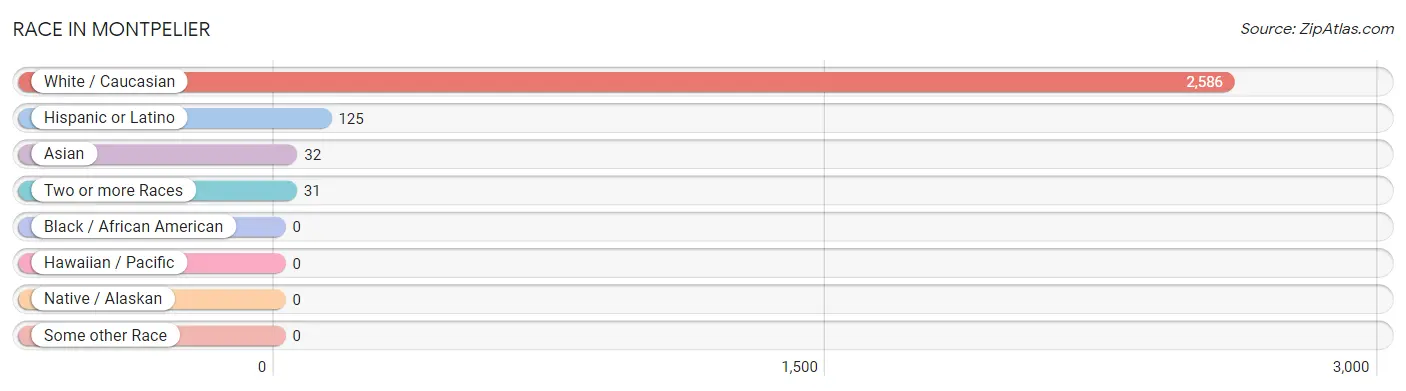
| Race | # Population | % Population |
| Asian | 32 | 1.2% |
| Black / African American | 0 | 0.0% |
| Hawaiian / Pacific | 0 | 0.0% |
| Hispanic or Latino | 125 | 4.7% |
| Native / Alaskan | 0 | 0.0% |
| White / Caucasian | 2,586 | 97.6% |
| Two or more Races | 31 | 1.2% |
| Some other Race | 0 | 0.0% |
| Total | 2,649 | 100.0% |
Ancestry in Montpelier
The most populous ancestries reported in Montpelier are English (635 | 24.0%), German (314 | 11.8%), Scottish (206 | 7.8%), Swedish (170 | 6.4%), and Welsh (123 | 4.6%), together accounting for 54.7% of all Montpelier residents.
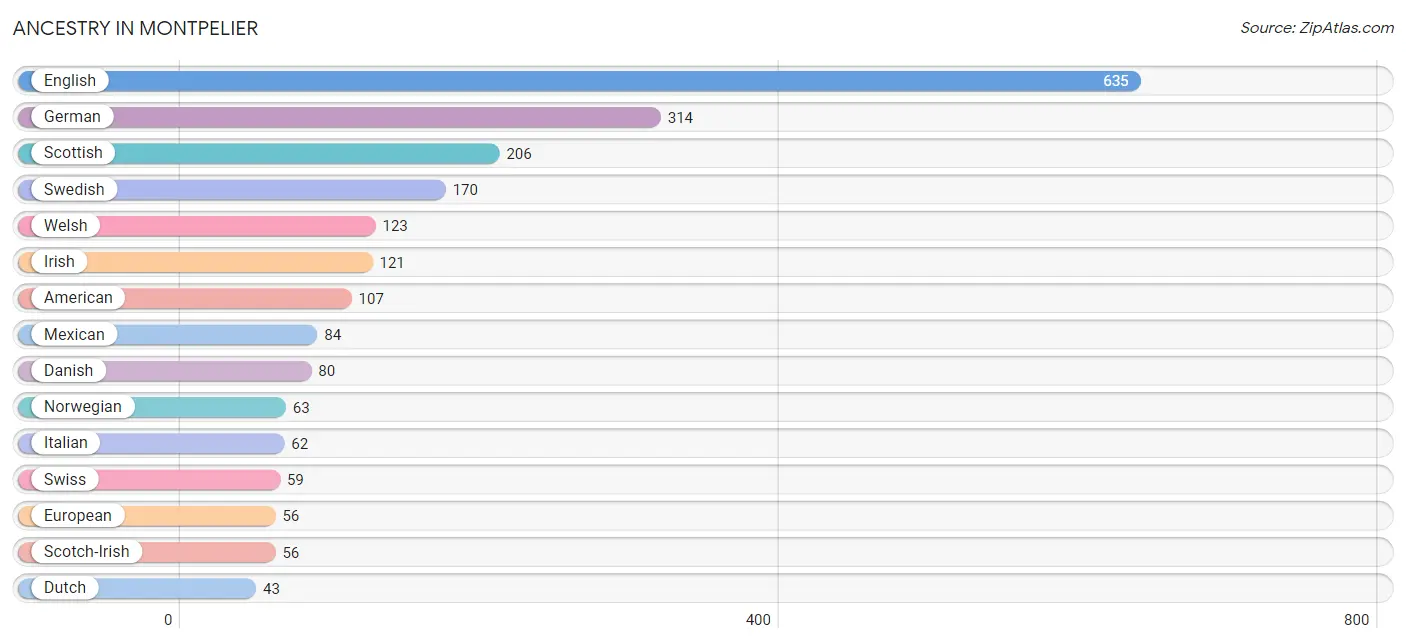
| Ancestry | # Population | % Population |
| American | 107 | 4.0% |
| British | 10 | 0.4% |
| Burmese | 14 | 0.5% |
| Canadian | 5 | 0.2% |
| Danish | 80 | 3.0% |
| Dutch | 43 | 1.6% |
| English | 635 | 24.0% |
| European | 56 | 2.1% |
| French | 12 | 0.4% |
| French Canadian | 2 | 0.1% |
| German | 314 | 11.8% |
| Hungarian | 6 | 0.2% |
| Indonesian | 16 | 0.6% |
| Irish | 121 | 4.6% |
| Italian | 62 | 2.3% |
| Korean | 8 | 0.3% |
| Mexican | 84 | 3.2% |
| Northern European | 20 | 0.8% |
| Norwegian | 63 | 2.4% |
| Polish | 15 | 0.6% |
| Romanian | 18 | 0.7% |
| Russian | 6 | 0.2% |
| Samoan | 14 | 0.5% |
| Scandinavian | 18 | 0.7% |
| Scotch-Irish | 56 | 2.1% |
| Scottish | 206 | 7.8% |
| Spanish | 24 | 0.9% |
| Swedish | 170 | 6.4% |
| Swiss | 59 | 2.2% |
| Welsh | 123 | 4.6% | View All 30 Rows |
Immigrants in Montpelier
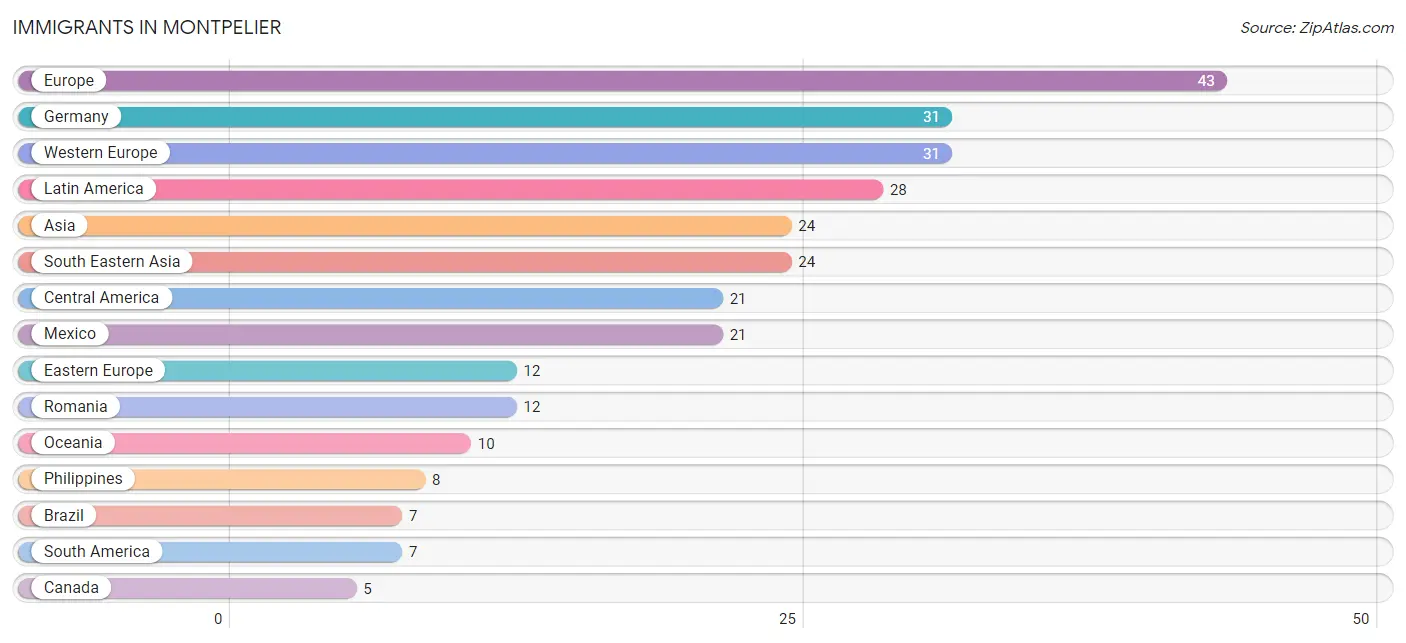
The most numerous immigrant groups reported in Montpelier came from Europe (43 | 1.6%), Germany (31 | 1.2%), Western Europe (31 | 1.2%), Latin America (28 | 1.1%), and Asia (24 | 0.9%), together accounting for 5.9% of all Montpelier residents.
| Immigration Origin | # Population | % Population |
| Asia | 24 | 0.9% |
| Brazil | 7 | 0.3% |
| Canada | 5 | 0.2% |
| Central America | 21 | 0.8% |
| Eastern Europe | 12 | 0.4% |
| Europe | 43 | 1.6% |
| Germany | 31 | 1.2% |
| Latin America | 28 | 1.1% |
| Mexico | 21 | 0.8% |
| Oceania | 10 | 0.4% |
| Philippines | 8 | 0.3% |
| Romania | 12 | 0.4% |
| South America | 7 | 0.3% |
| South Eastern Asia | 24 | 0.9% |
| Western Europe | 31 | 1.2% | View All 15 Rows |
Sex and Age in Montpelier
Sex and Age in Montpelier
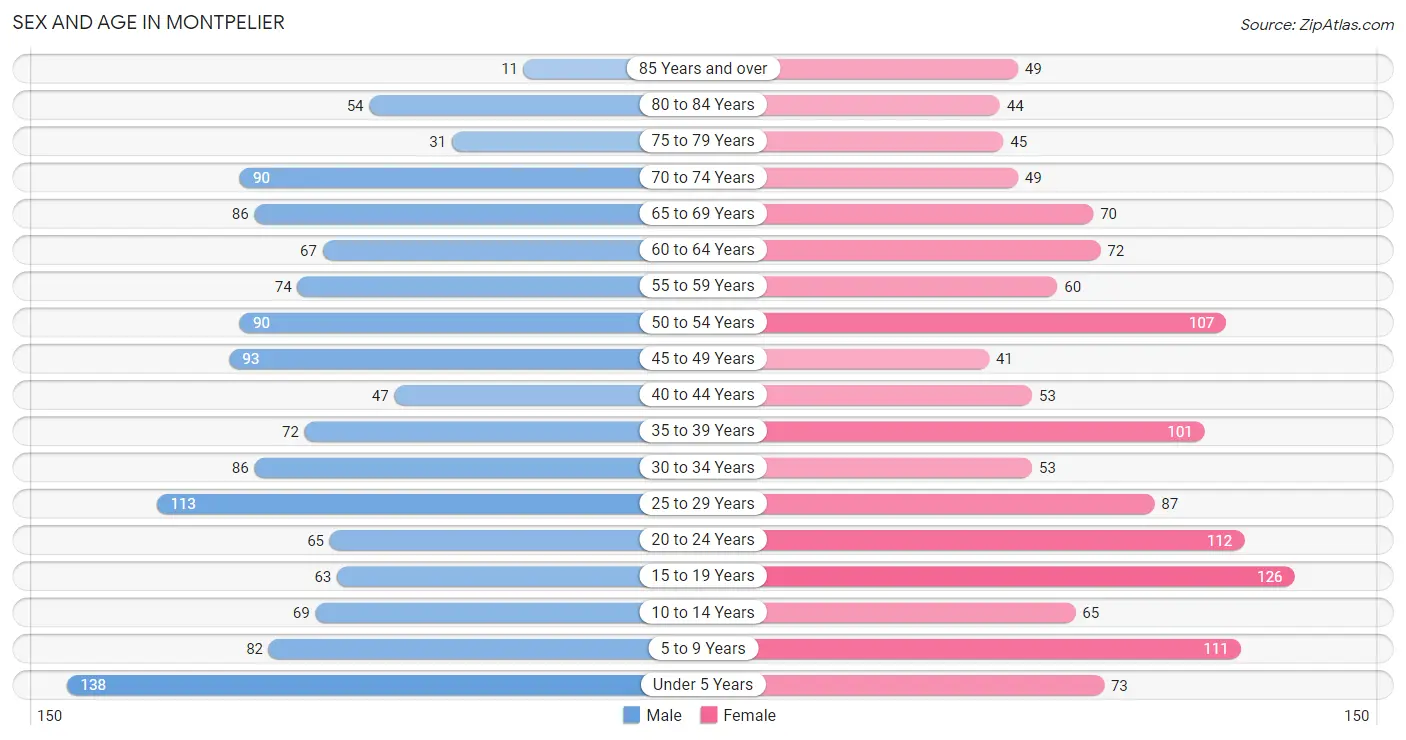
The most populous age groups in Montpelier are Under 5 Years (138 | 10.4%) for men and 15 to 19 Years (126 | 9.6%) for women.
| Age Bracket | Male | Female |
| Under 5 Years | 138 (10.4%) | 73 (5.5%) |
| 5 to 9 Years | 82 (6.2%) | 111 (8.4%) |
| 10 to 14 Years | 69 (5.2%) | 65 (4.9%) |
| 15 to 19 Years | 63 (4.7%) | 126 (9.6%) |
| 20 to 24 Years | 65 (4.9%) | 112 (8.5%) |
| 25 to 29 Years | 113 (8.5%) | 87 (6.6%) |
| 30 to 34 Years | 86 (6.5%) | 53 (4.0%) |
| 35 to 39 Years | 72 (5.4%) | 101 (7.7%) |
| 40 to 44 Years | 47 (3.5%) | 53 (4.0%) |
| 45 to 49 Years | 93 (7.0%) | 41 (3.1%) |
| 50 to 54 Years | 90 (6.8%) | 107 (8.1%) |
| 55 to 59 Years | 74 (5.6%) | 60 (4.5%) |
| 60 to 64 Years | 67 (5.0%) | 72 (5.5%) |
| 65 to 69 Years | 86 (6.5%) | 70 (5.3%) |
| 70 to 74 Years | 90 (6.8%) | 49 (3.7%) |
| 75 to 79 Years | 31 (2.3%) | 45 (3.4%) |
| 80 to 84 Years | 54 (4.1%) | 44 (3.3%) |
| 85 Years and over | 11 (0.8%) | 49 (3.7%) |
| Total | 1,331 (100.0%) | 1,318 (100.0%) |
Families and Households in Montpelier
Median Family Size in Montpelier
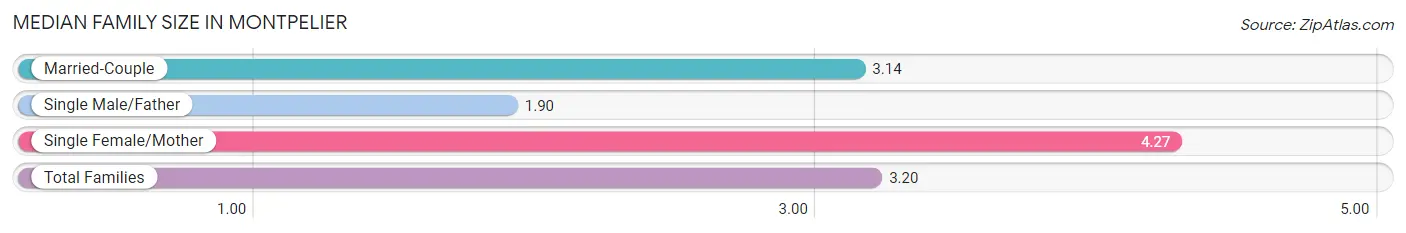
The median family size in Montpelier is 3.20 persons per family, with single female/mother families (59 | 8.8%) accounting for the largest median family size of 4.27 persons per family. On the other hand, single male/father families (20 | 3.0%) represent the smallest median family size with 1.90 persons per family.
| Family Type | # Families | Family Size |
| Married-Couple | 588 (88.2%) | 3.14 |
| Single Male/Father | 20 (3.0%) | 1.90 |
| Single Female/Mother | 59 (8.8%) | 4.27 |
| Total Families | 667 (100.0%) | 3.20 |
Median Household Size in Montpelier
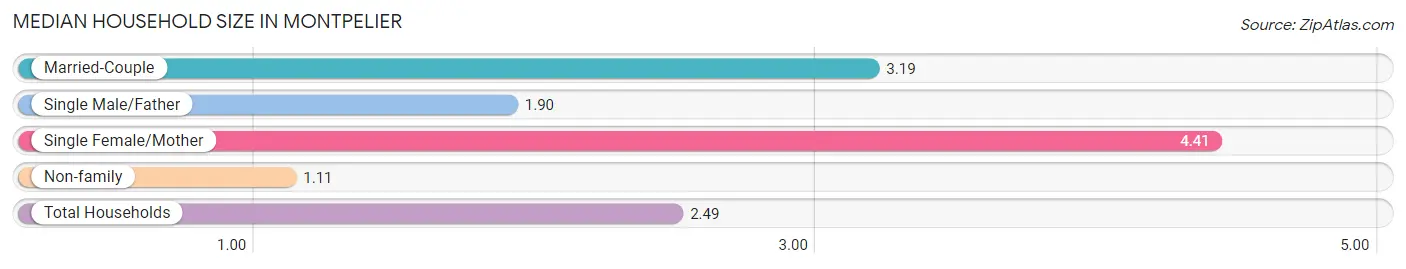
The median household size in Montpelier is 2.49 persons per household, with single female/mother households (59 | 5.7%) accounting for the largest median household size of 4.41 persons per household. non-family households (370 | 35.7%) represent the smallest median household size with 1.11 persons per household.
| Household Type | # Households | Household Size |
| Married-Couple | 588 (56.7%) | 3.19 |
| Single Male/Father | 20 (1.9%) | 1.90 |
| Single Female/Mother | 59 (5.7%) | 4.41 |
| Non-family | 370 (35.7%) | 1.11 |
| Total Households | 1,037 (100.0%) | 2.49 |
Household Size by Marriage Status in Montpelier
Out of a total of 1,037 households in Montpelier, 667 (64.3%) are family households, while 370 (35.7%) are nonfamily households. The most numerous type of family households are 2-person households, comprising 388, and the most common type of nonfamily households are 1-person households, comprising 355.
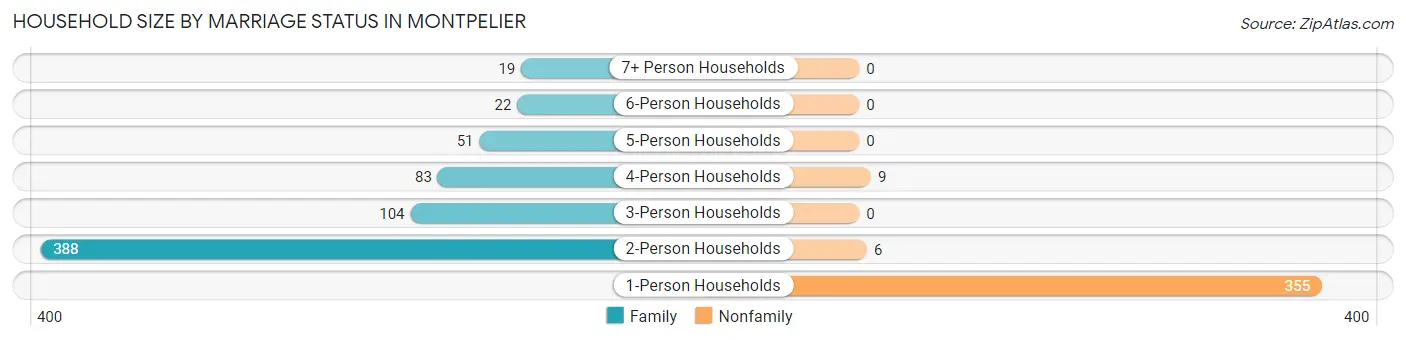
| Household Size | Family Households | Nonfamily Households |
| 1-Person Households | - | 355 (34.2%) |
| 2-Person Households | 388 (37.4%) | 6 (0.6%) |
| 3-Person Households | 104 (10.0%) | 0 (0.0%) |
| 4-Person Households | 83 (8.0%) | 9 (0.9%) |
| 5-Person Households | 51 (4.9%) | 0 (0.0%) |
| 6-Person Households | 22 (2.1%) | 0 (0.0%) |
| 7+ Person Households | 19 (1.8%) | 0 (0.0%) |
| Total | 667 (64.3%) | 370 (35.7%) |
Female Fertility in Montpelier
Fertility by Age in Montpelier
Average fertility rate in Montpelier is 82.0 births per 1,000 women. Women in the age bracket of 20 to 34 years have the highest fertility rate with 194.0 births per 1,000 women. Women in the age bracket of 20 to 34 years acount for 100.0% of all women with births.
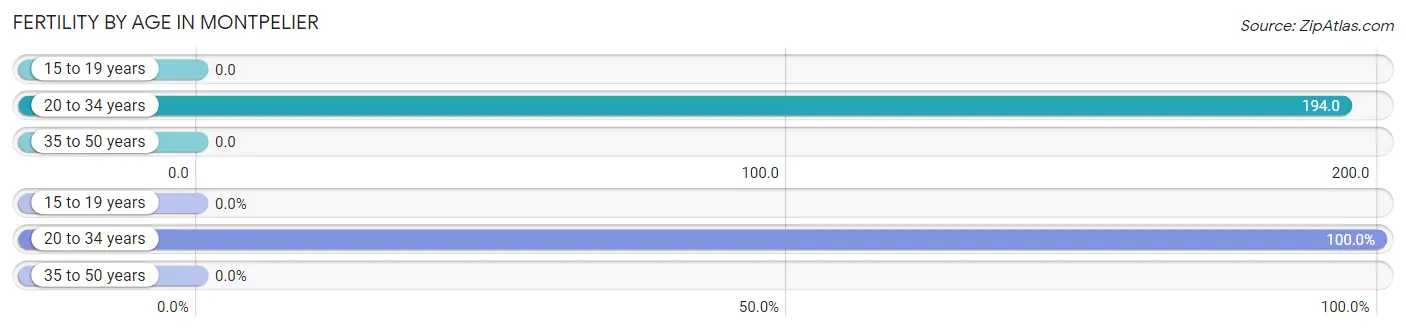
| Age Bracket | Women with Births | Births / 1,000 Women |
| 15 to 19 years | 0 (0.0%) | 0.0 |
| 20 to 34 years | 49 (100.0%) | 194.0 |
| 35 to 50 years | 0 (0.0%) | 0.0 |
| Total | 49 (100.0%) | 82.0 |
Fertility by Age by Marriage Status in Montpelier
89.8% of women with births (49) in Montpelier are married. The highest percentage of unmarried women with births falls into 20 to 34 years age bracket with 10.2% of them unmarried at the time of birth, while the lowest percentage of unmarried women with births belong to 20 to 34 years age bracket with 10.2% of them unmarried.
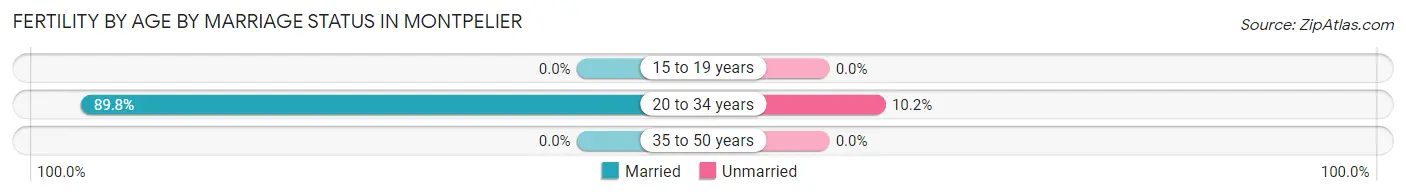
| Age Bracket | Married | Unmarried |
| 15 to 19 years | 0 (0.0%) | 0 (0.0%) |
| 20 to 34 years | 44 (89.8%) | 5 (10.2%) |
| 35 to 50 years | 0 (0.0%) | 0 (0.0%) |
| Total | 44 (89.8%) | 5 (10.2%) |
Fertility by Education in Montpelier
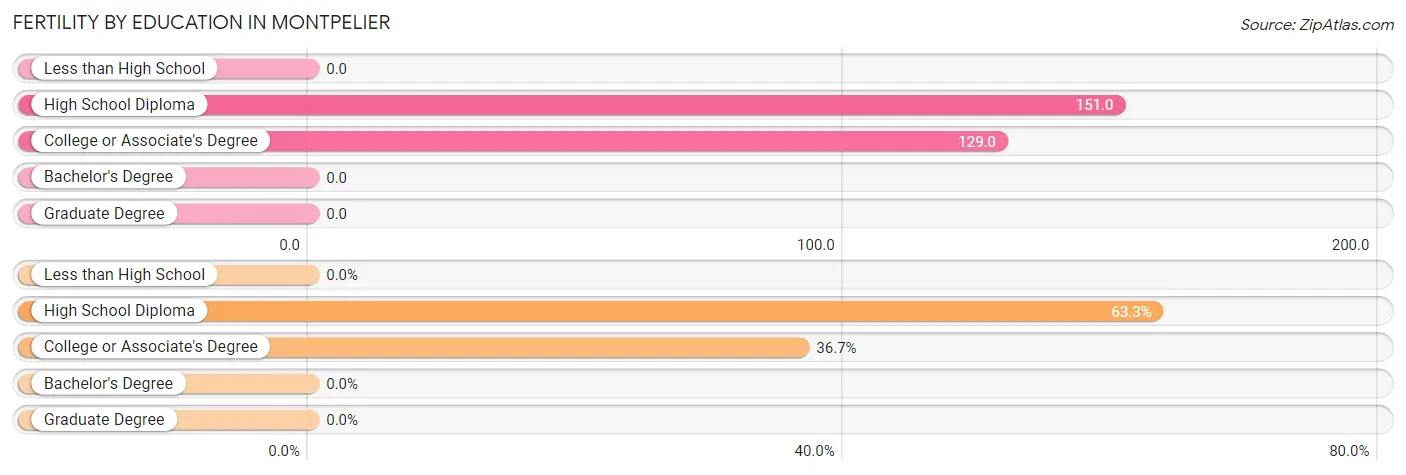
| Educational Attainment | Women with Births | Births / 1,000 Women |
| Less than High School | 0 (0.0%) | 0.0 |
| High School Diploma | 31 (63.3%) | 151.0 |
| College or Associate's Degree | 18 (36.7%) | 129.0 |
| Bachelor's Degree | 0 (0.0%) | 0.0 |
| Graduate Degree | 0 (0.0%) | 0.0 |
| Total | 49 (100.0%) | 82.0 |
Fertility by Education by Marriage Status in Montpelier
10.2% of women with births in Montpelier are unmarried. Women with the educational attainment of high school diploma are most likely to be married with 100.0% of them married at childbirth, while women with the educational attainment of college or associate's degree are least likely to be married with 27.8% of them unmarried at childbirth.
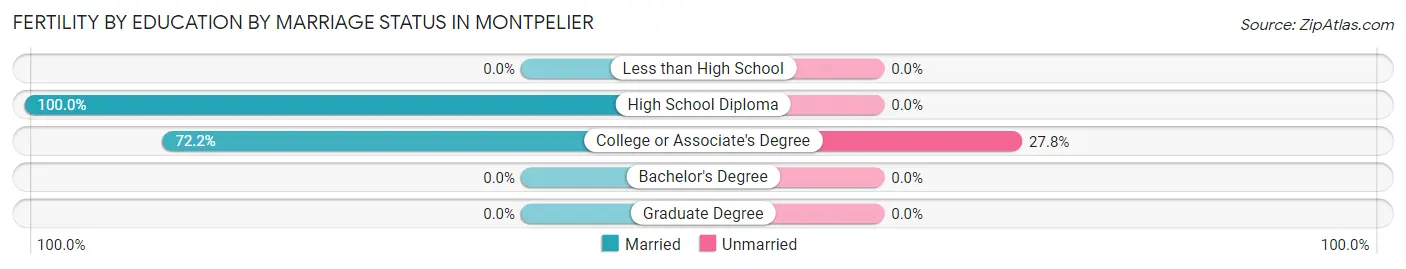
| Educational Attainment | Married | Unmarried |
| Less than High School | 0 (0.0%) | 0 (0.0%) |
| High School Diploma | 31 (100.0%) | 0 (0.0%) |
| College or Associate's Degree | 13 (72.2%) | 5 (27.8%) |
| Bachelor's Degree | 0 (0.0%) | 0 (0.0%) |
| Graduate Degree | 0 (0.0%) | 0 (0.0%) |
| Total | 44 (89.8%) | 5 (10.2%) |
Employment Characteristics in Montpelier
Employment by Class of Employer in Montpelier
Among the 1,074 employed individuals in Montpelier, private company employees (701 | 65.3%), local government employees (149 | 13.9%), and self-employed (incorporated) (59 | 5.5%) make up the most common classes of employment.
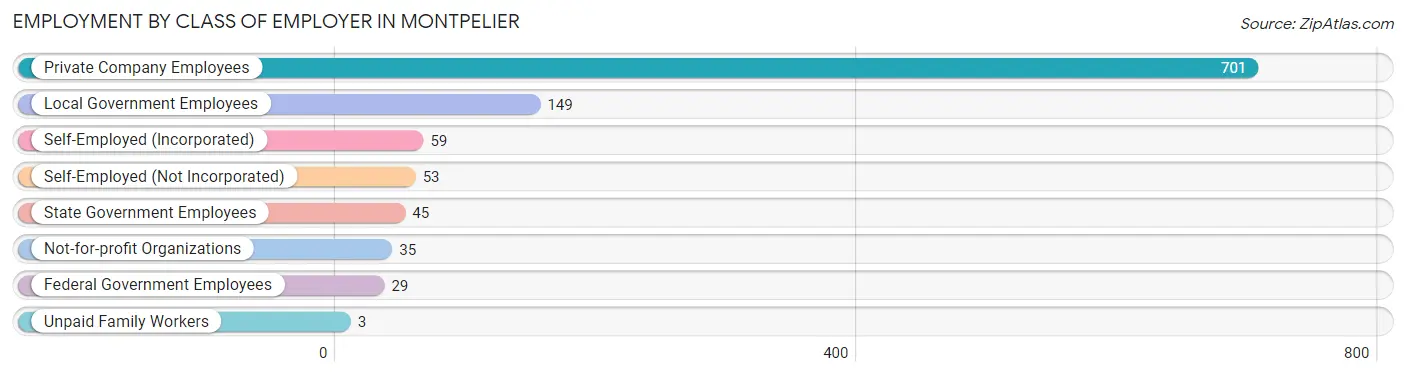
| Employer Class | # Employees | % Employees |
| Private Company Employees | 701 | 65.3% |
| Self-Employed (Incorporated) | 59 | 5.5% |
| Self-Employed (Not Incorporated) | 53 | 4.9% |
| Not-for-profit Organizations | 35 | 3.3% |
| Local Government Employees | 149 | 13.9% |
| State Government Employees | 45 | 4.2% |
| Federal Government Employees | 29 | 2.7% |
| Unpaid Family Workers | 3 | 0.3% |
| Total | 1,074 | 100.0% |
Employment Status by Age in Montpelier
According to the labor force statistics for Montpelier, out of the total population over 16 years of age (2,070), 58.5% or 1,211 individuals are in the labor force, with 7.3% or 88 of them unemployed. The age group with the highest labor force participation rate is 25 to 29 years, with 91.0% or 182 individuals in the labor force. Within the labor force, the 16 to 19 years age range has the highest percentage of unemployed individuals, with 24.6% or 17 of them being unemployed.
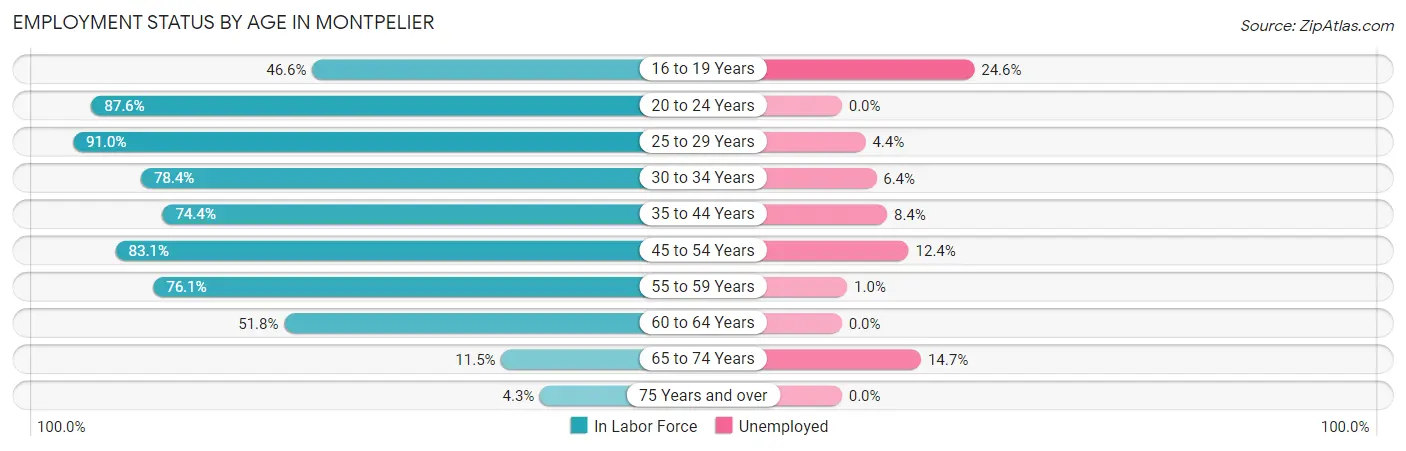
| Age Bracket | In Labor Force | Unemployed |
| 16 to 19 Years | 69 (46.6%) | 17 (24.6%) |
| 20 to 24 Years | 155 (87.6%) | 0 (0.0%) |
| 25 to 29 Years | 182 (91.0%) | 8 (4.4%) |
| 30 to 34 Years | 109 (78.4%) | 7 (6.4%) |
| 35 to 44 Years | 203 (74.4%) | 17 (8.4%) |
| 45 to 54 Years | 275 (83.1%) | 34 (12.4%) |
| 55 to 59 Years | 102 (76.1%) | 1 (1.0%) |
| 60 to 64 Years | 72 (51.8%) | 0 (0.0%) |
| 65 to 74 Years | 34 (11.5%) | 5 (14.7%) |
| 75 Years and over | 10 (4.3%) | 0 (0.0%) |
| Total | 1,211 (58.5%) | 88 (7.3%) |
Employment Status by Educational Attainment in Montpelier
According to labor force statistics for Montpelier, 77.5% of individuals (942) out of the total population between 25 and 64 years of age (1,216) are in the labor force, with 7.1% or 67 of them being unemployed. The group with the highest labor force participation rate are those with the educational attainment of bachelor's degree or higher, with 88.9% or 240 individuals in the labor force. Within the labor force, individuals with high school diploma education have the highest percentage of unemployment, with 11.7% or 41 of them being unemployed.
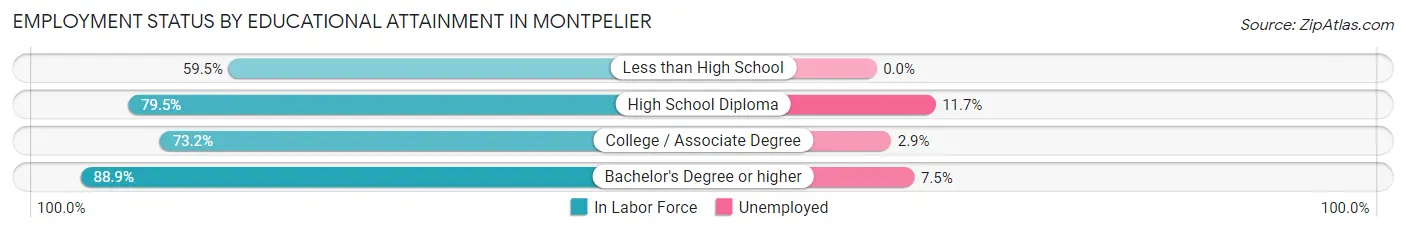
| Educational Attainment | In Labor Force | Unemployed |
| Less than High School | 75 (59.5%) | 0 (0.0%) |
| High School Diploma | 350 (79.5%) | 51 (11.7%) |
| College / Associate Degree | 278 (73.2%) | 11 (2.9%) |
| Bachelor's Degree or higher | 240 (88.9%) | 20 (7.5%) |
| Total | 942 (77.5%) | 86 (7.1%) |
Employment Occupations by Sex in Montpelier
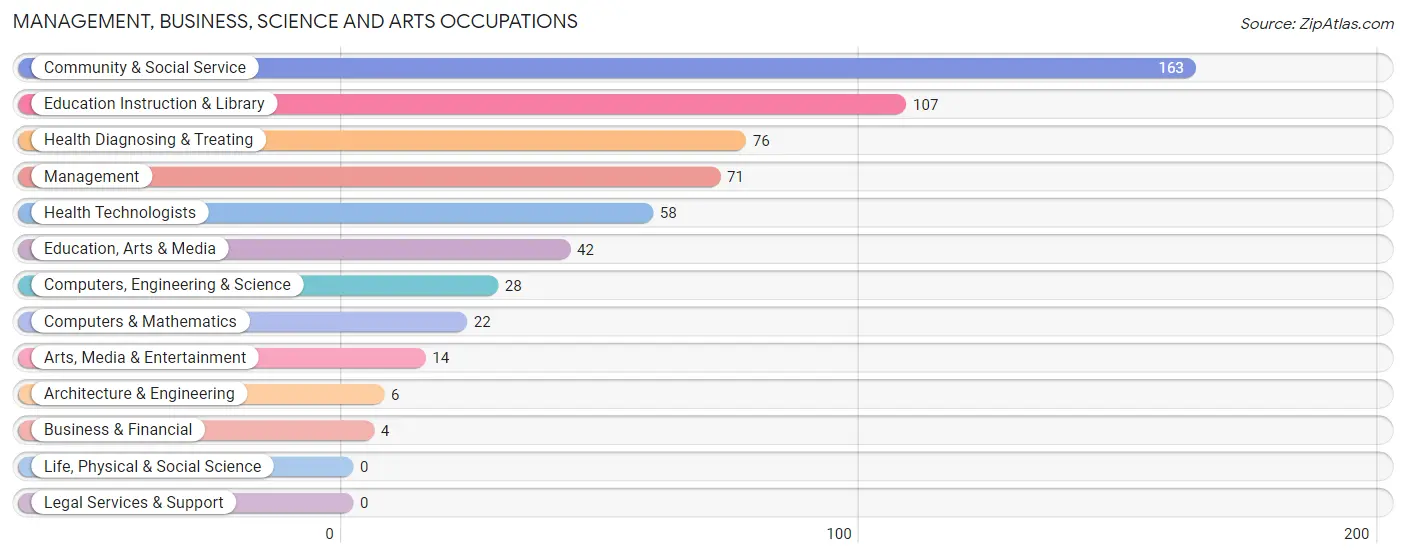
Management, Business, Science and Arts Occupations
The most common Management, Business, Science and Arts occupations in Montpelier are Community & Social Service (163 | 14.5%), Education Instruction & Library (107 | 9.5%), Health Diagnosing & Treating (76 | 6.8%), Management (71 | 6.3%), and Health Technologists (58 | 5.2%).
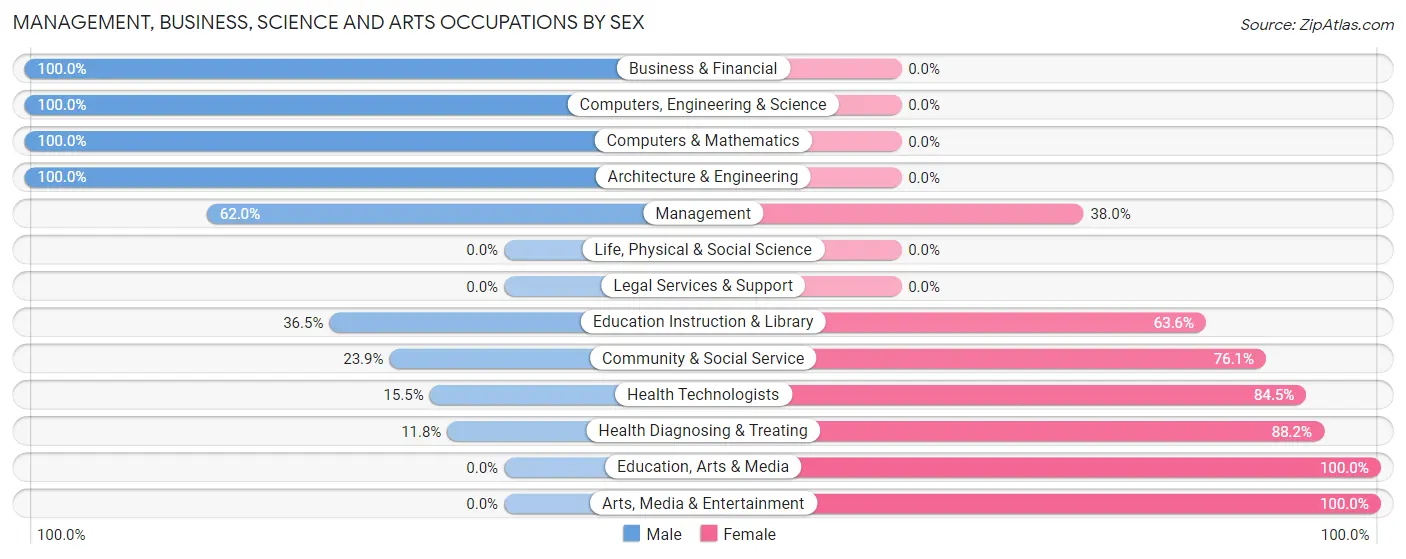
Management, Business, Science and Arts Occupations by Sex
Within the Management, Business, Science and Arts occupations in Montpelier, the most male-oriented occupations are Business & Financial (100.0%), Computers, Engineering & Science (100.0%), and Computers & Mathematics (100.0%), while the most female-oriented occupations are Education, Arts & Media (100.0%), Arts, Media & Entertainment (100.0%), and Health Diagnosing & Treating (88.2%).
| Occupation | Male | Female |
| Management | 44 (62.0%) | 27 (38.0%) |
| Business & Financial | 4 (100.0%) | 0 (0.0%) |
| Computers, Engineering & Science | 28 (100.0%) | 0 (0.0%) |
| Computers & Mathematics | 22 (100.0%) | 0 (0.0%) |
| Architecture & Engineering | 6 (100.0%) | 0 (0.0%) |
| Life, Physical & Social Science | 0 (0.0%) | 0 (0.0%) |
| Community & Social Service | 39 (23.9%) | 124 (76.1%) |
| Education, Arts & Media | 0 (0.0%) | 42 (100.0%) |
| Legal Services & Support | 0 (0.0%) | 0 (0.0%) |
| Education Instruction & Library | 39 (36.4%) | 68 (63.5%) |
| Arts, Media & Entertainment | 0 (0.0%) | 14 (100.0%) |
| Health Diagnosing & Treating | 9 (11.8%) | 67 (88.2%) |
| Health Technologists | 9 (15.5%) | 49 (84.5%) |
| Total (Category) | 124 (36.3%) | 218 (63.7%) |
| Total (Overall) | 572 (51.0%) | 550 (49.0%) |
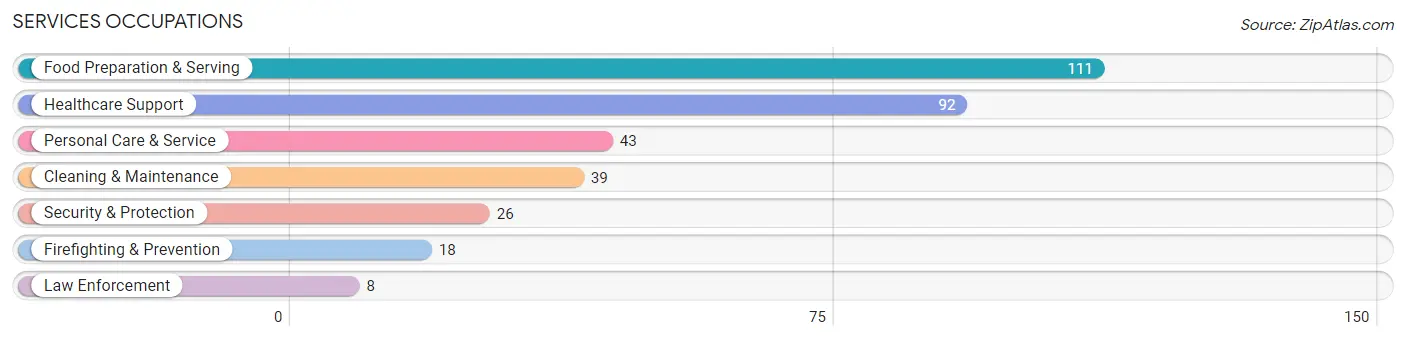
Services Occupations
The most common Services occupations in Montpelier are Food Preparation & Serving (111 | 9.9%), Healthcare Support (92 | 8.2%), Personal Care & Service (43 | 3.8%), Cleaning & Maintenance (39 | 3.5%), and Security & Protection (26 | 2.3%).
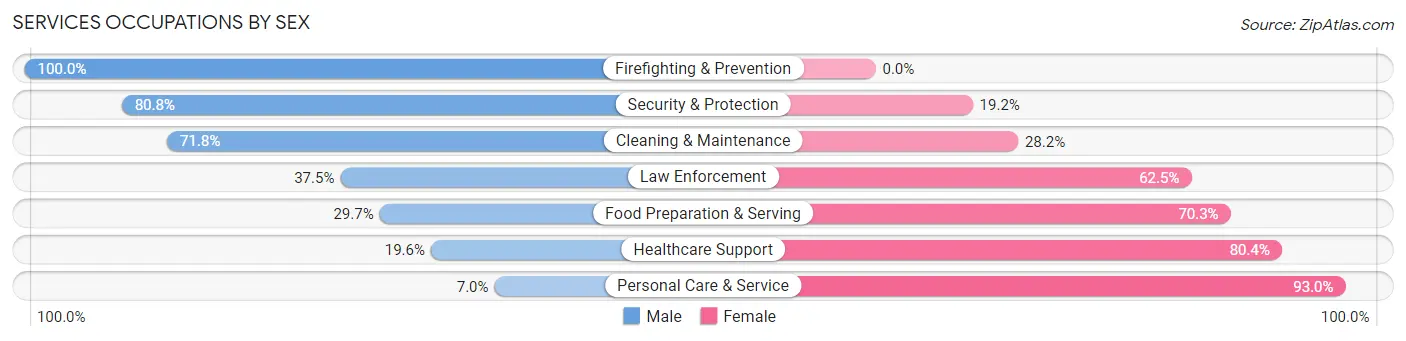
Services Occupations by Sex
Within the Services occupations in Montpelier, the most male-oriented occupations are Firefighting & Prevention (100.0%), Security & Protection (80.8%), and Cleaning & Maintenance (71.8%), while the most female-oriented occupations are Personal Care & Service (93.0%), Healthcare Support (80.4%), and Food Preparation & Serving (70.3%).
| Occupation | Male | Female |
| Healthcare Support | 18 (19.6%) | 74 (80.4%) |
| Security & Protection | 21 (80.8%) | 5 (19.2%) |
| Firefighting & Prevention | 18 (100.0%) | 0 (0.0%) |
| Law Enforcement | 3 (37.5%) | 5 (62.5%) |
| Food Preparation & Serving | 33 (29.7%) | 78 (70.3%) |
| Cleaning & Maintenance | 28 (71.8%) | 11 (28.2%) |
| Personal Care & Service | 3 (7.0%) | 40 (93.0%) |
| Total (Category) | 103 (33.1%) | 208 (66.9%) |
| Total (Overall) | 572 (51.0%) | 550 (49.0%) |
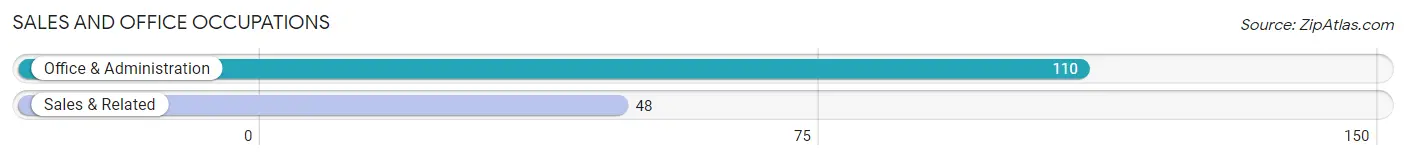
Sales and Office Occupations
The most common Sales and Office occupations in Montpelier are Office & Administration (110 | 9.8%), and Sales & Related (48 | 4.3%).
Sales and Office Occupations by Sex
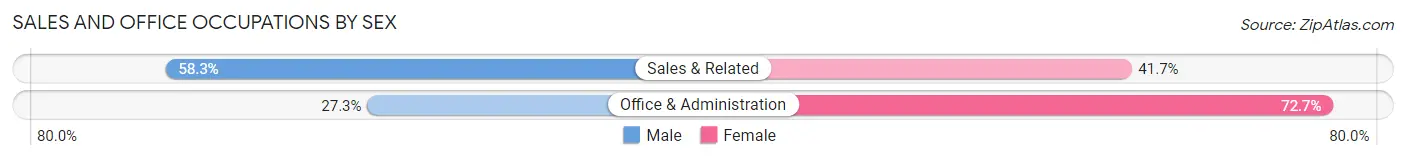
| Occupation | Male | Female |
| Sales & Related | 28 (58.3%) | 20 (41.7%) |
| Office & Administration | 30 (27.3%) | 80 (72.7%) |
| Total (Category) | 58 (36.7%) | 100 (63.3%) |
| Total (Overall) | 572 (51.0%) | 550 (49.0%) |
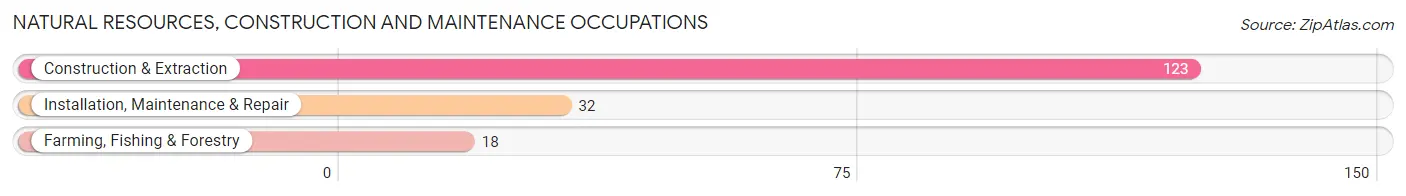
Natural Resources, Construction and Maintenance Occupations
The most common Natural Resources, Construction and Maintenance occupations in Montpelier are Construction & Extraction (123 | 11.0%), Installation, Maintenance & Repair (32 | 2.9%), and Farming, Fishing & Forestry (18 | 1.6%).
Natural Resources, Construction and Maintenance Occupations by Sex
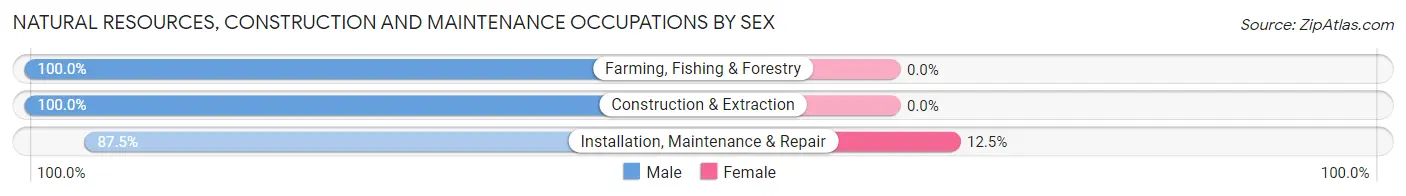
| Occupation | Male | Female |
| Farming, Fishing & Forestry | 18 (100.0%) | 0 (0.0%) |
| Construction & Extraction | 123 (100.0%) | 0 (0.0%) |
| Installation, Maintenance & Repair | 28 (87.5%) | 4 (12.5%) |
| Total (Category) | 169 (97.7%) | 4 (2.3%) |
| Total (Overall) | 572 (51.0%) | 550 (49.0%) |
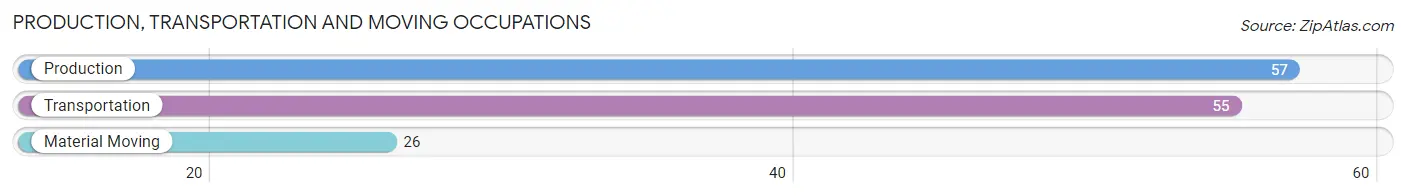
Production, Transportation and Moving Occupations
The most common Production, Transportation and Moving occupations in Montpelier are Production (57 | 5.1%), Transportation (55 | 4.9%), and Material Moving (26 | 2.3%).
Production, Transportation and Moving Occupations by Sex
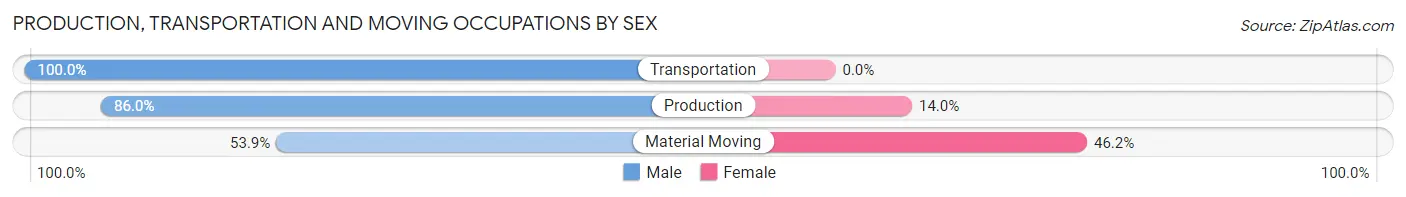
| Occupation | Male | Female |
| Production | 49 (86.0%) | 8 (14.0%) |
| Transportation | 55 (100.0%) | 0 (0.0%) |
| Material Moving | 14 (53.8%) | 12 (46.2%) |
| Total (Category) | 118 (85.5%) | 20 (14.5%) |
| Total (Overall) | 572 (51.0%) | 550 (49.0%) |
Employment Industries by Sex in Montpelier
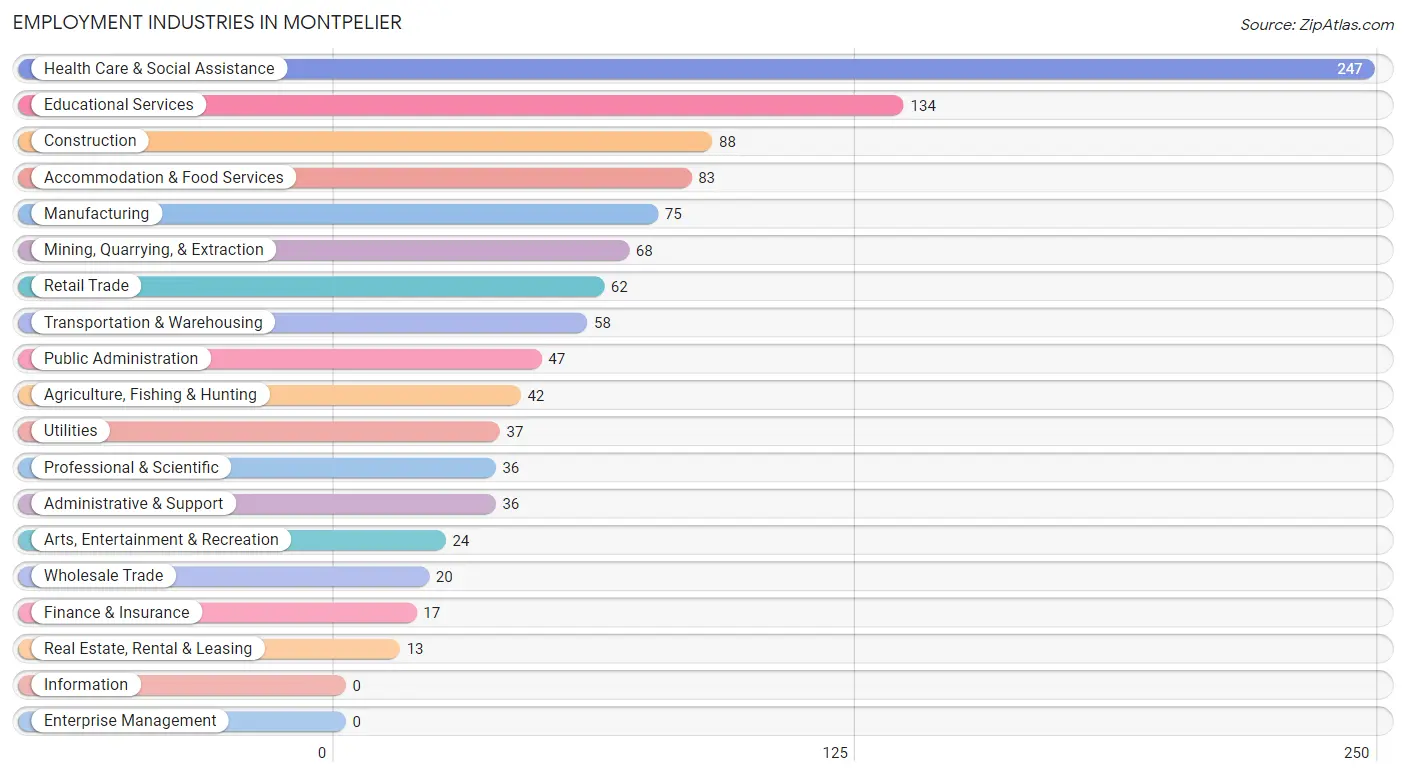
Employment Industries in Montpelier
The major employment industries in Montpelier include Health Care & Social Assistance (247 | 22.0%), Educational Services (134 | 11.9%), Construction (88 | 7.8%), Accommodation & Food Services (83 | 7.4%), and Manufacturing (75 | 6.7%).
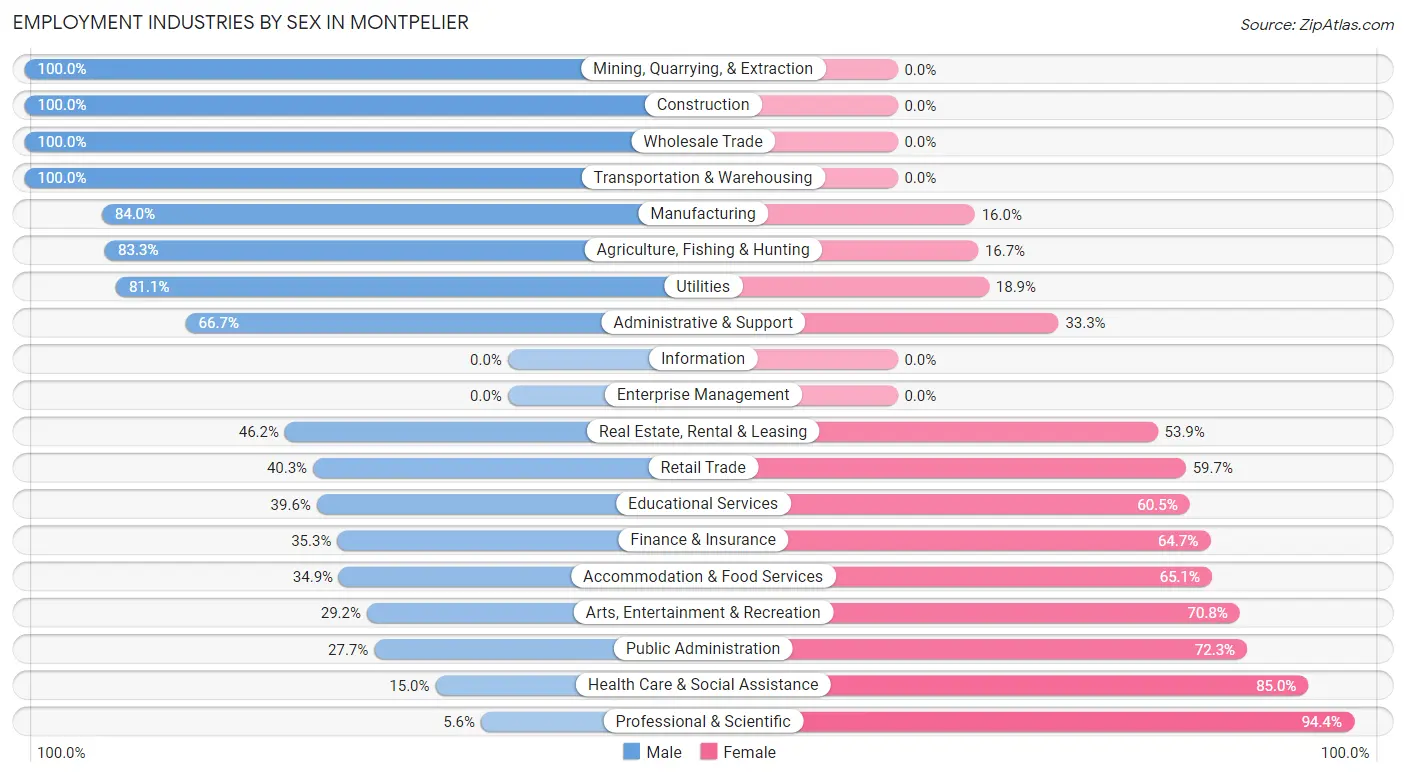
Employment Industries by Sex in Montpelier
The Montpelier industries that see more men than women are Mining, Quarrying, & Extraction (100.0%), Construction (100.0%), and Wholesale Trade (100.0%), whereas the industries that tend to have a higher number of women are Professional & Scientific (94.4%), Health Care & Social Assistance (85.0%), and Public Administration (72.3%).
| Industry | Male | Female |
| Agriculture, Fishing & Hunting | 35 (83.3%) | 7 (16.7%) |
| Mining, Quarrying, & Extraction | 68 (100.0%) | 0 (0.0%) |
| Construction | 88 (100.0%) | 0 (0.0%) |
| Manufacturing | 63 (84.0%) | 12 (16.0%) |
| Wholesale Trade | 20 (100.0%) | 0 (0.0%) |
| Retail Trade | 25 (40.3%) | 37 (59.7%) |
| Transportation & Warehousing | 58 (100.0%) | 0 (0.0%) |
| Utilities | 30 (81.1%) | 7 (18.9%) |
| Information | 0 (0.0%) | 0 (0.0%) |
| Finance & Insurance | 6 (35.3%) | 11 (64.7%) |
| Real Estate, Rental & Leasing | 6 (46.2%) | 7 (53.8%) |
| Professional & Scientific | 2 (5.6%) | 34 (94.4%) |
| Enterprise Management | 0 (0.0%) | 0 (0.0%) |
| Administrative & Support | 24 (66.7%) | 12 (33.3%) |
| Educational Services | 53 (39.6%) | 81 (60.5%) |
| Health Care & Social Assistance | 37 (15.0%) | 210 (85.0%) |
| Arts, Entertainment & Recreation | 7 (29.2%) | 17 (70.8%) |
| Accommodation & Food Services | 29 (34.9%) | 54 (65.1%) |
| Public Administration | 13 (27.7%) | 34 (72.3%) |
| Total | 572 (51.0%) | 550 (49.0%) |
Education in Montpelier
School Enrollment in Montpelier
The most common levels of schooling among the 615 students in Montpelier are high school (169 | 27.5%), elementary school (116 | 18.9%), and middle school (115 | 18.7%).
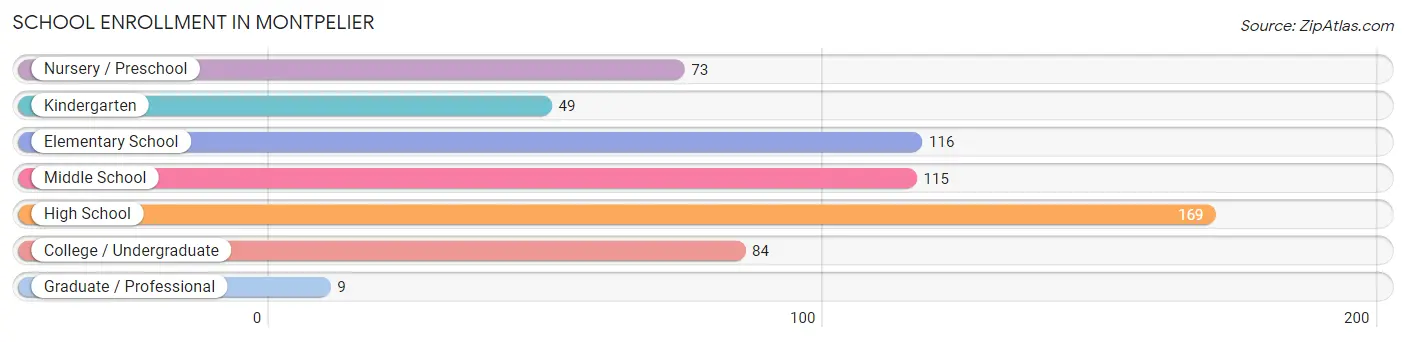
| School Level | # Students | % Students |
| Nursery / Preschool | 73 | 11.9% |
| Kindergarten | 49 | 8.0% |
| Elementary School | 116 | 18.9% |
| Middle School | 115 | 18.7% |
| High School | 169 | 27.5% |
| College / Undergraduate | 84 | 13.7% |
| Graduate / Professional | 9 | 1.5% |
| Total | 615 | 100.0% |
School Enrollment by Age by Funding Source in Montpelier
Out of a total of 615 students who are enrolled in schools in Montpelier, 160 (26.0%) attend a private institution, while the remaining 455 (74.0%) are enrolled in public schools. The age group of 25 to 34 year olds has the highest likelihood of being enrolled in private schools, with 15 (68.2% in the age bracket) enrolled. Conversely, the age group of 15 to 17 year olds has the lowest likelihood of being enrolled in a private school, with 104 (93.7% in the age bracket) attending a public institution.
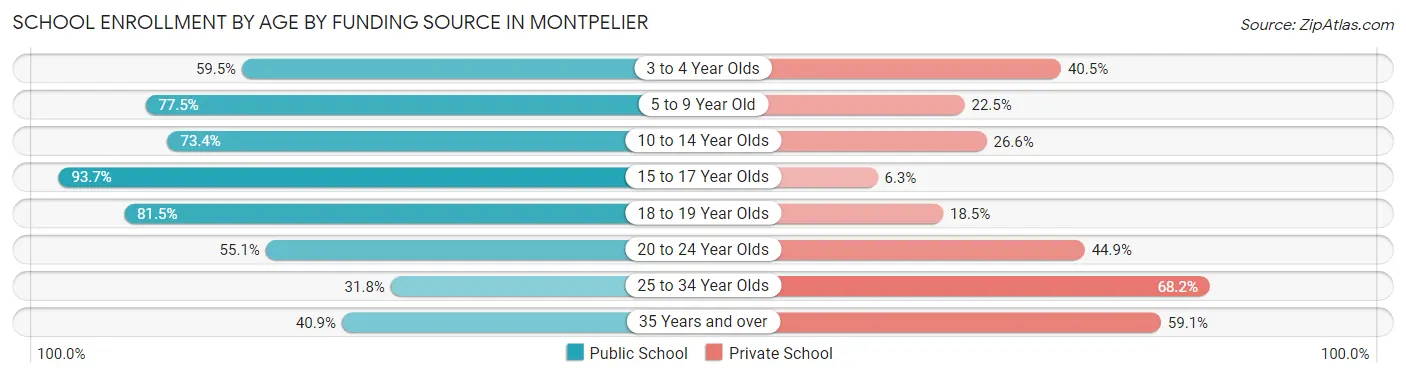
| Age Bracket | Public School | Private School |
| 3 to 4 Year Olds | 25 (59.5%) | 17 (40.5%) |
| 5 to 9 Year Old | 148 (77.5%) | 43 (22.5%) |
| 10 to 14 Year Olds | 91 (73.4%) | 33 (26.6%) |
| 15 to 17 Year Olds | 104 (93.7%) | 7 (6.3%) |
| 18 to 19 Year Olds | 44 (81.5%) | 10 (18.5%) |
| 20 to 24 Year Olds | 27 (55.1%) | 22 (44.9%) |
| 25 to 34 Year Olds | 7 (31.8%) | 15 (68.2%) |
| 35 Years and over | 9 (40.9%) | 13 (59.1%) |
| Total | 455 (74.0%) | 160 (26.0%) |
Educational Attainment by Field of Study in Montpelier
Education (101 | 28.9%), bio, nature & agricultural (62 | 17.8%), science & technology (45 | 12.9%), business (37 | 10.6%), and arts & humanities (32 | 9.2%) are the most common fields of study among 349 individuals in Montpelier who have obtained a bachelor's degree or higher.
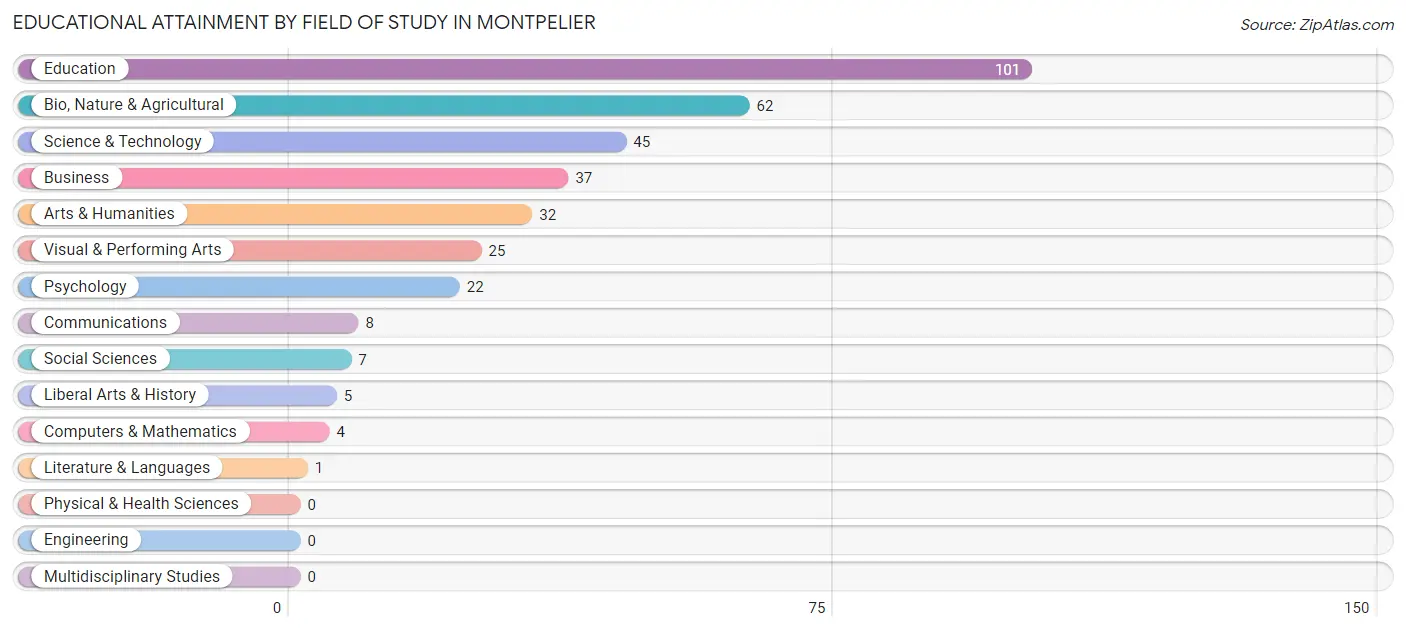
| Field of Study | # Graduates | % Graduates |
| Computers & Mathematics | 4 | 1.1% |
| Bio, Nature & Agricultural | 62 | 17.8% |
| Physical & Health Sciences | 0 | 0.0% |
| Psychology | 22 | 6.3% |
| Social Sciences | 7 | 2.0% |
| Engineering | 0 | 0.0% |
| Multidisciplinary Studies | 0 | 0.0% |
| Science & Technology | 45 | 12.9% |
| Business | 37 | 10.6% |
| Education | 101 | 28.9% |
| Literature & Languages | 1 | 0.3% |
| Liberal Arts & History | 5 | 1.4% |
| Visual & Performing Arts | 25 | 7.2% |
| Communications | 8 | 2.3% |
| Arts & Humanities | 32 | 9.2% |
| Total | 349 | 100.0% |
Transportation & Commute in Montpelier
Vehicle Availability by Sex in Montpelier
The most prevalent vehicle ownership categories in Montpelier are males with 2 vehicles (242, accounting for 45.3%) and females with 2 vehicles (223, making up 44.8%).
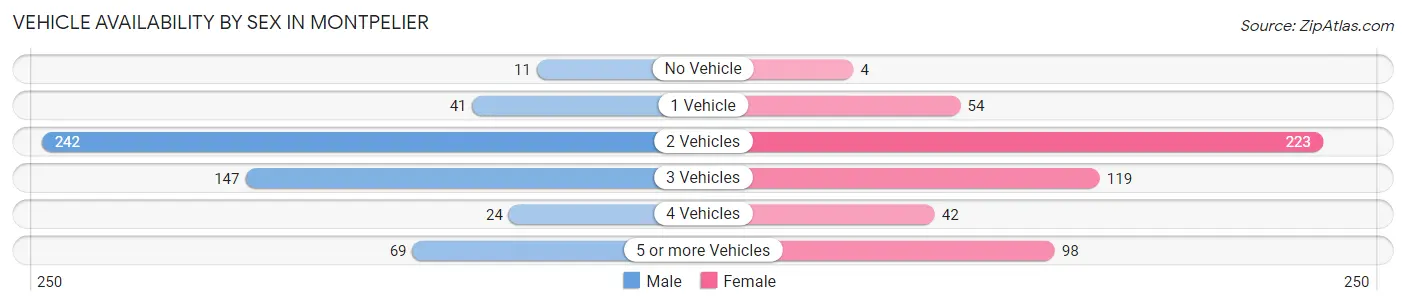
| Vehicles Available | Male | Female |
| No Vehicle | 11 (2.1%) | 4 (0.7%) |
| 1 Vehicle | 41 (7.7%) | 54 (10.0%) |
| 2 Vehicles | 242 (45.3%) | 223 (41.3%) |
| 3 Vehicles | 147 (27.5%) | 119 (22.0%) |
| 4 Vehicles | 24 (4.5%) | 42 (7.8%) |
| 5 or more Vehicles | 69 (12.9%) | 98 (18.1%) |
| Total | 534 (100.0%) | 540 (100.0%) |
Commute Time in Montpelier
The most frequently occuring commute durations in Montpelier are less than 5 minutes (286 commuters, 29.1%), 5 to 9 minutes (265 commuters, 26.9%), and 90 or more minutes (109 commuters, 11.1%).
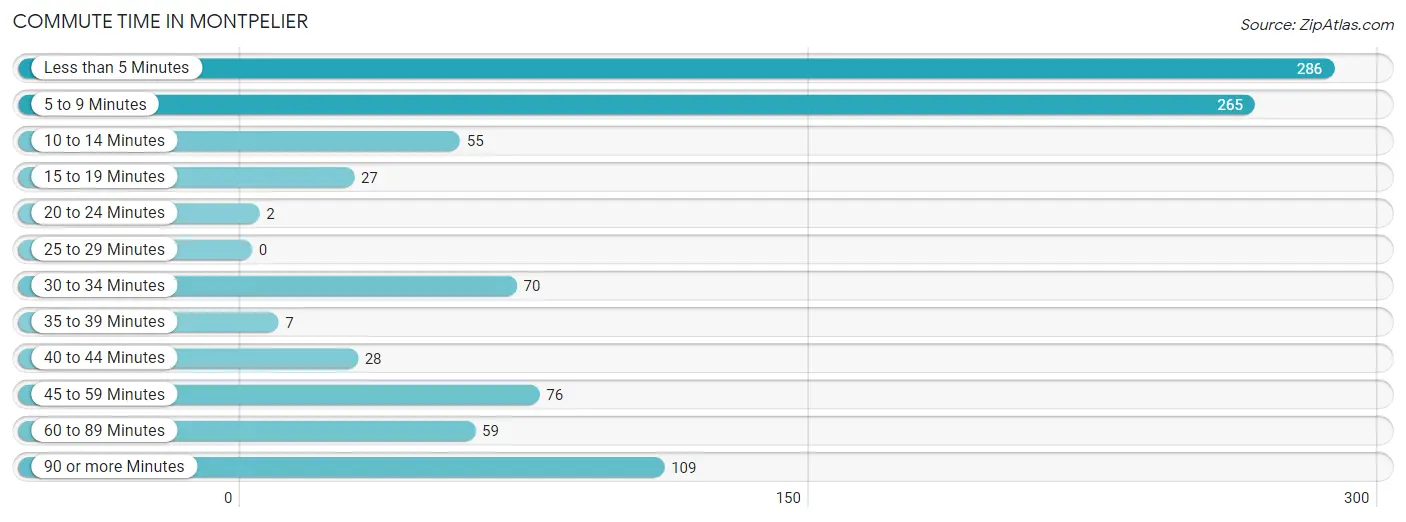
| Commute Time | # Commuters | % Commuters |
| Less than 5 Minutes | 286 | 29.1% |
| 5 to 9 Minutes | 265 | 26.9% |
| 10 to 14 Minutes | 55 | 5.6% |
| 15 to 19 Minutes | 27 | 2.7% |
| 20 to 24 Minutes | 2 | 0.2% |
| 25 to 29 Minutes | 0 | 0.0% |
| 30 to 34 Minutes | 70 | 7.1% |
| 35 to 39 Minutes | 7 | 0.7% |
| 40 to 44 Minutes | 28 | 2.9% |
| 45 to 59 Minutes | 76 | 7.7% |
| 60 to 89 Minutes | 59 | 6.0% |
| 90 or more Minutes | 109 | 11.1% |
Commute Time by Sex in Montpelier
The most common commute times in Montpelier are 5 to 9 minutes (129 commuters, 26.6%) for males and less than 5 minutes (209 commuters, 41.9%) for females.
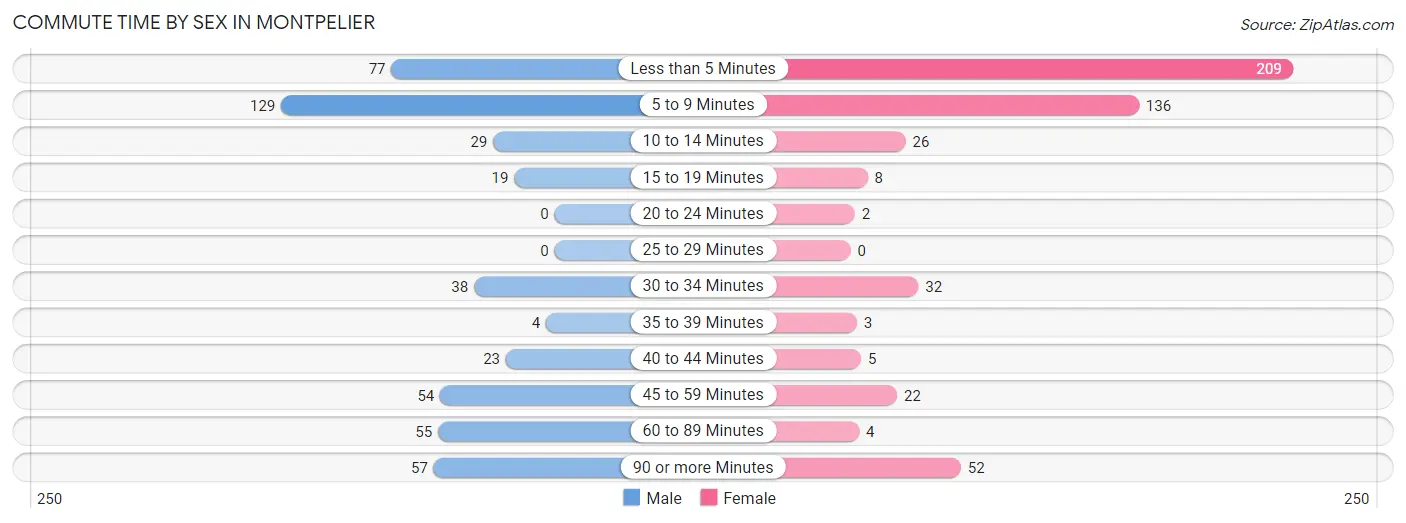
| Commute Time | Male | Female |
| Less than 5 Minutes | 77 (15.9%) | 209 (41.9%) |
| 5 to 9 Minutes | 129 (26.6%) | 136 (27.3%) |
| 10 to 14 Minutes | 29 (6.0%) | 26 (5.2%) |
| 15 to 19 Minutes | 19 (3.9%) | 8 (1.6%) |
| 20 to 24 Minutes | 0 (0.0%) | 2 (0.4%) |
| 25 to 29 Minutes | 0 (0.0%) | 0 (0.0%) |
| 30 to 34 Minutes | 38 (7.8%) | 32 (6.4%) |
| 35 to 39 Minutes | 4 (0.8%) | 3 (0.6%) |
| 40 to 44 Minutes | 23 (4.7%) | 5 (1.0%) |
| 45 to 59 Minutes | 54 (11.1%) | 22 (4.4%) |
| 60 to 89 Minutes | 55 (11.3%) | 4 (0.8%) |
| 90 or more Minutes | 57 (11.7%) | 52 (10.4%) |
Time of Departure to Work by Sex in Montpelier
The most frequent times of departure to work in Montpelier are 12:00 AM to 4:59 AM (92, 19.0%) for males and 7:30 AM to 7:59 AM (116, 23.3%) for females.
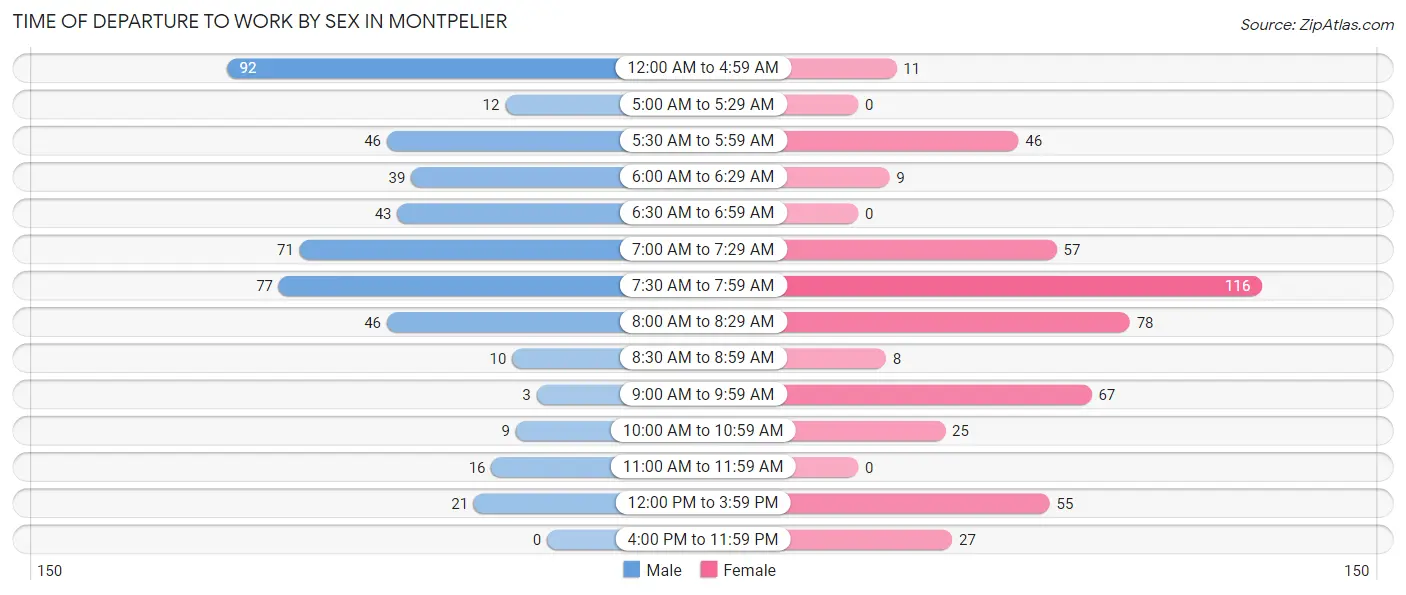
| Time of Departure | Male | Female |
| 12:00 AM to 4:59 AM | 92 (19.0%) | 11 (2.2%) |
| 5:00 AM to 5:29 AM | 12 (2.5%) | 0 (0.0%) |
| 5:30 AM to 5:59 AM | 46 (9.5%) | 46 (9.2%) |
| 6:00 AM to 6:29 AM | 39 (8.0%) | 9 (1.8%) |
| 6:30 AM to 6:59 AM | 43 (8.9%) | 0 (0.0%) |
| 7:00 AM to 7:29 AM | 71 (14.6%) | 57 (11.4%) |
| 7:30 AM to 7:59 AM | 77 (15.9%) | 116 (23.3%) |
| 8:00 AM to 8:29 AM | 46 (9.5%) | 78 (15.6%) |
| 8:30 AM to 8:59 AM | 10 (2.1%) | 8 (1.6%) |
| 9:00 AM to 9:59 AM | 3 (0.6%) | 67 (13.4%) |
| 10:00 AM to 10:59 AM | 9 (1.9%) | 25 (5.0%) |
| 11:00 AM to 11:59 AM | 16 (3.3%) | 0 (0.0%) |
| 12:00 PM to 3:59 PM | 21 (4.3%) | 55 (11.0%) |
| 4:00 PM to 11:59 PM | 0 (0.0%) | 27 (5.4%) |
| Total | 485 (100.0%) | 499 (100.0%) |
Housing Occupancy in Montpelier
Occupancy by Ownership in Montpelier
Of the total 1,037 dwellings in Montpelier, owner-occupied units account for 758 (73.1%), while renter-occupied units make up 279 (26.9%).
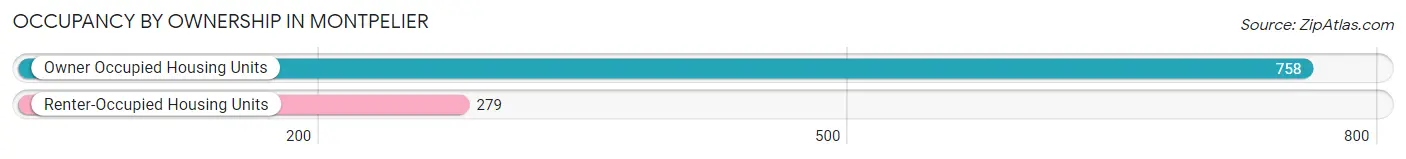
| Occupancy | # Housing Units | % Housing Units |
| Owner Occupied Housing Units | 758 | 73.1% |
| Renter-Occupied Housing Units | 279 | 26.9% |
| Total Occupied Housing Units | 1,037 | 100.0% |
Occupancy by Household Size in Montpelier
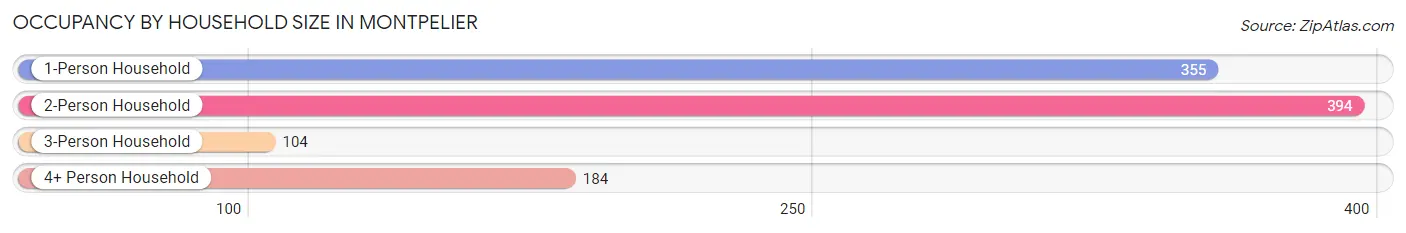
| Household Size | # Housing Units | % Housing Units |
| 1-Person Household | 355 | 34.2% |
| 2-Person Household | 394 | 38.0% |
| 3-Person Household | 104 | 10.0% |
| 4+ Person Household | 184 | 17.7% |
| Total Housing Units | 1,037 | 100.0% |
Occupancy by Ownership by Household Size in Montpelier
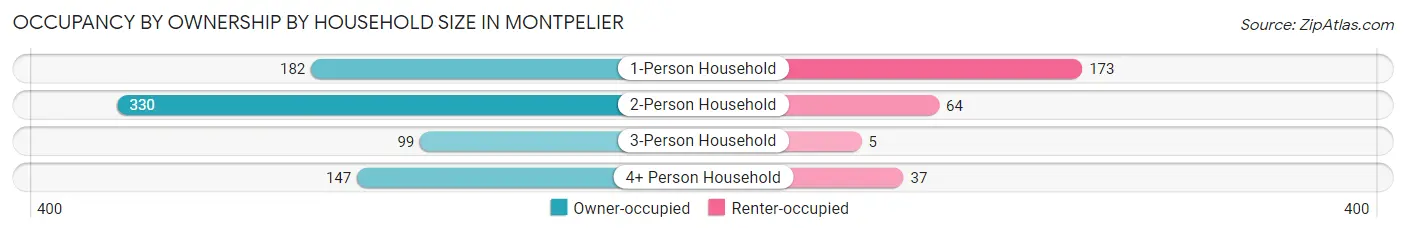
| Household Size | Owner-occupied | Renter-occupied |
| 1-Person Household | 182 (51.3%) | 173 (48.7%) |
| 2-Person Household | 330 (83.8%) | 64 (16.2%) |
| 3-Person Household | 99 (95.2%) | 5 (4.8%) |
| 4+ Person Household | 147 (79.9%) | 37 (20.1%) |
| Total Housing Units | 758 (73.1%) | 279 (26.9%) |
Occupancy by Educational Attainment in Montpelier
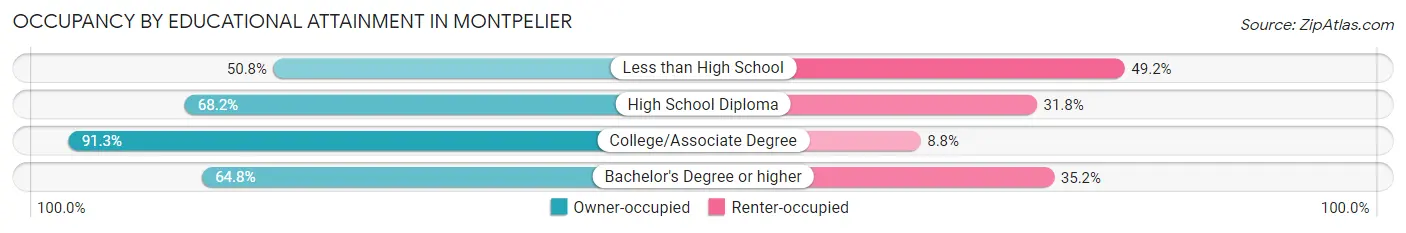
| Household Size | Owner-occupied | Renter-occupied |
| Less than High School | 65 (50.8%) | 63 (49.2%) |
| High School Diploma | 266 (68.2%) | 124 (31.8%) |
| College/Associate Degree | 313 (91.2%) | 30 (8.7%) |
| Bachelor's Degree or higher | 114 (64.8%) | 62 (35.2%) |
Occupancy by Age of Householder in Montpelier

| Age Bracket | # Households | % Households |
| Under 35 Years | 227 | 21.9% |
| 35 to 44 Years | 118 | 11.4% |
| 45 to 54 Years | 187 | 18.0% |
| 55 to 64 Years | 168 | 16.2% |
| 65 to 74 Years | 209 | 20.2% |
| 75 to 84 Years | 115 | 11.1% |
| 85 Years and Over | 13 | 1.3% |
| Total | 1,037 | 100.0% |
Housing Finances in Montpelier
Median Income by Occupancy in Montpelier
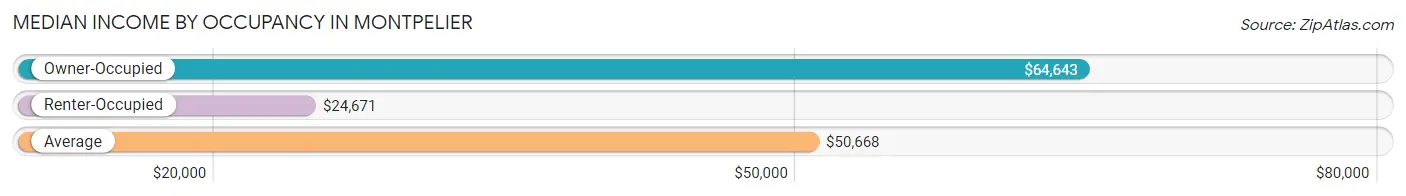
| Occupancy Type | # Households | Median Income |
| Owner-Occupied | 758 (73.1%) | $64,643 |
| Renter-Occupied | 279 (26.9%) | $24,671 |
| Average | 1,037 (100.0%) | $50,668 |
Occupancy by Householder Income Bracket in Montpelier
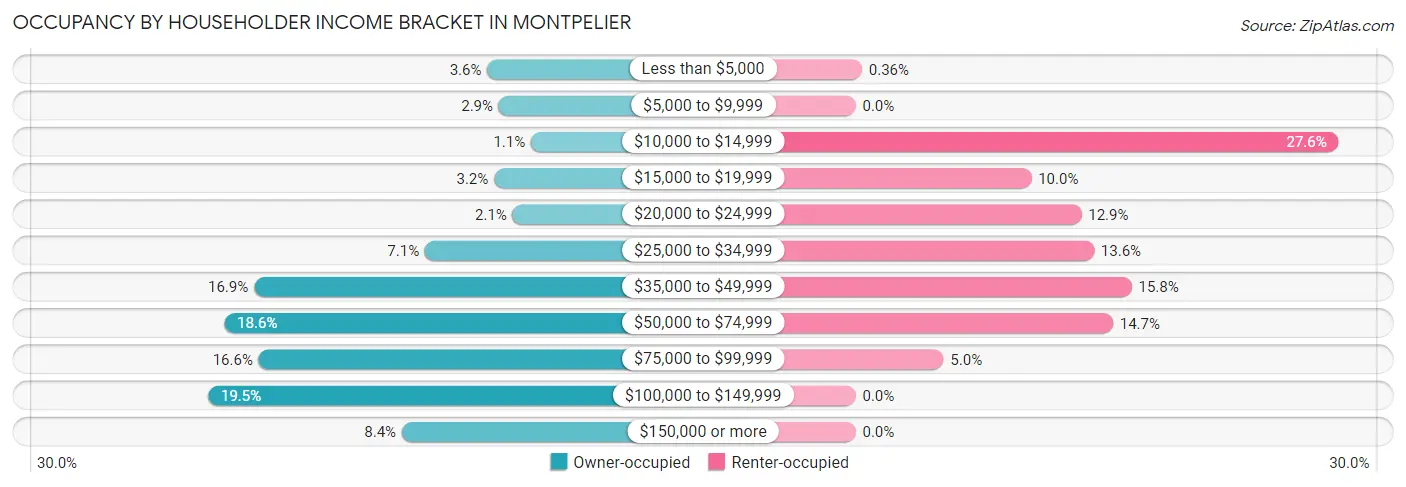
| Income Bracket | Owner-occupied | Renter-occupied |
| Less than $5,000 | 27 (3.6%) | 1 (0.4%) |
| $5,000 to $9,999 | 22 (2.9%) | 0 (0.0%) |
| $10,000 to $14,999 | 8 (1.1%) | 77 (27.6%) |
| $15,000 to $19,999 | 24 (3.2%) | 28 (10.0%) |
| $20,000 to $24,999 | 16 (2.1%) | 36 (12.9%) |
| $25,000 to $34,999 | 54 (7.1%) | 38 (13.6%) |
| $35,000 to $49,999 | 128 (16.9%) | 44 (15.8%) |
| $50,000 to $74,999 | 141 (18.6%) | 41 (14.7%) |
| $75,000 to $99,999 | 126 (16.6%) | 14 (5.0%) |
| $100,000 to $149,999 | 148 (19.5%) | 0 (0.0%) |
| $150,000 or more | 64 (8.4%) | 0 (0.0%) |
| Total | 758 (100.0%) | 279 (100.0%) |
Monthly Housing Cost Tiers in Montpelier
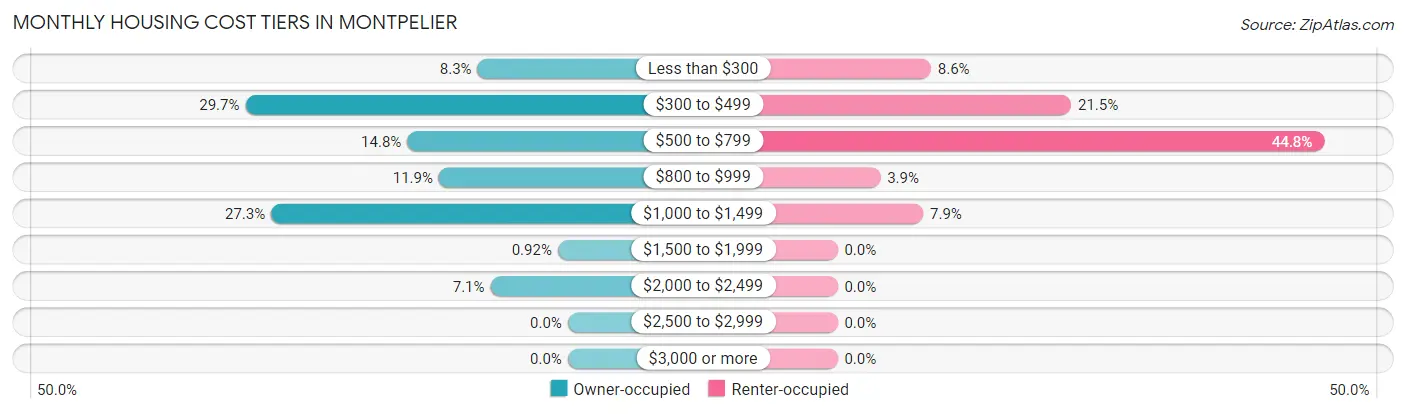
| Monthly Cost | Owner-occupied | Renter-occupied |
| Less than $300 | 63 (8.3%) | 24 (8.6%) |
| $300 to $499 | 225 (29.7%) | 60 (21.5%) |
| $500 to $799 | 112 (14.8%) | 125 (44.8%) |
| $800 to $999 | 90 (11.9%) | 11 (3.9%) |
| $1,000 to $1,499 | 207 (27.3%) | 22 (7.9%) |
| $1,500 to $1,999 | 7 (0.9%) | 0 (0.0%) |
| $2,000 to $2,499 | 54 (7.1%) | 0 (0.0%) |
| $2,500 to $2,999 | 0 (0.0%) | 0 (0.0%) |
| $3,000 or more | 0 (0.0%) | 0 (0.0%) |
| Total | 758 (100.0%) | 279 (100.0%) |
Physical Housing Characteristics in Montpelier
Housing Structures in Montpelier
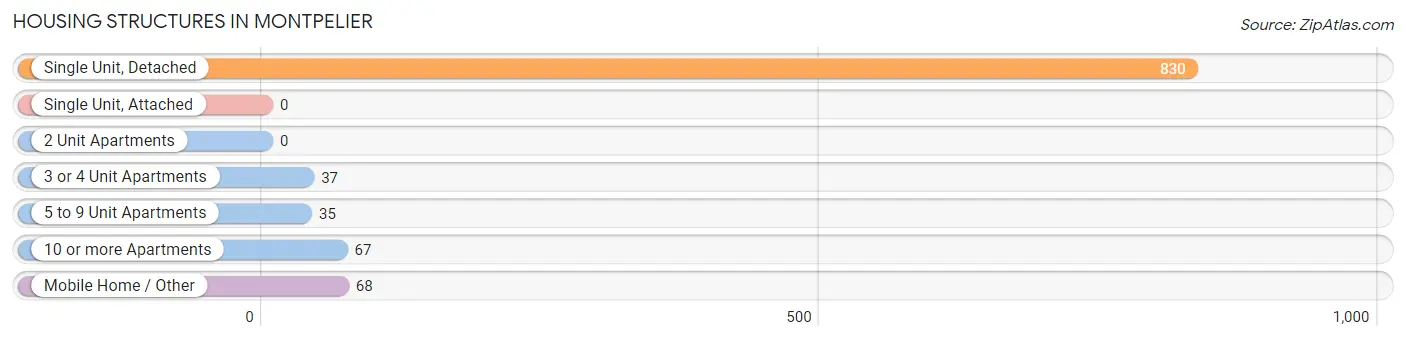
| Structure Type | # Housing Units | % Housing Units |
| Single Unit, Detached | 830 | 80.0% |
| Single Unit, Attached | 0 | 0.0% |
| 2 Unit Apartments | 0 | 0.0% |
| 3 or 4 Unit Apartments | 37 | 3.6% |
| 5 to 9 Unit Apartments | 35 | 3.4% |
| 10 or more Apartments | 67 | 6.5% |
| Mobile Home / Other | 68 | 6.6% |
| Total | 1,037 | 100.0% |
Housing Structures by Occupancy in Montpelier
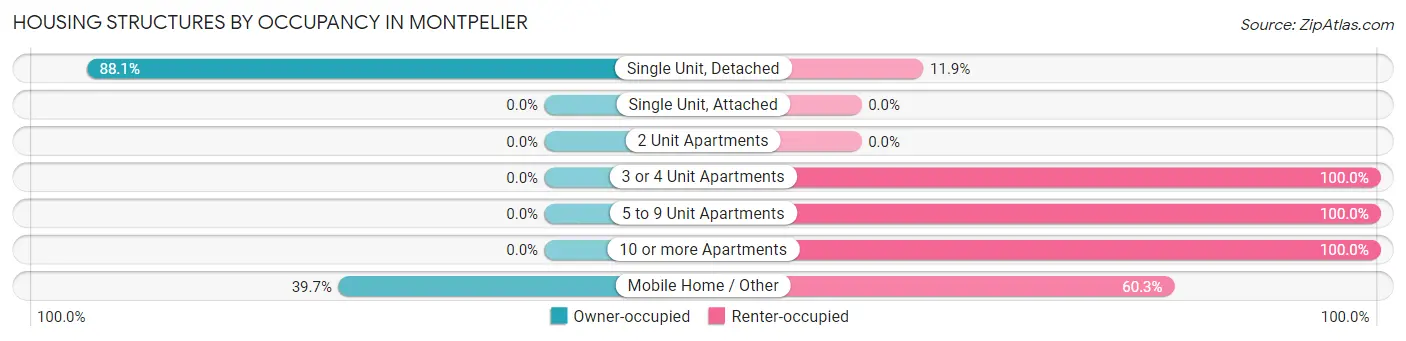
| Structure Type | Owner-occupied | Renter-occupied |
| Single Unit, Detached | 731 (88.1%) | 99 (11.9%) |
| Single Unit, Attached | 0 (0.0%) | 0 (0.0%) |
| 2 Unit Apartments | 0 (0.0%) | 0 (0.0%) |
| 3 or 4 Unit Apartments | 0 (0.0%) | 37 (100.0%) |
| 5 to 9 Unit Apartments | 0 (0.0%) | 35 (100.0%) |
| 10 or more Apartments | 0 (0.0%) | 67 (100.0%) |
| Mobile Home / Other | 27 (39.7%) | 41 (60.3%) |
| Total | 758 (73.1%) | 279 (26.9%) |
Housing Structures by Number of Rooms in Montpelier
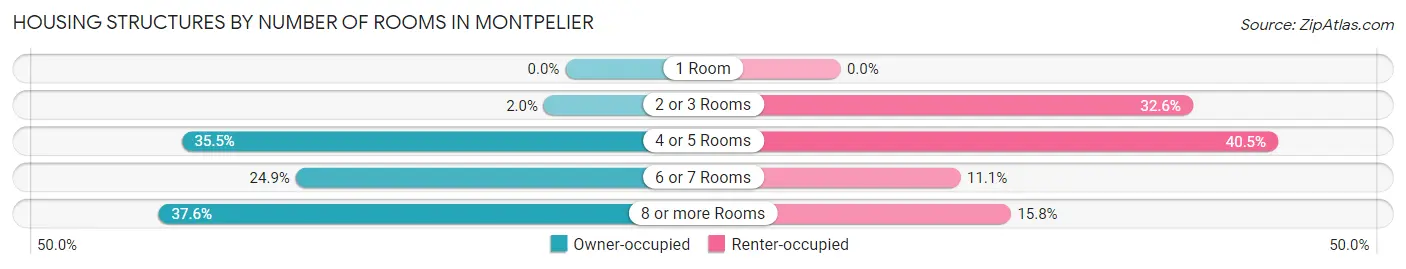
| Number of Rooms | Owner-occupied | Renter-occupied |
| 1 Room | 0 (0.0%) | 0 (0.0%) |
| 2 or 3 Rooms | 15 (2.0%) | 91 (32.6%) |
| 4 or 5 Rooms | 269 (35.5%) | 113 (40.5%) |
| 6 or 7 Rooms | 189 (24.9%) | 31 (11.1%) |
| 8 or more Rooms | 285 (37.6%) | 44 (15.8%) |
| Total | 758 (100.0%) | 279 (100.0%) |
Housing Structure by Heating Type in Montpelier
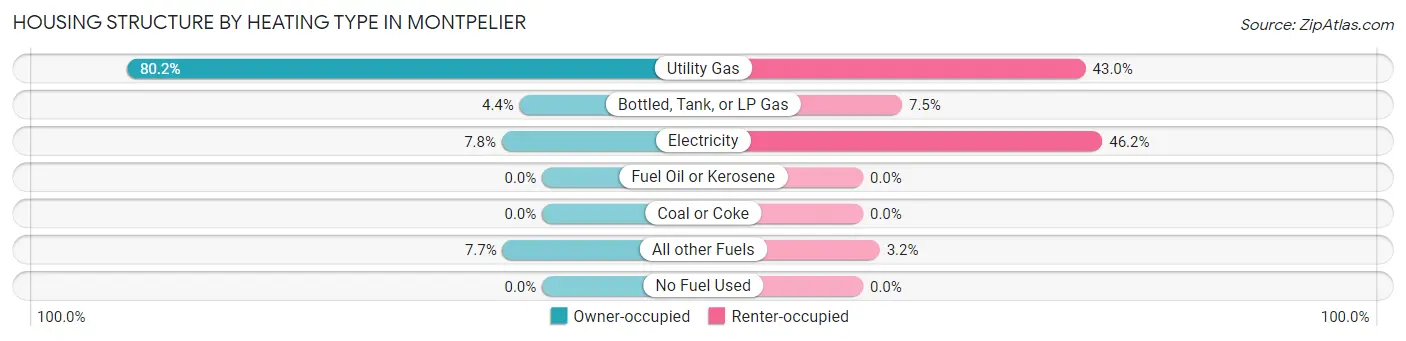
| Heating Type | Owner-occupied | Renter-occupied |
| Utility Gas | 608 (80.2%) | 120 (43.0%) |
| Bottled, Tank, or LP Gas | 33 (4.3%) | 21 (7.5%) |
| Electricity | 59 (7.8%) | 129 (46.2%) |
| Fuel Oil or Kerosene | 0 (0.0%) | 0 (0.0%) |
| Coal or Coke | 0 (0.0%) | 0 (0.0%) |
| All other Fuels | 58 (7.6%) | 9 (3.2%) |
| No Fuel Used | 0 (0.0%) | 0 (0.0%) |
| Total | 758 (100.0%) | 279 (100.0%) |
Household Vehicle Usage in Montpelier
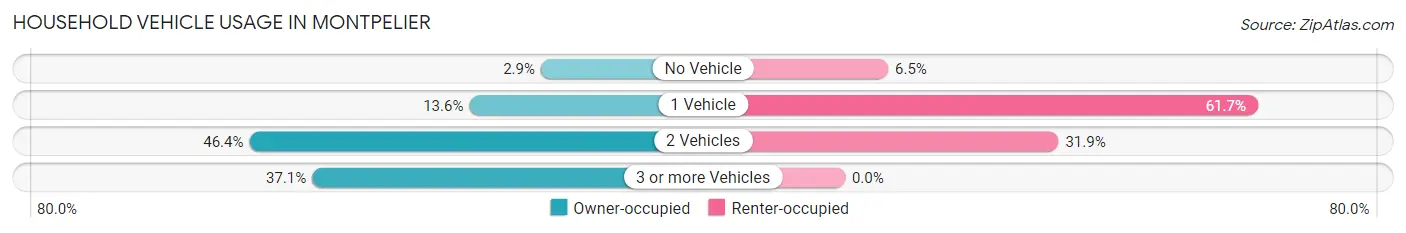
| Vehicles per Household | Owner-occupied | Renter-occupied |
| No Vehicle | 22 (2.9%) | 18 (6.5%) |
| 1 Vehicle | 103 (13.6%) | 172 (61.7%) |
| 2 Vehicles | 352 (46.4%) | 89 (31.9%) |
| 3 or more Vehicles | 281 (37.1%) | 0 (0.0%) |
| Total | 758 (100.0%) | 279 (100.0%) |
Real Estate & Mortgages in Montpelier
Real Estate and Mortgage Overview in Montpelier
| Characteristic | Without Mortgage | With Mortgage |
| Housing Units | 291 | 467 |
| Median Property Value | $122,000 | $181,700 |
| Median Household Income | $50,801 | $59 |
| Monthly Housing Costs | $336 | $0 |
| Real Estate Taxes | $959 | $17 |
Property Value by Mortgage Status in Montpelier
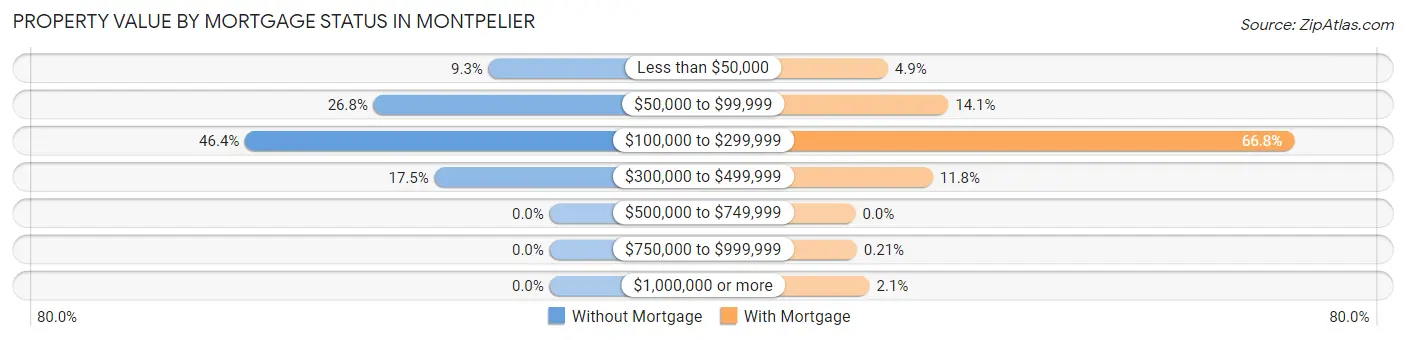
| Property Value | Without Mortgage | With Mortgage |
| Less than $50,000 | 27 (9.3%) | 23 (4.9%) |
| $50,000 to $99,999 | 78 (26.8%) | 66 (14.1%) |
| $100,000 to $299,999 | 135 (46.4%) | 312 (66.8%) |
| $300,000 to $499,999 | 51 (17.5%) | 55 (11.8%) |
| $500,000 to $749,999 | 0 (0.0%) | 0 (0.0%) |
| $750,000 to $999,999 | 0 (0.0%) | 1 (0.2%) |
| $1,000,000 or more | 0 (0.0%) | 10 (2.1%) |
| Total | 291 (100.0%) | 467 (100.0%) |
Household Income by Mortgage Status in Montpelier
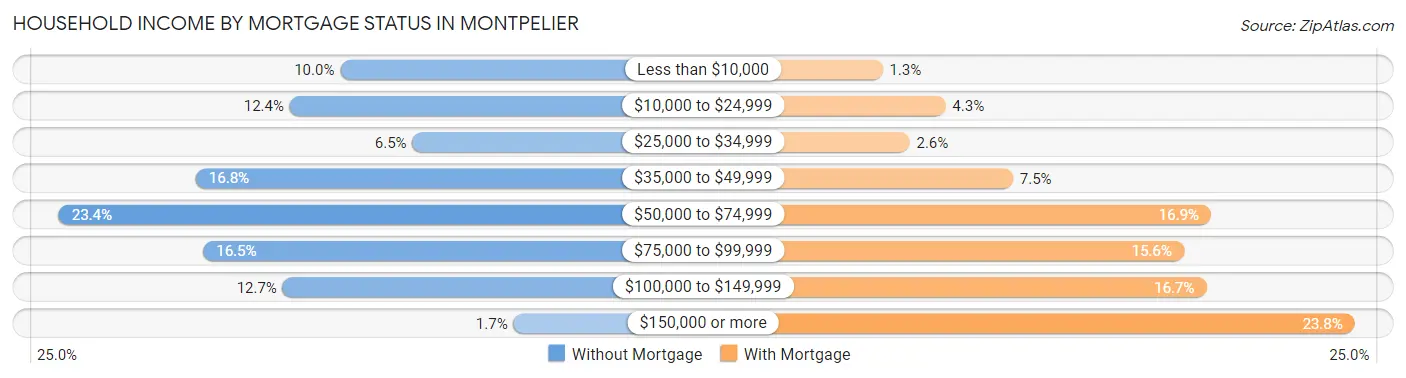
| Household Income | Without Mortgage | With Mortgage |
| Less than $10,000 | 29 (10.0%) | 6 (1.3%) |
| $10,000 to $24,999 | 36 (12.4%) | 20 (4.3%) |
| $25,000 to $34,999 | 19 (6.5%) | 12 (2.6%) |
| $35,000 to $49,999 | 49 (16.8%) | 35 (7.5%) |
| $50,000 to $74,999 | 68 (23.4%) | 79 (16.9%) |
| $75,000 to $99,999 | 48 (16.5%) | 73 (15.6%) |
| $100,000 to $149,999 | 37 (12.7%) | 78 (16.7%) |
| $150,000 or more | 5 (1.7%) | 111 (23.8%) |
| Total | 291 (100.0%) | 467 (100.0%) |
Property Value to Household Income Ratio in Montpelier
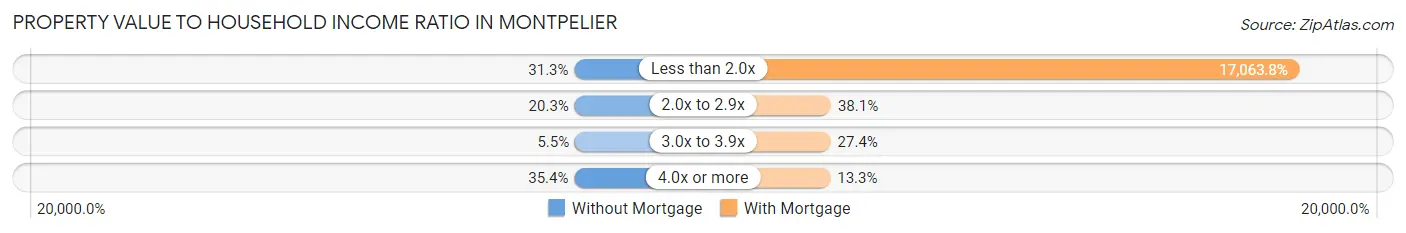
| Value-to-Income Ratio | Without Mortgage | With Mortgage |
| Less than 2.0x | 91 (31.3%) | 79,688 (17,063.8%) |
| 2.0x to 2.9x | 59 (20.3%) | 178 (38.1%) |
| 3.0x to 3.9x | 16 (5.5%) | 128 (27.4%) |
| 4.0x or more | 103 (35.4%) | 62 (13.3%) |
| Total | 291 (100.0%) | 467 (100.0%) |
Real Estate Taxes by Mortgage Status in Montpelier
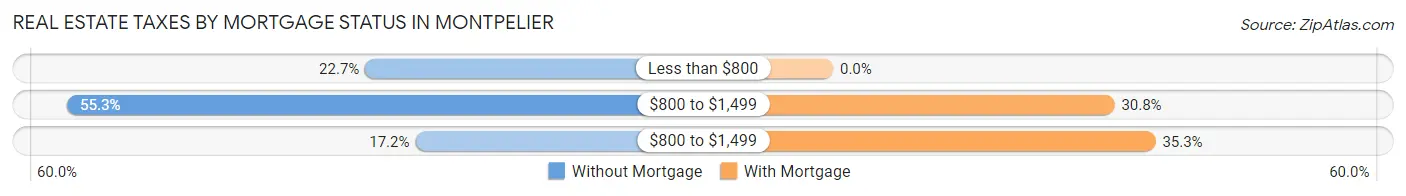
| Property Taxes | Without Mortgage | With Mortgage |
| Less than $800 | 66 (22.7%) | 0 (0.0%) |
| $800 to $1,499 | 161 (55.3%) | 144 (30.8%) |
| $800 to $1,499 | 50 (17.2%) | 165 (35.3%) |
| Total | 291 (100.0%) | 467 (100.0%) |
Health & Disability in Montpelier
Health Insurance Coverage by Age in Montpelier
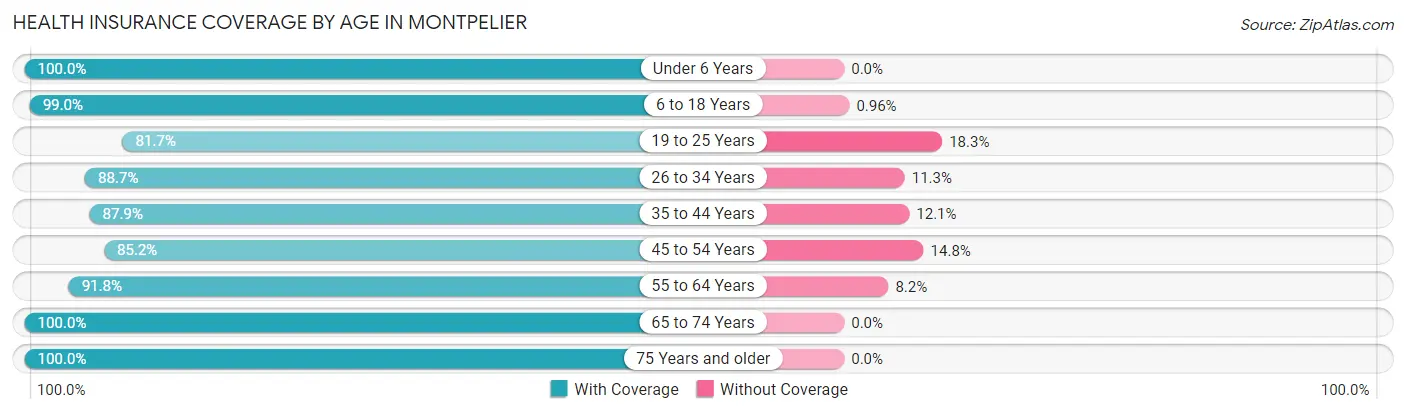
| Age Bracket | With Coverage | Without Coverage |
| Under 6 Years | 281 (100.0%) | 0 (0.0%) |
| 6 to 18 Years | 411 (99.0%) | 4 (1.0%) |
| 19 to 25 Years | 179 (81.7%) | 40 (18.3%) |
| 26 to 34 Years | 291 (88.7%) | 37 (11.3%) |
| 35 to 44 Years | 239 (87.9%) | 33 (12.1%) |
| 45 to 54 Years | 282 (85.2%) | 49 (14.8%) |
| 55 to 64 Years | 245 (91.8%) | 22 (8.2%) |
| 65 to 74 Years | 288 (100.0%) | 0 (0.0%) |
| 75 Years and older | 186 (100.0%) | 0 (0.0%) |
| Total | 2,402 (92.8%) | 185 (7.1%) |
Health Insurance Coverage by Citizenship Status in Montpelier
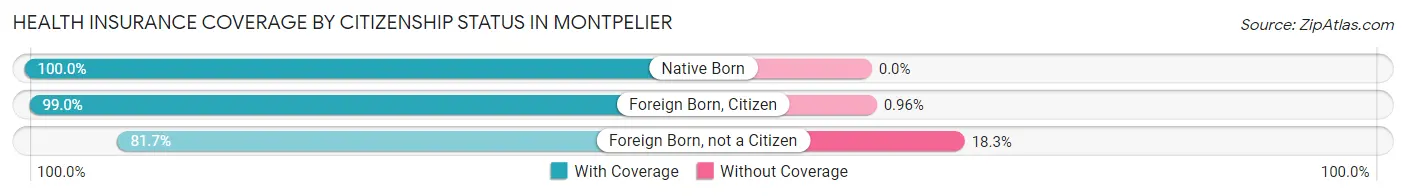
| Citizenship Status | With Coverage | Without Coverage |
| Native Born | 281 (100.0%) | 0 (0.0%) |
| Foreign Born, Citizen | 411 (99.0%) | 4 (1.0%) |
| Foreign Born, not a Citizen | 179 (81.7%) | 40 (18.3%) |
Health Insurance Coverage by Household Income in Montpelier
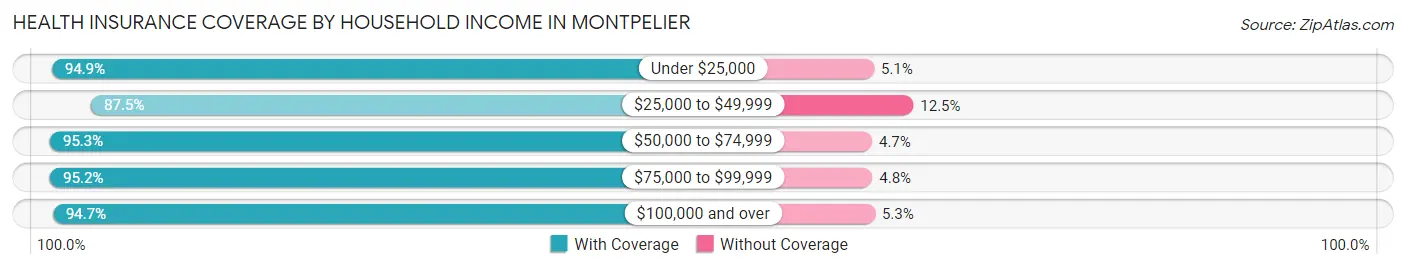
| Household Income | With Coverage | Without Coverage |
| Under $25,000 | 279 (94.9%) | 15 (5.1%) |
| $25,000 to $49,999 | 646 (87.5%) | 92 (12.5%) |
| $50,000 to $74,999 | 383 (95.3%) | 19 (4.7%) |
| $75,000 to $99,999 | 358 (95.2%) | 18 (4.8%) |
| $100,000 and over | 736 (94.7%) | 41 (5.3%) |
Public vs Private Health Insurance Coverage by Age in Montpelier
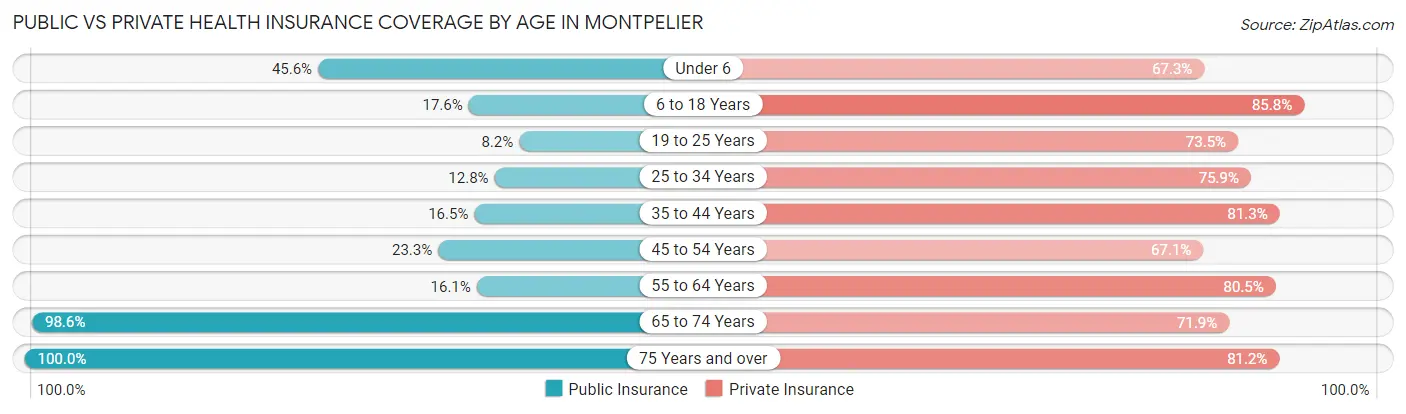
| Age Bracket | Public Insurance | Private Insurance |
| Under 6 | 128 (45.6%) | 189 (67.3%) |
| 6 to 18 Years | 73 (17.6%) | 356 (85.8%) |
| 19 to 25 Years | 18 (8.2%) | 161 (73.5%) |
| 25 to 34 Years | 42 (12.8%) | 249 (75.9%) |
| 35 to 44 Years | 45 (16.5%) | 221 (81.2%) |
| 45 to 54 Years | 77 (23.3%) | 222 (67.1%) |
| 55 to 64 Years | 43 (16.1%) | 215 (80.5%) |
| 65 to 74 Years | 284 (98.6%) | 207 (71.9%) |
| 75 Years and over | 186 (100.0%) | 151 (81.2%) |
| Total | 896 (34.6%) | 1,971 (76.2%) |
Disability Status by Sex by Age in Montpelier
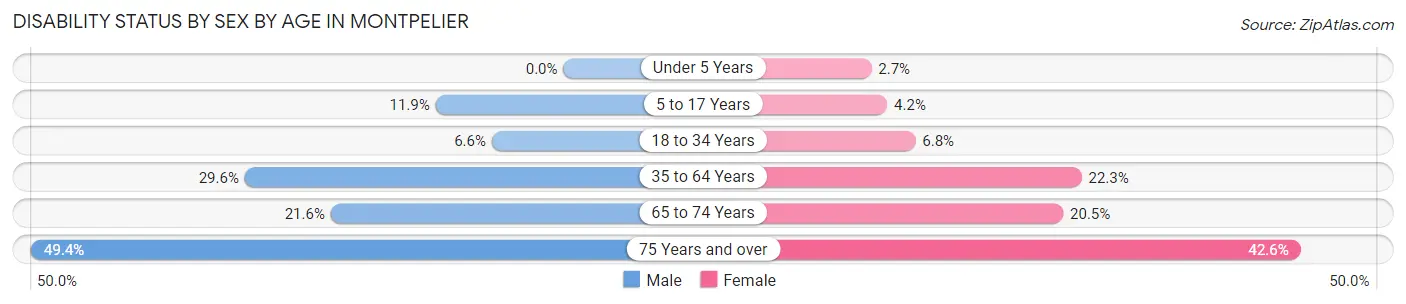
| Age Bracket | Male | Female |
| Under 5 Years | 0 (0.0%) | 2 (2.7%) |
| 5 to 17 Years | 21 (11.9%) | 11 (4.2%) |
| 18 to 34 Years | 20 (6.6%) | 20 (6.8%) |
| 35 to 64 Years | 131 (29.6%) | 95 (22.3%) |
| 65 to 74 Years | 38 (21.6%) | 23 (20.5%) |
| 75 Years and over | 42 (49.4%) | 43 (42.6%) |
Disability Class by Sex by Age in Montpelier
Disability Class: Hearing Difficulty
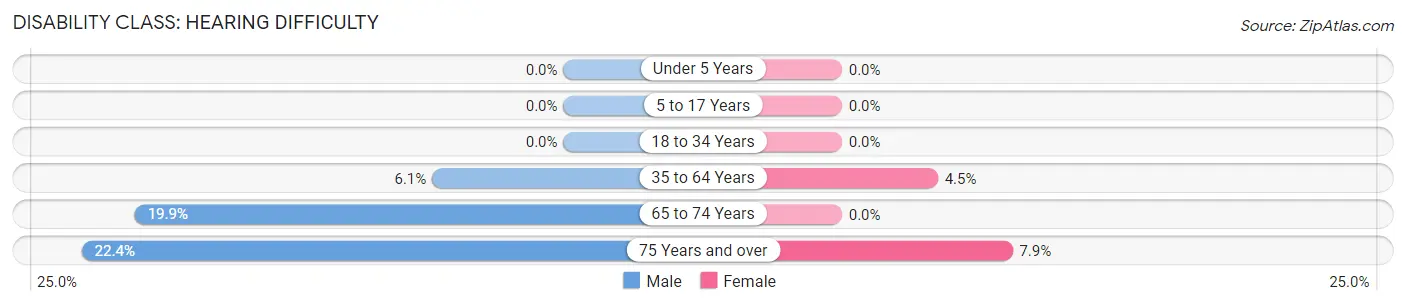
| Age Bracket | Male | Female |
| Under 5 Years | 0 (0.0%) | 0 (0.0%) |
| 5 to 17 Years | 0 (0.0%) | 0 (0.0%) |
| 18 to 34 Years | 0 (0.0%) | 0 (0.0%) |
| 35 to 64 Years | 27 (6.1%) | 19 (4.4%) |
| 65 to 74 Years | 35 (19.9%) | 0 (0.0%) |
| 75 Years and over | 19 (22.4%) | 8 (7.9%) |
Disability Class: Vision Difficulty
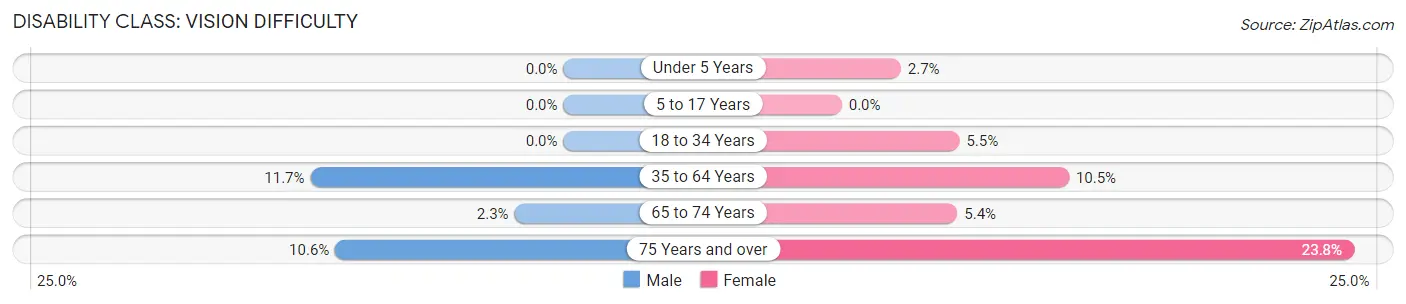
| Age Bracket | Male | Female |
| Under 5 Years | 0 (0.0%) | 2 (2.7%) |
| 5 to 17 Years | 0 (0.0%) | 0 (0.0%) |
| 18 to 34 Years | 0 (0.0%) | 16 (5.5%) |
| 35 to 64 Years | 52 (11.7%) | 45 (10.5%) |
| 65 to 74 Years | 4 (2.3%) | 6 (5.4%) |
| 75 Years and over | 9 (10.6%) | 24 (23.8%) |
Disability Class: Cognitive Difficulty
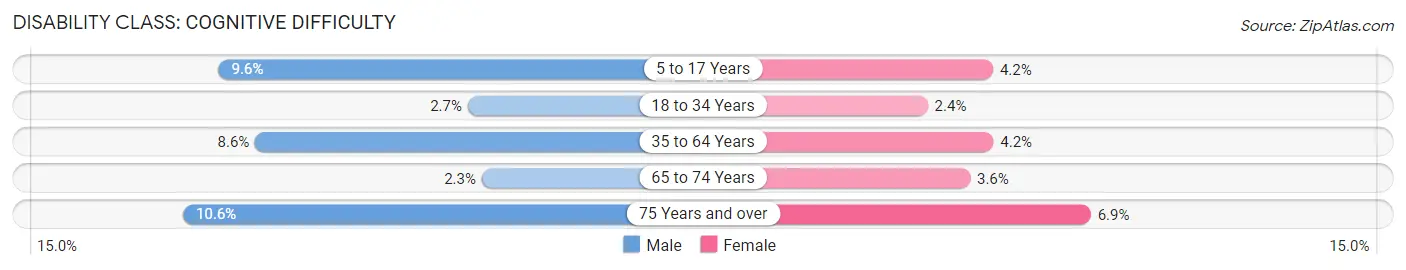
| Age Bracket | Male | Female |
| 5 to 17 Years | 17 (9.6%) | 11 (4.2%) |
| 18 to 34 Years | 8 (2.7%) | 7 (2.4%) |
| 35 to 64 Years | 38 (8.6%) | 18 (4.2%) |
| 65 to 74 Years | 4 (2.3%) | 4 (3.6%) |
| 75 Years and over | 9 (10.6%) | 7 (6.9%) |
Disability Class: Ambulatory Difficulty
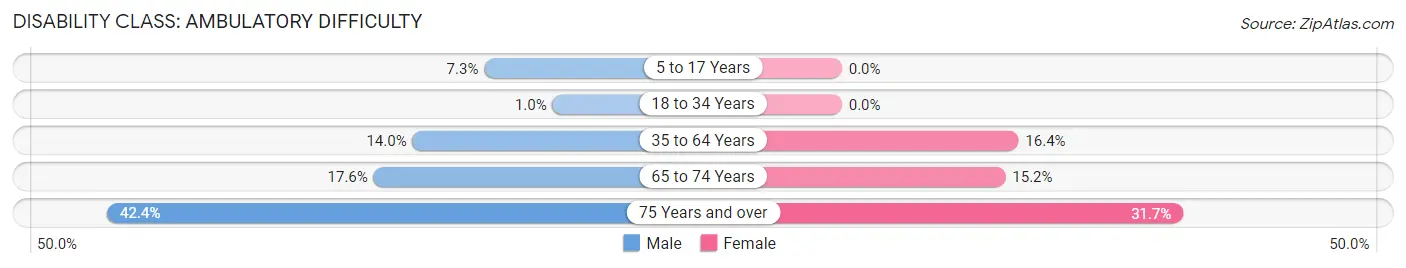
| Age Bracket | Male | Female |
| 5 to 17 Years | 13 (7.3%) | 0 (0.0%) |
| 18 to 34 Years | 3 (1.0%) | 0 (0.0%) |
| 35 to 64 Years | 62 (14.0%) | 70 (16.4%) |
| 65 to 74 Years | 31 (17.6%) | 17 (15.2%) |
| 75 Years and over | 36 (42.3%) | 32 (31.7%) |
Disability Class: Self-Care Difficulty
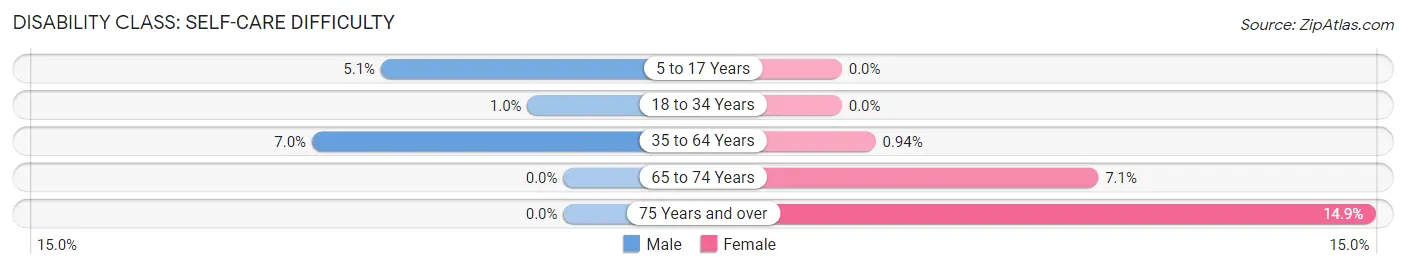
| Age Bracket | Male | Female |
| 5 to 17 Years | 9 (5.1%) | 0 (0.0%) |
| 18 to 34 Years | 3 (1.0%) | 0 (0.0%) |
| 35 to 64 Years | 31 (7.0%) | 4 (0.9%) |
| 65 to 74 Years | 0 (0.0%) | 8 (7.1%) |
| 75 Years and over | 0 (0.0%) | 15 (14.8%) |
Technology Access in Montpelier
Computing Device Access in Montpelier
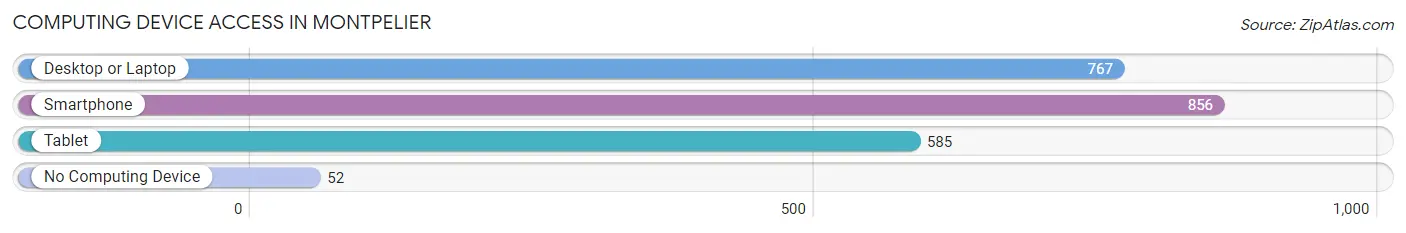
| Device Type | # Households | % Households |
| Desktop or Laptop | 767 | 74.0% |
| Smartphone | 856 | 82.6% |
| Tablet | 585 | 56.4% |
| No Computing Device | 52 | 5.0% |
| Total | 1,037 | 100.0% |
Internet Access in Montpelier
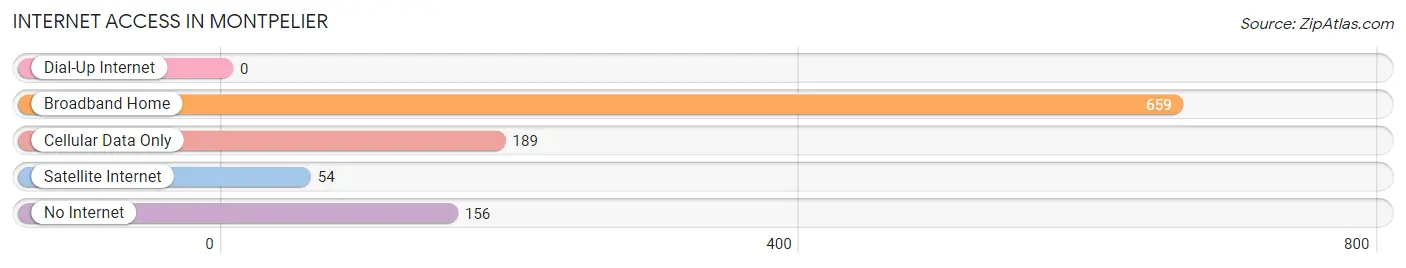
| Internet Type | # Households | % Households |
| Dial-Up Internet | 0 | 0.0% |
| Broadband Home | 659 | 63.5% |
| Cellular Data Only | 189 | 18.2% |
| Satellite Internet | 54 | 5.2% |
| No Internet | 156 | 15.0% |
| Total | 1,037 | 100.0% |
Montpelier Summary
Montpelier, Idaho is a small city located in Bear Lake County in the southeastern corner of the state. It is the county seat and the largest city in the county. The city is situated in a valley surrounded by the Bear Lake Mountains and is located near the Utah border. The city has a population of 2,521 as of the 2010 census.
History
Montpelier was founded in 1864 by Mormon settlers who were sent to the area by Brigham Young. The city was named after the French city of Montpellier. The settlers built a fort and a sawmill and began to farm the land. The city was incorporated in 1883 and the first mayor was elected in 1884.
In the early 1900s, the city experienced a period of growth and development. The railroad arrived in 1906 and the city became a major shipping center for the surrounding area. The city also became a center for the lumber industry and the local economy began to grow.
Geography
Montpelier is located in the Bear Lake Valley, which is surrounded by the Bear Lake Mountains. The city is situated at an elevation of 5,845 feet and is located near the Utah border. The city is located in a semi-arid climate zone and receives an average of 16 inches of precipitation per year.
The city is located along the Bear River and is home to several parks and recreational areas. The city is also home to the Bear Lake National Wildlife Refuge, which is a protected area for migratory birds.
Economy
The economy of Montpelier is largely based on agriculture and tourism. The city is home to several farms and ranches that produce a variety of crops, including potatoes, hay, and alfalfa. The city is also home to several tourist attractions, including the Bear Lake National Wildlife Refuge and the Bear Lake State Park.
The city is also home to several manufacturing companies, including a furniture factory and a wood products plant. The city is also home to several retail stores and restaurants.
Demographics
As of the 2010 census, the population of Montpelier was 2,521. The racial makeup of the city was 95.3% White, 0.3% African American, 0.7% Native American, 0.3% Asian, 0.1% Pacific Islander, 1.2% from other races, and 2.3% from two or more races. Hispanic or Latino of any race were 4.2% of the population.
The median income for a household in the city was $37,917 and the median income for a family was $45,938. The per capita income for the city was $17,945. About 11.2% of families and 14.2% of the population were below the poverty line, including 17.2% of those under age 18 and 8.2% of those age 65 or over.
Common Questions
What is Per Capita Income in Montpelier?
Per Capita income in Montpelier is $27,350.
What is the Median Family Income in Montpelier?
Median Family Income in Montpelier is $70,625.
What is the Median Household income in Montpelier?
Median Household Income in Montpelier is $50,668.
What is Income or Wage Gap in Montpelier?
Income or Wage Gap in Montpelier is 45.6%.
Women in Montpelier earn 54.4 cents for every dollar earned by a man.
What is Inequality or Gini Index in Montpelier?
Inequality or Gini Index in Montpelier is 0.44.
What is the Total Population of Montpelier?
Total Population of Montpelier is 2,649.
What is the Total Male Population of Montpelier?
Total Male Population of Montpelier is 1,331.
What is the Total Female Population of Montpelier?
Total Female Population of Montpelier is 1,318.
What is the Ratio of Males per 100 Females in Montpelier?
There are 100.99 Males per 100 Females in Montpelier.
What is the Ratio of Females per 100 Males in Montpelier?
There are 99.02 Females per 100 Males in Montpelier.
What is the Median Population Age in Montpelier?
Median Population Age in Montpelier is 37.4 Years.
What is the Average Family Size in Montpelier
Average Family Size in Montpelier is 3.2 People.
What is the Average Household Size in Montpelier
Average Household Size in Montpelier is 2.5 People.
How Large is the Labor Force in Montpelier?
There are 1,211 People in the Labor Forcein in Montpelier.
What is the Percentage of People in the Labor Force in Montpelier?
58.5% of People are in the Labor Force in Montpelier.
What is the Unemployment Rate in Montpelier?
Unemployment Rate in Montpelier is 7.3%.