Midvale, ID Map & Demographics
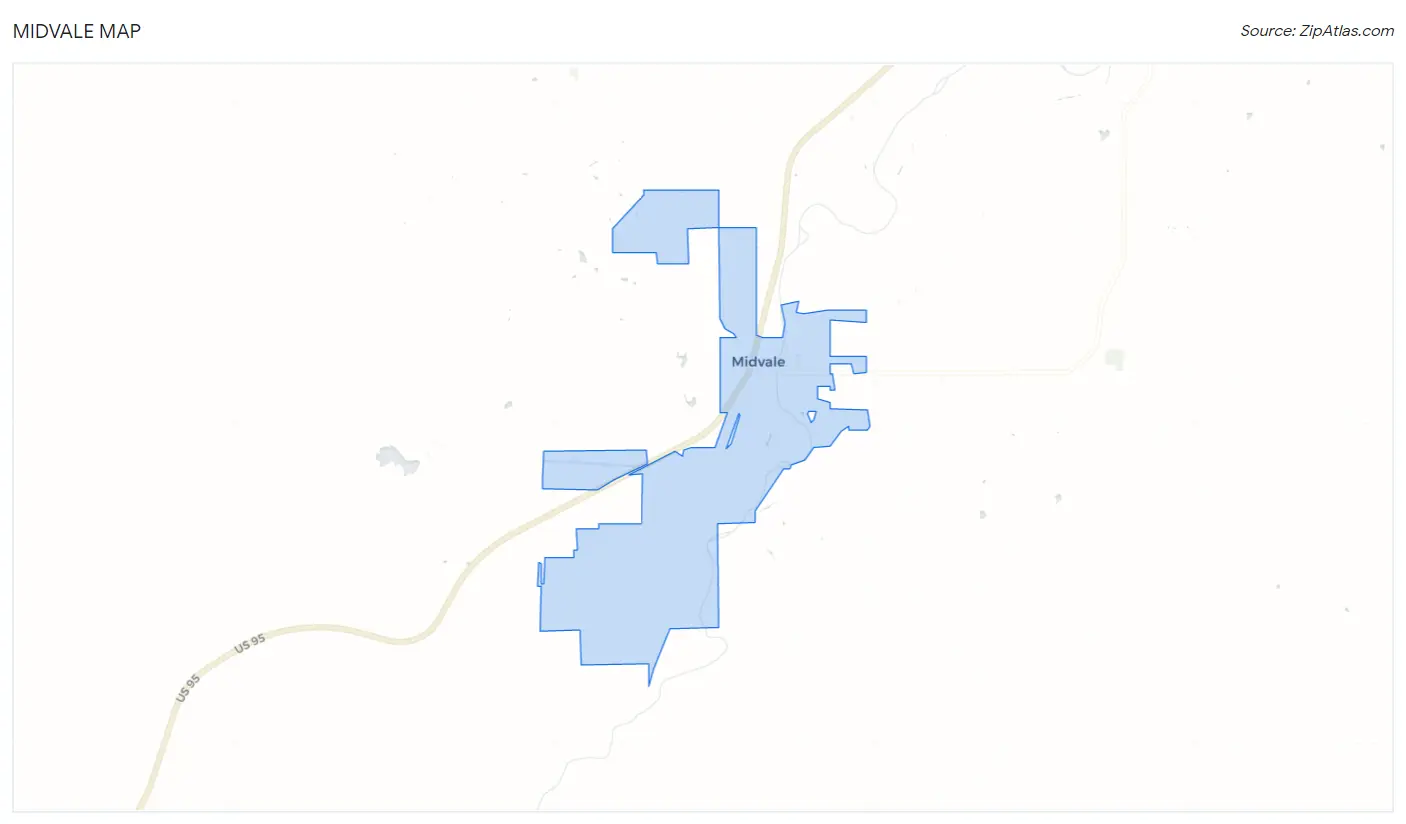
Midvale Map
Midvale Overview
$20,451
PER CAPITA INCOME
$53,125
AVG FAMILY INCOME
$53,333
AVG HOUSEHOLD INCOME
60.0%
WAGE / INCOME GAP [ % ]
40.0¢/ $1
WAGE / INCOME GAP [ $ ]
0.35
INEQUALITY / GINI INDEX
273
TOTAL POPULATION
135
MALE POPULATION
138
FEMALE POPULATION
97.83
MALES / 100 FEMALES
102.22
FEMALES / 100 MALES
44.6
MEDIAN AGE
3.4
AVG FAMILY SIZE
3.2
AVG HOUSEHOLD SIZE
86
LABOR FORCE [ PEOPLE ]
41.5%
PERCENT IN LABOR FORCE
5.8%
UNEMPLOYMENT RATE
Midvale Zip Codes
Midvale Area Codes
Income in Midvale
Income Overview in Midvale
Per Capita Income in Midvale is $20,451, while median incomes of families and households are $53,125 and $53,333 respectively.
| Characteristic | Number | Measure |
| Per Capita Income | 273 | $20,451 |
| Median Family Income | 75 | $53,125 |
| Mean Family Income | 75 | $59,315 |
| Median Household Income | 86 | $53,333 |
| Mean Household Income | 86 | $59,883 |
| Income Deficit | 75 | $0 |
| Wage / Income Gap (%) | 273 | 60.00% |
| Wage / Income Gap ($) | 273 | 40.00¢ per $1 |
| Gini / Inequality Index | 273 | 0.35 |
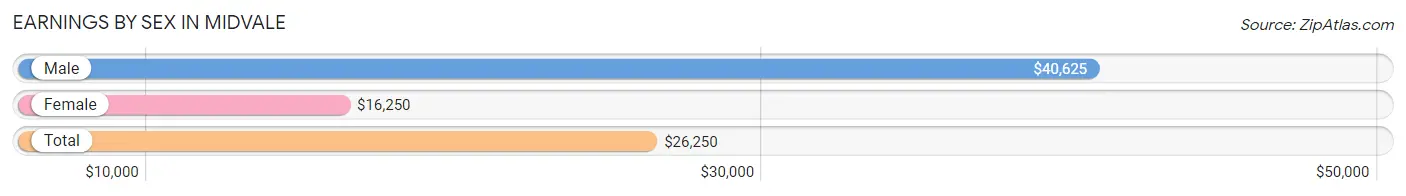
Earnings by Sex in Midvale
Average Earnings in Midvale are $26,250, $40,625 for men and $16,250 for women, a difference of 60.0%.
| Sex | Number | Average Earnings |
| Male | 63 (70.8%) | $40,625 |
| Female | 26 (29.2%) | $16,250 |
| Total | 89 (100.0%) | $26,250 |
Earnings by Sex by Income Bracket in Midvale
The most common earnings brackets in Midvale are $22,500 to $24,999 for men (7 | 11.1%) and $15,000 to $17,499 for women (10 | 38.5%).
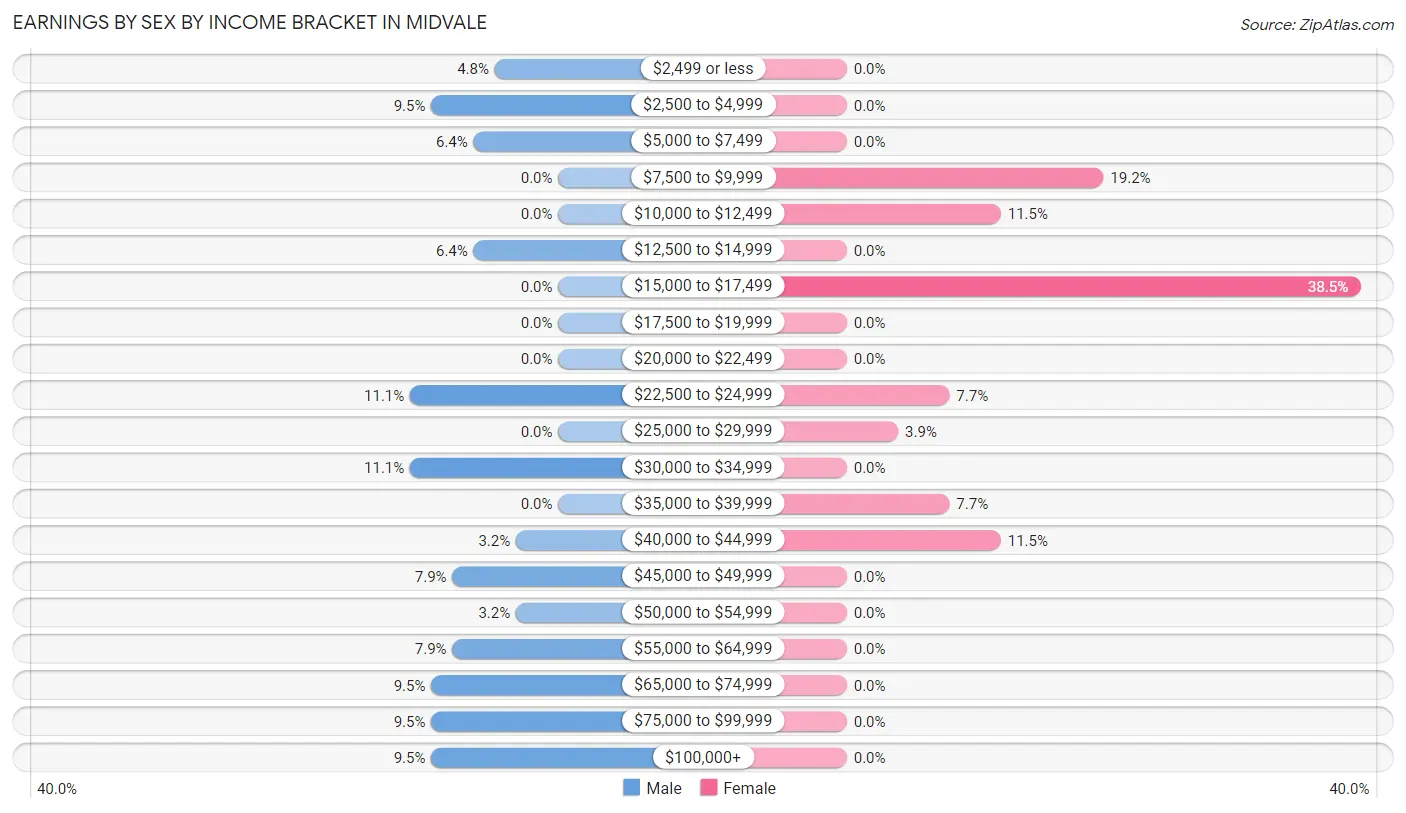
| Income | Male | Female |
| $2,499 or less | 3 (4.8%) | 0 (0.0%) |
| $2,500 to $4,999 | 6 (9.5%) | 0 (0.0%) |
| $5,000 to $7,499 | 4 (6.4%) | 0 (0.0%) |
| $7,500 to $9,999 | 0 (0.0%) | 5 (19.2%) |
| $10,000 to $12,499 | 0 (0.0%) | 3 (11.5%) |
| $12,500 to $14,999 | 4 (6.4%) | 0 (0.0%) |
| $15,000 to $17,499 | 0 (0.0%) | 10 (38.5%) |
| $17,500 to $19,999 | 0 (0.0%) | 0 (0.0%) |
| $20,000 to $22,499 | 0 (0.0%) | 0 (0.0%) |
| $22,500 to $24,999 | 7 (11.1%) | 2 (7.7%) |
| $25,000 to $29,999 | 0 (0.0%) | 1 (3.8%) |
| $30,000 to $34,999 | 7 (11.1%) | 0 (0.0%) |
| $35,000 to $39,999 | 0 (0.0%) | 2 (7.7%) |
| $40,000 to $44,999 | 2 (3.2%) | 3 (11.5%) |
| $45,000 to $49,999 | 5 (7.9%) | 0 (0.0%) |
| $50,000 to $54,999 | 2 (3.2%) | 0 (0.0%) |
| $55,000 to $64,999 | 5 (7.9%) | 0 (0.0%) |
| $65,000 to $74,999 | 6 (9.5%) | 0 (0.0%) |
| $75,000 to $99,999 | 6 (9.5%) | 0 (0.0%) |
| $100,000+ | 6 (9.5%) | 0 (0.0%) |
| Total | 63 (100.0%) | 26 (100.0%) |
Earnings by Sex by Educational Attainment in Midvale
Average earnings in Midvale are $46,500 for men and $16,250 for women, a difference of 65.0%. Men with an educational attainment of high school diploma enjoy the highest average annual earnings of $75,833, while those with bachelor's degree education earn the least with $53,750. Women with an educational attainment of high school diploma earn the most with the average annual earnings of $15,750, while those with high school diploma education have the smallest earnings of $15,750.
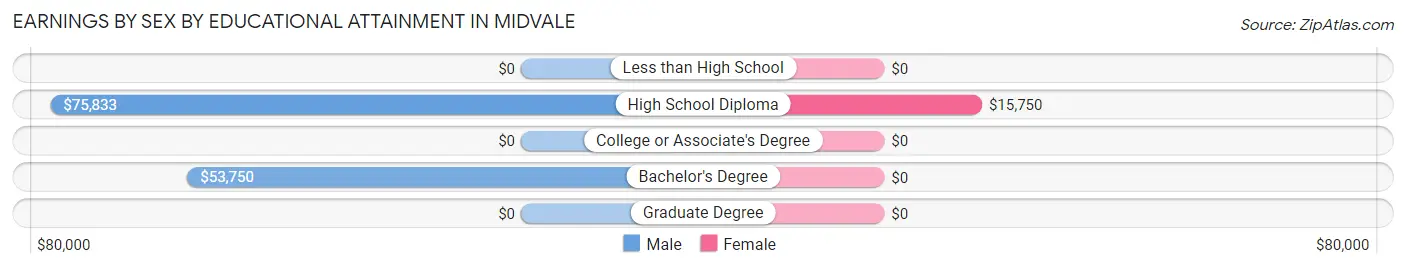
| Educational Attainment | Male Income | Female Income |
| Less than High School | - | - |
| High School Diploma | $75,833 | $15,750 |
| College or Associate's Degree | - | - |
| Bachelor's Degree | $53,750 | $0 |
| Graduate Degree | - | - |
| Total | $46,500 | $16,250 |
Family Income in Midvale
Family Income Brackets in Midvale
According to the Midvale family income data, there are 18 families falling into the $75,000 to $99,999 income range, which is the most common income bracket and makes up 24.0% of all families.
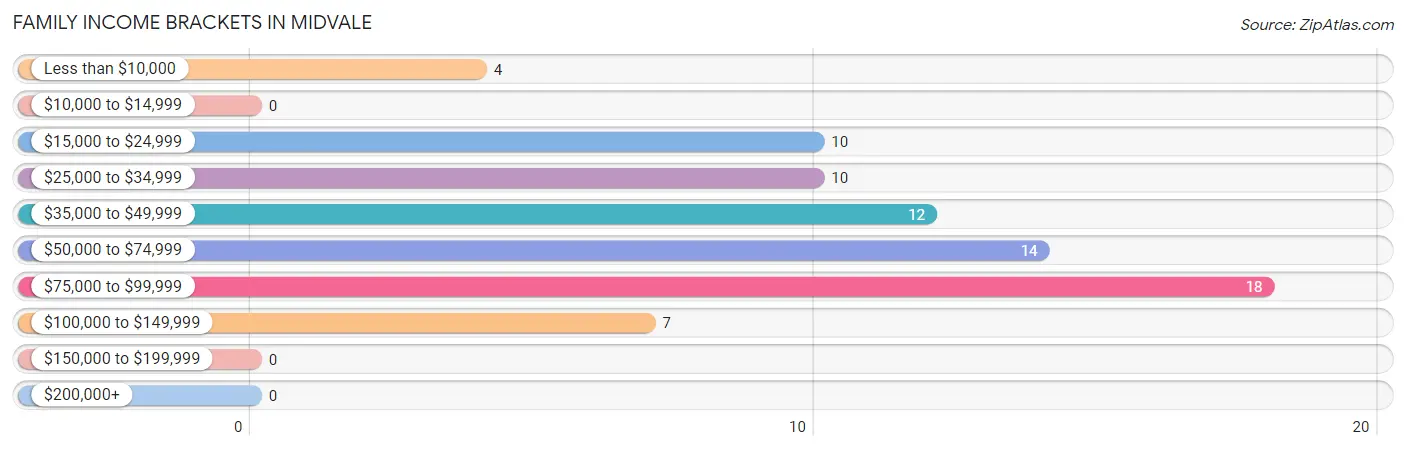
| Income Bracket | # Families | % Families |
| Less than $10,000 | 4 | 5.3% |
| $10,000 to $14,999 | 0 | 0.0% |
| $15,000 to $24,999 | 10 | 13.3% |
| $25,000 to $34,999 | 10 | 13.3% |
| $35,000 to $49,999 | 12 | 16.0% |
| $50,000 to $74,999 | 14 | 18.7% |
| $75,000 to $99,999 | 18 | 24.0% |
| $100,000 to $149,999 | 7 | 9.3% |
| $150,000 to $199,999 | 0 | 0.0% |
| $200,000+ | 0 | 0.0% |
Family Income by Famaliy Size in Midvale
4-person families (7 | 9.3%) account for the highest median family income in Midvale with $86,250 per family, while 2-person families (53 | 70.7%) have the highest median income of $22,812 per family member.
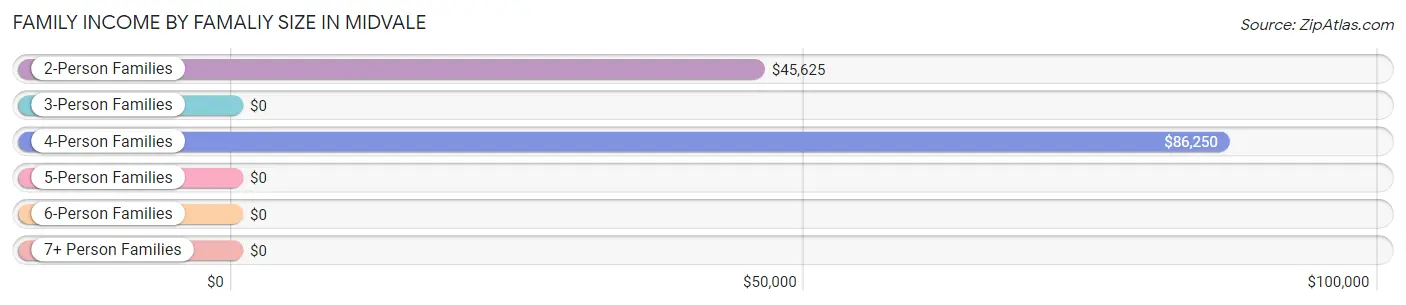
| Income Bracket | # Families | Median Income |
| 2-Person Families | 53 (70.7%) | $45,625 |
| 3-Person Families | 5 (6.7%) | $0 |
| 4-Person Families | 7 (9.3%) | $86,250 |
| 5-Person Families | 5 (6.7%) | $0 |
| 6-Person Families | 0 (0.0%) | $0 |
| 7+ Person Families | 5 (6.7%) | $0 |
| Total | 75 (100.0%) | $53,125 |
Family Income by Number of Earners in Midvale
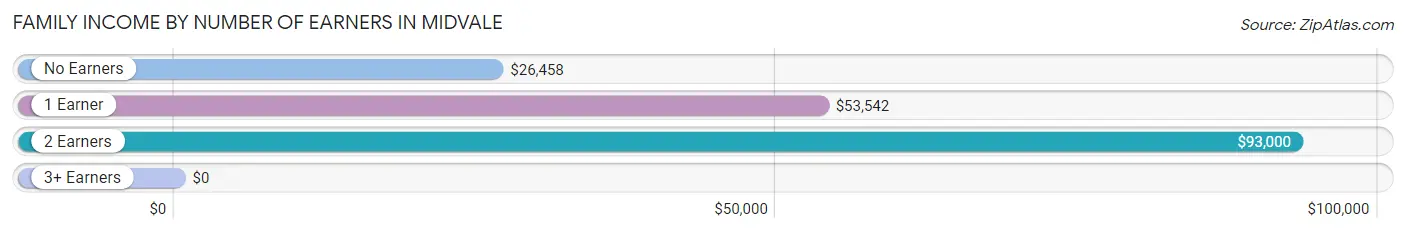
| Number of Earners | # Families | Median Income |
| No Earners | 23 (30.7%) | $26,458 |
| 1 Earner | 29 (38.7%) | $53,542 |
| 2 Earners | 22 (29.3%) | $93,000 |
| 3+ Earners | 1 (1.3%) | $0 |
| Total | 75 (100.0%) | $53,125 |
Household Income in Midvale
Household Income Brackets in Midvale
With 24 households falling in the category, the $75,000 to $99,999 income range is the most frequent in Midvale, accounting for 27.9% of all households.
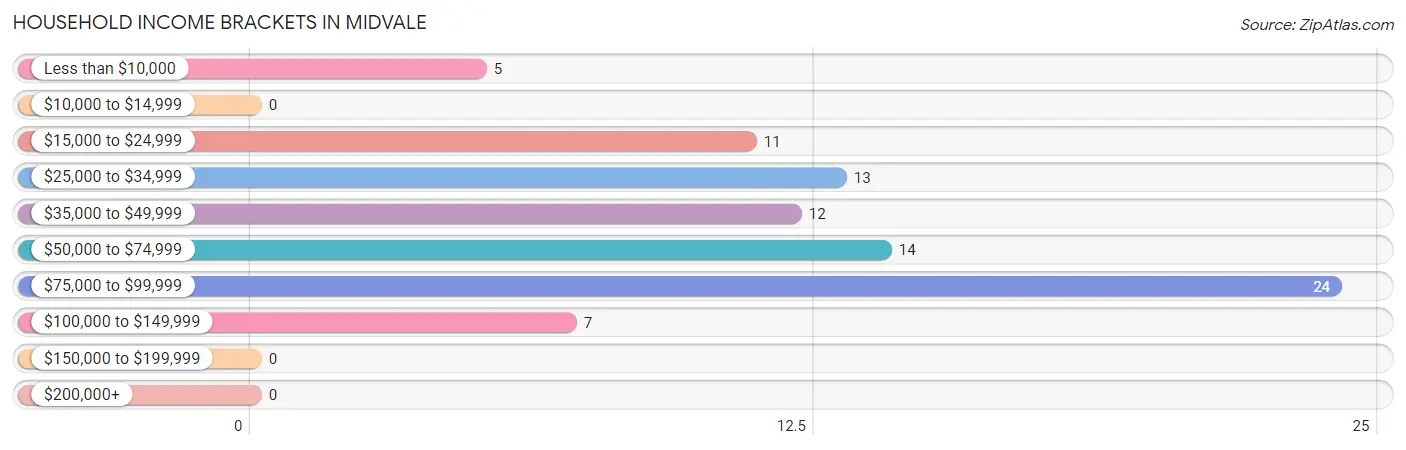
| Income Bracket | # Households | % Households |
| Less than $10,000 | 5 | 5.8% |
| $10,000 to $14,999 | 0 | 0.0% |
| $15,000 to $24,999 | 11 | 12.8% |
| $25,000 to $34,999 | 13 | 15.1% |
| $35,000 to $49,999 | 12 | 14.0% |
| $50,000 to $74,999 | 14 | 16.3% |
| $75,000 to $99,999 | 24 | 27.9% |
| $100,000 to $149,999 | 7 | 8.1% |
| $150,000 to $199,999 | 0 | 0.0% |
| $200,000+ | 0 | 0.0% |
Household Income by Householder Age in Midvale
The median household income in Midvale is $53,333, with the highest median household income of $81,875 found in the 45 to 64 years age bracket for the primary householder. A total of 21 households (24.4%) fall into this category. Meanwhile, the 15 to 24 years age bracket for the primary householder has the lowest median household income of $0, with 5 households (5.8%) in this group.
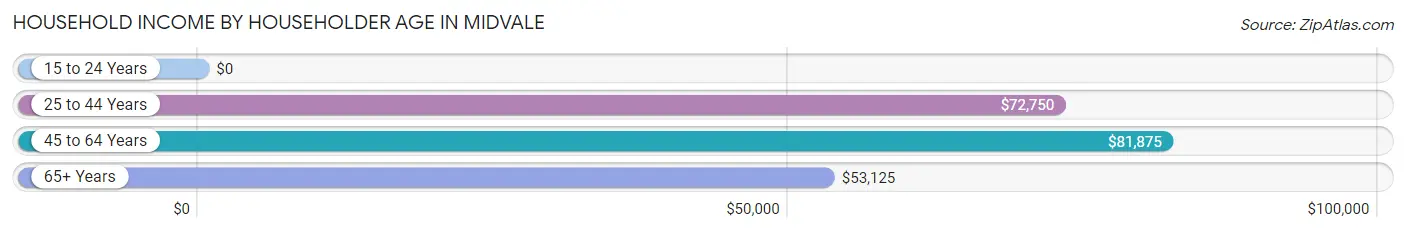
| Income Bracket | # Households | Median Income |
| 15 to 24 Years | 5 (5.8%) | $0 |
| 25 to 44 Years | 27 (31.4%) | $72,750 |
| 45 to 64 Years | 21 (24.4%) | $81,875 |
| 65+ Years | 33 (38.4%) | $53,125 |
| Total | 86 (100.0%) | $53,333 |
Poverty in Midvale
Income Below Poverty by Sex and Age in Midvale
With 40.7% poverty level for males and 26.1% for females among the residents of Midvale, 5 year old males and 6 to 11 year old females are the most vulnerable to poverty, with 5 males (100.0%) and 14 females (63.6%) in their respective age groups living below the poverty level.
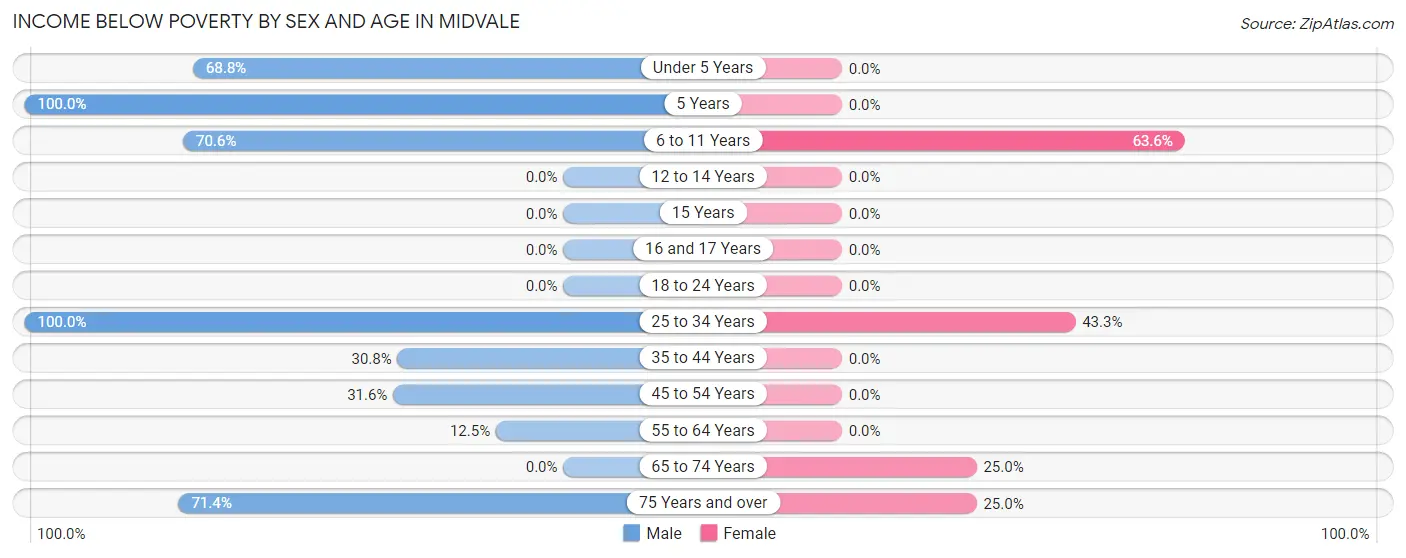
| Age Bracket | Male | Female |
| Under 5 Years | 11 (68.8%) | 0 (0.0%) |
| 5 Years | 5 (100.0%) | 0 (0.0%) |
| 6 to 11 Years | 12 (70.6%) | 14 (63.6%) |
| 12 to 14 Years | 0 (0.0%) | 0 (0.0%) |
| 15 Years | 0 (0.0%) | 0 (0.0%) |
| 16 and 17 Years | 0 (0.0%) | 0 (0.0%) |
| 18 to 24 Years | 0 (0.0%) | 0 (0.0%) |
| 25 to 34 Years | 5 (100.0%) | 13 (43.3%) |
| 35 to 44 Years | 4 (30.8%) | 0 (0.0%) |
| 45 to 54 Years | 6 (31.6%) | 0 (0.0%) |
| 55 to 64 Years | 2 (12.5%) | 0 (0.0%) |
| 65 to 74 Years | 0 (0.0%) | 8 (25.0%) |
| 75 Years and over | 10 (71.4%) | 1 (25.0%) |
| Total | 55 (40.7%) | 36 (26.1%) |
Income Above Poverty by Sex and Age in Midvale
According to the poverty statistics in Midvale, males aged 18 to 24 years and females aged under 5 years are the age groups that are most secure financially, with 100.0% of males and 100.0% of females in these age groups living above the poverty line.
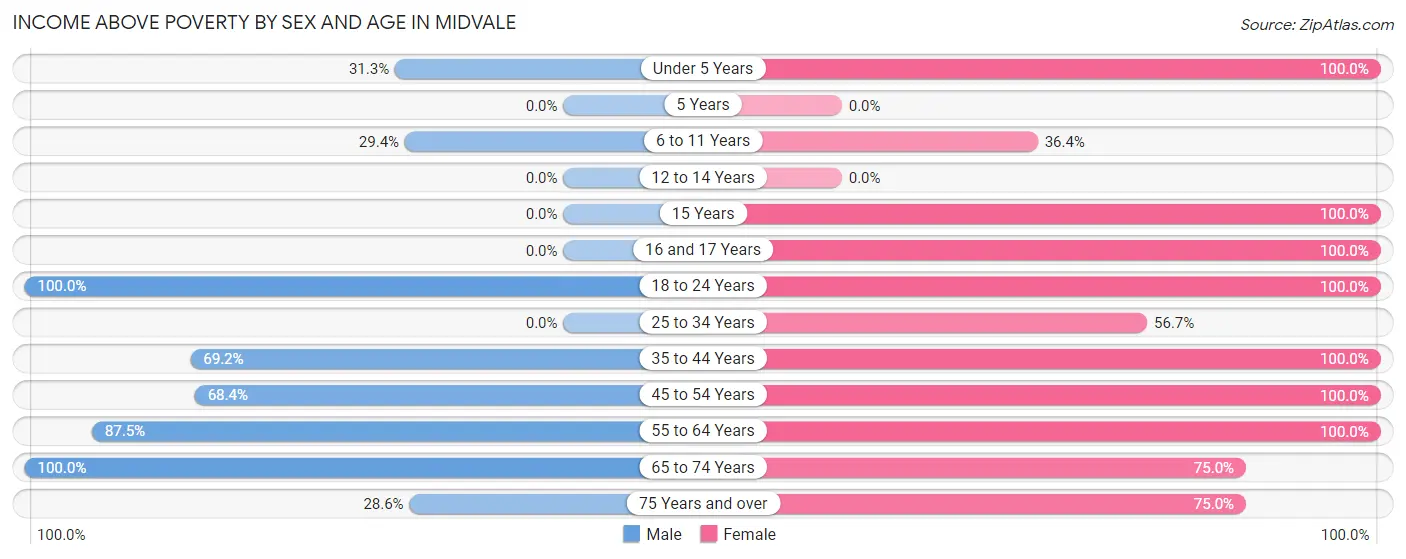
| Age Bracket | Male | Female |
| Under 5 Years | 5 (31.2%) | 3 (100.0%) |
| 5 Years | 0 (0.0%) | 0 (0.0%) |
| 6 to 11 Years | 5 (29.4%) | 8 (36.4%) |
| 12 to 14 Years | 0 (0.0%) | 0 (0.0%) |
| 15 Years | 0 (0.0%) | 3 (100.0%) |
| 16 and 17 Years | 0 (0.0%) | 2 (100.0%) |
| 18 to 24 Years | 9 (100.0%) | 5 (100.0%) |
| 25 to 34 Years | 0 (0.0%) | 17 (56.7%) |
| 35 to 44 Years | 9 (69.2%) | 9 (100.0%) |
| 45 to 54 Years | 13 (68.4%) | 14 (100.0%) |
| 55 to 64 Years | 14 (87.5%) | 14 (100.0%) |
| 65 to 74 Years | 21 (100.0%) | 24 (75.0%) |
| 75 Years and over | 4 (28.6%) | 3 (75.0%) |
| Total | 80 (59.3%) | 102 (73.9%) |
Income Below Poverty Among Married-Couple Families in Midvale
The poverty statistics for married-couple families in Midvale show that 19.4% or 13 of the total 67 families live below the poverty line. Families with 5 or more children have the highest poverty rate of 100.0%, comprising of 5 families. On the other hand, families with 1 or 2 children have the lowest poverty rate of 0.0%, which includes 0 families.
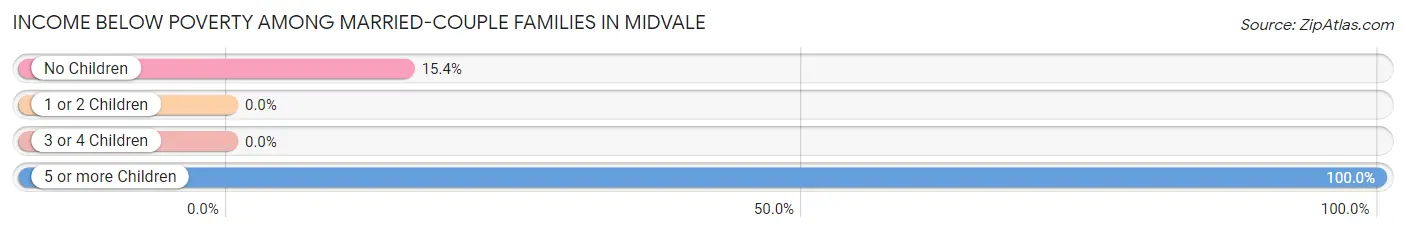
| Children | Above Poverty | Below Poverty |
| No Children | 44 (84.6%) | 8 (15.4%) |
| 1 or 2 Children | 10 (100.0%) | 0 (0.0%) |
| 3 or 4 Children | 0 (0.0%) | 0 (0.0%) |
| 5 or more Children | 0 (0.0%) | 5 (100.0%) |
| Total | 54 (80.6%) | 13 (19.4%) |
Income Below Poverty Among Single-Parent Households in Midvale
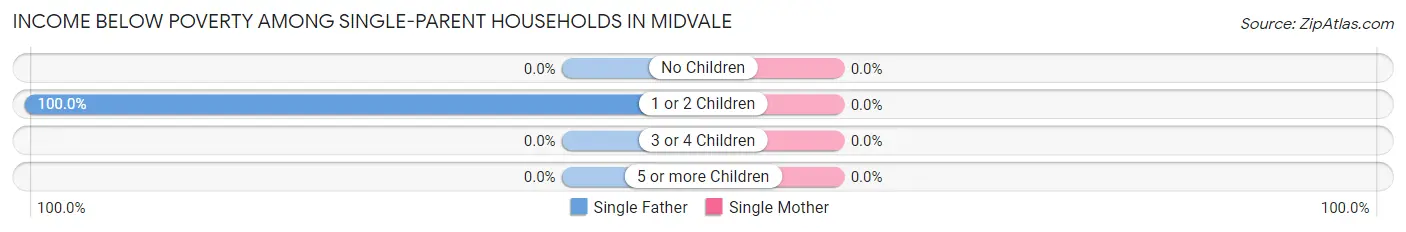
| Children | Single Father | Single Mother |
| No Children | 0 (0.0%) | 0 (0.0%) |
| 1 or 2 Children | 4 (100.0%) | 0 (0.0%) |
| 3 or 4 Children | 0 (0.0%) | 0 (0.0%) |
| 5 or more Children | 0 (0.0%) | 0 (0.0%) |
| Total | 4 (80.0%) | 0 (0.0%) |
Income Below Poverty Among Married-Couple vs Single-Parent Households in Midvale
The poverty data for Midvale shows that 13 of the married-couple family households (19.4%) and 4 of the single-parent households (50.0%) are living below the poverty level. Within the married-couple family households, those with 5 or more children have the highest poverty rate, with 5 households (100.0%) falling below the poverty line. Among the single-parent households, those with 1 or 2 children have the highest poverty rate, with 4 household (57.1%) living below poverty.
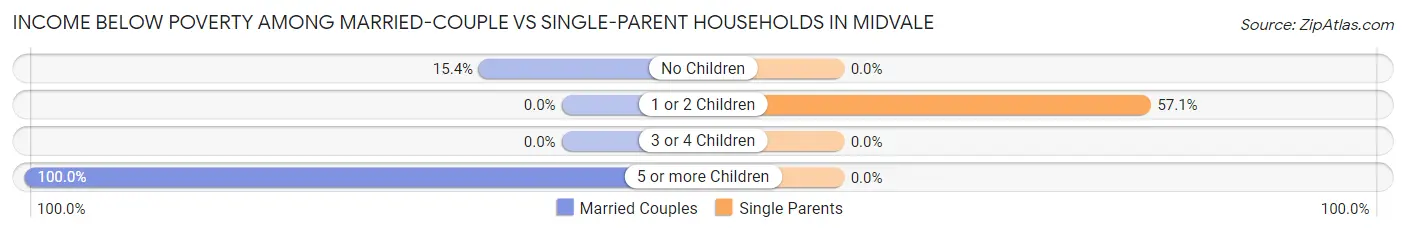
| Children | Married-Couple Families | Single-Parent Households |
| No Children | 8 (15.4%) | 0 (0.0%) |
| 1 or 2 Children | 0 (0.0%) | 4 (57.1%) |
| 3 or 4 Children | 0 (0.0%) | 0 (0.0%) |
| 5 or more Children | 5 (100.0%) | 0 (0.0%) |
| Total | 13 (19.4%) | 4 (50.0%) |
Race in Midvale
The most populous races in Midvale are White / Caucasian (261 | 95.6%), and Two or more Races (12 | 4.4%).
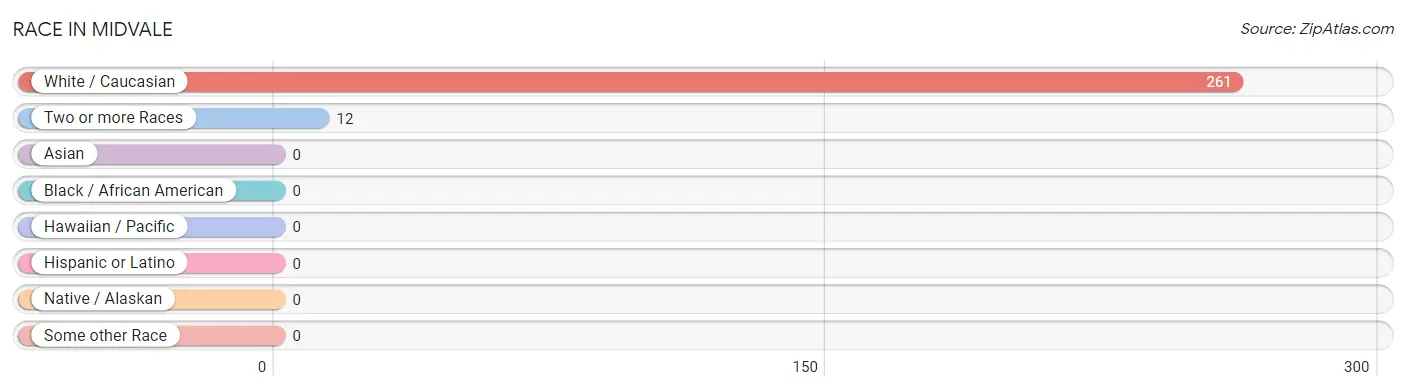
| Race | # Population | % Population |
| Asian | 0 | 0.0% |
| Black / African American | 0 | 0.0% |
| Hawaiian / Pacific | 0 | 0.0% |
| Hispanic or Latino | 0 | 0.0% |
| Native / Alaskan | 0 | 0.0% |
| White / Caucasian | 261 | 95.6% |
| Two or more Races | 12 | 4.4% |
| Some other Race | 0 | 0.0% |
| Total | 273 | 100.0% |
Ancestry in Midvale
The most populous ancestries reported in Midvale are Scottish (61 | 22.3%), English (51 | 18.7%), German (29 | 10.6%), Irish (25 | 9.2%), and Scotch-Irish (14 | 5.1%), together accounting for 65.9% of all Midvale residents.
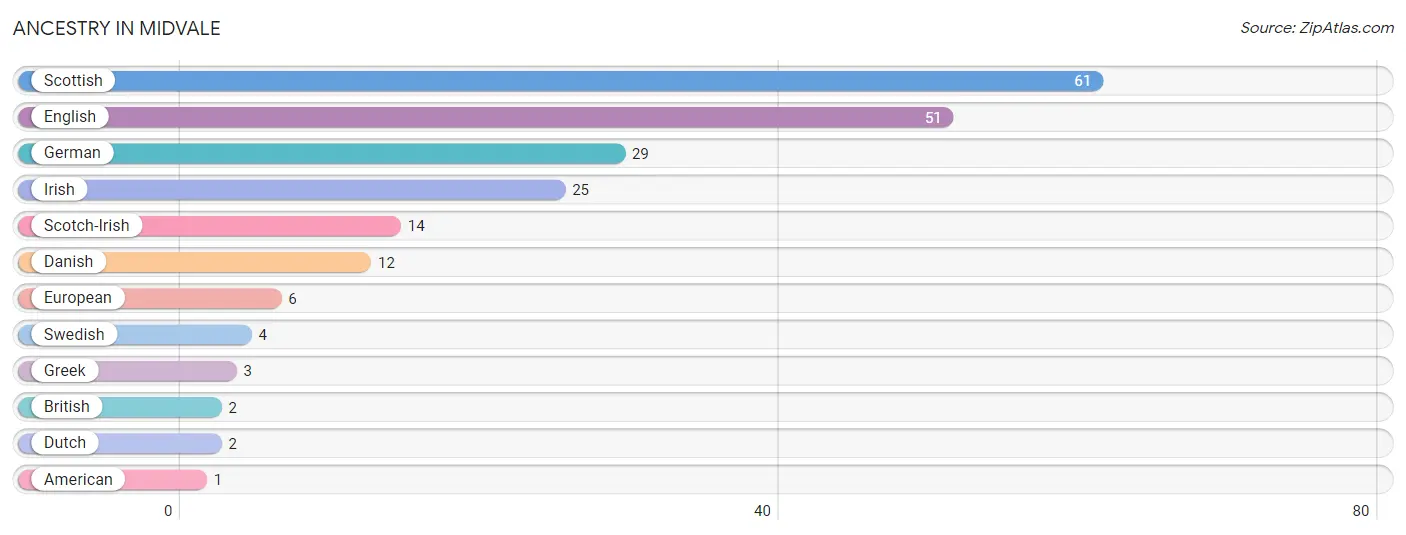
| Ancestry | # Population | % Population |
| American | 1 | 0.4% |
| British | 2 | 0.7% |
| Danish | 12 | 4.4% |
| Dutch | 2 | 0.7% |
| English | 51 | 18.7% |
| European | 6 | 2.2% |
| German | 29 | 10.6% |
| Greek | 3 | 1.1% |
| Irish | 25 | 9.2% |
| Scotch-Irish | 14 | 5.1% |
| Scottish | 61 | 22.3% |
| Swedish | 4 | 1.5% | View All 12 Rows |
Immigrants in Midvale
The most numerous immigrant groups reported in Midvale came from Denmark (3 | 1.1%), Europe (3 | 1.1%), and Northern Europe (3 | 1.1%), together accounting for 3.3% of all Midvale residents.
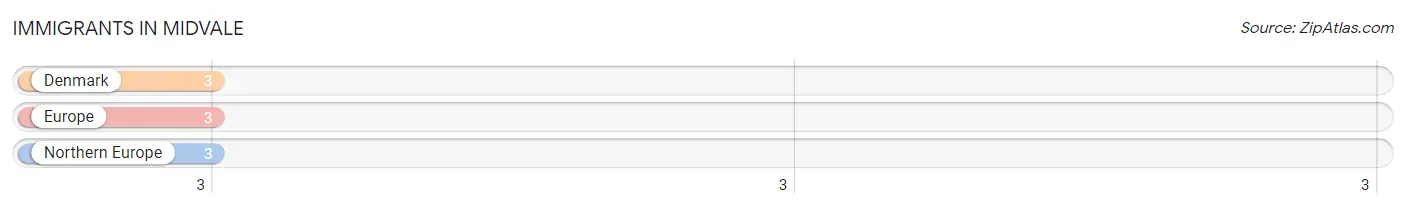
| Immigration Origin | # Population | % Population |
| Denmark | 3 | 1.1% |
| Europe | 3 | 1.1% |
| Northern Europe | 3 | 1.1% | View All 3 Rows |
Sex and Age in Midvale
Sex and Age in Midvale
The most populous age groups in Midvale are 65 to 69 Years (19 | 14.1%) for men and 25 to 29 Years (30 | 21.7%) for women.
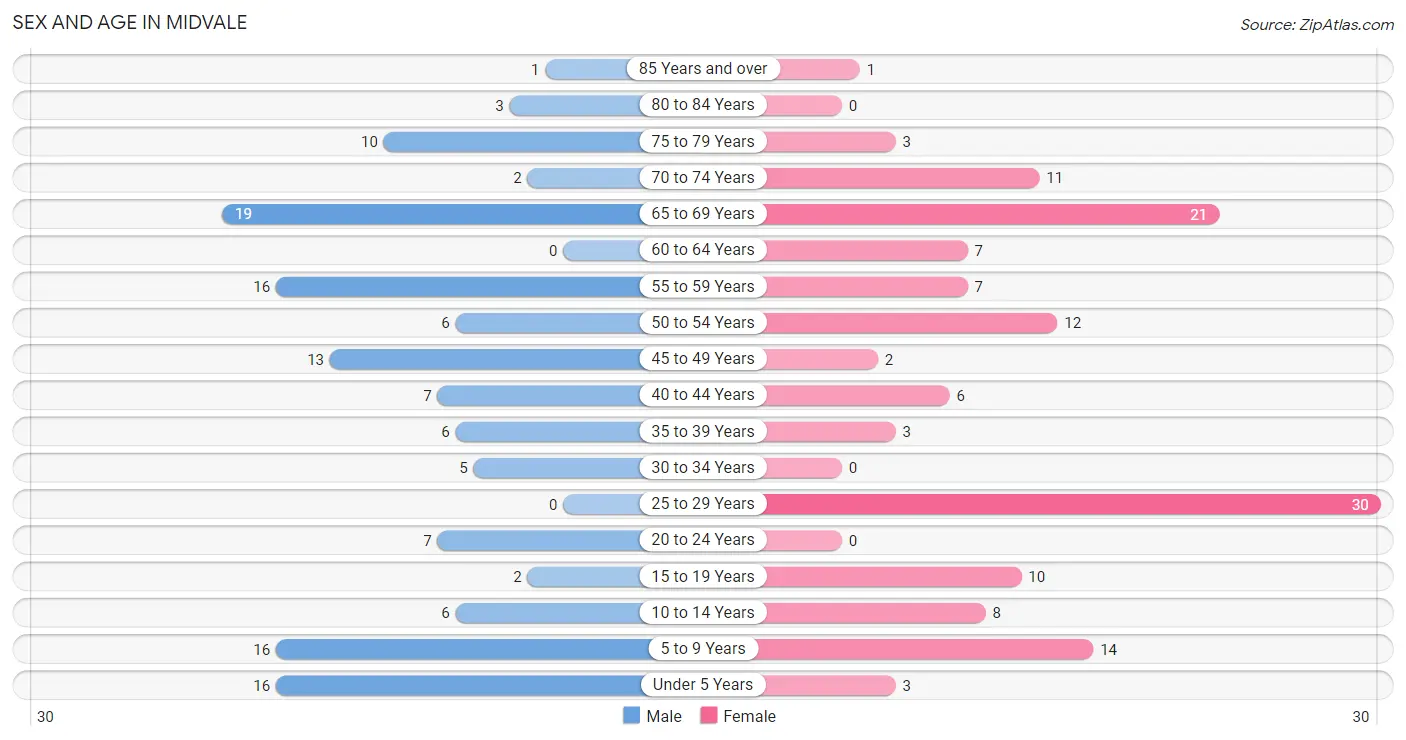
| Age Bracket | Male | Female |
| Under 5 Years | 16 (11.8%) | 3 (2.2%) |
| 5 to 9 Years | 16 (11.8%) | 14 (10.1%) |
| 10 to 14 Years | 6 (4.4%) | 8 (5.8%) |
| 15 to 19 Years | 2 (1.5%) | 10 (7.2%) |
| 20 to 24 Years | 7 (5.2%) | 0 (0.0%) |
| 25 to 29 Years | 0 (0.0%) | 30 (21.7%) |
| 30 to 34 Years | 5 (3.7%) | 0 (0.0%) |
| 35 to 39 Years | 6 (4.4%) | 3 (2.2%) |
| 40 to 44 Years | 7 (5.2%) | 6 (4.3%) |
| 45 to 49 Years | 13 (9.6%) | 2 (1.5%) |
| 50 to 54 Years | 6 (4.4%) | 12 (8.7%) |
| 55 to 59 Years | 16 (11.8%) | 7 (5.1%) |
| 60 to 64 Years | 0 (0.0%) | 7 (5.1%) |
| 65 to 69 Years | 19 (14.1%) | 21 (15.2%) |
| 70 to 74 Years | 2 (1.5%) | 11 (8.0%) |
| 75 to 79 Years | 10 (7.4%) | 3 (2.2%) |
| 80 to 84 Years | 3 (2.2%) | 0 (0.0%) |
| 85 Years and over | 1 (0.7%) | 1 (0.7%) |
| Total | 135 (100.0%) | 138 (100.0%) |
Families and Households in Midvale
Median Family Size in Midvale
The median family size in Midvale is 3.35 persons per family, with single female/mother families (3 | 4.0%) accounting for the largest median family size of 4 persons per family. On the other hand, single male/father families (5 | 6.7%) represent the smallest median family size with 2.40 persons per family.
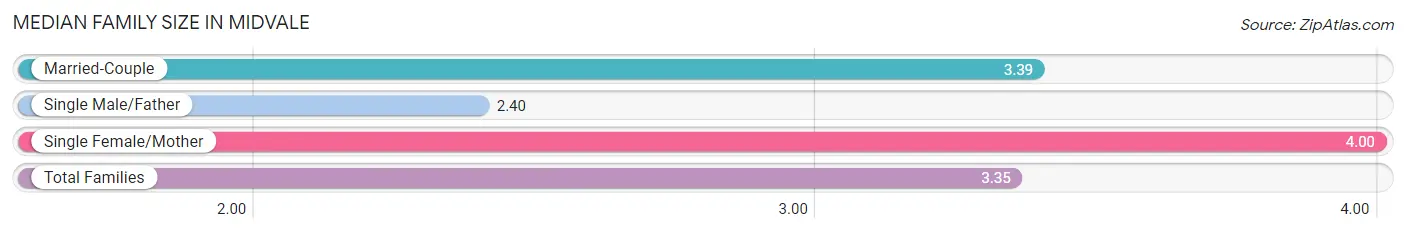
| Family Type | # Families | Family Size |
| Married-Couple | 67 (89.3%) | 3.39 |
| Single Male/Father | 5 (6.7%) | 2.40 |
| Single Female/Mother | 3 (4.0%) | 4.00 |
| Total Families | 75 (100.0%) | 3.35 |
Median Household Size in Midvale
The median household size in Midvale is 3.17 persons per household, with single female/mother households (3 | 3.5%) accounting for the largest median household size of 4 persons per household. non-family households (11 | 12.8%) represent the smallest median household size with 1.55 persons per household.
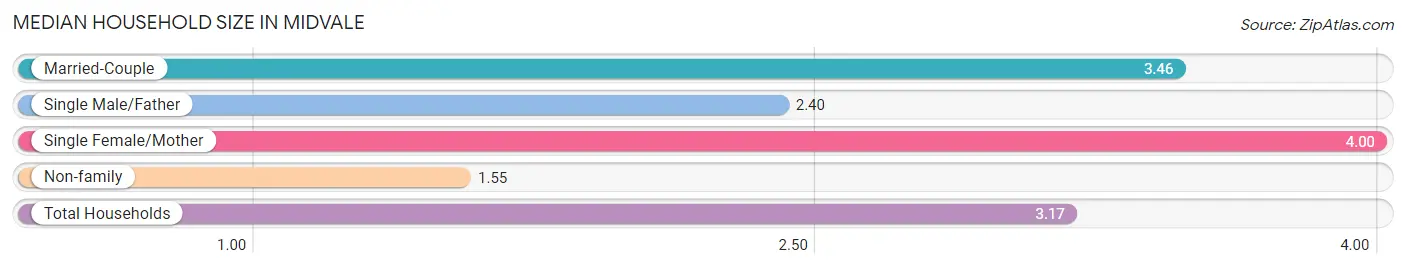
| Household Type | # Households | Household Size |
| Married-Couple | 67 (77.9%) | 3.46 |
| Single Male/Father | 5 (5.8%) | 2.40 |
| Single Female/Mother | 3 (3.5%) | 4.00 |
| Non-family | 11 (12.8%) | 1.55 |
| Total Households | 86 (100.0%) | 3.17 |
Household Size by Marriage Status in Midvale
Out of a total of 86 households in Midvale, 75 (87.2%) are family households, while 11 (12.8%) are nonfamily households. The most numerous type of family households are 2-person households, comprising 47, and the most common type of nonfamily households are 2-person households, comprising 6.
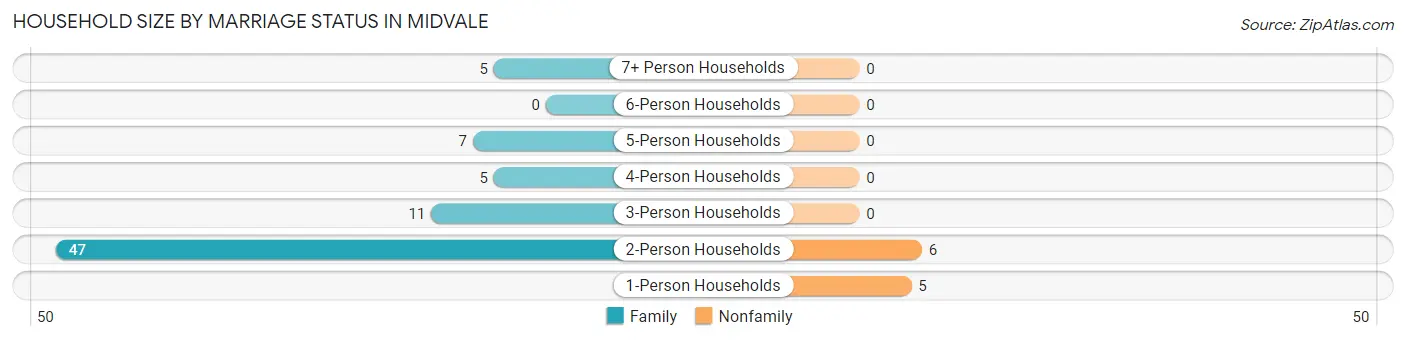
| Household Size | Family Households | Nonfamily Households |
| 1-Person Households | - | 5 (5.8%) |
| 2-Person Households | 47 (54.6%) | 6 (7.0%) |
| 3-Person Households | 11 (12.8%) | 0 (0.0%) |
| 4-Person Households | 5 (5.8%) | 0 (0.0%) |
| 5-Person Households | 7 (8.1%) | 0 (0.0%) |
| 6-Person Households | 0 (0.0%) | 0 (0.0%) |
| 7+ Person Households | 5 (5.8%) | 0 (0.0%) |
| Total | 75 (87.2%) | 11 (12.8%) |
Female Fertility in Midvale
Fertility by Age in Midvale
Average fertility rate in Midvale is 49.0 births per 1,000 women. Women in the age bracket of 20 to 34 years have the highest fertility rate with 100.0 births per 1,000 women. Women in the age bracket of 20 to 34 years acount for 100.0% of all women with births.
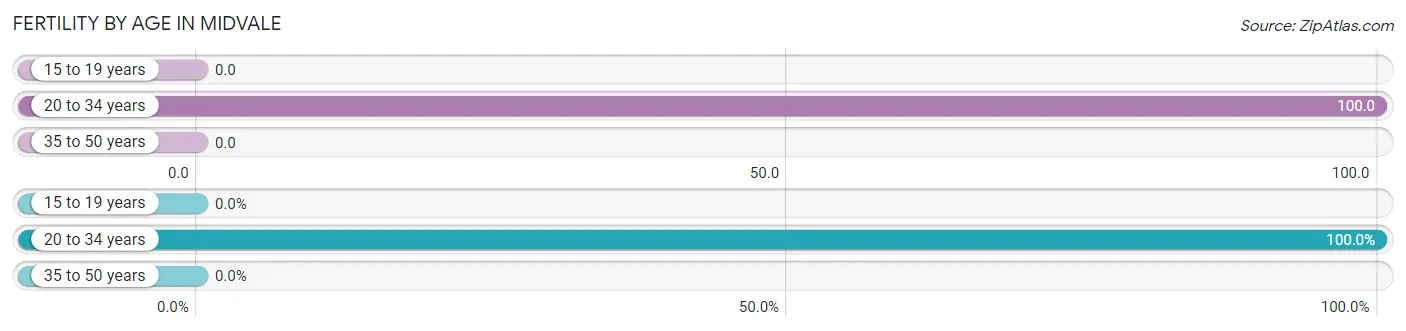
| Age Bracket | Women with Births | Births / 1,000 Women |
| 15 to 19 years | 0 (0.0%) | 0.0 |
| 20 to 34 years | 3 (100.0%) | 100.0 |
| 35 to 50 years | 0 (0.0%) | 0.0 |
| Total | 3 (100.0%) | 49.0 |
Fertility by Age by Marriage Status in Midvale
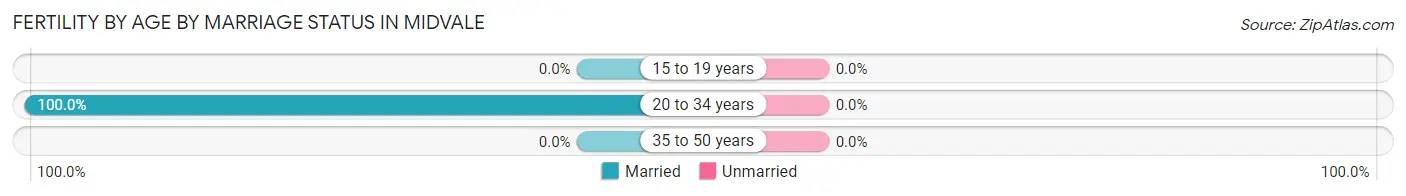
| Age Bracket | Married | Unmarried |
| 15 to 19 years | 0 (0.0%) | 0 (0.0%) |
| 20 to 34 years | 3 (100.0%) | 0 (0.0%) |
| 35 to 50 years | 0 (0.0%) | 0 (0.0%) |
| Total | 3 (100.0%) | 0 (0.0%) |
Fertility by Education in Midvale
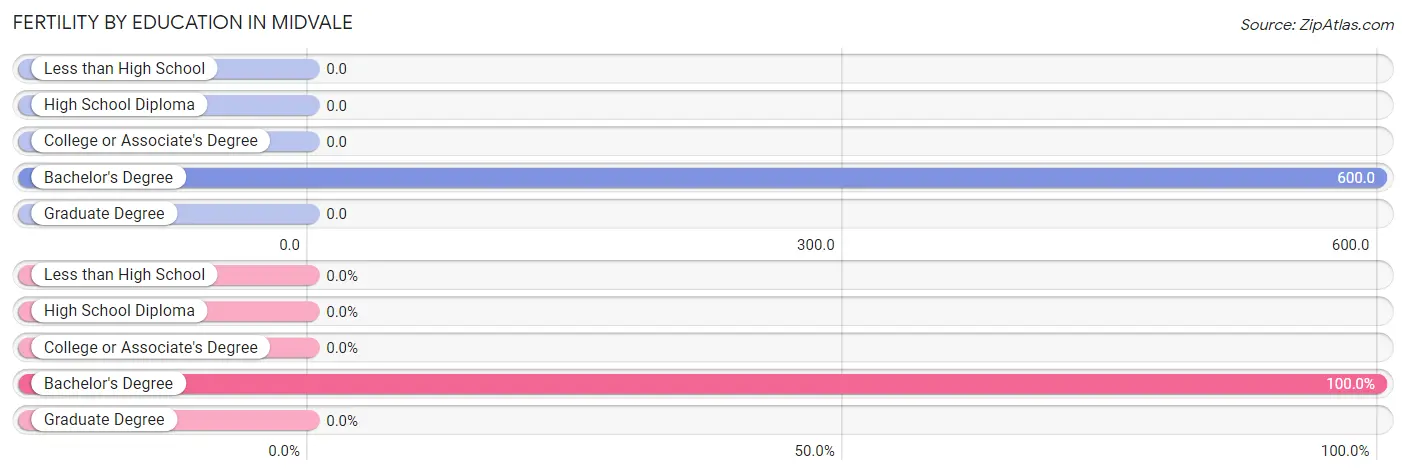
| Educational Attainment | Women with Births | Births / 1,000 Women |
| Less than High School | 0 (0.0%) | 0.0 |
| High School Diploma | 0 (0.0%) | 0.0 |
| College or Associate's Degree | 0 (0.0%) | 0.0 |
| Bachelor's Degree | 3 (100.0%) | 600.0 |
| Graduate Degree | 0 (0.0%) | 0.0 |
| Total | 3 (100.0%) | 49.0 |
Fertility by Education by Marriage Status in Midvale
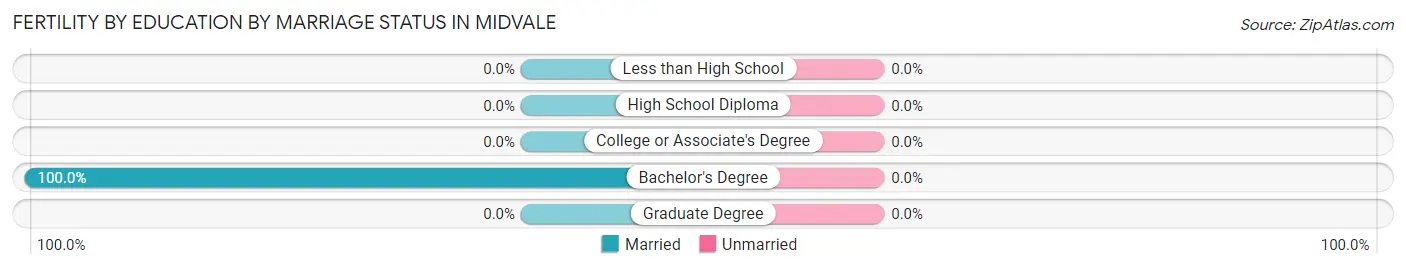
| Educational Attainment | Married | Unmarried |
| Less than High School | 0 (0.0%) | 0 (0.0%) |
| High School Diploma | 0 (0.0%) | 0 (0.0%) |
| College or Associate's Degree | 0 (0.0%) | 0 (0.0%) |
| Bachelor's Degree | 3 (100.0%) | 0 (0.0%) |
| Graduate Degree | 0 (0.0%) | 0 (0.0%) |
| Total | 3 (100.0%) | 0 (0.0%) |
Employment Characteristics in Midvale
Employment by Class of Employer in Midvale
Among the 80 employed individuals in Midvale, private company employees (49 | 61.3%), self-employed (not incorporated) (10 | 12.5%), and self-employed (incorporated) (7 | 8.7%) make up the most common classes of employment.
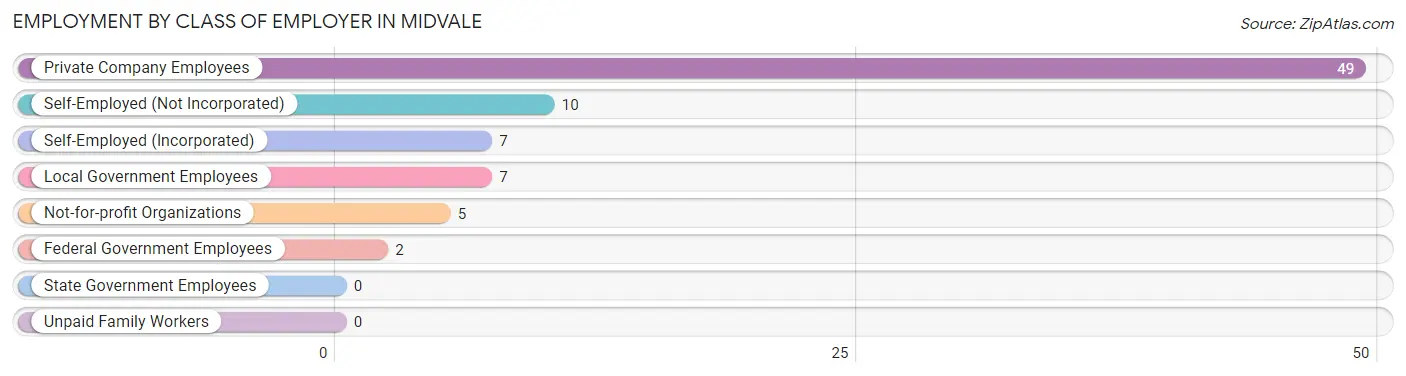
| Employer Class | # Employees | % Employees |
| Private Company Employees | 49 | 61.3% |
| Self-Employed (Incorporated) | 7 | 8.7% |
| Self-Employed (Not Incorporated) | 10 | 12.5% |
| Not-for-profit Organizations | 5 | 6.2% |
| Local Government Employees | 7 | 8.7% |
| State Government Employees | 0 | 0.0% |
| Federal Government Employees | 2 | 2.5% |
| Unpaid Family Workers | 0 | 0.0% |
| Total | 80 | 100.0% |
Employment Status by Age in Midvale
According to the labor force statistics for Midvale, out of the total population over 16 years of age (207), 41.5% or 86 individuals are in the labor force, with 5.8% or 5 of them unemployed. The age group with the highest labor force participation rate is 20 to 24 years, with 100.0% or 7 individuals in the labor force. Within the labor force, the 16 to 19 years age range has the highest percentage of unemployed individuals, with 100.0% or 5 of them being unemployed.
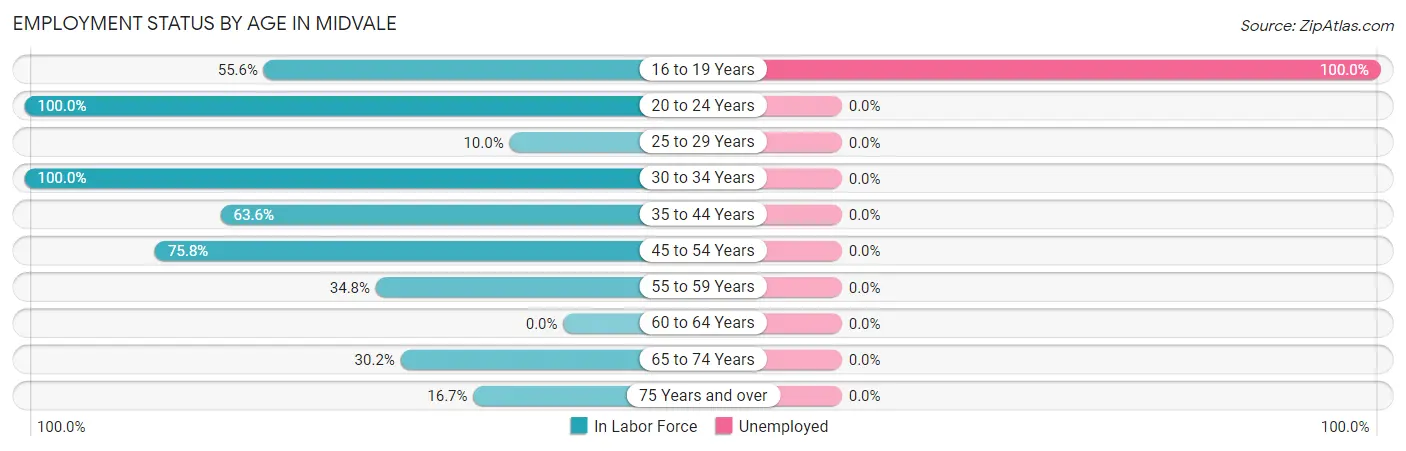
| Age Bracket | In Labor Force | Unemployed |
| 16 to 19 Years | 5 (55.6%) | 5 (100.0%) |
| 20 to 24 Years | 7 (100.0%) | 0 (0.0%) |
| 25 to 29 Years | 3 (10.0%) | 0 (0.0%) |
| 30 to 34 Years | 5 (100.0%) | 0 (0.0%) |
| 35 to 44 Years | 14 (63.6%) | 0 (0.0%) |
| 45 to 54 Years | 25 (75.8%) | 0 (0.0%) |
| 55 to 59 Years | 8 (34.8%) | 0 (0.0%) |
| 60 to 64 Years | 0 (0.0%) | 0 (0.0%) |
| 65 to 74 Years | 16 (30.2%) | 0 (0.0%) |
| 75 Years and over | 3 (16.7%) | 0 (0.0%) |
| Total | 86 (41.5%) | 5 (5.8%) |
Employment Status by Educational Attainment in Midvale
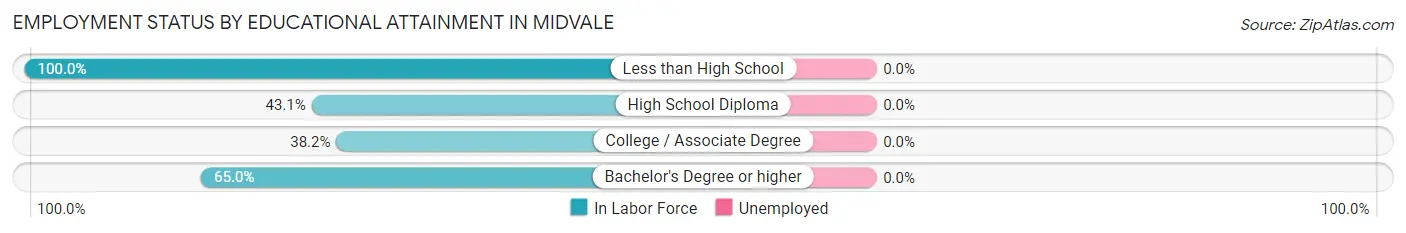
| Educational Attainment | In Labor Force | Unemployed |
| Less than High School | 1 (100.0%) | 0 (0.0%) |
| High School Diploma | 28 (43.1%) | 0 (0.0%) |
| College / Associate Degree | 13 (38.2%) | 0 (0.0%) |
| Bachelor's Degree or higher | 13 (65.0%) | 0 (0.0%) |
| Total | 55 (45.8%) | 0 (0.0%) |
Employment Occupations by Sex in Midvale
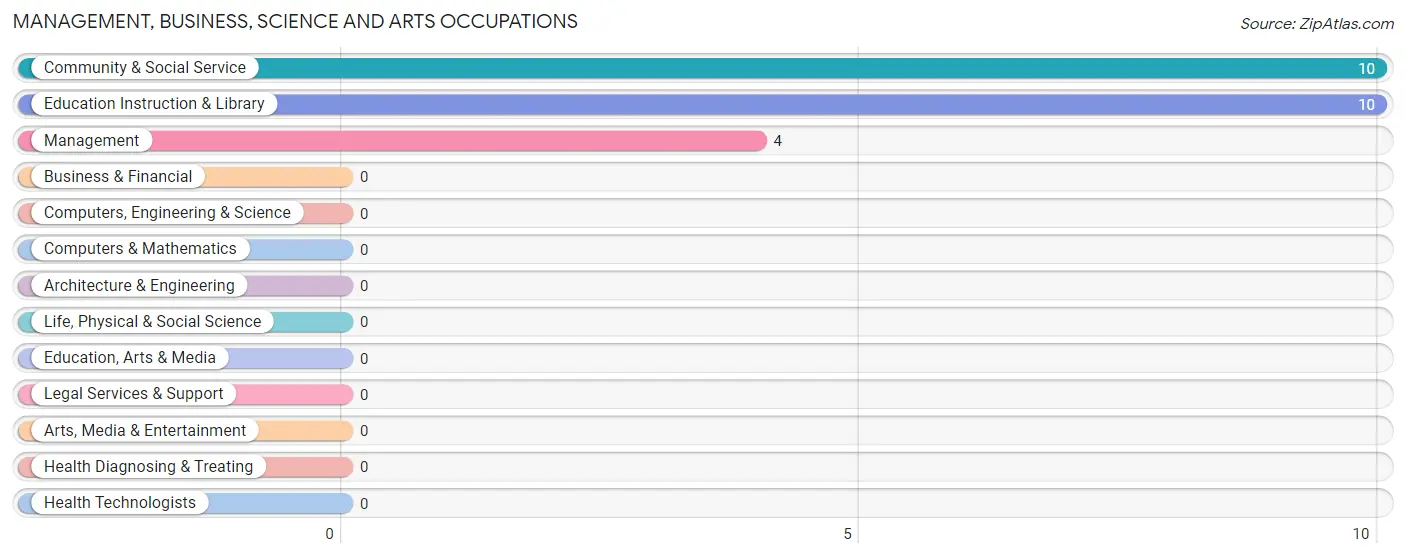
Management, Business, Science and Arts Occupations
The most common Management, Business, Science and Arts occupations in Midvale are Community & Social Service (10 | 12.3%), Education Instruction & Library (10 | 12.3%), and Management (4 | 4.9%).
Management, Business, Science and Arts Occupations by Sex
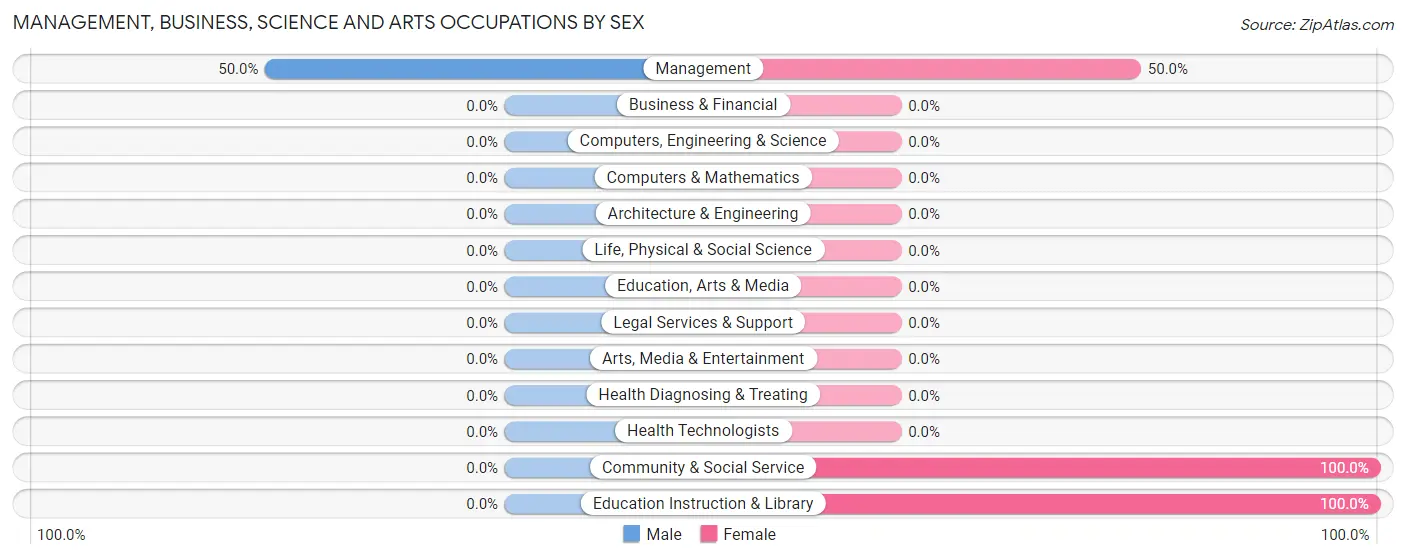
| Occupation | Male | Female |
| Management | 2 (50.0%) | 2 (50.0%) |
| Business & Financial | 0 (0.0%) | 0 (0.0%) |
| Computers, Engineering & Science | 0 (0.0%) | 0 (0.0%) |
| Computers & Mathematics | 0 (0.0%) | 0 (0.0%) |
| Architecture & Engineering | 0 (0.0%) | 0 (0.0%) |
| Life, Physical & Social Science | 0 (0.0%) | 0 (0.0%) |
| Community & Social Service | 0 (0.0%) | 10 (100.0%) |
| Education, Arts & Media | 0 (0.0%) | 0 (0.0%) |
| Legal Services & Support | 0 (0.0%) | 0 (0.0%) |
| Education Instruction & Library | 0 (0.0%) | 10 (100.0%) |
| Arts, Media & Entertainment | 0 (0.0%) | 0 (0.0%) |
| Health Diagnosing & Treating | 0 (0.0%) | 0 (0.0%) |
| Health Technologists | 0 (0.0%) | 0 (0.0%) |
| Total (Category) | 2 (14.3%) | 12 (85.7%) |
| Total (Overall) | 60 (74.1%) | 21 (25.9%) |
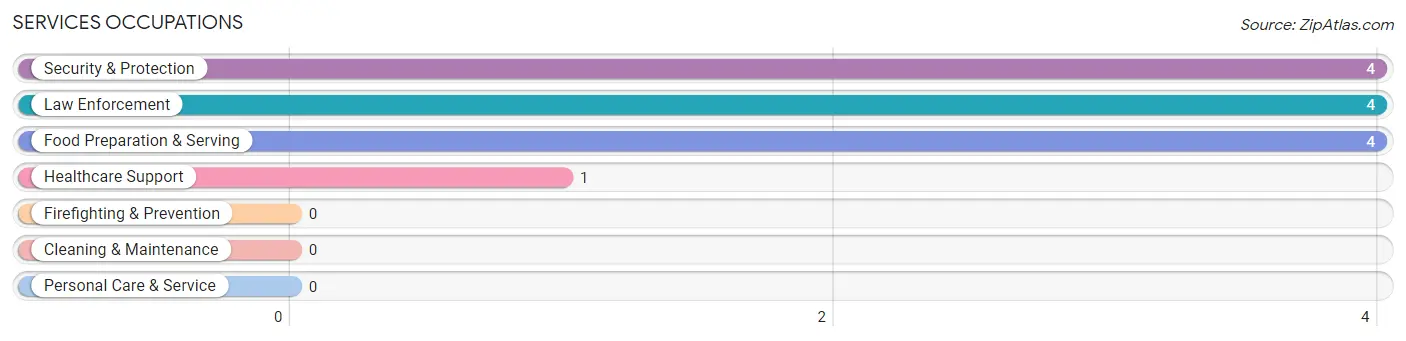
Services Occupations
The most common Services occupations in Midvale are Security & Protection (4 | 4.9%), Law Enforcement (4 | 4.9%), Food Preparation & Serving (4 | 4.9%), and Healthcare Support (1 | 1.2%).
Services Occupations by Sex
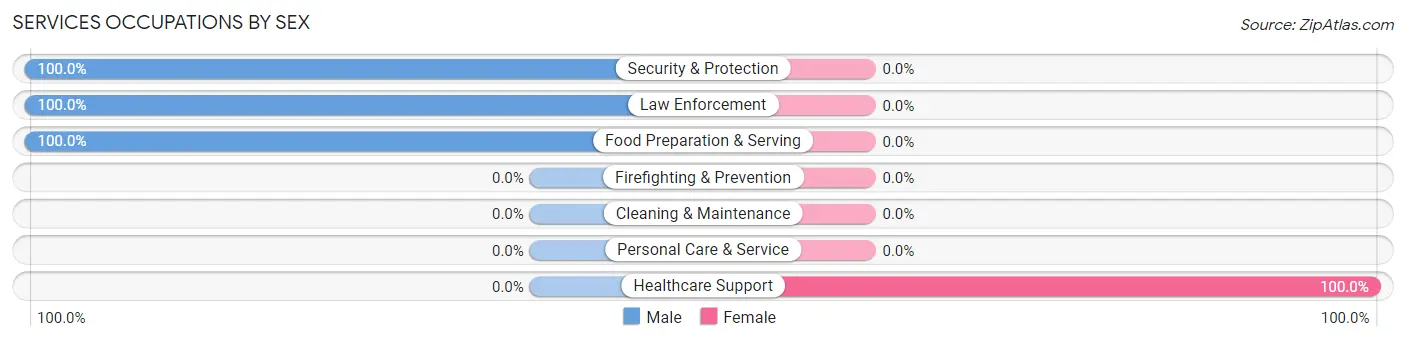
| Occupation | Male | Female |
| Healthcare Support | 0 (0.0%) | 1 (100.0%) |
| Security & Protection | 4 (100.0%) | 0 (0.0%) |
| Firefighting & Prevention | 0 (0.0%) | 0 (0.0%) |
| Law Enforcement | 4 (100.0%) | 0 (0.0%) |
| Food Preparation & Serving | 4 (100.0%) | 0 (0.0%) |
| Cleaning & Maintenance | 0 (0.0%) | 0 (0.0%) |
| Personal Care & Service | 0 (0.0%) | 0 (0.0%) |
| Total (Category) | 8 (88.9%) | 1 (11.1%) |
| Total (Overall) | 60 (74.1%) | 21 (25.9%) |
Sales and Office Occupations
The most common Sales and Office occupations in Midvale are Sales & Related (10 | 12.3%), and Office & Administration (6 | 7.4%).
Sales and Office Occupations by Sex

| Occupation | Male | Female |
| Sales & Related | 7 (70.0%) | 3 (30.0%) |
| Office & Administration | 6 (100.0%) | 0 (0.0%) |
| Total (Category) | 13 (81.2%) | 3 (18.8%) |
| Total (Overall) | 60 (74.1%) | 21 (25.9%) |
Natural Resources, Construction and Maintenance Occupations
The most common Natural Resources, Construction and Maintenance occupations in Midvale are Construction & Extraction (24 | 29.6%), and Installation, Maintenance & Repair (5 | 6.2%).
Natural Resources, Construction and Maintenance Occupations by Sex
| Occupation | Male | Female |
| Farming, Fishing & Forestry | 0 (0.0%) | 0 (0.0%) |
| Construction & Extraction | 24 (100.0%) | 0 (0.0%) |
| Installation, Maintenance & Repair | 5 (100.0%) | 0 (0.0%) |
| Total (Category) | 29 (100.0%) | 0 (0.0%) |
| Total (Overall) | 60 (74.1%) | 21 (25.9%) |
Production, Transportation and Moving Occupations
The most common Production, Transportation and Moving occupations in Midvale are Production (7 | 8.6%), and Transportation (6 | 7.4%).
Production, Transportation and Moving Occupations by Sex
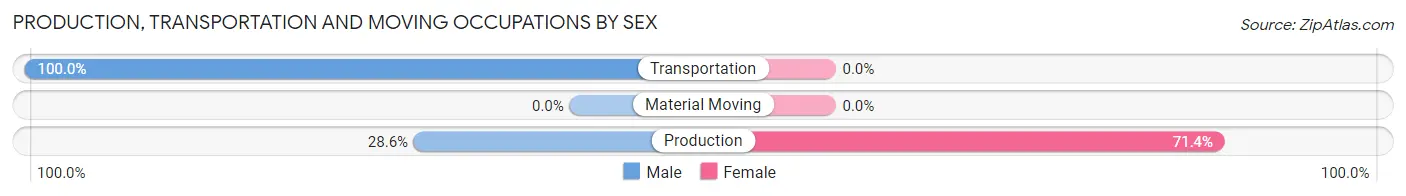
| Occupation | Male | Female |
| Production | 2 (28.6%) | 5 (71.4%) |
| Transportation | 6 (100.0%) | 0 (0.0%) |
| Material Moving | 0 (0.0%) | 0 (0.0%) |
| Total (Category) | 8 (61.5%) | 5 (38.5%) |
| Total (Overall) | 60 (74.1%) | 21 (25.9%) |
Employment Industries by Sex in Midvale
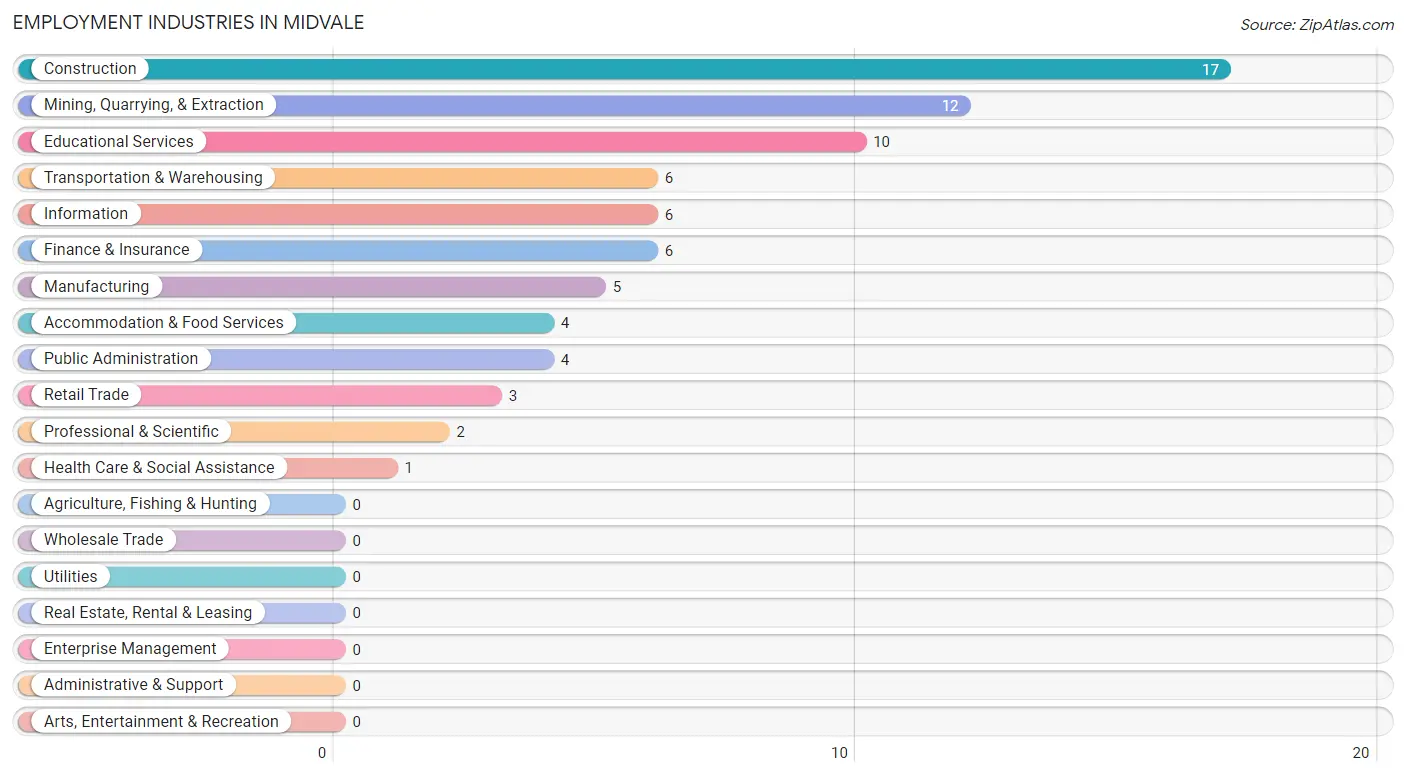
Employment Industries in Midvale
The major employment industries in Midvale include Construction (17 | 21.0%), Mining, Quarrying, & Extraction (12 | 14.8%), Educational Services (10 | 12.3%), Transportation & Warehousing (6 | 7.4%), and Information (6 | 7.4%).
Employment Industries by Sex in Midvale
The Midvale industries that see more men than women are Mining, Quarrying, & Extraction (100.0%), Construction (100.0%), and Transportation & Warehousing (100.0%), whereas the industries that tend to have a higher number of women are Manufacturing (100.0%), Retail Trade (100.0%), and Professional & Scientific (100.0%).
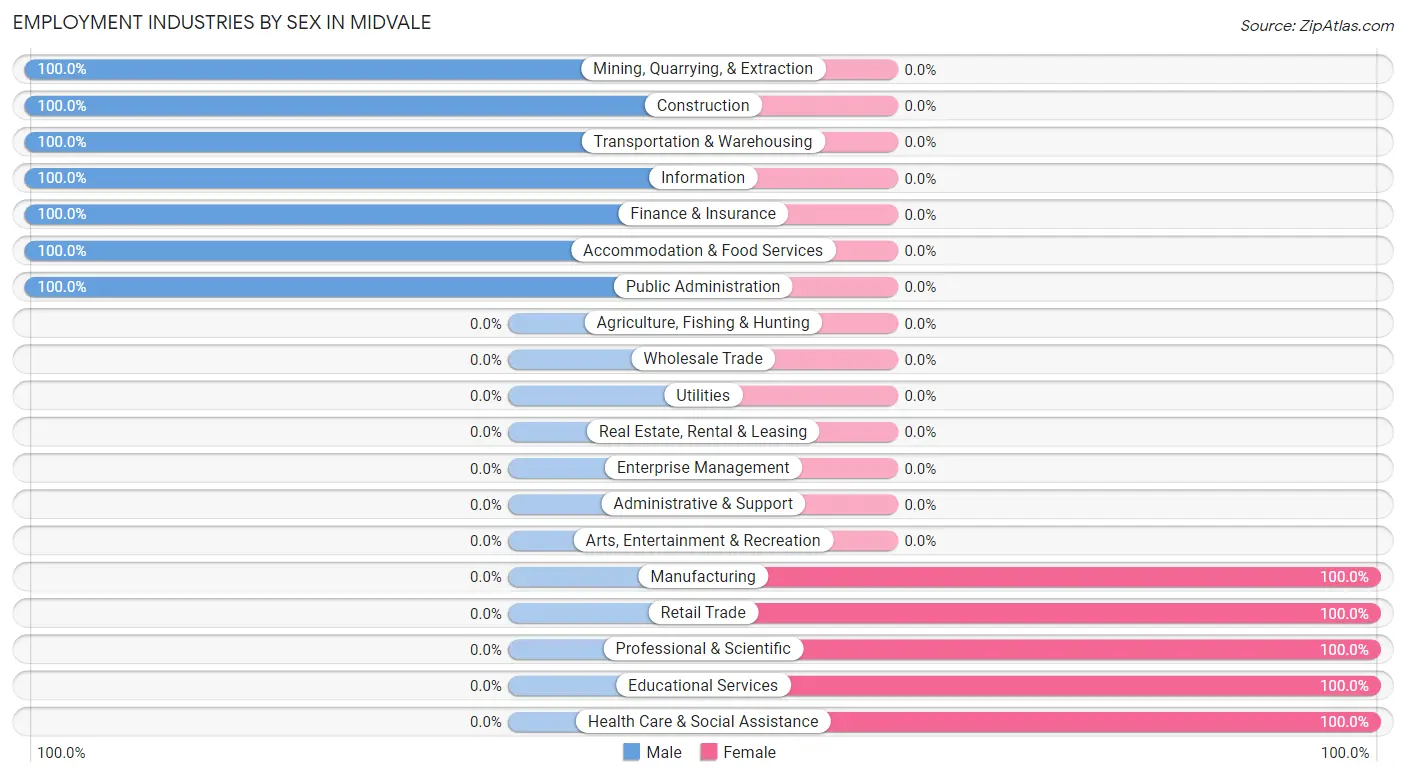
| Industry | Male | Female |
| Agriculture, Fishing & Hunting | 0 (0.0%) | 0 (0.0%) |
| Mining, Quarrying, & Extraction | 12 (100.0%) | 0 (0.0%) |
| Construction | 17 (100.0%) | 0 (0.0%) |
| Manufacturing | 0 (0.0%) | 5 (100.0%) |
| Wholesale Trade | 0 (0.0%) | 0 (0.0%) |
| Retail Trade | 0 (0.0%) | 3 (100.0%) |
| Transportation & Warehousing | 6 (100.0%) | 0 (0.0%) |
| Utilities | 0 (0.0%) | 0 (0.0%) |
| Information | 6 (100.0%) | 0 (0.0%) |
| Finance & Insurance | 6 (100.0%) | 0 (0.0%) |
| Real Estate, Rental & Leasing | 0 (0.0%) | 0 (0.0%) |
| Professional & Scientific | 0 (0.0%) | 2 (100.0%) |
| Enterprise Management | 0 (0.0%) | 0 (0.0%) |
| Administrative & Support | 0 (0.0%) | 0 (0.0%) |
| Educational Services | 0 (0.0%) | 10 (100.0%) |
| Health Care & Social Assistance | 0 (0.0%) | 1 (100.0%) |
| Arts, Entertainment & Recreation | 0 (0.0%) | 0 (0.0%) |
| Accommodation & Food Services | 4 (100.0%) | 0 (0.0%) |
| Public Administration | 4 (100.0%) | 0 (0.0%) |
| Total | 60 (74.1%) | 21 (25.9%) |
Education in Midvale
School Enrollment in Midvale
The most common levels of schooling among the 57 students in Midvale are elementary school (30 | 52.6%), middle school (14 | 24.6%), and high school (7 | 12.3%).
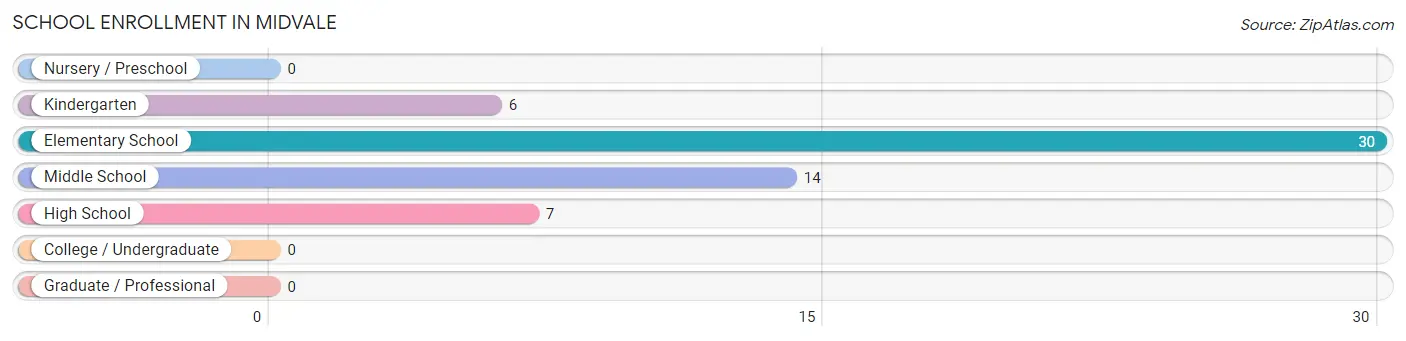
| School Level | # Students | % Students |
| Nursery / Preschool | 0 | 0.0% |
| Kindergarten | 6 | 10.5% |
| Elementary School | 30 | 52.6% |
| Middle School | 14 | 24.6% |
| High School | 7 | 12.3% |
| College / Undergraduate | 0 | 0.0% |
| Graduate / Professional | 0 | 0.0% |
| Total | 57 | 100.0% |
School Enrollment by Age by Funding Source in Midvale
Out of a total of 57 students who are enrolled in schools in Midvale, 32 (56.1%) attend a private institution, while the remaining 25 (43.9%) are enrolled in public schools. The age group of 3 to 4 year olds has the highest likelihood of being enrolled in private schools, with 6 (100.0% in the age bracket) enrolled. Conversely, the age group of 15 to 17 year olds has the lowest likelihood of being enrolled in a private school, with 5 (100.0% in the age bracket) attending a public institution.
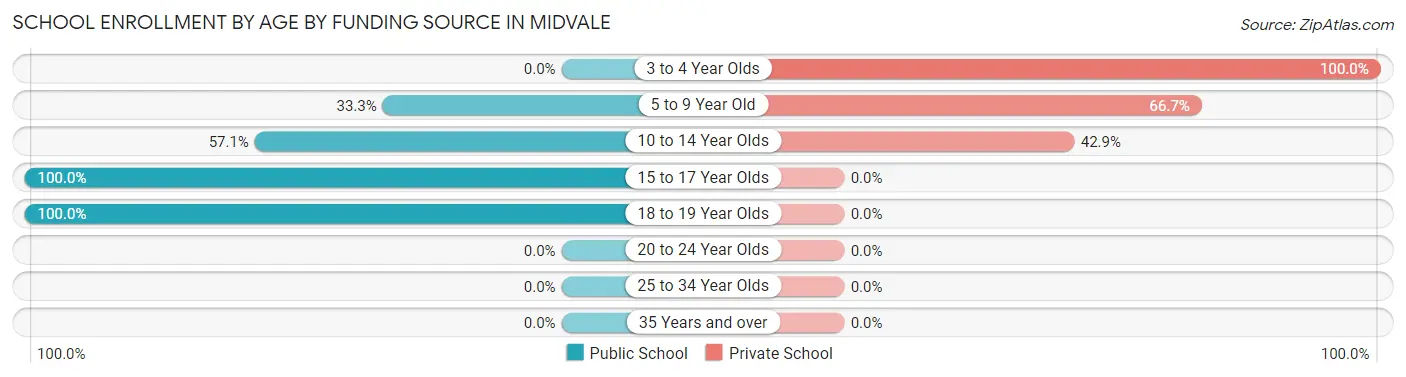
| Age Bracket | Public School | Private School |
| 3 to 4 Year Olds | 0 (0.0%) | 6 (100.0%) |
| 5 to 9 Year Old | 10 (33.3%) | 20 (66.7%) |
| 10 to 14 Year Olds | 8 (57.1%) | 6 (42.9%) |
| 15 to 17 Year Olds | 5 (100.0%) | 0 (0.0%) |
| 18 to 19 Year Olds | 2 (100.0%) | 0 (0.0%) |
| 20 to 24 Year Olds | 0 (0.0%) | 0 (0.0%) |
| 25 to 34 Year Olds | 0 (0.0%) | 0 (0.0%) |
| 35 Years and over | 0 (0.0%) | 0 (0.0%) |
| Total | 25 (43.9%) | 32 (56.1%) |
Educational Attainment by Field of Study in Midvale
Business (12 | 30.8%), communications (8 | 20.5%), education (7 | 17.9%), science & technology (6 | 15.4%), and bio, nature & agricultural (3 | 7.7%) are the most common fields of study among 39 individuals in Midvale who have obtained a bachelor's degree or higher.
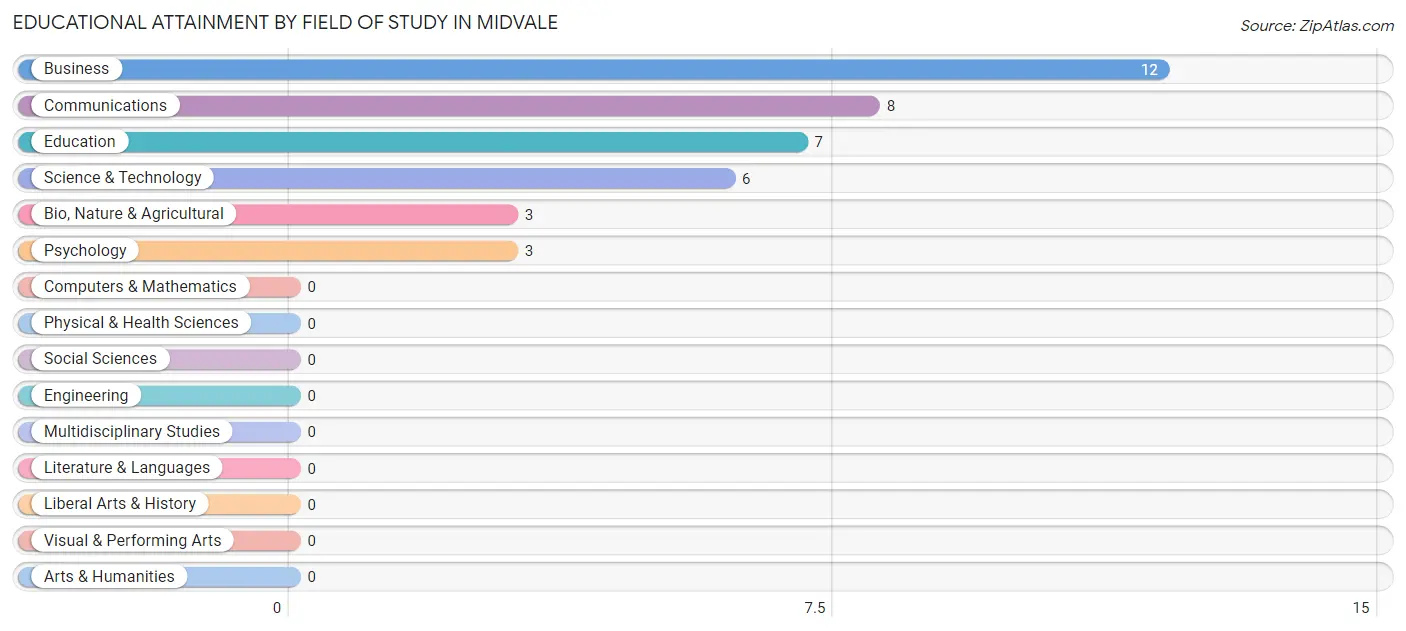
| Field of Study | # Graduates | % Graduates |
| Computers & Mathematics | 0 | 0.0% |
| Bio, Nature & Agricultural | 3 | 7.7% |
| Physical & Health Sciences | 0 | 0.0% |
| Psychology | 3 | 7.7% |
| Social Sciences | 0 | 0.0% |
| Engineering | 0 | 0.0% |
| Multidisciplinary Studies | 0 | 0.0% |
| Science & Technology | 6 | 15.4% |
| Business | 12 | 30.8% |
| Education | 7 | 17.9% |
| Literature & Languages | 0 | 0.0% |
| Liberal Arts & History | 0 | 0.0% |
| Visual & Performing Arts | 0 | 0.0% |
| Communications | 8 | 20.5% |
| Arts & Humanities | 0 | 0.0% |
| Total | 39 | 100.0% |
Transportation & Commute in Midvale
Vehicle Availability by Sex in Midvale
The most prevalent vehicle ownership categories in Midvale are males with 2 vehicles (19, accounting for 31.7%) and females with 2 vehicles (3, making up 95.0%).
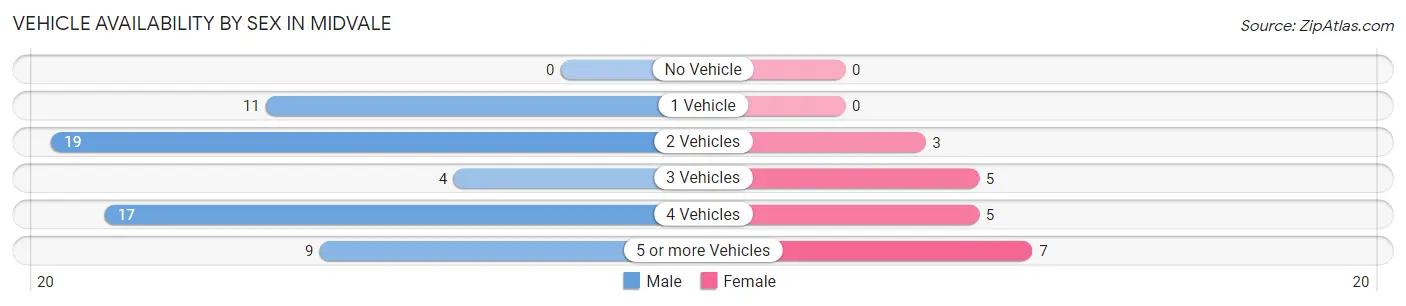
| Vehicles Available | Male | Female |
| No Vehicle | 0 (0.0%) | 0 (0.0%) |
| 1 Vehicle | 11 (18.3%) | 0 (0.0%) |
| 2 Vehicles | 19 (31.7%) | 3 (15.0%) |
| 3 Vehicles | 4 (6.7%) | 5 (25.0%) |
| 4 Vehicles | 17 (28.3%) | 5 (25.0%) |
| 5 or more Vehicles | 9 (15.0%) | 7 (35.0%) |
| Total | 60 (100.0%) | 20 (100.0%) |
Commute Time in Midvale
The most frequently occuring commute durations in Midvale are less than 5 minutes (17 commuters, 22.7%), 20 to 24 minutes (12 commuters, 16.0%), and 10 to 14 minutes (11 commuters, 14.7%).
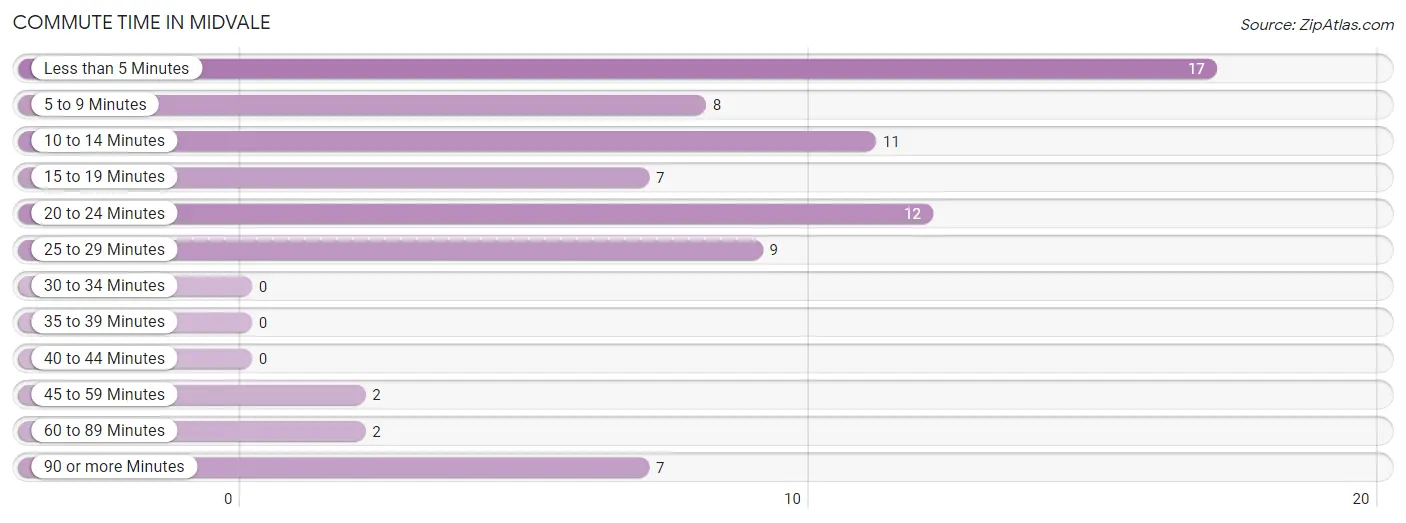
| Commute Time | # Commuters | % Commuters |
| Less than 5 Minutes | 17 | 22.7% |
| 5 to 9 Minutes | 8 | 10.7% |
| 10 to 14 Minutes | 11 | 14.7% |
| 15 to 19 Minutes | 7 | 9.3% |
| 20 to 24 Minutes | 12 | 16.0% |
| 25 to 29 Minutes | 9 | 12.0% |
| 30 to 34 Minutes | 0 | 0.0% |
| 35 to 39 Minutes | 0 | 0.0% |
| 40 to 44 Minutes | 0 | 0.0% |
| 45 to 59 Minutes | 2 | 2.7% |
| 60 to 89 Minutes | 2 | 2.7% |
| 90 or more Minutes | 7 | 9.3% |
Commute Time by Sex in Midvale
The most common commute times in Midvale are 20 to 24 minutes (12 commuters, 20.0%) for males and less than 5 minutes (6 commuters, 40.0%) for females.
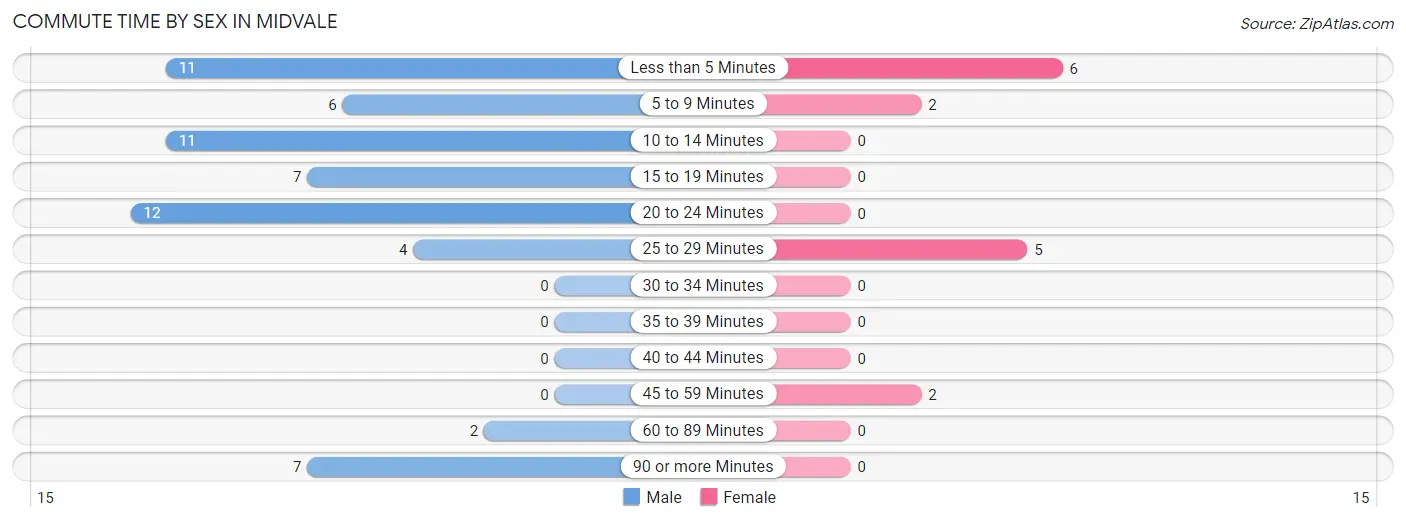
| Commute Time | Male | Female |
| Less than 5 Minutes | 11 (18.3%) | 6 (40.0%) |
| 5 to 9 Minutes | 6 (10.0%) | 2 (13.3%) |
| 10 to 14 Minutes | 11 (18.3%) | 0 (0.0%) |
| 15 to 19 Minutes | 7 (11.7%) | 0 (0.0%) |
| 20 to 24 Minutes | 12 (20.0%) | 0 (0.0%) |
| 25 to 29 Minutes | 4 (6.7%) | 5 (33.3%) |
| 30 to 34 Minutes | 0 (0.0%) | 0 (0.0%) |
| 35 to 39 Minutes | 0 (0.0%) | 0 (0.0%) |
| 40 to 44 Minutes | 0 (0.0%) | 0 (0.0%) |
| 45 to 59 Minutes | 0 (0.0%) | 2 (13.3%) |
| 60 to 89 Minutes | 2 (3.3%) | 0 (0.0%) |
| 90 or more Minutes | 7 (11.7%) | 0 (0.0%) |
Time of Departure to Work by Sex in Midvale
The most frequent times of departure to work in Midvale are 8:00 AM to 8:29 AM (22, 36.7%) for males and 7:30 AM to 7:59 AM (8, 53.3%) for females.
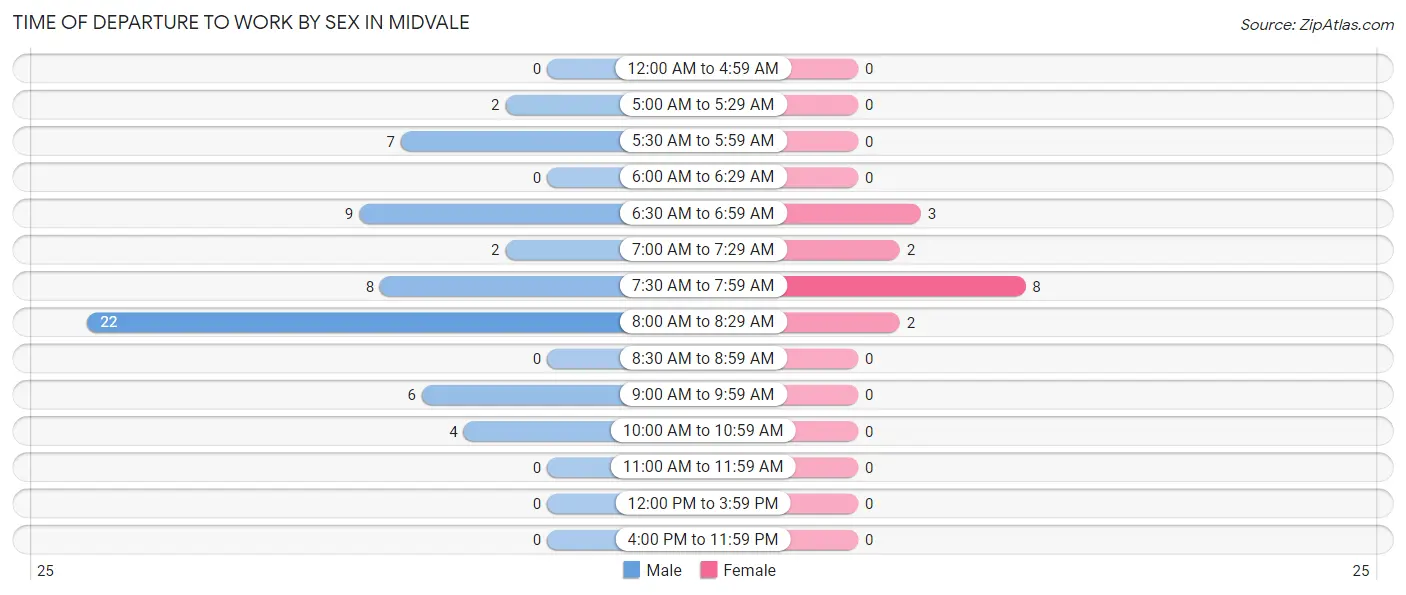
| Time of Departure | Male | Female |
| 12:00 AM to 4:59 AM | 0 (0.0%) | 0 (0.0%) |
| 5:00 AM to 5:29 AM | 2 (3.3%) | 0 (0.0%) |
| 5:30 AM to 5:59 AM | 7 (11.7%) | 0 (0.0%) |
| 6:00 AM to 6:29 AM | 0 (0.0%) | 0 (0.0%) |
| 6:30 AM to 6:59 AM | 9 (15.0%) | 3 (20.0%) |
| 7:00 AM to 7:29 AM | 2 (3.3%) | 2 (13.3%) |
| 7:30 AM to 7:59 AM | 8 (13.3%) | 8 (53.3%) |
| 8:00 AM to 8:29 AM | 22 (36.7%) | 2 (13.3%) |
| 8:30 AM to 8:59 AM | 0 (0.0%) | 0 (0.0%) |
| 9:00 AM to 9:59 AM | 6 (10.0%) | 0 (0.0%) |
| 10:00 AM to 10:59 AM | 4 (6.7%) | 0 (0.0%) |
| 11:00 AM to 11:59 AM | 0 (0.0%) | 0 (0.0%) |
| 12:00 PM to 3:59 PM | 0 (0.0%) | 0 (0.0%) |
| 4:00 PM to 11:59 PM | 0 (0.0%) | 0 (0.0%) |
| Total | 60 (100.0%) | 15 (100.0%) |
Housing Occupancy in Midvale
Occupancy by Ownership in Midvale
Of the total 86 dwellings in Midvale, owner-occupied units account for 69 (80.2%), while renter-occupied units make up 17 (19.8%).
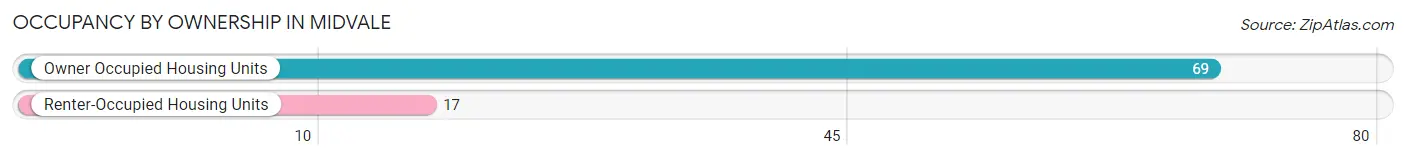
| Occupancy | # Housing Units | % Housing Units |
| Owner Occupied Housing Units | 69 | 80.2% |
| Renter-Occupied Housing Units | 17 | 19.8% |
| Total Occupied Housing Units | 86 | 100.0% |
Occupancy by Household Size in Midvale
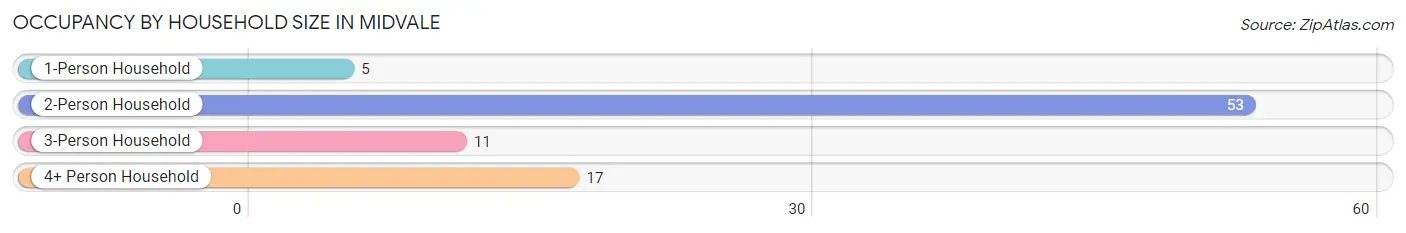
| Household Size | # Housing Units | % Housing Units |
| 1-Person Household | 5 | 5.8% |
| 2-Person Household | 53 | 61.6% |
| 3-Person Household | 11 | 12.8% |
| 4+ Person Household | 17 | 19.8% |
| Total Housing Units | 86 | 100.0% |
Occupancy by Ownership by Household Size in Midvale
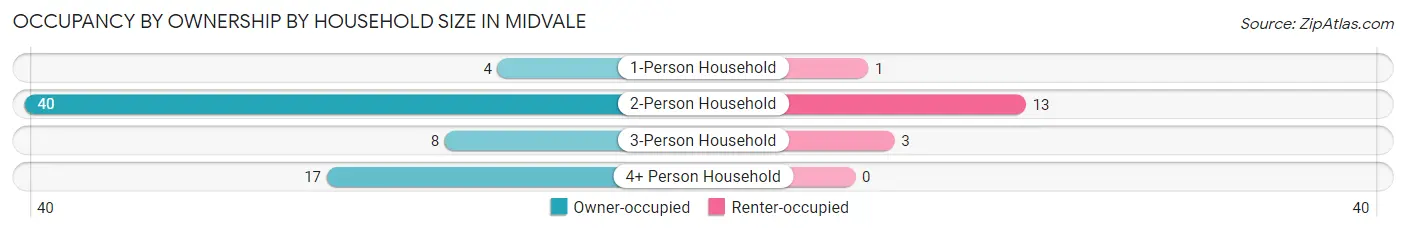
| Household Size | Owner-occupied | Renter-occupied |
| 1-Person Household | 4 (80.0%) | 1 (20.0%) |
| 2-Person Household | 40 (75.5%) | 13 (24.5%) |
| 3-Person Household | 8 (72.7%) | 3 (27.3%) |
| 4+ Person Household | 17 (100.0%) | 0 (0.0%) |
| Total Housing Units | 69 (80.2%) | 17 (19.8%) |
Occupancy by Educational Attainment in Midvale
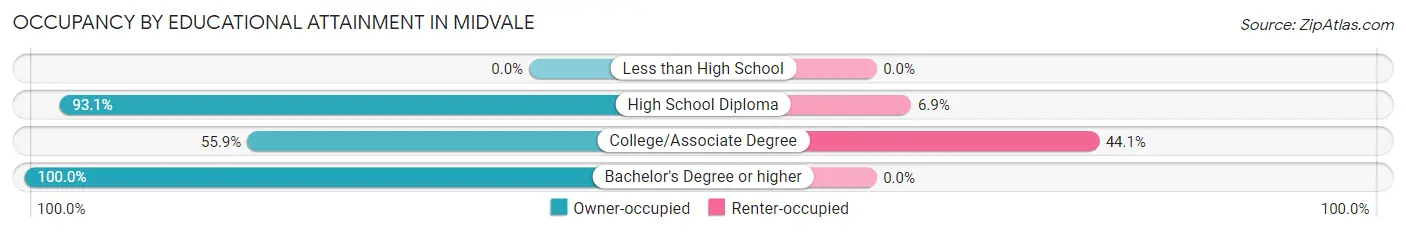
| Household Size | Owner-occupied | Renter-occupied |
| Less than High School | 0 (0.0%) | 0 (0.0%) |
| High School Diploma | 27 (93.1%) | 2 (6.9%) |
| College/Associate Degree | 19 (55.9%) | 15 (44.1%) |
| Bachelor's Degree or higher | 23 (100.0%) | 0 (0.0%) |
Occupancy by Age of Householder in Midvale
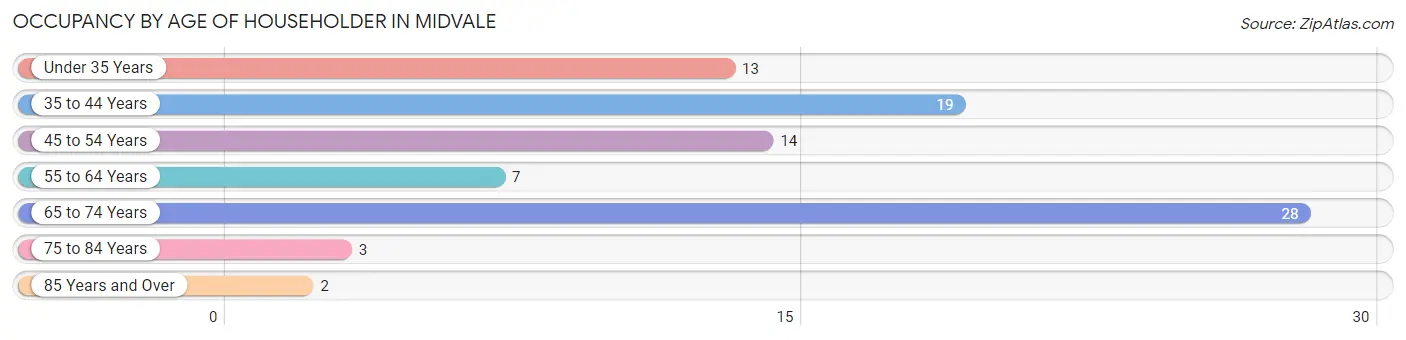
| Age Bracket | # Households | % Households |
| Under 35 Years | 13 | 15.1% |
| 35 to 44 Years | 19 | 22.1% |
| 45 to 54 Years | 14 | 16.3% |
| 55 to 64 Years | 7 | 8.1% |
| 65 to 74 Years | 28 | 32.6% |
| 75 to 84 Years | 3 | 3.5% |
| 85 Years and Over | 2 | 2.3% |
| Total | 86 | 100.0% |
Housing Finances in Midvale
Median Income by Occupancy in Midvale
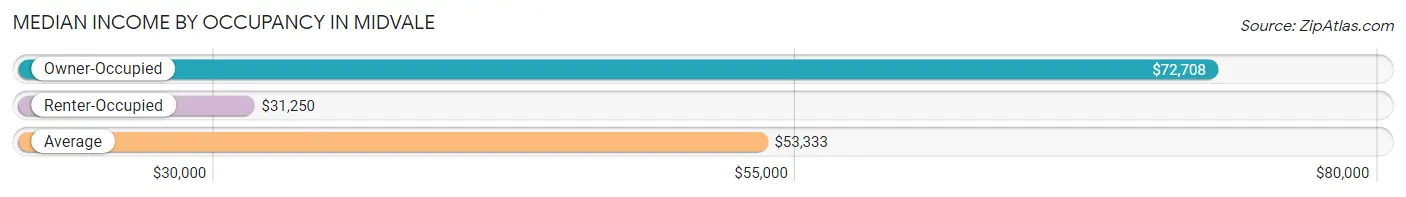
| Occupancy Type | # Households | Median Income |
| Owner-Occupied | 69 (80.2%) | $72,708 |
| Renter-Occupied | 17 (19.8%) | $31,250 |
| Average | 86 (100.0%) | $53,333 |
Occupancy by Householder Income Bracket in Midvale
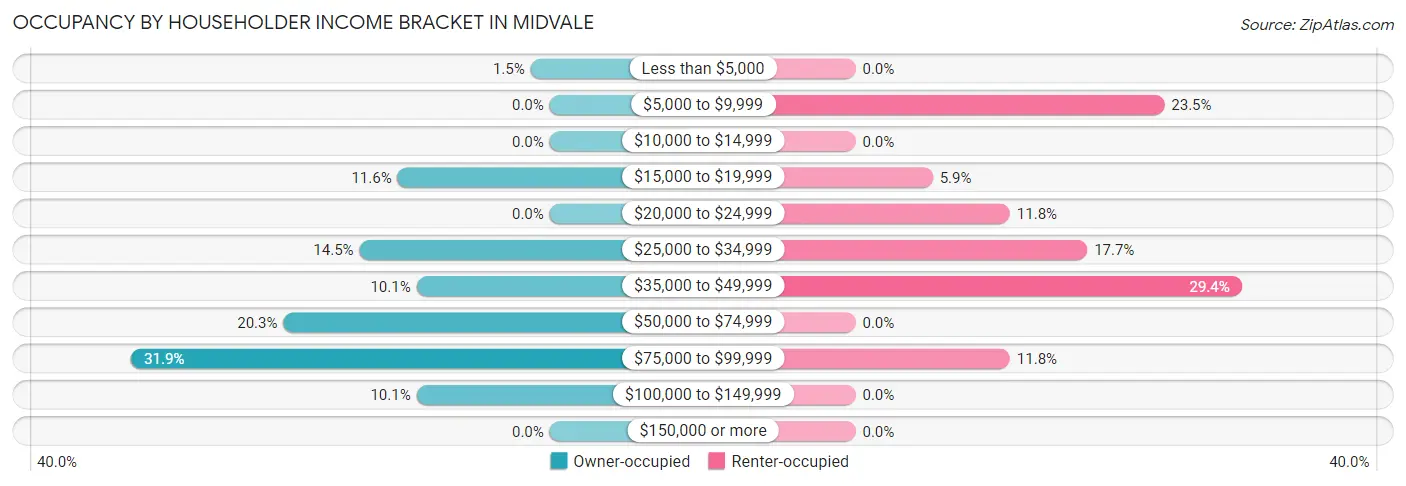
| Income Bracket | Owner-occupied | Renter-occupied |
| Less than $5,000 | 1 (1.5%) | 0 (0.0%) |
| $5,000 to $9,999 | 0 (0.0%) | 4 (23.5%) |
| $10,000 to $14,999 | 0 (0.0%) | 0 (0.0%) |
| $15,000 to $19,999 | 8 (11.6%) | 1 (5.9%) |
| $20,000 to $24,999 | 0 (0.0%) | 2 (11.8%) |
| $25,000 to $34,999 | 10 (14.5%) | 3 (17.6%) |
| $35,000 to $49,999 | 7 (10.1%) | 5 (29.4%) |
| $50,000 to $74,999 | 14 (20.3%) | 0 (0.0%) |
| $75,000 to $99,999 | 22 (31.9%) | 2 (11.8%) |
| $100,000 to $149,999 | 7 (10.1%) | 0 (0.0%) |
| $150,000 or more | 0 (0.0%) | 0 (0.0%) |
| Total | 69 (100.0%) | 17 (100.0%) |
Monthly Housing Cost Tiers in Midvale
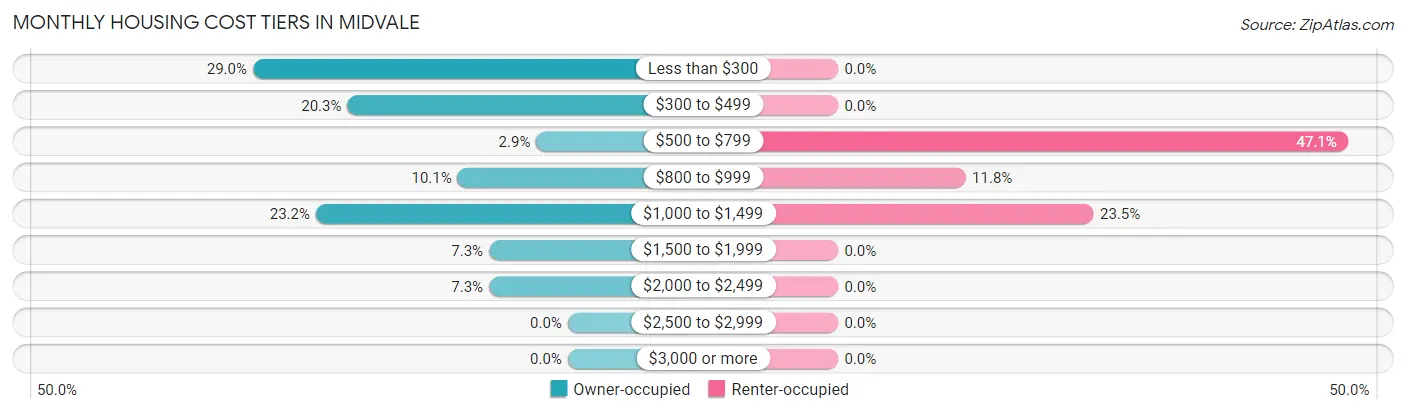
| Monthly Cost | Owner-occupied | Renter-occupied |
| Less than $300 | 20 (29.0%) | 0 (0.0%) |
| $300 to $499 | 14 (20.3%) | 0 (0.0%) |
| $500 to $799 | 2 (2.9%) | 8 (47.1%) |
| $800 to $999 | 7 (10.1%) | 2 (11.8%) |
| $1,000 to $1,499 | 16 (23.2%) | 4 (23.5%) |
| $1,500 to $1,999 | 5 (7.2%) | 0 (0.0%) |
| $2,000 to $2,499 | 5 (7.2%) | 0 (0.0%) |
| $2,500 to $2,999 | 0 (0.0%) | 0 (0.0%) |
| $3,000 or more | 0 (0.0%) | 0 (0.0%) |
| Total | 69 (100.0%) | 17 (100.0%) |
Physical Housing Characteristics in Midvale
Housing Structures in Midvale
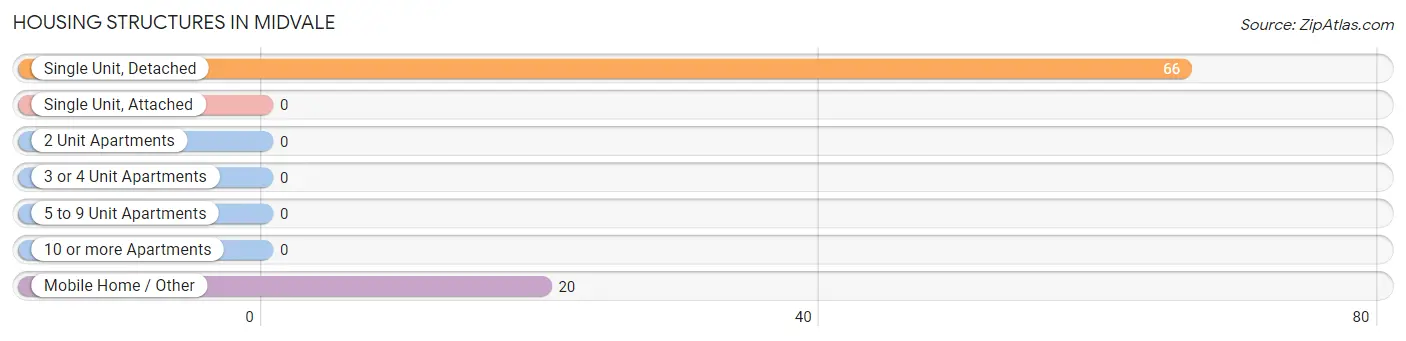
| Structure Type | # Housing Units | % Housing Units |
| Single Unit, Detached | 66 | 76.7% |
| Single Unit, Attached | 0 | 0.0% |
| 2 Unit Apartments | 0 | 0.0% |
| 3 or 4 Unit Apartments | 0 | 0.0% |
| 5 to 9 Unit Apartments | 0 | 0.0% |
| 10 or more Apartments | 0 | 0.0% |
| Mobile Home / Other | 20 | 23.3% |
| Total | 86 | 100.0% |
Housing Structures by Occupancy in Midvale
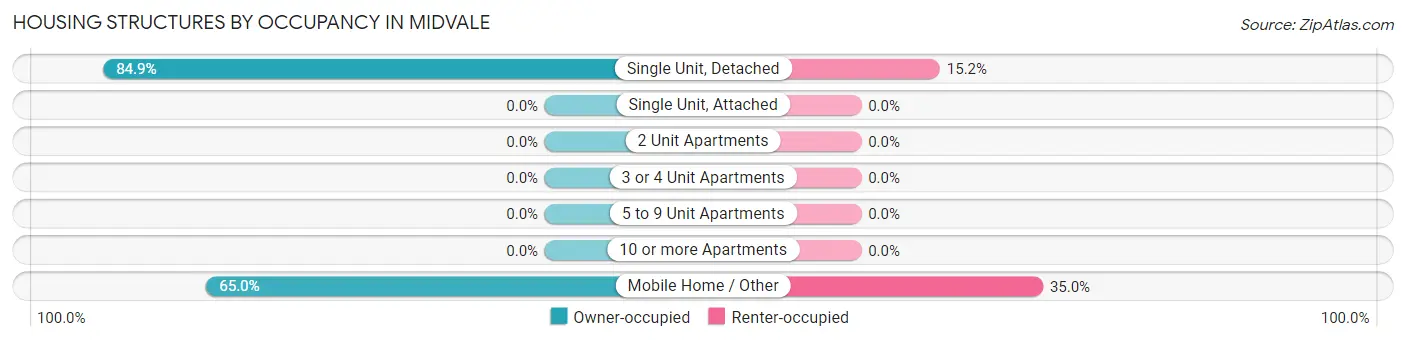
| Structure Type | Owner-occupied | Renter-occupied |
| Single Unit, Detached | 56 (84.9%) | 10 (15.1%) |
| Single Unit, Attached | 0 (0.0%) | 0 (0.0%) |
| 2 Unit Apartments | 0 (0.0%) | 0 (0.0%) |
| 3 or 4 Unit Apartments | 0 (0.0%) | 0 (0.0%) |
| 5 to 9 Unit Apartments | 0 (0.0%) | 0 (0.0%) |
| 10 or more Apartments | 0 (0.0%) | 0 (0.0%) |
| Mobile Home / Other | 13 (65.0%) | 7 (35.0%) |
| Total | 69 (80.2%) | 17 (19.8%) |
Housing Structures by Number of Rooms in Midvale
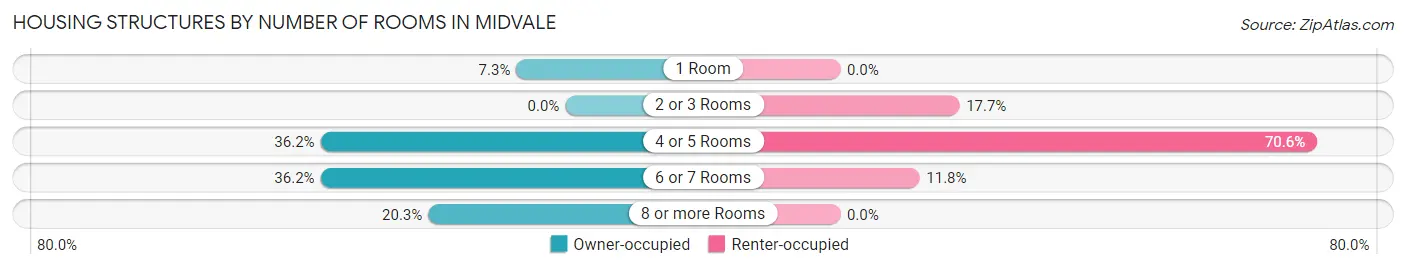
| Number of Rooms | Owner-occupied | Renter-occupied |
| 1 Room | 5 (7.2%) | 0 (0.0%) |
| 2 or 3 Rooms | 0 (0.0%) | 3 (17.6%) |
| 4 or 5 Rooms | 25 (36.2%) | 12 (70.6%) |
| 6 or 7 Rooms | 25 (36.2%) | 2 (11.8%) |
| 8 or more Rooms | 14 (20.3%) | 0 (0.0%) |
| Total | 69 (100.0%) | 17 (100.0%) |
Housing Structure by Heating Type in Midvale
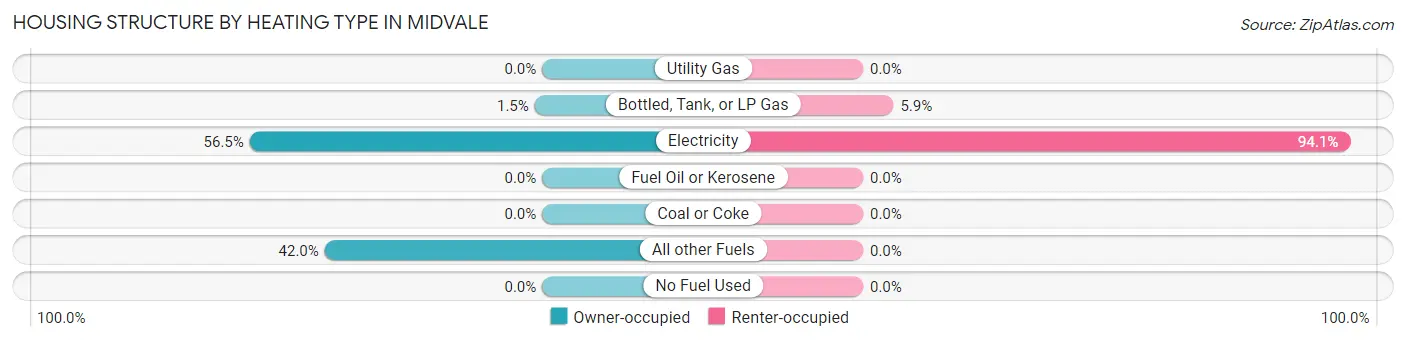
| Heating Type | Owner-occupied | Renter-occupied |
| Utility Gas | 0 (0.0%) | 0 (0.0%) |
| Bottled, Tank, or LP Gas | 1 (1.5%) | 1 (5.9%) |
| Electricity | 39 (56.5%) | 16 (94.1%) |
| Fuel Oil or Kerosene | 0 (0.0%) | 0 (0.0%) |
| Coal or Coke | 0 (0.0%) | 0 (0.0%) |
| All other Fuels | 29 (42.0%) | 0 (0.0%) |
| No Fuel Used | 0 (0.0%) | 0 (0.0%) |
| Total | 69 (100.0%) | 17 (100.0%) |
Household Vehicle Usage in Midvale
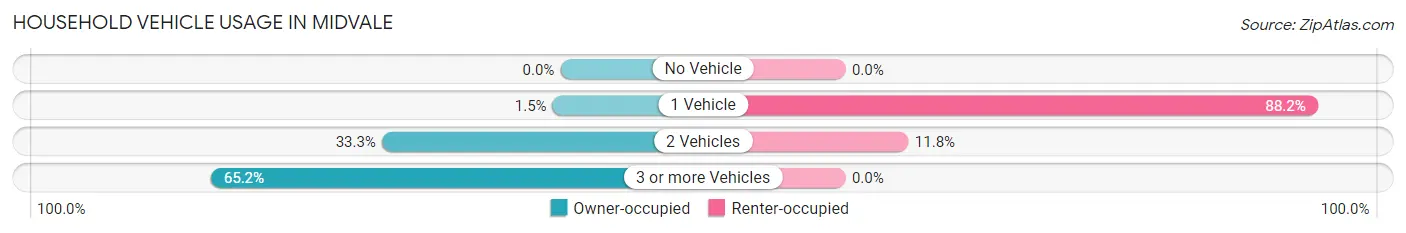
| Vehicles per Household | Owner-occupied | Renter-occupied |
| No Vehicle | 0 (0.0%) | 0 (0.0%) |
| 1 Vehicle | 1 (1.5%) | 15 (88.2%) |
| 2 Vehicles | 23 (33.3%) | 2 (11.8%) |
| 3 or more Vehicles | 45 (65.2%) | 0 (0.0%) |
| Total | 69 (100.0%) | 17 (100.0%) |
Real Estate & Mortgages in Midvale
Real Estate and Mortgage Overview in Midvale
| Characteristic | Without Mortgage | With Mortgage |
| Housing Units | 37 | 32 |
| Median Property Value | $106,300 | $181,800 |
| Median Household Income | - | - |
| Monthly Housing Costs | $292 | $0 |
| Real Estate Taxes | $817 | $0 |
Property Value by Mortgage Status in Midvale
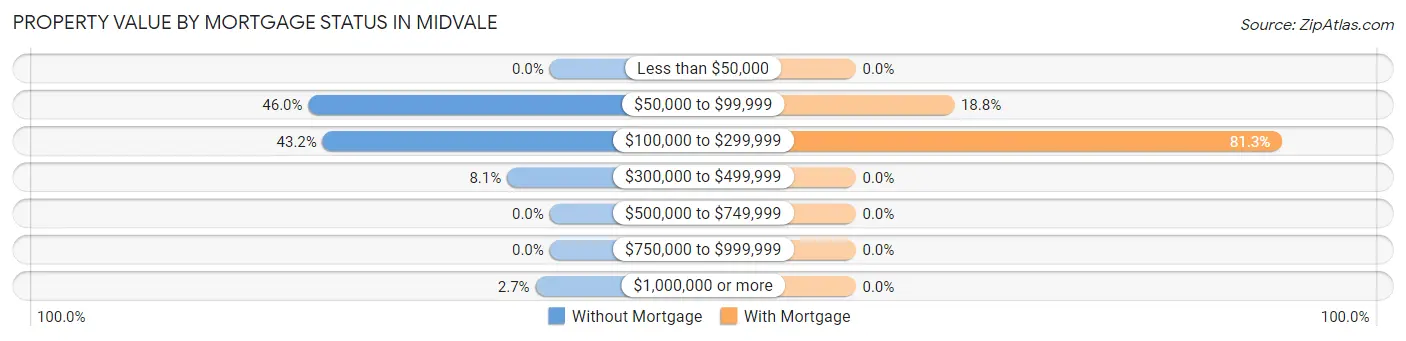
| Property Value | Without Mortgage | With Mortgage |
| Less than $50,000 | 0 (0.0%) | 0 (0.0%) |
| $50,000 to $99,999 | 17 (46.0%) | 6 (18.8%) |
| $100,000 to $299,999 | 16 (43.2%) | 26 (81.2%) |
| $300,000 to $499,999 | 3 (8.1%) | 0 (0.0%) |
| $500,000 to $749,999 | 0 (0.0%) | 0 (0.0%) |
| $750,000 to $999,999 | 0 (0.0%) | 0 (0.0%) |
| $1,000,000 or more | 1 (2.7%) | 0 (0.0%) |
| Total | 37 (100.0%) | 32 (100.0%) |
Household Income by Mortgage Status in Midvale
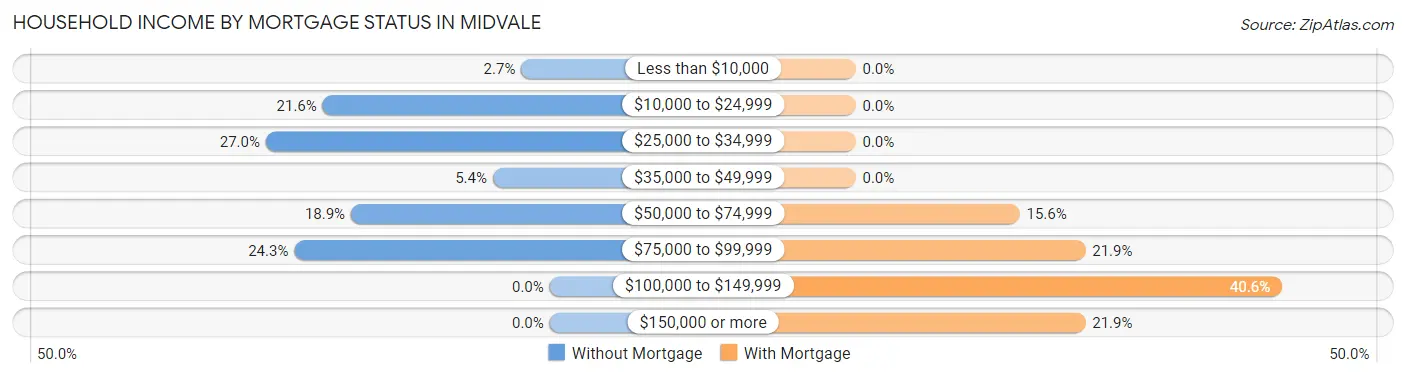
| Household Income | Without Mortgage | With Mortgage |
| Less than $10,000 | 1 (2.7%) | 0 (0.0%) |
| $10,000 to $24,999 | 8 (21.6%) | 0 (0.0%) |
| $25,000 to $34,999 | 10 (27.0%) | 0 (0.0%) |
| $35,000 to $49,999 | 2 (5.4%) | 0 (0.0%) |
| $50,000 to $74,999 | 7 (18.9%) | 5 (15.6%) |
| $75,000 to $99,999 | 9 (24.3%) | 7 (21.9%) |
| $100,000 to $149,999 | 0 (0.0%) | 13 (40.6%) |
| $150,000 or more | 0 (0.0%) | 7 (21.9%) |
| Total | 37 (100.0%) | 32 (100.0%) |
Property Value to Household Income Ratio in Midvale
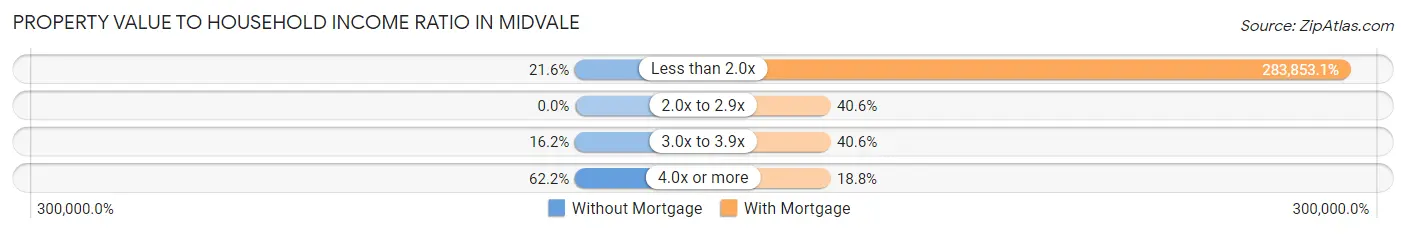
| Value-to-Income Ratio | Without Mortgage | With Mortgage |
| Less than 2.0x | 8 (21.6%) | 90,833 (283,853.1%) |
| 2.0x to 2.9x | 0 (0.0%) | 13 (40.6%) |
| 3.0x to 3.9x | 6 (16.2%) | 13 (40.6%) |
| 4.0x or more | 23 (62.2%) | 6 (18.8%) |
| Total | 37 (100.0%) | 32 (100.0%) |
Real Estate Taxes by Mortgage Status in Midvale
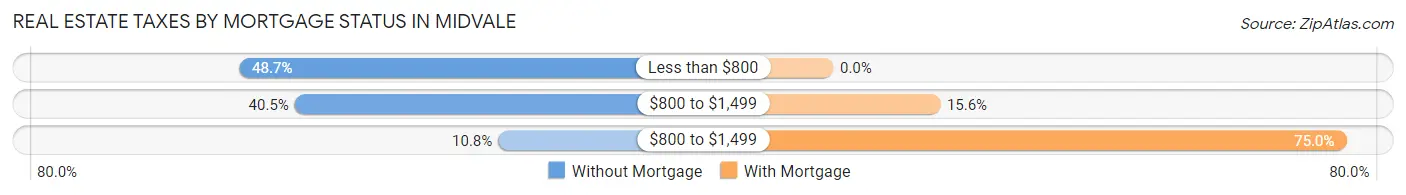
| Property Taxes | Without Mortgage | With Mortgage |
| Less than $800 | 18 (48.6%) | 0 (0.0%) |
| $800 to $1,499 | 15 (40.5%) | 5 (15.6%) |
| $800 to $1,499 | 4 (10.8%) | 24 (75.0%) |
| Total | 37 (100.0%) | 32 (100.0%) |
Health & Disability in Midvale
Health Insurance Coverage by Age in Midvale
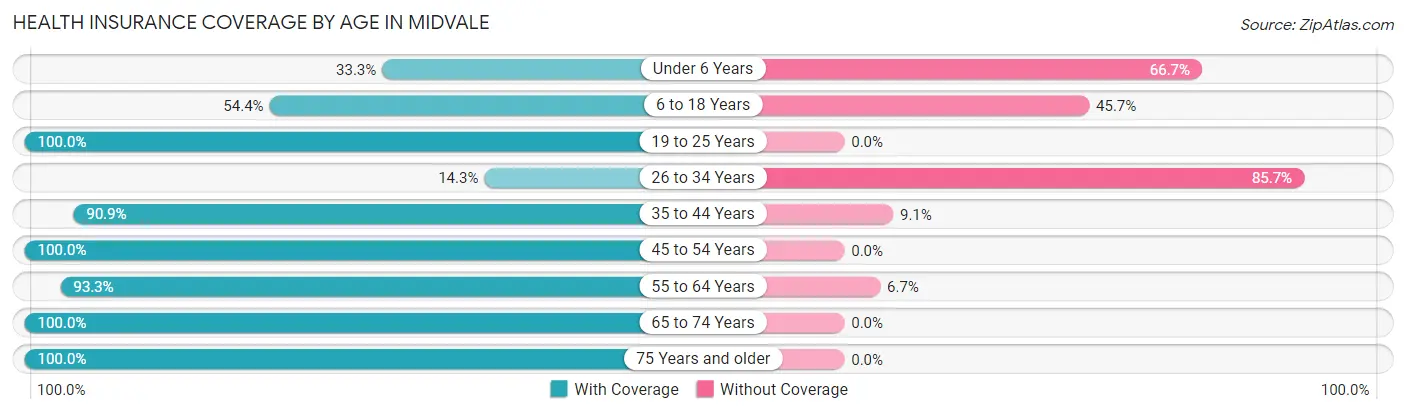
| Age Bracket | With Coverage | Without Coverage |
| Under 6 Years | 8 (33.3%) | 16 (66.7%) |
| 6 to 18 Years | 25 (54.3%) | 21 (45.7%) |
| 19 to 25 Years | 26 (100.0%) | 0 (0.0%) |
| 26 to 34 Years | 3 (14.3%) | 18 (85.7%) |
| 35 to 44 Years | 20 (90.9%) | 2 (9.1%) |
| 45 to 54 Years | 33 (100.0%) | 0 (0.0%) |
| 55 to 64 Years | 28 (93.3%) | 2 (6.7%) |
| 65 to 74 Years | 53 (100.0%) | 0 (0.0%) |
| 75 Years and older | 18 (100.0%) | 0 (0.0%) |
| Total | 214 (78.4%) | 59 (21.6%) |
Health Insurance Coverage by Citizenship Status in Midvale
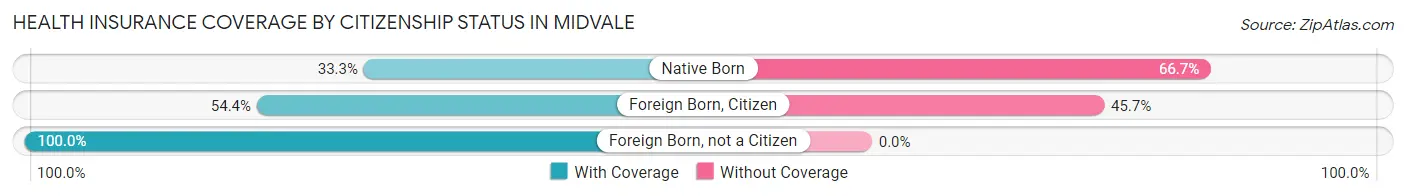
| Citizenship Status | With Coverage | Without Coverage |
| Native Born | 8 (33.3%) | 16 (66.7%) |
| Foreign Born, Citizen | 25 (54.3%) | 21 (45.7%) |
| Foreign Born, not a Citizen | 26 (100.0%) | 0 (0.0%) |
Health Insurance Coverage by Household Income in Midvale
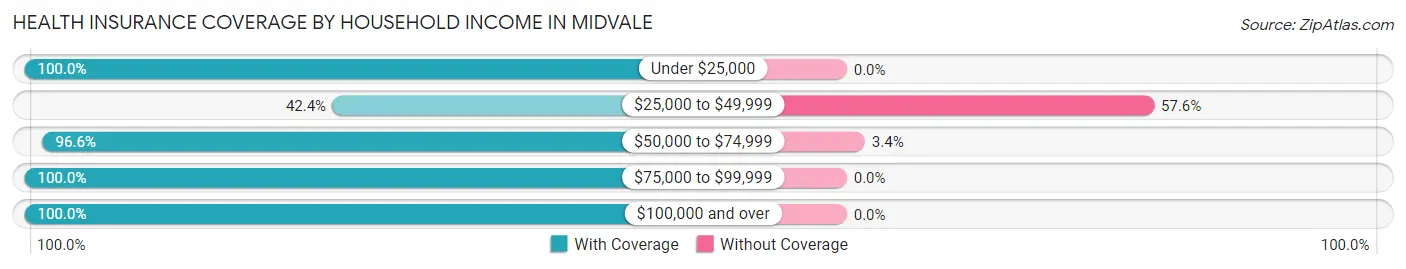
| Household Income | With Coverage | Without Coverage |
| Under $25,000 | 33 (100.0%) | 0 (0.0%) |
| $25,000 to $49,999 | 42 (42.4%) | 57 (57.6%) |
| $50,000 to $74,999 | 57 (96.6%) | 2 (3.4%) |
| $75,000 to $99,999 | 58 (100.0%) | 0 (0.0%) |
| $100,000 and over | 24 (100.0%) | 0 (0.0%) |
Public vs Private Health Insurance Coverage by Age in Midvale
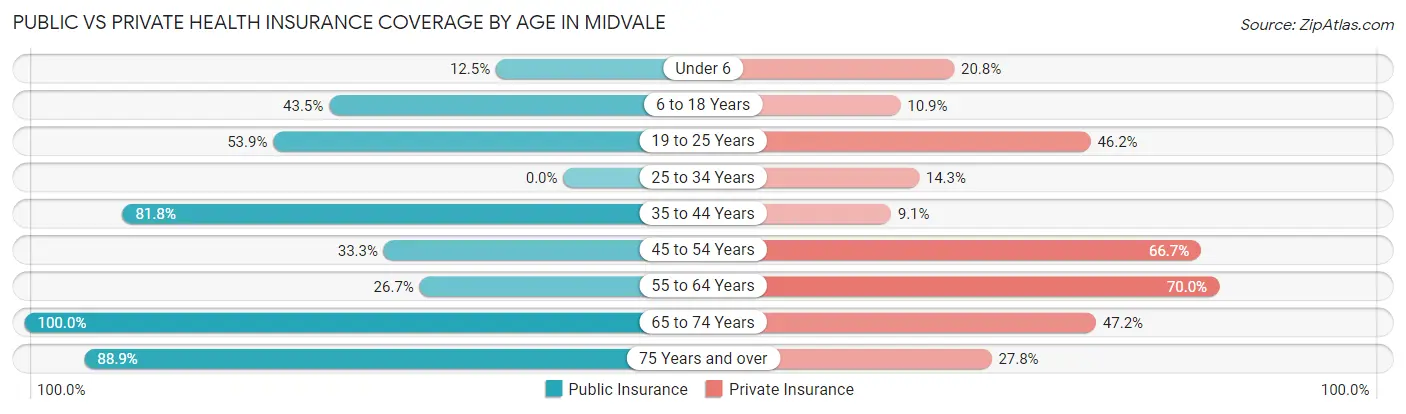
| Age Bracket | Public Insurance | Private Insurance |
| Under 6 | 3 (12.5%) | 5 (20.8%) |
| 6 to 18 Years | 20 (43.5%) | 5 (10.9%) |
| 19 to 25 Years | 14 (53.8%) | 12 (46.2%) |
| 25 to 34 Years | 0 (0.0%) | 3 (14.3%) |
| 35 to 44 Years | 18 (81.8%) | 2 (9.1%) |
| 45 to 54 Years | 11 (33.3%) | 22 (66.7%) |
| 55 to 64 Years | 8 (26.7%) | 21 (70.0%) |
| 65 to 74 Years | 53 (100.0%) | 25 (47.2%) |
| 75 Years and over | 16 (88.9%) | 5 (27.8%) |
| Total | 143 (52.4%) | 100 (36.6%) |
Disability Status by Sex by Age in Midvale
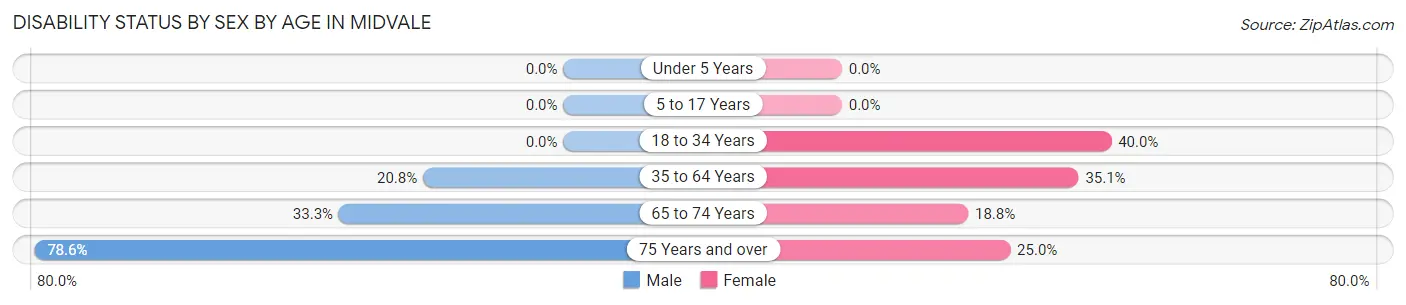
| Age Bracket | Male | Female |
| Under 5 Years | 0 (0.0%) | 0 (0.0%) |
| 5 to 17 Years | 0 (0.0%) | 0 (0.0%) |
| 18 to 34 Years | 0 (0.0%) | 14 (40.0%) |
| 35 to 64 Years | 10 (20.8%) | 13 (35.1%) |
| 65 to 74 Years | 7 (33.3%) | 6 (18.8%) |
| 75 Years and over | 11 (78.6%) | 1 (25.0%) |
Disability Class by Sex by Age in Midvale
Disability Class: Hearing Difficulty
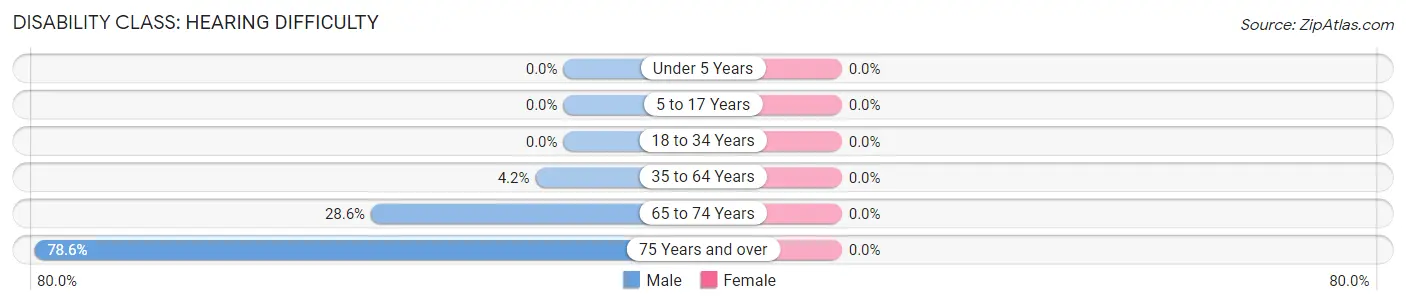
| Age Bracket | Male | Female |
| Under 5 Years | 0 (0.0%) | 0 (0.0%) |
| 5 to 17 Years | 0 (0.0%) | 0 (0.0%) |
| 18 to 34 Years | 0 (0.0%) | 0 (0.0%) |
| 35 to 64 Years | 2 (4.2%) | 0 (0.0%) |
| 65 to 74 Years | 6 (28.6%) | 0 (0.0%) |
| 75 Years and over | 11 (78.6%) | 0 (0.0%) |
Disability Class: Vision Difficulty
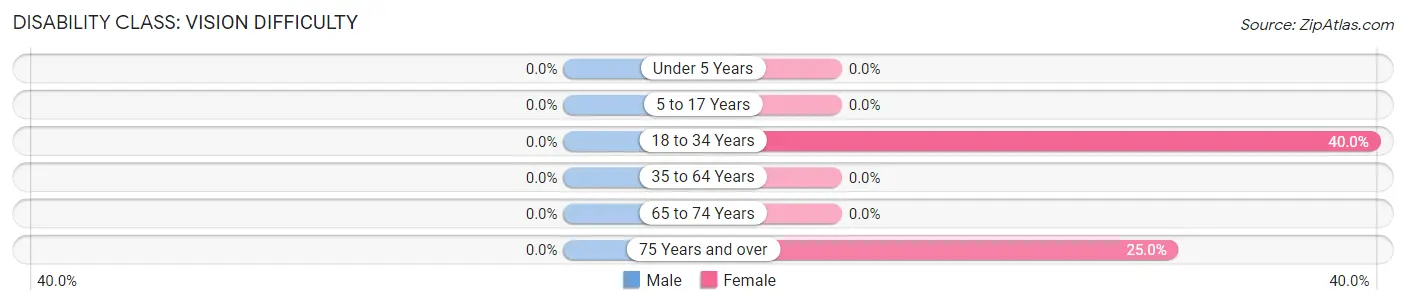
| Age Bracket | Male | Female |
| Under 5 Years | 0 (0.0%) | 0 (0.0%) |
| 5 to 17 Years | 0 (0.0%) | 0 (0.0%) |
| 18 to 34 Years | 0 (0.0%) | 14 (40.0%) |
| 35 to 64 Years | 0 (0.0%) | 0 (0.0%) |
| 65 to 74 Years | 0 (0.0%) | 0 (0.0%) |
| 75 Years and over | 0 (0.0%) | 1 (25.0%) |
Disability Class: Cognitive Difficulty
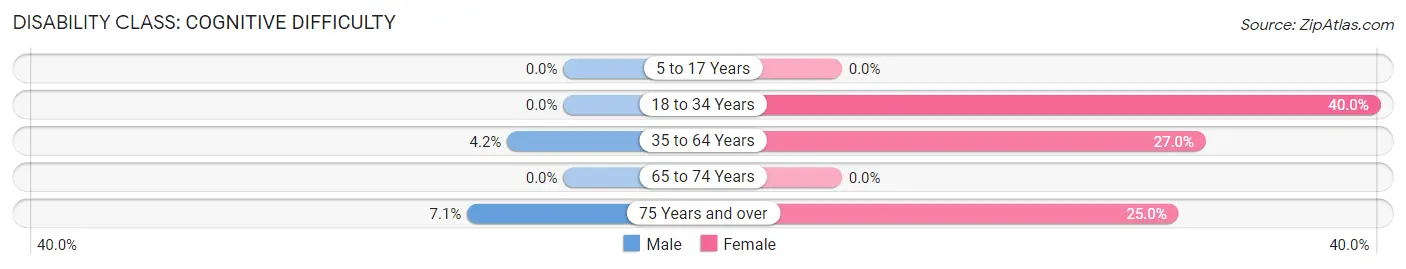
| Age Bracket | Male | Female |
| 5 to 17 Years | 0 (0.0%) | 0 (0.0%) |
| 18 to 34 Years | 0 (0.0%) | 14 (40.0%) |
| 35 to 64 Years | 2 (4.2%) | 10 (27.0%) |
| 65 to 74 Years | 0 (0.0%) | 0 (0.0%) |
| 75 Years and over | 1 (7.1%) | 1 (25.0%) |
Disability Class: Ambulatory Difficulty
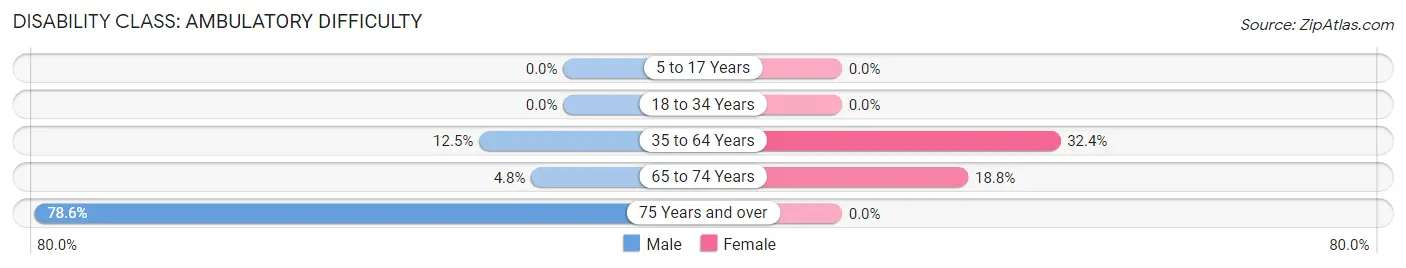
| Age Bracket | Male | Female |
| 5 to 17 Years | 0 (0.0%) | 0 (0.0%) |
| 18 to 34 Years | 0 (0.0%) | 0 (0.0%) |
| 35 to 64 Years | 6 (12.5%) | 12 (32.4%) |
| 65 to 74 Years | 1 (4.8%) | 6 (18.8%) |
| 75 Years and over | 11 (78.6%) | 0 (0.0%) |
Disability Class: Self-Care Difficulty
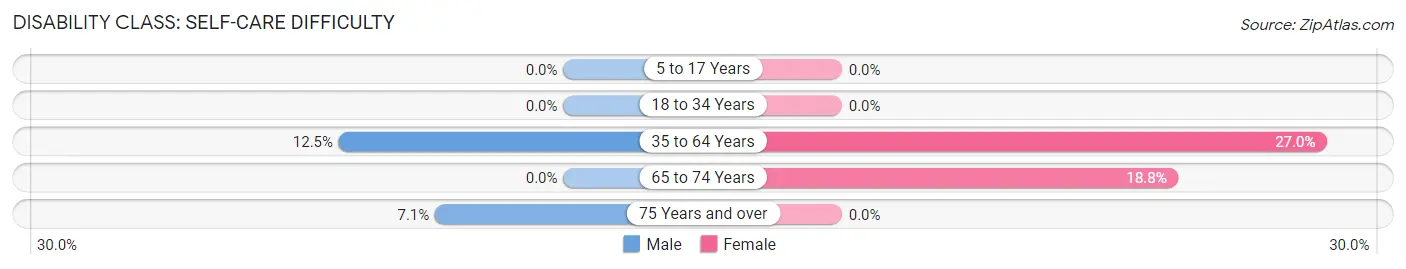
| Age Bracket | Male | Female |
| 5 to 17 Years | 0 (0.0%) | 0 (0.0%) |
| 18 to 34 Years | 0 (0.0%) | 0 (0.0%) |
| 35 to 64 Years | 6 (12.5%) | 10 (27.0%) |
| 65 to 74 Years | 0 (0.0%) | 6 (18.8%) |
| 75 Years and over | 1 (7.1%) | 0 (0.0%) |
Technology Access in Midvale
Computing Device Access in Midvale
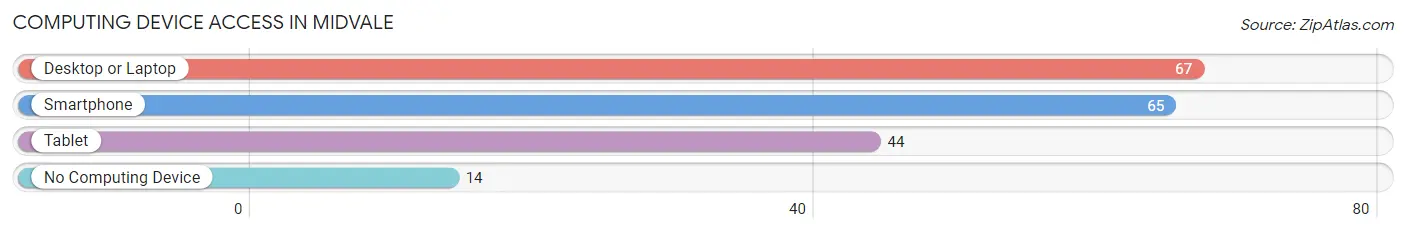
| Device Type | # Households | % Households |
| Desktop or Laptop | 67 | 77.9% |
| Smartphone | 65 | 75.6% |
| Tablet | 44 | 51.2% |
| No Computing Device | 14 | 16.3% |
| Total | 86 | 100.0% |
Internet Access in Midvale
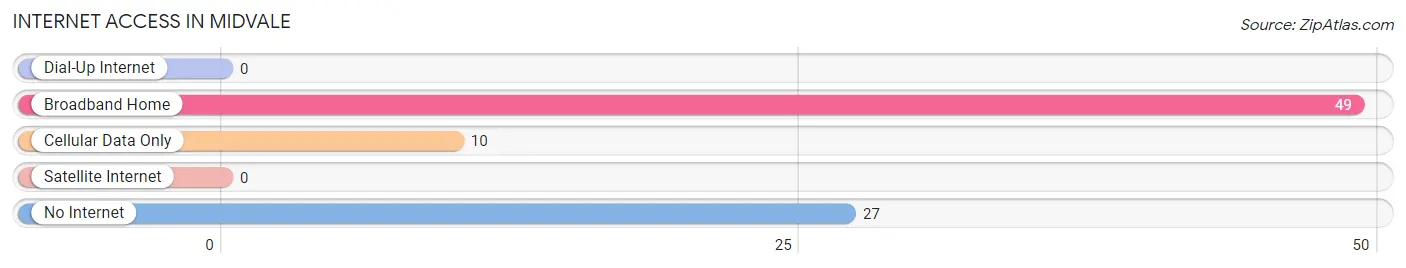
| Internet Type | # Households | % Households |
| Dial-Up Internet | 0 | 0.0% |
| Broadband Home | 49 | 57.0% |
| Cellular Data Only | 10 | 11.6% |
| Satellite Internet | 0 | 0.0% |
| No Internet | 27 | 31.4% |
| Total | 86 | 100.0% |
Midvale Summary
Midvale, Idaho is a small city located in the western part of the state, in the Snake River Valley. It is situated in the foothills of the Owyhee Mountains, and is part of the Boise metropolitan area. The city has a population of approximately 1,500 people, and is the county seat of Washington County.
History
Midvale was founded in 1883 by a group of settlers from the Midwest. The city was originally named “Midway”, as it was located halfway between Boise and Weiser. The name was later changed to Midvale, as it was thought to be more descriptive of the area.
The city was originally a farming community, and the main crops grown were wheat, barley, and potatoes. In the early 1900s, the city began to grow and develop, and by the 1920s, it had become a thriving commercial center. The city was home to several businesses, including a bank, a hotel, a theater, and a variety of stores.
In the 1950s, the city began to experience a decline in population, as many of the businesses closed and people moved away. However, in the late 1970s, the city began to experience a resurgence, as new businesses opened and the population began to grow again.
Geography
Midvale is located in the western part of Idaho, in the Snake River Valley. The city is situated in the foothills of the Owyhee Mountains, and is part of the Boise metropolitan area. The city is located at an elevation of 3,400 feet, and has a total area of 1.2 square miles.
The city is located near several rivers, including the Snake River, the Boise River, and the Payette River. The city is also located near several lakes, including Lake Lowell, Lake Cascade, and Lake Walcott.
Economy
The economy of Midvale is largely based on agriculture and tourism. The city is home to several farms, which produce a variety of crops, including wheat, barley, potatoes, and hay. The city is also home to several wineries, which produce a variety of wines.
The city is also home to several tourist attractions, including the Snake River Canyon, the Owyhee Mountains, and the Boise River. The city is also home to several museums, including the Midvale Historical Museum and the Midvale Art Museum.
Demographics
As of the 2010 census, the population of Midvale was 1,500 people. The racial makeup of the city was 95.3% White, 0.7% African American, 0.7% Native American, 0.7% Asian, 0.3% from other races, and 2.0% from two or more races. Hispanic or Latino of any race were 1.3% of the population.
The median income for a household in the city was $37,500, and the median income for a family was $45,000. The per capita income for the city was $18,000. About 11.7% of families and 14.3% of the population were below the poverty line, including 18.2% of those under age 18 and 8.3% of those age 65 or over.
Common Questions
What is Per Capita Income in Midvale?
Per Capita income in Midvale is $20,451.
What is the Median Family Income in Midvale?
Median Family Income in Midvale is $53,125.
What is the Median Household income in Midvale?
Median Household Income in Midvale is $53,333.
What is Income or Wage Gap in Midvale?
Income or Wage Gap in Midvale is 60.0%.
Women in Midvale earn 40.0 cents for every dollar earned by a man.
What is Inequality or Gini Index in Midvale?
Inequality or Gini Index in Midvale is 0.35.
What is the Total Population of Midvale?
Total Population of Midvale is 273.
What is the Total Male Population of Midvale?
Total Male Population of Midvale is 135.
What is the Total Female Population of Midvale?
Total Female Population of Midvale is 138.
What is the Ratio of Males per 100 Females in Midvale?
There are 97.83 Males per 100 Females in Midvale.
What is the Ratio of Females per 100 Males in Midvale?
There are 102.22 Females per 100 Males in Midvale.
What is the Median Population Age in Midvale?
Median Population Age in Midvale is 44.6 Years.
What is the Average Family Size in Midvale
Average Family Size in Midvale is 3.4 People.
What is the Average Household Size in Midvale
Average Household Size in Midvale is 3.2 People.
How Large is the Labor Force in Midvale?
There are 86 People in the Labor Forcein in Midvale.
What is the Percentage of People in the Labor Force in Midvale?
41.5% of People are in the Labor Force in Midvale.
What is the Unemployment Rate in Midvale?
Unemployment Rate in Midvale is 5.8%.