Mccammon, ID Map & Demographics
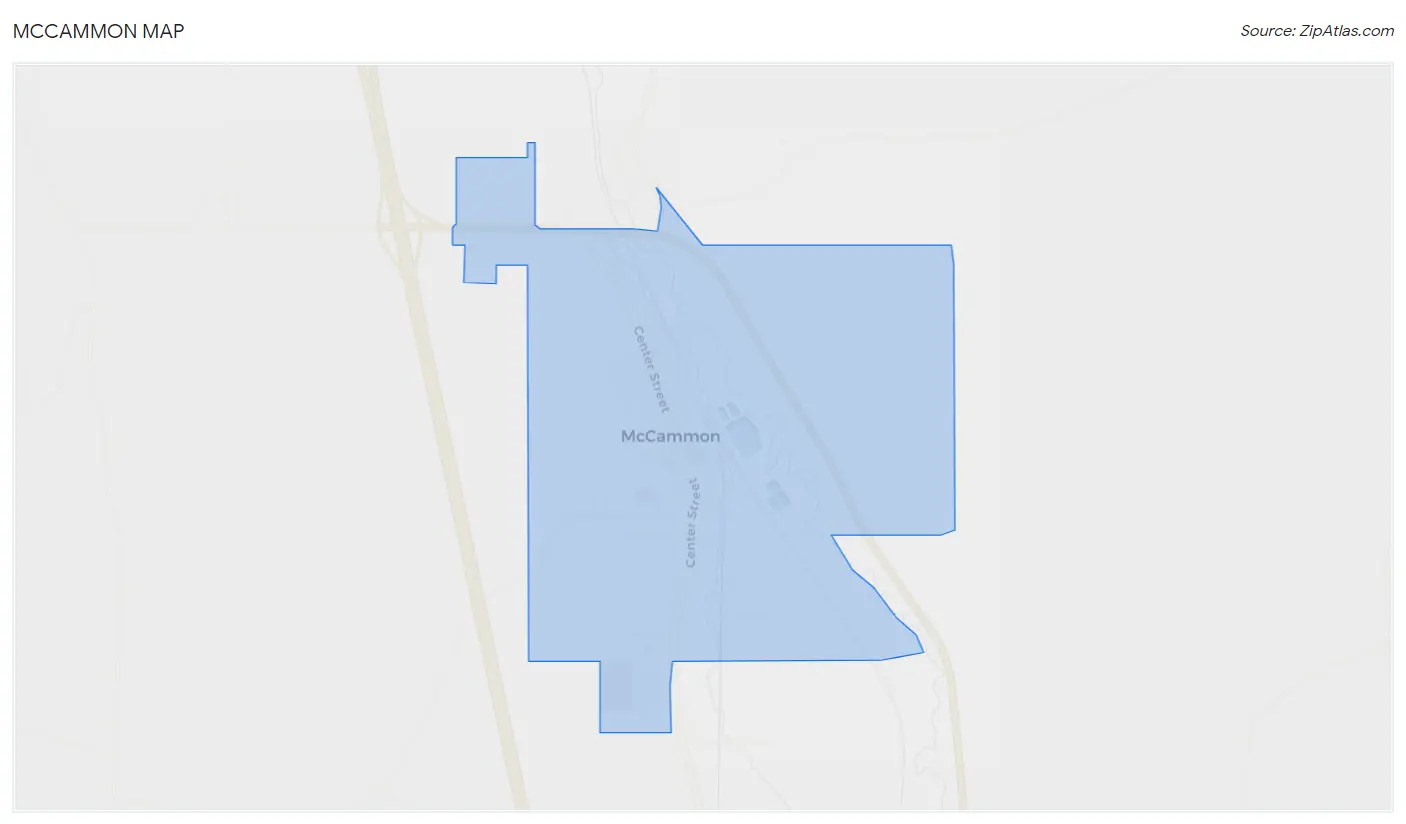
Mccammon Map
Mccammon Overview
$30,993
PER CAPITA INCOME
$85,000
AVG FAMILY INCOME
$74,583
AVG HOUSEHOLD INCOME
20.8%
WAGE / INCOME GAP [ % ]
79.2¢/ $1
WAGE / INCOME GAP [ $ ]
0.37
INEQUALITY / GINI INDEX
1,017
TOTAL POPULATION
459
MALE POPULATION
558
FEMALE POPULATION
82.26
MALES / 100 FEMALES
121.57
FEMALES / 100 MALES
41.2
MEDIAN AGE
3.4
AVG FAMILY SIZE
3.0
AVG HOUSEHOLD SIZE
487
LABOR FORCE [ PEOPLE ]
60.3%
PERCENT IN LABOR FORCE
5.1%
UNEMPLOYMENT RATE
Mccammon Zip Codes
Mccammon Area Codes
Income in Mccammon
Income Overview in Mccammon
Per Capita Income in Mccammon is $30,993, while median incomes of families and households are $85,000 and $74,583 respectively.
| Characteristic | Number | Measure |
| Per Capita Income | 1,017 | $30,993 |
| Median Family Income | 278 | $85,000 |
| Mean Family Income | 278 | $102,492 |
| Median Household Income | 340 | $74,583 |
| Mean Household Income | 340 | $92,659 |
| Income Deficit | 278 | $0 |
| Wage / Income Gap (%) | 1,017 | 20.80% |
| Wage / Income Gap ($) | 1,017 | 79.20¢ per $1 |
| Gini / Inequality Index | 1,017 | 0.37 |
Earnings by Sex in Mccammon
Average Earnings in Mccammon are $36,842, $41,429 for men and $32,813 for women, a difference of 20.8%.
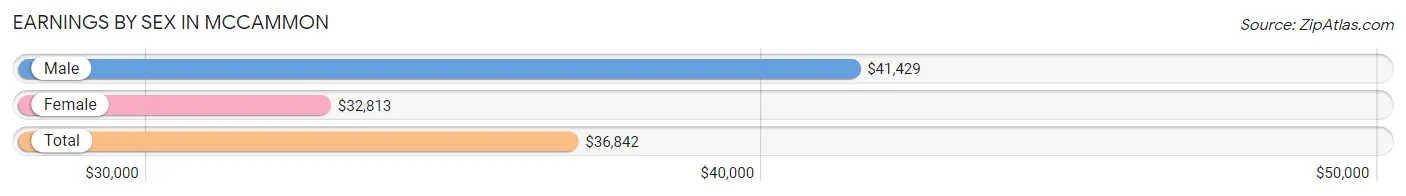
| Sex | Number | Average Earnings |
| Male | 294 (52.9%) | $41,429 |
| Female | 262 (47.1%) | $32,813 |
| Total | 556 (100.0%) | $36,842 |
Earnings by Sex by Income Bracket in Mccammon
The most common earnings brackets in Mccammon are $75,000 to $99,999 for men (63 | 21.4%) and $2,499 or less for women (52 | 19.9%).
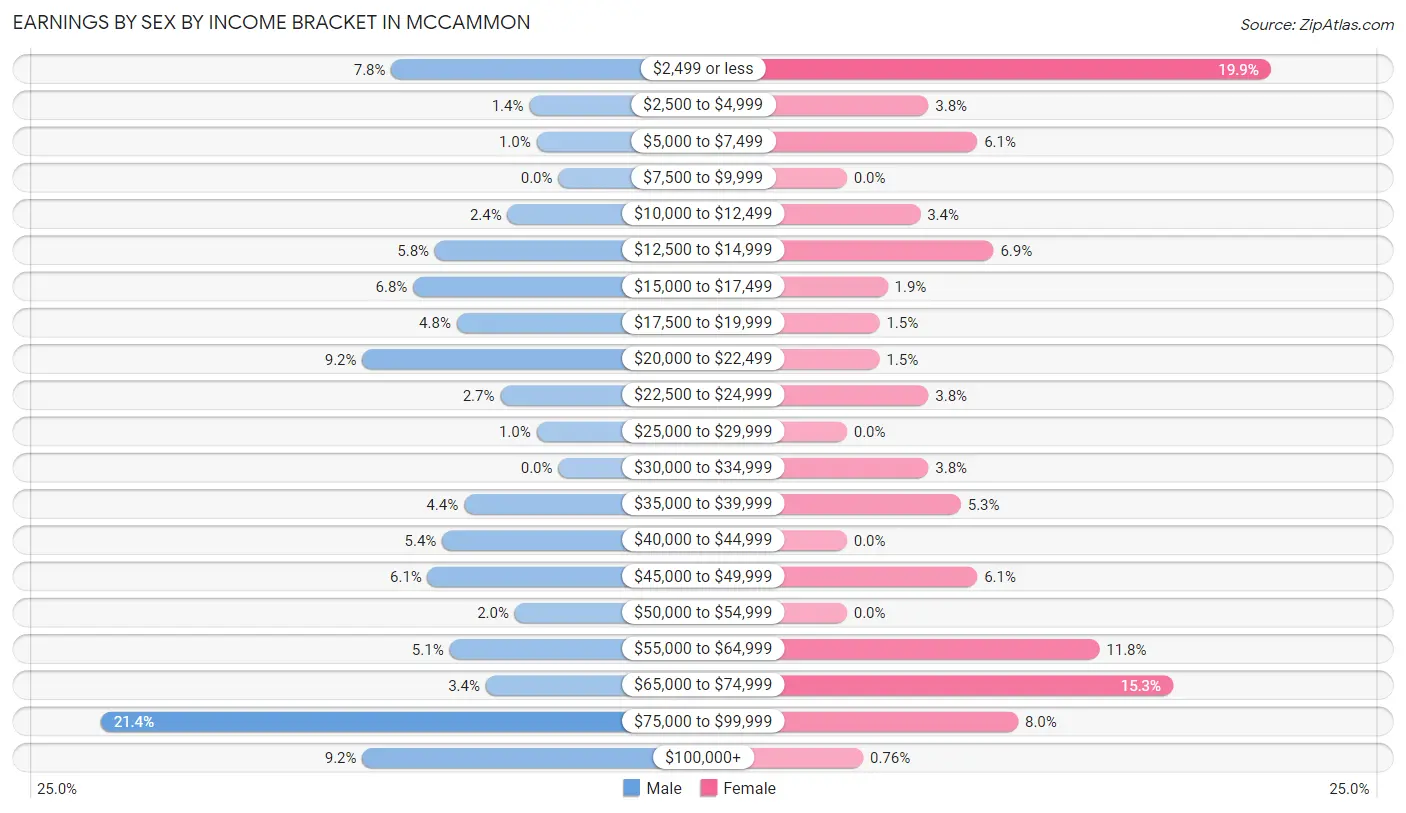
| Income | Male | Female |
| $2,499 or less | 23 (7.8%) | 52 (19.9%) |
| $2,500 to $4,999 | 4 (1.4%) | 10 (3.8%) |
| $5,000 to $7,499 | 3 (1.0%) | 16 (6.1%) |
| $7,500 to $9,999 | 0 (0.0%) | 0 (0.0%) |
| $10,000 to $12,499 | 7 (2.4%) | 9 (3.4%) |
| $12,500 to $14,999 | 17 (5.8%) | 18 (6.9%) |
| $15,000 to $17,499 | 20 (6.8%) | 5 (1.9%) |
| $17,500 to $19,999 | 14 (4.8%) | 4 (1.5%) |
| $20,000 to $22,499 | 27 (9.2%) | 4 (1.5%) |
| $22,500 to $24,999 | 8 (2.7%) | 10 (3.8%) |
| $25,000 to $29,999 | 3 (1.0%) | 0 (0.0%) |
| $30,000 to $34,999 | 0 (0.0%) | 10 (3.8%) |
| $35,000 to $39,999 | 13 (4.4%) | 14 (5.3%) |
| $40,000 to $44,999 | 16 (5.4%) | 0 (0.0%) |
| $45,000 to $49,999 | 18 (6.1%) | 16 (6.1%) |
| $50,000 to $54,999 | 6 (2.0%) | 0 (0.0%) |
| $55,000 to $64,999 | 15 (5.1%) | 31 (11.8%) |
| $65,000 to $74,999 | 10 (3.4%) | 40 (15.3%) |
| $75,000 to $99,999 | 63 (21.4%) | 21 (8.0%) |
| $100,000+ | 27 (9.2%) | 2 (0.8%) |
| Total | 294 (100.0%) | 262 (100.0%) |
Earnings by Sex by Educational Attainment in Mccammon
Average earnings in Mccammon are $45,750 for men and $35,521 for women, a difference of 22.4%. Men with an educational attainment of graduate degree enjoy the highest average annual earnings of $155,833, while those with less than high school education earn the least with $21,000. Women with an educational attainment of college or associate's degree earn the most with the average annual earnings of $42,500, while those with high school diploma education have the smallest earnings of $24,821.
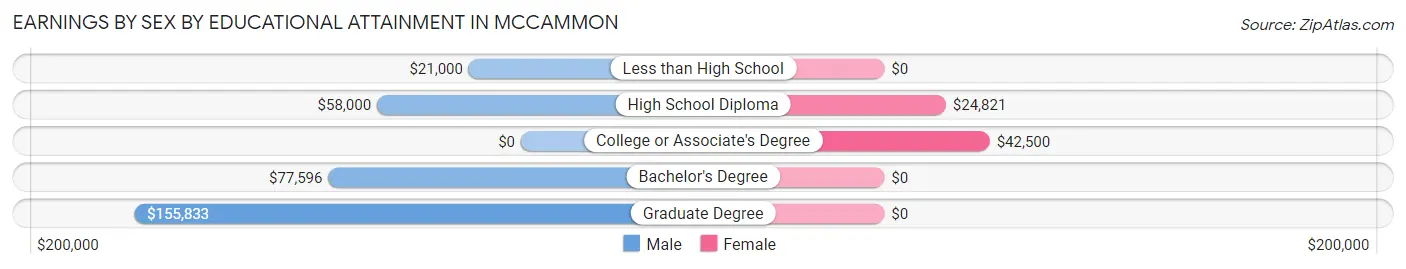
| Educational Attainment | Male Income | Female Income |
| Less than High School | $21,000 | $0 |
| High School Diploma | $58,000 | $24,821 |
| College or Associate's Degree | - | - |
| Bachelor's Degree | $77,596 | $0 |
| Graduate Degree | $155,833 | $0 |
| Total | $45,750 | $35,521 |
Family Income in Mccammon
Family Income Brackets in Mccammon
According to the Mccammon family income data, there are 64 families falling into the $100,000 to $149,999 income range, which is the most common income bracket and makes up 23.0% of all families.
| Income Bracket | # Families | % Families |
| Less than $10,000 | 0 | 0.0% |
| $10,000 to $14,999 | 0 | 0.0% |
| $15,000 to $24,999 | 8 | 2.9% |
| $25,000 to $34,999 | 17 | 6.1% |
| $35,000 to $49,999 | 43 | 15.5% |
| $50,000 to $74,999 | 54 | 19.4% |
| $75,000 to $99,999 | 47 | 16.9% |
| $100,000 to $149,999 | 64 | 23.0% |
| $150,000 to $199,999 | 15 | 5.4% |
| $200,000+ | 30 | 10.8% |
Family Income by Famaliy Size in Mccammon
5-person families (21 | 7.5%) account for the highest median family income in Mccammon with $148,365 per family, while 2-person families (130 | 46.8%) have the highest median income of $34,375 per family member.
| Income Bracket | # Families | Median Income |
| 2-Person Families | 130 (46.8%) | $68,750 |
| 3-Person Families | 32 (11.5%) | $56,250 |
| 4-Person Families | 59 (21.2%) | $89,250 |
| 5-Person Families | 21 (7.5%) | $148,365 |
| 6-Person Families | 32 (11.5%) | $0 |
| 7+ Person Families | 4 (1.4%) | $0 |
| Total | 278 (100.0%) | $85,000 |
Family Income by Number of Earners in Mccammon
| Number of Earners | # Families | Median Income |
| No Earners | 34 (12.2%) | $58,438 |
| 1 Earner | 77 (27.7%) | $55,417 |
| 2 Earners | 108 (38.9%) | $88,750 |
| 3+ Earners | 59 (21.2%) | $0 |
| Total | 278 (100.0%) | $85,000 |
Household Income in Mccammon
Household Income Brackets in Mccammon
With 73 households falling in the category, the $50,000 to $74,999 income range is the most frequent in Mccammon, accounting for 21.5% of all households. In contrast, only 5 households (1.5%) fall into the less than $10,000 income bracket, making it the least populous group.
| Income Bracket | # Households | % Households |
| Less than $10,000 | 5 | 1.5% |
| $10,000 to $14,999 | 7 | 2.1% |
| $15,000 to $24,999 | 16 | 4.7% |
| $25,000 to $34,999 | 25 | 7.4% |
| $35,000 to $49,999 | 45 | 13.2% |
| $50,000 to $74,999 | 73 | 21.5% |
| $75,000 to $99,999 | 58 | 17.1% |
| $100,000 to $149,999 | 66 | 19.4% |
| $150,000 to $199,999 | 15 | 4.4% |
| $200,000+ | 30 | 8.8% |
Household Income by Householder Age in Mccammon
The median household income in Mccammon is $74,583, with the highest median household income of $86,750 found in the 45 to 64 years age bracket for the primary householder. A total of 126 households (37.1%) fall into this category. Meanwhile, the 15 to 24 years age bracket for the primary householder has the lowest median household income of $56,875, with 17 households (5.0%) in this group.
| Income Bracket | # Households | Median Income |
| 15 to 24 Years | 17 (5.0%) | $56,875 |
| 25 to 44 Years | 90 (26.5%) | $86,250 |
| 45 to 64 Years | 126 (37.1%) | $86,750 |
| 65+ Years | 107 (31.5%) | $58,594 |
| Total | 340 (100.0%) | $74,583 |
Poverty in Mccammon
Income Below Poverty by Sex and Age in Mccammon
With 4.4% poverty level for males and 4.5% for females among the residents of Mccammon, 18 to 24 year old males and 75 year old and over females are the most vulnerable to poverty, with 10 males (17.0%) and 6 females (16.7%) in their respective age groups living below the poverty level.
| Age Bracket | Male | Female |
| Under 5 Years | 2 (9.1%) | 2 (3.7%) |
| 5 Years | 0 (0.0%) | 0 (0.0%) |
| 6 to 11 Years | 2 (6.7%) | 0 (0.0%) |
| 12 to 14 Years | 0 (0.0%) | 0 (0.0%) |
| 15 Years | 0 (0.0%) | 0 (0.0%) |
| 16 and 17 Years | 0 (0.0%) | 0 (0.0%) |
| 18 to 24 Years | 10 (17.0%) | 0 (0.0%) |
| 25 to 34 Years | 0 (0.0%) | 4 (5.1%) |
| 35 to 44 Years | 5 (5.9%) | 5 (8.2%) |
| 45 to 54 Years | 1 (9.1%) | 0 (0.0%) |
| 55 to 64 Years | 0 (0.0%) | 7 (9.0%) |
| 65 to 74 Years | 0 (0.0%) | 1 (1.4%) |
| 75 Years and over | 0 (0.0%) | 6 (16.7%) |
| Total | 20 (4.4%) | 25 (4.5%) |
Income Above Poverty by Sex and Age in Mccammon
According to the poverty statistics in Mccammon, males aged 5 years and females aged 5 years are the age groups that are most secure financially, with 100.0% of males and 100.0% of females in these age groups living above the poverty line.
| Age Bracket | Male | Female |
| Under 5 Years | 20 (90.9%) | 52 (96.3%) |
| 5 Years | 1 (100.0%) | 4 (100.0%) |
| 6 to 11 Years | 28 (93.3%) | 36 (100.0%) |
| 12 to 14 Years | 8 (100.0%) | 33 (100.0%) |
| 15 Years | 13 (100.0%) | 9 (100.0%) |
| 16 and 17 Years | 7 (100.0%) | 17 (100.0%) |
| 18 to 24 Years | 49 (83.1%) | 15 (100.0%) |
| 25 to 34 Years | 51 (100.0%) | 74 (94.9%) |
| 35 to 44 Years | 80 (94.1%) | 56 (91.8%) |
| 45 to 54 Years | 10 (90.9%) | 64 (100.0%) |
| 55 to 64 Years | 73 (100.0%) | 71 (91.0%) |
| 65 to 74 Years | 63 (100.0%) | 72 (98.6%) |
| 75 Years and over | 36 (100.0%) | 30 (83.3%) |
| Total | 439 (95.6%) | 533 (95.5%) |
Income Below Poverty Among Married-Couple Families in Mccammon
The poverty statistics for married-couple families in Mccammon show that 2.1% or 5 of the total 237 families live below the poverty line. Families with 3 or 4 children have the highest poverty rate of 18.5%, comprising of 5 families. On the other hand, families with no children have the lowest poverty rate of 0.0%, which includes 0 families.
| Children | Above Poverty | Below Poverty |
| No Children | 143 (100.0%) | 0 (0.0%) |
| 1 or 2 Children | 63 (100.0%) | 0 (0.0%) |
| 3 or 4 Children | 22 (81.5%) | 5 (18.5%) |
| 5 or more Children | 4 (100.0%) | 0 (0.0%) |
| Total | 232 (97.9%) | 5 (2.1%) |
Income Below Poverty Among Single-Parent Households in Mccammon
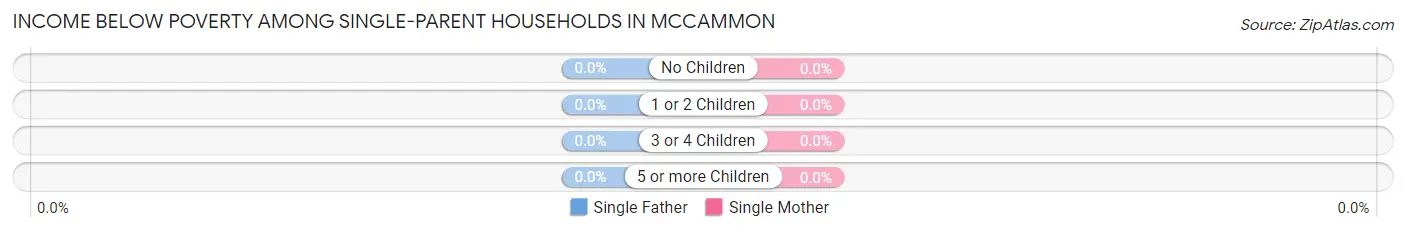
| Children | Single Father | Single Mother |
| No Children | 0 (0.0%) | 0 (0.0%) |
| 1 or 2 Children | 0 (0.0%) | 0 (0.0%) |
| 3 or 4 Children | 0 (0.0%) | 0 (0.0%) |
| 5 or more Children | 0 (0.0%) | 0 (0.0%) |
| Total | 0 (0.0%) | 0 (0.0%) |
Income Below Poverty Among Married-Couple vs Single-Parent Households in Mccammon
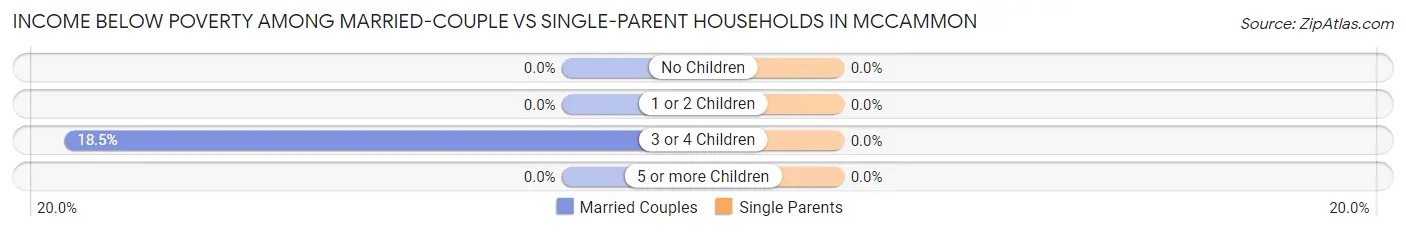
| Children | Married-Couple Families | Single-Parent Households |
| No Children | 0 (0.0%) | 0 (0.0%) |
| 1 or 2 Children | 0 (0.0%) | 0 (0.0%) |
| 3 or 4 Children | 5 (18.5%) | 0 (0.0%) |
| 5 or more Children | 0 (0.0%) | 0 (0.0%) |
| Total | 5 (2.1%) | 0 (0.0%) |
Race in Mccammon
The most populous races in Mccammon are White / Caucasian (943 | 92.7%), Two or more Races (38 | 3.7%), and Hispanic or Latino (31 | 3.0%).
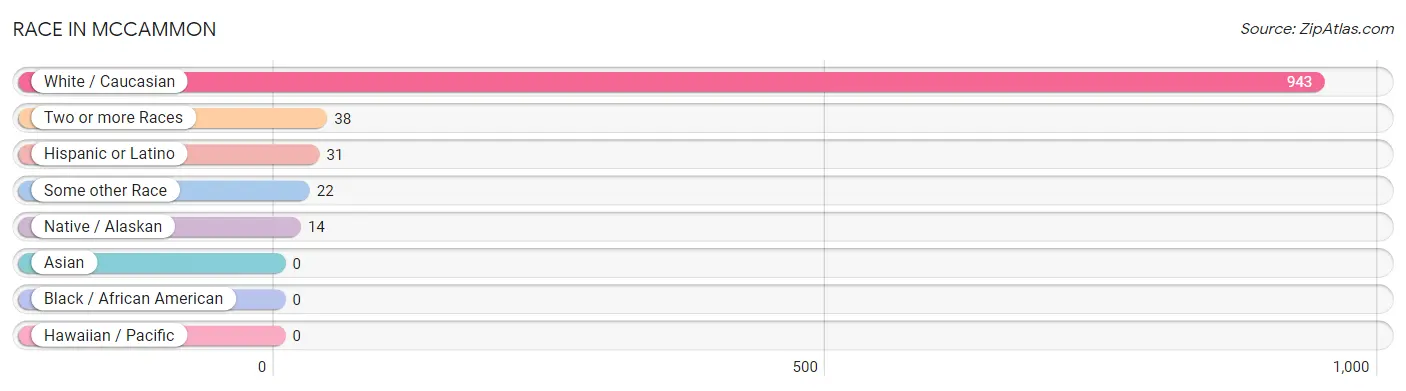
| Race | # Population | % Population |
| Asian | 0 | 0.0% |
| Black / African American | 0 | 0.0% |
| Hawaiian / Pacific | 0 | 0.0% |
| Hispanic or Latino | 31 | 3.0% |
| Native / Alaskan | 14 | 1.4% |
| White / Caucasian | 943 | 92.7% |
| Two or more Races | 38 | 3.7% |
| Some other Race | 22 | 2.2% |
| Total | 1,017 | 100.0% |
Ancestry in Mccammon
The most populous ancestries reported in Mccammon are English (247 | 24.3%), German (162 | 15.9%), European (108 | 10.6%), Scottish (98 | 9.6%), and Welsh (97 | 9.5%), together accounting for 70.0% of all Mccammon residents.
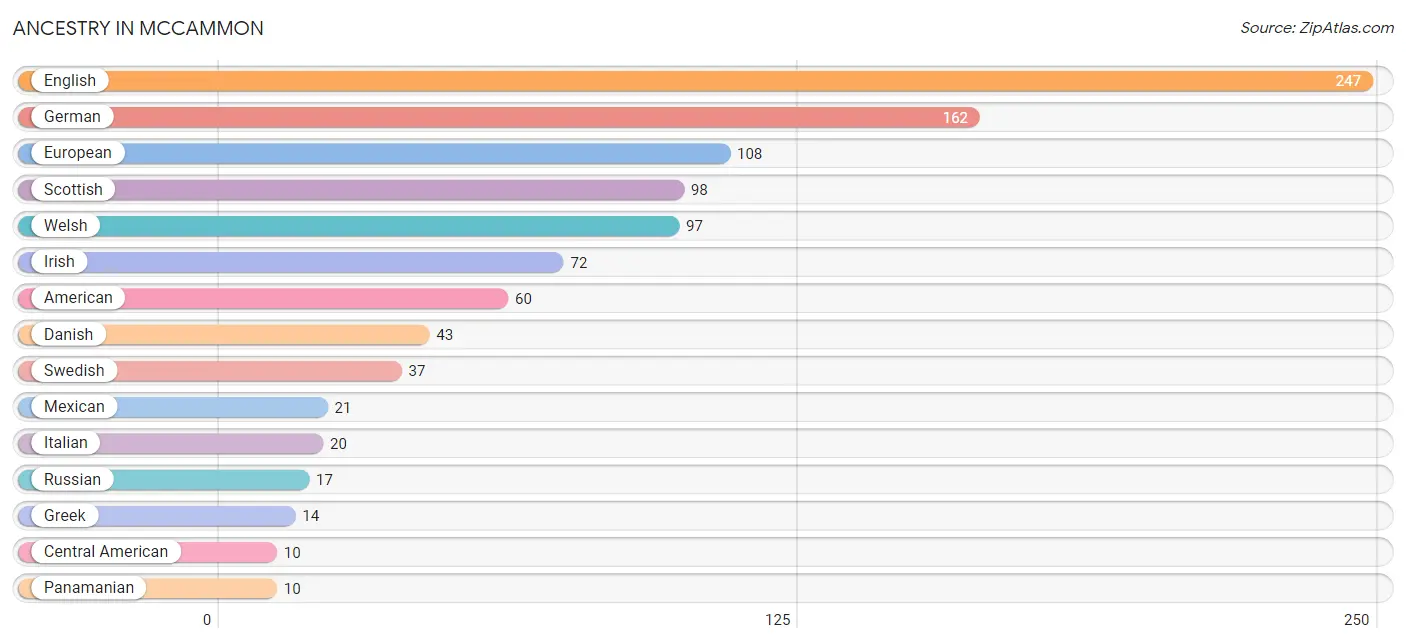
| Ancestry | # Population | % Population |
| American | 60 | 5.9% |
| Basque | 7 | 0.7% |
| British | 7 | 0.7% |
| Central American | 10 | 1.0% |
| Choctaw | 7 | 0.7% |
| Creek | 7 | 0.7% |
| Danish | 43 | 4.2% |
| Dutch | 4 | 0.4% |
| English | 247 | 24.3% |
| European | 108 | 10.6% |
| French Canadian | 6 | 0.6% |
| German | 162 | 15.9% |
| Greek | 14 | 1.4% |
| Icelander | 2 | 0.2% |
| Irish | 72 | 7.1% |
| Italian | 20 | 2.0% |
| Lithuanian | 5 | 0.5% |
| Mexican | 21 | 2.1% |
| Norwegian | 8 | 0.8% |
| Panamanian | 10 | 1.0% |
| Russian | 17 | 1.7% |
| Scotch-Irish | 10 | 1.0% |
| Scottish | 98 | 9.6% |
| Swedish | 37 | 3.6% |
| Swiss | 4 | 0.4% |
| Welsh | 97 | 9.5% | View All 26 Rows |
Immigrants in Mccammon
The most numerous immigrant groups reported in Mccammon came from , and Canada (13 | 1.3%), together accounting for 1.3% of all Mccammon residents.

| Immigration Origin | # Population | % Population |
| Canada | 13 | 1.3% | View All 1 Rows |
Sex and Age in Mccammon
Sex and Age in Mccammon
The most populous age groups in Mccammon are 40 to 44 Years (50 | 10.9%) for men and 65 to 69 Years (62 | 11.1%) for women.
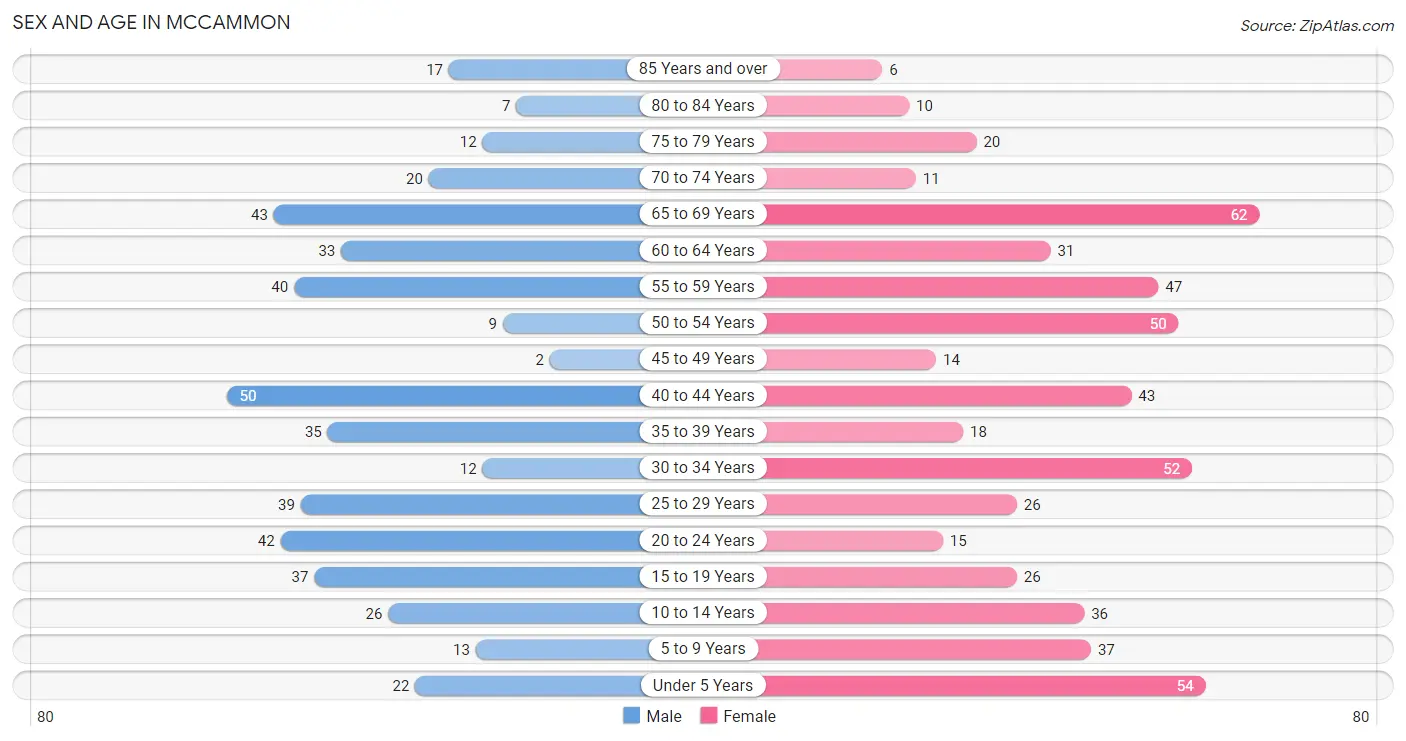
| Age Bracket | Male | Female |
| Under 5 Years | 22 (4.8%) | 54 (9.7%) |
| 5 to 9 Years | 13 (2.8%) | 37 (6.6%) |
| 10 to 14 Years | 26 (5.7%) | 36 (6.5%) |
| 15 to 19 Years | 37 (8.1%) | 26 (4.7%) |
| 20 to 24 Years | 42 (9.1%) | 15 (2.7%) |
| 25 to 29 Years | 39 (8.5%) | 26 (4.7%) |
| 30 to 34 Years | 12 (2.6%) | 52 (9.3%) |
| 35 to 39 Years | 35 (7.6%) | 18 (3.2%) |
| 40 to 44 Years | 50 (10.9%) | 43 (7.7%) |
| 45 to 49 Years | 2 (0.4%) | 14 (2.5%) |
| 50 to 54 Years | 9 (2.0%) | 50 (9.0%) |
| 55 to 59 Years | 40 (8.7%) | 47 (8.4%) |
| 60 to 64 Years | 33 (7.2%) | 31 (5.6%) |
| 65 to 69 Years | 43 (9.4%) | 62 (11.1%) |
| 70 to 74 Years | 20 (4.4%) | 11 (2.0%) |
| 75 to 79 Years | 12 (2.6%) | 20 (3.6%) |
| 80 to 84 Years | 7 (1.5%) | 10 (1.8%) |
| 85 Years and over | 17 (3.7%) | 6 (1.1%) |
| Total | 459 (100.0%) | 558 (100.0%) |
Families and Households in Mccammon
Median Family Size in Mccammon
The median family size in Mccammon is 3.37 persons per family, with single female/mother families (36 | 13.0%) accounting for the largest median family size of 4.33 persons per family. On the other hand, married-couple families (237 | 85.3%) represent the smallest median family size with 3.22 persons per family.
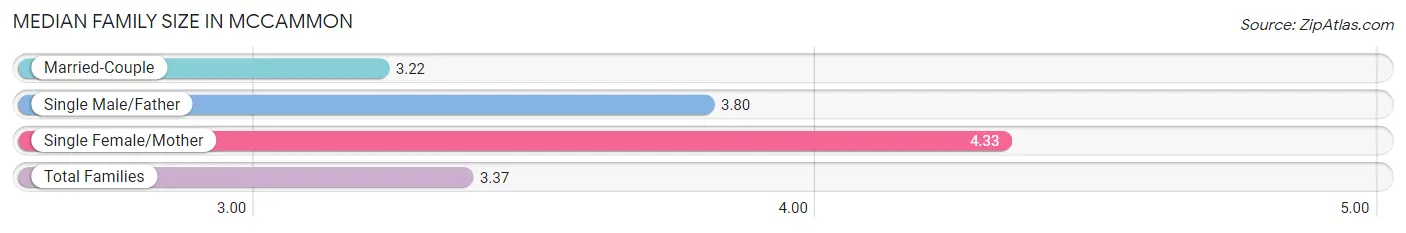
| Family Type | # Families | Family Size |
| Married-Couple | 237 (85.3%) | 3.22 |
| Single Male/Father | 5 (1.8%) | 3.80 |
| Single Female/Mother | 36 (13.0%) | 4.33 |
| Total Families | 278 (100.0%) | 3.37 |
Median Household Size in Mccammon
The median household size in Mccammon is 2.99 persons per household, with single female/mother households (36 | 10.6%) accounting for the largest median household size of 4.67 persons per household. non-family households (62 | 18.2%) represent the smallest median household size with 1.10 persons per household.
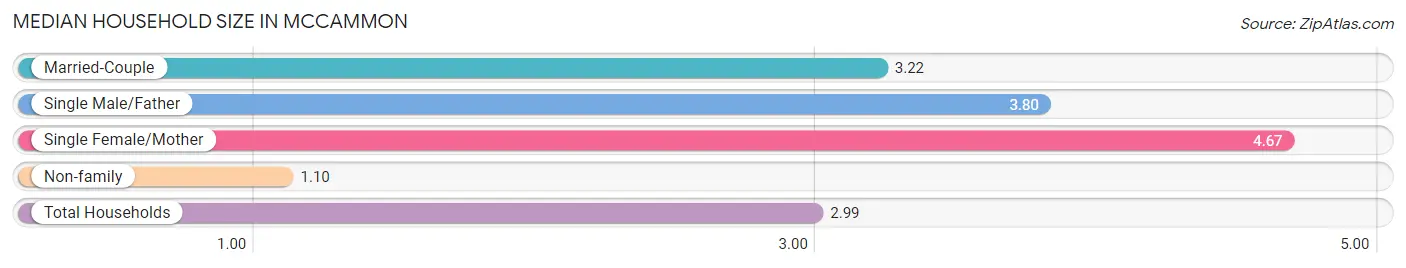
| Household Type | # Households | Household Size |
| Married-Couple | 237 (69.7%) | 3.22 |
| Single Male/Father | 5 (1.5%) | 3.80 |
| Single Female/Mother | 36 (10.6%) | 4.67 |
| Non-family | 62 (18.2%) | 1.10 |
| Total Households | 340 (100.0%) | 2.99 |
Household Size by Marriage Status in Mccammon
Out of a total of 340 households in Mccammon, 278 (81.8%) are family households, while 62 (18.2%) are nonfamily households. The most numerous type of family households are 2-person households, comprising 130, and the most common type of nonfamily households are 1-person households, comprising 58.
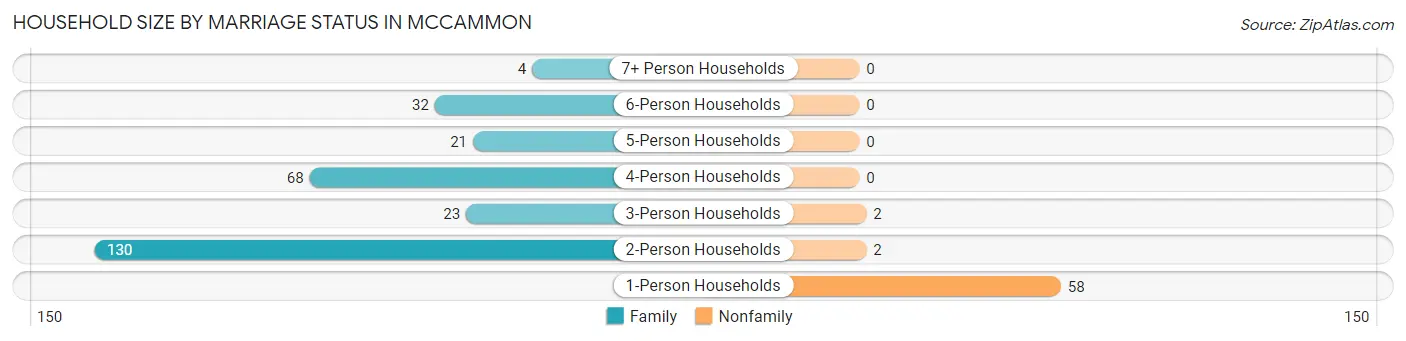
| Household Size | Family Households | Nonfamily Households |
| 1-Person Households | - | 58 (17.1%) |
| 2-Person Households | 130 (38.2%) | 2 (0.6%) |
| 3-Person Households | 23 (6.8%) | 2 (0.6%) |
| 4-Person Households | 68 (20.0%) | 0 (0.0%) |
| 5-Person Households | 21 (6.2%) | 0 (0.0%) |
| 6-Person Households | 32 (9.4%) | 0 (0.0%) |
| 7+ Person Households | 4 (1.2%) | 0 (0.0%) |
| Total | 278 (81.8%) | 62 (18.2%) |
Female Fertility in Mccammon
Fertility by Age in Mccammon
Average fertility rate in Mccammon is 80.0 births per 1,000 women. Women in the age bracket of 20 to 34 years have the highest fertility rate with 183.0 births per 1,000 women. Women in the age bracket of 20 to 34 years acount for 100.0% of all women with births.
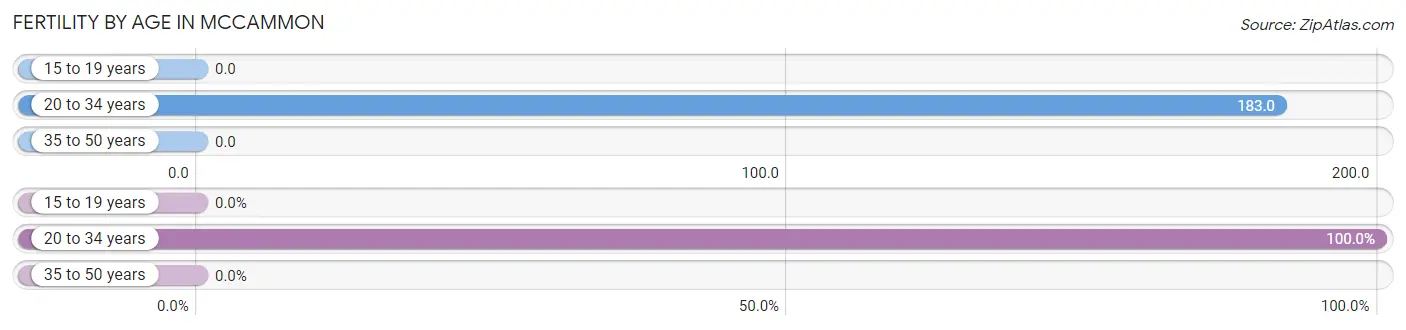
| Age Bracket | Women with Births | Births / 1,000 Women |
| 15 to 19 years | 0 (0.0%) | 0.0 |
| 20 to 34 years | 17 (100.0%) | 183.0 |
| 35 to 50 years | 0 (0.0%) | 0.0 |
| Total | 17 (100.0%) | 80.0 |
Fertility by Age by Marriage Status in Mccammon
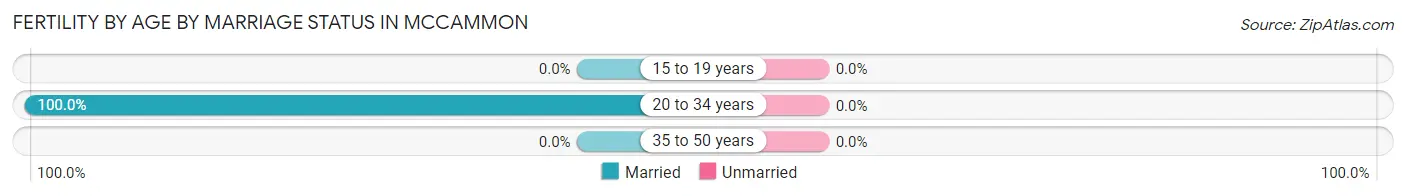
| Age Bracket | Married | Unmarried |
| 15 to 19 years | 0 (0.0%) | 0 (0.0%) |
| 20 to 34 years | 17 (100.0%) | 0 (0.0%) |
| 35 to 50 years | 0 (0.0%) | 0 (0.0%) |
| Total | 17 (100.0%) | 0 (0.0%) |
Fertility by Education in Mccammon
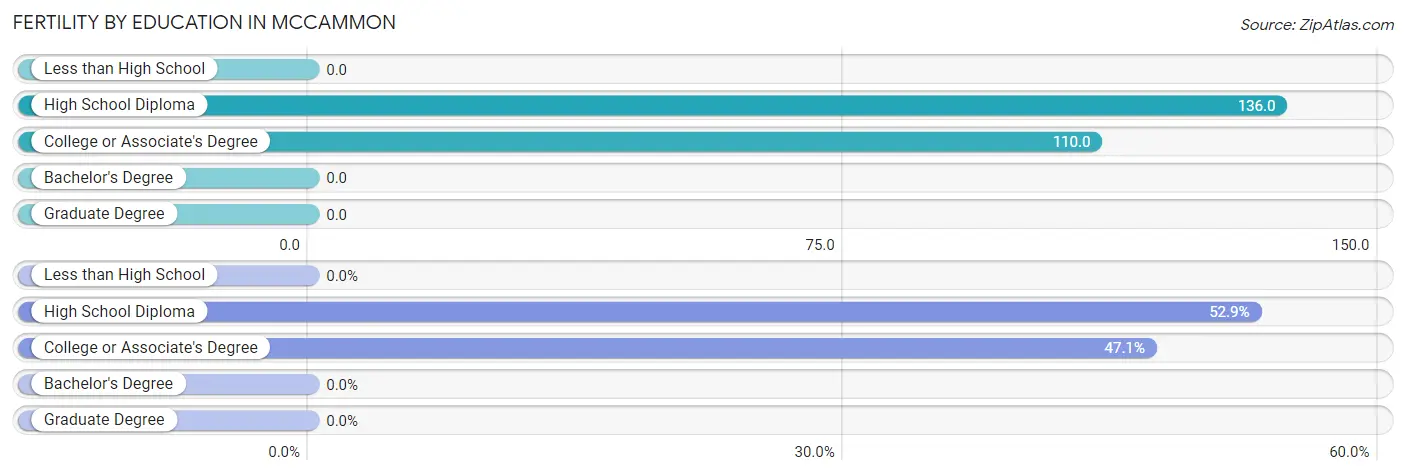
| Educational Attainment | Women with Births | Births / 1,000 Women |
| Less than High School | 0 (0.0%) | 0.0 |
| High School Diploma | 9 (52.9%) | 136.0 |
| College or Associate's Degree | 8 (47.1%) | 110.0 |
| Bachelor's Degree | 0 (0.0%) | 0.0 |
| Graduate Degree | 0 (0.0%) | 0.0 |
| Total | 17 (100.0%) | 80.0 |
Fertility by Education by Marriage Status in Mccammon
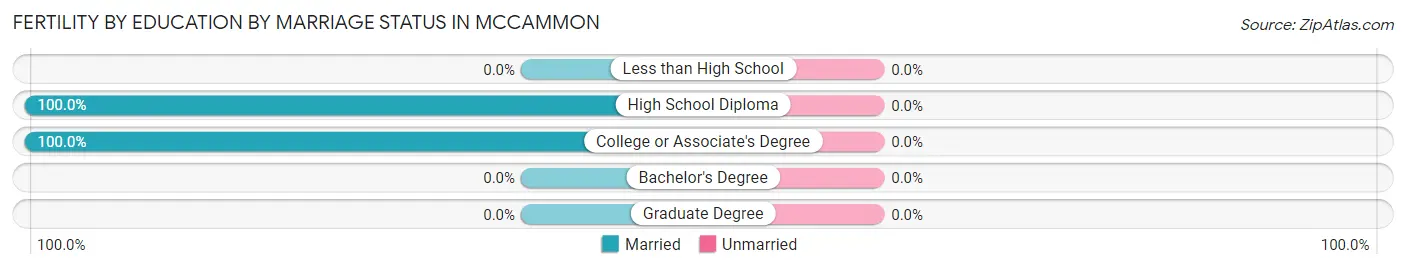
| Educational Attainment | Married | Unmarried |
| Less than High School | 0 (0.0%) | 0 (0.0%) |
| High School Diploma | 9 (100.0%) | 0 (0.0%) |
| College or Associate's Degree | 8 (100.0%) | 0 (0.0%) |
| Bachelor's Degree | 0 (0.0%) | 0 (0.0%) |
| Graduate Degree | 0 (0.0%) | 0 (0.0%) |
| Total | 17 (100.0%) | 0 (0.0%) |
Employment Characteristics in Mccammon
Employment by Class of Employer in Mccammon
Among the 449 employed individuals in Mccammon, private company employees (300 | 66.8%), local government employees (44 | 9.8%), and self-employed (not incorporated) (40 | 8.9%) make up the most common classes of employment.
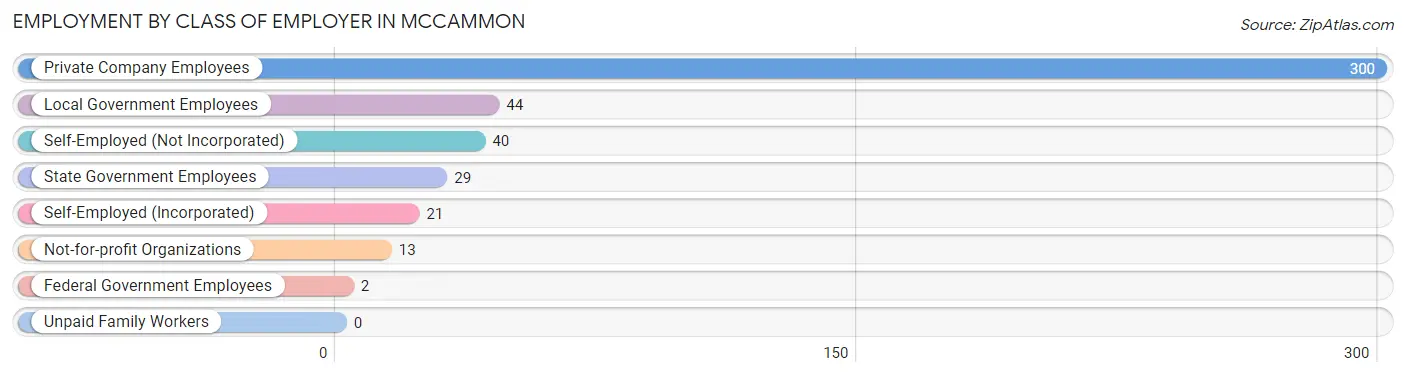
| Employer Class | # Employees | % Employees |
| Private Company Employees | 300 | 66.8% |
| Self-Employed (Incorporated) | 21 | 4.7% |
| Self-Employed (Not Incorporated) | 40 | 8.9% |
| Not-for-profit Organizations | 13 | 2.9% |
| Local Government Employees | 44 | 9.8% |
| State Government Employees | 29 | 6.5% |
| Federal Government Employees | 2 | 0.4% |
| Unpaid Family Workers | 0 | 0.0% |
| Total | 449 | 100.0% |
Employment Status by Age in Mccammon
According to the labor force statistics for Mccammon, out of the total population over 16 years of age (807), 60.3% or 487 individuals are in the labor force, with 5.1% or 25 of them unemployed. The age group with the highest labor force participation rate is 45 to 54 years, with 96.0% or 72 individuals in the labor force. Within the labor force, the 65 to 74 years age range has the highest percentage of unemployed individuals, with 45.8% or 11 of them being unemployed.
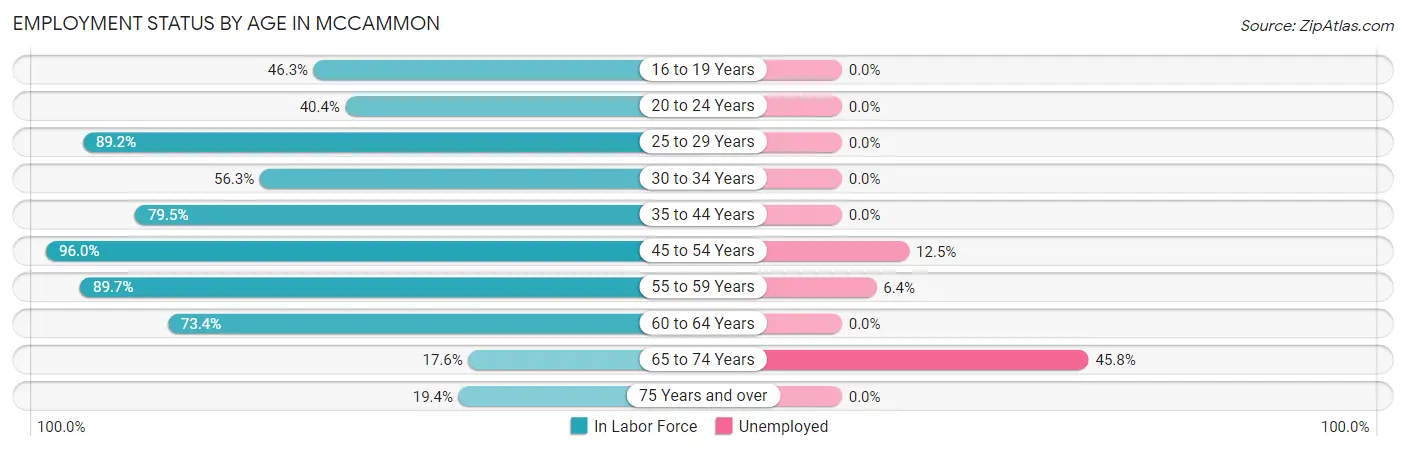
| Age Bracket | In Labor Force | Unemployed |
| 16 to 19 Years | 19 (46.3%) | 0 (0.0%) |
| 20 to 24 Years | 23 (40.4%) | 0 (0.0%) |
| 25 to 29 Years | 58 (89.2%) | 0 (0.0%) |
| 30 to 34 Years | 36 (56.3%) | 0 (0.0%) |
| 35 to 44 Years | 116 (79.5%) | 0 (0.0%) |
| 45 to 54 Years | 72 (96.0%) | 9 (12.5%) |
| 55 to 59 Years | 78 (89.7%) | 5 (6.4%) |
| 60 to 64 Years | 47 (73.4%) | 0 (0.0%) |
| 65 to 74 Years | 24 (17.6%) | 11 (45.8%) |
| 75 Years and over | 14 (19.4%) | 0 (0.0%) |
| Total | 487 (60.3%) | 25 (5.1%) |
Employment Status by Educational Attainment in Mccammon
According to labor force statistics for Mccammon, 81.2% of individuals (407) out of the total population between 25 and 64 years of age (501) are in the labor force, with 3.4% or 14 of them being unemployed. The group with the highest labor force participation rate are those with the educational attainment of bachelor's degree or higher, with 92.2% or 130 individuals in the labor force. Within the labor force, individuals with college / associate degree education have the highest percentage of unemployment, with 8.2% or 13 of them being unemployed.
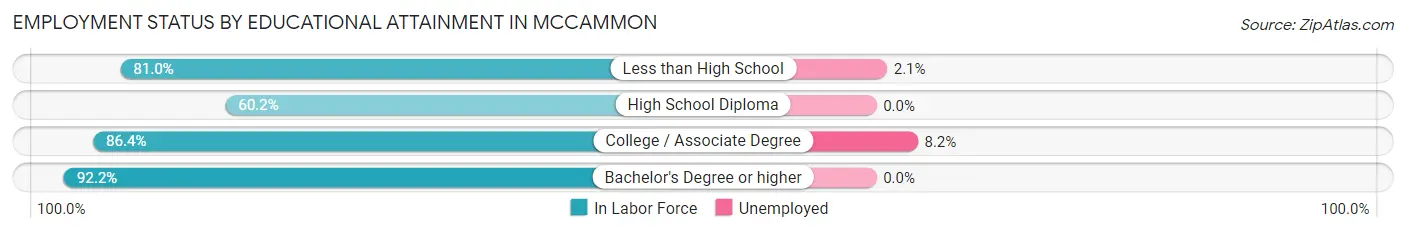
| Educational Attainment | In Labor Force | Unemployed |
| Less than High School | 47 (81.0%) | 1 (2.1%) |
| High School Diploma | 71 (60.2%) | 0 (0.0%) |
| College / Associate Degree | 159 (86.4%) | 15 (8.2%) |
| Bachelor's Degree or higher | 130 (92.2%) | 0 (0.0%) |
| Total | 407 (81.2%) | 17 (3.4%) |
Employment Occupations by Sex in Mccammon
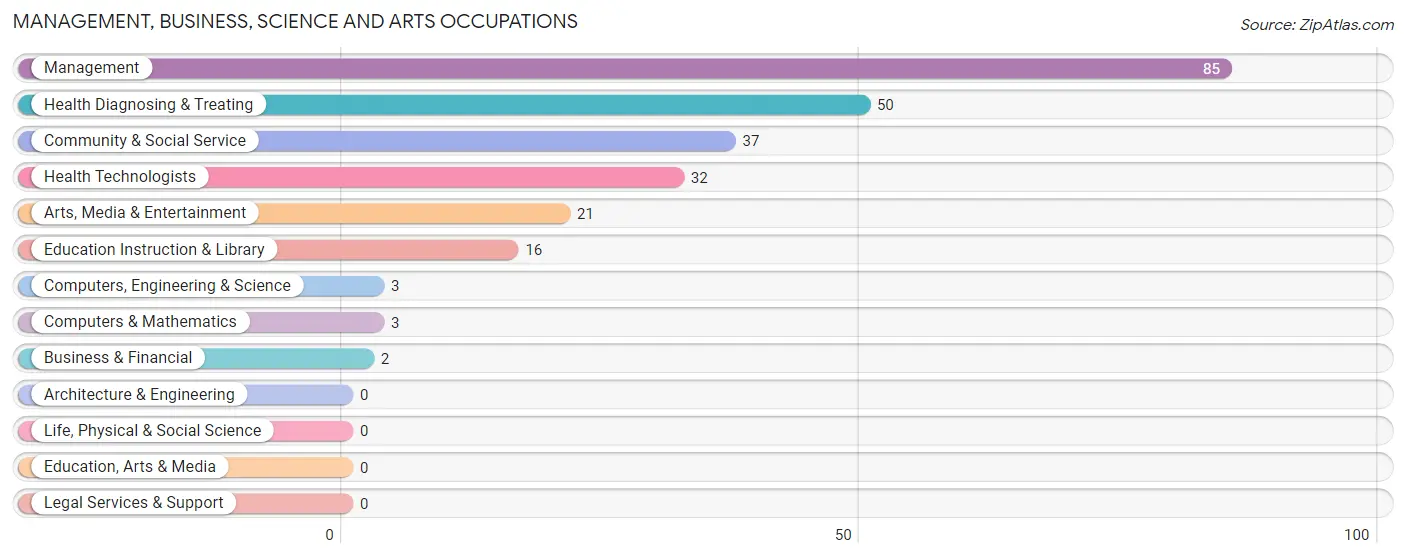
Management, Business, Science and Arts Occupations
The most common Management, Business, Science and Arts occupations in Mccammon are Management (85 | 18.4%), Health Diagnosing & Treating (50 | 10.8%), Community & Social Service (37 | 8.0%), Health Technologists (32 | 6.9%), and Arts, Media & Entertainment (21 | 4.5%).
Management, Business, Science and Arts Occupations by Sex
Within the Management, Business, Science and Arts occupations in Mccammon, the most male-oriented occupations are Computers, Engineering & Science (100.0%), Computers & Mathematics (100.0%), and Management (63.5%), while the most female-oriented occupations are Business & Financial (100.0%), Arts, Media & Entertainment (90.5%), and Community & Social Service (89.2%).
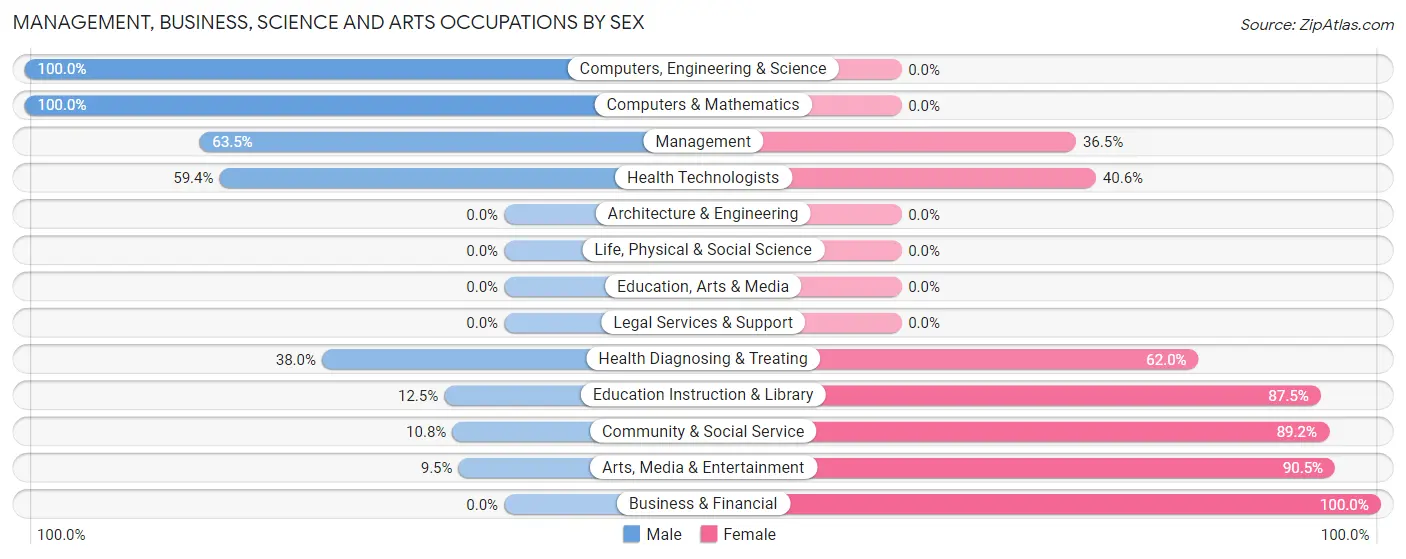
| Occupation | Male | Female |
| Management | 54 (63.5%) | 31 (36.5%) |
| Business & Financial | 0 (0.0%) | 2 (100.0%) |
| Computers, Engineering & Science | 3 (100.0%) | 0 (0.0%) |
| Computers & Mathematics | 3 (100.0%) | 0 (0.0%) |
| Architecture & Engineering | 0 (0.0%) | 0 (0.0%) |
| Life, Physical & Social Science | 0 (0.0%) | 0 (0.0%) |
| Community & Social Service | 4 (10.8%) | 33 (89.2%) |
| Education, Arts & Media | 0 (0.0%) | 0 (0.0%) |
| Legal Services & Support | 0 (0.0%) | 0 (0.0%) |
| Education Instruction & Library | 2 (12.5%) | 14 (87.5%) |
| Arts, Media & Entertainment | 2 (9.5%) | 19 (90.5%) |
| Health Diagnosing & Treating | 19 (38.0%) | 31 (62.0%) |
| Health Technologists | 19 (59.4%) | 13 (40.6%) |
| Total (Category) | 80 (45.2%) | 97 (54.8%) |
| Total (Overall) | 252 (54.5%) | 210 (45.5%) |
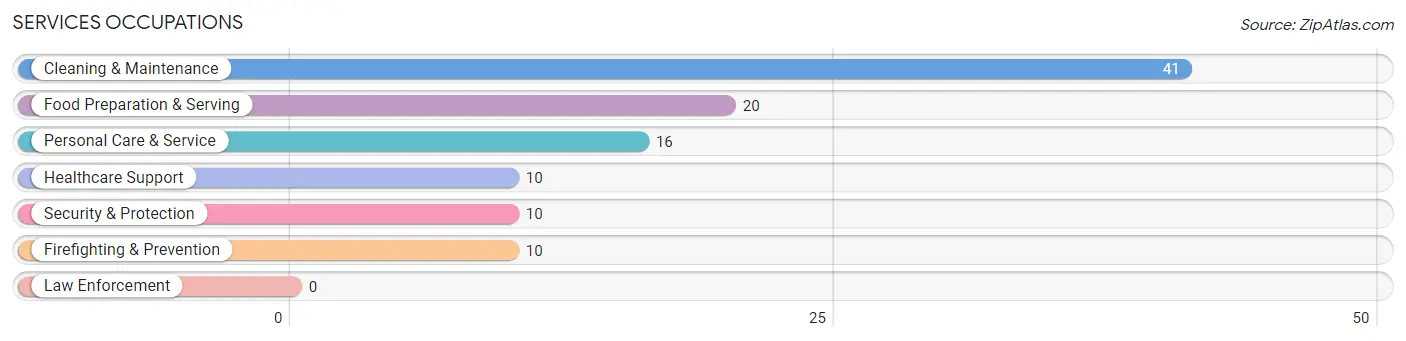
Services Occupations
The most common Services occupations in Mccammon are Cleaning & Maintenance (41 | 8.9%), Food Preparation & Serving (20 | 4.3%), Personal Care & Service (16 | 3.5%), Healthcare Support (10 | 2.2%), and Security & Protection (10 | 2.2%).
Services Occupations by Sex
Within the Services occupations in Mccammon, the most male-oriented occupations are Food Preparation & Serving (80.0%), Cleaning & Maintenance (56.1%), and Healthcare Support (20.0%), while the most female-oriented occupations are Security & Protection (100.0%), Firefighting & Prevention (100.0%), and Personal Care & Service (100.0%).
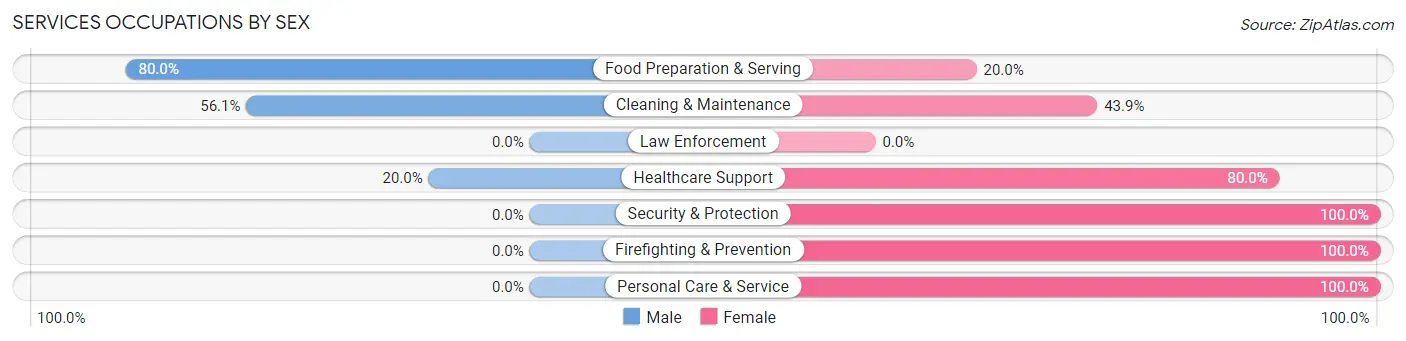
| Occupation | Male | Female |
| Healthcare Support | 2 (20.0%) | 8 (80.0%) |
| Security & Protection | 0 (0.0%) | 10 (100.0%) |
| Firefighting & Prevention | 0 (0.0%) | 10 (100.0%) |
| Law Enforcement | 0 (0.0%) | 0 (0.0%) |
| Food Preparation & Serving | 16 (80.0%) | 4 (20.0%) |
| Cleaning & Maintenance | 23 (56.1%) | 18 (43.9%) |
| Personal Care & Service | 0 (0.0%) | 16 (100.0%) |
| Total (Category) | 41 (42.3%) | 56 (57.7%) |
| Total (Overall) | 252 (54.5%) | 210 (45.5%) |
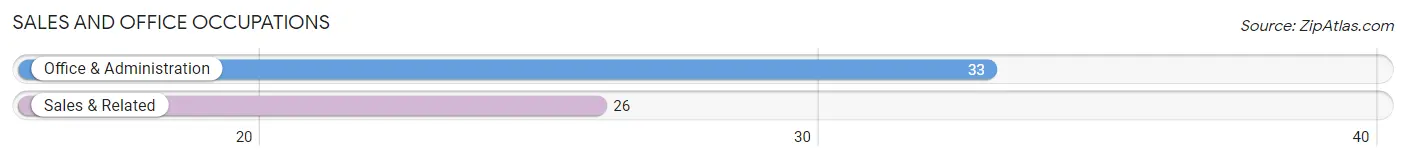
Sales and Office Occupations
The most common Sales and Office occupations in Mccammon are Office & Administration (33 | 7.1%), and Sales & Related (26 | 5.6%).
Sales and Office Occupations by Sex
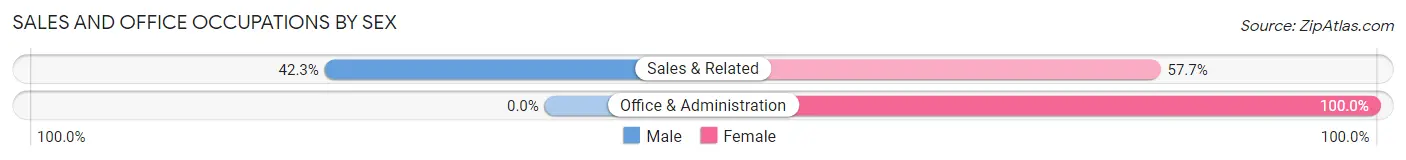
| Occupation | Male | Female |
| Sales & Related | 11 (42.3%) | 15 (57.7%) |
| Office & Administration | 0 (0.0%) | 33 (100.0%) |
| Total (Category) | 11 (18.6%) | 48 (81.4%) |
| Total (Overall) | 252 (54.5%) | 210 (45.5%) |
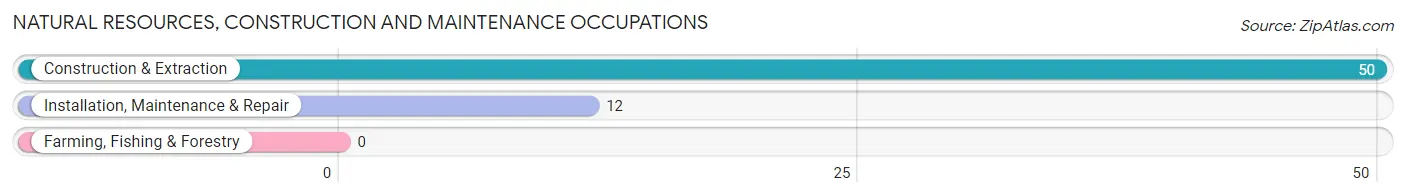
Natural Resources, Construction and Maintenance Occupations
The most common Natural Resources, Construction and Maintenance occupations in Mccammon are Construction & Extraction (50 | 10.8%), and Installation, Maintenance & Repair (12 | 2.6%).
Natural Resources, Construction and Maintenance Occupations by Sex
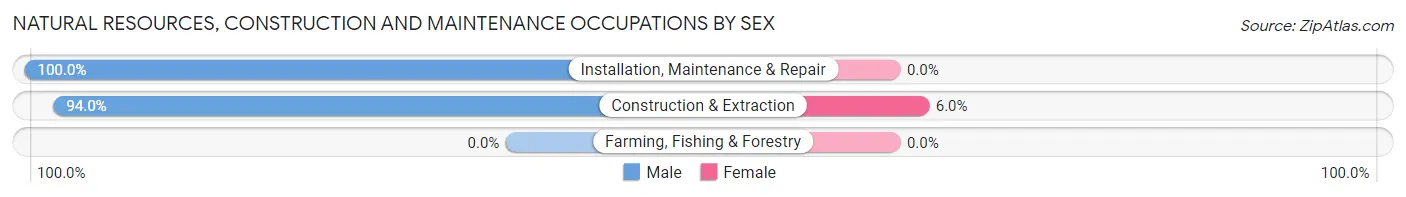
| Occupation | Male | Female |
| Farming, Fishing & Forestry | 0 (0.0%) | 0 (0.0%) |
| Construction & Extraction | 47 (94.0%) | 3 (6.0%) |
| Installation, Maintenance & Repair | 12 (100.0%) | 0 (0.0%) |
| Total (Category) | 59 (95.2%) | 3 (4.8%) |
| Total (Overall) | 252 (54.5%) | 210 (45.5%) |
Production, Transportation and Moving Occupations
The most common Production, Transportation and Moving occupations in Mccammon are Production (40 | 8.7%), Material Moving (14 | 3.0%), and Transportation (13 | 2.8%).
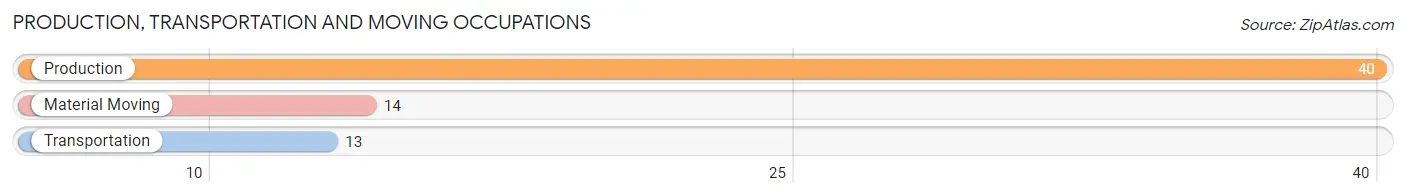
Production, Transportation and Moving Occupations by Sex
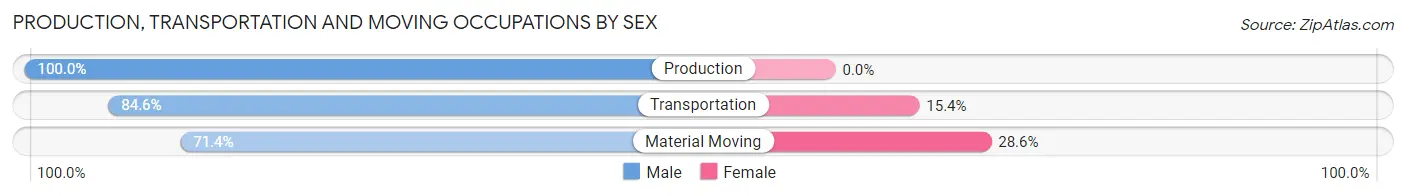
| Occupation | Male | Female |
| Production | 40 (100.0%) | 0 (0.0%) |
| Transportation | 11 (84.6%) | 2 (15.4%) |
| Material Moving | 10 (71.4%) | 4 (28.6%) |
| Total (Category) | 61 (91.0%) | 6 (9.0%) |
| Total (Overall) | 252 (54.5%) | 210 (45.5%) |
Employment Industries by Sex in Mccammon
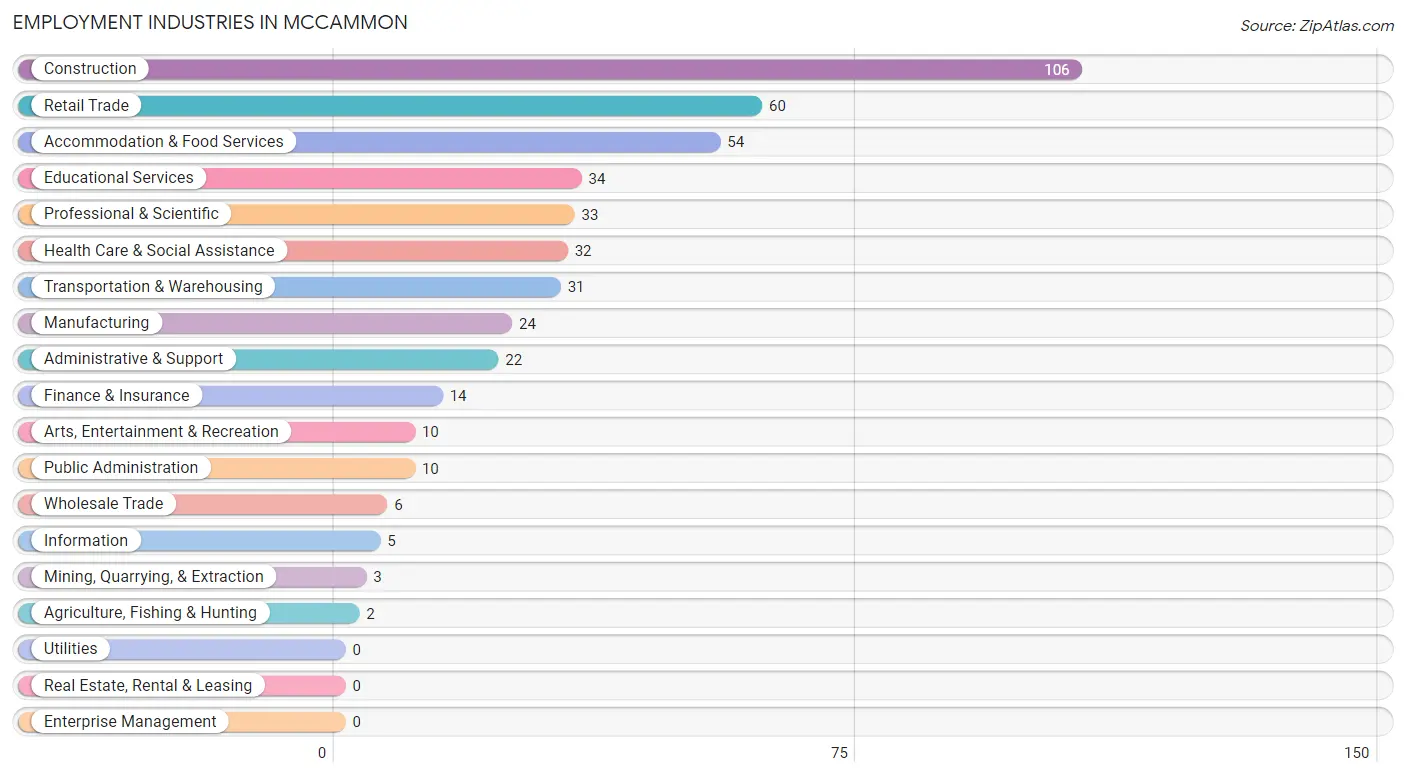
Employment Industries in Mccammon
The major employment industries in Mccammon include Construction (106 | 22.9%), Retail Trade (60 | 13.0%), Accommodation & Food Services (54 | 11.7%), Educational Services (34 | 7.4%), and Professional & Scientific (33 | 7.1%).
Employment Industries by Sex in Mccammon
The Mccammon industries that see more men than women are Agriculture, Fishing & Hunting (100.0%), Construction (100.0%), and Wholesale Trade (100.0%), whereas the industries that tend to have a higher number of women are Mining, Quarrying, & Extraction (100.0%), Arts, Entertainment & Recreation (100.0%), and Health Care & Social Assistance (93.8%).
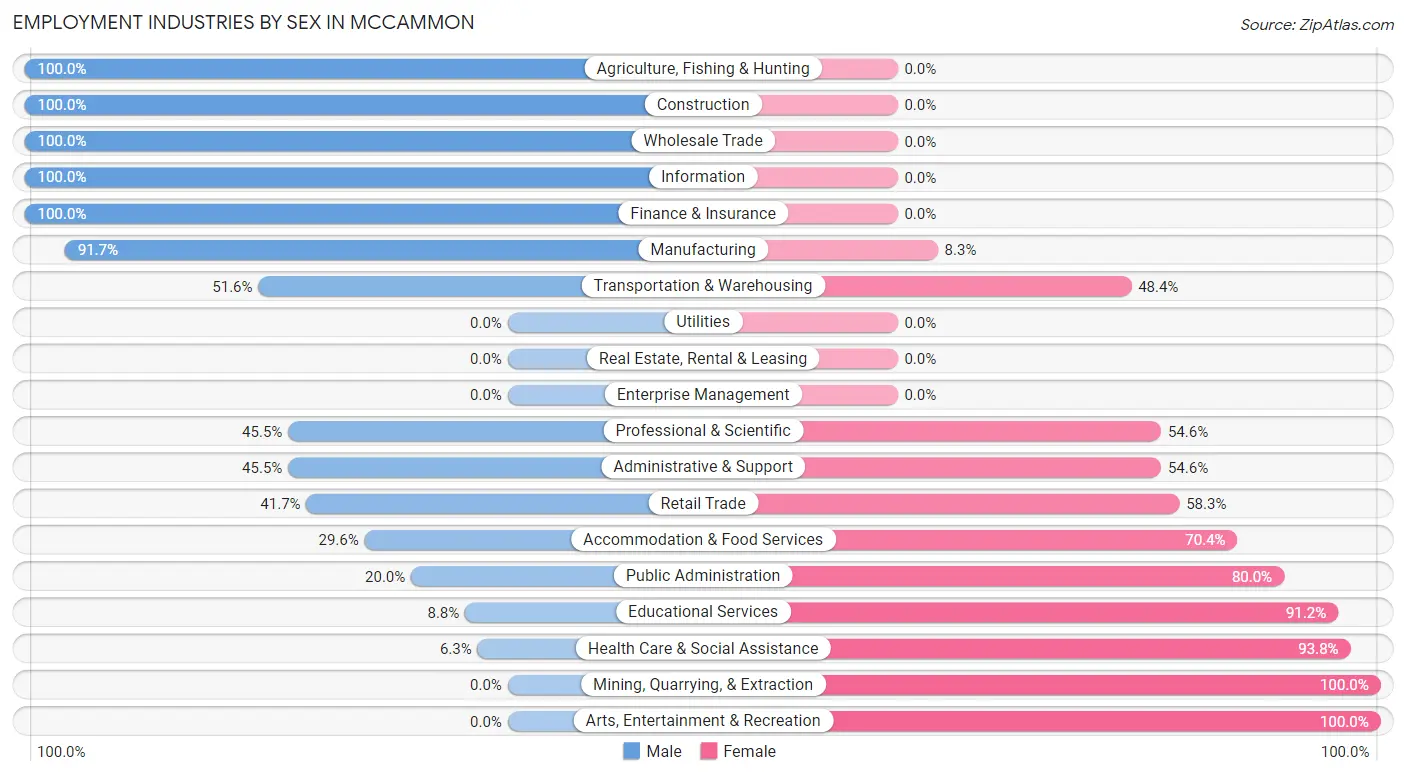
| Industry | Male | Female |
| Agriculture, Fishing & Hunting | 2 (100.0%) | 0 (0.0%) |
| Mining, Quarrying, & Extraction | 0 (0.0%) | 3 (100.0%) |
| Construction | 106 (100.0%) | 0 (0.0%) |
| Manufacturing | 22 (91.7%) | 2 (8.3%) |
| Wholesale Trade | 6 (100.0%) | 0 (0.0%) |
| Retail Trade | 25 (41.7%) | 35 (58.3%) |
| Transportation & Warehousing | 16 (51.6%) | 15 (48.4%) |
| Utilities | 0 (0.0%) | 0 (0.0%) |
| Information | 5 (100.0%) | 0 (0.0%) |
| Finance & Insurance | 14 (100.0%) | 0 (0.0%) |
| Real Estate, Rental & Leasing | 0 (0.0%) | 0 (0.0%) |
| Professional & Scientific | 15 (45.5%) | 18 (54.5%) |
| Enterprise Management | 0 (0.0%) | 0 (0.0%) |
| Administrative & Support | 10 (45.5%) | 12 (54.5%) |
| Educational Services | 3 (8.8%) | 31 (91.2%) |
| Health Care & Social Assistance | 2 (6.2%) | 30 (93.8%) |
| Arts, Entertainment & Recreation | 0 (0.0%) | 10 (100.0%) |
| Accommodation & Food Services | 16 (29.6%) | 38 (70.4%) |
| Public Administration | 2 (20.0%) | 8 (80.0%) |
| Total | 252 (54.5%) | 210 (45.5%) |
Education in Mccammon
School Enrollment in Mccammon
The most common levels of schooling among the 239 students in Mccammon are high school (73 | 30.5%), middle school (45 | 18.8%), and college / undergraduate (38 | 15.9%).
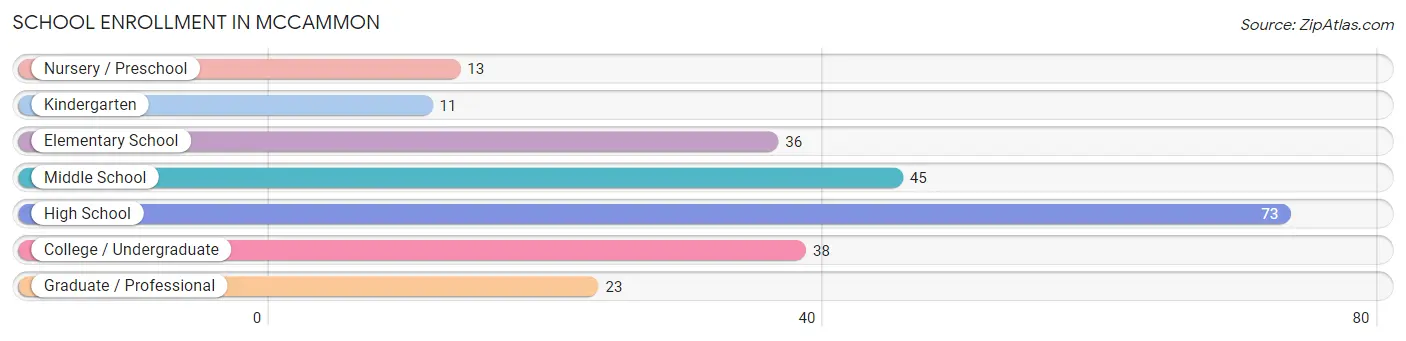
| School Level | # Students | % Students |
| Nursery / Preschool | 13 | 5.4% |
| Kindergarten | 11 | 4.6% |
| Elementary School | 36 | 15.1% |
| Middle School | 45 | 18.8% |
| High School | 73 | 30.5% |
| College / Undergraduate | 38 | 15.9% |
| Graduate / Professional | 23 | 9.6% |
| Total | 239 | 100.0% |
School Enrollment by Age by Funding Source in Mccammon
Out of a total of 239 students who are enrolled in schools in Mccammon, 19 (7.9%) attend a private institution, while the remaining 220 (92.1%) are enrolled in public schools. The age group of 3 to 4 year olds has the highest likelihood of being enrolled in private schools, with 10 (76.9% in the age bracket) enrolled. Conversely, the age group of 15 to 17 year olds has the lowest likelihood of being enrolled in a private school, with 46 (100.0% in the age bracket) attending a public institution.
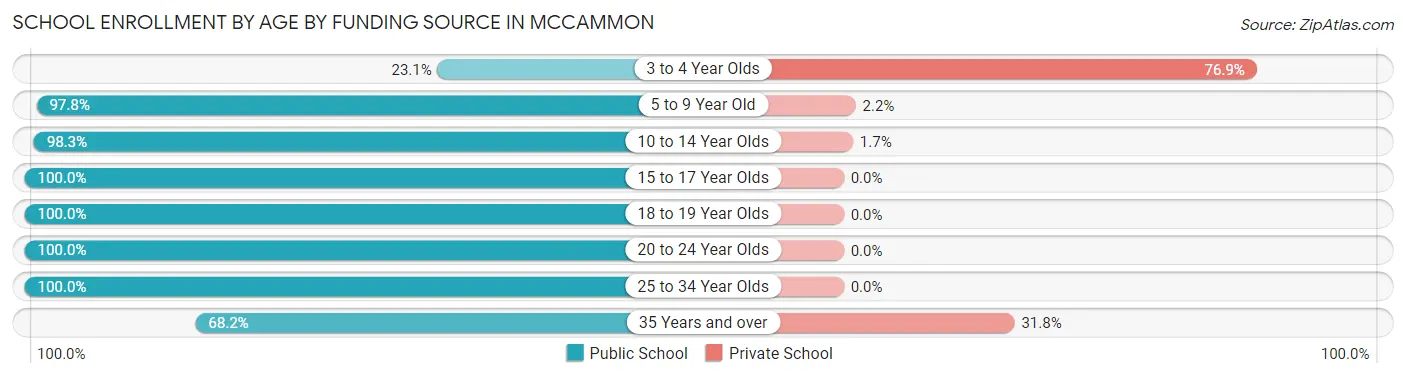
| Age Bracket | Public School | Private School |
| 3 to 4 Year Olds | 3 (23.1%) | 10 (76.9%) |
| 5 to 9 Year Old | 44 (97.8%) | 1 (2.2%) |
| 10 to 14 Year Olds | 57 (98.3%) | 1 (1.7%) |
| 15 to 17 Year Olds | 46 (100.0%) | 0 (0.0%) |
| 18 to 19 Year Olds | 14 (100.0%) | 0 (0.0%) |
| 20 to 24 Year Olds | 5 (100.0%) | 0 (0.0%) |
| 25 to 34 Year Olds | 36 (100.0%) | 0 (0.0%) |
| 35 Years and over | 15 (68.2%) | 7 (31.8%) |
| Total | 220 (92.1%) | 19 (7.9%) |
Educational Attainment by Field of Study in Mccammon
Science & technology (36 | 15.9%), business (28 | 12.3%), social sciences (23 | 10.1%), literature & languages (22 | 9.7%), and bio, nature & agricultural (20 | 8.8%) are the most common fields of study among 227 individuals in Mccammon who have obtained a bachelor's degree or higher.
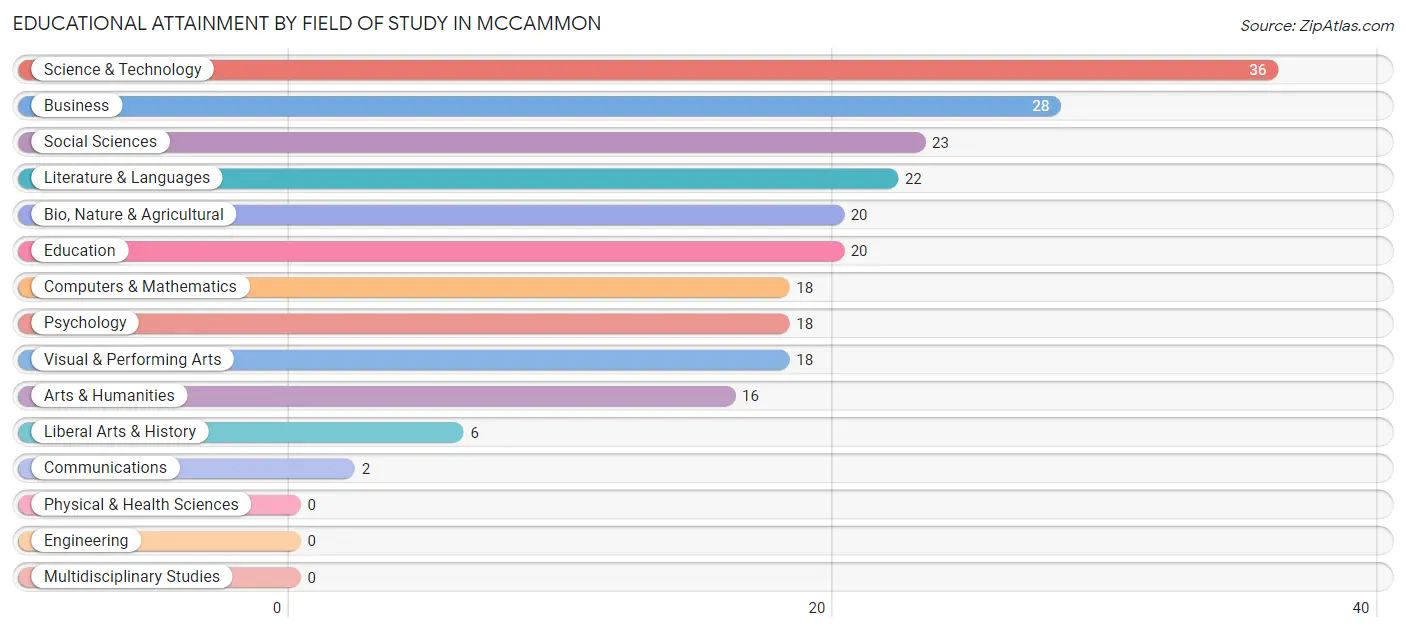
| Field of Study | # Graduates | % Graduates |
| Computers & Mathematics | 18 | 7.9% |
| Bio, Nature & Agricultural | 20 | 8.8% |
| Physical & Health Sciences | 0 | 0.0% |
| Psychology | 18 | 7.9% |
| Social Sciences | 23 | 10.1% |
| Engineering | 0 | 0.0% |
| Multidisciplinary Studies | 0 | 0.0% |
| Science & Technology | 36 | 15.9% |
| Business | 28 | 12.3% |
| Education | 20 | 8.8% |
| Literature & Languages | 22 | 9.7% |
| Liberal Arts & History | 6 | 2.6% |
| Visual & Performing Arts | 18 | 7.9% |
| Communications | 2 | 0.9% |
| Arts & Humanities | 16 | 7.0% |
| Total | 227 | 100.0% |
Transportation & Commute in Mccammon
Vehicle Availability by Sex in Mccammon
The most prevalent vehicle ownership categories in Mccammon are males with 2 vehicles (74, accounting for 31.0%) and females with 2 vehicles (55, making up 35.2%).
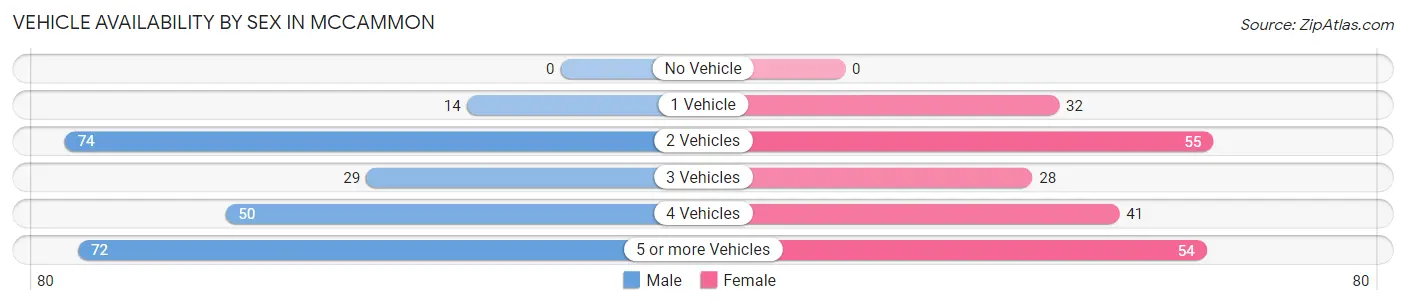
| Vehicles Available | Male | Female |
| No Vehicle | 0 (0.0%) | 0 (0.0%) |
| 1 Vehicle | 14 (5.9%) | 32 (15.2%) |
| 2 Vehicles | 74 (31.0%) | 55 (26.2%) |
| 3 Vehicles | 29 (12.1%) | 28 (13.3%) |
| 4 Vehicles | 50 (20.9%) | 41 (19.5%) |
| 5 or more Vehicles | 72 (30.1%) | 54 (25.7%) |
| Total | 239 (100.0%) | 210 (100.0%) |
Commute Time in Mccammon
The most frequently occuring commute durations in Mccammon are 30 to 34 minutes (84 commuters, 19.0%), 25 to 29 minutes (62 commuters, 14.0%), and 20 to 24 minutes (55 commuters, 12.4%).
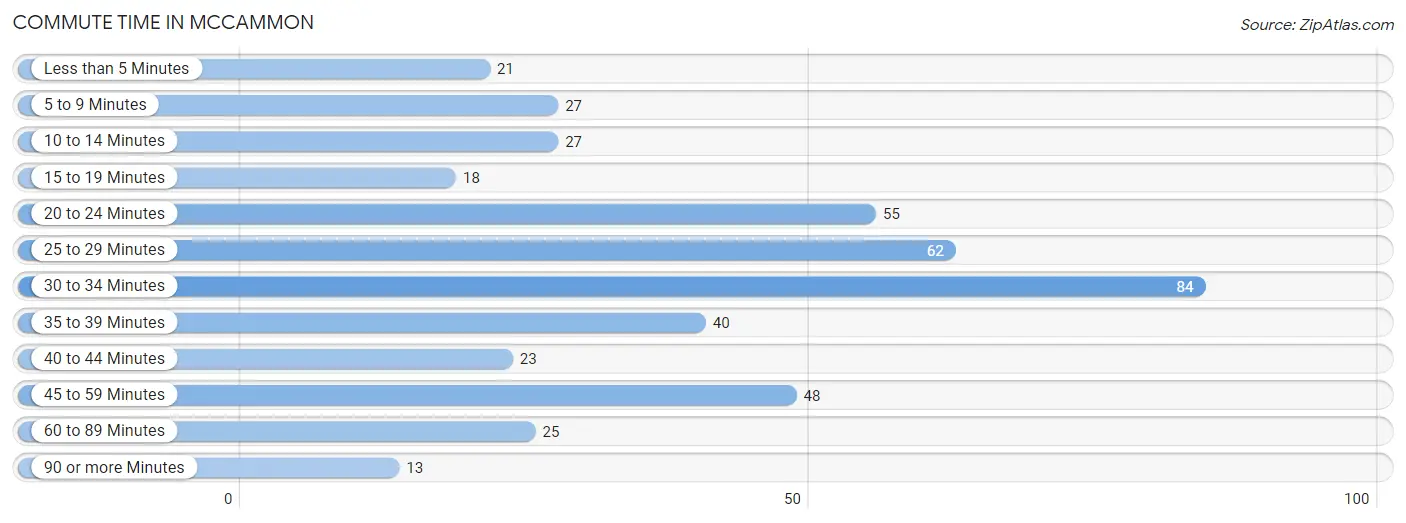
| Commute Time | # Commuters | % Commuters |
| Less than 5 Minutes | 21 | 4.7% |
| 5 to 9 Minutes | 27 | 6.1% |
| 10 to 14 Minutes | 27 | 6.1% |
| 15 to 19 Minutes | 18 | 4.1% |
| 20 to 24 Minutes | 55 | 12.4% |
| 25 to 29 Minutes | 62 | 14.0% |
| 30 to 34 Minutes | 84 | 19.0% |
| 35 to 39 Minutes | 40 | 9.0% |
| 40 to 44 Minutes | 23 | 5.2% |
| 45 to 59 Minutes | 48 | 10.8% |
| 60 to 89 Minutes | 25 | 5.6% |
| 90 or more Minutes | 13 | 2.9% |
Commute Time by Sex in Mccammon
The most common commute times in Mccammon are 30 to 34 minutes (47 commuters, 19.9%) for males and 25 to 29 minutes (41 commuters, 19.8%) for females.
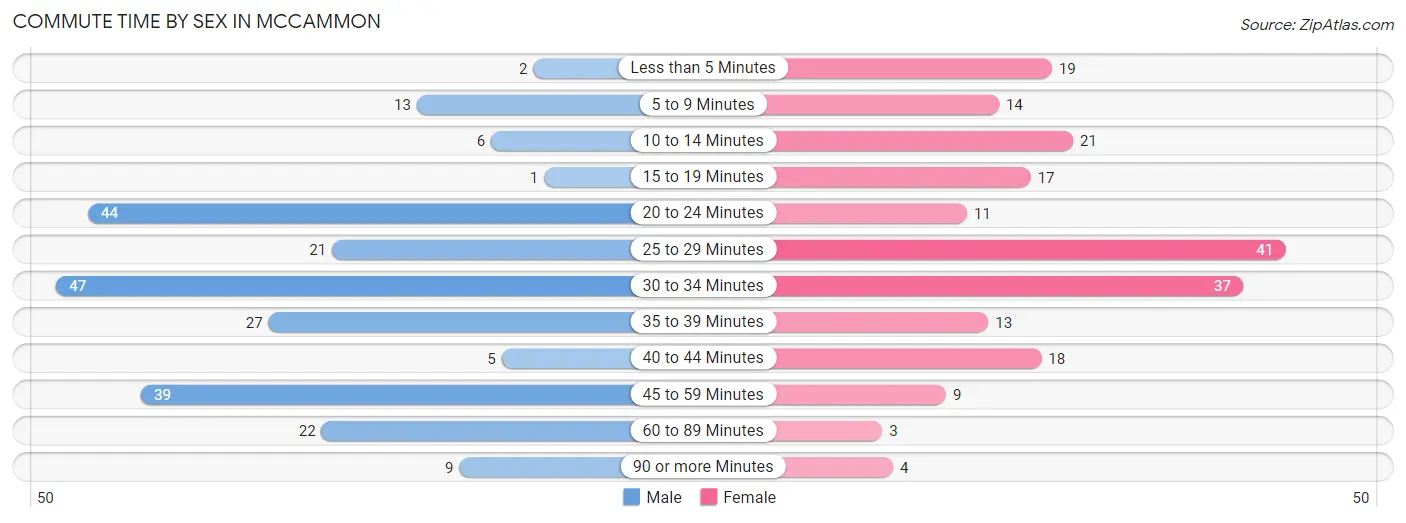
| Commute Time | Male | Female |
| Less than 5 Minutes | 2 (0.9%) | 19 (9.2%) |
| 5 to 9 Minutes | 13 (5.5%) | 14 (6.8%) |
| 10 to 14 Minutes | 6 (2.5%) | 21 (10.1%) |
| 15 to 19 Minutes | 1 (0.4%) | 17 (8.2%) |
| 20 to 24 Minutes | 44 (18.6%) | 11 (5.3%) |
| 25 to 29 Minutes | 21 (8.9%) | 41 (19.8%) |
| 30 to 34 Minutes | 47 (19.9%) | 37 (17.9%) |
| 35 to 39 Minutes | 27 (11.4%) | 13 (6.3%) |
| 40 to 44 Minutes | 5 (2.1%) | 18 (8.7%) |
| 45 to 59 Minutes | 39 (16.5%) | 9 (4.3%) |
| 60 to 89 Minutes | 22 (9.3%) | 3 (1.5%) |
| 90 or more Minutes | 9 (3.8%) | 4 (1.9%) |
Time of Departure to Work by Sex in Mccammon
The most frequent times of departure to work in Mccammon are 6:00 AM to 6:29 AM (57, 24.1%) for males and 8:00 AM to 8:29 AM (37, 17.9%) for females.
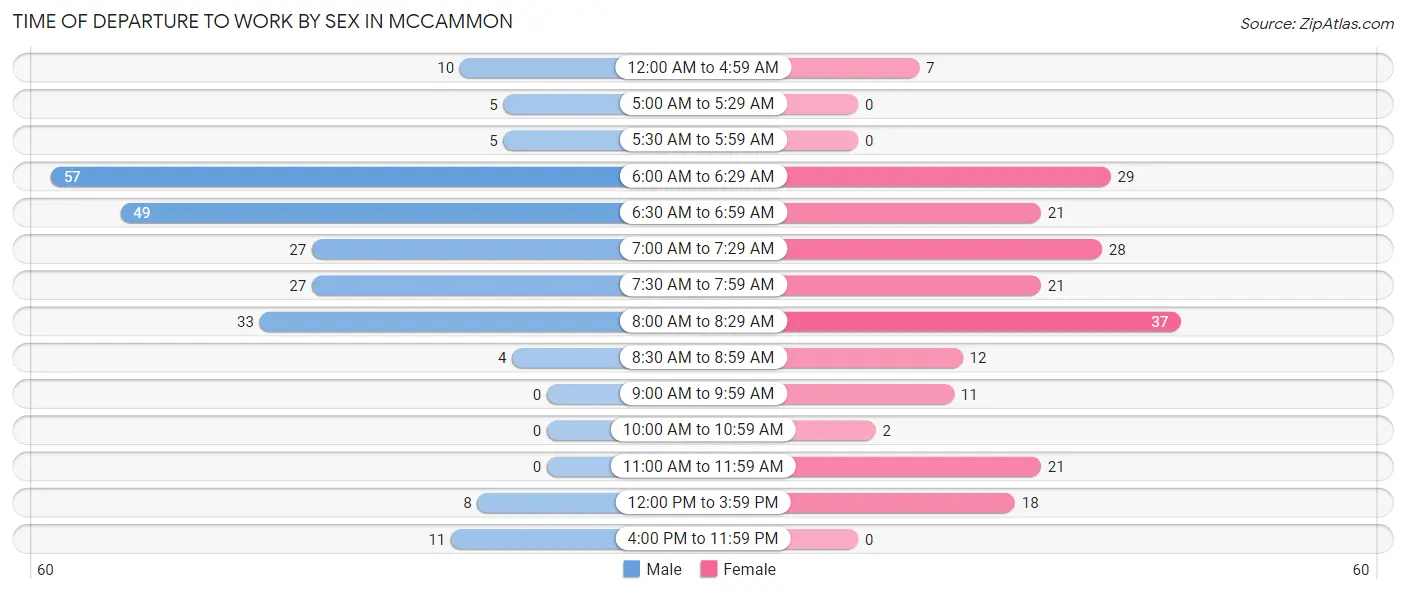
| Time of Departure | Male | Female |
| 12:00 AM to 4:59 AM | 10 (4.2%) | 7 (3.4%) |
| 5:00 AM to 5:29 AM | 5 (2.1%) | 0 (0.0%) |
| 5:30 AM to 5:59 AM | 5 (2.1%) | 0 (0.0%) |
| 6:00 AM to 6:29 AM | 57 (24.1%) | 29 (14.0%) |
| 6:30 AM to 6:59 AM | 49 (20.8%) | 21 (10.1%) |
| 7:00 AM to 7:29 AM | 27 (11.4%) | 28 (13.5%) |
| 7:30 AM to 7:59 AM | 27 (11.4%) | 21 (10.1%) |
| 8:00 AM to 8:29 AM | 33 (14.0%) | 37 (17.9%) |
| 8:30 AM to 8:59 AM | 4 (1.7%) | 12 (5.8%) |
| 9:00 AM to 9:59 AM | 0 (0.0%) | 11 (5.3%) |
| 10:00 AM to 10:59 AM | 0 (0.0%) | 2 (1.0%) |
| 11:00 AM to 11:59 AM | 0 (0.0%) | 21 (10.1%) |
| 12:00 PM to 3:59 PM | 8 (3.4%) | 18 (8.7%) |
| 4:00 PM to 11:59 PM | 11 (4.7%) | 0 (0.0%) |
| Total | 236 (100.0%) | 207 (100.0%) |
Housing Occupancy in Mccammon
Occupancy by Ownership in Mccammon
Of the total 340 dwellings in Mccammon, owner-occupied units account for 268 (78.8%), while renter-occupied units make up 72 (21.2%).
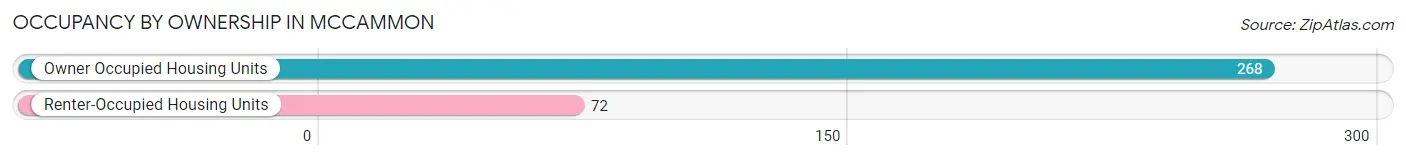
| Occupancy | # Housing Units | % Housing Units |
| Owner Occupied Housing Units | 268 | 78.8% |
| Renter-Occupied Housing Units | 72 | 21.2% |
| Total Occupied Housing Units | 340 | 100.0% |
Occupancy by Household Size in Mccammon
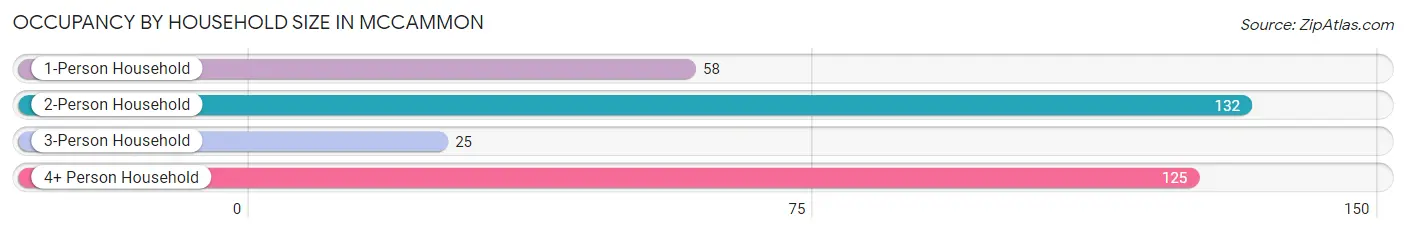
| Household Size | # Housing Units | % Housing Units |
| 1-Person Household | 58 | 17.1% |
| 2-Person Household | 132 | 38.8% |
| 3-Person Household | 25 | 7.3% |
| 4+ Person Household | 125 | 36.8% |
| Total Housing Units | 340 | 100.0% |
Occupancy by Ownership by Household Size in Mccammon
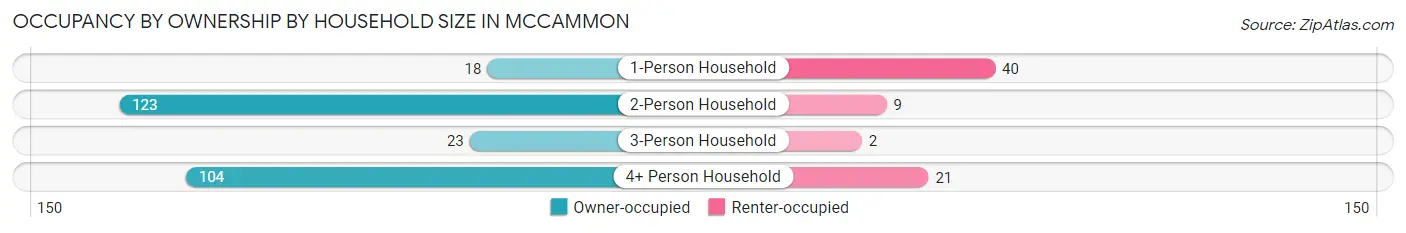
| Household Size | Owner-occupied | Renter-occupied |
| 1-Person Household | 18 (31.0%) | 40 (69.0%) |
| 2-Person Household | 123 (93.2%) | 9 (6.8%) |
| 3-Person Household | 23 (92.0%) | 2 (8.0%) |
| 4+ Person Household | 104 (83.2%) | 21 (16.8%) |
| Total Housing Units | 268 (78.8%) | 72 (21.2%) |
Occupancy by Educational Attainment in Mccammon
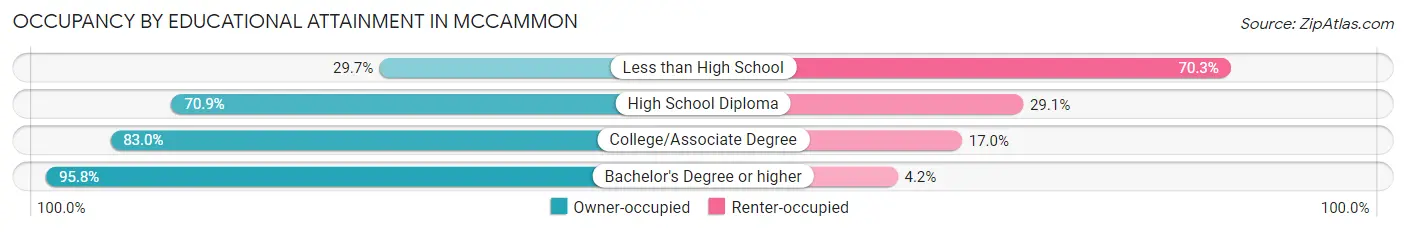
| Household Size | Owner-occupied | Renter-occupied |
| Less than High School | 11 (29.7%) | 26 (70.3%) |
| High School Diploma | 56 (70.9%) | 23 (29.1%) |
| College/Associate Degree | 88 (83.0%) | 18 (17.0%) |
| Bachelor's Degree or higher | 113 (95.8%) | 5 (4.2%) |
Occupancy by Age of Householder in Mccammon
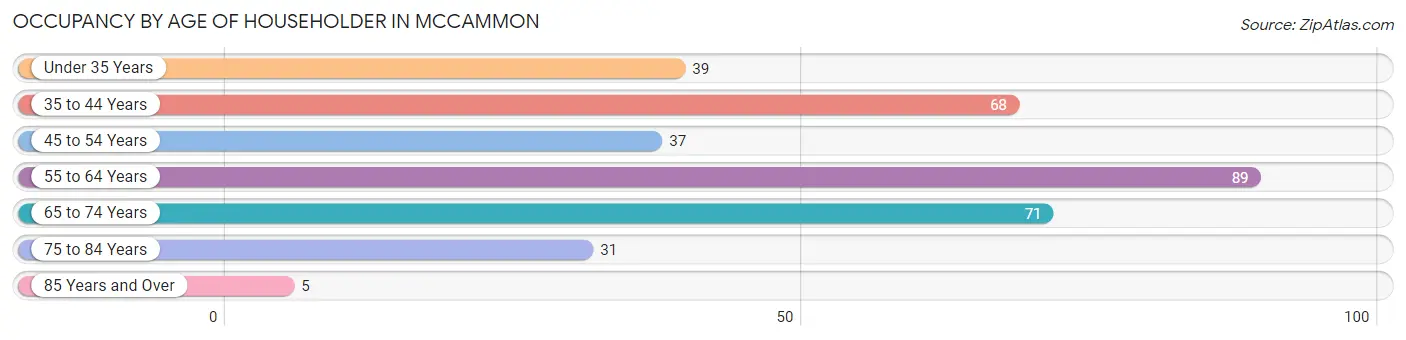
| Age Bracket | # Households | % Households |
| Under 35 Years | 39 | 11.5% |
| 35 to 44 Years | 68 | 20.0% |
| 45 to 54 Years | 37 | 10.9% |
| 55 to 64 Years | 89 | 26.2% |
| 65 to 74 Years | 71 | 20.9% |
| 75 to 84 Years | 31 | 9.1% |
| 85 Years and Over | 5 | 1.5% |
| Total | 340 | 100.0% |
Housing Finances in Mccammon
Median Income by Occupancy in Mccammon
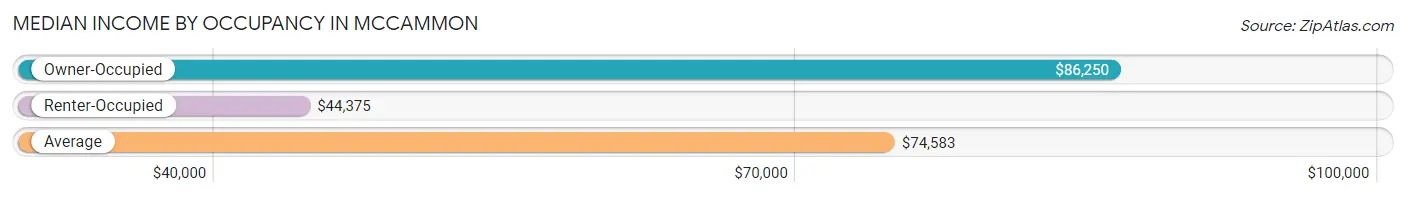
| Occupancy Type | # Households | Median Income |
| Owner-Occupied | 268 (78.8%) | $86,250 |
| Renter-Occupied | 72 (21.2%) | $44,375 |
| Average | 340 (100.0%) | $74,583 |
Occupancy by Householder Income Bracket in Mccammon
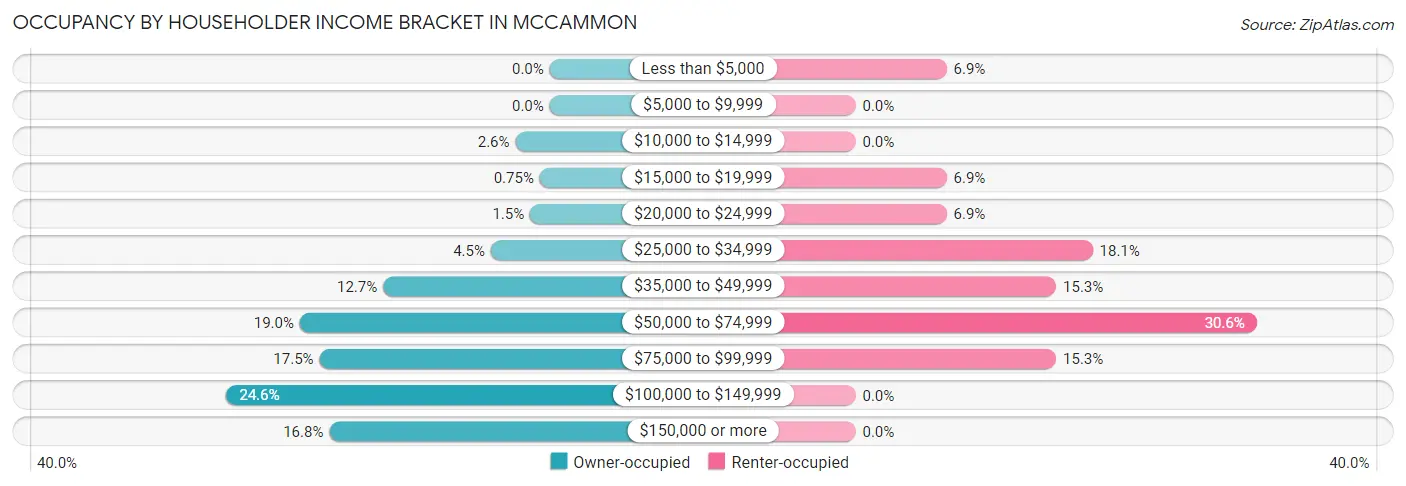
| Income Bracket | Owner-occupied | Renter-occupied |
| Less than $5,000 | 0 (0.0%) | 5 (6.9%) |
| $5,000 to $9,999 | 0 (0.0%) | 0 (0.0%) |
| $10,000 to $14,999 | 7 (2.6%) | 0 (0.0%) |
| $15,000 to $19,999 | 2 (0.7%) | 5 (6.9%) |
| $20,000 to $24,999 | 4 (1.5%) | 5 (6.9%) |
| $25,000 to $34,999 | 12 (4.5%) | 13 (18.1%) |
| $35,000 to $49,999 | 34 (12.7%) | 11 (15.3%) |
| $50,000 to $74,999 | 51 (19.0%) | 22 (30.6%) |
| $75,000 to $99,999 | 47 (17.5%) | 11 (15.3%) |
| $100,000 to $149,999 | 66 (24.6%) | 0 (0.0%) |
| $150,000 or more | 45 (16.8%) | 0 (0.0%) |
| Total | 268 (100.0%) | 72 (100.0%) |
Monthly Housing Cost Tiers in Mccammon
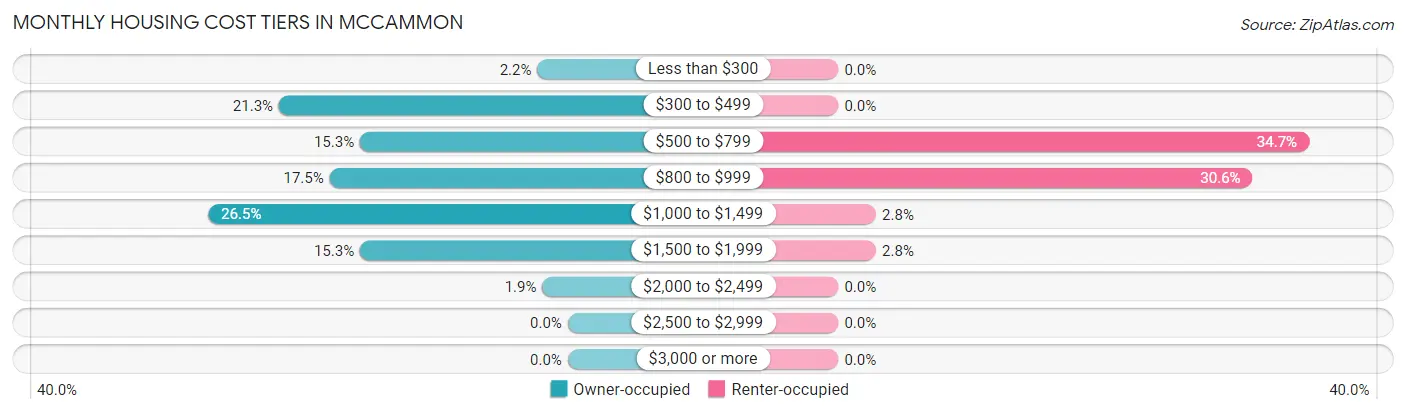
| Monthly Cost | Owner-occupied | Renter-occupied |
| Less than $300 | 6 (2.2%) | 0 (0.0%) |
| $300 to $499 | 57 (21.3%) | 0 (0.0%) |
| $500 to $799 | 41 (15.3%) | 25 (34.7%) |
| $800 to $999 | 47 (17.5%) | 22 (30.6%) |
| $1,000 to $1,499 | 71 (26.5%) | 2 (2.8%) |
| $1,500 to $1,999 | 41 (15.3%) | 2 (2.8%) |
| $2,000 to $2,499 | 5 (1.9%) | 0 (0.0%) |
| $2,500 to $2,999 | 0 (0.0%) | 0 (0.0%) |
| $3,000 or more | 0 (0.0%) | 0 (0.0%) |
| Total | 268 (100.0%) | 72 (100.0%) |
Physical Housing Characteristics in Mccammon
Housing Structures in Mccammon
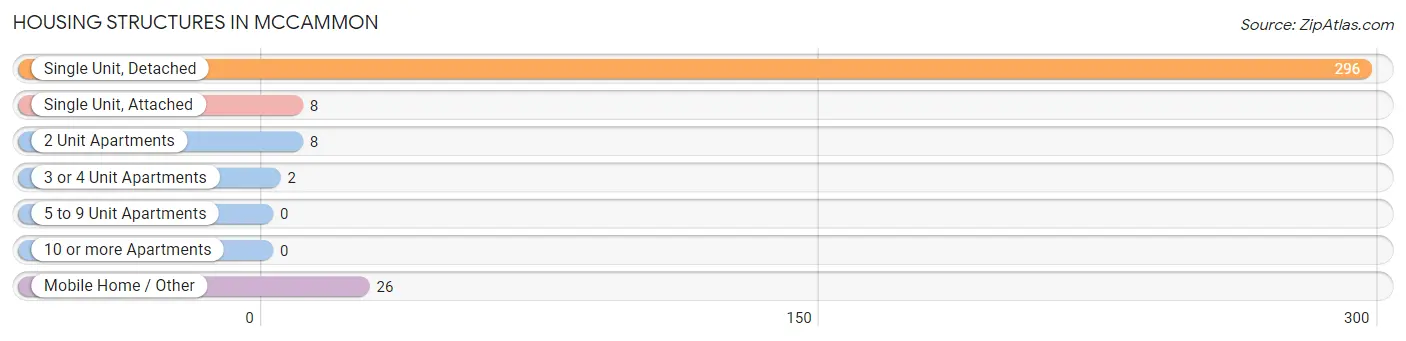
| Structure Type | # Housing Units | % Housing Units |
| Single Unit, Detached | 296 | 87.1% |
| Single Unit, Attached | 8 | 2.4% |
| 2 Unit Apartments | 8 | 2.4% |
| 3 or 4 Unit Apartments | 2 | 0.6% |
| 5 to 9 Unit Apartments | 0 | 0.0% |
| 10 or more Apartments | 0 | 0.0% |
| Mobile Home / Other | 26 | 7.6% |
| Total | 340 | 100.0% |
Housing Structures by Occupancy in Mccammon
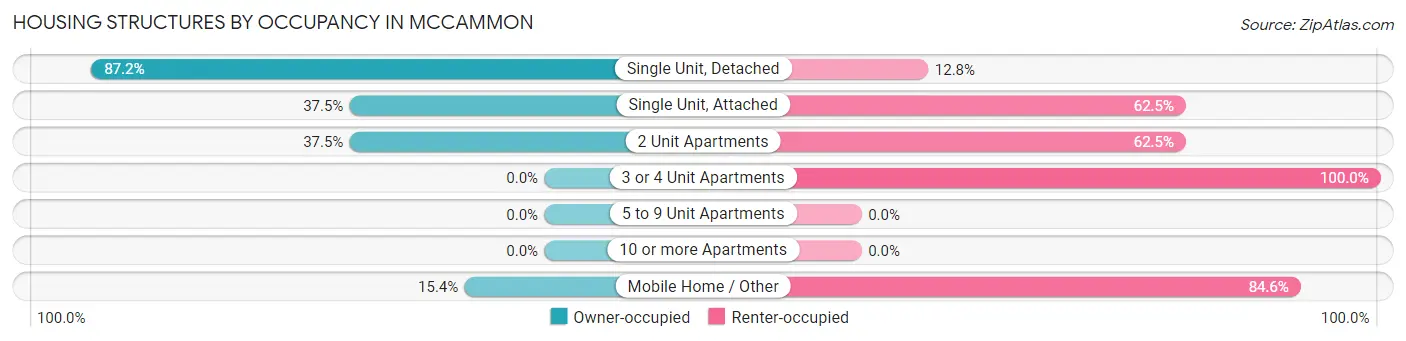
| Structure Type | Owner-occupied | Renter-occupied |
| Single Unit, Detached | 258 (87.2%) | 38 (12.8%) |
| Single Unit, Attached | 3 (37.5%) | 5 (62.5%) |
| 2 Unit Apartments | 3 (37.5%) | 5 (62.5%) |
| 3 or 4 Unit Apartments | 0 (0.0%) | 2 (100.0%) |
| 5 to 9 Unit Apartments | 0 (0.0%) | 0 (0.0%) |
| 10 or more Apartments | 0 (0.0%) | 0 (0.0%) |
| Mobile Home / Other | 4 (15.4%) | 22 (84.6%) |
| Total | 268 (78.8%) | 72 (21.2%) |
Housing Structures by Number of Rooms in Mccammon
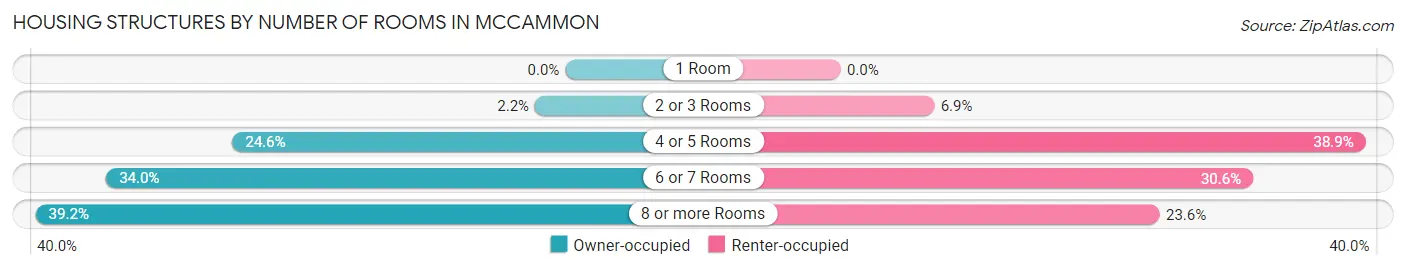
| Number of Rooms | Owner-occupied | Renter-occupied |
| 1 Room | 0 (0.0%) | 0 (0.0%) |
| 2 or 3 Rooms | 6 (2.2%) | 5 (6.9%) |
| 4 or 5 Rooms | 66 (24.6%) | 28 (38.9%) |
| 6 or 7 Rooms | 91 (34.0%) | 22 (30.6%) |
| 8 or more Rooms | 105 (39.2%) | 17 (23.6%) |
| Total | 268 (100.0%) | 72 (100.0%) |
Housing Structure by Heating Type in Mccammon
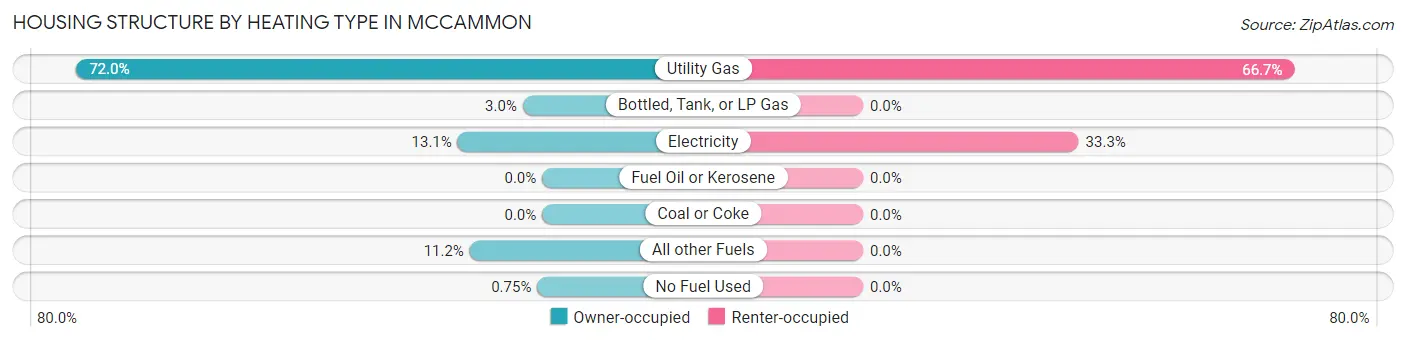
| Heating Type | Owner-occupied | Renter-occupied |
| Utility Gas | 193 (72.0%) | 48 (66.7%) |
| Bottled, Tank, or LP Gas | 8 (3.0%) | 0 (0.0%) |
| Electricity | 35 (13.1%) | 24 (33.3%) |
| Fuel Oil or Kerosene | 0 (0.0%) | 0 (0.0%) |
| Coal or Coke | 0 (0.0%) | 0 (0.0%) |
| All other Fuels | 30 (11.2%) | 0 (0.0%) |
| No Fuel Used | 2 (0.7%) | 0 (0.0%) |
| Total | 268 (100.0%) | 72 (100.0%) |
Household Vehicle Usage in Mccammon
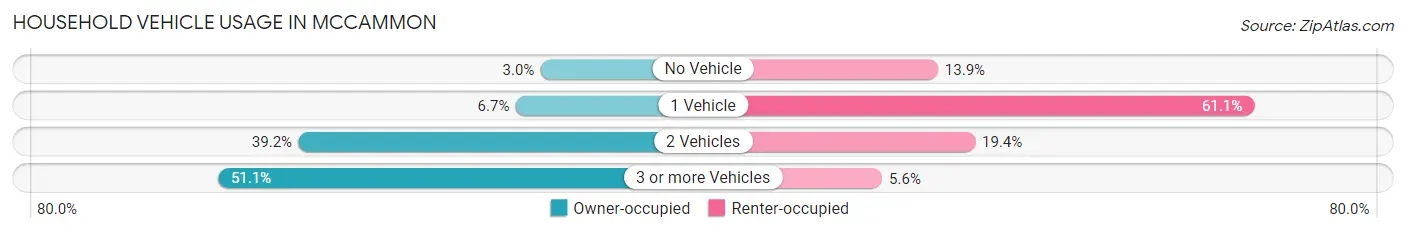
| Vehicles per Household | Owner-occupied | Renter-occupied |
| No Vehicle | 8 (3.0%) | 10 (13.9%) |
| 1 Vehicle | 18 (6.7%) | 44 (61.1%) |
| 2 Vehicles | 105 (39.2%) | 14 (19.4%) |
| 3 or more Vehicles | 137 (51.1%) | 4 (5.6%) |
| Total | 268 (100.0%) | 72 (100.0%) |
Real Estate & Mortgages in Mccammon
Real Estate and Mortgage Overview in Mccammon
| Characteristic | Without Mortgage | With Mortgage |
| Housing Units | 110 | 158 |
| Median Property Value | $218,800 | $216,700 |
| Median Household Income | $83,750 | $17 |
| Monthly Housing Costs | $475 | $0 |
| Real Estate Taxes | $1,203 | $0 |
Property Value by Mortgage Status in Mccammon
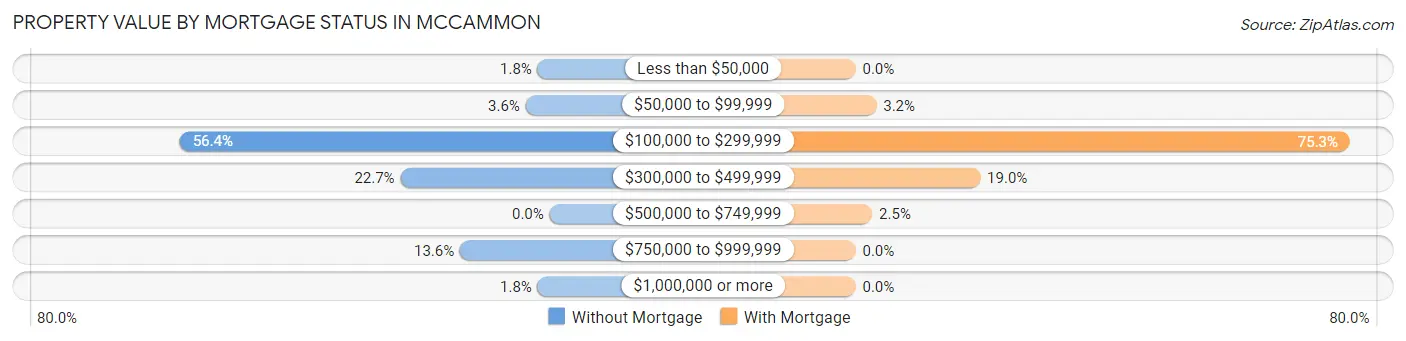
| Property Value | Without Mortgage | With Mortgage |
| Less than $50,000 | 2 (1.8%) | 0 (0.0%) |
| $50,000 to $99,999 | 4 (3.6%) | 5 (3.2%) |
| $100,000 to $299,999 | 62 (56.4%) | 119 (75.3%) |
| $300,000 to $499,999 | 25 (22.7%) | 30 (19.0%) |
| $500,000 to $749,999 | 0 (0.0%) | 4 (2.5%) |
| $750,000 to $999,999 | 15 (13.6%) | 0 (0.0%) |
| $1,000,000 or more | 2 (1.8%) | 0 (0.0%) |
| Total | 110 (100.0%) | 158 (100.0%) |
Household Income by Mortgage Status in Mccammon
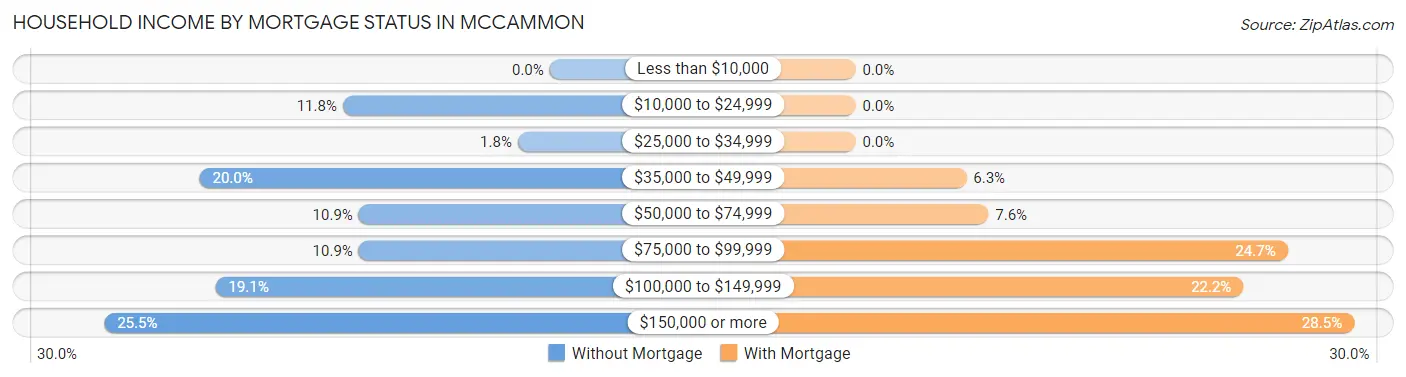
| Household Income | Without Mortgage | With Mortgage |
| Less than $10,000 | 0 (0.0%) | 0 (0.0%) |
| $10,000 to $24,999 | 13 (11.8%) | 0 (0.0%) |
| $25,000 to $34,999 | 2 (1.8%) | 0 (0.0%) |
| $35,000 to $49,999 | 22 (20.0%) | 10 (6.3%) |
| $50,000 to $74,999 | 12 (10.9%) | 12 (7.6%) |
| $75,000 to $99,999 | 12 (10.9%) | 39 (24.7%) |
| $100,000 to $149,999 | 21 (19.1%) | 35 (22.2%) |
| $150,000 or more | 28 (25.5%) | 45 (28.5%) |
| Total | 110 (100.0%) | 158 (100.0%) |
Property Value to Household Income Ratio in Mccammon
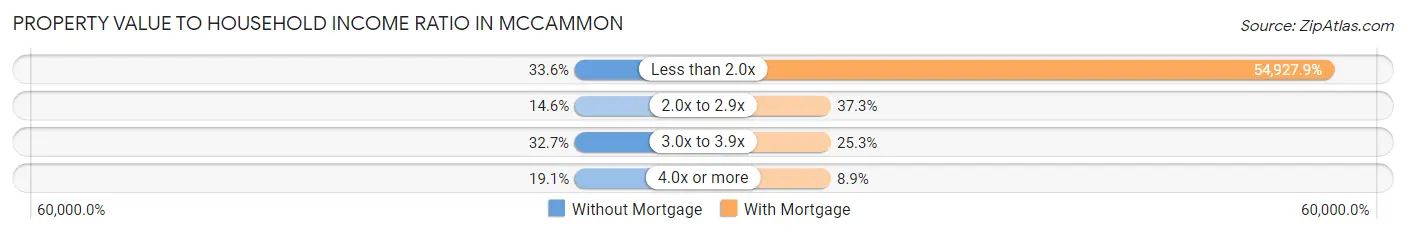
| Value-to-Income Ratio | Without Mortgage | With Mortgage |
| Less than 2.0x | 37 (33.6%) | 86,786 (54,927.9%) |
| 2.0x to 2.9x | 16 (14.5%) | 59 (37.3%) |
| 3.0x to 3.9x | 36 (32.7%) | 40 (25.3%) |
| 4.0x or more | 21 (19.1%) | 14 (8.9%) |
| Total | 110 (100.0%) | 158 (100.0%) |
Real Estate Taxes by Mortgage Status in Mccammon
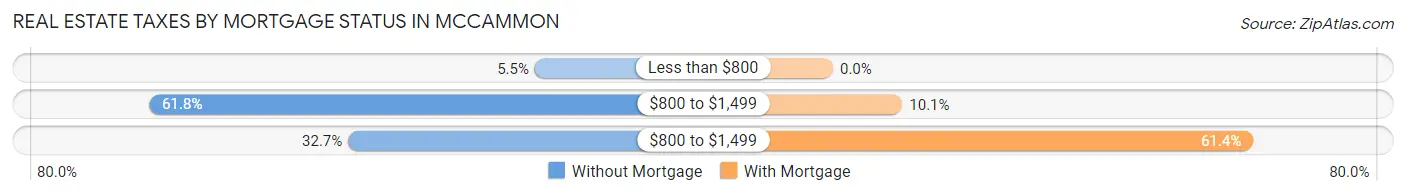
| Property Taxes | Without Mortgage | With Mortgage |
| Less than $800 | 6 (5.4%) | 0 (0.0%) |
| $800 to $1,499 | 68 (61.8%) | 16 (10.1%) |
| $800 to $1,499 | 36 (32.7%) | 97 (61.4%) |
| Total | 110 (100.0%) | 158 (100.0%) |
Health & Disability in Mccammon
Health Insurance Coverage by Age in Mccammon
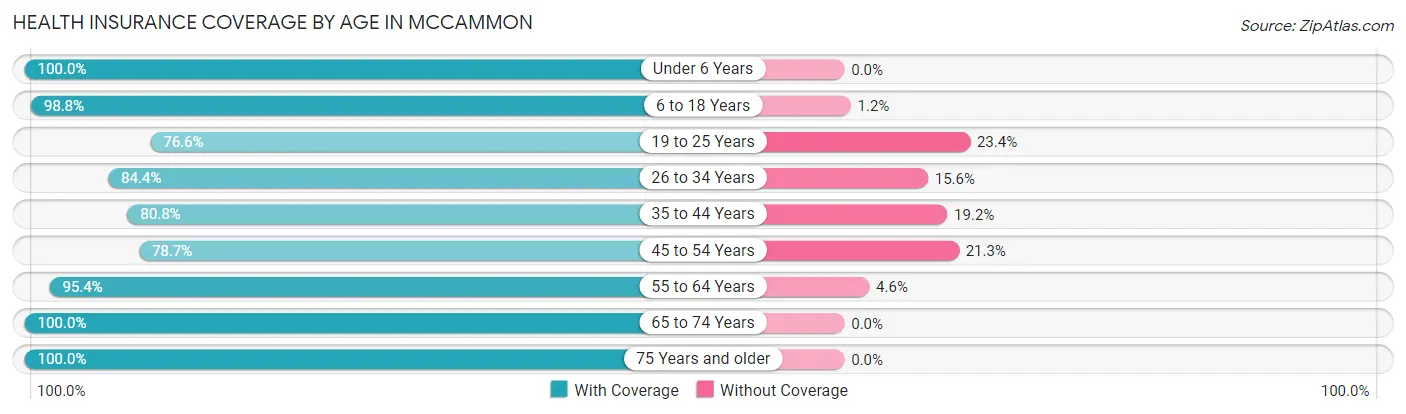
| Age Bracket | With Coverage | Without Coverage |
| Under 6 Years | 81 (100.0%) | 0 (0.0%) |
| 6 to 18 Years | 168 (98.8%) | 2 (1.2%) |
| 19 to 25 Years | 49 (76.6%) | 15 (23.4%) |
| 26 to 34 Years | 103 (84.4%) | 19 (15.6%) |
| 35 to 44 Years | 118 (80.8%) | 28 (19.2%) |
| 45 to 54 Years | 59 (78.7%) | 16 (21.3%) |
| 55 to 64 Years | 144 (95.4%) | 7 (4.6%) |
| 65 to 74 Years | 136 (100.0%) | 0 (0.0%) |
| 75 Years and older | 72 (100.0%) | 0 (0.0%) |
| Total | 930 (91.4%) | 87 (8.6%) |
Health Insurance Coverage by Citizenship Status in Mccammon
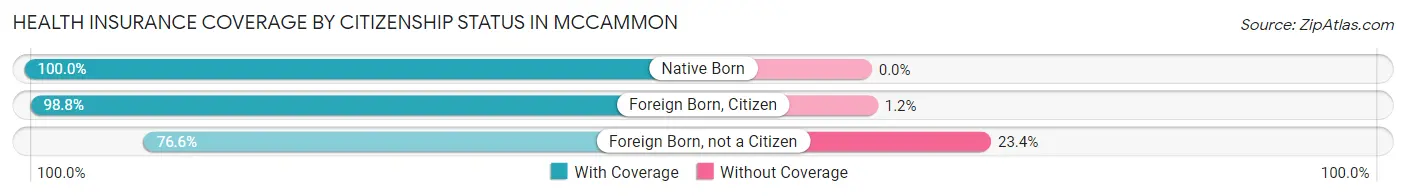
| Citizenship Status | With Coverage | Without Coverage |
| Native Born | 81 (100.0%) | 0 (0.0%) |
| Foreign Born, Citizen | 168 (98.8%) | 2 (1.2%) |
| Foreign Born, not a Citizen | 49 (76.6%) | 15 (23.4%) |
Health Insurance Coverage by Household Income in Mccammon
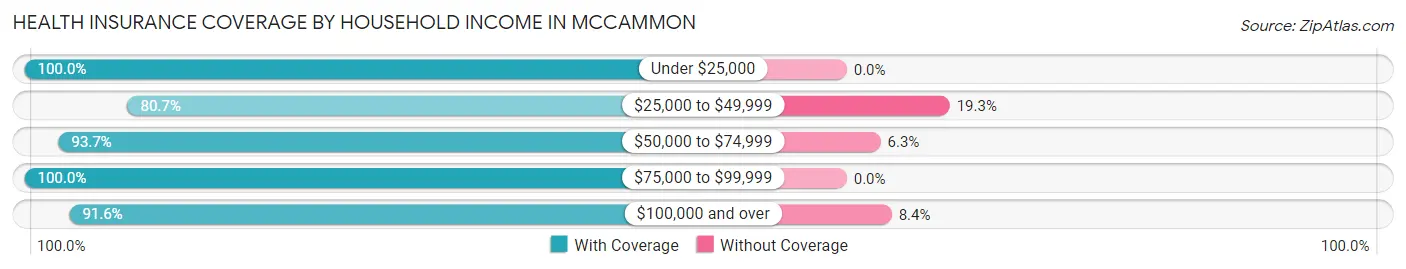
| Household Income | With Coverage | Without Coverage |
| Under $25,000 | 40 (100.0%) | 0 (0.0%) |
| $25,000 to $49,999 | 159 (80.7%) | 38 (19.3%) |
| $50,000 to $74,999 | 192 (93.7%) | 13 (6.3%) |
| $75,000 to $99,999 | 147 (100.0%) | 0 (0.0%) |
| $100,000 and over | 392 (91.6%) | 36 (8.4%) |
Public vs Private Health Insurance Coverage by Age in Mccammon
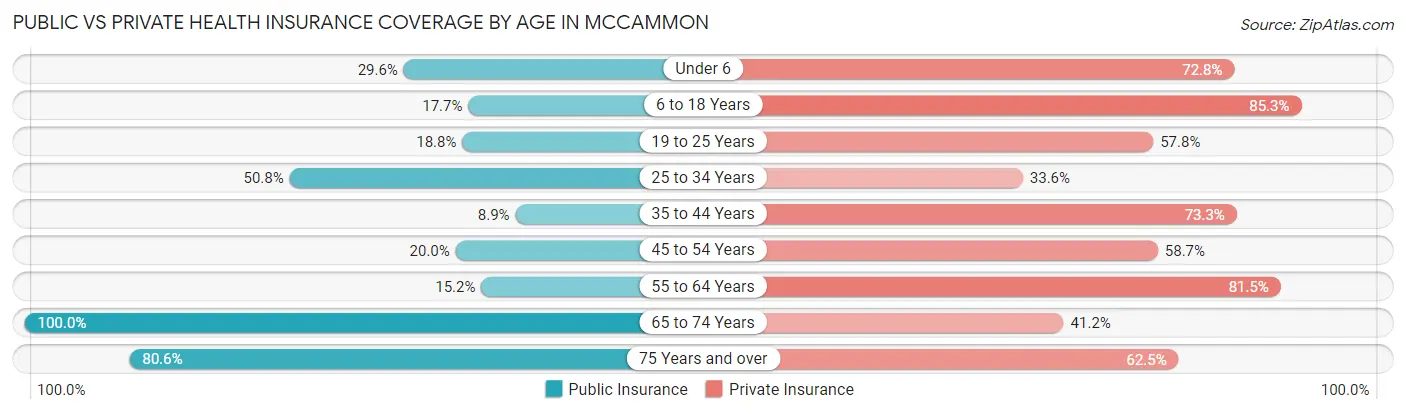
| Age Bracket | Public Insurance | Private Insurance |
| Under 6 | 24 (29.6%) | 59 (72.8%) |
| 6 to 18 Years | 30 (17.6%) | 145 (85.3%) |
| 19 to 25 Years | 12 (18.8%) | 37 (57.8%) |
| 25 to 34 Years | 62 (50.8%) | 41 (33.6%) |
| 35 to 44 Years | 13 (8.9%) | 107 (73.3%) |
| 45 to 54 Years | 15 (20.0%) | 44 (58.7%) |
| 55 to 64 Years | 23 (15.2%) | 123 (81.5%) |
| 65 to 74 Years | 136 (100.0%) | 56 (41.2%) |
| 75 Years and over | 58 (80.6%) | 45 (62.5%) |
| Total | 373 (36.7%) | 657 (64.6%) |
Disability Status by Sex by Age in Mccammon
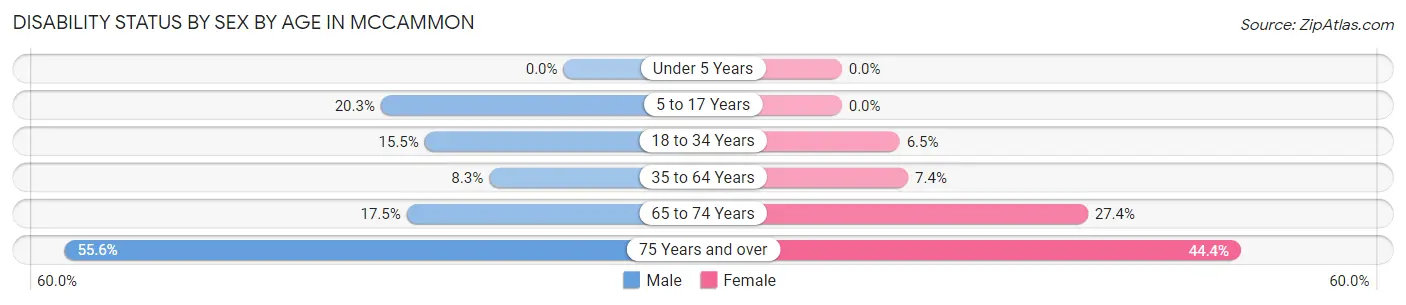
| Age Bracket | Male | Female |
| Under 5 Years | 0 (0.0%) | 0 (0.0%) |
| 5 to 17 Years | 12 (20.3%) | 0 (0.0%) |
| 18 to 34 Years | 17 (15.4%) | 6 (6.5%) |
| 35 to 64 Years | 14 (8.3%) | 15 (7.4%) |
| 65 to 74 Years | 11 (17.5%) | 20 (27.4%) |
| 75 Years and over | 20 (55.6%) | 16 (44.4%) |
Disability Class by Sex by Age in Mccammon
Disability Class: Hearing Difficulty
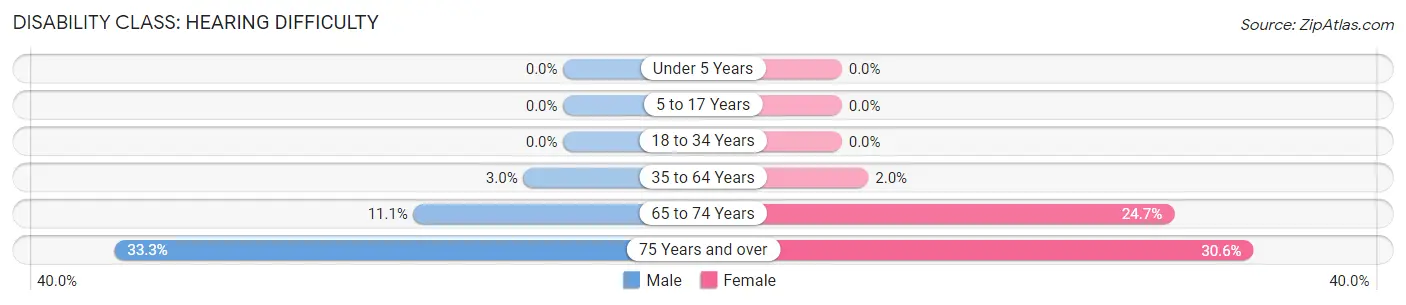
| Age Bracket | Male | Female |
| Under 5 Years | 0 (0.0%) | 0 (0.0%) |
| 5 to 17 Years | 0 (0.0%) | 0 (0.0%) |
| 18 to 34 Years | 0 (0.0%) | 0 (0.0%) |
| 35 to 64 Years | 5 (3.0%) | 4 (2.0%) |
| 65 to 74 Years | 7 (11.1%) | 18 (24.7%) |
| 75 Years and over | 12 (33.3%) | 11 (30.6%) |
Disability Class: Vision Difficulty
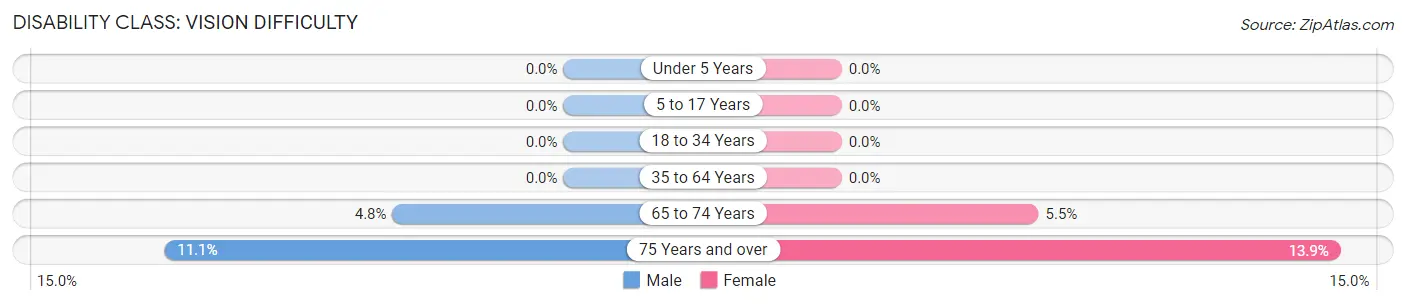
| Age Bracket | Male | Female |
| Under 5 Years | 0 (0.0%) | 0 (0.0%) |
| 5 to 17 Years | 0 (0.0%) | 0 (0.0%) |
| 18 to 34 Years | 0 (0.0%) | 0 (0.0%) |
| 35 to 64 Years | 0 (0.0%) | 0 (0.0%) |
| 65 to 74 Years | 3 (4.8%) | 4 (5.5%) |
| 75 Years and over | 4 (11.1%) | 5 (13.9%) |
Disability Class: Cognitive Difficulty
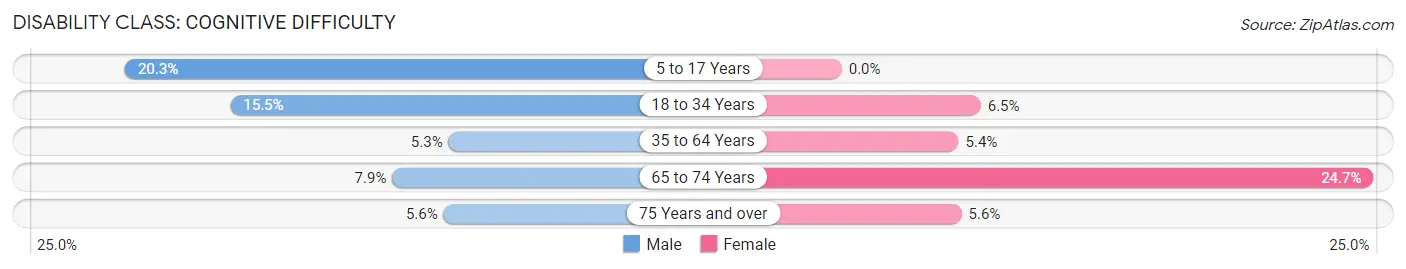
| Age Bracket | Male | Female |
| 5 to 17 Years | 12 (20.3%) | 0 (0.0%) |
| 18 to 34 Years | 17 (15.4%) | 6 (6.5%) |
| 35 to 64 Years | 9 (5.3%) | 11 (5.4%) |
| 65 to 74 Years | 5 (7.9%) | 18 (24.7%) |
| 75 Years and over | 2 (5.6%) | 2 (5.6%) |
Disability Class: Ambulatory Difficulty
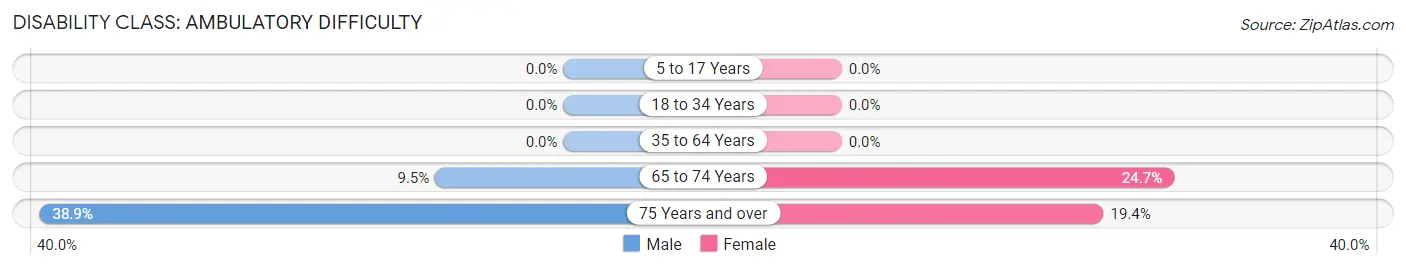
| Age Bracket | Male | Female |
| 5 to 17 Years | 0 (0.0%) | 0 (0.0%) |
| 18 to 34 Years | 0 (0.0%) | 0 (0.0%) |
| 35 to 64 Years | 0 (0.0%) | 0 (0.0%) |
| 65 to 74 Years | 6 (9.5%) | 18 (24.7%) |
| 75 Years and over | 14 (38.9%) | 7 (19.4%) |
Disability Class: Self-Care Difficulty
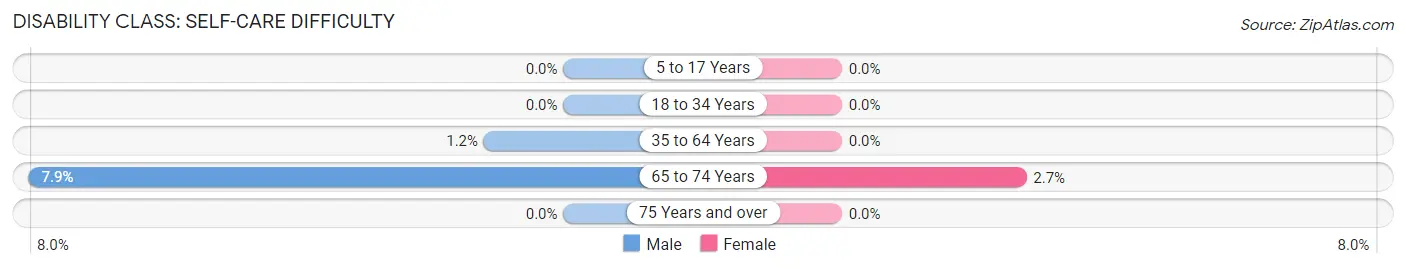
| Age Bracket | Male | Female |
| 5 to 17 Years | 0 (0.0%) | 0 (0.0%) |
| 18 to 34 Years | 0 (0.0%) | 0 (0.0%) |
| 35 to 64 Years | 2 (1.2%) | 0 (0.0%) |
| 65 to 74 Years | 5 (7.9%) | 2 (2.7%) |
| 75 Years and over | 0 (0.0%) | 0 (0.0%) |
Technology Access in Mccammon
Computing Device Access in Mccammon
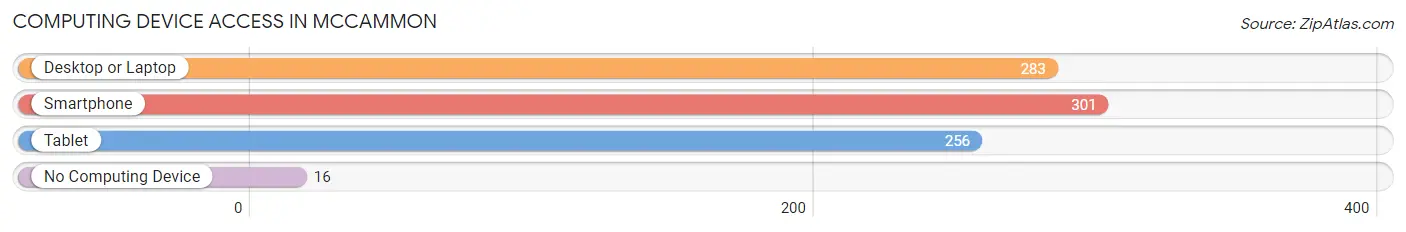
| Device Type | # Households | % Households |
| Desktop or Laptop | 283 | 83.2% |
| Smartphone | 301 | 88.5% |
| Tablet | 256 | 75.3% |
| No Computing Device | 16 | 4.7% |
| Total | 340 | 100.0% |
Internet Access in Mccammon
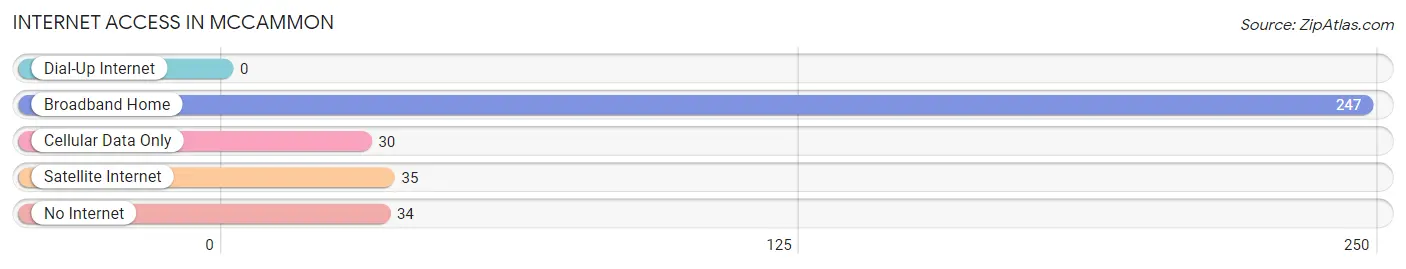
| Internet Type | # Households | % Households |
| Dial-Up Internet | 0 | 0.0% |
| Broadband Home | 247 | 72.7% |
| Cellular Data Only | 30 | 8.8% |
| Satellite Internet | 35 | 10.3% |
| No Internet | 34 | 10.0% |
| Total | 340 | 100.0% |
Mccammon Summary
Mccammon is a small city located in Bannock County, Idaho. It is situated in the southeastern part of the state, about 20 miles south of Pocatello. The city has a population of 1,093 people, according to the 2010 census.
History
Mccammon was founded in 1883 by a group of Mormon settlers led by William Mccammon. The settlers were looking for a place to settle and build a community. The area was originally known as "Mccammonville" and was later shortened to "Mccammon". The city was incorporated in 1891 and has remained a small, rural community ever since.
The city was named after William Mccammon, who was a prominent figure in the early days of the settlement. He was a leader in the Mormon Church and was instrumental in the development of the city.
Geography
Mccammon is located in the southeastern part of Idaho, about 20 miles south of Pocatello. The city is situated in the Portneuf River Valley, which is surrounded by the Portneuf Mountains. The city is located at an elevation of 4,890 feet above sea level.
The climate in Mccammon is semi-arid, with hot summers and cold winters. The average annual temperature is around 50 degrees Fahrenheit. The average annual precipitation is around 12 inches.
Economy
Mccammon is a small, rural community with a limited economy. The main industries in the city are agriculture and tourism. The city is home to several farms and ranches, which produce a variety of crops and livestock.
The city also has a few small businesses, including a grocery store, a hardware store, and a few restaurants. The city also has a few small manufacturing companies, which produce a variety of products.
Demographics
According to the 2010 census, the population of Mccammon was 1,093 people. The racial makeup of the city was 95.3% White, 0.7% Native American, 0.3% Asian, 0.2% African American, and 3.5% from other races. The median household income was $35,938, and the median family income was $41,250.
The city has a high rate of poverty, with 24.3% of the population living below the poverty line. The unemployment rate in Mccammon is also high, at 8.2%.
Conclusion
Mccammon is a small city located in Bannock County, Idaho. It was founded in 1883 by a group of Mormon settlers and has remained a small, rural community ever since. The city has a population of 1,093 people, according to the 2010 census. The main industries in the city are agriculture and tourism. The city also has a few small businesses and manufacturing companies. The median household income was $35,938, and the median family income was $41,250. The city has a high rate of poverty, with 24.3% of the population living below the poverty line.
Common Questions
What is Per Capita Income in Mccammon?
Per Capita income in Mccammon is $30,993.
What is the Median Family Income in Mccammon?
Median Family Income in Mccammon is $85,000.
What is the Median Household income in Mccammon?
Median Household Income in Mccammon is $74,583.
What is Income or Wage Gap in Mccammon?
Income or Wage Gap in Mccammon is 20.8%.
Women in Mccammon earn 79.2 cents for every dollar earned by a man.
What is Inequality or Gini Index in Mccammon?
Inequality or Gini Index in Mccammon is 0.37.
What is the Total Population of Mccammon?
Total Population of Mccammon is 1,017.
What is the Total Male Population of Mccammon?
Total Male Population of Mccammon is 459.
What is the Total Female Population of Mccammon?
Total Female Population of Mccammon is 558.
What is the Ratio of Males per 100 Females in Mccammon?
There are 82.26 Males per 100 Females in Mccammon.
What is the Ratio of Females per 100 Males in Mccammon?
There are 121.57 Females per 100 Males in Mccammon.
What is the Median Population Age in Mccammon?
Median Population Age in Mccammon is 41.2 Years.
What is the Average Family Size in Mccammon
Average Family Size in Mccammon is 3.4 People.
What is the Average Household Size in Mccammon
Average Household Size in Mccammon is 3.0 People.
How Large is the Labor Force in Mccammon?
There are 487 People in the Labor Forcein in Mccammon.
What is the Percentage of People in the Labor Force in Mccammon?
60.3% of People are in the Labor Force in Mccammon.
What is the Unemployment Rate in Mccammon?
Unemployment Rate in Mccammon is 5.1%.