Lapwai, ID Map & Demographics
Lapwai Map
Lapwai Overview
$18,066
PER CAPITA INCOME
$58,500
AVG FAMILY INCOME
$58,558
AVG HOUSEHOLD INCOME
14.2%
WAGE / INCOME GAP [ % ]
85.8¢/ $1
WAGE / INCOME GAP [ $ ]
$9,966
FAMILY INCOME DEFICIT
0.32
INEQUALITY / GINI INDEX
1,310
TOTAL POPULATION
669
MALE POPULATION
641
FEMALE POPULATION
104.37
MALES / 100 FEMALES
95.81
FEMALES / 100 MALES
28.5
MEDIAN AGE
4.1
AVG FAMILY SIZE
3.9
AVG HOUSEHOLD SIZE
509
LABOR FORCE [ PEOPLE ]
59.3%
PERCENT IN LABOR FORCE
9.6%
UNEMPLOYMENT RATE
Lapwai Zip Codes
Lapwai Area Codes
Income in Lapwai
Income Overview in Lapwai
Per Capita Income in Lapwai is $18,066, while median incomes of families and households are $58,500 and $58,558 respectively.
| Characteristic | Number | Measure |
| Per Capita Income | 1,310 | $18,066 |
| Median Family Income | 288 | $58,500 |
| Mean Family Income | 288 | $67,054 |
| Median Household Income | 333 | $58,558 |
| Mean Household Income | 333 | $66,402 |
| Income Deficit | 288 | $9,966 |
| Wage / Income Gap (%) | 1,310 | 14.23% |
| Wage / Income Gap ($) | 1,310 | 85.77¢ per $1 |
| Gini / Inequality Index | 1,310 | 0.32 |
Earnings by Sex in Lapwai
Average Earnings in Lapwai are $33,906, $32,000 for men and $37,308 for women, a difference of 14.2%.
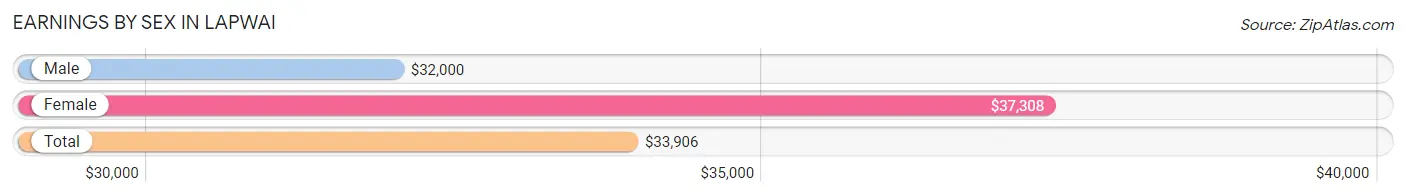
| Sex | Number | Average Earnings |
| Male | 244 (47.5%) | $32,000 |
| Female | 270 (52.5%) | $37,308 |
| Total | 514 (100.0%) | $33,906 |
Earnings by Sex by Income Bracket in Lapwai
The most common earnings brackets in Lapwai are $30,000 to $34,999 for men (57 | 23.4%) and $40,000 to $44,999 for women (29 | 10.7%).
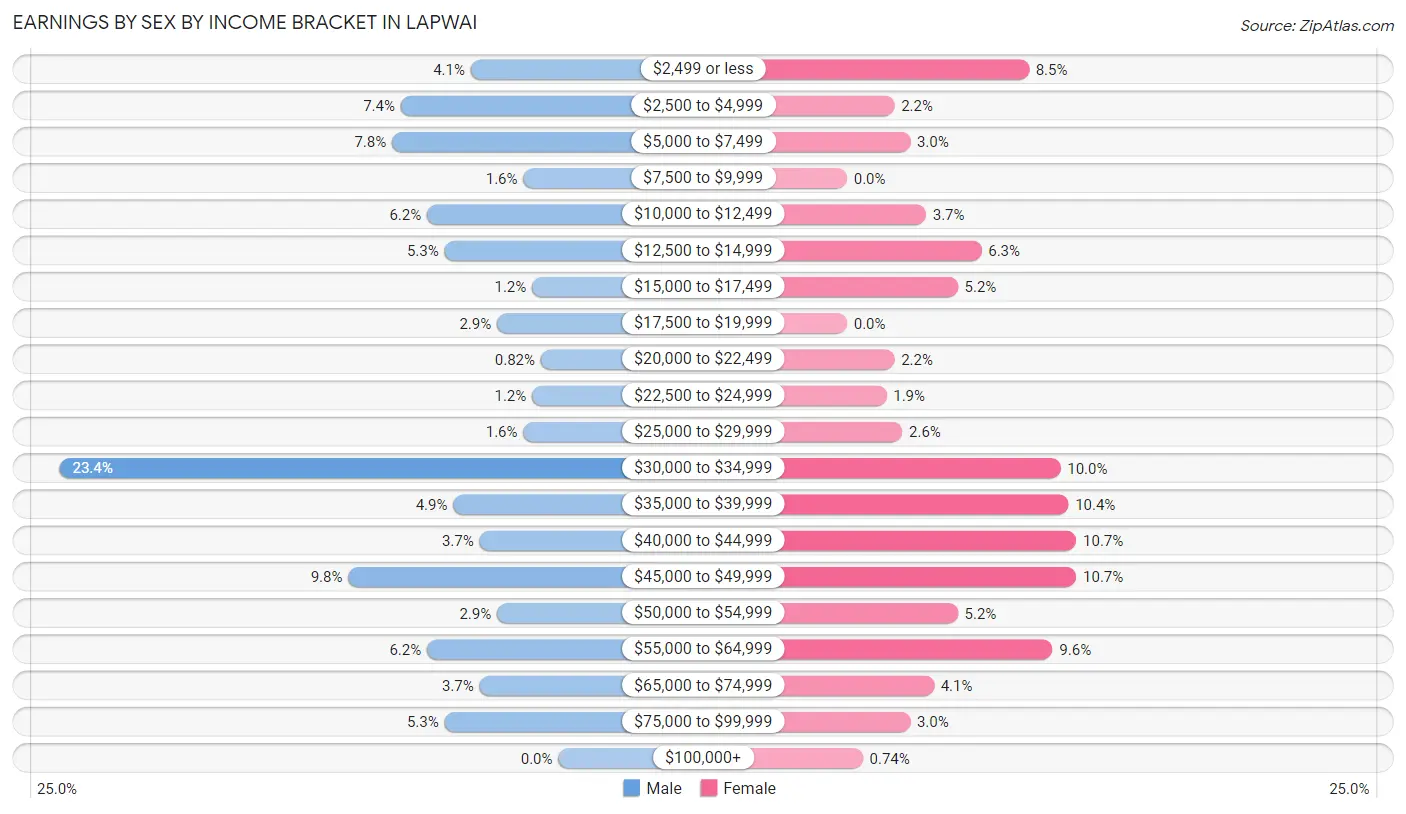
| Income | Male | Female |
| $2,499 or less | 10 (4.1%) | 23 (8.5%) |
| $2,500 to $4,999 | 18 (7.4%) | 6 (2.2%) |
| $5,000 to $7,499 | 19 (7.8%) | 8 (3.0%) |
| $7,500 to $9,999 | 4 (1.6%) | 0 (0.0%) |
| $10,000 to $12,499 | 15 (6.1%) | 10 (3.7%) |
| $12,500 to $14,999 | 13 (5.3%) | 17 (6.3%) |
| $15,000 to $17,499 | 3 (1.2%) | 14 (5.2%) |
| $17,500 to $19,999 | 7 (2.9%) | 0 (0.0%) |
| $20,000 to $22,499 | 2 (0.8%) | 6 (2.2%) |
| $22,500 to $24,999 | 3 (1.2%) | 5 (1.8%) |
| $25,000 to $29,999 | 4 (1.6%) | 7 (2.6%) |
| $30,000 to $34,999 | 57 (23.4%) | 27 (10.0%) |
| $35,000 to $39,999 | 12 (4.9%) | 28 (10.4%) |
| $40,000 to $44,999 | 9 (3.7%) | 29 (10.7%) |
| $45,000 to $49,999 | 24 (9.8%) | 29 (10.7%) |
| $50,000 to $54,999 | 7 (2.9%) | 14 (5.2%) |
| $55,000 to $64,999 | 15 (6.1%) | 26 (9.6%) |
| $65,000 to $74,999 | 9 (3.7%) | 11 (4.1%) |
| $75,000 to $99,999 | 13 (5.3%) | 8 (3.0%) |
| $100,000+ | 0 (0.0%) | 2 (0.7%) |
| Total | 244 (100.0%) | 270 (100.0%) |
Earnings by Sex by Educational Attainment in Lapwai
Average earnings in Lapwai are $33,519 for men and $38,667 for women, a difference of 13.3%. Men with an educational attainment of bachelor's degree enjoy the highest average annual earnings of $42,917, while those with college or associate's degree education earn the least with $33,981. Women with an educational attainment of graduate degree earn the most with the average annual earnings of $61,667, while those with high school diploma education have the smallest earnings of $29,375.
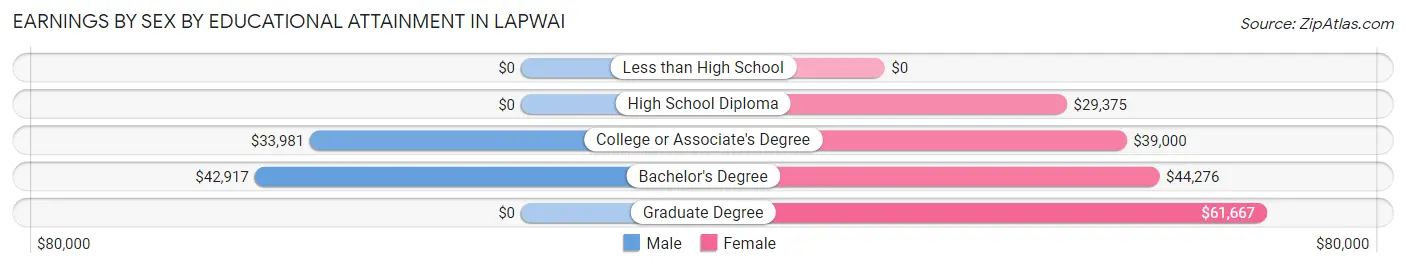
| Educational Attainment | Male Income | Female Income |
| Less than High School | - | - |
| High School Diploma | - | - |
| College or Associate's Degree | $33,981 | $39,000 |
| Bachelor's Degree | $42,917 | $44,276 |
| Graduate Degree | - | - |
| Total | $33,519 | $38,667 |
Family Income in Lapwai
Family Income Brackets in Lapwai
According to the Lapwai family income data, there are 82 families falling into the $50,000 to $74,999 income range, which is the most common income bracket and makes up 28.5% of all families.
| Income Bracket | # Families | % Families |
| Less than $10,000 | 10 | 3.5% |
| $10,000 to $14,999 | 10 | 3.5% |
| $15,000 to $24,999 | 28 | 9.7% |
| $25,000 to $34,999 | 15 | 5.2% |
| $35,000 to $49,999 | 36 | 12.5% |
| $50,000 to $74,999 | 82 | 28.5% |
| $75,000 to $99,999 | 48 | 16.7% |
| $100,000 to $149,999 | 45 | 15.6% |
| $150,000 to $199,999 | 14 | 4.9% |
| $200,000+ | 0 | 0.0% |
Family Income by Famaliy Size in Lapwai
5-person families (46 | 16.0%) account for the highest median family income in Lapwai with $98,750 per family, while 2-person families (75 | 26.0%) have the highest median income of $29,554 per family member.
| Income Bracket | # Families | Median Income |
| 2-Person Families | 75 (26.0%) | $59,107 |
| 3-Person Families | 56 (19.4%) | $46,250 |
| 4-Person Families | 77 (26.7%) | $54,375 |
| 5-Person Families | 46 (16.0%) | $98,750 |
| 6-Person Families | 13 (4.5%) | $0 |
| 7+ Person Families | 21 (7.3%) | $98,750 |
| Total | 288 (100.0%) | $58,500 |
Family Income by Number of Earners in Lapwai
The median family income in Lapwai is $58,500, with families comprising 3+ earners (50) having the highest median family income of $109,167, while families with 1 earner (55) have the lowest median family income of $45,972, accounting for 17.4% and 19.1% of families, respectively.
| Number of Earners | # Families | Median Income |
| No Earners | 75 (26.0%) | $52,538 |
| 1 Earner | 55 (19.1%) | $45,972 |
| 2 Earners | 108 (37.5%) | $75,000 |
| 3+ Earners | 50 (17.4%) | $109,167 |
| Total | 288 (100.0%) | $58,500 |
Household Income in Lapwai
Household Income Brackets in Lapwai
With 94 households falling in the category, the $50,000 to $74,999 income range is the most frequent in Lapwai, accounting for 28.2% of all households.
| Income Bracket | # Households | % Households |
| Less than $10,000 | 8 | 2.4% |
| $10,000 to $14,999 | 10 | 3.0% |
| $15,000 to $24,999 | 21 | 6.3% |
| $25,000 to $34,999 | 45 | 13.5% |
| $35,000 to $49,999 | 36 | 10.8% |
| $50,000 to $74,999 | 94 | 28.2% |
| $75,000 to $99,999 | 58 | 17.4% |
| $100,000 to $149,999 | 45 | 13.5% |
| $150,000 to $199,999 | 16 | 4.8% |
| $200,000+ | 0 | 0.0% |
Household Income by Householder Age in Lapwai
The median household income in Lapwai is $58,558, with the highest median household income of $76,250 found in the 45 to 64 years age bracket for the primary householder. A total of 104 households (31.2%) fall into this category.
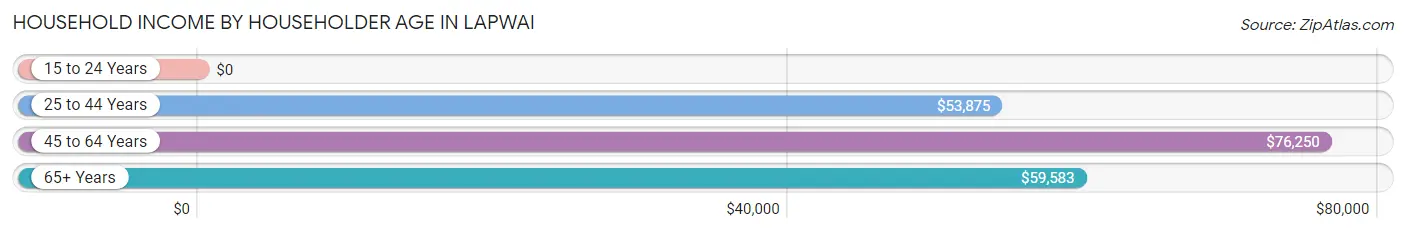
| Income Bracket | # Households | Median Income |
| 15 to 24 Years | 0 (0.0%) | $0 |
| 25 to 44 Years | 151 (45.4%) | $53,875 |
| 45 to 64 Years | 104 (31.2%) | $76,250 |
| 65+ Years | 78 (23.4%) | $59,583 |
| Total | 333 (100.0%) | $58,558 |
Poverty in Lapwai
Income Below Poverty by Sex and Age in Lapwai
With 21.9% poverty level for males and 18.4% for females among the residents of Lapwai, 15 year old males and 12 to 14 year old females are the most vulnerable to poverty, with 6 males (100.0%) and 22 females (43.1%) in their respective age groups living below the poverty level.
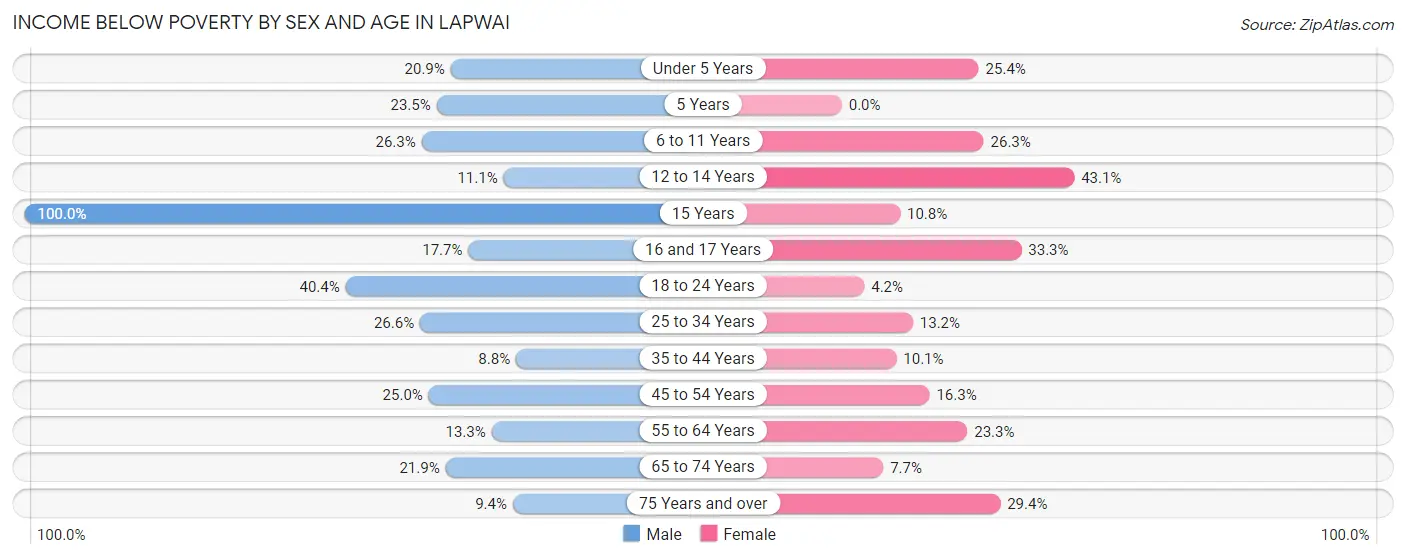
| Age Bracket | Male | Female |
| Under 5 Years | 9 (20.9%) | 16 (25.4%) |
| 5 Years | 8 (23.5%) | 0 (0.0%) |
| 6 to 11 Years | 30 (26.3%) | 15 (26.3%) |
| 12 to 14 Years | 4 (11.1%) | 22 (43.1%) |
| 15 Years | 6 (100.0%) | 4 (10.8%) |
| 16 and 17 Years | 3 (17.6%) | 1 (33.3%) |
| 18 to 24 Years | 19 (40.4%) | 2 (4.2%) |
| 25 to 34 Years | 29 (26.6%) | 19 (13.2%) |
| 35 to 44 Years | 8 (8.8%) | 8 (10.1%) |
| 45 to 54 Years | 5 (25.0%) | 7 (16.3%) |
| 55 to 64 Years | 6 (13.3%) | 17 (23.3%) |
| 65 to 74 Years | 14 (21.9%) | 2 (7.7%) |
| 75 Years and over | 3 (9.4%) | 5 (29.4%) |
| Total | 144 (21.9%) | 118 (18.4%) |
Income Above Poverty by Sex and Age in Lapwai
According to the poverty statistics in Lapwai, males aged 35 to 44 years and females aged 18 to 24 years are the age groups that are most secure financially, with 91.2% of males and 95.8% of females in these age groups living above the poverty line.
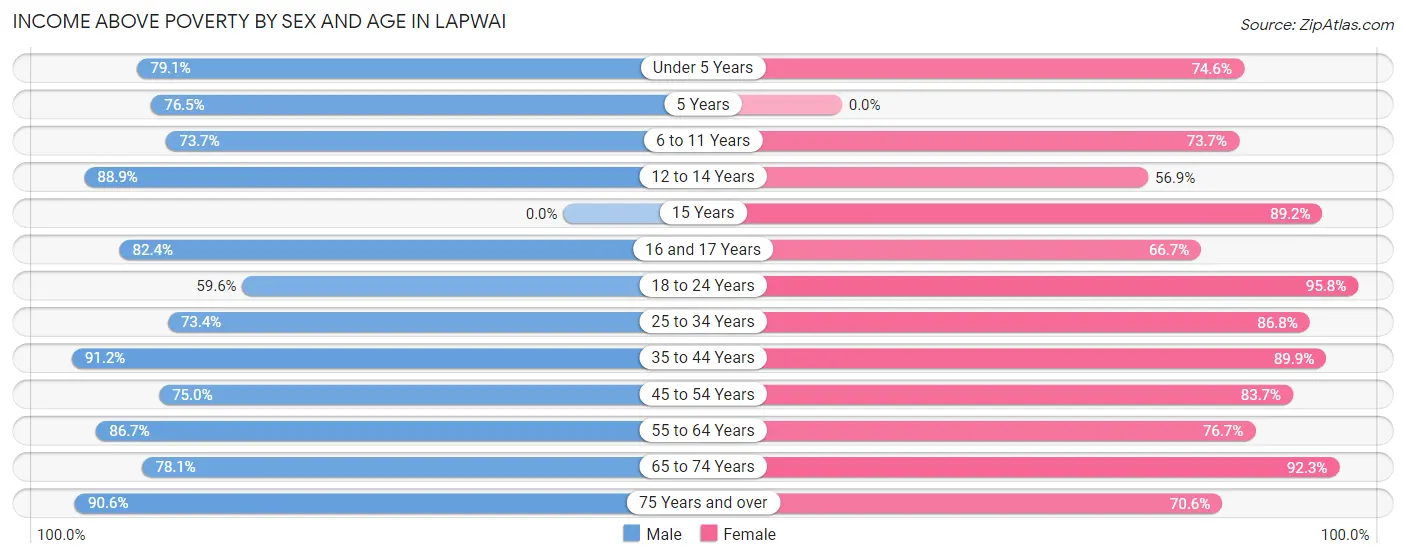
| Age Bracket | Male | Female |
| Under 5 Years | 34 (79.1%) | 47 (74.6%) |
| 5 Years | 26 (76.5%) | 0 (0.0%) |
| 6 to 11 Years | 84 (73.7%) | 42 (73.7%) |
| 12 to 14 Years | 32 (88.9%) | 29 (56.9%) |
| 15 Years | 0 (0.0%) | 33 (89.2%) |
| 16 and 17 Years | 14 (82.4%) | 2 (66.7%) |
| 18 to 24 Years | 28 (59.6%) | 46 (95.8%) |
| 25 to 34 Years | 80 (73.4%) | 125 (86.8%) |
| 35 to 44 Years | 83 (91.2%) | 71 (89.9%) |
| 45 to 54 Years | 15 (75.0%) | 36 (83.7%) |
| 55 to 64 Years | 39 (86.7%) | 56 (76.7%) |
| 65 to 74 Years | 50 (78.1%) | 24 (92.3%) |
| 75 Years and over | 29 (90.6%) | 12 (70.6%) |
| Total | 514 (78.1%) | 523 (81.6%) |
Income Below Poverty Among Married-Couple Families in Lapwai
The poverty statistics for married-couple families in Lapwai show that 7.6% or 12 of the total 158 families live below the poverty line. Families with 1 or 2 children have the highest poverty rate of 12.8%, comprising of 11 families. On the other hand, families with 3 or 4 children have the lowest poverty rate of 0.0%, which includes 0 families.
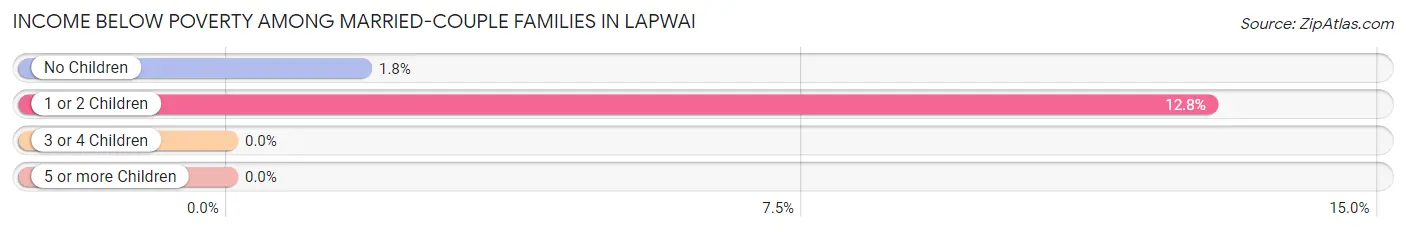
| Children | Above Poverty | Below Poverty |
| No Children | 56 (98.3%) | 1 (1.8%) |
| 1 or 2 Children | 75 (87.2%) | 11 (12.8%) |
| 3 or 4 Children | 10 (100.0%) | 0 (0.0%) |
| 5 or more Children | 5 (100.0%) | 0 (0.0%) |
| Total | 146 (92.4%) | 12 (7.6%) |
Income Below Poverty Among Single-Parent Households in Lapwai
According to the poverty data in Lapwai, 29.2% or 14 single-father households and 29.3% or 24 single-mother households are living below the poverty line. Among single-father households, those with 3 or 4 children have the highest poverty rate, with 8 households (61.5%) experiencing poverty. Likewise, among single-mother households, those with 3 or 4 children have the highest poverty rate, with 9 households (56.2%) falling below the poverty line.
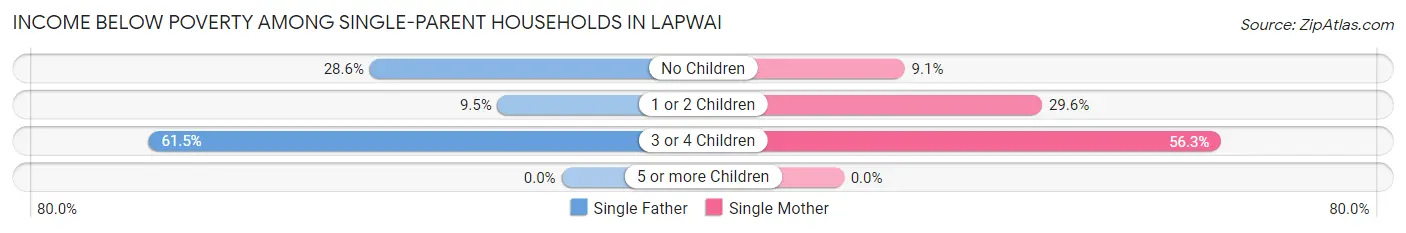
| Children | Single Father | Single Mother |
| No Children | 4 (28.6%) | 2 (9.1%) |
| 1 or 2 Children | 2 (9.5%) | 13 (29.5%) |
| 3 or 4 Children | 8 (61.5%) | 9 (56.2%) |
| 5 or more Children | 0 (0.0%) | 0 (0.0%) |
| Total | 14 (29.2%) | 24 (29.3%) |
Income Below Poverty Among Married-Couple vs Single-Parent Households in Lapwai
The poverty data for Lapwai shows that 12 of the married-couple family households (7.6%) and 38 of the single-parent households (29.2%) are living below the poverty level. Within the married-couple family households, those with 1 or 2 children have the highest poverty rate, with 11 households (12.8%) falling below the poverty line. Among the single-parent households, those with 3 or 4 children have the highest poverty rate, with 17 household (58.6%) living below poverty.
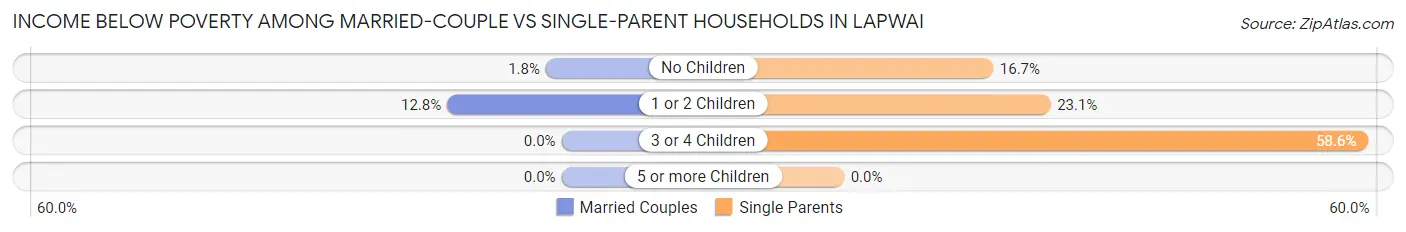
| Children | Married-Couple Families | Single-Parent Households |
| No Children | 1 (1.8%) | 6 (16.7%) |
| 1 or 2 Children | 11 (12.8%) | 15 (23.1%) |
| 3 or 4 Children | 0 (0.0%) | 17 (58.6%) |
| 5 or more Children | 0 (0.0%) | 0 (0.0%) |
| Total | 12 (7.6%) | 38 (29.2%) |
Race in Lapwai
The most populous races in Lapwai are Native / Alaskan (999 | 76.3%), White / Caucasian (171 | 13.1%), and Two or more Races (83 | 6.3%).
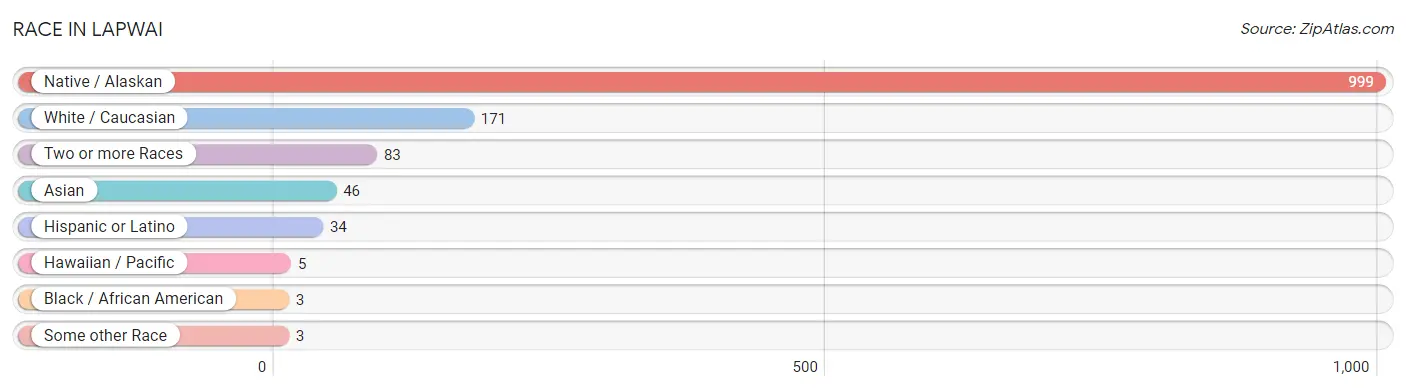
| Race | # Population | % Population |
| Asian | 46 | 3.5% |
| Black / African American | 3 | 0.2% |
| Hawaiian / Pacific | 5 | 0.4% |
| Hispanic or Latino | 34 | 2.6% |
| Native / Alaskan | 999 | 76.3% |
| White / Caucasian | 171 | 13.1% |
| Two or more Races | 83 | 6.3% |
| Some other Race | 3 | 0.2% |
| Total | 1,310 | 100.0% |
Ancestry in Lapwai
The most populous ancestries reported in Lapwai are German (45 | 3.4%), Colville (43 | 3.3%), American (32 | 2.4%), Mexican (28 | 2.1%), and Burmese (27 | 2.1%), together accounting for 13.4% of all Lapwai residents.
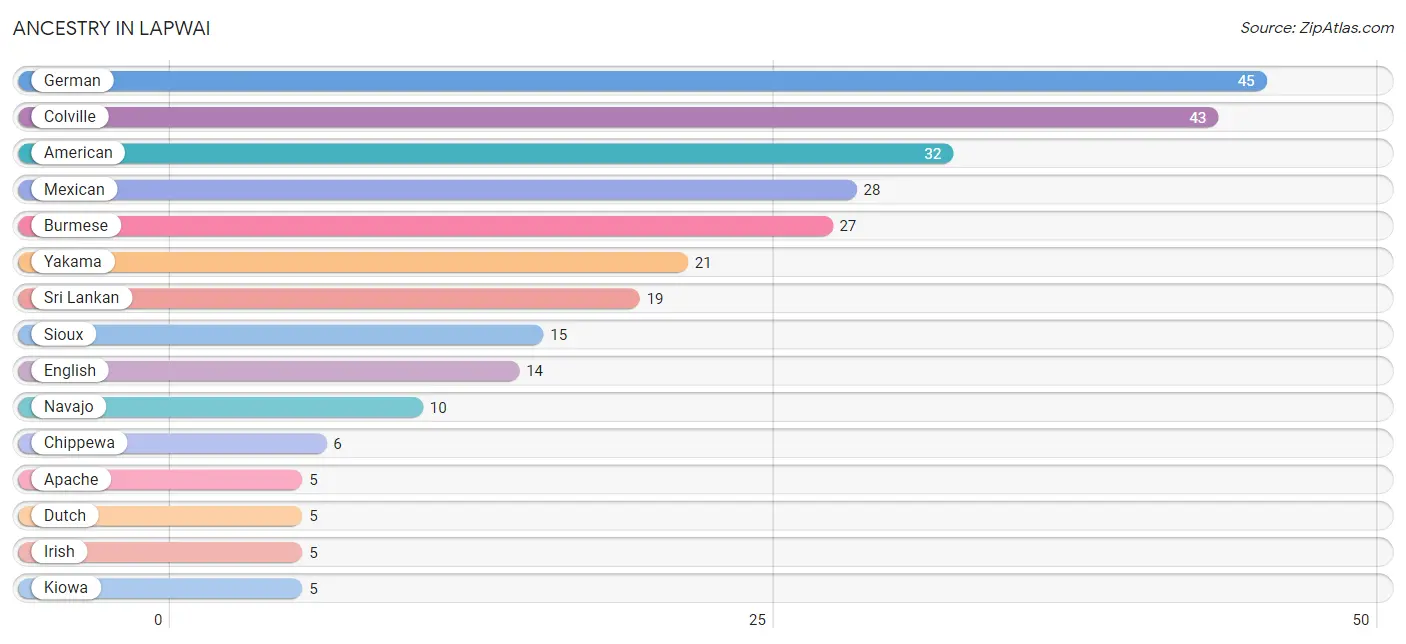
| Ancestry | # Population | % Population |
| American | 32 | 2.4% |
| Apache | 5 | 0.4% |
| Austrian | 2 | 0.2% |
| Burmese | 27 | 2.1% |
| Central American | 4 | 0.3% |
| Chippewa | 6 | 0.5% |
| Colville | 43 | 3.3% |
| Costa Rican | 4 | 0.3% |
| Crow | 2 | 0.2% |
| Dutch | 5 | 0.4% |
| English | 14 | 1.1% |
| French | 2 | 0.2% |
| French Canadian | 3 | 0.2% |
| German | 45 | 3.4% |
| Irish | 5 | 0.4% |
| Kiowa | 5 | 0.4% |
| Korean | 1 | 0.1% |
| Mexican | 28 | 2.1% |
| Native Hawaiian | 5 | 0.4% |
| Navajo | 10 | 0.8% |
| Norwegian | 3 | 0.2% |
| Polish | 1 | 0.1% |
| Samoan | 2 | 0.2% |
| Scotch-Irish | 3 | 0.2% |
| Scottish | 2 | 0.2% |
| Sioux | 15 | 1.1% |
| Sri Lankan | 19 | 1.5% |
| Yakama | 21 | 1.6% | View All 28 Rows |
Immigrants in Lapwai
The most numerous immigrant groups reported in Lapwai came from Central America (4 | 0.3%), Guatemala (4 | 0.3%), Latin America (4 | 0.3%), Asia (2 | 0.2%), and Eastern Asia (2 | 0.2%), together accounting for 1.2% of all Lapwai residents.
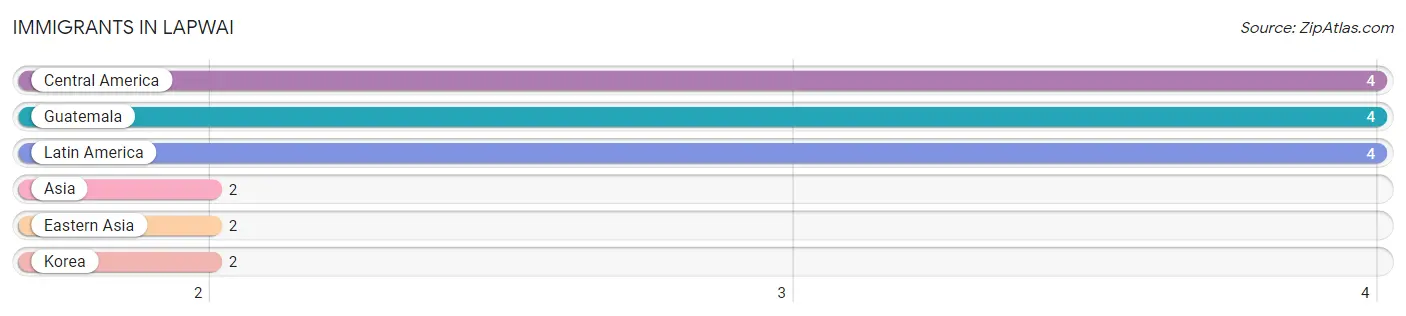
| Immigration Origin | # Population | % Population |
| Asia | 2 | 0.2% |
| Central America | 4 | 0.3% |
| Eastern Asia | 2 | 0.2% |
| Guatemala | 4 | 0.3% |
| Korea | 2 | 0.2% |
| Latin America | 4 | 0.3% | View All 6 Rows |
Sex and Age in Lapwai
Sex and Age in Lapwai
The most populous age groups in Lapwai are 5 to 9 Years (97 | 14.5%) for men and 30 to 34 Years (76 | 11.9%) for women.
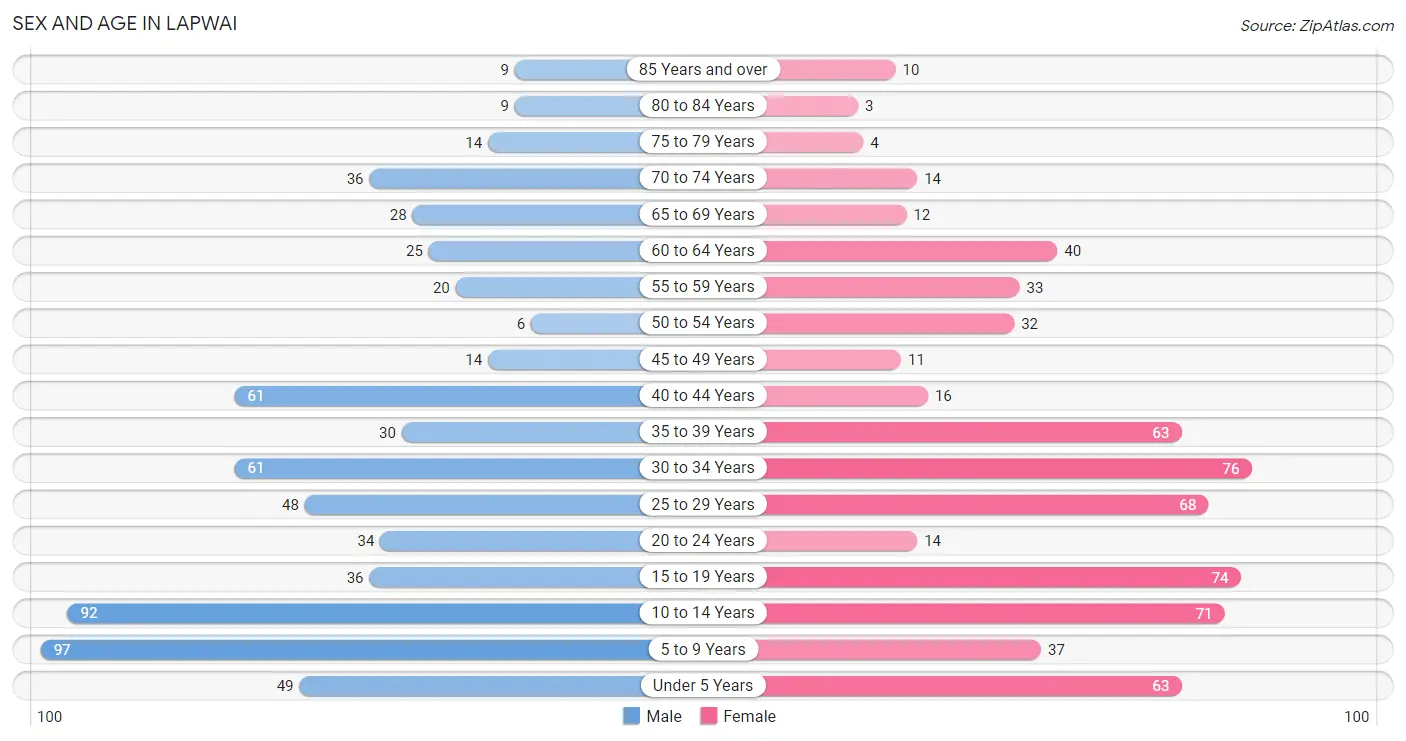
| Age Bracket | Male | Female |
| Under 5 Years | 49 (7.3%) | 63 (9.8%) |
| 5 to 9 Years | 97 (14.5%) | 37 (5.8%) |
| 10 to 14 Years | 92 (13.8%) | 71 (11.1%) |
| 15 to 19 Years | 36 (5.4%) | 74 (11.5%) |
| 20 to 24 Years | 34 (5.1%) | 14 (2.2%) |
| 25 to 29 Years | 48 (7.2%) | 68 (10.6%) |
| 30 to 34 Years | 61 (9.1%) | 76 (11.9%) |
| 35 to 39 Years | 30 (4.5%) | 63 (9.8%) |
| 40 to 44 Years | 61 (9.1%) | 16 (2.5%) |
| 45 to 49 Years | 14 (2.1%) | 11 (1.7%) |
| 50 to 54 Years | 6 (0.9%) | 32 (5.0%) |
| 55 to 59 Years | 20 (3.0%) | 33 (5.1%) |
| 60 to 64 Years | 25 (3.7%) | 40 (6.2%) |
| 65 to 69 Years | 28 (4.2%) | 12 (1.9%) |
| 70 to 74 Years | 36 (5.4%) | 14 (2.2%) |
| 75 to 79 Years | 14 (2.1%) | 4 (0.6%) |
| 80 to 84 Years | 9 (1.3%) | 3 (0.5%) |
| 85 Years and over | 9 (1.3%) | 10 (1.6%) |
| Total | 669 (100.0%) | 641 (100.0%) |
Families and Households in Lapwai
Median Family Size in Lapwai
The median family size in Lapwai is 4.08 persons per family, with single female/mother families (82 | 28.5%) accounting for the largest median family size of 4.87 persons per family. On the other hand, married-couple families (158 | 54.9%) represent the smallest median family size with 3.67 persons per family.
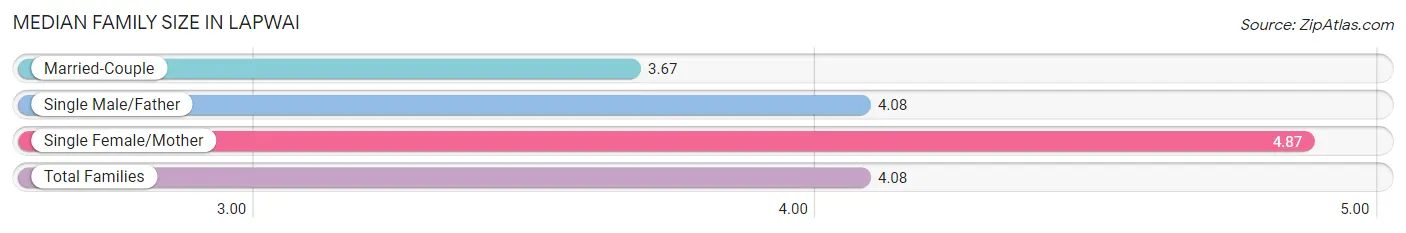
| Family Type | # Families | Family Size |
| Married-Couple | 158 (54.9%) | 3.67 |
| Single Male/Father | 48 (16.7%) | 4.08 |
| Single Female/Mother | 82 (28.5%) | 4.87 |
| Total Families | 288 (100.0%) | 4.08 |
Median Household Size in Lapwai
The median household size in Lapwai is 3.89 persons per household, with single female/mother households (82 | 24.6%) accounting for the largest median household size of 5.17 persons per household. non-family households (45 | 13.5%) represent the smallest median household size with 1.33 persons per household.
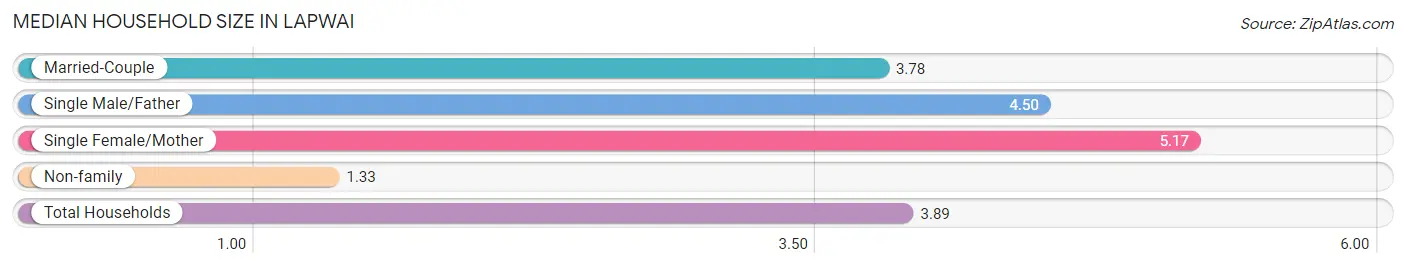
| Household Type | # Households | Household Size |
| Married-Couple | 158 (47.4%) | 3.78 |
| Single Male/Father | 48 (14.4%) | 4.50 |
| Single Female/Mother | 82 (24.6%) | 5.17 |
| Non-family | 45 (13.5%) | 1.33 |
| Total Households | 333 (100.0%) | 3.89 |
Household Size by Marriage Status in Lapwai
Out of a total of 333 households in Lapwai, 288 (86.5%) are family households, while 45 (13.5%) are nonfamily households. The most numerous type of family households are 4-person households, comprising 72, and the most common type of nonfamily households are 1-person households, comprising 38.
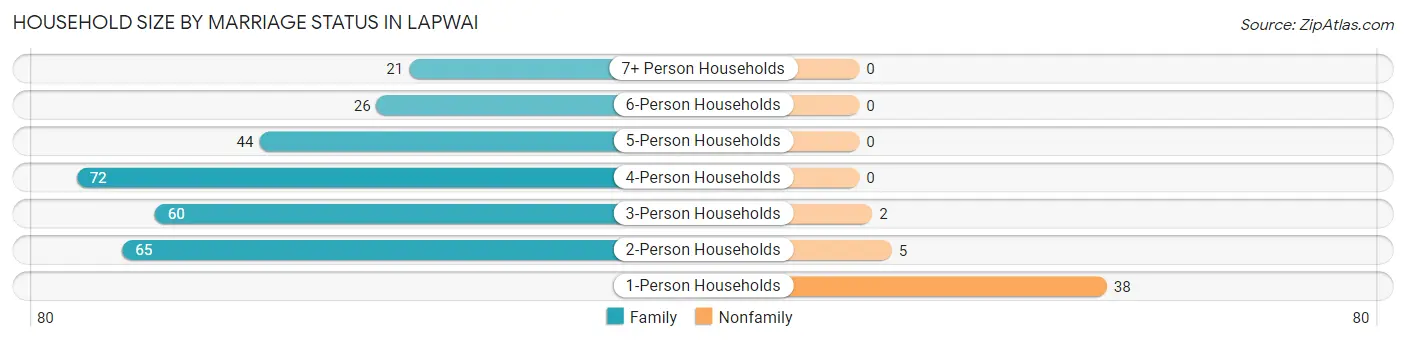
| Household Size | Family Households | Nonfamily Households |
| 1-Person Households | - | 38 (11.4%) |
| 2-Person Households | 65 (19.5%) | 5 (1.5%) |
| 3-Person Households | 60 (18.0%) | 2 (0.6%) |
| 4-Person Households | 72 (21.6%) | 0 (0.0%) |
| 5-Person Households | 44 (13.2%) | 0 (0.0%) |
| 6-Person Households | 26 (7.8%) | 0 (0.0%) |
| 7+ Person Households | 21 (6.3%) | 0 (0.0%) |
| Total | 288 (86.5%) | 45 (13.5%) |
Female Fertility in Lapwai
Fertility by Age in Lapwai
Average fertility rate in Lapwai is 31.0 births per 1,000 women. Women in the age bracket of 35 to 50 years have the highest fertility rate with 43.0 births per 1,000 women. Women in the age bracket of 20 to 34 years acount for 60.0% of all women with births.
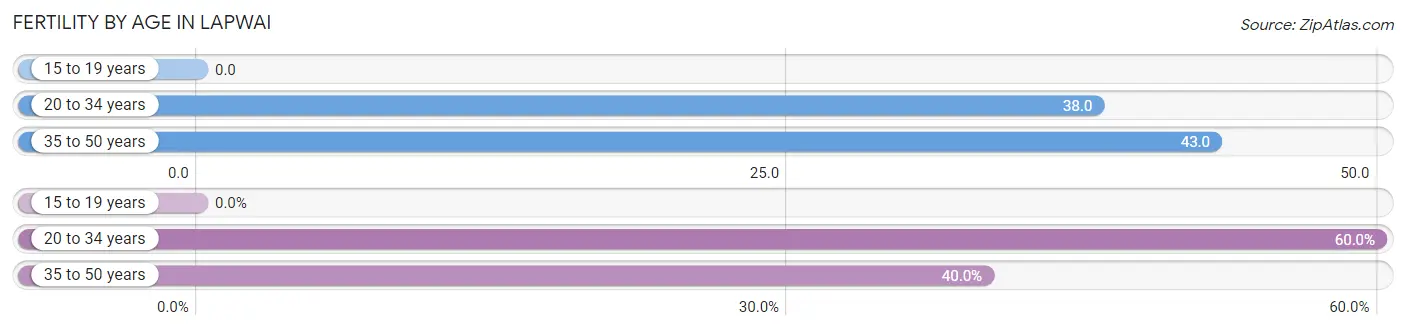
| Age Bracket | Women with Births | Births / 1,000 Women |
| 15 to 19 years | 0 (0.0%) | 0.0 |
| 20 to 34 years | 6 (60.0%) | 38.0 |
| 35 to 50 years | 4 (40.0%) | 43.0 |
| Total | 10 (100.0%) | 31.0 |
Fertility by Age by Marriage Status in Lapwai
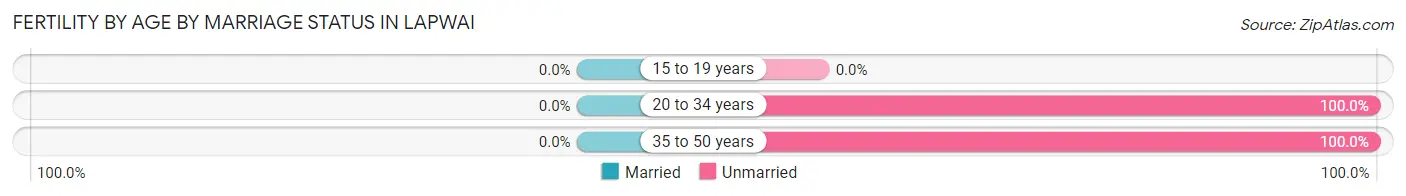
| Age Bracket | Married | Unmarried |
| 15 to 19 years | 0 (0.0%) | 0 (0.0%) |
| 20 to 34 years | 0 (0.0%) | 6 (100.0%) |
| 35 to 50 years | 0 (0.0%) | 4 (100.0%) |
| Total | 0 (0.0%) | 10 (100.0%) |
Fertility by Education in Lapwai
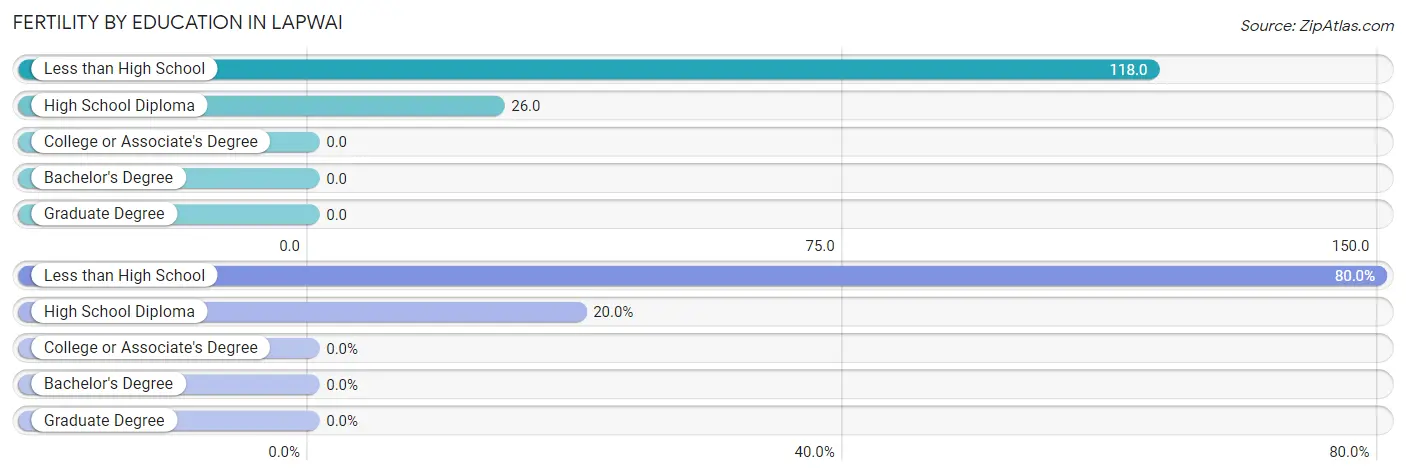
| Educational Attainment | Women with Births | Births / 1,000 Women |
| Less than High School | 8 (80.0%) | 118.0 |
| High School Diploma | 2 (20.0%) | 26.0 |
| College or Associate's Degree | 0 (0.0%) | 0.0 |
| Bachelor's Degree | 0 (0.0%) | 0.0 |
| Graduate Degree | 0 (0.0%) | 0.0 |
| Total | 10 (100.0%) | 31.0 |
Fertility by Education by Marriage Status in Lapwai
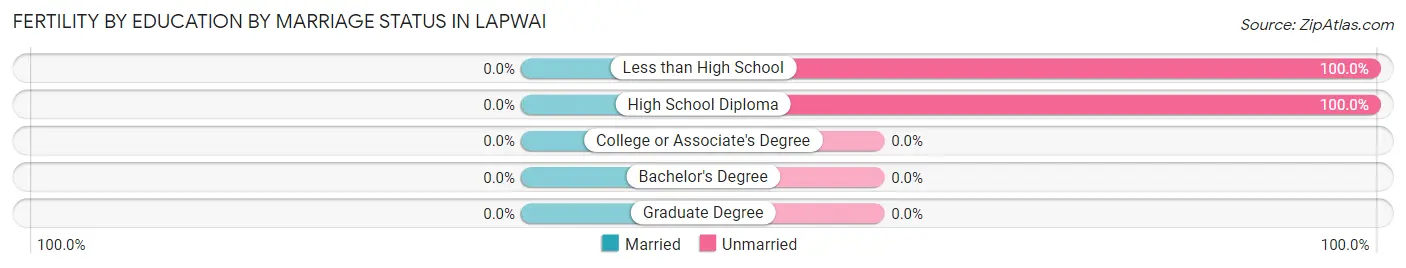
| Educational Attainment | Married | Unmarried |
| Less than High School | 0 (0.0%) | 8 (100.0%) |
| High School Diploma | 0 (0.0%) | 2 (100.0%) |
| College or Associate's Degree | 0 (0.0%) | 0 (0.0%) |
| Bachelor's Degree | 0 (0.0%) | 0 (0.0%) |
| Graduate Degree | 0 (0.0%) | 0 (0.0%) |
| Total | 0 (0.0%) | 10 (100.0%) |
Employment Characteristics in Lapwai
Employment by Class of Employer in Lapwai
Among the 443 employed individuals in Lapwai, local government employees (155 | 35.0%), private company employees (154 | 34.8%), and federal government employees (100 | 22.6%) make up the most common classes of employment.
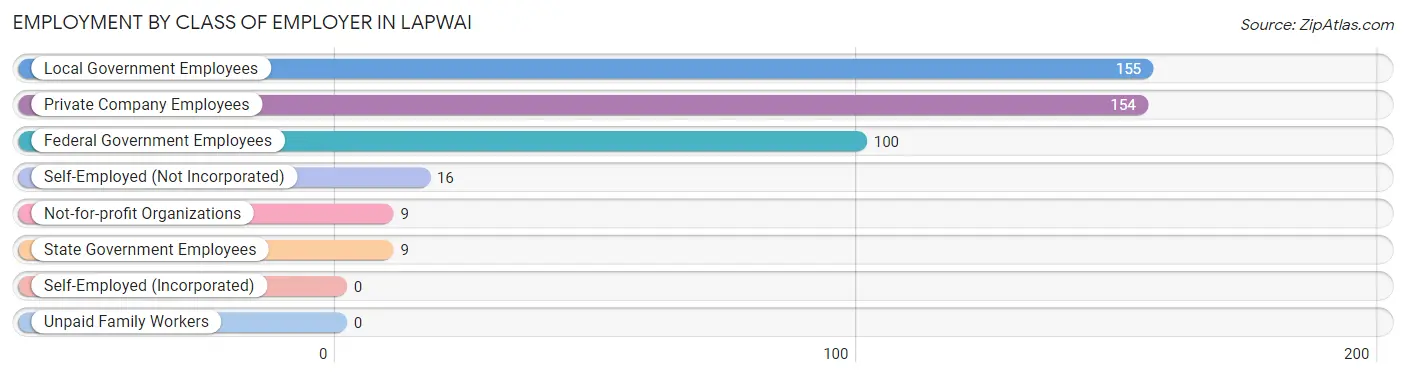
| Employer Class | # Employees | % Employees |
| Private Company Employees | 154 | 34.8% |
| Self-Employed (Incorporated) | 0 | 0.0% |
| Self-Employed (Not Incorporated) | 16 | 3.6% |
| Not-for-profit Organizations | 9 | 2.0% |
| Local Government Employees | 155 | 35.0% |
| State Government Employees | 9 | 2.0% |
| Federal Government Employees | 100 | 22.6% |
| Unpaid Family Workers | 0 | 0.0% |
| Total | 443 | 100.0% |
Employment Status by Age in Lapwai
According to the labor force statistics for Lapwai, out of the total population over 16 years of age (858), 59.3% or 509 individuals are in the labor force, with 9.6% or 49 of them unemployed. The age group with the highest labor force participation rate is 25 to 29 years, with 93.1% or 108 individuals in the labor force. Within the labor force, the 16 to 19 years age range has the highest percentage of unemployed individuals, with 18.2% or 2 of them being unemployed.
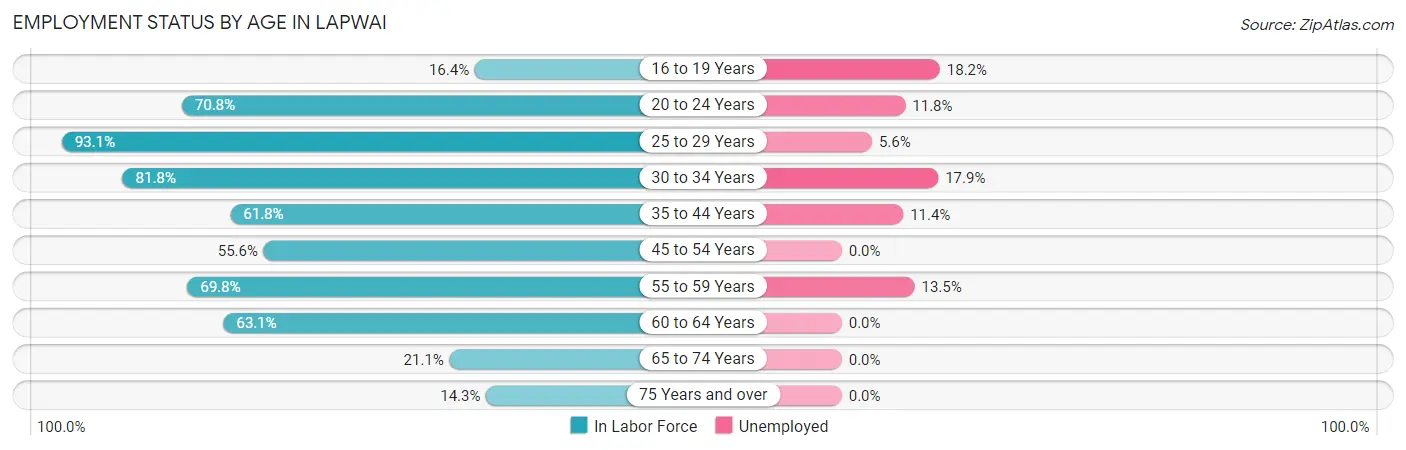
| Age Bracket | In Labor Force | Unemployed |
| 16 to 19 Years | 11 (16.4%) | 2 (18.2%) |
| 20 to 24 Years | 34 (70.8%) | 4 (11.8%) |
| 25 to 29 Years | 108 (93.1%) | 6 (5.6%) |
| 30 to 34 Years | 112 (81.8%) | 20 (17.9%) |
| 35 to 44 Years | 105 (61.8%) | 12 (11.4%) |
| 45 to 54 Years | 35 (55.6%) | 0 (0.0%) |
| 55 to 59 Years | 37 (69.8%) | 5 (13.5%) |
| 60 to 64 Years | 41 (63.1%) | 0 (0.0%) |
| 65 to 74 Years | 19 (21.1%) | 0 (0.0%) |
| 75 Years and over | 7 (14.3%) | 0 (0.0%) |
| Total | 509 (59.3%) | 49 (9.6%) |
Employment Status by Educational Attainment in Lapwai
According to labor force statistics for Lapwai, 72.5% of individuals (438) out of the total population between 25 and 64 years of age (604) are in the labor force, with 9.8% or 43 of them being unemployed. The group with the highest labor force participation rate are those with the educational attainment of bachelor's degree or higher, with 86.1% or 99 individuals in the labor force. Within the labor force, individuals with high school diploma education have the highest percentage of unemployment, with 22.0% or 29 of them being unemployed.
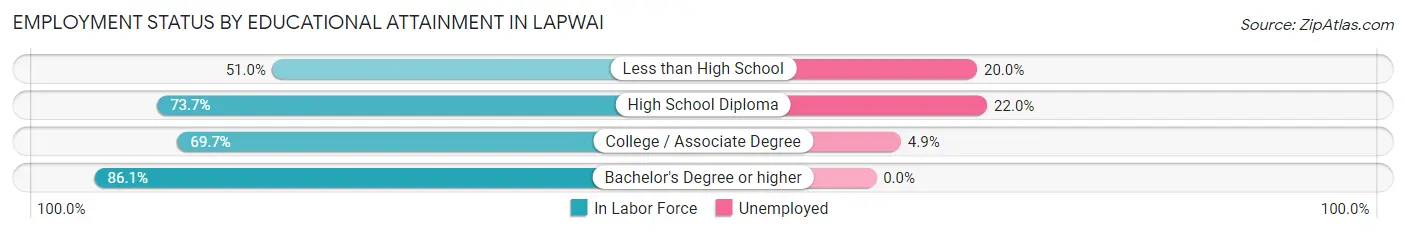
| Educational Attainment | In Labor Force | Unemployed |
| Less than High School | 25 (51.0%) | 10 (20.0%) |
| High School Diploma | 132 (73.7%) | 39 (22.0%) |
| College / Associate Degree | 182 (69.7%) | 13 (4.9%) |
| Bachelor's Degree or higher | 99 (86.1%) | 0 (0.0%) |
| Total | 438 (72.5%) | 59 (9.8%) |
Employment Occupations by Sex in Lapwai
Management, Business, Science and Arts Occupations
The most common Management, Business, Science and Arts occupations in Lapwai are Community & Social Service (92 | 20.0%), Education Instruction & Library (54 | 11.7%), Management (43 | 9.3%), Education, Arts & Media (30 | 6.5%), and Health Diagnosing & Treating (15 | 3.3%).
Management, Business, Science and Arts Occupations by Sex
Within the Management, Business, Science and Arts occupations in Lapwai, the most male-oriented occupations are Computers, Engineering & Science (100.0%), Computers & Mathematics (100.0%), and Arts, Media & Entertainment (100.0%), while the most female-oriented occupations are Legal Services & Support (100.0%), Health Diagnosing & Treating (100.0%), and Health Technologists (100.0%).
| Occupation | Male | Female |
| Management | 14 (32.6%) | 29 (67.4%) |
| Business & Financial | 0 (0.0%) | 0 (0.0%) |
| Computers, Engineering & Science | 11 (100.0%) | 0 (0.0%) |
| Computers & Mathematics | 11 (100.0%) | 0 (0.0%) |
| Architecture & Engineering | 0 (0.0%) | 0 (0.0%) |
| Life, Physical & Social Science | 0 (0.0%) | 0 (0.0%) |
| Community & Social Service | 20 (21.7%) | 72 (78.3%) |
| Education, Arts & Media | 3 (10.0%) | 27 (90.0%) |
| Legal Services & Support | 0 (0.0%) | 6 (100.0%) |
| Education Instruction & Library | 15 (27.8%) | 39 (72.2%) |
| Arts, Media & Entertainment | 2 (100.0%) | 0 (0.0%) |
| Health Diagnosing & Treating | 0 (0.0%) | 15 (100.0%) |
| Health Technologists | 0 (0.0%) | 7 (100.0%) |
| Total (Category) | 45 (28.0%) | 116 (72.1%) |
| Total (Overall) | 209 (45.4%) | 251 (54.6%) |
Services Occupations
The most common Services occupations in Lapwai are Cleaning & Maintenance (58 | 12.6%), Food Preparation & Serving (30 | 6.5%), Security & Protection (23 | 5.0%), Firefighting & Prevention (15 | 3.3%), and Personal Care & Service (15 | 3.3%).
Services Occupations by Sex
Within the Services occupations in Lapwai, the most male-oriented occupations are Law Enforcement (100.0%), Security & Protection (78.3%), and Cleaning & Maintenance (72.4%), while the most female-oriented occupations are Food Preparation & Serving (83.3%), Healthcare Support (50.0%), and Personal Care & Service (40.0%).
| Occupation | Male | Female |
| Healthcare Support | 3 (50.0%) | 3 (50.0%) |
| Security & Protection | 18 (78.3%) | 5 (21.7%) |
| Firefighting & Prevention | 10 (66.7%) | 5 (33.3%) |
| Law Enforcement | 8 (100.0%) | 0 (0.0%) |
| Food Preparation & Serving | 5 (16.7%) | 25 (83.3%) |
| Cleaning & Maintenance | 42 (72.4%) | 16 (27.6%) |
| Personal Care & Service | 9 (60.0%) | 6 (40.0%) |
| Total (Category) | 77 (58.3%) | 55 (41.7%) |
| Total (Overall) | 209 (45.4%) | 251 (54.6%) |
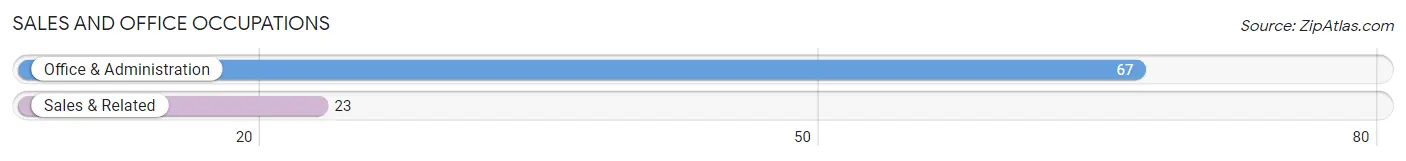
Sales and Office Occupations
The most common Sales and Office occupations in Lapwai are Office & Administration (67 | 14.6%), and Sales & Related (23 | 5.0%).
Sales and Office Occupations by Sex
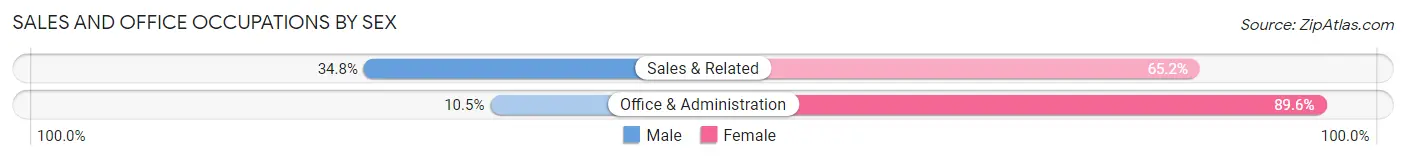
| Occupation | Male | Female |
| Sales & Related | 8 (34.8%) | 15 (65.2%) |
| Office & Administration | 7 (10.4%) | 60 (89.5%) |
| Total (Category) | 15 (16.7%) | 75 (83.3%) |
| Total (Overall) | 209 (45.4%) | 251 (54.6%) |
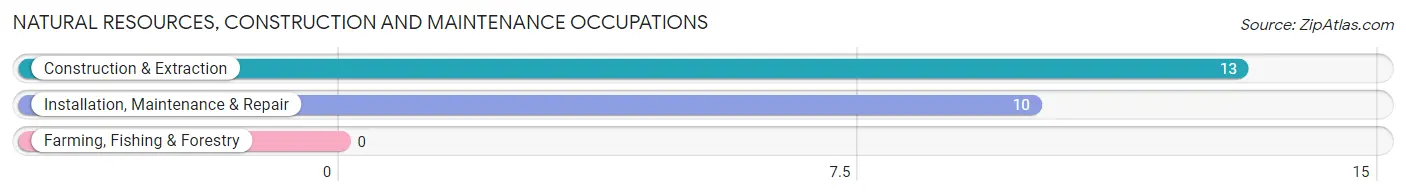
Natural Resources, Construction and Maintenance Occupations
The most common Natural Resources, Construction and Maintenance occupations in Lapwai are Construction & Extraction (13 | 2.8%), and Installation, Maintenance & Repair (10 | 2.2%).
Natural Resources, Construction and Maintenance Occupations by Sex
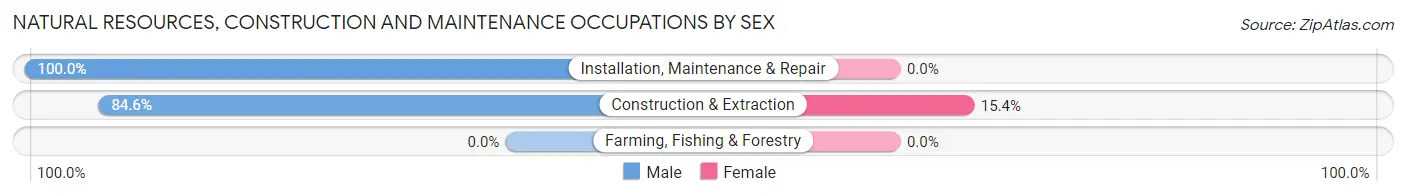
| Occupation | Male | Female |
| Farming, Fishing & Forestry | 0 (0.0%) | 0 (0.0%) |
| Construction & Extraction | 11 (84.6%) | 2 (15.4%) |
| Installation, Maintenance & Repair | 10 (100.0%) | 0 (0.0%) |
| Total (Category) | 21 (91.3%) | 2 (8.7%) |
| Total (Overall) | 209 (45.4%) | 251 (54.6%) |
Production, Transportation and Moving Occupations
The most common Production, Transportation and Moving occupations in Lapwai are Material Moving (21 | 4.6%), Transportation (18 | 3.9%), and Production (15 | 3.3%).
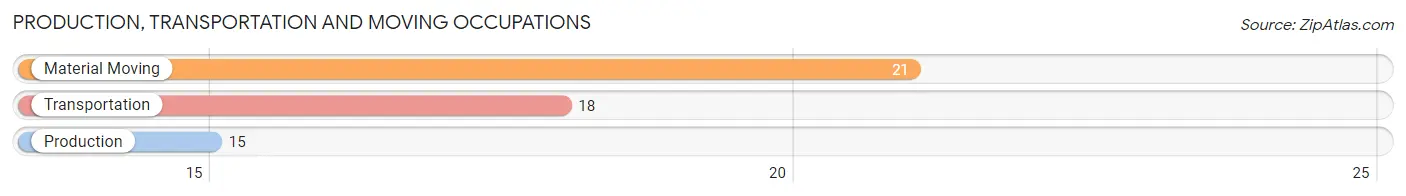
Production, Transportation and Moving Occupations by Sex
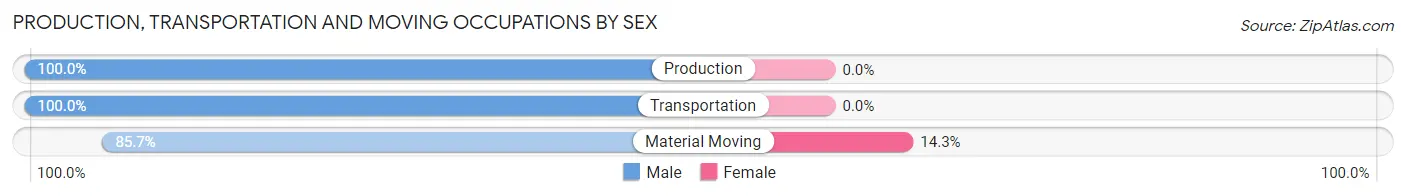
| Occupation | Male | Female |
| Production | 15 (100.0%) | 0 (0.0%) |
| Transportation | 18 (100.0%) | 0 (0.0%) |
| Material Moving | 18 (85.7%) | 3 (14.3%) |
| Total (Category) | 51 (94.4%) | 3 (5.6%) |
| Total (Overall) | 209 (45.4%) | 251 (54.6%) |
Employment Industries by Sex in Lapwai
Employment Industries in Lapwai
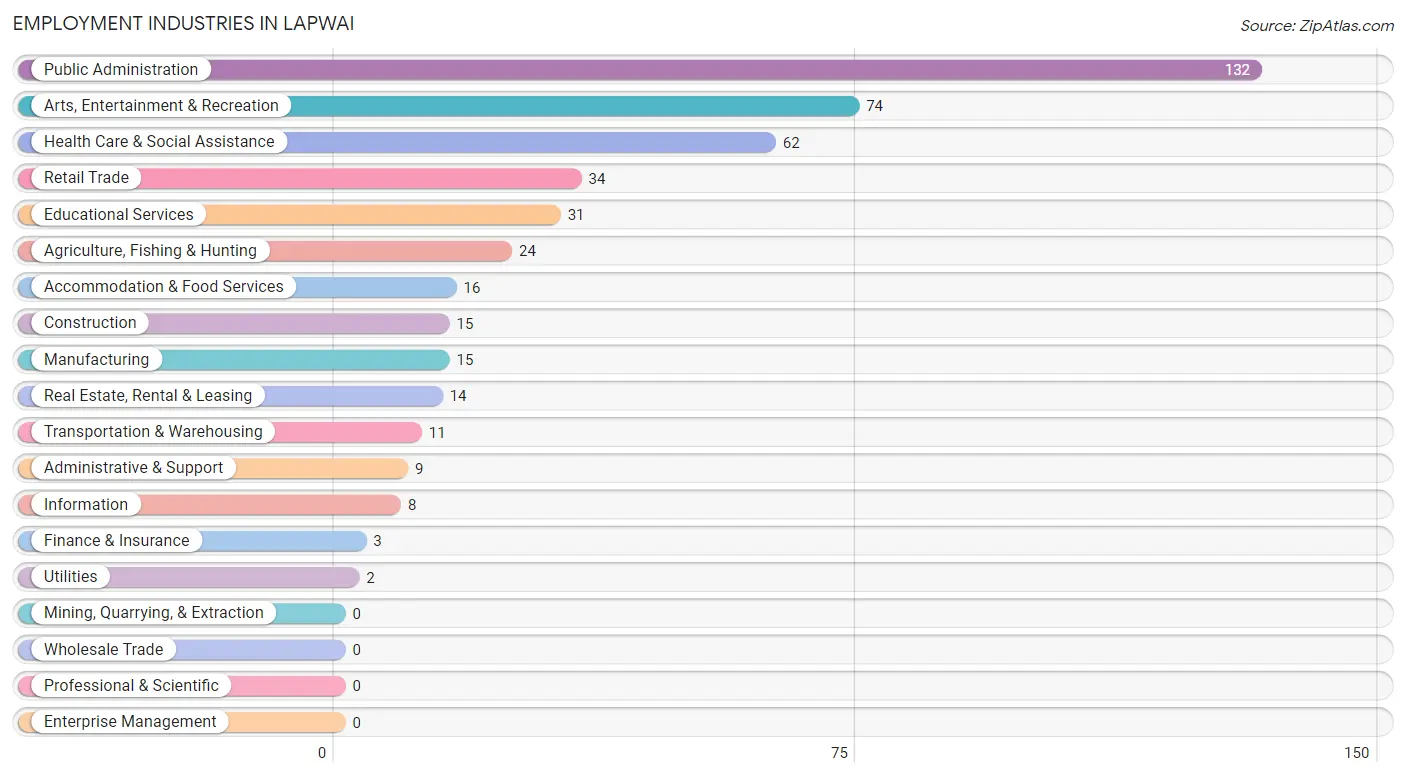
The major employment industries in Lapwai include Public Administration (132 | 28.7%), Arts, Entertainment & Recreation (74 | 16.1%), Health Care & Social Assistance (62 | 13.5%), Retail Trade (34 | 7.4%), and Educational Services (31 | 6.7%).
Employment Industries by Sex in Lapwai
The Lapwai industries that see more men than women are Utilities (100.0%), Administrative & Support (100.0%), and Agriculture, Fishing & Hunting (87.5%), whereas the industries that tend to have a higher number of women are Information (100.0%), Finance & Insurance (100.0%), and Accommodation & Food Services (87.5%).
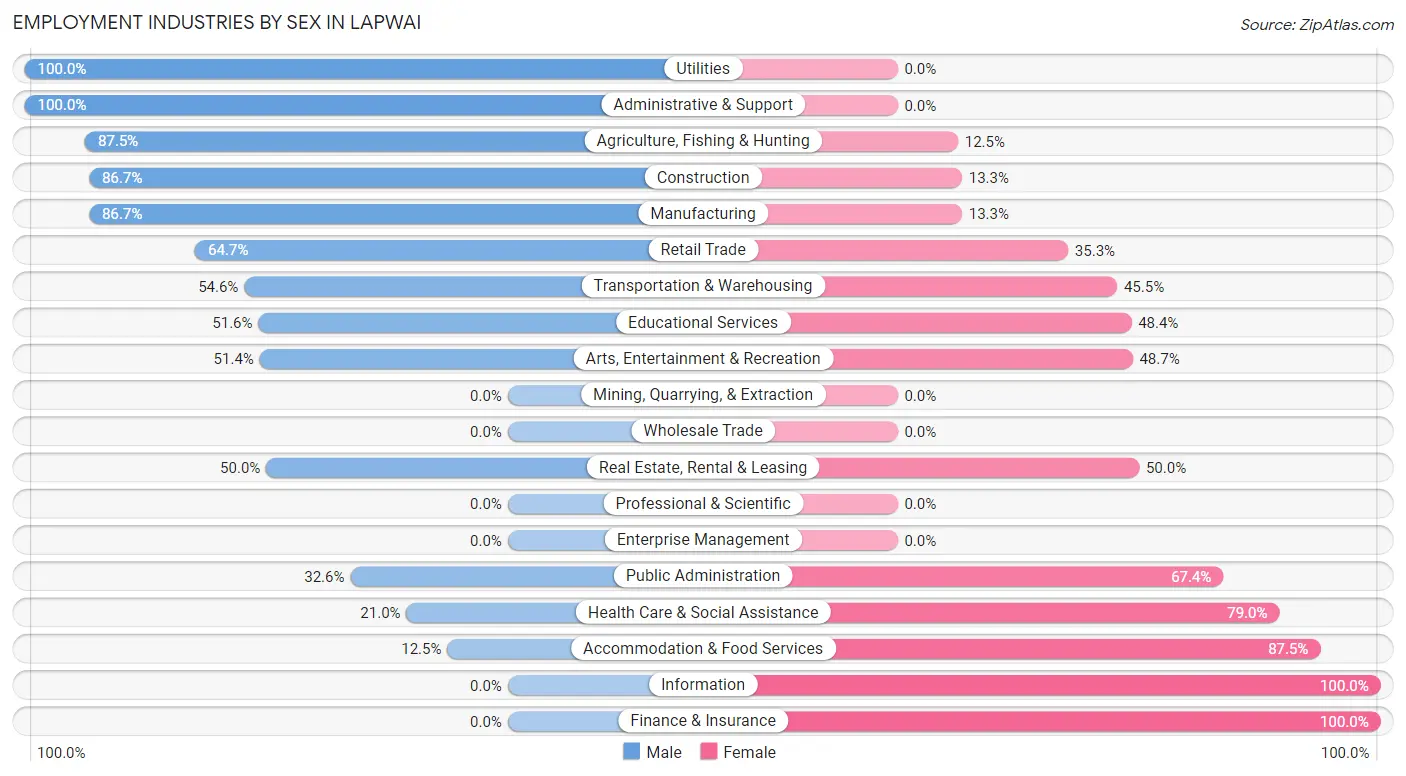
| Industry | Male | Female |
| Agriculture, Fishing & Hunting | 21 (87.5%) | 3 (12.5%) |
| Mining, Quarrying, & Extraction | 0 (0.0%) | 0 (0.0%) |
| Construction | 13 (86.7%) | 2 (13.3%) |
| Manufacturing | 13 (86.7%) | 2 (13.3%) |
| Wholesale Trade | 0 (0.0%) | 0 (0.0%) |
| Retail Trade | 22 (64.7%) | 12 (35.3%) |
| Transportation & Warehousing | 6 (54.5%) | 5 (45.5%) |
| Utilities | 2 (100.0%) | 0 (0.0%) |
| Information | 0 (0.0%) | 8 (100.0%) |
| Finance & Insurance | 0 (0.0%) | 3 (100.0%) |
| Real Estate, Rental & Leasing | 7 (50.0%) | 7 (50.0%) |
| Professional & Scientific | 0 (0.0%) | 0 (0.0%) |
| Enterprise Management | 0 (0.0%) | 0 (0.0%) |
| Administrative & Support | 9 (100.0%) | 0 (0.0%) |
| Educational Services | 16 (51.6%) | 15 (48.4%) |
| Health Care & Social Assistance | 13 (21.0%) | 49 (79.0%) |
| Arts, Entertainment & Recreation | 38 (51.3%) | 36 (48.6%) |
| Accommodation & Food Services | 2 (12.5%) | 14 (87.5%) |
| Public Administration | 43 (32.6%) | 89 (67.4%) |
| Total | 209 (45.4%) | 251 (54.6%) |
Education in Lapwai
School Enrollment in Lapwai
The most common levels of schooling among the 449 students in Lapwai are middle school (110 | 24.5%), high school (106 | 23.6%), and elementary school (98 | 21.8%).
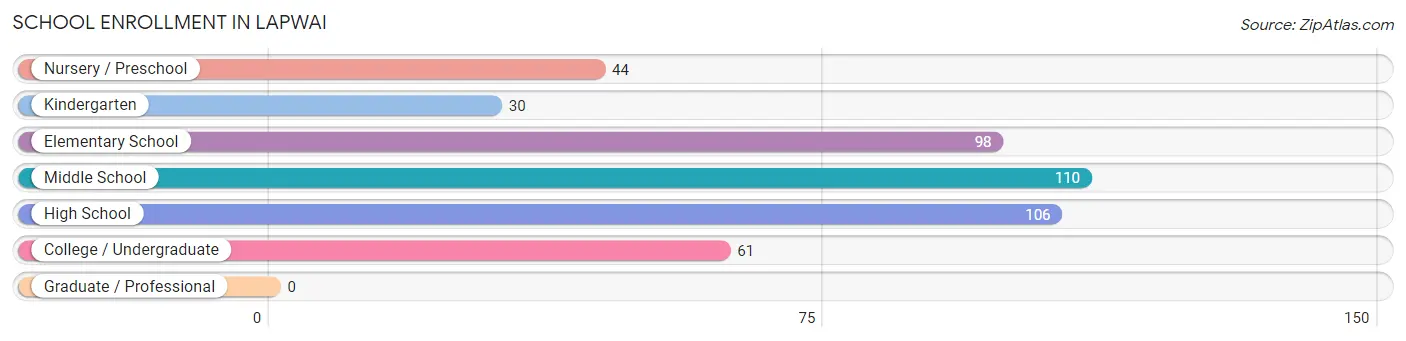
| School Level | # Students | % Students |
| Nursery / Preschool | 44 | 9.8% |
| Kindergarten | 30 | 6.7% |
| Elementary School | 98 | 21.8% |
| Middle School | 110 | 24.5% |
| High School | 106 | 23.6% |
| College / Undergraduate | 61 | 13.6% |
| Graduate / Professional | 0 | 0.0% |
| Total | 449 | 100.0% |
School Enrollment by Age by Funding Source in Lapwai
Out of a total of 449 students who are enrolled in schools in Lapwai, 45 (10.0%) attend a private institution, while the remaining 404 (90.0%) are enrolled in public schools. The age group of 18 to 19 year olds has the highest likelihood of being enrolled in private schools, with 16 (43.2% in the age bracket) enrolled. Conversely, the age group of 3 to 4 year olds has the lowest likelihood of being enrolled in a private school, with 36 (100.0% in the age bracket) attending a public institution.
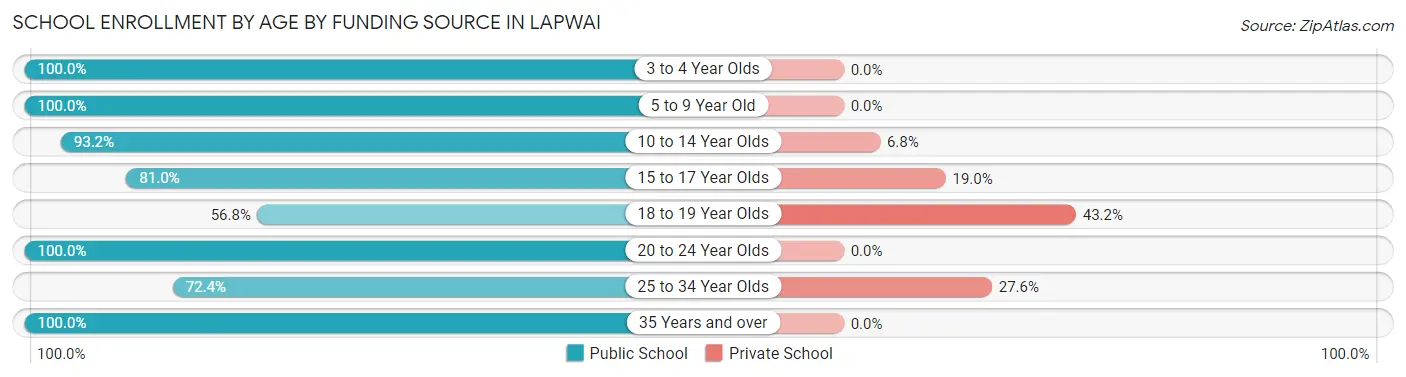
| Age Bracket | Public School | Private School |
| 3 to 4 Year Olds | 36 (100.0%) | 0 (0.0%) |
| 5 to 9 Year Old | 121 (100.0%) | 0 (0.0%) |
| 10 to 14 Year Olds | 138 (93.2%) | 10 (6.8%) |
| 15 to 17 Year Olds | 47 (81.0%) | 11 (19.0%) |
| 18 to 19 Year Olds | 21 (56.8%) | 16 (43.2%) |
| 20 to 24 Year Olds | 9 (100.0%) | 0 (0.0%) |
| 25 to 34 Year Olds | 21 (72.4%) | 8 (27.6%) |
| 35 Years and over | 11 (100.0%) | 0 (0.0%) |
| Total | 404 (90.0%) | 45 (10.0%) |
Educational Attainment by Field of Study in Lapwai
Education (34 | 25.0%), business (20 | 14.7%), arts & humanities (20 | 14.7%), liberal arts & history (13 | 9.6%), and bio, nature & agricultural (12 | 8.8%) are the most common fields of study among 136 individuals in Lapwai who have obtained a bachelor's degree or higher.
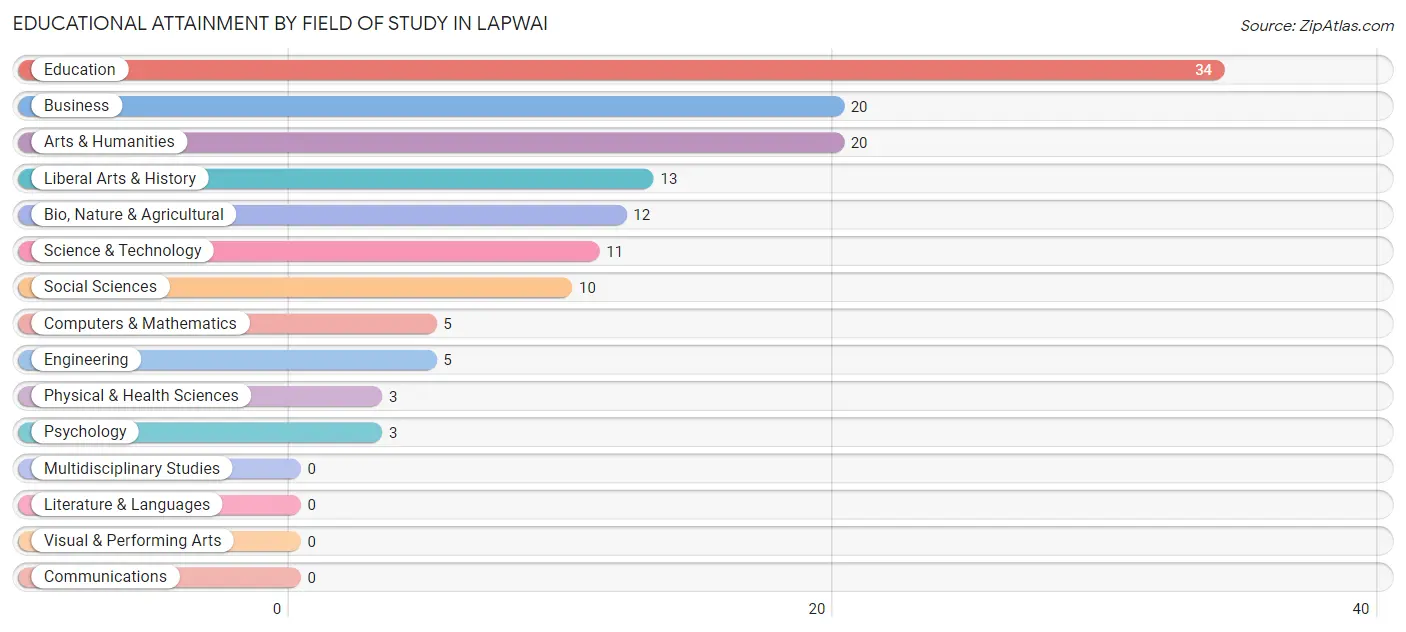
| Field of Study | # Graduates | % Graduates |
| Computers & Mathematics | 5 | 3.7% |
| Bio, Nature & Agricultural | 12 | 8.8% |
| Physical & Health Sciences | 3 | 2.2% |
| Psychology | 3 | 2.2% |
| Social Sciences | 10 | 7.3% |
| Engineering | 5 | 3.7% |
| Multidisciplinary Studies | 0 | 0.0% |
| Science & Technology | 11 | 8.1% |
| Business | 20 | 14.7% |
| Education | 34 | 25.0% |
| Literature & Languages | 0 | 0.0% |
| Liberal Arts & History | 13 | 9.6% |
| Visual & Performing Arts | 0 | 0.0% |
| Communications | 0 | 0.0% |
| Arts & Humanities | 20 | 14.7% |
| Total | 136 | 100.0% |
Transportation & Commute in Lapwai
Vehicle Availability by Sex in Lapwai
The most prevalent vehicle ownership categories in Lapwai are males with 2 vehicles (53, accounting for 26.9%) and females with 2 vehicles (49, making up 21.5%).
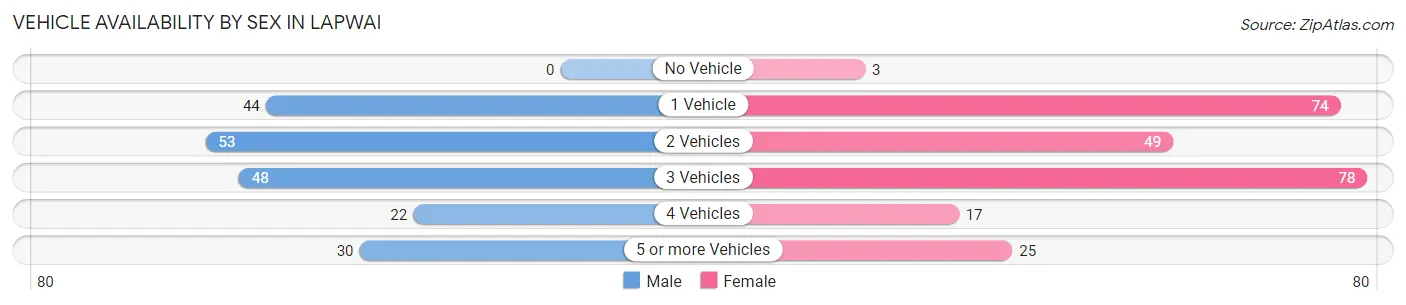
| Vehicles Available | Male | Female |
| No Vehicle | 0 (0.0%) | 3 (1.2%) |
| 1 Vehicle | 44 (22.3%) | 74 (30.1%) |
| 2 Vehicles | 53 (26.9%) | 49 (19.9%) |
| 3 Vehicles | 48 (24.4%) | 78 (31.7%) |
| 4 Vehicles | 22 (11.2%) | 17 (6.9%) |
| 5 or more Vehicles | 30 (15.2%) | 25 (10.2%) |
| Total | 197 (100.0%) | 246 (100.0%) |
Commute Time in Lapwai
The most frequently occuring commute durations in Lapwai are 5 to 9 minutes (113 commuters, 25.9%), less than 5 minutes (110 commuters, 25.2%), and 10 to 14 minutes (62 commuters, 14.2%).
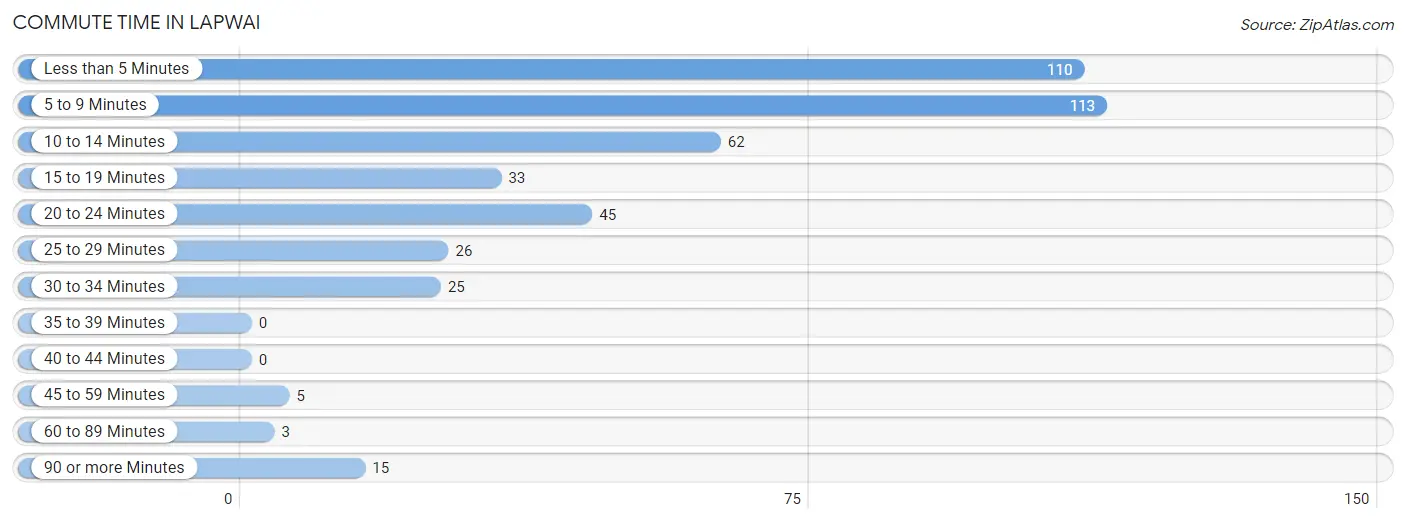
| Commute Time | # Commuters | % Commuters |
| Less than 5 Minutes | 110 | 25.2% |
| 5 to 9 Minutes | 113 | 25.9% |
| 10 to 14 Minutes | 62 | 14.2% |
| 15 to 19 Minutes | 33 | 7.5% |
| 20 to 24 Minutes | 45 | 10.3% |
| 25 to 29 Minutes | 26 | 5.9% |
| 30 to 34 Minutes | 25 | 5.7% |
| 35 to 39 Minutes | 0 | 0.0% |
| 40 to 44 Minutes | 0 | 0.0% |
| 45 to 59 Minutes | 5 | 1.1% |
| 60 to 89 Minutes | 3 | 0.7% |
| 90 or more Minutes | 15 | 3.4% |
Commute Time by Sex in Lapwai
The most common commute times in Lapwai are 20 to 24 minutes (42 commuters, 21.5%) for males and less than 5 minutes (79 commuters, 32.6%) for females.
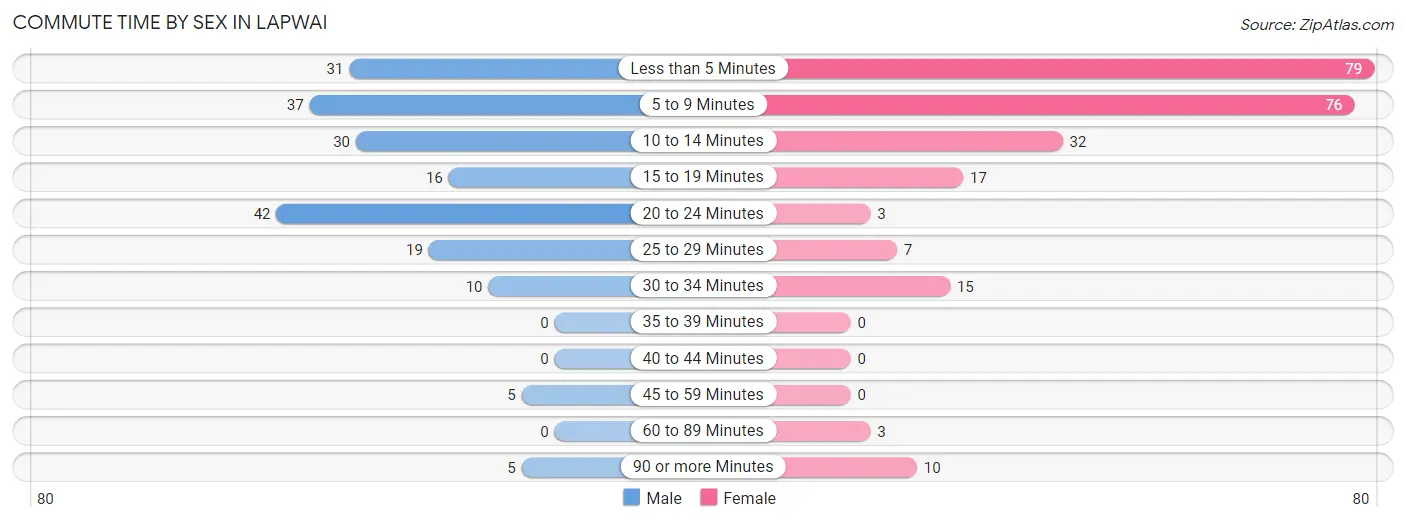
| Commute Time | Male | Female |
| Less than 5 Minutes | 31 (15.9%) | 79 (32.6%) |
| 5 to 9 Minutes | 37 (19.0%) | 76 (31.4%) |
| 10 to 14 Minutes | 30 (15.4%) | 32 (13.2%) |
| 15 to 19 Minutes | 16 (8.2%) | 17 (7.0%) |
| 20 to 24 Minutes | 42 (21.5%) | 3 (1.2%) |
| 25 to 29 Minutes | 19 (9.7%) | 7 (2.9%) |
| 30 to 34 Minutes | 10 (5.1%) | 15 (6.2%) |
| 35 to 39 Minutes | 0 (0.0%) | 0 (0.0%) |
| 40 to 44 Minutes | 0 (0.0%) | 0 (0.0%) |
| 45 to 59 Minutes | 5 (2.6%) | 0 (0.0%) |
| 60 to 89 Minutes | 0 (0.0%) | 3 (1.2%) |
| 90 or more Minutes | 5 (2.6%) | 10 (4.1%) |
Time of Departure to Work by Sex in Lapwai
The most frequent times of departure to work in Lapwai are 7:30 AM to 7:59 AM (51, 26.2%) for males and 7:30 AM to 7:59 AM (62, 25.6%) for females.
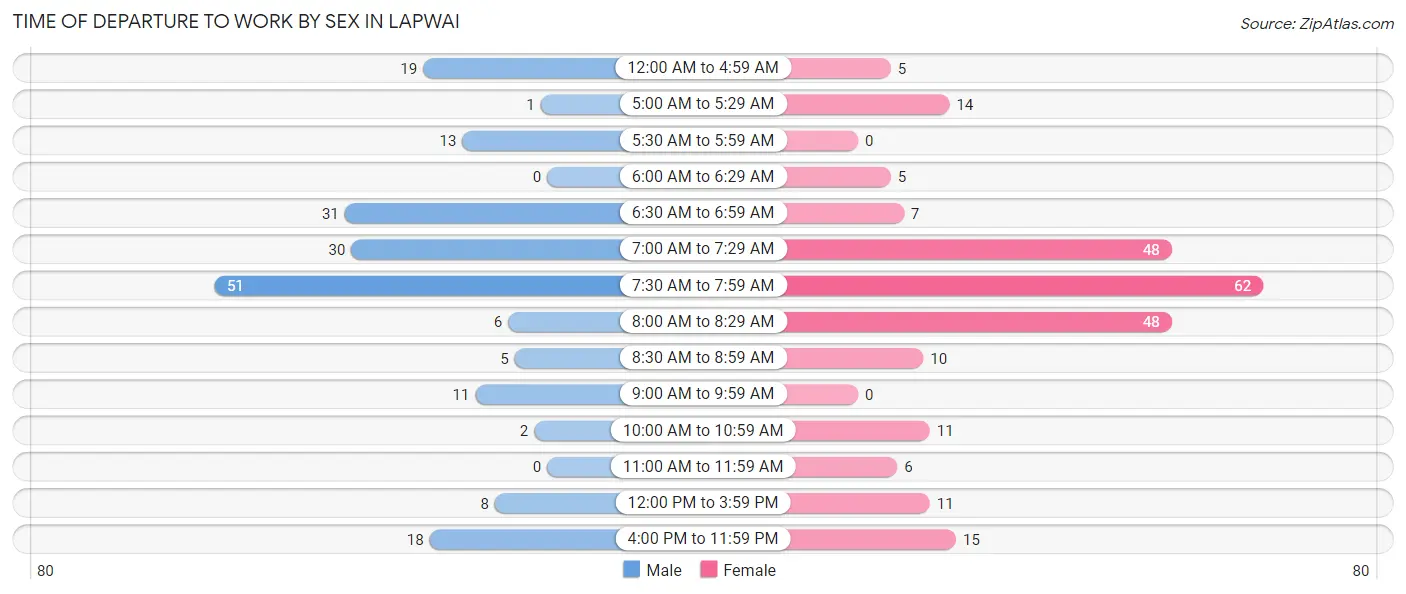
| Time of Departure | Male | Female |
| 12:00 AM to 4:59 AM | 19 (9.7%) | 5 (2.1%) |
| 5:00 AM to 5:29 AM | 1 (0.5%) | 14 (5.8%) |
| 5:30 AM to 5:59 AM | 13 (6.7%) | 0 (0.0%) |
| 6:00 AM to 6:29 AM | 0 (0.0%) | 5 (2.1%) |
| 6:30 AM to 6:59 AM | 31 (15.9%) | 7 (2.9%) |
| 7:00 AM to 7:29 AM | 30 (15.4%) | 48 (19.8%) |
| 7:30 AM to 7:59 AM | 51 (26.2%) | 62 (25.6%) |
| 8:00 AM to 8:29 AM | 6 (3.1%) | 48 (19.8%) |
| 8:30 AM to 8:59 AM | 5 (2.6%) | 10 (4.1%) |
| 9:00 AM to 9:59 AM | 11 (5.6%) | 0 (0.0%) |
| 10:00 AM to 10:59 AM | 2 (1.0%) | 11 (4.5%) |
| 11:00 AM to 11:59 AM | 0 (0.0%) | 6 (2.5%) |
| 12:00 PM to 3:59 PM | 8 (4.1%) | 11 (4.5%) |
| 4:00 PM to 11:59 PM | 18 (9.2%) | 15 (6.2%) |
| Total | 195 (100.0%) | 242 (100.0%) |
Housing Occupancy in Lapwai
Occupancy by Ownership in Lapwai
Of the total 333 dwellings in Lapwai, owner-occupied units account for 191 (57.4%), while renter-occupied units make up 142 (42.6%).
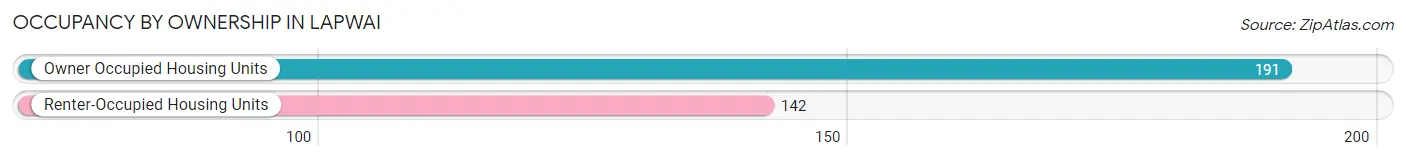
| Occupancy | # Housing Units | % Housing Units |
| Owner Occupied Housing Units | 191 | 57.4% |
| Renter-Occupied Housing Units | 142 | 42.6% |
| Total Occupied Housing Units | 333 | 100.0% |
Occupancy by Household Size in Lapwai
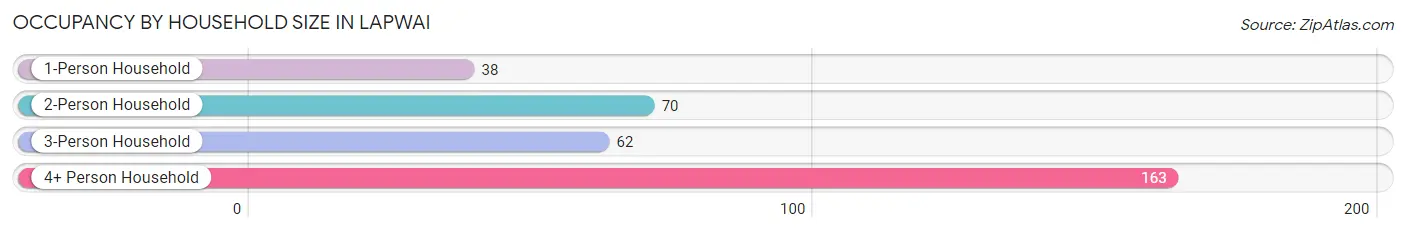
| Household Size | # Housing Units | % Housing Units |
| 1-Person Household | 38 | 11.4% |
| 2-Person Household | 70 | 21.0% |
| 3-Person Household | 62 | 18.6% |
| 4+ Person Household | 163 | 48.9% |
| Total Housing Units | 333 | 100.0% |
Occupancy by Ownership by Household Size in Lapwai
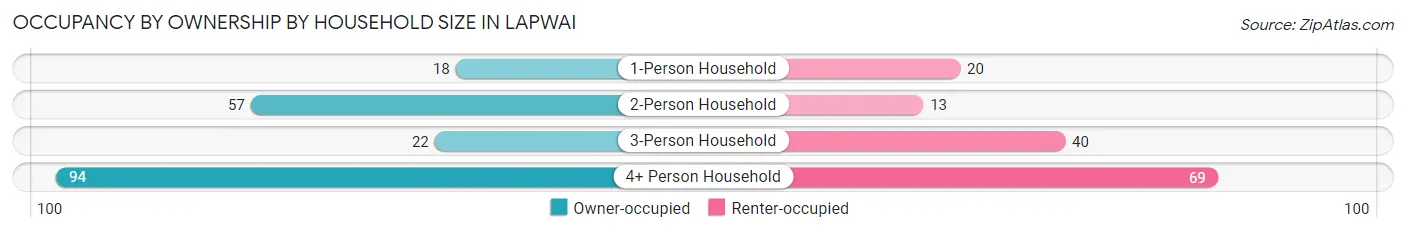
| Household Size | Owner-occupied | Renter-occupied |
| 1-Person Household | 18 (47.4%) | 20 (52.6%) |
| 2-Person Household | 57 (81.4%) | 13 (18.6%) |
| 3-Person Household | 22 (35.5%) | 40 (64.5%) |
| 4+ Person Household | 94 (57.7%) | 69 (42.3%) |
| Total Housing Units | 191 (57.4%) | 142 (42.6%) |
Occupancy by Educational Attainment in Lapwai
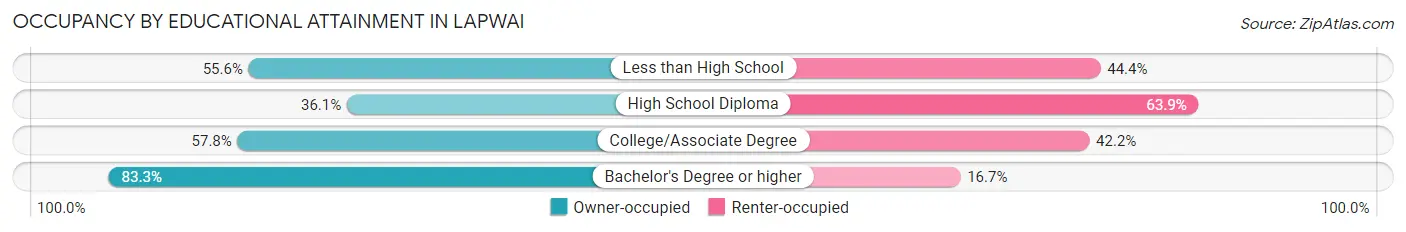
| Household Size | Owner-occupied | Renter-occupied |
| Less than High School | 10 (55.6%) | 8 (44.4%) |
| High School Diploma | 22 (36.1%) | 39 (63.9%) |
| College/Associate Degree | 119 (57.8%) | 87 (42.2%) |
| Bachelor's Degree or higher | 40 (83.3%) | 8 (16.7%) |
Occupancy by Age of Householder in Lapwai
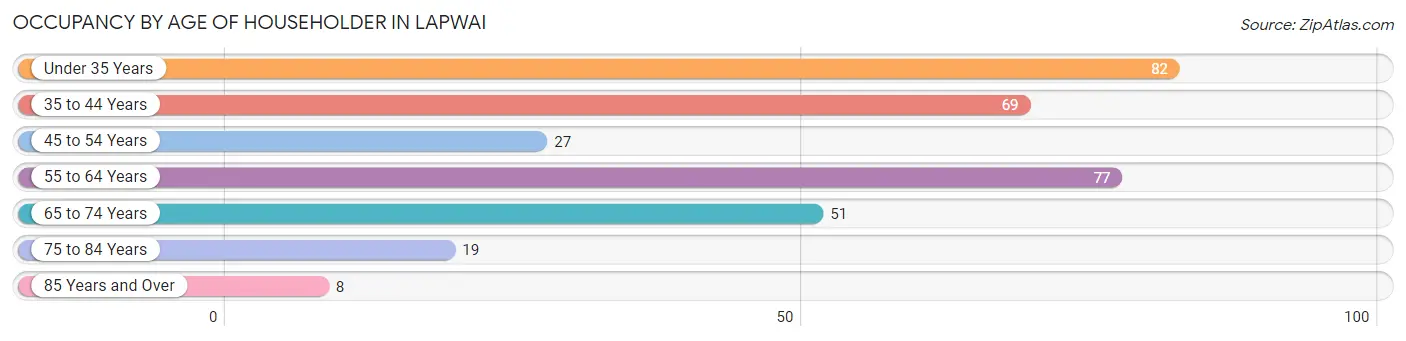
| Age Bracket | # Households | % Households |
| Under 35 Years | 82 | 24.6% |
| 35 to 44 Years | 69 | 20.7% |
| 45 to 54 Years | 27 | 8.1% |
| 55 to 64 Years | 77 | 23.1% |
| 65 to 74 Years | 51 | 15.3% |
| 75 to 84 Years | 19 | 5.7% |
| 85 Years and Over | 8 | 2.4% |
| Total | 333 | 100.0% |
Housing Finances in Lapwai
Median Income by Occupancy in Lapwai
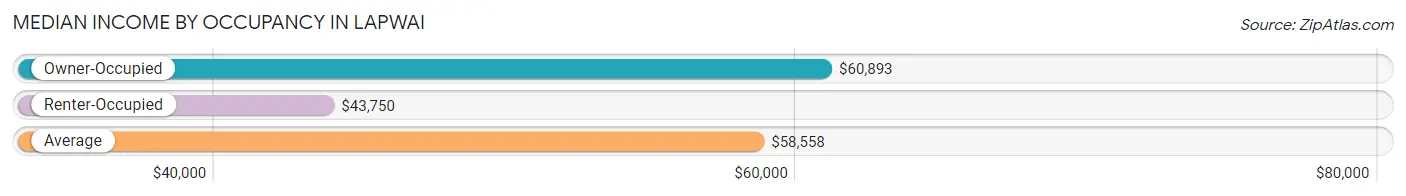
| Occupancy Type | # Households | Median Income |
| Owner-Occupied | 191 (57.4%) | $60,893 |
| Renter-Occupied | 142 (42.6%) | $43,750 |
| Average | 333 (100.0%) | $58,558 |
Occupancy by Householder Income Bracket in Lapwai
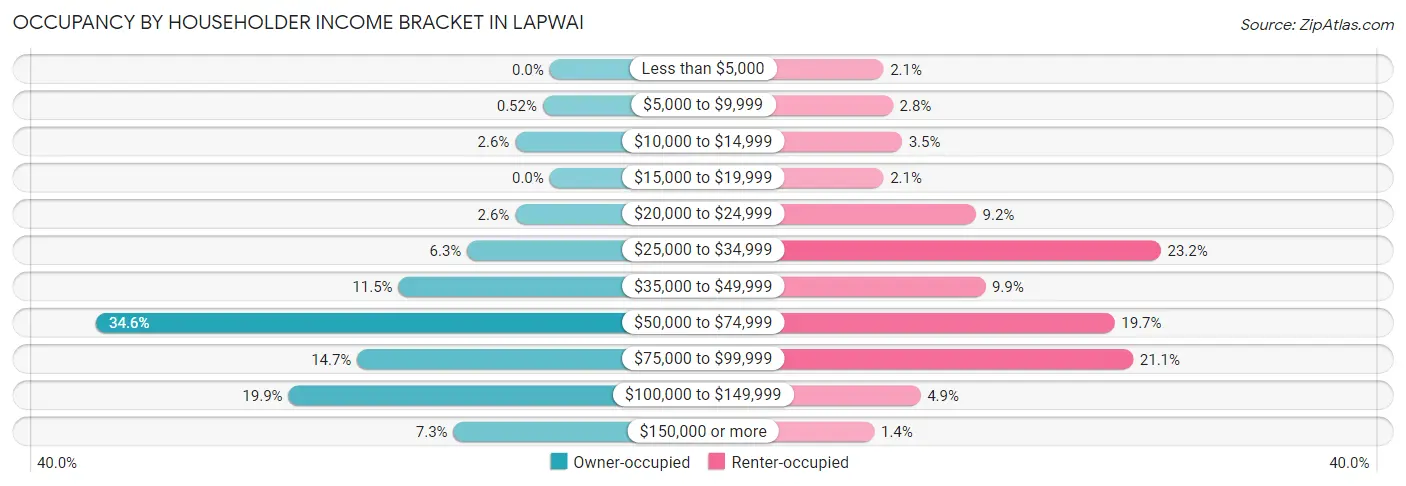
| Income Bracket | Owner-occupied | Renter-occupied |
| Less than $5,000 | 0 (0.0%) | 3 (2.1%) |
| $5,000 to $9,999 | 1 (0.5%) | 4 (2.8%) |
| $10,000 to $14,999 | 5 (2.6%) | 5 (3.5%) |
| $15,000 to $19,999 | 0 (0.0%) | 3 (2.1%) |
| $20,000 to $24,999 | 5 (2.6%) | 13 (9.1%) |
| $25,000 to $34,999 | 12 (6.3%) | 33 (23.2%) |
| $35,000 to $49,999 | 22 (11.5%) | 14 (9.9%) |
| $50,000 to $74,999 | 66 (34.5%) | 28 (19.7%) |
| $75,000 to $99,999 | 28 (14.7%) | 30 (21.1%) |
| $100,000 to $149,999 | 38 (19.9%) | 7 (4.9%) |
| $150,000 or more | 14 (7.3%) | 2 (1.4%) |
| Total | 191 (100.0%) | 142 (100.0%) |
Monthly Housing Cost Tiers in Lapwai
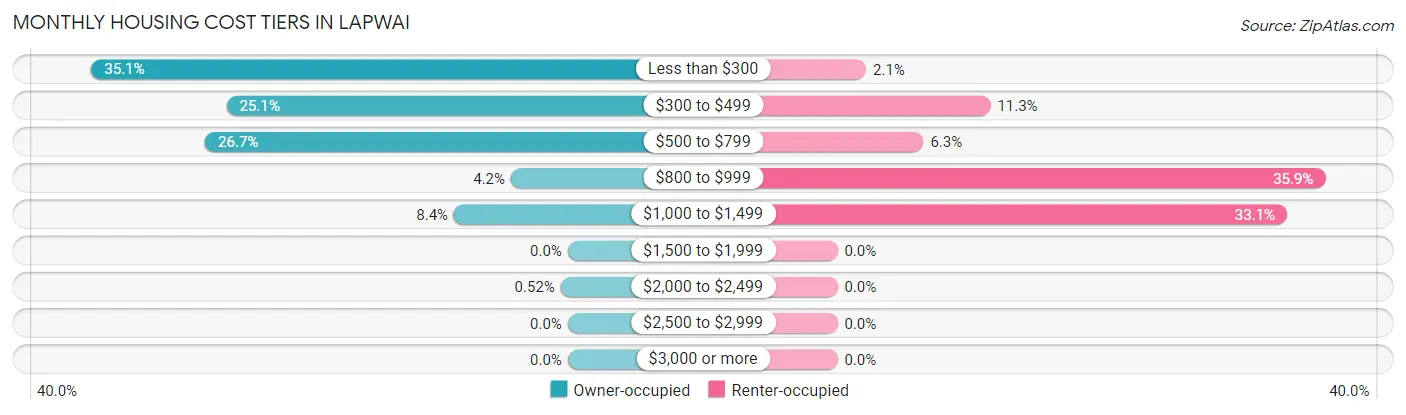
| Monthly Cost | Owner-occupied | Renter-occupied |
| Less than $300 | 67 (35.1%) | 3 (2.1%) |
| $300 to $499 | 48 (25.1%) | 16 (11.3%) |
| $500 to $799 | 51 (26.7%) | 9 (6.3%) |
| $800 to $999 | 8 (4.2%) | 51 (35.9%) |
| $1,000 to $1,499 | 16 (8.4%) | 47 (33.1%) |
| $1,500 to $1,999 | 0 (0.0%) | 0 (0.0%) |
| $2,000 to $2,499 | 1 (0.5%) | 0 (0.0%) |
| $2,500 to $2,999 | 0 (0.0%) | 0 (0.0%) |
| $3,000 or more | 0 (0.0%) | 0 (0.0%) |
| Total | 191 (100.0%) | 142 (100.0%) |
Physical Housing Characteristics in Lapwai
Housing Structures in Lapwai
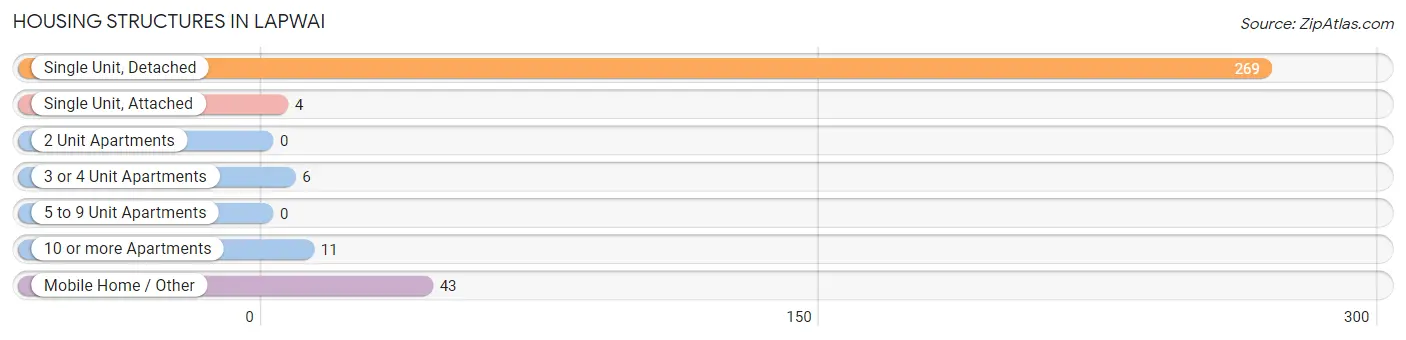
| Structure Type | # Housing Units | % Housing Units |
| Single Unit, Detached | 269 | 80.8% |
| Single Unit, Attached | 4 | 1.2% |
| 2 Unit Apartments | 0 | 0.0% |
| 3 or 4 Unit Apartments | 6 | 1.8% |
| 5 to 9 Unit Apartments | 0 | 0.0% |
| 10 or more Apartments | 11 | 3.3% |
| Mobile Home / Other | 43 | 12.9% |
| Total | 333 | 100.0% |
Housing Structures by Occupancy in Lapwai
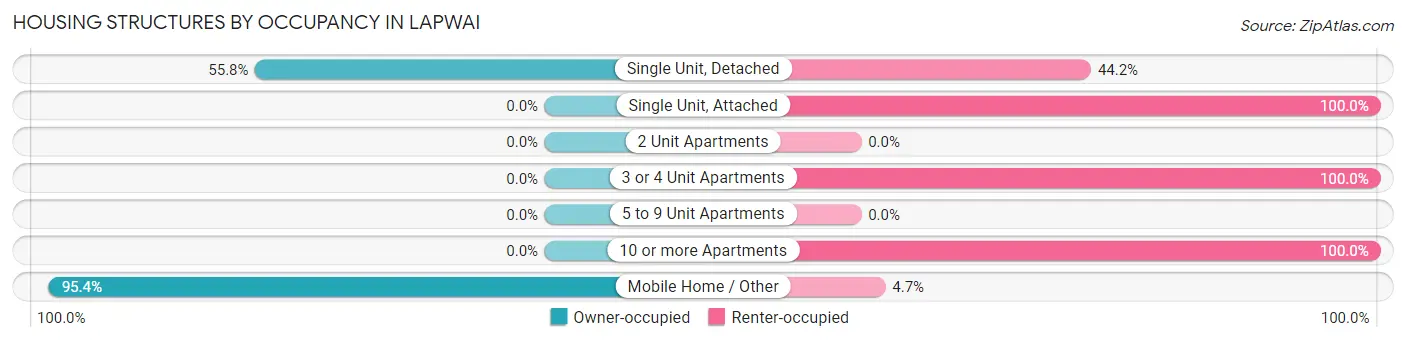
| Structure Type | Owner-occupied | Renter-occupied |
| Single Unit, Detached | 150 (55.8%) | 119 (44.2%) |
| Single Unit, Attached | 0 (0.0%) | 4 (100.0%) |
| 2 Unit Apartments | 0 (0.0%) | 0 (0.0%) |
| 3 or 4 Unit Apartments | 0 (0.0%) | 6 (100.0%) |
| 5 to 9 Unit Apartments | 0 (0.0%) | 0 (0.0%) |
| 10 or more Apartments | 0 (0.0%) | 11 (100.0%) |
| Mobile Home / Other | 41 (95.4%) | 2 (4.6%) |
| Total | 191 (57.4%) | 142 (42.6%) |
Housing Structures by Number of Rooms in Lapwai
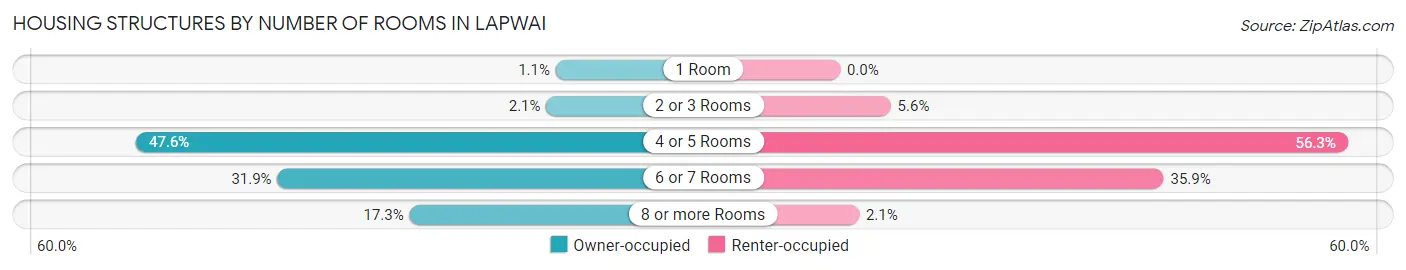
| Number of Rooms | Owner-occupied | Renter-occupied |
| 1 Room | 2 (1.1%) | 0 (0.0%) |
| 2 or 3 Rooms | 4 (2.1%) | 8 (5.6%) |
| 4 or 5 Rooms | 91 (47.6%) | 80 (56.3%) |
| 6 or 7 Rooms | 61 (31.9%) | 51 (35.9%) |
| 8 or more Rooms | 33 (17.3%) | 3 (2.1%) |
| Total | 191 (100.0%) | 142 (100.0%) |
Housing Structure by Heating Type in Lapwai
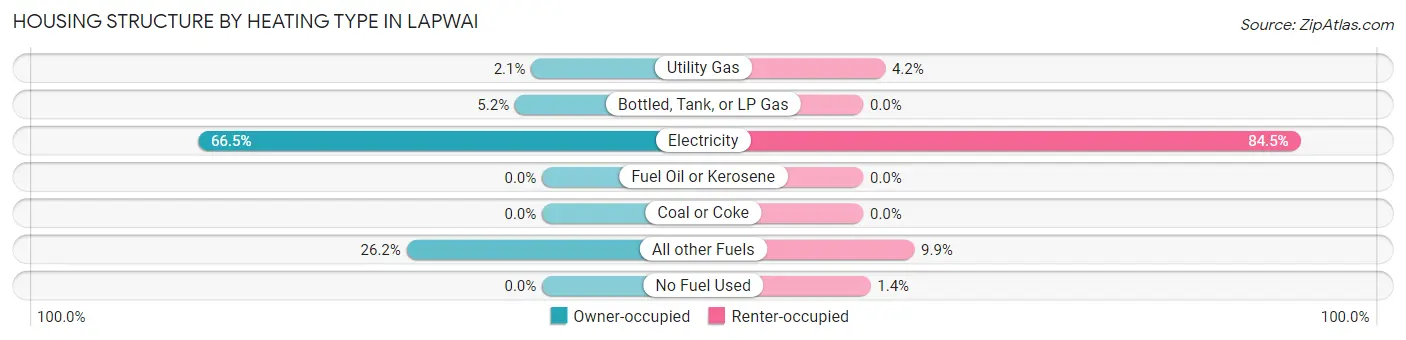
| Heating Type | Owner-occupied | Renter-occupied |
| Utility Gas | 4 (2.1%) | 6 (4.2%) |
| Bottled, Tank, or LP Gas | 10 (5.2%) | 0 (0.0%) |
| Electricity | 127 (66.5%) | 120 (84.5%) |
| Fuel Oil or Kerosene | 0 (0.0%) | 0 (0.0%) |
| Coal or Coke | 0 (0.0%) | 0 (0.0%) |
| All other Fuels | 50 (26.2%) | 14 (9.9%) |
| No Fuel Used | 0 (0.0%) | 2 (1.4%) |
| Total | 191 (100.0%) | 142 (100.0%) |
Household Vehicle Usage in Lapwai
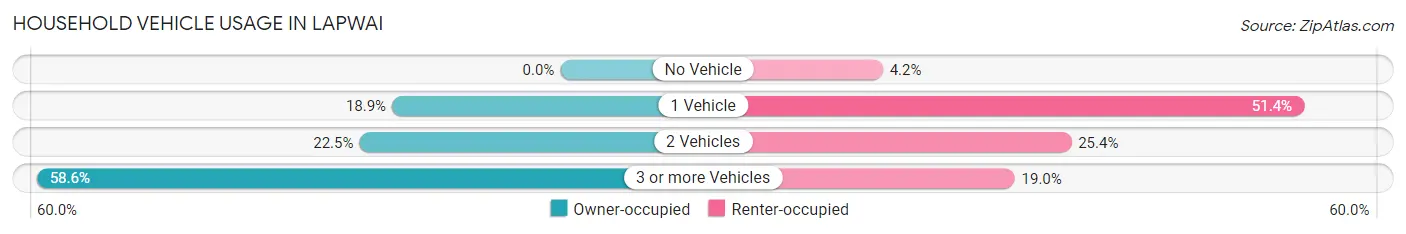
| Vehicles per Household | Owner-occupied | Renter-occupied |
| No Vehicle | 0 (0.0%) | 6 (4.2%) |
| 1 Vehicle | 36 (18.9%) | 73 (51.4%) |
| 2 Vehicles | 43 (22.5%) | 36 (25.4%) |
| 3 or more Vehicles | 112 (58.6%) | 27 (19.0%) |
| Total | 191 (100.0%) | 142 (100.0%) |
Real Estate & Mortgages in Lapwai
Real Estate and Mortgage Overview in Lapwai
| Characteristic | Without Mortgage | With Mortgage |
| Housing Units | 155 | 36 |
| Median Property Value | $106,800 | $166,700 |
| Median Household Income | $58,375 | $8 |
| Monthly Housing Costs | $337 | $0 |
| Real Estate Taxes | $1,133 | $17 |
Property Value by Mortgage Status in Lapwai
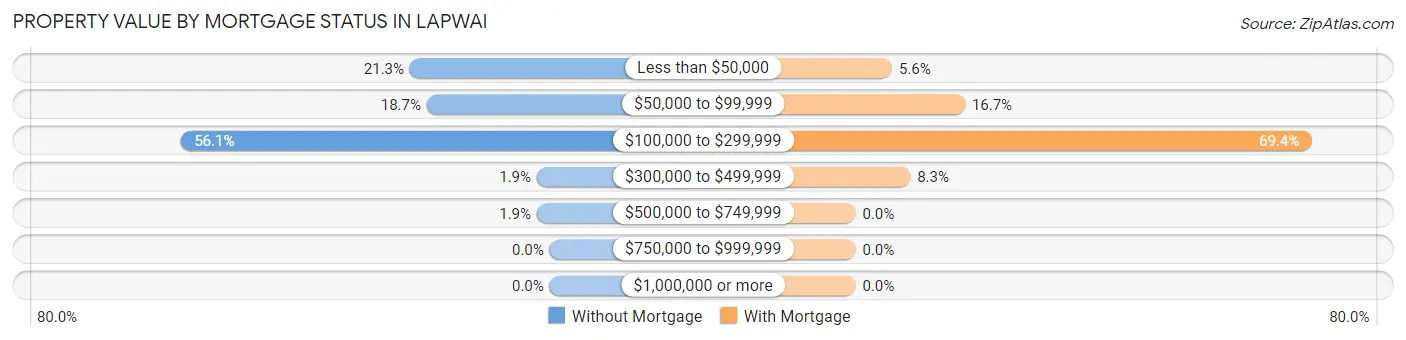
| Property Value | Without Mortgage | With Mortgage |
| Less than $50,000 | 33 (21.3%) | 2 (5.6%) |
| $50,000 to $99,999 | 29 (18.7%) | 6 (16.7%) |
| $100,000 to $299,999 | 87 (56.1%) | 25 (69.4%) |
| $300,000 to $499,999 | 3 (1.9%) | 3 (8.3%) |
| $500,000 to $749,999 | 3 (1.9%) | 0 (0.0%) |
| $750,000 to $999,999 | 0 (0.0%) | 0 (0.0%) |
| $1,000,000 or more | 0 (0.0%) | 0 (0.0%) |
| Total | 155 (100.0%) | 36 (100.0%) |
Household Income by Mortgage Status in Lapwai
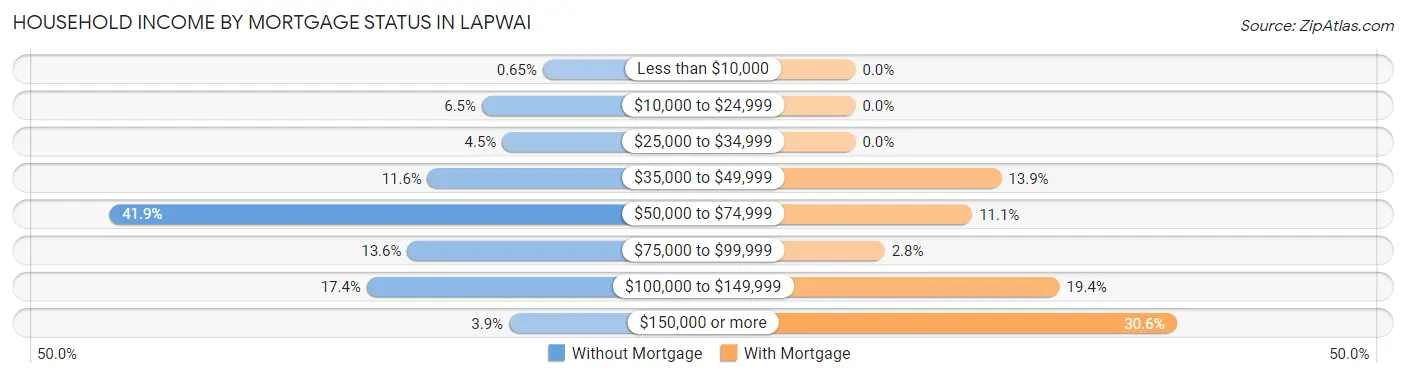
| Household Income | Without Mortgage | With Mortgage |
| Less than $10,000 | 1 (0.6%) | 0 (0.0%) |
| $10,000 to $24,999 | 10 (6.5%) | 0 (0.0%) |
| $25,000 to $34,999 | 7 (4.5%) | 0 (0.0%) |
| $35,000 to $49,999 | 18 (11.6%) | 5 (13.9%) |
| $50,000 to $74,999 | 65 (41.9%) | 4 (11.1%) |
| $75,000 to $99,999 | 21 (13.6%) | 1 (2.8%) |
| $100,000 to $149,999 | 27 (17.4%) | 7 (19.4%) |
| $150,000 or more | 6 (3.9%) | 11 (30.6%) |
| Total | 155 (100.0%) | 36 (100.0%) |
Property Value to Household Income Ratio in Lapwai
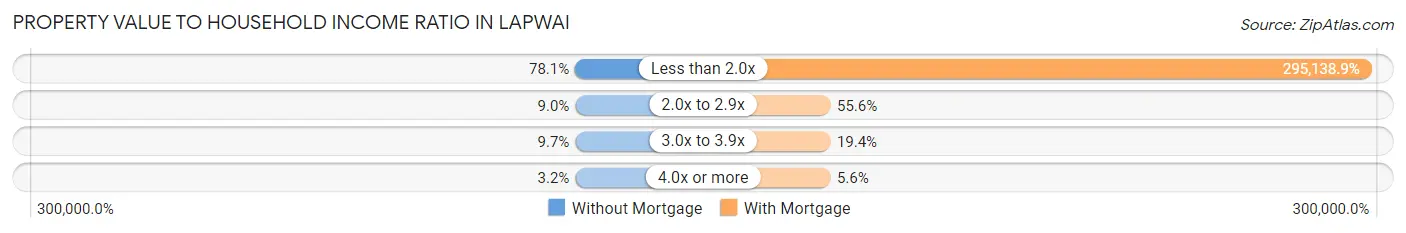
| Value-to-Income Ratio | Without Mortgage | With Mortgage |
| Less than 2.0x | 121 (78.1%) | 106,250 (295,138.9%) |
| 2.0x to 2.9x | 14 (9.0%) | 20 (55.6%) |
| 3.0x to 3.9x | 15 (9.7%) | 7 (19.4%) |
| 4.0x or more | 5 (3.2%) | 2 (5.6%) |
| Total | 155 (100.0%) | 36 (100.0%) |
Real Estate Taxes by Mortgage Status in Lapwai
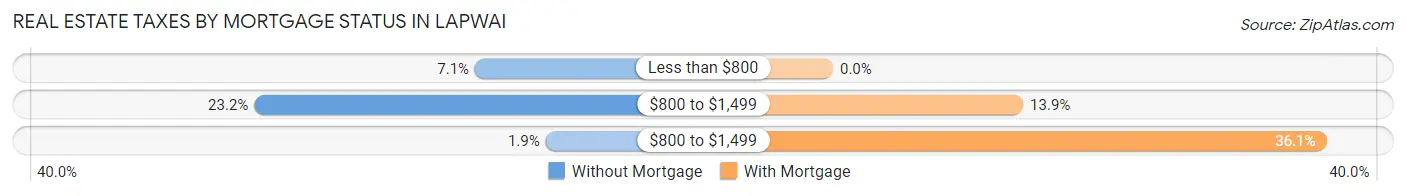
| Property Taxes | Without Mortgage | With Mortgage |
| Less than $800 | 11 (7.1%) | 0 (0.0%) |
| $800 to $1,499 | 36 (23.2%) | 5 (13.9%) |
| $800 to $1,499 | 3 (1.9%) | 13 (36.1%) |
| Total | 155 (100.0%) | 36 (100.0%) |
Health & Disability in Lapwai
Health Insurance Coverage by Age in Lapwai
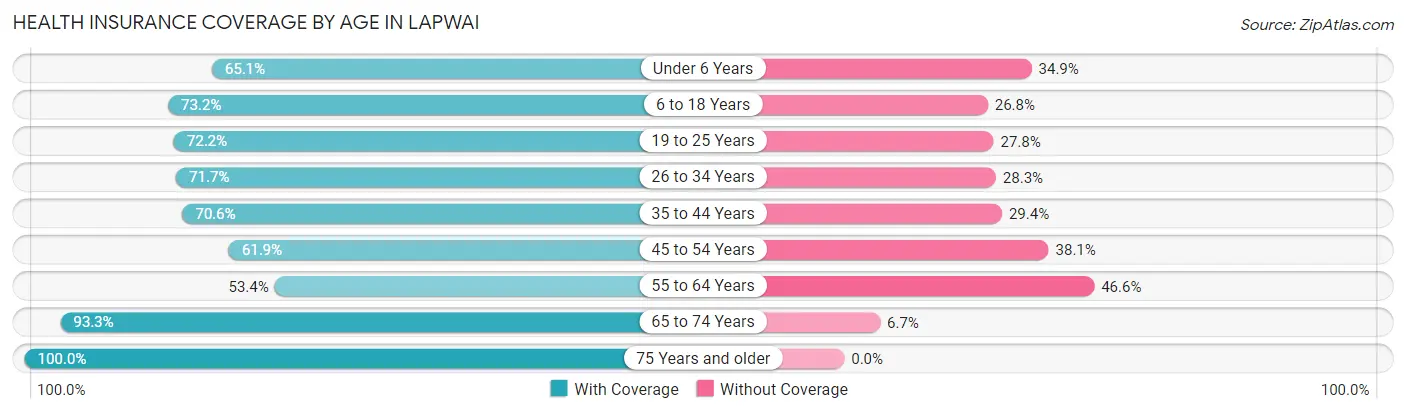
| Age Bracket | With Coverage | Without Coverage |
| Under 6 Years | 95 (65.1%) | 51 (34.9%) |
| 6 to 18 Years | 249 (73.2%) | 91 (26.8%) |
| 19 to 25 Years | 70 (72.2%) | 27 (27.8%) |
| 26 to 34 Years | 170 (71.7%) | 67 (28.3%) |
| 35 to 44 Years | 120 (70.6%) | 50 (29.4%) |
| 45 to 54 Years | 39 (61.9%) | 24 (38.1%) |
| 55 to 64 Years | 63 (53.4%) | 55 (46.6%) |
| 65 to 74 Years | 84 (93.3%) | 6 (6.7%) |
| 75 Years and older | 49 (100.0%) | 0 (0.0%) |
| Total | 939 (71.7%) | 371 (28.3%) |
Health Insurance Coverage by Citizenship Status in Lapwai
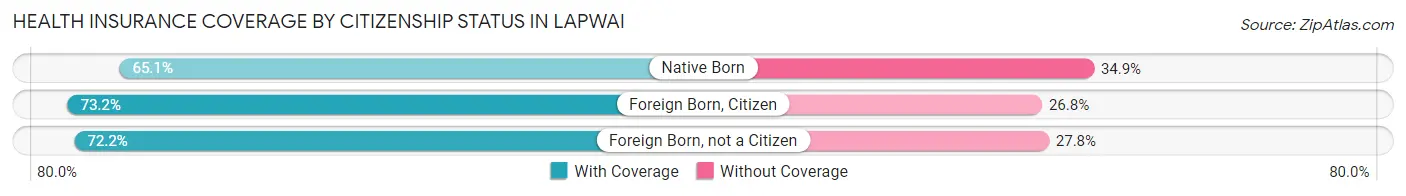
| Citizenship Status | With Coverage | Without Coverage |
| Native Born | 95 (65.1%) | 51 (34.9%) |
| Foreign Born, Citizen | 249 (73.2%) | 91 (26.8%) |
| Foreign Born, not a Citizen | 70 (72.2%) | 27 (27.8%) |
Health Insurance Coverage by Household Income in Lapwai
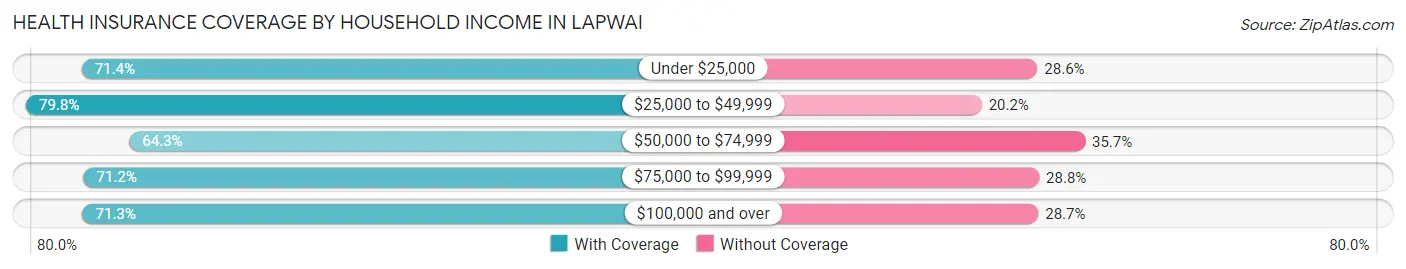
| Household Income | With Coverage | Without Coverage |
| Under $25,000 | 80 (71.4%) | 32 (28.6%) |
| $25,000 to $49,999 | 217 (79.8%) | 55 (20.2%) |
| $50,000 to $74,999 | 198 (64.3%) | 110 (35.7%) |
| $75,000 to $99,999 | 195 (71.2%) | 79 (28.8%) |
| $100,000 and over | 236 (71.3%) | 95 (28.7%) |
Public vs Private Health Insurance Coverage by Age in Lapwai
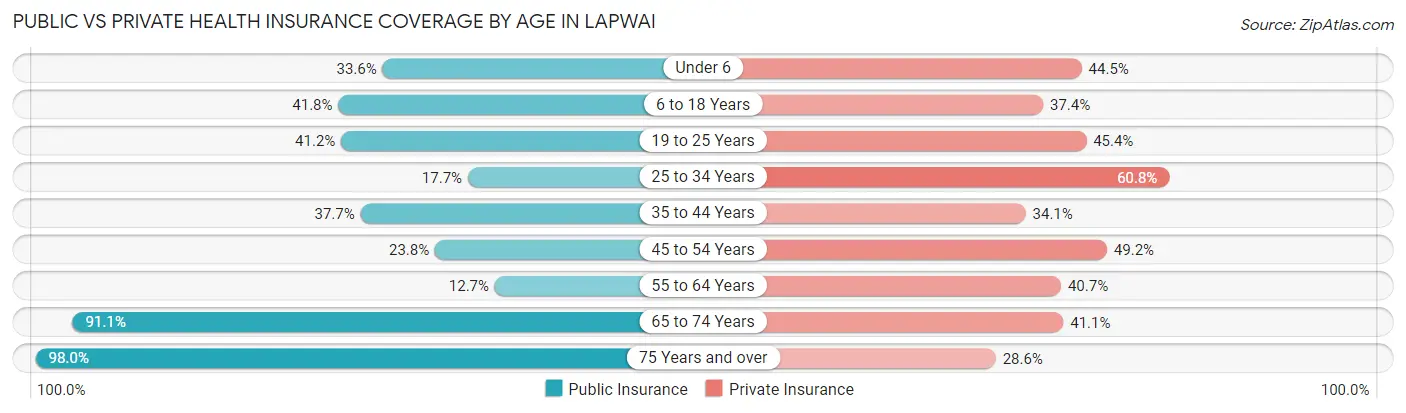
| Age Bracket | Public Insurance | Private Insurance |
| Under 6 | 49 (33.6%) | 65 (44.5%) |
| 6 to 18 Years | 142 (41.8%) | 127 (37.3%) |
| 19 to 25 Years | 40 (41.2%) | 44 (45.4%) |
| 25 to 34 Years | 42 (17.7%) | 144 (60.8%) |
| 35 to 44 Years | 64 (37.7%) | 58 (34.1%) |
| 45 to 54 Years | 15 (23.8%) | 31 (49.2%) |
| 55 to 64 Years | 15 (12.7%) | 48 (40.7%) |
| 65 to 74 Years | 82 (91.1%) | 37 (41.1%) |
| 75 Years and over | 48 (98.0%) | 14 (28.6%) |
| Total | 497 (37.9%) | 568 (43.4%) |
Disability Status by Sex by Age in Lapwai
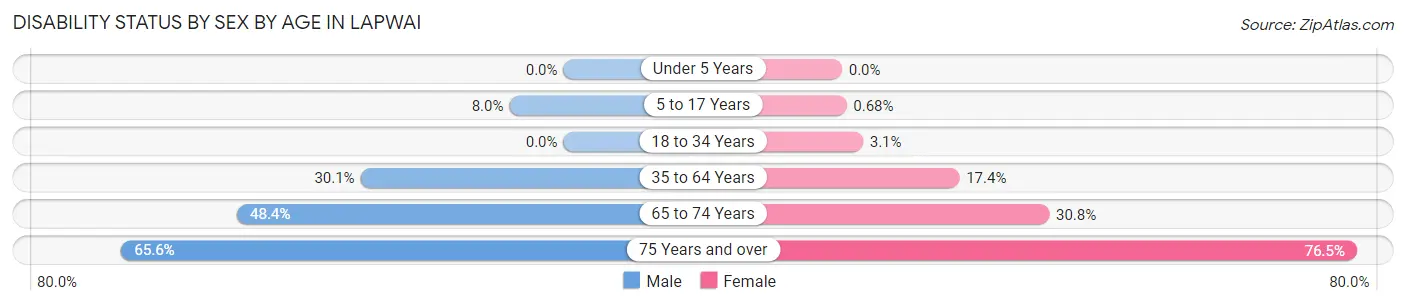
| Age Bracket | Male | Female |
| Under 5 Years | 0 (0.0%) | 0 (0.0%) |
| 5 to 17 Years | 17 (8.0%) | 1 (0.7%) |
| 18 to 34 Years | 0 (0.0%) | 6 (3.1%) |
| 35 to 64 Years | 47 (30.1%) | 34 (17.4%) |
| 65 to 74 Years | 31 (48.4%) | 8 (30.8%) |
| 75 Years and over | 21 (65.6%) | 13 (76.5%) |
Disability Class by Sex by Age in Lapwai
Disability Class: Hearing Difficulty
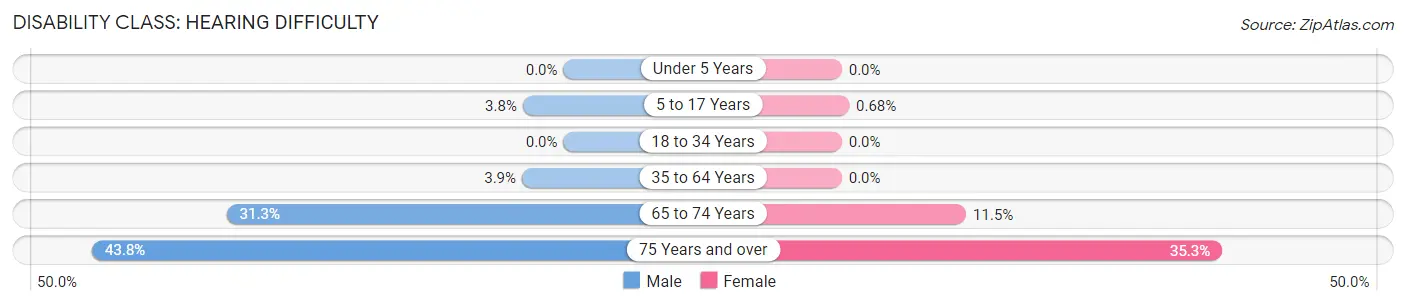
| Age Bracket | Male | Female |
| Under 5 Years | 0 (0.0%) | 0 (0.0%) |
| 5 to 17 Years | 8 (3.8%) | 1 (0.7%) |
| 18 to 34 Years | 0 (0.0%) | 0 (0.0%) |
| 35 to 64 Years | 6 (3.8%) | 0 (0.0%) |
| 65 to 74 Years | 20 (31.2%) | 3 (11.5%) |
| 75 Years and over | 14 (43.8%) | 6 (35.3%) |
Disability Class: Vision Difficulty
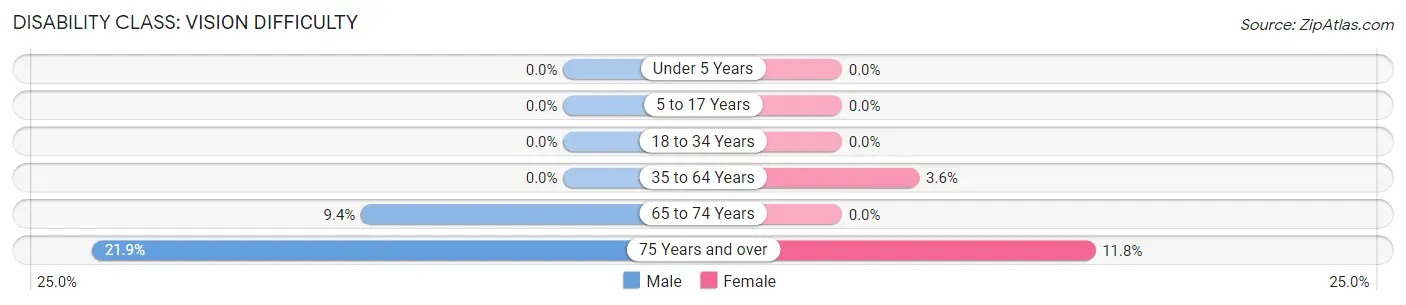
| Age Bracket | Male | Female |
| Under 5 Years | 0 (0.0%) | 0 (0.0%) |
| 5 to 17 Years | 0 (0.0%) | 0 (0.0%) |
| 18 to 34 Years | 0 (0.0%) | 0 (0.0%) |
| 35 to 64 Years | 0 (0.0%) | 7 (3.6%) |
| 65 to 74 Years | 6 (9.4%) | 0 (0.0%) |
| 75 Years and over | 7 (21.9%) | 2 (11.8%) |
Disability Class: Cognitive Difficulty
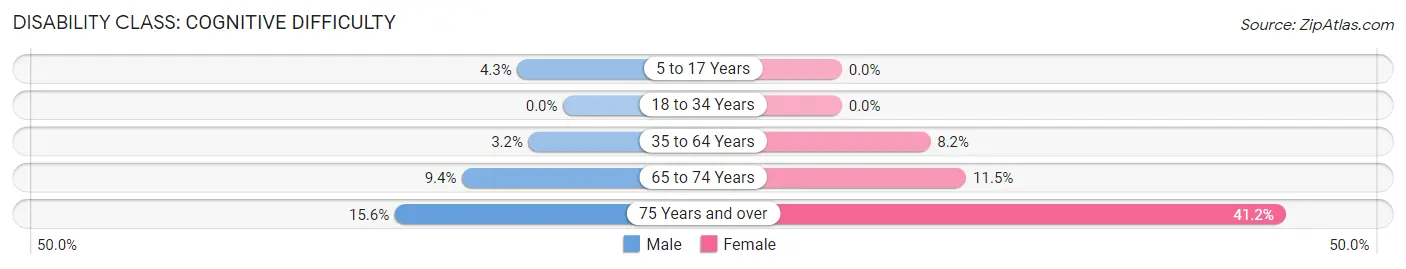
| Age Bracket | Male | Female |
| 5 to 17 Years | 9 (4.3%) | 0 (0.0%) |
| 18 to 34 Years | 0 (0.0%) | 0 (0.0%) |
| 35 to 64 Years | 5 (3.2%) | 16 (8.2%) |
| 65 to 74 Years | 6 (9.4%) | 3 (11.5%) |
| 75 Years and over | 5 (15.6%) | 7 (41.2%) |
Disability Class: Ambulatory Difficulty
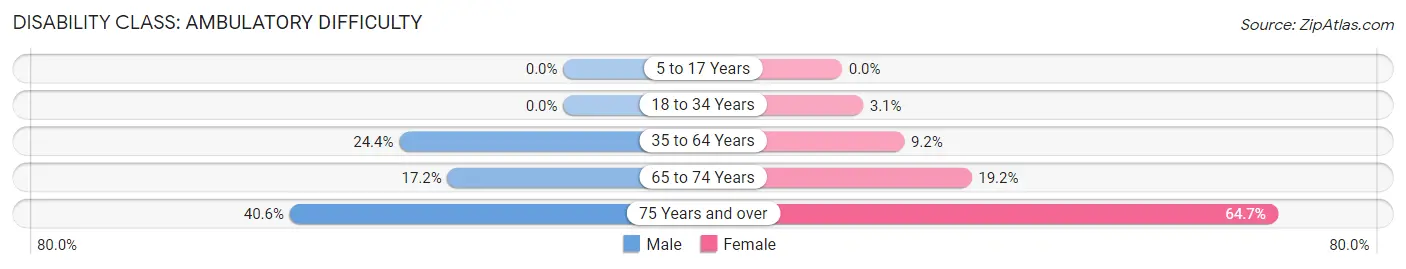
| Age Bracket | Male | Female |
| 5 to 17 Years | 0 (0.0%) | 0 (0.0%) |
| 18 to 34 Years | 0 (0.0%) | 6 (3.1%) |
| 35 to 64 Years | 38 (24.4%) | 18 (9.2%) |
| 65 to 74 Years | 11 (17.2%) | 5 (19.2%) |
| 75 Years and over | 13 (40.6%) | 11 (64.7%) |
Disability Class: Self-Care Difficulty
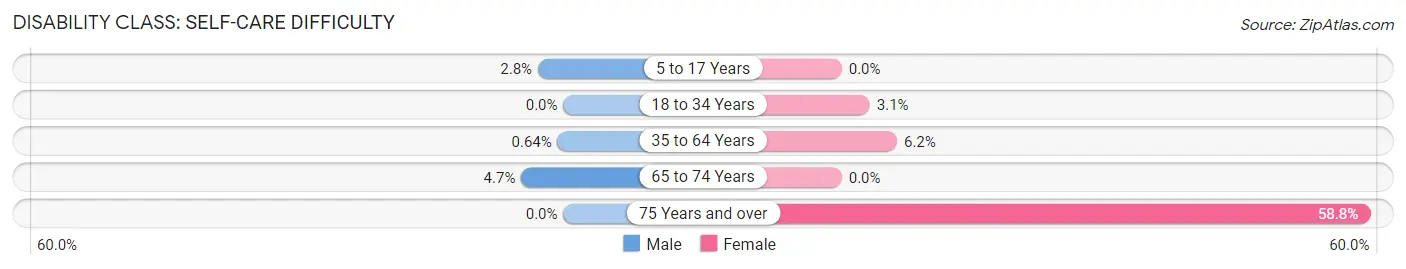
| Age Bracket | Male | Female |
| 5 to 17 Years | 6 (2.8%) | 0 (0.0%) |
| 18 to 34 Years | 0 (0.0%) | 6 (3.1%) |
| 35 to 64 Years | 1 (0.6%) | 12 (6.1%) |
| 65 to 74 Years | 3 (4.7%) | 0 (0.0%) |
| 75 Years and over | 0 (0.0%) | 10 (58.8%) |
Technology Access in Lapwai
Computing Device Access in Lapwai
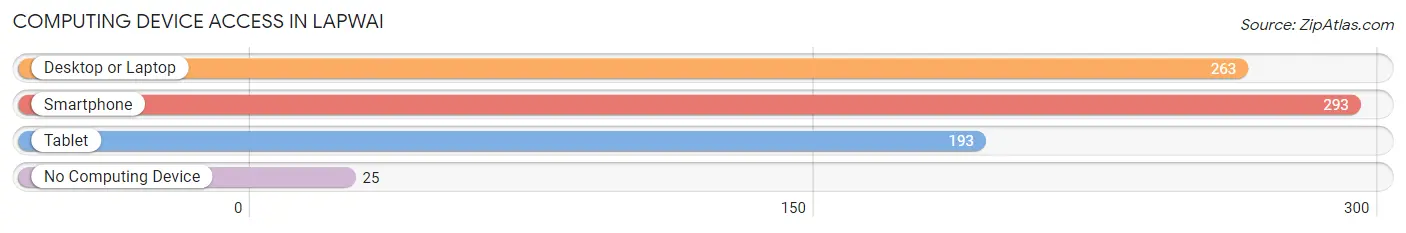
| Device Type | # Households | % Households |
| Desktop or Laptop | 263 | 79.0% |
| Smartphone | 293 | 88.0% |
| Tablet | 193 | 58.0% |
| No Computing Device | 25 | 7.5% |
| Total | 333 | 100.0% |
Internet Access in Lapwai
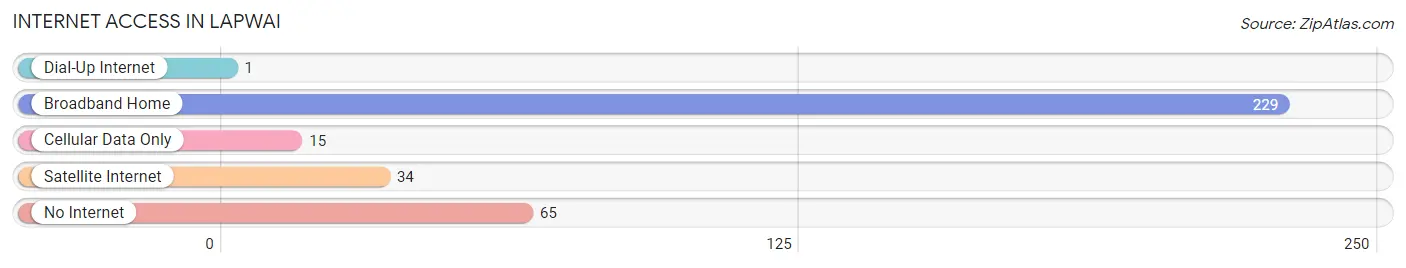
| Internet Type | # Households | % Households |
| Dial-Up Internet | 1 | 0.3% |
| Broadband Home | 229 | 68.8% |
| Cellular Data Only | 15 | 4.5% |
| Satellite Internet | 34 | 10.2% |
| No Internet | 65 | 19.5% |
| Total | 333 | 100.0% |
Lapwai Summary
Lapwai is a small city located in Nez Perce County, Idaho, United States. It is the tribal headquarters of the Nez Perce Tribe and is located on the Nez Perce Indian Reservation. The population was 1,093 at the 2010 census.
Geography
Lapwai is located at 46°25′17″N 116°51′17″W (46.4214, -116.8548). According to the United States Census Bureau, the city has a total area of 0.9sqmi, all of it land.
History
The Nez Perce Tribe has lived in the area for thousands of years. The name Lapwai is derived from the Nez Perce word for “butterfly”. The tribe has a long history of trading with other tribes and Europeans.
In 1805, the Lewis and Clark Expedition passed through the area. In 1836, the Nez Perce Tribe signed the Treaty of Lapwai with the United States, which established the Nez Perce Reservation.
In 1877, the Nez Perce War began when the tribe refused to move to a reservation in Oregon. The war ended with the surrender of Chief Joseph and the Nez Perce at the Battle of Bear Paw in Montana.
In 1883, the Nez Perce Agency was established in Lapwai. The agency was responsible for managing the affairs of the Nez Perce Tribe.
In 1885, the Nez Perce Indian School was established in Lapwai. The school was the first off-reservation boarding school in the United States.
In the early 20th century the city of Lapwai was incorporated
Economy
The economy of Lapwai is largely based on the Nez Perce Tribe. The tribe operates a number of businesses, including a casino, a hotel, and a gas station. The tribe also operates a number of government programs, including a health clinic, a housing authority, and a tribal court.
The city also has a number of small businesses including restaurants shops and a grocery store
Demographics
As of the census of 2010, there were 1,093 people, 431 households, and 270 families residing in the city. The population density was 1,213.3 people per square mile (468.7/km2). There were 471 housing units at an average density of 519.4 per square mile (200.7/km2). The racial makeup of the city was 75.2% Native American, 0.2% White, 0.2% African American, 0.2% Asian, 0.2% Pacific Islander, 0.2% from other races, and 23.9% from two or more races. Hispanic or Latino of any race were 1.2% of the population.
There were 431 households, out of which 33.2% had children under the age of 18 living with them, 33.2% were married couples living together, 24.2% had a female householder with no husband present, and 33.2% were non-families. 28.2% of all households were made up of individuals, and 11.2% had someone living alone who was 65 years of age or older. The average household size was 2.54 and the average family size was 3.09.
In the city, the population was spread out, with 28.2% under the age of 18, 8.2% from 18 to 24, 25.2% from 25 to 44, 24.2% from 45 to 64, and 14.2% who were 65 years of age or older. The median age was 36 years. For every 100 females, there were 94.2 males. For every 100 females age 18 and over, there were 91.2 males.
The median income for a household in the city was $25,000, and the median income for a family was $30,000. Males had a median income of $25,000 versus $20,000 for females. The per capita income for the city was $13,000. About 20.2% of families and 24.2% of the population were below the poverty line, including 33.2% of those under age 18 and 10.2% of those age 65 or over.
Common Questions
What is Per Capita Income in Lapwai?
Per Capita income in Lapwai is $18,066.
What is the Median Family Income in Lapwai?
Median Family Income in Lapwai is $58,500.
What is the Median Household income in Lapwai?
Median Household Income in Lapwai is $58,558.
What is Income or Wage Gap in Lapwai?
Income or Wage Gap in Lapwai is 14.2%.
Women in Lapwai earn 85.8 cents for every dollar earned by a man.
What is Family Income Deficit in Lapwai?
Family Income Deficit in Lapwai is $9,966.
Families that are below poverty line in Lapwai earn $9,966 less on average than the poverty threshold level.
What is Inequality or Gini Index in Lapwai?
Inequality or Gini Index in Lapwai is 0.32.
What is the Total Population of Lapwai?
Total Population of Lapwai is 1,310.
What is the Total Male Population of Lapwai?
Total Male Population of Lapwai is 669.
What is the Total Female Population of Lapwai?
Total Female Population of Lapwai is 641.
What is the Ratio of Males per 100 Females in Lapwai?
There are 104.37 Males per 100 Females in Lapwai.
What is the Ratio of Females per 100 Males in Lapwai?
There are 95.81 Females per 100 Males in Lapwai.
What is the Median Population Age in Lapwai?
Median Population Age in Lapwai is 28.5 Years.
What is the Average Family Size in Lapwai
Average Family Size in Lapwai is 4.1 People.
What is the Average Household Size in Lapwai
Average Household Size in Lapwai is 3.9 People.
How Large is the Labor Force in Lapwai?
There are 509 People in the Labor Forcein in Lapwai.
What is the Percentage of People in the Labor Force in Lapwai?
59.3% of People are in the Labor Force in Lapwai.
What is the Unemployment Rate in Lapwai?
Unemployment Rate in Lapwai is 9.6%.