Kellogg, ID Map & Demographics
Kellogg Map
Kellogg Overview
$22,374
PER CAPITA INCOME
$56,176
AVG FAMILY INCOME
$38,316
AVG HOUSEHOLD INCOME
26.9%
WAGE / INCOME GAP [ % ]
73.1¢/ $1
WAGE / INCOME GAP [ $ ]
0.44
INEQUALITY / GINI INDEX
2,294
TOTAL POPULATION
1,117
MALE POPULATION
1,177
FEMALE POPULATION
94.90
MALES / 100 FEMALES
105.37
FEMALES / 100 MALES
36.1
MEDIAN AGE
3.3
AVG FAMILY SIZE
2.4
AVG HOUSEHOLD SIZE
1,021
LABOR FORCE [ PEOPLE ]
56.0%
PERCENT IN LABOR FORCE
14.5%
UNEMPLOYMENT RATE
Kellogg Zip Codes
Kellogg Area Codes
Income in Kellogg
Income Overview in Kellogg
Per Capita Income in Kellogg is $22,374, while median incomes of families and households are $56,176 and $38,316 respectively.
| Characteristic | Number | Measure |
| Per Capita Income | 2,294 | $22,374 |
| Median Family Income | 496 | $56,176 |
| Mean Family Income | 496 | $64,831 |
| Median Household Income | 920 | $38,316 |
| Mean Household Income | 920 | $50,338 |
| Income Deficit | 496 | $0 |
| Wage / Income Gap (%) | 2,294 | 26.93% |
| Wage / Income Gap ($) | 2,294 | 73.07¢ per $1 |
| Gini / Inequality Index | 2,294 | 0.44 |
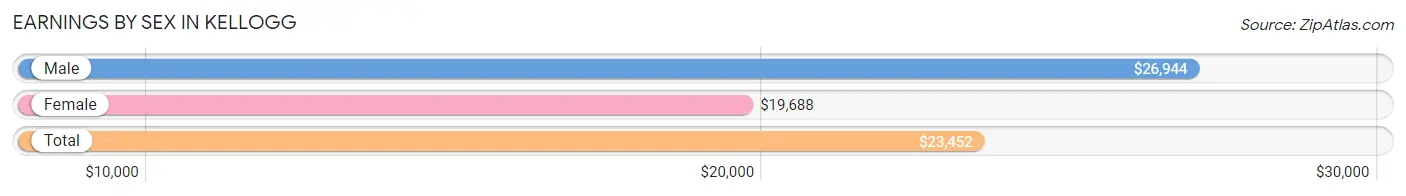
Earnings by Sex in Kellogg
Average Earnings in Kellogg are $23,452, $26,944 for men and $19,688 for women, a difference of 26.9%.
| Sex | Number | Average Earnings |
| Male | 538 (53.2%) | $26,944 |
| Female | 474 (46.8%) | $19,688 |
| Total | 1,012 (100.0%) | $23,452 |
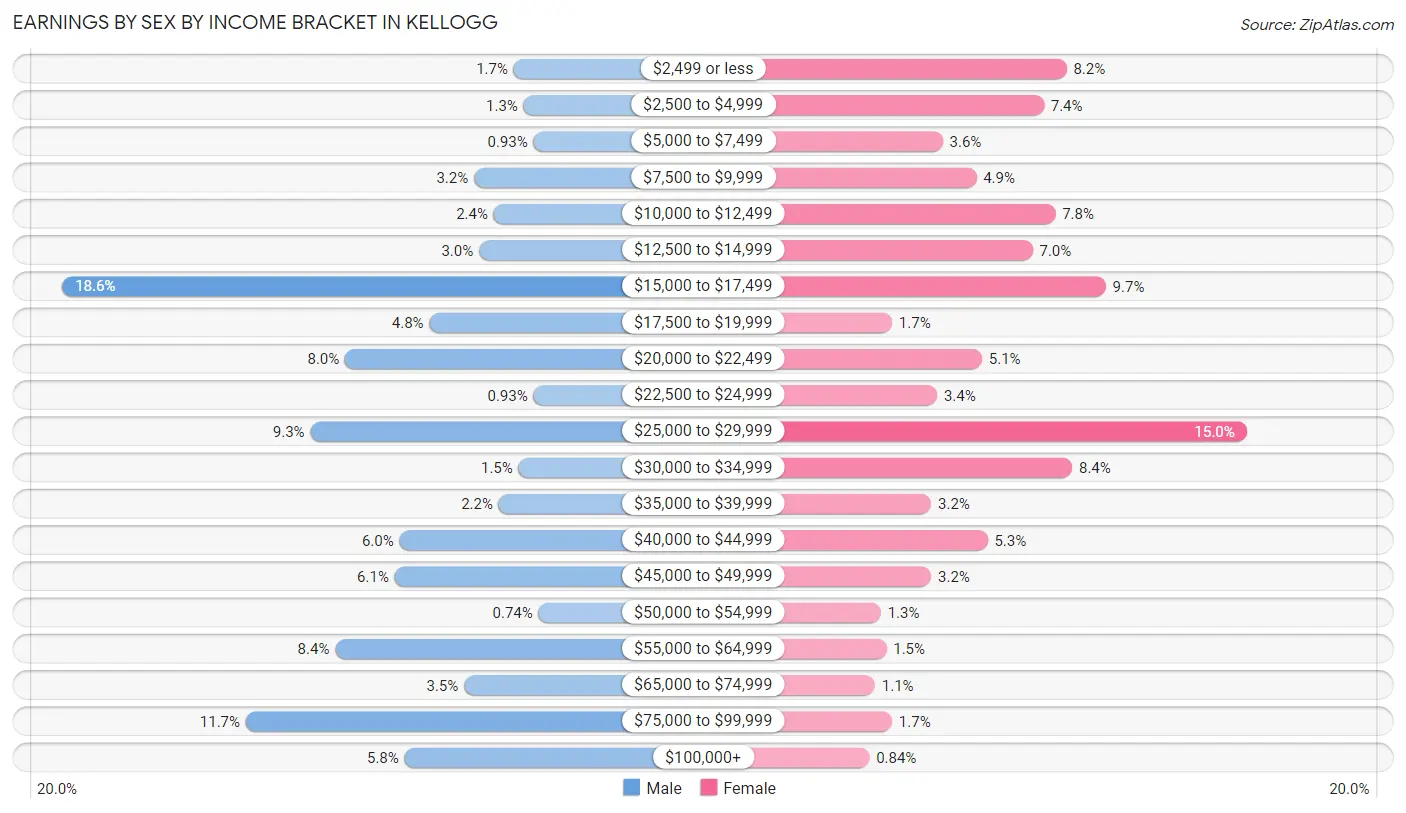
Earnings by Sex by Income Bracket in Kellogg
The most common earnings brackets in Kellogg are $15,000 to $17,499 for men (100 | 18.6%) and $25,000 to $29,999 for women (71 | 15.0%).
| Income | Male | Female |
| $2,499 or less | 9 (1.7%) | 39 (8.2%) |
| $2,500 to $4,999 | 7 (1.3%) | 35 (7.4%) |
| $5,000 to $7,499 | 5 (0.9%) | 17 (3.6%) |
| $7,500 to $9,999 | 17 (3.2%) | 23 (4.9%) |
| $10,000 to $12,499 | 13 (2.4%) | 37 (7.8%) |
| $12,500 to $14,999 | 16 (3.0%) | 33 (7.0%) |
| $15,000 to $17,499 | 100 (18.6%) | 46 (9.7%) |
| $17,500 to $19,999 | 26 (4.8%) | 8 (1.7%) |
| $20,000 to $22,499 | 43 (8.0%) | 24 (5.1%) |
| $22,500 to $24,999 | 5 (0.9%) | 16 (3.4%) |
| $25,000 to $29,999 | 50 (9.3%) | 71 (15.0%) |
| $30,000 to $34,999 | 8 (1.5%) | 40 (8.4%) |
| $35,000 to $39,999 | 12 (2.2%) | 15 (3.2%) |
| $40,000 to $44,999 | 32 (5.9%) | 25 (5.3%) |
| $45,000 to $49,999 | 33 (6.1%) | 15 (3.2%) |
| $50,000 to $54,999 | 4 (0.7%) | 6 (1.3%) |
| $55,000 to $64,999 | 45 (8.4%) | 7 (1.5%) |
| $65,000 to $74,999 | 19 (3.5%) | 5 (1.1%) |
| $75,000 to $99,999 | 63 (11.7%) | 8 (1.7%) |
| $100,000+ | 31 (5.8%) | 4 (0.8%) |
| Total | 538 (100.0%) | 474 (100.0%) |
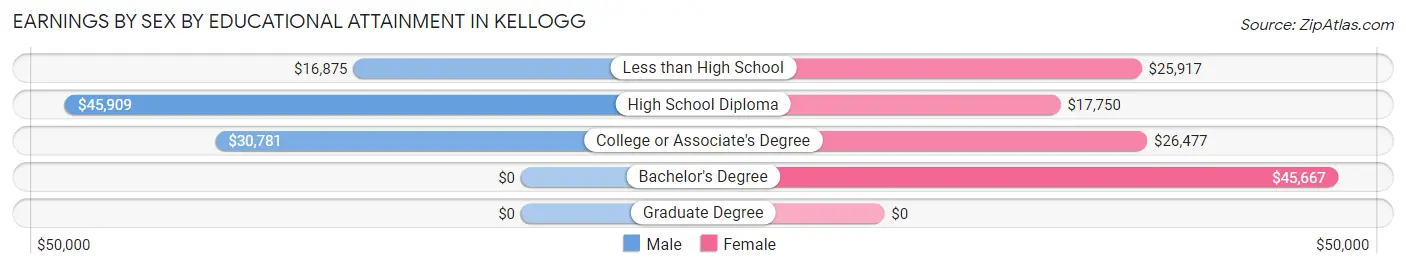
Earnings by Sex by Educational Attainment in Kellogg
Average earnings in Kellogg are $28,839 for men and $26,351 for women, a difference of 8.6%. Men with an educational attainment of high school diploma enjoy the highest average annual earnings of $45,909, while those with less than high school education earn the least with $16,875. Women with an educational attainment of bachelor's degree earn the most with the average annual earnings of $45,667, while those with high school diploma education have the smallest earnings of $17,750.
| Educational Attainment | Male Income | Female Income |
| Less than High School | $16,875 | $25,917 |
| High School Diploma | $45,909 | $17,750 |
| College or Associate's Degree | $30,781 | $26,477 |
| Bachelor's Degree | - | - |
| Graduate Degree | - | - |
| Total | $28,839 | $26,351 |
Family Income in Kellogg
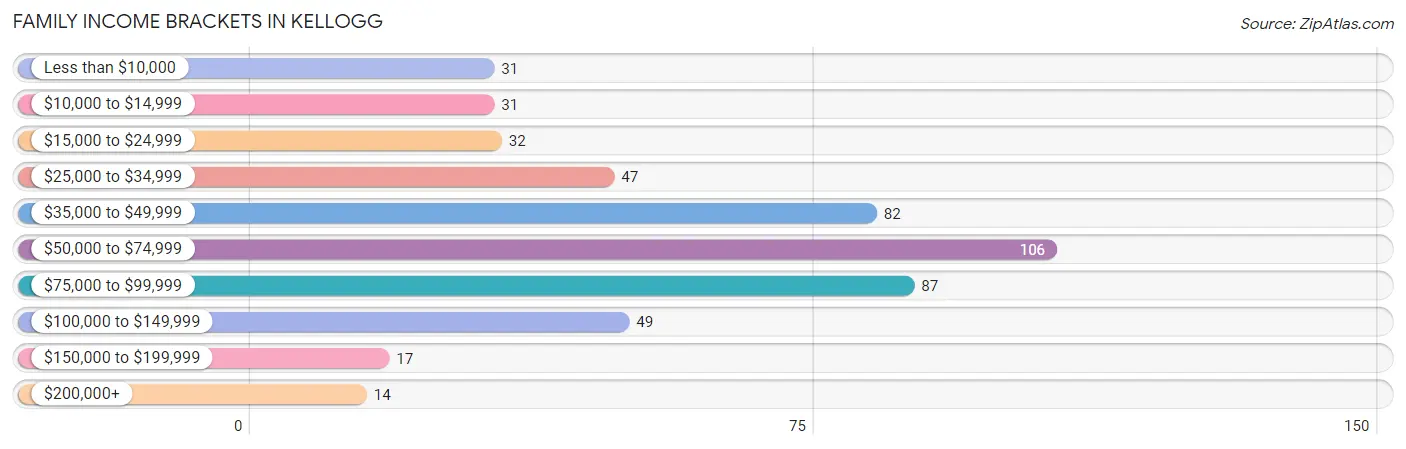
Family Income Brackets in Kellogg
According to the Kellogg family income data, there are 106 families falling into the $50,000 to $74,999 income range, which is the most common income bracket and makes up 21.4% of all families. Conversely, the $200,000+ income bracket is the least frequent group with only 14 families (2.8%) belonging to this category.
| Income Bracket | # Families | % Families |
| Less than $10,000 | 31 | 6.3% |
| $10,000 to $14,999 | 31 | 6.3% |
| $15,000 to $24,999 | 32 | 6.5% |
| $25,000 to $34,999 | 47 | 9.5% |
| $35,000 to $49,999 | 82 | 16.5% |
| $50,000 to $74,999 | 106 | 21.4% |
| $75,000 to $99,999 | 87 | 17.5% |
| $100,000 to $149,999 | 49 | 9.9% |
| $150,000 to $199,999 | 17 | 3.4% |
| $200,000+ | 14 | 2.8% |
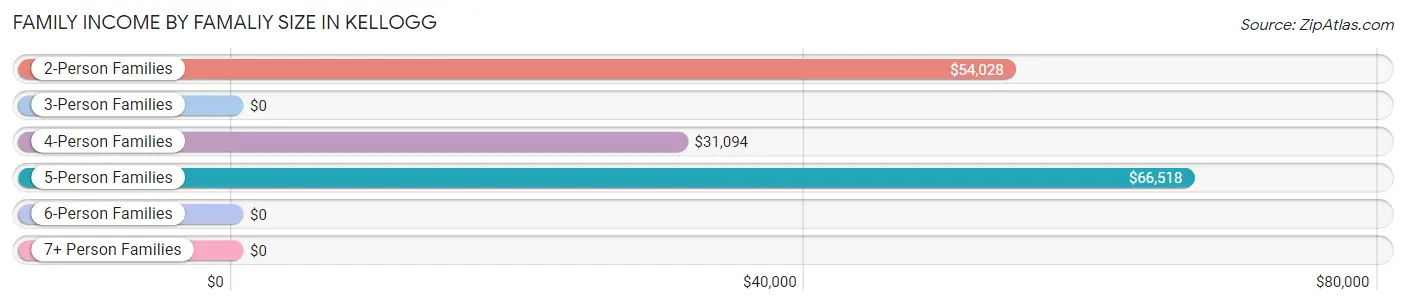
Family Income by Famaliy Size in Kellogg
5-person families (46 | 9.3%) account for the highest median family income in Kellogg with $66,518 per family, while 2-person families (271 | 54.6%) have the highest median income of $27,014 per family member.
| Income Bracket | # Families | Median Income |
| 2-Person Families | 271 (54.6%) | $54,028 |
| 3-Person Families | 102 (20.6%) | $0 |
| 4-Person Families | 62 (12.5%) | $31,094 |
| 5-Person Families | 46 (9.3%) | $66,518 |
| 6-Person Families | 15 (3.0%) | $0 |
| 7+ Person Families | 0 (0.0%) | $0 |
| Total | 496 (100.0%) | $56,176 |
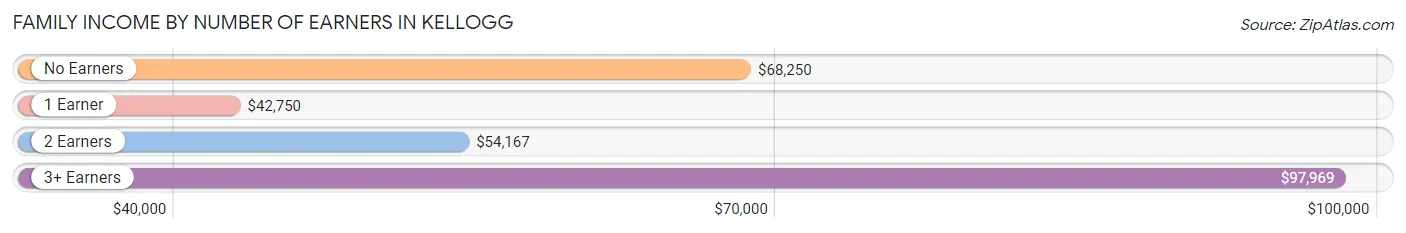
Family Income by Number of Earners in Kellogg
The median family income in Kellogg is $56,176, with families comprising 3+ earners (40) having the highest median family income of $97,969, while families with 1 earner (213) have the lowest median family income of $42,750, accounting for 8.1% and 42.9% of families, respectively.
| Number of Earners | # Families | Median Income |
| No Earners | 79 (15.9%) | $68,250 |
| 1 Earner | 213 (42.9%) | $42,750 |
| 2 Earners | 164 (33.1%) | $54,167 |
| 3+ Earners | 40 (8.1%) | $97,969 |
| Total | 496 (100.0%) | $56,176 |
Household Income in Kellogg
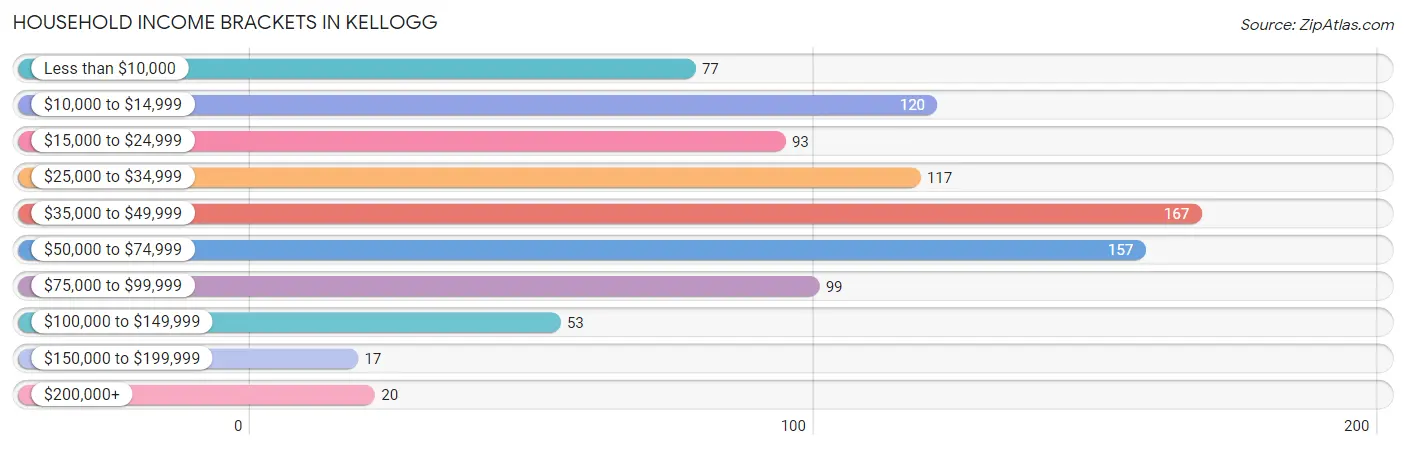
Household Income Brackets in Kellogg
With 167 households falling in the category, the $35,000 to $49,999 income range is the most frequent in Kellogg, accounting for 18.1% of all households. In contrast, only 17 households (1.8%) fall into the $150,000 to $199,999 income bracket, making it the least populous group.
| Income Bracket | # Households | % Households |
| Less than $10,000 | 77 | 8.4% |
| $10,000 to $14,999 | 120 | 13.0% |
| $15,000 to $24,999 | 93 | 10.1% |
| $25,000 to $34,999 | 117 | 12.7% |
| $35,000 to $49,999 | 167 | 18.2% |
| $50,000 to $74,999 | 157 | 17.1% |
| $75,000 to $99,999 | 99 | 10.8% |
| $100,000 to $149,999 | 53 | 5.8% |
| $150,000 to $199,999 | 17 | 1.8% |
| $200,000+ | 20 | 2.2% |
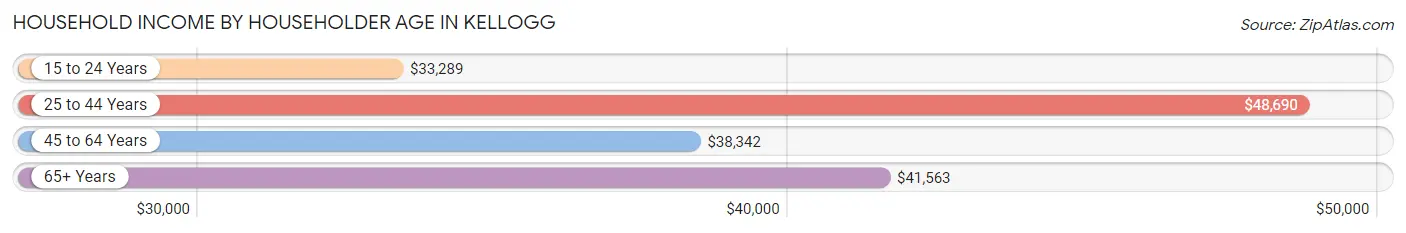
Household Income by Householder Age in Kellogg
The median household income in Kellogg is $38,316, with the highest median household income of $48,690 found in the 25 to 44 years age bracket for the primary householder. A total of 268 households (29.1%) fall into this category. Meanwhile, the 15 to 24 years age bracket for the primary householder has the lowest median household income of $33,289, with 96 households (10.4%) in this group.
| Income Bracket | # Households | Median Income |
| 15 to 24 Years | 96 (10.4%) | $33,289 |
| 25 to 44 Years | 268 (29.1%) | $48,690 |
| 45 to 64 Years | 293 (31.9%) | $38,342 |
| 65+ Years | 263 (28.6%) | $41,563 |
| Total | 920 (100.0%) | $38,316 |
Poverty in Kellogg
Income Below Poverty by Sex and Age in Kellogg
With 17.9% poverty level for males and 25.7% for females among the residents of Kellogg, 5 year old males and under 5 year old females are the most vulnerable to poverty, with 6 males (50.0%) and 56 females (61.5%) in their respective age groups living below the poverty level.
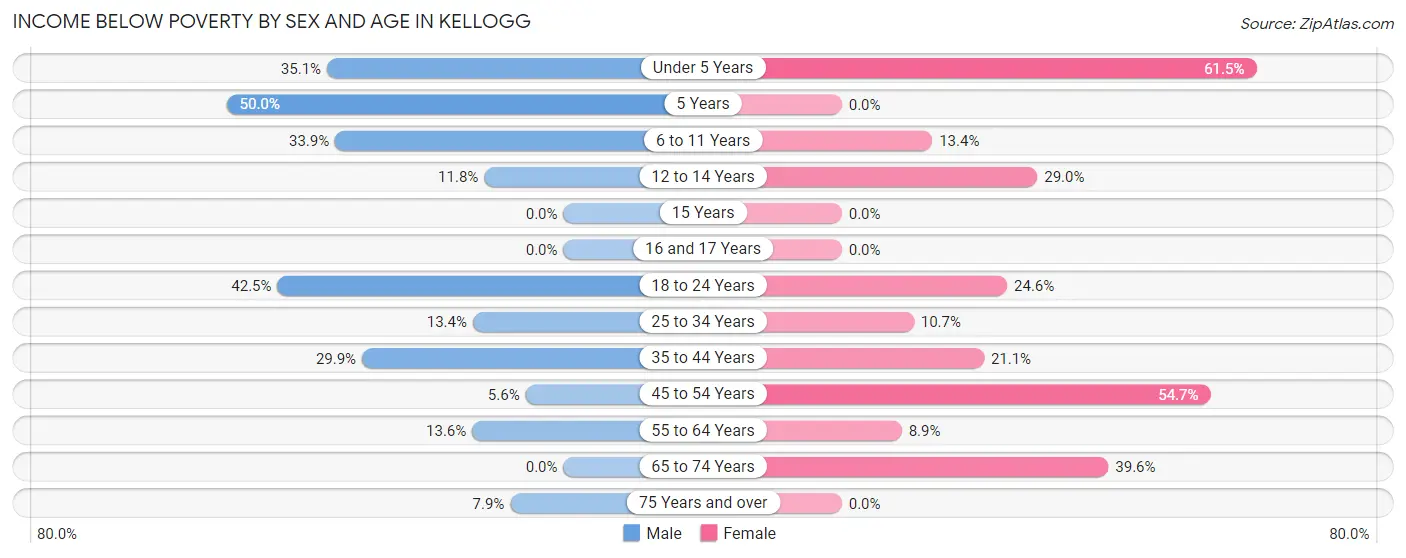
| Age Bracket | Male | Female |
| Under 5 Years | 33 (35.1%) | 56 (61.5%) |
| 5 Years | 6 (50.0%) | 0 (0.0%) |
| 6 to 11 Years | 20 (33.9%) | 9 (13.4%) |
| 12 to 14 Years | 6 (11.8%) | 9 (29.0%) |
| 15 Years | 0 (0.0%) | 0 (0.0%) |
| 16 and 17 Years | 0 (0.0%) | 0 (0.0%) |
| 18 to 24 Years | 31 (42.5%) | 41 (24.5%) |
| 25 to 34 Years | 34 (13.4%) | 14 (10.7%) |
| 35 to 44 Years | 32 (29.9%) | 19 (21.1%) |
| 45 to 54 Years | 5 (5.6%) | 58 (54.7%) |
| 55 to 64 Years | 21 (13.6%) | 13 (8.9%) |
| 65 to 74 Years | 0 (0.0%) | 57 (39.6%) |
| 75 Years and over | 6 (7.9%) | 0 (0.0%) |
| Total | 194 (17.9%) | 276 (25.7%) |
Income Above Poverty by Sex and Age in Kellogg
According to the poverty statistics in Kellogg, males aged 65 to 74 years and females aged 5 years are the age groups that are most secure financially, with 100.0% of males and 100.0% of females in these age groups living above the poverty line.
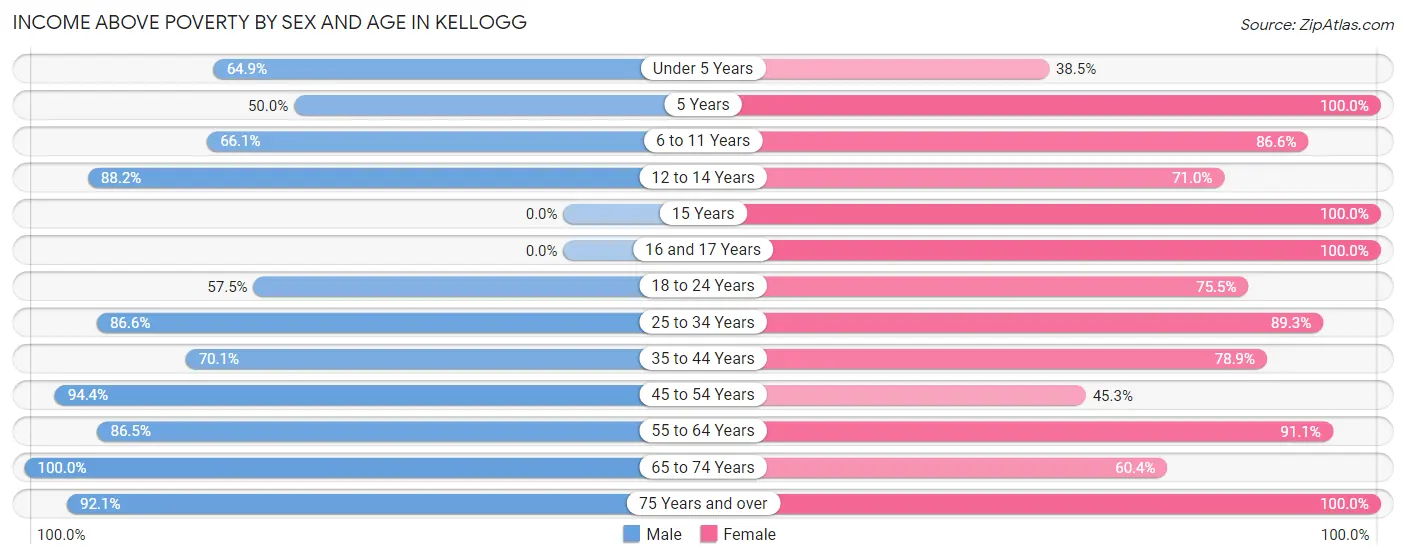
| Age Bracket | Male | Female |
| Under 5 Years | 61 (64.9%) | 35 (38.5%) |
| 5 Years | 6 (50.0%) | 5 (100.0%) |
| 6 to 11 Years | 39 (66.1%) | 58 (86.6%) |
| 12 to 14 Years | 45 (88.2%) | 22 (71.0%) |
| 15 Years | 0 (0.0%) | 21 (100.0%) |
| 16 and 17 Years | 0 (0.0%) | 37 (100.0%) |
| 18 to 24 Years | 42 (57.5%) | 126 (75.4%) |
| 25 to 34 Years | 219 (86.6%) | 117 (89.3%) |
| 35 to 44 Years | 75 (70.1%) | 71 (78.9%) |
| 45 to 54 Years | 84 (94.4%) | 48 (45.3%) |
| 55 to 64 Years | 134 (86.5%) | 133 (91.1%) |
| 65 to 74 Years | 113 (100.0%) | 87 (60.4%) |
| 75 Years and over | 70 (92.1%) | 37 (100.0%) |
| Total | 888 (82.1%) | 797 (74.3%) |
Income Below Poverty Among Married-Couple Families in Kellogg
The poverty statistics for married-couple families in Kellogg show that 11.4% or 31 of the total 273 families live below the poverty line. Families with 1 or 2 children have the highest poverty rate of 48.0%, comprising of 24 families. On the other hand, families with 3 or 4 children have the lowest poverty rate of 0.0%, which includes 0 families.
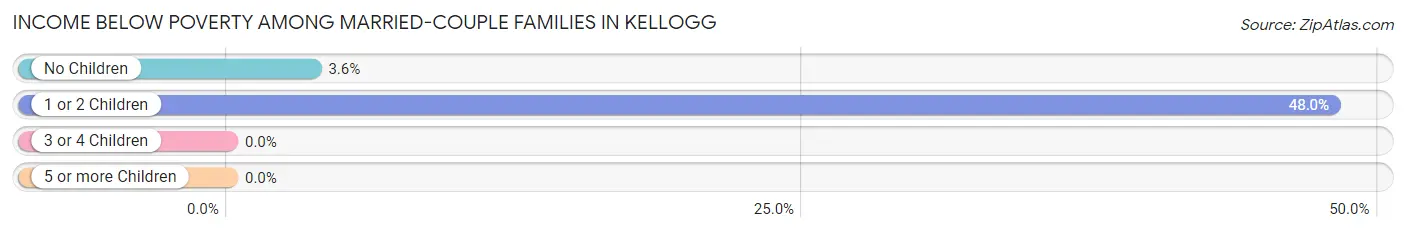
| Children | Above Poverty | Below Poverty |
| No Children | 186 (96.4%) | 7 (3.6%) |
| 1 or 2 Children | 26 (52.0%) | 24 (48.0%) |
| 3 or 4 Children | 30 (100.0%) | 0 (0.0%) |
| 5 or more Children | 0 (0.0%) | 0 (0.0%) |
| Total | 242 (88.6%) | 31 (11.4%) |
Income Below Poverty Among Single-Parent Households in Kellogg
According to the poverty data in Kellogg, 14.0% or 16 single-father households and 38.5% or 42 single-mother households are living below the poverty line. Among single-father households, those with 1 or 2 children have the highest poverty rate, with 16 households (34.8%) experiencing poverty. Likewise, among single-mother households, those with 1 or 2 children have the highest poverty rate, with 37 households (53.6%) falling below the poverty line.
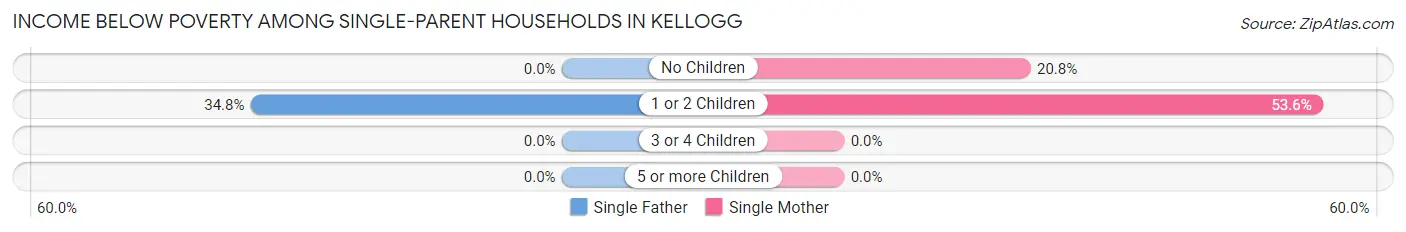
| Children | Single Father | Single Mother |
| No Children | 0 (0.0%) | 5 (20.8%) |
| 1 or 2 Children | 16 (34.8%) | 37 (53.6%) |
| 3 or 4 Children | 0 (0.0%) | 0 (0.0%) |
| 5 or more Children | 0 (0.0%) | 0 (0.0%) |
| Total | 16 (14.0%) | 42 (38.5%) |
Income Below Poverty Among Married-Couple vs Single-Parent Households in Kellogg
The poverty data for Kellogg shows that 31 of the married-couple family households (11.4%) and 58 of the single-parent households (26.0%) are living below the poverty level. Within the married-couple family households, those with 1 or 2 children have the highest poverty rate, with 24 households (48.0%) falling below the poverty line. Among the single-parent households, those with 1 or 2 children have the highest poverty rate, with 53 household (46.1%) living below poverty.
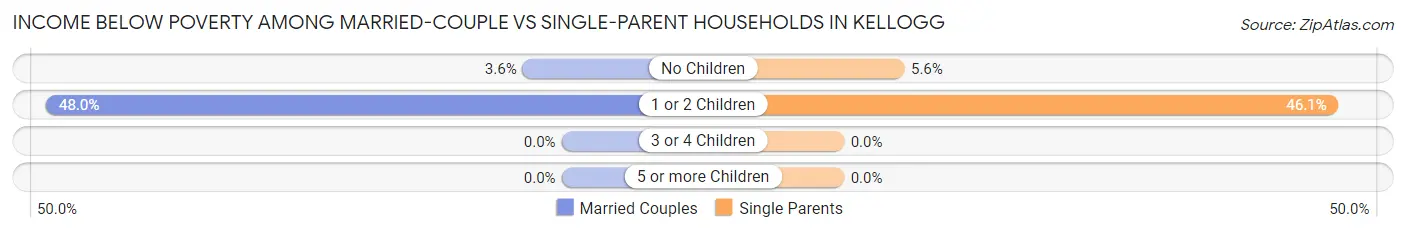
| Children | Married-Couple Families | Single-Parent Households |
| No Children | 7 (3.6%) | 5 (5.6%) |
| 1 or 2 Children | 24 (48.0%) | 53 (46.1%) |
| 3 or 4 Children | 0 (0.0%) | 0 (0.0%) |
| 5 or more Children | 0 (0.0%) | 0 (0.0%) |
| Total | 31 (11.4%) | 58 (26.0%) |
Race in Kellogg
The most populous races in Kellogg are White / Caucasian (2,071 | 90.3%), Two or more Races (120 | 5.2%), and Hispanic or Latino (103 | 4.5%).
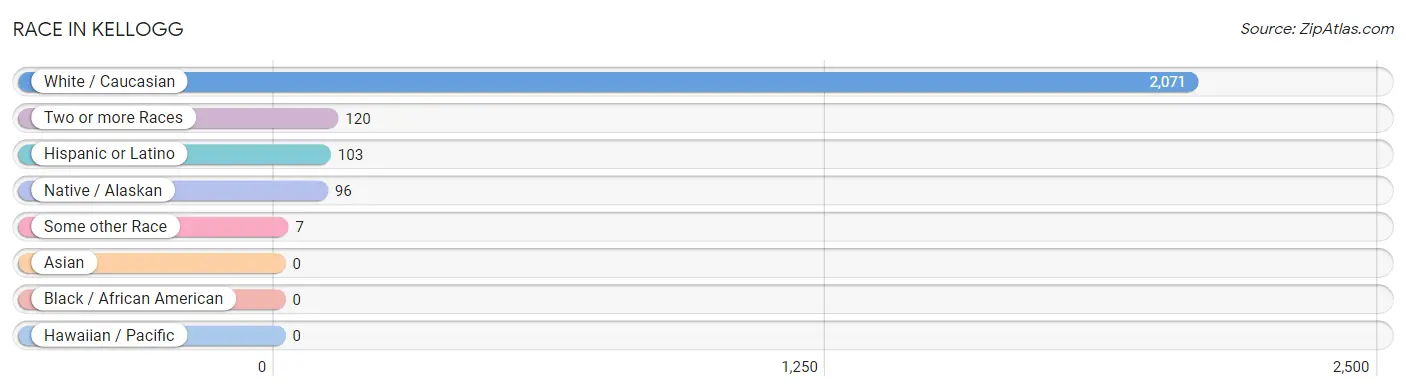
| Race | # Population | % Population |
| Asian | 0 | 0.0% |
| Black / African American | 0 | 0.0% |
| Hawaiian / Pacific | 0 | 0.0% |
| Hispanic or Latino | 103 | 4.5% |
| Native / Alaskan | 96 | 4.2% |
| White / Caucasian | 2,071 | 90.3% |
| Two or more Races | 120 | 5.2% |
| Some other Race | 7 | 0.3% |
| Total | 2,294 | 100.0% |
Ancestry in Kellogg
The most populous ancestries reported in Kellogg are German (429 | 18.7%), Irish (368 | 16.0%), English (182 | 7.9%), American (136 | 5.9%), and Italian (120 | 5.2%), together accounting for 53.8% of all Kellogg residents.
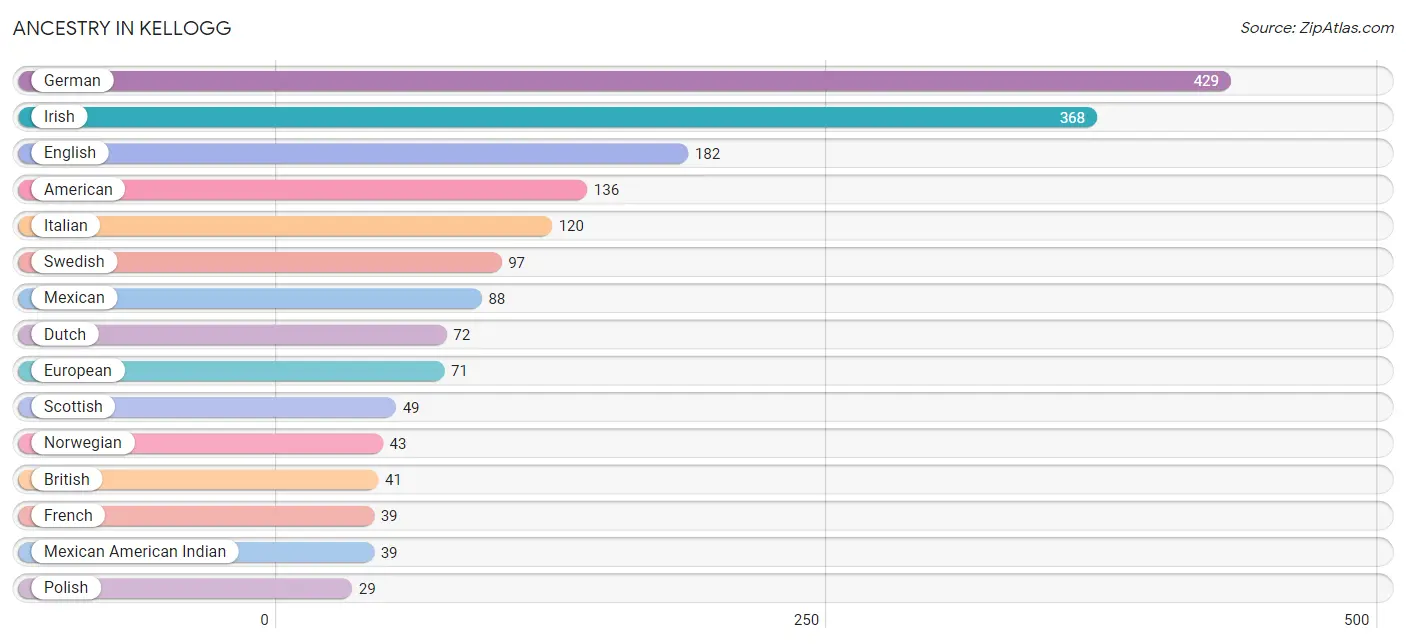
| Ancestry | # Population | % Population |
| American | 136 | 5.9% |
| Apache | 14 | 0.6% |
| British | 41 | 1.8% |
| Canadian | 3 | 0.1% |
| Cherokee | 14 | 0.6% |
| Chippewa | 5 | 0.2% |
| Choctaw | 18 | 0.8% |
| Czech | 8 | 0.4% |
| Danish | 4 | 0.2% |
| Dutch | 72 | 3.1% |
| English | 182 | 7.9% |
| European | 71 | 3.1% |
| Finnish | 7 | 0.3% |
| French | 39 | 1.7% |
| German | 429 | 18.7% |
| Greek | 7 | 0.3% |
| Icelander | 6 | 0.3% |
| Inupiat | 6 | 0.3% |
| Irish | 368 | 16.0% |
| Italian | 120 | 5.2% |
| Mexican | 88 | 3.8% |
| Mexican American Indian | 39 | 1.7% |
| Norwegian | 43 | 1.9% |
| Polish | 29 | 1.3% |
| Portuguese | 8 | 0.4% |
| Scandinavian | 20 | 0.9% |
| Scotch-Irish | 13 | 0.6% |
| Scottish | 49 | 2.1% |
| Serbian | 5 | 0.2% |
| Shoshone | 17 | 0.7% |
| Sioux | 10 | 0.4% |
| Spaniard | 8 | 0.4% |
| Swedish | 97 | 4.2% |
| Swiss | 11 | 0.5% |
| Ukrainian | 17 | 0.7% |
| Welsh | 5 | 0.2% | View All 36 Rows |
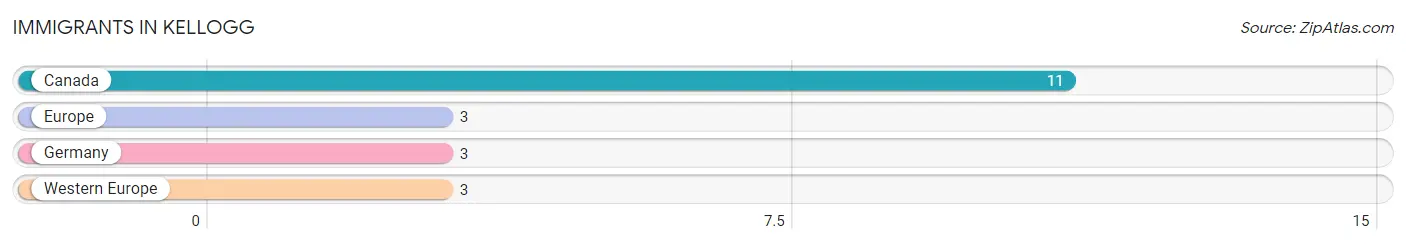
Immigrants in Kellogg
The most numerous immigrant groups reported in Kellogg came from Canada (11 | 0.5%), Europe (3 | 0.1%), Germany (3 | 0.1%), and Western Europe (3 | 0.1%), together accounting for 0.9% of all Kellogg residents.
| Immigration Origin | # Population | % Population |
| Canada | 11 | 0.5% |
| Europe | 3 | 0.1% |
| Germany | 3 | 0.1% |
| Western Europe | 3 | 0.1% | View All 4 Rows |
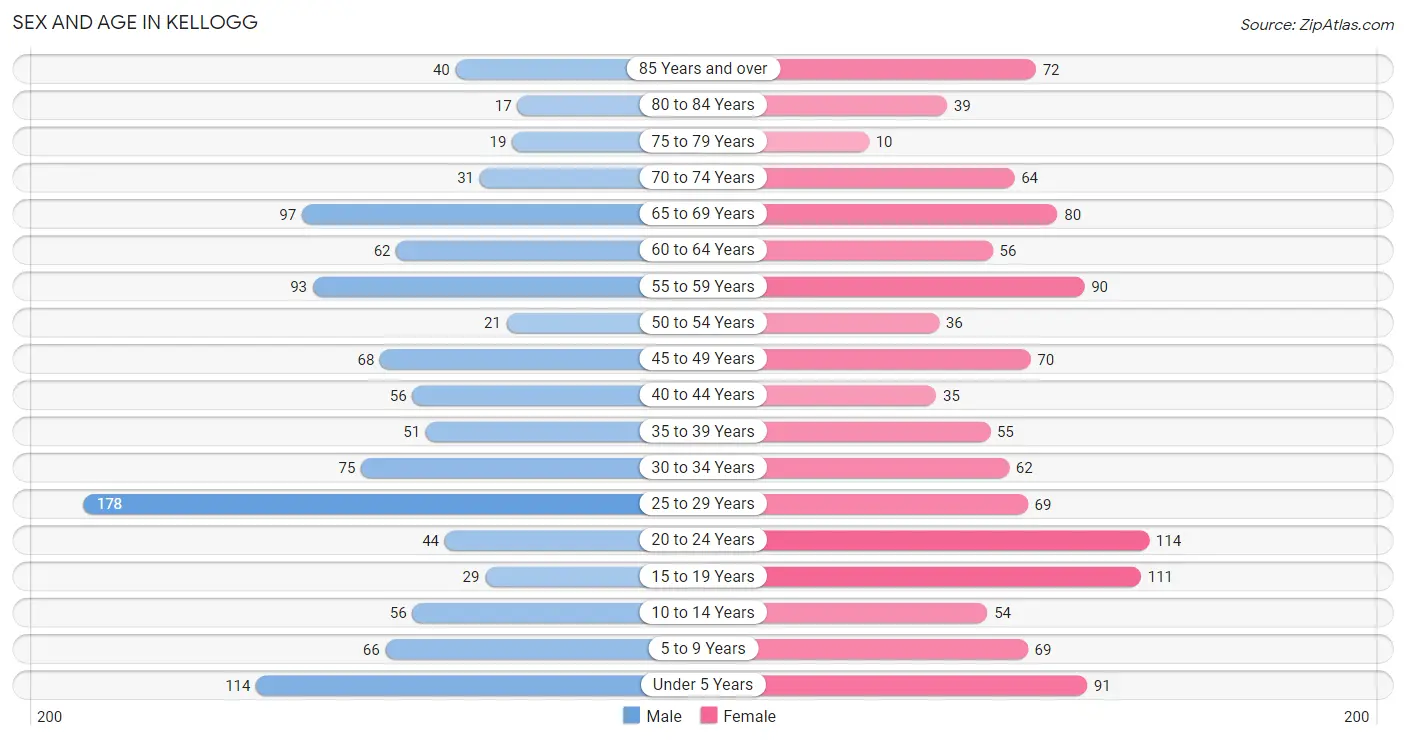
Sex and Age in Kellogg
Sex and Age in Kellogg
The most populous age groups in Kellogg are 25 to 29 Years (178 | 15.9%) for men and 20 to 24 Years (114 | 9.7%) for women.
| Age Bracket | Male | Female |
| Under 5 Years | 114 (10.2%) | 91 (7.7%) |
| 5 to 9 Years | 66 (5.9%) | 69 (5.9%) |
| 10 to 14 Years | 56 (5.0%) | 54 (4.6%) |
| 15 to 19 Years | 29 (2.6%) | 111 (9.4%) |
| 20 to 24 Years | 44 (3.9%) | 114 (9.7%) |
| 25 to 29 Years | 178 (15.9%) | 69 (5.9%) |
| 30 to 34 Years | 75 (6.7%) | 62 (5.3%) |
| 35 to 39 Years | 51 (4.6%) | 55 (4.7%) |
| 40 to 44 Years | 56 (5.0%) | 35 (3.0%) |
| 45 to 49 Years | 68 (6.1%) | 70 (5.9%) |
| 50 to 54 Years | 21 (1.9%) | 36 (3.1%) |
| 55 to 59 Years | 93 (8.3%) | 90 (7.6%) |
| 60 to 64 Years | 62 (5.6%) | 56 (4.8%) |
| 65 to 69 Years | 97 (8.7%) | 80 (6.8%) |
| 70 to 74 Years | 31 (2.8%) | 64 (5.4%) |
| 75 to 79 Years | 19 (1.7%) | 10 (0.9%) |
| 80 to 84 Years | 17 (1.5%) | 39 (3.3%) |
| 85 Years and over | 40 (3.6%) | 72 (6.1%) |
| Total | 1,117 (100.0%) | 1,177 (100.0%) |
Families and Households in Kellogg
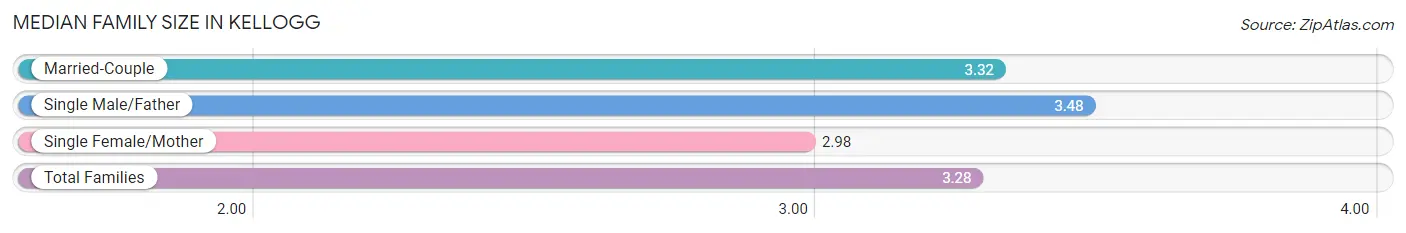
Median Family Size in Kellogg
The median family size in Kellogg is 3.28 persons per family, with single male/father families (114 | 23.0%) accounting for the largest median family size of 3.48 persons per family. On the other hand, single female/mother families (109 | 22.0%) represent the smallest median family size with 2.98 persons per family.
| Family Type | # Families | Family Size |
| Married-Couple | 273 (55.0%) | 3.32 |
| Single Male/Father | 114 (23.0%) | 3.48 |
| Single Female/Mother | 109 (22.0%) | 2.98 |
| Total Families | 496 (100.0%) | 3.28 |
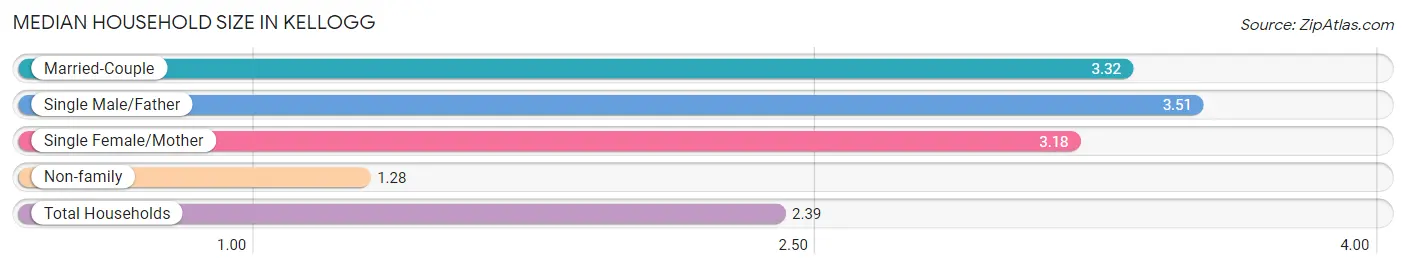
Median Household Size in Kellogg
The median household size in Kellogg is 2.39 persons per household, with single male/father households (114 | 12.4%) accounting for the largest median household size of 3.51 persons per household. non-family households (424 | 46.1%) represent the smallest median household size with 1.28 persons per household.
| Household Type | # Households | Household Size |
| Married-Couple | 273 (29.7%) | 3.32 |
| Single Male/Father | 114 (12.4%) | 3.51 |
| Single Female/Mother | 109 (11.8%) | 3.18 |
| Non-family | 424 (46.1%) | 1.28 |
| Total Households | 920 (100.0%) | 2.39 |
Household Size by Marriage Status in Kellogg
Out of a total of 920 households in Kellogg, 496 (53.9%) are family households, while 424 (46.1%) are nonfamily households. The most numerous type of family households are 2-person households, comprising 246, and the most common type of nonfamily households are 1-person households, comprising 355.
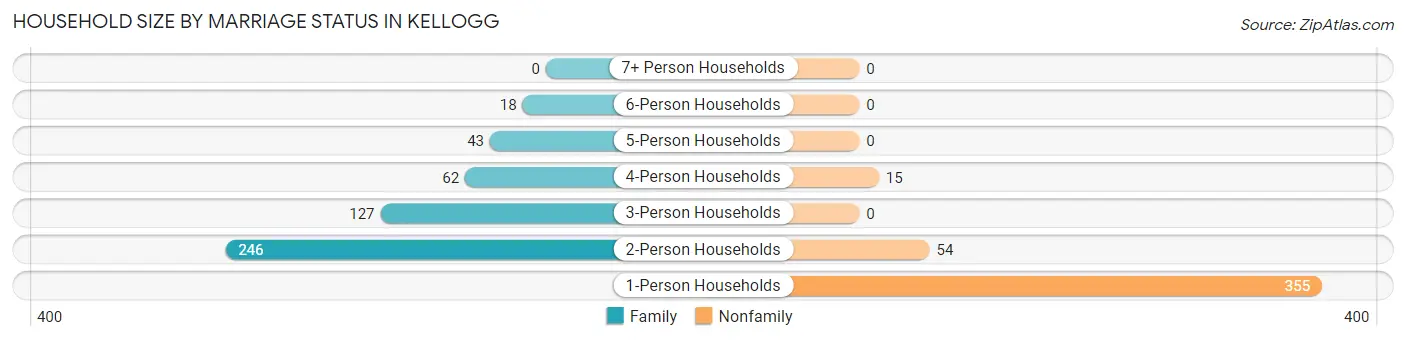
| Household Size | Family Households | Nonfamily Households |
| 1-Person Households | - | 355 (38.6%) |
| 2-Person Households | 246 (26.7%) | 54 (5.9%) |
| 3-Person Households | 127 (13.8%) | 0 (0.0%) |
| 4-Person Households | 62 (6.7%) | 15 (1.6%) |
| 5-Person Households | 43 (4.7%) | 0 (0.0%) |
| 6-Person Households | 18 (2.0%) | 0 (0.0%) |
| 7+ Person Households | 0 (0.0%) | 0 (0.0%) |
| Total | 496 (53.9%) | 424 (46.1%) |
Female Fertility in Kellogg
Fertility by Age in Kellogg
Average fertility rate in Kellogg is 55.0 births per 1,000 women. Women in the age bracket of 20 to 34 years have the highest fertility rate with 90.0 births per 1,000 women. Women in the age bracket of 20 to 34 years acount for 75.9% of all women with births.
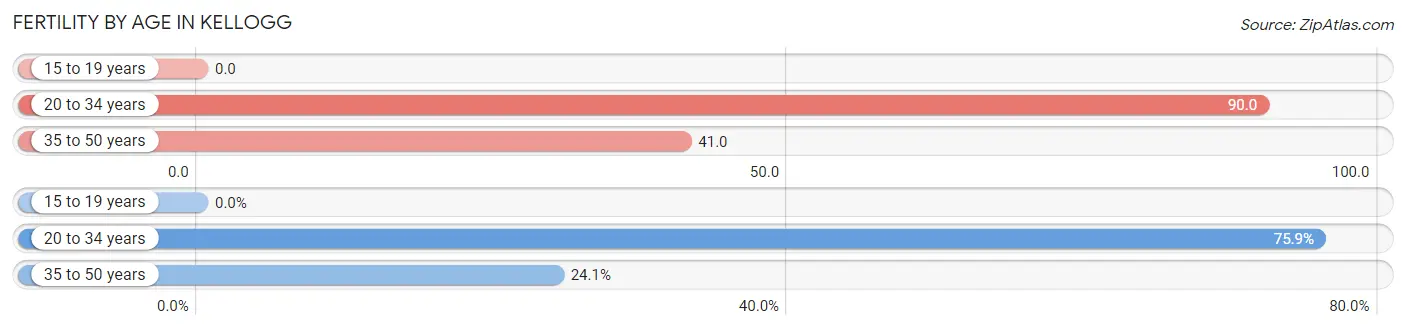
| Age Bracket | Women with Births | Births / 1,000 Women |
| 15 to 19 years | 0 (0.0%) | 0.0 |
| 20 to 34 years | 22 (75.9%) | 90.0 |
| 35 to 50 years | 7 (24.1%) | 41.0 |
| Total | 29 (100.0%) | 55.0 |
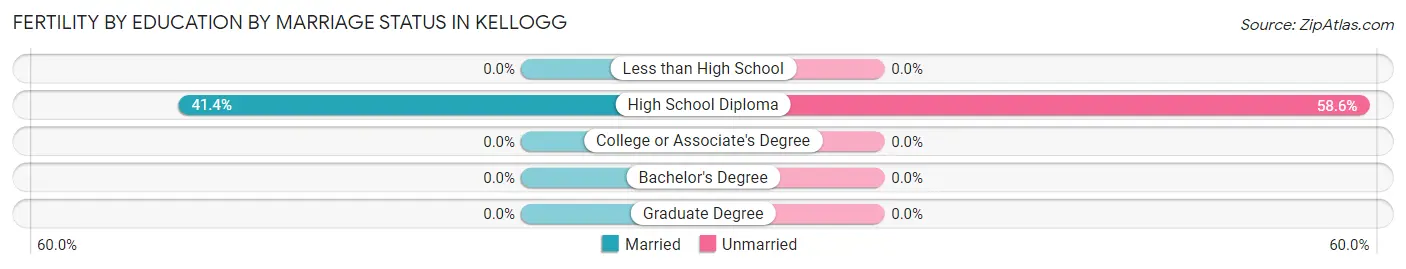
Fertility by Age by Marriage Status in Kellogg
41.4% of women with births (29) in Kellogg are married. The highest percentage of unmarried women with births falls into 20 to 34 years age bracket with 77.3% of them unmarried at the time of birth, while the lowest percentage of unmarried women with births belong to 35 to 50 years age bracket with 0.0% of them unmarried.
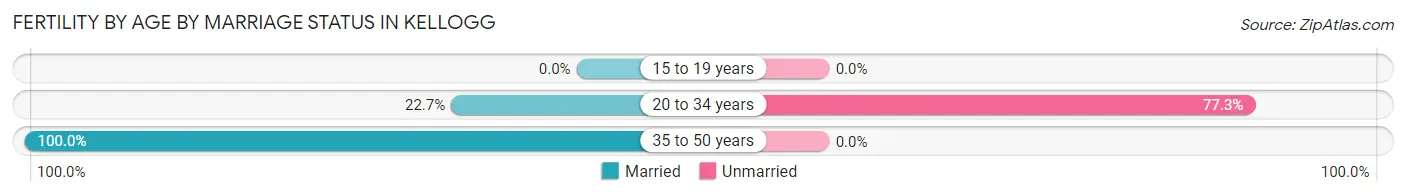
| Age Bracket | Married | Unmarried |
| 15 to 19 years | 0 (0.0%) | 0 (0.0%) |
| 20 to 34 years | 5 (22.7%) | 17 (77.3%) |
| 35 to 50 years | 7 (100.0%) | 0 (0.0%) |
| Total | 12 (41.4%) | 17 (58.6%) |
Fertility by Education in Kellogg
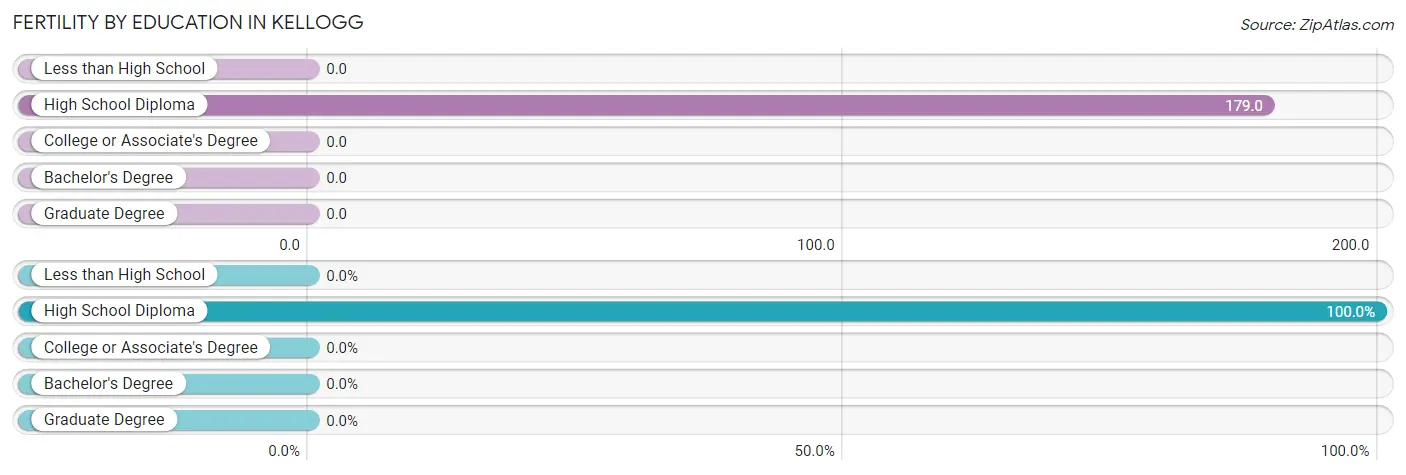
| Educational Attainment | Women with Births | Births / 1,000 Women |
| Less than High School | 0 (0.0%) | 0.0 |
| High School Diploma | 29 (100.0%) | 179.0 |
| College or Associate's Degree | 0 (0.0%) | 0.0 |
| Bachelor's Degree | 0 (0.0%) | 0.0 |
| Graduate Degree | 0 (0.0%) | 0.0 |
| Total | 29 (100.0%) | 55.0 |
Fertility by Education by Marriage Status in Kellogg
58.6% of women with births in Kellogg are unmarried. Women with the educational attainment of high school diploma are most likely to be married with 41.4% of them married at childbirth, while women with the educational attainment of high school diploma are least likely to be married with 58.6% of them unmarried at childbirth.
| Educational Attainment | Married | Unmarried |
| Less than High School | 0 (0.0%) | 0 (0.0%) |
| High School Diploma | 12 (41.4%) | 17 (58.6%) |
| College or Associate's Degree | 0 (0.0%) | 0 (0.0%) |
| Bachelor's Degree | 0 (0.0%) | 0 (0.0%) |
| Graduate Degree | 0 (0.0%) | 0 (0.0%) |
| Total | 12 (41.4%) | 17 (58.6%) |
Employment Characteristics in Kellogg
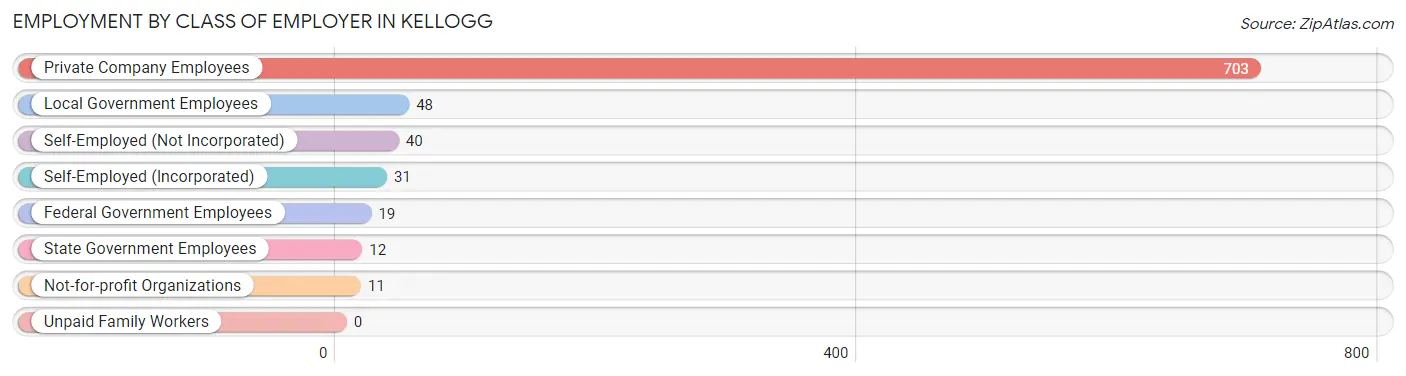
Employment by Class of Employer in Kellogg
Among the 864 employed individuals in Kellogg, private company employees (703 | 81.4%), local government employees (48 | 5.6%), and self-employed (not incorporated) (40 | 4.6%) make up the most common classes of employment.
| Employer Class | # Employees | % Employees |
| Private Company Employees | 703 | 81.4% |
| Self-Employed (Incorporated) | 31 | 3.6% |
| Self-Employed (Not Incorporated) | 40 | 4.6% |
| Not-for-profit Organizations | 11 | 1.3% |
| Local Government Employees | 48 | 5.6% |
| State Government Employees | 12 | 1.4% |
| Federal Government Employees | 19 | 2.2% |
| Unpaid Family Workers | 0 | 0.0% |
| Total | 864 | 100.0% |
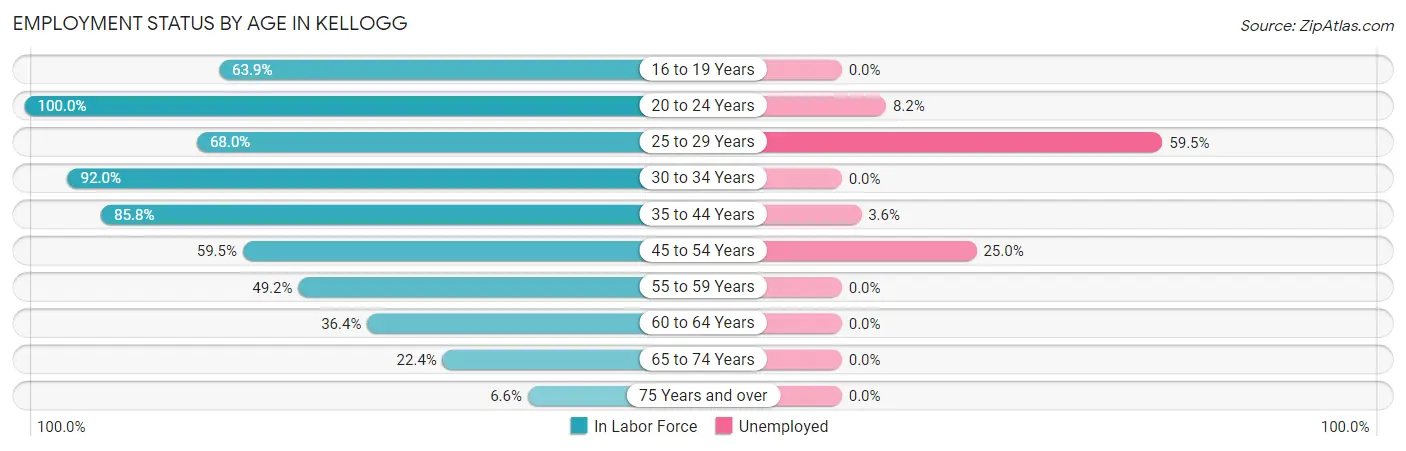
Employment Status by Age in Kellogg
According to the labor force statistics for Kellogg, out of the total population over 16 years of age (1,823), 56.0% or 1,021 individuals are in the labor force, with 14.5% or 148 of them unemployed. The age group with the highest labor force participation rate is 20 to 24 years, with 100.0% or 158 individuals in the labor force. Within the labor force, the 25 to 29 years age range has the highest percentage of unemployed individuals, with 59.5% or 100 of them being unemployed.
| Age Bracket | In Labor Force | Unemployed |
| 16 to 19 Years | 76 (63.9%) | 0 (0.0%) |
| 20 to 24 Years | 158 (100.0%) | 13 (8.2%) |
| 25 to 29 Years | 168 (68.0%) | 100 (59.5%) |
| 30 to 34 Years | 126 (92.0%) | 0 (0.0%) |
| 35 to 44 Years | 169 (85.8%) | 6 (3.6%) |
| 45 to 54 Years | 116 (59.5%) | 29 (25.0%) |
| 55 to 59 Years | 90 (49.2%) | 0 (0.0%) |
| 60 to 64 Years | 43 (36.4%) | 0 (0.0%) |
| 65 to 74 Years | 61 (22.4%) | 0 (0.0%) |
| 75 Years and over | 13 (6.6%) | 0 (0.0%) |
| Total | 1,021 (56.0%) | 148 (14.5%) |
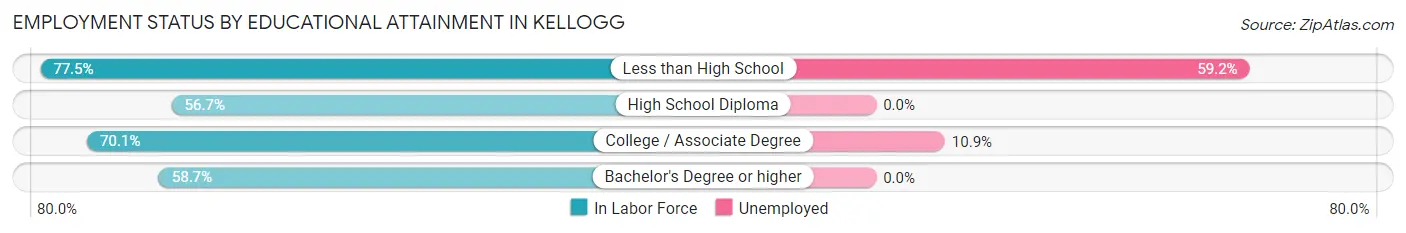
Employment Status by Educational Attainment in Kellogg
According to labor force statistics for Kellogg, 66.1% of individuals (712) out of the total population between 25 and 64 years of age (1,077) are in the labor force, with 19.0% or 135 of them being unemployed. The group with the highest labor force participation rate are those with the educational attainment of less than high school, with 77.5% or 179 individuals in the labor force. Within the labor force, individuals with less than high school education have the highest percentage of unemployment, with 59.2% or 106 of them being unemployed.
| Educational Attainment | In Labor Force | Unemployed |
| Less than High School | 179 (77.5%) | 137 (59.2%) |
| High School Diploma | 195 (56.7%) | 0 (0.0%) |
| College / Associate Degree | 267 (70.1%) | 42 (10.9%) |
| Bachelor's Degree or higher | 71 (58.7%) | 0 (0.0%) |
| Total | 712 (66.1%) | 205 (19.0%) |
Employment Occupations by Sex in Kellogg
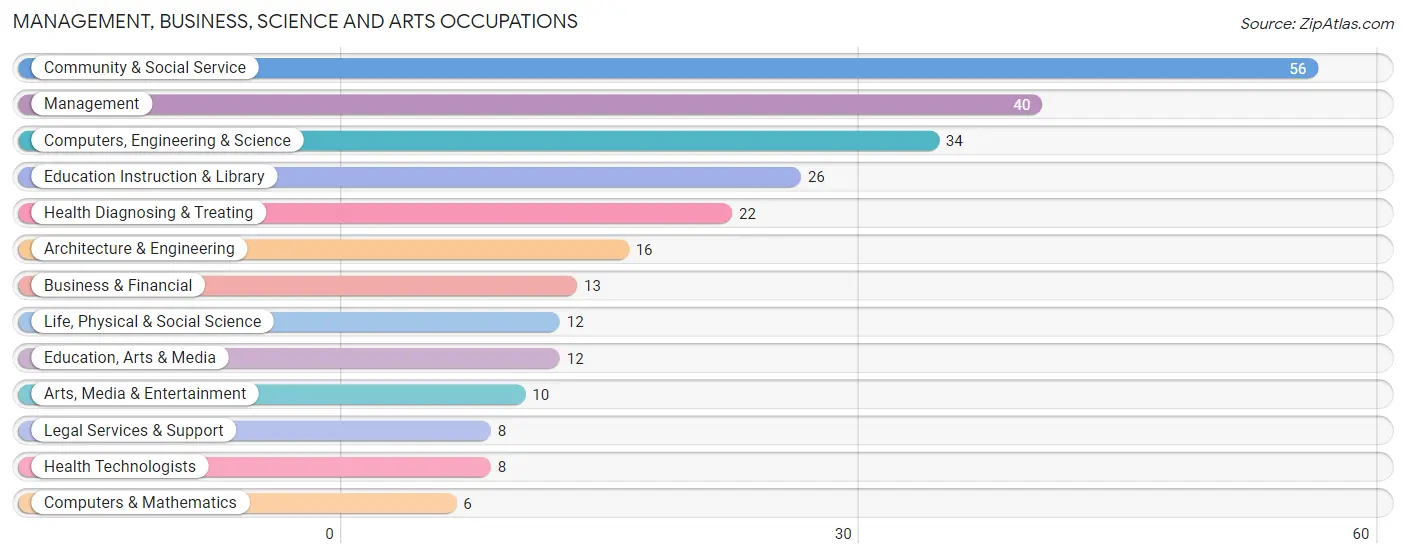
Management, Business, Science and Arts Occupations
The most common Management, Business, Science and Arts occupations in Kellogg are Community & Social Service (56 | 6.4%), Management (40 | 4.6%), Computers, Engineering & Science (34 | 3.9%), Education Instruction & Library (26 | 3.0%), and Health Diagnosing & Treating (22 | 2.5%).
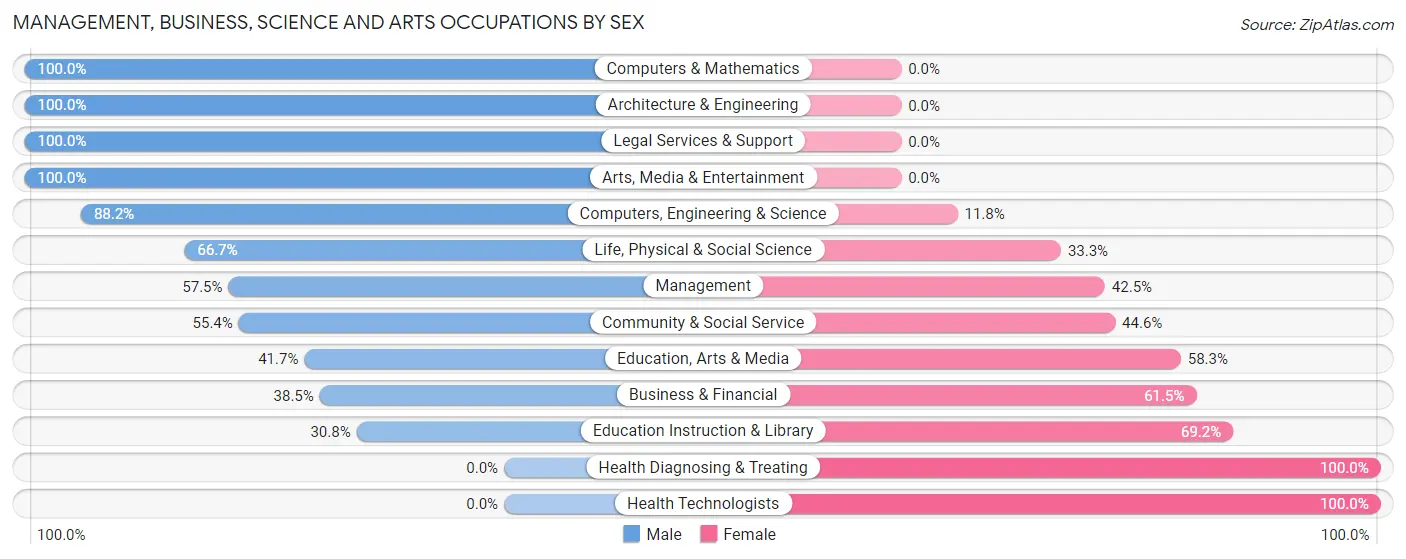
Management, Business, Science and Arts Occupations by Sex
Within the Management, Business, Science and Arts occupations in Kellogg, the most male-oriented occupations are Computers & Mathematics (100.0%), Architecture & Engineering (100.0%), and Legal Services & Support (100.0%), while the most female-oriented occupations are Health Diagnosing & Treating (100.0%), Health Technologists (100.0%), and Education Instruction & Library (69.2%).
| Occupation | Male | Female |
| Management | 23 (57.5%) | 17 (42.5%) |
| Business & Financial | 5 (38.5%) | 8 (61.5%) |
| Computers, Engineering & Science | 30 (88.2%) | 4 (11.8%) |
| Computers & Mathematics | 6 (100.0%) | 0 (0.0%) |
| Architecture & Engineering | 16 (100.0%) | 0 (0.0%) |
| Life, Physical & Social Science | 8 (66.7%) | 4 (33.3%) |
| Community & Social Service | 31 (55.4%) | 25 (44.6%) |
| Education, Arts & Media | 5 (41.7%) | 7 (58.3%) |
| Legal Services & Support | 8 (100.0%) | 0 (0.0%) |
| Education Instruction & Library | 8 (30.8%) | 18 (69.2%) |
| Arts, Media & Entertainment | 10 (100.0%) | 0 (0.0%) |
| Health Diagnosing & Treating | 0 (0.0%) | 22 (100.0%) |
| Health Technologists | 0 (0.0%) | 8 (100.0%) |
| Total (Category) | 89 (53.9%) | 76 (46.1%) |
| Total (Overall) | 422 (48.4%) | 450 (51.6%) |
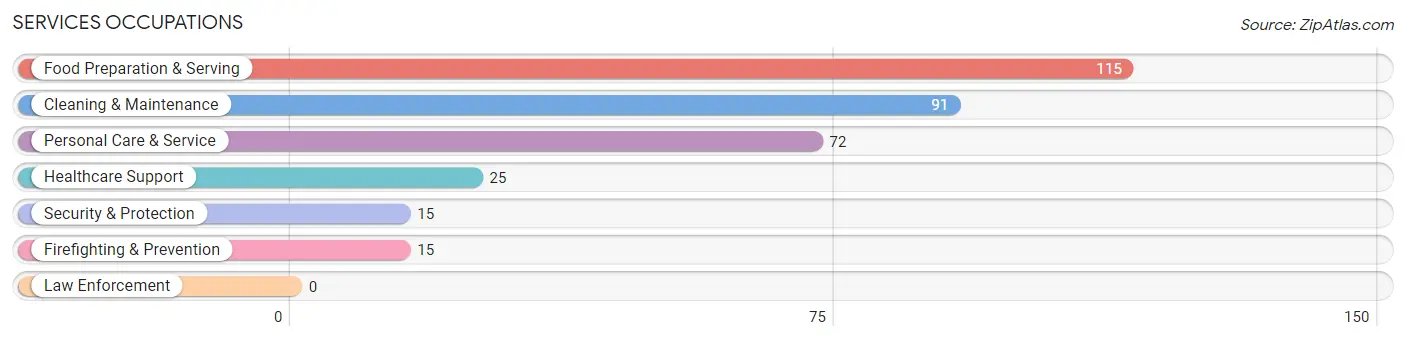
Services Occupations
The most common Services occupations in Kellogg are Food Preparation & Serving (115 | 13.2%), Cleaning & Maintenance (91 | 10.4%), Personal Care & Service (72 | 8.3%), Healthcare Support (25 | 2.9%), and Security & Protection (15 | 1.7%).
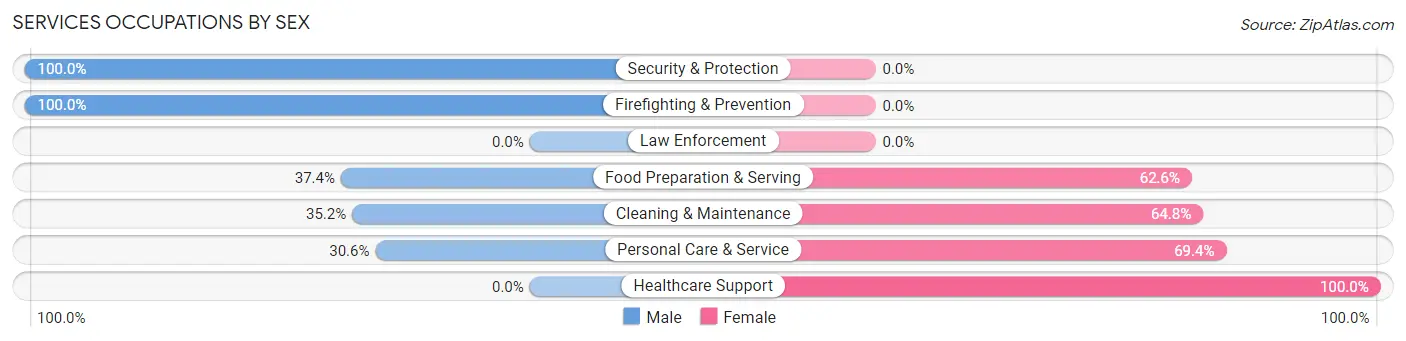
Services Occupations by Sex
Within the Services occupations in Kellogg, the most male-oriented occupations are Security & Protection (100.0%), Firefighting & Prevention (100.0%), and Food Preparation & Serving (37.4%), while the most female-oriented occupations are Healthcare Support (100.0%), Personal Care & Service (69.4%), and Cleaning & Maintenance (64.8%).
| Occupation | Male | Female |
| Healthcare Support | 0 (0.0%) | 25 (100.0%) |
| Security & Protection | 15 (100.0%) | 0 (0.0%) |
| Firefighting & Prevention | 15 (100.0%) | 0 (0.0%) |
| Law Enforcement | 0 (0.0%) | 0 (0.0%) |
| Food Preparation & Serving | 43 (37.4%) | 72 (62.6%) |
| Cleaning & Maintenance | 32 (35.2%) | 59 (64.8%) |
| Personal Care & Service | 22 (30.6%) | 50 (69.4%) |
| Total (Category) | 112 (35.2%) | 206 (64.8%) |
| Total (Overall) | 422 (48.4%) | 450 (51.6%) |
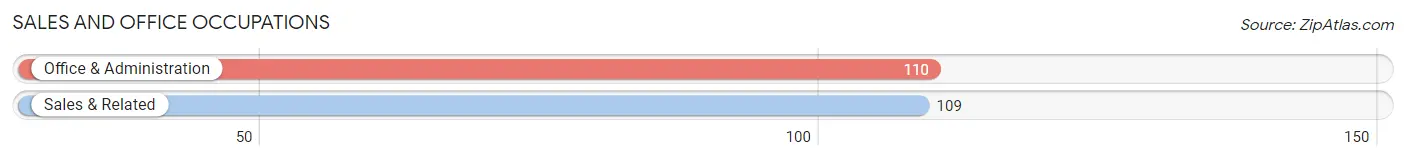
Sales and Office Occupations
The most common Sales and Office occupations in Kellogg are Office & Administration (110 | 12.6%), and Sales & Related (109 | 12.5%).
Sales and Office Occupations by Sex
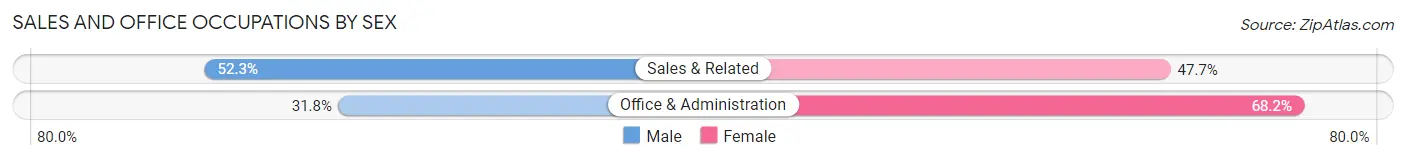
| Occupation | Male | Female |
| Sales & Related | 57 (52.3%) | 52 (47.7%) |
| Office & Administration | 35 (31.8%) | 75 (68.2%) |
| Total (Category) | 92 (42.0%) | 127 (58.0%) |
| Total (Overall) | 422 (48.4%) | 450 (51.6%) |
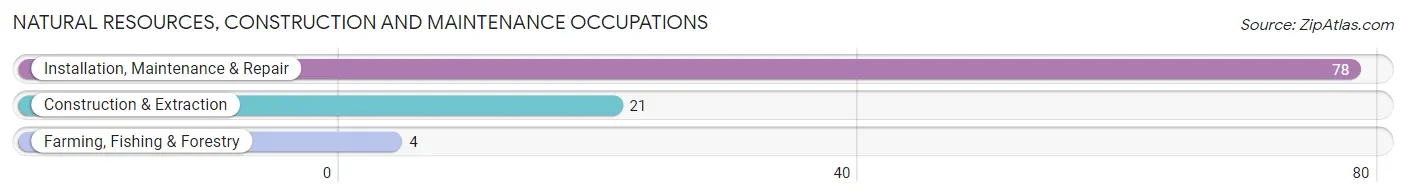
Natural Resources, Construction and Maintenance Occupations
The most common Natural Resources, Construction and Maintenance occupations in Kellogg are Installation, Maintenance & Repair (78 | 8.9%), Construction & Extraction (21 | 2.4%), and Farming, Fishing & Forestry (4 | 0.5%).
Natural Resources, Construction and Maintenance Occupations by Sex
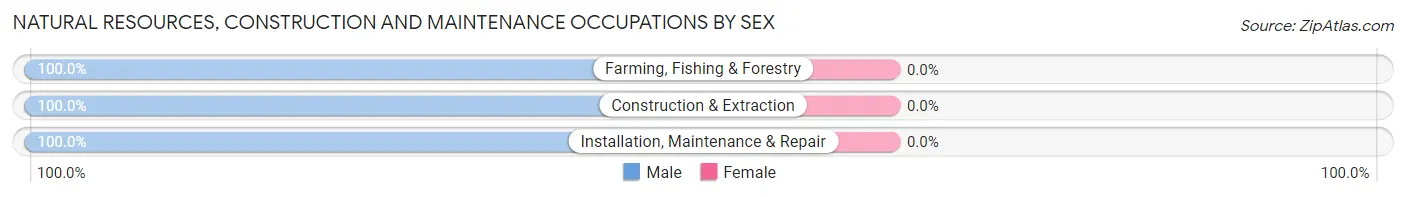
| Occupation | Male | Female |
| Farming, Fishing & Forestry | 4 (100.0%) | 0 (0.0%) |
| Construction & Extraction | 21 (100.0%) | 0 (0.0%) |
| Installation, Maintenance & Repair | 78 (100.0%) | 0 (0.0%) |
| Total (Category) | 103 (100.0%) | 0 (0.0%) |
| Total (Overall) | 422 (48.4%) | 450 (51.6%) |
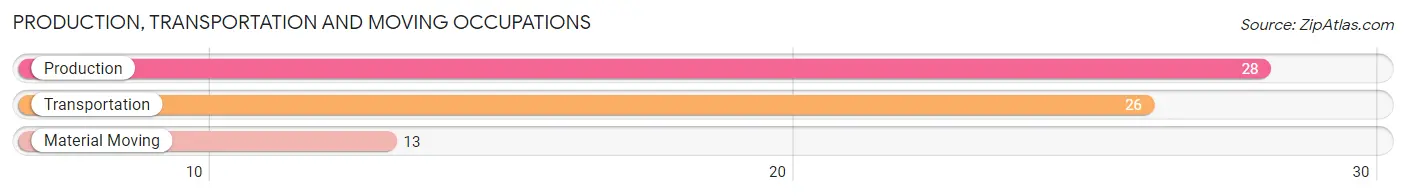
Production, Transportation and Moving Occupations
The most common Production, Transportation and Moving occupations in Kellogg are Production (28 | 3.2%), Transportation (26 | 3.0%), and Material Moving (13 | 1.5%).
Production, Transportation and Moving Occupations by Sex
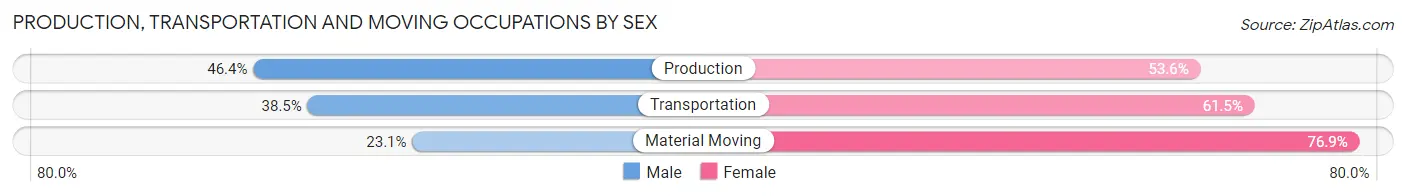
| Occupation | Male | Female |
| Production | 13 (46.4%) | 15 (53.6%) |
| Transportation | 10 (38.5%) | 16 (61.5%) |
| Material Moving | 3 (23.1%) | 10 (76.9%) |
| Total (Category) | 26 (38.8%) | 41 (61.2%) |
| Total (Overall) | 422 (48.4%) | 450 (51.6%) |
Employment Industries by Sex in Kellogg
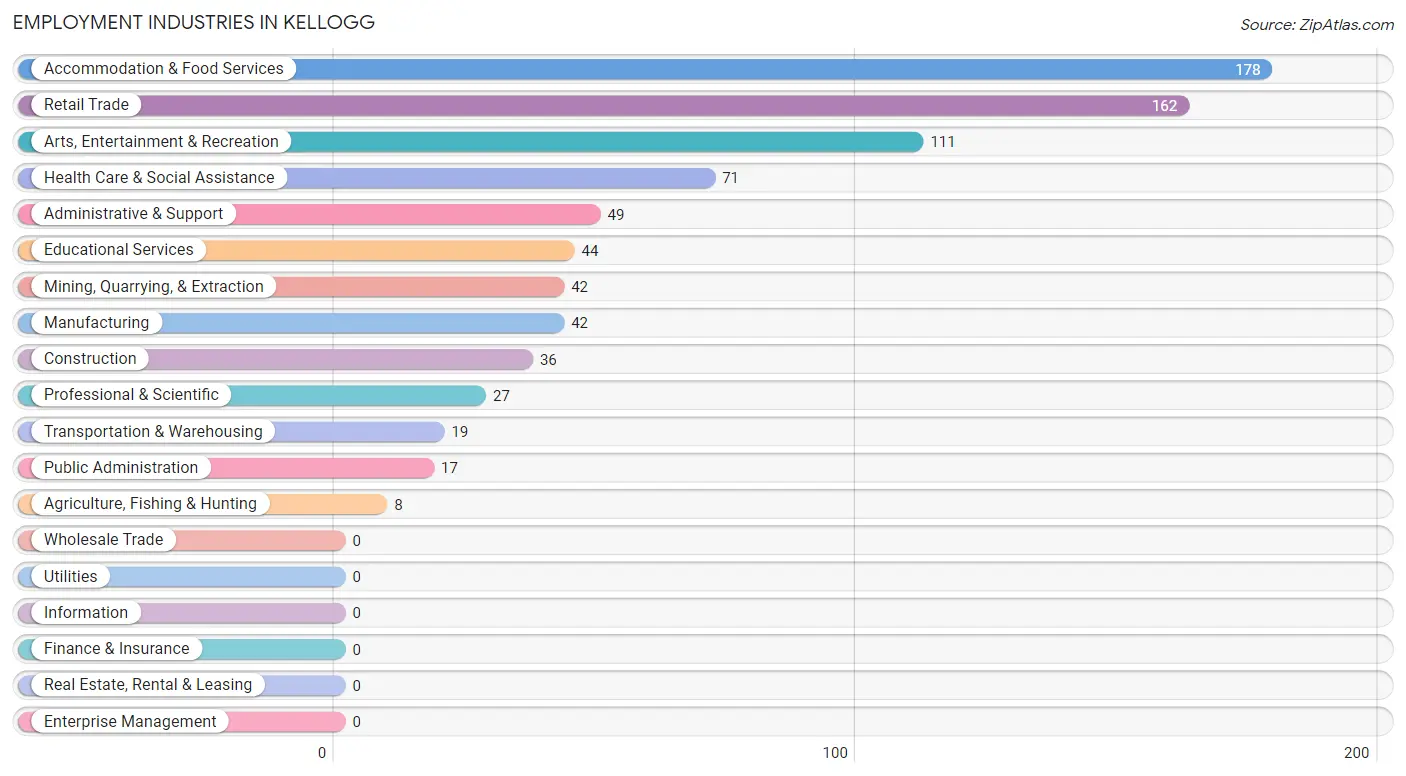
Employment Industries in Kellogg
The major employment industries in Kellogg include Accommodation & Food Services (178 | 20.4%), Retail Trade (162 | 18.6%), Arts, Entertainment & Recreation (111 | 12.7%), Health Care & Social Assistance (71 | 8.1%), and Administrative & Support (49 | 5.6%).
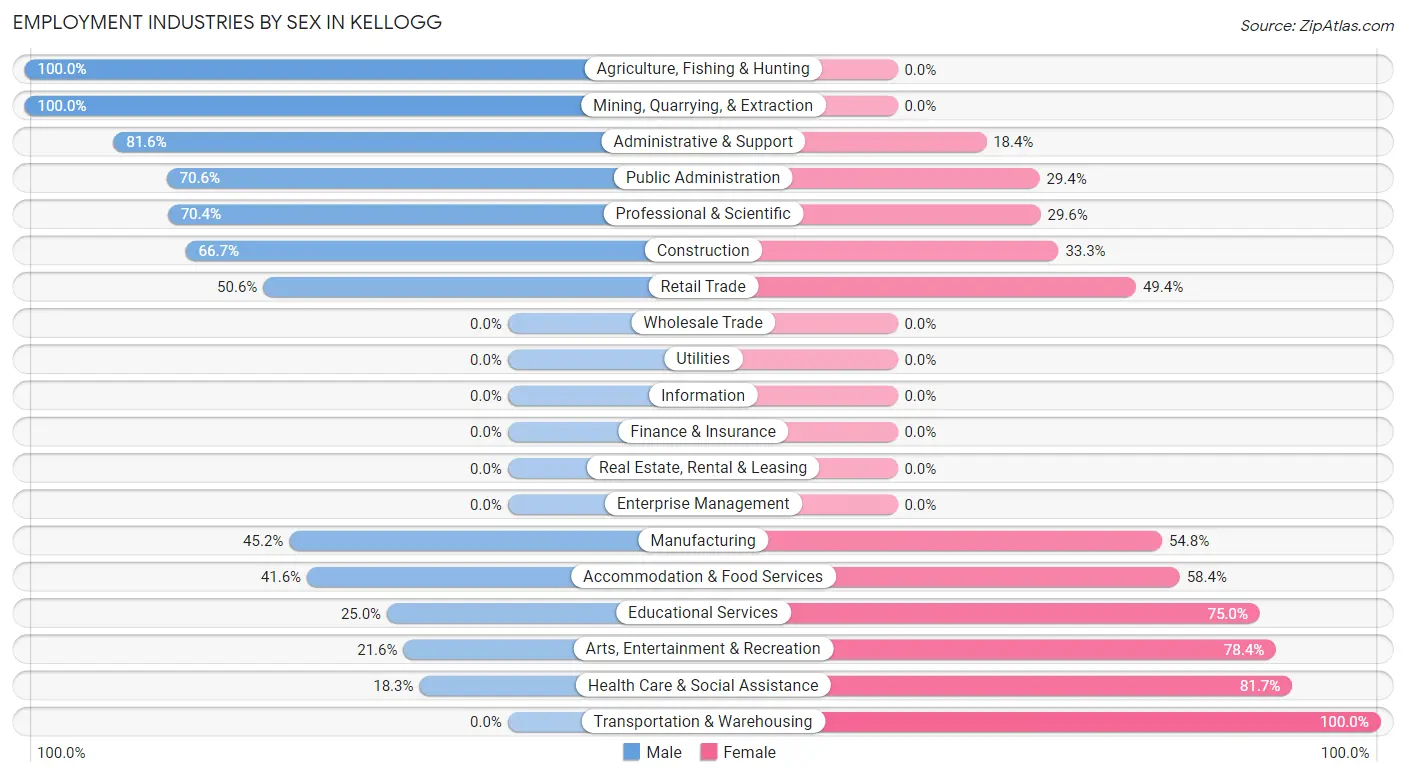
Employment Industries by Sex in Kellogg
The Kellogg industries that see more men than women are Agriculture, Fishing & Hunting (100.0%), Mining, Quarrying, & Extraction (100.0%), and Administrative & Support (81.6%), whereas the industries that tend to have a higher number of women are Transportation & Warehousing (100.0%), Health Care & Social Assistance (81.7%), and Arts, Entertainment & Recreation (78.4%).
| Industry | Male | Female |
| Agriculture, Fishing & Hunting | 8 (100.0%) | 0 (0.0%) |
| Mining, Quarrying, & Extraction | 42 (100.0%) | 0 (0.0%) |
| Construction | 24 (66.7%) | 12 (33.3%) |
| Manufacturing | 19 (45.2%) | 23 (54.8%) |
| Wholesale Trade | 0 (0.0%) | 0 (0.0%) |
| Retail Trade | 82 (50.6%) | 80 (49.4%) |
| Transportation & Warehousing | 0 (0.0%) | 19 (100.0%) |
| Utilities | 0 (0.0%) | 0 (0.0%) |
| Information | 0 (0.0%) | 0 (0.0%) |
| Finance & Insurance | 0 (0.0%) | 0 (0.0%) |
| Real Estate, Rental & Leasing | 0 (0.0%) | 0 (0.0%) |
| Professional & Scientific | 19 (70.4%) | 8 (29.6%) |
| Enterprise Management | 0 (0.0%) | 0 (0.0%) |
| Administrative & Support | 40 (81.6%) | 9 (18.4%) |
| Educational Services | 11 (25.0%) | 33 (75.0%) |
| Health Care & Social Assistance | 13 (18.3%) | 58 (81.7%) |
| Arts, Entertainment & Recreation | 24 (21.6%) | 87 (78.4%) |
| Accommodation & Food Services | 74 (41.6%) | 104 (58.4%) |
| Public Administration | 12 (70.6%) | 5 (29.4%) |
| Total | 422 (48.4%) | 450 (51.6%) |
Education in Kellogg
School Enrollment in Kellogg
The most common levels of schooling among the 426 students in Kellogg are middle school (98 | 23.0%), high school (93 | 21.8%), and elementary school (91 | 21.4%).
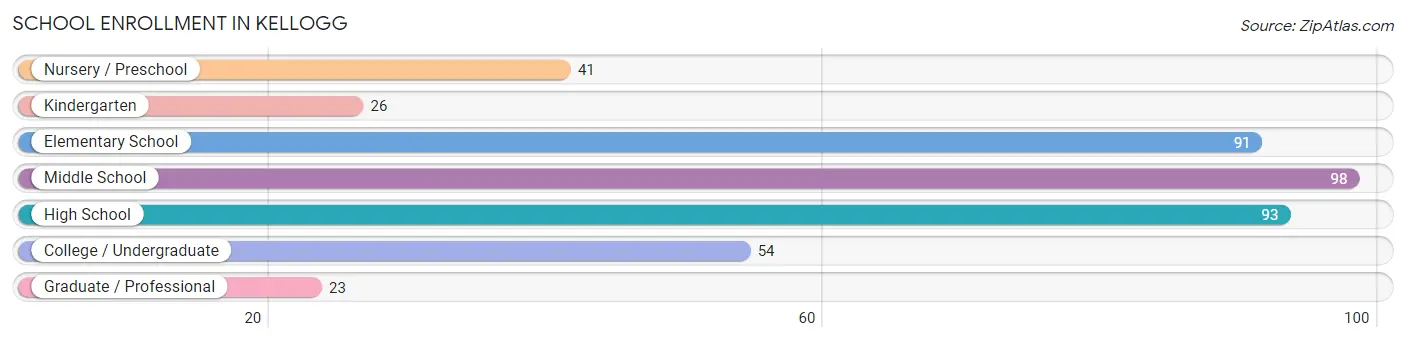
| School Level | # Students | % Students |
| Nursery / Preschool | 41 | 9.6% |
| Kindergarten | 26 | 6.1% |
| Elementary School | 91 | 21.4% |
| Middle School | 98 | 23.0% |
| High School | 93 | 21.8% |
| College / Undergraduate | 54 | 12.7% |
| Graduate / Professional | 23 | 5.4% |
| Total | 426 | 100.0% |
School Enrollment by Age by Funding Source in Kellogg
Out of a total of 426 students who are enrolled in schools in Kellogg, 19 (4.5%) attend a private institution, while the remaining 407 (95.5%) are enrolled in public schools. The age group of 25 to 34 year olds has the highest likelihood of being enrolled in private schools, with 6 (31.6% in the age bracket) enrolled. Conversely, the age group of 3 to 4 year olds has the lowest likelihood of being enrolled in a private school, with 41 (100.0% in the age bracket) attending a public institution.
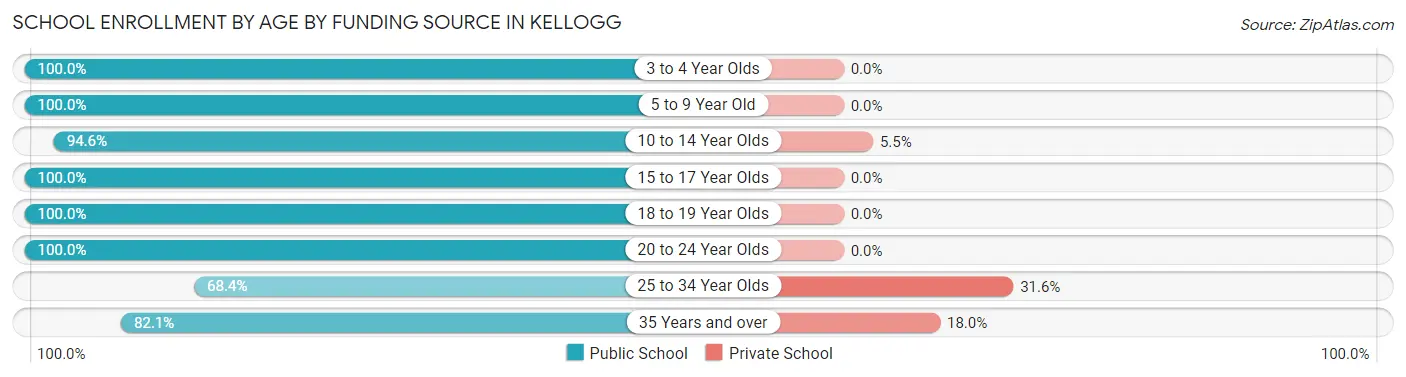
| Age Bracket | Public School | Private School |
| 3 to 4 Year Olds | 41 (100.0%) | 0 (0.0%) |
| 5 to 9 Year Old | 111 (100.0%) | 0 (0.0%) |
| 10 to 14 Year Olds | 104 (94.6%) | 6 (5.4%) |
| 15 to 17 Year Olds | 58 (100.0%) | 0 (0.0%) |
| 18 to 19 Year Olds | 29 (100.0%) | 0 (0.0%) |
| 20 to 24 Year Olds | 19 (100.0%) | 0 (0.0%) |
| 25 to 34 Year Olds | 13 (68.4%) | 6 (31.6%) |
| 35 Years and over | 32 (82.1%) | 7 (17.9%) |
| Total | 407 (95.5%) | 19 (4.5%) |
Educational Attainment by Field of Study in Kellogg
Education (46 | 20.5%), science & technology (34 | 15.2%), visual & performing arts (22 | 9.8%), psychology (19 | 8.5%), and engineering (19 | 8.5%) are the most common fields of study among 224 individuals in Kellogg who have obtained a bachelor's degree or higher.
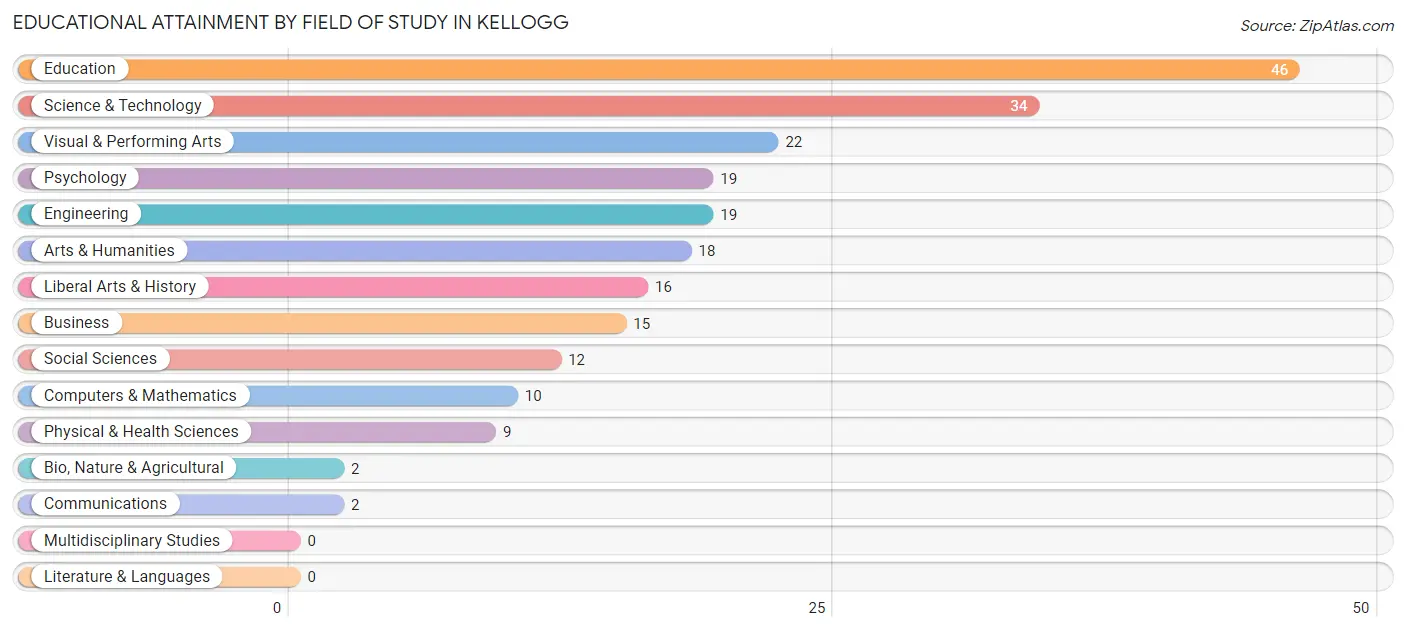
| Field of Study | # Graduates | % Graduates |
| Computers & Mathematics | 10 | 4.5% |
| Bio, Nature & Agricultural | 2 | 0.9% |
| Physical & Health Sciences | 9 | 4.0% |
| Psychology | 19 | 8.5% |
| Social Sciences | 12 | 5.4% |
| Engineering | 19 | 8.5% |
| Multidisciplinary Studies | 0 | 0.0% |
| Science & Technology | 34 | 15.2% |
| Business | 15 | 6.7% |
| Education | 46 | 20.5% |
| Literature & Languages | 0 | 0.0% |
| Liberal Arts & History | 16 | 7.1% |
| Visual & Performing Arts | 22 | 9.8% |
| Communications | 2 | 0.9% |
| Arts & Humanities | 18 | 8.0% |
| Total | 224 | 100.0% |
Transportation & Commute in Kellogg
Vehicle Availability by Sex in Kellogg
The most prevalent vehicle ownership categories in Kellogg are males with 2 vehicles (197, accounting for 47.0%) and females with 2 vehicles (247, making up 44.3%).
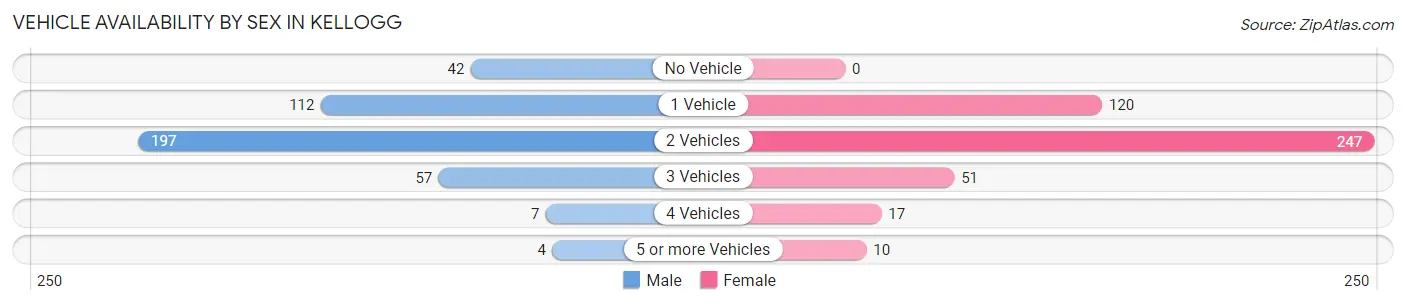
| Vehicles Available | Male | Female |
| No Vehicle | 42 (10.0%) | 0 (0.0%) |
| 1 Vehicle | 112 (26.7%) | 120 (27.0%) |
| 2 Vehicles | 197 (47.0%) | 247 (55.5%) |
| 3 Vehicles | 57 (13.6%) | 51 (11.5%) |
| 4 Vehicles | 7 (1.7%) | 17 (3.8%) |
| 5 or more Vehicles | 4 (0.9%) | 10 (2.2%) |
| Total | 419 (100.0%) | 445 (100.0%) |
Commute Time in Kellogg
The most frequently occuring commute durations in Kellogg are less than 5 minutes (214 commuters, 25.4%), 5 to 9 minutes (170 commuters, 20.2%), and 10 to 14 minutes (153 commuters, 18.2%).
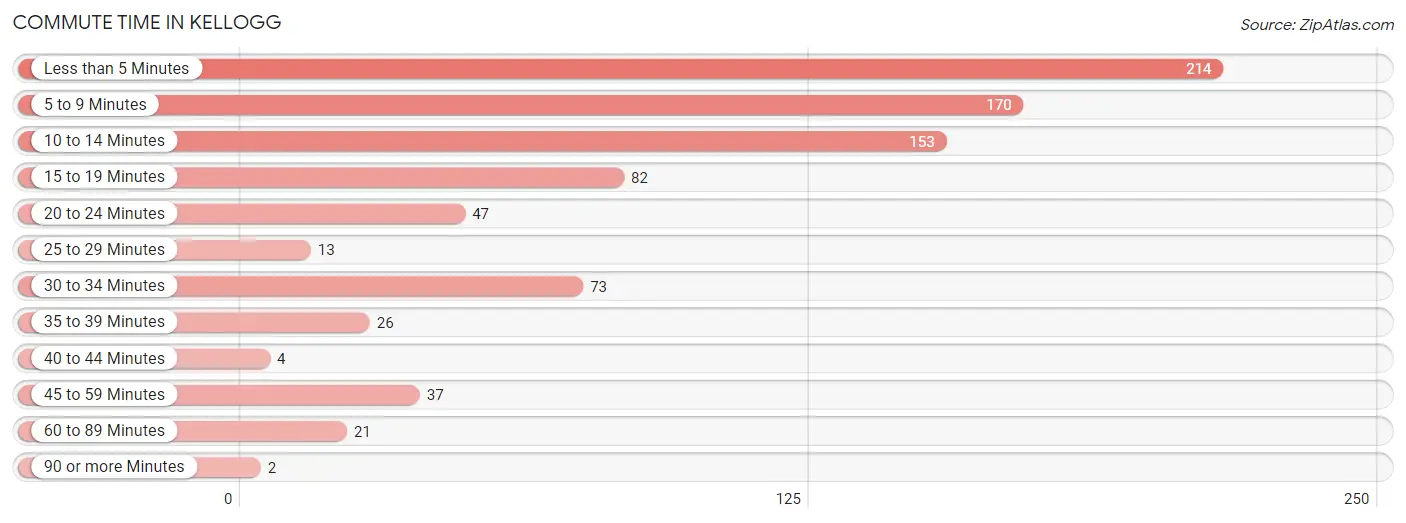
| Commute Time | # Commuters | % Commuters |
| Less than 5 Minutes | 214 | 25.4% |
| 5 to 9 Minutes | 170 | 20.2% |
| 10 to 14 Minutes | 153 | 18.2% |
| 15 to 19 Minutes | 82 | 9.7% |
| 20 to 24 Minutes | 47 | 5.6% |
| 25 to 29 Minutes | 13 | 1.5% |
| 30 to 34 Minutes | 73 | 8.7% |
| 35 to 39 Minutes | 26 | 3.1% |
| 40 to 44 Minutes | 4 | 0.5% |
| 45 to 59 Minutes | 37 | 4.4% |
| 60 to 89 Minutes | 21 | 2.5% |
| 90 or more Minutes | 2 | 0.2% |
Commute Time by Sex in Kellogg
The most common commute times in Kellogg are less than 5 minutes (118 commuters, 29.4%) for males and 5 to 9 minutes (142 commuters, 32.2%) for females.
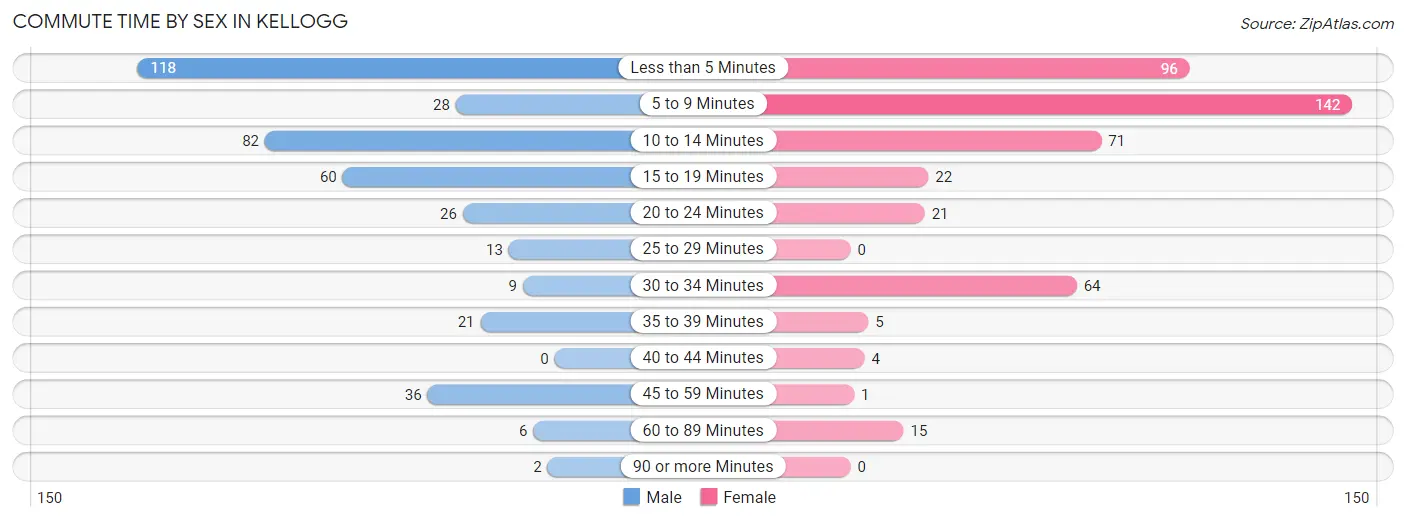
| Commute Time | Male | Female |
| Less than 5 Minutes | 118 (29.4%) | 96 (21.8%) |
| 5 to 9 Minutes | 28 (7.0%) | 142 (32.2%) |
| 10 to 14 Minutes | 82 (20.4%) | 71 (16.1%) |
| 15 to 19 Minutes | 60 (15.0%) | 22 (5.0%) |
| 20 to 24 Minutes | 26 (6.5%) | 21 (4.8%) |
| 25 to 29 Minutes | 13 (3.2%) | 0 (0.0%) |
| 30 to 34 Minutes | 9 (2.2%) | 64 (14.5%) |
| 35 to 39 Minutes | 21 (5.2%) | 5 (1.1%) |
| 40 to 44 Minutes | 0 (0.0%) | 4 (0.9%) |
| 45 to 59 Minutes | 36 (9.0%) | 1 (0.2%) |
| 60 to 89 Minutes | 6 (1.5%) | 15 (3.4%) |
| 90 or more Minutes | 2 (0.5%) | 0 (0.0%) |
Time of Departure to Work by Sex in Kellogg
The most frequent times of departure to work in Kellogg are 6:30 AM to 6:59 AM (73, 18.2%) for males and 7:00 AM to 7:29 AM (74, 16.8%) for females.
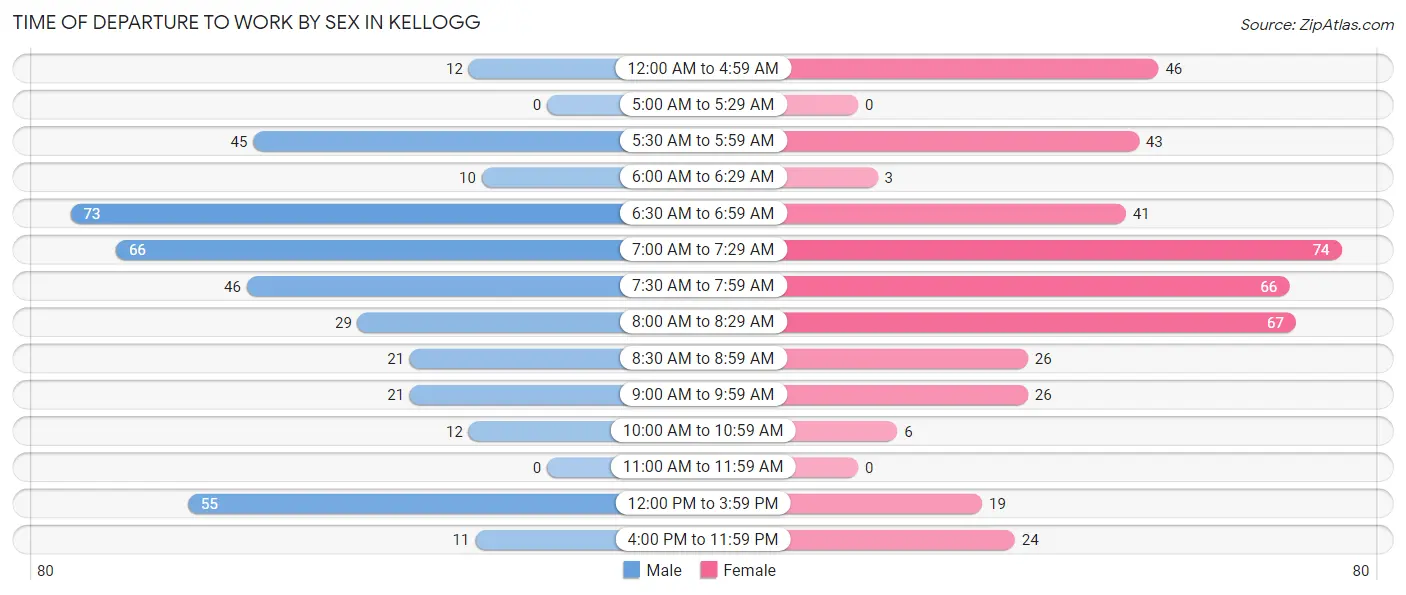
| Time of Departure | Male | Female |
| 12:00 AM to 4:59 AM | 12 (3.0%) | 46 (10.4%) |
| 5:00 AM to 5:29 AM | 0 (0.0%) | 0 (0.0%) |
| 5:30 AM to 5:59 AM | 45 (11.2%) | 43 (9.8%) |
| 6:00 AM to 6:29 AM | 10 (2.5%) | 3 (0.7%) |
| 6:30 AM to 6:59 AM | 73 (18.2%) | 41 (9.3%) |
| 7:00 AM to 7:29 AM | 66 (16.5%) | 74 (16.8%) |
| 7:30 AM to 7:59 AM | 46 (11.5%) | 66 (15.0%) |
| 8:00 AM to 8:29 AM | 29 (7.2%) | 67 (15.2%) |
| 8:30 AM to 8:59 AM | 21 (5.2%) | 26 (5.9%) |
| 9:00 AM to 9:59 AM | 21 (5.2%) | 26 (5.9%) |
| 10:00 AM to 10:59 AM | 12 (3.0%) | 6 (1.4%) |
| 11:00 AM to 11:59 AM | 0 (0.0%) | 0 (0.0%) |
| 12:00 PM to 3:59 PM | 55 (13.7%) | 19 (4.3%) |
| 4:00 PM to 11:59 PM | 11 (2.7%) | 24 (5.4%) |
| Total | 401 (100.0%) | 441 (100.0%) |
Housing Occupancy in Kellogg
Occupancy by Ownership in Kellogg
Of the total 920 dwellings in Kellogg, owner-occupied units account for 524 (57.0%), while renter-occupied units make up 396 (43.0%).
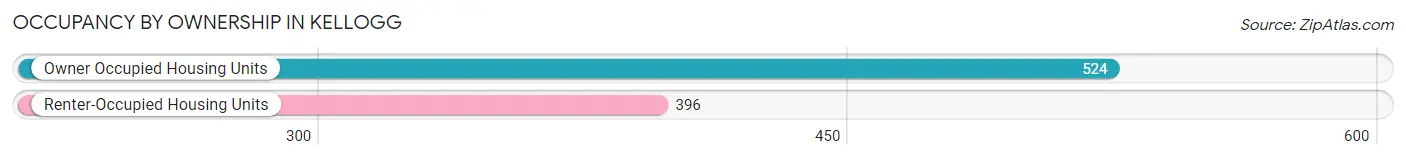
| Occupancy | # Housing Units | % Housing Units |
| Owner Occupied Housing Units | 524 | 57.0% |
| Renter-Occupied Housing Units | 396 | 43.0% |
| Total Occupied Housing Units | 920 | 100.0% |
Occupancy by Household Size in Kellogg
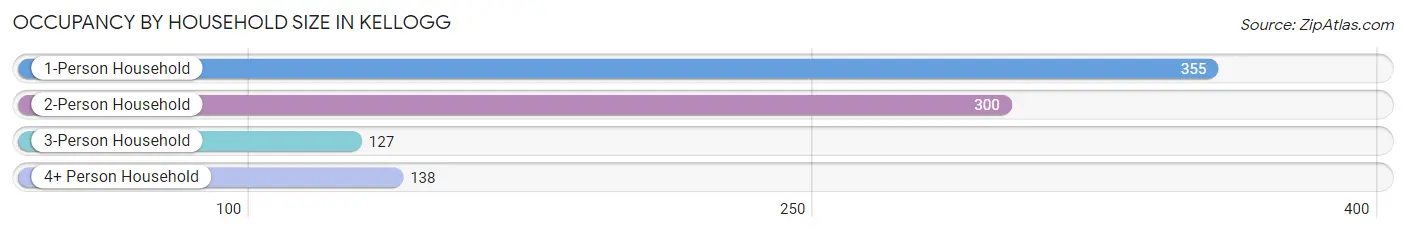
| Household Size | # Housing Units | % Housing Units |
| 1-Person Household | 355 | 38.6% |
| 2-Person Household | 300 | 32.6% |
| 3-Person Household | 127 | 13.8% |
| 4+ Person Household | 138 | 15.0% |
| Total Housing Units | 920 | 100.0% |
Occupancy by Ownership by Household Size in Kellogg
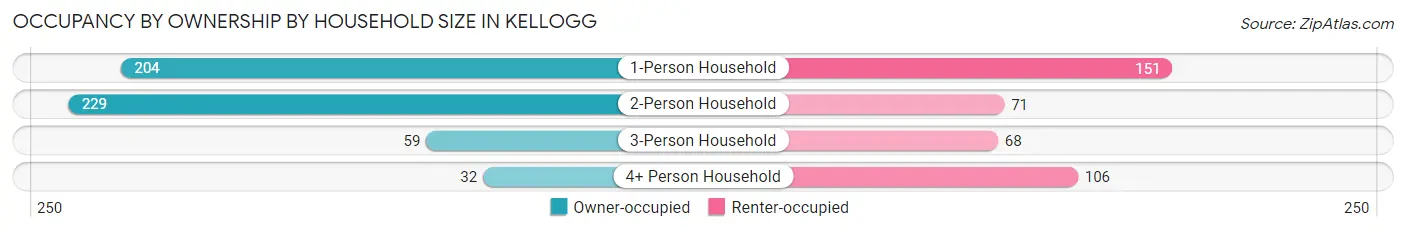
| Household Size | Owner-occupied | Renter-occupied |
| 1-Person Household | 204 (57.5%) | 151 (42.5%) |
| 2-Person Household | 229 (76.3%) | 71 (23.7%) |
| 3-Person Household | 59 (46.5%) | 68 (53.5%) |
| 4+ Person Household | 32 (23.2%) | 106 (76.8%) |
| Total Housing Units | 524 (57.0%) | 396 (43.0%) |
Occupancy by Educational Attainment in Kellogg
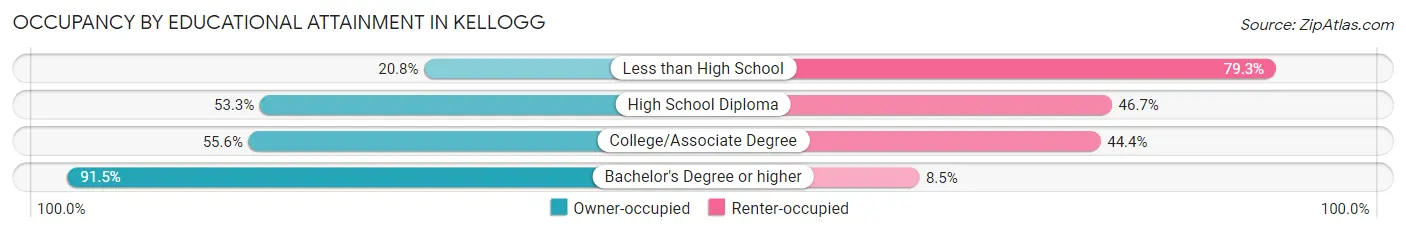
| Household Size | Owner-occupied | Renter-occupied |
| Less than High School | 11 (20.7%) | 42 (79.2%) |
| High School Diploma | 161 (53.3%) | 141 (46.7%) |
| College/Associate Degree | 255 (55.6%) | 204 (44.4%) |
| Bachelor's Degree or higher | 97 (91.5%) | 9 (8.5%) |
Occupancy by Age of Householder in Kellogg
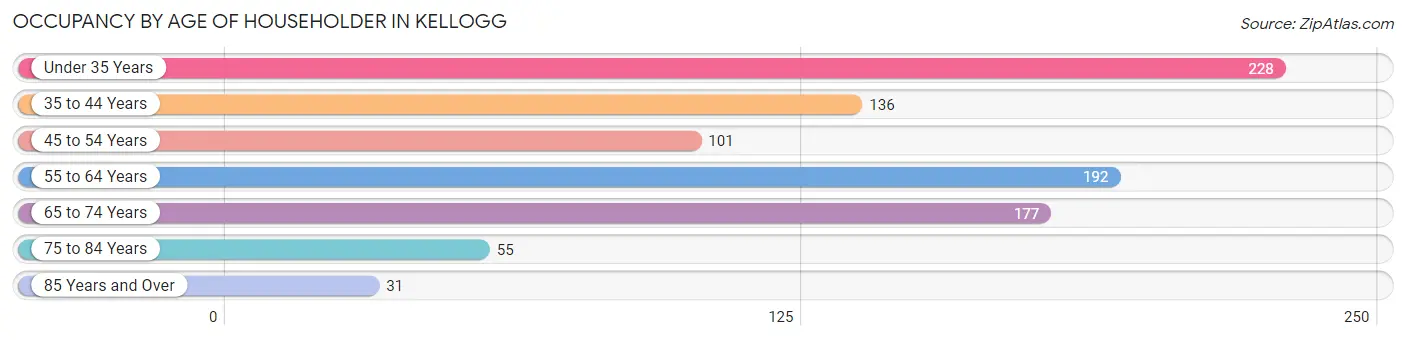
| Age Bracket | # Households | % Households |
| Under 35 Years | 228 | 24.8% |
| 35 to 44 Years | 136 | 14.8% |
| 45 to 54 Years | 101 | 11.0% |
| 55 to 64 Years | 192 | 20.9% |
| 65 to 74 Years | 177 | 19.2% |
| 75 to 84 Years | 55 | 6.0% |
| 85 Years and Over | 31 | 3.4% |
| Total | 920 | 100.0% |
Housing Finances in Kellogg
Median Income by Occupancy in Kellogg
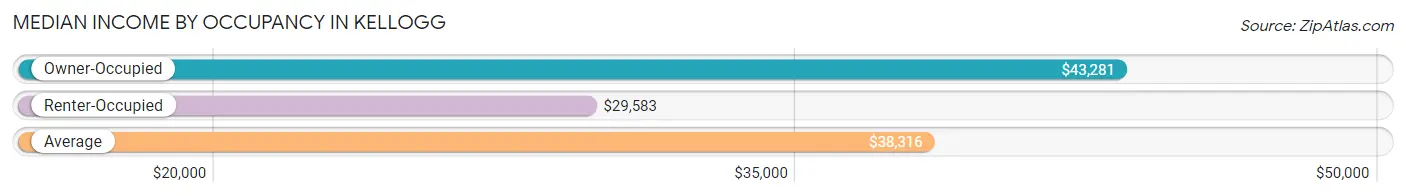
| Occupancy Type | # Households | Median Income |
| Owner-Occupied | 524 (57.0%) | $43,281 |
| Renter-Occupied | 396 (43.0%) | $29,583 |
| Average | 920 (100.0%) | $38,316 |
Occupancy by Householder Income Bracket in Kellogg
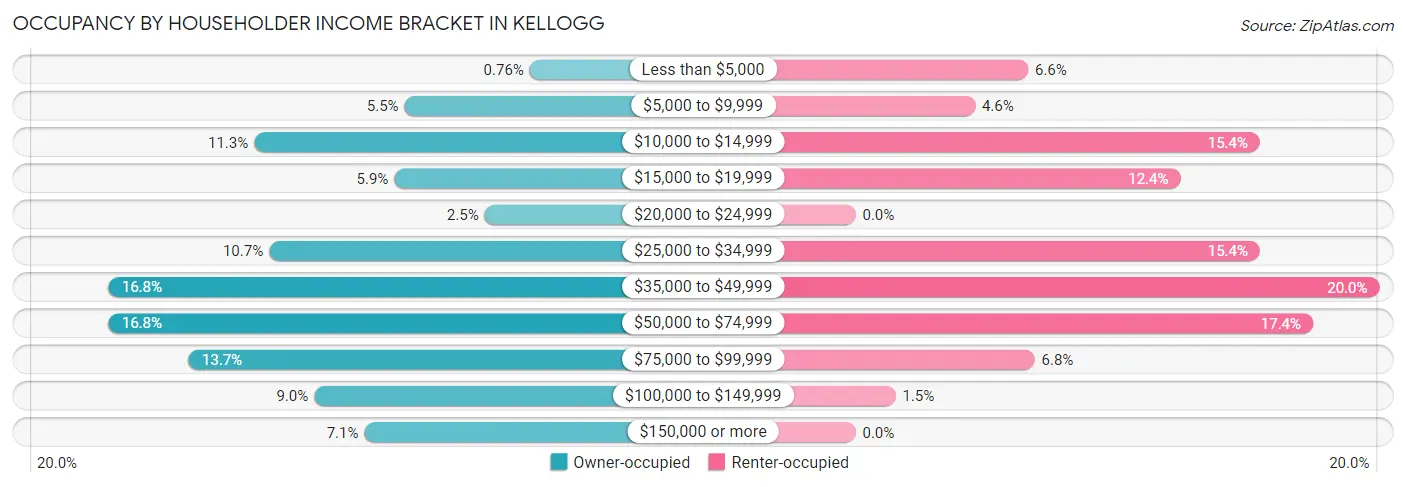
| Income Bracket | Owner-occupied | Renter-occupied |
| Less than $5,000 | 4 (0.8%) | 26 (6.6%) |
| $5,000 to $9,999 | 29 (5.5%) | 18 (4.5%) |
| $10,000 to $14,999 | 59 (11.3%) | 61 (15.4%) |
| $15,000 to $19,999 | 31 (5.9%) | 49 (12.4%) |
| $20,000 to $24,999 | 13 (2.5%) | 0 (0.0%) |
| $25,000 to $34,999 | 56 (10.7%) | 61 (15.4%) |
| $35,000 to $49,999 | 88 (16.8%) | 79 (20.0%) |
| $50,000 to $74,999 | 88 (16.8%) | 69 (17.4%) |
| $75,000 to $99,999 | 72 (13.7%) | 27 (6.8%) |
| $100,000 to $149,999 | 47 (9.0%) | 6 (1.5%) |
| $150,000 or more | 37 (7.1%) | 0 (0.0%) |
| Total | 524 (100.0%) | 396 (100.0%) |
Monthly Housing Cost Tiers in Kellogg
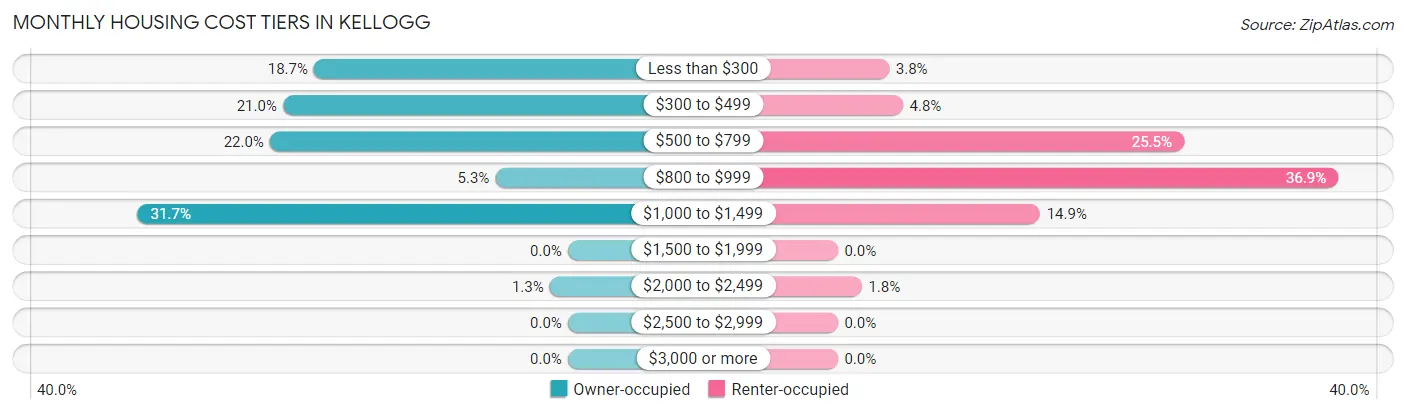
| Monthly Cost | Owner-occupied | Renter-occupied |
| Less than $300 | 98 (18.7%) | 15 (3.8%) |
| $300 to $499 | 110 (21.0%) | 19 (4.8%) |
| $500 to $799 | 115 (22.0%) | 101 (25.5%) |
| $800 to $999 | 28 (5.3%) | 146 (36.9%) |
| $1,000 to $1,499 | 166 (31.7%) | 59 (14.9%) |
| $1,500 to $1,999 | 0 (0.0%) | 0 (0.0%) |
| $2,000 to $2,499 | 7 (1.3%) | 7 (1.8%) |
| $2,500 to $2,999 | 0 (0.0%) | 0 (0.0%) |
| $3,000 or more | 0 (0.0%) | 0 (0.0%) |
| Total | 524 (100.0%) | 396 (100.0%) |
Physical Housing Characteristics in Kellogg
Housing Structures in Kellogg
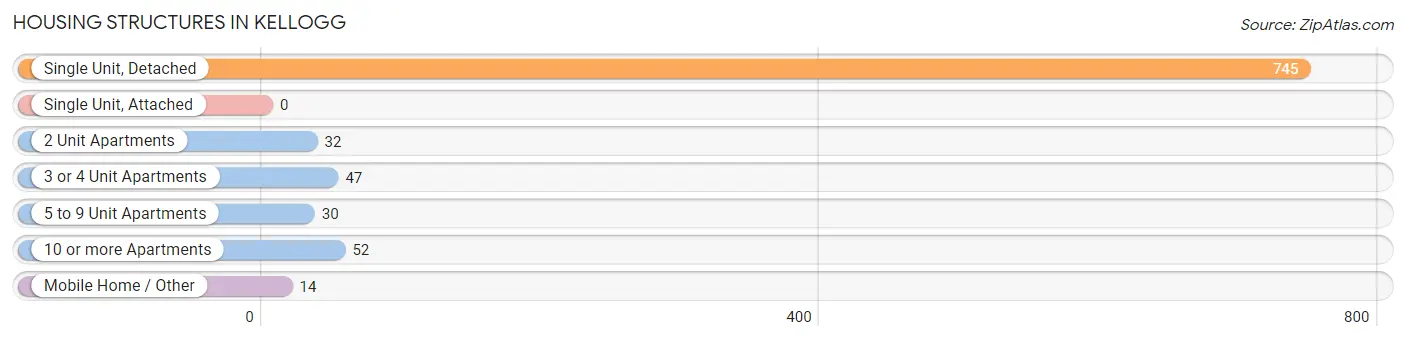
| Structure Type | # Housing Units | % Housing Units |
| Single Unit, Detached | 745 | 81.0% |
| Single Unit, Attached | 0 | 0.0% |
| 2 Unit Apartments | 32 | 3.5% |
| 3 or 4 Unit Apartments | 47 | 5.1% |
| 5 to 9 Unit Apartments | 30 | 3.3% |
| 10 or more Apartments | 52 | 5.7% |
| Mobile Home / Other | 14 | 1.5% |
| Total | 920 | 100.0% |
Housing Structures by Occupancy in Kellogg
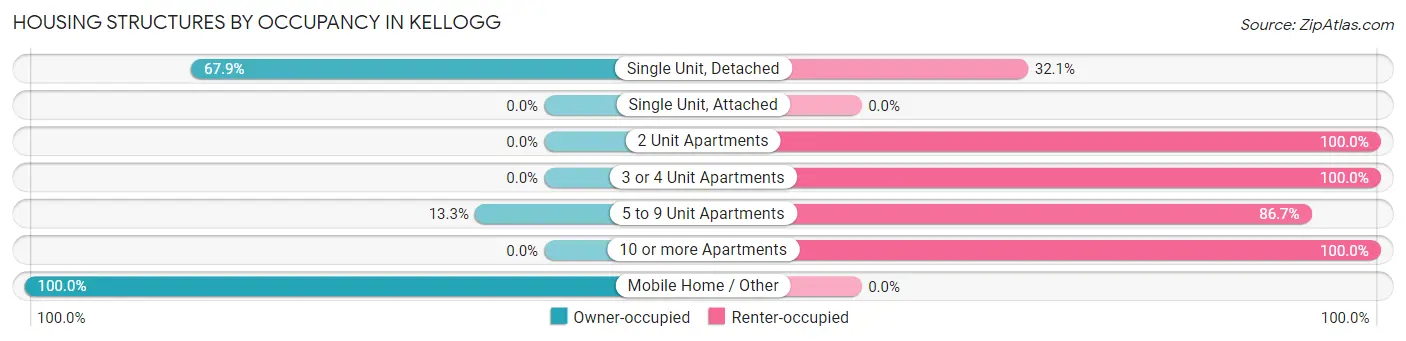
| Structure Type | Owner-occupied | Renter-occupied |
| Single Unit, Detached | 506 (67.9%) | 239 (32.1%) |
| Single Unit, Attached | 0 (0.0%) | 0 (0.0%) |
| 2 Unit Apartments | 0 (0.0%) | 32 (100.0%) |
| 3 or 4 Unit Apartments | 0 (0.0%) | 47 (100.0%) |
| 5 to 9 Unit Apartments | 4 (13.3%) | 26 (86.7%) |
| 10 or more Apartments | 0 (0.0%) | 52 (100.0%) |
| Mobile Home / Other | 14 (100.0%) | 0 (0.0%) |
| Total | 524 (57.0%) | 396 (43.0%) |
Housing Structures by Number of Rooms in Kellogg
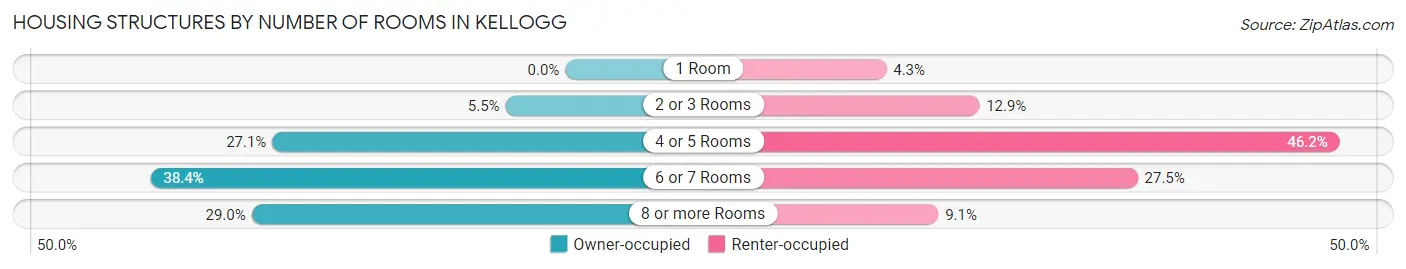
| Number of Rooms | Owner-occupied | Renter-occupied |
| 1 Room | 0 (0.0%) | 17 (4.3%) |
| 2 or 3 Rooms | 29 (5.5%) | 51 (12.9%) |
| 4 or 5 Rooms | 142 (27.1%) | 183 (46.2%) |
| 6 or 7 Rooms | 201 (38.4%) | 109 (27.5%) |
| 8 or more Rooms | 152 (29.0%) | 36 (9.1%) |
| Total | 524 (100.0%) | 396 (100.0%) |
Housing Structure by Heating Type in Kellogg
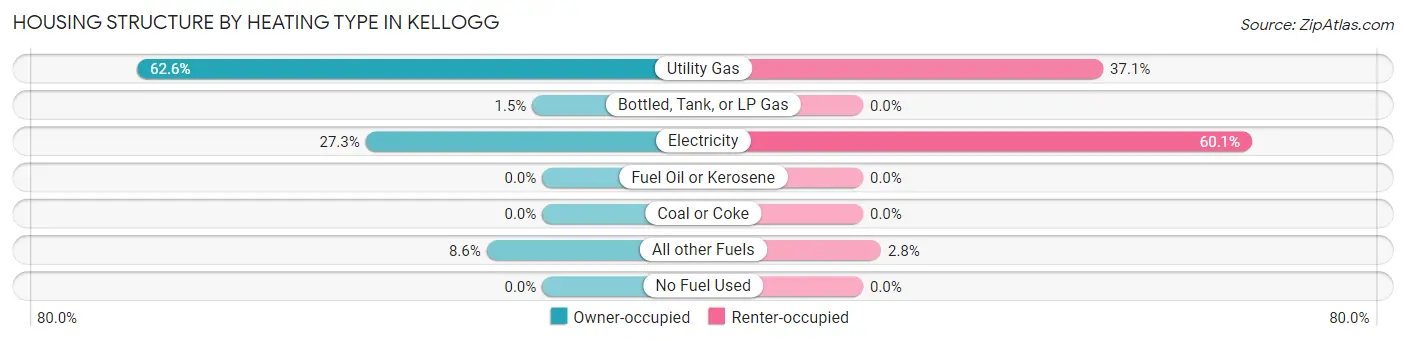
| Heating Type | Owner-occupied | Renter-occupied |
| Utility Gas | 328 (62.6%) | 147 (37.1%) |
| Bottled, Tank, or LP Gas | 8 (1.5%) | 0 (0.0%) |
| Electricity | 143 (27.3%) | 238 (60.1%) |
| Fuel Oil or Kerosene | 0 (0.0%) | 0 (0.0%) |
| Coal or Coke | 0 (0.0%) | 0 (0.0%) |
| All other Fuels | 45 (8.6%) | 11 (2.8%) |
| No Fuel Used | 0 (0.0%) | 0 (0.0%) |
| Total | 524 (100.0%) | 396 (100.0%) |
Household Vehicle Usage in Kellogg
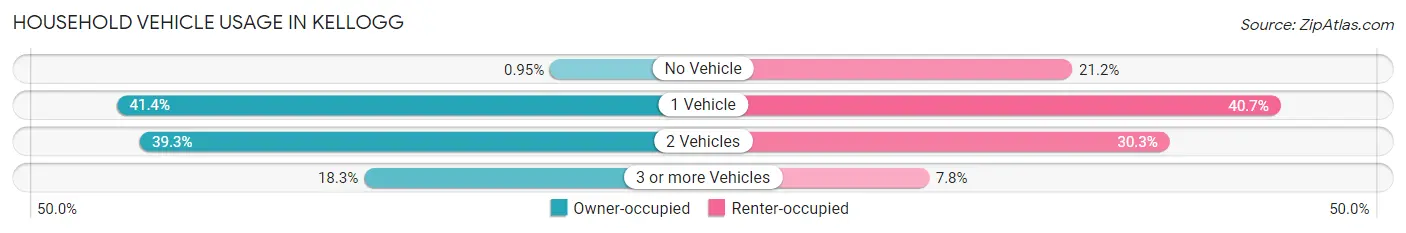
| Vehicles per Household | Owner-occupied | Renter-occupied |
| No Vehicle | 5 (0.9%) | 84 (21.2%) |
| 1 Vehicle | 217 (41.4%) | 161 (40.7%) |
| 2 Vehicles | 206 (39.3%) | 120 (30.3%) |
| 3 or more Vehicles | 96 (18.3%) | 31 (7.8%) |
| Total | 524 (100.0%) | 396 (100.0%) |
Real Estate & Mortgages in Kellogg
Real Estate and Mortgage Overview in Kellogg
| Characteristic | Without Mortgage | With Mortgage |
| Housing Units | 309 | 215 |
| Median Property Value | $138,900 | $177,700 |
| Median Household Income | $38,648 | $18 |
| Monthly Housing Costs | $390 | $0 |
| Real Estate Taxes | $1,357 | $0 |
Property Value by Mortgage Status in Kellogg
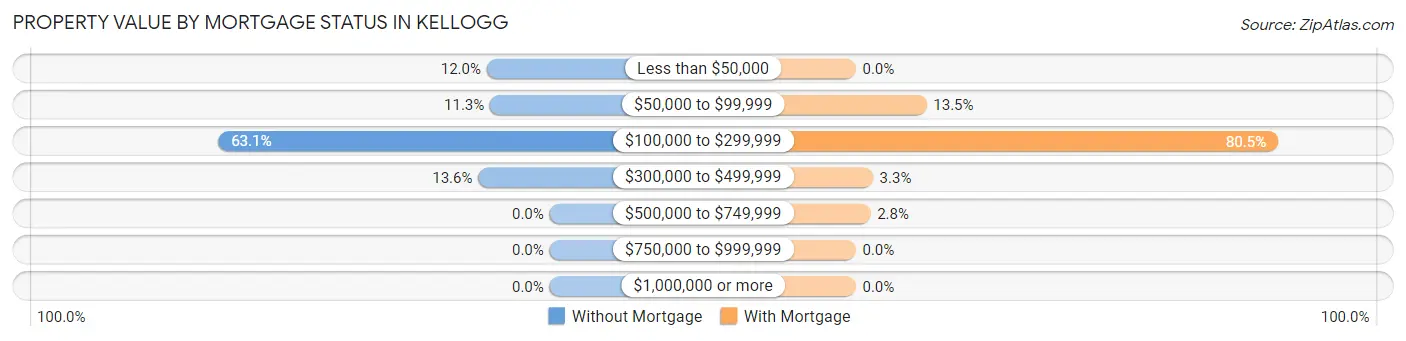
| Property Value | Without Mortgage | With Mortgage |
| Less than $50,000 | 37 (12.0%) | 0 (0.0%) |
| $50,000 to $99,999 | 35 (11.3%) | 29 (13.5%) |
| $100,000 to $299,999 | 195 (63.1%) | 173 (80.5%) |
| $300,000 to $499,999 | 42 (13.6%) | 7 (3.3%) |
| $500,000 to $749,999 | 0 (0.0%) | 6 (2.8%) |
| $750,000 to $999,999 | 0 (0.0%) | 0 (0.0%) |
| $1,000,000 or more | 0 (0.0%) | 0 (0.0%) |
| Total | 309 (100.0%) | 215 (100.0%) |
Household Income by Mortgage Status in Kellogg
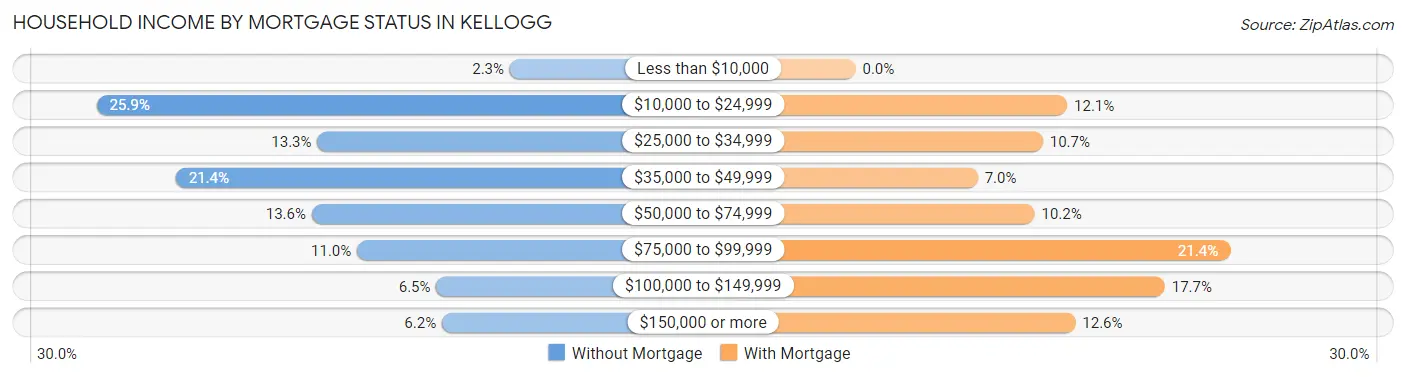
| Household Income | Without Mortgage | With Mortgage |
| Less than $10,000 | 7 (2.3%) | 0 (0.0%) |
| $10,000 to $24,999 | 80 (25.9%) | 26 (12.1%) |
| $25,000 to $34,999 | 41 (13.3%) | 23 (10.7%) |
| $35,000 to $49,999 | 66 (21.4%) | 15 (7.0%) |
| $50,000 to $74,999 | 42 (13.6%) | 22 (10.2%) |
| $75,000 to $99,999 | 34 (11.0%) | 46 (21.4%) |
| $100,000 to $149,999 | 20 (6.5%) | 38 (17.7%) |
| $150,000 or more | 19 (6.1%) | 27 (12.6%) |
| Total | 309 (100.0%) | 215 (100.0%) |
Property Value to Household Income Ratio in Kellogg
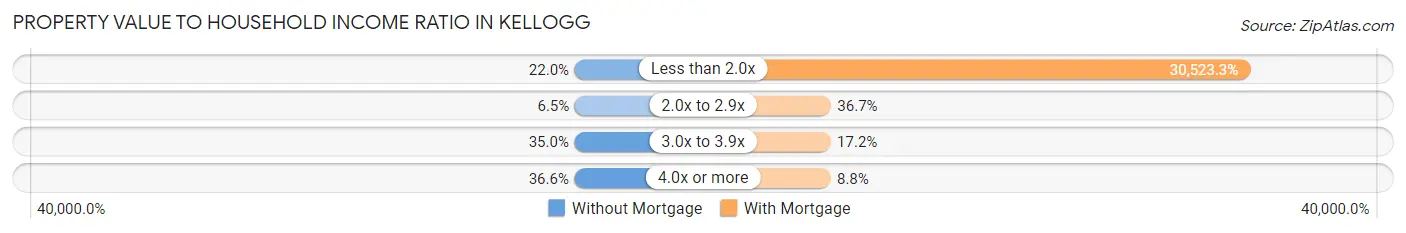
| Value-to-Income Ratio | Without Mortgage | With Mortgage |
| Less than 2.0x | 68 (22.0%) | 65,625 (30,523.3%) |
| 2.0x to 2.9x | 20 (6.5%) | 79 (36.7%) |
| 3.0x to 3.9x | 108 (34.9%) | 37 (17.2%) |
| 4.0x or more | 113 (36.6%) | 19 (8.8%) |
| Total | 309 (100.0%) | 215 (100.0%) |
Real Estate Taxes by Mortgage Status in Kellogg
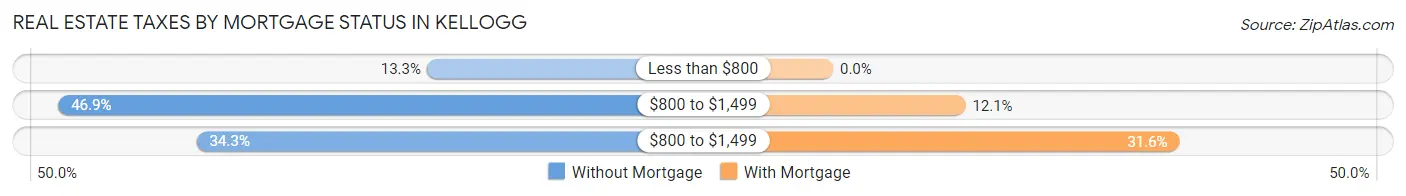
| Property Taxes | Without Mortgage | With Mortgage |
| Less than $800 | 41 (13.3%) | 0 (0.0%) |
| $800 to $1,499 | 145 (46.9%) | 26 (12.1%) |
| $800 to $1,499 | 106 (34.3%) | 68 (31.6%) |
| Total | 309 (100.0%) | 215 (100.0%) |
Health & Disability in Kellogg
Health Insurance Coverage by Age in Kellogg

| Age Bracket | With Coverage | Without Coverage |
| Under 6 Years | 242 (100.0%) | 0 (0.0%) |
| 6 to 18 Years | 252 (94.7%) | 14 (5.3%) |
| 19 to 25 Years | 198 (76.1%) | 62 (23.8%) |
| 26 to 34 Years | 199 (54.7%) | 165 (45.3%) |
| 35 to 44 Years | 153 (77.7%) | 44 (22.3%) |
| 45 to 54 Years | 165 (84.6%) | 30 (15.4%) |
| 55 to 64 Years | 224 (74.4%) | 77 (25.6%) |
| 65 to 74 Years | 241 (93.8%) | 16 (6.2%) |
| 75 Years and older | 113 (100.0%) | 0 (0.0%) |
| Total | 1,787 (81.4%) | 408 (18.6%) |
Health Insurance Coverage by Citizenship Status in Kellogg
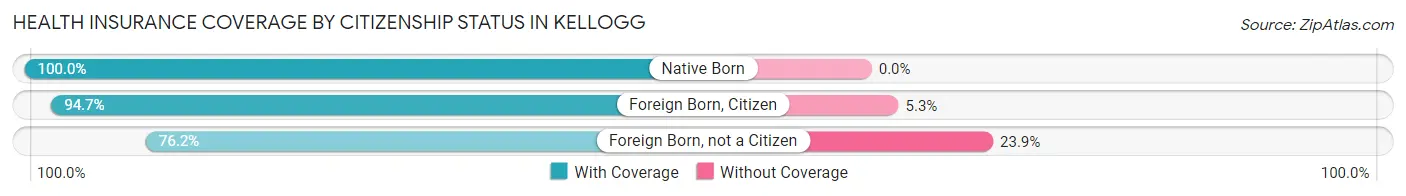
| Citizenship Status | With Coverage | Without Coverage |
| Native Born | 242 (100.0%) | 0 (0.0%) |
| Foreign Born, Citizen | 252 (94.7%) | 14 (5.3%) |
| Foreign Born, not a Citizen | 198 (76.1%) | 62 (23.8%) |
Health Insurance Coverage by Household Income in Kellogg
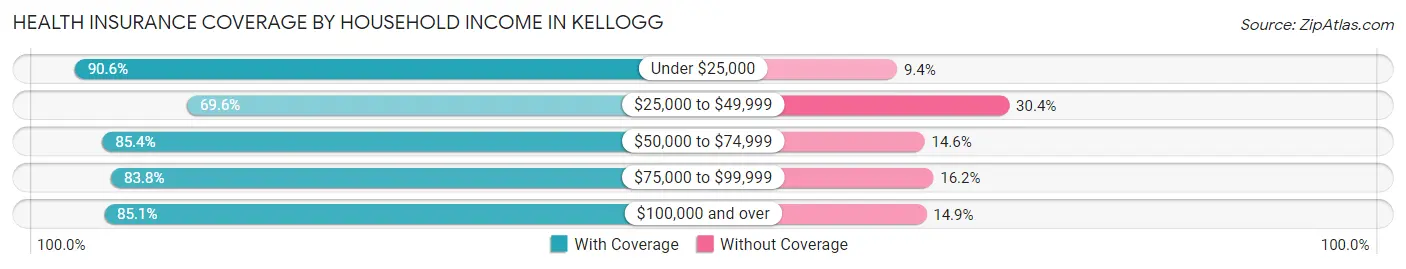
| Household Income | With Coverage | Without Coverage |
| Under $25,000 | 424 (90.6%) | 44 (9.4%) |
| $25,000 to $49,999 | 469 (69.6%) | 205 (30.4%) |
| $50,000 to $74,999 | 393 (85.4%) | 67 (14.6%) |
| $75,000 to $99,999 | 238 (83.8%) | 46 (16.2%) |
| $100,000 and over | 263 (85.1%) | 46 (14.9%) |
Public vs Private Health Insurance Coverage by Age in Kellogg
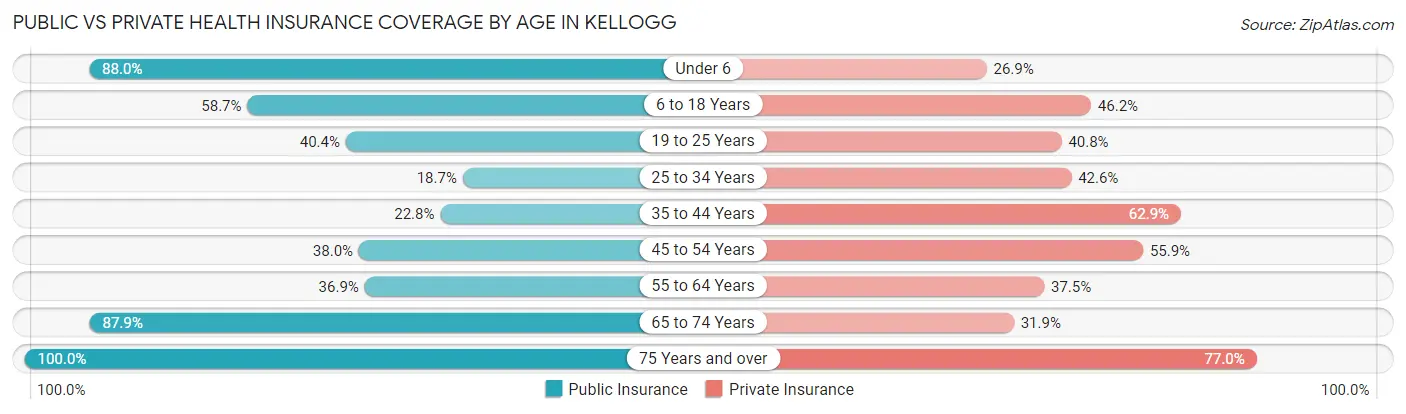
| Age Bracket | Public Insurance | Private Insurance |
| Under 6 | 213 (88.0%) | 65 (26.9%) |
| 6 to 18 Years | 156 (58.7%) | 123 (46.2%) |
| 19 to 25 Years | 105 (40.4%) | 106 (40.8%) |
| 25 to 34 Years | 68 (18.7%) | 155 (42.6%) |
| 35 to 44 Years | 45 (22.8%) | 124 (62.9%) |
| 45 to 54 Years | 74 (38.0%) | 109 (55.9%) |
| 55 to 64 Years | 111 (36.9%) | 113 (37.5%) |
| 65 to 74 Years | 226 (87.9%) | 82 (31.9%) |
| 75 Years and over | 113 (100.0%) | 87 (77.0%) |
| Total | 1,111 (50.6%) | 964 (43.9%) |
Disability Status by Sex by Age in Kellogg
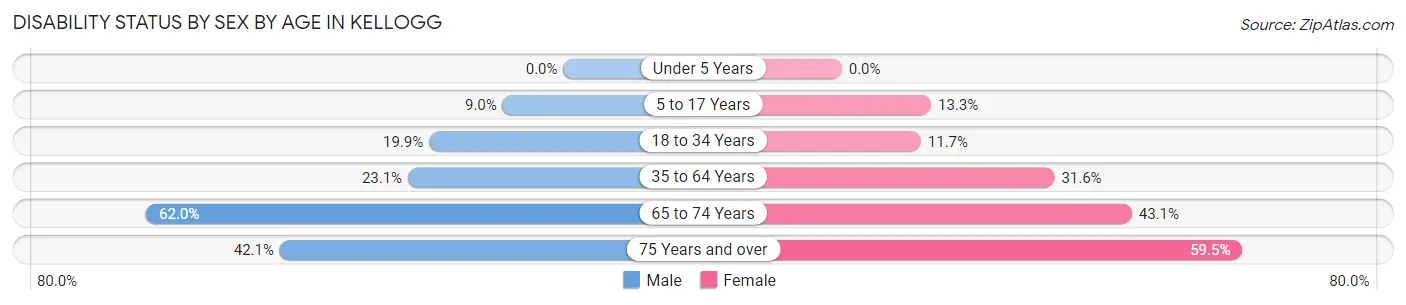
| Age Bracket | Male | Female |
| Under 5 Years | 0 (0.0%) | 0 (0.0%) |
| 5 to 17 Years | 11 (9.0%) | 24 (13.3%) |
| 18 to 34 Years | 65 (19.9%) | 35 (11.7%) |
| 35 to 64 Years | 81 (23.1%) | 108 (31.6%) |
| 65 to 74 Years | 70 (62.0%) | 62 (43.1%) |
| 75 Years and over | 32 (42.1%) | 22 (59.5%) |
Disability Class by Sex by Age in Kellogg
Disability Class: Hearing Difficulty
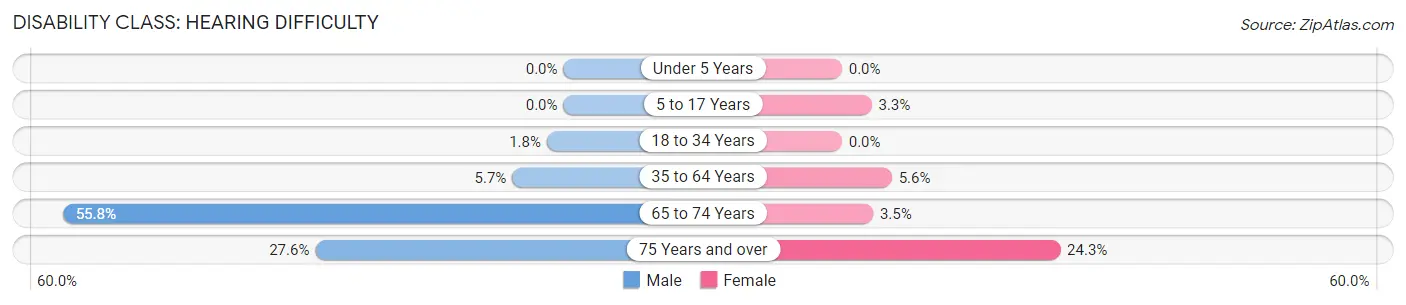
| Age Bracket | Male | Female |
| Under 5 Years | 0 (0.0%) | 0 (0.0%) |
| 5 to 17 Years | 0 (0.0%) | 6 (3.3%) |
| 18 to 34 Years | 6 (1.8%) | 0 (0.0%) |
| 35 to 64 Years | 20 (5.7%) | 19 (5.6%) |
| 65 to 74 Years | 63 (55.7%) | 5 (3.5%) |
| 75 Years and over | 21 (27.6%) | 9 (24.3%) |
Disability Class: Vision Difficulty
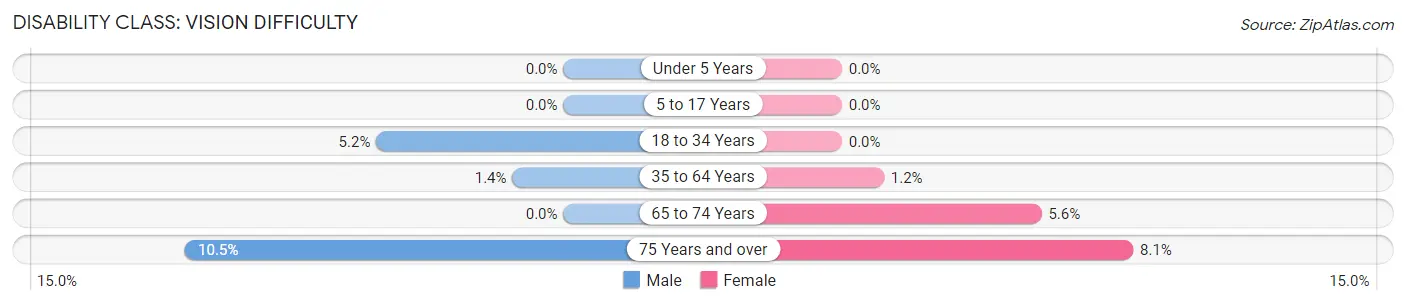
| Age Bracket | Male | Female |
| Under 5 Years | 0 (0.0%) | 0 (0.0%) |
| 5 to 17 Years | 0 (0.0%) | 0 (0.0%) |
| 18 to 34 Years | 17 (5.2%) | 0 (0.0%) |
| 35 to 64 Years | 5 (1.4%) | 4 (1.2%) |
| 65 to 74 Years | 0 (0.0%) | 8 (5.6%) |
| 75 Years and over | 8 (10.5%) | 3 (8.1%) |
Disability Class: Cognitive Difficulty
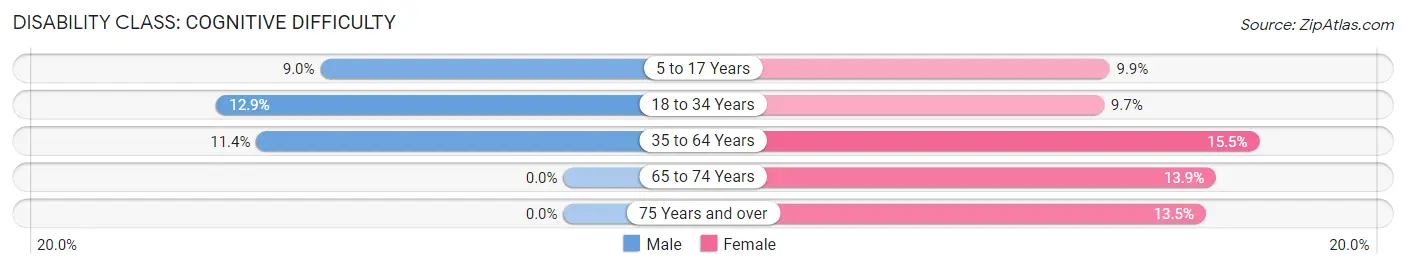
| Age Bracket | Male | Female |
| 5 to 17 Years | 11 (9.0%) | 18 (9.9%) |
| 18 to 34 Years | 42 (12.9%) | 29 (9.7%) |
| 35 to 64 Years | 40 (11.4%) | 53 (15.5%) |
| 65 to 74 Years | 0 (0.0%) | 20 (13.9%) |
| 75 Years and over | 0 (0.0%) | 5 (13.5%) |
Disability Class: Ambulatory Difficulty
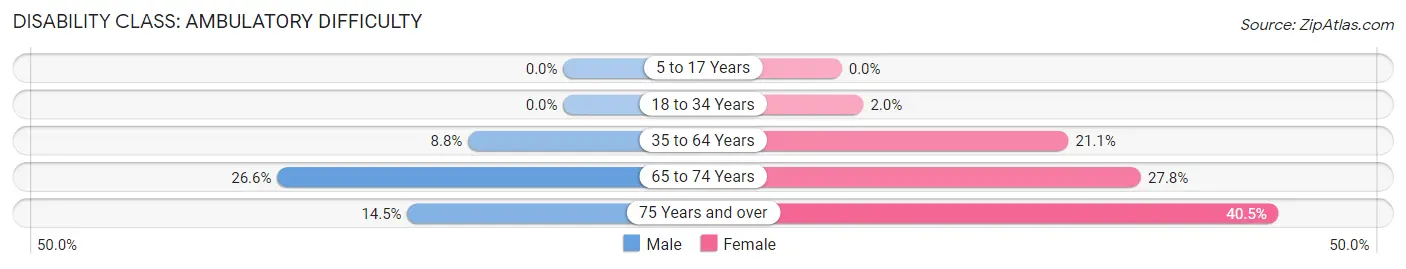
| Age Bracket | Male | Female |
| 5 to 17 Years | 0 (0.0%) | 0 (0.0%) |
| 18 to 34 Years | 0 (0.0%) | 6 (2.0%) |
| 35 to 64 Years | 31 (8.8%) | 72 (21.0%) |
| 65 to 74 Years | 30 (26.6%) | 40 (27.8%) |
| 75 Years and over | 11 (14.5%) | 15 (40.5%) |
Disability Class: Self-Care Difficulty
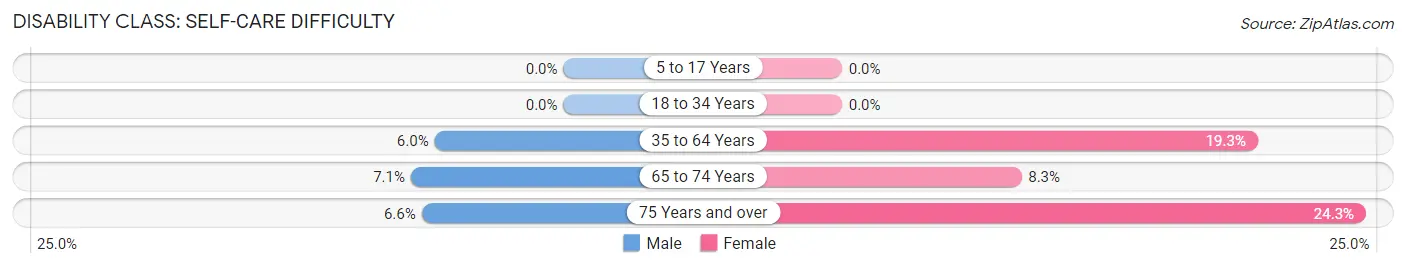
| Age Bracket | Male | Female |
| 5 to 17 Years | 0 (0.0%) | 0 (0.0%) |
| 18 to 34 Years | 0 (0.0%) | 0 (0.0%) |
| 35 to 64 Years | 21 (6.0%) | 66 (19.3%) |
| 65 to 74 Years | 8 (7.1%) | 12 (8.3%) |
| 75 Years and over | 5 (6.6%) | 9 (24.3%) |
Technology Access in Kellogg
Computing Device Access in Kellogg
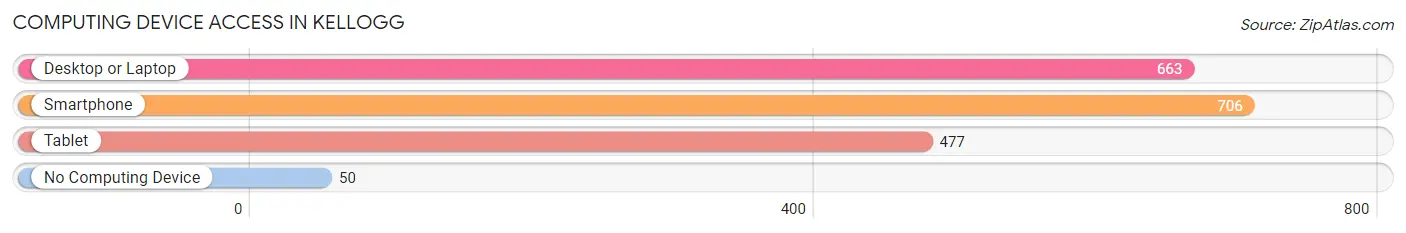
| Device Type | # Households | % Households |
| Desktop or Laptop | 663 | 72.1% |
| Smartphone | 706 | 76.7% |
| Tablet | 477 | 51.8% |
| No Computing Device | 50 | 5.4% |
| Total | 920 | 100.0% |
Internet Access in Kellogg
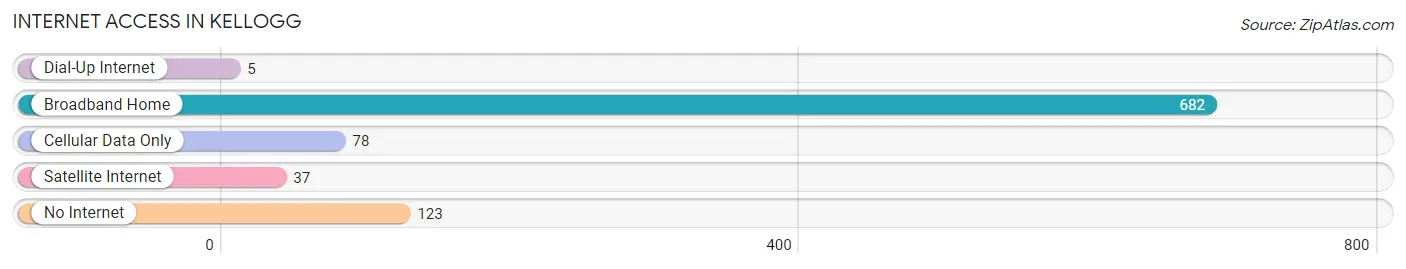
| Internet Type | # Households | % Households |
| Dial-Up Internet | 5 | 0.5% |
| Broadband Home | 682 | 74.1% |
| Cellular Data Only | 78 | 8.5% |
| Satellite Internet | 37 | 4.0% |
| No Internet | 123 | 13.4% |
| Total | 920 | 100.0% |
Kellogg Summary
Kellogg, Idaho is a small city located in the northern part of the state, in the Silver Valley region of the Coeur d'Alene Mountains. It is the county seat of Shoshone County and is situated at an elevation of 2,400 feet. The city was founded in 1885 and named after the mining magnate, Noah Kellogg. The population of Kellogg was 2,120 at the 2010 census.
History
Kellogg was founded in 1885 by Noah Kellogg, a mining magnate who had discovered a rich vein of silver ore in the area. He established the Bunker Hill and Sullivan Mining and Concentrating Company, which became the largest silver producer in the world. The city was incorporated in 1889 and quickly became a bustling mining town. The Bunker Hill Mine was the largest employer in the area, and the city was home to many saloons, hotels, and other businesses catering to the miners.
In the early 1900s, the Bunker Hill Mine closed and the city's population began to decline. The city was hit hard by the Great Depression, and many of the businesses closed. In the 1940s, the city began to experience a resurgence as the Bunker Hill Mine reopened and the city became a center for logging and lumber production.
Geography
Kellogg is located in the northern part of Idaho, in the Silver Valley region of the Coeur d'Alene Mountains. It is situated at an elevation of 2,400 feet and is surrounded by mountains and forests. The city is located on the Coeur d'Alene River, which flows through the city and is a popular destination for fishing and other recreational activities.
The city is located approximately 25 miles east of Coeur d'Alene and 40 miles south of Spokane, Washington. It is also close to the Idaho-Montana border, and is within driving distance of several ski resorts.
Economy
Kellogg's economy is largely based on tourism and recreation. The city is home to several ski resorts, including Silver Mountain Resort, which is the largest ski resort in Idaho. The city is also home to several golf courses, and is a popular destination for fishing, camping, and other outdoor activities.
The city is also home to several manufacturing companies, including a paper mill and a lumber mill. The Bunker Hill Mine is still in operation, and is the largest employer in the city.
Demographics
As of the 2010 census, the population of Kellogg was 2,120. The racial makeup of the city was 95.3% White, 0.7% Native American, 0.3% Asian, 0.2% African American, 0.1% Pacific Islander, and 2.4% from other races. The median household income was $35,938, and the median family income was $41,944.
Kellogg is a small city with a close-knit community. The city is home to several churches, and is a popular destination for outdoor recreation. The city is also home to several festivals and events throughout the year, including the Silver Valley Fair and the Kellogg Days Festival.
Common Questions
What is Per Capita Income in Kellogg?
Per Capita income in Kellogg is $22,374.
What is the Median Family Income in Kellogg?
Median Family Income in Kellogg is $56,176.
What is the Median Household income in Kellogg?
Median Household Income in Kellogg is $38,316.
What is Income or Wage Gap in Kellogg?
Income or Wage Gap in Kellogg is 26.9%.
Women in Kellogg earn 73.1 cents for every dollar earned by a man.
What is Inequality or Gini Index in Kellogg?
Inequality or Gini Index in Kellogg is 0.44.
What is the Total Population of Kellogg?
Total Population of Kellogg is 2,294.
What is the Total Male Population of Kellogg?
Total Male Population of Kellogg is 1,117.
What is the Total Female Population of Kellogg?
Total Female Population of Kellogg is 1,177.
What is the Ratio of Males per 100 Females in Kellogg?
There are 94.90 Males per 100 Females in Kellogg.
What is the Ratio of Females per 100 Males in Kellogg?
There are 105.37 Females per 100 Males in Kellogg.
What is the Median Population Age in Kellogg?
Median Population Age in Kellogg is 36.1 Years.
What is the Average Family Size in Kellogg
Average Family Size in Kellogg is 3.3 People.
What is the Average Household Size in Kellogg
Average Household Size in Kellogg is 2.4 People.
How Large is the Labor Force in Kellogg?
There are 1,021 People in the Labor Forcein in Kellogg.
What is the Percentage of People in the Labor Force in Kellogg?
56.0% of People are in the Labor Force in Kellogg.
What is the Unemployment Rate in Kellogg?
Unemployment Rate in Kellogg is 14.5%.